Attached files
| file | filename |
|---|---|
| EX-99.1 - EXHIBIT 99.1 - TECH DATA CORP | tv480267_ex99-1.htm |
| 8-K - FORM 8-K - TECH DATA CORP | tv480267_8k.htm |
Exhibit 99.2

Q3 Fiscal Year 2018 Financial Highlights For the quarter ended October 31, 2017 November 27, 2017

2 Forward - Looking Statements Certain statements in this communication may contain “forward - looking statements” within the meaning of the Private Securities Litigatio n Reform Act of 1995. These statements, including statements regarding Tech Data’s plans, objectives, expectations and intentions, Tech Data’s financial results and estimates and/or busi nes s prospects, involve a number of risks and uncertainties and actual results could differ materially from those projected. These forward looking statements are based on current expectations, estimates, foreca sts , and projections about the operating environment, economies and markets in which Tech Data operates and the beliefs and assumptions of our management. Words such as “expects,” “anticipates,” “targets, ” “ goals,” “projects,” “intends,” “plans,” “believes,” “seeks,” “estimates,” variations of such words, and similar expressions are intended to identify such forward looking statements. In addition, any sta tements that refer to Tech Data’s future financial performance, our anticipated growth and trends in our businesses, and other characterizations of future events or circumstances, are forward looking state men ts. These forward looking statements are only predictions and are subject to risks, uncertainties, and assumptions. Therefore, actual results may differ materially and adversely from those expressed in any forward looking statements. For additional information with respect to important risks and other factors that could cause actual results to differ materially from those in the forward - looking statements, see Tech Data’s Annual Report on Form 10 - K for the year ended January 31, 2017, including Part I, Item 1A, “Risk Factors” therein, Quarterly Reports on Form 10 - Q , Current Reports on Form 8 - K and other securities filings with the Securities and Exchange Commission (the “SEC”) that are available at the SEC’s website at www.sec.gov and other securities regulators. Reade rs are cautioned not to place undue reliance upon any such forward - looking statements, which speak only as of the date made. Many of these factors are beyond Tech Data’s control. Unless otherwise req uir ed by applicable securities laws, Tech Data disclaims any intention or obligation to update or revise any forward - looking statements, whether as a result of new information, future events or otherwise. Tech Dat a undertakes no duty to update any forward looking statements contained herein to reflect actual results or changes in Tech Data’s expectations. Use of Non - GAAP Financial Information This document includes financial results prepared in accordance with generally accepted accounting principles (“GAAP”). In ad dit ion to GAAP results, Tech Data management believes that the presentation of non - GAAP financial measures is useful to investors because it provides investors with a more complete understanding of our opera tional results and a meaningful comparison of our performance between periods. The non - GAAP results and outlook should only be used in conjunction with results reported in accordance with GAAP and a re not intended to be a substitute for results reported in accordance with GAAP. Non - GAAP financial measures presented in this presentation or other presentations, press releases and similar documents is sued by Tech Data, include but are not limited to sales, income or expense items as adjusted for the impact of changes in foreign currencies (referred to as “constant currency”) , non - GAAP selling, gener al and administrative expenses (“SG&A”), non - GAAP operating income, non - GAAP operating margin, non - GAAP net income, non - GAAP earnings per diluted share and Adjusted Return on Invested Capital. These non - GA AP financial measures do not have any standardized meaning and are therefore unlikely to be comparable to similar measures presented by comparable companies. Management may also use these non - GAA P financial measures to establish operational goals and, in some cases, for measuring performance for compensation purposes. This presentation provides a detailed reconciliation between results reporte d i n accordance with GAAP and non - GAAP financial measures.

3 Worldwide Q3 FY18: • Worldwide reported net sales of $9.1 billion increased 41% year - over - year and 3 % sequentially. The increase in net sales year - over - year is primarily due to the Technology Solutions business acquired from Avnet, Inc. on February 27, 2017. • On a constant currency basis, net sales increased 37% year - over - year and were relatively flat sequentially . ⁽ ¹ ⁾ CC: constant currency Q3 FY17 Q4 FY17 Q1 FY18 Q2 FY18 Q3 FY18 Asia Pacific $0.0 $0.0 $1.0 $1.0 $1.0 Americas $2.6 $2.7 $3.5 $4.2 $4.0 Europe $3.9 $4.7 $4.0 $4.4 $4.8 Reported Y/Y Growth 1% -1% 29% 40% 41% Y/Y CC Growth ⁽ ¹ ⁾ 4% 2% 33% 41% 37% $7.7 $9.1 $6.5 $7.4 60% 40% 6 4 % 36% 52% 45% 3% 50% 47% 3% $8.9 $ in Billions Net Sales 53% 44% 3%

4 Q3 FY17 Q4 FY17 Q1 FY18 Q2 FY18 Q3 FY18 Americas $2.6 $2.7 $3.5 $4.2 $4.0 Reported Y/Y growth 2% 0% 45% 57% 53% Y/Y CC growth ⁽ ¹ ⁾ 2% 0% 45% 57% 52% $2.6 $2.7 $3.5 $4.2 $4.0 0% 2% 4% 6% 8% 10% 12% $(0.3) $0.3 $0.8 $1.3 $1.8 $2.3 $2.8 $3.3 $3.8 $4.3 $4.8 Q3 FY18: • Americas reported net sales of $4.0 billion increased 53% year - over - year and declined 5% sequentially . The increase in net sales year - over - year is primarily attributed to the addition of Technology Solutions. • On a constant currency basis, net sales increased 52% year - over - year and declined 5% sequentially. ⁽ ¹ ⁾ CC: constant currency Americas $ in Billions Net Sales

5 Q3 FY17 Q4 FY17 Q1 FY18 Q2 FY18 Q3 FY18 Europe $3.9 $4.7 $4.0 $4.4 $4.8 Reported Y/Y growth 1% -1% 12% 20% 25% Y/Y CC growth ⁽ ¹ ⁾ 5% 3% 19% 21% 19% $3.9 $4.7 $4.0 $4.4 $4.8 -3% -1% 1% 3% 5% 7% 9% 11% 13% 15% $- $1.0 $2.0 $3.0 $4.0 $5.0 $6.0 Q3 FY18: • Europe’s reported net sales of $4.8 billion increased 25% year - over - year and 10% sequentially. The increase in net sales year - over - year is primarily attributed to the addition of Technology Solutions. • On a constant currency basis, net sales increased 19% year - over - year and 6% sequentially. ⁽ ¹ ⁾ CC: constant currency Europe $ in Billions Net Sales
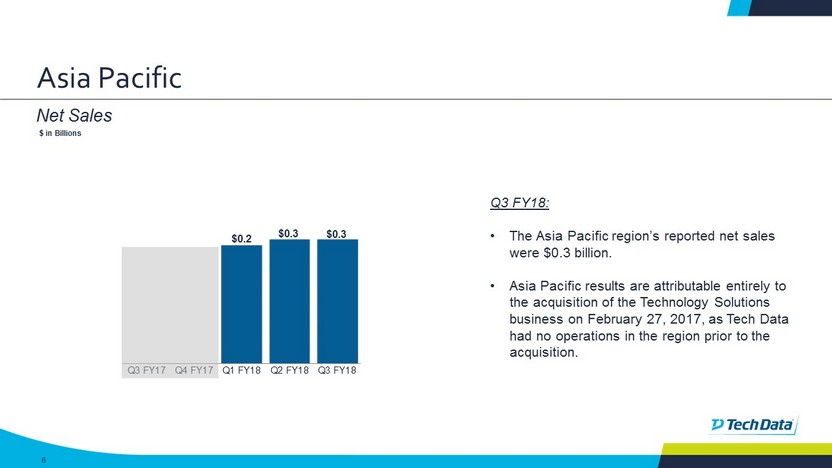
6 Asia Pacific Q3 FY18: • The Asia Pacific region’s reported net sales were $0.3 billion. • Asia Pacific results are attributable entirely to the acquisition of the Technology Solutions business on February 27, 2017, as Tech Data had no operations in the region prior to the acquisition. Q3 FY17 Q4 FY17 Q1 FY18 Q2 FY18 Q3 FY18 Americas $- $- $0.2 $0.2 $0.2 0 0.02 0.04 0.06 0.08 0.1 0.12 0.14 0.16 0.18 0.2 0.22 0.24 0.26 0.28 0.3 0.32 0.34 0.36 0.38 0.4 0.42 0.44 0.46 0.48 0.5 0.52 0.54 0.56 0.58 0.6 0.62 0.64 0.66 0.68 0.7 0.72 0.74 0.76 0.78 0.8 0.82 0.84 0.86 0.88 0.9 0.92 0.94 0.96 0.98 1 $- $0.1 $0.1 $0.2 $0.2 $0.3 $0.3 $0.2 $ in Billions Net Sales $0.3

7 $315.8 $371.0 $457.1 $515.6 $526.1 4.87% 5.00% 5.96% 5.80% 5.76% 3.00% 4.00% 5.00% 6.00% 7.00% 8.00% $- $100.0 $200.0 $300.0 $400.0 $500.0 Q3 FY17 Q4 FY17 Q1 FY18 Q2 FY18 Q3 FY18 Gross Profit Gross Margin Q3 FY18: • Gross profit of $526.1 million increased $210.2 million or 67% compared to the prior - year quarter. • Gross profit margin increased 89 basis points from the prior - year quarter. • The increase in gross profit and gross margin percentage is primarily attributable to the addition of Technology Solutions. Worldwide $ in Millions Gross Profit and Margin

8 (1) Non - GAAP SG&A excludes acquisition - related amortization of intangibles expenses. See GAAP to Non - GAAP reconciliation in the app endix. Q3 FY18: • Non - GAAP SG&A expenses of $390.4 million increased $155.7 million or 66% compared to the prior - year quarter. • Non - GAAP SG&A as a percentage of net sales increased 65 basis points from the prior - year quarter . • The increase in both dollars and percentage of net sales, on a GAAP and non - GAAP basis, is primarily attributable to the addition of Technology Solutions. • GAAP depreciation and amortization expense was $42.3 million compared to $13.1 million in the prior - year quarter. $234.7 $248.9 $333.9 $387.7 $390.4 3.62% 3.35% 4.36% 4.37% 4.27% 2.00% 2.50% 3.00% 3.50% 4.00% 4.50% 5.00% 5.50% 6.00% 6.50% 7.00% $- $50.0 $100.0 $150.0 $200.0 $250.0 $300.0 $350.0 $400.0 Q3 FY17 Q4 FY17 Q1 FY18 Q2 FY18 Q3 FY18 SG&A Expenses (Non - GAAP) (1) $240.0 $253.9 $352.6 $410.6 $416.8 3.70% 3.42% 4.60% 4.62% 4.56% 2.00% 2.50% 3.00% 3.50% 4.00% 4.50% 5.00% 5.50% 6.00% 6.50% 7.00% $- $50.0 $100.0 $150.0 $200.0 $250.0 $300.0 $350.0 $400.0 Q3 FY17 Q4 FY17 Q1 FY18 Q2 FY18 Q3 FY18 SG&A Expenses Worldwide $ in Millions SG&A Expenses

9 ⁽ ¹ ⁾ See the GAAP to Non - GAAP reconciliation in the appendix. Q3 FY18: • Worldwide non - GAAP operating income of $135.7 million increased $54.6 million or 67% compared to the prior - year quarter . • Worldwide non - GAAP operating margin improved 24 basis points from the prior - year quarter. • The increase in operating income, on a GAAP and non - GAAP basis, is primarily attributable to the addition of Technology Solutions. $81.1 $122.1 $123.2 $127.8 $135.7 1.25% 1.64% 1.61% 1.44% 1.49% $- $20.0 $40.0 $60.0 $80.0 $100.0 $120.0 $140.0 $160.0 Q3 FY17 Q4 FY17 Q1 FY18 Q2 FY18 Q3 FY18 $62.9 $103.1 $75.1 $103.5 $79.6 0.97% 1.39% 0.98% 1.17% 0.87% Q3 FY17 Q4 FY17 Q1 FY18 Q2 FY18 Q3 FY18 Operating Income (Non - GAAP) (1 ) Operating Income Worldwide $ in Millions Operating Income

10 (1) Before stock compensation expense. (2) See the GAAP to non - GAAP reconciliation in the appendix. Q3 FY18: • Americas ’ non - GAAP operating income of $85.5 million increased $43.1 million or 101% compared to the prior - year quarter. • Non - GAAP operating margin improved 52 basis points over the prior - year quarter. • The increase in operating income and operating margin percentage, on a GAAP and non - GAAP basis, is primarily attributable to the addition of Technology Solutions. $32.4 $39.3 $50.9 $88.0 $55.6 1.24% 1.45% 1.47% 2.10% 1.39% 0.00% 1.00% 2.00% 3.00% 4.00% 5.00% 6.00% 7.00% 8.00% 9.00% $- $20.0 $40.0 $60.0 $80.0 $100.0 $120.0 Q3 FY17 Q4 FY17 Q1 FY18 Q2 FY18 Q3 FY18 $42.5 $47.4 $78.5 $84.7 $85.5 1.62% 1.75% 2.26% 2.02% 2.14% 0.00% 1.00% 2.00% 3.00% 4.00% 5.00% 6.00% 7.00% 8.00% 9.00% $- $20.0 $40.0 $60.0 $80.0 $100.0 $120.0 Q3 FY17 Q4 FY17 Q1 FY18 Q2 FY18 Q3 FY18 Operating Income (Non - GAAP) ( 2 ) Operating Income Americas $ in Millions Operating Income (1)

11 Europe (1) Before stock compensation expense. (2) See the GAAP to non - GAAP reconciliation in the appendix. Q3 FY18: • The decrease in GAAP operating income and operating margin percentage is primarily due to acquisition, integration and restructuring expenses. • Europe’s non - GAAP operating income of $53.4 million increased $11.2 million or 26% compared to the prior - year quarter. • Non - GAAP operating margin increased 1 basis point from the prior - year quarter. • The increase in non - GAAP operating income and non - GAAP operating margin percentage is primarily attributable to the addition of Technology Solutions. $34.0 $66.7 $24.8 $18.5 $29.9 0.88% 1.41% 0.62% 0.42% 0.62% 0.00% 1.00% 2.00% 3.00% 4.00% 5.00% 6.00% 7.00% $- $20.0 $40.0 $60.0 $80.0 $100.0 Q3 FY17 Q4 FY17 Q1 FY18 Q2 FY18 Q3 FY18 $42.2 $77.7 $44.1 $43.4 $53.4 1.09% 1.65% 1.10% 0.99% 1.10% 0.00% 1.00% 2.00% 3.00% 4.00% 5.00% 6.00% $- $20.0 $40.0 $60.0 $80.0 $100.0 $120.0 Q3 FY17 Q4 FY17 Q1 FY18 Q2 FY18 Q3 FY18 Operating Income (Non - GAAP) ( 2 ) Operating Income $ in Millions Operating Income (1)

12 Asia Pacific (1) Before stock compensation expense. (2) See the GAAP to non - GAAP reconciliation in the appendix. Q3 FY18: • The Asia Pacific region’s non - GAAP operating income was $3.9 million or 1.32% of net sales. • Asia Pacific results are attributable entirely to the acquisition of the Technology Solutions business on February 27, 2017, as Tech Data had no operations in the region prior to the acquisition. $4.3 $5.1 $2.4 2.28% 1.76% 0.82% 0 0.01 0.02 0.03 0.04 0.05 0.06 0.07 0.08 0.09 0.1 0 2 4 6 8 10 12 Q3 FY17 Q4 FY17 Q1 FY18 Q2 FY18 Q3 FY18 $5.2 $6.7 $3.9 2.76% 2.32% 1.32% 0 0.01 0.02 0.03 0.04 0.05 0.06 0.07 0.08 0.09 0.1 0 2 4 6 8 10 12 Q3 FY17 Q4 FY17 Q1 FY18 Q2 FY18 Q3 FY18 Operating Income (Non - GAAP) ( 2 ) Operating Income $ in Millions Operating Income (1)

13 $50.9 $87.0 $70.1 $66.7 $76.7 $1.44 $2.45 $1.87 $1.74 $2.00 $- $1.00 $2.00 $3.00 $4.00 $5.00 $6.00 $- $10.0 $20.0 $30.0 $40.0 $50.0 $60.0 $70.0 $80.0 $90.0 $100.0 Q3 FY17 Q4 FY17 Q1 FY18 Q2 FY18 Q3 FY18. (1) See the GAAP to non - GAAP reconciliation in the appendix. Q3 FY18: • The effective tax rate was 32.1%, compared to 29.3% in the prior - year quarter. Excluding non - GAAP adjustments, the effective tax rate was 30.9%, compared to 30.6% in the prior - year quarter. • Non - GAAP net income of $76.7 million increased $25.8 million or 51% compared to the prior - year quarter . • Non - GAAP Earnings per diluted share of $2.00 increased $0.56 or 39% compared to the prior - year quarter. $36.5 $78.8 $30.7 $47.5 $37.3 $1.03 $2.22 $0.82 $1.24 $0.97 $- $1.00 $2.00 $3.00 $4.00 $5.00 $6.00 Q3 FY17 Q4 FY17 Q1 FY18 Q2 FY18 Q3 FY18 Net Income and EPS (Non - GAAP) ( 1 ) Net Income and EPS $ in Millions Net Income and EPS Worldwide

14 Worldwide $27 $445 $224 $146 $70 -$150 -$50 $50 $150 $250 $350 $450 Q3 FY17 Q4 FY17 Q1 FY18 Q2 FY18 Q3 FY18 Cash Conversion Cycle Q3 FY17 Q4 FY17 Q1 FY18 Q2 FY18 Q3 FY18 Days of Sales Outstanding 40 37 49 51 48 Days of Supply 33 27 30 29 31 Days of Purchases Outstanding (51) (49) (57) (59) (58) Cash Conversion Cycle 22 15 22 21 21 Q3 FY18: • Net cash generated by operations was $ 70 million. • The cash balance at the end of the quarter was $563 million. Cash Metrics $ in Millions Cash Flow from Operations

15 15% 39% 48% 45% 41% Q3FY17 Q4FY17 Q1FY18 Q2FY18 Q3FY18 Debt $365 $1,363 $2,286 $2,268 $1,920 Equity $2,092 $2,170 $2,481 $2,732 $2,724 Debt to Total Capital ratio 15% 39% 48% 45% 41% Debt to Total Capital Worldwide Q3 FY18: • Accumulated other comprehensive income, which consists of currency translation, net of applicable taxes, was $100.4 million • Capital expenditures were $172 million, which includes $156 million related to the purchase of facilities in the U.S. previously leased under our synthetic lease arrangement. • At October 31, 2017, the company had $ 2.7 billion of equity, and 38.15 million shares outstanding resulting in book value of $ 71.39 per share. • At October 31, 2017, the company had approximately $1.8 billion of goodwill and acquired intangibles . Balance Sheet Highlights

16 • Company’s Weighted Average Cost of Capital is approximately 9% (2) (1) See reconciliation of ROIC calculation in appendix. (2) Source: Bloomberg, November 5, 2017. 13% 9% Q3 FY17 TTM Q3 FY18 TTM Adjusted ROIC (1 ) ROIC (1 ) 14% 12% Q3 FY17 TTM Q3 FY18 TTM Return on Invested Capital Worldwide

17 APPENDIX GAAP to Non - GAAP Reconciliations

18 Three months ended October 31, 2016 January 31, 2017 April 30, 2017 July 31, 2017 October 31, 2017 (In thousands) Net Sales $ 6,490,265 $ 7,427,510 $ 7,664,063 $ 8,882,691 $ 9,135,728 GAAP SG&A expenses 239,952$ 253,941$ 352,632$ 410,598$ 416,766$ Acquisition-related intangible assets amortization expense (5,243) (5,063) (18,749) (22,855) (26,385) Non-GAAP SG&A expenses 234,709$ 248,878$ 333,883$ 387,743$ 390,381$ GAAP SG&A percentage of net sales 3.70% 3.42% 4.60% 4.62% 4.56% Non-GAAP SG&A percentage of net sales 3.62% 3.35% 4.36% 4.37% 4.27% Selling, general and administrative ("SG&A") Three months ended SG&A

19 Americas ⁽ ¹ ⁾ Europe ⁽ ¹ ⁾ APAC ⁽ ¹ ⁾ Stock Compensation Expense Consolidated Net Sales 3,997,159$ 4,841,961$ 296,608$ 9,135,728$ GAAP operating income ⁽ ¹ ⁾ 55,551$ 29,909$ 2,432$ (8,325)$ 79,567$ Acquisition, integration and restructuring expenses 14,149 14,128 287 1,184 29,748 Acquisition-related intangible assets amortization expense 15,816 9,362 1,207 26,385 Total non-GAAP operating income adjustments 29,965$ 23,490$ 1,494$ 1,184$ 56,133$ Non-GAAP operating income 85,516$ 53,399$ 3,926$ (7,141)$ 135,700$ GAAP operating margin 1.39% 0.62% 0.82% 0.87% Non-GAAP operating margin 2.14% 1.10% 1.32% 1.49% Three months ended October 31, 2017 ⁽ ¹ ⁾ GAAP operating income does not include stock compensation expense at the regional level. Operating Income Q3 FY18 (In thousands)

20 Americas ⁽ ¹ ⁾ Europe ⁽ ¹ ⁾ APAC ⁽ ¹ ⁾ Stock Compensation Expense Consolidated Net Sales 4,192,475$ 4,402,054$ 288,162$ 8,882,691$ GAAP operating income ⁽ ¹ ⁾ 87,975$ 18,464$ 5,066$ (7,974)$ 103,531$ LCD settlements and other, net (29,971) 1,316 - (28,655) Acquisition, integration and restructuring expenses 14,242 14,685 145 1,045 30,117 Acquisition-related intangible assets amortization expense 12,413 8,965 1,477 22,855 Total non-GAAP operating income adjustments (3,316)$ 24,966$ 1,622$ 1,045$ 24,317$ Non-GAAP operating income 84,659$ 43,430$ 6,688$ (6,929)$ 127,848$ GAAP operating margin 2.10% 0.42% 1.76% 1.17% Non-GAAP operating margin 2.02% 0.99% 2.32% 1.44% Three months ended July 31, 2017 ⁽ ¹ ⁾ GAAP operating income does not include stock compensation expense at the regional level. Operating Income Q2 FY18 (In thousands)
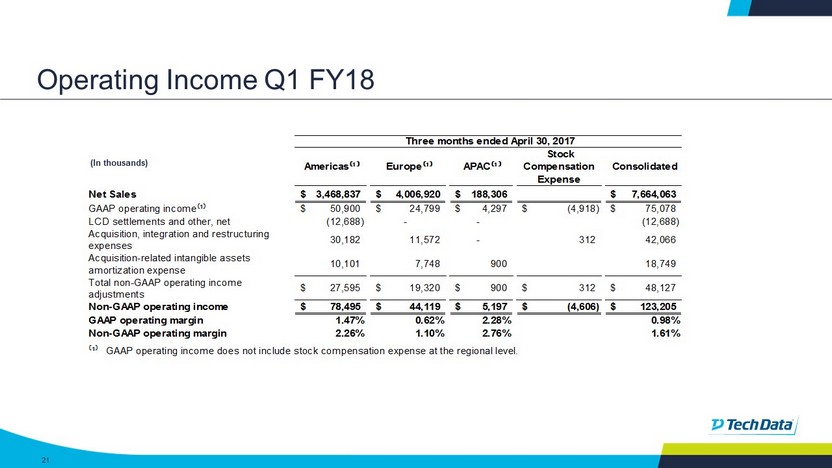
21 Americas ⁽ ¹ ⁾ Europe ⁽ ¹ ⁾ APAC ⁽ ¹ ⁾ Stock Compensation Expense Consolidated Net Sales 3,468,837$ 4,006,920$ 188,306$ 7,664,063$ GAAP operating income ⁽ ¹ ⁾ 50,900$ 24,799$ 4,297$ (4,918)$ 75,078$ LCD settlements and other, net (12,688) - - (12,688) Acquisition, integration and restructuring expenses 30,182 11,572 - 312 42,066 Acquisition-related intangible assets amortization expense 10,101 7,748 900 18,749 Total non-GAAP operating income adjustments 27,595$ 19,320$ 900$ 312$ 48,127$ Non-GAAP operating income 78,495$ 44,119$ 5,197$ (4,606)$ 123,205$ GAAP operating margin 1.47% 0.62% 2.28% 0.98% Non-GAAP operating margin 2.26% 1.10% 2.76% 1.61% Three months ended April 30, 2017 ⁽ ¹ ⁾ GAAP operating income does not include stock compensation expense at the regional level. (In thousands) Operating Income Q1 FY18
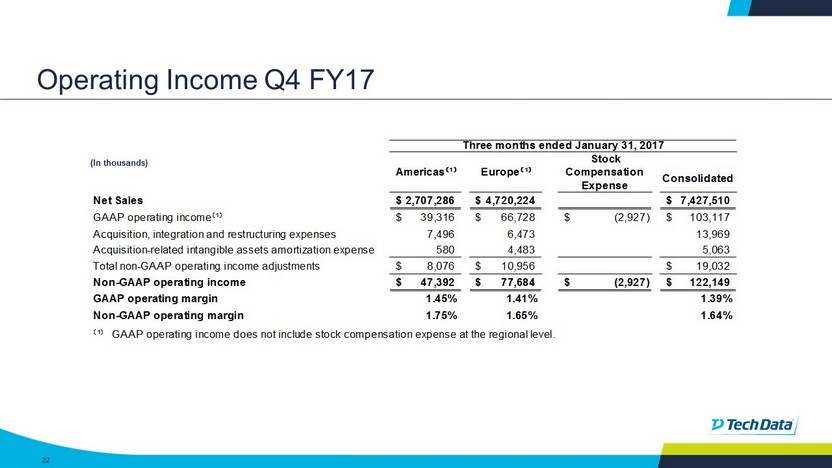
22 Americas ⁽ ¹ ⁾ Europe ⁽ ¹ ⁾ Stock Compensation Expense Consolidated Net Sales 2,707,286$ 4,720,224$ 7,427,510$ GAAP operating income ⁽ ¹ ⁾ 39,316$ 66,728$ (2,927)$ 103,117$ Acquisition, integration and restructuring expenses 7,496 6,473 13,969 Acquisition-related intangible assets amortization expense 580 4,483 5,063 Total non-GAAP operating income adjustments 8,076$ 10,956$ 19,032$ Non-GAAP operating income 47,392$ 77,684$ (2,927)$ 122,149$ GAAP operating margin 1.45% 1.41% 1.39% Non-GAAP operating margin 1.75% 1.65% 1.64% Three months ended January 31, 2017⁽ ¹ ⁾ GAAP operating income does not include stock compensation expense at the regional level. Operating Income Q4 FY17 (In thousands)
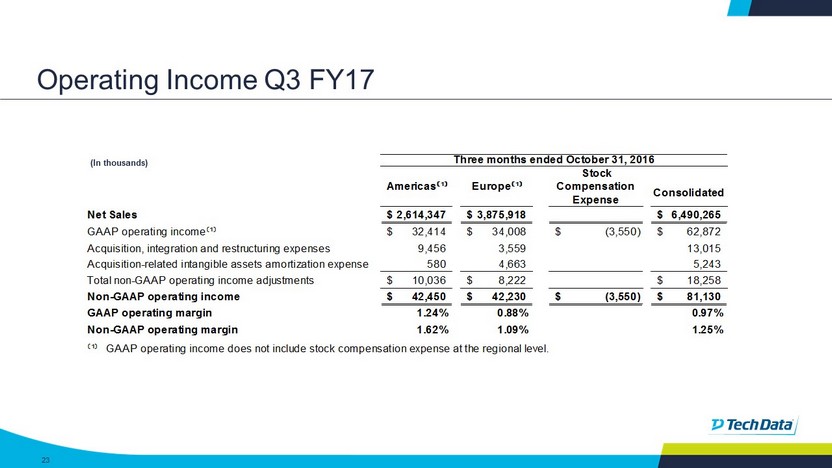
23 Americas ⁽ ¹ ⁾ Europe ⁽ ¹ ⁾ Stock Compensation Expense Consolidated Net Sales 2,614,347$ 3,875,918$ 6,490,265$ GAAP operating income ⁽ ¹ ⁾ 32,414$ 34,008$ (3,550)$ 62,872$ Acquisition, integration and restructuring expenses 9,456 3,559 13,015 Acquisition-related intangible assets amortization expense 580 4,663 5,243 Total non-GAAP operating income adjustments 10,036$ 8,222$ 18,258$ Non-GAAP operating income 42,450$ 42,230$ (3,550)$ 81,130$ GAAP operating margin 1.24% 0.88% 0.97% Non-GAAP operating margin 1.62% 1.09% 1.25% Three months ended October 31, 2016⁽ ¹ ⁾ GAAP operating income does not include stock compensation expense at the regional level. Operating Income Q3 FY17 (In thousands)

24 Net Income Diluted EPS Net Income Diluted EPS Net Income Diluted EPS Net Income Diluted EPS Net Income Diluted EPS GAAP Results $36,506 $1.03 $78,822 $2.22 $30,654 $0.82 $47,459 $1.24 $37,268 $0.97 LCD settlements and other, net - - - - (12,688) (0.34) (28,332) (0.74) - - Acquisition, integration and restructuring expenses 13,015 0.37 13,969 0.39 42,066 1.12 30,117 0.78 29,748 0.77 Acquisition-related intangible assets amortization expense 5,243 0.15 5,063 0.14 18,749 0.50 22,855 0.60 26,385 0.69 Acquisition-related financing expenses 3,414 0.10 8,476 0.24 8,807 0.24 - - - - Income tax effect of the above adjustments (7,277) (0.21) (6,864) (0.19) (17,529) (0.47) (5,367) (0.14) (16,652) (0.43) Reversal of deferred tax valuation allowances - - (12,455) (0.35) - - - - - - Non-GAAP results $50,901 $1.44 $87,011 $2.45 $70,059 $1.87 $66,732 $1.74 $76,749 $2.00 Weighted average shares outstanding - diluted 35,449 35,512 37,468 38,388 38,433 Three months ended, October 31, 2016 January 31, 2017 April 30, 2017 July 31, 2017 October 31, 2017 (In thousands, except per share data) Net Income and EPS
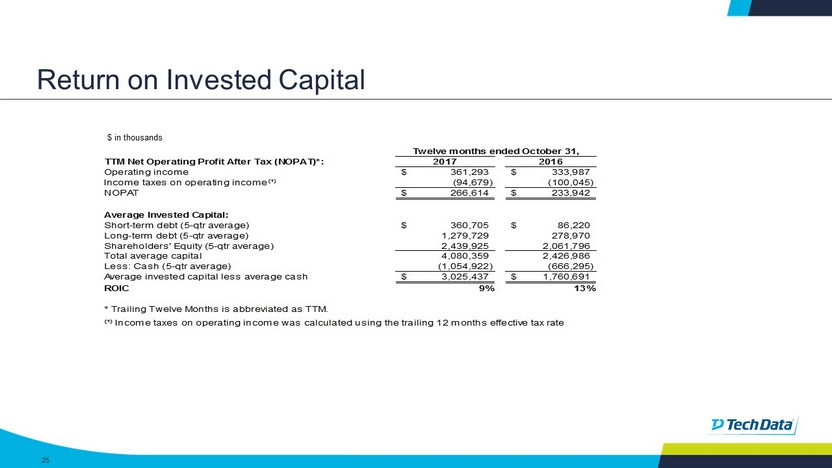
25 TTM Net Operating Profit After Tax (NOPAT)*: 2017 2016 Operating income 361,293$ 333,987$ Income taxes on operating income ⁽ ¹ ⁾ (94,679) (100,045) NOPAT 266,614$ 233,942$ Average Invested Capital: Short-term debt (5-qtr average) 360,705$ 86,220$ Long-term debt (5-qtr average) 1,279,729 278,970 Shareholders' Equity (5-qtr average) 2,439,925 2,061,796 Total average capital 4,080,359 2,426,986 Less: Cash (5-qtr average) (1,054,922) (666,295) Average invested capital less average cash 3,025,437$ 1,760,691$ ROIC 9% 13% * Trailing Twelve Months is abbreviated as TTM. Twelve months ended October 31, ⁽ ¹ ⁾ Income taxes on operating income was calculated using the trailing 12 months effective tax rate $ in thousands Return on Invested Capital

26 TTM Net Operating Profit After Tax (NOPAT), as adjusted *: 2017 2016 Non-GAAP operating income ⁽ ¹ ⁾ 508,902$ 333,593$ Income taxes on non-GAAP operating income ⁽ ² ⁾ (151,859) (95,174) NOPAT, as adjusted 357,043$ 238,419$ Average Invested Capital, as adjusted: Short-term debt (5-qtr average) 360,705$ 86,220$ Long-term debt (5-qtr average) 1,279,729 278,970 Shareholders' Equity (5-qtr average) 2,439,925 2,061,796 Tax effected impact of non-GAAP adjustments ⁽ ³ ⁾ 50,441 (13,338) Total average capital, as adjusted 4,130,800 2,413,648 Less: Cash (5-qtr average) (1,054,922) (666,295) Average invested capital less average cash 3,075,878$ 1,747,353$ Adjusted ROIC 12% 14% * Trailing Twelve Months is abbreviated as TTM. ⁽ ³ ⁾ Represents the 5 quarter average of the year-to-date impact of non-GAAP adjustments. Twelve months ended October 31, ⁽ ² ⁾ Income taxes on non-GAAP operating income was calculated using the trailing 12 months effective tax rate adjusted for the impact of non-GAAP adjustments during the respective periods. ⁽ ¹ ⁾ Represents operating income as adjusted to exclude acquisition, integration and restructuring expenses, LCD settlements and other, net, value added tax assessments and acquisition-related intangible assets amortization expense. $ in thousands Adjusted Return on Invested Capital