Attached files
| file | filename |
|---|---|
| EX-31.1 - EXHIBIT 31.1 - RITCHIE BROS AUCTIONEERS INC | tv478965_ex31-1.htm |
| EX-32.2 - EXHIBIT 32.2 - RITCHIE BROS AUCTIONEERS INC | tv478965_ex32-2.htm |
| EX-32.1 - EXHIBIT 32.1 - RITCHIE BROS AUCTIONEERS INC | tv478965_ex32-1.htm |
| EX-31.2 - EXHIBIT 31.2 - RITCHIE BROS AUCTIONEERS INC | tv478965_ex31-2.htm |
UNITED STATES
SECURITIES AND EXCHANGE COMMISSION
Washington, D.C. 20549
FORM 10-Q
| x | QUARTERLY REPORT PURSUANT TO SECTION 13 OR 15(d) OF THE SECURITIES EXCHANGE ACT OF 1934 | |
| For the quarterly period ended September 30, 2017 | ||
| OR | ||
| ¨ | TRANSITION REPORT PURSUANT TO SECTION 13 OR 15(d) OF THE SECURITIES EXCHANGE ACT OF 1934 | |
| For the transition period from ______ to ______ | ||
Commission file number: 001-13425

| Ritchie Bros. Auctioneers Incorporated |
| (Exact Name of Registrant as Specified in its Charter) |
| Canada | N/A | |
| (State or other jurisdiction of incorporation or organization) | (I.R.S. Employer Identification No.) | |
| 9500 Glenlyon Parkway | ||
| Burnaby, British Columbia, Canada | V5J 0C6 | |
| (Address of Principal Executive Offices) | (Zip Code) |
(778) 331-5500
(Registrant’s Telephone Number, including Area Code)
Indicate by checkmark whether the registrant (1) filed all reports required to be filed by Section 13 or 15(d) of the Securities Exchange Act of 1934 during the preceding 12 months (or for such shorter period that the registrant was required to file such reports), and (2) has been subject to such filing requirements for the past 90 days. Yes x No ¨
Indicate by check mark whether the Registrant has submitted electronically and posted on its corporate Web site, if any, every Interactive Data File required to be submitted and posted pursuant to Rule 405 of Regulation S-T (§ 229.405 of this chapter) during the preceding 12 months (or for such shorter period that the registrant was required to submit and post such files). Yes x No ¨
Indicate by check mark whether the registrant is a large accelerated filer, an accelerated filer, a non-accelerated filer, smaller reporting company, or an emerging growth company. See the definitions of “large accelerated filer,” “accelerated filer,” “smaller reporting company,” and “emerging growth company” in Rule 12b-2 of the Exchange Act.
Large accelerated filer x
Accelerated filer ¨
Non-accelerated filer ¨ (Do not check if a smaller reporting company)
Smaller reporting company ¨
Emerging growth company ¨
If an emerging growth company, indicate by check mark if the registrant has elected not to use the extended transition period for complying with any new or revised financial accounting standards provided pursuant to Section 13(a) of the Exchange Act. ¨
Indicate by check mark whether the registrant is a shell company (as defined in Rule 12b-2 of the Exchange Act):
Yes ¨ No x
Indicate the number of shares outstanding of each of the issuer’s classes of common stock, as of the latest practical date: 107,184,927 common shares, without par value, outstanding as of November 7, 2017.
RITCHIE BROS. AUCTIONEERS INCORPORATED
FORM 10-Q
For the quarter ended September 30, 2017
INDEX
Cautionary Note Regarding Forward-Looking Statements
The information discussed in this Quarterly Report on Form 10-Q of Ritchie Bros. Auctioneers Incorporated (“Ritchie Bros.”, the “Company”, “we” or “us”) includes “forward-looking statements” within the meaning of Section 27A of the Securities Act of 1933 (the “Securities Act”) and Section 21E of the Securities Exchange Act of 1934 (the “Exchange Act”) and Canadian securities laws. These statements are based on our current expectations and estimates about our business and markets, and include, among others, statements relating to:
| · | our future strategy, objectives, targets, projections, performance, and key enablers; |
| · | our ability to drive shareholder value; |
| · | market opportunities; |
| · | our internet initiatives and the level of participation in our auctions by internet bidders, and the success of IronPlanet, EquipmentOne, Marketplacee, and our other online marketplaces; |
| · | our ability to grow our businesses, acquire new customers, enhance our sector reach, drive geographic depth, and scale our operations; |
| · | the impact of our initiatives, services, investments, and acquisitions on us and our customers; |
| · | the acquisition or disposition of properties; |
| · | our ability to integrate our acquisitions; |
| · | our ability to add new business and information solutions, including, among others, our ability to maximize and integrate technology to enhance our existing services and support additional value-added service offerings; |
| · | the supply trend of equipment in the market and the anticipated price environment for late model equipment, as well as the resulting effect on our business and Gross Transaction Value (“GTV”) (defined under “Part I, Item 2: Management’s Discussion and Analysis of Financial Condition and Results of Operations” of this Quarterly Report on Form 10-Q); |
| · | fluctuations in our quarterly revenues and operating performance resulting from the seasonality of our business; |
| · | our compliance with all laws, rules, regulations, and requirements that affect our business; |
| · | effects of various economic, financial, industry, and market conditions or policies, including the supply and demand for property, equipment, or natural resources; |
| · | the behavior of oil and gas equipment pricing; |
| · | the relative percentage of GTV represented by straight commission or underwritten (guarantee and inventory) contracts, and its impact on revenues and profitability; |
| · | our Revenue Rates (described under “Part I, Item 2: Management’s Discussion and Analysis of Financial Condition and Results of Operations” of this Quarterly Report on Form 10-Q), the sustainability of those rates, and the seasonality of GTV and revenues; |
| · | our future capital expenditures and returns on those expenditures; |
| · | the effect of any currency exchange and interest rate fluctuations on our results of operations; |
| · | the grant and satisfaction of equity awards pursuant to our compensation plans; |
| · | any future declaration and payment of dividends, including the tax treatment of any such dividends; |
| · | financing available to us, our ability to refinance borrowings, and the sufficiency of our working capital to meet our financial needs; and |
| · | our ability to satisfy our present operating requirements and fund future growth through existing working capital and credit facilities. |
| Ritchie Bros. | 1 |
Forward-looking statements are typically identified by such words as “aim”, “anticipate”, “believe”, “could”, “continue”, “estimate”, “expect”, “intend”, “may”, “ongoing”, “plan”, “potential”, “predict”, “will”, “should”, “would”, “could”, “likely”, “generally”, “future”, “period to period”, “long-term”, or the negative of these terms, and similar expressions intended to identify forward-looking statements. Our forward-looking statements are not guarantees of future performance and involve risks, uncertainties and assumptions that are difficult to predict.
While we have not described all potential risks related to our business and owning our common shares, the important factors discussed in “Part II, Item 1A: Risk Factors” of this Quarterly Report on Form 10-Q and in “Part I, Item 1A: Risk Factors” of our Annual Report on Form 10-K for the year ended December 31, 2016, which is available on our website at www.rbauction.com, on EDGAR at www.sec.gov, or on SEDAR at www.sedar.com, are among those that we consider may affect our performance materially or could cause our actual financial and operational results to differ significantly from our expectations. Except as required by applicable securities law and regulations of relevant securities exchanges, we do not intend to update publicly any forward-looking statements, even if our expectations have been affected by new information, future events or other developments. You should consider our forward-looking statements in light of the factors listed or referenced under “Risk Factors” herein and other relevant factors.
| Ritchie Bros. | 2 |
| ITEM 1: | CONSOLIDATED FINANCIAL STATEMENTS |
Condensed Consolidated Income Statements
(Expressed in thousands of United States dollars, except share and per share data)
(Unaudited)
| Three months ended | Nine months ended | |||||||||||||||
| September 30, | September 30, | |||||||||||||||
| 2017 | 2016 | 2017 | 2016 | |||||||||||||
| Revenues (note 6) | $ | 141,047 | $ | 128,876 | $ | 431,732 | $ | 419,626 | ||||||||
| Costs of services, excluding depreciation and amortization (note 7) | 19,583 | 14,750 | 53,987 | 49,821 | ||||||||||||
| 121,464 | 114,126 | 377,745 | 369,805 | |||||||||||||
| Selling, general and administrative expenses (note 7) | 85,335 | 68,293 | 230,287 | 209,395 | ||||||||||||
| Acquisition-related costs (note 7) | 3,587 | 5,398 | 35,162 | 7,198 | ||||||||||||
| Depreciation and amortization expenses (note 7) | 14,837 | 10,196 | 37,047 | 30,560 | ||||||||||||
| Gain on disposition of property, plant and equipment | (42 | ) | (570 | ) | (1,071 | ) | (1,017 | ) | ||||||||
| Impairment loss (note 7) | - | 28,243 | 8,911 | 28,243 | ||||||||||||
| Foreign exchange loss (gain) | 816 | 281 | (7 | ) | 332 | |||||||||||
| Operating income | 16,931 | 2,285 | 67,416 | 95,094 | ||||||||||||
| Other income (expense): | ||||||||||||||||
| Interest income | 517 | 369 | 2,459 | 1,354 | ||||||||||||
| Interest expense | (10,558 | ) | (934 | ) | (27,311 | ) | (3,357 | ) | ||||||||
| Equity income (loss) (note 17) | (109 | ) | 213 | (158 | ) | 1,209 | ||||||||||
| Other, net | 184 | 247 | 4,045 | 1,214 | ||||||||||||
| (9,966 | ) | (105 | ) | (20,965 | ) | 420 | ||||||||||
| Income before income taxes | 6,965 | 2,180 | 46,451 | 95,514 | ||||||||||||
| Income tax expense (recovery) (note 8): | ||||||||||||||||
| Current | 1,402 | 9,652 | 17,565 | 35,767 | ||||||||||||
| Deferred | (4,760 | ) | (2,472 | ) | (9,583 | ) | (5,838 | ) | ||||||||
| (3,358 | ) | 7,180 | 7,982 | 29,929 | ||||||||||||
| Net income (loss) | $ | 10,323 | $ | (5,000 | ) | $ | 38,469 | $ | 65,585 | |||||||
| Net income (loss) attributable to: | ||||||||||||||||
| Stockholders | $ | 10,261 | $ | (5,137 | ) | $ | 38,273 | $ | 63,979 | |||||||
| Non-controlling interests | 62 | 137 | 196 | 1,606 | ||||||||||||
| $ | 10,323 | $ | (5,000 | ) | $ | 38,469 | $ | 65,585 | ||||||||
| Earnings (loss) per share attributable to stockholders (note 9): | ||||||||||||||||
| Basic | $ | 0.10 | $ | (0.05 | ) | $ | 0.36 | $ | 0.60 | |||||||
| Diluted | $ | 0.09 | $ | (0.05 | ) | $ | 0.35 | $ | 0.60 | |||||||
| Weighted average number of shares outstanding (note 9): | ||||||||||||||||
| Basic | 107,120,618 | 106,622,376 | 106,993,358 | 106,595,088 | ||||||||||||
| Diluted | 108,178,303 | 107,525,051 | 108,069,624 | 107,221,390 | ||||||||||||
See accompanying notes to the condensed consolidated financial statements.
| Ritchie Bros. | 3 |
Condensed Consolidated Statements of Comprehensive Income
(Expressed in thousands of United States dollars)
(Unaudited)
| Three months ended | Nine months ended | |||||||||||||||
| September 30, | September 30, | |||||||||||||||
| 2017 | 2016 | 2017 | 2016 | |||||||||||||
| Net income (loss) | $ | 10,323 | $ | (5,000 | ) | $ | 38,469 | $ | 65,585 | |||||||
| Other comprehensive income, net of income tax: | ||||||||||||||||
| Foreign currency translation adjustment | 6,009 | 590 | 22,822 | 7,990 | ||||||||||||
| Total comprehensive income (loss) | $ | 16,332 | $ | (4,410 | ) | $ | 61,291 | $ | 73,575 | |||||||
| Total comprehensive income (loss) attributable to: | ||||||||||||||||
| Stockholders | 16,256 | (4,550 | ) | 61,045 | 71,798 | |||||||||||
| Non-controlling interests | 76 | 140 | 246 | 1,777 | ||||||||||||
| $ | 16,332 | $ | (4,410 | ) | $ | 61,291 | $ | 73,575 | ||||||||
See accompanying notes to the condensed consolidated financial statements.
| Ritchie Bros. | 4 |
Condensed Consolidated Balance Sheets
(Expressed in thousands of United States dollars, except share data)
(Unaudited)
| September 30, | December 31, | |||||||
| 2017 | 2016 | |||||||
| Assets | ||||||||
| Current assets: | ||||||||
| Cash and cash equivalents | $ | 224,474 | $ | 207,867 | ||||
| Restricted cash (note 10) | 89,846 | 50,222 | ||||||
| Trade and other receivables | 212,330 | 52,979 | ||||||
| Inventory (note 12) | 46,333 | 28,491 | ||||||
| Advances against auction contracts | 9,983 | 5,621 | ||||||
| Prepaid expenses and deposits | 16,422 | 19,005 | ||||||
| Assets held for sale (note 13) | 654 | 632 | ||||||
| Income taxes receivable | 21,413 | 13,181 | ||||||
| 621,455 | 377,998 | |||||||
| Property, plant and equipment (note 14) | 530,495 | 515,030 | ||||||
| Equity-accounted investments (note 17) | 7,287 | 7,326 | ||||||
| Restricted cash (note 10) | - | 500,000 | ||||||
| Deferred debt issue costs (note 18) | 4,054 | 6,182 | ||||||
| Other non-current assets | 7,198 | 4,027 | ||||||
| Intangible assets (note 15) | 261,122 | 72,304 | ||||||
| Goodwill (note 16) | 669,646 | 97,537 | ||||||
| Deferred tax assets | 28,607 | 19,129 | ||||||
| $ | 2,129,864 | $ | 1,599,533 | |||||
| Liabilities and Equity | ||||||||
| Current liabilities: | ||||||||
| Auction proceeds payable | $ | 360,517 | $ | 98,873 | ||||
| Trade and other payables | 132,045 | 124,694 | ||||||
| Income taxes payable | 1,277 | 5,355 | ||||||
| Short-term debt (note 18) | 8,567 | 23,912 | ||||||
| Current portion of long-term debt (note 18) | 16,985 | - | ||||||
| 519,391 | 252,834 | |||||||
| Long-term debt (note 18) | 800,900 | 595,706 | ||||||
| Share unit liabilities | 2,444 | 4,243 | ||||||
| Other non-current liabilities | 18,118 | 14,583 | ||||||
| Deferred tax liabilities | 62,068 | 36,387 | ||||||
| 1,402,921 | 903,753 | |||||||
| Contingencies (note 21) | ||||||||
| Contingently redeemable performance share units (note 20) | 7,230 | 3,950 | ||||||
| Stockholders' equity (note 19): | ||||||||
| Share capital: | ||||||||
| Common stock; no par value, unlimited shares authorized, issued and outstanding shares: 107,180,726 (December 31, 2016: 106,822,001) | 135,919 | 125,474 | ||||||
| Additional paid-in capital | 38,907 | 27,638 | ||||||
| Retained earnings | 584,263 | 601,071 | ||||||
| Accumulated other comprehensive loss | (44,354 | ) | (67,126 | ) | ||||
| Stockholders' equity | 714,735 | 687,057 | ||||||
| Non-controlling interest | 4,978 | 4,773 | ||||||
| 719,713 | 691,830 | |||||||
| $ | 2,129,864 | $ | 1,599,533 | |||||
See accompanying notes to the condensed consolidated financial statements.
| Ritchie Bros. | 5 |
Condensed Consolidated Statements of Changes in Equity
(Expressed in thousands of United States dollars, except where noted)
(Unaudited)
| Attributable to stockholders | Contingently | |||||||||||||||||||||||||||||||
| Additional | Accumulated | Non- | redeemable | |||||||||||||||||||||||||||||
| Common stock | paid-In | other | controlling | performance | ||||||||||||||||||||||||||||
| Number of | capital | Retained | comprehensive | interest | Total | share units | ||||||||||||||||||||||||||
| shares | Amount | ("APIC") | earnings | income (loss) | ("NCI") | equity | ("PSUs") | |||||||||||||||||||||||||
| Balance, December 31, 2016 | 106,822,001 | $ | 125,474 | $ | 27,638 | $ | 601,071 | $ | (67,126 | ) | $ | 4,773 | $ | 691,830 | $ | 3,950 | ||||||||||||||||
| Net income | - | - | - | 38,273 | - | 196 | 38,469 | - | ||||||||||||||||||||||||
| Other comprehensive income | - | - | - | - | 22,772 | 50 | 22,822 | - | ||||||||||||||||||||||||
| - | - | - | 38,273 | 22,772 | 246 | 61,291 | - | |||||||||||||||||||||||||
| Stock option exercises | 355,514 | 10,354 | (2,420 | ) | - | - | - | 7,934 | - | |||||||||||||||||||||||
| Stock option compensation expense (note 20) | - | - | 10,996 | - | - | - | 10,996 | - | ||||||||||||||||||||||||
| Assumption of stock options on acquisition of IronPlanet (note 22) | - | - | 2,330 | - | - | - | 2,330 | - | ||||||||||||||||||||||||
| Settlement of equity-classified PSUs | 3,211 | 91 | 91 | (172 | ) | |||||||||||||||||||||||||||
| Modification of PSUs (note 20) | - | - | - | (382 | ) | - | - | (382 | ) | 1,803 | ||||||||||||||||||||||
| Equity-classified PSU expense (note 20) | - | - | 340 | - | - | - | 340 | 1,531 | ||||||||||||||||||||||||
| Equity-classified PSU dividend equivalents | - | - | 23 | (126 | ) | - | - | (103 | ) | 103 | ||||||||||||||||||||||
| Change in value of contingently redeemable equity-classified PSUs | - | - | - | (15 | ) | - | - | (15 | ) | 15 | ||||||||||||||||||||||
| Cash dividends paid (note 19) | - | - | - | (54,558 | ) | - | (41 | ) | (54,599 | ) | - | |||||||||||||||||||||
| Balance, September 30, 2017 | 107,180,726 | $ | 135,919 | $ | 38,907 | $ | 584,263 | $ | (44,354 | ) | $ | 4,978 | $ | 719,713 | $ | 7,230 | ||||||||||||||||
See accompanying notes to the condensed consolidated financial statements.
| Ritchie Bros. | 6 |
Condensed Consolidated Statements of Cash Flows
(Expressed in thousands of United States dollars)
(Unaudited)
| Nine months ended September 30, | 2017 | 2016 | ||||||
| Cash provided by (used in): | ||||||||
| Operating activities: | ||||||||
| Net income | $ | 38,469 | $ | 65,585 | ||||
| Adjustments for items not affecting cash: | ||||||||
| Depreciation and amortization expenses (note 7) | 37,047 | 30,560 | ||||||
| Inventory write down (note 12) | 778 | 2,284 | ||||||
| Impairment loss (note 7) | 8,911 | 28,243 | ||||||
| Stock option compensation expense (note 20) | 10,996 | 4,025 | ||||||
| Equity-classified PSU expense (note 20) | 1,871 | 1,222 | ||||||
| Deferred income tax recovery | (9,583 | ) | (5,838 | ) | ||||
| Equity loss (income) less dividends received | 158 | (1,209 | ) | |||||
| Unrealized foreign exchange (gain) loss | (1,011 | ) | 586 | |||||
| Change in fair value of contingent consideration | (2,194 | ) | - | |||||
| Gain on disposition of property, plant and equipment | (1,071 | ) | (1,017 | ) | ||||
| Debt issue cost amortization | 2,058 | - | ||||||
| Other, net | 239 | - | ||||||
| Net changes in operating assets and liabilities (note 10) | 10,547 | 36,980 | ||||||
| Net cash provided by operating activities | 97,215 | 161,421 | ||||||
| Investing activities: | ||||||||
| Acquisition of IronPlanet, net of cash acquired (note 22) | (675,851 | ) | - | |||||
| Acquisition of Mascus (note 22) | - | (28,123 | ) | |||||
| Acquisition of Petrowsky (note 22) | - | (6,250 | ) | |||||
| Acquisition of contingently redeemable NCI (note 23) | - | (41,092 | ) | |||||
| Acquisition of NCI (note 22) | - | (226 | ) | |||||
| Property, plant and equipment additions | (8,086 | ) | (12,600 | ) | ||||
| Intangible asset additions | (20,482 | ) | (12,041 | ) | ||||
| Proceeds on disposition of property, plant and equipment | 3,487 | 3,259 | ||||||
| Other, net | (667 | ) | (243 | ) | ||||
| Net cash used in investing activities | (701,599 | ) | (97,316 | ) | ||||
| Financing activities: | ||||||||
| Issuances of share capital | 7,934 | 20,702 | ||||||
| Share repurchase (note 19) | - | (36,726 | ) | |||||
| Dividends paid to stockholders (note 19) | (54,558 | ) | (52,303 | ) | ||||
| Dividends paid to NCI | (41 | ) | (3,436 | ) | ||||
| Proceeds from short-term debt | 6,850 | 52,584 | ||||||
| Repayment of short-term debt | (22,793 | ) | (28,641 | ) | ||||
| Proceeds from long-term debt | 325,000 | 46,572 | ||||||
| Repayment of long-term debt | (104,729 | ) | (46,568 | ) | ||||
| Debt issue costs | (12,624 | ) | (844 | ) | ||||
| Repayment of finance lease obligations | (1,565 | ) | (1,282 | ) | ||||
| Other, net | (129 | ) | 332 | |||||
| Net cash provided by (used in) financing activities | 143,345 | (49,610 | ) | |||||
| Effect of changes in foreign currency rates on cash, cash equivalents, and restricted cash | 17,270 | 6,656 | ||||||
| Cash, cash equivalents, and restricted cash: | ||||||||
| Increase (decrease) | (443,769 | ) | 21,151 | |||||
| Beginning of period | 758,089 | 293,246 | ||||||
| Cash, cash equivalents, and restricted cash, end of period (note 10) | $ | 314,320 | 314,397 | |||||
See accompanying notes to the condensed consolidated financial statements.
| Ritchie Bros. | 7 |
Notes to the Condensed Consolidated Financial Statements
(Tabular amounts expressed in thousands of United States dollars, except where noted)
(Unaudited)
1. General information
Ritchie Bros. Auctioneers Incorporated and its subsidiaries (collectively referred to as the “Company”) provide global asset management and disposition services, offering customers end-to-end solutions for buying and selling used industrial equipment and other durable assets through its unreserved auctions, online marketplaces, listing services, and private brokerage services. Ritchie Bros. Auctioneers Incorporated is a company incorporated in Canada under the Canada Business Corporations Act, whose shares are publicly traded on the Toronto Stock Exchange (“TSX”) and the New York Stock Exchange (“NYSE”).
2. Significant accounting policies
(a) Basis of preparation
These unaudited condensed consolidated interim financial statements have been prepared in accordance with United States generally accepted accounting principles (“US GAAP”). They include the accounts of Ritchie Bros. Auctioneers Incorporated and its subsidiaries from their respective dates of formation or acquisition. All significant intercompany balances and transactions have been eliminated.
Certain information and footnote disclosure required by US GAAP for complete annual financial statements have been omitted and, therefore, these unaudited condensed consolidated interim financial statements should be read in conjunction with the Company’s audited consolidated financial statements for the year ended December 31, 2016, included in the Company’s Annual Report on Form 10-K, filed with the Securities Exchange Commission (“SEC”). In the opinion of management, these unaudited condensed consolidated interim financial statements reflect all adjustments, consisting of normal recurring adjustments, which are necessary to present fairly, in all material respects, the Company’s consolidated financial position, results of operations, cash flows and changes in equity for the interim periods presented. The preparation of financial statements in conformity with US GAAP requires management to make estimates and assumptions that affect the amounts reported in the financial statements and accompanying notes. Actual results could differ from those estimates.
(b) Revenue recognition
Revenues are comprised of:
| · | commissions earned at the Company’s auctions through the Company acting as an agent for consignors of equipment and other assets, as well as commissions on online marketplace sales, and |
| · | fees earned in the process of conducting auctions, including online marketplace listing and inspection fees, fees from value-added services and make-ready activities, as well as fees paid by buyers on online marketplace sales. |
The Company recognizes revenue when persuasive evidence of an arrangement exists, delivery has occurred or services have been rendered, the price is fixed or determinable, and collectability is reasonably assured. For auction or online marketplace sales, revenue is recognized when the auction or online marketplace sale is complete and the Company has determined that the sale proceeds are collectible. Revenue is measured at the fair value of the consideration received or receivable and is shown net of value-added tax and duties.
Commissions from sales at the Company’s auctions represent the percentage earned by the Company on the gross auction proceeds from equipment and other assets sold at auction. The majority of the Company’s commissions are earned as a pre-negotiated fixed rate of the gross selling price. Other commissions from sales at the Company’s auctions are earned from underwritten commission contracts, when the Company guarantees a certain level of proceeds to a consignor or purchases inventory to be sold at auction. Commissions also include those earned on online marketplace sales.
| Ritchie Bros. | 8 |
Notes to the Condensed Consolidated Financial Statements
(Tabular amounts expressed in thousands of United States dollars, except where noted)
(Unaudited)
2. Significant accounting policies (continued)
(b) Revenue recognition (continued)
Commission and fee revenues from sales at auction
The Company accepts equipment and other assets on consignment or takes title for a short period of time prior to auction, stimulates buyer interest through professional marketing techniques, and matches sellers (also known as consignors) to buyers through the auction or private sale process.
In its role as auctioneer, the Company matches buyers to sellers of equipment on consignment, as well as to inventory held by the Company, through the auction process. Following the auction, the Company invoices the buyer for the purchase price of the property, collects payment from the buyer, and where applicable, remits to the consignor the net sale proceeds after deducting its commissions, expenses, and applicable taxes. Commissions are calculated as a percentage of the hammer price of the property sold at auction. Fees earned in the process of conducting the Company’s auctions include administrative, documentation, and advertising fees.
On the fall of the auctioneer’s hammer, the highest bidder becomes legally obligated to pay the full purchase price, which is the hammer price of the property purchased and the seller is legally obligated to relinquish the property in exchange for the hammer price less any seller’s commissions. Commission and fee revenue is recognized on the date of the auction sale upon the fall of the auctioneer’s hammer, which is the point in time when the Company has substantially accomplished what it must do to be entitled to the benefits represented by the revenues. Subsequent to the date of the auction sale, the Company’s remaining obligations for its auction services relate only to the collection of the purchase price from the buyer and the remittance of the net sale proceeds to the seller. These remaining service obligations are not an essential part of the auction services provided by the Company.
Under the standard terms and conditions of its auction sales, the Company is not obligated to pay a consignor for property that has not been paid for by the buyer, provided the property has not been released to the buyer. In the rare event where a buyer refuses to take title of the property, the sale is cancelled in the period in which the determination is made, and the property is returned to the consignor or placed in a later auction. Historically, cancelled sales have not been material in relation to the aggregate hammer price of property sold at auction.
Commission revenues are recorded net of commissions owed to third parties, which are principally the result of situations when the commission is shared with a consignor or with the counterparty in an auction guarantee risk and reward sharing arrangement. Additionally, in certain situations, commissions are shared with third parties who introduce the Company to consignors who sell property at auction.
Underwritten commission contracts can take the form of guarantee or inventory contracts. Guarantee contracts typically include a pre-negotiated percentage of the guaranteed gross proceeds plus a percentage of proceeds in excess of the guaranteed amount. If actual auction proceeds are less than the guaranteed amount, commission is reduced; if proceeds are sufficiently lower, the Company can incur a loss on the sale. Losses, if any, resulting from guarantee contracts are recorded in the period in which the relevant auction is completed. If a loss relating to a guarantee contract held at the period end to be sold after the period end is known or is probable and estimable at the financial statement reporting date, the loss is accrued in the financial statements for that period. The Company’s exposure from these guarantee contracts fluctuates over time (note 21).
Revenues related to inventory contracts are recognized in the period in which the sale is completed, title to the property passes to the purchaser and the Company has fulfilled any other obligations that may be relevant to the transaction, including, but not limited to, delivery of the property. Revenue from inventory sales is presented net of costs within revenues on the consolidated income statement, as the Company takes title only for a short period of time and the risks and rewards of ownership are not substantially different than the Company’s other underwritten commission contracts.
| Ritchie Bros. | 9 |
Notes to the Condensed Consolidated Financial Statements
(Tabular amounts expressed in thousands of United States dollars, except where noted)
(Unaudited)
2. Significant accounting policies (continued)
(b) Revenue recognition (continued)
Commissions and fees on online marketplace sales
Through its online marketplaces, the Company typically sells equipment or other assets on consignment from sellers and stimulates buyer interest through sales and marketing techniques in order to match online marketplace sellers with buyers. Prior to offering an item for sale on its online marketplaces, the Company performs required inspections, title and lien searches, and make-ready activities to prepare the item for sale.
Online marketplace revenues are primarily driven by seller commissions, fees charged to sellers for listing and inspecting equipment, and amounts paid by buyers, including buyer transaction fees and buyer’s premiums. The Company also generates revenue from related online marketplace services including make-ready activities, logistics coordination, storage, private auction hosting, and asset appraisals. Online marketplace sale commission and fee revenues are recognized when the sale is complete, which is generally at the conclusion of the marketplace transaction between the seller and buyer. This occurs when a buyer has become legally obligated to pay the purchase price and buyer transaction fee for an asset that the seller is obligated to relinquish in exchange for the sales price less seller commissions and listing fees. At that time, the Company has substantially performed what it must do to be entitled to receive the benefits represented by its commissions and fees.
Following the sale of the item, the Company invoices the buyer for the purchase price of the asset, taxes, and the buyer transaction fee or buyer’s premium, collects payment from the buyer, and remits the proceeds – net of the seller commissions, listing fees, and applicable taxes – to the seller. The Company notifies the seller when the buyer payment has been received in order to clear release of the equipment or other asset to the seller. These remaining service obligations are not viewed to be an essential part of the services provided by the Company.
Under the Company’s standard terms and conditions, it is not obligated to pay the seller for items in an online marketplace sale in which the buyer has not paid for the purchased item. If the buyer defaults on its payment obligation, the equipment or other assets may be returned to the seller or moved into a subsequent online marketplace event.
Online marketplace commission revenue is reduced by a provision for disputes, which is an estimate of disputed items that are expected to be settled at a cost to the Company. This provision is related to settlement of discrepancies under the Company’s equipment condition certification program. The equipment condition certification refers to a written inspection report provided to potential buyers that reflects the condition of a specific piece of equipment offered for sale, and includes ratings, comments, and photographs of the equipment following inspection by one of the Company’s equipment inspectors. The equipment condition certification provides that a buyer may file a written dispute claim during an eligible dispute period for consideration and resolution at the sole determination of the Company if the purchased equipment is not substantially in the condition represented in the inspection report. Typically disputes under the equipment condition certification program are settled with minor repairs or additional services, such as washing or detailing the item; the estimated costs of such items or services are included in the provision for disputes.
For guarantee contracts, if actual online marketplace sale proceeds are less than the guaranteed amount, the commission earned is reduced; if proceeds are sufficiently lower, the Company may incur a loss on the sale. If such consigned equipment sells above the minimum price, the Company may be entitled to a share of the excess proceeds as negotiated with the seller. The Company’s share of the excess, if any, is recorded in revenue together with the related online marketplace sale commission. Losses, if any, resulting from guarantee contracts are recorded in revenue in the period in which the relevant online marketplace sale was completed. If a loss relating to a guarantee contract held at the period end to be sold after the period end is known or is probable and estimable at the financial statement reporting date, the loss is accrued in the financial statements for that period. The Company’s exposure from these guarantee contracts fluctuates over time (note 21).
| Ritchie Bros. | 10 |
Notes to the Condensed Consolidated Financial Statements
(Tabular amounts expressed in thousands of United States dollars, except where noted)
(Unaudited)
2. Significant accounting policies (continued)
(b) Revenue recognition (continued)
Commissions and fees on online marketplace sales (continued)
For inventory contracts related to online marketplace sales, revenue from the sale of inventory through the Company’s online marketplaces are recorded net of acquisition costs because the acquisition of equipment in advance of an online marketplace sale is an ancillary component of the Company’s business and, in general, the risks and rewards of ownership are not substantially different than the Company’s other guarantee contracts. Since the online marketplace sale business is a net business, gross sales proceeds are not reported as revenue in the consolidated income statement. Rather, the net commission earned from online marketplace sales is reported as revenue, which reflects the Company’s agency relationship between buyers and sellers of equipment.
Other fees
Fees from value-added services include financing, appraisal, and technology service fees. Fees are recognized in the period in which the service is provided to the customer.
(c) Costs of services, excluding depreciation and amortization expenses
Costs of services are comprised of expenses incurred in direct relation to conducting auctions (“direct expenses”), earning online marketplace revenues, and earning other fee revenues. Direct expenses include direct labour, buildings and facilities charges, and travel, advertising and promotion costs.
Costs of services incurred to earn online marketplace revenues include inspection costs, facilities costs, inventory management, referral, sampling, and appraisal fees. Inspections are generally performed at the seller’s physical location. The cost of inspections include payroll costs and related benefits for the Company’s employees that perform and manage field inspection services, the related inspection report preparation and quality assurance costs, fees paid to contractors who perform field inspections, related travel and incidental costs for the Company’s inspection service organization, and office and occupancy costs for its inspection services personnel. Costs of earning online marketplace revenues also include costs for the Company’s customer support, online marketplace operations, logistics, title and lien investigation functions, and lease and operations costs related to the Company’s third-party data centers at which its websites are hosted.
Costs of services incurred in earning other fee revenues include direct labour (including commissions on sales), software maintenance fees, and materials. Costs of services exclude depreciation and amortization expenses.
(d) Share-based payments
The Company classifies a share-based payment award as an equity or liability payment based on the substantive terms of the award and any related arrangement.
Equity-classified share-based payments
The Company has three stock option compensation plans that provide for the award of stock options to selected employees, directors and officers of the Company. The cost of options granted is measured at the fair value of the underlying option at the grant date using the Black-Scholes option pricing model. The Company also has a senior executive PSU plan that provides for the award of PSUs to selected senior executives of the Company. The Company has the option to settle certain share unit awards in cash or shares and expects to settle them in shares. The cost of PSUs granted is measured at the fair value of the underlying PSUs at the grant date using a binomial model.
| Ritchie Bros. | 11 |
Notes to the Condensed Consolidated Financial Statements
(Tabular amounts expressed in thousands of United States dollars, except where noted)
(Unaudited)
| 2. | Significant accounting policies (continued) |
(d) Share-based payments (continued)
Equity-classified share-based payments (continued)
This fair value of awards expected to vest under these plans is expensed over the respective remaining service period of the individual awards, on an accelerated recognition basis, with the corresponding increase to APIC recorded in equity. At the end of each reporting period, the Company revises its estimate of the number of equity instruments expected to vest. The impact of the revision of the original estimates, if any, is recognized in earnings, such that the consolidated expense reflects the revised estimate, with a corresponding adjustment to equity.
Any consideration paid on exercise of the stock options is credited to the common shares. Dividend equivalents on the equity-classified PSUs are recognized as a reduction to retained earnings over the service period.
PSUs awarded under the senior executive and employee PSU plans (described in note 20) are contingently redeemable in cash in the event of death of the participant. The contingently redeemable portion of the senior executive PSU awards, which represents the amount that would be redeemable based on the conditions at the date of grant, to the extent attributable to prior service, is recognized as temporary equity. The balance reported in temporary equity increases on the same basis as the related compensation expense over the service period of the award, with any excess of the temporary equity value over the amount recognized in compensation expense charged against retained earnings. In the event it becomes probable an award is going to become eligible for redemption by the holder, the award would be reclassified to a liability award.
Liability-classified share-based payments
The Company maintains other share unit compensation plans that vest over a period of up to five years after grant. Under those plans, the Company is either required or expects to settle vested awards on a cash basis or by providing cash to acquire shares on the open market on the employee’s behalf, where the settlement amount is determined using the volume weighted average price of the Company’s common shares for the twenty days prior to the vesting date or, in the case of deferred share unit (“DSU”) recipients, following cessation of service on the Board of Directors.
These awards are classified as liability awards, measured at fair value at the date of grant and re-measured at fair value at each reporting date up to and including the settlement date. The determination of the fair value of the share units under these plans is described in note 20. The fair value of the awards is expensed over the respective vesting period of the individual awards with recognition of a corresponding liability. Changes in fair value after vesting are recognized through compensation expense. Compensation expense reflects estimates of the number of instruments expected to vest.
The impact of forfeitures and fair value revisions, if any, are recognized in earnings such that the cumulative expense reflects the revisions, with a corresponding adjustment to the settlement liability. Liability-classified share unit liabilities due within 12 months of the reporting date are presented in trade and other payables while settlements due beyond 12 months of the reporting date are presented in non-current liabilities.
(e) Restricted cash
In certain jurisdictions, local laws require the Company to hold cash in segregated bank accounts, which are used to settle auction proceeds payable resulting from auctions and online marketplace sales conducted in those regions. In addition, the Company also holds cash generated from its EquipmentOne online marketplace sales in separate escrow accounts, for settlement of the respective online marketplace transactions as a part of its secured escrow service. Restricted cash balances also include funds held in accounts owned by the Company in support of short-term stand-by letters of credit to provide seller security.
| Ritchie Bros. | 12 |
Notes to the Condensed Consolidated Financial Statements
(Tabular amounts expressed in thousands of United States dollars, except where noted)
(Unaudited)
| 2. | Significant accounting policies (continued) |
(e) Restricted cash (continued)
During the period from December 21, 2016 through May 31, 2017, non-current restricted cash consisted of funds held in escrow pursuant to the offering of senior unsecured notes (note 18), which were only available when the Company received approval to acquire IronPlanet Holdings, Inc. (“IronPlanet”) and whose use was restricted to the funding of the IronPlanet acquisition (note 22).
(f) Inventories
Inventory consists of equipment and other assets purchased for resale in an upcoming Company auction or online marketplace event. Inventory is valued at the lower of cost and net realizable value where net realizable value represents the expected sale price upon disposition less make-ready costs and the costs of disposal and transportation. The significant elements of cost include the acquisition price of the inventory and make-ready costs to prepare the inventory for sale that are not selling expenses. The specific identification method is used to determine amounts removed from inventory. Write-downs to the carrying value of inventory are recorded in revenue in the consolidated income statement.
(g) Intangible assets
Intangible assets are measured at cost less accumulated amortization and accumulated impairment losses. Cost includes all expenditures that are directly attributable to the acquisition or development of the asset, net of any amounts received in relation to those assets, including scientific research and experimental development tax credits. Costs of internally developed software are amortized on a straight-line basis over the remaining estimated economic life of the software product. Costs related to software incurred prior to establishing technological feasibility or the beginning of the application development stage of software are charged to operations as such costs are incurred. Once technological feasibility is established or the application development stage has begun, directly attributable costs are capitalized until the software is available for use.
Amortization is recognized in net earnings on a straight-line basis over the estimated useful lives of intangible assets from the date that they are available for use. The estimated useful lives are:
| Asset | Basis | Rate / term | |||
| Trade names and trademarks | Straight-line | 3 - 15 years or indefinite-lived | |||
| Customer relationships | Straight-line | 6 - 20 years | |||
| Software assets | Straight-line | 3 - 7 years |
Customer relationships includes relationships with buyers and sellers.
(h) Goodwill
Goodwill represents the excess of the purchase price of an acquired enterprise over the fair value assigned to the assets acquired and liabilities assumed in a business combination.
Goodwill is not amortized, but it is tested annually for impairment at the reporting unit level as of December 31 and between annual tests if indicators of potential impairment exist. The Company has the option of performing a qualitative assessment of a reporting unit to first determine whether the quantitative impairment test is necessary. This involves an assessment of qualitative factors to determine the existence of events or circumstances that would indicate whether it is more likely than not that the carrying amount of the reporting unit to which goodwill belongs is less than its fair value. If the qualitative assessment indicates it is not more likely than not that the reporting unit’s carrying amount is less than its fair value, a quantitative impairment test is not required.
| Ritchie Bros. | 13 |
Notes to the Condensed Consolidated Financial Statements
(Tabular amounts expressed in thousands of United States dollars, except where noted)
(Unaudited)
| 2. | Significant accounting policies (continued) |
(h) Goodwill (continued)
Where a quantitative impairment test is required, the procedure is to identify potential impairment by comparing the reporting unit’s fair value with its carrying amount, including goodwill. The reporting unit’s fair value is determined using various valuation approaches and techniques that involve assumptions based on what the Company believes a hypothetical marketplace participant would use in estimating fair value on the measurement date. An impairment loss is recognized as the difference between the reporting unit’s carrying amount and its fair value. If the difference between the reporting unit’s carrying amount and fair value is greater than the amount of goodwill allocated to the reporting unit, the impairment loss is restricted by the amount of the goodwill allocated to the reporting unit.
| (i) | Early adoption of new accounting pronouncements |
| (i) | In January 2017, the Financial Accounting Standards Board (“FASB”) issued Accounting Standards Update (“ASU”) 2017-04, Intangibles – Goodwill and Other (Topic 350): Simplifying the Test for Goodwill Impairment, which eliminates Step 2 from the goodwill impairment test. Entities still have the option of performing a qualitative assessment of a reporting unit to first determine whether the quantitative impairment test is necessary. Where an annual or interim quantitative impairment test is necessary, there is only one step, which is to compare the fair value of a reporting unit with its carrying value. An impairment loss is recognized as the difference between the reporting unit’s carrying amount and its fair value to the extent the difference does not exceed the total amount of goodwill allocated to the reporting unit. |
ASU 2017-04 is effective for fiscal years, and interim periods within those fiscal years, beginning after December 15, 2019. Early adoption is permitted for interim and annual goodwill impairment tests performed on testing dates after January 1, 2017. The amendments are applied on a prospective basis. Because the amendments reduce the cost and complexity of goodwill impairment testing, the Company has early adopted ASU 2017-04 in the first quarter of 2017.
| (ii) | In June 2017, the Company adopted ASU 2017-09, Compensation – Stock Compensation (Topic 718): Scope of Modification Accounting. ASU 2017-09 clarifies that the effects of a modification should be accounted for unless all the following criteria are met: |
| 1. | The fair value (or calculated or intrinsic value, as appropriate) of the modified award is the same as the fair value (or calculated or intrinsic value, as appropriate) of the original award immediately before the modification. The value immediately before and after the modification does not have to be estimated if the modification does affect any of the inputs to the valuation technique used to value the award. |
| 2. | The modified award’s vesting conditions are the same as those of the original award immediately before the modification. |
| 3. | The classification of the modified award as an equity or liability instrument is the same as the original award’s classification immediately before the modification. |
Adoption of this standard did not have a significant impact on the Company’s consolidated financial statements.
| Ritchie Bros. | 14 |
Notes to the Condensed Consolidated Financial Statements
(Tabular amounts expressed in thousands of United States dollars, except where noted)
(Unaudited)
| 2. | Significant accounting policies (continued) |
(j) New and amended accounting standards
| (i) | Effective January 1, 2017, the Company adopted ASU 2016-06, Derivatives and Hedging (Topic 815): Contingent Put and Call Options in Debt Instruments, which impacts entities that are issuers of or investors in debt instruments – or hybrid financial instruments determined to have a debt host – with embedded call (put) options. One of the criteria for bifurcating an embedded derivative is assessing whether the economic characteristics and risks of call (put) options are clearly and closely related to those of their debt hosts. The amendments of ASU 2016-06 clarify the steps required in making this assessment for contingent call (put) options that can accelerate the payment of principal on debt instruments. Specifically, ASU 2016-06 requires the call (or put) options to be assessed solely in accordance with a four-step decision sequence. Consequently, when a call (put) option is contingently exercisable, an entity does not have to assess whether the triggering event is related to interest rates or credit risks. The standard was applied on a modified retrospective basis to existing debt instruments as of January 1, 2017. Adoption of this standard did not have a significant impact on the Company’s consolidated financial statements. |
| (ii) | Effective January 1, 2017, the Company adopted ASU 2016-09, Compensation – Stock Compensation (Topic 718): Improvements to Employee Share-Based Payment Accounting, which requires an entity to recognize share-based payment (“SBP”) award income tax effects in the consolidated income statement when the awards vest or are settled. Consequently, the requirement for entities to track additional paid-in capital (“APIC”) pools is eliminated. Other amendments include: |
| · | All excess tax benefits and tax deficiencies (including tax benefits of dividends on share-based payment awards) are recognized as income tax expense or benefit in the consolidated income statement. The tax effects of exercised or vested awards are treated as discrete items in the reporting period in which they occur. Excess tax benefits are recognized regardless of whether the benefit reduces taxes payable in the current period. These amendments were applied prospectively. |
| · | Because excess taxes no longer flow through APIC, when applying the treasury stock method in calculating diluted earnings per share (“EPS”), the assumed proceeds will no longer include any estimated excess taxes. Excess tax benefits increase assumed proceeds, which results in more hypothetical shares being reacquired. The incremental number of dilutive shares for diluted EPS is calculated as the number of shares from the assumed exercise of the stock less the hypothetical shares reacquired. Therefore, removing excess tax benefits from the equation results in fewer hypothetical shares being reacquired, increasing the incremental number of dilutive shares. |
| · | Excess tax benefits are classified along with other income tax cash flows as an operating activity in the statement of cash flows. The Company elected to apply this amendment prospectively. |
| · | An entity can make an entity-wide accounting policy election to either estimate the number of awards that are expected to vest or account for forfeitures as they occur. Since forfeiture rates of the Company’s stock awards have historically been nominal and represent an insignificant assumption used in management’s estimate of the fair value of those awards, the Company has elected to account for forfeitures as they occur. This accounting policy change was applied on a modified retrospective basis and did not have an impact on the Company’s consolidated financial statements. |
| · | The threshold to qualify for equity classification permits withholding up to the maximum statutory tax rates in the applicable jurisdictions. This amendment was applied on a modified retrospective basis. |
| · | Cash paid by an employer when directly withholding shares for tax-withholding purposes is classified as a financing activity in the statement of cash flows. This amendment was applied prospectively. |
Adoption of this standard did not have a significant impact on the Company’s consolidated financial statements.
| Ritchie Bros. | 15 |
Notes to the Condensed Consolidated Financial Statements
(Tabular amounts expressed in thousands of United States dollars, except where noted)
(Unaudited)
2. Significant accounting policies (continued)
(k) Recent accounting standards not yet adopted
| (i) | In May 2014, the FASB issued ASU 2014-09, Revenue from Contracts with Customers (Topic 606), which requires an entity to recognize revenue when it transfers promised goods or services to customers in an amount that reflects the consideration to which the entity expects to be entitled in exchange for those goods or services. In particular, it moves away from the current industry and transaction specific requirements. ASU 2014-09 creates a five-step model that requires entities to exercise judgment when considering the terms of the contract(s) which include: |
| 1. | Identifying the contract(s) with the customer, |
| 2. | Identifying the separate performance obligations in the contract, |
| 3. | Determining the transaction price, |
| 4. | Allocating the transaction price to the separate performance obligations, and |
| 5. | Recognizing revenue as each performance obligation is satisfied. |
The amendments also contain extensive disclosure requirements designed to enable users of the financial statements to understand the nature, amount, timing and uncertainty of revenue and cash flows arising from contracts with customers. In July 2015, the FASB delayed the effective date of ASU 2014-09 by one year so that ASU 2014-09 is effective for fiscal years, and interim periods within those fiscal years, beginning after December 15, 2017. ASU 2014-09 permits the use of either the retrospective or modified retrospective (cumulative effect) transition method.
In 2015, the Company established a global new revenue accounting standard adoption team, consisting of financial reporting and accounting advisory representatives from across all geographical regions and business operations (the “Team”). The Team developed an adoption framework that continues to be used as guidance in identifying the Company’s significant contracts with customers. In 2016, the Team commenced its analysis, with the initial focus being on the impact of the amendments on accounting for the Company’s straight commission contracts, underwritten (inventory and guarantee) commission contracts, and ancillary service contracts. The Team is currently in the process of identifying the appropriate changes to our business processes, systems, and controls required to adopt the amendments based on preliminary findings.
Since its inception, the Team has regularly reported the findings and progress of the adoption project to management and the Audit Committee. Based on these findings and analysis, management has determined that the Company will not early adopt ASU 2014-09. The Company had previously planned on using a modified retrospective (cumulative-effect) method of adoption. The reason for not early adopting and for electing to use a modified retrospective method was primarily due to the Company’s acquisition of IronPlanet Holdings, Inc. (“IronPlanet”) on May 31, 2017. The IronPlanet acquisition added complexity to applying the amendments retrospectively, and as such, the modified retrospective method of adoption was chosen.
As the Team continues to make progress in its adoption project, it now believes that it will be able to adopt ASU 2014-09 using a full retrospective method, which it anticipates will provide more useful comparative information to financial statement users. The Company also continues to evaluate recently issued guidance on practical expedients as part of the adoption method decision.
| Ritchie Bros. | 16 |
Notes to the Condensed Consolidated Financial Statements
(Tabular amounts expressed in thousands of United States dollars, except where noted)
(Unaudited)
2. Significant accounting policies (continued)
(k) Recent accounting standards not yet adopted (continued)
The Team concluded that one of the most significant impacts of the adoption of ASU 2014-09 will be a change in the presentation of revenue from the majority of inventory, ancillary service, and Ritchie Bros. Logistical Services contracts as gross as a principal versus net as an agent. The Team’s analysis of these significant contracts with customers was aided by the FASB issuing ASU 2016-08, Revenue from Contracts with Customers (Topic 606), Principal versus Agent Considerations (Reporting Revenue Gross versus Net), which clarifies the implementation guidance on principal versus agent considerations, focusing on whether an entity controls a specified good or service before that good or service is transferred to a customer.
SEC Regulation S-X Rule 5-03.1 requires revenue from the sale of tangible products to be presented as a separate line item of the face of the consolidated income statement from revenues from services where income from one or both of those classes is more than 10 percent the sum of total revenues. Similarly, SEC Regulation Rule 5-03.2 requires the costs related to those revenue classes to be presented in the same manner. Based on historical information, the Team expects revenue from inventory contracts that are recognized gross as a principal selling tangible products to exceed 10 percent of total revenues.
Presenting most inventory contract revenues gross as a principal selling a tangible product versus net as an agent providing a service will significantly change the face of the Company’s consolidated income statement. Currently, all revenue from inventory sales is presented net of costs within service revenues on the income statement. After ASU 2014-09 is adopted, service revenues will exclude revenue from inventory sales and cost of inventory sold for inventory contracts recorded on a gross basis. Those amounts will instead be presented gross as separate line items on the face of the consolidated income statement in accordance with SEC Regulation S-X Rules 5-03.1 and 5-03.2. Ancillary service revenues will be presented within service revenues, but on a gross basis, with ancillary service costs presented separately within costs of services.
The Team, together with oversight from the Audit Committee, will also continue to closely monitor FASB activity related to ASU 2014-09 to conclude on specific interpretative issues. Over the remaining term until ASU 2014-09 takes effect, the Team will complete its assessment of the impact of the new standard on remaining contracts with customers, as well as evaluate the impact on financial statement disclosures and processes that capture information required for the revised financial statement presentation. The Team will also continue to work with management to determine the impact of the change in presentation on the key performance metrics used to evaluate operational performance of the Company.
Expected impact to reported results
While continuing to assess all potential impacts of adoption of ASU 2014-09, the Team’s current analysis indicates that the most significant change will be the gross versus net presentation described above. This presentation is expected to increase the amount of revenue compared to the current presentation. Presenting these revenues as gross as a principal versus net as an agent has no impact on operating income. The Company expects the effects of this change to be as follows:
| Ritchie Bros. | 17 |
Notes to the Condensed Consolidated Financial Statements
(Tabular amounts expressed in thousands of United States dollars, except where noted)
(Unaudited)
2. Significant accounting policies (continued)
(k) Recent accounting standards not yet adopted (continued)
| As reported | New revenue standard | |||||||||||||||||
| Three months ended September 30, | 2017 | 2016 | Three months ended September 30, | 2017 | 2016 | |||||||||||||
| Revenue from inventory sales | $ | 82,213 | $ | 176,381 | ||||||||||||||
| Service revenues | 145,843 | 124,595 | ||||||||||||||||
| Revenues | $ | 141,047 | $ | 128,876 | Total revenues | 228,056 | 300,976 | |||||||||||
| Cost of inventory sold | (73,131 | ) | (159,850 | ) | ||||||||||||||
| Costs of services, excluding | ||||||||||||||||||
| depreciation and amortization ("D&A") | (19,583 | ) | (14,750 | ) | Costs of services, excluding D&A | (33,461 | ) | (27,000 | ) | |||||||||
| $ | 121,464 | $ | 114,126 | Gross profit | $ | 121,464 | $ | 114,126 | ||||||||||
| As reported | New revenue standard | |||||||||||||||||
| Nine months ended September 30, | 2017 | 2016 | Nine months ended September 30, | 2017 | 2016 | |||||||||||||
| Revenue from inventory sales | $ | 238,515 | $ | 411,970 | ||||||||||||||
| Service revenues | 442,474 | 420,177 | ||||||||||||||||
| Revenues | $ | 431,732 | $ | 419,626 | Total revenues | 680,989 | 832,147 | |||||||||||
| Cost of inventory sold | (209,151 | ) | (376,364 | ) | ||||||||||||||
| Costs of services, excluding D&A | (53,987 | ) | (49,821 | ) | Costs of services, excluding D&A | (94,093 | ) | (85,978 | ) | |||||||||
| $ | 377,745 | $ | 369,805 | Gross profit | $ | 377,745 | $ | 369,805 | ||||||||||
| (ii) | In February 2016, the FASB issued ASU 2016-02, Leases (Topic 842), which requires lessees to recognize almost all leases, including operating leases, on the balance sheet through a right-of-use asset and a corresponding lease liability. For short-term leases, defined as those with a term of 12 months or less, the lessee is permitted to make an accounting policy election not to recognize the lease assets and liabilities, and instead recognize the lease expense generally on a straight-line basis over the lease term. The accounting treatment under this election is consistent with current operating lease accounting. No extensive amendments were made to lessor accounting, but amendments of note include changes to the definition of initial direct costs and accounting for collectability uncertainties in a lease. |
ASU 2016-02 is effective for fiscal years, and interim periods within those fiscal years, beginning after December 15, 2018, with early adoption permitted. Both lessees and lessors must apply ASU 2016-02 using a “modified retrospective transition”, which reflects the new guidance from the beginning of the earliest period presented in the financial statements. However, lessees and lessors can elect to apply certain practical expedients on transition.
Management continues to perform a detailed inventory and analysis of all the Company’s leases, of which there are approximately 395 operating and 90 finance leases for which the Company is a lessee at the reporting date. The most significant operating leases in terms of the amount of rental charges and duration of the contract are for various auction sites and offices located in North America, Europe, the Middle East, and Asia. However, in terms of the number of leases, the majority consist of leases for computer, automotive, and yard equipment.
| Ritchie Bros. | 18 |
Notes to the Condensed Consolidated Financial Statements
(Tabular amounts expressed in thousands of United States dollars, except where noted)
(Unaudited)
2. Significant accounting policies (continued)
(k) Recent accounting standards not yet adopted (continued)
The Company continues to evaluate the new guidance to determine the impact it will have on its consolidated financial statements. Under the expectation that the majority, if not all, of the operating leases will be brought onto the Company’s balance sheet on adoption of ASU 2016-02, management is also investigating the functionality within the Company’s systems to automate the lease accounting process.
The adoption of ASU 2016-02 is expected to add complexity to the accounting for leases, as well as require extensive system and process changes to manage the large number of operating leases that the Company anticipates will be brought onto its balance sheet. As a result, management has determined that the Company will not early adopt ASU 2016-02, and will continue to evaluate the elections available to the Company involving the application of practical expedients on transition.
| (iii) | In March 2016, the FASB issued ASU 2016-08, Revenue from Contracts with Customers (Topic 606), Principal versus Agent Considerations (Reporting Revenue Gross versus Net). The amendments in ASU 2016-08 clarify the implementation guidance on principal versus agent considerations, focusing on whether an entity controls a specified good or service before that good or service is transferred to a customer. Where such control exists – i.e. where the entity is required to provide the specified good or service itself – the entity is a ‘principal’. Where the entity is required to arrange for another party to provide the good or service, it is an agent. |
The effective date and transition requirements of ASU 2016-08 are the same as for ASU 2014-09, which is for fiscal years, and interim periods within those fiscal years, beginning after December 15, 2017. The impact of adoption of ASU 2016-08 on the Company’s consolidated financial statements has been considered as part of the ASU 2014-09 adoption project discussed above.
| (iv) | In June 2016, the FASB issued ASU 2016-13, Financial Instruments – Credit Losses (Topic 326), Measurement of Credit Losses on Financial Instruments, which replaces the ‘incurred loss methodology’ credit impairment model with a new forward-looking “methodology that reflects expected credit losses and requires consideration of a broader range of reasonable and supportable information to inform credit loss estimates.” ASU 2016-13 is effective for fiscal years, and interim periods within those fiscal years, beginning after December 15, 2019. Early adoption is only permitted for fiscal years beginning after December 15, 2018, including interim periods within those years. The Company is evaluating the new guidance to determine the impact it will have on its consolidated financial statements. |
| (v) | In January 2017, the FASB issued ASU 2017-01, Business Combinations (Topic 805): Clarifying the Definition of a Business, whose amendments provide a screen to determine when an integrated set of assets and activities does not constitute a business as defined by Topic 805. Specifically, the amendments require that a set is not a business when substantially all the fair value of gross assets acquired (or disposed of) is concentrated in a single identifiable asset or group of similar identifiable assets. This screen reduces the number of transactions that need to be further evaluated and as such, it is anticipated that more acquisitions will be accounted for as asset acquisitions rather than business combinations. If the screen is not met, the amendments: |
| 1) | Require that the set must, at a minimum, include an input and a substantive process that together significantly contribute to the ability to create an output in order to be considered a business; and |
| 2) | Remove the evaluation of whether a market participant could replace missing elements. |
| Ritchie Bros. | 19 |
Notes to the Condensed Consolidated Financial Statements
(Tabular amounts expressed in thousands of United States dollars, except where noted)
(Unaudited)
2. Significant accounting policies (continued)
(k) Recent accounting standards not yet adopted (continued)
The amendments also provide a framework to assist in evaluating whether both an input and a substantive process are present, and this framework includes two sets of criteria to consider that depend on whether a set has outputs. Finally, the amendments narrow the definition of the term “output” so the term is consistent with how outputs are described in Topic 606 Revenue from Contracts with Customers.
ASU 2017-01 is effective for fiscal years, and interim periods within those fiscal years, beginning after December 15, 2017. The amendments are applied prospectively on or after the effective date. No disclosures are required at transition. The Company is evaluating the new guidance to determine the impact it will have on its consolidated financial statements.
| (vi) | In February 2017, the FASB issued ASU 2017-05, Other Income – Gains and Losses from the Derecognition of Nonfinancial Assets (Subtopic 610-20): Clarifying the Scope of Asset Derecognition Guidance and Accounting for Partial Sales of Nonfinancial Assets, which clarifies the scope of Subtopic 610-20 and adds clarity around accounting for partial sales of nonfinancial assets and the identification of, allocation of consideration to, and derecognition of distinct nonfinancial assets. The amendments also define ‘in substance nonfinancial assets’, which are within the scope of Subtopic 610-20, and clarify that nonfinancial assets within the scope of Subtopic 610-20 may include nonfinancial assets transferred within a legal entity to a counterparty. |
ASU 2017-05 is effective at the same time as ASU 2014-09, which is for fiscal years, and interim periods within those fiscal years, beginning after December 15, 2017. Early adoption is permitted, including adoption in an interim period. The amendments in ASU 2017-05 must be applied at the same time as the amendments in ASU 2014-09. Entities may elect to apply these amendments retrospectively to each period presented in the financial statements or using a modified retrospective basis as of the beginning of the fiscal year of adoption. The Company is evaluating the new guidance to determine the impact it will have on its consolidated financial statements.
3. Significant judgments, estimates and assumptions
The preparation of financial statements in conformity with US GAAP requires management to make judgments, estimates and assumptions that affect the reported amounts of assets and liabilities and the disclosure of contingent liabilities at the date of the financial statements, and the reported amounts of revenues and expenses during the reporting period.
Future differences arising between actual results and the judgments, estimates and assumptions made by the Company at the reporting date, or future changes to estimates and assumptions, could necessitate adjustments to the underlying reported amounts of assets, liabilities, revenues and expenses in future reporting periods.
Judgments, estimates and underlying assumptions are evaluated on an ongoing basis by management, and are based on historical experience and other factors including expectations of future events that are believed to be reasonable under the circumstances. Existing circumstances and assumptions about future developments, however, may change due to market changes or circumstance and such changes are reflected in the assumptions when they occur. Significant items subject to estimates include purchase price allocations, the carrying amounts of goodwill, the useful lives of long-lived assets, share based compensation, deferred income taxes, reserves for tax uncertainties, and other contingencies.
| Ritchie Bros. | 20 |
Notes to the Condensed Consolidated Financial Statements
(Tabular amounts expressed in thousands of United States dollars, except where noted)
(Unaudited)
4. Seasonality of operations
The Company's operations are both seasonal and event driven. Revenues tend to be highest during the second and fourth calendar quarters. The Company generally conducts more auctions during these quarters than during the first and third calendar quarters. Late December through mid-February and mid-July through August are traditionally less active periods.
5. Segmented information
The Company’s principal business activity is the management and disposition of used industrial equipment and other durable assets. During the three months ended September 30, 2017, the Company continued to integrate its IronPlanet acquisition, which resulted in changes in the basis of organization of the Company, including its leadership structure, sales processes, and management reporting. Most significantly, the Chief Operating Decision Maker (“CODM”) began to assess the performance of the business and allocate resources based on whether the Company’s services are transactional (generating value from the disposition of assets) or non-transactional in nature, and redesigned key metrics accordingly.
These changes resulted in the identification of the following new operating segments as of September 30, 2017:
| · | Auctions and Marketplaces – This is the Company’s only reportable segment, which consists of the Company’s live on site auctions, its online auctions and marketplaces, and its brokerage service; |
| · | Ritchie Bros. Financial Services (“RBFS”) – This is the Company’s financial brokerage service, which is reported within the “other” category; and |
| · | Mascus – This is the Company’s online listing service, which is reported within the “other” category. |
The “other” category also includes results from various value-added services and make-ready activities, including the Company’s equipment refurbishment services, Asset Appraisal Services, and Ritchie Bros. Logistical Services.
| Three months ended September 30, 2017 | Nine months ended September 30, 2017 | |||||||||||||||||||||||
| Auctions and Marketplaces | Other | Consolidated | Auctions and Marketplaces | Other | Consolidated | |||||||||||||||||||
| Revenues | $ | 130,242 | $ | 10,805 | $ | 141,047 | $ | 400,565 | $ | 31,167 | $ | 431,732 | ||||||||||||
| Costs of services, excluding D&A | (18,383 | ) | (1,200 | ) | (19,583 | ) | (51,948 | ) | (2,039 | ) | (53,987 | ) | ||||||||||||
| Selling, general and administrative ("SG&A") expenses | (81,964 | ) | (3,371 | ) | (85,335 | ) | (220,555 | ) | (9,732 | ) | (230,287 | ) | ||||||||||||
| Impairment loss | - | - | - | (8,911 | ) | - | (8,911 | ) | ||||||||||||||||
| Segment profit | $ | 29,895 | $ | 6,234 | $ | 36,129 | $ | 119,151 | $ | 19,396 | $ | 138,547 | ||||||||||||
| Acquisition-related costs | (3,587 | ) | (35,162 | ) | ||||||||||||||||||||
| D&A expenses | (14,837 | ) | (37,047 | ) | ||||||||||||||||||||
| Gain on disposition of Property, plant and equipment ("PPE") | 42 | 1,071 | ||||||||||||||||||||||
| Foreign exchange gain (loss) | (816 | ) | 7 | |||||||||||||||||||||
| Operating income | $ | 16,931 | $ | 67,416 | ||||||||||||||||||||
| Other expense | (9,966 | ) | (20,965 | ) | ||||||||||||||||||||
| Income tax recovery (expense) | 3,358 | (7,982 | ) | |||||||||||||||||||||
| Net income | $ | 10,323 | $ | 38,469 | ||||||||||||||||||||
| Ritchie Bros. | 21 |
Notes to the Condensed Consolidated Financial Statements
(Tabular amounts expressed in thousands of United States dollars, except where noted)
(Unaudited)
| 5. | Segmented information (continued) |
| Three months ended September 30, 2016 | Nine months ended September 30, 2016 | |||||||||||||||||||||||
| Auctions and Marketplaces | Other | Consolidated | Auctions and Marketplaces | Other | Consolidated | |||||||||||||||||||
| Revenues | $ | 121,111 | $ | 7,765 | $ | 128,876 | $ | 395,228 | $ | 24,398 | $ | 419,626 | ||||||||||||
| Costs of services, excluding D&A | (14,493 | ) | (257 | ) | (14,750 | ) | (49,213 | ) | (608 | ) | (49,821 | ) | ||||||||||||
| SG&A expenses | (65,346 | ) | (2,947 | ) | (68,293 | ) | (200,967 | ) | (8,428 | ) | (209,395 | ) | ||||||||||||
| Impairment loss | (28,243 | ) | - | (28,243 | ) | (28,243 | ) | - | (28,243 | ) | ||||||||||||||
| Segment profit | $ | 13,029 | $ | 4,561 | $ | 17,590 | $ | 116,805 | $ | 15,362 | $ | 132,167 | ||||||||||||
| Acquisition-related costs | (5,398 | ) | (7,198 | ) | ||||||||||||||||||||
| D&A expenses | (10,196 | ) | (30,560 | ) | ||||||||||||||||||||
| Gain on disposition of PPE | 570 | 1,017 | ||||||||||||||||||||||
| Foreign exchange loss | (281 | ) | (332 | ) | ||||||||||||||||||||
| Operating income | $ | 2,285 | $ | 95,094 | ||||||||||||||||||||
| Other income (expense) | (105 | ) | 420 | |||||||||||||||||||||
| Income tax expense | (7,180 | ) | (29,929 | ) | ||||||||||||||||||||
| Net income (loss) | $ | (5,000 | ) | $ | 65,585 | |||||||||||||||||||
The carrying value of goodwill of $648,819,000 has been allocated to Auctions and Marketplaces and $20,827,000 has been allocated to other. As in prior periods, the CODM does not evaluate the performance of its operating segments based on segment assets and liabilities, nor does the Company classify liabilities on a segmented basis.
6. Revenues
The Company’s revenue from the rendering of services is as follows:
| Three months ended | Nine months ended | |||||||||||||||
| September 30, | September 30, | |||||||||||||||
| 2017 | 2016 | 2017 | 2016 | |||||||||||||
| Commissions | $ | 97,683 | $ | 96,110 | $ | 310,007 | $ | 314,084 | ||||||||
| Fees | 43,364 | 32,766 | 121,725 | 105,542 | ||||||||||||
| $ | 141,047 | $ | 128,876 | $ | 431,732 | $ | 419,626 | |||||||||
Net profits on inventory sales included in commissions are:
| Three months ended | Nine months ended | |||||||||||||||
| September 30, | September 30, | |||||||||||||||
| 2017 | 2016 | 2017 | 2016 | |||||||||||||
| Revenue from inventory sales | $ | 93,275 | $ | 176,381 | $ | 255,156 | $ | 411,970 | ||||||||
| Cost of inventory sold | (82,733 | ) | (159,850 | ) | (222,956 | ) | (376,364 | ) | ||||||||
| $ | 10,542 | $ | 16,531 | $ | 32,200 | $ | 35,606 | |||||||||
| Ritchie Bros. | 22 |
Notes to the Condensed Consolidated Financial Statements
(Tabular amounts expressed in thousands of United States dollars, except where noted)
(Unaudited)
7. Operating expenses
Certain prior period operating expenses have been reclassified to conform with current year presentation.
Costs of services, excluding depreciation and amortization
| Three months ended | Nine months ended | |||||||||||||||
| September 30, | September 30, | |||||||||||||||
| 2017 | 2016 | 2017 | 2016 | |||||||||||||
| Employee compensation expenses | $ | 10,032 | $ | 6,593 | $ | 24,321 | $ | 21,731 | ||||||||
| Buildings, facilities and technology expenses | 1,872 | 1,709 | 5,819 | 6,015 | ||||||||||||
| Travel, advertising and promotion expenses | 5,562 | 4,991 | 17,644 | 18,287 | ||||||||||||
| Other costs of services | 2,117 | 1,457 | 6,203 | 3,788 | ||||||||||||
| $ | 19,583 | $ | 14,750 | $ | 53,987 | $ | 49,821 | |||||||||
SG&A expenses
| Three months ended | Nine months ended | |||||||||||||||
| September 30, | September 30, | |||||||||||||||
| 2017 | 2016 | 2017 | 2016 | |||||||||||||
| Employee compensation expenses | $ | 55,560 | 42,370 | $ | 147,420 | $ | 133,370 | |||||||||
| Buildings, facilities and technology expenses | 13,494 | 12,466 | 39,083 | 36,671 | ||||||||||||
| Travel, advertising and promotion expenses | 8,431 | 6,273 | 21,218 | 18,595 | ||||||||||||
| Professional fees | 3,381 | 3,675 | 9,705 | 9,524 | ||||||||||||
| Other SG&A expenses | 4,469 | 3,509 | 12,861 | 11,235 | ||||||||||||
| $ | 85,335 | $ | 68,293 | $ | 230,287 | $ | 209,395 | |||||||||
| Ritchie Bros. | 23 |
Notes to the Condensed Consolidated Financial Statements
(Tabular amounts expressed in thousands of United States dollars, except where noted)
(Unaudited)
7. Operating expenses (continued)
Acquisition-related costs
| Three months ended | Nine months ended | |||||||||||||||
| September 30, | September 30, | |||||||||||||||
| 2017 | 2016 | 2017 | 2016 | |||||||||||||
| IronPlanet: (note 22) | ||||||||||||||||
| Stock option compensation expense (note 20) | $ | - | $ | - | $ | 4,752 | $ | - | ||||||||
| Legal costs | 248 | 2,264 | 8,843 | 2,264 | ||||||||||||
| Other acquisition-related costs | 2,464 | 2,250 | 18,996 | 2,250 | ||||||||||||
| Mascus: (note 22) | ||||||||||||||||
| Continuing employment costs | 126 | 262 | 404 | 701 | ||||||||||||
| Other acquisition-related costs | - | - | 22 | 749 | ||||||||||||
| Xcira: | ||||||||||||||||
| Continuing employment costs | 447 | 305 | 1,112 | 917 | ||||||||||||
| Petrowsky: (note 22) | ||||||||||||||||
| Continuing employment costs | 134 | 140 | 554 | 140 | ||||||||||||
| Other acquisition-related costs | - | 177 | 3 | 177 | ||||||||||||
| Kramer: (note 22) | ||||||||||||||||
| Continuing employment costs | 122 | - | 351 | - | ||||||||||||
| Other acquisition-related costs | - | - | 78 | - | ||||||||||||
| Other | 46 | - | 47 | - | ||||||||||||
| $ | 3,587 | $ | 5,398 | $ | 35,162 | $ | 7,198 | |||||||||
Depreciation and amortization expenses
| Three months ended | Nine months ended | |||||||||||||||
| September 30, | September 30, | |||||||||||||||
| 2017 | 2016 | 2017 | 2016 | |||||||||||||
| Depreciation expense | $ | 7,228 | $ | 7,751 | $ | 20,813 | $ | 23,466 | ||||||||
| Amortization expense | 7,609 | 2,445 | 16,234 | 7,094 | ||||||||||||
| $ | 14,837 | $ | 10,196 | $ | 37,047 | $ | 30,560 | |||||||||
Impairment loss
The Company did not record an impairment loss during the three months ended September 30, 2017. During the three months ended June 30, 2017, management identified indicators of impairment on certain software and software under development intangible assets (the “technology assets”). The indicators consisted of decisions made after the acquisition of IronPlanet that adversely impacted the extent or manner in which certain technology assets would be utilized. As part of its integration activities the Company determined that it was more likely than not that certain technology assets would not be utilized or developed as originally intended and no longer had value. As a result, management performed an impairment test that resulted in the recognition of an impairment loss of $8,911,000 on the technology assets.
During the three months ended September 30, 2016, the Company recorded an impairment loss on the EquipmentOne reporting unit goodwill of $23,574,000 and a pre-tax impairment loss on the EquipmentOne reporting unit customer relationships of $4,669,000.
| Ritchie Bros. | 24 |
Notes to the Condensed Consolidated Financial Statements
(Tabular amounts expressed in thousands of United States dollars, except where noted)
(Unaudited)
8. Income taxes
At the end of each interim period, the Company estimates the effective tax rate expected to be applicable for the full fiscal year. The estimate reflects, among other items, management’s best estimate of operating results. It does not include the estimated impact of foreign exchange rates or unusual and/or infrequent items, which may cause significant variations in the customary relationship between income tax expense and income before income taxes.
The Company’s consolidated effective tax rate in respect of operations for the three and nine months ended September 30, 2017 was -48.2% and 17.2%, respectively (2016: 329.4% and 31.3%).
9. Earnings per share attributable to stockholders
Basic earnings per share (“EPS”) attributable to stockholders was calculated by dividing the net income attributable to stockholders by the weighted average (“WA”) number of common shares outstanding. Diluted EPS attributable to stockholders was calculated by dividing the net income attributable to stockholders after giving effect to outstanding dilutive stock options and PSUs by the WA number of shares outstanding adjusted for all dilutive securities.
| Three months ended | Nine months ended | |||||||||||||||||||||||
| September 30, 2017 | September 30, 2017 | |||||||||||||||||||||||
| Net income | WA | Net income | WA | |||||||||||||||||||||
| attributable to | number | Per share | attributable to | number | Per share | |||||||||||||||||||
| stockholders | of shares | amount | stockholders | of shares | amount | |||||||||||||||||||
| Basic | $ | 10,261 | 107,120,618 | $ | 0.10 | $ | 38,273 | 106,993,358 | $ | 0.36 | ||||||||||||||
| Effect of dilutive securities: | ||||||||||||||||||||||||
| PSUs | - | 214,304 | - | (50 | ) | 337,570 | - | |||||||||||||||||
| Stock options | - | 843,381 | (0.01 | ) | - | 738,696 | (0.01 | ) | ||||||||||||||||
| Diluted | $ | 10,261 | 108,178,303 | $ | 0.09 | $ | 38,223 | 108,069,624 | $ | 0.35 | ||||||||||||||
| Three months ended | Nine months ended | |||||||||||||||||||||||
| September 30, 2016 | September 30, 2016 | |||||||||||||||||||||||
| Net loss | WA | Net income | WA | |||||||||||||||||||||
| attributable to | number | Per share | attributable to | number | Per share | |||||||||||||||||||
| stockholders | of shares | amount | stockholders | of shares | amount | |||||||||||||||||||
| Basic | $ | (5,137 | ) | 106,622,376 | $ | (0.05 | ) | $ | 63,979 | 106,595,088 | $ | 0.60 | ||||||||||||
| Effect of dilutive securities: | ||||||||||||||||||||||||
| PSUs | - | 81,610 | - | - | 27,203 | - | ||||||||||||||||||
| Stock options | - | 821,065 | - | - | 599,099 | - | ||||||||||||||||||
| Diluted | $ | (5,137 | ) | 107,525,051 | $ | (0.05 | ) | $ | 63,979 | 107,221,390 | $ | 0.60 | ||||||||||||
In respect of PSUs awarded under the sign-on grant PSUs, and the senior executive and employee PSU plans (described in note 20), performance and market conditions, depending on their outcome at the end of the contingency period, can reduce the number of vested awards to nil or to a maximum of 200% of the number of outstanding PSUs. For the three and nine months ended September 30, 2017, no PSUs to purchase common shares were outstanding but excluded from the calculation of diluted EPS attributable to stockholders as they were anti-dilutive (2016: 253,646 and 231,671). For the three and nine months ended September 30, 2017, stock options to purchase 901,969 and 585,257 common shares, respectively, were outstanding but excluded from the calculation of diluted EPS attributable to stockholders as they were anti-dilutive (2016: nil and 1,002,929).
| Ritchie Bros. | 25 |
Notes to the Condensed Consolidated Financial Statements
(Tabular amounts expressed in thousands of United States dollars, except where noted)
(Unaudited)
10. Supplemental cash flow information
| Nine months ended September 30, | 2017 | 2016 | ||||||
| Trade and other receivables | (139,411 | ) | (129,980 | ) | ||||
| Inventory | (16,460 | ) | 15,257 | |||||
| Advances against auction contracts | 601 | 914 | ||||||
| Prepaid expenses and deposits | 4,498 | (774 | ) | |||||
| Income taxes receivable | (8,062 | ) | (3,387 | ) | ||||
| Auction proceeds payable | 186,147 | 172,273 | ||||||
| Trade and other payables | (9,451 | ) | (5,331 | ) | ||||
| Income taxes payable | (3,075 | ) | (9,410 | ) | ||||
| Share unit liabilities | (5,848 | ) | 2,413 | |||||
| Other | 1,608 | (4,995 | ) | |||||
| Net changes in operating assets and liabilities | $ | 10,547 | $ | 36,980 | ||||
| Nine months ended September 30, | 2017 | 2016 | ||||||
| Interest paid, net of interest capitalized | $ | 20,233 | $ | 3,859 | ||||
| Interest received | 2,460 | 1,353 | ||||||
| Net income taxes paid | 28,037 | 44,869 | ||||||
| Non-cash transactions: | ||||||||
| Non-cash purchase of property, plant and equipment under capital lease | 6,851 | 1,009 | ||||||
| September 30, | December 31, | |||||||
| 2017 | 2016 | |||||||
| Cash and cash equivalents | $ | 224,474 | $ | 207,867 | ||||
| Restricted cash: | ||||||||
| Current | 89,846 | 50,222 | ||||||
| Non-current | - | 500,000 | ||||||
| Cash, cash equivalents, and restricted cash | $ | 314,320 | $ | 758,089 | ||||
On December 21, 2016, the Company completed the offering of $500,000,000 aggregate principal amount of 5.375% senior unsecured notes due January 15, 2025 (note 18). Upon the closing of the offering, the gross proceeds from the offering were deposited in to an escrow account. The funds were released from escrow upon the closing of the acquisition of IronPlanet (note 22).
| Ritchie Bros. | 26 |
Notes to the Condensed Consolidated Financial Statements
(Tabular amounts expressed in thousands of United States dollars, except where noted)
(Unaudited)
10. Supplemental cash flow information (continued)
In the fourth quarter of 2016, Company early adopted ASU 2016-18, Statement of Cash Flows (Topic 230), Restricted Cash, which requires that the change in the total of cash, cash equivalents, and restricted cash during a reporting period be explained in the Statement of Cash Flows (“SCF”). Therefore, the Company has included its restricted cash balances when reconciling the total beginning and end of period amounts shown on the face of the SCF. The effect of this change is detailed below.
| Nine months ended September 30, | 2016 | |||
| Net changes in operating assets and liabilities: | ||||
| As reported | $ | 38,982 | ||
| Current presentation | 36,980 | |||
| Net cash provided by operating activities: | ||||
| As reported | 163,423 | |||
| Current presentation | 161,421 | |||
| Effect of changes in foreign currency rates on cash: | ||||
| As reported | 4,339 | |||
| Current presentation | 6,656 | |||
| Increase (decrease) in cash: | ||||
| As reported | 20,836 | |||
| Current presentation | 21,151 | |||
| Cash and cash equivalents | 230,984 | |||
| Total cash, cash equivalents and restricted cash | $ | 314,397 | ||
11. Fair value measurement
All assets and liabilities for which fair value is measured or disclosed in the condensed consolidated financial statements are categorized within the fair value hierarchy, described as follows, based on the lowest level input that is significant to the fair value measurement or disclosure:
| ● Level 1: | Unadjusted quoted prices in active markets for identical assets or liabilities that the entity can access at measurement date; |
| ● Level 2: | Inputs other than quoted prices included in Level 1 that are observable for the asset or liability, either directly or indirectly; and |
| ● Level 3: | Unobservable inputs for the asset or liability. |
| Ritchie Bros. | 27 |
Notes to the Condensed Consolidated Financial Statements
(Tabular amounts expressed in thousands of United States dollars, except where noted)
(Unaudited)
11. Fair value measurement (continued)
| September 30, 2017 | December 31, 2016 | |||||||||||||||||
| Category | Carrying amount | Fair value | Carrying amount | Fair value | ||||||||||||||
| Fair values disclosed, recurring: | ||||||||||||||||||
| Cash and cash equivalents | Level 1 | $ | 224,474 | $ | 224,474 | $ | 207,867 | $ | 207,867 | |||||||||
| Restricted cash | Level 1 | 89,846 | 89,846 | 550,222 | 550,222 | |||||||||||||
| Short-term debt (note 18) | Level 2 | 8,567 | 8,567 | 23,912 | 23,912 | |||||||||||||
| Long-term debt (note 18) | ||||||||||||||||||
| Senior unsecured notes | Level 1 | 486,886 | 526,875 | 495,780 | 509,500 | |||||||||||||
| Revolving loans | Level 2 | - | - | 99,926 | 99,926 | |||||||||||||
| Delayed draw term loans | Level 2 | 330,999 | 335,447 | - | - | |||||||||||||
The carrying value of the Company‘s cash and cash equivalents, restricted cash, trade and other receivables, advances against auction contracts, auction proceeds payable, trade and other payables, short term debt, and revolving loans approximate their fair values due to their short terms to maturity. The carrying value of the delayed draw term loan, before deduction of deferred debt issue costs, approximates its fair value as the interest rates on the loans were short-term in nature. The fair value of the senior unsecured notes is determined by reference to a quoted market price.
12. Inventory
At each period end, inventory is reviewed to ensure that it is recorded at the lower of cost and net realizable value. During the three and nine months ended September 30, 2017, the Company recorded an inventory write-down of $122,000 and $778,000, respectively (2016: $882,000 and $2,284,000).
Of inventory held at September 30, 2017, 100% is expected to be sold prior to the end of December 2017 (December 31, 2016: 93% sold by the end of March 2017 with the remainder sold by the end of June 2017).
13. Assets held for sale
| Balance, December 31, 2016 | $ | 632 | ||
| Reclassified from property, plant and equipment | 411 | |||
| Disposal | (389 | ) | ||
| Balance, September 30, 2017 | $ | 654 |
In March 2017, the Company sold excess auction site acreage in Orlando, United States, for net proceeds of $953,000 resulting in a gain of $564,000.
As at September 30, 2017, the Company’s assets held for sale consisted of excess auction site acreage located in Denver and Kansas City, United States, and Truro, Canada. Management made the strategic decision to sell this excess acreage to maximize the Company’s return on invested capital. The properties have been actively marketed for sale, and management expects the sales to be completed within 12 months of September 30, 2017. This land belongs to the Auctions and Marketplaces reportable segment.
| Ritchie Bros. | 28 |
Notes to the Condensed Consolidated Financial Statements
(Tabular amounts expressed in thousands of United States dollars, except where noted)
(Unaudited)
14. Property, plant and equipment
| As at September 30, 2017 | Cost | Accumulated depreciation | Net book value | |||||||||
| Land and improvements | $ | 377,491 | $ | (67,164 | ) | $ | 310,327 | |||||
| Buildings | 265,816 | (101,301 | ) | 164,515 | ||||||||
| Yard and automotive equipment | 60,125 | (39,489 | ) | 20,636 | ||||||||
| Computer software and equipment | 68,728 | (59,639 | ) | 9,089 | ||||||||
| Office equipment | 24,875 | (18,443 | ) | 6,432 | ||||||||
| Leasehold improvements | 21,369 | (14,492 | ) | 6,877 | ||||||||
| Assets under development | 12,619 | - | 12,619 | |||||||||
| $ | 831,023 | $ | (300,528 | ) | $ | 530,495 | ||||||
| As at December 31, 2016 | Cost | Accumulated depreciation | Net book value | |||||||||
| Land and improvements | $ | 362,283 | $ | (60,576 | ) | $ | 301,707 | |||||
| Buildings | 256,168 | (91,323 | ) | 164,845 | ||||||||
| Yard and automotive equipment | 55,352 | (38,560 | ) | 16,792 | ||||||||
| Computer software and equipment | 66,265 | (57,624 | ) | 8,641 | ||||||||
| Office equipment | 22,963 | (16,706 | ) | 6,257 | ||||||||
| Leasehold improvements | 20,199 | (12,541 | ) | 7,658 | ||||||||
| Assets under development | 9,130 | - | 9,130 | |||||||||
| $ | 792,360 | $ | (277,330 | ) | $ | 515,030 | ||||||
During the three and nine months ended September 30, 2017, interest of $40,000 and $78,000, respectively, was capitalized to the cost of assets under development (2016: $42,000 and $65,000). These interest costs relating to qualifying assets are capitalized at a weighted average rate of 2.7% (2016: 4.4%).
| Ritchie Bros. | 29 |
Notes to the Condensed Consolidated Financial Statements
(Tabular amounts expressed in thousands of United States dollars, except where noted)
(Unaudited)
15. Intangible assets
| As at September 30, 2017 | Cost | Accumulated amortization | Net book value | |||||||||
| Trade names and trademarks | $ | 54,229 | $ | (347 | ) | $ | 53,882 | |||||
| Customer relationships | 124,295 | (6,317 | ) | 117,978 | ||||||||
| Software | 96,860 | (22,155 | ) | 74,705 | ||||||||
| Software under development | 14,557 | - | 14,557 | |||||||||
| $ | 289,941 | $ | (28,819 | ) | $ | 261,122 | ||||||
| As at December 31, 2016 | Cost | Accumulated amortization | Net book value | |||||||||
| Trade names and trademarks | $ | 5,585 | $ | (50 | ) | $ | 5,535 | |||||
| Customer relationships | 25,618 | (1,072 | ) | 24,546 | ||||||||
| Software | 36,566 | (13,116 | ) | 23,450 | ||||||||
| Software under development | 18,773 | - | 18,773 | |||||||||
| $ | 86,542 | $ | (14,238 | ) | $ | 72,304 | ||||||
During the nine months ended September 30, 2017, the Company recognized an impairment loss of $8,911,000 due to the impairment of certain software and software under development and during the three and nine months ended September 30, 2016 the Company recorded an impairment loss on the Equipment One customer relationships of $4,669,000 (note 7).
During the three and nine months ended September 30, 2017, interest of $74,000 and $140,000, respectively was capitalized to the cost of software under development (2016: $111,000 and $287,000). These interest costs relating to qualifying assets are capitalized at a weighted average rate of 2.70% (2016: 5.32.%).
16. Goodwill
| Balance, December 31, 2016 | $ | 97,537 | ||
| Additions | 567,785 | |||
| Foreign exchange movement | 4,324 | |||
| Balance, September 30, 2017 | $ | 669,646 |
| Ritchie Bros. | 30 |
Notes to the Condensed Consolidated Financial Statements
(Tabular amounts expressed in thousands of United States dollars, except where noted)
(Unaudited)
17. Equity-accounted investments
The Company holds a 48% share interest in a group of companies detailed below (together, the Cura Classis entities), which have common ownership. The Cura Classis entities provide dedicated fleet management services in three jurisdictions to a common customer unrelated to the Company. The Company has determined the Cura Classis entities are variable interest entities and the Company is not the primary beneficiary, as it does not have the power to make any decisions that significantly affect the economic results of the Cura Classis entities. Accordingly, the Company accounts for its investments in the Cura Classis entities following the equity method.
A condensed summary of the Company's investments in and advances to equity-accounted investees are as follows (in thousands of U.S. dollars, except percentages):
| Ownership | September 30, | December 31, | ||||||||||
| percentage | 2017 | 2016 | ||||||||||
| Cura Classis entities | 48 | % | $ | 4,650 | $ | 4,594 | ||||||
| Other equity investments | 32 | % | 2,637 | 2,732 | ||||||||
| 7,287 | 7,326 | |||||||||||
As a result of the Company’s investments, the Company is exposed to risks associated with the results of operations of the Cura Classis entities. The Company has no other business relationships with the Cura Classis entities. The Company’s maximum risk of loss associated with these entities is the investment carrying amount.
| Ritchie Bros. | 31 |
Notes to the Condensed Consolidated Financial Statements
(Tabular amounts expressed in thousands of United States dollars, except where noted)
(Unaudited)
18. Debt
| Carrying amount | ||||||||
| September 30, | December 31, | |||||||
| 2017 | 2016 | |||||||
| Short-term debt | $ | 8,567 | $ | 23,912 | ||||
| Long-term debt: | ||||||||
| Revolving loans: | ||||||||
| Denominated in Canadian dollars, unsecured, bearing interest at a weighted average rate of 2.380%, due in monthly installments of interest only, with the committed, revolving credit facility available until October 2021 | - | 69,926 | ||||||
| Denominated in United States dollars, unsecured, bearing interest at a weighted average rate of 2.075%, due in monthly installments of interest only, with the committed, revolving credit facility available until October 2021 | - | 30,000 | ||||||
| Delayed draw term loan: | ||||||||
| Denominated in Canadian dollars, secured, bearing interest at a weighted average rate of 3.044%, due in monthly installments of interest only and quarterly installments of principal, with the committed credit facility, available until October 2021 | 189,050 | - | ||||||
| Denominated in United States dollars, secured, bearing interest at a weighted average rate of 3.157%, due in monthly installments of interest only and quarterly installments of principal, with the committed credit facility, available until October 2021 | 146,397 | - | ||||||
| Less: unamortized debt issue costs | (4,448 | ) | - | |||||
| Senior unsecured notes: | ||||||||
| Bearing interest at 5.375% due in semi-annual installments, with the full amount of principal due in January 2025 | 500,000 | 500,000 | ||||||
| Less: unamortized debt issue costs | (13,114 | ) | (4,220 | ) | ||||
| 817,885 | 595,706 | |||||||
| Total debt | $ | 826,452 | $ | 619,618 | ||||
| Long-term debt: | ||||||||
| Current portion | $ | 16,985 | $ | - | ||||
| Non-current portion | 800,900 | 595,706 | ||||||
| $ | 817,885 | $ | 595,706 | |||||
On October 27, 2016, the Company entered into a credit agreement (the “Credit Agreement”) with a syndicate of lenders, and Bank of America, N.A. (“BofA”), as administrative agent which provides the Company with:
| · | Multicurrency revolving facilities of up to $675,000,000 (the “Multicurrency Facilities”); |
| · | A delayed draw term loan facility of up to $325,000,000 (the “Delayed-Draw Facility); and together with the Multicurrency Facilities, the (“Syndicated Facilities”) and |
| · | At the Company’s election and subject to certain conditions, including receipt of related commitments, incremental term loan facilities and/or increases to the Multicurrency Facilities in an aggregate amount of up to $50,000,000. |
| Ritchie Bros. | 32 |
Notes to the Condensed Consolidated Financial Statements
(Tabular amounts expressed in thousands of United States dollars, except where noted)
(Unaudited)
18. Debt (continued)
The Company may use the proceeds from the Multicurrency Facilities for general corporate purposes. The amount available pursuant to the Delayed-Draw Facility is only available to finance the acquisition of IronPlanet and will not be available for other corporate purposes upon repayment of amounts borrowed under that facility. On May 31, 2017, the Company borrowed $325,000,000 under the Delayed-Draw Facility to finance the acquisition of IronPlanet. The Delayed-Draw Facility amortizes in equal quarterly installments in an annual amount of 5% for the first two years and 10% in the third through fifth years, with the balance payable at maturity. Upon the closing of the acquisition the Syndicated Facilities became secured by the assets of the Company and certain of its subsidiaries in Canada and the United States. The Syndicated Facilities may become unsecured again, subject to the Company meeting specified credit rating or leverage ratio conditions.
The Company has incurred debt issue costs of $9,704,000 in connection with the Syndicated Facilities, of which $4,753,000 was allocated to the Multicurrency Facilities and $4,951,000 was allocated to the Delayed-Draw Facility. As the former allocation is not related to specific draws, the costs have been capitalized as other non-current assets and are being amortized over the term of the Syndicated Facilities. For the later allocation, the costs have been capitalized and reduce the carrying value of the delayed draw term loans to which they relate. At September 30, 2017, the Company had unamortized deferred debt issue costs relating to the Multicurrency Facilities of $4,054,000 (December 31, 2016: $6,182,000 relating to the Syndicated Facilities) and unamortized deferred debt issue costs of $4,448,000 relating to the delayed draw term loans.
On December 21, 2016, the Company completed the offering of $500,000,000 aggregate principal amount of 5.375% senior unsecured notes due January 15, 2025 (the “Notes”). Interest on the Notes is payable semi-annually. The proceeds from the offering were held in escrow until completion of the acquisition of IronPlanet. On May 31, 2017, the funds were released from escrow to finance the acquisition of IronPlanet. The Notes are jointly and severally guaranteed on an unsecured basis, subject to certain exceptions, by each of the Company’s subsidiaries that is a borrower or guarantees indebtedness under the Credit Agreement. IronPlanet and certain of its subsidiaries were added as additional guarantors in connection with the acquisition of IronPlanet.
The Company has incurred debt issue costs of $13,945,000 in connection with the offering of the Notes. At September 30, 2017, the Company had unamortized deferred debt issue costs relating to the Notes of $13,114,000 (December 31, 2016: $4,220,000)
Short-term debt at September 30, 2017 is comprised of drawings in different currencies on the Company’s committed revolving credit facilities and have a weighted average interest rate of 2.8% (December 31, 2016: 2.2%).
As at September 30, 2017, the Company had available committed revolving credit facilities aggregating $647,213,000 of which $637,891,000 is available until October 27, 2021.
19. Equity and dividends
Share capital
Preferred stock
Unlimited number of senior preferred shares, without par value, issuable in series.
Unlimited number of junior preferred shares, without par value, issuable in series.
All issued shares are fully paid. No preferred shares have been issued.
Share repurchase
There were no common shares repurchased during the three and nine months ended September 30, 2017 (March 2016: 1,460,000 repurchased common shares, which were cancelled on March 15, 2016).
| Ritchie Bros. | 33 |
Notes to the Condensed Consolidated Financial Statements
(Tabular amounts expressed in thousands of United States dollars, except where noted)
(Unaudited)
19. Equity and dividends (continued)
Dividends
Declared and paid
The Company declared and paid the following dividends during the three and nine months ended September 30, 2017 and 2016:
| Declaration date | Dividend per share | Record date | Total dividends | Payment date | ||||||||||
| Nine months ended September 30, 2017: | ||||||||||||||
| Fourth quarter 2016 | January 23, 2017 | $ | 0.1700 | February 10, 2017 | $ | 18,160 | March 3, 2017 | |||||||
| First quarter 2017 | May 4, 2017 | 0.1700 | May 23, 2017 | 18,188 | June 13, 2017 | |||||||||
| Second quarter 2017 | August 4, 2017 | 0.1700 | August 25, 2017 | 18,210 | September 15, 2017 | |||||||||
| Nine months ended September 30, 2016: | ||||||||||||||
| Fourth quarter 2015 | January 15, 2016 | $ | 0.1600 | February 12, 2016 | $ | 17,154 | March 4, 2016 | |||||||
| First quarter 2016 | May 9, 2016 | 0.1600 | May 24, 2016 | 17,022 | June 14, 2016 | |||||||||
| Second quarter 2016 | August 5, 2016 | 0.1700 | September 2, 2016 | 18,127 | September 23, 2016 | |||||||||
Declared and undistributed
Subsequent to September 30, 2017, the Company’s Board of Directors declared a quarterly dividend of $0.17 cents per common share, payable on December 20, 2017 to stockholders of record on November 29, 2017. This dividend payable has not been recognized as a liability in the financial statements. The payment of this dividend will not have any tax consequence for the Company.
Foreign currency translation reserve
Foreign currency translation adjustments include intra-entity foreign currency transactions that are of a long-term investment nature, which generated net gains of $5,838,000 and $17,322,000 for the three and nine months ended September 30, 2017, respectively (2016: net gains of $958,000 and net gains of $9,569,000).
| Ritchie Bros. | 34 |
Notes to the Condensed Consolidated Financial Statements
(Tabular amounts expressed in thousands of United States dollars, except where noted)
(Unaudited)
20. Share-based payments
Share-based payments consist of the following compensation costs:
| Three months ended | Nine months ended | |||||||||||||||
| September 30, | September 30, | |||||||||||||||
| 2017 | 2016 | 2017 | 2016 | |||||||||||||
| Stock option compensation expense: | ||||||||||||||||
| SG&A expenses | $ | 2,920 | 1,555 | $ | 6,244 | $ | 4,025 | |||||||||
| Acquisition-related costs | - | - | 4,752 | - | ||||||||||||
| Share unit expense (recovery): | ||||||||||||||||
| Equity-classified PSUs | (176 | ) | 736 | 1,871 | 1,222 | |||||||||||
| Liability-classified share units | 821 | 1,515 | 246 | 8,295 | ||||||||||||
| Employee share purchase plan -employer contributions | 468 | 403 | 1,350 | 1,152 | ||||||||||||
| $ | 4,033 | $ | 4,209 | $ | 14,463 | $ | 14,694 | |||||||||
Share unit expense (recovery) and employer contributions to the employee share purchase plan are recognized in SG&A expenses.
Stock option plan
The Company has three stock option plans that provide for the award of stock options to selected employees, directors and officers of the Company: a) 1999 Employee Stock Purchase Plan, as amended February 17, 2017, b) IronPlanet 1999 Stock Plan, and c) IronPlanet 2015 Stock Plan. The IronPlanet 1999 Stock Plan and IronPlanet 2015 Stock Plan were assumed by the Company as part of the acquisition of IronPlanet (note 22).
Stock option activity for the nine months ended September 30, 2017 is presented below:
| WA | ||||||||||||||||
| Common | WA | remaining | Aggregate | |||||||||||||
| shares under | exercise | contractual | intrinsic | |||||||||||||
| option | price | life (in years) | value | |||||||||||||
| Outstanding, December 31, 2016 | 3,366,714 | $ | 24.02 | 7.5 | $ | 33,601 | ||||||||||
| Granted | 960,057 | 31.14 | ||||||||||||||
| Assumed in acquisition (note 22) | 737,358 | 14.26 | ||||||||||||||
| Exercised | (355,514 | ) | 22.32 | $ | 3,202 | |||||||||||
| Forfeited | (124,414 | ) | 18.85 | |||||||||||||
| Outstanding, September 30, 2017 | 4,584,201 | $ | 21.92 | 7.6 | $ | 23,721 | ||||||||||
| Exercisable, September 30, 2017 | 1,917,439 | $ | 23.25 | 6.2 | $ | 14,418 | ||||||||||
The fair value of the stock option grants is estimated on the date of the grant using the Black-Scholes option pricing model. The weighted average grant date fair value of options granted during the nine months ended September 30, 2017 was $7.24.
| Ritchie Bros. | 35 |
Notes to the Condensed Consolidated Financial Statements
(Tabular amounts expressed in thousands of United States dollars, except where noted)
(Unaudited)
20. Share-based payments (continued)
The significant assumptions used to estimate the fair value of stock options granted during the nine months ended September 30, 2017 and 2016 are presented in the following table on a weighted average basis:
| Nine months ended September 30, | 2017 | 2016 | ||||||
| Risk free interest rate | 2.0 | % | 1.1 | % | ||||
| Expected dividend yield | 2.14 | % | 2.36 | % | ||||
| Expected lives of the stock options | 5 years | 5 years | ||||||
| Expected volatility | 27.8 | % | 26.9 | % | ||||
The fair value of the assumed stock options is estimated on the IronPlanet acquisition date using the Black-Scholes option pricing model. The weighted average fair value of the assumed options was $16.93. The significant assumptions used to estimate the fair value of these assumed stock options are presented in the following table on a weighted average basis:
| Nine months ended September 30, | 2017 | |||
| Risk free interest rate | 0.8 | % | ||
| Expected dividend yield | 2.19 | % | ||
| Expected lives of the stock options | 0.4 years | |||
| Expected volatility | 32.1 | % | ||
As at September 30, 2017, the unrecognized stock-based compensation cost related to the non-vested stock options was $8,924,000, which is expected to be recognized over a weighted average period of 2.4 years.
Share unit plans
Share unit activity for the nine months ended September 30, 2017 is presented below:
| Equity-classified awards | Liability-classified awards | |||||||||||||||||||||||||||||||
| PSUs | PSUs (1) | Restricted share units ("RSUs") | DSUs | |||||||||||||||||||||||||||||
| WA grant | WA grant | WA grant | WA grant | |||||||||||||||||||||||||||||
| date fair | date fair | date fair | date fair | |||||||||||||||||||||||||||||
| Number | value | Number | value | Number | value | Number | value | |||||||||||||||||||||||||
| Outstanding, December 31, 2016 | 243,968 | $ | 27.48 | 311,329 | $ | 23.96 | 160,009 | $ | 23.37 | 73,520 | $ | 25.41 | ||||||||||||||||||||
| Granted | 133,452 | 30.31 | 94,982 | 31.40 | 849 | 32.47 | 13,548 | 30.77 | ||||||||||||||||||||||||
| Reclassification on modification | 81,533 | 24.47 | (81,533 | ) | 24.66 | - | - | - | - | |||||||||||||||||||||||
| Vested and settled | (27,326 | ) | 26.82 | (49,873 | ) | 23.64 | (152,544 | ) | 23.26 | - | - | |||||||||||||||||||||
| Forfeited | - | - | (15,806 | ) | 26.31 | - | - | - | - | |||||||||||||||||||||||
| Outstanding, September 30, 2017 | 431,627 | $ | 27.83 | 259,099 | $ | 26.39 | 8,314 | $ | 26.29 | 87,068 | $ | 26.24 | ||||||||||||||||||||
| (1) | Liability-classified PSUs include PSUs awarded under the employee PSU plan and the previous 2013 PSU plan, in place prior to 2015, that are cash-settled and not subject to market vesting conditions. |
As at September 30, 2017, the unrecognized share unit expense related to equity-classified PSUs was $5,986,000, which is expected to be recognized over a weighted average period of 1.9 years. The unrecognized share unit expense related to liability-classified PSUs was $4,030,000, which is expected to be recognized over a weighted average period of 1.8 years. The unrecognized share unit expense related to liability-classified RSUs was $58,000, which is expected to be recognized over a weighted average period of 1.0 years. There is no unrecognized share unit expense related to liability-classified DSUs as they vest immediately upon grant.
| Ritchie Bros. | 36 |
Notes to the Condensed Consolidated Financial Statements
(Tabular amounts expressed in thousands of United States dollars, except where noted)
(Unaudited)
20. Share-based payments (continued)
Share unit plans (continued)
Senior executive and employee PSU plans
The Company grants PSUs under a senior executive PSU plan and an employee PSU plan (the “PSU Plans”). Under the PSU Plans, the number of PSUs that vest is conditional upon specified market, service, and performance vesting conditions being met.
PSUs awarded under the PSU Plans are subject to market vesting conditions. The fair value of the liability-classified PSUs awarded under the employee PSU plan is estimated on the date of grant and at each reporting date using a binomial model. The significant assumptions used to estimate the fair value of the liability-classified PSUs awarded under the employee PSU plan during the nine months ended September 30, 2017 and 2016 are presented in the following table on a weighted average basis:
| Nine months ended September 30, | 2017 | 2016 | ||||||
| Risk free interest rate | 1.4 | % | 1.2 | % | ||||
| Expected dividend yield | 1.92 | % | 2.49 | % | ||||
| Expected lives of the PSUs | 3 years | 3 years | ||||||
| Expected volatility | 28.2 | % | 29.9 | % | ||||
| Average expected volatility of comparable companies | 37.0 | % | 37.0 | % | ||||
Sign-on grant PSUs
On August 11, 2014, the Company awarded 102,375 one-time sign-on grant PSUs (the “SOG PSUs”). The SOG PSUs were cash-settled and subject to market vesting conditions related to the Company’s share performance over rolling two, three, four, and five-year periods.
Prior to May 1, 2017, the Company was only able to settle the SOG PSU award in cash, and as such, the plan was classified as a liability award. On May 1, 2017 (the “modification date”), the shareholders approved amendments to the SOG PSU grant, allowing the Company to choose whether to settle the award in cash or in shares. With respect to settling in shares, the new settlement options allow the Company to issue a number of shares equal to the number of units that vest. The shareholders authorized 150,000 shares to be issued for settlement of the PSUs.
On the modification date, the SOG PSU award was reclassified to equity award, based on the Company’s settlement intentions. The weighted average fair value of the SOG PSU award outstanding on the modification date was $24.47. The share unit liability, representing the portion of the fair value attributable to past service, was $1,421,000, which was reclassified to equity on that date. No incremental compensation was recognized as a result of the modification. Unrecognized compensation expense based on the fair value of the SOG PSU award on the modification date will be amortized over the remaining service period.
Because the PSUs awarded under the new plans are contingently redeemable in cash in the event of death of the participant, on the modification date, the Company reclassified $1,803,000 to temporary equity, representing the portion of the contingent redemption amount of the SOG PSUs as if redeemable on May 1, 2017, to the extent attributable to prior service.
| Ritchie Bros. | 37 |
Notes to the Condensed Consolidated Financial Statements
(Tabular amounts expressed in thousands of United States dollars, except where noted)
(Unaudited)
20. Share-based payments (continued)
Share unit plans (continued)
Sign-on grant PSUs (continued)
The fair value of the equity-classified SOG PSUs is estimated on modification date and on the date of grant using a binomial model. The significant assumptions used to estimate the fair value of the equity-classified PSUs for the nine months ended September 30, 2017 are presented in the following table on a weighted average basis:
| Nine months ended September 30, | 2017 | |||
| Risk free interest rate | 1.6 | % | ||
| Expected dividend yield | 2.54 | % | ||
| Expected lives of the PSU | 4 years | |||
| Expected volatility | 28.6 | % | ||
Amendment to RSU plans
The Company has RSU plans that are not subject to market vesting conditions. Prior to November 8, 2017, the Company was only able to settle the RSU awards in cash, and as such, the RSUs were classified as liability awards, which are fair valued on grant date and at each reporting date using the 20-day volume weighted average price of the Company’s common shares listed on the New York Stock Exchange. On November 8, 2017 (the “RSU modification date”), the Board of Directors approved amendments to the RSU plans, allowing the Company to choose whether to settle the awards in cash or in shares for new RSUs granted after the RSU modification date. With respect to settling in shares, the new settlement options allow the Company to either (i) arrange for the purchase shares on the open market on the employee’s behalf based on the cash value that otherwise would be delivered, or (ii) to issue a number of shares equal to the number of units that vest. The Company has registered 300,000 shares to be issued for settlement of the RSUs which will be proposed for shareholder approval at the next annual general meeting.
21. Contingencies
Legal and other claims
The Company is subject to legal and other claims that arise in the ordinary course of its business. Management does not believe that the results of these claims will have a material effect on the Company’s consolidated balance sheet or consolidated income statement.
Guarantee contracts
In the normal course of business, the Company will in certain situations guarantee to a consignor a minimum level of proceeds in connection with the sale at auction of that consignor’s equipment.
At September 30, 2017 there was $40,722,000 of industrial assets guaranteed under contract, of which 60% is expected to be sold prior to the end of December 2017, with the remainder relating to guarantees issued by IronPlanet to be sold by October 2018 (December 31, 2016: $3,813,000 of which 100% was expected to be sold prior to the end of March 2017).
At September 30, 2017 there was $14,577,000 of agricultural assets guaranteed under contract, of which 77% is expected to be sold prior to the end of December 2017, with the remainder to be sold by the end of April 2018 (December 31, 2016: $11,415,000 of which 100% was expected to be sold prior to the end of July 2017).
The outstanding guarantee amounts are undiscounted and before estimated proceeds from sale at auction.
| Ritchie Bros. | 38 |
Notes to the Condensed Consolidated Financial Statements
(Tabular amounts expressed in thousands of United States dollars, except where noted)
(Unaudited)
22. Business combinations
| (a) | IronPlanet acquisition |
On May 31, 2017 (the “IronPlanet Acquisition Date”), the Company acquired 100% of the issued and outstanding shares of IronPlanet for a total fair value consideration of $776,474,000. As at the acquisition date, cash consideration of $772,706,000 has been paid to the former shareholders, vested option holders and warrant holders of IronPlanet. In addition to the cash consideration, non-cash consideration of $2,330,000 was issued attributable to the assumption of outstanding IronPlanet options, $1,771,000 was paid in cash related to customary closing adjustments, and $333,000 was related to settlement of intercompany payable transactions.
A summary of the net cash flows and purchase price are detailed below:
| May 31, 2017 | ||||
| Cash consideration paid to former equity holders | $ | 723,810 | ||
| Settlement of IronPlanet's debt | 36,313 | |||
| Settlement of IronPlanet's transaction costs | 12,583 | |||
| Cash consideration paid on closing | 772,706 | |||
| Cash consideration paid related to closing adjustments | 1,771 | |||
| Less: cash and cash equivalents acquired | (95,626 | ) | ||
| Less: restricted cash acquired | (3,000 | ) | ||
| Acquisition of IronPlanet, net of cash acquired | $ | 675,851 | ||
| Cash consideration paid on closing | $ | 772,706 | ||
| Replacement stock option awards attributable to pre- combination services | 4,926 | |||
| Stock option compensation expense from accelerated vesting of awards attributable to post-combination services | (2,596 | ) | ||
| Cash consideration paid relating to closing adjustments | 1,771 | |||
| Settlement of pre-existing intercompany balances | (333 | ) | ||
| Purchase price | $ | 776,474 | ||
As part of the acquisition of IronPlanet, the Company assumed IronPlanet’s existing 1999 and 2015 Stock Option Plans under the same terms and conditions. The fair value of IronPlanet’s stock options at the date of acquisition was determined using the Black-Scholes pricing model. Of the total fair value, $51,678,000 has been attributed as pre-combination service and included as part of the total acquisition consideration. The post-combination attribution of $10,154,000 is made up of two components, 1) $4,752,000 related to acceleration of options upon closing of the transaction, which was immediately recognized in acquisition-related costs, and 2) $5,402,000 related to the remaining unvested options, which will be recognized as compensation expense over the vesting period.
IronPlanet is a leading online marketplace for selling and buying used equipment and other durable assets and an innovative participant in the multi–billion dollar used equipment market. The acquisition expands the breadth and depth of equipment disposition and management solutions the Company can offer its customers.
The acquisition was accounted for in accordance with ASC 805, Business Combinations. The assets acquired and liabilities assumed were recorded at their estimated fair values at the IronPlanet Acquisition Date. Goodwill of $567,410,000 was calculated as the fair value of consideration over the estimated fair value of the net assets acquired.
| Ritchie Bros. | 39 |
Notes to the Condensed Consolidated Financial Statements
(Tabular amounts expressed in thousands of United States dollars, except where noted)
(Unaudited)
22. Business combinations (continued)
| (a) | IronPlanet acquisition (continued) |
IronPlanet provisional purchase price allocation
| May 31, 2017 | ||||
| Purchase price | $ | 776,474 | ||
| Assets acquired: | ||||
| Cash and cash equivalents | $ | 95,626 | ||
| Restricted cash | 3,000 | |||
| Trade and other receivables | 13,021 | |||
| Inventory | 1,012 | |||
| Advances against auction contracts | 4,623 | |||
| Prepaid expenses and deposits | 1,233 | |||
| Income taxes receivable | 170 | |||
| Property, plant and equipment | 2,381 | |||
| Other non-current assets | 2,551 | |||
| Deferred tax assets | 1,497 | |||
| Intangible assets ~ | 188,000 | |||
| Liabilities assumed: | ||||
| Auction proceeds payable | 63,616 | |||
| Trade and other payables | 14,511 | |||
| Income taxes payable | 55 | |||
| Deferred tax liabilities | 25,868 | |||
| Fair value of identifiable net assets acquired | 209,064 | |||
| Goodwill acquired on acquisition | $ | 567,410 | ||
| ~ | Intangible assets consist of indefinite-lived trade names and trademarks, customer relationships with estimated useful lives of ranging from six to 13 years, and a technology platform with an estimated useful life of 7 years. |
The amounts included in the IronPlanet provisional purchase price allocation are preliminary in nature and are subject to adjustment as additional information is obtained about the facts and circumstances that existed as of the IronPlanet Acquisition Date. The final determination of the fair values of certain assets and liabilities will be completed within the measurement period of up to one year from the IronPlanet Acquisition Date, and is dependent upon finalization of income tax liabilities and the valuation report. Adjustments to the preliminary values during the measurement period will be recorded in the operating results of the reporting period in which the adjustments are determined. Changes to the amounts recorded as assets and liabilities will result in a corresponding adjustment to goodwill.
Goodwill
The main drivers generating goodwill are the anticipated synergies from (1) the Company's auction expertise and transactional capabilities to IronPlanet's existing customer base, (2) IronPlanet providing existing technology to the Company's current customer base, and (3) future growth from international expansion and new Caterpillar dealers. Other factors generating goodwill include the acquisition of IronPlanet's assembled work force and their associated technical expertise.
| Ritchie Bros. | 40 |
Notes to the Condensed Consolidated Financial Statements
(Tabular amounts expressed in thousands of United States dollars, except where noted)
(Unaudited)
22. Business combinations (continued)
| (a) | IronPlanet acquisition (continued) |
Contributed revenue and net income
The results of IronPlanet’s operations are included in these consolidated financial statements from the IronPlanet Acquisition Date. IronPlanet contributed revenues of $22,500,000 and a net loss of $1,696,000 to the Company’s revenues and net income during the three months ended September 30, 2017. IronPlanet contributed revenues of $33,380,000 and a net loss of $1,404,000 to the Company's revenues and net income during period from acquisition to September 30, 2017. IronPlanet’s contributed net loss includes charges related to amortization of intangible assets acquired.
The following table includes the unaudited condensed pro forma financial information that presents the combined results of operations as if the transactions relating to the IronPlanet acquisition and the financing required to fund the acquisition had occurred on January 1, 2016. These transactions include adjustments in each applicable period presented for recurring charges related to amortization of intangible assets acquired, interest expense related to the acquisition financing, changes in fair value of convertible preferred stock warrant liability, certain stock option compensation expenses, and taxes, as well as adjustments to the diluted weighted average number of shares outstanding. In addition, these transactions also include pre-tax adjustments related to non-recurring charges totalling $55,239,000 incurred between the third quarter of 2016 and the second quarter of 2017. The non-recurring transactions include certain acquisition-related and financing costs, stock option compensation expenses, and severance costs, together with the related income tax recovery.
The unaudited pro forma condensed combined financial information does not purport to represent what the Company’s results of operations or financial condition would have been had the IronPlanet acquisition and related transactions occurred on the dates indicated, and it does not purport to project the Company’s results of operations or financial condition for any future period or as of any future date.
| Three months ended | Nine months ended | |||||||||||||||
| September 30, | September 30, | |||||||||||||||
| 2017 | 2016 | 2017 | 2016 | |||||||||||||
| Revenue | $ | 141,047 | $ | 153,817 | $ | 481,076 | $ | 503,711 | ||||||||
| Net income (loss) | 10,323 | (9,583 | ) | 57,491 | 2,089 | |||||||||||
| Basic earnings (loss) per share | 0.10 | (0.09 | ) | 0.54 | 0.00 | |||||||||||
| Diluted earnings (loss) per share | 0.09 | (0.09 | ) | 0.53 | 0.00 | |||||||||||
The unaudited pro forma net loss for the third quarter of 2016 includes an impairment loss on the EquipmentOne reporting unit goodwill of $23,574,000 and a pre-tax impairment loss on the EquipmentOne reporting unit customer relationships of $4,669,000.
The pro forma financial information included in the Company’s unaudited condensed consolidated interim financial statements for the three and six months ended June 30, 2017 and 2016 previously filed on August 8, 2017, has been adjusted as per the table below. The adjustments correct a mechanical computation error in determining pro forma net income. The adjustments resulted in an increase to net income by $2,844,000 and $3,343,000 for the three and six months ended June 30, 2017, respectively, and an increase to net income by $3,618,000 for the three months ended June 30, 2016 and a decrease to net income by $16,702,000 for the six months ended June 30, 2016. There were related adjustments to the basic and diluted earnings per share. There was no adjustment to revenues as reported. These adjustments have no impact on the consolidated balance sheets, consolidated income statements, or the consolidated statements of cash flows.
| Ritchie Bros. | 41 |
Notes to the Condensed Consolidated Financial Statements
(Tabular amounts expressed in thousands of United States dollars, except where noted)
(Unaudited)
22. Business combinations (continued)
| (a) | IronPlanet acquisition (continued) |
Contributed revenue and net income (continued)
| Three months ended | Six months ended | |||||||||||||||
| June 30, | June 30, | |||||||||||||||
| 2017 | 2016 | 2017 | 2016 | |||||||||||||
| Revenue | $ | 185,485 | $ | 187,089 | $ | 340,029 | $ | 349,893 | ||||||||
| Net income | 28,619 | 32,021 | 47,168 | 11,671 | ||||||||||||
| Basic earnings per share | 0.27 | 0.29 | 0.44 | 0.10 | ||||||||||||
| Diluted earnings per share | 0.26 | 0.29 | 0.43 | 0.10 | ||||||||||||
Transactions recognized separately from the acquisition of assets and assumptions of liabilities
Acquisition-related costs
Expenses totalling $32,591,000 for legal fees, stock option compensation expense, and other acquisition-related costs are included in the consolidated income statement for the nine months ended September 30, 2017.
| (b) | Kramer acquisition |
On November 15, 2016 (the “Kramer Acquisition Date”), the Company purchased the assets of Kramer Auctions Ltd. for cash consideration of Canadian dollar 15,300,000 ($11,361,000) comprised of Canadian dollar 15,000,000 ($11,138,000) paid at acquisition date and Canadian dollar 300,000 ($223,000) deferred payments over three years. In addition to cash consideration, consideration of up to Canadian dollar 2,500,000 ($1,856,000) is contingent on Kramer achieving certain operating performance targets over the three-year period following acquisition. Kramer is a leading Canadian agricultural auction company with exceptionally strong customer relationships in central Canada. This acquisition is expected to significantly strengthen Ritchie Bros.’ penetration of Canada’s agricultural sector and add key talent to our Canadian Agricultural sales and operations team.
The acquisition was accounted for in accordance with ASC 805 Business Combinations. The assets acquired were recorded at their estimated fair values at the Kramer Acquisition Date. Goodwill of $6,822,000 was calculated as the fair value of consideration over the estimated fair value of the net assets acquired.
Kramer provisional purchase price allocation
| November 15, 2016 | ||||
| Purchase price | $ | 11,138 | ||
| Deferred purchase note consideration | 223 | |||
| Fair value of contingent consideration | 538 | |||
| Total fair value at Petrowsky Acquisition Date | 11,899 | |||
| Assets acquired: | ||||
| Property, plant and equipment | $ | 399 | ||
| Intangible assets ~ | 4,678 | |||
| Fair value of identifiable net assets acquired | 5,077 | |||
| Goodwill acquired on acquisition | $ | 6,822 | ||
~ Consists of customer relationships and trade names with estimated useful lives of 10 and three years, respectively.
| Ritchie Bros. | 42 |
Notes to the Condensed Consolidated Financial Statements
(Tabular amounts expressed in thousands of United States dollars, except where noted)
(Unaudited)
22. Business combinations (continued)
| (b) | Kramer acquisition (continued) |
Kramer provisional purchase price allocation (continued)
The amounts included in the Kramer provisional purchase price allocation are preliminary in nature and are subject to adjustment as additional information is obtained about the facts and circumstances that existed as of the Kramer Acquisition Date. The final determination of the fair values of certain assets and liabilities will be completed within the measurement period of up to one year from the Kramer Acquisition Date. Adjustments to the preliminary values during the measurement period will be recorded in the operating results of the period in which the adjustments are determined. Changes to the amounts recorded as assets and liabilities will result in a corresponding adjustment to goodwill.
Assets acquired
At the date of acquisition, the Company determined the fair value of the assets acquired using appropriate valuation techniques.
Goodwill
Kramer is a highly complementary business that will broaden the Company’s base in the agriculture sector in Canada, one of the main drivers generating goodwill.
Contingent consideration
At the date of acquisition, the maximum contingent consideration of Canadian dollar 2,500,000 ($1,856,000) was fair valued at Canadian dollar 725,000 ($538,000). The contingent consideration is based on the cumulative revenue growth during a three-year period ending November 15, 2019. The liability is remeasured on each reporting date at its estimated fair value, which is determined using actual results up to the reporting date and forecasted results over the remainder of the performance period. Changes in the fair value are recognized in other income or expense in the consolidated income statement, as applicable. At September 30, 2017, the Company did not recognize a liability as the estimated fair value of the contingent consideration was nil (December 31, 2016: Canadian dollar 725,000 ($538,000)). In the three and nine months ending September 30, 2017 the Company recognized other income of $626,000 and $620,000, respectively associated with the change in fair value.
Transactions recognized separately from the acquisition of assets and assumptions of liabilities
Acquisition-related costs
Expenses totalling $429,000 for continuing employment costs and other acquisition-related costs are included in the consolidated income statements for the nine months ended September 30, 2017.
Employee compensation in exchange for continued services
The Company may pay an additional amount not exceeding Canadian dollar 1,000,000 ($743,000) over a three-year period based on the continuing employment of four key leaders of Kramer with the Company.
| (c) | Petrowsky acquisition |
On August 1, 2016 (the “Petrowsky Acquisition Date”), the Company acquired the assets of Petrowsky for cash consideration of $6,250,000. An additional $750,000 was paid for the retention of certain key employees. In addition to cash consideration, consideration of up to $3,000,000 is contingent on Petrowsky achieving certain revenue growth targets over the three-year period following acquisition. Based in North Franklin, Connecticut, Petrowsky caters largely to equipment sellers in the construction and transportation industries. Petrowsky also serves customers selling assets in the underground utility, waste recycling, marine, and commercial real estate industries. The business operates one permanent auction site, in North Franklin, which will continue to hold auctions, and also specializes in off-site auctions held on the land of the consignor.
| Ritchie Bros. | 43 |
Notes to the Condensed Consolidated Financial Statements
(Tabular amounts expressed in thousands of United States dollars, except where noted)
(Unaudited)
22. Business combinations (continued)
| (c) | Petrowsky acquisition (continued) |
The acquisition was accounted for in accordance with ASC 805 Business Combinations. The assets acquired were recorded at their estimated fair values at the Petrowsky Acquisition Date. Goodwill of $4,308,000 was calculated as the fair value of consideration over the estimated fair value of the net assets acquired.
Petrowsky purchase price allocation
| August 1, 2016 | ||||
| Purchase price | $ | 6,250 | ||
| Fair value of contingent consideration | 1,433 | |||
| Total fair value at Petrowsky Acquisition Date | 7,683 | |||
| Assets acquired: | ||||
| Property, plant and equipment | $ | 441 | ||
| Intangible assets ~ | 2,934 | |||
| Fair value of identifiable net assets acquired | 3,375 | |||
| Goodwill acquired on acquisition | $ | 4,308 | ||
~Consists of customer relationships with estimated useful lives of 10 years.
Assets acquired and liabilities assumed
At the date of the acquisition, the carrying amounts of the assets and liabilities acquired approximated their fair values, except customer relationships, whose fair value was determined using appropriate valuation techniques.
Goodwill
Petrowsky is a highly complementary business that will broaden the Company’s base of equipment sellers, one of the main drivers generating goodwill. Petrowsky’s sellers are primarily in the construction and transportation industries, which are also well aligned with the Company’s sector focus.
Contingent consideration
As part of the acquisition, contingent consideration of up to $3,000,000 is payable to Petrowsky if certain revenue growth targets are achieved. The contingent consideration is based on the cumulative revenue growth during a three-year period ending July 31, 2019. The liability is remeasured on each reporting date at its estimated fair value, which is determined using actual results up to the reporting date and forecasted results over the remainder of the performance period. Changes in the fair value are recognized in other income or expense in the consolidated income statement, as applicable. In the three and nine months ending September 30, 2017, the Company recognized other income of nil and $1,457,000, respectively, associated with the change in fair value. At September 30, 2017, the Company did not recognize a liability as the estimated fair value of the contingent consideration was nil (December 31, 2016: $1,433,000).
Transactions recognized separately from the acquisition of assets and assumptions of liabilities
Acquisition-related costs
Expenses totalling $557,000 for continuing employment and other acquisition-related costs are included in the condensed consolidated income statement for the nine months ended September 30, 2017.
| Ritchie Bros. | 44 |
Notes to the Condensed Consolidated Financial Statements
(Tabular amounts expressed in thousands of United States dollars, except where noted)
(Unaudited)
22. Business combinations (continued)
| (c) | Petrowsky acquisition (continued) |
Transactions recognized separately from the acquisition of assets and assumptions of liabilities (continued)
Employee compensation in exchange for continued services
As noted above, $750,000 was paid on the Petrowsky Acquisition Date in exchange for the continuing services of certain key employees. In addition, the Company may pay an amount not exceeding $1,000,000 over a three-year period, payable in equal annual installments, on the anniversary date of the acquisition based on the founder of Petrowsky’s continuing employment with the Company. The Company paid $333,000 in this regard during the three months ended September 30, 2017.
| (d) | Mascus acquisition |
On February 19, 2016 (the “Mascus Acquisition Date”), the Company acquired 100% of the issued and outstanding shares of Mascus for cash consideration of €26,553,000 ($29,580,000). In addition to cash consideration, consideration of up to €3,198,000 ($3,563,000) of which, €1,215,000 ($1,302,000) has been paid, is contingent on Mascus achieving certain operating performance targets over the three-year period following acquisition. Mascus is based in Amsterdam and provides an online equipment listing service for used heavy machines and trucks. The acquisition expands the breadth and depth of equipment disposition and management solutions the Company can offer its customers.
The acquisition was accounted for in accordance with ASC 805, Business Combinations. The assets acquired and liabilities assumed were recorded at their estimated fair values at the Mascus Acquisition Date. Goodwill of $19,664,000 was calculated as the fair value of consideration over the estimated fair value of the net assets acquired.
Mascus purchase price allocation
| February 19, 2016 | ||||
| Purchase price | $ | 29,580 | ||
| Fair value of contingent consideration | 3,431 | |||
| Non-controlling interests (1) | 596 | |||
| Total fair value at Mascus Acquisition Date | 33,607 | |||
| Fair value of assets acquired: | ||||
| Cash and cash equivalents | $ | 1,457 | ||
| Trade and other receivables | 1,290 | |||
| Prepaid expenses | 528 | |||
| Property, plant and equipment | 104 | |||
| Intangible assets (2) | 14,817 | |||
| Fair value of liabilities assumed: | ||||
| Trade and other payables | 1,533 | |||
| Other non-current liabilities | 37 | |||
| Deferred tax liabilities | 2,683 | |||
| Fair value of identifiable net assets acquired | 13,943 | |||
| Goodwill acquired on acquisition | $ | 19,664 | ||
| Ritchie Bros. | 45 |
Notes to the Condensed Consolidated Financial Statements
(Tabular amounts expressed in thousands of United States dollars, except where noted)
(Unaudited)
22. Business combinations (continued)
| (d) | Mascus acquisition (continued) |
Mascus purchase price allocation (continued)
| (1) | The Company acquired 100% of Mascus and within the Mascus group of entities there were two subsidiaries that were not wholly-owned, one domiciled in the United States and one domiciled in Denmark. As such, the Company acquired non-controlling interests. The fair value of each non-controlling interest was determined using an income approach based on cash flows of the respective entities that were attributable to the non-controlling interest. On May 27, 2016, Ritchie Bros. Holdings (America) Inc. acquired the remaining issued and outstanding shares of the Mascus subsidiary domiciled in the United States for cash consideration of $226,000. |
| (2) | Intangible assets consist of customer relationships with estimated useful lives of 17 years, indefinite-lived trade names, and software assets with estimated useful lives of five years. |
Goodwill
The main drivers generating goodwill are the anticipated synergies from (1) the Company's core auction expertise and transactional capabilities to Mascus' existing customer base, and (2) Mascus' providing existing technology to the Company's current customer base. Other factors generating goodwill include the acquisition of Mascus' assembled work force and their associated technical expertise.
Contingent consideration
At the date of acquisition, the maximum contingent consideration of €3,198,000 ($3,563,000) was fair valued at €3,080,000 ($3,431,000). The consideration is contingent upon the achievement of certain operating performance targets during the three-year period following acquisition and is due in three instalments, each occurring after the end of the respective 12-month performance period. During the nine months ended September 30, 2017 after having achieved certain first performance period targets, the Company made the first instalment payment of €1,215,000 ($1,302,000). The remaining liability is remeasured on each reporting date at its estimated fair value, which is determined using actual results up to the reporting date and forecasted results over the remainder of the performance period. Changes in the fair value are recognized in other income or expense in the consolidated income statement, as applicable. At September 30, 2017 the estimated fair value of the contingent consideration was €1,608,000 ($1,900,000) (December 31, 2016: €3,080,000 ($3,431,000)). During the nine months ended September 30, 2017 the Company recognized €178,000 ($193,000) in other income associated with the change in fair value.
Transactions recognized separately from the acquisition of assets and assumptions of liabilities
Acquisition-related costs
Expenses totalling $426,000 for continuing employments costs and other acquisition-related costs are included in the condensed consolidated income statement for the nine months ended September 30, 2017 (2016: $1,450,000).
Employee compensation in exchange for continued services
The Company may pay additional amounts not exceeding €1,625,000 ($1,849,000) over a three-year period ending February 19, 2019 based on key employees’ continuing employment with Mascus. The Company paid €393,000 ($419,000) in this regard during the nine months ended September 30, 2017.
| Ritchie Bros. | 46 |
Notes to the Condensed Consolidated Financial Statements
(Tabular amounts expressed in thousands of United States dollars, except where noted)
(Unaudited)
23. Contingently redeemable non-controlling interest in Ritchie Bros. Financial Services
Until July 12, 2016, the Company held a 51% interest in RBFS, an entity that provides loan origination services to enable the Company’s auction customers to obtain financing from third party lenders.
The Company and the NCI holders each held options pursuant to which the Company could acquire, or be required to acquire, the NCI holders’ 49% interest in RBFS. On July 12, 2016, the Company completed its acquisition of the NCI. On that date, the Company acquired the NCI holders’ 49% interest in RBFS for total consideration of 57,900,000 Canadian dollars ($44,141,000).
| Ritchie Bros. | 47 |
| ITEM 2: | MANAGEMENT’S DISCUSSION AND ANALYSIS OF FINANCIAL CONDITION AND RESULTS OF OPERATIONS |
About Us
Ritchie Bros. Auctioneers Incorporated (“Ritchie Bros.”, the “Company”, “we”, or “us”) (NYSE & TSX: RBA) is a world leader in asset management and disposition of used industrial equipment and other durable assets, selling $3.2 billion of used equipment and other assets during the first nine months of 2017. Our expertise, unprecedented global reach, market insight, and trusted portfolio of brands provide us with a unique position in the used equipment market. We primarily sell used equipment for our customers through live, unreserved auctions at 45 auction sites worldwide, which are simulcast online to reach a global bidding audience. On May 31, 2017, we completed our acquisition of IronPlanet Holdings, Inc. (“IronPlanet”), a leading online marketplace for heavy equipment and other durable assets. Between its inception in 1999 and 2016, IronPlanet sold over $5 billion of used heavy equipment online and registered more than 1.5 million users worldwide. These complementary used equipment brand solutions, together with EquipmentOne, an online-only used equipment marketplace we launched in 2013, provide different value propositions to equipment owners and allow us to meet the needs and preferences of a wide spectrum of equipment sellers and buyers. In the past three years, we have also added a private brokerage service (Ritchie Bros. Private Treaty) and an online listing service (Mascus).
Through our unreserved auctions, online marketplaces, and private brokerage services, we sell a broad range of used and unused equipment, including earthmoving equipment, truck trailers, government surplus, oil and gas equipment and other industrial assets. Construction and heavy machinery comprise the majority of the equipment sold through our multiple brand solutions. Customers selling equipment through our sales channels include end users (such as construction companies), equipment dealers, original equipment manufacturers (“OEMs”) and other equipment owners (such as rental companies). Our customers participate in a variety of sectors, including heavy construction, transportation, agriculture, energy, and mining.
We operate globally with locations in more than 20 countries, including the United States, Canada, Australia, United Arab Emirates, and the Netherlands, and employ more than 2,100 full time employees worldwide.
On May 15, 2012, we purchased AssetNation, an online marketplace and solutions provider for surplus and salvage assets based in the United States. Leveraging AssetNation’s technology and e-commerce expertise, we commercially launched our online marketplace, EquipmentOne, in early 2013.
On November 4, 2015, we acquired a 75% interest in Xcira LLC (“Xcira”), a proven leader in simulcast auction technology that provides a seamless customer experience for online bidding at live on site auctions. Through this acquisition, we secured Xcira’s bidding technology, which represents a significant and growing portion of all bidding conducted at our auctions.
On February 19, 2016, we acquired 100% of the equity interests in Mascus International Holding B.V. (“Mascus”). Mascus is based in Amsterdam and operates a global online listing service to advertise equipment and other assets for sale. Unlike other sales channels offered by Ritchie Bros., Mascus currently does not process transactions through its website; rather, sales facilitated through Mascus are conducted directly between the seller and buyer.
On July 12, 2016, we acquired the remaining minority interest of Ritchie Bros. Financial Services (“RBFS”), providing us with full ownership of this growing business. RBFS provides financing and leasing options to equipment purchasers, as a brokerage business, through several bank relationships. RBFS does not leverage our balance sheet for the loans it originates.
On August 1, 2016, we acquired Petrowsky Auctioneers (“Petrowsky”), a leading regional industrial auctioneer in the Northern United States. Similar to Ritchie Bros. Auctioneers, Petrowsky offers live on site and simulcast live online auctions.
| Ritchie Bros. | 48 |
On November 15, 2016, we acquired substantially all the assets of Kramer Auctions Ltd. and Kramer Auctions — Real Estate Division Inc. (together, ‘‘Kramer’’), a Canadian agricultural auction company with strong customer relationships in central Canada. Operating for more than 65 years, Kramer operates in Saskatchewan, Alberta and Manitoba as a premier agricultural auctioneer, offering both on-the-farm and live on site auctions for customers selling equipment, livestock and real-estate in the agricultural sector.
On May 31, 2017, we completed the acquisition of a 100% interest in IronPlanet (the “Merger”) pursuant to the Agreement and Plan of Merger we entered into on August 29, 2016. IronPlanet operates online and event-based equipment auctions under a number of brands, which are discussed in more detail below.
Our alliance with Caterpillar Inc. (“Caterpillar”), pursuant to the Strategic Alliance and Remarketing Agreement (the “Alliance”) that we entered into on August 29, 2016, became effective upon the consummation of the Merger on May 31, 2017. As discussed in more detail below, under the Alliance, we became Caterpillar's preferred global partner for live on site and online auctions for used Caterpillar equipment.
Our Service Offering
We offer equipment sellers and buyers multiple distinct, complementary, multi-channel brand solutions that address the range of customer needs. Our global customer base has a variety of transaction options, breadth of services, and the widest selection of used equipment available to them. The channels and formats with which our customers may choose to dispose and/or buy equipment based on their individual needs are illustrated in the tables below.
Auctions and Marketplaces
|
Channels |
Brand Solutions |
Description of Offering |
| Live On Site Auctions |  |
n Live unreserved on site with live simulcast online auctions |
 |
n Event-based sales of used construction and heavy equipment held in the Caterpillar dealer geographies | |
 |
n Event-based sales of used energy equipment | |
| Online Auctions and Marketplaces |  |
n Online marketplace for selling and buying used equipment |
 |
n Online marketplace offering multiple price and timing options | |
 |
n Online marketplace for the sale of government and military assets | |
 |
n Online truck and trailer marketplace | |
| Brokerage Service |  |
n Confidential, negotiated sales |
| Ritchie Bros. | 49 |
Other Services
|
Channels |
Brand Solutions |
Description of Offering |
| Financial Service |  |
n Loan origination service that uses a brokerage model to match loan applicants with appropriate financial lending institutions |
| Appraisal Service |  |
n Unbiased, certified appraisal services, as well as truck and lease return inspection services |
| Online Listing Service |  |
n Online equipment listing service and B2B dealer portal |
| Ancillary Services | n Repair, paint, and other make-ready services | |
| Logistical Service |  |
n End-to-end transportation and customs clearance solution for sellers and buyers with shipping needs |
Overview
The following discussion and analysis summarizes significant factors affecting our consolidated operating results and financial condition for the three and nine months ended September 30, 2017 and 2016. This discussion and analysis contains forward-looking statements that involve risks and uncertainties. Our actual results could differ materially from those expressed or implied in any forward-looking statements as a result of various factors, including those set forth in “Part II, Item 1A: Risk Factors” of this Quarterly Report on Form 10-Q and in “Part I, Item 1A: Risk Factors” of our Annual Report on Form 10-K for the year ended December 31, 2016, which is available on our website at www.rbauction.com, on EDGAR at www.sec.gov, or on SEDAR at www.sedar.com.
This discussion and analysis should be read in conjunction with the “Cautionary Note Regarding Forward-Looking Statements” and the consolidated financial statements and the notes thereto included in “Part I, Item 1: Consolidated Financial Statements” of this Quarterly Report on Form 10-Q. The following discussion should also be read in conjunction with our Annual Report on Form 10-K for the year ended December 31, 2016. None of the information on our website, EDGAR, or SEDAR is incorporated by reference into this document by this or any other reference.
We prepare our consolidated financial statements in accordance with United States generally accepted accounting principles (“US GAAP”). Except for GTV – which is a measure of operational performance and not a measure of financial performance, liquidity, or revenue – the amounts discussed below are based on our consolidated financial statements and are presented in United States (“U.S.”) dollars. Unless indicated otherwise, all tabular dollar amounts, including related footnotes, presented below are expressed in thousands of dollars.
We reference various non-GAAP financial and performance measures throughout this discussion and analysis. These measures do not have a standardized meaning and are, therefore, unlikely to be comparable to similar measures presented by other companies.
| Ritchie Bros. | 50 |
Strategy Update
Our strategy is to become a more diversified, multichannel marketplace that offers a full range of asset management and disposition solutions, all on a greater scale that will provide even more choice to customers. We are executing a transformation of our business and the industry that is being driven by our technology, data, and solutions. The following discussion highlights and describes our strategic drivers, Grow, Drive, and Optimize, and provides a post-merger integration update within each applicable section. Our integration activities began in the latter part of the second quarter of 2017, following the closing of the Merger with IronPlanet and, overall, we are currently progressing as expected through our multi-year plan of integration activities and milestones.
GROW Revenues and Net Income
Over the last several years, we have undertaken a meaningful strategic transformation, through both organic and acquisitive growth initiatives, to broaden our service offering and the value propositions we provide to different segments of the used asset and equipment market. The Merger with IronPlanet positions us to accelerate this strategy and take positive and meaningful steps towards meeting our strategic objectives.
The Merger is a transformative transaction that is helping us expand our equipment sales platform to better serve customers globally by enabling customers with varying preferences to choose from a variety of auction formats. We believe the Merger with IronPlanet:
| • | Offers a superior customer experience |
| • | Accelerates growth |
| • | Strengthens relationships with OEMs and dealers; |
| o | Caterpillar strategic alliance – the Alliance – which is for an initial period of five years, took effect during the third quarter of 2017. Under the Alliance, we became Caterpillar's preferred global partner for live on site and online auctions for used equipment, which we expect will contribute to our growth. We will provide Caterpillar and its dealers with access to proprietary, global auction and marketplace platforms, software, and other value-added services, which enhance the exchange of information and services between customers, dealers, and suppliers. When requested, we will coordinate and manage Cat® Auctions in the respective dealer geographies. |
| • | Builds on the power of the Ritchie Bros. existing global platform |
| • | Enhances digital and technology capabilities |
We are committed to pursuing growth initiatives that will further enhance our sector reach, drive geographic depth, meet a broader set of customer needs, and add scale to our operations. These growth initiatives include:
| • | Increasing customer penetration and overall market share through the network effect of our combined solution selling platform |
| • | Expanding IronPlanet internationally |
| • | Growing the Cat® Auctions brand, combined with the Alliance |
| • | Increasing access and penetration of growth sectors such as government surplus and energy |
| • | Continuing expansion of our Private Treaty capability |
| • | Expanding our financial services business, RBFS, into other geographies and to a broader customer base accessible through brand solutions, such as IronPlanet, that we gained with the Merger |
Notable integration activities that contributed to our GROW strategy in the quarter included:
| • | Expanding RBFS to the customer base accessible through the brand solutions we gained with the Merger |
| • | Expanding the Alliance, including tools and data available as a result |
| • | Expanding our government business in the United Kingdom |
| • | Launching IronPlanet in Australia |
| Ritchie Bros. | 51 |
DRIVE Efficiencies and Effectiveness
We are committed to driving efficiencies and effectiveness by:
| • | Improving sales productivity through consistent go-to-market processes |
| • | Modernizing legacy systems |
| • | Scaling the business and leveraging multi-channel opportunities |
| • | Targeting operating expense growth lower than revenue growth |
We continue to evaluate the returns generated at each of our permanent and regional auction sites we operate to assess whether each site and related site capital investments are generating returns that meet predetermined targets. During the first nine months of 2017, we terminated our lease in Panama and began exploring alternative future uses of our auction site land and buildings in Japan beyond a sale of the property.
The Merger impacted our auction site assessment, providing additional opportunities to optimize our auction sites. As a point of reference, in 2016, approximately 20% of IronPlanet’s revenues were driven from event-based auctions. We are undertaking efforts to optimize channel strategies that could eliminate duplicative event-based auctions, enhance equipment offerings at event-based auctions, and maximize auction channels.
Notable integration activities that contributed to our DRIVE strategy in the quarter included:
| • | Completing IronPlanet and Ritchie Bros. customer integration |
| • | Integrating IronPlanet pricing tools and SalesHub |
| • | Launching our Activity Tracking System on our Ritchie Bros. website |
| • | Integrating IronPlanet and Ritchie Bros.’ employee performance management processes |
| · | Completing the first phase of the technology integration – The Sales Unification Phase. This phase provides our teams with the ability to sell across platforms and integrate pricing and appraisal tools. |
| · | Commencing work on the second phase of the technology integration – The Enhanced Buyer Experience Phase. This phase will allow customers to search and find equipment across our websites and view their transaction history through single logon identification functionality. With the functionality, our customer will have a single point of entry, enabling listing and transaction visibility across our entire marketplace. This will give our buyers a true multichannel solution and access to our combined selection of equipment. We will also combine our platform solution offerings, which will enable our sellers to manage their assets across a multichannel listing and disposition solution. Customers will also benefit from a new contract that allows them to utilize our multiple channels with a single contract. |
Over time, we will also complete the third phase of the technology integration – The Operations Optimization Phase. This involves integrating our auction administration systems with real-time data and optimized workflow, leading to common processes and opportunities for further synergies.
OPTIMIZE our Balance Sheet
We will optimize our balance sheet by:
| • | Increasing cashflow from operating activities |
| • | Targeting net capital spend at less than 10% of revenue |
| • | Focusing on IT systems to optimize business processes and reduce costs |
| • | Managing debt levels while returning cash via ongoing dividends |
| Ritchie Bros. | 52 |
Key Metric Changes
In the third quarter of 2017, we updated our segment reporting to reflect changes in how we manage and evaluate the business operations. This change was driven by the Merger and the growth of our services that do not generate Gross Transaction Value1 (“GTV”). Our new segmented information disclosure distinguishes between revenues and expenses generated from transactional asset disposition services, which are services that generate GTV, and those that do not generate GTV. GTV replaces the previous term of Gross Auction Proceeds (“GAP”) used by Ritchie Bros. and Gross Merchandise Volume (“GMV”) used by IronPlanet, providing a common nomenclature across all channels.
With the change in segment reporting, we updated our GTV and Revenue Rate key metrics. GTV represents the total proceeds from all items sold in conjunction with our Auctions and Marketplaces segment. We have retrospectively restated GTV to exclude GTV from our Asset Appraisal Services (“AAS”) business. GTV attributable to AAS was $8.0 million during the third quarter of 2017 and $3.1 million during the second quarter of 2017. In addition, effective August 1, 2017, GTV no longer includes EquipmentOne buyer’s premiums. Excluding AAS GTV and EquipmentOne buyer’s premiums has a less than 1% impact on GTV reported to date.
We also introduced a segment Revenue Rate, which is calculated as Auctions and Marketplaces segment revenue divided by GTV. When referring to the original Revenue Rate metric, which is calculated as total, consolidated revenues divided by GTV, we will use the term ‘Consolidated Revenue Rate’.
Consolidated Financial Highlights
During the quarter, we generated $141.0 million of revenues, an increase of 9% versus the same quarter last year with $10.3 million of net income attributable to stockholders. Diluted earnings per share (“EPS”) attributable to stockholders was $0.09 including $3.6 million of acquisition-related costs and $10.6 million of interest expense, compared to a diluted loss per share attributable to stockholders of $0.05 in the third quarter of 2016.
| · | GTV of $1,019.3 million, a 2% increase compared to the third quarter of 2016 |
| · | Consolidated Revenue Rate of 13.84%, a 94-basis point increase from the third quarter of 2016 |
| · | Auctions and Marketplaces segment revenues up 8% with segment Revenue Rate up 66 basis points (“bps”) to 12.78% versus third quarter 2016 |
| · | Revenues from other services of $10.8 million; an increase of 39% compared to the third quarter of 2016 |
| · | $97.2 million of net cash provided by operating activities through the first nine months of 2017 |
| · | Declared quarterly dividend of $0.17 per common share |
| 1 | GTV represents total proceeds from all items sold at our auctions and online marketplaces. GTV is not a measure of financial performance, liquidity, or revenue, and is not presented in our consolidated financial statements. |
| Ritchie Bros. | 53 |
Results of Operations
Third Quarter Update
| Financial overview | Three months ended September 30, | |||||||||||||||
| $ Change | % Change | |||||||||||||||
| (in U.S. $000's, except EPS) | 2017 | 2016 | 2017
over 2016 | 2017
over 2016 | ||||||||||||
| Revenues | $ | 141,047 | $ | 128,876 | $ | 12,171 | 9 | % | ||||||||
| Costs of services, excluding depreciation and amortization | 19,583 | 14,750 | 4,833 | 33 | % | |||||||||||
| Selling, general and administrative expenses | 85,335 | 68,293 | 17,042 | 25 | % | |||||||||||
| Acquisition-related costs | 3,587 | 5,398 | (1,811 | ) | (34 | )% | ||||||||||
| Depreciation and amortization expenses | 14,837 | 10,196 | 4,641 | 46 | % | |||||||||||
| Gain on disposal of property, plant and equipment | (42 | ) | (570 | ) | 528 | (93 | )% | |||||||||
| Impairment loss | - | 28,243 | (28,243 | ) | (100 | )% | ||||||||||
| Foreign exchange loss | 816 | 281 | 535 | 190 | % | |||||||||||
| Operating income | 16,931 | 2,285 | 14,646 | 641 | % | |||||||||||
| Operating income margin | 12.0 | % | 1.8 | % | n/a | 1020 | bps | |||||||||
| Other expense | (9,966 | ) | (105 | ) | (9,861 | ) | 9391 | % | ||||||||
| Income tax expense (recovery) | (3,358 | ) | 7,180 | (10,538 | ) | (147 | )% | |||||||||
| Net income (loss) attributable to stockholders | 10,261 | (5,137 | ) | 15,398 | 300 | % | ||||||||||
| Diluted earnings (loss) per share attributable to stockholders | $ | 0.09 | $ | (0.05 | ) | $ | 0.14 | 280 | % | |||||||
| Effective tax rate | -48.2 | % | 329.4 | % | n/a | -37760 | bps | |||||||||
| GTV | $ | 1,019,322 | $ | 998,859 | $ | 20,463 | 2 | % | ||||||||
| Consolidated Revenue Rate | 13.84 | % | 12.90 | % | n/a | 94 | bps | |||||||||
| Auctions and Marketplaces segment: | ||||||||||||||||
| Revenues | 130,242 | 121,111 | 9,131 | 8 | % | |||||||||||
| Revenue Rate | 12.78 | % | 12.12 | % | n/a | 66 | bps | |||||||||
Consolidated results
Revenues and Consolidated Revenue Rate
Our revenues are comprised of:
| · | commissions earned at our auctions where we act as an agent for consignors of equipment and other assets, as well as commissions on online marketplace sales; and |
| · | fees earned in the process of conducting auctions, including online marketplace listing and inspection fees, fees from value-added services and make-ready activities, as well as fees paid by buyers on online marketplace sales. |
| Ritchie Bros. | 54 |
Revenues increased $12.2 million, or 9%, in the third quarter of 2017 compared to the third quarter of 2016. This increase is primarily due to the performance of live on site auction activities in Europe and Australia, as well as the Merger and increases in revenues from other value-added services, including RBFS. Unaudited pro forma revenues decreased 8% from $153.8 million in the third quarter of 2016 to $141.0 million in the third quarter of 2017.
Consolidated Revenue Rate increased from 12.90% for the third quarter of 2016 to 13.84% for the third quarter of 2017. Approximately 66 basis points of the 94-basis point increase in Consolidated Revenue Rate is due to a higher Auctions and Marketplaces segment Revenue Rate, while the remaining 28 basis point increase in Consolidated Revenue Rate is due to a higher percentage of revenues from our non-transactional services.
The distribution of our revenues across the geographic regions in which we operate was as follows, where the geographic location of revenues corresponds to the location in which the sale occurred, or in the case of online sales, where the company earning the revenues is incorporated:
| Revenue distribution | Canada | Outside of Canada | United States | Europe | Other | |||||||||||||||
| Three months ended September 30, 2017 | 24 | % | 76 | % | 55 | % | 11 | % | 10 | % | ||||||||||
| Three months ended September 30, 2016 | 28 | % | 72 | % | 56 | % | 8 | % | 8 | % | ||||||||||
On a U.S. dollar basis, the proportion of revenue earned in the Europe grew in the third quarter of 2017 compared to the third quarter of 2016 primarily due to our live on site auction activities in that region and the growth of our Mascus brand. The increase in revenues from other geographic regions in the third quarter of 2017 compared to the third quarter of 2016 is primarily due to growth of our live on site auction activities in Australia.
Costs of services
Costs of services are comprised of expenses incurred in direct relation to conducting auctions (“direct expenses”), earning online marketplace revenues, and earning other fee revenues. Direct expenses include direct labour, buildings and facilities charges, and travel, advertising and promotion costs. Typically, agricultural auctions and auctions located in frontier regions are costlier than auctions held at our permanent and regional auction sites as they do not benefit from economies of scale and frequency.
Costs of services incurred to earn online marketplace revenues include inspection costs, facilities costs, and inventory management, referral, sampling, and appraisal fees. Costs of services incurred in earning other fee revenues include direct labour (including commissions on sales), software maintenance fees, and materials. Costs of services exclude depreciation and amortization (“D&A”) expenses.
Costs of services increased $4.8 million, or 33%, in the third quarter of 2017 compared to the third quarter of 2016. This increase is primarily due to costs associated with the growth in our inspection and appraisal activities because of the Merger, as well as an increase in the number of agricultural auctions over the comparative period.
Selling, general and administrative (“SG&A”) expenses
SG&A expenses increased $17.0 million, or 25%, in the third quarter of 2017 compared to the third quarter of 2016. This increase is primarily due to the Merger, including increased headcount, travel costs, and search engine fees associated with our online marketplace channel, as well as merit increases and higher bank fees attributable to our new credit facility.
| Ritchie Bros. | 55 |
Segment Performance
Auctions and Marketplaces reportable segment
| (in U.S. $000's) | Three months ended September 30, | |||||||||||||||
| $ Change | % Change | |||||||||||||||
| 2017 | 2016 | 2017 over 2016 | 2017 over 2016 | |||||||||||||
| Revenues | $ | 130,242 | $ | 121,111 | $ | 9,131 | 8 | % | ||||||||
| Costs of services, excluding D&A | (18,383 | ) | (14,493 | ) | (3,890 | ) | 27 | % | ||||||||
| SG&A expenses | (81,964 | ) | (65,346 | ) | (16,618 | ) | 25 | % | ||||||||
| Impairment loss | - | (28,243 | ) | 28,243 | (100 | )% | ||||||||||
| Segment profit | $ | 29,895 | $ | 13,029 | $ | 16,866 | 129 | % | ||||||||
Used equipment market update
Our Auction and Marketplace businesses are influenced by certain market forces of the used equipment market, particularly with regards to supply, age of equipment and pricing.
Supply volume
During the first nine months of 2017, we experienced used equipment market supply volume pressure, particularly in the United States and Western Canada. High levels of construction activity in the United States resulted in owners holding onto their equipment, rental business utilization reaching peak levels, and various dealers being understock and dealing with long lead times between placing orders with OEMs and production of the new equipment. Our customers are also experiencing longer lead times for new equipment production by OEMs. We believe these supply volume constraints negatively impacted GTV and the volume of underwritten commission contracts over the comparative period.
Age of equipment
With owners and dealers utilizing and/or holding onto their equipment in response to the macro-economic conditions discussed above, we saw a deterioration in the overall age of equipment coming to market relative to recent years. We observed increases in the age of equipment across all asset sectors and geographies. All other things being equal, older equipment sells for lower prices and reduces the commission-based revenue we earn.
Pricing
Overall, we saw improvement in used equipment market pricing during 2017, a continuation of the marginal improvement that we first observed during the second half of 2016. This pricing performance varied among asset sectors and geographies.
Construction assets continued to perform well during 2017, with late model equipment experiencing the most pricing improvement, representative of the tightening equipment supply in North America and increased demand for used equipment. Transportation assets rebounded slightly from 2016, with lower mileage truck tractors experiencing the most lift. Agricultural equipment experienced some pricing weakness in the United States during 2017. Some oil and gas equipment continued to experience the price improvement that we first noted in the second quarter of 2017, indicating that oil and gas equipment pricing may have bottomed in the second half of 2016.
Regionally, North America continued to be our strongest geographical region for equipment values during 2017, responding most favorably to changes in commodity pricing and the overall economic environment. Beginning in the third quarter of 2017, we are also seeing improved pricing in our European operations.
| Ritchie Bros. | 56 |
Gross Transaction Value
We use GTV to measure the performance of our Auctions and Marketplaces segment. The following table presents GTV by channel:
| (in U.S. $000's) | Three months ended September 30, | |||||||||||||||||||||||
| 2017 | 2016 | $ Change | % Change | |||||||||||||||||||||
| Total GTV | % of total | Total GTV | % of total | 2017 over 2016 | 2017 over 2016 | |||||||||||||||||||
| Live on site auctions | $ | 834,388 | 82 | % | $ | 956,723 | 96 | % | $ | (122,335 | ) | (13 | )% | |||||||||||
| Online auctions and marketplaces | 184,934 | 18 | % | 42,136 | 4 | % | 142,798 | 339 | % | |||||||||||||||
| GTV | $ | 1,019,322 | 100 | % | $ | 998,859 | 100 | % | $ | 20,463 | 2 | % | ||||||||||||
GTV increased $20.5 million, or 2%, in the third quarter of 2017 compared to the third quarter of 2016. The increase in GTV is primarily due to the Merger and the resulting increase in online marketplace GTV, as well as a positive impact of foreign exchange rates over the comparative period. Approximately 82% of third quarter 2017 GTV was generated from live on site auctions and 18% from online marketplaces, compared to 96% and 4% respectively for the third quarter of 2016.
Our live on site auction GTV declined primarily due to a decrease in the number of industrial and agricultural auction lots in the third quarter of 2017 compared to the third quarter of 2016. The total number of lots decreased 7% to 92,000 in the third quarter of 2017 from 98,500 in the third quarter of 2016. We believe the decrease in number of lots was primarily driven by constrained supply on used equipment, as well as some lower sales productivity as we complete the integration of our sales teams post-Merger. The decrease in lots was partially offset by a 9% increase in industrial and agricultural auction GTV per lot from $9,700 per lot in the third quarter of 2016 to $10,600 per lot in the third quarter of 2017.
During the third quarter of 2017, we continued to actively pursue the use of underwritten commission contracts from a strategic perspective, and when the opportunity arose, only entered such contracts when the risk/reward profile of the terms were agreeable. The volume of underwritten commission contracts decreased to 18% of our GTV in the third quarter of 2017 from 27% in the third quarter of 2016, primarily due to the pressure on used equipment market supply volume. The tight supply of used equipment, coupled with improved pricing, resulted in less seller interest in underwritten commission contracts. Straight commission contracts continue to account for the majority of our GTV.
Revenue and segment Revenue Rate
As this segment revenue is generated from transactional asset disposition services, we believe that these revenues are best understood by considering their relationship to GTV. Therefore, in the third quarter of 2017 we introduced the metric Auctions and Maketplaces segment Revenue Rate, which is calculated as segment revenue divided by GTV.
Segment revenues by geographical region and segment Revenue Rate are presented below:
| (in U.S. $000's) | Three months ended September 30, | |||||||||||||||
| $ Change | % Change | |||||||||||||||
| 2017 | 2016 | 2017 over 2016 | 2017 over 2016 | |||||||||||||
| United States | $ | 74,097 | $ | 69,938 | $ | 4,159 | 6 | % | ||||||||
| Canada | 29,367 | 32,320 | (2,953 | ) | (9 | )% | ||||||||||
| International | 26,778 | 18,853 | 7,925 | 42 | % | |||||||||||
| Segment revenues | $ | 130,242 | $ | 121,111 | $ | 9,131 | 8 | % | ||||||||
| GTV | $ | 1,019,322 | $ | 998,859 | $ | 20,463 | 2 | % | ||||||||
| Segment Revenue Rate | 12.78 | % | 12.12 | % | n/a | 66 | bps | |||||||||
| Ritchie Bros. | 57 |
Changes in segment revenues in the third quarter of 2017 compared to the third quarter of 2016 were primarily due to:
| · | United States – 6% increase primarily due to the Merger, partially offset by the decrease in GTV in that region, which was primarily driven by constrained supply on used equipment, as well as some lower sales productivity as we complete the integration of our sales teams post-Merger. |
| · | Canada – 9% decrease primarily due to decreases in GTV in that region, which were primarily driven by continued pressure on used equipment market supply volume, and most significantly in Western Canada where we continued to see fewer disposals of oil and gas assets as a result of commodity price improvements. |
| · | International – 42% increase primarily due to live on site auction activities in Europe and Australia, as well as the Merger. |
Segment Revenue Rate grew from 12.12% in the third quarter of 2016 to 12.78% in the third quarter of 2017, primarily due to the Merger, which resulted in higher buyer transaction and listing fees from our online marketplace channel. Our historical segment Revenue Rates are presented in the graph below:
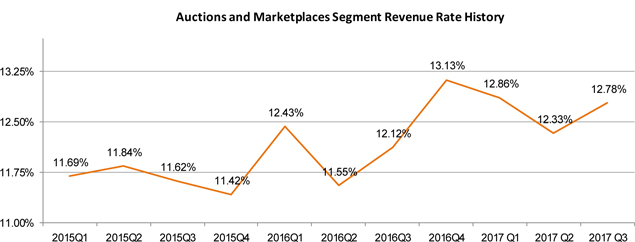
Costs of services
Segment costs of services by nature and as a percentage of GTV are presented below:
| (in U.S. $000's) | Three months ended September 30, | |||||||||||||||
| $ Change | % Change | |||||||||||||||
| 2017 | 2016 | 2017
over 2016 | 2017
over 2016 | |||||||||||||
| Employee compensation | $ | 9,296 | $ | 6,517 | $ | 2,779 | 43 | % | ||||||||
| Buildings, facilities and technology | 1,669 | 1,511 | 158 | 10 | % | |||||||||||
| Travel, advertising and promotion | 5,323 | 4,991 | 332 | 7 | % | |||||||||||
| Other costs of services | 2,095 | 1,474 | 621 | 42 | % | |||||||||||
| Segment cost of services | $ | 18,383 | $ | 14,493 | $ | 3,890 | 27 | % | ||||||||
| GTV | $ | 1,019,322 | $ | 998,859 | $ | 20,463 | 2 | % | ||||||||
| Segment costs of services as a percentage of GTV | 1.80 | % | 1.45 | % | n/a | 35 | bps | |||||||||
Segment costs of services increased 27% in the third quarter of 2017 compared to the third quarter of 2016 primarily due to the Merger, which drove the increase in our online marketplace GTV and revenues.
| Ritchie Bros. | 58 |
The increase in online marketplace revenue resulted in an increase in the costs incurred to earn those revenues, which were primarily related to inspection activities. Other costs of services include storage and shipping costs, primarily associated with costs to move equipment off government facilities as part of our GovPlanet channel activities.
The increase in segment costs of services was also due to an increase in the number of live on site agricultural auctions held during the third quarter of 2017 compared to the third quarter of 2016. We held 28 unreserved agricultural auctions in the third quarter of 2017, compared to 20 in the third quarter of 2016.
SG&A expenses
Segment SG&A expenses by nature are presented below:
| (in U.S. $000's) | Three months ended September 30, | |||||||||||||||
| $ Change | % Change | |||||||||||||||
| 2017 | 2016 | 2017 over 2016 | 2017 over 2016 | |||||||||||||
| Employee compensation | $ | 53,218 | $ | 40,272 | $ | 12,946 | 32 | % | ||||||||
| Buildings, facilities and technology | 13,070 | 12,102 | 968 | 8 | % | |||||||||||
| Travel, advertising and promotion | 8,106 | 6,039 | 2,067 | 34 | % | |||||||||||
| Professional fees | 3,171 | 3,484 | (313 | ) | (9 | )% | ||||||||||
| Other SG&A expenses | 4,399 | 3,449 | 950 | 28 | % | |||||||||||
| Segment SG&A expenses | $ | 81,964 | $ | 65,346 | $ | 16,618 | 25 | % | ||||||||
Our segment SG&A expenses increased $16.6 million, or 25%, in the third quarter of 2017 compared to the third quarter of 2016. The increase is primarily due to the Merger, including increased headcount, travel costs, and search engine fees associated with our online marketplace channel, as well as merit increases and higher bank fees attributable to our new credit facility.
Impairment loss
There was no impairment in the third quarter of 2017. Comparatively, we recognized an impairment loss of $28.2 million on our EquipmentOne goodwill and customer relationships in the third quarter of 2016.
Other services
Our operating segments, RBFS and Mascus, as well as our other non-transactional services, AAS, equipment refurbishing, and Ritchie Bros. Logistical Services (“RBLS”), are reported in the ‘other’ category for segmented information disclosure purposes.
| (in U.S. $000's) | Three months ended September 30, | |||||||||||||||
| $ Change | % Change | |||||||||||||||
| 2017 | 2016 | 2017 over 2016 | 2017 over 2016 | |||||||||||||
| Revenues | $ | 10,805 | $ | 7,765 | $ | 3,040 | 39 | % | ||||||||
| Costs of services, excluding D&A | (1,200 | ) | (257 | ) | (943 | ) | 367 | % | ||||||||
| SG&A expenses | (3,371 | ) | (2,947 | ) | (424 | ) | 14 | % | ||||||||
| Other category profit | $ | 6,234 | $ | 4,561 | $ | 1,673 | 37 | % | ||||||||
Revenue from other services grew $3.0 million, or 39%, in the third quarter of 2017 compared to the third quarter of 2016, primarily due to the Merger, which added $1.4 million of AAS revenue in the third quarter of 2017, RBFS, and a 19% increase in Mascus segment revenue from $2.0 million to $2.4 million over the comparative period.
| Ritchie Bros. | 59 |
RBFS operating segment
Funded volume, which represents the amount of lending brokered by RBFS, increased 15% from $56.3 million in the third quarter of 2016 to $65.0 million in the third quarter of 2017. RBFS segment revenues were $3.4 million in the third quarter of 2017, a 20% increase compared to the $2.9 million in the third quarter of 2016. RBFS segment profit increased 9% over the same comparative period to $1.7 million from $1.5 million.
Consolidated results (continued)
Acquisition-related costs
Acquisition-related costs consist of operating expenses directly incurred as part of a business combination, due diligence and integration planning – including those related to the Merger – and continuing employment costs that are recognized separately from our business combinations. Business combination, due diligence, and integration operating expenses include advisory, legal, accounting, valuation, and other professional or consulting fees, and travel and securities filing fees.
Third quarter 2017 and 2016 acquisition-related costs were $3.6 million and $5.4 million, respectively, and consisted primarily of costs associated with the Merger of $2.7 million and $4.5 million, respectively.
Foreign exchange loss
We recognized $0.8 million of transactional foreign exchange losses in the third quarter of 2017, compared to $0.3 million in the third quarter of 2016. Foreign exchange losses and gains are primarily the result of settlement of non-functional currency-denominated monetary assets and liabilities.
Operating income
Operating income increased $14.6 million, or 641%, to $16.9 million in the third quarter of 2017 compared to $2.3 million the third quarter of 2016. This improvement was primarily due to the third quarter 2016 impairment loss and higher third quarter 2017 revenues, partially offset by higher third quarter 2017 SG&A expenses, costs of services, and D&A expenses. Adjusted operating income2 (non-GAAP measure) decreased 45% to $16.9 million for the third quarter of 2017 compared to $30.5 million for the third quarter of 2016.
Foreign exchange rates did not have a significant impact on operating income in the third quarter of 2017.
Primarily for the same reasons noted above, operating income margin, which is our operating income divided by revenues, increased 1020 bps to 12.0% in the third quarter of 2017 compared to 1.8% in the third quarter of 2016. Adjusted operating income margin3 (non-GAAP measure) decreased 1170 bps to 12.0% in the third quarter of 2017 from 23.7% in the third quarter of 2016.
| 2 | Adjusted operating income is a non-GAAP measure. We use income statement and balance sheet performance scorecards to align our operations with our strategic priorities. We concentrate on a limited number of metrics to ensure focus and to facilitate quarterly performance discussions. Our income statement scorecard includes the performance metric, adjusted operating income. We believe that comparing adjusted operating income for different financial periods provides useful information about the growth or decline of operating income for the relevant financial period. We calculate adjusted operating income by eliminating from operating income the pre-tax effects of significant non-recurring items that we do not consider to be part of our normal operating results, such as acquisition-related costs, management reorganization costs, severance, retention, gains/losses on sale of certain property, plant and equipment, impairment losses, and certain other items, which we refer to as ‘adjusting items’. Adjusted operating income is reconciled to the most directly comparable GAAP measures in our consolidated financial statements under “Non-GAAP Measures” below. |
| 3 | Our income statement scorecard includes the performance metric, adjusted operating income margin, which is a non-GAAP measure. We believe that comparing adjusted operating income margin for different financial periods provides useful information about the growth or decline of our operating income for the relevant financial period. We calculate adjusted operating income margin by dividing adjusted operating income (non-GAAP measure) by revenues. Adjusted operating income margin is reconciled to the most directly comparable GAAP measures in our consolidated financial statements under “Non-GAAP Measures” below. |
| Ritchie Bros. | 60 |
Other income (expense)
Other income (expense) is comprised of the following:
| (in U.S. $000's) | Three months ended September 30, | |||||||||||||||
| $ Change | % Change | |||||||||||||||
| 2017 | 2016 | 2017 over 2016 | 2017 over 2016 | |||||||||||||
| Interest income | $ | 517 | $ | 369 | $ | 148 | 40 | % | ||||||||
| Interest expense | (10,558 | ) | (934 | ) | (9,624 | ) | 1030 | % | ||||||||
| Equity income (loss) | (109 | ) | 213 | (322 | ) | (151 | )% | |||||||||
| Other, net | 184 | 247 | (63 | ) | (26 | )% | ||||||||||
| Other income (expense) | $ | (9,966 | ) | $ | (105 | ) | $ | (9,861 | ) | 9391 | % | |||||
We incurred additional indebtedness to finance the Merger. As of September 30, 2017, our total debt was $826.5 million, compared to $140.6 million as of September 30, 2016. The increase in interest expense is primarily due to our higher debt balances, as well as minimal increases in short-term interest rates.
Income tax expense and effective tax rate
At the end of each interim period, we make our best estimate of the effective tax rate expected to be applicable for the full fiscal year. The estimate reflects, among other items, our best estimate of operating results, including the jurisdiction in which income is earned. It does not include the estimated impact of foreign exchange rates or unusual and/or infrequent items, which may cause significant variations in the customary relationship between income tax expense and income before income taxes.
During the third quarter of 2017, we recorded $3.4 million of income tax recovery, compared to a $7.2 million income tax expense in the third quarter of 2016. Our effective tax rate was -48.2% in the third quarter of 2017 compared to 329.4% in the third quarter of 2016. The change from third quarter 2016 income tax expense to third quarter 2017 income tax recovery was primarily due to the lower estimated annual effective tax rate for the full 2017 year, which was caused by a greater proportion of earnings taxed in jurisdictions with lower tax rates, as well as the impact of revised estimates of the tax deductibility of stock option compensation expenses and acquisition-related costs. Also, the comparative period reflected the impact of a non-deductible goodwill impairment loss recorded in the third quarter of 2016.
Net income
Net income attributable to stockholders increased $15.4 million in the third quarter of 2017 compared to the third quarter of 2016. This improvement is primarily due to the increase in operating income and decrease in income tax expense, partially offset by the increase in interest expense over the same comparative period. Adjusted net income attributable to stockholders4 (non-GAAP measure) decreased 52% to $10.3 million in the third quarter of 2017 compared to $21.3 million in the third quarter of 2016.
| 4 | Adjusted net income attributable to stockholders is a non-GAAP financial measure. We believe that comparing adjusted net income attributable to stockholders for different financial periods provides useful information about the growth or decline of our net income attributable to stockholders for the relevant financial period, and eliminates the financial impact of adjusting items we do not consider to be part of our normal operating results. Adjusted net income attributable to stockholders represents net income attributable to stockholders excluding the effects of adjusting items and is reconciled to the most directly comparable GAAP measures in our consolidated financial statements under “Non-GAAP Measures” below. |
| Ritchie Bros. | 61 |
Primarily for the same reasons noted above, net income increased $15.3 million, or 306%, in the third quarter of 2017 compared to the third quarter of 2016. Adjusted Earnings Before Interest, Taxes, Depreciation and Amortization (“EBITDA”)5 (non-GAAP measure) decreased 23% to $31.8 million in the third quarter of 2017 compared to $41.2 million in the third quarter of 2016.
Primarily for the same reasons noted above, net income margin, which is our net income divided by our revenues, increased 1120 bps to 7.3% in the third quarter of 2017 from -3.9% in the third quarter of 2016. Adjusted EBITDA margin6 (non-GAAP measure) decreased 940 bps to 22.6% in the third quarter of 2017 from 32.0% in the third quarter of 2016.
Diluted EPS
Diluted EPS attributable to stockholders increased to $0.09 in the third quarter of 2017 from a diluted loss per share attributable to stockholders of $0.05 in the third quarter of 2016. This increase is primarily due to the increase in net income attributable to stockholders, partially offset by an increase in the weighted average number of dilutive shares outstanding over the same comparative period. Diluted adjusted EPS attributable to stockholders7 (non-GAAP measure) decreased 55% to $0.09 in the third quarter of 2017 from $0.20 in the third quarter of 2016.
| 5 | Adjusted EBITDA is a non-GAAP financial measure that we believe provides useful information about the growth or decline of our net income when compared between different financial periods. Adjusted EBITDA was also an element of the performance criteria for certain performance share units that we granted our employees and officers in 2013 and 2014. Adjusted EBITDA is calculated by adding back depreciation and amortization expenses, interest expense, and current income tax expense, and subtracting interest income and deferred income tax recovery from net income excluding the pre-tax effects of adjusting items. Adjusted EBITDA is reconciled to the most directly comparable GAAP measures in our consolidated financial statements under “Non-GAAP Measures” below. |
| 6 | Adjusted EBITDA margin is a non-GAAP financial measure that we believe provides useful information about the growth or decline of our net income when compared between different financial periods. Adjusted EBITDA margin presents adjusted EBITDA (non-GAAP measure) as a multiple of revenues. Adjusted EBITDA margin is reconciled to the most directly comparable GAAP measures in our consolidated financial statements under “Non-GAAP Measures” below. |
| 7 | Diluted adjusted EPS attributable to stockholders is a non-GAAP financial measure. We believe that comparing diluted adjusted EPS attributable to stockholders for different financial periods provides useful information about the growth or decline of our diluted EPS attributable to stockholders for the relevant financial period, and eliminates the financial impact of adjusting items we do not consider to be part of our normal operating results. Diluted adjusted EPS attributable to stockholders is calculated by dividing adjusted net income attributable to stockholders (non-GAAP measure) (described in footnote 4), net of the effect of dilutive securities, by the weighted average number of dilutive shares outstanding. Diluted adjusted EPS attributable to stockholders is reconciled to the most directly comparable GAAP measures in our consolidated financial statements under “Non-GAAP Measures” below. |
| Ritchie Bros. | 62 |
Year-to-Date Performance
| Financial overview | Nine months ended September 30, | |||||||||||||||
| $ Change | Change | |||||||||||||||
| (in U.S. $000's, except EPS) | 2017 | 2016 | 2017
over 2016 | 2017
over 2016 | ||||||||||||
| Revenues | $ | 431,732 | $ | 419,626 | $ | 12,106 | 3 | % | ||||||||
| Costs of services, excluding depreciation and amortization | 53,987 | 49,821 | 4,166 | 8 | % | |||||||||||
| Selling, general and administrative expenses | 230,287 | 209,395 | 20,892 | 10 | % | |||||||||||
| Acquisition-related costs | 35,162 | 7,198 | 27,964 | 388 | % | |||||||||||
| Depreciation and amortization expenses | 37,047 | 30,560 | 6,487 | 21 | % | |||||||||||
| Gain on disposal of property, plant and equipment | (1,071 | ) | (1,017 | ) | (54 | ) | 5 | % | ||||||||
| Impairment loss | 8,911 | 28,243 | (19,332 | ) | (68 | )% | ||||||||||
| Foreign exchange loss (gain) | (7 | ) | 332 | (339 | ) | (102 | )% | |||||||||
| Operating income | 67,416 | 95,094 | (27,678 | ) | (29 | )% | ||||||||||
| Operating income margin | 15.6 | % | 22.7 | % | n/a | -710 | bps | |||||||||
| Other income (expense) | (20,965 | ) | 420 | (21,385 | ) | (5092 | )% | |||||||||
| Income tax expense | 7,982 | 29,929 | (21,947 | ) | (73 | )% | ||||||||||
| Net income attributable to stockholders | 38,273 | 63,979 | (25,706 | ) | (40 | )% | ||||||||||
| Diluted EPS attributable to stockholders | $ | 0.35 | $ | 0.60 | $ | (0.25 | ) | (42 | )% | |||||||
| Effective tax rate | 17.2 | % | 31.3 | % | n/a | -1410 | bps | |||||||||
| GTV | $ | 3,173,050 | $ | 3,294,463 | $ | (121,413 | ) | (4 | )% | |||||||
| Consolidated Revenue Rate | 13.61 | % | 12.74 | % | n/a | 87 | bps | |||||||||
| Auctions and Marketplaces segment: | ||||||||||||||||
| Revenues | 400,565 | 395,228 | 5,337 | 1 | % | |||||||||||
| Revenue Rate | 12.62 | % | 12.00 | % | n/a | 62 | bps | |||||||||
Consolidated results
Revenues and Consolidated Revenue Rate
Revenues increased $12.1 million, or 3%, in the nine months ended September 30, 2017 compared to the nine months ended September 30, 2016. This increase is primarily due to the Merger, which closed on May 31, 2017, and increases in revenues from other value-added services, including RBFS, partially offset by the impact of lower GTV. Unaudited pro forma revenues decreased 4% from $503.7 million in the first nine months of 2016 to $481.1 million in the first nine months of 2017.
Consolidated Revenue Rate increased from 12.74% for the nine months ended September 30, 2016 to 13.61% for the nine months ended September 30, 2017. Approximately 62 bps of the 87-basis point increase in Consolidated Revenue Rate is due to a higher Auctions and Marketplaces segment Revenue Rate, while the remaining 25-basis point increase in Consolidated Revenue Rate is due a higher percentage of revenues from our non-transactional services.
| Ritchie Bros. | 63 |
The distribution of our revenues across the geographic regions in which we operate was as follows, where the geographic location of revenues corresponds to the location in which the sale occurred, or in the case of online sales, where the company earning the revenues is incorporated:
| Revenue distribution | Canada | Outside of Canada | United States | Europe | Other | |||||||||||||||
| Nine months ended September 30, 2017 | 28 | % | 72 | % | 53 | % | 11 | % | 8 | % | ||||||||||
| Nine months ended September 30, 2016 | 31 | % | 69 | % | 51 | % | 9 | % | 9 | % | ||||||||||
On a U.S. dollar basis, the proportion of revenue earned in the United States and Europe grew for the nine months ended September 30, 2017 compared to the nine months ended September 30, 2016. Growth in the United States over the comparative period is primarily due to the Merger. Growth in Europe is primarily due to our live on site auction activities in that region and the growth of our Mascus brand. The increase in revenues from other geographic regions in the first nine months of 2017 compared to the first nine months of 2016 is primarily due to growth of our live on site auction activities in the United Arab Emirates.
Costs of services
Costs of services increased $4.2 million, or 8%, for the nine months ended September 30, 2017 compared to the nine months ended September 30, 2016. This increase is primarily due to costs associated with the growth in our inspection and appraisal activities because of the Merger.
SG&A expenses
SG&A expenses increased $20.9 million, or 10%, for the nine months ended September 30, 2017 compared to the nine months ended September 30, 2016. This increase is primarily due to post-Merger increased headcount, travel costs, and search engine fees associated with our online marketplace channel, as well as merit increases and higher bank fees attributable to our new credit facility.
Segment Performance
Auctions and Marketplaces reportable segment
| (in U.S. $000's) | Nine months ended September 30, | |||||||||||||||
| $ Change | % Change | |||||||||||||||
| 2017 | 2016 | 2017 over 2016 | 2017 over 2016 | |||||||||||||
| Revenues | $ | 400,565 | $ | 395,228 | $ | 5,337 | 1 | % | ||||||||
| Costs of services, excluding D&A | (51,948 | ) | (49,213 | ) | (2,735 | ) | 6 | % | ||||||||
| SG&A expenses | (220,555 | ) | (200,967 | ) | (19,588 | ) | 10 | % | ||||||||
| Impairment loss | (8,911 | ) | (28,243 | ) | 19,332 | (68 | )% | |||||||||
| Segment profit | $ | 119,151 | $ | 116,805 | $ | 2,346 | 2 | % | ||||||||
| Ritchie Bros. | 64 |
Gross Transaction Value
We use GTV to measure the performance of our Auctions and Marketplaces segment. The following table presents GTV by channel:
| (in U.S. $000's) | Nine months ended September 30, | |||||||||||||||||||||||
| 2017 | 2016 | $ Change | % Change | |||||||||||||||||||||
| Total GTV | % of total | Total GTV | % of total | 2017 over 2016 | 2017 over 2016 | |||||||||||||||||||
| Live on site auctions | $ | 2,817,387 | 89 | % | $ | 3,187,014 | 97 | % | $ | (369,627 | ) | (12 | )% | |||||||||||
| Online auctions and marketplaces | 355,663 | 11 | % | 107,449 | 3 | % | 248,214 | 231 | % | |||||||||||||||
| GTV | $ | 3,173,050 | 100 | % | $ | 3,294,463 | 100 | % | $ | (121,413 | ) | (4 | )% | |||||||||||
GTV decreased $121.4 million, or 4%, in the nine months ended September 30, 2017 compared to the nine months ended September 30, 2016. The decrease in GTV is primarily due to the performance of our live on site auction channel in the first nine months of 2017 compared to the first nine months of 2016, partially offset by the Merger and the resulting increase in our online marketplace sales, as well as the positive impact of foreign exchange rates over the comparative period.
The live on site auction channel GTV decrease is primarily due to a decrease in the number of industrial and agricultural auction lots and changes in our auction calendar in the nine months ended September 30, 2017 compared to the same period in 2016. The total number of lots decreased 5% to 306,900 in the first nine months of 2017 from 321,400 in the first nine months of 2016. We believe the decrease in number of lots was primarily driven by constrained supply of used equipment, as well as some lower sales productivity as we complete the integration of our sales teams post-Merger. Industrial and agricultural auction GTV per lot remained consistent at $9,900 in the first nine months of 2017 and 2016.
With respect to auction calendar changes, we held the largest-ever auction in Grande Prairie, Canada, in March 2016, which generated more than $46.0 million (62.0 million Canadian dollars) of GTV, with no similar auction on the calendar in the first nine months of 2017.
During 2017, we continued to actively pursue the use of underwritten commission contracts from a strategic perspective, and when the opportunity arose, only entered such contracts when the risk/reward profile of the terms were agreeable. The volume of underwritten commission contracts decreased to 16% of our GTV in the first nine months of 2017 from 25% in the first nine months of 2016, primarily due to the pressure on used equipment market supply volume. The tight supply of used equipment, coupled with improved pricing, resulted in less seller interest in underwritten commission contracts. Straight commission contracts continue to account for the majority of our GTV.
Revenue and segment Revenue Rate
Segment revenues by geographical region and segment Revenue Rate are presented below:
| (in U.S. $000's) | Nine months ended September 30, | |||||||||||||||
| $ Change | % Change | |||||||||||||||
| 2017 | 2016 | 2017
over 2016 | 2017
over 2016 | |||||||||||||
| United States | $ | 220,375 | $ | 208,677 | $ | 11,698 | 6 | % | ||||||||
| Canada | 107,756 | 120,351 | (12,595 | ) | (10 | )% | ||||||||||
| International | 72,434 | 66,200 | 6,234 | 9 | % | |||||||||||
| Segment revenues | $ | 400,565 | $ | 395,228 | $ | 5,337 | 1 | % | ||||||||
| GTV | $ | 3,173,050 | $ | 3,294,463 | $ | (121,413 | ) | (4 | )% | |||||||
| Segment Revenue Rate | 12.62 | % | 12.00 | % | n/a | 62 | bps | |||||||||
| Ritchie Bros. | 65 |
Changes in segment revenues in the first nine months of 2017 compared to the first nine months of 2016 were primarily due to:
| · | United States – 6% increase primarily due to the Merger, partially offset by the effect of constrained supply on used equipment in that region, as well as some lower sales productivity as we complete the integration of our sales teams post-Merger. |
| · | Canada – 10% decrease primarily driven by the aforementioned auction calendar changes, as well as continued pressure on used equipment market supply volume, and most significantly in Western Canada where we continued to see fewer disposals of oil and gas assets as a result of commodity price improvements. |
| · | International – 9% increase primarily due to live on site auction activities in Europe and the United Arab Emirates, as well as the Merger and the growth of our Mascus brand. |
Segment Revenue Rate grew from 12.00% in the first nine months of 2016 to 12.62% in the first nine months of 2017, primarily due to the Merger, which resulted in higher buyer transaction and listing fees from our online marketplace channel and improved performance on underwritten transactions. The impact of the improved Revenue Rate was partially offset by the impact of lower GTV.
Costs of services
Segment costs of services by nature and as a percentage of GTV are presented below:
| (in U.S. $000's) | Nine months ended September 30, | |||||||||||||||
| $ Change | % Change | |||||||||||||||
| 2017 | 2016 | 2017 over 2016 | 2017 over 2016 | |||||||||||||
| Employee compensation | $ | 23,204 | $ | 21,568 | $ | 1,636 | 8 | % | ||||||||
| Buildings, facilities and technology | 5,225 | 5,571 | (346 | ) | (6 | )% | ||||||||||
| Travel, advertising and promotion | 17,349 | 18,287 | (938 | ) | (5 | )% | ||||||||||
| Other costs of services | 6,170 | 3,787 | 2,383 | 63 | % | |||||||||||
| Segment cost of services | $ | 51,948 | $ | 49,213 | $ | 2,735 | 6 | % | ||||||||
| GTV | $ | 3,173,050 | $ | 3,294,463 | $ | (121,413 | ) | (4 | )% | |||||||
| Segment costs of services as a percentage of GTV | 1.64 | % | 1.49 | % | n/a | 15 | bps | |||||||||
Segment costs of services increased 6% in the first nine months of 2017 compared to the first nine months of 2016 primarily due to the Merger, which drove the increase in our online marketplace GTV and revenues. The increase in online marketplace revenue resulted in an increase in the costs incurred to earn those revenues, which were primarily related to inspection activities. Other costs of services include storage and shipping costs, primarily associated with costs to move equipment off government facilities as part of our GovPlanet channel activities.
The increase in segment costs of services was also due to an increase in the number of live on site agricultural auctions held during the first nine months of 2017 compared to the first nine months of 2016. We held 135 unreserved agricultural auctions in the first nine months of 2017, compared to 105 in the first nine months of 2016.
| Ritchie Bros. | 66 |
SG&A expenses
Segment SG&A expenses by nature are presented below:
| (in U.S. $000's) | Nine months ended September 30, | |||||||||||||||
| $ Change | % Change | |||||||||||||||
| 2017 | 2016 | 2017 over 2016 | 2017 over 2016 | |||||||||||||
| Employee compensation | $ | 140,654 | $ | 127,508 | $ | 13,146 | 10 | % | ||||||||
| Buildings, facilities and technology | 37,879 | 35,608 | 2,271 | 6 | % | |||||||||||
| Travel, advertising and promotion | 20,227 | 17,813 | 2,414 | 14 | % | |||||||||||
| Professional fees | 9,181 | 9,072 | 109 | 1 | % | |||||||||||
| Other SG&A expenses | 12,614 | 10,966 | 1,648 | 15 | % | |||||||||||
| Segment SG&A expenses | $ | 220,555 | $ | 200,967 | $ | 19,588 | 10 | % | ||||||||
Our segment SG&A expenses increased $19.6 million, or 10%, in the first nine months of 2017 compared to the first nine months of 2016. The increase is primarily due to the Merger, including increased headcount, travel costs, and search engine fees associated with our online marketplace channel, as well as merit increases and higher bank fees attributable to our new credit facility.
Impairment loss
During the first nine months of 2017, we recognized an impairment loss of $8.9 million on certain technology assets. Comparatively, we recognized an impairment loss of $28.2 million on our EquipmentOne goodwill and customer relationships in the first nine months of 2016.
Other sevices
Our operating segments RBFS and Mascus, as well as our other non-transactional services, AAS, equipment refurbishing, and RBLS, are reported in the ‘other’ category for segmented information disclosure purposes.
| (in U.S. $000's) | Nine months ended September 30, | |||||||||||||||
| $ Change | % Change | |||||||||||||||
| 2017 | 2016 | 2017 over 2016 | 2017 over 2016 | |||||||||||||
| Revenues | $ | 31,167 | $ | 24,398 | $ | 6,769 | 28 | % | ||||||||
| Costs of services, excluding D&A | (2,039 | ) | (608 | ) | (1,431 | ) | 235 | % | ||||||||
| SG&A expenses | (9,732 | ) | (8,428 | ) | (1,304 | ) | 15 | % | ||||||||
| Other category profit | $ | 19,396 | $ | 15,362 | $ | 4,034 | 26 | % | ||||||||
Revenue from other services grew $4.0 million, or 26%, in the first nine months of 2017 compared to the first nine months of 2016, primarily due to RBFS, the Merger, which added $1.9 million of AAS revenue in the first nine months of 2017, and a 29% increase in Mascus segment revenue from $5.3 million to $6.9 million over the comparative period.
RBFS operating segment
Funded volume, which represents the amount of lending brokered by RBFS, increased 13% from $191.6 million in the first nine months of 2016 to $216.2 million in the first nine months of 2017. RBFS segment revenues were $11.5 million in the first nine months of 2017, a 29% increase compared to the $8.9 million in the first nine months of 2016. RBFS segment operating profit increased 31% over the same comparative period to $6.4 million from $4.9 million.
| Ritchie Bros. | 67 |
Consolidated results (continued)
Acquisition-related costs
Acquisition-related costs for the first nine months of 2017 totalled $35.2 million and consisted primarily of $32.6 million associated with the Merger. IronPlanet acquisition-related costs for the first nine months of 2017 included $9.1 million of non-recurring acquisition and finance structure advisory fees, $8.8 million of legal fees related to the regulatory approval process and closing of the transaction, $4.8 million of stock option compensation expenses resulting from accelerated vesting of options assumed as part of the Merger, $1.4 million of severance and retention costs that followed the Merger in the resulting corporate reorganization, and various integration costs.
This compares to $7.2 million of acquisition related expenses for the first nine months of 2016, which includes costs associated with the IronPlanet, Mascus, Xcira, and Petrowsky acquisitions.
Operating income
Operating income decreased $27.7 million, or 29%, to $67.4 million in the first nine months of 2017 compared to the first nine months of 2016. This decrease was primarily due to the higher acquisition-related costs, SG&A expenses, D&A expenses, and costs of services. These increases were partially offset by a lower impairment loss and higher revenues than the comparable period. Adjusted operating income (non-GAAP measure) decreased $31.7 million, or 26%, to $91.6 million in the first nine months of 2017 compared to $123.3 million in the first nine months of 2016.
Foreign exchange rates had a minimal impact on operating income in the first nine months of 2017.
Primarily for the same reasons noted above, operating income margin, which is our operating income divided by revenues, decreased 710 bps to 15.6% in the first nine months of 2017 compared to 22.7% in the first nine months of 2016. Adjusted operating income margin (non-GAAP measure) decreased 820 bps to 21.2% in the first nine months of 2017 from 29.4% in the first nine months of 2016.
Other income (expense)
Other income (expense) is comprised of the following:
| (in U.S. $000's) | Nine months ended September 30, | |||||||||||||||
| $ Change | % Change | |||||||||||||||
| 2017 | 2016 | 2017 over 2016 | 2017 over 2016 | |||||||||||||
| Interest income | $ | 2,459 | $ | 1,354 | $ | 1,105 | 82 | % | ||||||||
| Interest expense | (27,311 | ) | (3,357 | ) | (23,954 | ) | 714 | % | ||||||||
| Equity income (loss) | (158 | ) | 1,209 | (1,367 | ) | (113 | )% | |||||||||
| Other, net | 4,045 | 1,214 | 2,831 | 233 | % | |||||||||||
| Other income (expense) | $ | (20,965 | ) | $ | 420 | $ | (21,385 | ) | (5092 | )% | ||||||
We incurred additional indebtedness to finance the Merger. As of September 30, 2017, our debt was $826.5 million, compared to $140.6 million as of September 31, 2016. The increase in interest expense is primarily due to our higher debt balances, as well as minimal increases in short-term interest rates.
$2.5 million of the increase in ‘other, net’ in the nine months ended September 30, 2017 compared to the nine months ended September 30, 2016 is due to changes in the fair value of contingent consideration associated with our Petrowsky, Kramer, and Mascus, as well as our acquisition of the non-controlling interests in RBFS.
| Ritchie Bros. | 68 |
Income tax expense and effective tax rate
We recorded an income tax expense of $8.0 million in the first nine months of 2017 compared to $29.9 million in the first nine months of 2016. Our effective tax rate was 17.2% in the first nine months of 2017 compared to 31.3% in the first nine months of 2016. The decrease in income tax expense over the comparative period was primarily the result of the lower estimated annual effective tax rate for the full 2017 year, which was caused by a greater proportion of earnings taxed in jurisdictions with lower tax rates, as well as the impact of revised estimates of the tax deductibility of stock option compensation expenses and acquisition-related costs. This decrease was partially offset by $2.3 million of expense related to an increase in uncertain tax positions. We increased our uncertain tax position in the first quarter of 2017 due to an unfavourable outcome of a tax dispute in one of our European operating jurisdictions. Income tax expense for the first nine months of 2016 also reflected the impact of a non-deductible goodwill impairment loss recorded in the third quarter of 2016.
Net income
Net income attributable to stockholders decreased $25.7 million, or 40%, in the first nine months of 2017 compared to the first nine months of 2016. This decrease was primarily due to the decrease in operating income and increase in interest expense, partially offset by a lower income tax expense over the same comparative period. Adjusted net income attributable to stockholders (non-GAAP measure) decreased 34% to $59.4 million in the first nine months of 2017 from $90.4 million in the first nine months of 2016.
For these same reasons, net income decreased $27.1 million, or 41%, in the first nine months of 2017 compared to the first nine months of 2016. Adjusted EBITDA (non-GAAP measure) decreased 15% to $132.5 million, in the first nine months of 2017 from $156.3 million in the first nine months of 2016.
Primarily for the same reasons noted above, net income margin decreased 670 bps to 8.9% in the first nine months of 2017 from 15.6% in the first nine months of 2016. Adjusted EBITDA margin (non-GAAP measure) decreased 660 bps to 30.7% in the first nine months of 2017 from 37.3% in the first nine months of 2016.
Debt at September 30, 2017 represented 12.4 times net income for the 12 months ended September 30, 2017. This compares to debt at September 30, 2016, which represented 1.2 times net income for the 12 months ended September 30, 2016. The increase in this debt/net income multiplier is primarily due to a net increase in long-term debt from September 30, 2016 to September 30, 2017, combined with a decrease in net income for the 12 months ended September 30, 2017 compared to the 12 months ended September 30, 2016, as discussed above. The increase in debt is primarily due to funding for the Merger. Adjusted net debt/adjusted EBITDA8 (non-GAAP measure) was 3.2 as at and for the 12 months ended September 30, 2017, compared to -0.4 as at and for the 12 months ended September 30, 2016.
| 8 | Adjusted net debt/adjusted EBITDA is a non-GAAP financial measure. We believe that comparing adjusted net debt/adjusted EBIDTA on a trailing 12-month basis for different financial periods provides useful information about the performance of our operations as an indicator of the amount of time it would take us to settle both our short and long-term debt. We do not consider this to be a measure of our liquidity, which is our ability to settle only short-term obligations, but rather a measure of how well we fund liquidity. Measures of liquidity are discussed further below under “liquidity and capital resources”. We calculate adjusted net debt/adjusted EBITDA by dividing adjusted net debt (non-GAAP measure) by adjusted EBITDA (non-GAAP measure). Adjusted net debt (non-GAAP measure) is calculated by subtracting cash and cash equivalents and long-term debt held in escrow from debt. Adjusted net debt/adjusted EBITDA is reconciled to the most directly comparable GAAP measures in our consolidated financial statements under “Non-GAAP Measures” below. In prior periods, we calculated this metric as adjusted debt (non-GAAP measure) divided by adjusted EBITDA (non-GAAP measure) and called it ‘adjusted debt/adjusted EBITDA (non-GAAP measure)’. In the second quarter of 2017, we changed the title, definition, and calculation of this non-GAAP measure to more closely align with our Evergreen Model performance metric, which reduces debt for cash and cash equivalents. The change has been applied retrospectively. |
| Ritchie Bros. | 69 |
Diluted EPS
Diluted EPS attributable to stockholders decreased 42% to $0.35 in the first nine months of 2017 from $0.60 per share in the first nine months of 2016. This decrease is primarily due to the decrease in net income attributable to stockholders, combined with an increase in the weighted average number of dilutive shares outstanding over the same comparative period. The increase in the weighted average number of dilutive shares is primarily due to the modification of certain share units from liability-classified to equity-classified in May 2016 and May 2017, as well as the assumption of IronPlanet stock options as part of the Merger. The performance share units awarded to Ravichandra Saligram, our Chief Executive Officer, in 2014 (the “CEO SOG PSUs”) as part of a grant agreement dated August 11, 2014 between the Company and Mr. Saligram (the “Sign-On Grant Agreement”), were modified on May 1, 2017 from liability-classified to equity-classified. Diluted adjusted EPS attributable to stockholders (non-GAAP measure) decreased 35% to $0.55 in the first nine months of 2017 from $0.84 in the first nine months of 2016.
Operations Update
Headcount
Our headcount statistics, which include IronPlanet and exclude Xcira and Mascus employees, are presented below as at the end of each period:
| Q3 2017 | Q2 2017 | Q1 2017 | Q4 2016 | Q3 2016 | Q2 2016 | Q1 2016 | Q4 2015 | |||||||||||||||||||||||||
| Total full-time employees | 2,124 | 2,114 | 1,659 | 1,649 | 1,641 | 1,600 | 1,559 | 1,522 | ||||||||||||||||||||||||
| Regional Sales Managers | 62 | 62 | 52 | 51 | 50 | 45 | 49 | 46 | ||||||||||||||||||||||||
| Territory Managers | 372 | 379 | 301 | 301 | 304 | 304 | 296 | 296 | ||||||||||||||||||||||||
| Revenue Producers | 434 | 441 | 353 | 352 | 354 | 349 | 345 | 342 | ||||||||||||||||||||||||
Total headcount (excluding Xcira and Mascus employees) increased by net 475 between December 31, 2016 and September 30, 2017, which included net 20 from RBFS to support the growth of that business. RBFS account managers are excluded from our definition of Revenue Producers. Xcira had a total headcount of 56 full time employees at September 30, 2017, which has increased by net four since December 31, 2016. Mascus had a total headcount of 49 at September 30, 2017 and December 31, 2016.
Productivity
The majority of our business continues to be generated by our Auctions and Marketplaces segment operations. Sales Force Productivity within this segment is an operational statistic that we believe provides a gauge of the effectiveness of our Revenue Producers in increasing our GTV and, ultimately, our net income. Historically, we measured Sales Force Productivity as trailing 12-month GTV divided by the number of Revenue Producers at the reporting date. As a result of the timing and impact of the Merger on both GTV and the number of Revenue Producers, we updated our Sales Force Productivity measure calculations as at and for the 12-month periods ended September 30, 2017 and 2016.
Our updated Sales Force Productivity measure calculation as at and for the 12-month period ended September 30, 2017 is the sum of the following two amounts:
| • | GTV for the eight months, pre-Merger, ended May 31, 2017, divided by the average number of Revenue Producers over the same eight-month period; and |
| • | GTV for the four months, post-Merger, ended September 30, 2017, divided by the average number of Revenue Producers over the same four-month period. |
Under the revised calculation, our Sales Force Productivity as at and for the trailing 12-month period ended September 30, 2017 is $11.1 million per Revenue Producer.
| Ritchie Bros. | 70 |
We similarly updated the calculation of the measure over the comparative period to be GTV for the trailing 12-month period ended September 30, 2016, divided by the average number of Revenue Producers over the same 12-month period. Under the revised calculation, our Sales Force Productivity as at and for the trailing 12-month period ended September 30, 2016 was $12.5 million. No IronPlanet GTV or Revenue Producers are included in this comparative metric.
Sales Force Productivity decreased by $1.4 million per Revenue Producer over the comparative period. We believe the decrease is due to a combination of factors, including:
| • | The acquisition of Revenue Producers from IronPlanet that had a lower Sales Force Productivity than Ritchie Bros. sales personnel, pre-Merger. IronPlanet’s Sales Force Productivity was $7.6 million per Revenue Producer for the trailing 12-month period ended May 31, 2017. |
| • | Headwinds resulting from our third quarter Columbus, United States, live on site auction, which generated $76.6 million in GTV in the third quarter of 2016 compared to $10.5 million in the third quarter of 2017. |
| • | The constrained supply of used equipment. |
| • | Some lower sales productivity as we complete the integration of our sales teams post-Merger. |
Industrial auction metrics
During the first nine months of 2017, we conducted 169 unreserved industrial auctions at locations in North America, Europe, the Middle East, Australia, New Zealand, and Asia, compared to 162 during the first nine months of 2016.
Our key industrial auction metrics9 are shown below:
| Nine months ended September 30, | ||||||||||||
| % Change | ||||||||||||
| 2017 | 2016 | 2017 over 2016 | ||||||||||
| Bidder registrations | 404,000 | 395,500 | 2 | % | ||||||||
| Consignments | 41,950 | 39,250 | 7 | % | ||||||||
| Buyers | 100,650 | 101,000 | - | |||||||||
| Lots | 276,000 | 294,000 | (6 | )% | ||||||||
We saw decreases in industrial auction buyers and lots in the first nine months of 2017 compared to the first nine months of 2016, primarily due to changes in our auction calendar combined with the performance of the used equipment market, which experienced supply volume pressure over the comparative period. Regarding auction calendar changes, we held the largest-ever auction in Grande Prairie, Canada, in the first quarter of 2016 that generated more than $46.0 million (62.0 million Canadian dollars) of GTV, with no similar auction on the calendar in the first nine months of 2017.
| 9 | For a breakdown of these key industrial auction metrics by month, please refer to our website at www.rbauction.com. None of the information in our website is incorporated by reference into this document by this or any other reference. |
| Ritchie Bros. | 71 |
Although our auctions vary in size, our average industrial auction results on a trailing 12-month basis are described in the following table:
| 12 months ended September 30, | ||||||||||||
| Change | ||||||||||||
| 2017 | 2016 | 2017
over 2016 | ||||||||||
| GTV | $ | 15.9 million | $ | 17.5 million | $ | -1.6 million | ||||||
| Bidder registrations | 2,324 | 2,397 | (3 | )% | ||||||||
| Consignors | 234 | 234 | - | |||||||||
| Lots | 1,589 | 1,718 | (8 | )% | ||||||||
For the same reasons discussed above, we saw a decrease in the average number of lots for the 12 months ended September 30, 2017 compared to the 12 months ended September 30, 2016.
Online bidding at live on site auctions
Internet bidders comprised 68% of the total bidder registrations at our live on site auctions in the first nine months of 2017, compared to 66% in the first nine months of 2016. This increase in the level of internet bidders continues to demonstrate our ability to drive multichannel participation at our auctions.
Website metrics10
Our IronPlanet websites www.ironplanet.com, www.govplanet.com, and www.truckplanet.com, and our EquipmentOne websites www.equipmentone.com, www.salvagesale.com, www.salvagesale.uk.com, and www.mexico.assetnation.com provide access to our online marketplaces.
Traffic across all our websites increased 19% in the first nine months of 2017 compared to the first nine months of 2016, with the addition of IronPlanet traffic accounting for 1230 of the 1900-basis point increase.
Outstanding Share Data
We are a public company and our common shares are listed under the symbol “RBA” on the New York Stock Exchange (“NYSE”) and the Toronto Stock Exchange (“TSX”). Financial information about our equity and share-based payments is set forth in our consolidated financial statement footnotes 19 “Equity and Dividends” and 20 “Share-based Payments” in “Part I, Item 1: Consolidated Financial Statements” of this Quarterly Report on Form 10-Q.
Share repurchase program
Our normal course issuer bid (“NCIB”) that was approved by the TSX on March 1, 2016 expired on March 2, 2017 and was not renewed. No share purchases were made pursuant to the NCIB, or by any other means, during the nine months ended September 30, 2017.
| 10 | None of the information in our websites is incorporated by reference into this document by this or any other reference. |
| Ritchie Bros. | 72 |
Liquidity and Capital Resources
Working capital
| (in U.S. $000's) | September 30, | December 31, | ||||||||||||||
| 2017 | 2016 | $ Change | % Change | |||||||||||||
| Cash and cash equivalents | $ | 224,474 | $ | 207,867 | $ | 16,607 | 8 | % | ||||||||
| Current restricted cash | $ | 89,846 | $ | 50,222 | $ | 39,624 | 79 | % | ||||||||
| Current assets | $ | 621,455 | $ | 377,998 | $ | 243,457 | 64 | % | ||||||||
| Current liabilities | 519,391 | 252,834 | 266,557 | 105 | % | |||||||||||
| Working capital | $ | 102,064 | $ | 125,164 | $ | (23,100 | ) | (18 | )% | |||||||
We believe that working capital is a more meaningful measure of our liquidity than cash alone. Our working capital decreased during the nine months ended September 30, 2017, primarily due to the payment of dividends of $54.6 and interest on our debt, partially offset by operating income generated during the period.
Cash flows
| (in U.S. $000's) | Nine months ended September 30, | |||||||||||||||
| $ Change | % Change | |||||||||||||||
| 2017 | 2016 | 2017 over 2016 | 2017 over 2016 | |||||||||||||
| Cash provided by (used in): | ||||||||||||||||
| Operating activities | $ | 97,215 | $ | 161,421 | $ | (64,206 | ) | (40 | )% | |||||||
| Investing activities | (701,599 | ) | (97,316 | ) | (604,283 | ) | 621 | % | ||||||||
| Financing activities | 143,345 | (49,610 | ) | 192,955 | (389 | )% | ||||||||||
| Effect of changes in foreign currency rates | 17,270 | 6,656 | 10,614 | 159 | % | |||||||||||
| Net increase (decrease) in cash, cash equivalents, and restricted cash | $ | (443,769 | ) | $ | 21,151 | $ | (464,920 | ) | (2198 | )% | ||||||
Operating activities
Cash provided by operating activities can fluctuate significantly from period to period due to factors such as differences in the timing, size, and number of auctions during the period, the volume of our underwritten contracts, the timing of the receipt of auction proceeds from buyers and of the payment of net amounts due to consignors, as well as the location of the auction with respect to restrictions on the use of cash generated therein.
Cash provided by operating activities decreased $64.2 million, or 40%, during the first nine months of 2017 compared to the first nine months of 2016. This decrease was primarily due to a decrease in cash earnings, which includes a decrease in net income of $27.1 million, and a decrease of $10.7 million in non-cash charges. Changes in certain of our operating assets and liabilities also contributed to the decline in cash flow from operations. In particular, changes in inventory used $31.7 million more cash during the first nine months of 2017 compared to the first nine months of 2016. This was primarly due to an increase in inventory deals in Australia and the Canadian agriculture sectors in the first nine months of September 30, 2017, combined with a decrease in the number of inventory packages during the first nine months of September 30, 2016. This decrease was primarily due to large inventory packages held at the end of 2015 being sold in the February 2016 Orlando auction. The remaining change in operating assets and liabilities came from a variety of smaller items.
Cash provided by operating activities decreased $31.5 million, or 22%, during the 12 months ended September 30, 2017 compared to the 12 months ended September 30, 2016, primarily due to a $46.6 million decrease in net income, changes in certain of our operating assets and liabilities, including auction proceeds payable, and a decrease in non-cash impairment losses over the same comparative period. This decrease was partially offset by changes in trade and other receivables during the 12 months ended September 30, 2017 compared to the 12 months ended September 30, 2016.
| Ritchie Bros. | 73 |
Investing activities
Net cash used in investing activities increased $604.3 million during the first nine months of 2017 compared to the first nine months of 2016. This increase is primarily due to the acquisition of IronPlanet for $675.9 million, net of cash acquired in the first nine months of 2017, compared to the acquisitions of RBFS non-controlling interests of $41.1 million, Mascus for $28.1 million, net of cash and cash equivalents acquired, and Petrowsky for $6.3 million in the first nine months of 2016.
CAPEX intensity presents net capital spending as a percentage of revenue. We believe that comparing CAPEX intensity on a trailing 12-month basis for different financial periods provides useful information as to the amount of capital expenditure that we require to generate revenues.
| (in U.S. $ millions) | 12 months ended September 30, | |||||||||||
| Change | ||||||||||||
| 2017 | 2016 | 2017 over 2016 | ||||||||||
| Property, plant and equipment additions | $ | 14.4 | $ | 22.0 | (35 | )% | ||||||
| Intangible asset additions | 26.0 | 16.6 | 57 | % | ||||||||
| Proceeds on disposition of property plant and equipment | (6.9 | ) | (15.2 | ) | (55 | )% | ||||||
| Net capital spending | $ | 33.5 | $ | 23.4 | 43 | % | ||||||
| Revenues | $ | 578.5 | $ | 555.1 | 4 | % | ||||||
| CAPEX intensity | 5.8 | % | 4.2 | % | 160 | bps | ||||||
CAPEX intensity for the 12 months ended September 30, 2017 increased compared to CAPEX intensity for the 12 months ended September 30, 2016, primarily due to the net capital spending increase of 43% exceeding the revenue increase of 4% period-over-period.
Net capital spending increased $10.1 million, or 43%, during the 12 months ended September 30, 2017 compared to the 12 months ended September 30, 2016, primarily due to a $9.4 million increase in intangible asset additions over the same comparative period. The increase in intangible asset additions period-over-period is primarily due to the capitalization of costs of assets under development. Significant software development projects during the 12 months ended September 30, 2017 include systems integration following the Merger and other acquisitions, along with enhanced functionality for our online marketplace sales channel. The decrease in cash provided by operating activities combined with the increase in net capital spending resulted in a decrease in operating free cash flow (“OFCF”)11 (non-GAAP measure) of $41.6 million, or 34%, from $121.5 million for the 12 months ended September 30, 2016 to $79.9 million for the 12 months ended September 30, 2017.
Financing activities
Net cash provided by financing activities increased $193.0 million in the first nine months of 2017 compared to the nine months of 2016. In the first nine months of 2017, we borrowed a net $180.4 million more than in the first nine months of 2016. We also had a $36.7 million decrease in share repurchases over the same comparative period. The increase in cash provided by financing activities was partially offset by a $12.8 million decrease in share capital issuances and the payment of debt issue costs of $11.8 million in the first nine months of 2017 compared to the first nine months of 2016.
| 11 | OFCF is non-GAAP financial measure that we believe, when compared on a trailing 12-month basis to different financial periods provides an effective measure of the cash generated by our business and provides useful information regarding cash flows remaining for discretionary return to stockholders, mergers and acquisitions, or debt reduction. Our balance sheet scorecard includes the performance metric, OFCF. OFCF is also an element of the performance criteria for certain annual short-term incentive awards we grant to our employees and officers. We calculate OFCF by subtracting net capital spending from cash provided by operating activities. OFCF is reconciled to the most directly comparable GAAP measures in our consolidated financial statements under “Non-GAAP Measures” below. |
| Ritchie Bros. | 74 |
We declared and paid regular cash dividends of $0.17 per common share for the quarters ended September 30, 2016, December 31, 2016, March 31, 2017, and June 30, 2017. We have declared, but not yet paid, a dividend of $0.17 per common share for the quarter ended September 30, 2017.
Total dividend payments during the nine months ended September 30, 2017 were $54.6 million to stockholders and $40.8 thousand to non-controlling interests. This compares to total dividend payments of $52.3 million to stockholders and $3.4 million to non-controlling interests during the nine months ended September 30, 2016. All dividends we pay are “eligible dividends” for Canadian income tax purposes unless indicated otherwise.
Our dividend payout ratio, which we calculate as dividends paid to stockholders divided by net income attributable to stockholders, increased 4710 bps to 110.0% for the 12 months ended September 30, 2017 from 62.9% for the 12 months ended September 30, 2016. This increase is primarily the result of the decrease in net income attributable to stockholders combined with the increase in our dividends paid to stockholders over the same comparative period. Our adjusted dividend payout ratio12 (non-GAAP measure) increased 2180 bps to 78.9% for the 12 months ended September 30, 2017 from 57.1% for the 12 months ended September 30, 2016.
Our return on average invested capital is calculated as net income attributable to stockholders divided by our average invested capital. We calculate average invested capital over a trailing 12-month period by adding the average long-term debt over that period to the average stockholders’ equity over that period. Return on average invested capital decreased 830 bps to 5.7% during the 12 months ended September 30, 2017 from 14.0% during the 12 months ended September 30, 2016. This decrease is primarily due to a $372.9 million, or a 47%, increase in average invested capital period-over-period, which was primarily the result of the issuance of $500.0 million of senior unsecured notes (the “Notes”) in the fourth quarter of 2016 and the delayed draw term loans borrowed in the second quarter of 2017. Also contributing to the decrease in return on average invested capital over this comparative period was a $44.4 million, or 40%, decrease in net income attributable to stockholders. Return on invested capital (“ROIC”)13 (non-GAAP measure) decreased 750 bps to 7.9% during the 12 months ended September 30, 2017 from 15.4% during the 12 months ended September 30, 2016.
Debt and credit facilities
At September 30, 2017, our short-term debt of $8.6 million consisted of borrowings under our committed revolving credit facilities and had a weighted average annual interest rate of 2.8%. This compares to current borrowings of $23.9 million at December 31, 2016 with a weighted average annual interest rate of 2.2%.
As at September 30, 2017, we had a total of $817.9 million long-term debt with a weighted average annual interest rate of 4.6%. This compares to long-term debt of $595.7 million as at December 31, 2016 with a weighted average annual interest rate of 4.9%.
| 12 | Adjusted dividend payout ratio is non-GAAP financial measure. We believe that comparing the adjusted dividend payout ratio for different financial periods provides useful information about how well our net income supports our dividend payments. Adjusted dividend payout ratio is calculated by dividing dividends paid to stockholders by adjusted net income attributable to stockholders (non-GAAP measure). Adjusted dividend payout ratio is reconciled to the most directly comparable GAAP measures in our consolidated financial statements under “Non-GAAP Measures” below. |
| 13 | ROIC is a non-GAAP financial measure that we believe, by comparing on a trailing 12-month basis for different financial periods provides useful information about the after-tax return generated by our investments. Our balance sheet scorecard includes the performance metric ROIC. ROIC was also an element of the performance criteria for certain PSUs that we granted our employees and officers in 2013 and 2014. We calculate ROIC as net income attributable to stockholders excluding the effects of adjusting items divided by average invested capital. Average invested capital is a GAAP measure calculated as the average long-term debt (including current and non-current portions) and stockholders’ equity over a trailing 12-month period. ROIC is reconciled to the most directly comparable GAAP measures in our consolidated financial statements under “Non-GAAP Measures” below. |
| Ritchie Bros. | 75 |
Future scheduled principal and interest payments (assuming no changes in short-term rates from current levels) over the next five years relating to our long-term debt outstanding at September 30, 2017 are as follows:
| (in U.S. $000's) | Scheduled payments by due period | |||||||||||||||||||||||
| In 2017 | In 2018 | In 2019 | In 2020 | In 2021 | Thereafter | |||||||||||||||||||
| On long-term debt: | ||||||||||||||||||||||||
| Principal | $ | 4,246 | $ | 16,985 | $ | 25,477 | $ | 33,969 | $ | 254,769 | $ | 500,000 | ||||||||||||
| Interest | 2,964 | 38,356 | 37,719 | 36,630 | 33,984 | 94,063 | ||||||||||||||||||
Syndicated credit facility
On October 27, 2016, we closed a five-year credit agreement (the “Credit Agreement”) with a syndicate of lenders, including Bank of America, N.A. (“BofA”) and Royal Bank of Canada, that provides us with:
| 1) | Multicurrency revolving facilities of up to $675.0 million (the “Multicurrency Facilities”); |
| 2) | A delayed-draw term loan facility of up to $325.0 million (the “Delayed-Draw Facility” and together with the Multicurrency Facilities, the “Syndicated Facilities”); and |
| 3) | At our election and subject to certain conditions, including receipt of related commitments, incremental term loan facilities and/or increases to the Multicurrency Facilities in an aggregate amount of up to $50 million. |
We may use the proceeds from the Multicurrency Facilities for general corporate purposes. During the second quarter of 2017, the full amount of the Delayed-Draw Facility was drawn to finance the Merger.
The Syndicated Facilities are secured by the assets of Ritchie Bros. Auctioneers Incorporated and certain of its subsidiaries in Canada and the United States. The Syndicated Facilities may become unsecured again, subject to Ritchie Bros. meeting specified credit rating or leverage ratio conditions. The Syndicated Facilities mature five years after the closing date of the Credit Agreement. The Delayed-Draw Facility is amortized in equal quarterly installments in an annual amount of 5% for the first two years after the closing of the Merger, and 10% in the third through fifth years after the closing of the Merger, with the balance payable at maturity.
Borrowings under the Credit Agreement bear floating rates of interest, which, at our option, are based on either a base rate (or Canadian prime rate for certain Canadian dollar borrowings) or LIBOR (or such customary floating rate customarily used by BofA for currencies other than U.S. dollars). In either case, an applicable margin is added to the rate. The applicable margin ranges from 0.25% to 1.50% for base rate loans, and 1.25% to 2.50% for LIBOR (or the equivalent of such currency) loans, depending on our leverage ratio at the time of borrowing. We must also pay quarterly in arrears a commitment fee equal to the daily amount of the unused commitments under the Syndicated Facilities multiplied by an applicable percentage per annum (which ranges from 0.25% to 0.50% depending on our leverage ratio).
We incurred debt issuance costs of $9.7 million in connection with the Credit Agreement, of which $4.8 million was allocated to the Multicurrency Facilities and $4.9 million was allocated to the Delayed-Draw Facility. As the former allocation is not related to specific draws, the costs have been capitalized as other non-current assets and are being amortized over the term of the Syndicated Facilities. For the latter allocation, the costs have been capitalized and reduce the carrying value of the delayed draw term loans to which they relate. At September 30, 2017, the unamortized deferred debt issuance costs relating to the Multicurrency Facilities and delayed draw term loans were $4.1 million and $4.4 million, respectively.
Senior unsecured notes
On December 21, 2016, we completed the offering of the Notes for an aggregate principal amount of $500.0 million. The Notes bear interest at a rate of 5.375% per annum and have a maturity date of January 15, 2025. The Notes were offered only to qualified institutional buyers in reliance on Rule 144A under the Securities Act, and outside the United States, only to non-U.S. investors pursuant to Regulation S under the Securities Act. The Notes have not been registered under the Securities Act or any state securities laws and may not be offered or sold in the United States absent an effective registration statement or an applicable exemption from registration requirements or a transaction not subject to the registration requirements of the Securities Act or any state securities laws.
| Ritchie Bros. | 76 |
The proceeds of the offering were used to finance the Merger. Upon the closing of the offering, the gross proceeds from the offering together with certain additional amounts including prepaid interest were deposited in to an escrow account. The funds were held in escrow until the Merger was completed on May 31, 2017.
Until the release of the proceeds in the escrow account, the Notes were secured by a first priority security interest in the escrow account. Upon the completion of the Merger, the Notes became senior unsecured obligations. The Notes are jointly and severally guaranteed on an unsecured basis, subject to certain exceptions, by each of our subsidiaries that is a borrower or guarantees indebtedness under the Credit Agreement. IronPlanet and certain of its subsidiaries were added as additional guarantors in connection with the Merger.
We incurred debt issuance costs of $13.9 million in connection with the offering of the Notes. At September 30, 2017, we had unamortized deferred debt issuance costs relating to the Notes of $13.1 million.
Other credit facilities
As at September 30, 2017, we also had $10.1 million in committed, revolving credit facilities, in certain foreign jurisdictions, which expire on May 31, 2018.
Debt covenants
The Credit Agreement contains certain covenants that could limit the ability of the Company and certain of its subsidiaries to, among other things and subject to certain significant exceptions: (i) incur, assume or guarantee additional indebtedness; (ii) declare or pay dividends or make other distributions with respect to, or purchase or otherwise acquire or retire for value, equity interests; (iii) make loans, advances or other investments; (iv) incur liens; (v) sell or otherwise dispose of assets; and (vi) enter into transactions with affiliates. The Credit Agreement also provides for certain events of default, which, if any of them occurs, would permit or require the principal, premium, if any, interest and any other monetary obligations on all the then outstanding amounts under the Credit Agreement to be declared immediately due and payable.
The Notes were issued pursuant to an indenture, dated December 21, 2016, with U.S. Bank National Association, as trustee (the “Indenture”). The Indenture contains covenants that limit our ability, and the ability of certain of our subsidiaries to, among other things and subject to certain significant exceptions: (i) incur, assume or guarantee additional indebtedness; (ii) declare or pay dividends or make other distributions with respect to, or purchase or otherwise acquire or retire for value, equity interests; (iii) make any principal payment on, or redeem or repurchase, subordinated debt; (iv) make loans, advances or other investments; (v) incur liens; (vi) sell or otherwise dispose of assets; and (vii) enter into transactions with affiliates. The Indenture also provides for certain events of default, which, if any of them occurs, would permit or require the principal, premium, if any, interest and any other monetary obligations on all the then outstanding Notes under the applicable indenture to be declared immediately due and payable.
At inception of the Credit Agreement and the Indenture, all parties anticipated the increase in indebtedness that followed the Merger. As such, covenants pertaining to our leverage ratio provide for a six-quarter expansion of debt levels, after which the leverage ratio settles to a moderately higher tier than pre-Merger conditions.
We were in compliance with all financial and other covenants applicable to our credit facilities at September 30, 2017.
Off-Balance Sheet Arrangements
We have no off-balance sheet arrangements that have or are reasonably likely to have a current or future material effect on our financial condition, changes in financial condition, revenues or expenses, financial performance, liquidity, capital expenditures or capital resources.
| Ritchie Bros. | 77 |
Historical Segmented Information
To provide additional historical context and an enhanced understanding of our business to the users of this filing, we are including the following tables, which present our historical segmented information under the new reportable segment, Auctions and Marketplaces, and the other category for periods not already included in “Part I, Item 1: Consolidated Financial Statements” of this Quarterly Report on Form 10-Q:
| Three months ended March 31, 2017 | Three months ended June 30, 2017 | |||||||||||||||||||||||
| Auctions and Marketplaces | Other | Consolidated | Auctions and Marketplaces | Other | Consolidated | |||||||||||||||||||
| Revenues | $ | 115,677 | $ | 8,822 | $ | 124,499 | $ | 54,646 | $ | 11,540 | $ | 166,186 | ||||||||||||
| Costs of services, excluding D&A | (12,587 | ) | (226 | ) | (12,813 | ) | (20,978 | ) | (613 | ) | (21,591 | ) | ||||||||||||
| SG&A expenses | (67,392 | ) | (3,183 | ) | (70,575 | ) | (71,199 | ) | (3,178 | ) | (74,377 | ) | ||||||||||||
| Impairment loss | - | - | - | (8,911 | ) | - | (8,911 | ) | ||||||||||||||||
| Segment profit | $ | 35,698 | $ | 5,413 | $ | 41,111 | $ | 53,558 | $ | 7,749 | $ | 61,307 | ||||||||||||
| Acquisition-related costs | (8,627 | ) | (22,948 | ) | ||||||||||||||||||||
| D&A expenses | (10,338 | ) | (11,872 | ) | ||||||||||||||||||||
| Gain on disposition of PPE | 721 | 308 | ||||||||||||||||||||||
| Foreign exchange gain | 730 | 93 | ||||||||||||||||||||||
| Operating income | $ | 23,597 | $ | 26,888 | ||||||||||||||||||||
| Other expense | (5,849 | ) | (5,150 | ) | ||||||||||||||||||||
| Income tax expense | (7,315 | ) | (4,025 | ) | ||||||||||||||||||||
| Net income | $ | 10,433 | $ | 17,713 | ||||||||||||||||||||
| Three months ended March 31, 2016 | Three months ended June 30, 2016 | |||||||||||||||||||||||
| Auctions
and Marketplaces | Other | Consolidated | Auctions
and Marketplaces | Other | Consolidated | |||||||||||||||||||
| Revenues | $ | 125,659 | $ | 6,286 | $ | 131,945 | $ | 148,458 | $ | 10,347 | $ | 158,805 | ||||||||||||
| Costs of services, excluding D&A | (15,313 | ) | - | (15,313 | ) | (19,407 | ) | (351 | ) | (19,758 | ) | |||||||||||||
| SG&A expenses | (65,706 | ) | (1,404 | ) | (67,110 | ) | (69,915 | ) | (4,077 | ) | (73,992 | ) | ||||||||||||
| Segment profit | $ | 44,640 | $ | 4,882 | $ | 49,522 | $ | 59,136 | $ | 5,919 | $ | 65,055 | ||||||||||||
| Acquisition-related costs | (1,197 | ) | (603 | ) | ||||||||||||||||||||
| D&A expenses | (10,080 | ) | (10,284 | ) | ||||||||||||||||||||
| Gain on disposition of PPE | 246 | 201 | ||||||||||||||||||||||
| Foreign exchange gain (loss) | 683 | (734 | ) | |||||||||||||||||||||
| Operating income | $ | 39,174 | $ | 53,635 | ||||||||||||||||||||
| Other income | 352 | 173 | ||||||||||||||||||||||
| Income tax expense | (9,532 | ) | (13,217 | ) | ||||||||||||||||||||
| Net income (loss) | $ | 29,994 | $ | 40,591 | ||||||||||||||||||||
| Ritchie Bros. | 78 |
| Three months ended September 31, 2016 | Three months ended December 31, 2016 | |||||||||||||||||||||||
| Auctions and Marketplaces | Other | Consolidated | Auctions and Marketplaces | Other | Consolidated | |||||||||||||||||||
| Revenues | $ | 121,111 | $ | 7,765 | $ | 128,876 | $ | 136,598 | $ | 10,171 | $ | 146,769 | ||||||||||||
| Costs of services, excluding D&A | (14,493 | ) | (257 | ) | (14,750 | ) | (16,035 | ) | (206 | ) | (16,241 | ) | ||||||||||||
| SG&A expenses | (65,346 | ) | (2,947 | ) | (68,293 | ) | (72,212 | ) | (1,922 | ) | (74,134 | ) | ||||||||||||
| Impairment loss | (28,243 | ) | - | (28,243 | ) | - | - | - | ||||||||||||||||
| Segment profit | $ | 13,029 | $ | 4,561 | $ | 17,590 | $ | 48,351 | $ | 8,043 | $ | 56,394 | ||||||||||||
| Acquisition-related costs | (5,398 | ) | (4,631 | ) | ||||||||||||||||||||
| D&A expenses | (10,196 | ) | (10,301 | ) | ||||||||||||||||||||
| Gain on disposition of PPE | 570 | 265 | ||||||||||||||||||||||
| Foreign exchange loss | (281 | ) | (1,099 | ) | ||||||||||||||||||||
| Operating income | $ | 2,285 | $ | 40,628 | ||||||||||||||||||||
| Other expense | (105 | ) | (5,648 | ) | ||||||||||||||||||||
| Income tax expense | (7,180 | ) | (7,053 | ) | ||||||||||||||||||||
| Net income (loss) | $ | (5,000 | ) | $ | 27,927 | |||||||||||||||||||
| Year ended December 31, 2016 | ||||||||||||
| Auctions and Marketplaces | Other | Consolidated | ||||||||||
| Revenues | $ | 531,826 | $ | 34,569 | $ | 566,395 | ||||||
| Costs of services, excluding D&A | (65,248 | ) | (814 | ) | (66,062 | ) | ||||||
| SG&A expenses | (273,179 | ) | (10,350 | ) | (283,529 | ) | ||||||
| Impairment loss | (28,243 | ) | - | (28,243 | ) | |||||||
| Segment profit | $ | 165,156 | $ | 23,405 | $ | 188,561 | ||||||
| Acquisition-related costs | (11,829 | ) | ||||||||||
| D&A expenses | (40,861 | ) | ||||||||||
| Gain on disposition of PPE | 1,282 | |||||||||||
| Foreign exchange loss | (1,431 | ) | ||||||||||
| Operating income | $ | 135,722 | ||||||||||
| Other expense | (5,228 | ) | ||||||||||
| Income tax expense | (36,982 | ) | ||||||||||
| Net income | $ | 93,512 | ||||||||||
Critical Accounting Policies, Judgments, Estimates and Assumptions
Aside from those discussed below, there were no material changes in our critical accounting policies, judgments, estimates and assumptions from those disclosed in our Annual Report on Form 10-K for the year ended December 31, 2016, which is available on our website at www.rbauction.com, on EDGAR at www.sec.gov, or on SEDAR at www.sedar.com, or in the notes to our consolidated financial statements included in “Part I, Item 1: Consolidated Financial Statements” in this Quarterly Report on Form 10-Q.
| Ritchie Bros. | 79 |
Recoverability of goodwill
We perform impairment tests on goodwill on an annual basis in accordance with US GAAP, or more frequently if events or changes in circumstances indicate that those assets might be impaired. Goodwill is tested for impairment at a reporting unit level, which is at the same level or one level below an operating segment.
On January 1, 2017, we early adopted Accounting Standards Update (“ASU”) 2017-04, Intangibles – Goodwill and Other (Topic 350): Simplifying the Test for Goodwill Impairment (“ASU 2017-04”), which eliminates Step 2 from the goodwill impairment test. Under ASU 2017-04, we still have the option of performing a qualitative assessment of a reporting unit to first determine whether the quantitative impairment test is necessary. We exercise judgment in performing our qualitative assessment of whether indicators of impairment exist.
When we determine that an annual or interim quantitative impairment test is necessary, we now only perform one step to identify potential impairment, which is to compare the reporting unit’s fair value with its carrying amount, including goodwill. The reporting unit’s fair value is determined using various valuation approaches and techniques that involve assumptions based on what we believe a hypothetical marketplace participant would use in estimating fair value on the measurement date. An impairment loss is recognized as the difference between the reporting unit’s carrying amount and its fair value to the extent the difference does not exceed the total amount of goodwill allocated to the reporting unit.
We measure the fair value of our reporting units using a blended analysis of the earnings valuation approach, which employs a discounted cash flow valuation technique, and the market valuation approach, which employs a multiple of earnings valuation technique. We believe that using a blended valuation approach compensates for the inherent risks associated with each technique if used on a stand-alone basis. In applying these valuation approaches, management is required to make significant estimates and assumptions about the timing and amount of future cash flows, revenue growth rates, and discount rates, which requires a significant amount of judgment. Accordingly, actual results may differ from those used in the goodwill impairment test.
Changes in Accounting Policies
There were no changes in our significant accounting policies during the three months ended September 30, 2017.
Future changes in accounting policies – recent accounting standards not yet adopted
In May 2014, the Financial Accounting Standards Board issued ASU 2014-09, Revenue from Contracts with Customers (Topic 606) (“ASU 2014-09”), which requires an entity to recognize revenue when it transfers promised goods or services to customers in an amount that reflects the consideration to which the entity expects to be entitled in exchange for those goods or services. ASU 2014-09 is effective for fiscal years, and interim periods within those fiscal years, beginning after December 15, 2017. We will not early adopt ASU 2014-09, and as such, the effective date will be January 1, 2018. We have decided to adopt ASU 2014-09 on a retrospective basis.
While continuing to assess all potential impacts of adoption of ASU 2014-09, our current analysis indicates that the most significant change will be in the presentation of revenue from the majority of inventory, ancillary service, and RBLS contracts to gross as a principal instead of net as an agent. This presentation is expected to significantly increase the amount of revenue reported compared to the current presentation, as well as add volatility to revenue over comparative periods. Presenting these revenues gross as a principal versus net as an agent has no impact on operating income.
| Ritchie Bros. | 80 |
The following tables illustrate the expected impact on our reported results of retrospectively adopting ASU 2014-09 and, thereunder, presenting the majority of inventory, ancillary service, and RBLS revenues on a gross basis:
| Nine months ended September 30, | Year ended December 31, | |||||||||||||||||||||||
| (in U.S. $000's) | 2017 | 2016 | 2016 | 2015 | 2014 | 2013 | ||||||||||||||||||
| Total revenues: | ||||||||||||||||||||||||
| As reported | $ | 431,732 | $ | 419,626 | $ | 566,395 | $ | 515,875 | $ | 481,097 | $ | 467,403 | ||||||||||||
| New revenue standard | 680,989 | 832,147 | 1,126,977 | 1,080,499 | 1,239,636 | 1,089,180 | ||||||||||||||||||
| Operating income: | ||||||||||||||||||||||||
| As reported | $ | 67,416 | $ | 95,094 | $ | 135,722 | $ | 174,840 | $ | 127,927 | $ | 136,959 | ||||||||||||
| New revenue standard | 67,416 | 95,094 | 135,722 | 174,840 | 127,927 | 136,959 | ||||||||||||||||||
Revenue reported under current US GAAP increased 3% in the first nine months of 2017 compared to the first nine months of 2016. The expected impact of retrospectively adopting ASU 2014-09 would result in an 18% decrease in total revenues in the first nine months of 2017 compared to the first nine months of 2016.
Revenue under current US GAAP will be most comparable to total revenues less cost of inventory sold under ASU 2014-09. As such, when ASU 2014-09 takes effect, we will introduce a new non-GAAP financial measure that we are tentatively calling “Agency Proceeds”, which will be calculated as total revenues less cost of inventory sold and will replace revenues used in our key performance metrics.
Non-GAAP Measures
We reference various non-GAAP measures throughout this Quarterly Report on Form 10-Q. These measures do not have a standardized meaning and are, therefore, unlikely to be comparable to similar measures presented by other companies. The presentation of this financial information, which is not prepared under any comprehensive set of accounting rules or principles, is not intended to be considered in isolation of, or as a substitute for, the financial information prepared and presented in accordance with generally accepted accounting principles.
The following tables present our adjusted operating income (non-GAAP measure) and adjusted operating income margin (non-GAAP measure) results for the three and nine months, respectively, ended September 30, 2017 and 2016, as well as reconcile those metrics to operating income, revenues, and operating income margin, which are the most directly comparable GAAP measures in, or calculated from, our consolidated income statements:
| (in U.S. $000's) | Three months ended September 30, | |||||||||||
| Change | ||||||||||||
| 2017 | 2016 | 2017
over 2016 | ||||||||||
| Operating income | $ | 16,931 | $ | 2,285 | 641 | % | ||||||
| Pre-tax adjusting item: | ||||||||||||
| Impairment loss | - | 28,243 | (100 | )% | ||||||||
| Adjusted operating income | ||||||||||||
| (non-GAAP measure) | 16,931 | 30,528 | (45 | )% | ||||||||
| Revenues | $ | 141,047 | $ | 128,876 | 9 | % | ||||||
| Operating income margin | 12.0 | % | 1.8 | % | 1020 | bps | ||||||
| Adjusted operating income margin | ||||||||||||
| (non-GAAP measure) | 12.0 | % | 23.7 | % | -1170 | bps | ||||||
| Ritchie Bros. | 81 |
| (in U.S. $000's) | Nine months ended September 30, | |||||||||||
| Change | ||||||||||||
| 2017 | 2016 | 2017 over 2016 | ||||||||||
| Operating income | $ | 67,416 | $ | 95,094 | (29 | )% | ||||||
| Pre-tax adjusting items: | ||||||||||||
| Accelerated vesting of assumed options | 4,752 | - | 100 | % | ||||||||
| Acquisition and finance structure advisory | 9,063 | - | 100 | % | ||||||||
| Severance and retention | 1,447 | - | 100 | % | ||||||||
| Impairment loss | 8,911 | 28,243 | (68 | )% | ||||||||
| Adjusted operating income | ||||||||||||
| (non-GAAP measure) | 91,589 | 123,337 | (26 | )% | ||||||||
| Revenues | $ | 431,732 | $ | 419,626 | 3 | % | ||||||
| Operating income margin | 15.6 | % | 22.7 | % | -710 | bps | ||||||
| Adjusted operating income margin | ||||||||||||
| (non-GAAP measure) | 21.2 | % | 29.4 | % | -820 | bps | ||||||
There were no adjusting items recognized in the first or third quarters of 2017. The adjusting items for the nine months ended September 30, 2017 were:
Recognized in the second quarter of 2017
| · | $4.8 million ($4.8 million after tax, or $0.04 per diluted share) of stock option compensation expense related to the accelerated vesting of certain IronPlanet stock options assumed as part of the Merger |
| · | $9.1 million ($6.6 million after tax, or $0.06 per diluted share) of acquisition and finance structure advisory costs |
| · | $1.4 million ($0.9 million after tax, or $0.01 per diluted share) of severance and retention costs in a corporate reorganization that followed the Merger |
| · | An $8.9 million ($6.6 million after tax, or $0.06 per diluted share) impairment loss recognized on various technology assets |
The adjusting items for the three and nine months ended September 30, 2016 were:
Recognized in the third quarter of 2016
| · | A $28.2 million ($26.4 million after tax, or $0.25 per diluted share) impairment loss on EquipmentOne reporting unit goodwill and customer relationships |
There were no first or second quarter 2016 adjusting items.
| Ritchie Bros. | 82 |
The following tables present our adjusted net income attributable to stockholders (non-GAAP measure) and diluted adjusted EPS attributable to stockholders (non-GAAP measure) results for the three and nine months, respectively, ended September 30, 2017 and 2016, as well as reconcile those metrics to net income attributable to stockholders, the effect of dilutive securities, the weighted average number of dilutive shares outstanding, and diluted earnings (loss) per share attributable to stockholders, which are the most directly comparable GAAP measures in our consolidated income statements:
| (in U.S. $000's, except share and | Three months ended September 30, | |||||||||||
| per share data) | Change | |||||||||||
| 2017 | 2016 | 2017 over 2016 | ||||||||||
| Net income (loss) attributable to stockholders | $ | 10,261 | $ | (5,137 | ) | 300 | % | |||||
| Pre-tax adjusting items: | ||||||||||||
| Impairment loss | - | 28,243 | (100 | )% | ||||||||
| Deferred income tax effect of adjusting items: | ||||||||||||
| Impairment loss | - | (1,798 | ) | (100 | )% | |||||||
| Adjusted net income attributable to stockholders (non-GAAP measure) | $ | 10,261 | $ | 21,308 | (52 | )% | ||||||
| Effect of dilutive securities | $ | - | $ | - | - | |||||||
| Weighted average number of dilutive shares outstanding | 108,178,303 | 107,525,051 | 1 | % | ||||||||
| Diluted earnings (loss) per share attributable to stockholders | $ | 0.09 | $ | (0.05 | ) | 280 | % | |||||
| Diluted adjusted EPS attributable to stockholders (non-GAAP measure) | $ | 0.09 | $ | 0.20 | (55 | )% | ||||||
| Ritchie Bros. | 83 |
| (in U.S. $000's, except share and | Nine months ended September 30, | |||||||||||
| per share data) | Change | |||||||||||
| 2017 | 2016 | 2017 over 2016 | ||||||||||
| Net income attributable to stockholders | $ | 38,273 | $ | 63,979 | (40 | )% | ||||||
| Pre-tax adjusting items: | ||||||||||||
| Accelerated vesting of assumed options | 4,752 | - | 100 | % | ||||||||
| Acquisition and finance structure advisory | 9,063 | - | 100 | % | ||||||||
| Severance and retention | 1,447 | - | 100 | % | ||||||||
| Impairment loss | 8,911 | 28,243 | (68 | )% | ||||||||
| Current income tax effect of adjusting items: | ||||||||||||
| Acquisition and finance structure advisory | (2,447 | ) | - | 100 | % | |||||||
| Severance and retention | (564 | ) | - | 100 | % | |||||||
| Deferred income tax effect of adjusting items: | ||||||||||||
| Impairment loss | (2,361 | ) | (1,798 | ) | 31 | % | ||||||
| Current income tax adjusting item: | ||||||||||||
| Change in uncertain tax provision | 2,290 | - | 100 | % | ||||||||
| Adjusted net income attributable to stockholders (non-GAAP measure) | $ | 59,364 | $ | 90,424 | (34 | )% | ||||||
| Effect of dilutive securities | $ | (50 | ) | $ | - | 100 | % | |||||
| Weighted average number of dilutive shares outstanding | 108,069,624 | 107,221,390 | 1 | % | ||||||||
| Diluted EPS attributable to stockholders | $ | 0.35 | $ | 0.60 | (42 | )% | ||||||
| Diluted adjusted EPS attributable to stockholders (non-GAAP measure) | $ | 0.55 | $ | 0.84 | (35 | )% | ||||||
There were no adjusting items recognized in the third quarter of 2017. The adjusting items for the nine months ended September 30, 2017 were:
Recognized in the second quarter of 2017
| · | $4.8 million ($4.8 million after tax, or $0.04 per diluted share) of stock option compensation expense related to the accelerated vesting of certain IronPlanet stock options assumed as part of the Merger |
| · | $9.1 million ($6.6 million after tax, or $0.06 per diluted share) of acquisition and finance structure advisory costs, |
| · | $1.4 million ($0.9 million after tax, or $0.01 per diluted share) of severance and retention costs in a corporate reorganization that followed the Merger |
| · | An $8.9 million ($6.6 million after tax, or $0.06 per diluted share) impairment loss recognized on various technology assets |
Recognized in the first quarter of 2017
| · | A $2.3 million (or $0.02 per diluted share) charge related to the change in uncertain tax provisions |
The adjusting items for the three and nine months ended September 30, 2016 were:
Recognized in the third quarter of 2016
| · | A $28.2 million ($26.4 million after tax, or $0.25 per diluted share) impairment loss on EquipmentOne reporting unit goodwill and customer relationships |
| Ritchie Bros. | 84 |
There were no first or second quarter 2016 adjusting items.
The following tables present our adjusted EBITDA (non-GAAP measure) and adjusted EBITDA margin (non-GAAP measure) results for the three and nine months, respectively, ended September 30, 2017 and 2016, as well as reconcile those metrics to net income (loss), revenues, and net income margin, which are the most directly comparable GAAP measures in, or calculated from, our consolidated income statements:
| (in U.S. $000's) | Three months ended September 30, | |||||||||||
| Change | ||||||||||||
| 2017 | 2016 | 2017
over 2016 | ||||||||||
| Net income (loss) | $ | 10,323 | $ | (5,000 | ) | 306 | % | |||||
| Add: depreciation and amortization expenses | 14,837 | 10,196 | 46 | % | ||||||||
| Less: interest income | (517 | ) | (369 | ) | 40 | % | ||||||
| Add: interest expense | 10,558 | 934 | 1030 | % | ||||||||
| Add: current income tax expense | 1,402 | 9,652 | (85 | )% | ||||||||
| Less: deferred income tax recovery | (4,760 | ) | (2,472 | ) | 93 | % | ||||||
| Pre-tax adjusting items: | ||||||||||||
| Impairment loss | - | 28,243 | (100 | )% | ||||||||
| Adjusted EBITDA (non-GAAP measure) | 31,843 | 41,184 | (23 | )% | ||||||||
| Revenues | $ | 141,047 | $ | 128,876 | 9 | % | ||||||
| Net income margin | 7.3 | % | -3.9 | % | 1120 | bps | ||||||
| Adjusted EBITDA margin (non-GAAP measure) | 22.6 | % | 32.0 | % | -940 | bps | ||||||
| Ritchie Bros. | 85 |
| (in U.S. $000's) | Nine months ended September 30, | |||||||||||
| Change | ||||||||||||
| 2017 | 2016 | 2017
over 2016 | ||||||||||
| Net income | $ | 38,469 | $ | 65,585 | (41 | )% | ||||||
| Add: depreciation and amortization expenses | 37,047 | 30,560 | 21 | % | ||||||||
| Less: interest income | (2,459 | ) | (1,354 | ) | 82 | % | ||||||
| Add: interest expense | 27,311 | 3,357 | 714 | % | ||||||||
| Add: current income tax expense | 17,565 | 35,767 | (51 | )% | ||||||||
| Add: deferred income tax recovery | (9,583 | ) | (5,838 | ) | 64 | % | ||||||
| Pre-tax adjusting items: | ||||||||||||
| Accelerated vesting of assumed options | 4,752 | - | 100 | % | ||||||||
| Acquisition and finance structure advisory | 9,063 | - | 100 | % | ||||||||
| Severance and retention | 1,447 | - | 100 | % | ||||||||
| Impairment loss | 8,911 | 28,243 | (68 | )% | ||||||||
| Adjusted EBITDA (non-GAAP measure) | 132,523 | 156,320 | (15 | )% | ||||||||
| Revenues | $ | 431,732 | $ | 419,626 | 3 | % | ||||||
| Net income margin | 8.9 | % | 15.6 | % | -670 | bps | ||||||
| Adjusted EBITDA margin (non-GAAP measure) | 30.7 | % | 37.3 | % | -660 | bps | ||||||
There were no adjusting items recognized in the first or third quarters of 2017. The adjusting items for the nine months ended September 30, 2017 were:
Recognized in the second quarter of 2017
| · | $4.8 million ($4.8 million after tax, or $0.04 per diluted share) of stock option compensation expense related to the accelerated vesting of certain IronPlanet stock options assumed as part of the Merger |
| · | $9.1 million ($6.6 million after tax, or $0.06 per diluted share) of acquisition and finance structure advisory costs |
| · | $1.4 million ($0.9 million after tax, or $0.01 per diluted share) of severance and retention costs in a corporate reorganization that followed the Merger |
| · | An $8.9 million ($6.6 million after tax, or $0.06 per diluted share) impairment loss recognized on various technology assets |
The adjusting items for the three and nine months ended September 30, 2016 were:
Recognized in the third quarter of 2016
| · | A $28.2 million ($26.4 million after tax, or $0.25 per diluted share) impairment loss on EquipmentOne reporting unit goodwill and customer relationships |
There were no first or second quarter 2016 adjusting items.
| Ritchie Bros. | 86 |
The following table presents our adjusted net debt/adjusted EBITDA (non-GAAP measures) results on a trailing 12-month basis, as well as reconciles that metric to debt, cash and cash equivalents, net income, and debt as a multiple of net income, which are the most directly comparable GAAP measures in, or calculated from, our consolidated financial statements:
| (in U.S. $ millions) | As at and for the 12 months ended September 30, | |||||||||||
| Change | ||||||||||||
| 2017 | 2016 | 2017 over 2016 | ||||||||||
| Short-term debt | $ | 8.6 | $ | 39.0 | (78 | )% | ||||||
| Long-term debt | 817.9 | 101.6 | 705 | % | ||||||||
| Debt | 826.5 | 140.6 | 488 | % | ||||||||
| Less: cash and cash equivalents | (224.5 | ) | (231.0 | ) | (3 | )% | ||||||
| Adjusted net debt (non-GAAP measure) | 602.0 | (90.4 | ) | 766 | % | |||||||
| Net income | $ | 66.4 | $ | 113.0 | (41 | )% | ||||||
| Add: depreciation and amortization expenses | 47.3 | 41.2 | 15 | % | ||||||||
| Less: interest income | (3.0 | ) | (1.9 | ) | 58 | % | ||||||
| Add: interest expense | 29.5 | 4.5 | 556 | % | ||||||||
| Add: current income tax expense | 22.1 | 39.4 | (44 | )% | ||||||||
| Less: deferred income tax recovery | (7.1 | ) | (6.2 | ) | 15 | % | ||||||
| Pre-tax adjusting items: | ||||||||||||
| Accelerated vesting of assumed options | 4.8 | - | 100 | % | ||||||||
| Acquisition and finance structure advisory | 9.1 | - | 100 | % | ||||||||
| Severance and retention | 1.4 | - | 100 | % | ||||||||
| Debt extinguishment costs | 6.8 | - | 100 | % | ||||||||
| Gain on sale of excess property | - | (8.4 | ) | (100 | )% | |||||||
| Impairment loss | 8.9 | 28.2 | (68 | )% | ||||||||
| Adjusted EBITDA (non-GAAP measure) | $ | 186.2 | $ | 209.8 | (11 | )% | ||||||
| Debt/net income | 12.4 | x | 1.2 | x | 933 | % | ||||||
| Adjusted net debt/adjusted EBITDA | ||||||||||||
| (non-GAAP measure) | 3.2 | x | -0.4 | x | 900 | % | ||||||
The adjusting items for the 12 months ended September 30, 2017 were:
Recognized in the second quarter of 2017
| · | $4.8 million ($4.8 million after tax, or $0.04 per diluted share) of stock option compensation expense related to the accelerated vesting of certain IronPlanet stock options assumed as part of the Merger |
| · | $9.1 million ($6.6 million after tax, or $0.06 per diluted share) of acquisition and finance structure advisory costs |
| · | $1.4 million ($0.9 million after tax, or $0.01 per diluted share) of severance and retention costs in a corporate reorganization that followed the Merger |
| · | An $8.9 million ($6.6 million after tax, or $0.06 per diluted share) impairment loss recognized on various technology assets |
Recognized in the fourth quarter of 2016
| · | A $6.8 million ($5.0 million after tax, or $0.05 per diluted share) charge related to the early termination of pre-existing debt |
There were no adjusting items recognized in the first or third quarters of 2017.
| Ritchie Bros. | 87 |
The adjusting items for the 12 months ended September 30, 2016 were:
Recognized in the third quarter of 2016
| · | A $28.2 million ($26.4 million after tax, or $0.25 per diluted share) impairment loss on EquipmentOne reporting unit goodwill and customer relationships |
Recognized in the fourth quarter of 2015
| · | A $8.4 million ($7.3 million after tax, or $0.07 per diluted share) gain on the sale of excess property in Edmonton, Canada |
There were no adjusting items for the first or second quarters of 2016.
The following table presents our OFCF (non-GAAP measure) results on a trailing 12-month basis, and reconciles that metric to cash provided by operating activities and net capital spending, which are the most directly comparable GAAP measures in, or calculated from, our consolidated statements of cash flows:
| (in U.S. $ millions) | 12 months ended September 30, | |||||||||||
| Change | ||||||||||||
| 2017 | 2016 | 2017 over 2016 | ||||||||||
| Cash provided by operating activities | $ | 113.4 | $ | 144.9 | (22 | )% | ||||||
| Property, plant and equipment additions | 14.4 | 22.0 | (35 | )% | ||||||||
| Intangible asset additions | 26.0 | 16.6 | 57 | % | ||||||||
| Proceeds on disposition of property plant and equipment | (6.9 | ) | (15.2 | ) | (55 | )% | ||||||
| Net capital spending | $ | 33.5 | $ | 23.4 | 43 | % | ||||||
| OFCF (non-GAAP measure) | $ | 79.9 | $ | 121.5 | (34 | )% | ||||||
| Ritchie Bros. | 88 |
The following table presents our adjusted net income attributable to stockholders (non-GAAP measure) and adjusted dividend payout ratio (non-GAAP measure) results on a trailing 12-month basis, and reconciles those metrics to dividends paid to stockholders, net income attributable to stockholders, and dividend payout ratio, which are the most directly comparable GAAP measures in, or calculated from, our consolidated financial statements:
| (in U.S. $ millions) | 12 months ended September 30, | |||||||||||
| Change | ||||||||||||
| 2017 | 2016 | 2017 over 2016 | ||||||||||
| Dividends paid to stockholders | $ | 72.7 | $ | 69.5 | 5 | % | ||||||
| Net income attributable to stockholders | $ | 66.1 | $ | 110.5 | (40 | )% | ||||||
| Pre-tax adjusting items: | ||||||||||||
| Accelerated vesting of assumed options | 4.8 | - | 100 | % | ||||||||
| Acquisition and finance structure advisory | 9.1 | - | 100 | % | ||||||||
| Severance and retention | 1.4 | - | 100 | % | ||||||||
| Debt extinguishment costs | 6.8 | - | 100 | % | ||||||||
| Gain on sale of excess property | - | (8.4 | ) | (100 | )% | |||||||
| Impairment loss | 8.9 | 28.2 | (68 | )% | ||||||||
| Current income tax effect of adjusting items: | ||||||||||||
| Acquisition and finance structure advisory | (2.4 | ) | - | 100 | % | |||||||
| Severance and retention | (0.6 | ) | - | 100 | % | |||||||
| Debt extinguishment costs | (1.8 | ) | - | 100 | % | |||||||
| Gain on sale of excess property | - | 1.1 | (100 | )% | ||||||||
| Deferred income tax effect of adjusting items: | ||||||||||||
| Impairment loss | (2.4 | ) | (1.8 | ) | 33 | % | ||||||
| Current income tax adjusting item: | ||||||||||||
| Change in uncertain tax provision | 2.3 | - | 100 | % | ||||||||
| Deferred tax adjusting item: | ||||||||||||
| Tax loss utilization | - | (7.9 | ) | (100 | )% | |||||||
| Adjusted net income attributable to stockholders (non-GAAP measure) | $ | 92.2 | $ | 121.8 | (24 | )% | ||||||
| Dividend payout ratio | 110.0 | % | 62.9 | % | 4710 | bps | ||||||
| Adjusted dividend payout ratio | ||||||||||||
| (non-GAAP measure) | 78.9 | % | 57.1 | % | 2180 | bps | ||||||
The adjusting items for the 12 months ended September 30, 2017 were:
Recognized in the second quarter of 2017
| · | $4.8 million ($4.8 million after tax, or $0.04 per diluted share) of stock option compensation expense related to the accelerated vesting of certain IronPlanet stock options assumed as part of the Merger |
| · | $9.1 million ($6.6 million after tax, or $0.06 per diluted share) of acquisition and finance structure advisory costs |
| · | $1.4 million ($0.9 million after tax, or $0.01 per diluted share) of severance and retention costs in a corporate reorganization that followed the Merger |
| · | An $8.9 million ($6.6 million after tax, or $0.06 per diluted share) impairment loss recognized on various technology assets |
| Ritchie Bros. | 89 |
Recognized in the first quarter of 2017
| · | A $2.3 million (or $0.02 per diluted share) charge related to the change in uncertain tax provisions |
Recognized in the fourth quarter of 2016
| · | A $6.8 million ($5.0 million after tax, or $0.05 per diluted share) charge related to the early termination of pre-existing debt |
There were no adjusting items recognized in the third quarter of 2017.
The adjusting items for the 12 months ended September 30, 2016 were:
Recognized in the third quarter of 2016
| · | A $28.2 million ($26.4 million after tax, or $0.25 per diluted share) impairment loss on EquipmentOne reporting unit goodwill and customer relationships |
Recognized in the fourth quarter of 2015
| · | A $8.4 million ($7.3 million after tax, or $0.07 per diluted share gain on the sale of excess property in Edmonton, Canada |
| · | A $7.9 million (or $0.07 per diluted share) tax saving generated by tax loss utilization |
There were no first or second quarter 2016 adjusting items.
| Ritchie Bros. | 90 |
The following table presents our ROIC (non-GAAP measure) results on a trailing 12-month basis, and reconciles that metric to net income attributable to stockholders, long-term debt, stockholders’ equity, and return on average invested capital, which are the most directly comparable GAAP measures in, or calculated from, our consolidated financial statements:
| (in U.S. $ millions) | As at and for the 12 months ended September 30, | |||||||||||
| Change | ||||||||||||
| 2017 | 2016 | 2017 over 2016 | ||||||||||
| Net income attributable to stockholders | $ | 66.1 | $ | 110.5 | (40 | )% | ||||||
| Pre-tax adjusting items: | ||||||||||||
| Accelerated vesting of assumed options | 4.8 | - | 100 | % | ||||||||
| Acquisition and finance structure advisory | 9.1 | - | 100 | % | ||||||||
| Severance and retention | 1.4 | - | 100 | % | ||||||||
| Debt extinguishment costs | 6.8 | - | 100 | % | ||||||||
| Gain on sale of excess property | - | (8.4 | ) | (100 | )% | |||||||
| Impairment loss | 8.9 | 28.2 | (68 | )% | ||||||||
| Current income tax effect of adjusting items: | ||||||||||||
| Acquisition and finance structure advisory | (2.4 | ) | - | 100 | % | |||||||
| Severance and retention | (0.6 | ) | - | 100 | % | |||||||
| Debt extinguishment costs | (1.8 | ) | - | 100 | % | |||||||
| Gain on sale of excess property | - | 1.1 | (100 | )% | ||||||||
| Deferred income tax effect of adjusting items: | ||||||||||||
| Impairment loss | (2.4 | ) | (1.8 | ) | 33 | % | ||||||
| Current income tax adjusting item: | ||||||||||||
| Change in uncertain tax provision | 2.3 | - | 100 | % | ||||||||
| Deferred tax adjusting item: | ||||||||||||
| Tax loss utilization | - | (7.9 | ) | (100 | )% | |||||||
| Adjusted net income attributable to stockholders (non-GAAP measure) | $ | 92.2 | $ | 121.8 | (24 | )% | ||||||
| Opening long-term debt | $ | 101.6 | $ | 100.6 | 1 | % | ||||||
| Ending long-term debt | 817.9 | 101.6 | 705 | % | ||||||||
| Average long-term debt | $ | 459.8 | $ | 101.1 | 355 | % | ||||||
| Opening stockholders' equity | $ | 689.6 | $ | 686.3 | - | |||||||
| Ending stockholders' equity | 714.7 | 689.6 | 4 | % | ||||||||
| Average stockholders' equity | 702.2 | 688.0 | 2 | % | ||||||||
| Average invested capital | $ | 1,162.0 | $ | 789.1 | 47 | % | ||||||
| Return on average invested capital(1) | 5.7 | % | 14.0 | % | -830 | bps | ||||||
| ROIC (non-GAAP measure)(2) | 7.9 | % | 15.4 | % | -750 | bps | ||||||
| (1) | Calculated as net income attributable to stockholders divided by average invested capital. |
| (2) | Calculated as adjusted net income attributable to stockholders (non-GAAP measure) divided by average invested capital. |
| Ritchie Bros. | 91 |
The adjusting items for the 12 months ended September 30, 2017 were:
Recognized in the second quarter of 2017
| · | $4.8 million ($4.8 million after tax, or $0.04 per diluted share) of stock option compensation expense related to the accelerated vesting of certain IronPlanet stock options assumed as part of the Merger |
| · | $9.1 million ($6.6 million after tax, or $0.06 per diluted share) of acquisition and finance structure advisory costs |
| · | $1.4 million ($0.9 million after tax, or $0.01 per diluted share) of severance and retention costs in a corporate reorganization that followed the Merger |
| · | An $8.9 million ($6.6 million after tax, or $0.06 per diluted share) impairment loss recognized on various technology assets |
Recognized in the first quarter of 2017
| · | A $2.3 million (or $0.02 per diluted share) charge related to the change in uncertain tax provisions |
Recognized in the fourth quarter of 2016
| · | A $6.8 million ($5.0 million after tax, or $0.05 per diluted share) charge related to the early termination of pre-existing debt |
There were no adjusting items recognized in the third quarter of 2017.
The adjusting items for the 12 months ended September 30, 2016 were:
Recognized in the third quarter of 2016
| · | A $28.2 million ($26.4 million after tax, or $0.25 per diluted share) impairment loss on EquipmentOne reporting unit goodwill and customer relationships |
Recognized in the fourth quarter of 2015
| · | A $8.4 million ($7.3 million after tax, or $0.07 per diluted share gain on the sale of excess property in Edmonton, Canada |
| · | A $7.9 million (or $0.07 per diluted share) tax saving generated by tax loss utilization |
There were no first or second quarter 2016 adjusting items.
There were no adjustments to debt at September 30, 2017 or 2016 as there was no long-term debt held in escrow at those reporting dates.
| ITEM 3: | QUANTITATIVE AND QUALITATIVE DISCLOSURES ABOUT MARKET RISK |
There have been no material changes to the Company’s market risk during the three months ended September 30, 2017 from those disclosed in the Company’s Annual Report on Form 10-K for the year ended December 31, 2016, which is available on our website at www.rbauction.com, on EDGAR at www.sec.gov, or on SEDAR at www.sedar.com.
| ITEM 4: | CONTROLS AND PROCEDURES |
Disclosure Controls and Procedures
Management of the Company, including the Chief Executive Officer (“CEO”) and Chief Financial Officer (“CFO”), have evaluated the effectiveness of the Company’s disclosure controls and procedures as at September 30, 2017. The term “disclosure controls and procedures” means controls and other procedures established by the Company that are designed to ensure that information required to be disclosed by the Company in the reports that it files or submits under the Exchange Act is recorded, processed, summarized and reported within the time periods specified in the Securities and Exchange Commission’s (“SEC’s”) rules and forms.
| Ritchie Bros. | 92 |
Disclosure controls and procedures include, without limitation, controls and procedures designed to ensure that information required to be disclosed by the Company in the reports that it files or submits under the Exchange Act is accumulated and communicated to the Company’s management, including its CEO and CFO, as appropriate, to allow timely decisions regarding required disclosure.
Based upon their evaluation of the Company’s disclosure controls and procedures, the CEO and the CFO concluded that the disclosure controls are effective to provide reasonable assurance that information required to be disclosed by the Company in the reports that it files or submits under the Exchange Act is accumulated and communicated to management, including the CEO and CFO, as appropriate, to allow timely decisions regarding required disclosure and are effective to provide reasonable assurance that such information is recorded, processed, summarized and reported within the time periods specified by the SEC’s rules and forms.
The Company closed the acquisition of IronPlanet on May 31, 2017. As at and for the nine months ended September 30, 2017, IronPlanet’s total assets and revenues constituted 40% and 8%, respectively, of the Company’s consolidated total assets and revenues as shown on the Company’s consolidated financial statements. As the Merger occurred in the second quarter of 2017, management excluded the internal control over financial reporting of IronPlanet from the scope of its assessment of the effectiveness of the Company’s disclosure controls and procedures. This exclusion is in accordance with the general guidance issued by the Staff of the Securities and Exchange Commission that an assessment of a recently-acquired business may be omitted from the scope in the year of acquisition, if specified conditions are satisfied.
The Company, including its CEO and CFO, does not expect that its internal controls and procedures will prevent or detect all error and all fraud. A control system, no matter how well conceived or operated, can provide only reasonable, not absolute, assurance that the objectives of the control system are met.
Changes in Internal Control over Financial Reporting
Management, with the participation of the CEO and CFO, concluded that there were no changes in the Company’s internal control over financial reporting during the quarter ended September 30, 2017 that have materially affected, or are reasonably likely to materially affect, the Company’s internal control over financial reporting.
| Ritchie Bros. | 93 |
| ITEM 1: | LEGAL PROCEEDINGS |
The Company has no material legal proceedings pending, other than ordinary routine litigation incidental to the business, and management does not know of any material proceedings contemplated by governmental authorities.
| ITEM 1A: | RISK FACTORS |
Our business is subject to a number of risks and uncertainties, and our past performance is no guarantee of our performance in future periods. In addition to the other information set forth in this Quarterly Report on Form 10-Q, you should carefully consider the risks and uncertainties discussed in “Part I, Item 1A: Risk Factors” of our Annual Report on Form 10-K for the year ended December 31, 2016, which is available on our website at www.rbauction.com, on EDGAR at www.sec.gov, or on SEDAR at www.sedar.com, before purchasing our common shares. Our business could also be affected by additional risks not currently known to us or that we currently deem to be immaterial. If any of the risks occur, our business, financial condition and results of operations could materially suffer. As a result, the trading price of our common shares could decline, and you may lose all or part of your investment.
Management anticipated that the acquisition of IronPlanet would result in a change to the Company’s risk factors. As such, during the fourth quarter of 2016, the Company’s risk factors were revised to apply to our post-Merger, combined business; particularly risk factors associated with the acquisition, financing, and integration of IronPlanet. These revised risk factors were disclosed in “Part I, Item 1A: Risk Factors” of our Annual Report on Form 10-K for the year ended December 31, 2016. The IronPlanet acquisition closed on May 31, 2017. There were no material changes in risk factors during the three months ended September 30, 2017.
| ITEM 2: | UNREGISTERED SALES OF EQUITY SECURITIES AND USE OF PROCEEDS |
As previously disclosed at the Company’s Annual and Special Meeting of Shareholders (the “Meeting”) held on May 1, 2017, the shareholders ratified, confirmed and approved certain amendments to the Company’s 2013 Performance Share Unit Plan and the Sign-On Grant Agreement (together, the “2013 PSU Plan Amendment”) approved and adopted by the Board in February of 2017, including provisions permitting the Company to pay vested CEO SOG PSUs under the Sign-On Grant Agreement either in cash or by issuing common shares, as opposed to payment only in cash, and setting the aggregate maximum number of the Company’s common shares reserved for issuance pursuant to the Sign-On Grant Agreement at 150,000 common shares. Immediately following the Meeting on May 1, 2017, the Company and Mr. Saligram executed and entered into the 2013 PSU Plan Amendment.
The Sign-On Grant Agreement had provided for the grant to Mr. Saligram of approximately 102,375 CEO SOG PSUs, which became eligible for vesting at a rate of 25% per year starting on the second anniversary of the grant date, with the actual number of units to vest to be determined based on achievement of pre-established performance criteria as set out therein. Additional terms, conditions, privileges and restrictions under the Sign-On Grant Agreement, as amended, are further described in the Company’s Schedule 14A proxy statement filed with the Securities and Exchange Commission on March 20, 2017.
The second tranche of the CEO SOG PSUs vested during the third quarter of 2017, pursuant to which Mr. Saligram was determined to be entitled to a payment, based on the Company’s absolute total shareholder return14 performance over the applicable period, net of applicable taxes, of $91,000. On September 5, 2017, the Company satisfied this payment obligation by issuing to Mr. Saligram 3,211 common shares in respect of the vested CEO SOG PSUs.
| 14 | Total shareholder return represents the total Company share price appreciation over a three-year period, including dividends per share distributed, where share price is based on the NYSE-trading price and dividends paid per share in U.S. dollars. |
| Ritchie Bros. | 94 |
The Company did not receive any proceeds from the execution and entering into the 2013 PSU Plan Amendment. The Company did not and will not receive any proceeds from the vesting of CEO SOG PSUs or the issuance of common shares as payment for vested CEO SOG PSUs under the Sign-On Grant Agreement. The CEO SOG PSUs were issued for compensatory purposes. The common shares issued as payment upon vesting of the second tranche of the CEO SOG PSUs were issued for compensatory purposes. Any common shares that will be issued as payment upon vesting of the third and fourth tranches of the CEO SOG PSUs, will also be issued for compensatory purposes.
To the extent that the execution and entering into the 2013 PSU Plan Amendment, the vesting of CEO SOG PSUs or any issuance of common shares as payment for vested CEO SOG PSUs under the Sign-On Grant Agreement constitutes a “sale” of securities, the Company relies on the exemption under Section 4(a)(2) of the Securities Act. Section 4(a)(2) generally provides an exemption from registration for transactions by an issuer not involving any public offering. Mr. Saligram is the Company’s CEO and an accredited investor as defined in Rule 501 under the Securities Act. No sales involved the use of an underwriter and no commissions were paid in connection with the sale of any securities.
| ITEM 5: | OTHER INFORMATION |
On November 8, 2017, the Board of Directors of the Company amended and restated the Senior Executive Restricted Share Unit Plan and the Employee Restricted Share Unit Plan (together, the “RSU Plans”, and the amendment and restatement of the RSU Plans, the “amendments”). The amendments of the RSU Plans generally clarify certain tax and other provisions of the RSU Plans and, subject to shareholder approval, permit the settlement of vested RSUs, in addition to the existing cash settlement option, by issuance or delivery pursuant to open market purchases of up to an aggregate of 300,000 common shares of the Company for both RSU Plans. The amendments do not affect any RSUs outstanding prior to the date of such amendments, and no common shares of the Company will be issued or delivered in respect of vested RSUs absent shareholder approval.
| Ritchie Bros. | 95 |
| ITEM 6: | EXHIBITS |
Exhibits
The exhibits listed in below are filed as part of this Quarterly Report on Form 10-Q and incorporated herein by reference.
| Ritchie Bros. | 96 |
Pursuant to the requirements of the Securities Exchange Act of 1934, the registrant has duly caused this report to be signed on its behalf by the undersigned, thereunto duly authorized.
| RITCHIE BROS. AUCTIONEERS INCORPORATED | ||
| Dated: November 9, 2017 | By: | /s/ Ravichandra K. Saligram |
| Ravichandra K. Saligram | ||
| Chief Executive Officer | ||
| Dated: November 9, 2017 | By: | /s/ Sharon R. Driscoll |
| Sharon R. Driscoll | ||
| Chief Financial Officer | ||
| Ritchie Bros. | 97 |