Attached files
| file | filename |
|---|---|
| EX-10.11 - EXHIBIT 10.11 - RITCHIE BROS AUCTIONEERS INC | tv486592_ex10-11.htm |
| EX-32.2 - EXHIBIT 32.2 - RITCHIE BROS AUCTIONEERS INC | tv486592_ex32-2.htm |
| EX-32.1 - EXHIBIT 32.1 - RITCHIE BROS AUCTIONEERS INC | tv486592_ex32-1.htm |
| EX-31.2 - EXHIBIT 31.2 - RITCHIE BROS AUCTIONEERS INC | tv486592_ex31-2.htm |
| EX-31.1 - EXHIBIT 31.1 - RITCHIE BROS AUCTIONEERS INC | tv486592_ex31-1.htm |
| EX-23.1 - EXHIBIT 23.1 - RITCHIE BROS AUCTIONEERS INC | tv486592_ex23-1.htm |
| EX-21.1 - EXHIBIT 21.1 - RITCHIE BROS AUCTIONEERS INC | tv486592_ex21-1.htm |
| EX-10.21 - EXHIBIT 10.21 - RITCHIE BROS AUCTIONEERS INC | tv486592_ex10-21.htm |
| EX-10.10 - EXHIBIT 10.10 - RITCHIE BROS AUCTIONEERS INC | tv486592_ex10-10.htm |
| EX-10.8 - EXHIBIT 10.8 - RITCHIE BROS AUCTIONEERS INC | tv486592_ex10-8.htm |
| EX-10.7 - EXHIBIT 10.7 - RITCHIE BROS AUCTIONEERS INC | tv486592_ex10-7.htm |
UNITED STATES
SECURITIES AND EXCHANGE COMMISSION
Washington, D.C. 20549
FORM 10-K
ANNUAL REPORT PURSUANT TO SECTION 13 OR 15(d) OF THE
SECURITIES EXCHANGE ACT OF 1934
For the fiscal year ended December 31, 2017
Commission file number: 001-13425

Ritchie Bros. Auctioneers Incorporated
(Exact Name of Registrant as Specified in its Charter)
| Canada | N/A | |
| (State or other jurisdiction of incorporation or organization) | (I.R.S. Employer Identification No.) | |
| 9500 Glenlyon Parkway | ||
| Burnaby, British Columbia, Canada V5J 0C6 | (778) 331-5500 | |
| (Address of Principal Executive Offices) | (Registrant’s Telephone Number, including Area Code) |
Securities registered pursuant to Section 12(b) of the Act:
| Title of Each Class | Name of Exchange on Which Registered | |
| Common Shares | New York Stock Exchange |
Securities registered pursuant to Section 12(g) of the Act:
None
Indicate by check mark if the registrant is a well-known seasoned issuer, as defined in Rule 405 of the Securities Act. Yes þ No ¨
Indicate by check mark if the registrant is not required to file reports pursuant to Section 13 or Section 15(d) of the Act. Yes ¨ No þ
Indicate by check mark whether the registrant (1) has filed all reports required to be filed by Section 13 or 15(d) of the Securities Exchange Act of 1934 during the preceding 12 months (or for such shorter period that the registrant was required to file such reports), and (2) has been subject to such filing requirements for the past 90 days. Yes þ No ¨
Indicate by check mark whether the registrant has submitted electronically and posted on its corporate Web site, if any, every Interactive Data File required to be submitted and posted pursuant to Rule 405 of Regulation S-T (§ 232.405 of this chapter) during the preceding 12 months (or for such shorter period that the registrant was required to submit and post such files). Yes þ No ¨
Indicate by check mark if disclosure of delinquent filers pursuant to Item 405 of Regulation S-K is not contained herein, and will not be contained, to the best of the registrant’s knowledge, in definitive proxy or information statements incorporated by reference on Part III of this Form 10-K or any amendment to this Form 10-K. ¨
Indicate by check mark whether the registrant is a large accelerated filer, an accelerated filer, a non-accelerated filer, smaller reporting company, or an emerging growth company. See the definitions of “large accelerated filer,” “accelerated filer,” “smaller reporting company,” and “emerging growth company” in Rule 12b-2 of the Exchange Act. (Check one):
| Large accelerated filer þ | Accelerated filer ¨ | Non-accelerated filer ¨ | Smaller reporting company ¨ |
| (Do not check if a smaller reporting company) |
Emerging growth company ¨ |
If an emerging growth company, indicate by check mark if the registrant has elected not to use the extended transition period for complying with any new or revised financial accounting standards provided pursuant to Section 13(a) of the Exchange Act. ¨
Indicate by check mark whether the registrant is a shell company (as defined in Rule 12b-2 of the Exchange Act). Yes ¨ No þ
At June 30, 2017 (the last business day of the registrant’s most recently completed second fiscal quarter), the aggregate market value of the registrant’s common shares held by non-affiliates of the registrant (assuming for these purposes, but without conceding, that all executive officers and Directors are "affiliates" of the registrant) was approximately $3,074,207,007. The number of common shares of the registrant outstanding as of February 23, 2018, was 107,328,067.
Documents Incorporated by Reference
Certain portions of the registrant’s definitive proxy statement to be filed with the Securities and Exchange Commission (“SEC”) pursuant to Regulation 14A not later than 120 days after the registrant's fiscal year ended December 31, 2017, in connection with the registrant’s 2018 Annual and Special Meeting of Shareholders, are incorporated herein by reference into Part III of this Annual Report on Form 10-K.
RITCHIE BROS. AUCTIONEERS INCORPORATED
FORM 10-K
For the year ended December 31, 2017
INDEX
Cautionary Note Regarding Forward-Looking Statements
The information discussed in this Annual Report on Form 10-K of Ritchie Bros. Auctioneers Incorporated (“Ritchie Bros.”, the “Company”, “we”, or “us”) includes “forward-looking statements” within the meaning of Section 27A of the Securities Act of 1933 (the “Securities Act”) and Section 21E of the Securities Exchange Act of 1934 (the “Exchange Act”) and Canadian securities laws. These statements are based on our current expectations and estimates about our business and markets, and include, among others, statements relating to:
| · | our future strategy, objectives, targets, projections, performance, and key enablers; |
| · | our ability to drive shareholder value; |
| · | market opportunities; |
| · | our internet initiatives and the level of participation in our auctions by internet bidders, and the success of IronPlanet, Marketplacee, and our other online marketplaces; |
| · | our ability to grow our businesses, acquire new customers, enhance our sector reach, drive geographic depth, and scale our operations; |
| · | the impact of our initiatives, services, investments, and acquisitions on us and our customers; |
| · | the acquisition or disposition of properties; |
| · | our ability to integrate our acquisitions; |
| · | our ability to add new business and information solutions, including, among others, our ability to maximize and integrate technology to enhance our existing services and support additional value-added service offerings; |
| · | the supply trend of equipment in the market and the anticipated price environment for late model equipment, as well as the resulting effect on our business and Gross Transaction Value (“GTV”) (defined under “Part I, Item 1: Business” of this Annual Report on Form 10-K); |
| · | fluctuations in our quarterly revenues and operating performance resulting from the seasonality of our business; |
| · | our compliance with all laws, rules, regulations, and requirements that affect our business; |
| · | effects of various economic, financial, industry, and market conditions or policies, including the supply and demand for property, equipment, or natural resources; |
| · | the behavior of equipment pricing; |
| · | the relative percentage of GTV represented by straight commission or underwritten (guarantee and inventory) contracts, and its impact on revenues and profitability; |
| · | our Revenue Rates (described under “Part II, Item 7: Management’s Discussion and Analysis of Financial Condition and Results of Operations” of this Annual Report on Form 10-K), the sustainability of those rates, and the seasonality of GTV and revenues; |
| · | the projected increase to our fee revenues as a result of the harmonization of our fee structure; |
| · | our future capital expenditures and returns on those expenditures; |
| · | the effect of any currency exchange and interest rate fluctuations on our results of operations; |
| · | the grant and satisfaction of equity awards pursuant to our compensation plans; |
| · | any future declaration and payment of dividends, including the tax treatment of any such dividends; |
| · | financing available to us, our ability to refinance borrowings, and the sufficiency of our working capital to meet our financial needs; and |
| · | our ability to satisfy our present operating requirements and fund future growth through existing working capital and credit facilities. |
| Ritchie Bros. | 1 |
Forward-looking statements are typically identified by such words as “aim”, “anticipate”, “believe”, “could”, “continue”, “estimate”, “expect”, “intend”, “may”, “ongoing”, “plan”, “potential”, “predict”, “will”, “should”, “would”, “could”, “likely”, “generally”, “future”, “period to period”, “long-term”, or the negative of these terms, and similar expressions intended to identify forward-looking statements. Our forward-looking statements are not guarantees of future performance and involve risks, uncertainties and assumptions that are difficult to predict.
While we have not described all potential risks related to our business and owning our common shares, the important factors discussed in “Part I, Item 1A: Risk Factors” of this Annual Report on Form 10-K for the year ended December 31, 2017 are among those that we consider may affect our performance materially or could cause our actual financial and operational results to differ significantly from our expectations. Except as required by applicable securities law and regulations of relevant securities exchanges, we do not intend to update publicly any forward-looking statements, even if our expectations have been affected by new information, future events or other developments. You should consider our forward-looking statements in light of the factors listed or referenced under “Risk Factors” herein and other relevant factors.
| Ritchie Bros. | 2 |
| ITEM 1: | BUSINESS |
Company Overview
Ritchie Bros. Auctioneers Incorporated (“Ritchie Bros.”, the “Company”, “we”, or “us”) (NYSE & TSX: RBA) is a world leader in asset management and disposition of used industrial equipment and other durable assets, selling $4.5 billion of used equipment and other assets during 2017. Our expertise, unprecedented global reach, market insight, and trusted portfolio of brands provide us with a unique position in the used equipment market. We primarily sell used equipment for our customers through live, unreserved auctions at 45 auction sites worldwide, which are simulcast online to reach a global bidding audience. On May 31, 2017, we acquired IronPlanet Holdings, Inc. (“IronPlanet”) for $776.5 million, a leading online marketplace for heavy equipment and other durable assets. Between its inception in 1999 and 2016, IronPlanet sold over $5 billion of used heavy equipment online and registered more than 1.5 million users worldwide. These complementary used equipment brand solutions, together with Marketplacee, our online marketplace that supports reserved pricing, provide different value propositions to equipment owners and allow us to meet the needs and preferences of a wide spectrum of equipment sellers and buyers. In the past three years, we have also added a private brokerage service (Ritchie Bros. Private Treaty) and an online listing service (Mascus).
Through our unreserved auctions, online marketplaces, and private brokerage services, we sell a broad range of used and unused equipment, including earthmoving equipment, truck trailers, government surplus, oil and gas equipment and other industrial assets. Construction and heavy machinery comprise the majority of the equipment sold through our multiple brand solutions. Customers selling equipment through our sales channels include end users (such as construction companies), equipment dealers, original equipment manufacturers (“OEMs”) and other equipment owners (such as rental companies). Our customers participate in a variety of sectors, including heavy construction, transportation, agriculture, energy, and mining.
We operate globally with locations in more than 20 countries, including the United States, Canada, Australia, the United Arab Emirates, and the Netherlands, and employ more than 2,100 full time employees worldwide.
History and development of our business
Ritchie Bros. Auctioneers Incorporated was amalgamated on December 12, 1997 under, and is governed by, the Canada Business Corporation Act.
Ritchie Bros. was founded in 1958 in Kelowna, British Columbia, Canada. We held our first major industrial auction in 1963, selling over $600,000 worth of construction equipment in Radium, British Columbia. By 1970, we had established operations in the United States and held our first American sale in Beaverton, Oregon. In 1987, we held our first European auctions in Liverpool, the United Kingdom, and Rotterdam, the Netherlands. Our first Australian auction was held in 1990 and was followed by expansion into Asia with subsequent sales in Japan, the Philippines, Hong Kong, Thailand, and Singapore. We held our first Mexican auction in 1995 and our first auction in the Middle East in Dubai, the United Arab Emirates, in 1997.
In March 1998, we completed an initial public offering of our common shares. Our common shares trade on the New York Stock Exchange (“NYSE”) and the Toronto Stock Exchange (“TSX”) under the ticker symbol “RBA”.
In early 2013, we commercially launched our online marketplace, EquipmentOne. We continued to expand our digital capabilities through the following acquisitions over the past five years:
| · | Xcira LLC (“Xcira”) on November 4, 2015 – a proven leader in simulcast auction technology that provides a seamless customer experience for online bidding at live on site auctions |
| Ritchie Bros. | 3 |
| · | Mascus International Holding B.V. (“Mascus”) on February 19, 2016 – a global online listing service to advertise equipment and other assets for sale |
| · | IronPlanet on May 31, 2017 (the “Acquisition”) – operates online and event-based equipment auctions under a number of brands discussed in more detail below |
On consummation of the Acquisition on May 31, 2017, we formed an alliance with Caterpillar Inc. (“Caterpillar”), pursuant to a Strategic Alliance and Remarketing Agreement (the “Alliance”) that we entered into on August 29, 2016. As discussed in more detail below, under the Alliance, we became Caterpillar's preferred global partner for live on site and online auctions for used Caterpillar equipment.
During the past five years, we also continued to grow our live on site auction business by acquiring:
| · | The remaining interest in Ritchie Bros. Financial Services (“RBFS”) on July 12, 2016 – provides financing and leasing options to equipment purchasers, as a brokerage business, through several bank relationships (RBFS does not leverage our balance sheet for the loans it originates) |
| · | Petrowsky Auctioneers (“Petrowsky”) on August 1, 2016 – a leading regional industrial auctioneer in the Northern United States that offers live on site and simulcast live online auctions |
| · | Kramer Auctions Ltd. and Kramer Auctions—Real Estate Division Inc. (together, “Kramer”) on November 15, 2016 – a premier Canadian agricultural auctioneer, offering both on-the-farm and live on site auctions for customers selling equipment, livestock and real-estate in the agricultural sector |
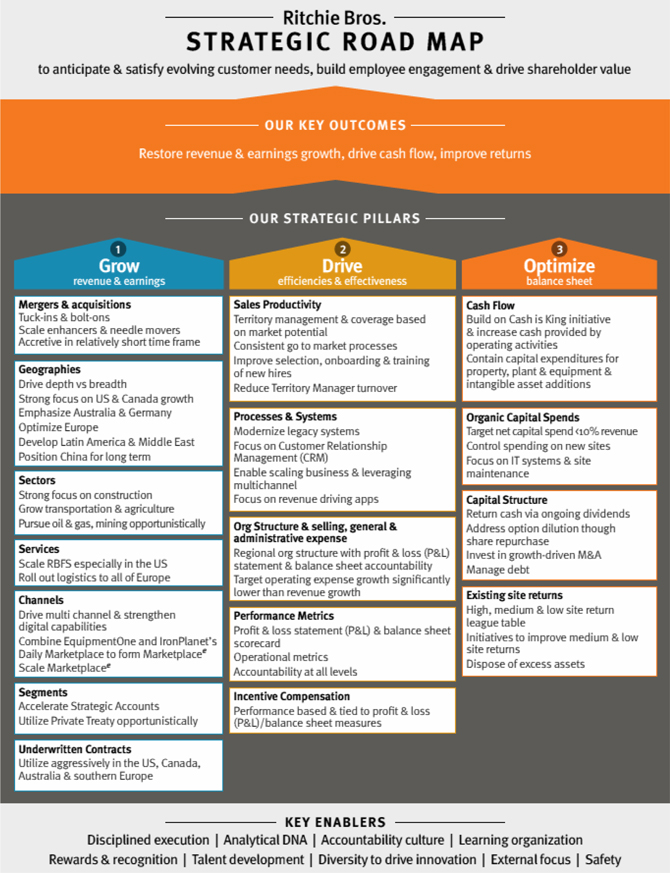
Strategy
At the beginning of 2015, we formalized a new strategy that centered around becoming a more diversified, multi-channel company that offered a full range of asset management and disposition solutions, all on a greater scale, that would provide even more choice to customers. In 2017, we took definitive steps towards furthering this strategy by completing the transformational acquisition of IronPlanet, a leading online marketplace for heavy equipment and other durable assets. The acquisition of IronPlanet positions Ritchie Bros. as one of the world’s leading one-stop-shop asset disposition companies. We are transforming our business and the industry through our technology and data, our breadth of solutions, and our people.
We continue to evolve our strategy as we integrate IronPlanet and develop our multi-channel business, focusing on two overarching strategic objectives: (i) grow share of the auction segment and (ii) penetrate the upstream market. The following discussion highlights how we performed against our strategy following the executable pillars of our road map, Grow, Drive, and Optimize.
GROW Revenues and Earnings
We are committed to pursuing growth initiatives that will further enhance our sector reach, drive geographic depth, meet a broader set of customer needs, and add scale to our operations. Over the last several years, we have undertaken a meaningful strategic transformation, through both organic and acquisitive growth initiatives, to broaden our service offering and the value propositions that we provide to different segments of the used asset and equipment market. Notably, the Acquisition with IronPlanet positions us to accelerate this strategy and take positive and meaningful steps towards meeting our strategic objectives.
We are focused on the following initiatives to deliver growth:
| · | Leveraging and scaling our one-stop-shop multi-channel solution set to drive organic market share and incremental penetration with existing customers; |
| · | Scaling multi-channel capabilities, including our IronPlanet Weekly Featured Auction and Marketplacee, to grow within existing sectors as well as penetrating new sector opportunities; |
| · | Leveraging and expanding multi-channel capabilities internationally; and |
| Ritchie Bros. | 4 |
| · | Driving increased penetration of auction services and, specifically, RBFS. |
DRIVE Efficiencies and Effectiveness
We plan to take advantage of opportunities to improve overall effectiveness of our organization. We are committed to driving efficiencies and effectiveness by:
| · | Improving sales effectiveness and sales productivity through consistent go-to-market processes; |
| · | Leveraging the rich data sets that we have at our disposal to create a unique and differentiated customer experience and delivering trust and confidence across our consignor and buyer bases; |
| · | Modernizing legacy systems and working to unify auction platforms to deliver technology efficiencies and create network effects for buyers and sellers by comprehensively meeting their needs, ease of use, and our business model; |
| · | Scaling the business and leveraging our expanded set of multi-channel assets to optimize our overall asset utilization and site optimization efforts while delivering choice to our customers; |
| · | Achieving acquisition synergies; and |
| · | Targeting operating expense growth lower than revenue growth. |
OPTIMIZE our Balance Sheet
Our business model provides us with the ability to generate strong cash flows. Cash flow represents our ability to convert revenue to cash, and provides a meaningful indication of the strength of our business. We will focus not only on profit growth but also further enhancing cash flow, reviewing contract structures and auction site returns to improve the cash flow and asset returns of our Auctions and Marketplaces (“A&M”) segment. During 2016, we also adjusted our capital structure, taking on more debt (through a new syndicated credit facility and issuance of senior unsecured notes) to acquire IronPlanet. We also continued to be prudent with our organic capital expenditures.
The acquisition of IronPlanet is a transformational transaction that will increase both the scale and the scope of our Company. The enhanced scale of our combined business is expected to drive further operating leverage from our unique business model, and provide new opportunities to operate more efficiently by utilizing an increasingly digital service offering.
We are focused on these areas to deliver optimization of our balance sheet:
| · | Increasing cash flows from operating activities; |
| · | Targeting net capital spend at less than 10% of revenue; |
| · | Investing in information technology systems to optimize business processes and reduce costs; and |
| · | Managing debt levels while returning cash via ongoing dividends. |
| Ritchie Bros. | 5 |
| Ritchie Bros. | 6 |
Service Offerings
We offer our equipment buyer and seller customers multiple distinct, complementary, multi-channel brand solutions that address the range of their needs. Our global customer base has a variety of transaction options, breadth of services, and the widest selection of used equipment available to them. The tables below illustrate the various channels and brand solutions available under our A&M segment, as well as our other services.
A&M segment
|
Channels |
Brand Solutions |
Description of Offering | ||
 |
n Live unreserved on site with live simulcast online auctions | |||
| Live On Site Auctions |  |
n Event-based sales of used construction and heavy equipment held in the Caterpillar dealer geographies | ||
 |
n Event-based sales of used energy equipment | |||
 |
n Online marketplace for selling and buying used equipment | |||
| Online Auctions and Marketplaces |  |
n Online marketplace offering multiple price and timing options | ||
 |
n Online marketplace for the sale of government and military assets | |||
 |
n Online truck and trailer marketplace | |||
| Brokerage Service |  |
n Confidential, negotiated sales |
Contact options
We offer consignors several contract options to meet their individual needs and sale objectives. Through our A&M business, options include:
| · | Straight commission contracts, where the consignor receives the gross proceeds from the sale less a pre-negotiated commission rate; |
| · | Guarantee contracts, where the consignor receives a guaranteed minimum amount plus an additional amount if proceeds exceed a specified level; and |
| · | Inventory contracts, where we purchase the equipment temporarily for resale. |
We refer to guarantee and inventory contracts as underwritten contracts. In 2017, our underwritten business accounted for approximately 16% of our GTV, compared to 25% in 2016 and 29% in 2015.
Value-added services
As part of our A&M business, we provide a wide array of value-added services to make the process of buying and selling equipment convenient for our customers. In addition to the other services listed in the table below, we also provide these value-added services to our customers:
| · | conducting title searches, where registries are commercially available, to ensure equipment is sold free and clear of all liens and encumbrances (if we are not able to deliver clear title, we provide a full refund up to the purchase price to the buyer); |
| · | making equipment available for inspection, testing, and comparison by prospective buyers; |
| · | displaying high-quality, zoomable photographs of equipment on our website; |
| Ritchie Bros. | 7 |
| · | providing free detailed equipment information on our website for most equipment; |
| · | providing access to insurance and powertrain warranty products; |
| · | providing access to transportation companies and customs brokerages through our partner, uSHIP; and |
| · | handling all pre-auction marketing, as well as collection and disbursement of proceeds. |
Our IronClad Assurance equipment condition certification provides online marketplace buyers with information on the condition of the equipment that includes, but is not limited to, providing buyers with pictures and comprehensive inspection information of key systems and components.
Other services
|
Channels |
Brand Solutions |
Description of Offering | ||
| Financial Service |  |
n Loan origination service that uses a brokerage model to match loan applicants with appropriate financial lending institutions | ||
| Appraisal Service |  |
n Unbiased, certified appraisal services, as well as truck and lease return inspection services | ||
| Online Listing Service |  |
n Online equipment listing service and B2B dealer portal | ||
| Ancillary Services | n Repair, paint, and other make-ready services | |||
| Logistical Service |  |
n End-to-end transportation and customs clearance solution for sellers and buyers with shipping needs |
Intellectual Property
We believe our intellectual property has significant value and is an important factor in marketing our organization, services, and website, as well as differentiating us from our competitors. We own or hold the rights to use valuable intellectual property such as trademarks, service marks, domain names and tradenames. We protect our intellectual property in Canada, the United States, and internationally through federal, provincial, state, and common law rights, including registration of certain trade mark and service marks for many of our brands, including our core brands. We also have secured patents for inventions and have registered our domain names.
We rely on contractual restrictions and rights to protect certain of our proprietary rights in products and services. Effective protection of our intellectual property can be expensive to maintain and may require litigation. We must protect our intellectual property rights and other proprietary rights in many jurisdictions throughout the world. In addition, we may, from time to time, be subject to intellectual property claims, including allegations of infringement, which can be costly to defend. For a discussion of the risks involved with intellectual property litigation and enforcement of our intellectual property rights, see the related information in “Part I, Item 1A: Risk Factors” of this Annual Report on Form 10-K.
| Ritchie Bros. | 8 |
Competition
Competition Overview
The global used industrial equipment market is highly fragmented and often fluid between sales channels. We compete for purchasers and sellers of used equipment with other asset management and disposition companies. These companies include non-auction competitors such as equipment manufacturers, distributors and dealers, used equipment brokers, equipment rental companies, and other online marketplaces. We compete based on breadth, brand reputation, security, technology, and global reach of our services, as well as in the variety of contracts and methods and channels of selling equipment. We also compete with private sales – often securing new business from equipment owners who had previously tried selling their equipment privately.
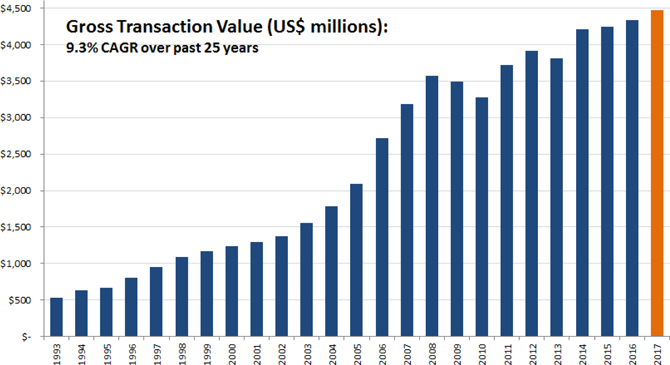
Competitive advantages
Our key strengths provide distinct competitive advantages, and have enabled us to achieve significant and profitable growth over the long term. Our Gross Transaction Value1 (“GTV”) has grown at a compound annual growth rate of 9.30% over the last 25 years, as illustrated below.
Global platform
Our business is a leader of equipment disposition services, with global reach, including 45 auction sites in more than 20 countries, including the United States, Canada, Australia, the United Arab Emirates, and the Netherlands. Our online bidding technology and Ritchie Bros. website are available in nine and 22 languages, respectively. Our global presence ensures we generate global market pricing for our equipment sellers, as we reach international buyers and equipment demand, helping to deliver strong price realization through our sales channels. This global reach provides us and our selling customers with the ability to transcend local market conditions.
| 1 | GTV represents total proceeds from all items sold at our auctions and online marketplaces. GTV is not a measure of financial performance, liquidity, or revenue, and is not presented in our consolidated financial statements. |
| Ritchie Bros. | 9 |
Breadth of solutions
We have the unique ability to meet all the buyers’ and sellers’ specific needs in a one-stop shop manner. The event-driven auction, which has been our core business for over 50 years, is just one solution—albeit a powerful solution—to meet customers’ varied needs. By delivering choice, we can work with customers as a trusted advisor to provide them with a tailored suite of equipment disposition solutions and, in the medium and long term, asset management. This is truly a fundamental evolution and transformation in the industry.
While we have a full suite of solutions, most of our auction volumes are generated through three core solutions. First, the unreserved live on site integrated auctions that provide our customers care, custody, and control. This offering is Ritchie Bros. Auctioneers, our primary business. Second, weekly online auctions for sellers looking to manage the disposition of their assets on a more frequent basis and being able to sell from their yard or location without having to move equipment. This offering is the IronPlanet Weekly Featured Auction. Third, our reserve online marketplace that affords sellers with control over price and timing, and with solutions such as Make Offer, Buy Now, and Reserve Price selling formats for buyers. We have recently launched a combined reserved online marketplace bringing together EquipmentOne and IronPlanet’s Daily Marketplace. The combined offering is known as Marketplacee.
An industry leader in a highly fragmented market
Based on a review of the construction, transportation and agricultural used equipment markets that we conducted in 2016, we believe the global used equipment market is valued at more than $300 billion2, including an opportunity in the United States of over $50 billion. The market is highly fragmented and fluid between sales channels; however, we believe our multi-channel brand solutions can meet a broad range of customer preferences and needs. While our business is a global market leader for the sale of used equipment, we currently have only 1.4% of the estimated global used equipment market, based on GTV during 2017. The United States represents a key area for growth with positive industrial tailwinds around infrastructure and construction.
Multi-channel product offering
Our multi-channel brand solutions provide a wide range of options for used industrial equipment, which appeal to a variety of personal preferences for sellers and buyers. We continue to build on our strong brand equity and loyal customer base by providing many value-added services to equipment sellers and buyers, including financing and leasing solutions, appraisal services, insurance services, refurbishment, and logistics services. We continue to look for even more ways to support the equipment industry and serve the various needs of equipment owners.
Diverse sector coverage
Our sales solutions cater to the needs of end users, dealers, and other equipment sellers across a variety of sectors, such as construction, transportation, agriculture, energy, and mining. This diversity of sectors mitigates sector-specific exposure and enables the sale of equipment with cross-sector applications, regardless of sector-specific cyclicality.
Experienced management team
Our experienced management team continues to capitalize on the strength of our live on site auction offering, while expanding our online offering through multiple acquisitions to better serve our existing customers and to attract new customers. Our executives have served as officers of a number of well-known global public companies, and we have developed a deep understanding of the used equipment market and customer base.
| 2 | Global used equipment market has been sourced through 1) Manfredi & Associates (2015), 2) ACT Research Co., LLC. (2016). This figure does not include the markets for used Class 1 trucks globally and used Class 2 and 3 trucks and trailers outside of the United States, 3) Company estimates. No third-party research report available or commissioned and 4) U.S. Federal Highway Administration. |
| Ritchie Bros. | 10 |
Data and sector intelligence
We transacted hundreds of thousands of assets through our sales channels in 2017 and had more than 694,000 people register to bid as users of www.rbauction.com or www.ironplanet.com in 2017. The volume of transactions and customer interactions have provided us with a unique, proprietary database of information. This database provides us with some of the world’s best information to identify market trends and estimate used equipment values.
The Role of Technology
The role of technology in our business continues to evolve and become more meaningful as more buyers adopt mobile and online channels to transact their business with us. We have been on a pathway to leverage digital and technology capabilities to improve the consumer auction and leverage technology as a competitive differentiator.
The acquisition of IronPlanet was an inflection point in our business and was a step change in this direction as it positioned us as a technology-enabled asset disposition company. The combination of IronPlanet’s technology and our existing assets results in tools and capabilities that provide our customers, both buyers and sellers, with more efficient and richer experiences for creation of deeper brand loyalty.
Buyers will now find it easier to locate inventory across all our websites with our enhanced search capabilities while sellers leverage both our rich data repository as well as our platform solution tools to give them the insights, tools, and solutions to manage their assets in an informed, efficient manner.
Offerings and initiatives
Integrated search capabilities
We are focused on helping buyers find what they are looking for easily and quickly while providing access to the largest equipment inventory across our brands and solutions. Our focus on improving our search capabilities allows us to extend our reach to more customers in a channel agnostic manner.
Marketplacee
Bringing together EquipmentOne and IronPlanet’s Daily Marketplace, we introduced a new sales solution, Marketplacee, in late 2017. Marketplacee is a flexible, online marketplace that gives customers the choice of negotiating offers, selling their assets at fixed prices, or setting a reserve (minimum) price. These three selling options are designed to give sellers more control over the selling price and processing of their assets while still benefiting from our marketing and expansive, global buyer network. Marketplacee provides choice to buyers who may prefer to buy in different formats based on their individual needs.
Platform solutions
Our unique software solutions allow us to work with sellers as a true business advisor as we provide tools, data, and insights to help our customers make real-time asset disposition decisions and deepen our relationships with our customers.
Auction management systems
We are in the preliminary stages of this initiative of leveraging one holistic platform to drive the live on site auction and online marketplace experience. Today, we have two discrete platforms. Known as project “MARS”, the new platform is a transformative initiative allowing us to simplify our technology footprint, reduce complexity, spur future innovation, and enable the development of customer-facing growth drivers such as more sophisticated personalization, data-driven insights, and real-time data-driven marketing.
RBA mobile app
Providing customers with the ability to search, register, and bid at our live on site auctions around the world using mobile devices. Mobile capabilities provide another opportunity to make our customer experiences easy and flexible so they can conduct business with us seven days a week, 24 hours a day.
| Ritchie Bros. | 11 |
Segmented Information
Segmented information is disclosed in the consolidated financial statements and the notes thereto included in footnote 4 to “Part II, Item 8: Financial Statements and Supplementary Data” presented elsewhere in this Annual Report on Form 10-K. Segmented information from prior years has been restated in footnote 4 to reflect the identification of the A&M reporting segment as of September 30, 2017.
Geographical Information
Geographical information about our revenues is disclosed in “Part II, Item 7: Management’s Discussion and Analysis of Financial Condition and Results of Operations — Geographic Analysis”, which is incorporated into this Item 1 by reference. Our international operations are subject to certain risks, as disclosed in “Part I, Item 1A: Risk Factors” of this Annual Report on Form 10-K.
The distribution of our long-lived assets includes property, plant and equipment according to the country in which they are located, is as follows:
| Outside of | United | |||||||||||||||||||
| Canada | Canada | States | Europe | Other | ||||||||||||||||
| Long-lived assets distribution | ||||||||||||||||||||
| December 31, 2017 | 22 | % | 78 | % | 52 | % | 16 | % | 10 | % | ||||||||||
| December 31, 2016 | 21 | % | 79 | % | 55 | % | 14 | % | 10 | % | ||||||||||
| December 31, 2015 | 20 | % | 80 | % | 55 | % | 15 | % | 10 | % | ||||||||||
Seasonality
Our GTV and associated A&M segment revenues are affected by the seasonal nature of our business. GTV and A&M segment revenues tend to increase during the second and fourth calendar quarters, during which time we generally conduct more business than in the first and third calendar quarters. Given the operating leverage inherent in our business model, the second and fourth quarter also tend to produce higher operating margins, given the higher volume and revenue generated in those quarters.
Governmental Regulations and Environmental Laws
Our operations are subject to a variety of federal, provincial, state and local laws, rules, and regulations throughout the world. We believe that we are compliant in all material respects with those laws, rules, and regulations that affect our business, and that such compliance does not impose a material impediment on our ability to conduct our business.
We believe that, among other things, laws, rules, and regulations related to the following list of items affect our business:
| · | Imports and exports of equipment. Particularly, there are restrictions in the United States and Europe that may affect the ability of equipment owners to transport certain equipment between specified jurisdictions. Also, engine emission standards in some jurisdictions limit the operation of certain trucks and equipment in those regions. |
| · | Development or expansion of auction sites. Such activities depend upon the receipt of required licenses, permits, and other governmental authorizations. We are also subject to various local zoning requirements pertaining to the location of our auction sites, which vary among jurisdictions. |
| · | The use, storage, discharge, and disposal of environmentally sensitive materials. Under such laws, an owner or lessee of, or other person involved in, real estate may be liable for the costs of removal or remediation of certain hazardous or toxic substances located on or in, or emanating from, such property, as well as related costs of investigation and property damage. These laws often impose liability without regard to whether the owner or lessee or other person knew of, or was responsible for, the presence of such hazardous or toxic substances. |
| Ritchie Bros. | 12 |
| · | Worker health and safety, privacy of customer information, and the use, storage, discharge, and disposal of environmentally sensitive materials. |
Available Information
The information contained on or accessible through our website is not part of this Annual Report on Form 10-K. We file required reports on Form 10-K, Form 10-Q, Form 8-K, proxy materials and other filings required under the Exchange Act. The public may read and copy any materials we file with the SEC at the SEC’s Public Reference Room at 100 F Street, NE, Washington DC 20549. The public may obtain information on the operation of the Public Reference Room by calling the SEC at (800) SEC-0330. The SEC maintains an Internet site (www.sec.gov) that contains reports, proxy and information statements, and other information regarding issuers that file electronically with the SEC.
We maintain a website at www.rbauction.com and copies of our reports on Form 10-K, Form 10-Q and Form 8-K, proxy materials and other filings required under the Exchange Act, are available on our website, free of charge, as soon as reasonably practicable after we electronically file such reports with, or furnish those reports to, the SEC. We have an investor website at www.investor.ritchiebros.com. None of the information on our websites is incorporated into this Annual Report on Form 10-K by this or any other reference.
We maintain a Code of Business Conduct and Ethics for our directors, officers and employees (“Code of Conduct”). A copy of our Code of Conduct may be found on our website in the Corporate Governance section.
Additional information related to Ritchie Bros. is also available on SEDAR at www.sedar.com.
| ITEM 1A: | RISK FACTORS |
An investment in our common stock involves a high degree of risk. In addition to the other information included in this Annual Report on Form 10-K, you should carefully consider each of the risks described below before purchasing our common shares. The risk factors set forth below are not the only risks that may affect our business. Our business could also be affected by additional risks not currently known to us or that we currently deem to be immaterial. If any of the following risks actually occur, our business, financial condition and results of operations could materially suffer. As a result, the trading price of our common shares could decline, and you may lose all or part of your investment. Information in this section may be considered “forward-looking statements.” See “Cautionary Note Regarding Forward-Looking Statements” for a discussion of certain qualifications regarding such statements.
Damage to our reputation could harm our business.
One of our founding principles is that we operate a fair and transparent business, and consistently act with integrity. Maintaining a positive reputation is key to our ability to attract and maintain customers, investors and employees. Damage to our reputation could cause significant harm to our business. Harm to our reputation could arise in a number of ways, including, but not limited to, employee conduct which is not aligned with our Code of Business Conduct and Ethics (and associated Company policies around behavioural expectations) or our Company’s core values, safety incidents, failure to maintain customer service standards, loss of trust in the fairness of our sales processes, and other technology or compliance failures.
We may not realize the anticipated benefits of, and synergies from, the Acquisition and may become responsible for certain liabilities and integration costs as a result.
Business acquisitions involve the integration of new businesses that have previously operated independently from us. The integration of our operations with those of IronPlanet is expected to result in financial and operational benefits, as well as operating synergies. There can be no assurance, however, regarding when or the extent to which we will be able to realize these and other benefits. Integration may also be difficult, unpredictable, and subject to delay because of possible company culture conflicts and different opinions on future business development.
| Ritchie Bros. | 13 |
We may be required to integrate or, in some cases, replace, numerous systems, including those involving management information, purchasing, accounting and finance, sales, billing, employee benefits, payroll and regulatory compliance, many of which may be dissimilar. Difficulties associated with the integration of acquired businesses could have a material adverse effect on our business.
Even if we are able to successfully integrate the operations of Ritchie Bros. and IronPlanet, we may not realize the full benefits that we anticipate. If we achieve the expected benefits, they may not be achieved within the anticipated time frame. Also, the benefits from the Acquisition may be offset by costs incurred in integrating Ritchie Bros. and IronPlanet, increases in other expenses, operating losses or problems in the business unrelated to the Acquisition. As a result, there can be no assurance that such synergies or other benefits will be achieved.
In addition, in connection with the Acquisition, we have assumed, and may assume in connection with future acquisitions, certain potential liabilities. To the extent such liabilities are not identified by us or to the extent indemnifications obtained from third parties are insufficient to cover such liabilities, these liabilities could have a material adverse effect on our business.
We have incurred substantial indebtedness in connection with the Acquisition, and the degree to which we are leveraged may materially and adversely affect our business, financial condition and results of operations.
We have incurred substantial indebtedness in connection with the Acquisition. As of December 31, 2017, we have $819.9 million of total debt outstanding, consisting of $335.9 million under a new five-year credit agreement (the “Credit Agreement”) with a syndicate of lenders entered into on October 27, 2016 (the “New Facilities”), and $500.0 million aggregate principal amount of 5.375% senior unsecured notes issued December 21, 2016 (the “Notes”), partially reduced by $16.8 million of unamortized debt issue costs, as well as $0.8 million under our foreign credit facilities. There is $637.8 million of availability under the New Facilities.
Our ability to make payments on and to refinance our indebtedness, including the debt incurred pursuant to the Acquisition as well as any future debt that we may incur, will depend on our ability to generate cash in the future from operations, financings or asset sales. Our ability to generate cash is subject to general economic, financial, competitive, legislative, regulatory and other factors that are beyond our control. We may not generate sufficient funds to service our debt and meet our business needs, such as funding working capital or the expansion of our operations. If we are not able to repay or refinance our debt as it becomes due, we may be forced to take certain actions, including reducing spending on marketing, advertising and new product innovation, reducing future financing for working capital, capital expenditures and general corporate purposes, selling assets or dedicating an unsustainable level of our cash flow from operations to the payment of principal and interest on our indebtedness. In addition, our ability to withstand competitive pressures and to react to changes in our industry, including both the live and online auction industry, could be impaired.
The lenders who hold our debt could also accelerate amounts due in the event that we default, which could potentially trigger a default or acceleration of the maturity of our other debt.
In addition, our substantial leverage could put us at a competitive disadvantage compared to our competitors that are less leveraged. These competitors could have greater financial flexibility to pursue strategic acquisitions and secure additional financing for their operations. Our substantial leverage could also impede our ability to withstand downturns in our industry or the economy in general.
We may incur substantial additional indebtedness in the future. The terms of the Credit Agreement and the indenture governing the Notes will limit, but not prohibit, us from incurring additional indebtedness. If we incur any additional indebtedness that has the same priority as the Notes and the guarantees thereof, the holders of that indebtedness will be entitled to share rateably with the holders of the Notes and the guarantees thereof in any proceeds distributed in connection with any insolvency, liquidation, reorganization, dissolution or other winding-up of us.
| Ritchie Bros. | 14 |
Subject to restrictions in the Credit Agreement and the indenture governing the Notes, we also will have the ability to incur additional secured indebtedness that would be effectively senior to the Notes offered hereby, to the extent of the value of the assets securing such obligations. If new indebtedness is added to our current debt levels, the related risks that we now face could intensify.
Our debt instruments have restrictive covenants that could limit our financial flexibility.
The terms of the Credit Agreement, as well as the indenture governing the Notes, contain financial and other restrictive covenants that limit our ability to engage in activities that may be in our long-term best interests. Our ability to borrow under our New Facilities is subject to compliance with a consolidated leverage ratio covenant and a consolidated interest coverage ratio covenant.
The Credit Agreement includes other restrictions that limit our ability in certain circumstances to: incur indebtedness; grant liens; engage in mergers, consolidations and liquidations; make asset dispositions, restricted payments and investments; enter into transactions with affiliates; and amend, modify or prepay certain indebtedness. The indenture governing the Notes contains covenants that limit our ability in certain circumstances to:
| · | incur additional indebtedness (including guarantees thereof); |
| · | incur or create liens on their assets securing indebtedness; |
| · | make certain restricted payments; |
| · | make certain investments; |
| · | dispose of certain assets; |
| · | allow to exist certain restrictions on the ability of our restricted subsidiaries to pay dividends or make other payments to us; |
| · | engage in certain transactions with affiliates; and |
| · | consolidate, amalgamate or merge with or into other companies. |
Our failure to comply with these covenants could result in an event of default that, if not cured or waived, could result in the acceleration of substantially all of our funded debt. We do not have sufficient working capital to satisfy our debt obligations in the event of an acceleration of all or a significant portion of our outstanding indebtedness.
Competition in our core markets could result in reductions in our future revenues and profitability.
The global used equipment market, including the auction segment of that market, is highly fragmented. We compete for potential purchasers and sellers of equipment with other auction companies and with non-auction competitors such as equipment manufacturers, distributors and dealers, equipment rental companies, and other online marketplaces. When sourcing equipment to sell at our auctions or other marketplaces, we compete with other on site and online auction companies, Original Equipment Manufacturer (“OEM”) and independent dealers, equipment brokers, other third parties, and equipment owners that have traditionally disposed of equipment in private sales.
Some of our competitors have significantly greater financial and marketing resources and name recognition than we do. New competitors with greater financial and other resources may enter the equipment auction market in the future. Additionally, existing or future competitors may succeed in entering and establishing successful operations in new geographic markets prior to our entry into those markets. They may also compete against us through internet-based services and other combined service offerings.
If commission rates decline, or if our strategy to compete against our many competitors is not effective, our revenues, market share, financial condition and results of operations may be adversely impacted. We may be susceptible to loss of business if competing models become more appealing to customers. If our selling model becomes undesirable or we are not successful in adding services complementary to our existing selling model and business, we may not be successful increasing market penetration over the long-term, which could prevent us from achieving our long-term earnings growth targets.
| Ritchie Bros. | 15 |
Our relationships with key long-term customers may be materially diminished or terminated.
We have long-standing and/or strategic relationships with a number of our customers and business partners, many of whom could unilaterally terminate their relationship with us or materially reduce the amount of business they conduct with us at any time. Market competition, business requirements and financial conditions could adversely affect our ability to continue or expand our relationships with our customers and business partners. There is no guarantee that we will be able to retain or renew existing agreements, or maintain relationships with any of our customers or business partners, on acceptable terms or at all. The loss of one or more of our major customers or business partners could adversely affect our business, financial condition and results of operations.
Decreases in the supply of, demand for, or market values of used equipment, could harm our business.
Our revenues could decrease if there was significant erosion in the supply of, demand for, or market values of used equipment, which could adversely affect our financial condition and results of operations. We have no control over any of the factors that affect the supply of, and demand for, used equipment, and the circumstances that cause market values for equipment to fluctuate — including, among other things, economic uncertainty, disruptions to credit and financial markets, lower commodity prices, and our customers’ restricted access to capital — are beyond our control. Recent economic conditions have caused fluctuations in the supply, mix and market values of used equipment available for sale, which has a direct impact on our revenues.
In addition, price competition and the availability of equipment directly affect the supply of, demand for, and market value of used equipment. Climate change initiatives, including significant changes to engine emission standards applicable to equipment, may also adversely affect the supply of, demand for or market values of equipment.
We may incur losses as a result of our guarantee and inventory contracts and advances to consignors.
Our most common type of auction contract is a straight commission contract, under which we earn a pre-negotiated, fixed commission rate on the gross sales price of the consigned equipment at auction. Straight commission contracts are used by us when we act as agent for consignors. In recent years, a majority of our annual business has been conducted on a straight commission basis. In certain other situations, we will enter into underwritten transactions and either offer to:
| · | guarantee a minimum level of sale proceeds to the consignor, regardless of the ultimate selling price of the consignment at the auction; or |
| · | purchase the equipment outright from the seller for sale in a particular auction. |
We determine the level of guaranteed proceeds or inventory purchase price based on appraisals performed on equipment by our internal personnel. Inaccurate appraisals could result in guarantees or inventory values that exceed the realizable auction proceeds. In addition, a change in market values could also result in guarantee or inventory values exceeding the realizable auction proceeds. If auction proceeds are less than the guaranteed amount, our commission will be reduced and we could potentially incur a loss, and, if auction proceeds are less than the purchase price we paid for equipment that we take into inventory temporarily, we will incur a loss. Because a majority of our auctions are unreserved, there is no way for us to protect against these types of losses by bidding on or acquiring any of the items at such auctions. In addition, we do not hold inventory indefinitely waiting for market conditions to improve. If our exposure to underwritten contracts increases, this risk would be compounded.
Occasionally, we advance to consignors a portion of the estimated auction proceeds prior to the auction. We generally make these advances only after taking possession of the assets to be auctioned and upon receipt of a security interest in the assets to secure the obligation. If we were unable to auction the assets or if auction proceeds were less than amounts advanced, we could incur a loss.
| Ritchie Bros. | 16 |
The availability and performance of our technology infrastructure, including our websites, is critical to our business.
The satisfactory performance, reliability and availability of our websites, enterprise resource planning system, processing systems and network infrastructure are important to our reputation and our business. Our systems may experience service interruptions or degradation because of hardware or software defects or malfunctions, computer denial of service, cyber events, human error and natural events beyond our control. Some of our systems are not fully redundant, and our recovery planning may not be sufficient for all possible disruptions.
Further, we will need to continue to expand, integrate, consolidate, and upgrade our technology, transaction processing systems and network infrastructure both to meet increased usage of our online bidding service and other services offered on our websites, to implement new features and functions and as a result of the Acquisition. Our business and results of operations could be harmed if we were unable to expand and upgrade in a timely manner our systems and infrastructure to accommodate any increases in the use of our internet services, or if we were to lose access to or the functionality of our internet systems for any reason, especially if such loss of service prevented internet bidders from effectively participating in one of our auctions. Frequent, persistent or ill-timed interruptions to our internet services could cause current or potential customers to believe that our systems are unreliable, which could lead to the loss of customers and harm our reputation.
We use both internally developed and licensed systems for transaction processing and accounting, including billings and collections processing. We continually upgrade and improve these systems to accommodate growth in our business. If we are unsuccessful in continuing to upgrade our technology, transaction processing systems or network infrastructure to accommodate increased transaction volumes, it could harm our operations and interfere with our ability to expand our business.
If the mobile solutions available to consumers are not effective, the use of our technology platform could decline.
Visits and purchases made on mobile devices by consumers have increased in recent years. The smaller screen size and reduced functionality associated with some mobile devices may make the use of a technology platform more difficult or less appealing to customers. Visits to our marketplaces on mobile devices may not convert into purchases as often as visits made through personal computers, which could result in less revenue for us.
Further, although we strive to provide engaging mobile experiences for customers who visit our mobile websites using a browser on their mobile device, as new mobile devices and mobile platforms are released, we may encounter problems in developing or supporting applications for them. In addition, supporting new devices and mobile device operating systems may require substantial time and resources. The success of our mobile applications could also be harmed by factors outside our control, such as:
| · | actions taken by providers of mobile operating systems or mobile application, or app, download stores; |
| · | unfavorable treatment received by our mobile apps, especially as compared to competing apps, such as the placement of our mobile apps in a mobile app download store; |
| · | increased costs to distribute or have customers use our mobile apps; or |
| · | changes in mobile operating systems, such as iOS and Android, that degrade the functionality of our mobile websites or mobile apps or that give preferential treatment to competitive products. |
If customers encounter difficulty accessing or using our technology platform on their mobile devices, or if sellers and buyers choose not to use our technology platform on their mobile devices, our growth prospects and our business may be adversely affected.
A deterioration of general macroeconomic conditions could materially and adversely affect our business.
Our performance is subject to macroeconomic conditions and their impact on customer spending. Adverse macroeconomic conditions typically result in a general tightening in credit markets, lower levels of liquidity, increased default and bankruptcy rates, and depressed levels of activity and investment.
| Ritchie Bros. | 17 |
Challenging macroeconomic conditions may have a negative impact on the operations, financial condition and liquidity of many customers and, as a result, may negatively impact the volume of equipment listed for sale and the prices of equipment sold in our marketplace, thereby having a negative impact on our revenue and ability to grow our business. If sellers choose not to sell their assets as a result of adverse economic conditions, buyers are unable to purchase equipment based on their inability to obtain sufficient financing or are unwilling to do so given the market climate, or if customers are in general financial distress, our operations may be negatively affected and revenue from our marketplace may decrease.
Our ability to provide a high quality customer experience may depend on third parties and external factors over which we may have little or no control.
Our ability to provide a high quality and efficient customer experience is also dependent on external factors over which we may have little or no control, including, without limitation, the reliability and performance of the equipment sold in our marketplaces and the performance of third-party carriers who transport purchased equipment on behalf of buyers. If our customers are dissatisfied with the accuracy of our appraisals and inspections, the quality of the business insights provided by our other value-added services, or do not receive the equipment they purchased in a timely manner or in the condition that they expect, customers may stop using us to purchase equipment. Failure to provide customers with high quality and efficient customer experiences could substantially harm our reputation and adversely impact our efforts to develop customer and industry trust in our brands.
Government regulation of the Internet and e-commerce is evolving, and unfavorable changes in this or other regulations could substantially harm our business and results of operations.
We are subject to general business regulations and laws as well as certain federal, provincial, state and local laws, rules and regulations, including those governing the internet and e-commerce. Existing and future laws and regulations may impede the growth of the internet, e-commerce or other services, and increase the cost of doing business, including providing online auction services. These regulations and laws may cover taxation, tariffs, user privacy, data protection, pricing, content, copyrights, distribution, electronic contracts, and other communications, consumer protection, broadband residential Internet access and the characteristics and quality of services. It is not clear how existing laws governing issues such as property ownership, sales, use and other taxes, libel, and personal privacy apply to the Internet and e-commerce. Changes to regulations and unfavorable resolution of these issues may harm our business and results of operations.
Our future expenses may increase significantly and our operations and ability to expand may be limited as a result of environmental and other regulations.
A variety of federal, provincial, state and local laws, rules and regulations throughout the world, including local tax and accounting rules, apply to our business. These relate to, among other things, the auction business, imports and exports of equipment, property ownership laws, licensing, worker safety, privacy of customer information, land use and the use, storage, discharge and disposal of environmentally sensitive materials. Complying with revisions to laws, rules and regulations could result in an increase in expenses and a deterioration of our financial performance. Failure to comply with applicable laws, rules and regulations could result in substantial liability to us, suspension or cessation of some or all of our operations, restrictions on our ability to expand at present locations or into new locations, requirements for the acquisition of additional equipment or other significant expenses or restrictions.
The development or expansion of auction sites depends upon receipt of required licenses, permits and other governmental authorizations. Our inability to obtain these required items could harm our business. Additionally, changes or concessions required by regulatory authorities could result in significant delays in, or prevent completion of, such development or expansion.
Under some environmental laws, an owner or lessee of, or other person involved in, real estate may be liable for the costs of removal or remediation of hazardous or toxic substances located on or in, or emanating from, the real estate, and related costs of investigation and property damage. These laws often impose liability without regard to whether the owner, lessee or other person knew of, or was responsible for, the presence of the hazardous or toxic substances.
| Ritchie Bros. | 18 |
Environmental contamination may exist at our owned or leased auction sites, or at other sites on which we may conduct auctions, or properties that we may be selling by auction, from prior activities at these locations or from neighboring properties.
In addition, auction sites that we acquire or lease in the future may be contaminated, and future use of or conditions on any of our properties or sites could result in contamination. The costs related to claims arising from environmental contamination of any of these properties could harm our financial condition and results of operations.
There are restrictions in the United States, Canada and Europe and other jurisdictions in which we do business that may affect the ability of equipment owners to transport certain equipment between specified jurisdictions or the saleability of older equipment. One example of these restrictions is environmental certification requirements in the United States, which prevent non-certified equipment from entering into commerce in the United States. In addition, engine emission standards in some jurisdictions limit the operation of certain trucks and equipment in those markets.
These restrictions, or changes to environmental laws, including laws in response to climate change, could inhibit materially the ability of customers to ship equipment to or from our auction sites, reducing our GTV and harming our business, financial condition and results of operations.
International bidders and consignors could be deterred from participating in our auctions if governmental bodies impose additional export or import regulations or additional duties, taxes or other charges on exports or imports. Reduced participation by international bidders and consignors could reduce GTV and harm our business, financial condition and results of operations.
Our substantial international operations expose us to foreign exchange rate fluctuations that could harm our results of operations.
We conduct business in many countries around the world and intend to continue to expand our presence in international markets, including emerging markets. Fluctuating currency exchange rates may negatively affect our business in international markets and our related results of operations.
Although we report our financial results in U.S. dollars, a significant portion of our revenues and expenses are generated outside the United States, primarily in currencies other than the U.S. dollar. In particular, a significant portion of our revenues are earned, and expenses incurred, in the Canadian dollar and the Euro. As a result, our financial results are impacted by fluctuations in foreign currency exchange rates. We do not currently engage in foreign currency hedging arrangements, and, consequently, foreign currency fluctuations may adversely affect our results of operations.
The results of operations of our foreign subsidiaries are translated from local currency into U.S. dollars for financial reporting purposes. If the U.S. dollar weakens against foreign currencies, the translation of these foreign currency denominated revenues or expenses will result in increased U.S. dollar denominated revenues and expenses. Similarly, if the U.S. dollar strengthens against foreign currencies, particularly the Canadian dollar and the Euro, our translation of foreign currency denominated revenues or expenses will result in lower U.S. dollar denominated revenues and expenses. Foreign currency movements relative to the U.S. dollar positively impacted revenues by $3.2 million in 2017, and negatively by $6.8 million and $40.5 million, respectively, in 2016 and 2015.
In addition, currency exchange rate fluctuations between the different countries in which we conduct our operations impact the purchasing power of buyers, the motivation of consignors, asset values and asset flows between various countries, including those in which we do not have operations. These factors and other global economic conditions may harm our business and our results of operations.
| Ritchie Bros. | 19 |
Our business is subject to the risks of operating internationally.
We operate in a large number of international jurisdictions. There are risks inherent in doing business internationally, including, but not limited to:
| · | trade barriers, trade regulations, currency controls, import or export regulations, and other restrictions on doing business freely; |
| · | local labor, environmental, tax, and other laws and regulations, and uncertainty or adverse changes in such laws and regulations or the interpretations thereof; |
| · | difficulties in staffing and managing foreign operations; |
| · | economic, political, social or labor instability or unrest, or changes in conditions; |
| · | terrorism, war, hostage-taking, or military repression; |
| · | corruption; |
| · | expropriation and nationalization; |
| · | high rates of inflation; and |
| · | uncertainty as to litigation in foreign jurisdictions and enforcement of local laws. |
If we violate the complex foreign and U.S. laws and regulations that apply to our international operations, we may face fines, criminal actions or sanctions, prohibitions on the conduct of our business and damage to our reputation. These risks inherent in our international operations increase our costs of doing business internationally and may result in a material adverse effect on our operations or profitability.
Our business operations may be subject to a number of federal and local laws, rules and regulations including export control regulations.
Our business operations may be subject to a number of federal and local laws, rules and regulations, including the Export Administration Regulations, or EAR, maintained by the U.S. Department of Commerce, the International Traffic in Arms Regulations, or ITAR, maintained by the U.S. Department of State, economic sanctions regulations maintained by the U.S. Department of the Treasury’s Office of Foreign Assets Control, or OFAC, and similar regulations in Canada and the European Union (“EU”). We have implemented procedures regarding compliance with these laws, including monitoring, on an automatic and manual basis, the potential sellers and buyers in our marketplace and restricting business from certain countries. We can offer no assurances that these procedures will always be effective.
We have implemented certain processes and procedures to prevent sellers and buyers that are located in a prohibited jurisdiction or are prohibited persons from participating in our marketplaces. Such processes and procedures are designed so that our business is in compliance with OFAC-administered sanctions regulations and other applicable sanction regulations, including those in Canada and the E.U.
If we were to violate applicable export control or sanctions regulations, we could be subject to administrative or criminal penalties which, in certain circumstances, could be material. We could be subject to damages, financial penalties, denial of export privileges, incarceration of our employees, other restrictions on our operations, and reputational harm. Further, any action on the part of the U.S. Department of State, the U.S. Department of Commerce, OFAC or other applicable regulator against the company or any of our employees for potential violations of these laws could have a negative impact on our reputation and business, which might decrease stockholder value.
| Ritchie Bros. | 20 |
Failure to comply with anti-bribery, anti-corruption, and anti-money laundering laws, including the U.S. Foreign Corrupt Practices Act of 1977, as amended, or the FCPA, the Corruption of Foreign Public Officials Act, or the CFPOA, and similar laws associated with our activities outside of the United States could subject us to penalties and other adverse consequences.
We are subject to the FCPA, the CFPOA, the U.S. domestic bribery statute contained in 18 U.S.C. §201, the U.S. Travel Act, the USA PATRIOT Act, the United Kingdom Bribery Act of 2010, or the U.K. Bribery Act, and possibly other anti-corruption, anti-bribery and anti-money laundering laws in countries in which we conduct activities or facilitate the buying and selling of equipment. We face significant risks if we fail to comply with the FCPA, the CFPOA and other anti-corruption and anti-bribery laws that prohibit companies and their employees and third-party intermediaries from authorizing, offering or providing, directly or indirectly, improper payments or benefits to foreign government officials, political parties or candidates, employees of public international organizations, and private-sector recipients for the corrupt purpose of obtaining or retaining business, directing business to any person, or securing any advantage. In many foreign countries, particularly in countries with developing economies, it may be a local custom that businesses engage in practices that are prohibited by the FCPA, the CFPOA or other applicable laws and regulations. In addition, we leverage various third parties to sell our solutions and conduct our business abroad. We, our channel partners, and our other third-party intermediaries may have direct or indirect interactions with officials and employees of government agencies or state-owned or affiliated entities. We may be held liable for the corrupt or other illegal activities of these third-party intermediaries, our employees, representatives, contractors, partners, and agents, even if we do not explicitly authorize such activities. Our Code of Business Conduct and Ethics and other corporate policies mandate compliance with these anti-bribery laws, which often carry substantial penalties.
Any violation of the FCPA, other applicable anti-bribery, anti-corruption laws, and anti-money laundering laws could result in whistleblower complaints, adverse media coverage, investigations, loss of export privileges, severe criminal or civil sanctions and, in the case of the FCPA, suspension or debarment from U.S. government contracts, which could have a material and adverse effect on our reputation, business, operating results and prospects. In addition, responding to any enforcement action may result in a materially significant diversion of management’s attention and resources and significant defense costs and other professional fees.
We are pursuing a long-term growth strategy that includes acquisitions and developing and enhancing an appropriate sales strategy, which requires upfront investment with no guarantee of long-term returns.
We continue to pursue a long-term growth strategy, including developing and enhancing an appropriate sales strategy, that contemplates upfront investments, including (i) investments in emerging markets that may not generate profitable growth in the near term, (ii) adding new business and information solutions, and (iii) developing our people. Planning for future growth requires investments to be made now in anticipation of growth that may not materialize, and if our strategies do not successfully address the needs of current and potential customers, we may not be successful in maintaining or growing our GTV and our financial condition and results of operations may be adversely impacted. We may also not be able to improve our systems and controls as a result of increased costs, technological challenges, or lack of qualified employees. A large component of our selling, general and administrative expenses is considered fixed costs that we will incur regardless of any GTV growth. There can be no assurances that our GTV and revenues will be maintained or grow at a more rapid rate than our fixed costs.
Part of our growth strategy includes growth through acquisitions, such as the Acquisition, which poses a number of risks. We may not be successful in identifying appropriate acquisition candidates, consummating acquisitions on satisfactory terms or integrating any newly acquired or expanded business with our current operations. Additionally, significant costs may be incurred in connection with any acquisition and our integration of such businesses with our business, including legal, accounting, financial advisory and other costs. We may also not realize the anticipated benefits of, and synergies from, such acquisition. We cannot guarantee that any future business acquisitions will be pursued, that any acquisitions that are pursued will be consummated, or that we will achieve the anticipated benefits of completed acquisitions.
| Ritchie Bros. | 21 |
Our business is subject to risks relating to our ability to safeguard our information systems, including the cyber-security and privacy of our customers’ confidential information.
We rely on information technology to manage our business, including maintaining proprietary databases containing sensitive and confidential information about our customers, suppliers, counterparties and employees (which may include personally identifiable information and credit information). An increasing number of websites have disclosed cyber breaches of their security, some of which have involved sophisticated and highly targeted attacks on portions of their websites or infrastructure. Because the techniques used to obtain unauthorized access, disable or degrade service, or sabotage systems, change frequently, we may not be able to anticipate these techniques or to implement adequate preventative measures. Unauthorized parties may also attempt to gain access to our systems or facilities through various means, including hacking into our systems or facilities, fraud, trickery or other means of deceiving our employees or contractors. A party that is able to circumvent our security measures could misappropriate our or our customers’ confidential information, cause interruption to our operations, damage our computing infrastructure or otherwise damage our reputation. Although we maintain information security measures, there can be no assurance that we will be immune from these security risks, and any breach of our information security may have a material adverse impact on our business and results of operations.
Under credit card payment rules and our contracts with credit card processors, if there is a breach of payment card information that we store, we could be liable to the payment card issuing banks for their cost of issuing new cards and related expenses. We may also be held liable for certain fraudulent credit card transactions and other payment disputes with customers. If we were unable to accept payment cards, our results of operations would be materially and adversely affected.
Security breaches could damage our reputation, cause a loss of confidence in the security of our services and expose us to a risk of loss or litigation and possible liability for damages. We may be required to make significant expenditures to protect against security breaches or to alleviate problems caused by any breaches. These issues are likely to become costlier as we expand. Our insurance policies may not be adequate to reimburse us for losses caused by security breaches, and we may not be able to fully collect, if at all, under these insurance policies.
Income and commodity tax amounts, including tax expense, may be materially different than expected.
Our global operations are subject to tax interpretations, regulations, and legislation in the numerous jurisdictions in which we operate, all of which are subject to continual change.
We accrue and pay income taxes and have significant income tax assets, liabilities, and expense that are estimates based primarily on the application of those interpretations, regulations and legislation, and the amount and timing of future taxable income. Accordingly, we cannot be certain that our estimates and reserves are sufficient. The timing concerning the monetization of deferred income tax amounts is uncertain, as they are dependent on our future earnings and other events. Our deferred income tax amounts are valued based upon substantively enacted income tax rates in effect at the time, which can be changed by governments in the future.
The audit and review activities of tax authorities affect the ultimate determination of the actual amounts of commodity taxes payable or receivable, income taxes payable or receivable, deferred income tax assets and liabilities, and income tax expense.
There is no assurance that taxes will be payable as anticipated or that the amount or timing of receipt or use of the tax-related assets will be as currently expected. Our experience indicates that taxation authorities are increasing the frequency and depth of audits and reviews and, while our approach to accounting for tax positions has generally been deemed appropriate through recent audits by taxation authorities, future tax authority determinations could have a material impact to our financial position.
| Ritchie Bros. | 22 |
The effects of newly enacted U.S. tax legislation have not yet been fully analyzed and could be materially different from our current estimates.
On December 22, 2017, U.S. tax legislation known as the Tax Cuts and Jobs Act, or TCJA, was signed into law, significantly reforming the U.S. Internal Revenue Code. The TCJA, among other things, includes changes to U.S. federal tax rates, imposes significant additional limitations on the deductibility of interest, allows for the expensing of capital expenditures, puts into effect the migration from a “worldwide” system of taxation to a territorial system and modifies or repeals many business deductions and credits. The TCJA added a minimum tax on a U.S. corporation’s taxable income after adding back certain deductible payments to non-U.S. affiliates. In addition, the TCJA disallows deductions for interest and royalty payments from U.S. companies to non-U.S. affiliates that are hybrid payments or made to hybrid entities. We continue to examine the impact the TCJA may have on our business. Our net deferred tax assets and liabilities will be revalued at the newly enacted U.S. corporate rate, and the impact will be recognized in our tax expense in the year of enactment. The impact of the TCJA on holders of common shares is uncertain and could be adverse.
Losing the services of one or more key personnel could materially affect our business and require us to incur substantial additional costs to recruit replacement personnel.
The growth and performance of our business depends to a significant extent on the efforts and abilities of our executive officers and senior managers. Many of our key executives have extensive experience with our business. These officers have knowledge and an understanding of our company and industry that cannot be readily duplicated. The loss of any member of our senior management team could impair our ability to execute our business plan and growth strategy, cause us to lose customers and reduce our revenues.
Our business could be harmed if we lost the services of any of these individuals. We do not maintain key person insurance on the lives of any of our executive officers. As a result, we would have no way to cover the financial loss if we were to lose the services of members of our senior management team. This uncertainty may adversely affect our ability to attract and retain key employees.
If any of our key personnel were to join a competitor or form a competing company, existing and potential customers could choose to form business relationships with that competitor instead of us. There can be no assurance that confidentiality, non-solicitation, non-competition or similar agreements signed by our former directors, officers, or employees, or by IronPlanet stockholders or our transactional counterparties, will be effective in preventing a loss of business.
Our future success largely depends on our ability to attract, develop and retain skilled employees in all areas of our business, as well as to design an appropriate organization structure and plan effectively for succession. Although we actively manage our human resource risks, there can be no assurance that we will be successful in our efforts. If we fail to attract, develop and retain skilled employees in all areas of our business, our financial condition and results of operations may be adversely affected and we may not achieve our growth or performance objectives.
We are regularly subject to general litigation and other claims, which could have an adverse effect on our business and results of operations.
We are subject to general litigation and other claims that arise in the ordinary course of our business. The outcome and impact of such litigation cannot be predicted with certainty, but regardless of the outcome, these proceedings can have an adverse impact on us because of legal costs, diversion of management resources and other factors. While the results of these claims have not historically had a material effect on our business, financial condition or results of operations, we may not be able to defend ourselves adequately against these claims in the future, and these proceedings may have a material adverse impact on our financial condition or results of operations.
In addition to other legal proceedings, we may also be subject to intellectual property claims, which are extremely costly to defend, could require us to pay significant damages, and could limit our ability to use certain technologies in the future. Companies in the Internet and technology industries are frequently subject to litigation based on allegations of infringement or other violations of intellectual property rights.
| Ritchie Bros. | 23 |
We periodically receive notices that claim we have infringed, misappropriated, or misused other parties’ intellectual property rights. To the extent we gain greater public recognition, we may face a higher risk of being the subject of intellectual property claims.
Third-party intellectual property rights may cover significant aspects of our technologies or business methods or block us from expanding our offerings. Any intellectual property claim against us, with or without merit, could be time consuming and expensive to settle or litigate and could divert the attention of our management. Litigation regarding intellectual property rights is inherently uncertain due to the complex issues involved, and we may not be successful in defending ourselves in such matters.
Many potential litigants, including some patent holding companies, have the ability to dedicate substantial resources to enforcing their intellectual property rights. Any claims successfully brought against us could subject us to significant liability for damages, and we may be required to stop using technology or other intellectual property alleged to be in violation of a third party’s rights. We also might be required to seek a license for third-party intellectual property. Even if a license is available, we could be required to pay significant royalties or submit to unreasonable terms, which would increase our operating expenses. We may also be required to develop alternative non-infringing technology, which could require significant time and expense. If we cannot license or develop technology for any allegedly infringing aspect of our business, we would be forced to limit our service and may be unable to compete effectively. Any of these results could harm our business.
We may be unable to adequately protect or enforce our intellectual property rights, which could harm our reputation and adversely affect our growth prospects.
We regard our proprietary technologies and intellectual property as integral to our success. We protect our proprietary technology through a combination of trade secrets, third-party confidentiality and nondisclosure agreements, additional contractual restrictions on disclosure and use, and patent, copyright, and trademark laws.
We currently are the registered owners of many Internet domain names internationally. As we seek to protect our domain names in an increasing number of jurisdictions, we may not be successful in doing so in certain jurisdictions. Our competitors may adopt trade names or domain names similar to ours, thereby impeding our ability to promote our marketplace and possibly leading to customer confusion. In addition, we could face trade name or trademark or service mark infringement claims brought by owners of other registered or unregistered trademarks or service marks, including trademarks or service marks that may incorporate variations of our brand names. The legal means we use to protect our proprietary technology and intellectual property do not afford complete protection and may not adequately protect our rights or permit us to gain or keep any competitive advantage. We cannot guarantee that any of our present or future intellectual property rights will not lapse or be invalidated, circumvented, challenged or abandoned; our intellectual property rights will provide competitive advantages to us; our ability to assert our intellectual property rights against potential competitors or to settle current or future disputes will not be limited by our agreements with third parties; any of our pending or future patent applications will be issued or have the coverage originally sought; or our intellectual property rights will be enforced in jurisdictions where competition may be intense or where legal protection may be weak.
We also may allow certain of our registered intellectual property rights, or our pending applications or registrations for intellectual property rights, to lapse or to become abandoned if we determine that obtaining or maintaining the applicable registered intellectual property rights is not worthwhile.
Further, although it is our practice to enter into confidentiality agreements and intellectual property assignment agreements with our employees and contractors, these agreements may not be enforceable or may not provide meaningful protection for our trade secrets or other proprietary information in the event of unauthorized use or disclosure or other breaches of the agreements.
| Ritchie Bros. | 24 |
Despite our efforts to protect our proprietary rights, unauthorized parties may attempt to copy, reverse engineer, or otherwise obtain and use our products or technology. We cannot be certain that we will be able to prevent unauthorized use of our technology or infringement or misappropriation of our intellectual property, particularly in foreign countries where the laws may not protect our proprietary rights. Effective patent, copyright, trademark, service mark, trade secret, and domain name protection is time-consuming and expensive to maintain. Litigation may be necessary to enforce our intellectual property rights, to protect our trade secrets, or to determine the validity and scope of the proprietary rights of others, which could result in substantial costs and diversion of our resources. In addition, our efforts may be met with defenses and counterclaims challenging the validity and enforceability of our intellectual property rights or may result in a court determining that our intellectual property rights are unenforceable. If we are unable to cost-effectively protect our intellectual property rights, then our business could be harmed. If competitors are able to use our technology or develop proprietary technology similar to ours or competing technologies, our ability to compete effectively and our growth prospects could be adversely affected.
We are subject to the terms of open source licenses because our technology platform incorporates open source software.
Some of the software powering our marketplace incorporates software covered by open source licenses. The terms of many open source licenses have not been interpreted by U.S. courts and there is a risk that the licenses could be construed in a manner that imposes unanticipated conditions or restrictions on our ability to operate our marketplace. Under certain open source licenses, we could be required to publicly release the source code of our software or to make our software available under open source licenses. To avoid the public release of the affected portions of our source code, we could be required to expend substantial time and resources to re-engineer some or all of our software which could significantly interrupt our operations.
In addition, use of open source software can lead to greater risks than use of third-party commercial software because open source licensors generally do not provide warranties or controls on the origin of the software. Use of open source software may also present additional security risks because the public availability of this software may make it easier for hackers and other third parties to determine how to compromise our technology platform. Any of these risks could be difficult to eliminate or manage and, if not addressed, could adversely affect our business, financial condition and results of operations.
Our business continuity plan may not operate effectively in the event of a significant interruption of our business.
We depend on our information and other systems and processes for the continuity and effective operation of our business. We have implemented a formal business continuity plan covering most significant aspects of our business that would take effect in the event of a significant interruption to our business, or the loss of key systems as a result of a natural or other disaster. Although we have tested our business continuity plan as part of the implementation, there can be no assurance that it will operate effectively or that our business, results of operations and financial condition will not be materially affected in the event of a significant interruption of our business.
If we were subject to a disaster or serious security breach, it could materially damage our business, financial condition and results of operations.
Our insurance may be insufficient to cover losses that may occur as a result of our operations.
We maintain property and general liability insurance. This insurance may not remain available to us at commercially reasonable rates, and the amount of our coverage may not be adequate to cover all liabilities that we may incur. Our auctions generally involve the operation of large equipment close to a large number of people, and despite our focus on safe work practices, an accident could damage our facilities or injure auction attendees. Any major accident could harm our reputation and our business. In addition, if we were held liable for amounts exceeding the limits of our insurance coverage or for claims outside the scope of our coverage, the resulting costs could harm our financial condition and results of operations.
| Ritchie Bros. | 25 |
Certain global conditions may affect our ability to conduct successful events.
Like most businesses with global operations, we are subject to the risk of certain global conditions, such as pandemics or other disease outbreaks or natural disasters that could hinder our ability to conduct our scheduled auctions, restrict our customers’ travel patterns or their desire to attend auctions or impact our online operations, including disrupting the Internet or mobile networks or one or more of our service providers. If this situation were to occur, we may not be able to generate sufficient equipment consignments to sustain our business or to attract enough bidders to our auctions to achieve world fair market values for the items we sell. This could harm our financial condition and results of operations.
Our operating results are subject to quarterly variations.
Historically, our revenues and operating results have fluctuated from quarter to quarter. We expect to continue to experience these fluctuations as a result of the following factors, among others:
| · | the size, timing and frequency of our auctions; |
| · | the seasonal nature of the auction business in general, with peak activity typically occurring in the second and fourth calendar quarters, mainly as a result of the seasonal nature of the construction and natural resources industries; |
| · | the performance of our underwritten (guarantee and outright purchase) contracts; |
| · | general economic conditions in the geographical regions in which we operate; and |
| · | the timing of acquisitions and development of auction facilities and related costs. |
In addition, we may incur substantial costs when entering new geographies and the profitability of operations at new locations is uncertain as a result of the increased variability in the number and size of auctions at new sites. These and other factors may cause our future results to fall short of investor expectations or not to compare favorably to our past results. Further, as our results generally fluctuate from quarter to quarter, period-to-period comparisons of our results of operations may not be meaningful indicators of future performance.
New regulation in the areas of consumer privacy and commercial electronic messages may restrict or increase costs of our marketing efforts.
Our operation and marketing activities are subject to various types of regulations, including laws relating to the protection of personal information, consumer protection and competition. User data protection and communication-based laws may be interpreted and applied inconsistently from country to country, and these laws continue to develop in ways we cannot predict and that may adversely affect our business. Complying with these varying national requirements could cause us to incur substantial costs or require us to change our business practices in a manner with adverse effects on our business, and violations of privacy-related laws can result in significant penalties. See “— We process, store, and use personal information and other data, which subjects us to a variety of evolving governmental regulation, industry standards and self-regulatory schemes, contractual obligations, and other legal obligations related to privacy and data protection, which may increase our costs, decrease adoption and use of our products and services and expose us to liability.” A determination that there have been violations of laws relating to our marketing practices under communications-based laws could expose us to significant damage awards, fines and other penalties that could, individually or in the aggregate, materially harm our business.
One example of such a law is Canada’s Anti-Spam Law, or CASL, which came into force on July 1, 2014. CASL prohibits the transmission of electronic messages for commercial purposes to an electronic address, which includes an electronic mail account, an instant messaging account, a telephone account, or any similar account, unless the recipient has consented to receiving the message and the message complies with the requirements under CASL, including the implementation of an unsubscribe mechanism. CASL further imposes certain restrictions on a service provider’s ability to automatically install or cause to be installed computer software (including software updates) on a person’s device without the person’s consent. CASL, in its current form, may impose additional costs and processes with respect to communicating with existing and prospective customers and may limit cross-selling opportunities for affiliated companies, depending on whether the appropriate consents have been obtained. Penalties for non-compliance with CASL are considerable, including administrative monetary penalties of up to 10 million Canadian dollars.
| Ritchie Bros. | 26 |
The provisions of CASL providing a private right of action were intended to come into force on July 1, 2017; however, this has been suspended by the Canadian federal government pending further review. If the provisions providing for a private right of action take effect at a later date, they will allow any person to bring claims for contravention of CASL’s terms. The private right of action may lead to increased risk of class action suits. The Canadian Radio-television and Telecommunications Commission has also begun actively enforcing CASL and penalizing non-compliant organizations.
We process, store, and use personal information and other data, which subjects us to a variety of evolving governmental regulation, industry standards and self-regulatory schemes, contractual obligations, and other legal obligations related to privacy and data protection, which may increase our costs, decrease adoption and use of our products and services and expose us to liability.
There are a number of federal, provincial, state, local laws, rules and regulations, as well as contractual obligations and industry standards, that provide for certain obligations and restrictions with respect to data privacy and security, and the collection, storage, retention, protection, use, processing, transmission, sharing, disclosure and protection of personal information and other customer data. The scope of these obligations and restrictions is changing, subject to differing interpretations, and may be inconsistent among countries or conflict with other rules, and their status remains uncertain.
Within the EU, strict laws, including EU Directive 95/46/EC, already apply in connection with the collection, storage, retention, protection, use, processing, transmission, sharing, disclosure and protection of personal information and other customer data. The EU model has been replicated substantially or in part in various jurisdictions outside the United States. Data protection regulators within the EU and other jurisdictions have the power to fine non-compliant organizations significant amounts and seek injunctive relief, including the cessation of certain data processing activities. If personal data transfers to us and by us from the EU are considered illegitimate under EU Directive 95/46/EC and applicable member states’ implementations thereof, we may face a risk of enforcement actions taken by EU data protection authorities.
Additionally, the General Data Protection Regulation (“GDPR”), which replaces the EU Directive 95/46/EC and strengthens the existing data protection regulations in the EU, is set to enter into full force on May 25, 2018. The GDPR applies to all EU citizens’ data, regardless of whether such data is collected, stored or processed within the EU. Penalties for non-compliance with the GDPR are considerable, allowing EU regulators to impose a monetary penalty equal to the greater of €100 million or 4% of a non-compliant organization’s worldwide annual sales. Such fines would be in addition to the rights of individuals to sue for damages in respect of any data privacy breach which causes them to suffer loss.
As Internet commerce and related technologies continue to evolve, thereby increasing a service provider’s capacity to collect, store, retain, protect, use, process and transmit large volumes of personal information, increasingly restrictive regulation by federal, provincial, state or foreign agencies becomes more likely. We believe that the adoption of increasingly restrictive regulation in the field of data privacy and security is likely in both the United States and in other jurisdictions, possibly as restrictive as the EU model. Obligations and restrictions imposed by current and future applicable laws, regulations, contracts and industry standards may affect our ability to provide all the current features of our products and services, and could require us to change our business practices in a manner adverse to our business.
In 2015, Canada’s federal privacy legislation was amended to implement mandatory data breach notification requirements and fines of up to 100,000 Canadian dollars per occurrence for organizations that fail to keep a log of breaches or notify the Office of the Privacy Commissioner or affected individuals. The amendments are not yet in force pending approval of related regulations, which were published for public comment in 2017. Such obligations and restrictions may limit our ability to collect, store, process, use, transmit and share data with our affiliated entities and third party partners. Compliance with, and other burdens imposed by, such obligations and restrictions could increase the cost of our operations. Failure to comply with obligations and restrictions related to data privacy and security could subject us to lawsuits, fines, criminal penalties, statutory damages, consent decrees, injunctions, adverse publicity and other losses that could harm our business.
| Ritchie Bros. | 27 |
In addition to government activity, privacy advocacy groups and industry groups have adopted and are considering the adoption of various self-regulatory standards and codes of conduct that, if applied to our business or current practices may place additional burdens on us, which may increase the costs of our products and services further reducing demand and harming our business.
Our customers may also accidentally disclose their passwords or store them on a mobile device that is lost or stolen, creating the perception that our systems are not secure against third-party access. Additionally, our third-party contractors may have access to customer data. If these or other third-party vendors violate applicable laws or our policies, such violations may also put our customers’ information at risk and could in turn have a material and adverse effect on our business. Any failure by us to protect our customers’ privacy and data, including as a result of our systems being compromised by hacking or other malicious or surreptitious activity, could result in a loss of customer confidence and ultimately in a loss of customers, which could materially and adversely affect our business.
Our articles, by-laws, shareholder rights plan and Canadian legislation contain provisions that may have the effect of delaying or preventing a change in control.
Certain provisions of our articles of amalgamation, and by-laws, as well as certain provisions of the Canada Business Corporations Act (the “CBCA”) and applicable Canadian securities law, could discourage potential acquisition proposals, delay or prevent a change in control or materially adversely impact the price that certain investors might be willing to pay for our common shares. Our articles of amalgamation authorize our board of directors to determine the designations, rights and restrictions to be attached to, and to issue an unlimited number of, junior preferred shares and senior preferred shares.
Our by-laws contain provisions establishing that shareholders must give advance notice to us in circumstances where nominations of persons for election to our board of directors are made by our shareholders other than pursuant to either a requisition of a meeting made in accordance with the provisions of the CBCA or a shareholder proposal made in accordance with the provisions of the CBCA.
Among other things, these advance notice provisions set a deadline by which shareholders must notify us in writing of an intention to nominate directors for election to the board of directors prior to any shareholder meeting at which directors are to be elected and set forth the information required in this notice for it to be valid.
Our board of directors has adopted a shareholder rights plan (the “Rights Plan”), pursuant to which we issued one right in respect of each common share outstanding. Under the Rights Plan, following a transaction in which any person becomes an “acquiring person” as defined in the Rights Plan, each right will entitle the holder to receive a number of common shares provided in the Rights Plan. The purposes of the Rights Plan are (i) to provide our board of directors time to consider value-enhancing alternatives to a take-over bid and to allow competing bids to emerge; (ii) to ensure that shareholders are provided equal treatment under a take-over bid; and (iii) to give adequate time for shareholders to properly assess a take-over bid without undue pressure. The Rights Plan can potentially impose a significant penalty on any person commencing a takeover bid that would result in the offeror becoming the beneficial owner of 20% or more of our outstanding common shares.
Any of these provisions, as well as certain provisions of the CBCA and applicable Canadian securities law, may discourage a potential acquirer from proposing or completing a transaction that may have otherwise presented a premium to our shareholders.
U.S. civil liabilities may not be enforceable against us, our directors, or our officers.
We are governed by the CBCA and our principal place of business is in Canada. Many of our directors and officers reside outside of the United States, and all or a substantial portion of their assets, as well as a substantial portion of our assets, are located outside the United States. As a result, it may be difficult for investors to effect service of process within the United States upon us and such directors and officers or to enforce judgments obtained against us or such persons, in U.S. courts, in any action, including actions predicated upon the civil liability provisions of U.S. federal securities laws or any other laws of the United States.
| Ritchie Bros. | 28 |
Additionally, rights predicated solely upon civil liability provisions of U.S. federal securities laws or any other laws of the United States may not be enforceable in original actions, or actions to enforce judgments obtained in U.S. courts, brought in Canadian courts, including courts in the Province of British Columbia.
We are governed by the corporate laws of Canada which in some cases have a different effect on shareholders than the corporate laws of Delaware.
We are governed by the CBCA and other relevant laws, which may affect the rights of shareholders differently than those of a company governed by the laws of a U.S. jurisdiction, and may, together with our charter documents, have the effect of delaying, deferring or discouraging another party from acquiring control of our company by means of a tender offer, a proxy contest or otherwise, or may affect the price an acquiring party would be willing to offer in such an instance.
| ITEM 1B: | UNRESOLVED STAFF COMMENTS |
Not applicable.
| ITEM 2: | PROPERTIES |
We own and lease various properties in Canada, the United States and 10 other countries around the world. We use the properties as auction sites and executive and administrative offices. Our corporate headquarters are located in Burnaby, Canada, and are held through a lease that expires in May 2030. We also lease a United States Leadership Office in Chicago, United States, a European head office in Breda, the Netherlands, and IronPlanet’s head office in Pleasanton, United States. We own an administrative office in Lincoln, United States.
International network of auction sites
We generally attempt to establish our auction sites in industrial areas close to major cities. Although we lease some auction sites, we have historically preferred to purchase land and construct purpose-built facilities once we have established a base of business and determined that a region can generate sufficient financial returns to justify the investment.
We generally do not construct a permanent auction site in a region until we have conducted several offsite sales in the area, and often we will operate from a regional auction site for several years before considering a more permanent investment. This process allows us to establish our business and evaluate the market potential before we make a significant investment. We will not invest in a permanent auction site unless we believe there is an opportunity for significant, profitable growth in that region. Our average expenditure on a permanent auction site has been in the range of $20 to $25 million in recent years, including land, improvements and buildings.
We currently have 45 locations in our auction site network. A permanent auction site includes locations that we own and on which we have constructed an auction theatre and other facilities (e.g. refurbishment), and that we lease with an original term longer than three years and on which we have built permanent structures with an investment of more than $1.5 million. We have 39 permanent auction sites as of the date of this Annual Report on Form 10-K.
A regional auction site is a location that we lease on a term longer than one year, have limited investment in facilities (i.e. less than $1.5 million) and on which we average more than two auctions per year on a rolling two-year basis and have at least two full time staff. This category also includes sites located on land that we own with limited investment in facilities. We have six regional auction sites as of the date of this Annual Report on Form 10-K.
| Ritchie Bros. | 29 |
Our auction site network as of the date of this discussion is as follows:
| Number of acres | Year placed | Lease | ||||||||||||||||
| Total | Developed | Developable | into service | Nature | expiry date | |||||||||||||
| Permanent auction sites | ||||||||||||||||||
| Canada: | ||||||||||||||||||
| Edmonton, Alberta | 267 | 175 | 92 | 2002 | Owned | |||||||||||||
| Grande Prairie, Alberta | 153 | 68 | 68 | 2009 | Owned | |||||||||||||
| Prince George, British Columbia1 | 114 | 60 | 50 | 2003 | Owned | |||||||||||||
| Montreal, Quebec | 91 | 68 | - | 2000 | Owned | |||||||||||||
| Toronto, Ontario | 65 | 65 | - | 1998 | Owned | |||||||||||||
| Saskatoon, Saskatchewan | 60 | 38 | 13 | 2006 | Owned | |||||||||||||
| Regina, Saskatchewan | 47 | 17 | 30 | 2007 | Owned | |||||||||||||
| Halifax, Nova Scotia | 28 | 28 | - | 1997 | Owned | |||||||||||||
| Chilliwack, British Columbia | 24 | 24 | - | 2010 | Owned | |||||||||||||
| United States: | ||||||||||||||||||
| Orlando, Florida | 227 | 189 | 27 | 2002 | Owned | |||||||||||||
| Chehalis, Washington | 204 | 131 | 40 | 2012 | Owned | |||||||||||||
| North East, Maryland | 193 | 80 | 28 | 2001 | Owned | |||||||||||||
| Denver, Colorado | 143 | 70 | 72 | 2007 | Owned | |||||||||||||
| Kansas City, Missouri | 140 | 40 | 60 | 2008 | Owned | |||||||||||||
| Columbus, Ohio | 135 | 95 | 30 | 2007 | Owned | |||||||||||||
| Houston, Texas | 128 | 116 | - | 2009 | Owned | |||||||||||||
| Minneapolis, Minnesota | 122 | 70 | 52 | 2009 | Owned | |||||||||||||
| Raleigh-Durham, North Carolina 1 | 113 | 45 | 56 | 2012 | Owned | |||||||||||||
| Fort Worth, Texas | 127 | 127 | - | 1994 | Owned | |||||||||||||
| Atlanta, Georgia | 94 | 62 | 7 | 1996 | Owned | |||||||||||||
| Chicago, Illinois | 91 | 71 | 20 | 2000 | Owned | |||||||||||||
| Sacramento, California | 90 | 90 | - | 2005 | Owned | |||||||||||||
| Nashville, Tennessee | 81 | 70 | 11 | 2006 | Owned | |||||||||||||
| Las Vegas, Nevada | 77 | 77 | - | 2012 | Leased | 31-May-33 | ||||||||||||
| St Louis, Missouri1 | 67 | 63 | 4 | 2010 | Owned | |||||||||||||
| Los Angeles, California | 65 | 63 | 2 | 2000 | Owned | |||||||||||||
| Phoenix, Arizona | 48 | 48 | - | 2002 | Owned | |||||||||||||
| Salt Lake City, Utah | 37 | 37 | - | 2010 | Leased | 28-Feb-24 | ||||||||||||
| Albuquerque, New Mexico1 | 11 | 11 | - | 1999 | Owned | |||||||||||||
| Albuquerque, New Mexico | 4 | 1 | 2 | 2010 | Leased | 15-May-18 | ||||||||||||
| Ritchie Bros. | 30 |
| Number of acres | Year placed | Lease | ||||||||||||||||
| Total | Developed | Developable | into service | Nature | expiry date | |||||||||||||
| Permanent auction sites | ||||||||||||||||||
| (continued) | ||||||||||||||||||
| Other: | ||||||||||||||||||
| Mexico City (Polotitlan), Mexico | 324 | 82 | 207 | 2008 | Owned | |||||||||||||
| Madrid (Ocaña), Spain | 85 | 65 | 20 | 2010 | Owned | |||||||||||||
| Moerdijk, The Netherlands | 62 | 62 | - | 1999 | Owned | |||||||||||||
| Milan (Caorso), Italy | 62 | 42 | 10 | 2010 | Owned | |||||||||||||
| Paris (St. Aubin sur Gaillon), France | 50 | 50 | - | 2008 | Owned | |||||||||||||
| Dubai, United Arab Emirates | 44 | 44 | - | 1999 | Leased | 30-Jun-19 | ||||||||||||
| Brisbane, Australia | 42 | 42 | - | 1999 | Owned | |||||||||||||
| Meppen, Germany | 41 | 41 | - | 2010 | Leased | 31-Oct-19 | ||||||||||||
| Melbourne (Geelong), Australia | 40 | 40 | - | 2013 | Owned | |||||||||||||
| Tokyo (Narita), Japan | 17 | 17 | - | 2010 | Owned | |||||||||||||
| Number of acres | Year placed | Lease | ||||||||||||||||
| Total | Developed | Developable | into service | Nature | expiry date | |||||||||||||
| Regional auction sites | ||||||||||||||||||
| Tipton, United States | 60 | 60 | - | 2010 | Leased | 30-Jun-21 | ||||||||||||
| Manchester, United States1 | 54 | 25 | 10 | 2013 | Leased | 1-Oct-18 | ||||||||||||
| North Franklin, United States | 23 | 23 | - | 2017 | Leased | 31-Jul-21 | ||||||||||||
| North Battleford, Canada | 21 | 11 | 10 | 2017 | Leased | 14-Nov-19 | ||||||||||||
| Lethbridge, Canada | 24 | 20 | 4 | 2011 | Leased | 31-Dec-19 | ||||||||||||
| Donington Park, United Kingdom2 | 11 | 11 | - | 2012 | Leased | 31-Dec-18 | ||||||||||||
| (1) | On November 9, 2017, we announced the closure of these Northern American sites. See further details below. |
| (2) | We received early notification from the landlord that the lease for Donington Park will be terminated effective December 31, 2018 instead of December 31, 2020. We intend to continue operating in the United Kingdom and, as such are exploring alternative sites within this region for relocation. |
We also own the following developable properties that are not currently under development but are available for future auction site expansion:
| Number | Year | |||||||
| of acres | acquired | |||||||
| Casa Grande, United States | 125 | 2010 | ||||||
| Tulare, United States | 99 | 2011 | ||||||
We believe that our administrative offices and developed auction sites are adequate and suitable for the conduct of our operations. Further, we believe that our properties that are being developed to expand our existing auction sites are sufficient to support the growth of our live on site business.
| Ritchie Bros. | 31 |
The closure of five North American auction sites, as note above, was completed at the end of 2017. We have provided termination notices on the leased sites and we are exploring various options towards the future use of the owned sites, including sale or lease. The closure of these five sites is one element of an overall strategy to grow larger live auction events at the remaining yards as well as grow the online auction and online marketplace channels.
In mid-2017, with the acquisition of Iron Planet and signing of the strategic relationship with Caterpillar, we were able to conduct a very successful auction in our Narita, Japan yard which we had previously considered exiting given our shift to increased digital sales in that market. We have decided to continue to utilize the Narita yard in 2018 to conduct more live auctions in partnership with Nippon Cat and will not be pursuing any disposition of the Narita yard at this time.
| ITEM 3: | LEGAL PROCEEDINGS |
We have no material legal proceedings pending, other than ordinary routine litigation incidental to the business, and we do not know of any material proceedings contemplated by governmental authorities.
| ITEM 4: | MINE SAFETY DISCLOSURES |
Not applicable.
| Ritchie Bros. | 32 |
| ITEM 5: | MARKET FOR REGISTRANT’S COMMON EQUITY, RELATED STOCKHOLDER MATTERS, AND ISSUER PURCHASES OF EQUITY SECURITIES |
Outstanding Share Data
We are a public company and our common shares are listed under the symbol “RBA” on the New York Stock Exchange (“NYSE”) and the Toronto Stock Exchange (“TSX”). Financial information about our equity and share-based payments is set forth in our consolidated financial statement footnotes 27 “Equity and Dividends” and 28 “Share-based Payments” in “Part II, Item 8: “Financial Statements and Supplementary Data” of this Annual Report on Form 10-K.
Market Information
Our common shares, without par value, are issued in registered form. The transfer agent for the shares is Computershare Trust Company of Canada, 100 University Avenue, 9th Floor, Toronto, Ontario M5J 2Y1. Our common shares trade on the NYSE and on the TSX under the symbol “RBA”. On February 23, 2018, there were 322 holders of record of our common shares that do not include the shareholders for whom shares are held in a nominee or street name.
The following table sets forth the high and low prices of our common shares by quarter for 2017 and 2016:
| NYSE (US dollars) | TSX (Canadian dollars) | |||||||||||||||
| Quarter ended | High | Low | High | Low | ||||||||||||
| December 31, 2017 | $ | 31.66 | $ | 24.08 | $ | 39.57 | $ | 30.63 | ||||||||
| September 30, 2017 | $ | 31.75 | $ | 26.68 | $ | 39.47 | $ | 34.03 | ||||||||
| June 30, 2017 | $ | 33.00 | $ | 27.65 | $ | 44.95 | $ | 36.64 | ||||||||
| March 31, 2017 | $ | 35.21 | $ | 30.41 | $ | 46.58 | $ | 40.07 | ||||||||
| December 31, 2016 | $ | 39.96 | $ | 33.50 | $ | 52.88 | $ | 45.47 | ||||||||
| September 30, 2016 | $ | 36.79 | $ | 27.13 | $ | 48.29 | $ | 34.80 | ||||||||
| June 30, 2016 | $ | 34.69 | $ | 26.41 | $ | 44.20 | $ | 34.58 | ||||||||
| March 31, 2016 | $ | 27.59 | $ | 21.03 | $ | 35.75 | $ | 29.73 | ||||||||
Dividend Policy
We currently pay a regular quarterly cash dividend of $0.17 per common share. We currently intend to continue to declare and pay a regular quarterly cash dividend on our common shares; however, any decision to declare and pay dividends in the future will be made at the discretion of our Board, after considering our operating results, financial condition, cash requirements, financing agreement restrictions and any other factors our Board may deem relevant. In 2017, we paid total cash dividends of $0.68 per common share, compared to $0.66 per common share in 2016, and $0.60 per common share in 2015.
Because Ritchie Bros. Auctioneers Incorporated is a holding company with no material assets other than the shares of its subsidiaries, our ability to pay dividends on our common shares depends on the income and cash flow of our subsidiaries. No financing agreements to which our subsidiaries are party currently restrict those subsidiaries from paying dividends.
Pursuant to income tax legislation, Canadian resident individuals who receive “eligible dividends” in 2006 and subsequent years will be entitled to an enhanced gross-up and dividend tax credit on such dividends. All dividends that we pay are “eligible dividends” unless indicated otherwise.
| Ritchie Bros. | 33 |
Comparison of Cumulative Return
The following graph compares the cumulative return on a $100 investment in our common shares over the last five fiscal years beginning December 31, 2012 through December 31, 2017, to that of the cumulative return on a $100 investment in the Russell Global Index (“Russell 2000”), the S&P / TSX Composite Index (“S&P/TSX”) and the Dow Jones Industrial Average Index (“DJIA”) for the same period. In calculating the cumulative return, reinvestment of dividends, if any, is assumed. The indices are included for comparative purpose only. This graph is not “soliciting material,” is not deemed filed with the SEC and is not to be incorporated by reference in any of our filings under the Securities Act or the Exchange Act, whether made before or after the date hereof and irrespective of any general incorporation language in any such filing.
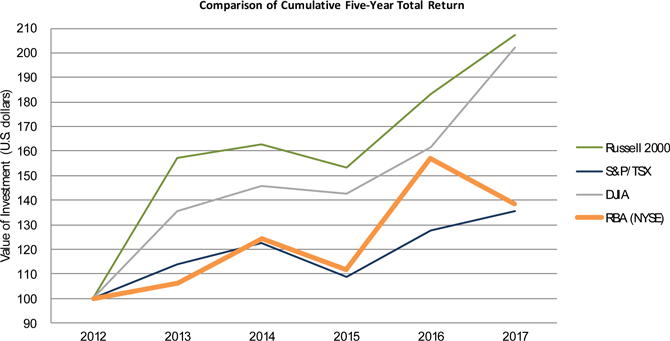
| Company / index | 2012 | 2013 | 2014 | 2015 | 2016 | 2017 | ||||||||||||||||||
| RBA (NYSE) | $ | 100.00 | $ | 106.14 | $ | 124.23 | $ | 111.91 | $ | 156.97 | $ | 138.63 | ||||||||||||
| Russell 2000 | $ | 100.00 | $ | 157.05 | $ | 162.59 | $ | 153.31 | $ | 183.17 | $ | 207.24 | ||||||||||||
| S&P/TSX | $ | 100.00 | $ | 113.94 | $ | 122.39 | $ | 108.82 | $ | 127.88 | $ | 135.58 | ||||||||||||
| DJIA | $ | 100.00 | $ | 135.68 | $ | 145.88 | $ | 142.62 | $ | 161.76 | $ | 202.33 | ||||||||||||
| Ritchie Bros. | 34 |
Securities Authorized for Issuance under Equity Compensation Plans
The following table is as of December 31, 2017:
| Number of securities to be issued upon exercise of outstanding options, warrants and rights | Weighted average exercise price of outstanding options, warrants and rights | Number of securities remaining available for future issuance under equity compensation plans (excluding securities reflected in column (a)) | ||||||||||
| Plan Category | (a) | (b) | (c) | |||||||||
| Equity compensation plans approved by security holders | 5,278,385 | (1) | $ | 24.29 | (2) | 4,459,270 | (3) | |||||
| Equity compensation plans not approved by security holders | - | - | - | |||||||||
| Total | 5,278,385 | $ | 24.29 | 4,459,270 | ||||||||
| (1) | Reflects our stock option plans, performance share units (“PSUs”) granted under the Senior Executive PSU Plan (March 2015) and the Employee PSU Plan (March 2015) (together, the “2015 PSU Plans”), Sign-On Grant PSUs granted to our Chief Executive Officer (“CEO”) (the “CEO SOG PSUs”) and equity-classified restricted share units. This amount reflects 100% of target number of PSUs granted and includes dividend equivalent rights credited in connection with such PSUs. |
Under the 2015 PSU Plans, the number of PSUs that vest is conditional upon specified market, service, and performance vesting conditions being met. The market vesting condition is based on the relative performance of our share price in comparison to the performance of a pre-determined portfolio of other companies’ share prices. The non-market vesting conditions are based on the achievement of specific performance measures and can result in participants earning between 0% and 200% of the target number of PSUs granted. Further, the Company has the option to choose whether to settle the PSUs in cash or in shares.
The CEO SOG PSUs are subject to service and market vesting conditions based on the relative performance of our share price in comparison to the performance of a pre-determined portfolio of other companies’ share prices and can result in earning between 0% and 200% of the target number of SOG PSUs granted.
For a further description of our stock option plans and share unit plans, see “Part II, Item 8: Financial Statements and Supplementary Data”.
| (2) | Weighted average exercise price does not include the effect of our outstanding share units. |
| (3) | Consists of: |
| a. | 3,402,481 common shares available for issuance Amended and Restated Stock Option Plan, the IronPlanet 1999 Stock Plan, and the IronPlanet 2015 Stock Plan. |
| b. | 1,000,000 common shares that we may elect to issue upon settlement of our PSUs granted under the 2015 PSU Plans. |
| c. | 146,789 common shares that we may elect to issue upon settlement of our CEO SOG PSUs. |
Issuer Purchases of Equity Securities
Share repurchase program
No share repurchases were made pursuant to our Normal Course Issuer Bid (“NCIB”), which expired March 2, 2017, or by any other means during 2017. For details of the March 2016 share repurchases pursuant to our NCIB, refer to “Part II, Item 8: Financial Statements and Supplementary Data” presented elsewhere in this Annual Report on Form 10-K.
Exchange Controls
Canada has no system of exchange controls. There are no Canadian restrictions on the repatriation of capital or earnings of a Canadian public company to non-resident investors. There are no laws in Canada or exchange restrictions affecting the remittance of dividends, profits, interest, royalties and other payments to U.S. Resident Holders (as defined below) of our common shares, except as discussed in “Certain Canadian Federal Income Tax Considerations for U.S. Residents” below.
| Ritchie Bros. | 35 |
There are no limitations under the laws of Canada or in our organizational documents on the right of foreigners to hold or vote our common shares, except that the Investment Canada Act may require review and approval by the Minister of Industry (Canada) of certain acquisitions of control of Ritchie Bros. by a “non-Canadian”. “Non-Canadian” generally means an individual who is not a Canadian citizen, or a corporation, partnership, trust or joint venture that is ultimately controlled by non-Canadians.
Certain Canadian Federal Income Tax Considerations for U.S. Residents
The following summarizes certain Canadian federal income tax consequences generally applicable under the Income Tax Act (Canada) and the regulations enacted thereunder (collectively, the “Canadian Tax Act”) and the Canada-United States Income Tax Convention (1980) (the “Convention”) to the holding and disposition of common shares.
This comment is restricted to holders of common shares each of whom, at all material times for the purposes of the Canadian Tax Act and the Convention, (i) is resident solely in the United States, (ii) is entitled to the full benefits of the Convention, (iii) holds all common shares as capital property, (iii) holds no common shares that are “taxable Canadian property” (within the meaning of the Canadian Tax Act) of the holder, (iv) deals at arm’s length with and is not affiliated with Ritchie Bros., (v) does not and is not deemed to use or hold any common shares in a business carried on in Canada, and (vi) is not an insurer that carries on business in Canada and elsewhere (each such holder, a “U.S. Resident Holder”).
Certain U.S.-resident entities that are fiscally transparent for United States federal income tax purposes (including limited liability companies) may not be regarded by the Canada Revenue Agency (“CRA”) as entitled to the benefits of the Convention. Members of or holders of an interest in such an entity that holds common shares should consult their own tax advisers regarding the extent, if any, to which the CRA will extend the benefits of the Convention to the entity in respect of its common shares.
Generally, a U.S. Resident Holder’s common shares will be considered to be capital property of a U.S. Resident Holder provided that the U.S. Resident Holder acquired the common shares as a long-term investment; is not a trader or dealer in securities; did not acquire, hold or dispose of the common shares in one or more transactions considered to be an adventure or concern in the nature of trade (i.e. speculation); and does not hold the common shares as inventory in the course of carrying on a business.
This summary is based on the current provisions of the Canadian Tax Act and the Convention in effect on the date hereof, all specific proposals to amend the Canadian Tax Act and Convention publicly announced by or on behalf of the Minister of Finance (Canada) on or before the date hereof, and the current published administrative and assessing policies of the CRA. It is assumed that all such amendments will be enacted as currently proposed, and that there will be no other material change to any applicable law or administrative or assessing practice, whether by judicial, legislative, governmental or administrative decision or action, although no assurance can be given in these respects. Except as otherwise expressly provided, this summary does not take into account any provincial, territorial or foreign tax considerations, which may differ materially from those set out herein.
This summary is of a general nature only and it is not intended to be, nor should it be construed to be, legal or tax advice to any holder of common shares, and no representation with respect to Canadian federal income tax consequences to any holder of common shares is made herein. Accordingly, holders of common shares should consult their own tax advisers with respect to their individual circumstances.
Disposition of common shares
A U.S. Resident Holder will not be subject to tax under the Canadian Tax Act in respect of any capital gain realized by such U.S. Resident Holder on a disposition of common shares unless the common shares constitute “taxable Canadian property” (within the meaning of the Canadian Tax Act) of the U.S. Resident Holder at the time of disposition and the U.S. Resident Holder is not entitled to relief under the Convention.
| Ritchie Bros. | 36 |
Generally, a U.S. Resident Holder’s common shares will not constitute “taxable Canadian property” of the U.S. Resident Holder at a particular time at which the common shares are listed on a “designated stock exchange” (which currently includes the TSX and NYSE) unless at any time during the 60-month period immediately preceding a disposition both of the following conditions are true:
| (i) | the U.S. Resident Holder, any one or more persons with whom the U.S. Resident Holder does not deal at arm’s length, or any partnership in which the holder or persons with whom the holder did not deal at arm’s length holds a membership interest directly or indirectly through one or more partnerships, alone or in any combination, owned 25% or more of the issued shares of any class or series of our share capital; and |
| (ii) | more than 50% of the fair market value of the common shares was derived directly or indirectly from, or from any combination of, real or immovable property situated in Canada, “Canadian resource properties” (as defined in the Canadian Tax Act), “timber resource properties” (within the meaning of the Canadian Tax Act), or options in respect of, interests in or civil law rights in, such properties whether or not such properties exist. |
In certain circumstances, a common share may be deemed to be “taxable Canadian property” for purposes of the Canadian Tax Act.
Even if the common shares constitute “taxable Canadian property” to a U.S. Resident Holder, under the Convention, such a U.S. Resident Holder will not be subject to tax under the Canadian Tax Act on any capital gain realized by such holder on a disposition of such common shares, provided the value of such common shares is not derived principally from real property situated in Canada (within the meaning of the Convention).
U.S. Resident Holders whose shares may be taxable Canadian property should consult their own tax advisors.
Dividends on common shares
Under the Canadian Tax Act, dividends on shares paid or credited to a non-resident of Canada (or amounts paid or credited on account, or in lieu of payment of, or in satisfaction of, dividends) will be subject to Canadian withholding tax at the rate of 25% of the gross amount of the dividends (subject to reduction under the provisions of any applicable tax treaty). Under the Convention, a U.S. resident that beneficially owns the dividends will generally be subject to Canadian withholding tax at the rate of 15% of the gross amount of such dividends unless the beneficial owner is a company which owns at least 10% of the voting shares of Ritchie Bros. at that time, in which case the rate of Canadian withholding tax is generally reduced to 5%.
| Ritchie Bros. | 37 |
| ITEM 6: | SELECTED FINANCIAL DATA |
The following table sets forth selected consolidated financial data as of and for the years ended December 31, 2013 through December 31, 2017. The consolidated financial statements have been prepared in accordance with U.S. generally accepted accounting principles (“U.S. GAAP”). Prior to 2015, our consolidated financial statements were prepared in accordance with International Financial Reporting Standards as issued by the International Accounting Standards Board (“IFRS”). All prior periods presented below have been restated from IFRS to U.S. GAAP. The following selected consolidated financial information should be read in conjunction with “Part II, Item 7: Management’s Discussion and Analysis of Financial Conditions and Results of Operations” and the consolidated financial statements and the notes thereto included in “Part II, Item 8: Financial Statements and Supplementary Data” presented elsewhere in this Annual Report on Form 10-K. Also see “Recently Adopted Accounting Pronouncements” included in the notes to the consolidated financial statements included elsewhere in this Annual Report on Form 10-K.
| (in U.S.$000's, except per | Year ended and as at December 31, | |||||||||||||||||||
| share amounts) | 2017 | 2016 | 2015 | 2014 | 2013 | |||||||||||||||
| Consolidated Income Statements Data | ||||||||||||||||||||
| Revenues | $ | 610,517 | $ | 566,395 | $ | 515,875 | $ | 481,097 | $ | 467,403 | ||||||||||
| Operating income | 107,454 | 135,722 | 174,840 | 127,927 | 136,959 | |||||||||||||||
| Income before income taxes | 77,394 | 130,494 | 176,436 | 129,038 | 134,755 | |||||||||||||||
| Net income attributable to stockholders | 75,027 | 91,832 | 136,214 | 90,981 | 93,644 | |||||||||||||||
| Earnings per share attributable to stockholders: | ||||||||||||||||||||
| Basic | $ | 0.70 | $ | 0.86 | $ | 1.27 | $ | 0.85 | $ | 0.88 | ||||||||||
| Diluted | 0.69 | 0.85 | 1.27 | 0.85 | 0.87 | |||||||||||||||
| Consolidated Balance Sheets Data | ||||||||||||||||||||
| Working capital | $ | 120,032 | $ | 125,164 | $ | 140,133 | $ | 140,482 | $ | 110,205 | ||||||||||
| Total assets | 2,017,312 | 1,599,533 | 1,120,115 | 1,121,510 | 1,161,985 | |||||||||||||||
| Long-term debt | 812,892 | 595,706 | 97,915 | 110,846 | 177,234 | |||||||||||||||
| Contingently redeemable non-controlling interests | - | - | 24,785 | 17,287 | 8,303 | |||||||||||||||
| Stockholders' equity | 739,682 | 687,057 | 703,176 | 691,932 | 686,095 | |||||||||||||||
| Consolidated Statements of Cash Flows Data | ||||||||||||||||||||
| Dividends declared per common share | $ | 0.68 | $ | 0.66 | $ | 0.60 | $ | 0.54 | $ | 0.51 | ||||||||||
| Acquisition of subsidiaries, net of cash acquired | $ | 675,851 | $ | 45,511 | $ | 12,107 | $ | - | $ | - | ||||||||||
| Net capital spending | 34,411 | 29,785 | 14,152 | 29,595 | 37,066 | |||||||||||||||
Subsidiaries acquired as disclosed in the table above consist of IronPlanet in May 2017, Kramer in November 2016, Petrowsky in August 2016, Mascus in February 2016, and Xcira in November 2015.
| Ritchie Bros. | 38 |
| ITEM 7: | MANAGEMENT’S DISCUSSION AND ANALYSIS OF FINANCIAL CONDITION AND RESULTS OF OPERATIONS |
About Us
Ritchie Bros. Auctioneers Incorporated (“Ritchie Bros.”, the “Company”, “we”, or “us”) (NYSE & TSX: RBA) is a world leader in asset management and disposition of used industrial equipment and other durable assets, selling $4.5 billion of used equipment and other assets during 2017. Our expertise, unprecedented global reach, market insight, and trusted portfolio of brands provide us with a unique position in the used equipment market. We primarily sell used equipment for our customers through live, unreserved auctions at 45 auction sites worldwide, which are simulcast online to reach a global bidding audience. On May 31, 2017, we acquired IronPlanet Holdings, Inc. (“IronPlanet”) for $776.5 million, a leading online marketplace for heavy equipment and other durable assets (the “Acquisition”). These complementary used equipment brand solutions, together with Marketplacee, our online marketplace that supports reserved pricing, provide different value propositions to equipment owners and allow us to meet the needs and preferences of a wide spectrum of equipment sellers and buyers. In the past three years, we have also added a private brokerage service (Ritchie Bros. Private Treaty) and an online listing service (Mascus).
During 2017, we continued to integrate our IronPlanet acquisition, which resulted in changes in our basis of organization, including our leadership structure, sales processes, and management reporting. Most significantly, we began to assess the performance of our business and allocate resources based on whether our services are transactional (generating value from the disposition of assets) or non-transactional in nature, and redesigned key metrics accordingly. These changes resulted in the identification of the following new operating segments:
| · | Auctions and Marketplaces (“A&M”) – This is our only reportable segment, which consists of our live on site auctions, online auctions and marketplaces, and brokerage service; |
| · | Ritchie Bros. Financial Services (“RBFS”) – This is our financial brokerage service, which is reported within the “other” category of our segmented information; and |
| · | Mascus – This is our online listing service, which is reported within the “other” category of our segmented information. |
The “other” category also includes results from various value-added services and make-ready activities, including our equipment refurbishment services, Asset Appraisal Services (“AAS”), and logistical services through Ritchie Bros. Logistics (“RB Logistics”).
Key performance metric changes
Our new segmented information disclosure distinguishes between revenues and expenses generated from transactional asset disposition services, which are services that generate Gross Transaction Value3 (“GTV”), and those that do not generate GTV. GTV replaces the previous term of Gross Auction Proceeds (“GAP”) used by Ritchie Bros. and Gross Merchandise Volume used by IronPlanet, providing a common nomenclature across all channels.
With the change in segment reporting, we updated our GTV and Revenue Rate key metrics. GTV represents the total proceeds from all items sold in conjunction with our A&M segment. We have retrospectively restated GTV to exclude GTV from our AAS business. GTV attributable to AAS was $18.6 million during the period from IronPlanet acquisition until December 31, 2017. In addition, effective August 1, 2017, GTV no longer includes EquipmentOne buyer premiums. Excluding AAS GTV and EquipmentOne buyer premiums has a less than 1% impact on GTV reported to date.
| 3 | GTV represents total proceeds from all items sold at our live on site auctions and online marketplaces. GTV is not a measure of financial performance, liquidity, or revenue, and is not presented in our consolidated financial statements. |
| Ritchie Bros. | 39 |
We also introduced a segment Revenue Rate, which is calculated as A&M segment revenue divided by GTV. When referring to the original Revenue Rate metric, which is calculated as total, consolidated revenues divided by GTV, we will use the term ‘Consolidated Revenue Rate’.
Overview
The following discussion and analysis summarizes significant factors affecting our consolidated operating results and financial condition for the years ended December 31, 2017, 2016, and 2015. This discussion and analysis should be read in conjunction with the “Cautionary Note Regarding Forward-Looking Statements”, “Part II, Item 6: Selected Financial Data”, and the consolidated financial statements and the notes thereto included in “Part II, Item 8. Financial Statements and Supplementary Data” presented in this Annual Report on Form 10-K. This discussion and analysis contains forward-looking statements that involve risks and uncertainties.
Our actual results could differ materially from those expressed or implied in any forward-looking statements due to various factors, including those set forth under “Part I, Item 1A: Risk Factors” in this Annual Report on Form 10-K. The date of this discussion is as of February 26, 2018.
We prepare our consolidated financial statements in accordance with United States generally accepted accounting principles (“US GAAP”). Except for GTV, which is a measure of operational performance and not a measure of financial performance, liquidity, or revenue, the amounts discussed below are based on our consolidated financial statements. Unless indicated otherwise, all tabular dollar amounts, including related footnotes, presented below are expressed in thousands of United States (“U.S.”) dollars.
We make reference to various non-GAAP financial measures throughout this discussion and analysis. These measures do not have a standardized meaning, and are therefore unlikely to be comparable to similar measures presented by other companies.
Consolidated Highlights
Financial highlights
Key highlights for fiscal 2017 were:
| · | GTV of $4.5 billion; a 3% increase over 2016 |
| · | Revenues of $610.5 million; an increase of 8% versus $566.4 million in 2016 |
| · | Consolidated Revenue Rate of 13.66%; a 59 basis points (“bps”) increase over 2016 |
| · | A&M segment revenues up 6% with segment Revenue Rate up 36 bps to 12.63% versus 12.27% in 2016 |
| · | Revenues from other services of $46.2 million; an increase of 34% compared to 2016 |
| · | Cash provided by operating activities of $146.3 million after interest expense of $33.2 million in 2017 resulting from the additional debt undertaken for the IronPlanet acquisition |
| · | Declared quarterly dividends aggregating to $0.68 per common share in 2017 |
Our 2017 financial performance was influenced by a few notable factors: first, our business experienced broad-based effects of unprecedented demand for infrastructure projects. This led to high equipment utilization rates and an overall equipment shortage, principally in the United States, resulting in lower than expected full year GTV and revenue performance. Other notable factors included:
| · | Our Columbus, United States, live on site auction, which generated $76.6 million of GTV in the third quarter of 2016 compared to $10.5 million in the third quarter of 2017; |
| · | Our largest-ever auction in Grande Prairie, Canada, in March 2016, which generated more than $46.0 million (62.0 million Canadian dollars) of GTV, with no similar auction on the calendar in 2017; and |
| Ritchie Bros. | 40 |
| · | A volume decrease in our underwritten business, most significantly in Western Canada, where we continued to see fewer disposals of oil and gas assets due to commodity price improvements. |
In addition, we completed the significant acquisition of IronPlanet and immersed ourselves in the integration of the businesses. During the integration, we experienced some temporary sales productivity decline, which was expected due to the size of the Acquisition.
In 2017, we generated $75.0 million of net income attributable to stockholders. Diluted earnings per share (“EPS”) attributable to stockholders was $0.69 including $38.3 million of acquisition-related costs and $38.3 million of interest expense, compared to a diluted EPS attributable to stockholders of $0.85 in 2016. Diluted adjusted EPS attributable to stockholders4 (non-GAAP measure) decreased 30% to $0.81 in 2017 from $1.15 in 2016.
Operational highlights
In 2017, our operational focus was on executing our A&M business while integrating the IronPlanet acquisition. Some notable highlights were:
| · | Completing the IronPlanet acquisition – the financing of which significantly increased our debt levels – which accelerated our multi-channel evolution and digital capabilities, while providing customers with unprecedented choice in our online marketplaces. |
| · | Achieving our 2017 integration milestones, which included the following accomplishments: |
| § | Integrating the separate Ritchie Bros. and IronPlanet sales teams into a single, unified, customer-facing sales force. |
| § | Completing the first phase of the technology integration – The Sales Unification Phase. This phase provides our sales teams with the ability to sell across platforms and integrate pricing and appraisal tools. |
| § | Combining EquipmentOne and IronPlanet’s Daily Marketplace to create our Marketplacee solution; a premium service offering unprecedented control and selection for buyers. |
| § | Delivering growth of 6% and 16% in GTV and revenues, respectively, in our business outside of the United States and Canada in 2017 compared to 2016. |
| § | Expanding RBFS capabilities to the broader customer base. |
| § | Initiating a harmonization of our live on site auction transaction fee structure with that of our online marketplace. The new harmonized fee structure, which will take effect in 2018, is intended to make customers channel agnostic with respect to purchasing equipment. The harmonization is expected to increase our fee revenues. |
| § | Staying on track to realize $20 million in run-rate IronPlanet acquisition synergies by the end of fiscal 2018. |
| · | Realizing positive equipment pricing due to the robust equipment demand environment combined with lower supply. |
| · | Expanding our government business in North America and the United Kingdom. |
| · |
Initiating our operational efficiency and site optimization program, the Acquisition enabled us to leverage our asset base more effectively. Specifically, our post-acquisition multi-channel product suite enabled us to execute the strategy to cease live on site auction operations at five sites. We will continue to drive volume from those regions to our online marketplaces and other live on site auction locations. |
| 4 | Diluted adjusted EPS attributable to stockholders is a non-GAAP financial measure. We believe that comparing diluted adjusted EPS attributable to stockholders for different financial periods provides useful information about the growth or decline of our diluted EPS attributable to stockholders for the relevant financial period, and eliminates the financial impact of adjusting items we do not consider to be part of our normal operating results. Diluted adjusted EPS attributable to stockholders is calculated by dividing adjusted net income attributable to stockholders (non-GAAP measure) (described in footnote 7), net of the effect of dilutive securities, by the weighted average number of dilutive shares outstanding. Diluted adjusted EPS attributable to stockholders is reconciled to the most directly comparable GAAP measures in our consolidated financial statements under “Non-GAAP Measures” below. |
| Ritchie Bros. | 41 |
| · | Leveraging our alliance with Caterpillar to gain momentum on dealer transactions, with 52 contracts signed in North America and 21 internationally. |
Results of Operations
| Financial overview | Year ended December 31, | |||||||||||||||||||||||||||
| $ Change | % Change | |||||||||||||||||||||||||||
| (in U.S. $000's, except EPS) | 2017 | 2016 | 2015 | 2017 over 2016 | 2016 over 2015 | 2017 over 2016 | 2016 over 2015 | |||||||||||||||||||||
| Revenues | $ | 610,517 | $ | 566,395 | $ | 515,875 | $ | 44,122 | $ | 50,520 | 8 | % | 10 | % | ||||||||||||||
| Costs of services, excluding depreciation and amortization ("D&A") | 79,013 | 66,062 | 56,026 | 12,951 | 10,036 | 20 | % | 18 | % | |||||||||||||||||||
| Selling, general and administrative expenses | 323,270 | 283,529 | 254,389 | 39,741 | 29,140 | 14 | % | 11 | % | |||||||||||||||||||
| Acquisition-related costs | 38,272 | 11,829 | 601 | 26,443 | 11,228 | 224 | % | 1868 | % | |||||||||||||||||||
| D&A expenses | 52,694 | 40,861 | 42,032 | 11,833 | (1,171 | ) | 29 | % | (3 | %) | ||||||||||||||||||
| Gain on disposal of property, plant and equipment | (1,656 | ) | (1,282 | ) | (9,691 | ) | (374 | ) | 8,409 | 29 | % | (87 | %) | |||||||||||||||
| Impairment loss | 8,911 | 28,243 | - | (19,332 | ) | 28,243 | (68 | %) | 100 | % | ||||||||||||||||||
| Foreign exchange loss (gain) | 2,559 | 1,431 | (2,322 | ) | 1,128 | 3,753 | 79 | % | (162 | %) | ||||||||||||||||||
| Operating income | 107,454 | 135,722 | 174,840 | (28,268 | ) | (39,118 | ) | (21 | %) | (22 | %) | |||||||||||||||||
| Operating income margin | 17.6 | % | 24.0 | % | 33.9 | % | n/a | n/a | -640 bps | -990 bps | ||||||||||||||||||
| Other income (expense) | (30,060 | ) | (5,228 | ) | 1,596 | (24,832 | ) | (6,824 | ) | 475 | % | (428 | %) | |||||||||||||||
| Income tax expense | 2,088 | 36,982 | 37,861 | (34,894 | ) | (879 | ) | (94 | %) | (2 | %) | |||||||||||||||||
| Net income attributable to stockholders | 75,027 | 91,832 | 136,214 | (16,805 | ) | (44,382 | ) | (18 | %) | (33 | %) | |||||||||||||||||
| Diluted EPS attributable to stockholders | $ | 0.69 | $ | 0.85 | $ | 1.27 | $ | (0.16 | ) | $ | (0.42 | ) | (19 | %) | (33 | %) | ||||||||||||
| Effective tax rate | 2.7 | % | 28.3 | % | 21.5 | % | n/a | n/a | -2560 bps | 680 bps | ||||||||||||||||||
| GTV | $ | 4,467,982 | $ | 4,334,815 | $ | 4,247,635 | $ | 133,167 | $ | 87,180 | 3 | % | 2 | % | ||||||||||||||
| Consolidated Revenue Rate | 13.66 | % | 13.07 | % | 12.14 | % | n/a | n/a | 59 bps | 93 bps | ||||||||||||||||||
| A&M segment: | ||||||||||||||||||||||||||||
| Revenues | 564,298 | 531,826 | 505,865 | 32,472 | 25,961 | 6 | % | 5 | % | |||||||||||||||||||
| Revenue Rate | 12.63 | % | 12.27 | % | 11.91 | % | n/a | n/a | 36 bps | 36 bps | ||||||||||||||||||
Revenues
Our revenues are comprised of:
| · | commissions earned at our live on site auctions and online marketplace sales where we act as an agent for consignors of equipment and other assets; and |
| · | fees earned in the process of conducting live on site auctions and online marketplace sales, including online marketplace listing and inspection fees, fees from value-added services and make-ready activities, as well as fees paid by buyers on online marketplace sales. |
| Ritchie Bros. | 42 |
Revenues increased $44.1 million, or 8%, in 2017 compared to 2016. This increase was primarily due to the Acquisition, which closed on May 31, 2017, and increases in revenues from RBFS, Mascus, and value-added services. Unaudited pro forma revenues decreased 2% from $676.2 million in 2016 to $659.9 million in 2017. Foreign exchange rates had a positive impact on revenues in 2017 as a significant portion of revenues are in Canada and the Netherlands.
Revenues increased $50.5 million, or 10%, in 2016 compared to 2015. This increase was primarily due to the performance of our underwritten business, volume increases in GTV, and increases in revenues from Mascus, RBFS, and our value-added services. This increase was partially offset by a negative foreign exchange rate impact on revenues in 2016.
Geographic analysis
The distribution of our revenues across the geographic regions in which we operate was as follows, where the geographic location of revenues corresponds to the location in which the sale occurred, or in the case of online sales, where the company earning the revenues is incorporated:
| Revenue distribution | Canada | Outside of Canada | United States | Europe | Other | |||||||||||||||
| Year ended December 31, 2017 | 28 | % | 72 | % | 53 | % | 11 | % | 8 | % | ||||||||||
| Year ended December 31, 2016 | 33 | % | 67 | % | 49 | % | 9 | % | 9 | % | ||||||||||
| Year ended December 31, 2015 | 32 | % | 68 | % | 50 | % | 9 | % | 9 | % | ||||||||||
On a U.S. dollar basis, the proportion of revenue earned in the United States and Europe grew during 2017 compared to 2016. Growth in the United States over the comparative period was primarily due to the Acquisition. Growth in Europe was primarily due to the performance of our live on site auction activities in Spain, as well as an increase in revenues from Mascus. The decrease in Canada was primarily driven by changes in our auction calendar and fewer oil and gas dispersals in Western Canada. Regarding auction calendar changes, we held the largest-ever auction in Grande Prairie in the first quarter of 2016 that generated over $46.0 million (62.0 million Canadian dollars) of GTV, with no similar auction on the Canadian calendar in 2017.
The proportion of revenue grew in Canada in 2016 compared to 2015, primarily due to the performance of our underwritten business, volume increases in GTV, and increases in revenues from RBFS, Mascus, and our value-added services.
Gross Transaction Value
We believe that revenues are best understood by considering their relationship with GTV. The following table presents GTV by channel:
| (in U.S. $000's) | Year ended December 31, | |||||||||||||||||||||||||||||||||||||||
| 2017 | 2016 | 2015 | $ Change | % Change | ||||||||||||||||||||||||||||||||||||
| GTV | % of total | GTV | % of total | GTV | % of total | 2017 over 2016 | 2016 over 2015 | 2017 over 2016 | 2016 over 2015 | |||||||||||||||||||||||||||||||
| Live on site auctions | $ | 3,947,730 | 88 | % | $ | 4,186,811 | 97 | % | $ | 4,127,631 | 97 | % | $ | (239,081 | ) | $ | 59,180 | (6 | )% | 1 | % | |||||||||||||||||||
| Online marketplaces: | ||||||||||||||||||||||||||||||||||||||||
| Featured (1) | 278,260 | 6 | % | - | - | - | - | 278,260 | - | 100 | % | - | ||||||||||||||||||||||||||||
| Other (2) | 241,992 | 5 | % | 148,004 | 3 | % | 120,004 | 3 | % | 93,988 | 28,000 | 64 | % | 23 | % | |||||||||||||||||||||||||
| GTV | $ | 4,467,982 | 100 | % | $ | 4,334,815 | 100 | % | $ | 4,247,635 | 100 | % | $ | 133,167 | $ | 87,180 | 3 | % | 2 | % | ||||||||||||||||||||
| (1) | This represents GTV from IronPlanet’s Weekly Featured Auction, which operates under an unreserved auction model. |
| (2) | This includes GTV from Marketplacee and, before that, EquipmentOne. |
| Ritchie Bros. | 43 |
2017 performance
Overall, GTV increased $133.2 million, or 3%, in 2017 compared to 2016. The increase was primarily due to the Acquisition, and the resulting increase in online marketplace GTV, as well as a positive impact of foreign exchange rates over the comparative period. The increase was partially offset by a decrease GTV from live on site auctions, which was primarily due to a decrease in the number of lots in 2017 compared to 2016 and 2016 auction activity discussed below.
The total number of industrial and agricultural lots decreased 5% to 417,600 in 2017 from 437,300 in 2016, and GTV on a per-lot basis decreased 3% to $9,300 in 2017 compared to $9,600 in 2016. We believe these decreases were primarily driven by constrained supply of used equipment, and the resulting impact on the mix and age of equipment that came to market, as well as some lower sales productivity as we complete the integration of our sales teams post-Acquisition. With respect to 2016 auction activity, our Columbus, United States, live on site auction generated $76.6 million of GTV in the third quarter of 2016 compared to $10.5 million in the third quarter of 2017. In addition, we held the largest-ever auction in Grande Prairie, Canada, in March 2016, which generated more than $46.0 million (62.0 million Canadian dollars) of GTV, with no similar auction on the calendar in 2017.
During 2017, we continued to actively pursue the use of underwritten commission contracts from a strategic perspective, and when the opportunity arose, only entered such contracts when the risk/reward profile of the terms were agreeable. The volume of underwritten commission contracts decreased to 16% of our GTV in 2017 from 25% in 2016, primarily due to the pressure on used equipment market supply volume. The tight supply of used equipment, coupled with improved pricing, resulted in less seller interest in underwritten commission contracts. Straight commission contracts continue to account for the majority of our GTV.
2016 performance
GTV increased $87.2 million, or 2%, in 2016 compared to 2015, primarily due to an increase in the number of live on site industrial and agricultural lots year-over-year. The total number of industrial and agricultural lots increased 12% to 437,300 in 2016 from 390,300 in 2015. The effect of this increase was partially offset by a decrease in GTV on a per-lot basis of 9% to $9,600 in 2016 from $10,600 in 2015, which was primarily due to the mix and age of equipment that came to market in 2016.
A decrease in the volume of underwritten contracts to 25% of our GTV in 2016 from 29% in 2015 also partially offset the increase in GTV. This decrease was primarily due to the underwritten contracts associated with the Casper, Wyoming, offsite auction that was held on March 25, 2015.
Included in GTV for 2016 was $29.6 million of assets that transacted on a dealer-to-dealer basis on EquipmentOne’s online marketplaces, primarily due to the launch of EquipmentOne’s Enterprise Software Solution (“ESS”) in 2016. Dealer-to-dealer transactions on EquipmentOne’s online marketplaces were not significant prior to the introduction of ESS in 2016.
Costs of services
Costs of services are comprised of expenses incurred in direct relation to conducting auctions (“direct expenses”), earning online marketplace revenues, and earning other fee revenues. Direct expenses include direct labour, buildings and facilities charges, and travel, advertising and promotion costs. Typically, agricultural auctions and auctions located in frontier regions are costlier than auctions held at our permanent and regional auction sites as they do not benefit from economies of scale and frequency.
Costs of services incurred to earn online marketplace revenues include inspection costs, facilities costs, and inventory management, referral, sampling, and appraisal fees. Costs of services incurred in earning other fee revenues include direct labour (including commissions on sales), software maintenance fees, and materials. Costs of services exclude D&A expenses.
Costs of services increased $13.0 million, or 20%, in 2017 compared to 2016. This increase is primarily due to costs associated with the growth in our inspection and appraisal activities because of the Acquisition.
| Ritchie Bros. | 44 |
Costs of services increased $10.0 million, or 18%, in 2016 compared to 2015. This increase was primarily due to the increase in number of lots at our live on site auctions, the increase in the number of agricultural auctions and live on site auctions located in frontier regions, a full year’s contribution of costs from Xcira, and a strategic increase in advertising and promotional expenditure targeted at our larger live on site auctions, including our five-day, premier global auction in Orlando, United States. We believe the targeted increase in advertising and promotional expenditure contributed to the increase in GTV in 2016 compared to 2015.
Selling, general and administrative (“SG&A”) expenses
Headcount
The majority of our SG&A expenses are comprised of employee compensation costs. Our headcount, which includes IronPlanet and excludes Xcira and Mascus employees, increased net 516, or 31%, to 2,165 at December 31, 2017 from 1,649 at December 31, 2016. This increase was primarily due to the Acquisition, as well as a net 30 increase from RBFS to support the growth of that business. Xcira and Mascus added another 100 full-time employees to our December 31, 2017 headcount, which is a net decrease of one compared to the combined headcount of 101 at December 31, 2016.
Our headcount, excluding Xcira and Mascus employees, increased net 127, or 8%, to 1,649 at December 31, 2016 from 1,522 at December 31, 2015. This increase included an increase of net 23 equipment inspectors, yard staff, and other personnel at our Edmonton, Canada, auction site to support growth in that region. While some of that increase in that region came from the addition of new employees, a portion was also the result of the conversion of part time employees to full time employees. The increase in total headcount also included a net 18 increase from RBFS to support the growth of that business. Xcira and Mascus added another 101 full-time employees to our December 31, 2016 headcount, compared to 50 added solely by Xcira at December 31, 2015.
2017 performance
SG&A expenses increased $39.7 million, or 14%, during 2017 compared to 2016. This increase is primarily due to post-Acquisition increased headcount, travel costs, and search engine fees associated with our online marketplace channel, as well as merit increases and higher commitment and other bank fees attributable to our new credit facility. Foreign exchange rates had a negative impact on SG&A expenses in 2017 as a significant portion of administration expenses are in Canada and the Netherlands.
This increase in SG&A expenses from 2016 to 2017 was partially offset by a decrease in share unit expense from mark-to-market fair value changes in our liability-classified share units. This decrease was primarily due to the modification of our Chief Executive Officer Sign-On Grant Performance Share Units (“CEO SOG PSUs”) from liability-classified to equity-classified on May 1, 2017, as well as the performance of our common share price.
2016 performance
SG&A expenses increased $29.1 million, or 11%, in 2016 compared to 2015. This increase is primarily due to an increase in employee compensation primarily due to our headcount growth and an increase in share unit expense from mark-to-market fair value changes in our liability-classified share units. This increase was partially offset by a decrease in termination benefits, primarily due to the difference between those resulting from the Separation Agreement with our former President, US & LATAM, in 2016 compared to those resulting from the Separation Agreement with our former Chief Sales Officer in 2015.
The increase in SG&A expenses year-over-year was also due to an increase in costs required to support the growing fee revenues generated by our value-added services, contributions of expenses from our 2016 acquisitions (Mascus, Petrowsky, and Kramer), a full year’s contribution of expenses from Xcira, and increased rental fees resulting from the replacement of our aged and retired company vehicles with new vehicles under operating leases. Foreign exchange rates had a positive impact on SG&A expenses in 2016.
| Ritchie Bros. | 45 |
Impairment loss
In 2017, we recognized an impairment loss of $8.9 million on certain technology assets. Comparatively, we recognized an impairment loss of $28.2 million on our EquipmentOne goodwill and customer relationships in 2016.
Acquisition-related costs
Acquisition-related costs consist of operating expenses directly incurred as part of a business combination, due diligence and integration planning – including those related to the Acquisition – and continuing employment costs that are recognized separately from our business combinations. Business combination, due diligence, and integration operating expenses include advisory, legal, accounting, valuation, and other professional or consulting fees, and travel and securities filing fees.
Acquisition-related costs in 2017 totalled $38.3 million and consisted primarily of $34.7 million associated with the Acquisition. IronPlanet acquisition-related costs for 2017 included $9.1 million of non-recurring acquisition and finance structure advisory fees, $8.9 million of legal fees related to the regulatory approval process and closing of the transaction, $4.8 million of stock option compensation expenses resulting from accelerated vesting of options assumed as part of the Acquisition, $3.1 million of severance and retention costs that followed the Acquisition in the resulting corporate reorganization, and various integration costs.
This compares to $11.8 million of acquisition related expenses for 2016, of which $8.2 million was associated with the Acquisition.
Foreign exchange loss (gain)
We conduct operations around the world in many different currencies, but our presentation currency is the U.S. dollar. In 2017, approximately 44% of our revenues and 53% of our operating expenses were denominated in currencies other than the U.S. dollar, compared to 48% and 58%, respectively, in 2016 and 45% and 58%, respectively, in 2015.
We recognized $2.6 million of transactional foreign exchange losses in 2017, $1.4 million of losses in 2016, and $2.3 million of gains in 2015. Foreign exchange losses and gains are primarily the result of settlement of non-functional currency-denominated monetary assets and liabilities.
U.S. dollar exchange rate comparison
The following table presents the variance in select foreign exchange rates over the comparative reporting periods:
| Year ended December 31, | ||||||||||||||||||||
| % Change | ||||||||||||||||||||
| Value of one U.S. dollar | 2017 | 2016 | 2015 | 2017 over 2016 | 2016 over 2015 | |||||||||||||||
| Period-end exchange rate | ||||||||||||||||||||
| Canadian dollar | $ | 1.2471 | $ | 1.3442 | $ | 1.3839 | (7 | )% | (3 | )% | ||||||||||
| Euro | 0.8465 | 0.9506 | 0.9208 | (11 | )% | 3 | % | |||||||||||||
| Average exchange rate | ||||||||||||||||||||
| Canadian dollar | $ | 1.2981 | $ | 1.3256 | $ | 1.2788 | (2 | )% | 4 | % | ||||||||||
| Euro | 0.8871 | 0.9042 | 0.9017 | (2 | )% | - | ||||||||||||||
| Ritchie Bros. | 46 |
Operating income
2017 performance
Operating income decreased $28.3 million, or 21%, in 2017 compared to 2016. This decrease was primarily due to the higher SG&A expenses, acquisition-related costs, costs of services, and D&A expenses. These increases were partially offset by the revenue increase and lower impairment loss over the same comparative period. Foreign exchange rates did not have a significant impact on operating income in 2017. Adjusted operating income5 (non-GAAP measure) decreased $30.2 million, or 18%, to $133.8 million in 2017 compared to $164.0 million in 2016.
Primarily for the same reasons noted above, operating income margin, which is our operating income divided by revenues, decreased 640 bps to 17.6% in 2017 compared to 24.0% in 2016. Adjusted operating income margin6 (non-GAAP measure) decreased 700 bps to 21.9% in 2017 from 28.9% in 2016.
2016 performance
Operating income decreased $39.1 million, or 22%, in 2016 compared to 2015. This decrease was primarily due to the increase in SG&A expense, the recognition of an impairment loss, higher acquisition-related costs and costs of services, and a decrease in gains on disposal of property, plant and equipment in 2016 compared to 2015. This decrease was partially offset by the increase in revenues year-over-year. Foreign exchange rates had a negative impact on operating income in 2016. Adjusted operating income (non-GAAP measure) decreased $2.5 million, or 1%, to $164.0 million in 2016 compared to $166.5 million in 2015.
Primarily for the same reasons noted above, operating income margin decreased 990 bps to 24.0% in 2016 compared to 33.9% in 2015. Adjusted operating income margin (non-GAAP measure) decreased 340 bps to 28.9% in 2016 from 32.3% in 2015.
Other income (expense)
Other income (expense) is comprised of the following:
| Year ended December 31, | ||||||||||||||||||||||||||||
| $ Change | % Change | |||||||||||||||||||||||||||
| (in U.S. $000's) | 2017 | 2016 | 2015 | 2017 over 2016 | 2016 over 2015 | 2017 over 2016 | 2016 over 2015 | |||||||||||||||||||||
| Interest income | $ | 3,194 | $ | 1,863 | $ | 2,660 | $ | 1,331 | $ | (797 | ) | 71 | % | (30 | )% | |||||||||||||
| Interest expense | (38,291 | ) | (5,564 | ) | (4,962 | ) | (32,727 | ) | (602 | ) | 588 | % | 12 | % | ||||||||||||||
| Equity income (loss) | (26 | ) | 1,028 | 916 | (1,054 | ) | 112 | (103 | )% | 12 | % | |||||||||||||||||
| Debt extinguishment costs | - | (6,787 | ) | - | 6,787 | (6,787 | ) | (100 | )% | 100 | % | |||||||||||||||||
| Other, net | 5,063 | 4,232 | 2,982 | 831 | 1,250 | 20 | % | 42 | % | |||||||||||||||||||
| Other income (expense) | $ | (30,060 | ) | $ | (5,228 | ) | $ | 1,596 | $ | (24,832 | ) | $ | (6,824 | ) | 475 | % | (428 | )% | ||||||||||
5 | Adjusted operating income is a non-GAAP measure. We use income statement and balance sheet performance scorecards to align our operations with our strategic priorities. We concentrate on a limited number of metrics to ensure focus and to facilitate quarterly performance discussions. Our income statement scorecard includes the performance metric, adjusted operating income. We believe that comparing adjusted operating income for different financial periods provides useful information about the growth or decline of operating income for the relevant financial period. We calculate adjusted operating income by eliminating from operating income the pre-tax effects of significant non-recurring items that we do not consider to be part of our normal operating results, such as acquisition-related costs, management reorganization costs, severance, retention, gains/losses on sale of certain property, plant and equipment, impairment losses, and certain other items, which we refer to as ‘adjusting items’. Adjusted operating income is reconciled to the most directly comparable GAAP measures in our consolidated financial statements under “Non-GAAP Measures” below. |
| 6 | Our income statement scorecard includes the performance metric, adjusted operating income margin, which is a non-GAAP measure. We believe that comparing adjusted operating income margin for different financial periods provides useful information about the growth or decline of our operating income for the relevant financial period. We calculate adjusted operating income margin by dividing adjusted operating income (non-GAAP measure) by revenues. Adjusted operating income margin is reconciled to the most directly comparable GAAP measures in our consolidated financial statements under “Non-GAAP Measures” below. |
| Ritchie Bros. | 47 |
We incurred additional indebtedness to finance the Acquisition. As of December 31, 2017, our debt was $819.9 million, compared to $619.6 million as of December 31, 2016. The increase in interest expense in 2017 compared to 2016 is primarily due to our higher debt balances, as well as minimal increases in short-term interest rates.
Debt extinguishment costs were incurred in the fourth quarter of 2016 in association with the early termination of pre-existing long-term debt due in May 2022.
Income tax expense and effective tax rate
Recent Tax Legislation
On December 22, 2017, the Tax Cuts and Jobs Act (“TCJA”) was enacted into law, which significantly changes existing U.S. tax law and includes numerous provisions that affect our business, such as reducing the U.S. federal statutory tax rate, imposing a one-time transition tax on deemed repatriation of deferred foreign income, and adopting a territorial tax system. The TCJA reduces the U.S. federal statutory tax rate from 35% to 21% effective January 1, 2018. The one-time transition tax is based on our total post-1986 earnings and profits (“E&P”) of controlled foreign affiliates of our US subsidiaries that we previously deferred from US income tax.
The TCJA includes a provision to tax global intangible low-taxed income (“GILTI”) of foreign subsidiaries and a base erosion anti-abuse tax (“BEAT”) measure that taxes certain payments between a U.S. corporation and its subsidiaries. In addition, the TCJA disallows deductions for interest and royalty payments from U.S. companies to non-U.S. affiliates that are hybrid payments (“HYBRID”) or made to hybrid entities. The GILTI, BEAT, and HYBRID provisions of the TCJA will be effective for us beginning January 1, 2018.
The TCJA is effective in the first quarter of fiscal year 2018. As of December 31, 2017, we have not completed our accounting for the tax effects of the TCJA. In December 2017, we recorded a provisional net benefit based on reasonable estimates for those tax effects. The provisional net benefit is subject to revisions as we complete our analysis of the TCJA, collect and prepare necessary data, and interpret any additional guidance issued by the U.S. Treasury Department, Internal Revenue Service, Financial Accounting Standards Board, and other standard-setting and regulatory bodies. Adjustments may materially impact our provision for income taxes and effective tax rate in the period in which the adjustments are made. Our accounting for the tax effects of the TCJA will be completed during the measurement period, which should not extend beyond one year from the enactment date.
During the fourth quarter of fiscal year 2017, we recorded an estimated net benefit of $9.7 million related to the TCJA, due to the impact of the one-time transition tax on the deemed repatriation of deferred foreign income of $0.3 million, and the impact of changes in the tax rate of $10.1 million on deferred tax assets and liabilities.
2017 performance
We recorded an income tax expense of $2.0 million in 2017 compared to $37.0 million in 2016. Our effective tax rate was 2.7% in 2017 compared to 28.3% in 2016. The decrease in income tax expense over the comparative period was primarily the result of a greater proportion of earnings taxed in jurisdictions with lower tax rates, a $10.1 million deferred income tax recovery due to the remeasurement of deferred income tax assets and liabilities arising from changes in statutory tax rates (as noted above), and a decrease in the valuation allowance applied to deferred income tax assets. This decrease was partially offset by an increase in non-deductible expenses and $2.3 million of expense related to an increase in uncertain tax positions. We increased our uncertain tax position in the first quarter of 2017 due to an unfavourable outcome of a tax dispute in one of our European operating jurisdictions.
2016 performance
Income tax expense was $37.0 million in 2016, compared to an income tax expense of $37.9 million in 2015. Our effective tax rate was 28.3% in 2016 compared to 21.5% in 2015. Income tax expense for 2016 reflected the impact of a non-deductible goodwill impairment loss recorded in the third quarter of 2016. The increase in the effective tax rate year-over-year was also due to the higher estimate of non-deductible acquisition-related costs, partially offset by a greater estimated proportion of annual earnings taxed in jurisdictions with lower tax rates.
| Ritchie Bros. | 48 |
Net income
2017 performance
Net income attributable to stockholders decreased $16.8 million, or 18%, in 2017 compared to 2016. This decrease was primarily due to the decrease in operating income and the increase in interest expense, partially offset by a lower income tax expense over the same comparative period. Adjusted net income attributable to stockholders7 (non-GAAP measure) decreased $35.6 million, or 29%, to $87.7 million in 2017 from $123.3 million in 2016.
For these same reasons, net income decreased $18.2 million, or 19%, in 2017 compared to 2016. Adjusted Earnings Before Interest, Taxes, Depreciation and Amortization (“EBITDA”)8 (non-GAAP measure) decreased $18.6 million, or 9%, to $191.5 million in 2017 from $210.1 million in 2016.
Primarily for the same reasons noted above, net income margin decreased 420 bps to 12.3% in 2017 from 16.5% in 2016. Adjusted EBITDA margin9 (non-GAAP measure) decreased 570 bps to 31.4% in 2017 from 37.1% in 2016.
Debt at December 31, 2017 represented 10.9 times net income for 2017. This compares to debt at December 31, 2016, which represented 6.6 times net income for 2016. The increase in this debt/net income multiplier was primarily due to a net increase in long-term debt in 2017, combined with the decrease in net income for 2017 compared to 2016. The increase in debt was primarily due to funding for the Acquisition. Adjusted net debt/adjusted EBITDA10 (non-GAAP measure) was 2.9 times as at and for the year ended December 31, 2017 compared to -0.4 times as at and for the year ended December 31, 2016.
2016 performance
Net income attributable to stockholders decreased $44.4 million, or 33%, in 2016 compared to 2015. This decrease was primarily due to the decrease in operating income and the increase in debt extinguishment costs over the same comparative period. Adjusted net income attributable to stockholders (non-GAAP measure) increased $2.2 million, or 2%, to $123.3 million in 2016 from $121.1 million in 2015.
Primarily for the same reasons noted above, net income decreased $45.1 million, or 33%, in 2016 compared to 2015. Adjusted EBITDA (non-GAAP measure) decreased $2.3 million, or 1%, to $210.1 million in 2016 from $212.4 million in 2015.
7 | Adjusted net income attributable to stockholders is a non-GAAP financial measure. We believe that comparing adjusted net income attributable to stockholders for different financial periods provides useful information about the growth or decline of our net income attributable to stockholders for the relevant financial period, and eliminates the financial impact of adjusting items we do not consider to be part of our normal operating results. Adjusted net income attributable to stockholders represents net income attributable to stockholders excluding the effects of adjusting items and is reconciled to the most directly comparable GAAP measures in our consolidated financial statements under “Non-GAAP Measures” below. |
| 8 | Adjusted EBITDA is a non-GAAP financial measure that we believe provides useful information about the growth or decline of our net income when compared between different financial periods. Adjusted EBITDA was also an element of the performance criteria for certain performance share units that we granted our employees and officers in 2013 and 2014. Adjusted EBITDA is calculated by adding back depreciation and amortization expenses, interest expense, and current income tax expense, and subtracting interest income and deferred income tax recovery from net income excluding the pre-tax effects of adjusting items. Adjusted EBITDA is reconciled to the most directly comparable GAAP measures in our consolidated financial statements under “Non-GAAP Measures” below. |
| 9 | Adjusted EBITDA margin is a non-GAAP financial measure that we believe provides useful information about the growth or decline of our net income when compared between different financial periods. Adjusted EBITDA margin presents adjusted EBITDA (non-GAAP measure) as a multiple of revenues. Adjusted EBITDA margin is reconciled to the most directly comparable GAAP measures in our consolidated financial statements under “Non-GAAP Measures” below. |
| 10 | Adjusted net debt/adjusted EBITDA is a non-GAAP financial measure. We believe that comparing adjusted net debt/adjusted EBIDTA on a trailing 12-month basis for different financial periods provides useful information about the performance of our operations as an indicator of the amount of time it would take us to settle both our short and long-term debt. We do not consider this to be a measure of our liquidity, which is our ability to settle only short-term obligations, but rather a measure of how well we fund liquidity. Measures of liquidity are discussed further below under “liquidity and capital resources”. We calculate adjusted net debt/adjusted EBITDA by dividing adjusted net debt (non-GAAP measure) by adjusted EBITDA (non-GAAP measure). Adjusted net debt (non-GAAP measure) is calculated by subtracting cash and cash equivalents and long-term debt held in escrow from debt. Adjusted net debt/adjusted EBITDA is reconciled to the most directly comparable GAAP measures in our consolidated financial statements under “Non-GAAP Measures” below. |
| Ritchie Bros. | 49 |
Primarily for the same reasons above, net income margin decreased 1040 bps to 16.5% in 2016 from 26.9% in 2015. Adjusted EBITDA margin (non-GAAP measure) decreased 410 bps to 37.1% in 2016 from 41.2% in 2015.
Debt at December 31, 2016 represented 6.6 times net income in 2016. This compares to debt at December 31, 2015, which represented 0.8 times net income in 2015. The increase in this debt/net income multiplier was primarily due to a net increase in long-term debt in 2016, combined with the decrease in net income for 2016 compared to 2015. The increase in debt was primarily due to funding for the Acquisition. Adjusted net debt/adjusted EBITDA7 (non-GAAP measure) was -0.4 as at and for the year ended December 31, 2016 compared to -0.5 as at and for the year ended December 31, 2015.
Diluted EPS
2017 performance
Diluted EPS attributable to stockholders decreased 19% to $0.69 in 2017 from $0.85 in 2016. This decrease is primarily due to the decrease in net income attributable to stockholders, combined with an increase in the weighted average number of dilutive shares outstanding over the same comparative period. The increase in the weighted average number of dilutive shares is primarily due to the modification of certain share units, including the CEO SOG PSUs, from liability-classified to equity-classified in May 2016 and May 2017, as well as the assumption of IronPlanet stock options as part of the Acquisition. Diluted adjusted EPS attributable to stockholders (non-GAAP measure) decreased 30% to $0.81 in 2017 from $1.15 in 2016.
2016 performance
Diluted EPS attributable to stockholders decreased 33% to $0.85 in 2016 from $1.27 in 2015. This decrease is primarily due to the decrease in net income attributable to stockholders, combined with an increase in the weighted average number of dilutive shares outstanding over the same comparative period. Diluted adjusted EPS attributable to stockholders (non-GAAP measure) increased 2% to $1.15 in 2016 from $1.13 in 2015.
Segment Performance
| Year ended December 31, 2017 | Year ended December 31, 2016 | Year ended December 31, 2015 | ||||||||||||||||||||||||||||||||||
| A&M | Other | Consolidated | A&M | Other | Consolidated | A&M | Other | Consolidated | ||||||||||||||||||||||||||||
| Revenues | $ | 564,298 | $ | 46,219 | $ | 610,517 | $ | 531,826 | $ | 34,569 | $ | 566,395 | $ | 505,865 | $ | 10,010 | $ | 515,875 | ||||||||||||||||||
| Costs of services, excluding D&A | (75,685 | ) | (3,328 | ) | (79,013 | ) | (65,248 | ) | (814 | ) | (66,062 | ) | (56,026 | ) | - | (56,026 | ) | |||||||||||||||||||
| SG&A expenses | (308,874 | ) | (14,396 | ) | (323,270 | ) | (272,317 | ) | (11,212 | ) | (283,529 | ) | (249,852 | ) | (4,537 | ) | (254,389 | ) | ||||||||||||||||||
| Impairment loss | (8,911 | ) | - | (8,911 | ) | (28,243 | ) | - | (28,243 | ) | - | - | - | |||||||||||||||||||||||
| Segment profit | $ | 170,828 | $ | 28,495 | $ | 199,323 | $ | 166,018 | $ | 22,543 | $ | 188,561 | $ | 199,987 | $ | 5,473 | $ | 205,460 | ||||||||||||||||||
Auctions and Marketplaces reportable operating segment
Used equipment market update
Our A&M segment businesses are influenced by certain market forces of the used equipment market, particularly with regards to supply, age of equipment, and pricing.
| Ritchie Bros. | 50 |
Supply volume
The volume of used equipment transactions is affected by the ongoing production of new equipment and trucks, the demand for equipment, the rate of equipment utilization and the motivations of equipment owners to realign and replace their fleets. Our goal is to capture a greater proportion of the transactions through our multi-channel strategy. Most of our businesses generate revenue based on a percent of the selling price of goods sold through our sales channels. As such, influences on used equipment pricing can affect corporate performance. Factors such as regional or global economic and construction activity, the supply of good quality used equipment, availability of low-cost financing and changes to regional regulations can affect the demand for, and therefore price of, equipment sold through our auctions and online marketplaces.
During 2017, we experienced used equipment market supply volume pressure, particularly in the United States. High levels of construction activity in the United States resulted in owners holding onto their equipment, rental business utilization reaching peak levels, and various dealers being understock and dealing with long lead times between placing orders with original equipment manufacturers (“OEMs”) and production of the new equipment. Our customers are also experiencing longer lead times for new equipment production by OEMs. We believe these supply volume constraints negatively impacted GTV and the volume of underwritten commission contracts over the comparative period.
Age of equipment
With owners and dealers utilizing and/or holding onto their equipment in response to the macro-economic conditions discussed above, we saw a deterioration in the overall age of equipment coming to market relative to recent years. We observed increases in the age of equipment across all asset sectors and geographies. All other things being equal, older equipment sells for lower prices and reduces the commission-based revenue we earn.
Pricing
Overall, we saw improvement in used equipment market pricing during 2017, a continuation of the marginal improvement that we first observed during the second half of 2016. This pricing performance varied among asset sectors and geographies.
Construction assets continued to perform well during 2017, with late model equipment experiencing the most pricing improvement, representative of the tightening equipment supply in North America and increased demand for used equipment. Transportation assets rebounded slightly from 2016, with lower mileage truck tractors experiencing the most lift. Agricultural equipment experienced some pricing weakness in the United States during 2017. Some oil and gas equipment continued to experience the price improvement that we first noted in the second quarter of 2017, indicating that oil and gas equipment pricing may have bottomed in the second half of 2016.
Regionally, North America continued to be our strongest geographical region for equipment values during 2017, responding most favorably to changes in commodity pricing and the overall economic environment. Beginning in the third quarter of 2017, we are also seeing improved pricing in our European operations.
Industrial auction metrics
During 2017, we conducted 245 unreserved industrial auctions at locations in North America, Europe, the Middle East, Australia, New Zealand, and Asia, compared to 233 during 2016.
| Ritchie Bros. | 51 |
Our key industrial auction metrics11 are shown below:
| Year ended December 31, | ||||||||||||||||||||
| % Change | ||||||||||||||||||||
| 2017 | 2016 | 2015 | 2017 over 2016 | 2016 over 2015 | ||||||||||||||||
| Bidder registrations | 575,500 | 549,000 | 507,500 | 5 | % | 8 | % | |||||||||||||
| Consignments | 56,850 | 53,450 | 47,600 | 6 | % | 12 | % | |||||||||||||
| Buyers | 139,900 | 138,400 | 123,700 | 1 | % | 12 | % | |||||||||||||
| Lots | 382,500 | 398,500 | 354,500 | (4 | )% | 12 | % | |||||||||||||
We saw increases in all key industrial auction metrics in 2017 compared to 2016, except for the number of lots. The decrease in lots was primarily due to the 2016 Columbus, United States, and Grande Prairie, Canada, auction activity discussed above, as well as the performance of the used equipment market, which experienced supply volume pressure over the comparative period.
We saw increases in all key industrial auction metrics in 2016 compared to 2015, primarily due to our focused efforts on growing the business combined with the performance of the used equipment market, which remained stable during most of 2016 and improved marginally late in the third quarter and into the fourth quarter of 2016.
Although our auctions vary in size, our average industrial auction results on a trailing 12-month basis are described in the following table:
| Year ended December 31, | ||||||||||||||||||||
| Change | ||||||||||||||||||||
| 2017 | 2016 | 2015 | 2017 over 2016 | 2016 over 2015 | ||||||||||||||||
| GTV | $ | 15.2 million | $ | 16.8 million | $ | 16.8 million | $ | -1.6 million | $ | - | ||||||||||
| Bidder registrations | 2,348 | 2,356 | 2,219 | - | 6 | % | ||||||||||||||
| Consignors | 232 | 229 | 209 | 1 | % | 10 | % | |||||||||||||
| Lots | 1,562 | 1,711 | 1,551 | (9 | )% | 10 | % | |||||||||||||
We saw a decrease in the average GTV per industrial auction in 2017 compared to 2016. We believe the decrease was primarily driven by constrained supply of used equipment, and the resulting impact on the mix and age of equipment that came to market, as well as some lower sales productivity as we complete the integration of our sales teams post-Acquisition. Primarily for the same reasons above, we saw a decrease in the average number of lots per industrial auction in 2017 compared to 2016.
Primarily for the same reasons discussed above, we saw improvements in all our average industrial auction metrics for 2016 compared to 2015, except GTV per industrial auction, which did not change between 2015 and 2016.
Online bidding at live on site auctions
Internet bidders comprised 69% of the total bidder registrations at our live on site auctions in 2017 compared to 66% in 2016. This increase in the level of internet bidders continues to demonstrate our ability to drive multi-channel participation at our auctions.
11 | For a breakdown of these key industrial auction metrics by month, please refer to our website at www.rbauction.com. None of the information in our website is incorporated by reference into this document by this or any other reference. |
| Ritchie Bros. | 52 |
Website metrics12
Our IronPlanet websites www.ironplanet.com, www.govplanet.com, and www.truckplanet.com, provide access to our online marketplaces. Traffic across all our websites increased 23% in 2017 compared to 2016, with the addition of IronPlanet traffic accounting for 78% of the increase. Traffic across all our websites remained consistent between 2015 and 2016.
Results of A&M segment operations
| Year ended December 31, | ||||||||||||||||||||||||||||
| $ Change | % Change | |||||||||||||||||||||||||||
| (in U.S. $000's) | 2017 | 2016 | 2015 | 2017 over 2016 | 2016 over 2015 | 2017 over 2016 | 2016 over 2015 | |||||||||||||||||||||
| Revenues | $ | 564,298 | $ | 531,826 | $ | 505,865 | $ | 32,472 | $ | 25,961 | 6 | % | 5 | % | ||||||||||||||
| Costs of services, excluding D&A | (75,685 | ) | (65,248 | ) | (56,026 | ) | (10,437 | ) | (9,222 | ) | 16 | % | 16 | % | ||||||||||||||
| SG&A expenses | (308,874 | ) | (272,317 | ) | (249,852 | ) | (36,557 | ) | (22,465 | ) | 13 | % | 9 | % | ||||||||||||||
| Impairment loss | (8,911 | ) | (28,243 | ) | - | 19,332 | (28,243 | ) | (68 | )% | 100 | % | ||||||||||||||||
| Segment profit | $ | 170,828 | $ | 166,018 | $ | 199,987 | $ | 4,810 | $ | (33,969 | ) | 3 | % | (17 | )% | |||||||||||||
Revenues
As the A&M segment revenue is generated from transactional asset disposition services, we believe that these revenues are best understood by considering their relationship to GTV. Therefore, in the third quarter of 2017 we introduced the metric ‘segment Revenue Rate’, which is calculated as segment revenue divided by GTV.
Segment revenues by geographical region and segment Revenue Rate are presented below:
| Year ended December 31, | ||||||||||||||||||||||||||||
| $ Change | % Change | |||||||||||||||||||||||||||
| (in U.S. $000's) | 2017 | 2016 | 2015 | 2017 over 2016 | 2016 over 2015 | 2017 over 2016 | 2016 over 2015 | |||||||||||||||||||||
| United States | $ | 310,722 | $ | 268,399 | $ | 257,812 | $ | 42,323 | $ | 10,587 | 16 | % | 4 | % | ||||||||||||||
| Canada | 150,143 | 172,214 | 156,692 | (22,071 | ) | 15,522 | (13 | )% | 10 | % | ||||||||||||||||||
| International | 103,433 | 91,213 | 91,361 | 12,220 | (148 | ) | 13 | % | - | |||||||||||||||||||
| Segment revenues | $ | 564,298 | $ | 531,826 | $ | 505,865 | $ | 32,472 | $ | 25,961 | 6 | % | 5 | % | ||||||||||||||
| GTV | $ | 4,467,982 | $ | 4,334,815 | $ | 4,247,635 | $ | 133,167 | $ | 87,180 | 3 | % | 2 | % | ||||||||||||||
| Segment Revenue Rate | 12.63 | % | 12.27 | % | 11.91 | % | n/a | n/a | 36 bps | 36 bps | ||||||||||||||||||
| 12 | None of the information in our websites is incorporated by reference into this document by this or any other reference. |
| Ritchie Bros. | 53 |
Our historical quarterly segment Revenue Rates are presented in the graph below:
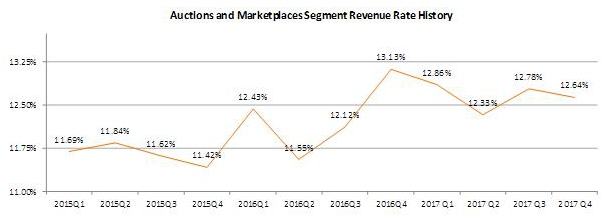
2017 performance
Changes in segment revenues in 2017 compared to 2016 were primarily due to:
| · | United States – 16% increase primarily due to the Acquisition, partially offset by the effect of constrained supply on used equipment in that region, the third quarter 2016 Columbus, United States, live on site auction, as well as some lower sales productivity as we complete the integration of our sales teams post-Acquisition. |
| · | Canada – 13% decrease primarily driven by changes in our auction calendar and fewer oil and gas dispersals in Western Canada. Regarding auction calendar changes, we held the largest-ever auction in Grande Prairie in the first quarter of 2016 that generated more than $46.0 million (62.0 million Canadian dollars) of GTV, with no similar auction on the Canadian calendar in 2017. |
| · | International – 13% increase primarily due to live on site auction activities in Spain, and the Acquisition. |
Segment Revenue Rate grew from 12.27% in 2016 to 12.63% in 2017, primarily due to the Acquisition, which resulted in higher buyer transaction and listing fees from our online marketplace channel, and improved performance on underwritten transactions.
2016 performance
Increases in segment revenues in Canada and the United States in 2016 compared to 2015 were primarily due to the performance of our underwritten business and volume increases in GTV.
Our segment Revenue Rate grew from 11.91% in 2015 to 12.27% in 2016, primarily due to our underwritten contract performance. While our underwritten contract volume decreased during 2016 compared to 2015, our underwritten contract commission rates increased over the same comparative period.
| Ritchie Bros. | 54 |
Costs of services
Segment costs of services by nature and as a percentage of GTV are presented below:
| Year ended December 31, | ||||||||||||||||||||||||||||
| $ Change | % Change | |||||||||||||||||||||||||||
| (in U.S. $000's) | 2017 | 2016 | 2015 | 2017 over 2016 | 2016 over 2015 | 2017 over 2016 | 2016 over 2015 | |||||||||||||||||||||
| Employee compensation | $ | 33,498 | $ | 27,643 | $ | 22,855 | $ | 5,855 | $ | 4,788 | 21 | % | 21 | % | ||||||||||||||
| Buildings, facilities and technology | 7,552 | 7,365 | 7,179 | 187 | 186 | 3 | % | 3 | % | |||||||||||||||||||
| Travel, advertising and promotion | 23,475 | 23,688 | 22,150 | (213 | ) | 1,538 | (1 | )% | 7 | % | ||||||||||||||||||
| Other costs of services | 11,160 | 6,552 | 3,842 | 4,608 | 2,710 | 70 | % | 71 | % | |||||||||||||||||||
| Segment cost of services | $ | 75,685 | $ | 65,248 | $ | 56,026 | $ | 10,437 | $ | 9,222 | 16 | % | 16 | % | ||||||||||||||
| GTV | $ | 4,467,982 | $ | 4,334,815 | $ | 4,247,635 | $ | 133,167 | $ | 87,180 | 3 | % | 2 | % | ||||||||||||||
| Segment costs of services as a percentage of GTV | 1.69 | % | 1.51 | % | 1.32 | % | n/a | n/a | 18 bps | 19 bps | ||||||||||||||||||
2017 performance
Segment costs of services increased 16% in 2017 compared to 2016 primarily due to the Acquisition, which drove the increase in our online marketplace GTV and revenues. The increase in online marketplace revenue resulted in an increase in the costs incurred to earn those revenues, which were primarily related to inspection activities. Other costs of services include storage and shipping costs, primarily associated with costs to move equipment off government facilities as part of our GovPlanet channel activities.
The increase in segment costs of services was also due to an increase in the number of live on site agricultural auctions held during 2017 compared to 2016. We held 157 unreserved agricultural auctions in 2017 compared to 123 in 2016.
2016 performance
Segment costs of services increased 16% in 2016 compared to 2015, primarily for the same reasons described above explaining the consolidated costs of services increase over the same comparative period.
SG&A expenses
Segment SG&A expenses, which include our corporate head office support costs, are presented by nature below:
| Year ended December 31, | ||||||||||||||||||||||||||||
| $ Change | % Change | |||||||||||||||||||||||||||
| (in U.S. $000's) | 2017 | 2016 | 2015 | 2017 over 2016 | 2016 over 2015 | 2017 over 2016 | 2016 over 2015 | |||||||||||||||||||||
| Employee compensation | $ | 198,523 | $ | 173,329 | $ | 163,155 | $ | 25,194 | $ | 10,174 | 15 | % | 6 | % | ||||||||||||||
| Buildings, facilities and technology | 51,504 | 47,790 | 40,820 | 3,714 | 6,970 | 8 | % | 17 | % | |||||||||||||||||||
| Travel, advertising and promotion | 29,071 | 23,310 | 21,800 | 5,761 | 1,510 | 25 | % | 7 | % | |||||||||||||||||||
| Professional fees | 12,388 | 12,506 | 12,204 | (118 | ) | 302 | (1 | )% | 2 | % | ||||||||||||||||||
| Other SG&A expenses | 17,388 | 15,382 | 11,873 | 2,006 | 3,509 | 13 | % | 30 | % | |||||||||||||||||||
| Segment SG&A expenses | $ | 308,874 | $ | 272,317 | $ | 249,852 | $ | 36,557 | $ | 22,465 | 13 | % | 9 | % | ||||||||||||||
Our segment SG&A expenses increased $36.6 million, or 13%, in 2017 compared to 2016. The increase is primarily due to the Acquisition, including increased headcount, travel costs, and search engine fees associated with our online marketplace channel, as well as merit increases and higher bank fees attributable to our new credit facility.
Our segment SG&A expenses increased $22.5 million, or 9%, in 2016 compared to 2015, primarily for the same reasons described above explaining the consolidated SG&A expense increase over the same comparative period.
| Ritchie Bros. | 55 |
Productivity
The majority of our business continues to be generated by our A&M segment operations. Sales Force Productivity within this segment is an operational statistic that we believe provides a gauge of the effectiveness of our Revenue Producers in increasing our GTV and, ultimately, our net income. The following table presents the composition of our Revenue Producers over the past two years:
| Q4 2017 | Q3 2017 | Q2 2017 | Q1 2017 | Q4 2016 | Q3 2016 | Q2 2016 | Q1 2016 | Q4 2015 | ||||||||||||||||||||||||||||
| Regional Sales Managers | 68 | 62 | 62 | 52 | 51 | 50 | 45 | 49 | 46 | |||||||||||||||||||||||||||
| Territory Managers | 387 | 372 | 379 | 301 | 301 | 304 | 304 | 296 | 296 | |||||||||||||||||||||||||||
| Revenue Producers | 455 | 434 | 441 | 353 | 352 | 354 | 349 | 345 | 342 | |||||||||||||||||||||||||||
Historically, we measured Sales Force Productivity as trailing 12-month GTV divided by the number of Revenue Producers at the reporting date. As a result of the timing and impact of the Acquisition on both GTV and the number of Revenue Producers, we updated our Sales Force Productivity measure calculations as at and for the 12-month periods ended December 31, 2017 and 2016.
Our updated Sales Force Productivity measure calculation as at and for the 12-month period ended December 31, 2017 is the sum of the following two amounts:
| · | GTV for the five months, pre-Acquisition, ended May 31, 2017, divided by the average number of Revenue Producers over the same five-month period; and |
| · | GTV for the seven months, post-Acquisition, ended December 31, 2017, divided by the average number of Revenue Producers over the same seven-month period. |
Under the revised calculation, our Sales Force Productivity as at and for the year ended December 31, 2017 was $11.0 million per Revenue Producer.
We similarly updated the calculations of the measure over the comparative periods to be GTV for the years ended December 31, 2016 and 2015, divided by the average number of Revenue Producers over each year. Under the revised calculation, our Sales Force Productivity as at and for the years ended December 31, 2016 and 2015 was $12.5 million and $12.2 million, respectively. No IronPlanet GTV or Revenue Producers are included in this comparative metric.
Sales Force Productivity decreased by $1.5 million per Revenue Producer in 2017 compared to 2016. We believe the decrease is due to a combination of factors, including:
| · | The acquisition of Revenue Producers from IronPlanet that had a lower Sales Force Productivity than Ritchie Bros. sales personnel, pre-Acquisition. IronPlanet’s Sales Force Productivity was $7.6 million per Revenue Producer for the trailing 12-month period ended May 31, 2017. |
| · | The constrained supply of used equipment. |
| · | Some lower sales productivity as we complete the integration of our sales teams post-Acquisition. |
Sales Force Productivity improved marginally between 2015 and 2016 under the revised calculation.
| Ritchie Bros. | 56 |
Other services
| Year ended December 31, | ||||||||||||||||||||||||||||
| $ Change | % Change | |||||||||||||||||||||||||||
| (in U.S. $000's) | 2017 | 2016 | 2015 | 2017 over 2016 | 2016 over 2015 | 2017 over 2016 | 2016 over 2015 | |||||||||||||||||||||
| Revenues | $ | 46,219 | $ | 34,569 | $ | 10,010 | $ | 11,650 | $ | 24,559 | 34 | % | 245 | % | ||||||||||||||
| Costs of services, excluding D&A | (3,328 | ) | (814 | ) | - | (2,514 | ) | (814 | ) | 309 | % | 100 | % | |||||||||||||||
| SG&A expenses | (14,396 | ) | (11,212 | ) | (4,537 | ) | (3,184 | ) | (6,675 | ) | 28 | % | 147 | % | ||||||||||||||
| Other category profit | $ | 28,495 | $ | 22,543 | $ | 5,473 | $ | 5,952 | $ | 17,070 | 26 | % | 312 | % | ||||||||||||||
2017 performance
Revenue from other services grew $11.7 million, or 34%, in 2017 compared to 2016. This increase was primarily due to the Acquisition, which added $3.4 million of AAS revenue in 2017, a 26% increase in RBFS revenue, and a 32% increase in Mascus revenue from $7.5 million to $9.9 million, and an 85% increase in RB Logistics revenues over the comparative period.
Funded volume, which represents the amount of lending brokered by RBFS, increased 17% from $261.4 million in 2016 to $306.4 million in 2017. RBFS segment revenues were $16.1 million in 2017, a 26% increase compared to $12.8 million in 2016. RBFS operating profit increased 28% over the same comparative period to $8.2 million from $6.4 million.
2016 performance
Revenue from other services grew $17.1 million, or 312% in 2016 compared to 2015, primarily due to the performance of our value-added services, the acquisition of Mascus that contributed $7.5 million in revenues, and a 30% increase in RBFS revenue over the comparative period. We also launched RB Logistics in 2016, which contributed $0.4 million of revenues in its start-up year.
Funded volume increased 17% from $222.6 million in 2015 to $261.4 million in 2016. RBFS segment revenues were $12.8 million in 2016, a 30% increase compared to the $9.8 million in 2015. RBFS segment operating profit increased 19% over the same comparative period to $6.4 million from $5.4 million.
Outstanding Share Data
We are a public company and our common shares are listed under the symbol “RBA” on the New York Stock Exchange (“NYSE”) and the Toronto Stock Exchange (“TSX”). Financial information about our equity and share-based payments is set forth in our consolidated financial statement footnotes 27 “Equity and Dividends” and 28 “Share-based Payments” in “Part II, Item 8: Financial Statements and Supplementary Data” of this Annual Report on Form 10-K.
Share repurchase program
Our normal course issuer bid (“NCIB”) that was approved by the TSX on March 1, 2016 expired on March 2, 2017 and was not renewed. No share purchases were made pursuant to the NCIB, or by any other means, during the year end December 31, 2017.
| Ritchie Bros. | 57 |
Liquidity and Capital Resources
Working capital
| December 31, | December 31, | |||||||||||||||
| (in U.S. $000's) | 2017 | 2016 | $ Change | % Change | ||||||||||||
| Cash and cash equivalents | $ | 267,910 | $ | 207,867 | $ | 60,043 | 29 | % | ||||||||
| Current restricted cash | $ | 63,206 | $ | 50,222 | $ | 12,984 | 26 | % | ||||||||
| Current assets | $ | 508,487 | $ | 377,998 | $ | 130,489 | 35 | % | ||||||||
| Current liabilities | 388,455 | 252,834 | 135,621 | 54 | % | |||||||||||
| Working capital | $ | 120,032 | $ | 125,164 | $ | (5,132 | ) | (4 | )% | |||||||
We believe that working capital is a more meaningful measure of our liquidity than cash alone. Our working capital decreased during fiscal 2017, primarily due to the payment of dividends of $72.8 million and interest on our debt, partially offset by operating income generated during the period.
Cash flows
| Year ended December 31, | ||||||||||||||||||||||||||||
| $ Change | % Change | |||||||||||||||||||||||||||
| (in U.S. $000's) | 2017 | 2016 | 2015 | 2017 over 2016 | 2016 over 2015 | 2017 over 2016 | 2016 over 2015 | |||||||||||||||||||||
| Cash provided by (used in): | ||||||||||||||||||||||||||||
| Operating activities | $ | 146,266 | $ | 177,558 | $ | 196,459 | $ | (31,292 | ) | $ | (18,901 | ) | (18 | )% | (10 | )% | ||||||||||||
| Investing activities | (710,954 | ) | (116,862 | ) | (29,348 | ) | (594,092 | ) | (87,514 | ) | 508 | % | 298 | % | ||||||||||||||
| Financing activities | 120,565 | 404,143 | (80,689 | ) | (283,578 | ) | 484,832 | (70 | )% | (601 | )% | |||||||||||||||||
| Effect of changes in foreign currency rates | 17,150 | 4 | (26,265 | ) | 17,146 | 26,269 | 428650 | % | (100 | )% | ||||||||||||||||||
| Net increase (decrease) in cash, cash equivalents, and restricted cash | $ | (426,973 | ) | $ | 464,843 | $ | 60,157 | $ | (891,816 | ) | $ | 404,686 | (192 | )% | 673 | % | ||||||||||||
Operating activities
Cash provided by operating activities can fluctuate significantly from period to period due to factors such as differences in the timing, size, and number of auctions during the period, the volume of our underwritten contracts, the timing of the receipt of auction proceeds from buyers and of the payment of net amounts due to consignors, as well as the location of the auction with respect to restrictions on the use of cash generated therein.
2017 performance
Cash provided by operating activities decreased $31.3 million, or 18%, during 2017 compared to 2016. This decrease was primarily due to a decrease in cash earnings, which included decreases in net income of $18.2 million, and a decrease in non-cash charges, which included decreases in impairment losses of $19.3 million. Changes in certain of our operating assets and liabilities also contributed to the decline in cash flow from operations. Particularly, changes in inventory used $35.1 million more cash during 2017 compared to 2016. This was primarily due to large inventory packages held at the end of 2015 being sold in the February 2016 Orlando auction, combined with a large inventory package held in Canada at the end of 2017 that relates to a dispersal of oil and gas equipment, most of which is to be sold in the March 2018 Grande Prairie auction.
2016 performance
Cash provided by operating activities decreased $18.9 million, or 10%, during 2016 compared to 2015. This decrease was primarily due to the decrease in cash earnings, which included decreases in net income of $45.1 million, partially offset by an increase in non-cash charges, which included an impairment loss of $28.2 million.
| Ritchie Bros. | 58 |
Changes in certain of our operating assets and liabilities also contributed to the decline in cash flow from operations, partially offset by change in inventory providing $44.2 million more cash in 2016 compared to 2015. This was primarily due to large inventory packages held at the end of 2015 being sold in the February 2016 Orlando auction, combined with a decrease in the volume of inventory deals in 2016 compared to 2015.
Investing activities
Net cash used in investing activities increased $594.1 million during 2017 compared to 2016. This increase is primarily due to the May 2017 acquisition of IronPlanet for $675.9 million (net of cash acquired) compared to the acquisitions of the RBFS non-controlling interest, Mascus, Kramer, and Petrowsky for a total of $86.6 million (net of cash acquired) in 2016.
Net cash used in investing activities increased $87.5 million during 2016 compared to 2015. This increase is primarily due to the 2016 acquisitions noted above compared to the 2015 acquisition of Xcira for $12.1 million (net of cash acquired), as well as a $10.0 million increase in proceeds on disposition of property, plant and equipment year-over-year. The decrease in proceeds on disposition of property, plant and equipment year-over-year was primarily due to the $8.4 million gain on sale of excess land in Edmonton, Canada, in 2015.
CAPEX intensity presents net capital spending as a percentage of revenue. We believe that comparing CAPEX intensity on a trailing 12-month basis for different financial periods provides useful information as to the amount of capital expenditure that we require to generate revenues.
| Year ended December 31, | ||||||||||||||||||||
| Change | ||||||||||||||||||||
| (in U.S. $ millions) | 2017 | 2016 | 2015 | 2017 over 2016 | 2016 over 2015 | |||||||||||||||
| Property, plant and equipment additions | $ | 10.8 | $ | 18.9 | $ | 22.1 | (43 | )% | (14 | )% | ||||||||||
| Intangible asset additions | 28.6 | 17.6 | 8.8 | 63 | % | 100 | % | |||||||||||||
| Proceeds on disposition of property plant and equipment | (5.0 | ) | (6.7 | ) | (16.7 | ) | (25 | )% | (60 | )% | ||||||||||
| Net capital spending | $ | 34.4 | $ | 29.8 | $ | 14.2 | 15 | % | 110 | % | ||||||||||
| Revenues | $ | 610.5 | $ | 566.4 | $ | 515.9 | 8 | % | 10 | % | ||||||||||
| CAPEX intensity | 5.6 | % | 5.3 | % | 2.8 | % | 30 bps | 250 bps | ||||||||||||
2017 performance
CAPEX intensity for 2017 increased compared to CAPEX intensity for 2016, primarily due to the net capital spending increase of 15% exceeding the revenue increase of 8% over the comparative period. The net capital spending increase was primarily due to an increase in the capitalization of costs of intangible assets under development. Significant software development projects in 2017 included systems integration following the Acquisition and other acquisitions, as well as enhanced functionality for our online marketplace sales channel. The decrease in cash provided by operating activities combined with the increase in net capital spending resulted in a decrease in operating free cash flow (“OFCF”)13 (non-GAAP measure) of $35.9 million, or 24%, to $111.9 million in 2017 from $147.8 million in 2016.
| 13 | OFCF is non-GAAP financial measure that we believe, when compared on a trailing 12-month basis to different financial periods provides an effective measure of the cash generated by our business and provides useful information regarding cash flows remaining for discretionary return to stockholders, mergers and acquisitions, or debt reduction. Our balance sheet scorecard includes the performance metric, OFCF. OFCF is also an element of the performance criteria for certain annual short-term incentive awards we grant to our employees and officers. We calculate OFCF by subtracting net capital spending from cash provided by operating activities. OFCF is reconciled to the most directly comparable GAAP measures in our consolidated financial statements under “Non-GAAP Measures” below. |
| Ritchie Bros. | 59 |
2016 performance
CAPEX intensity for 2016 increased compared to CAPEX intensity for 2015, primarily due to the net capital spending increase of 110% exceeding the revenue increase of 10% over the comparative period. The net capital spending increase was primarily due to the decrease in proceeds on disposition of property, plant and equipment discussed above. OFCF (non-GAAP measure) decreased $34.5 million, or 19%, to $147.8 million in 2016 from $182.3 million in 2015.
Financing activities
Net cash provided by financing activities decreased $283.6 million in 2017 compared to 2016. We borrowed $310.5 million less debt, net of repayments, in 2017 compared to 2016. This increase in cash provided by financing activities was partially offset by a $36.7 million decrease in share repurchases year-over-year because no share repurchases were executed in 2017.
Net cash provided by financing activities increased $484.8 million in 2016 compared to 2015, primarily due to gross proceeds of $500.0 million received in exchange for the issue of our senior unsecured notes in December 2016 (the “Notes”). This increase was partially offset by the payment of $10.6 million in debt issue costs in 2016.
Dividend information
We declared and paid regular cash dividends of $0.17 per common share for the quarters ended December 31, 2016, March 31, 2017, June 30, 2017, and September 31, 2017. We have declared, but not yet paid, a dividend of $0.17 per common share for the quarter ended December 31, 2017.
Total dividend payments in 2017 were $72.8 million to stockholders and $40.8 thousand to non-controlling interests. This compares to total dividend payments of $70.5 million and $64.3 million to stockholders in 2016 and 2015, respectively, and $3.4 million and $1.3 million to non-controlling interests in 2015, respectively. All dividends we pay are “eligible dividends” for Canadian income tax purposes unless indicated otherwise.
Our dividend payout ratio, which we calculate as dividends paid to stockholders divided by net income attributable to stockholders, increased to 97.1% in 2017 from 76.8% in 2016. This increase is primarily the result of the decrease in net income attributable to stockholders combined with the increase in our dividends paid to stockholders, year-over-year. Our adjusted dividend payout ratio14 (non-GAAP measure) increased to 83.0% in 2017 from 57.2% in 2016.
Our dividend payout ratio increased to 76.8% in 2016 from 47.2% in 2015. This increase is primarily the result of the decrease in net income attributable to stockholders combined with the increase in our dividends paid to stockholders, year-over-year. Our adjusted dividend payout ratio (non-GAAP measure) increased to 57.2% in 2016 from 53.1% in 2015.
Return on average invested capital
Our return on average invested capital is calculated as net income attributable to stockholders divided by our average invested capital. We calculate average invested capital over a trailing 12-month period by adding the average long-term debt over that period to the average stockholders’ equity over that period.
14 | Adjusted dividend payout ratio is non-GAAP financial measure. We believe that comparing the adjusted dividend payout ratio for different financial periods provides useful information about how well our net income supports our dividend payments. Adjusted dividend payout ratio is calculated by dividing dividends paid to stockholders by adjusted net income attributable to stockholders (non-GAAP measure). Adjusted dividend payout ratio is reconciled to the most directly comparable GAAP measures in our consolidated financial statements under “Non-GAAP Measures” below. |
| Ritchie Bros. | 60 |
Return on average invested capital decreased 350 bps to 5.3% in 2017 from 8.8% in 2016. This decrease is primarily due to a $375.7 million, or 36%, increase in average invested capital year-over-year, which was driven by the issuance of the Notes in the fourth quarter of 2016 and the delayed-draw term loans borrowed in the second quarter of 2017. Also contributing to the decrease in return on average invested capital over this comparative period was a $16.8 million, or 18%, decrease in net income attributable to stockholders. Return on invested capital (“ROIC”) excluding escrowed debt15 (non-GAAP measure) decreased 930 bps to 6.2% in 2017 from 15.5% in 2016.
Return on average invested capital decreased 820 bps to 8.8% in 2016 from 17.0% in 2015. This decrease is primarily due to a $240.0 million, or 30%, increase in average invested capital year-over-year, which was driven by the issuance of the Notes in the fourth quarter of 2016. Also contributing to the decrease in return on average invested capital over this comparative period was a $44.4 million, or 33%, decrease in net income attributable to stockholders. ROIC excluding escrowed debt (non-GAAP measure) increased 40 bps to 15.5% in 2016 from 15.1% in 2015.
Debt and credit facilities
At December 31, 2017, our short-term debt of $7.0 million consisted of borrowings under our committed revolving credit facilities and had a weighted average annual interest rate of 2.7%. This compares to current borrowings of $23.9 million at December 31, 2016 with a weighted average annual interest rate of 2.2%.
As at December 31, 2017, we had a total of $812.9 million long-term debt with a weighted average annual interest rate of 4.8%. This compares to long-term debt of $595.7 million as at December 31, 2016 with a weighted average annual interest rate of 4.9%.
Our long-term debt and available credit facilities at December 31, 2017 and 2016 were as follows:
| Year ended December 31, | ||||||||||||
| (in U.S. $000's) | 2017 | 2016 | % Change | |||||||||
| Long-term debt | $ | 812,892 | $ | 595,706 | 36 | % | ||||||
| Committed | ||||||||||||
| Revolving credit facilities | 685,000 | 687,000 | (0 | )% | ||||||||
| Revolving credit facilities available | 646,991 | 548,649 | 18 | % | ||||||||
| Delayed draw facility | 316,546 | 325,000 | (3 | )% | ||||||||
| Delayed draw facility available | - | 325,000 | (100 | )% | ||||||||
| Total credit facilities | $ | 1,001,546 | $ | 1,012,000 | (1 | )% | ||||||
| Total credit facilities available | 646,991 | 873,649 | (26 | )% | ||||||||
15 | ROIC excluding escrowed debt is a non-GAAP financial measure that we believe, by comparing on a trailing 12-month basis for different financial periods provides useful information about the after-tax return generated by our investments by removing the impact of the issue of the Notes, which were held in escrow at December 31, 2016. While the Notes were in escrow and not accessible by us, they were not contributing to the generation of net income. We believe that by adjusting debt to remove funds we do not have access to, we are providing more accurate information about the after-tax return generated by our investments. We calculate ROIC excluding escrowed debt as adjusted net income attributable to stockholders (non-GAAP measure) divided by adjusted average invested capital (non-GAAP measure). We calculate adjusted average invested capital (non-GAAP measure) as the adjusted average long-term debt (non-GAAP measure) and average stockholders’ equity over a trailing 12-month period. We calculate adjusted average long-term debt (non-GAAP measure) as the average of adjusted opening long-term debt (non-GAAP measure) and adjusted ending long-term debt (non-GAAP measure). Adjusted opening long-term debt (non-GAAP measure) and adjusted ending long-term debt (non-GAAP measure) are calculated as opening or ending long-term debt, as applicable, as reported in our consolidated financial statements reduced by long-term debt held in escrow. ROIC excluding escrowed debt is reconciled to the most directly comparable GAAP measures in our consolidated financial statements under “Non-GAAP Measures” below. |
| Ritchie Bros. | 61 |
Syndicated credit facility
On October 27, 2016, we entered a five-year credit agreement (the “Credit Agreement”) with a syndicate of lenders, including Bank of America, N.A. (“BofA”) and Royal Bank of Canada, that provides us with:
| 1) | Multicurrency revolving facilities of up to $675.0 million (the “Multicurrency Facilities”); |
| 2) | A delayed draw term loan facility of up to $325.0 million (the “Delayed-Draw Facility” and together with the Multicurrency Facilities, the “Syndicated Facilities”); and |
| 3) | At our election and subject to certain conditions, including receipt of related commitments, incremental term loan facilities and/or increases to the Multicurrency Facilities in an aggregate amount of up to $50 million. |
We may use the proceeds from the Multicurrency Facilities for general corporate purposes. During the second quarter of 2017, the full amount of the Delayed-Draw Facility was drawn to finance the Acquisition.
The Syndicated Facilities are secured by the assets of Ritchie Bros. Auctioneers Incorporated and certain of its subsidiaries in Canada and the United States. The Syndicated Facilities may become unsecured again, subject to Ritchie Bros. meeting specified credit rating or leverage ratio conditions. The Syndicated Facilities mature five years after the closing date of the Credit Agreement. The Delayed-Draw Facility is amortized in equal quarterly installments in an annual amount of 5% for the first two years after the closing of the Acquisition, and 10% in the third through fifth years after the closing of the Acquisition, with the balance payable at maturity.
Borrowings under the Credit Agreement bear floating rates of interest, which, at our option, are based on either a base rate (or Canadian prime rate for certain Canadian dollar borrowings) or LIBOR (or such customary floating rate customarily used by BofA for currencies other than U.S. dollars). In either case, an applicable margin is added to the rate. The applicable margin ranges from 0.25% to 1.50% for base rate loans, and 1.25% to 2.50% for LIBOR (or the equivalent of such currency) loans, depending on our leverage ratio at the time of borrowing. We must also pay quarterly in arrears a commitment fee equal to the daily amount of the unused commitments under the Syndicated Facilities multiplied by an applicable percentage per annum (which ranges from 0.25% to 0.50% depending on our leverage ratio).
We incurred debt issuance costs of $9.7 million in connection with the Credit Agreement, of which $4.7 million was allocated to the Multicurrency Facilities and $5.0 million was allocated to the Delayed-Draw Facility. As the former allocation is not related to specific draws, the costs have been capitalized as other non-current assets and are being amortized over the term of the Syndicated Facilities. For the latter allocation, the costs have been capitalized and reduce the carrying value of the delayed draw term loans to which they relate. At December 31, 2017, the unamortized deferred debt issuance costs relating to the Multicurrency Facilities and delayed draw term loans were $3.8 million and $4.1 million, respectively.
Senior unsecured notes
On December 21, 2016, we completed the offering of the Notes for an aggregate principal amount of $500.0 million. The Notes bear interest at a rate of 5.375% per annum and have a maturity date of January 15, 2025. The Notes were offered only to qualified institutional buyers in reliance on Rule 144A under the Securities Act, and outside the United States, only to non-U.S. investors pursuant to Regulation S under the Securities Act. The Notes have not been registered under the Securities Act or any state securities laws and may not be offered or sold in the United States absent an effective registration statement or an applicable exemption from registration requirements or a transaction not subject to the registration requirements of the Securities Act or any state securities laws.
The proceeds of the offering were used to finance the Acquisition. Upon the closing of the offering, the gross proceeds from the offering together with certain additional amounts including prepaid interest were deposited in to an escrow account. The funds were held in escrow until the Acquisition was completed on May 31, 2017.
| Ritchie Bros. | 62 |
Until the release of the proceeds in the escrow account, the Notes were secured by a first priority security interest in the escrow account. Upon the completion of the Acquisition, the Notes became senior unsecured obligations. The Notes are jointly and severally guaranteed on an unsecured basis, subject to certain exceptions, by each of our subsidiaries that is a borrower or guarantees indebtedness under the Credit Agreement. IronPlanet and certain of its subsidiaries were added as additional guarantors in connection with the Acquisition.
We incurred debt issuance costs of $13.9 million in connection with the offering of the Notes. At December 31, 2017, we had unamortized deferred debt issuance costs relating to the Notes of $12.7 million.
Other credit facilities
As at December 31, 2017, we also had $10.0 million in committed, revolving credit facilities, in certain foreign jurisdictions, which expire on May 31, 2018.
Debt covenants
The Credit Agreement contains certain covenants that could limit the ability of the Company and certain of its subsidiaries to, among other things and subject to certain significant exceptions: (i) incur, assume or guarantee additional indebtedness; (ii) declare or pay dividends or make other distributions with respect to, or purchase or otherwise acquire or retire for value, equity interests; (iii) make loans, advances or other investments; (iv) incur liens; (v) sell or otherwise dispose of assets; and (vi) enter into transactions with affiliates. The Credit Agreement also provides for certain events of default, which, if any of them occurs, would permit or require the principal, premium, if any, interest and any other monetary obligations on all the then outstanding amounts under the Credit Agreement to be declared immediately due and payable.
The Notes were issued pursuant to an indenture, dated December 21, 2016, with U.S. Bank National Association, as trustee (the “Indenture”). The Indenture contains covenants that limit our ability, and the ability of certain of our subsidiaries to, among other things and subject to certain significant exceptions: (i) incur, assume or guarantee additional indebtedness; (ii) declare or pay dividends or make other distributions with respect to, or purchase or otherwise acquire or retire for value, equity interests; (iii) make any principal payment on, or redeem or repurchase, subordinated debt; (iv) make loans, advances or other investments; (v) incur liens; (vi) sell or otherwise dispose of assets; and (vii) enter into transactions with affiliates. The Indenture also provides for certain events of default, which, if any of them occurs, would permit or require the principal, premium, if any, interest and any other monetary obligations on all the then outstanding Notes under the applicable indenture to be declared immediately due and payable.
At inception of the Credit Agreement and the Indenture, all parties anticipated the increase in indebtedness that followed the Acquisition. As such, covenants pertaining to our leverage ratio provide for a six-quarter expansion of debt levels, after which the leverage ratio settles to a moderately higher tier than pre-Acquisition conditions.
We were in compliance with all financial and other covenants applicable to our credit facilities at December 31, 2017.
| Ritchie Bros. | 63 |
Contractual obligations at December 31, 2017
| Payments due by period | ||||||||||||||||||||
| Less than | 1 to 3 | 3 to 5 | More than | |||||||||||||||||
| (in U.S. $000's) | Total | 1 year | years | years | 5 years | |||||||||||||||
| Long-term debt obligations: | ||||||||||||||||||||
| Principal | $ | 829,687 | $ | 16,907 | $ | 59,174 | $ | 253,606 | $ | 500,000 | ||||||||||
| Interest | 245,475 | 39,740 | 76,831 | 61,716 | 67,188 | |||||||||||||||
| Capital lease obligations | 11,305 | 3,463 | 5,778 | 2,064 | - | |||||||||||||||
| Operating lease obligations | 97,754 | 14,763 | 21,913 | 13,260 | 47,818 | |||||||||||||||
| Purchase obligations | 1,607 | 1,607 | - | - | - | |||||||||||||||
| Share unit liabilities | 8,274 | 5,407 | 2,867 | - | - | |||||||||||||||
| Other non-current liabilities | 6,140 | - | 3,698 | 23 | 2,419 | |||||||||||||||
| Total contractual obligations | $ | 1,200,242 | $ | 81,887 | $ | 170,261 | $ | 330,669 | $ | 617,425 | ||||||||||
Our long-term debt obligations included in the table above consist of draws under the New Facilities and our Notes. Our finance leases relate primarily to computer, automotive, and yard equipment. Our operating leases relate primarily to land on which we operate regional auction sites and administrative buildings, located in North America, Central America, Europe, the Middle East, and Asia. Other operating leases include leases of automotive, yard, and office equipment. Purchase obligations relate to capital expenditure commitments we have made with respect to property, plant and equipment and intangible assets. Share unit liabilities reflect the amounts of the future cash-settlement obligations of share units earned that, as of December 31, 2017, are expected to vest.
In the normal course of our business, we may guarantee a minimum level of proceeds in connection with the sale at auction of a consignor’s equipment. Our total exposure as at December 31, 2017 from these guarantee contracts was $30.9 million, compared to $15.2 million at December 31, 2016, which we anticipate will be fully covered by the proceeds that we will receive from the sale at auction of the related equipment, plus our commission. We do not record any liability in our financial statements in respect of these guarantee contracts, and they are not reflected in the contractual obligations table above.
Going concern assessment
We believe our existing working capital and availability under our credit facilities, including the New Facilities, the Notes, and our other credit facilities, are sufficient to satisfy our present operating requirements and contractual obligations (detailed above), as well as to fund future growth including, but not limited to, mergers and acquisitions, development of our A&M, RBFS, and Mascus operating segments, as well as other growth opportunities.
Off-Balance Sheet Arrangements
We have no off-balance sheet arrangements that have or are reasonably likely to have a current or future material effect on our financial condition, changes in financial condition, revenues or expenses, financial performance, liquidity, capital expenditures or capital resources.
Critical Accounting Policies, Judgments, Estimates and Assumptions
In preparing our consolidated financial statements in conformity with US GAAP, we must make decisions that impact the reported amounts and related disclosures. Such decisions include the selection of the appropriate accounting principles to be applied and the assumptions on which to base accounting estimates. In reaching such decisions, we apply judgments based on our understanding and analysis of the relevant circumstances and historical experience. On an ongoing basis, we evaluate these judgments and estimates, including:
| Ritchie Bros. | 64 |
| · | recognition of revenue from inventory sales net of cost of inventory sold; |
| · | valuation of consignors’ equipment and other assets subject to guarantee contracts; |
| · | consolidation of variable interest entities; |
| · | the grant date fair value of stock option and share unit awards; |
| · | the identification of reporting units and recoverability of goodwill; |
| · | recoverability of long-lived assets; and |
| · | recoverability of deferred income tax assets. |
Actual amounts could differ materially from those estimated by us at the time our consolidated financial statements are prepared.
The following discussion of critical accounting policies and estimates is intended to supplement the significant accounting policies presented in the notes to our consolidated financial statements included in “Part II, Item 8: Financial Statements and Supplementary Data” presented in this Annual Report on Form 10-K, which summarize the accounting policies and methods used in the preparation of those consolidated financial statements. The policies and the estimates discussed below are included here because they require more significant judgments and estimates in the preparation and presentation of our consolidated financial statements than other policies and estimates.
Recognition of revenue from inventory sales net of cost of inventory sold
We record revenues from inventory sales net of costs of inventory sold within commission revenue on the consolidated income statement. This commission revenue, as well as commission revenues earned on straight commission and guarantee contracts, is classified as revenues from the rendering of services as opposed to revenues from the sale of goods.
Most of the equipment sold at our live on site auctions is sold to the highest bidder on an unreserved basis. Although we take title to the equipment we sell under inventory contracts, the period of direct ownership is relatively short, and the equipment is processed in the same manner as other consigned equipment such that the risks and rewards of ownership are not substantially different from those in our guarantee contracts. As such, we have determined that we are acting as an agent when we sell inventory, not as a principal. And in that capacity, we record revenue from inventory sales on a net basis, as opposed to a gross basis.
For inventory contracts related to online marketplace sales, revenue from the sale of inventory through our online marketplaces are recorded net of acquisition costs because the acquisition of equipment in advance of an online marketplace sale is an ancillary component of our business and, in general, the risks and rewards of ownership are not substantially different from our other guarantee contracts. Since the online marketplace sale business is a net business, gross sales proceeds are not reported as revenue in the consolidated income statement. Rather, the net commission earned from online marketplace sales is reported as revenue, which reflects our agency relationship between buyers and sellers of equipment.
We value each inventory contract at the lower of cost and net realizable value. In addition, we monitor the results from the sale of this inventory at auction after the balance sheet date up to the release of our financial statements and record any losses realized on inventory contracts.
Consolidation of variable interest entities
When we acquire a variable interest entity (“VIE”), we must determine whether we are the primary beneficiary. If we determine that we are the primary beneficiary, we are required to consolidate the VIE. The primary beneficiary determination requires us to make assumptions as to which activities most significantly impact the VIE’s economic performance, identify the existence of any de facto related parties, and make an assessment as to whether we have the power to direct the activities determined to most significantly impact the VIE’s economic performance.
| Ritchie Bros. | 65 |
Valuation of performance share units subject to market conditions
We initially measure the cost of share units that are subject to market vesting conditions using a binomial model to determine the fair value of the liability incurred. Estimating fair value for share-based payment transactions requires determination of the most appropriate valuation model, which is dependent on the terms and conditions of the grant. This estimate also requires determination of the most appropriate inputs to the valuation model, including the expected life of the share unit, volatility and dividend yield, as well as making assumptions about them. For cash-settled share-based payment transactions, the liability needs to be re-measured at the end of each reporting period up to the date of settlement. This requires a reassessment of the estimates used at the end of each reporting period.
Recoverability of goodwill
We perform impairment tests on goodwill on an annual basis in accordance with US GAAP, or more frequently if events or changes in circumstances indicate that those assets might be impaired. Goodwill is tested for impairment at a reporting unit level, which is at the same level or one level below an operating segment. We determined our reporting units to be at the same level as our operating segments for A&M and Mascus.
On January 1, 2017, we early adopted Accounting Standards Update (“ASU”) 2017-04, Intangibles – Goodwill and Other (Topic 350): Simplifying the Test for Goodwill Impairment (“ASU 2017-04”), which eliminates Step 2 from the goodwill impairment test. Under ASU 2017-04, we still have the option of performing a qualitative assessment of a reporting unit to first determine whether the quantitative impairment test is necessary. We exercise judgment in performing our qualitative assessment of whether indicators of impairment exist.
When we determine that an annual or interim quantitative impairment test is necessary, we now only perform one step to identify potential impairment, which is to compare the reporting unit’s fair value with its carrying amount, including goodwill. The reporting unit’s fair value is determined using various valuation approaches and techniques that involve assumptions based on what we believe a hypothetical marketplace participant would use in estimating fair value on the measurement date. An impairment loss is recognized as the difference between the reporting unit’s carrying amount and its fair value to the extent the difference does not exceed the total amount of goodwill allocated to the reporting unit.
We measure the fair value of our reporting units using an earnings valuation approach, which employs a discounted cash flow valuation technique. In applying this valuation approach, management is required to make significant estimates and assumptions about the timing and amount of future cash flows, revenue growth rates, and discount rates, which requires a significant amount of judgment. Accordingly, actual results may differ from those used in the goodwill impairment test.
A&M reporting unit goodwill
Significant estimates used in the earnings approach valuation of our A&M reporting unit are our discount rate of 10%, which reflects the risk premium on this reporting unit based on assessments of risks related to projected cash flows, and our long-term growth rate of 3%, which is used to extrapolate cash flows beyond the five-year forecast.
Mascus reporting unit goodwill
Goodwill arising from the acquisition of Mascus forms part of the reporting unit On December 31, 2017, we performed the US GAAP goodwill impairment test.
Using the cash flow methodology of the earnings approach, the fair value of the Mascus reporting unit was measured based on the present value of the cash flows that we expect the reporting unit to generate. The testing was performed in Mascus’ functional currency, which is the Euro.
| Ritchie Bros. | 66 |
The earnings approach valuation was most sensitive to the following assumptions:
| (i) | Revenue growth rate |
Cash flow forecasts estimate an annual growth rate of 15% in fiscal 2018 and 8% in each of fiscal 2019 through 2023. The estimated growth rate used in determining the Mascus reporting unit’s future cash flows is based on our expectation of future growth rates resulting from application of our business strategy.
| (ii) | Operating margin |
Cash flow forecasts estimate an operating margin of 34% in fiscal 2018, 36% in fiscal 2019, 39% in fiscal 2020, 41% in fiscal 2021, and 43% in fiscal 2022. The estimated operating margin used in determining the Mascus reporting unit’s future cash flows is based on our expectation of future growth rates resulting from application of our business strategy.
We applied a discount rate of 12% which reflects the risk premium on this reporting unit based on assessments of risks related to projected cash flows. Cash flows beyond the five-year period were extrapolated using a long-term growth rate estimated to be 3.5%.
As the fair value of the Mascus reporting unit was greater than its carrying amount, management concluded that Mascus goodwill was not impaired at December 31, 2017. We estimated that the fair value of the Mascus reporting unit exceeds its carrying amount by 7.9 million Euros ($9.5 million). Consequently, a reasonably possible decline in the revenue growth rate or operating margin may result in an impairment loss.
With all other assumptions remaining constant, the following changes taken individually would result in the Mascus reporting unit’s fair value being equal to its carrying amount:
| · | Revenue growth rate – decrease of five percentage points |
| · | Operating margin – decrease of 10 percentage points |
Recoverability of indefinite-lived intangible assets
We perform impairment tests on indefinite-lived intangible assets, which are certain of our trade names and trademarks, on an annual basis in accordance with US GAAP, or more frequently if events or changes in circumstances indicate that those assets might be impaired. We elected to bypass the qualitative assessment and performed a quantitative impairment test during our annual impairment test on December 31, 2017. The indefinite-lived intangible asset’s fair value is determined using the relief from royalty valuation approach and involves assumptions based on what we believe a hypothetical marketplace participant would use in estimating fair value on the measurement date. An impairment loss is recognized as the difference between the indefinite-lived intangible asset’s carrying amount and its fair value.
Indefinite-lived intangible asset impairment testing involves determination of the unit of accounting, which we determined to be at the same level as our operating segments for A&M and Mascus.
A&M
In making the determination that the intangible assets in the A&M segment should be combined as a single unit of accounting for impairment testing purposes, we exercised significant judgement in concluding that those assets are operated as a single asset and are, essentially, inseparable from one another.
Significant estimates used in the valuation of the A&M indefinite-lived intangible asset included a discount rate of 10% based on assessments of risks related to projected cash flows, and a long-term growth rate of 3%, which was used to extrapolate cash flows beyond the five-year forecast.
Since the fair value of the A&M indefinite-lived intangible asset was greater than its carrying amount, management concluded the asset was not impaired at December 31, 2017.
| Ritchie Bros. | 67 |
Mascus
Significant estimates used in the valuation of the Mascus indefinite-lived intangible asset included a revenue growth rate projection of 15% in fiscal 2018 and 8% in each of fiscal 2019 to 2022, a discount rate of 12% based on assessments of risks related to the projected cash flows, and a long-term growth rate of 3.5%, which was used to extrapolate cash flows beyond the five-year forecast.
Since the fair value of the Mascus indefinite-lived intangible asset was greater than its carrying amount, management concluded that the asset was not impaired at December 31, 2017.
Accounting for income taxes
Income taxes are accounted for using the asset and liability method. Deferred income tax assets and liabilities are based on temporary differences (differences between the accounting basis and the tax basis of the assets and liabilities) and non-capital loss, capital loss, and tax credit carry-forwards are measured using the enacted tax rates and laws expected to apply when these differences reverse. Deferred tax benefits, including non-capital loss, capital loss, and tax credits carry-forwards, are recognized to the extent that realization of such benefits is considered more likely than not.
Changes in tax rates and tax law are accounted for in the period of enactment. On December 22, 2017, new federal tax reform legislation was enacted in the United States, resulting in significant changes from previous tax law. The TCJA reduces the federal corporate income tax rate to 21% from 35% effective January 1, 2018. ASC 740, Income Taxes, requires deferred tax assets and liabilities to be measured at the enacted tax rate expected to apply when temporary differences are to be realized or settled, which may impact the carrying values of deferred tax assets and liabilities. The effect of a change in tax law is recorded as a discrete component of the income tax provision related to continuing operations in the period of enactment. Changes in the valuation allowance assessment due to the TCJA would also be recorded to continuing operations in the tax provision. When realization of deferred income tax assets does not meet the more-likely-than-not criterion for recognition, a valuation allowance is provided.
Liabilities for uncertain tax positions are recorded based on a two-step process. The first step is to evaluate the tax position for recognition by determining if the weight of available evidence indicates that it is more likely than not that the position will be sustained on audit, including resolution of related appeals or litigation processes, if any. The second step is to measure the tax benefit as the largest amount that is more than 50% likely of being realized upon settlement. We regularly assess the potential outcomes of examinations by tax authorities in determining the adequacy of our provision for income taxes. We also continually assess the likelihood and amount of potential adjustments and adjust the income tax provision, income taxes payable and deferred taxes in the period in which the facts that give rise to a revision become known.
Recent Accounting Pronouncements
Recent accounting pronouncements that significantly impact our accounting policies or the presentation of our consolidated financial position or performance have been disclosed in the notes to our consolidated financial statements included in “Part II, Item 8: Financial Statements and Supplementary Data” presented elsewhere in this Annual Report on Form 10-K.
Future changes in accounting policies – recent accounting standards not yet adopted
In May 2014, the Financial Accounting Standards Board issued ASU 2014-09, Revenue from Contracts with Customers (Topic 606) (“ASU 2014-09”), which requires an entity to recognize revenue when it transfers promised goods or services to customers in an amount that reflects the consideration to which the entity expects to be entitled in exchange for those goods or services. ASU 2014-09 is effective for fiscal years, and interim periods within those fiscal years, beginning after December 15, 2017. We will not early adopt ASU 2014-09, and as such, the effective date will be January 1, 2018. We have decided to adopt ASU 2014-09 on a retrospective basis.
| Ritchie Bros. | 68 |
While continuing to assess all potential impacts of adoption of ASU 2014-09, our current analysis indicates that the most significant change will be in the presentation of revenue from the majority of inventory, ancillary service, and RB Logistics contracts to gross as a principal instead of net as an agent. This presentation is expected to significantly increase the amount of revenue reported compared to the current presentation, as well as add volatility to revenue over comparative periods. Presenting these revenues gross as a principal versus net as an agent has no impact on operating income.
The following tables illustrate the expected impact on our reported results of retrospectively adopting ASU 2014-09 and, thereunder, presenting the majority of inventory, ancillary service, and RB Logistics revenues on a gross basis.
| (in U.S. $000's) | Full Year 2017 | Q4 2017 | Q3 2017 | Q2 2017 | Q1 2017 | |||||||||||||||
| Total revenues: | ||||||||||||||||||||
| As reported | $ | 610,517 | $ | 178,785 | $ | 141,047 | $ | 166,186 | $ | 124,499 | ||||||||||
| Expected impact: | ||||||||||||||||||||
| Sales of inventory gross up | 306,498 | 98,895 | 72,476 | 71,726 | 63,401 | |||||||||||||||
| Ancillary service and RB Logistics gross up | 54,176 | 14,070 | 13,878 | 14,701 | 11,527 | |||||||||||||||
| New revenue standard | $ | 971,191 | $ | 291,750 | $ | 227,401 | $ | 252,613 | $ | 199,427 | ||||||||||
| Operating income: | ||||||||||||||||||||
| As reported | $ | 107,454 | $ | 40,038 | $ | 16,931 | $ | 26,888 | $ | 23,597 | ||||||||||
| New revenue standard | 107,454 | 40,038 | 16,931 | 26,888 | 23,597 | |||||||||||||||
| (in U.S. $000's) | Full Year 2016 | Q4 2016 | Q3 2016 | Q2 2016 | Q1 2016 | |||||||||||||||
| Total revenues: | ||||||||||||||||||||
| As reported | $ | 566,395 | $ | 146,769 | $ | 128,876 | $ | 158,805 | $ | 131,945 | ||||||||||
| Expected impact: | ||||||||||||||||||||
| Sales of inventory gross up | 513,348 | 136,984 | 159,850 | 104,978 | 111,536 | |||||||||||||||
| Ancillary service and RB Logistics gross up | 47,234 | 11,077 | 12,250 | 11,884 | 12,023 | |||||||||||||||
| New revenue standard | $ | 1,126,977 | $ | 294,830 | $ | 300,976 | $ | 275,667 | $ | 255,504 | ||||||||||
| Operating income: | ||||||||||||||||||||
| As reported | $ | 135,722 | $ | 40,628 | $ | 2,285 | $ | 53,635 | $ | 39,174 | ||||||||||
| New revenue standard | 135,722 | 40,628 | 2,285 | 53,635 | 39,174 | |||||||||||||||
| Ritchie Bros. | 69 |
| (in U.S. $000's) | Full Year 2015 | Q4 2015 | Q3 2015 | Q2 2015 | Q1 2015 | |||||||||||||||
| Total revenues: | ||||||||||||||||||||
| As reported | $ | 515,875 | $ | 135,462 | $ | 109,318 | $ | 155,477 | $ | 115,618 | ||||||||||
| Expected impact: | ||||||||||||||||||||
| Sales of inventory gross up | 511,892 | 139,314 | 97,745 | 136,255 | 138,578 | |||||||||||||||
| Ancillary service and RB Logistics gross up | 52,732 | 14,880 | 13,216 | 13,946 | 10,690 | |||||||||||||||
| New revenue standard | $ | 1,080,499 | $ | 289,656 | $ | 220,279 | $ | 305,678 | $ | 264,886 | ||||||||||
| Operating income: | ||||||||||||||||||||
| As reported | $ | 174,840 | $ | 50,424 | $ | 28,602 | $ | 62,795 | $ | 33,019 | ||||||||||
| New revenue standard | 174,840 | 50,424 | 28,602 | 62,795 | 33,019 | |||||||||||||||
Revenue reported under current US GAAP increased 8% in 2017 compared to 2016. The expected impact of retrospectively adopting ASU 2014-09 would result in a 14% decrease in total revenues of 2017 compared to 2016.
Revenue reported under current US GAAP increased 10% in 2016 compared to 2015. The expected impact of retrospectively adopting ASU 2014-09 would result in a 4% increase in total revenues of 2016 compared to 2015.
Revenue under current US GAAP will be most comparable to total revenues less cost of inventory sold under ASU 2014-09. As such, when ASU 2014-09 takes effect, we will introduce a new non-GAAP financial measure that we are tentatively calling “Agency Proceeds”, which will be calculated as total revenues less cost of inventory sold and will replace revenues used in our key performance metrics.
| Ritchie Bros. | 70 |
Non-GAAP Measures
We reference various non-GAAP measures throughout this Annual Report on Form 10-K. These measures do not have a standardized meaning and are, therefore, unlikely to be comparable to similar measures presented by other companies. The presentation of this financial information, which is not prepared under any comprehensive set of accounting rules or principles, is not intended to be considered in isolation of, or as a substitute for, the financial information prepared and presented in accordance with generally accepted accounting principles.
The following table presents our adjusted operating income (non-GAAP measure) and adjusted operating income margin (non-GAAP measure) results for the years ended December 31, 2017, 2016 and 2015, as well as reconciles those metrics to operating income, revenues, and operating income margin, which are the most directly comparable GAAP measures in, or calculated from, our consolidated income statements:
| Year ended December 31, | ||||||||||||||||||||
| Change | ||||||||||||||||||||
| (in U.S. $000's) | 2017 | 2016 | 2015 | 2017 over 2016 | 2016 over 2015 | |||||||||||||||
| Operating income | $ | 107,454 | $ | 135,722 | $ | 174,840 | (21 | )% | (22 | )% | ||||||||||
| Pre-tax adjusting items: | ||||||||||||||||||||
| Accelerated vesting of assumed options | 4,752 | - | - | 100 | % | - | ||||||||||||||
| Acquisition and finance structure advisory | 9,063 | - | - | 100 | % | - | ||||||||||||||
| Severance and retention | 3,613 | - | - | 100 | % | - | ||||||||||||||
| Gain on sale of excess property | - | - | (8,384 | ) | - | (100 | )% | |||||||||||||
| Impairment loss | 8,911 | 28,243 | - | (68 | )% | 100 | % | |||||||||||||
| Adjusted operating income (non-GAAP measure) | 133,793 | 163,965 | 166,456 | (18 | )% | (1 | )% | |||||||||||||
| Revenues | $ | 610,517 | $ | 566,395 | $ | 515,875 | 8 | % | 10 | % | ||||||||||
| Operating income margin | 17.6 | % | 24.0 | % | 33.9 | % | -640 bps | -990 bps | ||||||||||||
| Adjusted operating income margin (non-GAAP measure) | 21.9 | % | 28.9 | % | 32.3 | % | -700 bps | -340 bps | ||||||||||||
The adjusting items for the year ended December 31, 2017 were:
| · | $4.8 million ($4.8 million after tax, or $0.04 per diluted share) of stock option compensation expense related to the accelerated vesting of certain IronPlanet stock options assumed as part of the Acquisition |
| · | $9.1 million ($6.6 million after tax, or $0.06 per diluted share) of acquisition and finance structure advisory costs, |
| · | $3.6 million ($2.5 million after tax, or $0.02 per diluted share) of severance and retention costs in a corporate reorganization that followed the Acquisition |
| · | $8.9 million ($6.6 million after tax, or $0.06 per diluted share) impairment loss recognized on various technology assets |
The adjusting item for the year ended December 31, 2016 was a $28.2 million ($26.4 million after tax, or $0.25 per diluted share) impairment loss on EquipmentOne reporting unit goodwill and customer relationships.
The adjusting item for the year ended December 31, 2015 was an $8.4 million ($7.3 million after tax, or $0.07 per diluted share) gain on the sale of the excess property in Edmonton, Canada.
| Ritchie Bros. | 71 |
The following table presents our adjusted net income attributable to stockholders (non-GAAP measure) and diluted adjusted EPS attributable to stockholders (non-GAAP measure) results for the years ended December 31, 2017, 2016, and 2015, as well as reconciles those metrics to net income attributable to stockholders, the effect of dilutive securities, the weighted average number of dilutive shares outstanding, and diluted EPS attributable to stockholders, which are the most directly comparable GAAP measures in our consolidated income statements:
| Year ended December 31, | ||||||||||||||||||||
| Change | ||||||||||||||||||||
| (in U.S. $000's, except share and per share data) | 2017 | 2016 | 2015 | 2017 over 2016 | 2016 over 2015 | |||||||||||||||
| Net income attributable to stockholders | $ | 75,027 | $ | 91,832 | $ | 136,214 | (18 | )% | (33 | )% | ||||||||||
| Pre-tax adjusting items: | ||||||||||||||||||||
| Accelerated vesting of assumed options | 4,752 | - | - | 100 | % | - | ||||||||||||||
| Acquisition and finance structure advisory | 9,063 | - | - | 100 | % | - | ||||||||||||||
| Severance and retention | 3,613 | - | - | 100 | % | - | ||||||||||||||
| Debt extinguishment costs | - | 6,787 | - | (100 | )% | 100 | % | |||||||||||||
| Gain on sale of excess property | - | - | (8,384 | ) | - | (100 | )% | |||||||||||||
| Impairment loss | 8,911 | 28,243 | - | (68 | )% | 100 | % | |||||||||||||
| Current income tax effect of adjusting items: | ||||||||||||||||||||
| Acquisition and finance structure advisory | (2,447 | ) | - | - | 100 | % | - | |||||||||||||
| Severance and retention | (748 | ) | - | - | 100 | % | - | |||||||||||||
| Debt extinguishment costs | - | (1,787 | ) | - | (100 | )% | 100 | % | ||||||||||||
| Gain on sale of excess property | - | - | 1,090 | - | (100 | )% | ||||||||||||||
| Deferred income tax effect of adjusting items: | ||||||||||||||||||||
| Impairment loss | (2,361 | ) | (1,798 | ) | - | 31 | % | 100 | % | |||||||||||
| Severance and retention | (368 | ) | - | - | 100 | % | - | |||||||||||||
| Current income tax adjusting item: | ||||||||||||||||||||
| Change in uncertain tax provision | 2,290 | - | - | 100 | % | - | ||||||||||||||
| Deferred tax adjusting item: | ||||||||||||||||||||
| Remeasurement of deferred taxes | (10,070 | ) | - | - | 100 | % | - | |||||||||||||
| Tax loss utilization | - | - | (7,862 | ) | - | (100 | )% | |||||||||||||
| Adjusted net income attributable to stockholders (non-GAAP measure) | $ | 87,662 | $ | 123,277 | $ | 121,058 | (29 | )% | 2 | % | ||||||||||
| Effect of dilutive securities | $ | (152 | ) | $ | - | $ | - | 100 | % | - | ||||||||||
| Weighted average number of dilutive shares outstanding | 108,113,151 | 107,457,794 | 107,432,474 | 1 | % | - | % | |||||||||||||
| Diluted EPS attributable to stockholders | $ | 0.69 | $ | 0.85 | $ | 1.27 | (19 | )% | (33 | )% | ||||||||||
| Diluted adjusted EPS attributable to stockholders (non-GAAP measure) | $ | 0.81 | $ | 1.15 | $ | 1.13 | (30 | )% | 2 | % | ||||||||||
The adjusting items for the year ended December 31, 2017 were:
| · | $4.8 million ($4.8 million after tax, or $0.04 per diluted share) of stock option compensation expense related to the accelerated vesting of certain IronPlanet stock options assumed as part of the Acquisition |
| · | $9.1 million ($6.6 million after tax, or $0.06 per diluted share) of acquisition and finance structure advisory costs, |
| Ritchie Bros. | 72 |
| · | $3.6 million ($2.5 million after tax, or $0.02 per diluted share) of severance and retention costs in a corporate reorganization that followed the Acquisition |
| · | $8.9 million ($6.6 million after tax, or $0.06 per diluted share) impairment loss recognized on various technology assets |
| · | $2.3 million (or $0.02 per diluted share) charge related to the change in uncertain tax provisions |
| · | $10.1 million (or $0.10 per diluted share) benefit on remeasurement of deferred taxes as a result of the TCJA |
The adjusting items for the year ended December 31, 2016 were:
| · | $6.8 million ($5.0 million after tax, or $0.05 per diluted share) charge related to the early termination of pre-existing debt |
| · | $28.2 million ($26.4 million after tax, or $0.25 per diluted share) impairment loss on EquipmentOne reporting unit goodwill and customer relationships |
The adjusting items for the year ended December 31, 2015 were:
| · | $8.4 million ($7.3 million before tax, or $0.07 per diluted share) gain on the sale of excess property in Edmonton, Canada |
| · | $7.9 million before tax (or $0.07 per diluted share) of tax savings generated by tax loss utilization |
| Ritchie Bros. | 73 |
The following table presents our adjusted EBITDA (non-GAAP measure) and adjusted EBITDA margin (non-GAAP measure) results for the years ended December 31, 2017, 2016 and 2015, as well as reconciles those metrics to net income, revenues, and net income margin, which are the most directly comparable GAAP measures in, or calculated from, our consolidated income statements:
| Year ended December 31, | ||||||||||||||||||||
| Change | ||||||||||||||||||||
| (in U.S. $000's) | 2017 | 2016 | 2015 | 2017 over 2016 | 2016 over 2015 | |||||||||||||||
| Net income | $ | 75,306 | $ | 93,512 | $ | 138,575 | (19 | )% | (33 | )% | ||||||||||
| Add: depreciation and amortization expenses | 52,694 | 40,861 | 42,032 | 29 | % | (3 | )% | |||||||||||||
| Less: interest income | (3,194 | ) | (1,863 | ) | (2,660 | ) | 71 | % | (30 | )% | ||||||||||
| Add: interest expense | 38,291 | 5,564 | 4,962 | 588 | % | 12 | % | |||||||||||||
| Add: current income tax expense | 19,356 | 40,341 | 42,420 | (52 | )% | (5 | )% | |||||||||||||
| Add: deferred income tax recovery | (17,268 | ) | (3,359 | ) | (4,559 | ) | 414 | % | (26 | )% | ||||||||||
| Pre-tax adjusting items: | ||||||||||||||||||||
| Accelerated vesting of assumed options | 4,752 | - | - | 100 | % | - | ||||||||||||||
| Acquisition and finance structure advisory | 9,063 | - | - | 100 | % | - | ||||||||||||||
| Severance and retention | 3,613 | - | - | 100 | % | - | ||||||||||||||
| Debt extinguishment costs | - | 6,787 | - | (100 | )% | 100 | % | |||||||||||||
| Gain on sale of excess property | - | - | (8,384 | ) | - | (100 | )% | |||||||||||||
| Impairment loss | 8,911 | 28,243 | - | (68 | )% | 100 | % | |||||||||||||
| Adjusted EBITDA (non-GAAP measure) | 191,524 | 210,086 | 212,386 | (9 | )% | (1 | )% | |||||||||||||
| Revenues | $ | 610,517 | $ | 566,395 | $ | 515,875 | 8 | % | 10 | % | ||||||||||
| Net income margin | 12.3 | % | 16.5 | % | 26.9 | % | -420 bps | -1040 bps | ||||||||||||
| Adjusted EBITDA margin (non-GAAP measure) | 31.4 | % | 37.1 | % | 41.2 | % | -570 bps | -410 bps | ||||||||||||
The adjusting items for the year ended December 31, 2017 were:
| · | $4.8 million ($4.8 million after tax, or $0.04 per diluted share) of stock option compensation expense related to the accelerated vesting of certain IronPlanet stock options assumed as part of the Acquisition |
| · | $9.1 million ($6.6 million after tax, or $0.06 per diluted share) of acquisition and finance structure advisory costs |
| · | $3.6 million ($2.5 million after tax, or $0.02 per diluted share) of severance and retention costs in a corporate reorganization that followed the Acquisition |
| · | $8.9 million ($6.6 million after tax, or $0.06 per diluted share) impairment loss recognized on various technology assets |
The adjusting items for the year ended December 31, 2016 were:
| · | $6.8 million ($5.0 million after tax, or $0.05 per diluted share) charge related to the early termination of pre-existing debt |
| · | $28.2 million ($26.4 million after tax, or $0.25 per diluted share) impairment loss on the EquipmentOne reporting unit goodwill and customer relationships |
The adjusting item for the year ended December 31, 2015 was an $8.4 million ($7.3 million after tax, or $0.07 per diluted share) gain on the sale of excess property in Edmonton, Canada.
| Ritchie Bros. | 74 |
The following table presents our adjusted net debt/adjusted EBITDA (non-GAAP measures) results as at and for the years ended December 31, 2017, 2016, and 2015, as well as reconciles that metric to debt, cash and cash equivalents, net income, and debt as a multiple of net income, which are the most directly comparable GAAP measures in, or calculated from, our consolidated financial statements:
| (in U.S. $ millions) | As at and for the year ended December 31, | |||||||||||||||||||
| Change | ||||||||||||||||||||
| 2017 | 2016 | 2015 | 2017 over 2016 | 2016 over 2015 | ||||||||||||||||
| Short-term debt | $ | 7.0 | $ | 23.9 | $ | 12.4 | (71 | )% | 93 | % | ||||||||||
| Long-term debt | 812.9 | 595.7 | 97.9 | 36 | % | 508 | % | |||||||||||||
| Debt | 819.9 | 619.6 | 110.3 | 32 | % | 462 | % | |||||||||||||
| Less: cash and cash equivalents | (267.9 | ) | (207.9 | ) | (210.1 | ) | 29 | % | (1 | )% | ||||||||||
| Less: long-term debt in escrow | - | (495.8 | ) | - | (100 | )% | 100 | % | ||||||||||||
| Adjusted net debt (non-GAAP measure) | 552.0 | (84.1 | ) | (99.8 | ) | 756 | % | (16 | )% | |||||||||||
| Net income | $ | 75.3 | $ | 93.5 | $ | 138.6 | (19 | )% | (33 | )% | ||||||||||
| Add: depreciation and amortization expenses | 52.7 | 40.9 | 42.1 | 29 | % | (3 | )% | |||||||||||||
| Less: interest income | (3.2 | ) | (1.9 | ) | (2.7 | ) | 68 | % | (30 | )% | ||||||||||
| Add: interest expense | 38.3 | 5.6 | 5.0 | 584 | % | 12 | % | |||||||||||||
| Add: current income tax expense | 19.4 | 40.3 | 42.4 | (52 | )% | (5 | )% | |||||||||||||
| Less: deferred income tax recovery | (17.3 | ) | (3.4 | ) | (4.6 | ) | 409 | % | (26 | )% | ||||||||||
| Pre-tax adjusting items: | ||||||||||||||||||||
| Accelerated vesting of assumed options | 4.8 | - | - | 100 | % | - | ||||||||||||||
| Acquisition and finance structure advisory | 9.1 | - | - | 100 | % | - | ||||||||||||||
| Severance and retention | 3.6 | - | - | 100 | % | - | ||||||||||||||
| Debt extinguishment costs | - | 6.8 | - | (100 | )% | 100 | % | |||||||||||||
| Gain on sale of excess property | - | - | (8.4 | ) | - | (100 | )% | |||||||||||||
| Impairment loss | 8.9 | 28.2 | - | (68 | )% | 100 | % | |||||||||||||
| Adjusted EBITDA (non-GAAP measure) | $ | 191.5 | $ | 210.1 | $ | 212.4 | (9 | )% | (1 | )% | ||||||||||
| Debt/net income | 10.9 | x | 6.6 | x | 0.8 | x | 65 | % | 725 | % | ||||||||||
| Adjusted net debt/adjusted EBITDA (non-GAAP measure) | 2.9 | x | -0.4 | x | -0.5 | x | 825 | % | (20 | )% | ||||||||||
The adjusting items for the year ended December 31, 2017 were:
| · | $4.8 million ($4.8 million after tax, or $0.04 per diluted share) of stock option compensation expense related to the accelerated vesting of certain IronPlanet stock options assumed as part of the Acquisition |
| · | $9.1 million ($6.6 million after tax, or $0.06 per diluted share) of acquisition and finance structure advisory costs |
| · | $3.6 million ($2.5 million after tax, or $0.02 per diluted share) of severance and retention costs in a corporate reorganization that followed the Acquisition |
| · | $8.9 million ($6.6 million after tax, or $0.06 per diluted share) impairment loss recognized on various technology assets |
The adjusting items for the year ended December 31, 2016 were:
| · | $6.8 million ($5.0 million after tax, or $0.05 per diluted share) charge related to the early termination of pre-existing debt |
| Ritchie Bros. | 75 |
| · | $28.2 million ($26.4 million after tax, or $0.25 per diluted share) impairment loss on the EquipmentOne reporting unit goodwill and customer relationships |
The adjusting item for the year ended December 31, 2015 was an $8.4 million ($7.3 million after tax, or $0.07 per diluted share) gain on the sale of excess property in Edmonton, Canada.
The following table presents our OFCF (non-GAAP measure) results for the years ended December 31, 2017, 2016, and 2015, as well as reconciles that metric to cash provided by operating activities and net capital spending, which are the most directly comparable GAAP measures in, or calculated from, our consolidated statements of cash flows:
| Year ended December 31, | ||||||||||||||||||||
| Change | ||||||||||||||||||||
| (in U.S. $ millions) | 2017 | 2016 | 2015 | 2017 over 2016 | 2016 over 2015 | |||||||||||||||
| Cash provided by operating activities | $ | 146.3 | $ | 177.6 | $ | 196.5 | (18 | %) | (10 | %) | ||||||||||
| Property, plant and equipment additions | 10.8 | 18.9 | 22.1 | (43 | %) | (14 | %) | |||||||||||||
| Intangible asset additions | 28.6 | 17.6 | 8.8 | 63 | % | 100 | % | |||||||||||||
| Proceeds on disposition of property | - | - | ||||||||||||||||||
| plant and equipment | (5.0 | ) | (6.7 | ) | (16.7 | ) | (25 | %) | (60 | %) | ||||||||||
| Net capital spending | $ | 34.4 | $ | 29.8 | $ | 14.2 | 15 | % | 110 | % | ||||||||||
| OFCF (non-GAAP measure) | $ | 111.9 | $ | 147.8 | $ | 182.3 | (24 | %) | (19 | %) | ||||||||||
| Ritchie Bros. | 76 |
The following table presents our adjusted net income attributable to stockholders (non-GAAP measure) and adjusted dividend payout ratio (non-GAAP measure) results for the years ended December 31, 2017, 2016, and 2015, as well as reconciles those metrics to dividends paid to stockholders, net income attributable to stockholders, and dividend payout ratio, which are the most directly comparable GAAP measures in, or calculated from, our consolidated financial statements:
| Year ended December 31, | ||||||||||||||||||||
| Change | ||||||||||||||||||||
| (in U.S. $ millions) | 2017 | 2016 | 2015 | 2017 over 2016 | 2016 over 2015 | |||||||||||||||
| Dividends paid to stockholders | $ | 72.8 | $ | 70.5 | $ | 64.3 | 3 | % | 10 | % | ||||||||||
| Net income attributable to stockholders | $ | 75.0 | $ | 91.8 | $ | 136.2 | (18 | %) | (33 | %) | ||||||||||
| Pre-tax adjusting items: | ||||||||||||||||||||
| Accelerated vesting of assumed options | 4.8 | - | - | 100 | % | - | ||||||||||||||
| Acquisition and finance structure advisory | 9.1 | - | - | 100 | % | - | ||||||||||||||
| Severance and retention | 3.6 | - | - | 100 | % | - | ||||||||||||||
| Debt extinguishment costs | - | 6.8 | - | (100 | %) | 100 | % | |||||||||||||
| Gain on sale of excess property | - | - | (8.4 | ) | - | (100 | %) | |||||||||||||
| Impairment loss | 8.9 | 28.2 | - | (68 | %) | 100 | % | |||||||||||||
| Current income tax effect of adjusting items: | ||||||||||||||||||||
| Acquisition and finance structure advisory | (2.4 | ) | - | - | 100 | % | - | |||||||||||||
| Severance and retention | (0.7 | ) | - | - | 100 | % | - | |||||||||||||
| Debt extinguishment costs | - | (1.8 | ) | - | (100 | %) | 100 | % | ||||||||||||
| Gain on sale of excess property | - | - | 1.1 | - | (100 | %) | ||||||||||||||
| Deferred income tax effect of adjusting items: | ||||||||||||||||||||
| Impairment loss | (2.4 | ) | (1.8 | ) | - | 33 | % | 100 | % | |||||||||||
| Severance and retention | (0.4 | ) | - | - | 100 | % | - | |||||||||||||
| Current income tax adjusting item: | ||||||||||||||||||||
| Change in uncertain tax provision | 2.3 | - | - | 100 | % | - | ||||||||||||||
| Deferred tax adjusting item: | ||||||||||||||||||||
| Remeasurement of deferred taxes | (10.1 | ) | - | - | 100 | % | - | |||||||||||||
| Tax loss utilization | - | - | (7.9 | ) | - | (100 | %) | |||||||||||||
| Adjusted net income attributable to stockholders (non-GAAP measure) | $ | 87.7 | $ | 123.3 | $ | 121.1 | (29 | %) | 2 | % | ||||||||||
| Dividend payout ratio | 97.1 | % | 76.8 | % | 47.2 | % | 2030 bps | 2960 bps | ||||||||||||
| Adjusted dividend payout ratio (non-GAAP measure) | 83.0 | % | 57.2 | % | 53.1 | % | 2580 bps | 410 bps | ||||||||||||
The adjusting items for the year ended December 31, 2017 were:
| · | $4.8 million ($4.8 million after tax, or $0.04 per diluted share) of stock option compensation expense related to the accelerated vesting of certain IronPlanet stock options assumed as part of the Acquisition |
| · | $9.1 million ($6.6 million after tax, or $0.06 per diluted share) of acquisition and finance structure advisory costs, |
| · | $3.6 million ($2.5 million after tax, or $0.02 per diluted share) of severance and retention costs in a corporate reorganization that followed the Acquisition |
| · | $8.9 million ($6.6 million after tax, or $0.06 per diluted share) impairment loss recognized on various technology assets |
| Ritchie Bros. | 77 |
| · | $2.3 million (or $0.02 per diluted share) charge related to the change in uncertain tax provisions |
| · | $10.1 million (or $0.10 per diluted share) benefit on remeasurement of deferred taxes due to the TCJA |
The adjusting items for the year ended December 31, 2016 were:
| · | $6.8 million ($5.0 million after tax, or $0.05 per diluted share) charge related to the early termination of pre-existing debt |
| · | $28.2 million ($26.4 million after tax, or $0.25 per diluted share) impairment loss on EquipmentOne reporting unit goodwill and customer relationships |
The adjusting items for the year ended December 31, 2015 were:
| · | $8.4 million ($7.3 million before tax, or $0.07 per diluted share) gain on the sale of excess property in Edmonton, Canada |
| · | $7.9 million before tax (or $0.07 per diluted share) of tax savings generated by tax loss utilization |
The following table presents our ROIC excluding escrowed debt (non-GAAP measure) results as at and for the years ended December 31, 2017, 2016, and 2015, as well as reconciles that metric to net income attributable to stockholders, long-term debt, stockholders’ equity, and return on average invested capital, which are the most directly comparable GAAP measures in, or calculated from, our consolidated financial statements:
| Ritchie Bros. | 78 |
| As at and for the year ended December 31, | ||||||||||||||||||||
| Change | ||||||||||||||||||||
| (in U.S. $ millions) | 2017 | 2016 | 2015 | 2017 over 2016 | 2016 over 2015 | |||||||||||||||
| Net income attributable to stockholders | $ | 75.0 | $ | 91.8 | $ | 136.2 | (18 | )% | (33 | )% | ||||||||||
| Pre-tax adjusting items: | ||||||||||||||||||||
| Accelerated vesting of assumed options | 4.8 | - | - | 100 | % | - | ||||||||||||||
| Acquisition and finance structure advisory | 9.1 | - | - | 100 | % | - | ||||||||||||||
| Severance and retention | 3.6 | - | - | 100 | % | - | ||||||||||||||
| Debt extinguishment costs | - | 6.8 | - | (100 | )% | 100 | % | |||||||||||||
| Gain on sale of excess property | - | - | (8.4 | ) | - | (100 | )% | |||||||||||||
| Impairment loss | 8.9 | 28.2 | - | (68 | )% | 100 | % | |||||||||||||
| Current income tax effect of adjusting items: | ||||||||||||||||||||
| Acquisition and finance structure advisory | (2.4 | ) | - | - | 100 | % | - | |||||||||||||
| Severance and retention | (0.7 | ) | - | - | 100 | % | - | |||||||||||||
| Debt extinguishment costs | - | (1.8 | ) | - | (100 | )% | 100 | % | ||||||||||||
| Gain on sale of excess property | - | - | 1.1 | - | (100 | )% | ||||||||||||||
| Deferred income tax effect of adjusting items: | ||||||||||||||||||||
| Impairment loss | (2.4 | ) | (1.8 | ) | - | 33 | % | 100 | % | |||||||||||
| Severance and retention | (0.4 | ) | - | - | 100 | % | - | |||||||||||||
| Current income tax adjusting item: | ||||||||||||||||||||
| Change in uncertain tax provision | 2.3 | - | - | 100 | % | - | ||||||||||||||
| Deferred tax adjusting item: | ||||||||||||||||||||
| Remeasurement of deferred taxes | (10.1 | ) | - | - | 100 | % | - | |||||||||||||
| Tax loss utilization | - | - | (7.9 | ) | - | (100 | )% | |||||||||||||
| Adjusted net income attributable to stockholders (non-GAAP measure) | $ | 87.7 | $ | 123.3 | $ | 121.1 | (29 | )% | 2 | % | ||||||||||
| Opening long-term debt | $ | 595.7 | $ | 97.9 | $ | 110.8 | 508 | % | (12 | )% | ||||||||||
| Ending long-term debt | 812.9 | 595.7 | 97.9 | 36 | % | 508 | % | |||||||||||||
| Less: long-term debt in escrow | - | (495.8 | ) | - | (100 | )% | 100 | % | ||||||||||||
| Adjusted ending long-term debt (non-GAAP measure) | 812.9 | 99.9 | 97.9 | 714 | % | 2 | % | |||||||||||||
| Average long-term debt | $ | 704.3 | $ | 346.8 | $ | 104.4 | 103 | % | 232 | % | ||||||||||
| Adjusted average long-term debt (non-GAAP measure) | 704.3 | 98.9 | 104.4 | 612 | % | (5 | )% | |||||||||||||
| Opening stockholders' equity | $ | 687.1 | $ | 703.2 | $ | 691.9 | (2 | )% | 2 | % | ||||||||||
| Ending stockholders' equity | 739.7 | 687.1 | 703.2 | 8 | % | (2 | )% | |||||||||||||
| Average stockholders' equity | 713.4 | 695.2 | 697.6 | 3 | % | - | ||||||||||||||
| Average invested capital | $ | 1,417.7 | $ | 1,042.0 | $ | 802.0 | 36 | % | 30 | % | ||||||||||
| Adjusted average invested capital (non-GAAP measure) | 1,417.7 | 794.1 | 802.0 | 79 | % | (1 | )% | |||||||||||||
| Return on average invested capital(1) | 5.3 | % | 8.8 | % | 17.0 | % | -350 bps | -820 bps | ||||||||||||
| ROIC excluding escrowed debt (non-GAAP measure)(2) | 6.2 | % | 15.5 | % | 15.1 | % | -930 bps | 40 bps | ||||||||||||
| Ritchie Bros. | 79 |
| (1) | Calculated as net income attributable to stockholders divided by average invested capital. |
| (2) | Calculated as adjusted net income attributable to stockholders (non-GAAP measure) divided by adjusted average invested capital (non-GAAP measure). |
The adjusting items for the year ended December 31, 2017 were:
| · | $4.8 million ($4.8 million after tax, or $0.04 per diluted share) of stock option compensation expense related to the accelerated vesting of certain IronPlanet stock options assumed as part of the Acquisition |
| · | $9.1 million ($6.6 million after tax, or $0.06 per diluted share) of acquisition and finance structure advisory costs, |
| · | $3.6 million ($2.5 million after tax, or $0.02 per diluted share) of severance and retention costs in a corporate reorganization that followed the Acquisition |
| · | $8.9 million ($6.6 million after tax, or $0.06 per diluted share) impairment loss recognized on various technology assets |
| · | $2.3 million (or $0.02 per diluted share) charge related to the change in uncertain tax provisions |
| · | $10.1 million (or $0.10 per diluted share) benefit on remeasurement of deferred taxes due to the TCJA. |
The adjusting items for the year ended December 31, 2016 were:
| · | $6.8 million ($5.0 million after tax, or $0.05 per diluted share) charge related to the early termination of pre-existing debt |
| · | $28.2 million ($26.4 million after tax, or $0.25 per diluted share) impairment loss on EquipmentOne reporting unit goodwill and customer relationships |
The adjusting items for the year ended December 31, 2015 were:
| · | $8.4 million ($7.3 million before tax, or $0.07 per diluted share) gain on the sale of excess property in Edmonton, Canada |
| · | $7.9 million before tax (or $0.07 per diluted share) of tax savings generated by tax loss utilization |
| Ritchie Bros. | 80 |
| ITEM 7A: | QUANTITATIVE AND QUALITATIVE DISCLOSURES ABOUT MARKET RISK |
Foreign Currency Exchange Rate Risk
We conduct operations in local currencies in countries around the world, but we use the U.S. dollar as our presentation currency. As a result, we are exposed to currency fluctuations and exchange rate risk. We cannot accurately predict the future effects of foreign currency fluctuations on our financial condition or results of operations, or quantify their effects on the macroeconomic environment. The proportion of revenues denominated in currencies other than the U.S. dollar in a given period will differ from the annual proportion for the year ended December 31, 2017, which was 44%, depending on the size and location of auctions held during the period. On annual basis, we expect fluctuations in revenues and operating expenses to largely offset and generally act as a natural hedge against exposure to fluctuations in the value of the U.S. dollar. As part of our debt management strategies, we continue to monitor our exposure to interest rate risk, and while we have not entered in to interest rate swaps to fix the interest rate on our variable rate debt, we may consider hedging specific borrowings if we deem it appropriate in the future.
During 2017, we recorded a net increase in our foreign currency translation adjustment balance of $24.7 million, compared to a net decrease of $9.8 million in 2016 and $40.8 million in 2015. Our foreign currency translation adjustment arises from the translation of our net assets denominated in currencies other than the U.S. dollar to the U.S. dollar for reporting purposes. Based on our exposures to foreign currency transactions as at December 31, 2017, and assuming all other variables remain constant, a 10% appreciation or depreciation of the Canadian dollar and Euro against the U.S. dollar would result in an increase/decrease of approximately $43.6 million in our consolidated comprehensive income, of which $41.5 million relates to our foreign currency translation adjustment and $2.1 million to our net income.
Interest Rate Risk
At December 31, 2017, our short-term debt and the remainder of our long-term debt consisted of loans under the Multicurrency Facilities and foreign credit facilities, which usually mature one to three months from inception. Those loans bear interest, at our option, at a rate equal to either a base rate (or Canadian prime rate for certain Canadian dollar borrowings) or LIBOR (or such floating rate customarily used by BofA for currencies other than U.S. dollars). In either case, an applicable margin is added to the rate. As at December 31, 2017, we had a total of $332.6 million in loans (short-term and those refinanced on a long-term basis) bearing floating rates of interest, as compared to $123.8 million at December 31, 2016. Based on the amount owing as of December 31, 2017, and assuming all other variables remain constant, a change in the U.S. prime rate by 100 bps would result in an increase/decrease of approximately $2.7 million in the pre-tax interest we accrue per annum.
Our exposure to interest rate risk increased at December 31, 2017 compared to December 31, 2016, primarily due to the delayed draw term loans borrowed in the second quarter of 2017. The Notes, which represent 60% of our long-term debt, bear interest at a fixed rate of 5.375% per annum. The proportion of fixed-to-floating interest rates is expected to increase as we make the required principal repayments on our delayed draw term loans and execute on our debt management strategies. As part of our debt management strategies, we continue to monitor our exposure to interest rate risk, and while we have not adopted a long-term hedging strategy to protect against interest rate fluctuations associated with our variable rate debt, we may consider hedging specific borrowings if we deem it appropriate in the future.
Inflation
Although we cannot accurately anticipate the future effect of inflation on our financial condition or results of operations, inflation historically has not had a material impact on our operations.
| ITEM 8: | FINANCIAL STATEMENTS AND SUPPLEMENTARY DATA |
The following financial statements and supplementary data should be read in conjunction with “Part II, Item 6: Selected Financial Data” of this Annual Report on Form 10-K.
| Ritchie Bros. | 81 |
Report of Independent Registered Public Accounting Firm
To the Shareholders and the Board of Directors of Ritchie Bros. Auctioneers Incorporated
Opinion on the Consolidated Financial Statements
We have audited the accompanying consolidated balance sheets of Ritchie Bros. Auctioneers Incorporated (the “Company“) as of December 31, 2017 and 2016, the related consolidated statements of income, comprehensive income, changes in equity and cash flows for each of the years in the three-year period ended December 31, 2017, and the related notes (collectively referred to as the “consolidated financial statements“). In our opinion, the consolidated financial statements present fairly, in all material respects, the consolidated financial position of the Company as of December 31, 2017 and 2016, and the results of its consolidated operations and its consolidated cash flows for each of the years in the three-year period ended December 31, 2017, in conformity with US generally accepted accounting principles.
Report on Internal Control over Financial Reporting
We also have audited, in accordance with the standards of the Public Company Accounting Oversight Board (United States) (“PCAOB”), the Company’s internal control over financial reporting as of December 31, 2017, based on the criteria established in Internal Control – Integrated Framework (2013) issued by the Committee of Sponsoring Organizations of the Treadway Commission (“COSO”), and our report dated February 26, 2018 expressed an unqualified opinion on the effectiveness of the Company’s internal control over financial reporting.
Basis for Opinion
These consolidated financial statements are the responsibility of the Company‘s management. Our responsibility is to express an opinion on the Company‘s consolidated financial statements based on our audits. We are a public accounting firm registered with the PCAOB and are required to be independent with respect to the Company in accordance with the US federal securities laws and the applicable rules and regulations of the Securities and Exchange Commission and the PCAOB.
We conducted our audits in accordance with the standards of the PCAOB. Those standards require that we plan and perform the audit to obtain reasonable assurance about whether the consolidated financial statements are free of material misstatement, whether due to error or fraud. Our audits included performing procedures to assess the risks of material misstatement of the consolidated financial statements, whether due to error or fraud, and performing procedures that respond to those risks. Such procedures include examining, on a test basis, evidence regarding the amounts and disclosures in the consolidated financial statements. Our audits also included evaluating the accounting principles used and significant estimates made by management, as well as evaluating the overall presentation of the consolidated financial statements. We believe that our audits provide a reasonable basis for our opinion.
/s/ Ernst & Young LLP
Chartered Professional Accountants
We have served as the Company‘s auditor since 2013.
Vancouver, Canada
February 26, 2018
| 82 |
Consolidated Income Statements
(Expressed in thousands of United States dollars, except share and per share data)
| Year ended December 31, | 2017 | 2016 | 2015 | |||||||||
| Revenues (note 5) | $ | 610,517 | $ | 566,395 | $ | 515,875 | ||||||
| Costs of services, excluding depreciation and amortization (note 6) | 79,013 | 66,062 | 56,026 | |||||||||
| 531,504 | 500,333 | 459,849 | ||||||||||
| Selling, general and administrative expenses (note 6) | 323,270 | 283,529 | 254,389 | |||||||||
| Acquisition-related costs (note 6) | 38,272 | 11,829 | 601 | |||||||||
| Depreciation and amortization expenses (note 6) | 52,694 | 40,861 | 42,032 | |||||||||
| Gain on disposition of property, plant and equipment | (1,656 | ) | (1,282 | ) | (9,691 | ) | ||||||
| Impairment loss (note 7) | 8,911 | 28,243 | - | |||||||||
| Foreign exchange loss (gain) | 2,559 | 1,431 | (2,322 | ) | ||||||||
| Operating income | 107,454 | 135,722 | 174,840 | |||||||||
| Other income (expense): | ||||||||||||
| Interest income | 3,194 | 1,863 | 2,660 | |||||||||
| Interest expense | (38,291 | ) | (5,564 | ) | (4,962 | ) | ||||||
| Debt extinguishment costs | - | (6,787 | ) | - | ||||||||
| Equity income (loss) (note 22) | (26 | ) | 1,028 | 916 | ||||||||
| Other, net | 5,063 | 4,232 | 2,982 | |||||||||
| (30,060 | ) | (5,228 | ) | 1,596 | ||||||||
| Income before income taxes | 77,394 | 130,494 | 176,436 | |||||||||
| Income tax expense (recovery) (note 8): | ||||||||||||
| Current | 19,356 | 40,341 | 42,420 | |||||||||
| Deferred | (17,268 | ) | (3,359 | ) | (4,559 | ) | ||||||
| 2,088 | 36,982 | 37,861 | ||||||||||
| Net income | $ | 75,306 | $ | 93,512 | $ | 138,575 | ||||||
| Net income attributable to: | ||||||||||||
| Stockholders | $ | 75,027 | $ | 91,832 | $ | 136,214 | ||||||
| Non-controlling interests | 279 | 1,680 | 2,361 | |||||||||
| $ | 75,306 | $ | 93,512 | $ | 138,575 | |||||||
| Earnings per share attributable to stockholders (note 10): | ||||||||||||
| Basic | $ | 0.70 | $ | 0.86 | $ | 1.27 | ||||||
| Diluted | $ | 0.69 | $ | 0.85 | $ | 1.27 | ||||||
| Weighted average number of shares | ||||||||||||
| outstanding (note 10): | ||||||||||||
| Basic | 107,044,348 | 106,630,323 | 107,075,845 | |||||||||
| Diluted | 108,113,151 | 107,457,794 | 107,432,474 | |||||||||
See accompanying notes to the consolidated financial statements.
| Ritchie Bros. | 83 |
Consolidated Statements of Comprehensive Income
(Expressed in thousands of United States dollars)
| Year ended December 31, | 2017 | 2016 | 2015 | |||||||||
| Net income | $ | 75,306 | $ | 93,512 | $ | 138,575 | ||||||
| Other comprehensive income (loss), net of income tax: | ||||||||||||
| Foreign currency translation adjustment | 24,670 | (9,847 | ) | (40,776 | ) | |||||||
| Total comprehensive income | $ | 99,976 | $ | 83,665 | $ | 97,799 | ||||||
| Total comprehensive income attributable to: | ||||||||||||
| Stockholders | 99,639 | 81,839 | 95,831 | |||||||||
| Non-controlling interests | 337 | 1,826 | 1,968 | |||||||||
| $ | 99,976 | $ | 83,665 | $ | 97,799 | |||||||
See accompanying notes to the consolidated financial statements.
| Ritchie Bros. | 84 |
(Expressed in thousands of United States dollars, except share data)
| December 31, | 2017 | 2016 | ||||||
| Assets | ||||||||
| Current assets: | ||||||||
| Cash and cash equivalents | $ | 267,910 | $ | 207,867 | ||||
| Restricted cash (note 11) | 63,206 | 50,222 | ||||||
| Trade and other receivables (note 13) | 92,105 | 52,979 | ||||||
| Inventory (note 14) | 38,238 | 28,491 | ||||||
| Advances against auction contracts (note 15) | 7,336 | 5,621 | ||||||
| Prepaid expenses and deposits (note 16) | 19,690 | 19,005 | ||||||
| Assets held for sale (note 17) | 584 | 632 | ||||||
| Income taxes receivable | 19,418 | 13,181 | ||||||
| 508,487 | 377,998 | |||||||
| Property, plant and equipment (note 18) | 526,581 | 515,030 | ||||||
| Equity-accounted investments (note 22) | 7,408 | 7,326 | ||||||
| Restricted cash (note 11) | - | 500,000 | ||||||
| Other non-current assets (note 19) | 24,146 | 20,244 | ||||||
| Intangible assets (note 20) | 261,094 | 72,304 | ||||||
| Goodwill (note 21) | 670,922 | 97,537 | ||||||
| Deferred tax assets (note 8) | 18,674 | 9,094 | ||||||
| $ | 2,017,312 | $ | 1,599,533 | |||||
| Liabilities and Equity | ||||||||
| Current liabilities: | ||||||||
| Auction proceeds payable | $ | 199,245 | $ | 98,873 | ||||
| Trade and other payables (note 23) | 164,553 | 124,694 | ||||||
| Income taxes payable | 732 | 5,355 | ||||||
| Short-term debt (note 25) | 7,018 | 23,912 | ||||||
| Current portion of long-term debt (note 25) | 16,907 | - | ||||||
| 388,455 | 252,834 | |||||||
| Long-term debt (note 25) | 795,985 | 595,706 | ||||||
| Other non-current liabilities (note 26) | 46,773 | 38,088 | ||||||
| Deferred tax liabilities (note 8) | 32,334 | 17,125 | ||||||
| 1,263,547 | 903,753 | |||||||
| Contingencies (note 30) | ||||||||
| Contingently redeemable performance share units (note 28) | 9,014 | 3,950 | ||||||
| Stockholders' equity (note 27): | ||||||||
| Share capital: | ||||||||
| Common stock; no par value, unlimited shares authorized, issued and outstanding shares: 107,269,783 (December 31, 2016: 106,822,001) | 138,582 | 125,474 | ||||||
| Additional paid-in capital | 41,005 | 27,638 | ||||||
| Retained earnings | 602,609 | 601,071 | ||||||
| Accumulated other comprehensive loss | (42,514 | ) | (67,126 | ) | ||||
| Stockholders' equity | 739,682 | 687,057 | ||||||
| Non-controlling interest | 5,069 | 4,773 | ||||||
| 744,751 | 691,830 | |||||||
| $ | 2,017,312 | $ | 1,599,533 | |||||
See accompanying notes to the consolidated financial statements.
| Ritchie Bros. | 85 |
Consolidated Statements of Changes in Equity
(Expressed in thousands of United States dollars, except where noted)
| Attributable to stockholders | Contingently | |||||||||||||||||||||||||||||||||||
| Additional | Accumulated | Non- | Non- | redeemable | ||||||||||||||||||||||||||||||||
| Common stock | paid-In | other | controlling | controlling | performance | |||||||||||||||||||||||||||||||
| Number of | capital | Retained | comprehensive | interest | Total | interest | share units | |||||||||||||||||||||||||||||
| shares | Amount | ("APIC") | earnings | income (loss) | ("NCI") | equity | ("NCI") | ("PSUs") | ||||||||||||||||||||||||||||
| Balance, December 31, 2014 | 107,687,935 | $ | 141,257 | $ | 31,314 | $ | 536,111 | (16,750 | ) | $ | - | 691,932 | $ | 17,287 | $ | - | ||||||||||||||||||||
| Net income | - | - | - | 136,214 | - | 64 | 136,278 | 2,297 | - | |||||||||||||||||||||||||||
| Other comprehensive loss | - | - | - | - | (40,383 | ) | - | (40,383 | ) | (393 | ) | - | ||||||||||||||||||||||||
| - | - | - | 136,214 | (40,383 | ) | 64 | 95,895 | 1,904 | - | |||||||||||||||||||||||||||
| Change in value of contingently redeemable non-controlling interest | - | - | - | (6,934 | ) | - | - | (6,934 | ) | 6,934 | - | |||||||||||||||||||||||||
| Stock option exercises | 1,412,535 | 37,762 | (7,946 | ) | - | - | - | 29,816 | - | - | ||||||||||||||||||||||||||
| Stock option tax adjustment | - | - | 359 | - | - | - | 359 | - | - | |||||||||||||||||||||||||||
| Stock option compensation expense (note 28) | - | - | 4,001 | - | - | - | 4,001 | - | - | |||||||||||||||||||||||||||
| NCI acquired in a business combination (note 32) | - | - | - | - | - | 4,119 | 4,119 | - | - | |||||||||||||||||||||||||||
| Shares repurchased (note 27) | (1,900,000 | ) | (47,489 | ) | - | - | - | - | (47,489 | ) | - | - | ||||||||||||||||||||||||
| Cash dividends paid (note 27) | - | - | - | (64,340 | ) | - | (64,340 | ) | (1,340 | ) | - | |||||||||||||||||||||||||
| Balance, December 31, 2015 | 107,200,470 | $ | 131,530 | $ | 27,728 | $ | 601,051 | $ | (57,133 | ) | $ | 4,183 | $ | 707,359 | $ | 24,785 | $ | - | ||||||||||||||||||
| Net income | - | - | - | 91,832 | - | 346 | 92,178 | 1,334 | - | |||||||||||||||||||||||||||
| Other comprehensive income (loss) | - | - | - | - | (9,993 | ) | (23 | ) | (10,016 | ) | 169 | - | ||||||||||||||||||||||||
| - | - | - | 91,832 | (9,993 | ) | 323 | 82,162 | 1,503 | - | |||||||||||||||||||||||||||
| Change in value of contingently redeemable NCI | - | - | - | (21,186 | ) | - | - | (21,186 | ) | 21,186 | - | |||||||||||||||||||||||||
| Stock option exercises | 1,081,531 | 30,670 | (6,332 | ) | - | - | - | 24,338 | - | - | ||||||||||||||||||||||||||
| Stock option tax adjustment | - | - | 443 | - | - | - | 443 | - | - | |||||||||||||||||||||||||||
| Stock option compensation expense (note 28) | - | - | 5,507 | - | - | - | 5,507 | - | - | |||||||||||||||||||||||||||
| Modification of PSUs (note 28) | - | - | - | (70 | ) | - | - | (70 | ) | - | 2,175 | |||||||||||||||||||||||||
| Equity-classified PSU expense (note 28) | - | - | 283 | - | - | - | 283 | - | 1,698 | |||||||||||||||||||||||||||
| Equity-classified PSU dividend equivalents | - | - | 9 | (62 | ) | - | - | (53 | ) | - | 42 | |||||||||||||||||||||||||
| Change in value of contingently redeemable equity-classified PSUs | - | - | - | (35 | ) | - | - | (35 | ) | - | 35 | |||||||||||||||||||||||||
| NCI acquired in a business combination (note 32) | - | - | - | - | - | 596 | 596 | - | - | |||||||||||||||||||||||||||
| Acquisition of NCI | - | - | - | - | - | (226 | ) | (226 | ) | (44,141 | ) | - | ||||||||||||||||||||||||
| Shares repurchased (note 27) | (1,460,000 | ) | (36,726 | ) | - | - | - | - | (36,726 | ) | - | - | ||||||||||||||||||||||||
| Cash dividends paid (note 27) | - | - | - | (70,459 | ) | - | (103 | ) | (70,562 | ) | (3,333 | ) | - | |||||||||||||||||||||||
| Balance, December 31, 2016 | 106,822,001 | $ | 125,474 | $ | 27,638 | $ | 601,071 | $ | (67,126 | ) | $ | 4,773 | $ | 691,830 | $ | - | $ | 3,950 | ||||||||||||||||||
| Net income | - | - | - | 75,027 | - | 279 | 75,306 | - | - | |||||||||||||||||||||||||||
| Other comprehensive income | - | - | - | - | 24,612 | 58 | 24,670 | - | - | |||||||||||||||||||||||||||
| - | - | - | 75,027 | 24,612 | 337 | 99,976 | - | - | ||||||||||||||||||||||||||||
| Stock option exercises | 444,571 | 13,017 | (3,081 | ) | - | - | - | 9,936 | - | - | ||||||||||||||||||||||||||
| Stock option compensation expense (note 28) | - | - | 13,700 | - | - | - | 13,700 | - | - | |||||||||||||||||||||||||||
| Assumption of stock options on acquisition of IronPlanet (note 32) | - | - | 2,330 | - | - | - | 2,330 | - | ||||||||||||||||||||||||||||
| Settlement of equity-classified PSUs | 3,211 | 91 | 91 | (172 | ) | |||||||||||||||||||||||||||||||
| Modification of PSUs (note 28) | - | - | - | (382 | ) | - | - | (382 | ) | - | 1,803 | |||||||||||||||||||||||||
| Equity-classified PSU expense (note 28) | - | - | 340 | - | - | - | 340 | - | 3,189 | |||||||||||||||||||||||||||
| Equity-classified PSU dividend equivalents | - | - | 78 | (227 | ) | - | - | (149 | ) | - | 149 | |||||||||||||||||||||||||
| Change in value of contingently redeemable equity-classified PSUs | - | - | - | (95 | ) | - | - | (95 | ) | - | 95 | |||||||||||||||||||||||||
| Cash dividends paid (note 27) | - | - | - | (72,785 | ) | - | (41 | ) | (72,826 | ) | - | - | ||||||||||||||||||||||||
| Balance, December 31, 2017 | 107,269,783 | $ | 138,582 | $ | 41,005 | $ | 602,609 | $ | (42,514 | ) | $ | 5,069 | $ | 744,751 | $ | - | $ | 9,014 | ||||||||||||||||||
See accompanying notes to the consolidated financial statements.
| Ritchie Bros. | 86 |
Consolidated Statements of Cash Flows
(Expressed in thousands of United States dollars)
| Year ended December 31, | 2017 | 2016 | 2015 | |||||||||
| Cash provided by (used in): | ||||||||||||
| Operating activities: | ||||||||||||
| Net income | $ | 75,306 | $ | 93,512 | $ | 138,575 | ||||||
| Adjustments for items not affecting cash: | ||||||||||||
| Depreciation and amortization expenses (note 6) | 52,694 | 40,861 | 42,032 | |||||||||
| Impairment loss (note 7) | 8,911 | 28,243 | - | |||||||||
| Stock option compensation expense (note 28) | 13,700 | 5,507 | 4,001 | |||||||||
| Equity-classified PSU expense (note 28) | 3,529 | 1,981 | - | |||||||||
| Inventory write down (note 14) | 834 | 3,084 | 480 | |||||||||
| Deferred income tax recovery | (17,268 | ) | (3,359 | ) | (4,559 | ) | ||||||
| Equity loss (income) less dividends received | 26 | (1,028 | ) | (916 | ) | |||||||
| Unrealized foreign exchange loss | 254 | 1,947 | 1,403 | |||||||||
| Change in fair value of contingent consideration | (2,446 | ) | (2,044 | ) | - | |||||||
| Gain on disposition of property, plant and equipment | (1,656 | ) | (1,282 | ) | (9,691 | ) | ||||||
| Amortization of debt issuance costs | 3,056 | 359 | - | |||||||||
| Other, net | 349 | (905 | ) | - | ||||||||
| Net changes in operating assets and liabilities (note 11) | 8,977 | 10,682 | 25,134 | |||||||||
| Net cash provided by operating activities | 146,266 | 177,558 | 196,459 | |||||||||
| Investing activities: | ||||||||||||
| Acquisition of IronPlanet, net of cash acquired (note 32) | (675,851 | ) | - | - | ||||||||
| Acquisition of Mascus, net of cash acquired (note 32) | - | (28,123 | ) | - | ||||||||
| Acquisition of Xcira, net of cash acquired | - | - | (12,107 | ) | ||||||||
| Acquisition of Petrowsky (note 32) | - | (6,250 | ) | - | ||||||||
| Acquisition of contingently redeemable NCI (note 9) | - | (41,092 | ) | - | ||||||||
| Acquisition of NCI (note 32) | - | (226 | ) | - | ||||||||
| Acquisition of Kramer (note 32) | - | (11,138 | ) | - | ||||||||
| Acquisition of equity investments | - | - | (3,000 | ) | ||||||||
| Property, plant and equipment additions | (10,812 | ) | (18,918 | ) | (22,055 | ) | ||||||
| Intangible asset additions | (28,584 | ) | (17,558 | ) | (8,764 | ) | ||||||
| Proceeds on disposition of property, plant and equipment | 4,985 | 6,691 | 16,667 | |||||||||
| Other, net | (692 | ) | (248 | ) | (89 | ) | ||||||
| Net cash used in investing activities | (710,954 | ) | (116,862 | ) | (29,348 | ) | ||||||
| Financing activities: | ||||||||||||
| Dividends paid to stockholders (note 27) | (72,785 | ) | (70,459 | ) | (64,340 | ) | ||||||
| Dividends paid to NCI | (41 | ) | (3,436 | ) | (1,340 | ) | ||||||
| Issuances of share capital | 9,936 | 24,338 | 29,816 | |||||||||
| Share repurchase (note 27) | - | (36,726 | ) | (47,489 | ) | |||||||
| Proceeds from short-term debt | 6,971 | 67,584 | 11,223 | |||||||||
| Repayment of short-term debt | (24,479 | ) | (57,516 | ) | (6,558 | ) | ||||||
| Proceeds from long-term debt | 325,000 | 647,091 | - | |||||||||
| Repayment of long-term debt | (108,985 | ) | (148,158 | ) | - | |||||||
| Debt issue costs (note 25) | (12,624 | ) | (10,644 | ) | - | |||||||
| Debt extinguishment costs | - | (6,787 | ) | - | ||||||||
| Repayment of finance lease obligations | (2,322 | ) | (1,655 | ) | (2,073 | ) | ||||||
| Other, net | (106 | ) | 511 | 72 | ||||||||
| Net cash provided by (used in) financing activities | 120,565 | 404,143 | (80,689 | ) | ||||||||
| Effect of changes in foreign currency rates on cash, cash equivalents, and restricted cash | 17,150 | 4 | (26,265 | ) | ||||||||
| Increase (decrease) | (426,973 | ) | 464,843 | 60,157 | ||||||||
| Beginning of period | 758,089 | 293,246 | 233,089 | |||||||||
| Cash, cash equivalents, and restricted cash, end of period (note 11) | $ | 331,116 | $ | 758,089 | $ | 293,246 | ||||||
See accompanying notes to the consolidated financial statements.
| Ritchie Bros. | 87 |
Notes to the Consolidated Financial Statements
(Tabular amounts expressed in thousands of United States dollars, except where noted)
| 1. | General information |
Ritchie Bros. Auctioneers Incorporated and its subsidiaries (collectively referred to as the “Company”) provide global asset management and disposition services, offering customers end-to-end solutions for buying and selling used industrial equipment and other durable assets through its unreserved live on site auctions, online marketplaces, listing services, and private brokerage services. Ritchie Bros. Auctioneers Incorporated is a company incorporated in Canada under the Canada Business Corporations Act, whose shares are publicly traded on the Toronto Stock Exchange (“TSX”) and the New York Stock Exchange (“NYSE”).
| 2. | Significant accounting policies |
| (a) | Basis of preparation |
These financial statements have been prepared in accordance with United States generally accepted accounting principles (“US GAAP”) and the following accounting policies have been consistently applied in the preparation of the consolidated financial statements. Previously, the Company prepared its consolidated financial statements under International Financial Reporting Standards (“IFRS”) as permitted by securities regulators in Canada, as well as in the United States under the status of a Foreign Private Issuer as defined by the United States Securities and Exchange Commission (“SEC”). At the end of the second quarter of 2015, the Company determined that it no longer qualified as a Foreign Private Issuer under the SEC rules. As a result, beginning January 1, 2016 the Company is required to report with the SEC on domestic forms and comply with domestic company rules in the United States. The transition to US GAAP was made retrospectively for all periods from the Company’s inception.
| (b) | Basis of consolidation |
The consolidated financial statements include the accounts of the Company and its wholly-owned and non-wholly owned subsidiaries in which the Company has a controlling financial interest either through voting rights or means other than voting rights. All inter-company transactions and balances have been eliminated on consolidation. Where the Company’s ownership interest in a consolidated subsidiary is less than 100%, the non-controlling interests’ share of these non-wholly owned subsidiaries is reported in the Company’s consolidated balance sheets as a separate component of equity or within temporary equity. The non-controlling interests’ share of the net income of these non-wholly owned subsidiaries is reported in the Company’s consolidated income statements as a deduction from the Company’s net earnings to arrive at net income attributable to stockholders of the Company.
The Company consolidates variable interest entities (“VIEs”) if the Company has (a) the power to direct matters that most significantly impact the VIEs economic performance and (b) the obligation to absorb losses or the right to receive benefits of the VIE that could potentially be significant to the VIE. For VIEs where the Company has shared power with unrelated parties, the Company uses the equity method of accounting to report their results. The determination of the primary beneficiary involves judgment.
| (c) | Revenue recognition |
Revenues are comprised of:
| · | commissions earned through the Company acting as an agent for consignors of equipment and other assets, at the Company’s live on site auctions and online marketplace sales, and |
| · | fees earned in the process of conducting auctions and online marketplace sales, including online marketplace listing and inspection fees, fees from value-added services and make-ready activities, as well as fees paid by buyers on online marketplace sales. |
| Ritchie Bros. | 88 |
Notes to the Consolidated Financial Statements
(Tabular amounts expressed in thousands of United States dollars, except where noted)
| 2. | Significant accounting policies (continued) |
| (c) | Revenue recognition (continued) |
The Company recognizes revenue when persuasive evidence of an arrangement exists, delivery has occurred or services have been rendered, the price is fixed or determinable, and collectability is reasonably assured. For live on site auctions or online marketplace sales, revenue is recognized when the auction or online marketplace sale is complete and the Company has determined that the sale proceeds are collectible. Revenue is measured at the fair value of the consideration received or receivable and is shown net of value-added tax and duties.
Commissions from sales at the Company’s auctions and online marketplace sales represent the percentage earned by the Company on the gross sale proceeds from equipment and other assets sold. The majority of the Company’s commissions are earned as a pre-negotiated fixed rate of the gross selling price. Other commissions from sales are earned from underwritten commission contracts, when the Company guarantees a certain level of proceeds to a consignor or purchases inventory to be sold.
Commission and fee revenues from sales at live on site auctions
The Company accepts equipment and other assets on consignment or takes title for a short period of time prior to auction, stimulates buyer interest through professional marketing techniques, and matches sellers (also known as consignors) to buyers through the auction or private sale process.
In its role as auctioneer, the Company matches buyers to sellers of equipment on consignment, as well as to inventory held by the Company, through the auction process. Following the auction, the Company invoices the buyer for the purchase price of the property, collects payment from the buyer, and where applicable, remits to the consignor the net sale proceeds after deducting its commissions, expenses, and applicable taxes. Commissions are calculated as a percentage of the hammer price of the property sold at auction. Fees earned in the process of conducting the Company’s auctions include administrative, documentation, and advertising fees.
On the fall of the auctioneer’s hammer, the highest bidder becomes legally obligated to pay the full purchase price, which is the hammer price of the property purchased and the seller is legally obligated to relinquish the property in exchange for the hammer price less any seller’s commissions. Commission and fee revenue is recognized on the date of the auction sale upon the fall of the auctioneer’s hammer, which is the point in time when the Company has substantially accomplished what it must do to be entitled to the benefits represented by the revenues. Subsequent to the date of the auction sale, the Company’s remaining obligations for its auction services relate only to the collection of the purchase price from the buyer and the remittance of the net sale proceeds to the seller. These remaining service obligations are not an essential part of the auction services provided by the Company.
Under the standard terms and conditions of its auction sales, the Company is not obligated to pay a consignor for property that has not been paid for by the buyer, provided the property has not been released to the buyer. In the rare event where a buyer refuses to take title of the property, the sale is cancelled in the period in which the determination is made, and the property is returned to the consignor or placed in a later auction. Historically, cancelled sales have not been material in relation to the aggregate hammer price of property sold at auction.
Commission revenues are recorded net of commissions owed to third parties, which are principally the result of situations when the commission is shared with a consignor or with the counterparty in an auction guarantee risk and reward sharing arrangement. Additionally, in certain situations, commissions are shared with third parties who introduce the Company to consignors who sell property at auction.
| Ritchie Bros. | 89 |
Notes to the Consolidated Financial Statements
(Tabular amounts expressed in thousands of United States dollars, except where noted)
| 2. | Significant accounting policies (continued) |
| (c) | Revenue recognition (continued) |
Underwritten commission contracts can take the form of guarantee or inventory contracts. Guarantee contracts typically include a pre-negotiated percentage of the guaranteed gross proceeds plus a percentage of proceeds in excess of the guaranteed amount. If actual auction proceeds are less than the guaranteed amount, commission is reduced; if proceeds are sufficiently lower, the Company can incur a loss on the sale. Losses, if any, resulting from guarantee contracts are recorded in the period in which the relevant auction is completed. If a loss relating to a guarantee contract held at the period end to be sold after the period end is known or is probable and estimable at the financial statement reporting date, the loss is accrued in the financial statements for that period. The Company’s exposure from these guarantee contracts fluctuates over time (note 30).
Revenues related to inventory contracts are recognized in the period in which the sale is completed, title to the property passes to the purchaser and the Company has fulfilled any other obligations that may be relevant to the transaction, including, but not limited to, delivery of the property. Revenue from inventory sales is presented net of costs within revenues on the consolidated income statement, as the Company takes title only for a short period of time and the risks and rewards of ownership are not substantially different than the Company’s other underwritten commission contracts.
Commissions and fees on online marketplace sales
Through its online marketplaces, the Company typically sells equipment or other assets on consignment from sellers and stimulates buyer interest through sales and marketing techniques in order to match online marketplace sellers with buyers. Prior to offering an item for sale on its online marketplaces, the Company performs required inspections, title and lien searches, and make-ready activities to prepare the item for sale.
Online marketplace revenues are primarily driven by seller commissions, fees charged to sellers for listing and inspecting equipment, and amounts paid by buyers, including buyer transaction fees and buyer’s premiums. Online marketplace sale commission and fee revenues are recognized when the sale is complete, which is generally at the conclusion of the marketplace transaction between the seller and buyer. This occurs when a buyer has become legally obligated to pay the purchase price and buyer transaction fee for an asset that the seller is obligated to relinquish in exchange for the sales price less seller commissions and listing fees. At that time, the Company has substantially performed what it must do to be entitled to receive the benefits represented by its commissions and fees.
Following the sale of the item, the Company invoices the buyer for the purchase price of the asset, taxes, and the buyer transaction fee or buyer’s premium, collects payment from the buyer, and remits the proceeds – net of the seller commissions, listing fees, and applicable taxes – to the seller. The Company notifies the seller when the buyer payment has been received in order to clear release of the equipment or other asset to the seller. These remaining service obligations are not viewed to be an essential part of the services provided by the Company.
Under the Company’s standard terms and conditions, it is not obligated to pay the seller for items in an online marketplace sale in which the buyer has not paid for the purchased item. If the buyer defaults on its payment obligation, the equipment or other assets may be returned to the seller or moved into a subsequent online marketplace event.
| Ritchie Bros. | 90 |
Notes to the Consolidated Financial Statements
(Tabular amounts expressed in thousands of United States dollars, except where noted)
| 2. | Significant accounting policies (continued) |
| (c) | Revenue recognition (continued) |
Online marketplace commission revenue is reduced by a provision for disputes, which is an estimate of disputed items that are expected to be settled at a cost to the Company. This provision is related to settlement of discrepancies under the Company’s equipment condition certification program. The equipment condition certification refers to a written inspection report provided to potential buyers that reflects the condition of a specific piece of equipment offered for sale, and includes ratings, comments, and photographs of the equipment following inspection by one of the Company’s equipment inspectors.
The equipment condition certification provides that a buyer may file a written dispute claim during an eligible dispute period for consideration and resolution at the sole determination of the Company if the purchased equipment is not substantially in the condition represented in the inspection report. Typically disputes under the equipment condition certification program are settled with minor repairs or additional services, such as washing or detailing the item; the estimated costs of such items or services are included in the provision for disputes.
For guarantee contracts, if actual online marketplace sale proceeds are less than the guaranteed amount, the commission earned is reduced; if proceeds are sufficiently lower, the Company may incur a loss on the sale. If such consigned equipment sells above the minimum price, the Company may be entitled to a share of the excess proceeds as negotiated with the seller. The Company’s share of the excess, if any, is recorded in revenue together with the related online marketplace sale commission. Losses, if any, resulting from guarantee contracts are recorded in revenue in the period in which the relevant online marketplace sale was completed. If a loss relating to a guarantee contract held at the period end to be sold after the period end is known or is probable and estimable at the financial statement reporting date, the loss is accrued in the financial statements for that period. The Company’s exposure from these guarantee contracts fluctuates over time (note 30).
For inventory contracts related to online marketplace sales, revenue from the sale of inventory through the Company’s online marketplaces are recorded net of acquisition costs because the acquisition of equipment in advance of an online marketplace sale is an ancillary component of the Company’s business and, in general, the risks and rewards of ownership are not substantially different than the Company’s other guarantee contracts. Since the online marketplace sale business is a net business, gross sale proceeds are not reported as revenue in the consolidated income statement. Rather, the net commission earned from online marketplace sales is reported as revenue, which reflects the Company’s agency relationship between buyers and sellers of equipment.
Other fees
Fees from other services include financing, appraisal, and technology service fees and fees related to online marketplaces sales. The Company’s revenue from online marketplace services includes fees charged to sellers for listing and inspecting equipment, and amounts paid by buyers, including buyer transaction fees and buyer’s premiums, fees for make-ready activities, logistics coordination, storage, private auction hosting, and asset appraisals. Fees are recognized in the period in which the service is provided to the customer.
| (d) | Costs of services, excluding depreciation and amortization expenses |
Costs of services are comprised of expenses incurred in direct relation to conducting auctions (“direct expenses”), earning online marketplace revenues, and earning other fee revenues. Direct expenses include direct labour, buildings and facilities charges, and travel, advertising and promotion costs.
Costs of services incurred to earn online marketplace revenues include inspection costs, facilities costs, inventory management, referral, sampling, and appraisal fees. Inspections are generally performed at the seller’s physical location.
| Ritchie Bros. | 91 |
Notes to the Consolidated Financial Statements
(Tabular amounts expressed in thousands of United States dollars, except where noted)
| 2. | Significant accounting policies (continued) |
| (d) | Costs of services, excluding depreciation and amortization expenses (continued) |
The cost of inspections include payroll costs and related benefits for the Company’s employees that perform and manage field inspection services, the related inspection report preparation and quality assurance costs, fees paid to contractors who perform field inspections, related travel and incidental costs for the Company’s inspection service organization, and office and occupancy costs for its inspection services personnel. Costs of earning online marketplace revenues also include costs for the Company’s customer support, online marketplace operations, logistics, title and lien investigation functions, and lease and operations costs related to the Company’s third-party data centers at which its websites are hosted. Costs of
services incurred in earning other fee revenues include direct labour (including commissions on sales), software maintenance fees, and materials. Costs of services exclude depreciation and amortization expenses.
| (e) | Share-based payments |
The Company classifies a share-based payment award as an equity or liability payment based on the substantive terms of the award and any related arrangement.
Equity-classified share-based payments
The Company has three stock option compensation plans that provide for the award of stock options to selected employees, directors, and officers of the Company. The cost of options granted is measured at the fair value of the underlying option at the grant date using the Black-Scholes option pricing model. The Company also has a senior executive PSU plan that provides for the award of PSUs to selected senior executives of the Company. The Company has the option to settle certain share unit awards in cash or shares, and expects to settle them in shares. The cost of PSUs granted is measured at the fair value of the underlying PSUs at the grant date using a binomial model.
This fair value of awards expected to vest under these plans is expensed over the respective remaining service period of the individual awards, on an accelerated recognition basis, with the corresponding increase to APIC recorded in equity. At the end of each reporting period, the Company revises its estimate of the number of equity instruments expected to vest. The impact of the revision of the original estimates, if any, is recognized in earnings, such that the consolidated expense reflects the revised estimate, with a corresponding adjustment to equity.
Any consideration paid on exercise of the stock options is credited to the common shares. Dividend equivalents on the equity-classified PSUs are recognized as a reduction to retained earnings over the service period.
PSUs awarded under the senior executive and employee PSU plans (described in note 28) are contingently redeemable in cash in the event of death of the participant. The contingently redeemable portion of the senior executive PSU awards, which represents the amount that would be redeemable based on the conditions at the date of grant, to the extent attributable to prior service, is recognized as temporary equity. The balance reported in temporary equity increases on the same basis as the related compensation expense over the service period of the award, with any excess of the temporary equity value over the amount recognized in compensation expense charged against retained earnings. In the event it becomes probable an award is going to become eligible for redemption in cash by the holder, the award would be reclassified to a liability award.
Liability-classified share-based payments
The Company maintains other share unit compensation plans that vest over a period of up to five years after grant. Under those plans, the Company is either required or expects to settle vested awards on a cash basis or by providing cash to acquire shares on the open market on the employee’s behalf, where the settlement amount is determined using the volume weighted average price of the Company’s common shares for the twenty days prior to the vesting date or, in the case of deferred share unit (“DSU”) recipients, following cessation of service on the Board of Directors.
| Ritchie Bros. | 92 |
Notes to the Consolidated Financial Statements
(Tabular amounts expressed in thousands of United States dollars, except where noted)
| 2. | Significant accounting policies (continued) |
| (e) | Share-based payments (continued) |
These awards are classified as liability awards, measured at fair value at the date of grant and re-measured at fair value at each reporting date up to and including the settlement date. The determination of the fair value of the share units under these plans is described in note 28. The fair value of the awards is expensed over the respective vesting period of the individual awards with recognition of a corresponding liability. Changes in fair value after vesting are recognized through compensation expense. Compensation expense reflects estimates of the number of instruments expected to vest.
The impact of forfeitures and fair value revisions, if any, are recognized in earnings such that the cumulative expense reflects the revisions, with a corresponding adjustment to the settlement liability. Liability-classified share unit liabilities due within 12 months of the reporting date are presented in trade and other payables while settlements due beyond 12 months of the reporting date are presented in other non-current liabilities.
| (f) | Fair value measurement |
Fair value is the exit price that would be received to sell an asset or paid to transfer a liability in an orderly transaction between market participants at the measurement date. The Company measures financial instruments or discloses select non-financial assets at fair value at each balance sheet date. Also, fair values of financial instruments measured at amortized cost are disclosed in note 12.
The Company uses valuation techniques that are appropriate in the circumstances and for which sufficient data is available to measure fair value, maximizing the use of relevant observable inputs and minimizing the use of unobservable inputs.
All assets and liabilities for which fair value is measured or disclosed in the financial statements at fair value are categorized within a fair value hierarchy, as disclosed in note 12, based on the lowest level input that is significant to the fair value measurement or disclosure. This fair value hierarchy gives the highest priority to quoted prices in active markets for identical assets or liabilities (Level 1) and the lowest priority to unobservable inputs (Level 3).
For assets and liabilities that are recognized in the financial statements at fair value on a recurring basis, the Company determines whether transfers have occurred between levels in the hierarchy by re-assessing categorization at the end of each reporting period.
For the purposes of fair value disclosures, the Company has determined classes of assets and liabilities on the basis of the nature, characteristics and risks of the assets or liability and the level of the fair value hierarchy as explained above.
| (g) | Foreign currency translation |
The parent entity‘s presentation and functional currency is the United States dollar. The functional currency for each of the parent entity‘s subsidiaries is the currency of the primary economic environment in which the entity operates, which is usually the currency of the country of residency.
Accordingly, the financial statements of the Company‘s subsidiaries that are not denominated in United States dollars have been translated into United States dollars using the exchange rate at the end of each reporting period for asset and liability amounts and the monthly average exchange rate for amounts included in the determination of earnings. Any gains or losses from the translation of asset and liability amounts are included in foreign currency translation adjustment in accumulated other comprehensive income.
| Ritchie Bros. | 93 |
Notes to the Consolidated Financial Statements
(Tabular amounts expressed in thousands of United States dollars, except where noted)
| 2. | Significant accounting policies (continued) |
| (g) | Foreign currency translation (continued) |
In preparing the financial statements of the individual subsidiaries, transactions in currencies other than the entity‘s functional currency are recognized at the rates of exchange prevailing at the dates of the transaction. At the end of each reporting period, monetary assets and liabilities denominated in foreign currencies are retranslated at the rates prevailing at that date. Foreign currency differences arising on retranslation of monetary items are recognized in earnings. Foreign currency translation adjustment includes intra-entity foreign currency transactions that are of a long-term investment nature of $18,129,000 for 2017 (2016: $1,967,000; 2015: $19,636,000).
| (h) | Cash and cash equivalents |
Cash and cash equivalents is comprised of cash on hand, deposits with financial institutions, and other short-term, highly liquid investments with original maturity of three months or less when acquired, that are readily convertible to known amounts of cash.
| (i) | Restricted cash |
In certain jurisdictions, local laws require the Company to hold cash in segregated bank accounts, which are used to settle auction proceeds payable resulting from live on site auctions and online marketplace sales conducted in those regions. In addition, the Company also holds cash generated from its EquipmentOne online marketplace sales in separate escrow accounts, for settlement of the respective online marketplace transactions as a part of its secured escrow service. Restricted cash balances also include funds held in accounts owned by the Company in support of short-term stand-by letters of credit to provide seller security.
During the period from December 21, 2016 through May 31, 2017, non-current restricted cash consisted of funds held in escrow pursuant to the offering of senior unsecured notes (note 25), which were only available when the Company received approval to acquire IronPlanet Holdings, Inc. (“IronPlanet”) and whose use was restricted to the funding of the IronPlanet acquisition (note 32).
| (j) | Trade and other receivables |
Trade receivables principally include amounts due from customers as a result of live on site auction and online marketplace transactions. The recorded amount reflects the purchase price of the item sold, including the Company’s commission. The allowance for doubtful accounts is the Company’s best estimate of the amount of probable credit losses in existing accounts receivable. The Company determines the allowance based on historical write-off experience and customer economic data.
The Company reviews the allowance for doubtful accounts regularly and past due balances are reviewed for collectability. Account balances are charged against the allowance when the Company believes that the receivable will not be recovered.
| (k) | Inventories |
Inventory consists of equipment and other assets purchased for resale in an upcoming live on site auction or online marketplace event. Inventory is valued at the lower of cost and net realizable value where net realizable value represents the expected sale price upon disposition less make-ready costs and the costs of disposal and transportation. The significant elements of cost include the acquisition price of the inventory and make-ready costs to prepare the inventory for sale that are not selling expenses. The specific identification method is used to determine amounts removed from inventory. Write-downs to the carrying value of inventory are recorded in revenue in the consolidated income statement.
| Ritchie Bros. | 94 |
Notes to the Consolidated Financial Statements
(Tabular amounts expressed in thousands of United States dollars, except where noted)
| 2. | Significant accounting policies (continued) |
| (l) | Equity-accounted investments |
Investments in entities that the Company has the ability to exercise significant influence over, but not control, are accounted for using the equity method of accounting. Under the equity method of accounting, investments are stated at initial costs and are adjusted for subsequent additional investments and the Company’s share of earnings or losses and distributions. The Company evaluates its equity-accounted investments for impairment when events or circumstances indicate that the carrying value of such investments may have experienced an other-than-temporary decline in value below their carrying value. If the estimated fair value is less than the carrying value and is considered an other than temporary decline, the carrying value is written down to its estimated fair value and the resulting impairment is recorded in the consolidated income statement.
| (m) | Property, plant and equipment |
All property, plant and equipment are stated at cost less accumulated depreciation. Cost includes all expenditures that are directly attributable to the acquisition or development of the asset, net of any amounts received in relation to those assets, including scientific research and experimental development tax credits.
The cost of self-constructed assets includes the cost of materials and direct labour, any other costs directly attributable to bringing the assets to working condition for their intended use, the costs of dismantling and removing items and restoring the site on which they are located (if applicable), and capitalized interest on qualifying assets. Subsequent costs are included in the asset’s carrying amount or recognized as a separate asset, as appropriate, only when it is probable that future economic benefits associated with the item will flow to the Company and the cost of the item can be measured reliably.
All repairs and maintenance costs are charged to earnings during the financial period in which they are incurred. Gains and losses on disposal of an item of property, plant and equipment are determined by comparing the proceeds from disposal with the carrying amount of the item, and are recognized net within operating income on the income statement.
Depreciation is provided to charge the cost of the assets to operations over their estimated useful lives based on their usage as follows:
| Asset | Rate / term | |
| Land improvements | 10% | |
| Buildings | 15 - 30 years | |
| Yard equipment | 20 - 30% | |
| Automotive equipment | 30% | |
| Computer software and equipment | 3 - 5 years | |
| Office equipment | 20% | |
| Leasehold improvements | Lease term |
No depreciation is provided on freehold land or on assets in the course of construction or development. Depreciation of property, plant and equipment under capital leases is recorded in depreciation expense.
Legal obligations to retire and to restore property, plant and equipment and assets under operating leases are recorded at management‘s best estimate in the period in which they are incurred, if a reasonable estimate can be made, with a corresponding increase in asset carrying value. The liability is accreted to face value over the remaining estimated useful life of the asset. The Company does not have any significant asset retirement obligations.
| Ritchie Bros. | 95 |
Notes to the Consolidated Financial Statements
(Tabular amounts expressed in thousands of United States dollars, except where noted)
| 2. | Significant accounting policies (continued) |
| (n) | Long-lived assets held for sale |
Long-lived assets, or disposal groups comprising assets and liabilities, that are expected to be recovered primarily through sale rather than through continuing use are classified as assets held for sale. Immediately before classification as held for sale, the assets, or components of a disposal group, are measured at carrying amount in accordance with the Company’s accounting policies. Thereafter, the assets, or disposal group, are measured at the lower of their carrying amount and fair value less cost to sell and are not depreciated. Impairment losses on initial classification as held for sale and subsequent gains or losses on re-measurement are recognized in operating income on the income statement.
| (o) | Intangible assets |
Intangible assets are measured at cost less accumulated amortization and accumulated impairment losses. Cost includes all expenditures that are directly attributable to the acquisition or development of the asset, net of any amounts received in relation to those assets, including scientific research and experimental development tax credits. Costs of internally developed software are amortized on a straight-line basis over the remaining estimated economic life of the software product. Costs related to software incurred prior to establishing technological feasibility or the beginning of the application development stage of software are charged to operations as such costs are incurred. Once technological feasibility is established or the application development stage has begun, directly attributable costs are capitalized until the software is available for use.
Amortization is recognized in net earnings on a straight-line basis over the estimated useful lives of intangible assets from the date that they are available for use. The estimated useful lives are:
| Asset | Rate / term | ||
| Trade names and trademarks | 3 - 15 years or indefinite-lived | ||
| Customer relationships | 6 - 20 years | ||
| Software assets | 3 - 7 years |
Customer relationships includes relationships with buyers and sellers.
| (p) | Impairment of long-lived and indefinite-lived assets |
Long-lived assets, comprised of property, plant and equipment and intangible assets subject to amortization, are assessed for impairment whenever events or circumstances indicate that their carrying value may not be recoverable. For the purpose of impairment testing, long-lived assets are grouped and tested for recoverability at the lowest level that generates independent cash flows. An impairment loss is recognized when the carrying value of the assets or asset groups is greater than the future projected undiscounted cash flows. The impairment loss is calculated as the excess of the carrying value over the fair value of the asset or asset group. Fair value is based on valuation techniques or third party appraisals. Significant estimates and judgments are applied in determining these cash flows and fair values.
Indefinite-lived intangible assets are tested annually for impairment as of December 31, and between annual tests if indicators of potential impairment exist. The Company has the option of performing a qualitative assessment to first determine whether the quantitative impairment test is necessary. This involves an assessment of qualitative factors to determine the existence of events or circumstances that would indicate whether it is more likely than not that the carrying amount of the indefinite-lived intangible asset is less than its fair value. If the qualitative assessment indicates it is not more likely than not that the carrying amount is less than its fair value, a quantitative impairment test is not required. Where a quantitative impairment test is required, the procedure is to compare the indefinite-lived intangible asset’s fair value with its carrying amount. An impairment loss is recognized as the difference between the indefinite-lived intangible asset’s carrying amount and its fair value.
| Ritchie Bros. | 96 |
Notes to the Consolidated Financial Statements
(Tabular amounts expressed in thousands of United States dollars, except where noted)
| 2. | Significant accounting policies (continued) |
| (q) | Goodwill |
Goodwill represents the excess of the purchase price of an acquired enterprise over the fair value assigned to the assets acquired and liabilities assumed in a business combination.
Goodwill is not amortized, but it is tested annually for impairment at the reporting unit level as of December 31, and between annual tests if indicators of potential impairment exist. The Company has the option of performing a qualitative assessment of a reporting unit to first determine whether the quantitative impairment test is necessary. This involves an assessment of qualitative factors to determine the existence of events or circumstances that would indicate whether it is more likely than not that the carrying amount of the reporting unit to which goodwill belongs is less than its fair value. If the qualitative assessment indicates it is not more likely than not that the reporting unit’s carrying amount is less than its fair value, a quantitative impairment test is not required.
Where a quantitative impairment test is required, the procedure is to identify potential impairment by comparing the reporting unit’s fair value with its carrying amount, including goodwill. The reporting unit’s fair value is determined using various valuation approaches and techniques that involve assumptions based on what the Company believes a hypothetical marketplace participant would use in estimating fair value on the measurement date. An impairment loss is recognized as the difference between the reporting unit’s carrying amount and its fair value. If the difference between the reporting unit’s carrying amount and fair value is greater than the amount of goodwill allocated to the reporting unit, the impairment loss is restricted by the amount of the goodwill allocated to the reporting unit.
| (r) | Deferred financing costs |
Deferred financing costs represent the unamortized costs incurred on the issuance of the Company’s long-term debt. Amortization of deferred financing costs is provided on the effective interest rate method over the term of the facility. Deferred financing costs relating to the Company’s term debt are presented in the consolidated balance sheet as a direct reduction of the carrying amount of the long-term debt. Deferred financing costs relating to the Company’s revolving loans are presented on the balance sheet as a deferred charge.
| (s) | Taxes |
Income tax expense represents the sum of current tax expense and deferred tax expense.
Current tax
The current tax expense is based on taxable profit for the period and includes any adjustments to tax payable in respect of previous years. Taxable profit differs from income before income taxes as reported in the consolidated income statement because it excludes (i) items of income or expense that are taxable or deductible in other years and (ii) items that are never taxable or deductible. The Company‘s liability for current tax is calculated using tax rates that have been enacted by the balance sheet date.
Deferred tax
Income taxes are accounted for using the asset and liability method. Deferred income tax assets and liabilities are based on temporary differences, which are differences between the accounting basis and the tax basis of the assets and liabilities and non-capital loss, capital loss, and tax credits carryforwards are measured using the enacted tax rates and laws expected to apply when these differences reverse. Deferred tax benefits, including non-capital loss, capital loss, and tax credits carryforwards, are recognized to the extent that realization of such benefits is considered more likely than not. The effect on deferred tax assets and liabilities of a change in tax rates is recognized in earnings in the period that enactment occurs. When realization of deferred income tax assets does not meet the more-likely-than-not criterion for recognition, a valuation allowance is provided.
| Ritchie Bros. | 97 |
Notes to the Consolidated Financial Statements
(Tabular amounts expressed in thousands of United States dollars, except where noted)
| 2. | Significant accounting policies (continued) |
| (s) | Taxes (continued) |
Deferred tax (continued)
Under US GAAP, changes in tax rates and tax law are accounted for in the period of enactment. The 2017 Tax Cuts and Jobs Act (“TCJA”) was enacted on December 22, 2017. ASC 740, Income Taxes, requires deferred tax assets and liabilities to be measured at the enacted tax rate expected to apply when temporary differences are to be realized or settled, which may impact the carrying values of deferred tax assets and liabilities. The effect of a change in tax law is recorded as a discrete component of the income tax provision related to continuing operations in the period of enactment. Changes in the valuation allowance assessment due to the 2017 TCJA would also be recorded to continuing operations in the tax provision.
Interest and penalties related to income taxes, including unrecognized tax benefits, are recorded in income tax expense in the income statement.
Liabilities for uncertain tax positions are recorded based on a two-step process. The first step is to evaluate the tax position for recognition by determining if the weight of available evidence indicates that it is more likely than not that the position will be sustained on audit, including resolution of related appeals or litigation processes, if any. The second step is to measure the tax benefit as the largest amount that is more than 50% likely of being realized upon settlement. The Company regularly assesses the potential outcomes of examinations by tax authorities in determining the adequacy of its provision for income taxes. The Company continually assesses the likelihood and amount of potential adjustments and adjusts the income tax provision, income taxes payable, and deferred taxes in the period in which the facts that give rise to a revision become known.
| (t) | Contingently redeemable non-controlling interest |
Contingently redeemable equity instruments are initially recorded at their fair value on the date of issue within temporary equity on the balance sheet. When the equity instruments become redeemable or redemption is probable, the Company recognizes changes in the estimated redemption value immediately as they occur, and adjusts the carrying amount of the redeemable equity instrument to equal the estimated redemption value at the end of each reporting period. Changes to the carrying value are charged or credited to retained earnings attributable to stockholders on the balance sheet.
Redemption value determinations require high levels of judgment (“Level 3” on the fair value hierarchy) and are based on various valuation techniques, including market comparables and discounted cash flow projections.
| (u) | Earnings per share |
Basic earnings per share has been calculated by dividing net income attributable to stockholders by the weighted average number of common shares outstanding. Diluted earnings per share has been calculated after giving effect to outstanding dilutive stock options calculated by adjusting the net income attributable to stockholders and the weighted average number of shares outstanding for all dilutive shares.
| (v) | Defined contribution plans |
The employees of the Company are members of retirement benefit plans to which the Company matches up to a specified percentage of employee contributions or, in certain jurisdictions, contributes a specified percentage of payroll costs as mandated by the local authorities. The only obligation of the Company with respect to the retirement benefit plans is to make the specified contributions.
| Ritchie Bros. | 98 |
Notes to the Consolidated Financial Statements
(Tabular amounts expressed in thousands of United States dollars, except where noted)
| 2. | Significant accounting policies (continued) |
| (w) | Advertising costs |
Advertising costs are expensed as incurred. Advertising expense is included in costs of services and selling, general and administrative (“SG&A”) expenses on the accompanying consolidated income statements.
| (x) | Early adoption of new accounting pronouncements |
| (i) | In January 2017, the Financial Accounting Standards Board (“FASB”) issued Accounting Standards Update (“ASU”) 2017-04, Intangibles – Goodwill and Other (Topic 350): Simplifying the Test for Goodwill Impairment, which eliminates Step 2 from the goodwill impairment test. Entities still have the option of performing a qualitative assessment of a reporting unit to first determine whether the quantitative impairment test is necessary. Where an annual or interim quantitative impairment test is necessary, there is only one step, which is to compare the fair value of a reporting unit with its carrying value. An impairment loss is recognized as the difference between the reporting unit’s carrying amount and its fair value to the extent the difference does not exceed the total amount of goodwill allocated to the reporting unit. |
ASU 2017-04 is effective for fiscal years, and interim periods within those fiscal years, beginning after December 15, 2019. Early adoption is permitted for interim and annual goodwill impairment tests performed on testing dates after January 1, 2017. The amendments are applied on a prospective basis. Because the amendments reduce the cost and complexity of goodwill impairment testing, the Company early adopted ASU 2017-04 in the first quarter of 2017.
| (ii) | In June 2017, the Company adopted ASU 2017-09, Compensation – Stock Compensation (Topic 718): Scope of Modification Accounting. ASU 2017-09 clarifies that the effects of a modification should be accounted for unless all the following criteria are met: |
| 1. | The fair value (or calculated or intrinsic value, as appropriate) of the modified award is the same as the fair value (or calculated or intrinsic value, as appropriate) of the original award immediately before the modification. The value immediately before and after the modification does not have to be estimated if the modification does affect any of the inputs to the valuation technique used to value the award. | |
| 2. | The modified award’s vesting conditions are the same as those of the original award immediately before the modification. | |
| 3. | The classification of the modified award as an equity or liability instrument is the same as the original award’s classification immediately before the modification. |
Adoption of this standard did not have a significant impact on the Company’s consolidated financial statements.
| (y) | New and amended accounting standards |
| (i) | Effective January 1, 2017, the Company adopted ASU 2016-06, Derivatives and Hedging (Topic 815): Contingent Put and Call Options in Debt Instruments, which impacts entities that are issuers of or investors in debt instruments – or hybrid financial instruments determined to have a debt host – with embedded call (put) options. One of the criteria for bifurcating an embedded derivative is assessing whether the economic characteristics and risks of call (put) options are clearly and closely related to those of their debt hosts. The amendments of ASU 2016-06 clarify the steps required in making this assessment for contingent call (put) options that can accelerate the payment of principal on debt instruments. Specifically, ASU 2016-06 requires the call (or put) options to be assessed solely in accordance with a four-step decision sequence. Consequently, when a call (put) option is contingently exercisable, an entity does not have to assess whether the triggering event is related to interest rates or credit risks. The standard was applied on a modified retrospective basis to existing debt instruments as of January 1, 2017. Adoption of this standard did not have a significant impact on the Company’s consolidated financial statements. |
| Ritchie Bros. | 99 |
Notes to the Consolidated Financial Statements
(Tabular amounts expressed in thousands of United States dollars, except where noted)
| 2. | Significant accounting policies (continued) |
| (y) | New and amended accounting standards (continued) |
| (ii) | Effective January 1, 2017, the Company adopted ASU 2016-09, Compensation – Stock Compensation (Topic 718): Improvements to Employee Share-Based Payment Accounting, which requires an entity to recognize share-based payment (“SBP”) award income tax effects in the consolidated income statement when the awards vest or are settled. Consequently, the requirement for entities to track APIC pools is eliminated. Other amendments include: |
| · | All excess tax benefits and tax deficiencies (including tax benefits of dividends on share-based payment awards) are recognized as income tax expense or benefit in the consolidated income statement. The tax effects of exercised or vested awards are treated as discrete items in the reporting period in which they occur. Excess tax benefits are recognized regardless of whether the benefit reduces taxes payable in the current period. These amendments were applied prospectively. |
| · | Because excess taxes no longer flow through APIC, when applying the treasury stock method in calculating diluted earnings per share (“EPS”), the assumed proceeds will no longer include any estimated excess taxes. |
| · | Excess tax benefits increase assumed proceeds, which results in more hypothetical shares being reacquired. The incremental number of dilutive shares for diluted EPS is calculated as the number of shares from the assumed exercise of the stock less the hypothetical shares reacquired. Therefore, removing excess tax benefits from the equation results in fewer hypothetical shares being reacquired, increasing the incremental number of dilutive shares. |
| · | Excess tax benefits are classified along with other income tax cash flows as an operating activity in the statement of cash flows. The Company elected to apply this amendment prospectively. |
| · | An entity can make an entity-wide accounting policy election to either estimate the number of awards that are expected to vest or account for forfeitures as they occur. Since forfeiture rates of the Company’s stock awards have historically been nominal and represent an insignificant assumption used in management’s estimate of the fair value of those awards, the Company has elected to account for forfeitures as they occur. This accounting policy change was applied on a modified retrospective basis and did not have an impact on the Company’s consolidated financial statements. |
| · | The threshold to qualify for equity classification permits withholding up to the maximum statutory tax rates in the applicable jurisdictions. This amendment was applied on a modified retrospective basis. |
| · | Cash paid by an employer when directly withholding shares for tax-withholding purposes is classified as a financing activity in the statement of cash flows. This amendment was applied prospectively. |
Adoption of this standard did not have a significant impact on the Company’s consolidated financial statements.
| (z) | Recent accounting standards not yet adopted |
| (i) | In May 2014, the FASB issued ASU 2014-09, Revenue from Contracts with Customers (Topic 606), which requires an entity to recognize revenue when it transfers promised goods or services to customers in an amount that reflects the consideration to which the entity expects to be entitled in exchange for those goods or services. In particular, it moves away from the current industry and transaction specific requirements. ASU 2014-09 creates a five-step model that requires entities to exercise judgment when considering the terms of the contract(s) which include: |
| 1. | Identifying the contract(s) with the customer, |
| 2. | Identifying the separate performance obligations in the contract, |
| 3. | Determining the transaction price, |
| 4. | Allocating the transaction price to the separate performance obligations, and |
| 5. | Recognizing revenue as each performance obligation is satisfied. |
| Ritchie Bros. | 100 |
Notes to the Consolidated Financial Statements
(Tabular amounts expressed in thousands of United States dollars, except where noted)
| 2. | Significant accounting policies (continued) |
| (z) | Recent accounting standards not yet adopted (continued) |
The amendments also contain extensive disclosure requirements designed to enable users of the financial statements to understand the nature, amount, timing and uncertainty of revenue and cash flows arising from contracts with customers. In July 2015, the FASB delayed the effective date of ASU 2014-09 by one year so that ASU 2014-09 is effective for fiscal years, and interim periods within those fiscal years, beginning after December 15, 2017. ASU 2014-09 permits the use of either the retrospective or modified retrospective (cumulative effect) transition method.
In 2015, the Company established a global new revenue accounting standard adoption team, consisting of financial reporting and accounting advisory representatives from across all geographical regions and business operations (the “Team”). The Team developed an adoption framework that continues to be used as guidance in identifying the Company’s significant contracts with customers. In 2016, the Team commenced its analysis, with the initial focus being on the impact of the amendments on accounting for the Company’s straight commission contracts, underwritten (inventory and guarantee) commission contracts, and ancillary service contracts. The Team is currently completing the process of identifying the appropriate changes to the Company’s business processes, systems, and controls required to adopt the amendments based on preliminary findings.
Since its inception, the Team has regularly reported the findings and progress of the adoption project to management and the Audit Committee. Based on these findings and analysis, management has determined that the Company will not early adopt ASU 2014-09. The reason for not early adopting and for electing to use a full retrospective method was primarily due to the Company’s acquisition of IronPlanet on May 31, 2017. Management believes that using a full retrospective method will provide more useful comparative information to financial statement users. The Company also continues to evaluate recently issued guidance on practical expedients as part of the adoption method decision.
The Team concluded that one of the most significant impacts of the adoption of ASU 2014-09 will be a change in the presentation of revenue from the majority of inventory, ancillary service, and Ritchie Bros. Logistical Services contracts as gross as a principal versus net as an agent. The Team’s analysis of these significant contracts with customers was aided by the FASB issuing ASU 2016-08, Revenue from Contracts with Customers (Topic 606), Principal versus Agent Considerations (Reporting Revenue Gross versus Net), which clarifies the implementation guidance on principal versus agent considerations, focusing on whether an entity controls a specified good or service before that good or service is transferred to a customer.
SEC Regulation S-X Rule 5-03.1 requires revenue from the sale of tangible products to be presented as a separate line item of the face of the consolidated income statement from revenues from services where income from one or both of those classes is more than 10 percent the sum of total revenues. Similarly, SEC Regulation Rule 5-03.2 requires the costs related to those revenue classes to be presented in the same manner. Based on historical information, the Team expects revenue from inventory contracts that are recognized gross as a principal selling tangible products to exceed 10 percent of total revenues.
| Ritchie Bros. | 101 |
Notes to the Consolidated Financial Statements
(Tabular amounts expressed in thousands of United States dollars, except where noted)
| 2. | Significant accounting policies (continued) |
| (z) | Recent accounting standards not yet adopted (continued) |
Presenting most inventory contract revenues gross as a principal selling a tangible product versus net as an agent providing a service will significantly change the face of the Company’s consolidated income statement. Currently, all revenue from inventory sales is presented net of costs within service revenues on the income statement. After ASU 2014-09 is adopted, service revenues will exclude revenue from inventory sales and cost of inventory sold for inventory contracts recorded on a gross basis. Those amounts will instead be presented gross as separate line items on the face of the consolidated income statement in accordance with SEC Regulation S-X Rules 5-03.1 and 5-03.2. Ancillary service and RB Logistical Services revenues will be presented within service revenues, but on a gross basis, with related service presented separately within costs of services.
The Team, together with oversight from the Audit Committee, will also continue to closely monitor FASB activity related to ASU 2014-09 to conclude on specific interpretative issues. Over the remaining term until ASU 2014-09 takes effect, the Team will complete its assessment of the impact of the new standard on remaining contracts with customers, as well as evaluate the impact on financial statement disclosures and processes that capture information required for the revised financial statement presentation. The Team will also continue to work with management to determine the impact of the change in presentation on the key performance metrics used to evaluate operational performance of the Company.
Expected impact to reported results
While continuing to assess all potential impacts of adoption of ASU 2014-09, the Team’s current analysis indicates that the most significant change will be the gross versus net presentation described above. This presentation is expected to increase the amount of revenue reported compared to the current presentation. Presenting these revenues gross as a principal versus net as an agent has no impact on operating income. The Company expects the effects of this change to be as follows:
| As reported | New revenue standard | |||||||||||||||||
| Year ended December 31, | 2017 | 2016 | Year ended December 31, | 2017 | 2016 | |||||||||||||
| Revenue from inventory sales | $ | 346,774 | $ | 571,134 | ||||||||||||||
| Service revenues | 624,417 | 555,843 | ||||||||||||||||
| Revenues | $ | 610,517 | $ | 566,395 | Total revenues | 971,191 | 1,126,977 | |||||||||||
| Cost of inventory sold | (306,498 | ) | (513,348 | ) | ||||||||||||||
| Costs of services, excluding depreciation and amortization ("D&A") | (79,013 | ) | (66,062 | ) | Costs of services, excluding D&A | (133,189 | ) | (113,296 | ) | |||||||||
| $ | 531,504 | $ | 500,333 | Gross profit | $ | 531,504 | $ | 500,333 | ||||||||||
| (ii) | In February 2016, the FASB issued ASU 2016-02, Leases (Topic 842), which requires lessees to recognize almost all leases, including operating leases, on the balance sheet through a right-of-use asset and a corresponding lease liability. For short-term leases, defined as those with a term of 12 months or less, the lessee is permitted to make an accounting policy election not to recognize the lease assets and liabilities, and instead recognize the lease expense generally on a straight-line basis over the lease term. The accounting treatment under this election is consistent with current operating lease accounting. No extensive amendments were made to lessor accounting, but amendments of note include changes to the definition of initial direct costs and accounting for collectability uncertainties in a lease. |
| Ritchie Bros. | 102 |
Notes to the Consolidated Financial Statements
(Tabular amounts expressed in thousands of United States dollars, except where noted)
| 2. | Significant accounting policies (continued) |
| (z) | Recent accounting standards not yet adopted (continued) |
ASU 2016-02 is effective for fiscal years, and interim periods within those fiscal years, beginning after December 15, 2018, with early adoption permitted. Both lessees and lessors must apply ASU 2016-02 using a “modified retrospective transition”, which reflects the new guidance from the beginning of the earliest period presented in the financial statements. However, lessees and lessors can elect to apply certain practical expedients on transition.
Management continues to perform a detailed inventory and analysis of all the Company’s leases, of which there are approximately 460 operating and 105 finance leases for which the Company is a lessee at the reporting date. The most significant operating leases in terms of the amount of rental charges and duration of the contract are for various auction sites and offices located in North America, Europe, the Middle East, and Asia. However, in terms of the number of leases, the majority consist of leases for computer, automotive, and yard equipment.
The Company continues to evaluate the new guidance to determine the impact it will have on its consolidated financial statements. Under the expectation that the majority, if not all, of the operating leases will be brought onto the Company’s balance sheet on adoption of ASU 2016-02, management is also investigating the functionality within the Company’s systems to automate the lease accounting process.
The adoption of ASU 2016-02 is expected to add complexity to the accounting for leases, as well as require extensive system and process changes to manage the large number of operating leases that the Company anticipates will be brought onto its balance sheet. As a result, management has determined that the Company will not early adopt ASU 2016-02, and will continue to evaluate the elections available to the Company involving the application of practical expedients on transition.
| (iii) | In March 2016, the FASB issued ASU 2016-08, Revenue from Contracts with Customers (Topic 606), Principal versus Agent Considerations (Reporting Revenue Gross versus Net). The amendments in ASU 2016-08 clarify the implementation guidance on principal versus agent considerations, focusing on whether an entity controls a specified good or service before that good or service is transferred to a customer. Where such control exists – i.e. where the entity is required to provide the specified good or service itself – the entity is a ‘principal’. Where the entity is required to arrange for another party to provide the good or service, it is an agent. |
The effective date and transition requirements of ASU 2016-08 are the same as for ASU 2014-09, which is for fiscal years, and interim periods within those fiscal years, beginning after December 15, 2017. The impact of adoption of ASU 2016-08 on the Company’s consolidated financial statements has been considered as part of the ASU 2014-09 adoption project discussed above.
| (iv) | In June 2016, the FASB issued ASU 2016-13, Financial Instruments – Credit Losses (Topic 326), Measurement of Credit Losses on Financial Instruments, which replaces the ‘incurred loss methodology’ credit impairment model with a new forward-looking “methodology that reflects expected credit losses and requires consideration of a broader range of reasonable and supportable information to inform credit loss estimates.” ASU 2016-13 is effective for fiscal years, and interim periods within those fiscal years, beginning after December 15, 2019. Early adoption is only permitted for fiscal years beginning after December 15, 2018, including interim periods within those years. The Company is evaluating the new guidance to determine the impact it will have on its consolidated financial statements. |
| Ritchie Bros. | 103 |
Notes to the Consolidated Financial Statements
(Tabular amounts expressed in thousands of United States dollars, except where noted)
| 2. | Significant accounting policies (continued) |
| (z) | Recent accounting standards not yet adopted (continued) |
| (v) | In August 2016, the FASB issued ASU 2016-15, Statement of Cash Flows (Topic 230): Classification of Certain Cash Receipts and Cash Payments. ASU 2016-15 identifies how certain cash receipts and cash payments are presented and classified in the statement of cash flows. The standard is effective for fiscal years and interim periods beginning after December 15, 2017. The amendments are applied retrospectively on the amendment date. The Company expects the adoption of ASU 2016-15 will result in the $1,302,000 Mascus contingent consideration paid in the second quarter of 2017 to be reclassified from operating to investing cash flows. |
| (vi) | In January 2017, the FASB issued ASU 2017-01, Business Combinations (Topic 805): Clarifying the Definition of a Business, whose amendments provide a screen to determine when an integrated set of assets and activities does not constitute a business as defined by Topic 805. Specifically, the amendments require that a set is not a business when substantially all the fair value of gross assets acquired (or disposed of) is concentrated in a single identifiable asset or group of similar identifiable assets. This screen reduces the number of transactions that need to be further evaluated and as such, it is anticipated that more acquisitions will be accounted for as asset acquisitions rather than business combinations. If the screen is not met, the amendments: |
| 1) | Require that the set must, at a minimum, include an input and a substantive process that together significantly contribute to the ability to create an output in order to be considered a business; and |
2) Remove the evaluation of whether a market participant could replace missing elements.
The amendments also provide a framework to assist in evaluating whether both an input and a substantive process are present, and this framework includes two sets of criteria to consider that depend on whether a set has outputs. Finally, the amendments narrow the definition of the term “output” so the term is consistent with how outputs are described in Topic 606 Revenue from Contracts with Customers.
ASU 2017-01 is effective for fiscal years, and interim periods within those fiscal years, beginning after December 15, 2017. The amendments are applied prospectively on or after the effective date.
| (vii) | In February 2017, the FASB issued ASU 2017-05, Other Income – Gains and Losses from the Derecognition of Nonfinancial Assets (Subtopic 610-20): Clarifying the Scope of Asset Derecognition Guidance and Accounting for Partial Sales of Nonfinancial Assets, which adds clarity around the scope of Subtopic 610-20, the accounting for partial sales of nonfinancial assets, and the identification of, allocation of consideration to, and derecognition of distinct nonfinancial assets. The amendments also define ‘in substance nonfinancial assets’, which are within the scope of Subtopic 610-20, and clarify that nonfinancial assets within the scope of Subtopic 610-20 may include nonfinancial assets transferred within a legal entity to a counterparty. |
ASU 2017-05 is effective at the same time as ASU 2014-09, which is for fiscal years, and interim periods within those fiscal years, beginning after December 15, 2017. Early adoption is permitted, including adoption in an interim period. The amendments in ASU 2017-05 must be applied at the same time as the amendments in ASU 2014-09. Entities may elect to apply these amendments retrospectively to each period presented in the financial statements or using a modified retrospective basis as of the beginning of the fiscal year of adoption. The Company does not expect the adoption of this standard to have a significant impact on its consolidated financial statements.
| Ritchie Bros. | 104 |
Notes to the Consolidated Financial Statements
(Tabular amounts expressed in thousands of United States dollars, except where noted)
| 3. | Significant judgments, estimates and assumptions |
The preparation of financial statements in conformity with US GAAP requires management to make judgments, estimates and assumptions that affect the reported amounts of assets and liabilities and the disclosure of contingent liabilities at the date of the financial statements, and the reported amounts of revenues and expenses during the reporting period.
Future differences arising between actual results and the judgments, estimates and assumptions made by the Company at the reporting date, or future changes to estimates and assumptions, could necessitate adjustments to the underlying reported amounts of assets, liabilities, revenues and expenses in future reporting periods.
Judgments, estimates and underlying assumptions are evaluated on an ongoing basis by management, and are based on historical experience and other factors including expectations of future events that are believed to be reasonable under the circumstances. However, existing circumstances and assumptions about future developments may change due to market changes or circumstance and such changes are reflected in the assumptions when they occur. Significant items subject to estimates include purchase price allocations, the carrying amounts of goodwill, the useful lives of long-lived assets, share based compensation, deferred income taxes, reserves for tax uncertainties, and other contingencies.
| 4. | Segmented information |
The Company’s principal business activity is the management and disposition of used industrial equipment and other durable assets. During the period ended December 31, 2017, the Company continued to integrate its IronPlanet acquisition, which resulted in changes in the basis of organization of the Company, including its leadership structure, sales processes, and management reporting. Most significantly, the Chief Operating Decision Maker (“CODM”) began to assess the performance of the business and allocate resources based on whether the Company’s services are transactional (generating value from the disposition of assets) or non-transactional in nature, and redesigned key metrics accordingly.
These changes resulted in the identification of the following new operating segments as of September 30, 2017:
| · | Auctions and Marketplaces (“A&M”) – This is the Company’s only reportable operating segment, which consists of the Company’s live on site auctions, its online auctions and marketplaces, and its brokerage service; |
| · | Ritchie Bros. Financial Services (“RBFS”) – This is the Company’s financial brokerage service, which is reported within the “other” category; and |
| · | Mascus – This is the Company’s online listing service, which is reported within the “other” category. |
The “other” category also includes results from various value-added services and make-ready activities, including the Company’s equipment refurbishment services, Asset Appraisal Services, and Ritchie Bros. Logistical Services.
| Ritchie Bros. | 105 |
Notes to the Consolidated Financial Statements
(Tabular amounts expressed in thousands of United States dollars, except where noted)
| 4. | Segmented information (continued) |
| Year ended December 31, 2017 | ||||||||||||
| A&M | Other | Consolidated | ||||||||||
| Revenues | $ | 564,298 | $ | 46,219 | $ | 610,517 | ||||||
| Costs of services, excluding D&A | (75,685 | ) | (3,328 | ) | (79,013 | ) | ||||||
| SG&A expenses | (308,874 | ) | (14,396 | ) | (323,270 | ) | ||||||
| Impairment loss | (8,911 | ) | - | (8,911 | ) | |||||||
| Segment profit | $ | 170,828 | $ | 28,495 | $ | 199,323 | ||||||
| Acquisition-related costs | (38,272 | ) | ||||||||||
| D&A expenses | (52,694 | ) | ||||||||||
| Gain on disposition of Property, plant and equipment ("PPE") | 1,656 | |||||||||||
| Foreign exchange loss | (2,559 | ) | ||||||||||
| Operating income | $ | 107,454 | ||||||||||
| Other expense, net | (30,060 | ) | ||||||||||
| Income tax expense | (2,088 | ) | ||||||||||
| Net income | $ | 75,306 | ||||||||||
| Year ended December 31, 2016 | ||||||||||||
| A&M | Other | Consolidated | ||||||||||
| Revenues | $ | 531,826 | $ | 34,569 | $ | 566,395 | ||||||
| Costs of services, excluding D&A | (65,248 | ) | (814 | ) | (66,062 | ) | ||||||
| SG&A expenses | (272,317 | ) | (11,212 | ) | (283,529 | ) | ||||||
| Impairment loss | (28,243 | ) | - | (28,243 | ) | |||||||
| Segment profit | $ | 166,018 | $ | 22,543 | $ | 188,561 | ||||||
| Acquisition-related costs | (11,829 | ) | ||||||||||
| D&A expenses | (40,861 | ) | ||||||||||
| Gain on disposition of PPE | 1,282 | |||||||||||
| Foreign exchange loss | (1,431 | ) | ||||||||||
| Operating income | $ | 135,722 | ||||||||||
| Other expense, net | (5,228 | ) | ||||||||||
| Income tax expense | (36,982 | ) | ||||||||||
| Net income | $ | 93,512 | ||||||||||
| Ritchie Bros. | 106 |
Notes to the Consolidated Financial Statements
(Tabular amounts expressed in thousands of United States dollars, except where noted)
| 4. | Segmented information (continued) |
| Year ended December 31, 2015 | ||||||||||||
| A&M | Other | Consolidated | ||||||||||
| Revenues | $ | 505,865 | $ | 10,010 | $ | 515,875 | ||||||
| Costs of services, excluding D&A | (56,026 | ) | - | (56,026 | ) | |||||||
| SG&A expenses | (249,852 | ) | (4,537 | ) | (254,389 | ) | ||||||
| Segment profit | $ | 199,987 | $ | 5,473 | $ | 205,460 | ||||||
| Acquisition-related costs | (601 | ) | ||||||||||
| D&A expenses | (42,032 | ) | ||||||||||
| Gain on disposition of PPE | 9,691 | |||||||||||
| Foreign exchange gain | 2,322 | |||||||||||
| Operating income | $ | 174,840 | ||||||||||
| Other income, net | 1,596 | |||||||||||
| Income tax expense | (37,861 | ) | ||||||||||
| Net income | $ | 138,575 | ||||||||||
Certain prior period SG&A expenses have been retrospectively reclassified between the A&M segment and the other category to conform with the current presentation. Details of the reclassifications are as follows:
| At September 30, | At June 30, | At March 31, | December 31, | |||||||||||||
| 2017 | 2017 | 2017 | 2016 | |||||||||||||
| A&M SG&A expenses: | ||||||||||||||||
| As reported | $ | 81,964 | $ | 71,199 | $ | 67,392 | $ | 273,179 | ||||||||
| Current presentation | 81,736 | 70,977 | 67,111 | 272,317 | ||||||||||||
| Other SG&A expenses: | ||||||||||||||||
| As reported | $ | 3,371 | $ | 3,178 | $ | 3,183 | $ | 10,350 | ||||||||
| Current presentation | 3,599 | 3,400 | 3,464 | 11,212 | ||||||||||||
| Ritchie Bros. | 107 |
Notes to the Consolidated Financial Statements
(Tabular amounts expressed in thousands of United States dollars, except where noted)
| 4. | Segmented information (continued) |
The carrying value of goodwill of $649,770,000 has been allocated to A&M and $21,152,000 has been allocated to other. As in prior periods, the CODM does not evaluate the performance of its operating segments based on segment assets and liabilities, nor does the Company classify liabilities on a segmented basis.
| As at December 31, | 2017 | 2016 | ||||||
| A&M | $ | 649,770 | $ | 78,934 | ||||
| Other | 21,152 | 18,603 | ||||||
| $ | 670,922 | $ | 97,537 | |||||
The Company‘s geographic information as determined by the revenue and location of assets, which represents property, plant and equipment is as follows:
| United States | Canada | Europe | Other | Consolidated | ||||||||||||||||
| Revenues for the year ended: | ||||||||||||||||||||
| December 31, 2017 | $ | 325,244 | $ | 168,928 | $ | 68,408 | $ | 47,937 | $ | 610,517 | ||||||||||
| December 31, 2016 | 278,198 | 187,699 | 52,809 | 47,689 | 566,395 | |||||||||||||||
| December 31, 2015 | 257,824 | 166,528 | 48,419 | 43,104 | 515,875 | |||||||||||||||
| United States | Canada | Europe | Other | Consolidated | ||||||||||||||||
| Long-lived assets: | ||||||||||||||||||||
| December 31, 2017 | $ | 275,628 | $ | 116,833 | $ | 82,795 | $ | 51,325 | $ | 526,581 | ||||||||||
| December 31, 2016 | 282,103 | 108,693 | 74,491 | 49,743 | 515,030 | |||||||||||||||
| 5. | Revenues |
The Company’s revenue from the rendering of services is as follows:
| Year ended December 31, | 2017 | 2016 | 2015 | |||||||||
| Commissions | $ | 434,672 | $ | 424,128 | $ | 405,308 | ||||||
| Fees | 175,845 | 142,267 | 110,567 | |||||||||
| $ | 610,517 | $ | 566,395 | $ | 515,875 | |||||||
Net profits on inventory sales included in commissions are:
| Year ended December 31, | 2017 | 2016 | 2015 | |||||||||
| Revenue from inventory sales | $ | 346,774 | $ | 571,134 | $ | 555,827 | ||||||
| Cost of inventory sold | (306,498 | ) | (513,348 | ) | (511,892 | ) | ||||||
| $ | 40,276 | $ | 57,786 | $ | 43,935 | |||||||
| Ritchie Bros. | 108 |
Notes to the Consolidated Financial Statements
(Tabular amounts expressed in thousands of United States dollars, except where noted)
| 6. | Operating expenses |
Costs of services, excluding D&A
| Year ended December 31, | 2017 | 2016 | 2015 | |||||||||
| Employee compensation expenses | $ | 35,440 | $ | 27,856 | $ | 22,855 | ||||||
| Buildings, facilities and technology expenses | 8,359 | 7,966 | 7,179 | |||||||||
| Travel, advertising and promotion expenses | 23,994 | 23,688 | 22,150 | |||||||||
| Other costs of services | 11,220 | 6,552 | 3,842 | |||||||||
| $ | 79,013 | $ | 66,062 | $ | 56,026 | |||||||
SG&A expenses
| Year ended December 31, | 2017 | 2016 | 2015 | |||||||||
| Employee compensation expenses | $ | 208,370 | $ | 180,929 | $ | 166,227 | ||||||
| Buildings, facilities and technology expenses | 53,151 | 49,219 | 41,404 | |||||||||
| Travel, advertising and promotion expenses | 30,440 | 24,384 | 22,307 | |||||||||
| Professional fees | 13,522 | 13,344 | 12,500 | |||||||||
| Other SG&A expenses | 17,787 | 15,653 | 11,951 | |||||||||
| $ | 323,270 | $ | 283,529 | $ | 254,389 | |||||||
| Ritchie Bros. | 109 |
Notes to the Consolidated Financial Statements
(Tabular amounts expressed in thousands of United States dollars, except where noted)
| 6. | Operating expenses (continued) |
Acquisition-related costs
Acquisition-related costs consist of operating expenses directly incurred as part of a business combination, due diligence and integration planning related to the IronPlanet acquisition (note 32), and continuing employment costs that are recognized separately from our business combinations. In the fourth quarter of 2016, the definition of acquisition-related costs was expanded to include continuing employment costs incurred to retain key employees for a specified period of time following a business acquisition. This change was applied retrospectively and resulted in a further reclassification of SG&A expenses to acquisition-related costs.
| Year ended December 31, | 2017 | 2016 | 2015 | |||||||||
| IronPlanet: (note 32) | $ | - | ||||||||||
| Stock option compensation expense (note 28) | $ | 4,752 | $ | - | ||||||||
| Legal costs | 8,898 | 3,402 | ||||||||||
| Other acquisition-related costs | 21,003 | 4,800 | ||||||||||
| Mascus: (note 32) | ||||||||||||
| Continuing employment costs | 530 | 954 | - | |||||||||
| Other acquisition-related costs | 22 | 766 | - | |||||||||
| Xcira: | ||||||||||||
| Continuing employment costs | 1,811 | 1,111 | 191 | |||||||||
| Other acquisition-related costs | - | - | 410 | |||||||||
| Petrowsky: (note 32) | ||||||||||||
| Continuing employment costs | 649 | 350 | - | |||||||||
| Other acquisition-related costs | 4 | 254 | - | |||||||||
| Kramer: (note 32) | ||||||||||||
| Continuing employment costs | 428 | 76 | - | |||||||||
| Other acquisition-related costs | 79 | 116 | ||||||||||
| Other | 96 | - | - | |||||||||
| $ | 38,272 | $ | 11,829 | $ | 601 | |||||||
Depreciation and amortization expenses
| Year ended December 31, | 2017 | 2016 | 2015 | |||||||||
| Depreciation expense | $ | 28,337 | $ | 30,983 | $ | 35,374 | ||||||
| Amortization expense | 24,357 | 9,878 | 6,658 | |||||||||
| $ | 52,694 | $ | 40,861 | $ | 42,032 | |||||||
During the year ended December 31, 2017, depreciation expense of $1,207,000 (2016: $2,880,000; 2015: $4,340,000) and amortization expense of $11,662,000 (2016: $7,218,000; 2015: $4,680,000) were recorded relating to software.
| Ritchie Bros. | 110 |
Notes to the Consolidated Financial Statements
(Tabular amounts expressed in thousands of United States dollars, except where noted)
| 7. | Impairment Loss |
Goodwill impairment
The Company performs impairment tests on goodwill on an annual basis in accordance with US GAAP, or more frequently if events or changes in circumstances indicate that those assets might be impaired. Goodwill is tested for impairment at a reporting unit level, which is at the same level or one level below an operating segment. A goodwill impairment loss is recognized when the carrying amount of the reporting unit is greater than its fair value. The goodwill impairment loss is calculated as the excess of the carrying amount of the goodwill over its implied fair value. During the year ended December 31, 2017 there was no goodwill impairment identified.
Goodwill arising from the acquisition of AssetNation, the provider of an online marketplace, was part of the former EquipmentOne reporting unit. During the year ended December 31, 2016, an indicator of impairment was identified with respect to the EquipmentOne reporting unit. The indicator consisted of a decline in actual and forecasted revenue and operating income compared with previously projected results, which was primarily due to the recent performance of the EquipmentOne reporting unit.
Based on the results of the goodwill impairment test, the Company recorded an impairment loss on the EquipmentOne reporting unit goodwill of $23,574,000 in the year ended December 31, 2016.
Long-lived asset impairment
Long-lived assets, which are comprised of property, plant and equipment and definite-lived intangible assets, are assessed for impairment whenever events or circumstances indicate that their carrying amounts may not be recoverable. For the purpose of impairment testing, long-lived assets are grouped and tested for recoverability at the lowest level that generates independent cash flows from another asset group. The carrying amount of the long-lived asset group is not recoverable if it exceeds the sum of the future undiscounted cash flows expected to result from the long-lived asset group’s use and eventual disposition. Where the carrying amount of the long-lived asset group is not recoverable, its fair value is determined in order to calculate any impairment loss. An impairment loss is measured as the excess of the long-lived asset group’s carrying amount over its fair value.
During the year ended December 31, 2017, management identified indicators of impairment on certain software and software under development intangible assets (the “technology assets”). The indicators consisted of decisions made after the acquisition of IronPlanet that adversely impacted the extent or manner in which certain technology assets would be utilized. As part of its integration activities the Company determined that it was more likely than not that certain technology assets would not be utilized or developed as originally intended and no longer had value. As a result, management performed an impairment test that resulted in the recognition of an impairment loss of $8,911,000 on the technology assets.
At September 30, 2016, for the same reason noted above under the EquipmentOne goodwill impairment test, management determined that there was an indicator that the carrying amount of the long-lived assets arising from our acquisition of AssetNation (the “EquipmentOne long-lived assets”) might not have been recoverable. As such, the Company performed the recoverability test, for which purpose management determined that the asset group to which the EquipmentOne long-lived assets belonged was the EquipmentOne reporting unit.
Based on the results of the long-lived asset impairment test, the Company recorded an impairment loss on the EquipmentOne reporting unit customer relationships of $4,669,000 in the year ended December 31, 2016. In connection with this impairment loss, the Company recorded a deferred tax benefit of $1,798,000 to the income tax provision. The result of this impairment test was reflected in the carrying value of the former EquipmentOne reporting unit prior to the completion of the goodwill impairment test described above.
| Ritchie Bros. | 111 |
Notes to the Consolidated Financial Statements
(Tabular amounts expressed in thousands of United States dollars, except where noted)
| 8. | Income taxes |
The expense for the year can be reconciled to income before income taxes as follows:
| Year ended December 31, | 2017 | 2016 | 2015 | |||||||||
| Income before income taxes | $ | 77,394 | $ | 130,494 | $ | 176,436 | ||||||
| Statutory federal and provincial tax rate in Canada | 26.00 | % | 26.00 | % | 26.00 | % | ||||||
| Expected income tax expense | $ | 20,122 | $ | 33,928 | $ | 45,873 | ||||||
| Impairment of goodwill | - | 6,129 | - | |||||||||
| Non-deductible expenses | 5,668 | 3,891 | 2,579 | |||||||||
| Non-taxable income | (105 | ) | (624 | ) | - | |||||||
| Sale of capital property | - | - | (1,291 | ) | ||||||||
| Changes in the valuation of deferred tax assets | (1,089 | ) | (259 | ) | (5,828 | ) | ||||||
| Different tax rates of subsidiaries operating in foreign jurisdictions | (12,269 | ) | (3,786 | ) | (3,426 | ) | ||||||
| Change in enacted rates | (10,299 | ) | 51 | 307 | ||||||||
| Change in estimate of deductibility of stock options | (1,557 | ) | - | - | ||||||||
| Unrecognized tax benefits | 3,291 | 799 | 1,362 | |||||||||
| Benefits of deductible stock options vested and exercised | (1,359 | ) | (1,042 | ) | (666 | ) | ||||||
| Deductions for tax purposes in excess of accounting expenses | (380 | ) | (490 | ) | (232 | ) | ||||||
| Other | 65 | (1,615 | ) | (817 | ) | |||||||
| $ | 2,088 | $ | 36,982 | $ | 37,861 | |||||||
| Ritchie Bros. | 112 |
Notes to the Consolidated Financial Statements
(Tabular amounts expressed in thousands of United States dollars, except where noted)
| 8. | Income taxes (continued) |
The income tax expense (recovery) consists of:
| Year ended December 31, | 2017 | 2016 | 2015 | |||||||||
| Canadian: | ||||||||||||
| Current tax expense | $ | 14,245 | $ | 30,525 | $ | 27,623 | ||||||
| Deferred tax expense | (10,192 | ) | (2,068 | ) | 1,880 | |||||||
| Foreign: | ||||||||||||
| Current tax expense before application of operating loss carryforwards | 8,987 | 12,126 | 16,707 | |||||||||
| Tax benefit of operating loss carryforwards | (3,876 | ) | (2,310 | ) | (1,910 | ) | ||||||
| Total foreign current tax expense | 5,111 | 9,816 | 14,797 | |||||||||
| Deferred tax expense before adjustment to opening valuation allowance | (6,317 | ) | (1,291 | ) | (273 | ) | ||||||
| Adjustment to opening valuation allowance | (759 | ) | - | (6,166 | ) | |||||||
| Total foreign deferred tax expense | (7,076 | ) | (1,291 | ) | (6,439 | ) | ||||||
| $ | 2,088 | $ | 36,982 | $ | 37,861 | |||||||
The foreign provision for income taxes is based on foreign pre-tax earnings of $64,252,000, $25,139,000, and $64,139,000 in 2017, 2016, and 2015, respectively. The Company’s consolidated financial statements provide for any related tax liability on undistributed earnings. As of December 31, 2017, income taxes have not been provided on a cumulative total of $466,000,000 of such earnings that are not indefinitely reinvested. The amount of unrecognized deferred tax liability related to these temporary differences is estimated to be approximately $8,600,000. Earnings retained by subsidiaries and equity-accounted investments amount to approximately $469,000,000 in 2017 (2016: $450,000,000; 2015: $411,000,000). The Company accrues withholding and other taxes that would become payable on the distribution of earnings only to the extent that either the Company does not control the relevant entity or it is expected that these earnings will be remitted in the foreseeable future.
Recent Tax Legislation
The TCJA was enacted on December 22, 2017. The TCJA reduces the United States federal corporate tax rate from 35% to 21%, requires companies to pay a one-time transition tax on earnings of certain foreign subsidiaries that were previously tax deferred and certain other provisions. At December 31, 2017, we have not completed our accounting for the tax effects of the TCJA. However, as described below, we have made a reasonable estimate of the effects on our existing deferred tax balances and the one-time transition tax. We have recognized a provisional amount of $9,734,000, which is included as a component of income tax expense.
We remeasured certain deferred tax assets and liabilities based on the rates at which they are expected to reverse in the future. However, we are still analyzing certain aspects of the TCJA and refining our calculations, which could potentially affect the measurement of these balances or potentially give rise to new deferred amounts. The provisional amount resulted in a reduction of our net deferred tax liabilities of $10,070,000 and a corresponding deferred income tax benefit in 2017.
The one-time transition tax is based on our total post-1986 earnings and profits (“E&P”) of controlled foreign affiliates of our US subsidiaries that we previously deferred from US income tax. Upon enactment, there is a one-time deemed repatriation tax on undistributed E&P (the “transition tax”). We recognized tax expense of $336,000 related to the transition tax in 2017.
| Ritchie Bros. | 113 |
Notes to the Consolidated Financial Statements
(Tabular amounts expressed in thousands of United States dollars, except where noted)
| 8. | Income taxes (continued) |
The tax effects of temporary differences that give rise to significant deferred tax assets and deferred tax liabilities were as follows:
| As at December 31, | 2017 | 2016 | ||||||
| Deferred tax assets: | ||||||||
| Working capital | $ | 9,583 | $ | 3,991 | ||||
| Property, plant and equipment | 6,495 | 5,475 | ||||||
| Goodwill | 1,016 | 341 | ||||||
| Share-based compensation | 5,733 | 3,154 | ||||||
| Unused tax losses | 50,967 | 17,790 | ||||||
| Other | 8,919 | 8,251 | ||||||
| 82,713 | 39,002 | |||||||
| Deferred tax liabilities: | ||||||||
| Property, plant and equipment | $ | (9,779 | ) | $ | (10,019 | ) | ||
| Goodwill | (9,202 | ) | (12,976 | ) | ||||
| Intangible assets | (54,401 | ) | (11,062 | ) | ||||
| Other | (8,628 | ) | (2,565 | ) | ||||
| (82,010 | ) | (36,622 | ) | |||||
| Net deferred tax assets | $ | 703 | $ | 2,380 | ||||
| Valuation allowance | (14,363 | ) | (10,411 | ) | ||||
| $ | (13,660 | ) | $ | (8,031 | ) | |||
Certain comparative figures have been reclassified to conform to current year presentation. Details of the reclassifications are as follows:
| December 31, | ||||
| 2016 | ||||
| Deferred tax assets | ||||
| As reported | $ | 19,129 | ||
| Reclassified to Other non-current assets (note 19) | (10,035 | ) | ||
| Current presentation | 9,094 | |||
| Deferred tax liabilities | ||||
| As reported | $ | 36,387 | ||
| Reclassified to Other non-current liabilities (note 26) | (19,262 | ) | ||
| Current presentation | 17,125 | |||
| Net deferred tax assets (liabilities) | ||||
| As reported | $ | (17,258 | ) | |
| Net reclassification detailed above | 9,227 | |||
| Current presentation | (8,031 | ) | ||
| Ritchie Bros. | 114 |
Notes to the Consolidated Financial Statements
(Tabular amounts expressed in thousands of United States dollars, except where noted)
| 8. | Income taxes (continued) |
At December 31, 2017, the Company had non-capital loss carryforwards that are available to reduce taxable income in the future years. These non-capital loss carryforwards expire as follows:
| 2018 | $ | 510 | ||
| 2019 | 148 | |||
| 2020 | 6,267 | |||
| 2021 | 5,125 | |||
| 2022 and thereafter | 199,986 | |||
| $ | 212,036 |
The Company has capital loss carryforwards of approximately $11,343,000 in 2017 (2016: $16,564,000) available to reduce future capital gains which carryforward indefinitely.
Tax losses are denominated in the currency of the countries in which the respective subsidiaries are located and operate. Fluctuations in currency exchange rates could reduce the U.S. dollar equivalent value of these tax loss and research tax credit carryforwards in future years.
In assessing the realizability of our deferred tax assets, management considers whether it is more likely than not that some portion or all of the deferred tax assets will not be realized. The ultimate realization of deferred tax assets is dependent upon the generation of future taxable income during periods in which temporary differences become deductible and the loss carryforwards or tax credits can be utilized. Management considers projected future taxable income and tax planning strategies in making our assessment.
Uncertain tax positions
Tax positions are evaluated in a two-step process. The Company first determines whether it is more likely than not that a tax position will be sustained upon examination. If a tax position meets the more-likely-than-not recognition threshold it is then measured to determine the amount of the benefit to recognize in the financial statements. The tax position is measured as the largest amount of the benefit that is greater than 50% likely of being realized upon ultimate settlement. The Company classifies unrecognized tax benefits that are not expected to result in the payment or receipt of cash within one year as non-current liabilities in the consolidated balance sheets.
At December 31, 2017, the Company had gross unrecognized tax benefits of $25,910,000 (2016: $19,262,000). Of this total, $13,737,000 (2016: $9,227,000) represents the amount of unrecognized tax benefits that, if recognized, would favorably impact the effective tax rate.
Reconciliation of unrecognized tax benefits:
| As at December 31, | 2017 | 2016 | ||||||
| Unrecognized tax benefits, beginning of year | $ | 19,262 | $ | 15,904 | ||||
| Increases - tax positions taken in prior period | 4,426 | 846 | ||||||
| Decreases - tax positions taken in prior period | (124 | ) | - | |||||
| Increases - tax positions taken in current period | 2,346 | 2,785 | ||||||
| Settlement and lapse of statute of limitations | - | (273 | ) | |||||
| Unrecognized tax benefits, end of year | $ | 25,910 | $ | 19,262 | ||||
Interest expense and penalties related to unrecognized tax benefits are recorded within the provision for income tax expense on the consolidated income statement. At December 31, 2017, the Company had accrued $3,677,000 (2016: $2,695,000) for interest and penalties.
| Ritchie Bros. | 115 |
Notes to the Consolidated Financial Statements
(Tabular amounts expressed in thousands of United States dollars, except where noted)
| 8. | Income taxes (continued) |
In the normal course of business, the Company is subject to audit by the Canadian federal and provincial taxing authorities, by the U.S. federal and various state taxing authorities and by the taxing authorities in various foreign jurisdictions. Tax years ranging from 2012 to 2017 remain subject to examination in Canada, the United States, Luxembourg, and the Netherlands.
| 9. | Contingently redeemable non-controlling interest in Ritchie Bros. Financial Services |
Until July 12, 2016, the Company held a 51% interest in RBFS, an entity that provides loan origination services to enable the Company’s auction customers to obtain financing from third party lenders.
Until July 12, 2016, the Company and the non-controlling interest (“NCI”) holders each held options pursuant to which the Company could acquire, or be required to acquire, the NCI holders’ 49% interest in RBFS. These call and put options became exercisable on April 6, 2016, and the Company had the option to elect to pay the purchase price in either cash or shares of the Company, subject to the Company obtaining all relevant security exchange and regulatory consents and approvals. As a result of the existence of the put option, the NCI was accounted for as a contingently redeemable equity instrument (the “contingently redeemable NCI”). The NCI could be redeemed at a purchase price to be determined through an independent appraisal process conducted in accordance with the terms of the agreement, or at a negotiated price (the “redemption value”).
On July 12, 2016, the Company completed its acquisition of the NCI. On that date, the Company acquired the NCI holders’ 49% interest in RBFS for total consideration of 57,900,000 Canadian dollars ($44,141,000). The purchase price consisted of cash consideration of 53,900,000 Canadian dollars ($41,092,000) and 4,000,000 Canadian dollars ($3,049,000) representing the acquisition date fair value of contingent consideration payable to the former shareholders of RBFS. The contingent payment is payable if RBFS achieves a specified annual revenue growth rate over a three-year post-acquisition period, and is calculated as a specified percentage of the accumulated earnings of RBFS after the three-year post-acquisition period. The maximum amount payable under the contingent payment arrangement is 10,000,000 Canadian dollars. The Company may pay an additional amount not exceeding 1,500,000 Canadian dollars over a three-year period based on the former NCI holders providing continued management services to RBFS.
| Ritchie Bros. | 116 |
Notes to the Consolidated Financial Statements
(Tabular amounts expressed in thousands of United States dollars, except where noted)
| 10. | Earnings per share attributable to stockholders |
Basic EPS attributable to stockholders was calculated by dividing the net income attributable to stockholders by the weighted average (“WA”) number of common shares outstanding. Diluted EPS attributable to stockholders was calculated by dividing the net income attributable to stockholders after giving effect to outstanding dilutive stock options and PSUs by the WA number of shares outstanding adjusted for all dilutive securities.
| Net income | WA | |||||||||||
| attributable to | number | Per share | ||||||||||
| Year ended December 31, 2017 | stockholders | of shares | amount | |||||||||
| Basic | 75,027 | 107,044,348 | $ | 0.70 | ||||||||
| Effect of dilutive securities: | ||||||||||||
| PSUs | (152 | ) | 353,880 | - | ||||||||
| Stock options | - | 714,923 | (0.01 | ) | ||||||||
| Diluted | 74,875 | 108,113,151 | $ | 0.69 | ||||||||
| Net income | WA | |||||||||||
| attributable to | number | Per share | ||||||||||
| Year ended December 31, 2016 | stockholders | of shares | amount | |||||||||
| Basic | 91,832 | 106,630,323 | $ | 0.86 | ||||||||
| Effect of dilutive securities: | ||||||||||||
| PSUs | - | 91,997 | - | |||||||||
| Stock options | - | 735,474 | (0.01 | ) | ||||||||
| Diluted | 91,832 | 107,457,794 | $ | 0.85 | ||||||||
| Net income | WA | |||||||||||
| attributable to | number | Per share | ||||||||||
| Year ended December 31, 2015 | stockholders | of shares | amount | |||||||||
| Basic | 136,214 | 107,075,845 | $ | 1.27 | ||||||||
| Effect of dilutive securities: | ||||||||||||
| Stock options | - | 356,629 | - | |||||||||
| Diluted | 136,214 | 107,432,474 | $ | 1.27 | ||||||||
In respect of PSUs awarded under the sign-on grant PSUs and the senior executive and employee PSU plans (described in note 28), performance and market conditions, depending on their outcome at the end of the contingency period, can reduce the number of vested awards to nil or to a maximum of 200% of the number of outstanding PSUs. For the year ended December 31, 2017, nil PSUs to purchase common shares were outstanding but excluded from the calculation of diluted EPS attributable to stockholders as they were anti-dilutive (2016: 173,754; 2015: nil). For the year ended December 31, 2017, stock options to purchase 668,900 common shares were outstanding but excluded from the calculation of diluted EPS attributable to stockholders as they were anti-dilutive (2016: 752,197; 2015: 253,839).
| Ritchie Bros. | 117 |
Notes to the Consolidated Financial Statements
(Tabular amounts expressed in thousands of United States dollars, except where noted)
| 11. | Supplemental cash flow information |
| Year ended December 31, | 2017 | 2016 | 2015 | |||||||||
| Trade and other receivables | (19,161 | ) | 6,419 | 12,757 | ||||||||
| Inventory | (8,557 | ) | 26,557 | (17,635 | ) | |||||||
| Advances against auction contracts | 3,246 | (1,012 | ) | 20,804 | ||||||||
| Prepaid expenses and deposits | 1,178 | (7,443 | ) | (307 | ) | |||||||
| Income taxes receivable | (6,067 | ) | (10,686 | ) | 742 | |||||||
| Auction proceeds payable | 25,783 | 550 | 5,151 | |||||||||
| Trade and other payables | 20,552 | 5,627 | (7,654 | ) | ||||||||
| Income taxes payable | (3,986 | ) | (8,657 | ) | 3,481 | |||||||
| Share unit liabilities | (5,421 | ) | 4,503 | 5,397 | ||||||||
| Other | 1,410 | (5,176 | ) | 2,398 | ||||||||
| Net changes in operating assets and liabilities | $ | 8,977 | $ | 10,682 | $ | 25,134 | ||||||
Net capital spending, which consists of property, plant and equipment and intangible asset additions, net of proceeds on disposition of property, plant and equipment, was $34,436,000 for the year ended December 31, 2017 (2016: $29,785,000, 2015: $14,152,000).
| Year ended December 31, | 2017 | 2016 | 2015 | |||||||||
| Interest paid, net of interest capitalized | $ | 23,360 | $ | 5,792 | $ | 4,989 | ||||||
| Interest received | 3,196 | 1,861 | 2,657 | |||||||||
| Net income taxes paid | 28,281 | 54,037 | 34,661 | |||||||||
| Non-cash transactions: | ||||||||||||
| Non-cash purchase of property, plant and equipment under capital lease | 8,820 | 3,376 | 943 | |||||||||
| As at December 31, | 2017 | 2016 | 2015 | |||||||||
| Cash and cash equivalents | $ | 267,910 | $ | 207,867 | $ | 210,148 | ||||||
| Restricted cash: | ||||||||||||
| Current | 63,206 | 50,222 | 83,098 | |||||||||
| Non-current | - | 500,000 | - | |||||||||
| Cash, cash equivalents, and restricted cash | $ | 331,116 | $ | 758,089 | $ | 293,246 | ||||||
On December 21, 2016, the Company completed the offering of $500,000,000 aggregate principal amount of 5.375% senior unsecured notes due January 15, 2025 (note 25). Upon the closing of the offering, the gross proceeds from the offering were deposited in to an escrow account. The funds were released from escrow upon the closing of the acquisition of IronPlanet (note 32).
| Ritchie Bros. | 118 |
Notes to the Consolidated Financial Statements
(Tabular amounts expressed in thousands of United States dollars, except where noted)
| 12. | Fair value measurement |
All assets and liabilities for which fair value is measured or disclosed in the consolidated financial statements are categorized within the fair value hierarchy, described as follows, based on the lowest level input that is significant to the fair value measurement or disclosure:
● Level 1: Unadjusted quoted prices in active markets for identical assets or liabilities that the entity can access at measurement date;
● Level 2: Inputs other than quoted prices included in Level 1 that are observable for the asset or liability, either directly or indirectly; and
● Level 3: Unobservable inputs for the asset or liability.
| December 31, 2017 | December 31, 2016 | |||||||||||||||||||
| Category | Carrying amount | Fair value | Carrying amount | Fair value | ||||||||||||||||
| Fair values disclosed, recurring: | ||||||||||||||||||||
| Cash and cash equivalents | Level 1 | $ | 267,910 | $ | 267,910 | $ | 207,867 | $ | 207,867 | |||||||||||
| Restricted cash | Level 1 | 63,206 | 63,206 | 550,222 | 550,222 | |||||||||||||||
| Short-term debt (note 25) | Level 2 | 7,018 | 7,018 | 23,912 | 23,912 | |||||||||||||||
| Long-term debt (note 25) | ||||||||||||||||||||
| Senior unsecured notes | Level 1 | 487,339 | 520,000 | 495,780 | 509,500 | |||||||||||||||
| Revolving loans | Level 2 | - | - | 99,926 | 99,926 | |||||||||||||||
| Delayed draw term loans | Level 2 | 325,553 | 329,687 | - | - | |||||||||||||||
The carrying value of the Company‘s cash and cash equivalents, restricted cash, trade and other receivables, advances against auction contracts, auction proceeds payable, trade and other payables, short term debt, and revolving loans approximate their fair values due to their short terms to maturity. The carrying value of the delayed draw term loan, before deduction of deferred debt issue costs, approximates its fair value as the interest rates on the loans were short-term in nature. The fair value of the senior unsecured notes is determined by reference to a quoted market price.
| Ritchie Bros. | 119 |
Notes to the Consolidated Financial Statements
(Tabular amounts expressed in thousands of United States dollars, except where noted)
| 13. | Trade and other receivables |
| As at December 31, | 2017 | 2016 | ||||||
| Trade receivables | $ | 77,870 | $ | 45,317 | ||||
| Consumption taxes receivable | 13,592 | 5,575 | ||||||
| Other receivables | 643 | 2,087 | ||||||
| $ | 92,105 | $ | 52,979 | |||||
Trade receivables are generally secured by the equipment that they relate to as it is Company policy that equipment is not released until payment has been collected. Trade receivables are due for settlement within three to seven days of the date of sale, after which they are interest bearing. Other receivables are unsecured and non-interest bearing.
As at December 31, 2017, there were $5,443,000 of impaired receivables that have been provided for in the balance sheet because they are over six months old, or specific situations where recovering the debt is considered unlikely (December 31, 2016: $6,581,000).
Consumption taxes receivable are deemed fully recoverable unless disputed by the relevant tax authority. The other classes within trade and other receivables do not contain impaired assets.
| 14. | Inventory |
At each period end, inventory is reviewed to ensure that it is recorded at the lower of cost and net realizable value. During the year ended December 31, 2017, the Company recorded an inventory write-down of $834,000 (2016: $3,084,000; 2015: $480,000).
Of inventory held at December 31, 2017, 99% is expected to be sold prior to the end of March 2018 with the remainder to be sold by the end of April 2018 (December 31, 2016: 93% sold by the end of March 2017 with the remainder sold by the end of June 2017).
| 15. | Advances against auction contracts |
Advances against auction contracts arise when the Company pays owners, in advance, a portion of the expected gross auction proceeds from the sale of the related assets at future auctions. The Company‘s policy is to limit the amount of advances to a percentage of the estimated gross auction proceeds from the sale of the related assets, and before advancing funds, require proof of owner‘s title to and equity in the assets, as well as receive delivery of the assets and title documents at a specified auction site, by a specified date and in a specified condition of repair.
Advances against auction contracts are generally secured by the assets to which they relate, as the Company requires owners to provide promissory notes and security instruments registering the Company as a charge against the asset. Advances against auction contracts are usually settled within two weeks of the date of sale, as they are netted against the associated auction proceeds payable to the owner.
| 16. | Prepaid expenses and deposits |
| As at December 31, | 2017 | 2016 | ||||||
| Prepaid expenses | $ | 17,736 | $ | 17,926 | ||||
| Refundable deposits | 1,954 | 1,079 | ||||||
| $ | 19,690 | $ | 19,005 | |||||
| Ritchie Bros. | 120 |
Notes to the Consolidated Financial Statements
(Tabular amounts expressed in thousands of United States dollars, except where noted)
| 17. | Assets held for sale |
| Balance, December 31, 2015 | $ | 629 | ||
| Reclassified from property, plant and equipment | 237 | |||
| Disposal | (242 | ) | ||
| Site preparation costs | 8 | |||
| Balance, December 31, 2016 | $ | 632 | ||
| Site preparation costs | 25 | |||
| Reclassified from property, plant and equipment | 411 | |||
| Disposal | (484 | ) | ||
| Balance, December 31, 2017 | $ | 584 |
As at December 31, 2017, the Company’s assets held for sale consisted of excess auction site acreage located in Denver and Kansas City, United States. Management made the strategic decision to sell this excess acreage to maximize the Company’s return on invested capital. The properties have been actively marketed for sale, and management expects the sales to be completed within 12 months of December 31, 2017. This land belongs to the A&M reportable segment.
During the year ended December 31, 2017, the Company sold excess auction site acreage in Orlando, United States, and Truro, Canada, for net proceeds of $1,084,000 resulting in net gains of $602,000 (2016: $493,000 gain related to the sale of property located in Denver, United States; 2015: $8,485,000 gain related to the sale of property in Edmonton, Canada, and London, Canada).
| 18. | Property, plant and equipment |
| As at December 31, 2017 | Cost | Accumulated depreciation | Net book value | |||||||||
| Land and improvements | $ | 379,546 | $ | (68,706 | ) | $ | 310,840 | |||||
| Buildings | 267,334 | (103,544 | ) | 163,790 | ||||||||
| Yard and automotive equipment | 58,209 | (38,126 | ) | 20,083 | ||||||||
| Computer software and equipment | 69,718 | (60,451 | ) | 9,267 | ||||||||
| Office equipment | 25,430 | (18,745 | ) | 6,685 | ||||||||
| Leasehold improvements | 21,467 | (15,090 | ) | 6,377 | ||||||||
| Assets under development | 9,539 | - | 9,539 | |||||||||
| $ | 831,243 | $ | (304,662 | ) | $ | 526,581 | ||||||
| Ritchie Bros. | 121 |
Notes to the Consolidated Financial Statements
(Tabular amounts expressed in thousands of United States dollars, except where noted)
| 18. | Property, plant and equipment (continued) |
| As at December 31, 2016 | Cost | Accumulated depreciation | Net book value | |||||||||
| Land and improvements | $ | 362,283 | $ | (60,576 | ) | $ | 301,707 | |||||
| Buildings | 256,168 | (91,323 | ) | 164,845 | ||||||||
| Yard and automotive equipment | 55,352 | (38,560 | ) | 16,792 | ||||||||
| Computer software and equipment | 66,265 | (57,624 | ) | 8,641 | ||||||||
| Office equipment | 22,963 | (16,706 | ) | 6,257 | ||||||||
| Leasehold improvements | 20,199 | (12,541 | ) | 7,658 | ||||||||
| Assets under development | 9,130 | - | 9,130 | |||||||||
| $ | 792,360 | $ | (277,330 | ) | $ | 515,030 | ||||||
During the year ended December 31, 2017, interest of $110,000 (2016: $95,000; 2015: $86,000) was capitalized to the cost of assets under development. These interest costs relating to qualifying assets are capitalized at a weighted average rate of 2.97% (2016: 3.99%; 2015: 6.27%).
Additions during the year include $8,820,000 (2016: $3,376,000; 2015: $943,000) of property, plant and equipment under capital leases.
| 19. | Other non-current assets |
| As at December 31, | 2017 | 2016 | ||||||
| Tax receivable (note 8) | $ | 12,851 | $ | 10,035 | ||||
| Deferred debt issue costs (note 25) | 3,768 | 6,182 | ||||||
| Other non-current assets | 7,527 | 4,027 | ||||||
| $ | 24,146 | $ | 20,244 | |||||
| 20. | Intangible assets |
| As at December 31, 2017 | Cost | Accumulated amortization | Net book value | |||||||||
| Trade names and trademarks | $ | 53,566 | $ | (461 | ) | $ | 53,105 | |||||
| Customer relationships | 125,234 | (9,487 | ) | 115,747 | ||||||||
| Software | 110,201 | (26,898 | ) | 83,303 | ||||||||
| Software under development | 8,939 | - | 8,939 | |||||||||
| $ | 297,940 | $ | (36,846 | ) | $ | 261,094 | ||||||
| Ritchie Bros. | 122 |
Notes to the Consolidated Financial Statements
(Tabular amounts expressed in thousands of United States dollars, except where noted)
| 20. | Intangible assets (continued) |
| As at December 31, 2016 | Cost | Accumulated amortization | Net book value | |||||||||
| Trade names and trademarks | $ | 5,585 | $ | (50 | ) | $ | 5,535 | |||||
| Customer relationships | 25,618 | (1,072 | ) | 24,546 | ||||||||
| Software | 36,566 | (13,116 | ) | 23,450 | ||||||||
| Software under development | 18,773 | - | 18,773 | |||||||||
| $ | 86,542 | $ | (14,238 | ) | $ | 72,304 | ||||||
During the year ended December 31, 2017, the Company recognized an impairment loss of $8,911,000 due to the impairment of certain software and software under development (2016: the Company recorded an impairment loss on the Equipment One customer relationships of $4,669,000; 2015: nil) (note 7).
At December 31, 2017, a net carrying amount of $59,380,000 (December 31, 2016: $22,665,000) included in intangible assets was not subject to amortization. During the year ended December 31, 2017, the cost of additions was reduced by $888,000 for recognition of tax credits (2016: $1,094,000; 2015: $1,678,000)
During the year ended December 31, 2017, interest of $281,000 (2016: $356,000; 2015: $772,000) was capitalized to the cost of software under development. These interest costs relating to qualifying assets are capitalized at a weighted average rate of 3.18% (2016: 4.91%; 2015: 6.39%).
During the year ended December 31, 2017, the weighted average amortization period for all classes of intangible assets was 7.9 years (2016: 8.2 years; 2015: 7.9 years).
As at December 31, 2017, estimated annual amortization expense for the next five years ended December 31 are as follows:
| 2018 | $ | 31,463 | ||
| 2019 | 29,535 | |||
| 2020 | 24,141 | |||
| 2021 | 21,285 | |||
| 2022 | 19,024 | |||
| $ | 125,448 |
21. Goodwill
| Balance, December 31, 2015 | $ | 91,234 | ||
| Additions (note 32) | 30,794 | |||
| Impairment loss (note 7) | (23,574 | ) | ||
| Foreign exchange movement | (917 | ) | ||
| Balance, December 31, 2016 | $ | 97,537 | ||
| Additions | 568,936 | |||
| Foreign exchange movement | 4,449 | |||
| Balance, December 31, 2017 | $ | 670,922 |
| Ritchie Bros. | 123 |
Notes to the Consolidated Financial Statements
(Tabular amounts expressed in thousands of United States dollars, except where noted)
| 22. | Equity-accounted investments |
The Company holds a 48% share interest in a group of companies detailed below (together, the Cura Classis entities), which have common ownership. The Cura Classis entities provide dedicated fleet management services in three jurisdictions to a common customer unrelated to the Company. The Company has determined the Cura Classis entities are variable interest entities and the Company is not the primary beneficiary, as it does not have the power to make any decisions that significantly affect the economic results of the Cura Classis entities. Accordingly, the Company accounts for its investments in the Cura Classis entities following the equity method.
A condensed summary of the Company's investments in and advances to equity-accounted investees are as follows (in thousands of United States dollars, except percentages):
| Ownership | December 31, | December 31, | ||||||||||
| percentage | 2017 | 2016 | ||||||||||
| Cura Classis entities | 48 | % | $ | 4,720 | $ | 4,594 | ||||||
| Other equity investments | 32 | % | 2,688 | 2,732 | ||||||||
| 7,408 | 7,326 | |||||||||||
As a result of the Company’s investments, the Company is exposed to risks associated with the results of operations of the Cura Classis entities. The Company has no other business relationships with the Cura Classis entities. The Company’s maximum risk of loss associated with these entities is the investment carrying amount.
| 23. | Trade and other payables |
| As at December 31, | 2017 | 2016 | ||||||
| Trade payables | $ | 77,575 | $ | 38,686 | ||||
| Accrued liabilities | 55,332 | 44,775 | ||||||
| Social security and sales taxes payable | 14,693 | 14,759 | ||||||
| Net consumption taxes payable | 10,559 | 12,631 | ||||||
| Share unit liabilities | 5,407 | 10,422 | ||||||
| Other payables | 987 | 3,421 | ||||||
| $ | 164,553 | $ | 124,694 | |||||
| 24. | Deferred compensation arrangement |
The Company established a non-qualified deferred compensation arrangement (the “Deferred Compensation Arrangement”) which is available to certain American employees. The Deferred Compensation Arrangement permits the deferral of up to 10% of base salary with the Company matching 100% of such contributions. Employees will receive the benefit, including a return on investment, on termination, retirement or other specified departures. The Company funds the deferred compensation obligations by investing in a non-qualified corporate owned life insurance policy (“COLI”), whereby funds are invested and the account balance fluctuates with the investment returns on those funds.
The expected benefit to be paid on termination of $2,419,000 (2016: $1,838,000) is presented in other non-current liabilities. The cash surrender value of the COLI asset of $2,649,000 (2016: $1,777,000) is classified within other non-current assets, with changes in the deferred compensation liability and COLI asset charged to SG&A expenses (note 6).
| Ritchie Bros. | 124 |
Notes to the Consolidated Financial Statements
(Tabular amounts expressed in thousands of United States dollars, except where noted)
| 25. | Debt |
| Carrying amount | ||||||||
| As at December 31, | 2017 | 2016 | ||||||
| Short-term debt | $ | 7,018 | $ | 23,912 | ||||
| Long-term debt: | ||||||||
| Revolving loans: | ||||||||
| Denominated in Canadian dollars, unsecured, bearing interest at a weighted average rate of 2.380%, due in monthly installments of interest only, with the committed, revolving credit facility available until October 2021 | - | 69,926 | ||||||
| Denominated in United States dollars, unsecured, bearing interest at a weighted average rate of 2.075%, due in monthly installments of interest only, with the committed, revolving credit facility available until October 2021 | - | 30,000 | ||||||
| Delayed draw term loan: | ||||||||
| Denominated in Canadian dollars, secured, bearing interest at a weighted average rate of 3.690%, due in monthly installments of interest only and quarterly installments of principal, with the committed credit facility, available until October 2021 | 185,143 | - | ||||||
| Denominated in United States dollars, secured, bearing interest at a weighted average rate of 3.662%, due in monthly installments of interest only and quarterly installments of principal, with the committed credit facility, available until October 2021 | 144,544 | - | ||||||
| Less: unamortized debt issue costs | (4,134 | ) | - | |||||
| Senior unsecured notes: | ||||||||
| Bearing interest at 5.375% due in semi-annual installments, with the full amount of principal due in January 2025 | 500,000 | 500,000 | ||||||
| Less: unamortized debt issue costs | (12,661 | ) | (4,220 | ) | ||||
| 812,892 | 595,706 | |||||||
| Total debt | $ | 819,910 | $ | 619,618 | ||||
| Long-term debt: | ||||||||
| Current portion | $ | 16,907 | $ | - | ||||
| Non-current portion | 795,985 | 595,706 | ||||||
| $ | 812,892 | $ | 595,706 | |||||
On October 27, 2016, the Company entered into a credit agreement (the “Credit Agreement”) with a syndicate of lenders, and Bank of America, N.A. (“BofA”), as administrative agent which provides the Company with:
| · | Multicurrency revolving facilities of up to $675,000,000 (the “Multicurrency Facilities”); |
| · | A delayed draw term loan facility of up to $325,000,000 (the “Delayed-Draw Facility); and together with the Multicurrency Facilities, the (“Syndicated Facilities”) and |
| · | At the Company’s election and subject to certain conditions, including receipt of related commitments, incremental term loan facilities and/or increases to the Multicurrency Facilities in an aggregate amount of up to $50,000,000. |
| Ritchie Bros. | 125 |
Notes to the Consolidated Financial Statements
(Tabular amounts expressed in thousands of United States dollars, except where noted)
| 25. | Debt (continued) |
The Company may use the proceeds from the Multicurrency Facilities for general corporate purposes. The amount available pursuant to the Delayed-Draw Facility was only available to finance the acquisition of IronPlanet and will not be available for other corporate purposes upon repayment of amounts borrowed under that facility. On May 31, 2017, the Company borrowed $325,000,000 under the Delayed-Draw Facility to finance the acquisition of IronPlanet. The Delayed-Draw Facility amortizes in equal quarterly installments in an annual amount of 5% for the first two years and 10% in the third through fifth years, with the balance payable at maturity. Upon the closing of the acquisition the Syndicated Facilities became secured by the assets of the Company and certain of its subsidiaries in Canada and the United States. The Syndicated Facilities may become unsecured again, subject to the Company meeting specified credit rating or leverage ratio conditions.
The Company has incurred debt issue costs of $9,682,000 in connection with the Syndicated Facilities, of which $4,731,000 was allocated to the Multicurrency Facilities and $4,951,000 was allocated to the Delayed-Draw Facility. As the former allocation is not related to specific draws, the costs have been capitalized as other non-current assets and are being amortized over the term of the Syndicated Facilities. For the later allocation, the costs have been capitalized and reduce the carrying value of the delayed draw term loans to which they relate. At December 31, 2017, the Company had unamortized deferred debt issue costs relating to the Multicurrency Facilities of $3,768,000 (December 31, 2016: $6,182,000 relating to the Syndicated Facilities) and unamortized deferred debt issue costs of $4,134,000 relating to the delayed draw term loans.
On December 21, 2016, the Company completed the offering of $500,000,000 aggregate principal amount of 5.375% senior unsecured notes due January 15, 2025 (the “Notes”). Interest on the Notes is payable semi-annually. The proceeds from the offering were held in escrow until completion of the acquisition of IronPlanet. On May 31, 2017, the funds were released from escrow to finance the acquisition of IronPlanet. The Notes are jointly and severally guaranteed on an unsecured basis, subject to certain exceptions, by each of the Company’s subsidiaries that is a borrower or guarantees indebtedness under the Credit Agreement. IronPlanet and certain of its subsidiaries were added as additional guarantors in connection with the acquisition of IronPlanet.
The Company has incurred debt issue costs of $13,945,000 in connection with the offering of the Notes. At December 31, 2017, the Company had unamortized deferred debt issue costs relating to the Notes of $12,661,000 (December 31, 2016: $4,220,000)
Short-term debt at December 31, 2017 is comprised of drawings in different currencies on the Company’s committed revolving credit facilities and have a weighted average interest rate of 2.7% (December 31, 2016: 2.2%).
As at December 31, 2017, principal repayments for the remaining period to the contractual maturity dates are as follows:
| Face value | ||||
| 2018 | $ | 16,907 | ||
| 2019 | 25,360 | |||
| 2020 | 33,814 | |||
| 2021 | 253,606 | |||
| 2022 | - | |||
| Thereafter | 500,000 | |||
| $ | 829,687 | |||
As at December 31, 2017, the Company had available committed revolving credit facilities aggregating $646,991,000 of which $637,806,000 is available until October 27, 2021.
| Ritchie Bros. | 126 |
Notes to the Consolidated Financial Statements
(Tabular amounts expressed in thousands of United States dollars, except where noted)
| 26. | Other non-current liabilities |
| As at December 31, | 2017 | 2016 | ||||||
| Tax payable (note 8) | $ | 25,958 | $ | 19,262 | ||||
| Finance lease obligation - non-current | 7,875 | 3,284 | ||||||
| Share unit liabilities | 2,865 | 4,243 | ||||||
| Other non-current liabilities | 10,075 | 11,299 | ||||||
| $ | 46,773 | $ | 38,088 | |||||
| 27. | Equity and dividends |
Share capital
Preferred stock
Unlimited number of senior preferred shares, without par value, issuable in series.
Unlimited number of junior preferred shares, without par value, issuable in series.
All issued shares are fully paid. No preferred shares have been issued.
Share repurchase
In the year ended December 31, 2017, there were no common shares repurchased. In 2016 1,460,000 common shares were repurchased at a weighted average (“WA”) share price of $25.16 per common share. The repurchased shares were cancelled on March 15, 2016.
Dividends
Declared and paid
The Company declared and paid the following dividends during the years ended December 31, 2017, 2016, and 2015:
| Declaration date | Dividend per share | Record date | Total dividends | Payment date | ||||||||||
| Year ended December 31, 2017: | ||||||||||||||
| Fourth quarter 2016 | January 23, 2017 | $ | 0.1700 | February 10, 2017 | $ | 18,160 | March 3, 2017 | |||||||
| First quarter 2017 | May 4, 2017 | 0.1700 | May 23, 2017 | 18,188 | June 13, 2017 | |||||||||
| Second quarter 2017 | August 4, 2017 | 0.1700 | August 25, 2017 | 18,210 | September 15, 2017 | |||||||||
| Third quarter 2017 | November 8, 2017 | 0.1700 | November 29, 2017 | 18,227 | December 20, 2017 | |||||||||
| Year ended December 31, 2016: | ||||||||||||||
| Fourth quarter 2015 | January 15, 2016 | $ | 0.1600 | February 12, 2016 | $ | 17,154 | March 4, 2016 | |||||||
| First quarter 2016 | May 9, 2016 | 0.1600 | May 24, 2016 | 17,022 | June 14, 2016 | |||||||||
| Second quarter 2016 | August 5, 2016 | 0.1700 | September 2, 2016 | 18,127 | September 23, 2016 | |||||||||
| Third quarter 2016 | November 8, 2016 | 0.1700 | November 28, 2016 | 18,156 | December 19, 2016 | |||||||||
| Year ended December 31, 2015: | ||||||||||||||
| Fourth quarter 2014 | January 12, 2015 | $ | 0.1400 | February 13, 2015 | $ | 15,089 | March 6, 2015 | |||||||
| First quarter 2015 | May 7, 2015 | 0.1400 | May 29, 2015 | 14,955 | June 19, 2015 | |||||||||
| Second quarter 2015 | August 6, 2015 | 0.1600 | September 4, 2015 | 17,147 | September 25, 2015 | |||||||||
| Third quarter 2015 | November 5, 2015 | 0.1600 | November 27, 2015 | 17,149 | December 18, 2015 | |||||||||
| Ritchie Bros. | 127 |
Notes to the Consolidated Financial Statements
(Tabular amounts expressed in thousands of United States dollars, except where noted)
| 27. | Equity and dividends (continued) |
Declared and undistributed
In addition to the above dividends, since the end of the year the Directors have recommended the payment of a final dividend of $0.17 cents per common share, accumulating to a total dividend of $18,246,000. The aggregate amount of the proposed final dividend is expected to be paid out of retained earnings on March 9, 2018 to stockholders of record on February 16, 2018. This dividend payable has not been recognized as a liability in the financial statements. The payment of this dividend will not have any tax consequence for the Company.
28. Share-based payments
Share-based payments consist of the following compensation costs:
| Year ended December 31, | 2017 | 2016 | 2015 | |||||||||
| Stock option compensation expense: | ||||||||||||
| SG&A expenses | $ | 8,948 | $ | 5,507 | $ | 4,001 | ||||||
| Acquisition-related costs | 4,752 | - | - | |||||||||
| Share unit expense: | ||||||||||||
| Equity-classified share units | 3,529 | 1,981 | - | |||||||||
| Liability-classified share units | 670 | 10,512 | 5,673 | |||||||||
| Employee share purchase plan - | ||||||||||||
| employer contributions | 1,813 | 1,597 | 1,332 | |||||||||
| $ | 19,712 | $ | 19,597 | $ | 11,006 | |||||||
Share unit expense and employer contributions to the employee share purchase plan are recognized in SG&A expenses.
Stock option plans
The Company has three stock option plans that provide for the award of stock options to selected employees, directors and officers of the Company: a) Amended and Restated Stock Option Plan, b) IronPlanet 1999 Stock Plan, and c) IronPlanet 2015 Stock Plan. The IronPlanet 1999 Stock Plan and IronPlanet 2015 Stock Plan were assumed by the Company as part of the acquisition of IronPlanet (note 32).
Stock options are granted with an exercise price equal to the fair market value of the Company‘s common shares at the grant date, with vesting periods ranging from immediate to five years and terms not exceeding 10 years. At December 31, 2017, there were 3,402,481 (December 31, 2016: 4,202,631) shares authorized and available for grants of options under the stock option plans.
| Ritchie Bros. | 128 |
Notes to the Consolidated Financial Statements
(Tabular amounts expressed in thousands of United States dollars, except where noted)
| 28. | Share-based payments (continued) |
Stock option plans (continued)
Stock option activity for the years ended December 31, 2017, 2016, and 2015 is presented below:
| WA | ||||||||||||||||
| Common | WA | remaining | Aggregate | |||||||||||||
| shares under | exercise | contractual | intrinsic | |||||||||||||
| option | price | life (in years) | value | |||||||||||||
| Outstanding, December 31, 2014 | 3,897,791 | 22.09 | ||||||||||||||
| Granted | 880,706 | 25.50 | ||||||||||||||
| Exercised | (1,412,535 | ) | 21.11 | $ | 9,426 | |||||||||||
| Forfeited | (89,884 | ) | 23.10 | |||||||||||||
| Outstanding, December 31, 2015 | 3,276,078 | 23.40 | ||||||||||||||
| Granted | 1,268,101 | 24.34 | ||||||||||||||
| Exercised | (1,081,531 | ) | 22.50 | $ | 9,380 | |||||||||||
| Forfeited | (95,934 | ) | 24.32 | |||||||||||||
| Outstanding, December 31, 2016 | 3,366,714 | $ | 24.02 | |||||||||||||
| Granted | 970,947 | 31.07 | ||||||||||||||
| Assumed in acquisition (note 32) | 737,358 | 14.26 | ||||||||||||||
| Exercised | (444,571 | ) | 22.35 | $ | 3,762 | |||||||||||
| Forfeited | (170,704 | ) | 19.38 | |||||||||||||
| Outstanding, December 31, 2017 | 4,459,744 | $ | 24.29 | 7.5 | $ | 17,649 | ||||||||||
| Exercisable, December 31, 2017 | 1,918,220 | $ | 23.02 | 6.2 | $ | 10,894 | ||||||||||
The options outstanding at December 31, 2017 expire on dates ranging to November 16, 2027. The WA share price of options exercised during the year ended December 31, 2017 was $30.81 (2016: $31.18; 2015: $27.78). The WA grant date fair value of options granted during the year ended December 31, 2017 was $7.22 per option (2016: $4.72; 2015: $5.39).
The compensation expense arising from option grants is amortized over the relevant vesting periods of the underlying options. As at December 31, 2017, the unrecognized stock-based compensation cost related to the non-vested stock options was $6,610,000, which is expected to be recognized over a weighted average period of 2.2 years. Cash received from stock-based award exercises for the year ended December 31, 2017 was $9,935,000 (2016: $24,338,000; 2015: $29,816,000). The actual tax benefit realized for the tax deductions from option exercise of the share based payment arrangements totaled $1,017,000 for the year ended December 31, 2017 (2016: $1,464,000; 2015: $1,150,000).
| Ritchie Bros. | 129 |
Notes to the Consolidated Financial Statements
(Tabular amounts expressed in thousands of United States dollars, except where noted)
| 28. | Share-based payments (continued) |
Stock option plans (continued)
The fair value of the stock option grants was estimated on the date of the grant using the Black-Scholes option pricing model. The significant assumptions used to estimate the fair value of stock options granted during the years ended December 31, 2017, 2016, and 2015 are presented in the following table on a weighted average basis:
| Year ended December 31, | 2017 | 2016 | 2015 | |||||||||
| Risk free interest rate | 2.0 | % | 1.2 | % | 1.8 | % | ||||||
| Expected dividend yield | 2.15 | % | 2.66 | % | 2.18 | % | ||||||
| Expected lives of the stock options | 5 years | 5 years | 5 years | |||||||||
| Expected volatility | 27.8 | % | 26.5 | % | 26.4 | % | ||||||
The fair value of the assumed stock options is estimated on the IronPlanet acquisition date using the Black-Scholes option pricing model. The weighted average fair value of the assumed options was $16.93. The significant assumptions used to estimate the fair value of these assumed stock options are presented in the following table on a weighted average basis:
| Year ended December 31, | 2017 | |||
| Risk free interest rate | 0.8 | % | ||
| Expected dividend yield | 2.19 | % | ||
| Expected lives of the stock options | 0.4 years | |||
| Expected volatility | 32.1 | % | ||
| Ritchie Bros. | 130 |
Notes to the Consolidated Financial Statements
(Tabular amounts expressed in thousands of United States dollars, except where noted)
| 28. | Share-based payments (continued) |
Share unit plans
Share unit activity for the years ended December 31, 2017, 2016, and 2015 is presented below:
| Equity-classified awards | Liability-classified awards | |||||||||||||||||||||||||||||||||||||||
| PSUs | RSUs | PSUs (1) | RSUs | DSUs | ||||||||||||||||||||||||||||||||||||
| WA grant | WA grant | WA grant | WA grant | WA grant | ||||||||||||||||||||||||||||||||||||
| date fair | date fair | date fair | date fair | date fair | ||||||||||||||||||||||||||||||||||||
| Number | value | Number | value | Number | value | Number | value | Number | value | |||||||||||||||||||||||||||||||
| Outstanding, December 31, 2014 | - | $ | - | - | $ | - | 238,573 | $ | 23.38 | 403,587 | $ | 22.32 | 42,289 | $ | 22.33 | |||||||||||||||||||||||||
| Granted | - | - | - | - | 218,699 | 24.57 | 20,528 | 26.38 | 29,072 | 26.07 | ||||||||||||||||||||||||||||||
| Vested and settled | - | - | - | - | (6,870 | ) | 22.22 | (28,887 | ) | 22.53 | (13,365 | ) | 22.34 | |||||||||||||||||||||||||||
| Forfeited | - | - | - | - | (28,817 | ) | 23.23 | (62,274 | ) | 21.56 | - | - | ||||||||||||||||||||||||||||
| Outstanding, December 31, 2015 | - | $ | - | - | $ | - | 421,585 | $ | 24.03 | 332,954 | $ | 22.70 | 57,996 | $ | 24.21 | |||||||||||||||||||||||||
| Granted | 7,714 | 31.40 | - | - | 257,117 | 23.32 | 4,543 | 29.33 | 17,371 | 29.41 | ||||||||||||||||||||||||||||||
| Transferred to (from) equity awards on modification | 257,934 | 27.34 | - | - | (257,934 | ) | 23.86 | - | - | - | - | |||||||||||||||||||||||||||||
| Vested and settled | - | - | - | - | (68,683 | ) | 23.08 | (162,306 | ) | 22.23 | (1,847 | ) | 25.28 | |||||||||||||||||||||||||||
| Forfeited | (21,680 | ) | 27.43 | - | - | (40,756 | ) | 22.75 | (15,182 | ) | 22.68 | - | - | |||||||||||||||||||||||||||
| Outstanding, December 31, 2016 | 243,968 | $ | 27.48 | - | $ | - | 311,329 | $ | 23.96 | 160,009 | $ | 23.37 | 73,520 | $ | 25.41 | |||||||||||||||||||||||||
| Granted | 136,073 | 30.28 | 125,152 | 26.93 | 98,775 | 31.21 | 878 | 32.30 | 19,967 | 29.67 | ||||||||||||||||||||||||||||||
| Transferred to (from) equity awards on modification | 81,533 | 24.47 | - | - | (81,533 | ) | 24.66 | - | - | - | - | |||||||||||||||||||||||||||||
| Vested and settled | (27,326 | ) | 26.82 | - | - | (49,873 | ) | 23.64 | (156,221 | ) | 23.33 | - | - | |||||||||||||||||||||||||||
| Forfeited | - | - | - | - | (19,457 | ) | 26.39 | - | - | - | - | |||||||||||||||||||||||||||||
| Outstanding, December 31, 2017 | 434,248 | $ | 27.83 | 125,152 | $ | 26.93 | 259,241 | $ | 26.38 | 4,666 | $ | 26.42 | 93,487 | $ | 26.32 | |||||||||||||||||||||||||
| (1) | Liability-classified PSUs include PSUs awarded under the employee PSU plan and the previous 2013 PSU plan, in place prior to 2015, that are cash-settled and not subject to market vesting conditions. |
The total market value of share units vested and released during the year ended December 31, 2017 was $6,521,000 (2016: $4,463,000; 2015: $1,253,000). As at December 31, 2017, the Company had a total share unit liability of $8,274,000 (December 31, 2016: $14,665,000) in respect of share units under the PSU, RSU, and DSU plans described herein. The compensation expense arising from share unit grants is amortized over the relevant vesting periods of the underlying units.
Senior executive and employee PSU plans
The Company grants PSUs under a senior executive PSU plan and an employee PSU plan (the “PSU Plans”). Under the PSU Plans, the number of PSUs that vest is conditional upon specified market, service, and performance vesting conditions being met.
The market vesting condition is based on the relative performance of the Company’s share price in comparison to the performance of a pre-determined portfolio of other companies’ share prices. The non-market vesting conditions are based on the achievement of specific performance measures and can result in participants earning between 0% and 200% of the target number of PSUs granted.
| Ritchie Bros. | 131 |
Notes to the Consolidated Financial Statements
(Tabular amounts expressed in thousands of United States dollars, except where noted)
| 28. | Share-based payments (continued) |
Share unit plans (continued)
Senior executive and employee PSU plans (continued)
Prior to May 2, 2016, the Company was only able to settle the PSU awards under the PSU Plans in cash, and as such, both new plans were classified as liability awards. On May 2, 2016 (the “modification date”), the shareholders approved amendments to the PSU Plans, allowing the Company to choose whether to settle the awards in cash or in shares. With respect to settling in shares, the Company has the option to either (i) arrange for the purchase shares on the open market on the employee’s behalf based on the cash value that otherwise would be delivered, or (ii) to issue a number of shares equal to the number of units that vest.
Under the first option, the shareholders authorized an unlimited number of open-market purchases of common shares for settlement of the PSUs. Under the second option, the shareholders authorized 1,000,000 shares to be issued for settlement of the PSUs.
On the modification date, the employee PSU plan remained classified as a liability and the senior executive PSU plan awards were reclassified to equity awards, based on the Company’s settlement intentions for each plan which remain unchanged at December 31, 2017. The fair value of the senior executive awards outstanding on the modification date was $27.34. The share unit liability, representing the portion of the fair value attributable to past service, was $2,105,000, which was reclassified to equity on that date. No incremental compensation was recognized as a result of the modification. Unrecognized compensation expense based on the fair value of the senior executive PSU awards on the modification date will be amortized over the remaining service period.
Because the PSUs awarded under the PSU Plans are contingently redeemable in cash in the event of death of the participant, on the modification date, the Company reclassified $2,175,000 to temporary equity, representing the portion of the contingent redemption amount of the senior executive PSU awards as if redeemable on May 2, 2016, to the extent attributable to prior service.
PSUs awarded under the PSU Plans are subject to market vesting conditions. The fair value of the liability-classified PSUs awarded under the employee PSU plan is estimated on the date of grant and at each reporting date using a binomial model.
The significant assumptions used to estimate the fair value of the liability-classified PSUs awarded under the employee PSU plan during 2017 and 2016 are presented in the following table on a weighted average basis:
| Year ended December 31, | 2017 | 2016 | 2015 | |||||||||
| Risk free interest rate | 1.5 | % | 1.2 | % | 1.3 | % | ||||||
| Expected dividend yield | 2.01 | % | 2.40 | % | 2.17 | % | ||||||
| Expected lives of the PSUs | 3 years | 3 years | 3 years | |||||||||
| Expected volatility | 28.9 | % | 29.7 | % | 24.4 | % | ||||||
| Average expected volatility of comparable companies | 33.4 | % | 37.0 | % | 32.8 | % | ||||||
Risk free interest rate is estimated using Bloomberg’s United States dollar Swap Rate as of the valuation date. Expected dividend yield assumes a continuation of the most recent quarterly dividend payments. Given the limited historical information available for the PSUs, the Company estimated the expected life of PSUs with reference to the expected life of stock options. Stock options have five-year expected lives, whereas PSUs vest after three years. As such, the Company estimates the expected life of the PSUs to equal the three-year vesting period. Expected volatility is estimated from Bloomberg’s volatility surface of the common shares as of the valuation date. The unrecognized share unit expense related to liability-classified PSUs was $3,163,000, which is expected to be recognized over a weighted average period of 1.6 years.
| Ritchie Bros. | 132 |
Notes to the Consolidated Financial Statements
(Tabular amounts expressed in thousands of United States dollars, except where noted)
| 28. | Share-based payments (continued) |
Share unit plans (continued)
Senior executive and employee PSU plans (continued)
The fair value of the equity-classified PSUs awarded under the senior executive PSU plan is estimated on modification date and on the date of grant using a binomial model. The significant assumptions used to estimate the fair value of the equity-classified PSUs awarded under the senior executive PSU plan during 2017 and 2016 are presented in the following table on a weighted average basis:
| Year ended December 31, | 2017 | 2016 | ||||||
| Risk free interest rate | 1.4 | % | 1.2 | % | ||||
| Expected dividend yield | 1.92 | % | 2.50 | % | ||||
| Expected lives of the PSUs | 3 years | 3 years | ||||||
| Expected volatility | 28.2 | % | 29.9 | % | ||||
| Average expected volatility of comparable companies | 37.0 | % | 37.0 | % | ||||
As at December 31, 2017, the unrecognized share unit expense related to equity-classified PSUs was $5,280,000, which is expected to be recognized over a weighted average period of 1.7 years.
Sign-on grant PSUs
On August 11, 2014, the Company awarded 102,375 one-time sign-on grant PSUs (the “SOG PSUs”). The SOG PSUs were cash-settled and subject to market vesting conditions related to the Company’s share performance over rolling two, three, four, and five-year periods.
Prior to May 1, 2017, the Company was only able to settle the SOG PSU award in cash, and as such, the plan was classified as a liability award. On May 1, 2017 (the “SOG modification date”), the shareholders approved amendments to the SOG PSU grant, allowing the Company to choose whether to settle the award in cash or in shares. With respect to settling in shares, the new settlement options allow the Company to issue a number of shares equal to the number of units that vest. The shareholders authorized 150,000 shares to be issued for settlement of the PSUs.
On the SOG modification date, the SOG PSU award was reclassified to equity award, based on the Company’s settlement intentions. The weighted average fair value of the SOG PSU award outstanding on the modification date was $24.47. The share unit liability, representing the portion of the fair value attributable to past service, was $1,421,000, which was reclassified to equity on that date. No incremental compensation was recognized as a result of the modification. Unrecognized compensation expense based on the fair value of the SOG PSU award on the modification date will be amortized over the remaining service period.
Because the PSUs awarded under the new plans are contingently redeemable in cash in the event of death of the participant, on the SOG modification date, the Company reclassified $1,803,000 to temporary equity, representing the portion of the contingent redemption amount of the SOG PSUs as if redeemable on May 1, 2017, to the extent attributable to prior service.
| Ritchie Bros. | 133 |
Notes to the Consolidated Financial Statements
(Tabular amounts expressed in thousands of United States dollars, except where noted)
| 28. | Share-based payments (continued) |
Share unit plans (continued)
Sign-on grant PSUs (continued)
The fair value of the equity-classified SOG PSUs is estimated on SOG modification date and on the date of grant using a binomial model. The significant assumptions used to estimate the fair value of the equity-classified PSUs for the year ended December 31, 2017 are presented in the following table on a weighted average basis:
| Year ended December 31, | 2017 | |||
| Risk free interest rate | 1.6 | % | ||
| Expected dividend yield | 2.54 | % | ||
| Expected lives of the PSU | 4 years | |||
| Expected volatility | 28.6 | % | ||
RSUs and DSUs
The Company has RSU and DSU plans that were cash-settled and not subject to market vesting conditions.
Prior to November 8, 2017, the Company was only able to settle the RSU awards in cash, and as such, the RSUs were classified as liability awards, which are fair valued on grant date and at each reporting date using the 20-day volume weighted average price of the Company’s common shares listed on the New York Stock Exchange. On November 8, 2017 (the “RSU modification date”), the Board of Directors approved amendments to the RSU plans, allowing the Company to choose whether to settle the awards in cash or in shares for new RSUs granted after the RSU modification date. With respect to settling in shares, the Company has the option to either (i) arrange for the purchase shares on the open market on the employee’s behalf based on the cash value that otherwise would be delivered, or (ii) to issue a number of shares equal to the number of units that vest, net of any applicable withholding, if any. The Company has registered 300,000 shares to be issued for settlement of the RSUs which will be proposed for shareholder approval at the next annual general meeting. As at December 31, 2017, the unrecognized share unit expense related to equity-classified RSUs was $2,980,000, which is expected to be recognized over a weighted average period of 2.9 years, and the unrecognized share unit expense related to liability-classified RSUs was $37,000, which is expected to be recognized over a weighted average period of 0.8 years.
Fair values of DSUs are estimated on grant date and at each reporting date using the 20-day volume weighted average price of the Company’s common shares listed on the New York Stock Exchange. DSUs are granted under the DSU plan to members of the Board of Directors. There is no unrecognized share unit expense related to liability-classified DSUs as they vest immediately and are expensed upon grant.
Employee share purchase plan
The Company has an employee share purchase plan that allows all employees that have completed one year of service to contribute funds to purchase common shares at the current market value at the time of share purchase. Employees may contribute up to 4% of their salary. The Company will match between 50% and 100% of the employee‘s contributions, depending on the employee‘s length of service with the Company.
| Ritchie Bros. | 134 |
Notes to the Consolidated Financial Statements
(Tabular amounts expressed in thousands of United States dollars, except where noted)
| 29. | Commitments |
Commitments for expenditures
As at December 31, 2017, the Company had committed to, but not yet incurred, $1,612,000 in capital expenditures for property, plant and equipment and intangible assets (December 31, 2016: $3,197,000).
Operating lease commitments – the Company as lessee
The Company has entered into commercial leases for various auction sites and offices located in North America, Central America, Europe, the Middle East and Asia. The majority of these leases are non-cancellable. The Company also has further operating leases for computer equipment, certain motor vehicles and small office equipment where it is not in the best interest of the Company to purchase these assets.
The majority of the Company‘s operating leases have a fixed term with a remaining life between one month and 20 years with renewal options included in the contracts. The leases have varying contract terms, escalation clauses and renewal rights. There are no restrictions placed upon the lessee by entering into these leases, other than restrictions on use of property, sub-letting and alterations. In certain leases there are options to purchase; if the intention to take this option changes subsequent to the commencement of the lease, the Company re-assesses the classification of the lease as operating.
The future aggregate minimum lease payments under non-cancellable operating leases, excluding reimbursed costs to the lessor, are as follows:
| 2018 | $ | 14,763 | ||
| 2019 | 12,309 | |||
| 2020 | 9,604 | |||
| 2021 | 7,422 | |||
| 2022 | 5,838 | |||
| Thereafter | 47,818 | |||
| $ | 97,754 |
As at December 31, 2017, the total future minimum sublease payments expected to be received under non-cancellable subleases is $1,936,000 (2016: $577,000; 2015 $1,077,000). The lease expenditure charged to earnings during the year ended December 31, 2017 was $21,956,000 (2016: $20,075,000; 2015: $17,367,000).
Capital lease commitments – the Company as lessee
The Company has entered into capital lease arrangements for computer and yard equipment. The majority of the leases have a fixed term with a remaining life of one month to four years with renewal options included in the contracts. In certain of these leases, the Company has the option to purchase the leased asset at fair market value or a stated residual value at the end of the lease term.
| Ritchie Bros. | 135 |
Notes to the Consolidated Financial Statements
(Tabular amounts expressed in thousands of United States dollars, except where noted)
| 29. | Commitments (continued) |
Capital lease commitments – the Company as lessee (continued)
As at December 31, 2017, the net carrying amount of computer and yard equipment under capital leases is $10,692,000 (December 31, 2016: $3,968,000), and is included in the total property, plant and equipment as disclosed on the consolidated balance sheets.
The future aggregate minimum lease payments under non-cancellable finance leases are as follows:
| 2018 | $ | 3,463 | ||
| 2019 | 3,371 | |||
| 2020 | 2,407 | |||
| 2021 | 1,469 | |||
| 2022 | 595 | |||
| Thereafter | - | |||
| $ | 11,305 |
Assets recorded under capital leases are as follows:
| As at December 31, 2017 | Cost | Accumulated depreciation | Net book value | |||||||||
| Computer equipment | $ | 8,699 | $ | (3,604 | ) | $ | 5,095 | |||||
| Yard and auto equipment | 6,493 | (896 | ) | 5,597 | ||||||||
| $ | 15,192 | $ | (4,500 | ) | $ | 10,692 | ||||||
| As at December 31, 2016 | Cost | Accumulated depreciation | Net book value | |||||||||
| Computer equipment | $ | 8,511 | $ | (4,990 | ) | $ | 3,521 | |||||
| Yard and auto equipment | 589 | (142 | ) | 447 | ||||||||
| $ | 9,100 | $ | (5,132 | ) | $ | 3,968 | ||||||
| 30. | Contingencies |
Legal and other claims
The Company is subject to legal and other claims that arise in the ordinary course of its business. Management does not believe that the results of these claims will have a material effect on the Company’s consolidated balance sheet or consolidated income statement.
Guarantee contracts
In the normal course of business, the Company will in certain situations guarantee to a consignor a minimum level of proceeds in connection with the sale at auction of that consignor’s equipment.
At December 31, 2017 there were $12,319,000 of government assets guaranteed under contract, of which 100% is expected to be sold prior to the end of December 31, 2018 (December 31, 2016: $nil).
| Ritchie Bros. | 136 |
Notes to the Consolidated Financial Statements
(Tabular amounts expressed in thousands of United States dollars, except where noted)
| 30. | Contingencies (continued) |
At December 31, 2017 there were $11,756,000 of industrial assets guaranteed under contract, of which 100% is expected to be sold prior to the end of April 2018 (December 31, 2016: $3,813,000 of which 100% was expected to be sold prior to the end of March 2017).
At December 31, 2017 there were $6,873,000 of agricultural assets guaranteed under contract, of which 100% is expected to be sold prior to the end of April 2018 (December 31, 2016: $11,415,000 of which 100% was expected to be sold prior to the end of July 2017).
The outstanding guarantee amounts are undiscounted and before estimated proceeds from sale at auction.
| 31. | Selected quarterly financial data (unaudited) |
The following is a summary of selected quarterly financial information (unaudited):
| Attributable to stockholders | ||||||||||||||||||||||||
| Operating | Net | Net | Earnings per share | |||||||||||||||||||||
| 2017 | Revenues | income | income | income | Basic | Diluted | ||||||||||||||||||
| First quarter | $ | 124,499 | $ | 23,597 | $ | 10,433 | $ | 10,377 | $ | 0.10 | $ | 0.10 | ||||||||||||
| Second quarter | 166,186 | 26,888 | 17,713 | 17,635 | 0.16 | 0.16 | ||||||||||||||||||
| Third quarter | 141,047 | 16,931 | 10,323 | 10,261 | 0.10 | 0.09 | ||||||||||||||||||
| Fourth quarter | 178,785 | 40,038 | 36,837 | 36,754 | 0.34 | 0.34 | ||||||||||||||||||
| Net | Attributable to stockholders | |||||||||||||||||||||||
| Operating | income | Net income | Earnings (loss) per share | |||||||||||||||||||||
| 2016 | Revenues | income | (loss) | (loss) | Basic | Diluted | ||||||||||||||||||
| First quarter | $ | 131,945 | $ | 39,174 | $ | 29,994 | $ | 29,406 | $ | 0.28 | $ | 0.27 | ||||||||||||
| Second quarter | 158,805 | 53,635 | 40,591 | 39,710 | 0.37 | 0.37 | ||||||||||||||||||
| Third quarter | 128,876 | 2,285 | (5,000 | ) | (5,137 | ) | (0.05 | ) | (0.05 | ) | ||||||||||||||
| Fourth quarter | 146,769 | 40,628 | 27,927 | 27,853 | 0.26 | 0.26 | ||||||||||||||||||
| Attributable to stockholders | ||||||||||||||||||||||||
| Operating | Net | Net | Earnings per share | |||||||||||||||||||||
| 2015 | Revenues | income | income | income | Basic | Diluted | ||||||||||||||||||
| First quarter | $ | 115,618 | $ | 33,019 | $ | 24,110 | $ | 23,777 | $ | 0.22 | $ | 0.22 | ||||||||||||
| Second quarter | 155,477 | 62,795 | 45,846 | 45,083 | 0.42 | 0.42 | ||||||||||||||||||
| Third quarter | 109,318 | 28,602 | 21,247 | 20,825 | 0.19 | 0.19 | ||||||||||||||||||
| Fourth quarter | 135,462 | 50,424 | 47,372 | 46,529 | 0.43 | 0.43 | ||||||||||||||||||
| Ritchie Bros. | 137 |
Notes to the Consolidated Financial Statements
(Tabular amounts expressed in thousands of United States dollars, except where noted)
| 32. | Business combinations |
| (a) | IronPlanet acquisition |
On May 31, 2017 (the “IronPlanet Acquisition Date”), the Company acquired 100% of the issued and outstanding shares of IronPlanet for a total fair value consideration of $776,474,000. On the acquisition date, cash consideration of $772,706,000 was paid to the former shareholders, vested option holders and warrant holders of IronPlanet. In addition to the cash consideration, non-cash consideration of $2,330,000 was issued attributable to the assumption of outstanding IronPlanet options, $1,771,000 was paid in cash related to customary closing adjustments, and $333,000 was related to settlement of intercompany payable transactions.
A summary of the net cash flows and purchase price are detailed below:
| May 31, 2017 | ||||
| Cash consideration paid to former equity holders | $ | 723,810 | ||
| Settlement of IronPlanet's debt | 36,313 | |||
| Settlement of IronPlanet's transaction costs | 12,583 | |||
| Cash consideration paid on closing | 772,706 | |||
| Cash consideration paid related to closing adjustments | 1,771 | |||
| Less: cash and cash equivalents acquired | (95,626 | ) | ||
| Less: restricted cash acquired | (3,000 | ) | ||
| Acquisition of IronPlanet, net of cash acquired | $ | 675,851 | ||
| Cash consideration paid on closing | $ | 772,706 | ||
| Replacement stock option awards attributable to pre- combination services | 4,926 | |||
| Stock option compensation expense from accelerated vesting of awards attributable to post-combination services | (2,596) | |||
| Cash consideration paid relating to closing adjustments | 1,771 | |||
| Settlement of pre-existing intercompany balances | (333 | ) | ||
| Purchase price | $ | 776,474 | ||
As part of the acquisition of IronPlanet, the Company assumed IronPlanet’s existing 1999 Stock Plan and 2015 Stock Plan, under the same terms and conditions. The fair value of IronPlanet’s stock options at the date of acquisition was determined using the Black-Scholes pricing model. Of the total fair value, $51,678,000 has been attributed as pre-combination service and included as part of the total acquisition consideration. The post-combination attribution of $10,154,000 is made up of two components, 1) $4,752,000 related to acceleration of options upon closing of the transaction, which was immediately recognized in acquisition-related costs, and 2) $5,402,000 related to the remaining unvested options, which will be recognized as compensation expense over the vesting period.
IronPlanet is a leading online marketplace for selling and buying used equipment and other durable assets and an innovative participant in the multi–billion dollar used equipment market. The acquisition expands the breadth and depth of equipment disposition and management solutions the Company can offer its customers.
The acquisition was accounted for in accordance with ASC 805, Business Combinations. The assets acquired and liabilities assumed were recorded at their estimated fair values at the IronPlanet Acquisition Date. Goodwill of $568,561,000 was calculated as the fair value of consideration over the estimated fair value of the net assets acquired.
| Ritchie Bros. | 138 |
Notes to the Consolidated Financial Statements
(Tabular amounts expressed in thousands of United States dollars, except where noted)
| 32. | Business combinations (continued) |
| (a) | IronPlanet acquisition (continued) |
IronPlanet provisional purchase price allocation
| May 31, 2017 | ||||
| Purchase price | $ | 776,474 | ||
| Assets acquired: | ||||
| Cash and cash equivalents | $ | 95,626 | ||
| Restricted cash | 3,000 | |||
| Trade and other receivables | 13,021 | |||
| Inventory | 600 | |||
| Advances against auction contracts | 4,623 | |||
| Prepaid expenses and deposits | 1,645 | |||
| Income taxes receivable | 55 | |||
| Property, plant and equipment | 2,381 | |||
| Other non-current assets | 2,551 | |||
| Deferred tax assets | 1,497 | |||
| Intangible assets ~ | 188,000 | |||
| Liabilities assumed: | ||||
| Auction proceeds payable | 63,616 | |||
| Trade and other payables | 14,511 | |||
| Deferred tax liabilities | 26,959 | |||
| Fair value of identifiable net assets acquired | 207,913 | |||
| Goodwill acquired on acquisition | $ | 568,561 | ||
| ~ | Intangible assets consist of indefinite-lived trade names and trademarks, customer relationships with estimated useful lives of ranging from six to 13 years, and a technology platform with an estimated useful life of 7 years. |
The amounts included in the IronPlanet provisional purchase price allocation are preliminary in nature and are subject to adjustment as additional information is obtained about the facts and circumstances that existed as of the IronPlanet Acquisition Date. The final determination of the fair values of certain assets and liabilities will be completed within the measurement period of up to one year from the IronPlanet Acquisition Date, and is dependent upon finalization of income tax liabilities. Adjustments to the preliminary values during the measurement period will be recorded in the operating results of the reporting period in which the adjustments are determined. Changes to the amounts recorded as assets and liabilities will result in a corresponding adjustment to goodwill.
During the period from May 31, 2017 to December 31, 2017, the Company made a revision to certain preliminary estimated fair values of assets acquired and liabilities assumed. A measurement period adjustment between inventory and prepaid expenses was made to revise the classification of certain assets. In addition, a measurement period adjustment for income tax assets and liabilities was made based on the Company’s revised analysis of the income tax liability expected to be settled or realized, which resulted in an increase to goodwill in the amount of $1,151,000.
| Ritchie Bros. | 139 |
Notes to the Consolidated Financial Statements
(Tabular amounts expressed in thousands of United States dollars, except where noted)
| 32. | Business combinations (continued) |
| (a) | IronPlanet acquisition (continued) |
Goodwill
The main drivers generating goodwill are the anticipated synergies from (1) the Company's auction expertise and transactional capabilities to IronPlanet's existing customer base, (2) IronPlanet providing existing technology to the Company's current customer base, and (3) future growth from international expansion and new Caterpillar dealers. Other factors generating goodwill include the acquisition of IronPlanet's assembled work force and their associated technical expertise.
Contributed revenue and net income
The results of IronPlanet’s operations are included in these consolidated financial statements from the IronPlanet Acquisition Date. IronPlanet contributed revenues of $65,641,000 and net income of $12,413,000 to the Company’s revenues and net income during the year ended December 31, 2017. IronPlanet’s contributed net income includes charges related to amortization of intangible assets acquired.
The following table includes the unaudited condensed pro forma financial information that presents the combined results of operations as if the transactions relating to the IronPlanet acquisition and the financing required to fund the acquisition had occurred on January 1, 2016. These transactions include adjustments in each applicable period presented for recurring charges related to amortization of intangible assets acquired, interest expense related to the acquisition financing, changes in fair value of convertible preferred stock warrant liability, certain stock option compensation expenses, and taxes, as well as adjustments to the diluted weighted average number of shares outstanding. In addition, these transactions also include pre-tax adjustments related to non-recurring charges totalling $55,239,000 incurred between the third quarter of 2016 and the second quarter of 2017 that were presented as if the transactions occurred on January 1, 2016. The non-recurring transactions include certain acquisition-related and financing costs, stock option compensation expenses, and severance costs, together with the related income tax recovery.
The unaudited pro forma condensed combined financial information does not purport to represent what the Company’s results of operations or financial condition would have been had the IronPlanet acquisition and related transactions occurred on the dates indicated, and it does not purport to project the Company’s results of operations or financial condition for any future period or as of any future date.
| Year ended December 31, | 2017 | 2016 | ||||||
| Revenue | $ | 659,861 | $ | 676,234 | ||||
| Net income | 94,244 | 24,179 | ||||||
| Basic earnings per share | 0.88 | 0.21 | ||||||
| Diluted earnings per share | 0.87 | 0.21 | ||||||
The unaudited pro forma net loss for the year ended December 31, 2016 includes an impairment loss on the EquipmentOne reporting unit goodwill of $23,574,000 and an impairment loss on the EquipmentOne reporting unit customer relationships of $4,669,000.
Transactions recognized separately from the acquisition of assets and assumptions of liabilities
Acquisition-related costs
Expenses totalling $34,653,000 for legal fees, stock option compensation expense, and other acquisition-related costs are included in the consolidated income statement for the year ended December 31, 2017 (2016: $8,202,000).
| Ritchie Bros. | 140 |
Notes to the Consolidated Financial Statements
(Tabular amounts expressed in thousands of United States dollars, except where noted)
| 32. | Business combinations (continued) |
| (b) | Kramer acquisition |
On November 15, 2016 (the “Kramer Acquisition Date”), the Company purchased the assets of Kramer Auctions Ltd. for cash consideration of Canadian dollar 15,300,000 ($11,361,000) comprised of Canadian dollar 15,000,000 ($11,138,000) paid at acquisition date and Canadian dollar 300,000 ($223,000) deferred payments over three years. In addition to cash consideration, consideration of up to Canadian dollar 2,500,000 ($1,856,000) is contingent on Kramer achieving certain operating performance targets over the three-year period following acquisition. Kramer is a leading Canadian agricultural auction company with strong customer relationships in central Canada. This acquisition is expected to strengthen Ritchie Bros.’ penetration of Canada’s agricultural sector and add key talent to our Canadian Agricultural sales and operations team.
The acquisition was accounted for in accordance with ASC 805 Business Combinations. The assets acquired were recorded at their estimated fair values at the Kramer Acquisition Date. Goodwill of $6,822,000 was calculated as the fair value of consideration over the estimated fair value of the net assets acquired.
Kramer purchase price allocation
| November 15, 2016 | ||||
| Purchase price | $ | 11,138 | ||
| Deferred purchase note consideration | 223 | |||
| Fair value of contingent consideration | 538 | |||
| Total fair value at Kramer Acquisition Date | 11,899 | |||
| Assets acquired: | ||||
| Property, plant and equipment | $ | 399 | ||
| Intangible assets ~ | 4,678 | |||
| Fair value of identifiable net assets acquired | 5,077 | |||
| Goodwill acquired on acquisition | $ | 6,822 | ||
| ~ | Consists of customer relationships and trade names with estimated useful lives of 10 and three years, respectively. |
Assets acquired
At the date of acquisition, the Company determined the fair value of the assets acquired using appropriate valuation techniques.
Goodwill
Kramer is a highly complementary business that will broaden the Company’s base in the agriculture sector in Canada, one of the main drivers generating goodwill.
Contingent consideration
At the date of acquisition, the maximum contingent consideration of Canadian dollar 2,500,000 ($1,856,000) was fair valued at Canadian dollar 725,000 ($538,000). The contingent consideration is based on the cumulative revenue growth during a three-year period ending November 15, 2019. The liability is remeasured on each reporting date at its estimated fair value, which is determined using actual results up to the reporting date and forecasted results over the remainder of the performance period. Changes in the fair value are recognized in other income or expense in the consolidated income statement, as applicable. At December 31, 2017, the Company did not recognize a liability as the estimated fair value of the contingent consideration was nil (December 31, 2016: Canadian dollar 725,000 ($538,000)). In the year ending December 31, 2017 the Company recognized other income of $620,000 (2016: nil) associated with the change in fair value.
| Ritchie Bros. | 141 |
Notes to the Consolidated Financial Statements
(Tabular amounts expressed in thousands of United States dollars, except where noted)
| 32. | Business combinations (continued) |
| (b) | Kramer acquisition (continued) |
Transactions recognized separately from the acquisition of assets and assumptions of liabilities
Acquisition-related costs
Expenses totalling $507,000 for continuing employment costs and other acquisition-related costs are included in the consolidated income statement for the year ended December 31, 2017 (2016: $192,000).
Employee compensation in exchange for continued services
The Company may pay an additional amount not exceeding Canadian dollar 1,000,000 ($743,000) over a three-year period based on the continuing employment of four key leaders of Kramer with the Company. The Company paid Canadian dollar 333,000 ($261,000) in this regard during the year ended December 31, 2017 (2016: nil).
| (c) | Petrowsky acquisition |
On August 1, 2016 (the “Petrowsky Acquisition Date”), the Company acquired the assets of Petrowsky for cash consideration of $6,250,000. An additional $750,000 was paid for the retention of certain key employees. In addition to cash consideration, consideration of up to $3,000,000 is contingent on Petrowsky achieving certain revenue growth targets over the three-year period following acquisition. Based in North Franklin, Connecticut, Petrowsky caters largely to equipment sellers in the construction and transportation industries. Petrowsky also serves customers selling assets in the underground utility, waste recycling, marine, and commercial real estate industries. The business operates one permanent auction site, in North Franklin, which will continue to hold auctions, and also specializes in off-site auctions held on the land of the consignor.
The acquisition was accounted for in accordance with ASC 805 Business Combinations. The assets acquired were recorded at their estimated fair values at the Petrowsky Acquisition Date. Goodwill of $4,308,000 was calculated as the fair value of consideration over the estimated fair value of the net assets acquired.
Petrowsky purchase price allocation
| August 1, 2016 | ||||
| Purchase price | $ | 6,250 | ||
| Fair value of contingent consideration | 1,433 | |||
| Total fair value at Petrowsky Acquisition Date | 7,683 | |||
| Assets acquired: | ||||
| Property, plant and equipment | $ | 441 | ||
| Intangible assets ~ | 2,934 | |||
| Fair value of identifiable net assets acquired | 3,375 | |||
| Goodwill acquired on acquisition | $ | 4,308 | ||
~Consists of customer relationships with estimated useful lives of 10 years.
Assets acquired and liabilities assumed
At the date of the acquisition, the carrying amounts of the assets and liabilities acquired approximated their fair values, except customer relationships, whose fair value was determined using appropriate valuation techniques.
| Ritchie Bros. | 142 |
Notes to the Consolidated Financial Statements
(Tabular amounts expressed in thousands of United States dollars, except where noted)
| 32. | Business combinations (continued) |
| (c) | Petrowsky acquisition (continued) |
Goodwill
Petrowsky is a highly complementary business that will broaden the Company’s base of equipment sellers, one of the main drivers generating goodwill. Petrowsky’s sellers are primarily in the construction and transportation industries, which are also well aligned with the Company’s sector focus.
Contingent consideration
As part of the acquisition, contingent consideration of up to $3,000,000 is payable to Petrowsky if certain revenue growth targets are achieved. The contingent consideration is based on the cumulative revenue growth during a three-year period ending July 31, 2019. The liability is remeasured on each reporting date at its estimated fair value, which is determined using actual results up to the reporting date and forecasted results over the remainder of the performance period. Changes in the fair value are recognized in other income or expense in the consolidated income statement, as applicable. In the year ending December 31, 2017, the Company recognized other income of $1,457,000 (2016: nil) associated with the change in fair value. At December 31, 2017, the Company did not recognize a liability as the estimated fair value of the contingent consideration was nil (December 31, 2016: $1,433,000).
Transactions recognized separately from the acquisition of assets and assumptions of liabilities
Acquisition-related costs
Expenses totalling $653,000 for continuing employment and other acquisition-related costs are included in the consolidated income statement for the year ended December 31, 2017 (2016: $604,000).
Transactions recognized separately from the acquisition of assets and assumptions of liabilities (continued)
Employee compensation in exchange for continued services
As noted above, $750,000 was paid on the Petrowsky Acquisition Date in exchange for the continuing services of certain key employees. In addition, the Company may pay an amount not exceeding $1,000,000 over a three-year period, payable in equal annual installments, on the anniversary date of the acquisition based on the founder of Petrowsky’s continuing employment with the Company. The Company paid $333,000 in this regard during the year ended December 31, 2017 (2016: nil).
| (d) | Mascus acquisition |
On February 19, 2016 (the “Mascus Acquisition Date”), the Company acquired 100% of the issued and outstanding shares of Mascus for cash consideration of €26,553,000 ($29,580,000). In addition to cash consideration, consideration of up to €3,198,000 ($3,563,000), of which €1,215,000 ($1,302,000) has been paid, is contingent on Mascus achieving certain operating performance targets over the three-year period following acquisition. Mascus is based in Amsterdam and provides an online equipment listing service for used heavy machines and trucks. The acquisition expands the breadth and depth of equipment disposition and management solutions the Company can offer its customers.
The acquisition was accounted for in accordance with ASC 805, Business Combinations. The assets acquired and liabilities assumed were recorded at their estimated fair values at the Mascus Acquisition Date. Goodwill of $19,664,000 was calculated as the fair value of consideration over the estimated fair value of the net assets acquired.
| Ritchie Bros. | 143 |
Notes to the Consolidated Financial Statements
(Tabular amounts expressed in thousands of United States dollars, except where noted)
| 32. | Business combinations (continued) |
| (d) | Mascus acquisition (continued) |
Mascus purchase price allocation
| February 19, 2016 | ||||
| Purchase price | $ | 29,580 | ||
| Fair value of contingent consideration | 3,431 | |||
| Non-controlling interests (1) | 596 | |||
| Total fair value at Mascus Acquisition Date | 33,607 | |||
| Fair value of assets acquired: | ||||
| Cash and cash equivalents | $ | 1,457 | ||
| Trade and other receivables | 1,290 | |||
| Prepaid expenses | 528 | |||
| Property, plant and equipment | 104 | |||
| Intangible assets (2) | 14,817 | |||
| Fair value of liabilities assumed: | ||||
| Trade and other payables | 1,533 | |||
| Other non-current liabilities | 37 | |||
| Deferred tax liabilities | 2,683 | |||
| Fair value of identifiable net assets acquired | 13,943 | |||
| Goodwill acquired on acquisition | $ | 19,664 | ||
| (1) | The Company acquired 100% of Mascus and within the Mascus group of entities there were two subsidiaries that were not wholly-owned, one domiciled in the United States and one domiciled in Denmark. As such, the Company acquired non-controlling interests. The fair value of each non-controlling interest was determined using an income approach based on cash flows of the respective entities that were attributable to the non-controlling interest. On May 27, 2016, Ritchie Bros. Holdings (America) Inc. acquired the remaining issued and outstanding shares of the Mascus subsidiary domiciled in the United States for cash consideration of $226,000. |
| (2) | Intangible assets consist of customer relationships with estimated useful lives of 17 years, indefinite-lived trade names, and software assets with estimated useful lives of five years. |
Goodwill
The main drivers generating goodwill are the anticipated synergies from (1) the Company's core auction expertise and transactional capabilities to Mascus' existing customer base, and (2) Mascus' providing existing technology to the Company's current customer base. Other factors generating goodwill include the acquisition of Mascus' assembled work force and their associated technical expertise.
| Ritchie Bros. | 144 |
Notes to the Consolidated Financial Statements
(Tabular amounts expressed in thousands of United States dollars, except where noted)
| 32. | Business combinations (continued) |
| (d) | Mascus acquisition (continued) |
Contingent consideration
At the date of acquisition, the maximum contingent consideration of €3,198,000 ($3,563,000) was fair valued at €3,080,000 ($3,431,000). The consideration is contingent upon the achievement of certain operating performance targets during the three-year period following acquisition and is due in three instalments, each occurring after the end of the respective 12-month performance period. During the year ended December 31, 2017 after having achieved certain first performance period targets, the Company made the first instalment payment of €1,215,000 ($1,302,000). The remaining liability is remeasured on each reporting date at its estimated fair value, which is determined using actual results up to the reporting date and forecasted results over the remainder of the performance period. Changes in the fair value are recognized in other income or expense in the consolidated income statement, as applicable. At December 31,2017 the estimated fair value of the contingent consideration was €1,879,000 ($2,255,000) (December 31, 2016: €3,080,000 ($3,431,000)). During the year ended December 31, 2017 the Company recognized €28,000 ($33,000) in other income associated with the change in fair value (2016: nil).
Transactions recognized separately from the acquisition of assets and assumptions of liabilities
Acquisition-related costs
Expenses totalling $552,000 for continuing employments costs and other acquisition-related costs are included in the consolidated income statement for the year ended December 31, 2017 (2016: $1,720,000).
Employee compensation in exchange for continued services
The Company may pay additional amounts not exceeding €1,625,000 ($1,849,000) over a three-year period ending February 19, 2019 based on key employees’ continuing employment with Mascus. The Company paid €393,000 ($419,000) in this regard during the year ended December 31, 2017 (2016: nil).
| Ritchie Bros. | 145 |
| ITEM 9: | CHANGES IN AND DISAGREEMENTS WITH ACCOUNTANTS ON ACCOUNTING AND FINANCIAL DISCLOSURE |
Not applicable.
| ITEM 9A: | CONTROLS AND PROCEDURES |
Disclosure Controls and Procedures
Management of the Company, including the Chief Executive Officer (“CEO”) and Chief Financial Officer (“CFO”), have evaluated the effectiveness of the Company’s disclosure controls and procedures as of the end of the period covered by this Form 10-K. The term “disclosure controls and procedures” means controls and other procedures established by the Company that are designed to ensure that information required to be disclosed by the Company in the reports that it files or submits under the Exchange Act is recorded, processed, summarized and reported within the time periods specified in the SEC’s rules and forms. Disclosure controls and procedures include, without limitation, controls and procedures designed to ensure that information required to be disclosed by the Company in the reports that it files or submits under the Exchange Act is accumulated and communicated to the Company’s management, including its CEO and CFO, as appropriate, to allow timely decisions regarding required disclosure.
Based upon their evaluation of the Company’s disclosure controls and procedures, the CEO and the CFO concluded that the disclosure controls are effective to provide reasonable assurance that information required to be disclosed by the Company in the reports that it files or submits under the Exchange Act is accumulated and communicated to management, including the CEO and CFO, as appropriate, to allow timely decisions regarding required disclosure and are effective to provide reasonable assurance that such information is recorded, processed, summarized and reported within the time periods specified by the SEC’s rules and forms.
The Company closed the IronPlanet Acquisition on May 31, 2017, and IronPlanet’s total assets and revenues constituted 41% and 11%, respectively, of the Company’s consolidated total assets and revenues as shown on our consolidated financial statements as of and for the period ended December 31, 2017. As the Acquisition occurred in the second quarter of 2017, we excluded the internal control over financial reporting of IronPlanet from the scope of our assessment of the effectiveness of the Company’s disclosure controls and procedures. This exclusion is in accordance with the general guidance issued by the Staff of the Securities and Exchange Commission that an assessment of a recently-acquired business may be omitted from our scope in the year of acquisition, if specified conditions are satisfied.
The Company, including its CEO and CFO, does not expect that its internal controls and procedures will prevent or detect all error and all fraud. A control system, no matter how well conceived or operated, can provide only reasonable, not absolute, assurance that the objectives of the control system are met.
Management’s Annual Report on Internal Control Over Financial Reporting
In accordance with Item 308 of SEC Regulation S-K, management is required to provide an annual report regarding internal controls over our financial reporting. This report, which includes management’s assessment of the effectiveness of our internal controls over financial reporting, is found below.
| Ritchie Bros. | 146 |
Management’s Report on Internal Control over Financial Reporting
Management of the Company is responsible for establishing and maintaining adequate internal controls over financial reporting for the Company as defined in Rule 13a-15(f) and 15d-15(f) under the Exchange Act. The Company’s internal control over financial reporting is a process designed under the supervision of the Company’s CEO and CFO, overseen by the Company’s Board of Directors and implemented by the Company’s management and other personnel, to provide reasonable assurance regarding the reliability of financial reporting and the preparation of the financial statements for external purposes in accordance with U.S. generally accepted accounting principles, and the requirements of the SEC.
Because of its inherent limitations, internal control over financial reporting may not prevent or detect misstatements. Also, projections of any evaluation of effectiveness to future periods are subject to the risk that controls may become inadequate because of changes in conditions or that the degree of compliance with policies and procedures may deteriorate.
Management has assessed the effectiveness of the Company’s internal control over financial reporting as of December 31, 2017. In making this assessment, management used the criteria described in “Internal Control – Integrated Framework” issued by the Committee of Sponsoring Organizations of the Treadway Commission (2013 Framework) (“COSO”). Based on its assessment under the framework in COSO, management has concluded that internal control over financial reporting was effective as of December 31, 2017.
The Company closed the IronPlanet Acquisition on May 31, 2017, and IronPlanet’s total assets and revenues constituted 42% and 11% respectively, of the Company’s consolidated total assets and revenues as shown on our consolidated financial statements as of and for the period ended December 31, 2017. As the Acquisition occurred in the second quarter of 2017, we excluded the internal control over financial reporting of IronPlanet from the scope of our assessment of the effectiveness of the Company’s internal control over financial reporting. This exclusion is in accordance with the general guidance issued by the Staff of the Securities and Exchange Commission that an assessment of a recently-acquired business may be omitted from our scope in the year of acquisition, if specified conditions are satisfied.
Attestation Report of Registered Public Accounting Firm
The attestation report required under this Item 9A is set forth below under the caption “Report of Independent Registered Public Accounting Firm.”
Changes in Internal Control over Financial Reporting
Management, with the participation of the CEO and CFO, concluded that there were no changes in the Company’s internal control over financial reporting during the quarter ended December 31, 2017 that have materially affected, or are reasonably likely to materially affect, the Company’s internal control over financial reporting.
| Ritchie Bros. | 147 |
Report of Independent Registered Public Accounting Firm
To the Shareholders and the Board of Directors of Ritchie Bros. Auctioneers Incorporated
Opinion on Internal Control over Financial Reporting
We have audited Ritchie Bros. Auctioneers Incorporated (the “Company”) internal control over financial reporting as of December 31, 2017, based on criteria established in Internal Control—Integrated Framework issued by the Committee of Sponsoring Organizations of the Treadway Commission (2013 framework) (the “COSO criteria”). In our opinion, Ritchie Bros. Auctioneers Incorporated maintained, in all material respects, effective internal control over financial reporting as of December 31, 2017, based on the COSO criteria.
As indicated in the accompanying Management’s Annual Report on Internal Control over Financial Reporting management’s assessment of and conclusion on the effectiveness of internal control over financial reporting did not include the internal controls of IronPlanet which is included in the 2017 consolidated financial statements of Ritchie Bros. Auctioneers Incorporated and constituted 42% of total assets as of December 31, 2017 and 11% of revenues for the year then ended. Our audit of internal control over financial reporting of Ritchie Bros. Auctioneers Incorporated also did not include an evaluation of the internal control over financial reporting of IronPlanet.
We also have audited, in accordance with the standards of the Public Company Accounting Oversight Board (United States) (“PCAOB”), the consolidated balance sheets of the Company as of December 31, 2017 and 2016, the related consolidated statements of income and comprehensive income, changes in equity and cash flows for each of the three years in the period ended December 31, 2017, and the related notes and our report dated 26 February 2018 expressed an unqualified opinion thereon.
Basis for Opinion
The Company’s management is responsible for maintaining effective internal control over financial reporting and for its assessment of the effectiveness of internal control over financial reporting included in the accompanying Management’s Report on Internal Control over Financial Reporting. Our responsibility is to express an opinion on the Company’s internal control over financial reporting based on our audit. We are a public accounting firm registered with the PCAOB and are required to be independent with respect to the Company in accordance with the U.S. federal securities laws and the applicable rules and regulations of the Securities and Exchange Commission and the PCAOB.
We conducted our audit in accordance with the standards of the PCAOB. Those standards require that we plan and perform the audit to obtain reasonable assurance about whether effective internal control over financial reporting was maintained in all material respects.
Our audit included obtaining an understanding of internal control over financial reporting, assessing the risk that a material weakness exists, testing and evaluating the design and operating effectiveness of internal control based on the assessed risk, and performing such other procedures as we considered necessary in the circumstances. We believe that our audit provides a reasonable basis for our opinion.
| 148 |
Definition and Limitations of Internal Control Over Financial Reporting
A company’s internal control over financial reporting is a process designed to provide reasonable assurance regarding the reliability of financial reporting and the preparation of financial statements for external purposes in accordance with generally accepted accounting principles. A company’s internal control over financial reporting includes those policies and procedures that (1) pertain to the maintenance of records that, in reasonable detail, accurately and fairly reflect the transactions and dispositions of the assets of the company; (2) provide reasonable assurance that transactions are recorded as necessary to permit preparation of financial statements in accordance with generally accepted accounting principles, and that receipts and expenditures of the company are being made only in accordance with authorizations of management and directors of the company; and (3) provide reasonable assurance regarding prevention or timely detection of unauthorized acquisition, use, or disposition of the company’s assets that could have a material effect on the financial statements.
Because of its inherent limitations, internal control over financial reporting may not prevent or detect misstatements. Also, projections of any evaluation of effectiveness to future periods are subject to the risk that controls may become inadequate because of changes in conditions, or that the degree of compliance with the policies or procedures may deteriorate.
/s/ Ernst & Young LLP
Chartered Professional Accountants
Vancouver, Canada
February 26, 2018
| 149 |
| ITEM 9B: | OTHER INFORMATION |
Not applicable.
| ITEM 10: | DIRECTORS, EXECUTIVE OFFICERS AND CORPORATE GOVERNANCE |
The information responsive to this Item is incorporated by reference to our definitive Proxy Statement for our 2018 Annual and Special Meeting of Shareholders, to be filed within 120 days of December 31, 2017, pursuant to Regulation 14A under the Securities Exchange Act of 1934, as amended (the “2018 Proxy Statement”).
| ITEM 11: | EXECUTIVE COMPENSATION |
The information responsive to this Item is incorporated by reference to our 2018 Proxy Statement.
| ITEM 12: | SECURITY OWNERSHIP OF CERTAIN BENEFICIAL OWNERS AND MANAGEMENT AND RELATED STOCKHOLDER MATTERS |
The information responsive to this Item is incorporated by reference to our 2018 Proxy Statement.
| ITEM 13: | CERTAIN RELATIONSHIPS AND RELATED TRANSACTIONS, AND DIRECTOR INDEPENDENCE |
The information responsive to this Item is incorporated by reference to our 2018 Proxy Statement.
| ITEM 14: | PRINCIPAL ACCOUNTANT FEES AND SERVICES |
The information responsive to this Item is incorporated by reference to our 2018 Proxy Statement.
| Ritchie Bros. | 150 |
| ITEM 15: | EXHIBITS, FINANCIAL STATEMENT SCHEDULES |
| (a) | Documents Filed with this Report: |
| 1. | FINANCIAL STATEMENTS |
| 2. | FINANCIAL STATEMENT SCHEDULES |
None.
| 3. | EXHIBITS |
The exhibits listed in (b) below are filed as part of this Annual Report on Form 10-K and incorporated herein by reference.
| (b) | Exhibits: |
| Ritchie Bros. | 151 |
| Ritchie Bros. | 152 |
| Ritchie Bros. | 153 |
| Ritchie Bros. | 154 |
| # | Indicates management contract or compensatory plan or arrangement. |
| * | Schedules have been omitted pursuant to Item 601(b)(2) of Regulation S-K. The registrant will furnish copies of any such schedules to the U.S. Securities and Exchange Commission upon request. |
| ** | Certain portions of this exhibit have been omitted pursuant to a request for confidential treatment and have been filed separately with the U.S. Securities and Exchange Commission. |
| ITEM 16: | FORM 10-K SUMMARY |
Not applicable.
| Ritchie Bros. | 155 |
Pursuant to the requirements of Section 13 or 15(d) of the Securities Exchange Act of 1934, the registrant has duly caused this report to be signed on its behalf by the undersigned, thereunto duly authorized.
|
RITCHIE BROS. AUCTIONEERS INCORPORATED | ||
| Date: February 26, 2018 | By: | /s/ Ravichandra K. Saligram |
|
Ravichandra K. Saligram Chief Executive Officer | ||
Pursuant to the requirements of the Securities Exchange Act of 1934, this Report has been signed below by the following persons on behalf of the registrant and in the capacities and on the dates indicated.
| By: | /s/ Ravichandra K. Saligram | Chief Executive Officer (principal executive officer) |
February 26, 2018 |
| Ravichandra K. Saligram | |||
| By: | /s/ Sharon R. Driscoll |
Chief Financial Officer (principal financial officer and principal accounting officer) |
February 26, 2018 |
| Sharon R. Driscoll | |||
| By: | /s/ Beverley A. Briscoe | Chair of the Board | February 26, 2018 |
| Beverley A. Briscoe | |||
| By: | /s/ Robert G. Elton | Director | February 26, 2018 |
| Robert G. Elton | |||
| By: | /s/ Erik Olsson | Director | February 26, 2018 |
| Erik Olsson | |||
| By: | /s/ Eric Patel | Director | February 26, 2018 |
| Eric Patel | |||
| By: | /s/ Edward B. Pitoniak | Director | February 26, 2018 |
| Edward B. Pitoniak | |||
| By: | /s/ Sarah Raiss | Director | February 26, 2018 |
| Sarah E. Raiss | |||
| By: | /s/ Christopher Zimmerman | Director | February 26, 2018 |
| Christopher Zimmerman | |||
| By: | /s/ Amy Guggenheim Skenkan | Director | February 26, 2018 |
| Amy Guggenheim Skenkan | |||
| By: | /s/ Kim Fennell | Director | February 26, 2018 |
| Kim Fennell |
| Ritchie Bros. | 156 |