Attached files
| file | filename |
|---|---|
| EX-99.2 - EXHIBIT 99.2 - BLUCORA, INC. | ex-992earningsreleaseq32017.htm |
| EX-99.1 - EXHIBIT 99.1 - BLUCORA, INC. | ex-991earningsreleaseq32017.htm |
| 8-K - 8-K - BLUCORA, INC. | bcor8-kq32017earningsrelea.htm |

Investor Presentation
October 26, 2017
3Q 2017

2
Forward-Looking Statements
and Non-GAAP Financial Measures
This presentation contains forward-looking statements within the meaning of Section 27A of the Securities Act of 1933 and Section 21E of the
Securities Exchange Act of 1934. These forward-looking statements generally are identified by the words "anticipate," "believe," "plan," "project,"
"expect," "future," "intend," "may," "will," "should," “could,” “would,” "estimate," "predict," "potential," "continue," and similar expressions. Actual
results may differ significantly from management's expectations due to various risks and uncertainties including, but not limited to: risks associated
with Blucora, Inc. (“Blucora” or the “Company”) strategic transformation and the successful execution of its strategic initiatives, operating plans and
marketing strategies; general economic, political, industry, and market conditions; the Company’s ability to attract and retain productive advisors;
the Company’s ability to successfully make technology enhancements and introduce new products and services; information technology and
cybersecurity risks; the effect of current, pending and future legislation, regulation and regulatory actions, such as the new Department of Labor
rule and any changes in tax laws; dependence on third parties to distribute products and services; litigation risks; the Company’s ability to hire,
retain and motivate key employees; the Company’s ability to protect its intellectual property; and financing risks, including risks related to the
Company’s existing debt obligations.
A more detailed description of these and certain other factors that could affect actual results is included in Blucora’s most recent Annual Report on
Form 10-K and subsequent reports filed with or furnished to the Securities and Exchange Commission. Readers are cautioned not to place undue
reliance on these forward-looking statements. The Company undertakes no obligation to update any forward-looking statements to reflect events
or circumstances after the date of this presentation.
This presentation contains non-GAAP financial measures relating to our performance. You can find the reconciliation of these measures to the most
directly comparable GAAP financial measure in the Appendix at the end of this presentation. The non-GAAP financial measures disclosed by the
Company should not be considered a substitute for, or superior to, the financial measures prepared in accordance with GAAP. Please refer to the
notes to reconciliation of non-GAAP financial measures in Blucora’s quarterly earnings release for a detailed explanation of the adjustments made
to the comparable GAAP measures, the ways management uses the non-GAAP measures, and the reasons why management believes the non-
GAAP measures provide investors with useful supplemental information.

3
Source: U.S. Bureau of Labor Statistics Empowering people’s goals by optimizing taxes.
We specialize in it.
Americans spend more on taxes than on their
mortgage, groceries and clothing, combined.
Yet few firms focus on tax,
and many avoid it altogether.

4
• Demonstrated revenue, segment income and non-GAAP EPS growth
• Our business portfolio is positioned with significant organic growth opportunities
• Strong cash flow generating business, strengthened balance sheet
• Diversified revenue streams with multiple growth drivers and positive industry tailwinds
• Differentiated business model with competitive advantages
Investment Highlights

5
2016 Overview Blucora’s tax-smart solutions
empower people’s goals by leveraging
one of life’s largest expenses – taxes
$42.7 B
Assets Under
Administration
$12 B
Assets Under
Management
4.3M
Consumer
e-Files
21K
Professional Users
5
Wealth Management
• #1 Tax-Focused Independent Broker Dealer
• We provide advisors with the training,
tools & support to deliver tax-smart
wealth management to clients
4,400
Advisors
345,000
Customers
Leadership: Bob Oros
Led Fidelity’s RIA business (2012-17)
LPL, Charles Schwab
1.7M
Professional
e-Files
• #3 Tax Preparation Service (unit share)
• Online tax software solution for
consumers and professionals that is
simple, affordable, accurate
Tax Preparation
19
Yrs. Revenue Growth
Leadership: Sanjay Baskaran
Led Amazon N. America Credit Card biz (2015-17)
Visa, HSBC
LTM Financial Results
(as of 9/30/17)
Wealth Management
$317M
Tax Preparation
$139M
Advisory
Commission & Trails
Cash sweep
& other
Fees
Consumer
Pro
$129
$150
$23
$14
$130
70% 30%
Revenue $498.5 M
Segment Income $127.8 M
Adjusted EBITDA $105.1 M
Non-GAAP EPS $1.44
About Us
Blucora helps consumers manage
their financial lives and optimize taxes
through two segments:

6
Multi-Year Transformation
Integrated Tax-Smart Platform
Reduced Customer Concentration Increased Recurring Revenue
2014 3Q’17 LTM
Customers Accounting for more than 5% of Revenue
Tax-Optimized
Wealth
Management
Tax Prep
0%
20%
40%
60%
80%
100%
2014 3Q'17 LTM 13% 77%
6.3x
Divested Non-Core Assets
Blucora
InfoSpace
Monoprice
55%
0%

7
2014 2015 2016 2017 E*
$0.70
$0.88
$1.06
$1.36
2014 2015 2016 3Q'17 LTM 2014 2015 2016 3Q'17 LTM
Continued Momentum
Revenue 7% CAGR Adjusted EBITDA 13% CAGR
Non-GAAP EPS 25% CAGR Strengthening Balance Sheet
$76 $82
$94
$105
$409 $437
$456
$499
2015 2016 3Q'17
6.3x
4.0x
2.6x
LTM Free Cash Flow
$72 million
Net Leverage Ratio
Adjusted EBITDA, non-GAAP EPS and Free Cash Flow are not defined under U.S. generally accepted accounting principles (GAAP). The company defines free cash flow as net cash provided by operating activities from continuing operations less purchases of
property and equipment. Please see appendix for reconciliations to nearest GAAP measures. On December 31, 2015, Blucora closed the acquisition of HD Vest . The pro forma information represents the combination of HD Vest, TaxAct, and corporate
expenses as if the acquisition closed on January 1, 2014, and excludes the divested Search and Content and E-Commerce businesses. The Company believes that this presentation most accurately reflects the financial performance of the Company on a go-
forward basis.

8
Wealth Management
• Revenue up 8% y/y
• Assets Under Administration (AUA) +11% y/y to $42.7B
• Assets Under Management (AUM) +17% y/y to $12.0B
Strong Third Quarter
New Record
Tax Preparation
• Revenue up 7% y/y
• Investing & positioning for next tax season
New Record
Blucora Consolidated
Revenue
UP 8%
Year over year
Net leverage
DOWN TO 2.6x
vs. 4.2x year-ago

9
Core Beliefs
• Taxes are one of life’s largest expenses
• Leveraging taxes is not maximizing a once-a-year refund,
but rather helping people achieve their financial goals
• The tax prep industry focuses consumers on maximizing a
once-a-year refund, a reactive approach that ignores the
greater goals of minimizing taxes, increasing cash flow and
enabling better long-term outcomes
• The brokerage and wealth management industries ignore
taxes, making the simplifying assumption that they don’t
exist – because they can’t advise on taxes; instead they
focus consumers on the illusion of investment alpha
We will leverage tax information – along with
trusted brands – to enable people to better
achieve their goals, connecting the dots
across a person’s financial life-cycle,
uncovering opportunity they would
otherwise miss
Taxes are the key to better outcomes
People are seriously underserved
We have a unique opportunity
to disrupt these outdated
approaches
The next innovation in managing finances:
Integrated tax and
wealth management
That frame our growth strategy

10
Purpose and Values
Purpose
Values
Vision
Strategic
Statement
“Tax-smart” leaders, earning world-class customer loyalty and trust
We live by a CREDO…
• Customer obsessed: We serve all customers with passion
• Reliable: We always deliver on our commitments
• Ethical: We respect all others and treat people as they want to be treated
• Driven: We demand excellence and strive to find a better way
• One-Blucora: We will win more together
Objective: High-performing growth company, delivering 15-18% growth in Non-GAAP EPS
Scope: For consumers and small businesses, and their trusted advisors, we enable better financial outcomes
through our tax expertise and insights – across relationship-led and digitally-led channels
Advantage: Leveraging the tax information through our trusted brands enables us to deliver better financial
recommendations and outcomes, across a breadth of demographic and the full consumer life-cycle
Empowering people to exceed their goals through optimizing one of life’s largest expenses – taxes

11
Accelerate Growth
Capture organic growth opportunities
Create clear competitive differentiation and customer value in each business
Deliver on cross-brand migration & synergies, leverage data to offer personalized services
Build Tax-smart
Leadership
Deliver tax-alpha through integrated products and services across brands
Deliver holistic tax-smart solutions, while others offer pieces
Create One Blucora
Enable efficiencies through shared services and expertise across the enterprise
Build high-performing organization that attracts, retains, develops and engages the strongest talent
Drive a shared purpose and common culture
Our Path Forward / How We Win From Here
Deliver Results
Drive continuous improvement, metrics driven organization
Continue to meet our goals and targets; maximize NOL
Blucora Strategy

12
Financial Objectives (Next 3-5 Years)
Revenue
Growth
Adjusted EBITDA
Growth
Non-GAAP
EPS Growth
5-8%
6-9%
15-18%
Near-term Focus
Organic growth requirements
Continued de-levering
Future Considerations
Consolidation & capability M&A
Return of capital (share repurchase)
Capital allocation priorities

2016 2017 2018+
13
Roadmap for Value Creation
Stabilize and Reposition Foundation for Growth Growth Company
Increase profit & grow share
Increase profit & grow AUM
Organic
Reposition TaxAct
HD Vest DOL & capability buildout
Redesign & streamline organization
Integrate HD Vest
Organization
Divestitures
De-lever
Refinance debt
Cap Allocation
Consolidation & capability M&A
Return of capital
De-lever

14
Wealth
Management
15
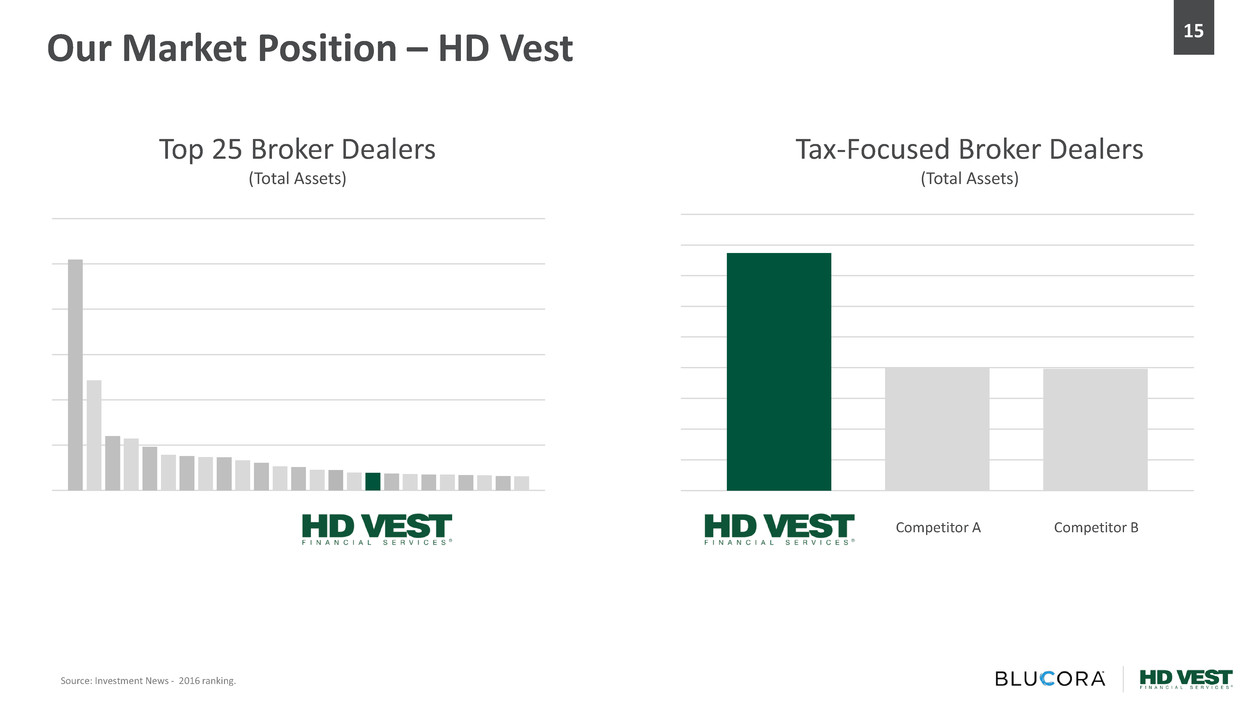
Our Market Position – HD Vest
Source: Investment News - 2016 ranking.
Competitor A
Top 25 Broker Dealers
(Total Assets)
Tax-Focused Broker Dealers
(Total Assets)
Competitor B

16
Financial Performance – HD Vest
Revenue
$40.3 $43.0
$46.3
$50.5
13% 13%
15%
15%
0.06
0.08
0.1
0.12
0.14
0.16
0.18
0
5
10
15
20
25
30
35
40
45
50
55
60
2014 2015 2016 LTM 3Q'17
Segment Income & Margin
40.8%
27.0%
20.5%
11.7%
Other
Fee-based
Transactional
Trails
3Q’17
$273 $286 $280 $297
$32
$33 $37
$41
$305
$320 $317
$338
2014 2015 2016 LTM 3Q'17
Advisor Driven Other
Revenue Mix
17
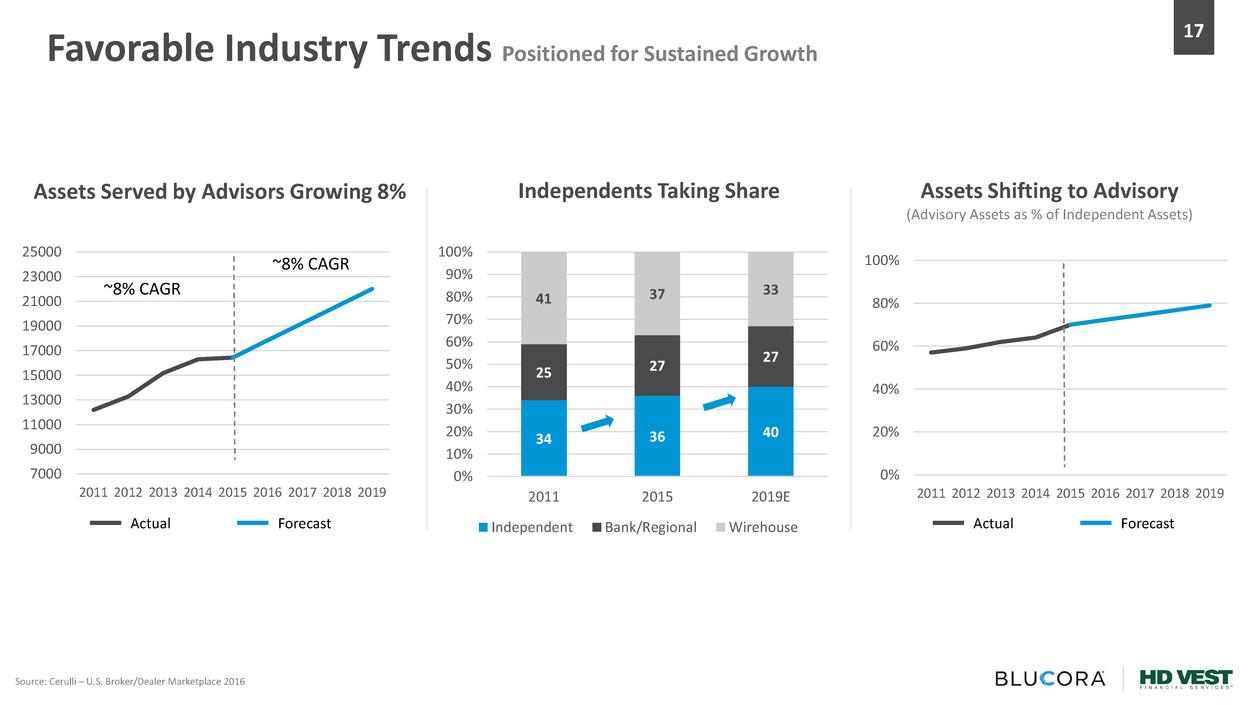
Favorable Industry Trends Positioned for Sustained Growth
Source: Cerulli – U.S. Broker/Dealer Marketplace 2016
7000
9000
11000
13000
15000
17000
19000
21000
23000
25000
2011 2012 2013 2014 2015 2016 2017 2018 2019
~8% CAGR
~8% CAGR
Actual Forecast
Assets Served by Advisors Growing 8%
34 36 40
25 27
27
41 37
33
0%
10%
20%
30%
40%
50%
60%
70%
80%
90%
100%
2011 2015 2019E
Independent Bank/Regional Wirehouse
Independents Taking Share Assets Shifting to Advisory
(Advisory Assets as % of Independent Assets)
0%
20%
40%
60%
80%
100%
2011 2012 2013 2014 2015 2016 2017 2018 2019
Actual Forecast

18
Differentiated Business Model
1. Recruiting 2. New Customers 3. Tax Focus 4. Teamwork
Train Existing
Tax-Pros to be
Wealth Mgmt.
Advisors
Advisors have
existing client base
…with trusted relationship
Offer Tax-Smart
Investing
…integrated with tax
management
Family Atmosphere:
Chapters, Mentors,
Support Groups
Recruit with
Bonuses, Loans,
Higher Payout
Cold Calls
Avoid Tax
Discussion
Tell clients to speak
with their tax advisor
Everyone for
Themselves
Traditional
IBD
Competitive
Advantage
• Advisor loyalty
• Lower avg. payout
• Limited upfront costs
• Trusted relationship
• Personalized approach
• Comprehensive advice
• Tax alpha
• Share best practices
• Client orientation
Increased Loyalty Higher Conversion More Profitable Improved outcomes

19
Organic Business Opportunities Strong Position with Significant Organic Opportunity
Highest Potential
Advisors Evaluate - Recruit
Technology Upgrades
Significantly
Increase Support
Leverage Proprietary
Tax-Smart Platform
1. Optimize Advisor Success & Productivity 3. Improve End-Client Penetration*
2. Transition to New Clearing Platform
(Scheduled for 3Q 2018)
4. Grow Managed Assets (AUM)
Narrow the Gap
Value Drivers
Grow Assets
(AUA)
Increase
Monetization
(ROCA)
• Better capture of interest income ($2-$3M for each 25bps)
• New technology
• DTF Assets Opportunity ($14B off-platform)
Est. $60-$100 million segment income benefit over 10 years
(equal to incremental 1-2 yrs. @ 3Q’17 run-rate).
Increasing PPA for ½ of second quartile HD Vest advisors to average of first
quartile = $20-$25M annual segment income opportunity.
Productivity Per Advisor (PPA) (Top 25 IBDs by Revenue)
70%
Unserved
Percentage of Advisor
Tax Clients Served
Wallet Share of
Served Clients
Increasing tax practice penetration to 40% could represent $20
million annual segment income opportunity.
Every 5 pts represents up to $5 million incremental recurring
segment income opportunity at existing asset levels.
HD Vest
28%
Best-in-Class*
54%
Managed Assets
% of Total
50%
Unserved
30%
Served
50%
Served
*Best in class among broker dealers

20
Key Takeaways – Wealth Management
• LT Growth in assets served by advisors
• Independents taking share
• Continued shift to fee-based
Favorable Industry Trends
Already strong business with significant organic growth opportunities
Differentiated business model, uniquely positioned
• Optimize advisor success & productivity
• Drive end-client penetration
• New clearing platform
• Grow managed assets

21
Tax Preparation

22
TaxAct Performance
$0
$20
$40
$60
$80
$100
$120
$140
$160
19 Consecutive Years of Growth
$-
$10
$20
$30
$40
$50
$60
$70
$80
$90
0.0
1.0
2.0
3.0
4.0
5.0
6.0
7.0
8.0
TY
2011
TY
2012
TY
2013
TY
2014
TY
2015
TY
2016
Preparer Online Segment Income
E-files
(Mil)
Segment Income
($Mil)
• YTD through Sept. 30, 2017
• ARPU – Average revenue per U.S. TaxAct return (e-file)
2014 2015 2016 2017
Revenue ($mil) E-Files & Segment Income ARPU

23
34% 35% 36% 37%
39% 40% 41%
46% 47%
46% 46%
46% 46% 46%
14% 13% 13% 12%
11% 11% 10%
6% 5% 5% 5% 4%
3% 3%
2011 2012 2013 2014 2015 2016 2017
Online
Leader
Online
Leader
Online
Leader
Retail
Leader
Retail
Leader
Retail
Leader
TaxAct TaxAct TaxAct
Other Other Other
0%
20%
40%
60%
80%
100%
2014 (TY13) 2016 (TY15) 2017E (TY16E)
Unit Market Share (DDIY) Consumer Tax Filings by Method
Percentage of U.S. Consumer Returns Processed Annually
Tax Pro DIY Software Paper Store Front
Source: Daymark Consulting, Blucora Estimates
Market Overview

Deductions, Credits & Investments $37.00 $54.99 $79.99 33% - 54%
Business Owner $47.00 $79.99 $114.99 41% - 59%
24
Market Overview (continued)
Savings H&R Block
• DDIY is fastest growing segment of market, but only
commands 12% of industry revenue
• DDIY volumetric leader growing category with focus
on stores
• New entrants targeting ‘free’ segment to sell
customer data
• Any tax reform/simplification expected to benefit DIY
Unit Share
178M Market
Dollar Share
$22B Market
Digital Volumetric Leader
Growing Category
46%
1% CAGR
4% CAGR
Federal Late-Season Pricing *Pricing as of 3/23/17
Tax Filing Market
(U.S. and Canada)
Pros
Stores
DDIY
Paper
69%
$180 ASP
10% 4% CAGR
19%
$225 ASP
40%
5% CAGR
12% $37 ASP
Source: Daymark Consulting, Intuit.
CAGR 2013-2016
ASP – Average Selling Price
Turbo Tax

25
New Entrants: Free
Leader: Free, Stores
Hidden Fees
& Charges
$50++ ‘free’ filings
$30 for copy of return
Varied
Tech: Clunky to Very Good
Support: None to Good
Sell Client Data
Mass Referral
Engine
Backed by True
Financial and
Tax-Expertise
BluVest- Assessment
BluPrint- tax-smart robo
HD Vest – 360o
High Potential
Segments
Pay year 1
Transparent
Excellent Value
Reliable,
Easy to Use
Targeting Pricing Technology & Support
Deepen & Monetize
Relationships
Competitive
Strength
• High long-term value • Loyalty
• Potential ancillary svcs.
• 70% customer retention • Thousands of advisors
• $43B AUA, $12B AUM
Increased LTV Extend Brand Profitable No reason to use others
Others
Differentiated Business Model

26
Win target segments Retain customers,
win-back former customers
• High-potential sub-segments
• High lifetime value • 70% paid retention
• Marketing optimization
• Partnerships
• Distribution
• BluVest™
• Referral to HD Vest Advisor
Business Opportunities
• Cloud migration
• Next-Gen operations &
customer Support
• Artificial Intelligence/Machine
Learning, Cybersecurity
• Marketing optimization
Enhance Winning Capabilities Diversify Revenue

27
Benefitting from secular shift to DDIY
Targeting higher value customer segments
Enhancing platform
Consistent growth in revenue and segment income
Any tax reform/simplification expected to benefit DDIY
Key Takeaways – Tax Preparation

28
Synergies

29
Convert TaxAct professional users to HD Vest financial advisors
• Currently 21,000 TaxAct Pro users vs. 4,400 HD Vest Advisors
Extend financial solutions to TaxAct DDIY tax filers
• Currently 4.3 million TA filers vs. 345,000 HD Vest Customers
• Examples include BluVest, BluPrint, Expert review
Create integrated tax pro software solutions
2018 2019 2020 2021
Business Unit Specific Synergy
While organic growth opportunities are
near-term priority, synergy opportunities
can drive incremental growth.
Synergy Opportunities are Incremental
Blucora Growth Opportunities
(Illustrative)
30
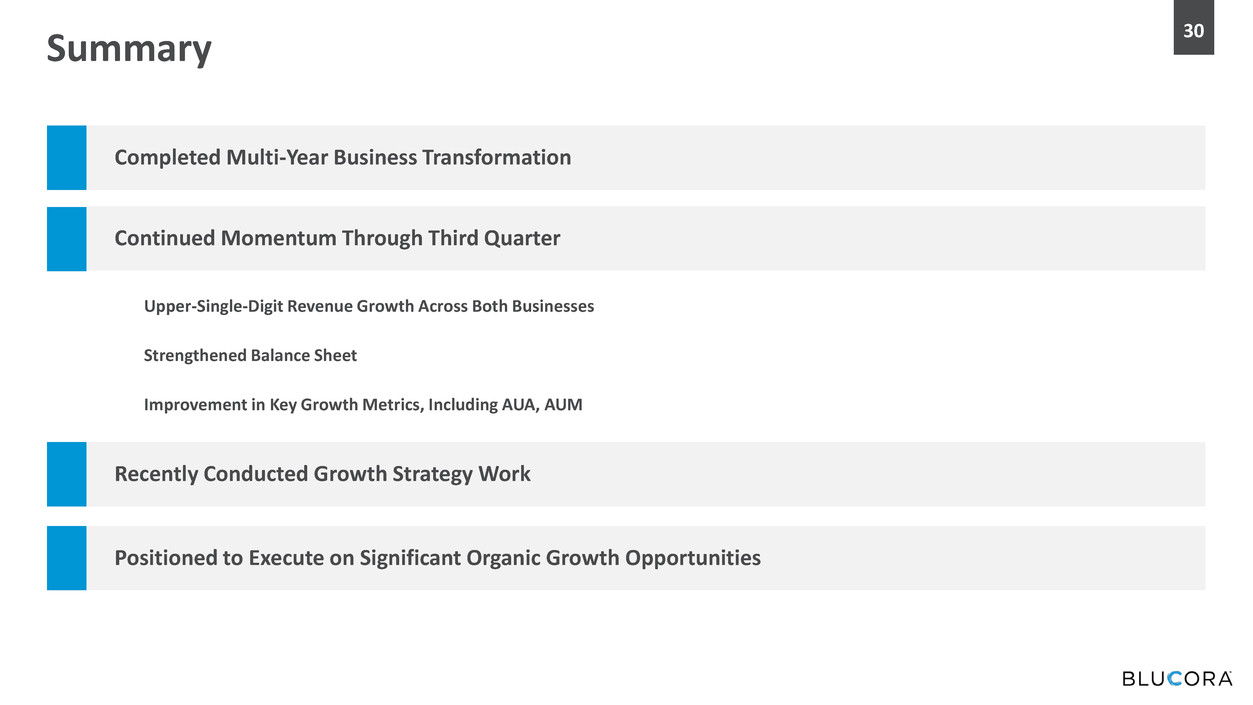
Summary
Completed Multi-Year Business Transformation
Continued Momentum Through Third Quarter
Recently Conducted Growth Strategy Work
Positioned to Execute on Significant Organic Growth Opportunities
Upper-Single-Digit Revenue Growth Across Both Businesses
Strengthened Balance Sheet
Improvement in Key Growth Metrics, Including AUA, AUM

Appendix
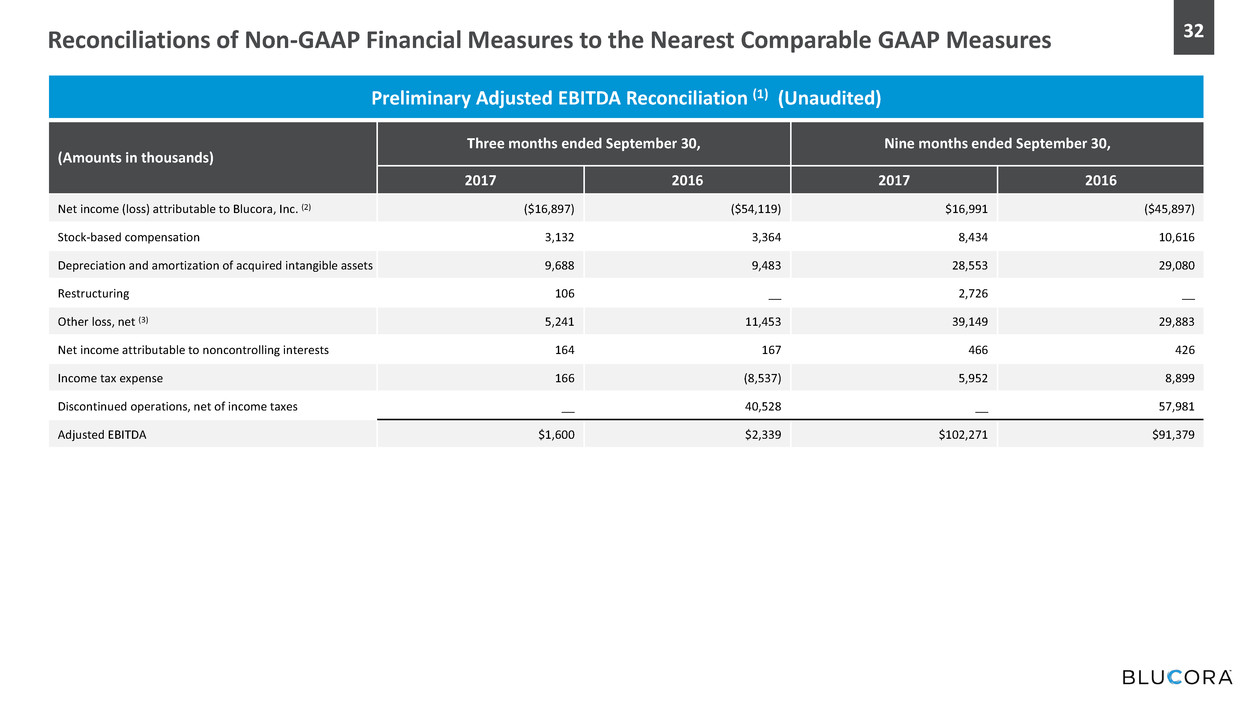
32 Reconciliations of Non-GAAP Financial Measures to the Nearest Comparable GAAP Measures
Preliminary Adjusted EBITDA Reconciliation (1) (Unaudited)
(Amounts in thousands)
Three months ended September 30, Nine months ended September 30,
2017 2016 2017 2016
Net income (loss) attributable to Blucora, Inc. (2) ($16,897) ($54,119) $16,991 ($45,897)
Stock-based compensation 3,132 3,364 8,434 10,616
Depreciation and amortization of acquired intangible assets 9,688 9,483 28,553 29,080
Restructuring 106 __ 2,726 __
Other loss, net (3) 5,241 11,453 39,149 29,883
Net income attributable to noncontrolling interests 164 167 466 426
Income tax expense 166 (8,537) 5,952 8,899
Discontinued operations, net of income taxes __ 40,528 __ 57,981
Adjusted EBITDA $1,600 $2,339 $102,271 $91,379

33
Preliminary Non-GAAP Net Income (Loss) Reconciliation (1) (Unaudited)
(Amounts in thousands,
except per share amounts)
Three months ended September 30, Nine months ended September 30,
2017 2016 2017 2016
Net income (loss) attributable to Blucora, Inc. (2) ($16,897) ($54,119) $16,991 ($45,897)
Discontinued operations, net of income taxes __ 40,528 __ 57,981
Stock-based compensation 3,132 3,364 8,434 10,616
Amortization of acquired intangible assets 8,665 8,346 25,337 25,694
Accretion of debt discount on Convertible Senior
Notes
__ 901 1,567 2,749
Accelerated accretion of debt discount on
Convertible Senior Notes repurchased
__ __ __ 1,628
Gain on Convertible Senior Notes repurchased __ __ __ (7,724)
Write-off of debt discount and debt issuance costs
on terminated Convertible Senior Notes
__ __ 6,715 __
Write-off of debt discount and debt issuance costs
on closed TaxAct - HD Vest 2015 credit facility
__ __ 9,593 __
Acquisition-related costs __ __ __ 391
Restructuring 106 __ 2,726 __
Impact of noncontrolling interests 164 167 466 426
Cash tax impact of adjustments to GAAP net income (928) (17) (3,334) 244
Non-cash income tax expense (1) 224 (9,312) 6,325 6,460
Non-GAAP net income (loss) ($5,534) ($10,142) $74,820 $52,568
Reconciliations of Non-GAAP Financial Measures to the Nearest Comparable GAAP Measures
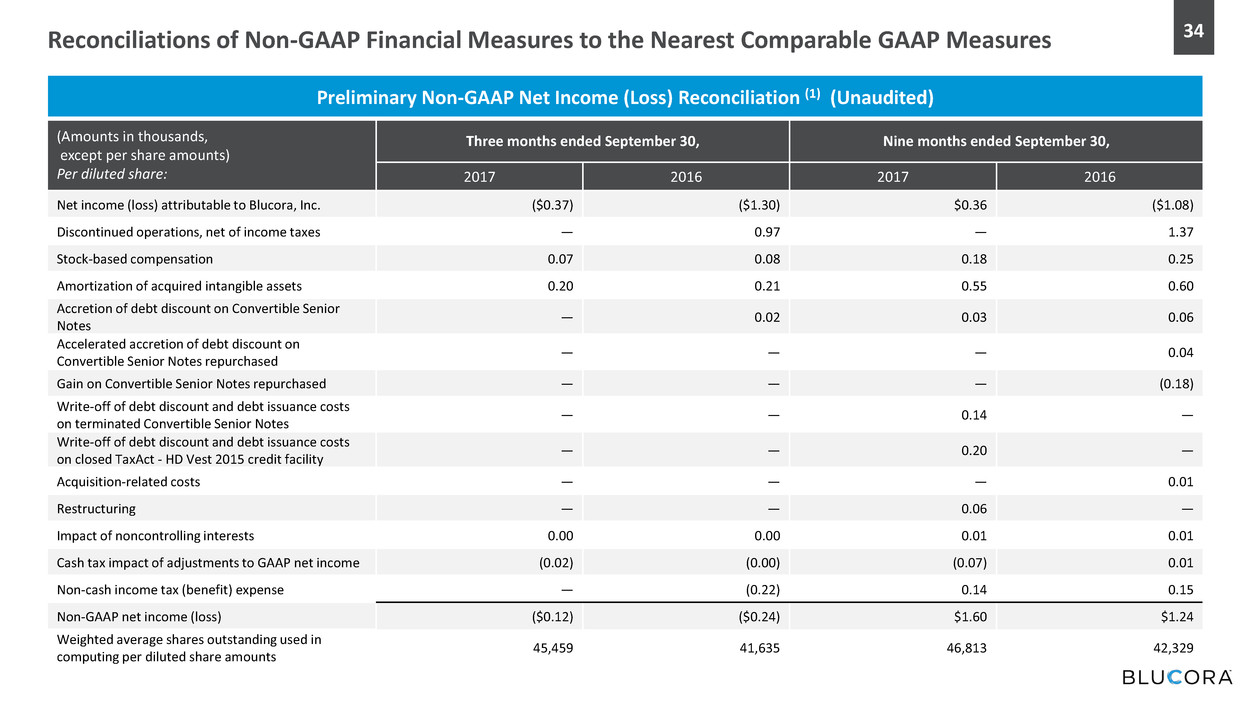
34
Preliminary Non-GAAP Net Income (Loss) Reconciliation (1) (Unaudited)
(Amounts in thousands,
except per share amounts)
Per diluted share:
Three months ended September 30, Nine months ended September 30,
2017 2016 2017 2016
Net income (loss) attributable to Blucora, Inc. ($0.37) ($1.30) $0.36 ($1.08)
Discontinued operations, net of income taxes — 0.97 — 1.37
Stock-based compensation 0.07 0.08 0.18 0.25
Amortization of acquired intangible assets 0.20 0.21 0.55 0.60
Accretion of debt discount on Convertible Senior
Notes
— 0.02 0.03 0.06
Accelerated accretion of debt discount on
Convertible Senior Notes repurchased
— — — 0.04
Gain on Convertible Senior Notes repurchased — — — (0.18)
Write-off of debt discount and debt issuance costs
on terminated Convertible Senior Notes
— — 0.14 —
Write-off of debt discount and debt issuance costs
on closed TaxAct - HD Vest 2015 credit facility
— — 0.20 —
Acquisition-related costs — — — 0.01
Restructuring — — 0.06 —
Impact of noncontrolling interests 0.00 0.00 0.01 0.01
Cash tax impact of adjustments to GAAP net income (0.02) (0.00) (0.07) 0.01
Non-cash income tax (benefit) expense — (0.22) 0.14 0.15
Non-GAAP net income (loss) ($0.12) ($0.24) $1.60 $1.24
Weighted average shares outstanding used in
computing per diluted share amounts
45,459 41,635 46,813 42,329
Reconciliations of Non-GAAP Financial Measures to the Nearest Comparable GAAP Measures

35 Notes to Reconciliations of Non-GAAP Financial Measures
to the Nearest Comparable GAAP Measures
(1) We define Adjusted EBITDA as net income (loss) attributable to Blucora, Inc., determined in accordance with GAAP, excluding the effects of stock-based compensation, depreciation,
amortization of acquired intangible assets (including acquired technology), restructuring, other loss, net, the impact of noncontrolling interests, income tax expense, the effects of discontinued
operations, and acquisition-related costs. Restructuring costs relate to the move of our corporate headquarters, which was announced in the fourth quarter of 2016. Acquisition-related costs
include professional services fees and other direct transaction costs and changes in the fair value of contingent consideration liabilities related to acquired companies. The SimpleTax acquisition
that was completed in 2015 included contingent consideration, for which the fair value of that liability was revalued in the second quarter of 2016.
We believe that Adjusted EBITDA provides meaningful supplemental information regarding our performance. We use this non-GAAP financial measure for internal management and compensation
purposes, when publicly providing guidance on possible future results, and as a means to evaluate period-to-period comparisons. We believe that Adjusted EBITDA is a common measure used by
investors and analysts to evaluate our performance, that it provides a more complete understanding of the results of operations and trends affecting our business when viewed together with
GAAP results, and that management and investors benefit from referring to this non-GAAP financial measure. Items excluded from Adjusted EBITDA are significant and necessary components to
the operations of our business and, therefore, Adjusted EBITDA should be considered as a supplement to, and not as a substitute for or superior to, GAAP net income (loss). Other companies may
calculate Adjusted EBITDA differently and, therefore, our Adjusted EBITDA may not be comparable to similarly titled measures of other companies.
We define non-GAAP net income (loss) as net income (loss) attributable to Blucora, Inc., determined in accordance with GAAP, excluding the effects of discontinued operations, stock-based
compensation, amortization of acquired intangible assets (including acquired technology), accretion of debt discount and accelerated accretion of debt discount on the Convertible Senior Notes
(the "Notes"), gain on the Notes repurchased, write-off of debt discount and debt issuance costs on the Notes that were redeemed and the terminated TaxAct - HD Vest 2015 credit facility,
acquisition-related costs (described further under Adjusted EBITDA above), restructuring costs (described further under Adjusted EBITDA above), the impact of noncontrolling interests, the related
cash tax impact of those adjustments, and non-cash income taxes. The write-off of debt discount and debt issuance costs on the terminated Notes and the closed TaxAct - HD Vest 2015 credit
facility relates to the debt refinancing that occurred in the second quarter of 2017. We exclude the non-cash portion of income taxes because of our ability to offset a substantial portion of our
cash tax liabilities by using deferred tax assets, which primarily consist of U.S. federal net operating losses. The majority of these net operating losses will expire, if unutilized, between 2020 and
2024.
We believe that non-GAAP net income (loss) and non-GAAP net income (loss) per share provide meaningful supplemental information to management, investors, and analysts regarding our
performance and the valuation of our business by excluding items in the statement of operations that we do not consider part of our ongoing operations or have not been, or are not expected to
be, settled in cash. Additionally, we believe that non-GAAP net income (loss) and non-GAAP net income (loss) per share are common measures used by investors and analysts to evaluate our
performance and the valuation of our business. Non-GAAP net income (loss) should be evaluated in light of our financial results prepared in accordance with GAAP and should be considered as a
supplement to, and not as a substitute for or superior to, GAAP net income (loss). Other companies may calculate non-GAAP net income differently, and, therefore, our non-GAAP net income may
not be comparable to similarly titled measures of other companies.
(2) As presented in the Preliminary Condensed Consolidated Statements of Operations (unaudited)
(3) Other loss, net primarily includes items such as interest income, interest expense, amortization of debt issuance costs, accretion of debt discounts, and gain/loss on debt extinguishment.

36 Blucora Net Leverage Ratio
(In thousands except ratio,
rounding differences may exist)
2015 2016 2017
FY 12/31 1Q 2Q 3Q 4Q
FY 12/31
1Q 2Q 3Q
CASH:
Cash and cash equivalents $55,473 $67,955 $74,273 $71,165 $51,713 $51,713 $74,609 $78,312 $78,558
Available-for-sale investments 11,301 11,642 7,821 4,492 7,101 7,101 160 — —
$66,774 $79,597 $82,094 $75,657 $58,814 $58,814 $74,769 $78,312 $78,558
DEBT:
Senior secured credit facility $ — $ — $ — $ — $ — $ — $ — $360,000 $350,000
TaxAct - HD Vest 2015 credit facility 400,000 360,000 340,000 295,000 260,000 260,000 222,000 — —
Convertible Senior Notes 201,250 172,859 172,859 172,859 172,859 172,859 172,859 — —
Note payable, related party 6,400 6,400 6,400 6,400 3,200 3,200 3,200 3,200 3,200
$607,650 $539,259 $519,259 $474,259 $436,059 $436,059 $398,059 $363,200 $353,200
NET DEBT FROM CONTINUING OPERATIONS ($540,876) ($459,662) ($437,165) ($398,602) ($377,245) ($377,245) ($323,290) ($284,888) ($274,642)
OTHER:
Add: Escrow receivable (1) $20,000 $ — $ — $ — $ — $ — $ — $ — $ —
TOTAL NET DEBT FROM CONTINUING OPERATIONS ($520,876) ($459,662) ($437,165) ($398,602) ($377,245) ($377,245) ($323,290) ($284,888) ($274,642)
Last twelve months (pro forma): (2)
SEGMENT INCOME:
Wealth Management $42,997 $45,256 $44,563 $44,703 $46,296 $46,296 $47,243 $49,725 $50,522
Tax Preparation 56,984 60,412 70,318 68,478 66,897 66,897 72,457 79,176 77,320
99,981 105,668 114,881 113,181 113,193 113,193 119,700 128,901 127,842
Unallocated corporate operating expenses (17,750) (18,073) (17,871) (18,345) (18,999) (18,999) (21,073) (23,076) (22,756)
ADJUSTED EBITDA $82,231 $87,595 $97,010 $94,836 $94,194 $94,194 $98,627 $105,825 $105,086
LEVERAGE RATIO 6.3 5.2 4.5 4.2 4.0 4.0 3.3 2.7 2.6
(1) Amount represents consideration funded to escrow that was contingent upon HD Vest's 2015 earnings performance. The contingent consideration was not achieved;
therefore, the amount was returned to the Company from escrow in 1Q16.
(2) The pro forma information represents the combination of HD Vest, TaxAct, and corporate expenses as if the acquisition closed on January 1, 2014. The Company
believes that this presentation most accurately reflects the financial performance of the Company on a go-forward basis.

37
(In thousands, rounding differences may exist)
2015 2016 2017
FY 12/31 1Q 2Q 3Q 4Q FY 12/31 1Q 2Q 3Q
Net cash provided by operating activities from continuing
operations
$24,308 (2) $68,721 (2) $22,165 ($2,349) ($2,567) $85,970 $52,900 $28,236 ($1,906)
Purchases of property and equipment (1,512) (677) (851) (1,120) (1,164) (3,812) (1,165) (746) (1,898)
Operating free cash flow from continuing operations $22,796 $68,044 $21,314 ($3,469) ($3,731) $82,158 $51,735 $27,490 ($3,804)
(1) We define operating free cash flow from continuing operations as net cash provided by operating activities from continuing operations less purchases of property and equipment. We believe operating
free cash flow is an important liquidity measure that reflects the cash generated by the continuing businesses, after the purchases of property and equipment, that can then be used for, among other
things, strategic acquisitions and investments in the businesses, stock repurchases, and funding ongoing operations.
(2) FY 2015 includes $20.0 million of consideration funded to escrow that was contingent upon HD Vest's 2015 earnings performance. The contingent consideration was not achieved; therefore, the
amount was returned to the Company from escrow in 1Q16.
Blucora Reconciliation of Operating Free Cash Flow from Continuing Operations (1)
