Attached files
Table of Contents
UNITED STATES
SECURITIES AND EXCHANGE COMMISSION
Washington, D.C. 20549
FORM 10-K
(Mark One)
| x | ANNUAL REPORT PURSUANT TO SECTION 13 OR 15(d) OF THE SECURITIES EXCHANGE ACT OF 1934 |
For the fiscal year ended December 31, 2009
OR
| ¨ | TRANSITION REPORT PURSUANT TO SECTION 13 OR 15(d) OF THE SECURITIES EXCHANGE ACT OF 1934 |
For the transition period from to
Commission File Number 000-25131
INFOSPACE, INC.
(Exact name of registrant as specified in its charter)
| Delaware | 91-1718107 | |
| (State or other jurisdiction of incorporation or organization) |
(IRS Employer Identification No.) |
601 108th Avenue NE, Suite 1200, Bellevue, Washington 98004
(Address of principal executive offices) (Zip code)
Registrant’s telephone number, including area code:
(425) 201-6100
Securities registered pursuant to Section 12(b) of the Act:
| Title of each class | Name of each exchange on which registered | |
| Common Stock, par value $.0001 per share | NASDAQ Global Select Market |
Securities registered pursuant to Section 12(g) of the Act:
Series C Participating Preferred Stock
(Title of Class)
Indicate by check mark whether the registrant is a well-known seasoned issuer, as defined in Rule 405 of the Securities Act. Yes ¨ No x
Indicate by check mark whether the registrant is not required to file reports pursuant to Section 13 or Section 15(d) of the Act. Yes ¨ No x
Indicate by check mark whether the registrant (1) has filed all reports required to be filed by Section 13 or 15(d) of the Securities Exchange Act of 1934 during the preceding 12 months (or for such shorter period that the registrant was required to file such reports), and (2) has been subject to such filing requirements for the past 90 days. Yes x No ¨
Indicate by check mark whether the registrant has submitted electronically and posted on its corporate Web site, if any, every Interactive Data File required to be submitted and posted pursuant to Rule 405 of Regulation S-T during the preceding 12 months (or for such shorter period that the registrant was required to submit and post such files). Yes ¨ No ¨
Indicate by check mark if disclosure of delinquent filers pursuant to Item 405 of Regulation S-K (§229.405 of this chapter) is not contained herein, and will not be contained, to the best of the registrant’s knowledge, in definitive proxy or information statements incorporated by reference in Part III of this Form 10-K or any amendment to this Form 10-K. x
Indicate by check mark whether the registrant is a large accelerated filer, an accelerated filer, a non-accelerated filer, or a smaller reporting company. See definitions of “large accelerated filer”, “accelerated filer”, and “smaller reporting company” in Rule 12b-2 of the Exchange Act.
| Large accelerated filer ¨ | Accelerated filer x | Non-accelerated filer ¨ | Smaller reporting company ¨ | |||
| (Do not check if a smaller reporting company) |
Indicate by check mark whether the registrant is a shell company (as defined in Rule 12b-2 of the Act). Yes ¨ No x
The aggregate market value of the Common Stock held by non-affiliates of the registrant outstanding as of June 30, 2009, based upon the closing price of Common Stock on June 30, 2009 as reported on the NASDAQ Global Select Market, was $230.9 million. Common Stock held by each officer and director has been excluded because such persons may be deemed to be affiliates. This determination of affiliate status is not necessarily a conclusive determination for other purposes.
As of February 19, 2010, 35,593,453 shares of the registrant’s Common Stock were outstanding.
DOCUMENTS INCORPORATED BY REFERENCE
Part III incorporates certain information by reference from the definitive proxy statement to be filed by the registrant in connection with the 2010 Annual Meeting of Stockholders (the “Proxy Statement”).
Table of Contents
| Part I |
||||
| Item 1. |
3 | |||
| Item 1A. |
11 | |||
| Item 1B. |
24 | |||
| Item 2. |
25 | |||
| Item 3. |
25 | |||
| Item 4. |
25 | |||
| Part II |
||||
| Item 5. |
25 | |||
| Item 6. |
27 | |||
| Item 7. |
Management’s Discussion and Analysis of Financial Condition and Results of Operations |
29 | ||
| Item 7A. |
47 | |||
| Item 8. |
48 | |||
| Item 9. |
Changes in and Disagreements with Accountants on Accounting and Financial Disclosure |
77 | ||
| Item 9A. |
77 | |||
| Item 9B. |
79 | |||
| Part III |
||||
| Item 10. |
80 | |||
| Item 11. |
80 | |||
| Item 12. |
Security Ownership of Certain Beneficial Owners and Management and Related Stockholder Matters |
80 | ||
| Item 13. |
Certain Relationships and Related Transactions, and Director Independence |
80 | ||
| Item 14. |
80 | |||
| Part IV |
||||
| Item 15. |
81 | |||
| 82 | ||||
Table of Contents
This report contains forward-looking statements that involve risks and uncertainties. The statements in this report that are not purely historical are forward-looking statements within the meaning of Section 21E of the Securities Exchange Act of 1934, as amended. Words such as “anticipate,” “believe,” “plan,” “expect,” “future,” “intend,” “may,” “will,” “should,” “estimate,” “predict,” “potential,” “continue,” and similar expressions identify forward-looking statements, but the absence of these words does not mean that the statement is not forward looking. These forward-looking statements include, but are not limited to, statements regarding projections of our future financial performance; trends in our businesses; our future business plans and growth strategy, including our plans to expand, develop or acquire particular operations or businesses; and the sufficiency of our cash balances and cash generated from operating, investing, and financing activities for our future liquidity and capital resource needs.
Forward-looking statements are subject to known and unknown risks, uncertainties and other factors that may cause our results, levels of activity, performance, achievements and prospects, and those of the Internet industries generally, to be materially different from those expressed or implied by such forward-looking statements. These risks, uncertainties and other factors include, among others, those identified under Item 1A, “Risk Factors” and elsewhere in this report. You should not rely on forward-looking statements, which speak only as of the date of this Annual Report on Form 10-K. We do not undertake any obligation to update publicly any forward-looking statement to reflect new information, events or circumstances after the date of this Annual Report on Form 10-K or to reflect the occurrence of unanticipated events.
| ITEM 1. | Business |
Overview
InfoSpace, Inc. (“InfoSpace”, “our” or “we”) develops search tools and technologies that assist consumers with finding content and information on the Internet. We offer search services that enable Internet users to locate and view content, information, merchants, individuals, and products online. We offer search services through our own Web sites, such as Dogpile.com, WebCrawler.com, MetaCrawler.com, and WebFetch.com, as well as through the Web sites of distribution partners. Partner versions of our Web offerings are generally private-labeled and delivered with each distribution partner’s unique requirements.
Our search offerings differ from most other mainstream search services in that they utilize our “metasearch” technology that selects results from several search engines, including Google, Yahoo!, and Bing, among others, which serve as our content providers. Some content providers, such as Google and Yahoo!, pay us to distribute their content, and we refer to those providers as our customers.
We compete against other providers of Web search services. We also compete against more traditional media, including radio, network and cable television, newspaper, magazines, Internet, direct mail and others for a share of the U.S. advertising media market. Until the fourth quarter of 2007, InfoSpace was comprised of three businesses: online search, online directory, and mobile. We exited portions of our mobile business in 2006 and 2007 and sold our online directory business and the remaining portions of our mobile services business in the fourth quarter of 2007. Following the sale of our mobile and directory businesses, our revenues are derived almost exclusively from providing online search services.
We plan to use a portion of our cash and investments to acquire businesses, including businesses that may not be related to online search.
We were founded in 1996 and are incorporated in the state of Delaware. Our principal corporate office is located in Bellevue, Washington. We also have offices in Bangalore, India and Palo Alto, California. Our common stock is listed on the NASDAQ Global Select Market under the symbol “INSP.”
Revenue Sources
Our customers are primarily search content providers that provide paid search links for display as part of our search services. From these content providers, whom we refer to as our customers, we license rights to certain search products and services, including both non-paid and paid search links. We receive revenues from our
3
Table of Contents
customers when an end user of our Web search services clicks on a paid search link that is provided by that customer and displayed on one of our owned and operated Web properties or displayed on the Web property of one of our search distribution partners. Revenues are recognized in the period in which such paid clicks occur and are based on the amounts earned and remitted to us by our customers for such clicks. In addition, we earn revenue from certain distribution partners, such as a fixed monthly fee in exchange for portal infrastructure services.
We derive a significant portion of our revenue from a small number of customers and we expect that this concentration will continue in the foreseeable future. Google and Yahoo! each accounted for more than 10% of our revenues in 2009 and jointly accounted for more than 95% of our revenues in 2009, 2008 and 2007. If either of these customers reduces or eliminates the services they provide to us or our distribution partners, or if either of these customers is unwilling to pay us amounts they owe us, it could materially harm our business and financial results.
Our main customer agreements are with Google and Yahoo!. Our principal agreements with Google and Yahoo! expire in April and January 2011, respectively, and we plan to negotiate renewals of these agreements. Each agreement may be renewed only upon mutual written agreement of the parties to the agreement. Both Google and Yahoo! have requirements and guidelines regarding, and reserve certain rights of approval over, the use and distribution of their respective search products and services. The requirements and guidelines are frequently subject to differing interpretations by the parties, and both Google and Yahoo! may modify certain requirements and guidelines of their agreements with us in their discretion. If Google or Yahoo! believe that we or our search distribution partners have failed to meet the requirements and guidelines promulgated under these customer agreements, they may suspend or terminate our or our distribution partners’ use and distribution of such customer’s search products and services, with or without notice, and in the event of certain violations, may terminate their agreements with us. We and our distribution partners have limited rights to cure breaches of the requirements and guidelines.
Google and Yahoo! each make certain representations and warranties to us in the agreements regarding the content and operation of their search products and services, and we make certain representations and warranties in the agreements regarding our use and distribution of their search products and services. Under these agreements, the parties also provide for some indemnification relating to these representations and warranties; Google and Yahoo! provide certain indemnification with respect to ownership of the content and technology provided by their search products and services, and we provide certain indemnification with respect to our, and our distribution partners’, use and distribution of Google and Yahoo!’s search products and services.
Our partners for distribution of our online search services include Internet service providers, Web portals and software application providers. We generated approximately 42%, 23% and 31% of our online search revenues through relationships with our top five distribution partners in 2009, 2008 and 2007, respectively. Our agreements with most of our distribution partners come up for renewal in 2010 and 2011, and we plan to negotiate renewals for many of these agreements. In addition, some of our distributors have the right to terminate their agreements immediately in the event of certain breaches. We anticipate that our content and distribution costs for our revenue-sharing arrangements with our distribution partners will increase as revenues grow, and may increase as a percentage of revenues to the extent that there are changes to existing arrangements or we enter into new arrangements on less favorable terms. Recently, we have experienced increased competition from our customers, seeking to enter into content provider agreements directly with our existing or potential distribution partners, making it increasingly difficult for us to renew agreements with existing major distribution partners or to enter into distribution agreements with new partners on favorable terms.
Product Development
We believe that our technology is essential to expand and enhance our products and services and maintain the attractiveness and competitiveness of our products and services. Product development expenses were $5.6 million in 2009, $9.9 million in 2008 and $9.9 million in 2007.
4
Table of Contents
Intellectual Property
Our success depends significantly upon our technology and intellectual property rights. To protect our rights and the value of our corporate brands and reputation, we rely on a combination of copyright, patent, domain name and trademark laws, trade secrets protection, confidentiality agreements with employees and third parties and protective contractual provisions. We also rely on laws pertaining to trademarks and domain names to protect our interests. It is our policy to require employees and contractors to execute confidentiality and non-use agreements that prohibit the unauthorized disclosure and use of our confidential and proprietary information and, if applicable, that transfer to us any rights they may have in inventions and discoveries, including but not limited to trade secrets, copyrightable works or patentable technologies that they may develop while under our employ. In addition, prior to entering into discussions with third parties regarding our business and technologies, we generally require that such parties enter into confidentiality and non-use agreements with us. If these discussions result in a license or other business relationship, we also generally require that the agreement setting forth the parties’ respective rights and obligations include provisions for the protection of our intellectual property rights. For example, the standard language in our agreements with distribution partners provides that we retain ownership of our intellectual property in our technologies and requires them to display our patent, copyright and trademark notices, as appropriate.
We hold 37 trademarks registered in the United States and 79 trademarks registered in various foreign countries. We also have applied for registration of certain service marks and trademarks in the United States and in other countries, and will seek to register additional marks in the U.S. and foreign countries, as appropriate. We may not be successful in obtaining registration for the service marks and trademarks for which we have applied or maintaining the registration of existing marks. In addition, if we are unable to acquire and maintain domain names associated with those trademarks (for example, dogpile.com, webcrawler.com, metacrawler.com, and infospace.com), the value of our trademarks may be diminished.
We hold 6 U.S. patents. Our issued patents relate to online search, advertisement and location services, among others. We believe that the duration of the applicable patents is adequate relative to the expected lives of our services. We are currently pursuing certain pending U.S. and foreign patent applications that relate to various aspects of our technology. We anticipate ongoing patent application activity in the future. However, patent claims may not be issued and, if issued, may be challenged or invalidated by third parties. In addition, issued patents may not provide us with any competitive advantages.
We may be unable to adequately or cost-effectively protect or enforce our intellectual property rights, and failure to do so could weaken our competitive position and negatively impact our business and financial results. If others claim that our products infringe their intellectual property rights, we may be forced to seek expensive licenses, reengineer our products, engage in expensive and time-consuming litigation or stop marketing and licensing our products. See the section entitled “Risk Factors” in Part I, Item 1A of this report for additional information regarding protecting and enforcing intellectual property rights by us and third parties against us.
MetaCrawler License Agreement. We hold an exclusive, perpetual worldwide license, subject to certain limited exceptions, to the MetaCrawler intellectual property and related search technology from the University of Washington. The technology currently used in some of our web search services could potentially be considered a derivative work of that licensed technology.
Competition
We operate in the online search market, which is extremely competitive and rapidly changing. We consider our primary competitors to be Google, Yahoo!, Bing (Microsoft) and other providers of online search services. Our current and prospective competitors include many large companies that have substantially greater resources than we have, some of whom are also our customers, and many small and start-up companies with a large variety of competitive products and services. If our competitors develop software and application services that are superior to ours, or that achieve greater market acceptance than ours, our business will suffer.
5
Table of Contents
We believe that the primary competitive factors in the market for online search services are:
| • | the ability to meet the specific information, content, and service demands of a particular Web property; |
| • | the cost-effectiveness, reliability and security of the products and application services; |
| • | the ability to provide products and application services that are innovative and attractive to consumers and other end users; |
| • | the ability to provide products or applications services, such as embedded search browsers, default search provider settings within the search browsers or downloadable applications, that displace our search services; |
| • | the ability to develop innovative products and services that enhance the appearance and utility of the Web properties; |
| • | the ability to meet the needs of major customers and distribution partners; and |
| • | the ability to develop and market new or enhanced products and search services. |
Although we believe that no one competitor offers all of the products and services we do in online search, we face competition from various sources. We compete, directly or indirectly, in the following ways, among others:
| • | Google, Yahoo! and other customers are also our competitors. Many of our current competitor customers have had relationships with some of our current and potential distribution partners. In addition to competing with us on their own Web properties, our customers may contract directly with our distribution partners to provide our distribution partners with online search services and products; |
| • | our online search services also compete against more traditional media, including radio, network and cable television, newspaper, magazines, Internet, direct mail and others for a share of the U.S. advertising market; |
| • | other information and content services we provide compete with specialized content providers; and |
| • | in international markets, in addition to competing with U.S.-based search providers, we compete with local companies whose greater understanding of and focus on a particular local market may provide a competitive advantage. |
We expect that in the future we will experience competition from other Internet application companies, as well as from other content providers. Some of these potential competitors are currently customers or distribution partners of ours, the loss of which could harm our business.
Governmental Regulation
Because of the increasing use of the Internet, U.S. and foreign governments have adopted or may in the future adopt laws and regulations relating to the Internet, addressing issues such as consumer protection, user privacy, security, pricing, age verification, content, taxation, copyrights and other intellectual property, distribution, advertising and product and services quality.
Recent concerns regarding Internet user privacy have led to the introduction of U.S. federal and state legislation to protect user privacy and data security. Existing federal laws regarding user privacy that we may be subject to include the Children’s Online Privacy Protection Act, which regulates the online collection of personal information from children under 13, and the Gramm-Leach-Bliley Act, which regulates the collection and processing of personal information by financial institutions as well as imposes information security obligations. In addition, the Federal Trade Commission (the “FTC”) has used its authority to regulate unfair and deceptive trade practices to investigate and regulate user privacy and data security concerns, and such investigations or regulation could adversely affect our business. Various states have likewise sought to regulate consumer protection, advertising, privacy and data security in ways that may affect the collection, use and disclosure of
6
Table of Contents
information. For example, California has passed several laws relating to the collection, storage and distribution of personal information, requiring in part the posting of a privacy policy and disclosure of how information is shared with third parties for marketing purposes as well as obligating businesses to secure such information. In addition, numerous states now require that companies notify individuals of security breaches that may result in third parties gaining unauthorized access to certain types of personal information. We believe we take reasonable steps to protect the security and confidentiality of the information we collect and store but there is no guarantee that third parties will not gain unauthorized access despite our efforts or that we will not incur costs in complying with our notification obligations under such circumstances.
We must also comply with federal and state laws and regulations governing online promotions and the taxation of items sold online. Additionally, certain bills are pending and some laws have been passed in certain jurisdictions setting forth requirements that must be met before a downloadable application is downloaded to an end user’s computer.
Foreign countries in which our services are provided have enacted, and may in the future enact, laws and regulations that may affect our ability to provide such services or the manner in which they are provided, including laws governing the provision of online search services, including the collection, use, disclosure, display and retention of end user information and data as part of such services, or laws and regulations governing online auctions.
Many countries outside of the United States have more restrictive privacy laws than the United States. The European Union, for example, strictly regulates the collection, use and transfer of personal information of its residents. Further, information lawfully collected in the European Union may not be transferred for processing outside the European Union to a country that lacks adequate protections. The European Union has deemed the U.S. to lack such protections and transfers of personal information gathered in the European Union to the United States are only permitted under limited circumstances. Additionally, regulatory authorities in the European Union increasingly take a different view from the U.S. with respect to what constitutes personal information, especially in the context of IP addresses. The European Union also increasingly seeks to regulate the duration for which a business can maintain information it has collected. Other countries such as Canada follow models similar to the European Union albeit without express prohibitions on data export. These and similar restrictions may limit our ability to collect, use, and transfer information regarding Internet users in those countries.
We may be subject to provisions of the Federal Trade Commission Act and similar state laws that regulate consumer protection and advertising in all media, including the Internet, and require advertisers to substantiate advertising claims before disseminating advertising. The FTC and various state attorneys general have recently brought actions charging deceptive advertising via the Internet and may actively monitor Internet advertising.
Other countries similarly regulate direct and indirect marketing. For example, the European Union has enacted an electronic communications directive that imposes certain restrictions on the use of cookies and action tags as well as the sending of unsolicited communications. Also, like the United States, the members of the European Union and other countries each may have localized consumer protection, advertising, and privacy related legislation that may impose additional costs or limit our ability to conduct business in such regions and elsewhere.
These or other laws or regulations that may be enacted in the future could have adverse effects on our business, including higher regulatory compliance costs, limitations on our ability to provide some services in some states or countries, and liabilities that might be incurred through lawsuits or regulatory penalties. See the section entitled “Risk Factors” in Part I, Item 1A of this report for additional information.
Seasonality
Our search services are affected by seasonal fluctuations in Internet usage, which generally declines in the summer months.
7
Table of Contents
Employees
As of February 19, 2010, we had 157 employees. None of our employees are represented by a labor union and we consider employee relations to be positive. There is significant competition for qualified personnel in our industry, particularly for software development and other technical staff. We believe that our future success will depend in part on our continued ability to hire and retain qualified personnel.
Company Internet Site and Availability of SEC Filings
Our corporate Internet site is located at www.infospaceinc.com. We make available on that site our Annual Reports on Form 10-K, Quarterly Reports on Form 10-Q and Current Reports on Form 8-K, as well as any amendments to those filings and other reports filed with or furnished to the U.S. Securities and Exchange Commission (the “SEC”). Our SEC filings, as well as our Code of Conduct and Ethics and other corporate governance documents, can be found in the Investor Relations section of our site and are available free of charge. Information on our Internet site is not part of this Annual Report on Form 10-K. In addition, the SEC maintains an Internet site at www.sec.gov that contains reports, proxy and information statements, and other information regarding us and other issuers that file electronically with the SEC.
Executive Officers and Directors of the Registrant
The following table sets forth certain information as of February 19, 2010 with respect to our executive officers and directors:
| Name |
Age | Position | ||
| William J. Lansing |
51 | Chief Executive Officer, President and Director | ||
| David B. Binder |
40 | Chief Financial Officer and Treasurer | ||
| Leo S. Chang |
36 | Chief Technology Officer | ||
| Eric M. Emans |
36 | Chief Accounting Officer | ||
| Michael J. Glover |
47 | Vice President, Distribution and Business Development | ||
| Alesia L. Pinney |
46 | General Counsel and Secretary | ||
| John J. Rodkin |
37 | General Manager of Search | ||
| James F. Voelker |
59 | Chairman of the Board | ||
| John E. Cunningham, IV |
52 | Director | ||
| Jules Haimovitz |
59 | Director | ||
| Richard D. Hearney |
70 | Director | ||
| Elizabeth I. Huebner |
52 | Director | ||
| Braden R. Kelly |
39 | Director | ||
| William J. Ruckelshaus |
45 | Director | ||
| Lewis M. Taffer |
62 | Director |
William J. Lansing has served as our Chief Executive Officer and President, and as a director, since February 2009. From December 2003 to October 2007, Mr. Lansing served as Chief Executive Officer, President and as a director of ValueVision Media, Inc., a direct marketing company. From September 2001 to December 2003, he served as a General Partner of General Atlantic LLC, a private equity investment firm. From April 2000 to August 2001, he was Chief Executive Officer of NBC Internet, Inc., an integrated Internet media company. From April 1998 to March 2000, he served as President, then as Chief Executive Officer, of Fingerhut Companies, Inc., a direct marketing company. From November 1996 to May 1998, Mr. Lansing served as Vice President, Corporate Business Development for General Electric Company. Mr. Lansing serves on the Board of Directors of Fair Isaac Corporation and RightNow Technologies, Inc.
David B. Binder has served as our Chief Financial Officer and Treasurer since January 2008. Mr. Binder joined InfoSpace as Vice President of Finance in October 2004. From November 2001 to October 2004, he served as Director, and later Senior Director, of Business Development at drugstore.com, Inc., an online drug store.
8
Table of Contents
Leo S. Chang has served as our Chief Technology Officer since May 2009. From January 2009 to May 2009, Mr. Chang was Principal Technical Consultant to F-Four, an operational consulting and proprietary software firm that he co-founded. From October 2007 to February 2009, Mr. Chang served as co-founder of Green Hedges, Inc., an insurance company. From December 2006 to January 2008, Mr. Chang held two roles at Webtrends Inc., a computer software company, first as Director of Software and later as Interim Vice President of Engineering. From May of 2005 until November 2006, Mr. Chang served as Chief Technology Officer for ClickShift, an Internet advertising optimization company that he co-founded and that was acquired by Webtrends Inc. in November 2006. From June of 2002 to May of 2005, Mr. Chang served as Vice President of Software at Savi Technology, Inc., a computer software company.
Eric M. Emans has served as our Chief Accounting Officer since January 2008. Mr. Emans joined the Company as Corporate Controller in September 2006. However, Mr. Emans had previously held various positions at the Company from September 2003 to December 2005, including Manager, Revenue Assurance and Senior Manager, Finance. From December 2005 to September 2006, he served as Director, Mobile Operations, at Corbis Corporation, a provider of visual content and rights services. He began his career as an auditor at Deloitte & Touche, LLP.
Michael J. Glover has served as our Vice President, Distribution and Business Development since October 2008. Mr. Glover has held various positions in Business Development since joining InfoSpace in October 2000. From April 2008 to September 2008, he served as Vice President, Business Development. From April 2006 to March 2008, he served as Senior Director, Business Development, after serving as Director, Business Development from June 2004 to April 2006. From January 2004 to June 2004, he served as Senior Manager, Business Development, after serving as Business Development Manager from October 2000 to December 2003.
Alesia L. Pinney has served as our General Counsel and Secretary since July 2009. From September 2006 to July 2009, Ms. Pinney provided operational and legal services to four privately held companies in transition, including Sound Inpatient Physicians, LLC as its Chief Administrative Officer, Secretary and General Counsel (2008-09), Talyst, Inc. as its Executive Vice President Operations and Legal (2007-08), Lighthouse Document Technologies, Inc. as its Acting General Counsel (2007) and Weldon Barber as its Chief Operating Officer and General Counsel (2006-07). Prior to such time, Ms. Pinney was employed by drugstore.com, Inc. as its Vice President, Legal and Human Affairs, Secretary and General Counsel from June 2005 to December 2006 and as its Vice President, General Counsel and Secretary from October 2000 to June 2005.
John J. Rodkin has served as our General Manager of Search since May 2009. From January 2009 to May 2009, Mr. Rodkin was Chief Executive Officer of F-Four, an operational consulting and proprietary software firm that he co-founded. From October 2007 to January 2009, Mr. Rodkin served as Chief Executive Officer of Green Hedges, Inc., an insurance company. From December 2006 to December 2007, Mr. Rodkin held two roles at Webtrends Inc., a computer software company, first as Vice President and General Manager, Digital Advertising Solutions, and later as Interim Vice President of Engineering and Product Management. From June 2005 to November 2006, Mr. Rodkin served as CEO of ClickShift, an Internet advertising optimization company that was acquired by Webtrends Inc. in November 2006. From June 2004 to August 2004, Mr. Rodkin served as an Entrepreneur in Residence at US Venture Partners, a venture capital firm.
James F. Voelker has served as our Chairman of the Board since December 2002. He also served as Chief Executive Officer from December 2002 to February 2009, and also as President from December 2005 to February 2009. He also held the title of President from December 2002 to April 2003. He has served as a director since July 2002. Mr. Voelker served as President and a director of NEXTLINK Communications, Inc. (now XO Communications, Inc.), a broadband communications company, from its inception in 1994 through 1998.
John E. Cunningham, IV has served as a director of InfoSpace since July 1998. Mr. Cunningham has been a general partner of Clear Fir Partners, L.P., a private equity investment partnership, since February 1998. From July 2006 to June 2008, he served as a board member of Citel Technologies, Inc., a telecommunications company, and also served as its non-executive Chairman from January 2004 to July 2006. From April 1996 until February 2003, he served as President of Kellett Investment Corporation, an investment fund for private companies.
9
Table of Contents
Jules Haimovitz has served as a director of InfoSpace since October 2005. Since July 2007, he has served as President of Haimovitz Consulting, a media consulting firm. From July 2002 to July 2007, Mr. Haimovitz served as Vice Chairman and Managing Partner of Dick Clark Productions Inc., a producer of programming for television, cable networks and syndicators. From June 1999 to July 2004, Mr. Haimovitz served in various capacities at Metro Goldwyn Mayer Inc., including President of MGM Networks Inc., Executive Consultant to the CEO, and Chair of the Library Task Force. Mr. Haimovitz is a director of Blockbuster, Inc.
Richard D. Hearney has served as a director of InfoSpace since September 2001. General Hearney served as President and Chief Executive Officer of Business Executives for National Security, an organization focusing on national security policy, from December 2000 to April 2002.
Elizabeth Huebner has served as a director of InfoSpace since May 2009. Mrs. Huebner retired from a 26-year career in the finance sector in 2006. Prior to retiring, Mrs. Huebner was Chief Financial Officer from 2000 to 2006 at Getty Images, Inc., a provider of visual content and rights services.
Braden Kelly has served as a director of InfoSpace since September 2009. Mr. Kelly currently serves as a senior advisor to Health Evolution Partners, a San Francisco-based private equity firm. Additionally, Mr. Kelly serves on the board of edo Interactive, Inc., a developer in digital payment and marketing platforms. From 1995 to 2006, Mr. Kelly was with General Atlantic LLC, a private equity investment firm focused on growth investing, where he served as a partner and managing director. Prior to joining General Atlantic, Mr. Kelly worked in the investment banking division at Morgan Stanley & Co. as a member of the mergers, acquisitions and restructuring department.
William J. Ruckelshaus has served as a director of InfoSpace since May 2007. Mr. Ruckelshaus has served as Chief Operating Officer of Audience Science, Inc. (formerly known as Revenue Science Inc.), an Internet advertising technology and services company, since August 2008, as well as its Chief Financial Officer since May 2006. From July 2002 to April 2006, he served as Senior Vice President Corporate Development at Expedia, Inc., an online travel agency, where he oversaw Expedia’s mergers and acquisitions and led the corporate strategic planning effort.
Lewis M. Taffer has served as a director of InfoSpace since June 2001. Since March 2006, Mr. Taffer has served as an Operating Advisor at Pegasus Capital Advisors, a private equity fund manager. Since May 2006, he has also served as a director and Senior Vice President at iGPS Company LLC, a provider of RFID (radio frequency identification)-tagged plastic pallet rental systems and an affiliate of Pegasus Capital Advisors. Since January 2005, he has been an independent management consultant. From January 2004 to January 2005, Mr. Taffer served as Executive Vice President, Acquisition Marketing of America Online, Inc. From May 2001 through December 2003, Mr. Taffer was an independent consultant specializing in marketing, business development and strategic partnerships.
10
Table of Contents
| ITEM 1A. | Risk Factors |
RISKS RELATED TO OUR BUSINESS
Most of our revenue is attributable to Google and Yahoo!, and the loss of or a payment dispute with either of these customers (or any future significant customer) would harm our business and financial results.
We acquire rights to content from third-party content providers, whom we refer to as customers, and our future success is highly dependent upon our ability to maintain and renew relationships with these customers. Google and Yahoo! jointly accounted for over 95% of our online search revenues in 2009, 2008 and 2007, and we expect that concentration will continue. Our principal agreements with Google and Yahoo! expire in April and January 2011, respectively. In addition, Google, Yahoo! and our other customers are competitors of each other, and the way we do business with one of them may not be acceptable to one or some of their competitors with whom we also do business, which may result in Google, Yahoo! or other customers not renewing their agreements with us on favorable terms or at all. Google, Yahoo! or other customers are also our competitors, and they have had relationships with some of our current and potential search distribution partners. In addition to competing with us on their own Web properties, our customers may, in the future, contract directly with our distribution partners to provide online search services and products. If Google, Yahoo! or any future significant customer were to substantially reduce or eliminate the content it provides to us or to our distribution partners, not renew its contract with us on favorable terms, be unwilling to pay us amounts that it owes us, or dispute amounts it owes us or has paid to us for any reason (including for the reasons described in the risk factors below), our business and financial results could materially suffer to the extent we were unable to establish and maintain new customer relationships, or expand our remaining customer relationships, to replace the lost or disputed revenue.
Failure by us or our search distribution partners to comply with the guidelines promulgated by Google and Yahoo! relating to the use of content may cause that customer to temporarily or permanently suspend the use of its content or terminate its agreement with us, or may require us to modify or terminate certain distribution relationships.
If we or our search distribution partners fail to meet the guidelines promulgated by Google or Yahoo! for the use of their content, we may not be able to continue to use their content or provide the content to such distribution partners. Our agreements with Google and Yahoo! give them the ability to suspend the use and the distribution of their content for non-compliance with their requirements and guidelines and, in the case of breaches of certain other provisions of their agreements, to terminate their agreements with us immediately, regardless of whether such breaches could be cured.
The terms of the customer agreements with Google and Yahoo! and related guidelines are subject to differing interpretations by the parties. Google and Yahoo! have in the past suspended, and may in the future, suspend their content provided to our Web sites or the Web sites of our distribution partners, without notice, if they believe that we or our distribution partners are not in compliance with their guidelines or are in breach of the terms of their agreements. During such suspension we will not receive any revenue from our site or the site of the affected distribution partner with respect to the suspended content, and the loss of such revenue could harm our business and financial results.
Additionally, as our business evolves, we expect that the guidelines of Google and Yahoo!, as well as the parties’ interpretations of compliance, breach and sufficient justification for suspension of use of content will change. This may result in further suspensions of our use and may require us to terminate our agreement with distribution partners or forego entering into agreements with distribution partners. The loss or reduction of content that we can use or make available to our distribution partners as a result of suspension, termination or modification of distribution or customer agreements, particularly our Google and Yahoo! agreements, could have a material adverse effect on our business and financial results.
11
Table of Contents
A substantial portion of our revenues is dependent on our relationships with a small number of distribution partners who distribute our online search services, the loss of which could have a material adverse effect on our business and financial results.
We rely on our relationships with online search distribution partners, including Internet service providers, Web portals and software application providers, for distribution of our online search services. In 2009, 76% of our total revenues came from searches conducted by end users on the Web properties of our search distribution partners. We generated approximately 42%, 23% and 31% of our online search revenues through relationships with our top five distribution partners in 2009, 2008 and 2007, respectively. There can be no assurance that these relationships will continue or will result in benefits to us that outweigh their cost. Moreover, as the proportion of our revenue generated by distribution partners has increased, we have experienced and expect to continue to experience less control and visibility over performance. One of our challenges is providing our distribution partners with relevant products and services at competitive prices in rapidly evolving markets. Distribution partners may create their own products and services or may seek to license products and services from our competitors or replace the products and services that we provide. Also, many of our distribution partners have limited operating histories and evolving business models that may prove unsuccessful even if our products and services are relevant and our prices competitive. If we are unable to maintain relationships with our distribution partners, our business and financial results could be materially adversely affected.
Our agreements with most of our distribution partners come up for renewal in 2010 and 2011. In addition, some of our distributors have the right to immediately terminate their agreements in the event of certain breaches. Such agreements may be terminated, may not be renewed or may not be renewed on favorable terms, any of which could adversely impact our business and financial results. We anticipate that our content and distribution costs for our revenue-sharing arrangements with our distribution partners will increase as revenues grow, and may increase as a percentage of revenues to the extent that there are changes to existing arrangements or we enter into new arrangements on less favorable terms.
In addition, competition continues for quality consumer traffic in the online search market. Recently, we have experienced increased competition from our customers as they seek to enter into content provider agreements directly with our existing or potential distribution partners, making it increasingly difficult for us to renew agreements with existing major distribution partners or to enter into distribution agreements with new partners on favorable terms. Any difficulties that we experience with maintaining or strengthening our business relationships with our major distribution partners could have an adverse effect on our business and financial results.
If advertisers perceive that they are not receiving quality traffic to their sites through their paid-per-click advertisements, they may reduce or eliminate their advertising through the Internet. Further, if Google, Yahoo! or other customers perceive that they are not receiving quality traffic from our own Web sites or the Web property of a distribution partner, they may reduce the fees they pay to us. Either of these factors could have a negative material impact on our business and financial results.
Most of our revenues from our online search business are based on the number of paid clicks on commercial search results served on our owned and operated Web properties or our distribution partners’ Web properties. Each time a user clicks on a commercial search result, the customer that provided the commercial search result receives a fee from the advertiser who paid for the click and the customer pays us a portion of that fee. If the click originated from one of our distribution partners’ Web properties, we share a portion of the fee we receive with such partner. If an advertiser receives what it perceives to be poor quality traffic, meaning that the advertiser’s objectives are met for an insufficient percentage of clicks for which it pays, the advertiser may reduce or eliminate its advertisements through the customer that provided the commercial search result to us. This leads to a loss of revenue for our customers and consequently fewer fees paid to us. Also, if a customer perceives that the traffic originating from one of our Web properties or the Web property of a distribution partner is of poor quality, the customer may discount the amount it charged all advertisers whose paid click advertisements appeared on such Web site or Web property based on the amount of poor quality traffic the
12
Table of Contents
customer deems to have been generated, and accordingly may reduce the fees it would have otherwise paid us. The customer may also suspend or terminate our ability to provide its content through such Web sites or Web properties if such activities are not modified to satisfy the customer’s concerns. The payment of fewer fees to us or the inability to provide content through such Web sites or Web properties, particularly the content of Google and Yahoo!, could have a material negative effect on our business and financial results.
Poor quality traffic may be a result of invalid click activity. Such invalid click activity occurs, for example, when a person or automated click generation program clicks on a commercial search result to generate fees for the Web property displaying the commercial search result rather than to view the Web page underlying the commercial search result. Some of this invalid click activity is referred to as “click fraud.” When such invalid click activity is detected, the customer may not charge the advertiser or may refund the fee paid by the advertiser for such invalid clicks. If the invalid click activity originated from one of our distribution partners’ Web properties or our owned and operated properties, such non-charge or refund of the fees paid by the advertisers in turn reduces the amount of fees the customer pays us. The resulting loss of revenue, particularly with respect to Google or Yahoo! content, could harm our business and financial results.
A significant part of our growth strategy involves identifying, acquiring or developing and successfully integrating businesses, some or all of which may not be complementary to our current operations or leverage our current infrastructure and operational experience. Our financial and operating results will suffer if we are unsuccessful in integrating acquired businesses.
An important component of our strategy for future growth is to identify, acquire or develop and successfully integrate new businesses into InfoSpace. We may be unable to identify acceptable targets for acquisition or development, and if we are successful, we will likely decide to diversify our business by acquiring targets that may not be complementary to our current operations and may not leverage our existing infrastructure or operational experience. Further, competition for acquisitions of businesses has been, and may in the future continue to be, intense. As a result, even if we are able to identify an acquisition that we would like to consummate, we may not be able to complete the acquisition on commercially reasonable terms. Moreover, any such acquisition may not prove successful. In the past, our financial results have suffered significantly due to impairment charges of goodwill and other intangible assets related to prior acquisitions.
Acquisitions or development of new businesses may involve the use of cash, potentially dilutive issuances of stock, the potential incurrence of debt and contingent liabilities or amortization expenses related to certain intangible assets. If outside financing is needed, we may be unable to obtain it on acceptable terms or at all in light of the current capital market conditions and other factors. The cost of development or acquisition, as the case may be, may be greater than anticipated by us or investors.
Acquisitions involve numerous other risks that could materially and adversely affect our results of operations or stock price, including:
| • | difficulties in assimilating the operations, products, technology, information systems and management and other personnel of acquired companies that result in unanticipated costs, delays or allocation of resources; |
| • | the dilutive effect on earnings per share as a result of issuances of stock, as well as incurring operating losses and the amortization of acquired intangible assets for the acquired business; |
| • | initial stock volatility due to the perceived value of the acquired business by investors; |
| • | diverting management’s attention from current operations and other business concerns, including potential strain on financial and managerial controls and reporting systems and procedures; |
| • | disruption of our ongoing business or the ongoing acquired business, including impairment of existing relationships with our employees, distributors, suppliers or customers or those of the acquired companies; |
13
Table of Contents
| • | diversion of capital from other uses; |
| • | failing to achieve the anticipated benefits of the acquisitions in a timely manner or at all; |
| • | difficulties in acquiring foreign companies, including risks related to integrating operations across different cultures and languages, currency risks and the particular economic, political and regulatory risks associated with specific countries; and |
| • | adverse outcome of litigation matters assumed in or arising out of the acquisitions. |
Development or acquisition of a technology or business, and then integrating that technology or business into InfoSpace, will be complex, time consuming and expensive, particularly if we acquire a technology or business that is not in our current industry. For example, the successful integration of an acquisition requires, among other things, that we retain key personnel; maintain and support preexisting supplier, distribution and customer relationships; and integrate accounting and support functions. The complexity of the technologies and operations being integrated and, in the case of an acquisition, the disparate corporate cultures and/or industries being combined, may increase the difficulties of integrating an acquired technology or business. If our integration of acquired or internally developed technologies or businesses is not successful, we may experience adverse financial or competitive effects. Moreover, there can be no assurance that the short- or long-term value of any technology or business that we develop or acquire will be equal to the value of the cash and other consideration that we paid or expenses we incurred.
We have a history of incurring net losses, we may incur net losses in the future, and we may not be able to regain or sustain profitability on a quarterly or annual basis.
We have incurred net losses on an annual basis for all but four of the years since our inception, and as of December 31, 2009, we had an accumulated deficit of $1.0 billion. We may incur net losses in the future, including but not limited to losses resulting from our operations, loss on investments, the impairment of goodwill or other intangible assets, losses from acquisitions, restructuring charges or expense related to stock-based compensation and other equity awards. There can be no assurance that we will be able to achieve and maintain consistent profitability in the future.
Our financial results are likely to continue to fluctuate, which could cause our stock price to continue to be volatile or decline.
Our financial results have varied on a quarterly basis and are likely to continue to fluctuate in the future. These fluctuations could cause our stock price to be volatile or decline. Many factors could cause our quarterly results to fluctuate materially, including but not limited to:
| • | changes or potential changes in our relationships with Google or Yahoo! or future significant customers, such as effects of changes to their requirements or guidelines or their measurement of the quality of traffic we send to their advertiser networks, and any resulting loss or reduction of content that we can use or make available to our distribution partners; |
| • | the loss, termination or reduction in scope of key distribution relationships, for example as a result of distribution partners licensing content directly from content providers or any suspension by our customers (particularly Google and Yahoo!) of the right to use or distribute content on the Web properties of our distribution partners; |
| • | our strategic initiatives and our ability to implement those initiatives, including increased costs related to investments for new initiatives, including new products and services, marketing and new distribution channels; |
| • | the mix of search revenues generated by our owned and operated Web properties versus our distribution partners’ Web properties, and the mix of revenues generated by our search business versus other businesses we develop or acquire; |
14
Table of Contents
| • | our ability to attract and retain quality traffic; |
| • | litigation expenses, including but not limited to settlement costs; |
| • | variable demand for our products and services, rapidly evolving technologies and markets, and consumer preferences; |
| • | the effects of acquisitions by us, our customers, or our distribution partners; |
| • | increases in the costs or availability of content for our products and services; |
| • | additional restructuring charges we may incur in the future; |
| • | the economic downturn, which may lead to lower online advertising spend by advertisers, resulting in lower monetization rates for paid search; |
| • | the adoption of new laws, rules or regulations, or new court rulings, that adversely affect our ability to continue to acquire content and distribute our search products and services, or the ability of our customers or distribution partners to continue to provide us with their content or distribute our products and services, that affect our ability to offer non-search products and services such as our recently launched Haggle.com auction service, or increase our potential liability; |
| • | impairment in the value of long-lived assets or the value of acquired assets, including goodwill, core technology and acquired contracts and relationships; |
| • | the effect of changes in accounting principles or in our accounting treatment of revenues or expenses; and |
| • | the adoption of new regulations or accounting standards. |
For these reasons, among others, you should not rely on period-to-period comparisons of our financial results to forecast our future performance. Furthermore, our fluctuating operating results may fall below the expectations of securities analysts or investors and financial results volatility could make us less attractive to investors, either of which could cause the trading price of our stock to decline.
Our stock price has been and is likely to continue to be highly volatile.
The trading price of our common stock has been highly volatile. Since our common stock began trading on December 15, 1998, our stock price has ranged from $3.70 to $1,385.00 (as adjusted for stock splits). Between January 8, 2008, which was the date that we paid our most recent special dividend, and December 31, 2009, our stock price has ranged from $5.20 to $12.52. On February 19, 2010, the closing price of our common stock was $10.35. Our stock price could decline or fluctuate wildly in response to many factors, including the other risks discussed in this section and the following, among others:
| • | actual or anticipated variations in quarterly and annual results of operations; |
| • | announcements of significant acquisitions, dispositions, charges, changes in or loss of material contracts, new customer or distribution partner relationships or other business developments by us, our customers, distribution partners or competitors; |
| • | conditions or trends in the online search services market; |
| • | changes in general conditions in the U.S. and global economies or financial markets; |
| • | announcements of technological innovations or new products or services by us or our competitors; |
| • | changes in financial estimates or recommendations by securities analysts; |
| • | disclosures of any accounting issues, such as restatements or material weaknesses in internal control over financial reporting; |
15
Table of Contents
| • | equity offerings resulting in the dilution of stockholders; |
| • | the adoption of new regulations or accounting standards; and |
| • | announcements or publicity relating to litigation and similar matters. |
In addition, the stock market in general, and the NASDAQ Global Select Market and the market for Internet and technology company securities in particular, have experienced extreme price and volume fluctuations. These broad market and industry factors and general economic conditions may materially and adversely affect our stock price. Our stock has been subject to such price and volume fluctuations in the recent past. Often, class action litigation has been instituted against companies after periods of volatility in the overall market and in the price of such companies’ stock. If such litigation were to be instituted against us, even if we were to prevail, it could result in substantial cost and diversion of management’s attention and resources.
Our recently launched Haggle.com business will expose us to new regulatory risks.
In the fourth quarter of 2009, we launched www.haggle.com, a competitive shopping Web site. Shoppers pre-purchase packs of bids for a small fee, and the bidding itself helps cover the cost of the items up for auction. In some cases, the total amount spent on bids used during the auction exceeds the cost of the item. In others, the total amount spent on bids is less than the cost of the item. The progress and success of a new business line entails substantial uncertainty. In particular, it is unclear how current and future governmental regulation will affect the Haggle.com business. Numerous states and foreign jurisdictions have regulations regarding auctions and may attempt to impose those regulations on us or on Haggle.com users. We must also comply with federal and state laws and regulations governing online promotions and the taxation of Internet commerce, and addressing these regulations could require us to develop additional technology or otherwise expend significant time and expense. We understand that some academics and others have suggested that prepaid bidding fee auctions resemble games of chance and/or gambling. We believe that the results of Haggle.com auctions depend on the skill of the participants and that, because the last bidder purchases the item at the final bid price, the items in the auction are not “prizes” won by “wagering.” If lawmakers or regulators were to decide that bidding fee auctions are games of chance or constitute gambling, businesses like Haggle.com could become illegal or subject to regulation as online gambling. We would be unable to conduct our Haggle.com business in any jurisdiction that prohibits prepaid bidding fee auctions, and we may be unable to continue operating Haggle.com in other jurisdictions where regulatory compliance becomes too burdensome or expensive.
If we are unable to hire, retain and motivate highly qualified employees, including our key employees, we may not be able to successfully manage our business.
Our future success depends on our ability to identify, attract, hire, retain and motivate highly skilled technical, managerial, sales and marketing, and corporate development personnel. Qualified personnel with experience relevant to our online search business are scarce and competition to recruit them is intense. If we fail to successfully hire and retain a sufficient number of highly qualified employees, we may have difficulties in supporting our customers or expanding our business. Realignments of resources, reductions in workforce, or other operational decisions have created and could continue to create an unstable work environment and may have a negative effect on our ability to hire, retain and motivate employees.
Our business and operations are substantially dependent on the performance of our key employees, all of whom are employed on an at-will basis. We have recently experienced significant changes at our executive management level and we may experience more changes in the future. Changes of management or key employees may cause disruption to our operations, which may materially and adversely affect our business and financial results or delay achievement of our business objectives. In addition, if we lose the services of one or more key employees and are unable to recruit and retain a suitable successor(s), we may not be able to successfully and timely manage our business or achieve our business objectives. There can be no assurance that any retention program we initiate will be successful at retaining employees, including key employees.
16
Table of Contents
In light of current market conditions, the value of stock options or restricted stock units granted to employees may cease to provide sufficient incentive to our employees.
Like many technology companies, we use stock options, restricted stock units and other equity-based awards to recruit technology professionals and senior level employees. We now issue only restricted stock units to employees, other than executives and selected employees, because stock options are not currently seen as providing enough incentive to attract or retain employees. With respect to those employees to whom we issue options, we face a significant challenge in retaining them if the value of these stock options (together with the value of any restricted stock units) is either not substantial enough or so substantial that the employee leaves after their stock options have vested. If our stock price does not increase significantly above the exercise prices of our options, we may need to issue new options, in order to motivate and retain our executives; or if option programs become impracticable, we may need to issue other equity incentives or increase other forms of compensation. We may undertake or seek stockholder approval to undertake other equity-based programs to retain our employees, which may be viewed as dilutive to our stockholders or may increase our compensation costs. Additionally, there can be no assurance that any such programs we undertake, including the restricted stock unit awards, will be successful in motivating and retaining our employees.
Our online search services may expose us to claims relating to how the content was obtained, distributed or displayed.
Our online search services link users, either directly through our own Web sites or indirectly through the Web properties of our distribution partners, to third-party Web pages and content in response to search queries and other requests. These services could expose us to legal liability from claims relating to such third-party content and sites, the manner in which these services are distributed and displayed by us or our distribution partners, or how the content provided by our customers was obtained or provided by our customers. Such claims could include the following: infringement of patent, copyright, trademark, trade secret or other intellectual property or proprietary rights; violation of privacy and publicity rights; unfair competition; defamation; providing false or misleading information; obscenity; pornography; and illegal gambling. Regardless of the legal merits of any such claims, they could result in costly litigation, be time consuming to defend and divert management’s attention and resources. If there were a determination that we had violated third-party rights or applicable law, we could incur substantial monetary liability, be required to enter into costly royalty or licensing arrangements (if available), or be required to change our business practices. We may also have obligations to indemnify and hold harmless certain of our customers or distribution partners for damages they suffer for such violations under our contracts with them. Implementing measures to reduce our exposure to such claims could require us to expend substantial resources and limit the attractiveness of our products and services. As a result, these claims could result in material harm to our business.
In the past, there have been legal actions brought or threatened against distributors of downloadable applications deemed to be “adware” or “spyware.” Additionally, certain bills are pending and some laws have been passed in certain jurisdictions setting forth requirements that must be met before a downloadable application is downloaded to an end user’s computer. We provide downloadable applications to promote use of our search services for our owned and operated search services. Such applications may be considered adware. We also partner with some distribution partners that provide adware to their users if the partners adhere to our strict guidelines requiring them, among other things, to disclose to the user what the adware does and to obtain the consent of the user before the application is downloaded. The adware must also be easy to uninstall. We also review the application the partner proposes to use before we distribute our results to them. We also have the right to audit our partners, and if we find that they are not following our guidelines, we can terminate our agreement with them or cease providing content to that downloadable application. Some partners have not been able to meet the new guidelines imposed by us or some of our customers, and we no longer provide the applicable content or any content, as the case may be, to such partners or certain of their downloadable applications. We work closely with some of our major customers to try to identify potential distribution partners that do not meet our guidelines or are in breach of our distribution agreements and we work with our distribution partners to ensure they deliver
17
Table of Contents
quality traffic. However, there can be no assurance that the measures we implement to reduce our exposure to claims that certain ways in which the content is distributed violate legal requirements will be successful. Any claims against us as a result of violations of legal requirements or contractual obligations could result in material harm to our business.
Our data center systems or the systems of the third-party co-location facilities in which they are located could fail or become unavailable, which could harm our reputation, result in a loss of revenues and current and potential customers and cause us to breach agreements with our partners.
We provide our own data center services from two geographically diverse third-party co-location facilities. Although the two data centers provide some redundancy, not all of our systems and operations have backup redundancy. Such systems and operations could be damaged or interrupted by fire, flood, earthquakes or other natural disasters, power loss, telecommunications failure, Internet breakdown, break-in, or other events beyond our control. We could face significant damage as a result of these events, and our business interruption insurance may not be adequate to compensate us for all the losses that may occur. In addition, such third-party co-location facilities and data center systems use sophisticated equipment, infrastructure and software that may contain bugs or suffer outages that could interrupt service. During the period in which service is unavailable, we will be unable or severely limited in our ability to generate revenues, and we may also be exposed to liability from those third parties to whom we provide products and services through our data centers. For these reasons, our business and financial results could be materially harmed if our systems and operations are damaged or interrupted, including if we are unable to develop, or if we or our third-party co-location facility providers are unable to successfully manage, the infrastructure necessary to meet current or future demands for reliability and scalability of our systems.
If the volume of traffic to our products and services, which runs through our data centers, increases substantially, we must respond in a timely fashion by expanding our systems, which may entail upgrading our technology and network infrastructure. Our ability to support our expansion and upgrade requirements may be constrained due to our business demands or constraints of our third-party co-location facility providers. Due to the number of our customers and the products and services that we offer, we could experience periodic capacity constraints which may cause temporary unanticipated system disruptions, slower response times and lower levels of customer service, and limit our ability to develop and release new or enhanced products and services. Our business could be harmed if we are unable to accurately project the rate or timing of increases, if any, in the use of our products and application services or we fail to expand and upgrade our systems and infrastructure to accommodate these increases in a timely manner.
The security measures we have implemented to secure information we collect and store may be breached. Security breaches may pose risks to the uninterrupted operation of our systems and could cause us to breach agreements with our customers and distribution partners and expose us to potential investigation and penalties by authorities and potential claims by persons whose information was disclosed.
Our networks or those from third parties that we utilize may be vulnerable to unauthorized access by hackers or others, computer viruses and other disruptive problems. Someone who is able to circumvent security measures could misappropriate our proprietary information or cause interruptions in our operations. Subscribers to some of our services are required to provide information in order to utilize the service that may be considered to be personally identifiable or private information. Unauthorized access to, and abuse of, this information could subject us to litigation, penalties from regulatory agencies and other loss or liability.
We take reasonable steps to protect the security, integrity and confidentiality of the information we collect and store but there is no guarantee that inadvertent or unauthorized disclosure will not occur or that third parties will not gain unauthorized access despite our efforts. If such unauthorized disclosure or access does occur, we may be required under existing and proposed laws to notify persons whose information was disclosed or accessed. We also may be subject to claims of breach of contract for such disclosure, investigation and penalties
18
Table of Contents
by regulatory authorities and potential claims by persons whose information was disclosed. Any such claims could result in costly litigation or liability, be time consuming to resolve and divert the attention and resources of management and other personnel.
We may need to expend significant capital or other resources protecting against the threat of security breaches or alleviating problems caused by breaches. Although we intend to continue to implement and improve our security measures, persons may be able to circumvent the measures that we implement in the future. Eliminating computer viruses and alleviating other security problems may require interruptions, delays or cessation of service to users accessing our services, any of which could harm our business and financial results.
We may be subject to liability for our use or distribution of information that we gather or receive from third parties and indemnity protections or insurance coverage may be inadequate to cover such liability.
We obtain content and commerce information from third parties. When we distribute this information, we may be liable for the data that is contained in that content. This could subject us to legal liability for such things as defamation, negligence, intellectual property infringement, violation of privacy or publicity rights and product or service liability, among others. Laws or regulations of certain jurisdictions may also deem some content illegal, which may expose us to legal liability as well. We also gather personal information from users in order to provide personalized services. Gathering and processing this personal information may subject us to legal liability for, among other things, negligence, defamation, invasion of privacy or product or service liability. We are also subject to laws and regulations, both in the United States and abroad, regarding the collection and use of end user information and search related data. If we do not comply with these laws and regulations, we may be exposed to legal liability.
Although the agreements by which we obtain content contain indemnity provisions, these provisions may not cover a particular claim or type of claim or the party giving the indemnity may not have the financial resources to cover the claim. Our insurance coverage may be inadequate to cover fully the amounts or types of claims that might be made against us. Any liability that we incur as a result of content we receive from third parties could harm our financial results.
If others claim that our products infringe their intellectual property rights, we may be forced to seek expensive licenses, reengineer our products, engage in expensive and time-consuming litigation or stop marketing and licensing our products.
Companies and individuals with rights relating to the Internet, software and application services industries have frequently resorted to litigation regarding intellectual property rights. In some cases, the ownership or scope of an entity’s or person’s rights is unclear and may also change over time, including through changes in U.S. or international intellectual property laws or regulations or through court decisions or decisions by agencies or regulatory boards that manage such rights.
Third parties have in the past and may in the future make claims against us alleging infringement of copyrights, trademarks, trade secret rights, intellectual property or other proprietary rights, or alleging unfair competition or violations of privacy or publicity rights. Responding to any such claims could be time-consuming, result in costly litigation, divert management’s attention, cause product or service release delays, require us to redesign our products or services or require us to enter into royalty or licensing agreements. Our technology and intellectual property may not be able to withstand any third-party claims or rights against their use. If a successful claim of infringement were made against us and we could not develop non-infringing technology or license the infringed or similar technology on a timely and cost-effective basis, our business could suffer.
We do not regularly conduct patent searches to determine whether the technology used in our products infringes patents held by third parties. Patent searches may not return every issued patent that may be deemed relevant to a particular product or service. It is therefore difficult to determine, with any level of certainty,
19
Table of Contents
whether a particular product or service may be construed as infringing a U.S. or foreign patent. Because patent applications in the United States are not publicly immediately disclosed, applications may have been filed by third parties that relate to our products. In addition, other companies, as well as research and academic institutions, have conducted research for many years in the search technology field, and this research could lead to the filing of further patent applications or affect filed applications.
If we were to discover that our products violated or potentially violated third-party proprietary rights, we might be required to obtain licenses that are costly or contain terms unfavorable to us, or expend substantial resources to reengineer those products so that they would not violate such third-party rights. Any reengineering effort may not be successful, and any such licenses may not be available on commercially reasonable terms, if at all. Any third-party infringement claims against us could result in costly litigation or liability and be time consuming to defend, divert management’s attention and resources, cause product and service delays or require us to enter into royalty and licensing agreements.
We rely heavily on our technology and intellectual property, but we may be unable to adequately or cost-effectively protect or enforce our intellectual property rights, thus weakening our competitive position and negatively impacting our business and financial results. We may have to litigate to enforce our intellectual property rights, which can be time consuming, expensive and difficult to predict.
To protect our rights in our products, services, and technology, we rely on a combination of copyright and trademark laws, patents, trade secrets, and confidentiality agreements with employees and third parties and protective contractual provisions. We also rely on laws pertaining to trademarks and domain names to protect the value of our corporate brands and reputation. Despite our efforts to protect our proprietary rights, unauthorized parties may copy aspects of our products, services or technology, or obtain and use information, marks or technology that we regard as proprietary, or otherwise violate or infringe our intellectual property rights. In addition, it is possible that others could independently develop substantially equivalent intellectual property. If we do not effectively protect our intellectual property, or if others independently develop substantially equivalent intellectual property, our competitive position could be weakened.
Effectively policing the unauthorized use of our products, services, and technology is time-consuming and costly, and the steps taken by us may not prevent misappropriation of our technology or other proprietary assets. The efforts we have taken to protect our proprietary rights may not be sufficient or effective, and unauthorized parties may obtain and use information, marks or technology that we regard as proprietary, copy aspects of our products or services, or use similar marks or domain names. In some cases, the ownership or scope of an entity’s or person’s rights is unclear and may also change over time, including through changes in U.S. or international intellectual property laws or regulations or through court decisions or decisions by agencies or regulatory boards that manage such rights. Our intellectual property may be subject to even greater risk in foreign jurisdictions, as protection is not sought or obtained in every country in which our products, services, and technology are available and it is often more difficult and costly to enforce our rights in foreign jurisdictions. Moreover, the laws of many countries do not protect proprietary rights to the same extent as the laws of the United States and intellectual property developed for us by our employees or contractors in foreign jurisdictions may not be as protected as if created in the United States.
We may have to litigate to enforce our intellectual property rights, to protect our trade secrets or to determine the validity and scope of others’ proprietary rights which are sometimes not clear or may change. Litigation can be time consuming, expensive and difficult to predict.
Delaware law and our charter documents may impede or discourage a takeover, which could cause the market price of our shares to decline.
We are a Delaware corporation and the anti-takeover provisions of Delaware law impose various impediments to the ability of a third party to acquire us, even if a change of control would be beneficial to our existing stockholders. For example, Section 203 of the Delaware General Corporation Law may discourage,
20
Table of Contents
delay or prevent a change in control by prohibiting us from engaging in a business combination with an interested stockholder for a period of three years after the person becomes an interested stockholder. In addition, our certificate of incorporation and bylaws contain provisions that may discourage, delay or prevent a third party from acquiring us without the consent of our board of directors, even if doing so would be beneficial to our stockholders. Provisions of our charter documents which could have an anti-takeover effect include:
| • | the classification of our board of directors into three groups so that directors serve staggered three-year terms, which may make it difficult for a potential acquirer to gain control of our board of directors; |
| • | the requirement for supermajority approval of stockholders for certain business combinations; |
| • | the ability of our board of directors to authorize the issuance of shares of undesignated preferred stock without a vote of stockholders; |
| • | the ability of our board of directors to amend or repeal the bylaws; |
| • | limitations on the removal of directors; |
| • | limitations on stockholders’ ability to call special stockholder meetings; |
| • | advance notice requirements for nominating candidates for election to our board of directors or for proposing matters that can be acted upon by stockholders at stockholder meetings; and |
| • | certain limited transfer restrictions on our common stock designed to preserve our federal net operating loss carryforwards (“NOLs”). |
On July 19, 2002, our board of directors adopted a stockholder rights plan, pursuant to which we declared and paid a dividend of one right for each share of common stock held by stockholders of record as of August 9, 2002. Unless redeemed by us prior to the time the rights are exercised, upon the occurrence of certain events, the rights will entitle the holders to receive shares of our preferred stock, or shares of an acquiring entity. The issuance of the rights would make the acquisition of InfoSpace more expensive to the acquirer and could delay or discourage third parties from acquiring InfoSpace without the approval of our board of directors.
If there is change in our ownership within the meaning of Section 382 of the Internal Revenue Code, our ability to utilize our NOLs may be severely limited or potentially eliminated.
As of December 31, 2009, we had NOLs of approximately $815 million that will expire over a twelve to twenty year period. If we were to have a change of ownership within the meaning of Section 382 of the Internal Revenue Code (defined as a cumulative change of 50 percentage points or more in the ownership positions of certain stockholders owning 5% or more of a company’s common stock over a three-year rolling period), then under certain conditions, the amount of NOLs we could use in any one year could be limited to an amount equal to our market capitalization, net of substantial non-business assets, at the time of the ownership change multiplied by the federal long-term tax exempt rate. Our certificate of incorporation imposes certain limited transfer restrictions on our common stock that we expect will assist us in preventing a change of ownership and preserving our NOLs, but there can be no assurance that these restrictions will be sufficient. If we are unable to use our NOLs before they expire, or if the use of this tax benefit is severely limited or eliminated by a change of ownership, there could be a material reduction in the amount of after-tax income and cash flow from operations, and it could have an effect on our ability to engage in certain transactions.
Restructuring and streamlining our business, including implementing reductions in workforce, discretionary spending, and other expense reductions, may harm our business.
We have in the past and may in the future find it advisable to take measures to streamline operations and reduce expenses, including, without limitation, reducing our workforce or discretionary spending. Effecting any restructuring or streamlining places significant strains on management, our employees, and our operational, financial, and other resources. In addition, such actions could impair our development, marketing, sales and
21
Table of Contents
customer support efforts or alter our product development plans. We may also incur liability from early termination or assignment of contracts, potential failure to meet required support levels of our platforms due to loss of employees who maintain such platforms, potential litigation and other effects from such restructuring and streamlining. Such effects from restructuring and streamlining could have a negative impact on our business and financial results.
If our former mobile content providers disagree with our estimate of our royalty liability due to them, it could expose us to significant liability and adversely impact our business and financial results.
Under our agreements with our former mobile content providers, we calculated our royalty liability based on inputs from various sources of data and have been and continue to be subject to audits by our former mobile content providers. If our former mobile content providers disagree with the royalty amounts we calculated were due to them and we are unable to resolve those disagreements amicably, it may subject us to potential litigation and substantial costs even if it is found that the amounts we determined were due to them were accurate. If a former mobile content provider prevails in showing that the royalty amount due to it was not what was intended under our agreement with them and our estimate of the royalty liability was significantly different, it could subject us to significant liability to the affected mobile content provider and have an adverse effect on our business and financial results. Two former mobile content providers initiated law suits against us due to such type of disagreements which have since been settled and did not have a material adverse effect on the Company’s business or results of operations. It is possible that other former mobile content providers may disagree with the royalty amount due to them and initiate their own litigation, or may allege a disagreement as a means to obtain an audit to search for other potential claims, such as intellectual property infringement. Any claims by former mobile content providers could result in costly litigation, liability and diversion of management’s attention and resources, and any adverse outcomes could have a material adverse effect on our business and financial results.
Our presence in India is subject to many risks.
We operate an office in Bangalore, India in which we develop technology. The risks of doing business in India include the following, among others:
| • | increased risks and burdens of complying with multiple, different, and often conflicting legal and regulatory standards; |
| • | limitations on the repatriation of funds and fluctuations of foreign exchange rates; |
| • | changes in and/or difficulties in complying with applicable laws and regulations in the United States that affect foreign operations, including the Foreign Corrupt Practices Act; |
| • | reduced ability to enforce, and increased difficulty and cost of enforcing, our contracts, proprietary rights, and intellectual property rights; and |
| • | barriers to market, such as tariffs, adverse tax consequences, and technology export controls. |
If we cannot manage these risks effectively, the costs of doing business in India may be prohibitive.
RISKS RELATED TO THE INDUSTRIES IN WHICH WE OPERATE
Intense competition in the online search markets could prevent us from increasing distribution of our services in those markets or cause us to lose market share.
Our current business model depends on distribution of our products and services into the online search market, which are extremely competitive and rapidly changing. Many of our competitors or potential competitors have substantially greater financial, technical and marketing resources, larger customer bases, longer operating histories, more developed infrastructures, greater name recognition or more established relationships in the industry than we have. Our competitors may be able to adopt more aggressive pricing policies, develop and
22
Table of Contents
expand their product and service offerings more rapidly, adapt to new or emerging technologies and changes in customer and distribution partner requirements more quickly, take advantage of acquisitions and other opportunities more readily, achieve greater economies of scale, and devote greater resources to the marketing and sale of their products and services than we can. Some of the companies we compete with are currently customers of ours, the loss of any of which could harm our business. Because of these competitive factors and due to our relatively small size and financial resources, we may be unable to compete successfully in the online search market and, to the extent that these competitive factors apply to other markets that we pursue, in such other markets.
Additionally, our business and financial results could be adversely affected as well if our distribution partners create their own products and services that compete or replace the products and services we provide or they acquire such products and services from other sources. We continue to experience increased competition from customers seeking to enter into agreements directly with our existing or potential distribution partners, making it increasingly difficult for us to renew agreements with existing major distribution partners or to enter into distribution agreements with new partners on favorable terms.
Consolidation in the industries in which we operate could lead to increased competition and loss of customers.
The Internet industry (including online search) has experienced substantial consolidation. This consolidation may continue. These acquisitions could adversely affect our business and results of operations in a number of ways, including the following:
| • | customers could acquire or be acquired by one of our other customers, or enter into new business relationships with each other, and stop licensing content to us or gain additional negotiating leverage in their relationships with us; |
| • | our distribution partners could acquire or be acquired by one of our competitors and terminate their relationship with us; |
| • | our distribution partners could merge with each other, which could reduce our ability to negotiate favorable terms; and |
| • | competitors could improve their competitive positions through strategic acquisitions or new business relationships with each other. |
Consolidation in the Internet industry could have a material and adverse effect on our business and results of operations.
Governmental regulation and the application of existing laws may slow business growth, increase our costs of doing business and create potential liability.
The growth and development of the Internet has led to new laws and regulations, as well as the application of existing laws to the Internet, in both the U.S. and foreign jurisdictions. See “—Government Regulation” in Part I, Item 1 of this report for additional information. Application of these laws can be unclear. For example, it is unclear how many existing laws regulating or requiring licenses for certain businesses (such as gambling, online auctions, distribution of pharmaceuticals, alcohol, tobacco or firearms, or insurance, securities brokerage and legal services) apply to online search services, online advertising and our business. The costs of complying or failure to comply with these laws and regulations could limit our ability to operate in our markets (including limiting our ability to distribute our products and services, conduct targeted advertising, collect, use or transfer user information or comply with new data security requirements), expose us to compliance costs and substantial liability and result in costly and time-consuming litigation. It is impossible to predict whether or when any new legislation may be adopted or existing legislation or regulatory requirements will be deemed applicable to us, any of which could materially and adversely affect our business.
23
Table of Contents
Any failure by us to comply with our posted privacy policies, Federal Trade Commission (“FTC”) requirements or other privacy-related laws and regulations could result in proceedings by the FTC or others, including potential class action litigation, which could potentially have an adverse effect on our business, results of operations and financial condition. In this regard, there are a large number of legislative proposals before the United States Congress and various state legislative bodies regarding privacy and data protection issues related to our business. It is not possible to predict whether or when such legislation may be adopted, and certain proposals, if adopted, could materially and adversely affect our business through a decrease in user registrations and revenues. This could be caused by, among other possible provisions, the required use of disclaimers or other requirements before users can utilize our services.
The FTC has recommended that search engine providers delineate paid-ranking search results from non-paid results. To the extent that we are required to modify presentation of search results as a result of specific regulations or requirements that may be issued in the future by the FTC or other state or federal agencies or legislative bodies with respect to the nature of such delineation or other aspects of advertising in connection with online search services, revenue from the affected search engines could be negatively impacted. With respect to our Haggle.com business, we must comply with regulations governing online promotions and the taxation of items sold online and the taxation of Internet commerce, and addressing these regulations may require us to develop additional technology or otherwise expend significant time and expense. We understand that some academics and others have suggested that prepaid bidding fee auctions resemble games of chance and/or gambling. We believe that the results of Haggle.com auctions depend on the skill of the participants and that, because the last bidder purchases the item at the final bid price, the items in the auction are not “prizes” won by “wagering.” If lawmakers or regulators were to decide that bidding fee auctions are games of chance or constitute gambling, businesses like Haggle.com could become illegal or subject to regulation as online gambling. In addition, complaints about online auction fraud consistently rank near the top of the list of complaints received by the FTC, and the FTC may use its authority to regulate unfair and deceptive trade practices to implement rules governing bidding fee auctions in particular. We would be unable to conduct our Haggle.com business in any jurisdiction that prohibits prepaid bidding fee auctions, and we may be unable to continue operating Haggle.com in other jurisdictions where regulatory compliance becomes too burdensome or expensive.
Due to the nature of the Internet, it is possible that the governments of states and foreign countries might attempt to regulate Internet transmissions, through data protection laws amongst others, or institute proceedings for violations of their laws. We might unintentionally violate such laws, such laws may be modified and new laws may be enacted in the future. Any such developments (or developments stemming from enactment or modification of other laws) could increase the costs of regulatory compliance for us or force us to change our business practices.
We rely on the infrastructure of the Internet networks, over which we have no control and the failure of which could substantially undermine our operations.
Our success depends, in large part, on other companies maintaining the Internet system infrastructure. In particular, we rely on other companies to maintain a reliable network backbone that provides adequate speed, data capacity and security and to develop products that enable reliable Internet access and services. As the Internet continues to experience growth in the number of users, frequency of use and amount of data transmitted, the Internet system infrastructure may be unable to support the demands placed on it, and the Internet’s performance or reliability may suffer as a result of this continued growth. Some of the companies that we rely upon to maintain network infrastructure may lack sufficient capital to take the necessary steps to support such demands or their long-term operations. The failure of the internet infrastructure would substantially undermine our operations and may have a material adverse effect on our business and financial results.
| ITEM 1B. | Unresolved Staff Comments |
None.
24
Table of Contents
| ITEM 2. | Properties |
Our principal corporate office is located in Bellevue, Washington, and we have business operations in Bangalore, India and Palo Alto, California. We provide data center services from third-party co-location facilities located in Tukwila, Washington and Reston, Virginia. All of our facilities are leased. We believe our properties are suitable and adequate for our present and anticipated near-term needs.
| ITEM 3. | Legal Proceedings |
See “Note 7: Commitments and Contingencies” of the Notes to Consolidated Financial Statements (Item 8, of Part II of this report) for information regarding legal proceedings.
| ITEM 4. | Submission of Matters to a Vote of Security Holders |
None.
PART II
| ITEM 5. | Market for Registrant’s Common Equity, Related Stockholder Matters and Issuer Purchases of Equity Securities |
Market for Our Common Stock
Our common stock trades on the NASDAQ Global Select Market under the symbol “INSP.” The following table sets forth, for the periods indicated, the high and low sales prices for our common stock as reported by the NASDAQ Global Select Market.
| High | Low | |||||
| Fiscal year ended December 31, 2009: |
||||||
| First Quarter |
$ | 8.29 | $ | 5.20 | ||
| Second Quarter |
$ | 7.40 | $ | 5.30 | ||
| Third Quarter |
$ | 8.67 | $ | 6.62 | ||
| Fourth Quarter |
$ | 8.87 | $ | 7.45 | ||
| Fiscal year ended December 31, 2008: |
||||||
| First Quarter |
$ | 19.03 | $ | 8.14 | ||
| Second Quarter |
$ | 12.73 | $ | 8.33 | ||
| Third Quarter |
$ | 11.94 | $ | 8.05 | ||
| Fourth Quarter |
$ | 10.81 | $ | 6.35 | ||
On February 19, 2010, the last reported sale price for our common stock on the NASDAQ Global Select Market was $10.35 per share.
Holders
As of February 19, 2010, there were 935 holders of record of our common stock. A substantially greater number of holders are beneficial owners whose shares are held of record by banks, brokers and other financial institutions.
Dividends
See “Note 5: Stockholders’ Equity” of the Notes to Consolidated Financial Statements (Item 8, Part II of this report) for information regarding dividends paid in 2008 and 2007. There were no dividends paid in 2009. We currently intend to retain our earnings to finance future growth and, therefore, do not anticipate paying any cash dividends on our common stock in the foreseeable future.
25
Table of Contents
Performance Graph
The information contained in the performance graph shall not be deemed to be “soliciting material” or to be “filed” with the SEC, and such information shall not be incorporated by reference into any future filing under the Securities Act or Exchange Act, except to the extent that we specifically incorporate it by reference into such filing.
Set forth below is a line graph comparing the cumulative total stockholder return of our common stock to the cumulative total return of (i) the NASDAQ Index and (ii) the NASDAQ Computer Index for the five-year period ending on December 31, 2009.
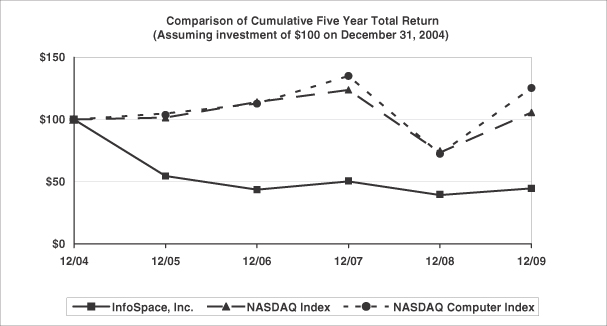
26
Table of Contents
| ITEM 6. | Selected Financial Data |
The following selected consolidated financial data should be read in conjunction with Management’s Discussion and Analysis of Financial Condition and Results of Operations, our consolidated financial statements and notes thereto and other financial information included elsewhere in this report. The selected consolidated statements of operations data and the consolidated balance sheet data are derived from our audited consolidated financial statements. In 2007, we sold our mobile and directory businesses to unaffiliated third parties. Our mobile and directory businesses have been presented as discontinued operations for 2008, 2007, 2006 and 2005, and our operating results for our remaining search business are partly based on identifying and assigning costs to our search business that were initially shared by the three businesses. The process used to separately present continuing and discontinued operations relied on certain estimates and assumptions, and the historical results of operations presented in our selected financial data do not necessarily reflect the results of operations that would have existed had we provided our search services as a standalone business.
| Years ended December 31, | |||||||||||||||||||
| 2009 (1) | 2008 (1) | 2007 (1)(2) | 2006 (1) | 2005 | |||||||||||||||
| (in thousands, except per share data) | |||||||||||||||||||
| Consolidated Statements of Operations Data: |
|||||||||||||||||||
| Revenues |
$ | 207,646 | $ | 156,727 | $ | 140,537 | $ | 153,800 | $ | 144,003 | |||||||||
| Operating expenses: |
|||||||||||||||||||
| Content and distribution |
126,493 | 75,969 | 61,765 | 62,346 | 59,897 | ||||||||||||||
| Systems and network operations |
9,703 | 11,537 | 9,800 | 11,494 | 7,592 | ||||||||||||||
| Product development |
5,617 | 9,931 | 9,921 | 6,814 | 6,640 | ||||||||||||||
| Sales and marketing |
25,379 | 24,261 | 29,259 | 15,935 | 15,809 | ||||||||||||||
| General and administrative |
23,586 | 24,079 | 105,083 | 34,507 | 27,344 | ||||||||||||||
| Depreciation |
7,141 | 7,335 | 5,542 | 5,044 | 3,334 | ||||||||||||||
| Amortization of intangible assets |
111 | — | — | — | — | ||||||||||||||
| Restructuring (3) |
— | 17 | 9,590 | 62,316 | — | ||||||||||||||
| Other, net |
— | (1,897 | ) | (3,248 | ) | — | — | ||||||||||||
| Total operating expenses |
198,030 | 151,232 | 227,712 | 198,456 | 120,616 | ||||||||||||||
| Operating income (loss) |
9,616 | 5,495 | (87,175 | ) | (44,656 | ) | 23,387 | ||||||||||||
| Gain (loss) on investments, net (4) |
(4,714 | ) | (28,520 | ) | (2,117 | ) | — | 154 | |||||||||||
| Other income, net (5) |
2,682 | 7,149 | 18,226 | 19,581 | 89,418 | ||||||||||||||
| Income (loss) from continuing operations before income taxes |
7,584 | (15,876 | ) | (71,066 | ) | (25,075 | ) | 112,959 | |||||||||||
| Income tax benefit (expense) (6) |
(181 | ) | (598 | ) | (13,409 | ) | 29,060 | 24,154 | |||||||||||
| Income (loss) from continuing operations |
7,403 | (16,474 | ) | (84,475 | ) | 3,985 | 137,113 | ||||||||||||
| Discontinued operations (7): |
|||||||||||||||||||
| Income (loss) from discontinued operations, net of taxes |
— | (1,455 | ) | (25,246 | ) | (19,073 | ) | 22,255 | |||||||||||
| Gain (loss) on sale of discontinued operations, net of taxes |
— | (770 | ) | 131,454 | — | — | |||||||||||||
| Net income (loss) |
$ | 7,403 | $ | (18,699 | ) | $ | 21,733 | $ | (15,088 | ) | $ | 159,368 | |||||||
| Basic income (loss) per share: |
|||||||||||||||||||
| Income (loss) from continuing operations |
$ | 0.21 | $ | (0.48 | ) | $ | (2.59 | ) | $ | 0.13 | $ | 4.25 | |||||||
| Income (loss) from discontinued operations |
— | (0.04 | ) | (0.77 | ) | (0.61 | ) | 0.69 | |||||||||||
| Gain (loss) on sale of discontinued operations |
— | (0.02 | ) | 4.03 | — | — | |||||||||||||
| Basic net income (loss) per share |
$ | 0.21 | $ | (0.54 | ) | $ | 0.67 | $ | (0.48 | ) | $ | 4.94 | |||||||
| Shares used in computing basic income (loss) per share |
34,983 | 34,415 | 32,640 | 31,254 | 32,284 | ||||||||||||||
| Diluted income (loss) per share: |
|||||||||||||||||||
| Income (loss) from continuing operations |
$ | 0.21 | $ | (0.48 | ) | $ | (2.59 | ) | $ | 0.12 | $ | 3.85 | |||||||
| Income (loss) from discontinued operations |
— | (0.04 | ) | (0.77 | ) | (0.58 | ) | 0.62 | |||||||||||
| Gain (loss) on sale of discontinued operations |
— | (0.02 | ) | 4.03 | — | — | |||||||||||||
| Diluted net income (loss) per share |
$ | 0.21 | $ | (0.54 | ) | $ | 0.67 | $ | (0.46 | ) | $ | 4.47 | |||||||
| Shares used in computing diluted income (loss) per share |
35,431 | 34,415 | 32,640 | 33,042 | 35,616 | ||||||||||||||
27
Table of Contents
| As of December 31, | |||||||||||||||
| 2009 | 2008 | 2007 | 2006 | 2005 | |||||||||||
| (in thousands) | |||||||||||||||
| Consolidated Balance Sheet Data: |
|||||||||||||||
| Cash, cash equivalents, short-term and long-term investments |
$ | 226,397 | $ | 205,444 | $ | 574,817 | $ | 400,831 | $ | 374,040 | |||||
| Working capital |
219,475 | 182,733 | 163,422 | 536,442 | 550,656 | ||||||||||
| Total assets |
322,216 | 291,133 | 671,424 | 765,839 | 743,379 | ||||||||||
| Total stockholders’ equity |
279,835 | 262,324 | 266,050 | 678,565 | 664,971 | ||||||||||
| Special dividend |
Special dividend paid |
Special dividend |
Total dividends | |||
| May 2, 2007 |
May 28, 2007 | $6.30 | $208,203 | |||
| November 14, 2007 |
January 8, 2008 | $9.00 | $299,296 |
| (1) | Effective January 1, 2006, we account for our stock-based compensation expense in accordance with Accounting Standards Codification 718, Share-Based Payment, which requires an enterprise to expense the fair value of an award of an equity instrument. Operating expenses from continuing operations in 2009, 2008, 2007 and 2006 include $10.6 million, $14.3 million, $34.1 million and $11.3 million, respectively, of stock-based compensation expense, allocated as follows (in thousands): |
| Year ended December 31, | ||||||||||||
| 2009 | 2008 | 2007 | 2006 | |||||||||
| Systems and network operations |
$ | 801 | $ | 1,663 | $ | 1,091 | $ | 1,194 | ||||
| Product development |
1,224 | 3,284 | 2,383 | 960 | ||||||||
| Sales and marketing |
2,036 | 3,551 | 7,948 | 2,400 | ||||||||
| General and administrative |
6,507 | 5,806 | 22,636 | 6,715 | ||||||||
| Total |
$ | 10,568 | $ | 14,304 | $ | 34,058 | $ | 11,269 | ||||
| (2) | In 2007, we recorded $56.2 million of employee expenses from continuing operations related to the cash distributions to shareholders. The expense was allocated as follows: $668,000 to systems and network operations, $1.5 million to product development, $6.8 million to sales and marketing, and $47.3 million to general and administrative. |
| (3) | In 2007, we recorded restructuring charges of $9.6 million, comprised of $8.0 million of employee separation costs, $831,000 of losses on contractual commitments, and $670,000 of stock-based compensation expense. In 2006, we recorded restructuring charges of $62.3 million, comprised of $44.5 million of impairments of goodwill and other intangible assets, $8.7 million of employee separation costs, $5.7 million of losses on contractual commitments, $2.6 million in costs of abandoned facilities, and $824,000 of stock-based compensation expense. |
| (4) | In 2009, 2008 and 2007, we recorded other-than-temporary impairment charges of $5.4 million, $24.3 million and $2.2 million, respectively, related to available-for-sale investments that we purchased for $40.4 million, became illiquid in 2007, and were sold for net proceeds of $9.2 million in 2009. |
| (5) | In 2005, we received proceeds of $83.2 million from the settlement of several outstanding litigation matters and recognized a gain of $79.3 million comprised of the settlement proceeds and interest, less $3.9 million in legal fees. |
| (6) | In 2007, we recorded a full valuation allowance related to our deferred tax assets. In 2006, we recognized a portion of our deferred tax assets related to goodwill, operating loss carryforwards, and equity. In 2005, we recognized a portion of our deferred tax assets related to operating loss carryforwards. |
| (7) | We completed the sale of our directory business on October 31, 2007 and the sale of our mobile business on December 28, 2007. The operating results and gains (losses) from the sales of these businesses have been presented as discontinued operations for 2008, 2007, 2006 and 2005. |
28
Table of Contents
| ITEM 7. | Management’s Discussion and Analysis of Financial Condition and Results of Operations |
You should read the following discussion and analysis in conjunction with the Selected Consolidated Financial Data and our consolidated financial statements and notes thereto included elsewhere in this report.
Overview
InfoSpace, Inc. (“InfoSpace”, “our” or “we”) is a developer of search tools and technologies that assist consumers with finding information, merchants, individuals, products and other content on the Internet. We use our metasearch technology to power our own branded Web sites and to provide online search services to distribution partners. Our metasearch technology selects search results from several search engine content providers, including Google, Yahoo!, and Bing, among others. Some content providers, such as Google and Yahoo!, pay us to distribute their content, and we refer to those providers as our customers.
We offer search services through our Web sites, such as Dogpile.com, WebCrawler.com, MetaCrawler.com, and WebFetch.com, as well as through the Web properties of distribution partners. Partner versions of our Web offerings are generally private-labeled and delivered with each distribution partner’s unique requirements.
Until the fourth quarter of 2007, InfoSpace was comprised of three businesses: online search, online directory, and mobile. We exited portions of our mobile business in 2006 and 2007 and sold our online directory business and the remaining portions of our mobile services business in the fourth quarter of 2007. Following the sale of our mobile and directory businesses, our revenues are derived almost exclusively from providing online search services.
We generate revenues primarily from our Web search services when an end user of our services clicks on a paid search link provided by a customer and displayed on one of our owned and operated Web properties or displayed on a distribution partner’s Web property. The customer that provided the paid search link receives a fee from the advertiser who paid for the click and the customer pays us a portion of that fee. If the click originated from one of our distribution partners’ Web properties, we share a portion of the fee we receive with such partner. Revenues are recognized in the period in which such paid clicks occur and are based on the amounts earned and remitted to us by our customers for such clicks. Revenue from Google and Yahoo! jointly account for over 95% of our search revenue for 2009 and each also accounted for more than 10% of our revenues, and we expect this concentration to continue in the foreseeable future. If either of these customers reduces or eliminates the content it provides to us or our distribution partners, or if either of these customers was unwilling to pay us amounts that it owes us, our business and financial results may materially suffer. Our principal agreements with Google and Yahoo! expire in April and January 2011, respectively.
Our ability to increase our online search services revenue generated through our owned and operated properties relies on growth in the volume of paid clicks, the fees advertisers pay our customers for these paid clicks, and the percentage of these fees our customers share with us. In recent periods, we have experienced an increase in paid clicks on our owned and operated properties, primarily driven by our marketing initiatives, but the revenue generated through this increase has been more than offset by lower average fees per paid click from our customers.
Similar to the revenues earned on our owned Web properties, revenues from distribution partners depend on growth in the volume of paid clicks, the fees advertisers pay our customers for these paid clicks, and the percentage of these fees our customers share with us. We have experienced steady growth in revenues from our search services offered through the Web properties of distribution partners, which has been primarily attributable to growth in paid click volumes from new distribution partners’ Web properties in the United States. In recent periods, revenues from certain distribution partners have been adversely affected by our customers’ process of measuring the quality of paid clicks and adjusting the fees paid to us, as well as their examinations of end-user acquisition processes. In an effort to drive quality traffic to our customers, we continue to invest in product development to expand the online search services we offer on our owned sites and those of our distribution partners.
29
Table of Contents
Engineering, operations, and product management personnel remain paramount to our ability to deliver high quality online search services, enhance our current technology and expand our product offerings. As a result, we expect to continue to invest in our workforce and increase our research and development operations. Additionally, we may use our cash and short-term available-for-sale investments to acquire businesses and other assets, including businesses that may not be related to online search.
Note Regarding Discontinued Operations
The operating results of the directory and mobile businesses have been presented as discontinued operations in our consolidated financial statements for all periods presented. The process used to separately present continuing and discontinued operations relied on certain estimates and assumptions, and the historical results of operations presented in our consolidated financial statements do not necessarily reflect the results that would have existed had we provided our online search services as a standalone business throughout the periods presented. Due to the rapidly evolving nature of our business, overall market conditions and the process used to separately present continuing and discontinued operations, we believe that comparisons of our 2009 and 2008 operating results to 2007 are not necessarily meaningful, and you should not rely upon them as indications of future performance. The loss from our discontinued operations, net of income taxes, was $1.5 million in 2008 and $25.2 million in 2007.
Overview of 2009 Operating Results
The following is an overview of our operating results for the year ended December 31, 2009. A more detailed discussion of our operating results, comparing our operating results for the years ended December 31, 2009, 2008 and 2007, is included under the heading “Historical Results of Operations” in this Management’s Discussion and Analysis of Financial Condition and Results of Operations.
Revenues for 2009 increased to $207.6 million from $156.7 million in 2008. This increase was due to an increase in revenue from search results delivered through our distribution partners, partially offset by a decrease in revenue from our owned and operated properties. The decrease in revenue from owned and operated properties was primarily due to a decrease in the average fees per paid click that our customers share with us, although paid click volume on our owned properties increased in 2009. The decrease in average fees per paid click was the result of a decrease in advertiser fees paid per click from our customers and a shift in the mix of revenue reflecting a higher proportion derived from our direct marketing initiatives on our owned properties. Average fees per paid click for revenues derived through our direct marketing initiatives historically have been lower.
During 2009 and 2008, approximately 76% and 65%, respectively, of our total revenues were generated through our search distribution partners’ Web properties. We generated approximately 42% and 23% of our online search revenues through the Web properties of our top five distribution partners during 2009 and 2008, respectively. The Web properties of our top five distribution partners for 2009 generated approximately 20% of our online search revenues during 2008.
Content and distribution costs for 2009 increased to $126.5 million from $76.0 million in 2008, primarily due to an increase in revenue from search results delivered through certain of our distribution partners, and increases in our average revenue sharing rates with our distribution partners.
Other operating expenses for 2009, excluding restructuring and other, net, decreased to $71.5 million from $77.1 million in 2008. Other operating expenses include expenses related to systems and network operations, product development, sales and marketing, general and administrative, depreciation and amortization of intangible assets. The decrease from 2008 was primarily attributable to decreases in stock-based compensation, salaries and benefits for employees and a one-time net business tax refund, partially offset by increases in marketing expenses associated with our owned and operated Web sites, legal fees and legal settlements.
30
Table of Contents
Other, net of $1.9 million for 2008 was related to gains on the sales of non-core assets. Loss on investments, net for 2009 was $4.7 million, compared to $28.5 million for 2008. The total loss on investments, net for 2009 and $24.3 million of the loss for 2008 were due to other-than-temporary impairments of our auction rate securities (“ARS”) investments that we sold subsequent to their impairment in 2009, net of gains on the sales of those investments.
Other income decreased to $2.7 million in 2009 compared to other income of $7.1 million in 2008 primarily due to reduced interest income resulting from declining interest rates. We recognized income tax expense in 2009 of $181,000 compared to income tax expense from continuing operations in 2008 of $598,000.
Net income in 2009 was $7.4 million, compared to net loss of $18.7 million in 2008, and was primarily attributable to the items noted above.
Critical Accounting Policies and Estimates
The Management’s Discussion and Analysis of Financial Condition and Results of Operations, as well as the disclosures included elsewhere in this Annual Report on Form 10-K, is based upon our consolidated financial statements, which have been prepared in accordance with accounting principles generally accepted in the United States of America. The preparation of these financial statements requires us to make estimates and judgments that affect the reported amounts of assets, liabilities, revenues, expenses and disclosures of contingencies. In some cases, we could have reasonably used different accounting policies and estimates.
The Securities and Exchange Commission (“SEC”) has defined a company’s most critical accounting policies as the ones that are the most important to the portrayal of the company’s financial condition and results of operations, and which require the company to make its most difficult and subjective judgments, often as a result of the need to make estimates of matters that are inherently uncertain. On an ongoing basis, we evaluate the estimates used, including those related to revenue recognition, impairment of goodwill, the estimated allowance for billing adjustments and doubtful accounts, stock-based compensation, the valuation allowance for our deferred tax assets, accrued contingencies and the fair value of investments. We base our estimates on historical experience, current conditions and on various other assumptions that we believe to be reasonable under the circumstances and, based on information available to us at that time, we make judgments about the carrying values of assets and liabilities that are not readily apparent from other sources as well as identify and assess our accounting treatment with respect to commitments and contingencies. Actual results may differ significantly from these estimates under different assumptions, judgments or conditions. We believe the following critical accounting policies involve the more significant judgments and estimates used in the preparation of our consolidated financial statements. We also have other accounting policies that involve the use of estimates, judgments and assumptions and that are significant to understanding our results. For additional information see “Note 2: Summary of Significant Accounting Policies” of the Notes to Consolidated Financial Statements (Item 8 of Part II of this report).
Revenue Recognition
Our revenues are derived from products and services delivered to our search customers. In general, we recognize revenues in the period in which the services are performed. Search revenue is recorded on a gross basis in accordance with Accounting Standards Codification (“ASC”) 605-45-45, Principal Agent Considerations—Overall Considerations of Reporting Revenue Gross as a Principal versus Net as an Agent. We are the primary obligor in the revenue-generating relationships with our search engine customers, we separately negotiate each revenue or unit pricing contract independent of any revenue sharing arrangements and assume the credit risk for amounts invoiced to such customers. We, through our meta-search technology, determine the paid click, content and information directed to our owned and operated Web sites and our distribution partners’ Web properties. We earn revenue from our search engine customers by providing paid search clicks generated from our distribution partners’ Web properties based on separately negotiated and agreed-upon terms with each distribution partner.
31
Table of Contents
We recognize amounts due to our distribution partners in the period they are earned and classify such costs as content and distribution expense. See “Note 2: Summary of Significant Accounting Policies” of the Notes to Consolidated Financial Statements (Item 8 of Part II of this report) for a description of products and services and the related revenue recognition policy.
Accounting for Goodwill
ASC 350, Goodwill and Other Intangible Assets, requires that goodwill be tested for impairment on an annual basis and between annual tests whenever circumstances indicate that the carrying value of the goodwill might be impaired, and requires an allocation of goodwill to the portions of a reporting unit when a portion of that reporting unit is disposed. On a quarterly basis, we assess whether business conditions, including material changes in the fair value of our outstanding common stock, indicate that our goodwill may not be recoverable.
When a portion of a reporting unit is disposed, goodwill is allocated to the disposed and retained portions based on the relative fair values of the respective businesses. Allocating goodwill to portions of a reporting unit requires judgment, including the identification of reporting unit portions, assigning assets and liabilities to the portions, assigning goodwill to the portions, and determining the fair value of each portion. The goodwill associated with the disposed portion is included in the portion’s carrying amount in determining the gain or loss on disposal. In 2007, we sold our directory business, which was combined with our search business in our online reporting unit. Based upon our analysis, we allocated $60.5 million of goodwill to our directory business, which was used in determining the gain on its sale to Idearc Inc.
Upon the sale of the mobile business in 2007, we determined that we no longer operate separate reporting units. We performed our annual impairment analysis of the goodwill on our balance sheet as of November 30, 2009, and we determined that there was no impairment. Our analysis included a comparison of the book value of our shareholders’ equity to the fair value of our outstanding common stock, based on quoted market prices, which fair value exceeded the book value of our shareholders’ equity on the annual measurement date. At December 31, 2009, we had $44.8 million of goodwill on our balance sheet.
Allowances for Sales and Doubtful Accounts
Our management must make estimates of potential future sales allowances related to current period revenues for our products and services. Our sales allowance estimates are primarily based on customer communications regarding revenue adjustments for poor traffic quality. Additionally, we analyze historical adjustments, current economic trends and changes in customer demand when evaluating the adequacy of the sales allowances. Estimates must be made and used in connection with establishing the sales allowance in any accounting period.
The allowance for doubtful accounts is a management estimate that considers actual facts and circumstances of individual customers and other debtors, such as financial condition and historical payment trends. We evaluate the adequacy of the allowance utilizing a combination of specific identification of potentially problematic accounts and identification of accounts that have exceeded payment terms.
Stock-Based Compensation
ASC 718, Share-Based Payment, requires companies to record stock compensation expense for equity-based awards granted, including stock options and restricted stock unit grants, for which expense will be recognized over the service period of the equity-based award based on the fair value of the award at the date of grant. During 2009, 2008 and 2007, we recognized $10.6 million, $14.3 million and $34.1 million, respectively, of stock-based compensation expense.
32
Table of Contents
Calculating stock-based compensation expense relies upon certain assumptions, including the expected term of the stock-based awards, stock price volatility, expected interest rate, number and types of stock-based awards, and the pre-vesting forfeiture rate. If we use different assumptions due to changes in our business or other factors, our stock-based compensation expense could vary materially in the future.
Income Taxes
We account for income taxes under the asset and liability method, under which deferred tax assets, including net operating loss carryforwards, and liabilities are determined based on temporary differences between the book and tax bases of assets and liabilities. We periodically evaluate the likelihood of the realization of deferred tax assets, and reduce the carrying amount of the deferred tax assets by a valuation allowance to the extent we believe a portion will not be realized. We consider many factors when assessing the likelihood of future realization of our deferred tax assets, including our recent cumulative earnings experience by taxing jurisdiction, expectations of future taxable income, the carryforward periods available to us for tax reporting purposes, and other relevant factors. There is a wide range of possible judgments relating to the valuation of our deferred tax assets.
During the years ended December 31, 2009 and 2008, based on the weight of available evidence, we determined that it was not more likely than not that we would realize our deferred tax assets. Accordingly, we provided a full valuation allowance against our net deferred tax assets at December 31, 2009 and 2008. Significant judgment is required in making this assessment, and it is very difficult to predict when, if ever, we may conclude that any portion of our deferred tax assets are more likely than not realizable.
Contingencies
We are subject to various legal proceedings and claims and tax matters, the outcomes of which are subject to significant uncertainty. ASC 450, Contingencies, requires that an estimated loss from a loss contingency be accrued by a charge to income if it is probable that an asset has been impaired or a liability has been incurred and the amount of the loss can be reasonably estimated. Disclosure of a contingency is required if there is at least a reasonable possibility that a loss has been incurred. We evaluate, among other factors, the degree of probability of an unfavorable outcome and the ability to make a reasonable estimate of the amount of loss. Changes in these factors could materially impact our financial position or our results of operations. See “Note 7: Commitments and Contingencies” of the Notes to Consolidated Financial Statements (Item 8 of Part II of this report) for further information regarding contingencies.
Fair Value Measurements
We follow the provisions of ASC 820, Fair Value Measurements and Disclosure, which defines fair value, establishes a framework for measuring fair value, and expands required disclosures about fair value measurements. ASC 820 defines fair value as the price that would be received to sell an asset or paid to transfer a liability in an orderly transaction between market participants at the measurement date. ASC 820 established a three-tier hierarchy for considering the inputs used in the valuation methodologies for measuring fair value, which is as follows:
Level 1—Observable inputs that reflect unadjusted quoted prices for identical assets or liabilities in active markets;
Level 2—Other inputs that are directly or indirectly observable in the marketplace;
Level 3—Unobservable inputs which are supported by little or no market activities.
That hierarchy also requires the maximum use of observable inputs and minimum use of unobservable inputs when measuring fair value.
33
Table of Contents
Our $75.6 million of cash equivalents and $142.6 million of short-term investments available-for-sale as of December 31, 2009, are classified in the Level 1 input category.
In 2007, the auctions for certain ARS that we purchased for $40.4 million began to fail due to insufficient bids from buyers. When the ARS auctions began to fail, we initially determined their fair values by using discounted cash flow models. Those ARS were classified in the Level 3 input category. We incorporated market information into our valuation models when a secondary market began to form. In 2007 and 2008, we recorded $2.2 million and $24.3 million, respectively, of other-than-temporary impairment charges related to those ARS in loss on investments, net. In 2009, we recorded $5.4 million of other-than-temporary impairment charges related to those ARS and a gain of $637,000 on the sale of our entire ARS portfolio, including the sale of preferred shares that replaced certain of the ARS, in loss on investments, net.
In 2009, 2008 and 2007, we did not measure the fair value of any of our assets or liabilities other than cash and cash equivalents, available-for-sale investments, warrants and an investment in a privately-held company. We consider the carrying values of accounts receivable, notes and other receivables, prepaid expenses and other current assets, accounts payable, accrued expenses and other current liabilities to approximate fair values primarily due to their short-term nature.
For additional information see “Note 4: Fair Value Measurements” of the Notes to Consolidated Financial Statements (Item 8 of Part II of this report.)
Discontinued Operations
In accordance with the provisions of ASC 360, Property, Plant and Equipment, the gains on sale, results of operations and cash flows of the directory and mobile businesses presented for all periods have been reported as discontinued operations. In addition, the liabilities of the mobile business have been classified as liabilities of discontinued operations at December 31, 2008. The process used to separately present continuing and discontinued operations required significant judgment to implement and relied on certain estimates and assumptions. Different estimates and assumptions could materially affect the allocations to the directory and mobile businesses of gains on sale, results of operations, cash flows, assets and liabilities.
Historical Results of Operations
Our net income for 2009 was $7.4 million. We have incurred net losses on an annual basis for all but four of the years since our inception, and as of December 31, 2009, we had an accumulated deficit of $1.0 billion.
34
Table of Contents
The following table sets forth the historical results of our operations (in thousands and as percent of revenues).
| Years ended December 31, | Years ended December 31, | ||||||||||||||||||||
| 2009 | 2008 | 2007 | 2009 | 2008 | 2007 | ||||||||||||||||
| (in thousands) | (as a percent of revenue) | ||||||||||||||||||||
| Revenues |
$ | 207,646 | $ | 156,727 | $ | 140,537 | 100.0 | % | 100.0 | % | 100.0 | % | |||||||||
| Operating expenses |
|||||||||||||||||||||
| Content and distribution |
126,493 | 75,969 | 61,765 | 60.9 | 48.5 | 43.9 | |||||||||||||||
| Systems and network operations |
9,703 | 11,537 | 9,800 | 4.7 | 7.4 | 7.0 | |||||||||||||||
| Product development |
5,617 | 9,931 | 9,921 | 2.7 | 6.3 | 7.1 | |||||||||||||||
| Sales and marketing |
25,379 | 24,261 | 29,259 | 12.2 | 15.5 | 20.8 | |||||||||||||||
| General and administrative |
23,586 | 24,079 | 105,083 | 11.4 | 15.3 | 74.8 | |||||||||||||||
| Depreciation |
7,141 | 7,335 | 5,542 | 3.4 | 4.7 | 3.9 | |||||||||||||||
| Amortization of intangible assets |
111 | — | — | 0.1 | — | — | |||||||||||||||
| Restructuring |
— | 17 | 9,590 | — | 0.0 | 6.8 | |||||||||||||||
| Other, net |
— | (1,897 | ) | (3,248 | ) | — | (1.2 | ) | (2.3 | ) | |||||||||||
| Total operating expenses |
198,030 | 151,232 | 227,712 | 95.4 | 96.5 | 162.0 | |||||||||||||||
| Operating income (loss) |
9,616 | 5,495 | (87,175 | ) | 4.6 | 3.5 | (62.0 | ) | |||||||||||||
| Loss on investments, net |
(4,714 | ) | (28,520 | ) | (2,117 | ) | (2.2 | ) | (18.2 | ) | (1.6 | ) | |||||||||
| Other income, net |
2,682 | 7,149 | 18,226 | 1.3 | 4.6 | 13.0 | |||||||||||||||
| Income (loss) from continuing operations before income taxes |
7,584 | (15,876 | ) | (71,066 | ) | 3.7 | (10.1 | ) | (50.6 | ) | |||||||||||
| Income tax expense |
(181 | ) | (598 | ) | (13,409 | ) | (0.1 | ) | (0.4 | ) | (9.5 | ) | |||||||||
| Income (loss) from continuing operations |
7,403 | (16,474 | ) | (84,475 | ) | 3.6 | (10.5 | ) | (60.1 | ) | |||||||||||
| Loss from discontinued operations, net of taxes |
— | (1,455 | ) | (25,246 | ) | — | (0.9 | ) | (18.0 | ) | |||||||||||
| Gain (loss) on sale of discontinued operations, net of taxes |
— | (770 | ) | 131,454 | — | (0.5 | ) | 93.6 | |||||||||||||
| Net income (loss) |
$ | 7,403 | $ | (18,699 | ) | $ | 21,733 | 3.6 | % | (11.9 | )% | 15.5 | % | ||||||||
Results of Operations for 2009, 2008 and 2007
Revenues. Revenues for the years ended December 31, 2009, 2008 and 2007 are presented below (in thousands):
| 2009 | Change | 2008 | Change | 2007 | |||||||||||
| Revenue |
$ | 207,646 | $ | 50,919 | $ | 156,727 | $ | 16,190 | $ | 140,537 | |||||
The increase in revenue for 2009 compared to 2008 and for 2008 compared to 2007 was due to an increase in revenue from search results delivered through our distribution partners. This increase was partially offset by a decrease in revenue from our owned and operated properties. The decrease in revenue from owned and operated properties was due to a decrease in the average fees per paid click that our customers share with us although paid click volume on our owned properties increased in 2009 and in 2008 over the prior year. The decrease in average fees per paid click was the result of a decrease in advertiser fees paid per click to our customers and a shift in the mix of revenue reflecting a higher proportion derived from our direct marketing initiatives on our owned properties. In 2009, 76% of our total revenues came from searches conducted by end users on the Web properties of our search distribution partners, compared to 65% in 2008 and 58% in 2007. 42% of our online search revenues were generated through the Web properties of our top five distribution partners in 2009, compared to 23% in 2008 and 31% in 2007.
35
Table of Contents
We expect that online search revenue from searches conducted by end users on sites of our distribution partners will continue to represent a significant proportion of our online search revenues for the foreseeable future.
Content and Distribution Expenses. Content and distribution expenses consist principally of costs related to revenue sharing arrangements with our content and distribution partners, as well as content and data licenses. Content and distribution expenses in total dollars (in thousands) and as a percent of revenue for 2009, 2008 and 2007 are presented below:
| 2009 | Change | 2008 | Change | 2007 | ||||||||||||||
| Content and Distribution Expenses |
$ | 126,493 | $ | 50,524 | $ | 75,969 | $ | 14,204 | $ | 61,765 | ||||||||
| Percent of Revenue |
60.9 | % | 48.5 | % | 43.9 | % | ||||||||||||
The increase in content and distribution expenses for 2009 compared to 2008 and for 2008 compared to 2007, both in absolute dollars and as a percent of revenue, was primarily due to an increase in revenue from search results delivered through our distribution partners, and increases in our average revenue sharing rates with our partners. We anticipate that our content and distribution costs will increase in absolute dollars if revenues increase through growth from existing arrangements with our distribution partners or we add new distribution partners. If revenue generated from our distribution partners increases at a greater rate than revenues generated from our own branded Web sites, content and distribution costs as a percent of revenue will increase.
Systems and Network Operations Expenses. Systems and network operations expenses are associated with the delivery, maintenance and support of our services, data management and infrastructure, including personnel expenses (which include salaries, benefits and other employee related costs, and stock-based compensation expense), costs for temporary help and contractors to augment our staffing, communication costs such as high-speed Internet access and hosting, equipment repair and maintenance, and professional service fees. Systems and network operations expenses in total dollars (in thousands) and as a percent of revenue for 2009, 2008 and 2007 are presented below:
| 2009 | Change | 2008 | Change | 2007 | |||||||||||||||
| Systems and Network Operations Expenses |
$ | 9,703 | $ | (1,834 | ) | $ | 11,537 | $ | 1,737 | $ | 9,800 | ||||||||
| Percent of Revenue |
4.7 | % | 7.4 | % | 7.0 | % | |||||||||||||
The absolute dollar decrease in systems and network operations expenses for 2009 compared to 2008 was primarily attributable to a $1.1 million decrease in the cost of contractors to augment our staffing and an $862,000 decrease in stock-based compensation expense. Partially offsetting these decreases was an increase of $541,000 in salaries and employee benefits excluding stock-based compensation expense.
The absolute dollar increase in systems and network operations expenses for 2008 compared to 2007 was primarily attributable to an increase of $599,000 in salaries and employee benefits, an increase of $573,000 in stock-based compensation expense, and an increase of $542,000 in the cost of contractors to augment staffing. Partially offsetting these increases was a decrease in employee expenses of $650,000 related to the cash distributions to shareholders declared in 2007.
Product Development Expenses. Product development expenses consist principally of personnel expenses (which include salaries, stock-based compensation expense, and benefits and other employee related costs) and the cost of temporary help and contractors to augment our staffing for research, development, support and ongoing enhancements of our products and services. Product development expenses in total dollars (in thousands) and as a percent of revenue for 2009, 2008 and 2007 are presented below:
| 2009 | Change | 2008 | Change | 2007 | |||||||||||||||
| Product Development Expenses |
$ | 5,617 | $ | (4,314 | ) | $ | 9,931 | $ | 10 | $ | 9,921 | ||||||||
| Percent of Revenue |
2.7 | % | 6.3 | % | 7.1 | % | |||||||||||||
36
Table of Contents
The absolute dollar decrease in product development expenses for 2009 compared to 2008 was primarily attributable to decreases of $2.1 million in stock-based compensation expense, $1.6 million in salaries and employee benefits excluding stock-based compensation and $791,000 in professional services fees.
The absolute dollar increase in product development expenses for 2008 compared to 2007 was primarily attributable to an increase of $900,000 in stock-based compensation expense and an increase of $398,000 in salaries and employee benefits, excluding stock-based compensation. These increases were offset by a decrease of $1.4 million in employee expenses related to the cash distributions to shareholders declared in 2007.
Product development costs may not be consistent with changes in revenues as they represent key costs to develop and enhance our product and service offerings. We believe that investments in technology are necessary to remain competitive, and we anticipate that we will continue to invest in our products and services.
Sales and Marketing Expenses. Sales and marketing expenses consist principally of personnel costs (which include salaries, stock-based compensation expense, and benefits and other employee related costs), the cost of temporary help and contractors to augment our staffing, and marketing expenses associated with our owned and operated Web sites (which consist of agency fees, brand promotion expense, market research expense and online direct marketing expense associated with traffic acquisition, including fees paid to search engines). Sales and marketing expenses in total dollars (in thousands) and as a percent of revenue for 2009, 2008 and 2007 are presented below:
| 2009 | Change | 2008 | Change | 2007 | |||||||||||||||
| Sales and Marketing Expenses |
$ | 25,379 | $ | 1,118 | $ | 24,261 | $ | (4,998 | ) | $ | 29,259 | ||||||||
| Percent of Revenue |
12.2 | % | 15.5 | % | 20.8 | % | |||||||||||||
The absolute dollar increase in sales and marketing expenses for 2009 was primarily attributable to an increase of $3.1 million in marketing expenses associated with our owned and operated Web sites and an increase of $445,000 in the costs of contractors to augment our staffing. These increases were partially offset by a decrease of $1.5 million in stock-based compensation expense and a decrease of $1.1 million in salaries and employee benefits, excluding stock-based compensation expense.
The absolute dollar decrease in sales and marketing expenses for 2008 was primarily attributable to a decrease of $6.9 million in employee expenses related to the cash distributions to shareholders declared in 2007, a decrease of $4.4 million in stock-based compensation expense and a decrease of $646,000 in professional services fees. These decreases were partially offset by an increase of $6.3 million in marketing expenses associated with our owned and operated Web sites and an increase of $996,000 in salaries and employee benefits, excluding stock-based compensation.
We expect to continue to invest in marketing initiatives to promote search services on our branded Web sites.
General and Administrative Expenses. General and administrative expenses consist primarily of personnel expenses (which include salaries, benefits and other employee related costs and stock-based compensation expense), professional service fees (which include legal, tax and audit fees), taxes, license and insurance expenses, certain legal settlements, occupancy and general office expenses, and general business development and management expenses. General and administrative expenses in total dollars (in thousands) and as a percent of revenue for 2009, 2008 and 2007 are presented below:
| 2009 | Change | 2008 | Change | 2007 | ||||||||||||||||
| General and Administrative Expenses |
$ | 23,586 | $ | (493 | ) | $ | 24,079 | $ | (81,004 | ) | $ | 105,083 | ||||||||
| Percent of Revenue |
11.4 | % | 15.3 | % | 74.8 | % | ||||||||||||||
37
Table of Contents
The absolute dollar decrease in general and administrative expenses for 2009 compared to 2008 was primarily attributable to a net business tax refund of $2.4 million, decreases of $1.5 million in taxes and salaries, benefits and other employee related costs excluding stock-based compensation expense, a decrease of $984,000 in professional services fees and a decrease of $366,000 in insurance expense. These decreases were partially offset by increases of $3.4 million in legal fees, increases of $935,000 in expenses related to legal settlements and an increase of $701,000 in stock-based compensation expense.
The absolute dollar decrease in general and administrative expenses for 2008 compared to 2007 was primarily attributable to a decrease of $46.5 million in employee expenses related to the cash distributions to shareholders declared in 2007, a decrease of $16.8 million in stock-based compensation expense, a decrease of $9.9 million in professional services fees, decreases totaling $2.5 million in salaries and employee benefits excluding stock-based compensation expense, a decrease of $2.3 million in expense due to a contract termination charge in 2007, a decrease of $1.6 million in software licensing fees, and a decrease of $1.0 million in insurance expense.
Restructuring. Restructuring charges reflect actual and estimated employee separation costs, stock-based compensation expense and losses on contractual commitments associated with reductions in workforce and costs associated with the consolidation and closures of certain of our facilities. Restructuring charges for 2008 and 2007 are presented below (in thousands):
| 2008 | 2007 | ||||||
| Restructuring charges: |
|||||||
| Employee separation costs |
$ | 52 | $ | 7,963 | |||
| Stock-based compensation expense |
60 | 670 | |||||
| Losses on contractual commitments |
(88 | ) | 831 | ||||
| Other |
(7 | ) | 126 | ||||
| $ | 17 | $ | 9,590 | ||||
In 2007, we sold our directory and mobile services businesses and, as a result, we committed to a plan to make operational changes to our business, including a reduction in our workforce and, as part of the workforce reduction, consolidation of our facilities. In 2008, we recorded $17,000 of restructuring expense related to that plan and a restructuring plan to which we committed in 2006 after we exited portions of our mobile business. In 2007, we recorded $7.4 million of expense related to the 2007 plan, and an additional $2.2 million of adjustments and additions relating to the 2006 plan.
We do not expect to incur material restructuring charges in future periods related to plans to which we have committed to date.
Depreciation. Depreciation of property and equipment includes depreciation of network servers and data center equipment, computers, software, office equipment and fixtures, and leasehold improvements. Depreciation expenses for 2009, 2008 and 2007 are presented below (in thousands):
| 2009 | Change | 2008 | Change | 2007 | ||||||||||||
| Depreciation Expenses |
$ | 7,141 | $ | (194 | ) | $ | 7,335 | $ | 1,793 | $ | 5,542 | |||||
There were no material variances between the depreciation expenses recorded in 2009 and 2008. The $1.8 million increase in depreciation expense from 2007 to 2008 was primarily a result of increases in depreciation expense of $810,000 for purchased software, $775,000 for our internally developed software, and $548,000 for data center equipment.
Other, Net. Other, net consists of costs, charges, refunds or gains that are not directly associated with other revenue or operating expense classifications. Other, net of $1.9 million in 2008 and $3.2 million in 2007 consisted of gains on the sale of non-core assets.
38
Table of Contents
Loss on Investments, Net. Loss on investments, net is comprised of the following for 2009, 2008 and 2007 (in thousands):
| 2009 | 2008 | 2007 | ||||||||||
| Impairment of other-than-temporary available-for-sale investments |
$ | (5,351 | ) | $ | (24,332 | ) | $ | (2,182 | ) | |||
| Gain on sale of available-for-sale investments |
637 | — | — | |||||||||
| Impairment of convertible note from equity investee |
— | (2,000 | ) | — | ||||||||
| Other-than-temporary impairment of equity investment in privately-held company |
— | (2,000 | ) | — | ||||||||
| Increase (decrease) in fair value of warrants |
— | (188 | ) | 65 | ||||||||
| $ | (4,714 | ) | $ | (28,520 | ) | $ | (2,117 | ) | ||||
In 2009, we determined that a portion of our ARS, which we classified as long-term available-for-sale securities, was other-than-temporarily impaired, and we recorded a loss on investments of $5.4 million, and sold all of our ARS and the preferred shares that replaced certain of the ARS. Subsequently, we sold all of the investments originally purchased as ARS and recognized gains on the sales totaling $637,000.
In 2008 and 2007, we determined that a portion of our ARS, which we classified as long-term available-for-sale securities, was other-than-temporarily impaired, and we recorded a loss on investments of $24.3 million and $2.2 million, respectively. In 2008, we determined that our equity investment and related warrants in a privately-held company, as well as a convertible note from that company, were fully impaired, and we recorded a loss on investments of $4.2 million. In accordance with ASC 815-10, Derivatives and Hedging, we adjust our derivative instruments to fair value and recognize the change in the recorded fair value in earnings. We hold warrants to purchase stock in other companies, which qualify as derivatives, and therefore gains or losses are based on the fair value.
Other Income, Net. Other income, net, primarily consists of interest income, gain on contingency resolution, gain (loss) on disposals of property and equipment and foreign currency exchange loss.
| 2009 | 2008 | 2007 | ||||||||||
| Interest income |
$ | 3,390 | $ | 7,315 | $ | 18,194 | ||||||
| Gain on contingency resolution |
— | 1,124 | — | |||||||||
| Foreign currency exchange loss |
(66 | ) | (661 | ) | (129 | ) | ||||||
| Gain (loss) on disposal of property and equipment |
(642 | ) | (629 | ) | 161 | |||||||
| $ | 2,682 | $ | 7,149 | $ | 18,226 | |||||||
Interest income decreased in 2009 compared to 2008 primarily due to a decline in interest rates, partially offset by $925,000 in interest received relating to a net business tax refund. Interest income decreased in 2008 compared to 2007 primarily due to lower cash and marketable investments balances and a decline in interest rates.
Income Tax Benefit (Expense). During 2009, 2008 and 2007, we recorded an income tax expense on continuing operations of $181,000, $598,000 and $13.4 million, respectively. During 2009, we further impaired and sold our portfolio of ARS, which provided a net $6.9 million income tax benefit from the net reduction of its portion of the valuation allowance. Absent the effect of the ARS, our income tax expense would have been $7.1 million, which would be primarily attributable to $2.7 million from current year operations and an increase of $4.2 million increase in the valuation allowance against the deferred tax assets. The 2008 income tax expense of $598,000 is primarily attributable to a $5.6 million tax benefit from current year operations, $436,000 tax expense for non-deductible compensation paid to an executive, and a $5.4 million tax expense for the net increase in the valuation allowance against the deferred tax assets. The 2007 income tax expense of $13.4 million
39
Table of Contents
is primarily attributable to a $16.0 million tax expense for increasing the valuation allowance against the deferred tax assets, a $22.3 million tax expense for non-deductible compensation paid to certain executives, and a $24.9 million tax benefit from current year operations.
At December 31, 2009, we had gross deferred tax assets of $869.9 million, primarily comprised of $815.0 million of accumulated net operating loss carryforwards. During 2009, we determined that it was not more likely than not that we would realize our deferred tax assets in the foreseeable future. Accordingly, we provided a valuation allowance against our deferred tax assets. If in the future, we determine that the realization of any portion of the deferred tax assets is more likely than not to be realized, we will record a benefit to the income statement or to additional paid-in-capital, as appropriate.
Income (Loss) from Discontinued Operations and Gain (Loss) on Sale of Discontinued Operations. In 2007, we completed the sale of our directory and mobile businesses and have reflected income (loss) from those businesses as income (loss) from discontinued operations. For 2007, we recorded a gain on the sale of the directory business of $57.3 million and a gain on the sale of the mobile services business of $74.2 million. For 2008, we recorded a gain on the sale of the directory business of $48,000 and a loss on the sale of the mobile services business of $818,000. Revenue, income before taxes, income tax expense (benefit), and income (loss) from discontinued operations for 2008 and 2007 are presented below (in thousands):
| Directory |
2008 | 2007 | ||||||
| Revenue from discontinued operations |
$ | — | $ | 28,882 | ||||
| Income from discontinued operations before taxes |
204 | 11,349 | ||||||
| Income tax expense |
(76 | ) | (4,213 | ) | ||||
| Income from discontinued operations, net of taxes |
$ | 128 | $ | 7,136 | ||||
| Mobile |
2008 | 2007 | ||||||
| Revenue from discontinued operations |
$ | 127 | $ | 103,488 | ||||
| Loss from discontinued operations before taxes |
(2,098 | ) | (50,100 | ) | ||||
| Income tax benefit |
515 | 17,718 | ||||||
| Loss from discontinued operations, net of taxes |
$ | (1,583 | ) | $ | (32,382 | ) | ||
Liquidity and Capital Resources
Cash, Cash Equivalents and Short-Term Investments
Our principal source of liquidity is our cash and cash equivalents and short-term investments. We initially generated cash from proceeds from private placements and our initial and follow-on public offerings. More recently we have generated cash from operations in certain periods. Further, in 2007, we received proceeds of $225.0 million from the sale of our directory business and $135.0 million from the sale of our mobile business. In 2008 and 2007, we paid special dividends to our shareholders of $299.3 million and $208.2 million, respectively.
As of December 31, 2009, we had cash and marketable investments of $226.4 million, consisting of cash and cash equivalents of $83.8 million and short-term investments available-for-sale of $142.6 million.
We generally invest our excess cash in high quality marketable investments. These investments include securities issued by U.S. government agencies, certificates of deposit, money market funds, investment grade corporate bonds and taxable municipal bonds.
We plan to use our cash to fund operations, develop technology, advertise, market and distribute our products and application services, and continue the enhancement of our network infrastructure. An important
40
Table of Contents
component of our strategy for future growth is to acquire technologies and businesses, and we plan to use our cash to acquire and integrate acceptable targets that we may identify. We may use a portion of our cash for special dividends or for common stock repurchases.
We believe that existing cash balances, cash equivalents, short term investments and cash generated from operations will be sufficient to meet our anticipated cash needs for working capital and capital expenditures for at least the next 12 months. However, the underlying levels of revenues and expenses that we assume may not prove to be accurate. Our anticipated cash needs exclude any payments for pending or future litigation matters. In addition, we evaluate acquisitions of businesses, products or technologies from time to time. Any such transactions, if completed, may use a significant portion of our cash balances and marketable investments. If we are unable to liquidate our investments when we need liquidity for business purposes, we may need to change or postpone such business purposes or find alternative financing for such business purposes, if available. We may seek additional funding through public or private financings or other arrangements prior to such time. Our ability to raise funds may be adversely affected by a number of factors, including factors beyond our control, such as economic conditions in markets in which we operate and from which we generate revenues, and increased uncertainty in the financial, capital, and credit markets. Adequate funds may not be available when needed or may not be available on favorable terms. If we raise additional funds by issuing equity securities, dilution to existing stockholders may result. If funding is insufficient at any time in the future, we may be unable to develop or enhance our products or services, take advantage of business opportunities or respond to competitive pressures, any of which could harm our business.
Contractual Obligations and Commitments
The following are our contractual obligations and commitments (in thousands):
| 2010 | 2011 | 2012 | 2013 | 2014 and thereafter |
Total | |||||||||||||
| Operating lease commitments |
$ | 1,890 | $ | 1,653 | $ | 1,592 | $ | 271 | $ | — | $ | 5,406 | ||||||
| Purchase commitments |
1,783 | 1,262 | 1,026 | 493 | — | 4,564 | ||||||||||||
| Capital lease commitments, net of imputed interest and executory costs |
568 | 210 | — | — | — | 778 | ||||||||||||
| Total |
$ | 4,241 | $ | 3,125 | $ | 2,618 | $ | 764 | $ | — | $ | 10,748 | ||||||
Operating lease commitments. We have entered into various non-cancelable operating lease agreements for our offices that expire through 2013. We are committed to pay a portion of the related operating expenses under certain of these lease agreements. These operating expenses are not included in the table above. Certain of these leases have escalating rent payment provisions and we recognize rent expense under such leases on a straight-line basis over the term of the lease.
Purchase commitments. Our purchase commitments consist primarily of non-cancelable service agreements for our data centers. Included in the table above are purchase commitments of $285,000 due in 2010, which are reflected as liabilities on our balance sheet.
Capital lease commitments. We entered into capital lease agreements for certain equipment used in our data centers in 2008.
We have pledged a portion of our cash as collateral for standby letters of credit and bank guaranties for certain of our property leases and banking arrangements. At December 31, 2009, the total amount of collateral pledged under these agreements was $4.7 million.
The above table does not reflect unrecognized tax benefits of $1.3 million, the timing of which is uncertain. For additional discussion on unrecognized tax benefits see “Note 8: Income Taxes” of the Notes to Consolidated Financial Statements (Item 8 of Part II of this report.)
41
Table of Contents
Cash Flows
Our net cash flows are comprised of the following for 2009, 2008 and 2007 (in thousands):
| 2009 | 2008 | 2007 | ||||||||||
| Net cash provided (used) by operating activities |
$ | 30,000 | $ | (20,182 | ) | $ | (27,276 | ) | ||||
| Net cash provided (used) by investing activities |
4,421 | (111,284 | ) | 156,181 | ||||||||
| Net cash used by financing activities |
(607 | ) | (298,926 | ) | (169,385 | ) | ||||||
| Net cash provided (used) by discontinued operations |
— | (17,998 | ) | 376,419 | ||||||||
| Net increase (decrease) in cash and cash equivalents |
$ | 33,814 | $ | (448,390 | ) | $ | 335,939 | |||||
Net Cash Provided (Used) by Operating Activities
Net cash provided (used) by operating activities consists of net income (loss) offset by certain adjustments not affecting current-period cash flows and the effect of changes in our operating assets and liabilities. Adjustments to net income (loss) to determine cash flow from operations include the loss from discontinued operations, the gain (loss) on sale of discontinued operations, net loss on investments, stock-based compensation expense, depreciation and amortization, loss on disposal of property and equipment, deferred income taxes, net gain on sale of non-core assets, excess tax benefits from stock-based award activity and restructuring charges. Net cash provided (used) by discontinued operations consists of proceeds from the sale of discontinued operations, income (loss) from discontinued operations, net changes in assets and liabilities of discontinued operations, and purchases of property and equipment classified as discontinued operations.
Net cash provided by operating activities was $30.0 million in 2009, consisting of our net income of $7.4 million, adjustments not affecting cash flows provided by operating activities of $26.4 million (primarily consisting of stock-based compensation, depreciation and amortization, loss on investments, net, and loss on disposals of property and equipment) and cash provided by changes in our operating assets and liabilities of $12.7 million (consisting of increases in accrued expenses and other current and long-term liabilities and in accounts payable and decreases in other long-term assets). Partially offsetting the increase was cash used by changes in our operating assets and liabilities of $15.9 million (primarily consisting of increases in accounts receivable, notes and other receivables and in prepaid expenses and other current assets) and adjustments not affecting cash flows used by operating activities of $607,000, consisting of deferred income taxes.
Net cash used by operating activities was $20.2 million in 2008, consisting of our net loss of $18.7 million, cash used by changes in our operating assets and liabilities of $59.3 million (consisting of decreases in accrued expenses and other liabilities) and adjustments not affecting cash flows used by operating activities of $4.6 million (primarily consisting of decreases in deferred income taxes and the gain on sale of assets). Offsetting the decrease was cash provided by changes in our operating assets and liabilities of $9.4 million (consisting of decreases in notes and other receivables, other long-term assets, accounts receivable, and prepaid expenses and other current assets and increases in accounts payable), and adjustments not affecting cash flows provided by operating activities of $52.9 million (primarily consisting of the loss on long-term investments, stock-based compensation, depreciation, the loss from discontinued operations and the loss on sale of discontinued operations).
Net cash used by operating activities was $27.3 million in 2007, consisting of changes in our operating assets and liabilities of $14.9 million (primarily consisting of a decrease in accounts payable and increases in notes and other receivables, accounts receivable, and other long-term assets) and adjustments not affecting cash flows provided by operating activities of $158.8 million (primarily consisting of the gain on the sale of discontinued operations, reclassification of the tax benefit from stock-based award activity to financing activities, and the gain on sale of assets). These decreases were partially offset by our net income of $21.7 million, cash provided by changes in our operating assets and liabilities of $35.2 million (consisting of increases in accrued expenses and other current and long-term liabilities and decreases in prepaid expenses and other current assets),
42
Table of Contents
and adjustments not affecting cash flows provided by operating activities of $89.4 million (primarily consisting of stock-based compensation, the loss from discontinued operations, decreases in deferred income taxes, restructuring, depreciation, and the loss on long-term investments).
Net Cash Provided (Used) by Investing Activities
Net cash provided (used) by investing activities primarily consists of transactions related to our investments, purchases of property and equipment, a loan to an equity investee, proceeds from the sale of certain assets and cash used in a business acquisition.
Net cash provided by investing activities was $4.4 million in 2009, primarily from the proceeds from the sale or maturity of our marketable investments of $196.9 million and proceeds from the sale of assets of $623,000. Partially offsetting cash provided by investing activities were the purchase of $190.2 million of marketable investments, $2.4 million of property and equipment purchases and $395,000 used for a business acquisition.
Net cash used by investing activities was $111.3 million in 2008, primarily consisting of the purchase of $145.3 million of marketable investments and the purchase of $12.3 million in property and equipment. Partially offsetting cash used by investing activities was proceeds from the sale or maturity of our marketable investments of $44.0 million and proceeds from the sale of assets of $2.6 million.
Net cash provided by investing activities was $156.2 million in 2007, consisting of proceeds from the sale or maturity of our marketable investments of $294.4 million and proceeds from the sale of assets of $2.8 million. Partially offsetting cash provided by investing activities was the purchase of $135.4 million of marketable investments, the purchase of $3.7 million in property and equipment, and a $2.0 million loan to an equity investee.
Net Cash Used by Financing Activities
Net cash used by financing activities consists of special dividends paid to our shareholders, proceeds from the issuance of stock through the exercise of stock options or warrants and our employee stock purchase plan, repayments of capital lease obligations and excess tax benefits from stock-based award activity.
Net cash used by financing activities in 2009 was $607,000, primarily from $1.1 million in tax payments from shares withheld upon vesting of restricted stock units and $564,000 used for the repayment of capital lease obligations. Cash used by financing activities was partially offset by tax benefits generated by stock-based award activity of $607,000 and proceeds of $404,000 from the exercise of stock options and the sale of shares through our employee stock purchase plan.
Net cash used by financing activities in 2008 was $298.9 million, primarily from the special dividend of $299.3 million paid in January 2008. Partially offsetting cash used in financing activities was proceeds of $603,000 from the exercise of stock options and the sale of shares through our employee stock purchase plan.
Net cash used by financing activities in 2007 was $169.4 million, primarily from the special dividend of $208.2 million paid in May 2007. Partially offsetting cash used in financing activities were tax benefits generated by stock-based award activity of $23.7 million and proceeds of $15.1 million from the exercise of stock options and warrants and the sale of shares through our employee stock purchase plan.
43
Table of Contents
Net Cash Provided (Used) by Discontinued Operations
Net cash used by operating activities attributable to discontinued operations in 2008 was $18.0 million. Net cash provided by discontinued operations activities in 2007 was $376.4 million, consisting of proceeds from the sale of discontinued operations of $342.6 million and cash from the operating activities attributable to discontinued operations of $33.8 million.
Acquisition
On May 22, 2009, we acquired the membership interests of F-Four, LLC and the assets of its subsidiary, a provider of search engine optimization analytics software, for $1.3 million in stock and cash.
Dispositions
On October 31, 2007, we completed the sale of our directory business to Idearc Inc. for $225 million in cash.
On December 28, 2007, we completed the sale of our mobile services business to Motricity, Inc. for $135 million in cash.
44
Table of Contents
Quarterly Results of Operations (Unaudited)
The following table presents a summary of our unaudited consolidated results of operations for the eight quarters ended December 31, 2009. The information for each of these quarters has been prepared on a basis consistent with our annual audited consolidated financial statements. In 2007, we sold our mobile and directory businesses to unaffiliated third parties, and our mobile and directory businesses have been presented as discontinued operations for all periods presented. You should read this information in conjunction with our consolidated financial statements and notes thereto included elsewhere in this Annual Report on Form 10-K. The operating results for any quarter are not necessarily indicative of results for any future period.
| March 31, 2008 |
June 30, 2008 |
September 30, 2008 |
December 31, 2008 |
March 31, 2009 |
June 30, 2009 |
September 30, 2009 |
December 31, 2009 | |||||||||||||||||||||||
| (in thousands except per share data) | ||||||||||||||||||||||||||||||
| Revenues |
$ | 42,182 | $ | 38,328 | $ | 39,469 | $ | 36,748 | $ | 39,070 | $ | 43,763 | $ | 54,356 | $ | 70,457 | ||||||||||||||
| Operating expenses: |
||||||||||||||||||||||||||||||
| Content and distribution |
21,792 | 18,062 | 18,265 | 17,850 | 20,377 | 24,309 | 34,016 | 47,791 | ||||||||||||||||||||||
| Systems and network operations |
2,442 | 2,774 | 3,238 | 3,083 | 2,421 | 2,369 | 2,430 | 2,483 | ||||||||||||||||||||||
| Product development |
2,209 | 2,929 | 2,757 | 2,036 | 1,406 | 1,603 | 1,207 | 1,401 | ||||||||||||||||||||||
| Sales and marketing |
3,789 | 6,041 | 6,882 | 7,549 | 6,943 | 5,139 | 6,694 | 6,603 | ||||||||||||||||||||||
| General and administrative |
7,722 | 4,960 | 5,940 | 5,457 | 6,202 | 6,366 | 6,884 | 4,134 | ||||||||||||||||||||||
| Depreciation |
1,487 | 1,731 | 2,160 | 1,957 | 1,811 | 1,795 | 1,771 | 1,764 | ||||||||||||||||||||||
| Amortization of intangible assets |
— | — | — | — | — | 16 | 47 | 48 | ||||||||||||||||||||||
| Restructuring |
140 | (114 | ) | (9 | ) | — | — | — | — | — | ||||||||||||||||||||
| Other, net |
— | (1,897 | ) | — | — | — | — | — | — | |||||||||||||||||||||
| Total operating expenses |
39,581 | 34,486 | 39,233 | 37,932 | 39,160 | 41,597 | 53,049 | 64,224 | ||||||||||||||||||||||
| Operating income (loss) |
2,601 | 3,842 | 236 | (1,184 | ) | (90 | ) | 2,166 | 1,307 | 6,233 | ||||||||||||||||||||
| Gain (loss) on investments, net |
(6,707 | ) | (4,362 | ) | (11,046 | ) | (6,405 | ) | (5,351 | ) | 335 | — | 302 | |||||||||||||||||
| Other income, net |
2,243 | 2,654 | 1,458 | 794 | 607 | 466 | 472 | 1,137 | ||||||||||||||||||||||
| Income (loss) from continuing operations before income taxes |
(1,863 | ) | 2,134 | (9,352 | ) | (6,795 | ) | (4,834 | ) | 2,967 | 1,779 | 7,672 | ||||||||||||||||||
| Income tax benefit (expense) |
(182 | ) | 577 | (548 | ) | (445 | ) | (201 | ) | (82 | ) | 32 | 70 | |||||||||||||||||
| Income (loss) from continuing operations |
(2,045 | ) | 2,711 | (9,900 | ) | (7,240 | ) | (5,035 | ) | 2,885 | 1,811 | 7,742 | ||||||||||||||||||
| Loss from discontinued operations, net of taxes |
(490 | ) | (821 | ) | (12 | ) | (132 | ) | — | — | — | — | ||||||||||||||||||
| Gain (loss) on sale of discontinued operations, net of taxes |
(238 | ) | 43 | (13 | ) | (562 | ) | — | — | — | — | |||||||||||||||||||
| Net income (loss) |
$ | (2,773 | ) | $ | 1,933 | $ | (9,925 | ) | $ | (7,934 | ) | $ | (5,035 | ) | $ | 2,885 | $ | 1,811 | $ | 7,742 | ||||||||||
| Net income (loss) per share – Basic |
||||||||||||||||||||||||||||||
| Income (loss) from continuing operations |
$ | (0.06 | ) | $ | 0.08 | $ | (0.29 | ) | $ | (0.21 | ) | $ | (0.14 | ) | $ | 0.08 | $ | 0.05 | $ | 0.22 | ||||||||||
| Loss from discontinued operations |
(0.01 | ) | (0.02 | ) | (0.00 | ) | (0.00 | ) | — | — | — | — | ||||||||||||||||||
| Gain (loss) on sale of discontinued operations |
(0.01 | ) | 0.00 | (0.00 | ) | (0.02 | ) | — | — | — | — | |||||||||||||||||||
| Net income (loss) per share – Basic |
$ | (0.08 | ) | $ | 0.06 | $ | (0.29 | ) | $ | (0.23 | ) | $ | (0.14 | ) | $ | 0.08 | $ | 0.05 | $ | 0.22 | ||||||||||
| Weighted average shares outstanding used in computing basic income (loss) per share |
34,298 | 34,334 | 34,479 | 34,548 | 34,853 | 35,044 | 35,035 | 35,094 | ||||||||||||||||||||||
| Net income (loss) per share – Diluted |
||||||||||||||||||||||||||||||
| Income (loss) from continuing operations |
$ | (0.06 | ) | $ | 0.08 | $ | (0.29 | ) | $ | (0.21 | ) | $ | (0.14 | ) | $ | 0.08 | $ | 0.05 | $ | 0.21 | ||||||||||
| Loss from discontinued operations |
(0.01 | ) | (0.02 | ) | (0.00 | ) | (0.00 | ) | — | — | — | — | ||||||||||||||||||
| Gain (loss) on sale of discontinued operations |
(0.01 | ) | 0.00 | (0.00 | ) | (0.02 | ) | — | — | — | — | |||||||||||||||||||
| Net income (loss) per share – Diluted |
$ | (0.08 | ) | $ | 0.06 | $ | (0.29 | ) | $ | (0.23 | ) | $ | (0.14 | ) | $ | 0.08 | $ | 0.05 | $ | 0.21 | ||||||||||
| Weighted average shares outstanding used in computing diluted income (loss) per share |
34,298 | 34,755 | 34,479 | 34,548 | 34,853 | 35,069 | 35,766 | 36,112 | ||||||||||||||||||||||
45
Table of Contents
| March 31, 2008 |
June 30, 2008 |
September 30, 2008 |
December 31, 2008 |
March 31, 2009 |
June 30, 2009 |
September 30, 2009 |
December 31, 2009 |
|||||||||||||||||
| (as a percent of revenue) | ||||||||||||||||||||||||
| Revenues |
100.0 | % | 100.0 | % | 100.0 | % | 100.0 | % | 100.0 | % | 100.0 | % | 100.0 | % | 100.0 | % | ||||||||
| Operating expenses: |
||||||||||||||||||||||||
| Content and distribution |
51.7 | 47.1 | 46.3 | 48.6 | 52.1 | 55.6 | 62.5 | 67.8 | ||||||||||||||||
| Systems and network operations |
5.8 | 7.2 | 8.2 | 8.4 | 6.2 | 5.4 | 4.5 | 3.5 | ||||||||||||||||
| Product development |
5.2 | 7.6 | 7.0 | 5.5 | 3.6 | 3.7 | 2.2 | 2.0 | ||||||||||||||||
| Sales and marketing |
9.0 | 15.8 | 17.4 | 20.5 | 17.8 | 11.7 | 12.3 | 9.4 | ||||||||||||||||
| General and administrative |
18.3 | 12.9 | 15.0 | 14.8 | 15.9 | 14.6 | 12.7 | 5.9 | ||||||||||||||||
| Depreciation |
3.5 | 4.5 | 5.5 | 5.4 | 4.6 | 4.1 | 3.3 | 2.5 | ||||||||||||||||
| Amortization of intangible assets |
— | — | — | — | — | 0.0 | 0.1 | 0.1 | ||||||||||||||||
| Restructuring |
0.3 | (0.3 | ) | (0.0 | ) | — | — | — | — | — | ||||||||||||||
| Other, net |
— | (4.8 | ) | — | — | — | — | — | — | |||||||||||||||
| Total operating expenses |
93.8 | 90.0 | 99.4 | 103.2 | 100.2 | 95.1 | 97.6 | 91.2 | ||||||||||||||||
| Operating income (loss) |
6.2 | 10.0 | 0.6 | (3.2 | ) | (0.2 | ) | 4.9 | 2.4 | 8.8 | ||||||||||||||
| Gain (loss) on investments, net |
(15.9 | ) | (11.4 | ) | (28.0 | ) | (17.5 | ) | (13.7 | ) | 0.8 | — | 0.5 | |||||||||||
| Other income, net |
5.3 | 6.9 | 3.7 | 2.2 | 1.5 | 1.1 | 0.9 | 1.6 | ||||||||||||||||
| Income (loss) from continuing operations before income taxes |
(4.4 | ) | 5.5 | (23.7 | ) | (18.5 | ) | (12.4 | ) | 6.8 | 3.3 | 10.9 | ||||||||||||
| Income tax benefit (expense) |
(0.4 | ) | 1.5 | (1.4 | ) | (1.2 | ) | (0.5 | ) | (0.2 | ) | 0.0 | 0.1 | |||||||||||
| Income (loss) from continuing operations |
(4.8 | ) | 7.0 | (25.1 | ) | (19.7 | ) | (12.9 | ) | 6.6 | 3.3 | 11.0 | ||||||||||||
| Income (loss) from discontinued operations, net of taxes |
(1.2 | ) | (2.1 | ) | (0.0 | ) | (0.4 | ) | — | — | — | — | ||||||||||||
| Gain (loss) on sale of discontinued operations, net of taxes |
(0.6 | ) | 0.1 | (0.0 | ) | (1.5 | ) | — | — | — | — | |||||||||||||
| Net income (loss) |
(6.6 | )% | 5.0 | % | (25.1 | )% | (21.6 | )% | (12.9 | )% | 6.6 | % | 3.3 | % | 11.0 | % | ||||||||
46
Table of Contents
| ITEM 7A. | Quantitative and Qualitative Disclosures About Market Risk |
We are exposed to financial market risks, including changes in the market values of our debt investments, interest rates, and foreign currency fluctuations.
Financial Market Risk. We do not invest in financial instruments or their derivatives for trading or speculative purposes. By policy, we limit our credit exposure to any one issuer, other than securities issued by the U.S. federal government and its agencies, and do not have any derivative instruments in our investment portfolio. The three primary goals that guide our investment decisions, with the first being the most important, are: preserve capital, maintain ease of conversion into immediate liquidity and achieve a rate of return over a predetermined benchmark. Our investment portfolio at December 31, 2009 included debt instruments issued by the U.S. federal government and its agencies, U.S. municipal governments, publicly-held corporations and money market funds invested in securities issued by agencies of the U.S. federal government. Beginning in 2007, the global financial markets began to experience unusual and significant distress that peaked in 2008 and moderated in 2009. In 2007, certain auction rate securities that we purchased for $40.4 million became illiquid and experienced a severe decline in fair value before we liquidated those investments in 2009 for net cash proceeds of $9.2 million and realized a net loss of $31.2 million. As of December 31, 2009, we invested exclusively in debt instruments with minimal default risk and maturity dates of less than one year from the end of any of our quarterly accounting periods. We consider the market value, default and liquidity risks of our investments to be low at December 31, 2009.
Interest Rate Risk. Investments in both fixed-rate and floating-rate interest earning instruments carry a degree of interest rate risk. Fixed-rate securities may have their fair market value adversely impacted due to a rise in interest rates, while floating-rate securities may produce less income than expected if interest rates fall. Due in part to these factors, our future investment income may fall short of expectations due to changes in interest rates or we may suffer losses in principal if we are forced to sell securities which have declined in market value due to changes in interest rates. At December 31, 2009, our cash equivalent balances in money market funds were $75.6 million and our short-term investment balances were $142.6 million.
The following table provides information about our cash equivalent and marketable fixed-income securities, including principal cash flows for 2010 and thereafter and the related weighted average interest rates. Amounts are presented in U.S. dollar equivalents, which is our reporting currency.
Principal amounts and weighted average interest rates by expected year of maturity in U.S. dollars as of December 31, 2009 are as follows (in thousands, except percentages):
| 2010 | 2011 -2014 | Thereafter | Total | Fair Value | |||||||||||||||||||||||
| U.S. government securities |
$ | 116,465 | 0.24 | % | $ | — | — | % | $ | — | — | % | $ | 116,465 | 0.24 | % | $ | 117,058 | |||||||||
| Money market funds |
60,072 | 0.05 | % | — | — | % | — | — | % | 60,072 | 0.05 | % | 60,072 | ||||||||||||||
| Commercial paper |
38,575 | 0.20 | % | — | — | % | — | — | % | 38,575 | 0.20 | % | 38,548 | ||||||||||||||
| Taxable municipal bonds |
2,550 | 0.22 | % | — | — | % | — | — | % | 2,550 | 0.22 | % | 2,604 | ||||||||||||||
| Cash equivalents and marketable fixed-income securities |
$ | 217,662 | $ | — | $ | — | $ | 217,662 | $ | 218,282 | |||||||||||||||||
Foreign Currency Risk. Our earnings and cash flows are subject to fluctuations due to changes in the exchange rates of the U.S. dollar versus the principal currency of foreign countries in which we generate revenues and expenses through our non-U.S. based subsidiaries and foreign distribution partners. As exchange rates vary, those results, when translated, may vary from expectations and adversely impact our consolidated results. The cumulative translation effects for subsidiaries using functional currencies other than the U.S. dollar are included in accumulated other comprehensive income in stockholders’ equity. We do not currently use derivative instruments to manage our exposure to changes in foreign currency exchange rates as this exposure has had an immaterial impact on our past financial results and we believe that our foreign currency activity and exposure at December 31, 2009 presents a low risk of negative material impact on our future financial results.
47
Table of Contents
| ITEM 8. | Financial Statements and Supplementary Data |
INDEX TO CONSOLIDATED FINANCIAL STATEMENTS
| INFOSPACE, Inc. |
Page | |
| 49 | ||
| 50 | ||
| Consolidated Statements of Operations and Comprehensive Income (Loss) |
51 | |
| 52 | ||
| 53 | ||
| 54 | ||
48
Table of Contents
REPORT OF INDEPENDENT REGISTERED PUBLIC ACCOUNTING FIRM
To the Board of Directors and Stockholders of
InfoSpace, Inc.
Bellevue, WA
We have audited the accompanying consolidated balance sheets of InfoSpace, Inc. and subsidiaries (the “Company”) as of December 31, 2009 and 2008, and the related consolidated statements of operations and comprehensive income (loss), stockholders’ equity, and cash flows for each of the three years in the period ended December 31, 2009. These financial statements are the responsibility of the Company’s management. Our responsibility is to express an opinion on these financial statements based on our audits.
We conducted our audits in accordance with the standards of the Public Company Accounting Oversight Board (United States). Those standards require that we plan and perform the audit to obtain reasonable assurance about whether the financial statements are free of material misstatement. An audit includes examining, on a test basis, evidence supporting the amounts and disclosures in the financial statements. An audit also includes assessing the accounting principles used and significant estimates made by management, as well as evaluating the overall financial statement presentation. We believe that our audits provide a reasonable basis for our opinion.
In our opinion, such consolidated financial statements present fairly, in all material respects, the financial position of InfoSpace, Inc. and subsidiaries as of December 31, 2009 and 2008, and the results of their operations and their cash flows for each of the three years in the period ended December 31, 2009, in conformity with accounting principles generally accepted in the United States of America.
We have also audited, in accordance with the standards of the Public Company Accounting Oversight Board (United States), the Company’s internal control over financial reporting as of December 31, 2009, based on the criteria established in Internal Control—Integrated Framework issued by the Committee of Sponsoring Organizations of the Treadway Commission and our report dated February 25, 2010 expressed an unqualified opinion on the Company’s internal control over financial reporting.
/s/ DELOITTE & TOUCHE LLP
Seattle, WA
February 25, 2010
49
Table of Contents
CONSOLIDATED BALANCE SHEETS
(amounts in thousands, except share data)
| December 31, | ||||||||
| 2009 | 2008 | |||||||
| ASSETS | ||||||||
| Current assets: |
||||||||
| Cash and cash equivalents |
$ | 83,750 | $ | 49,936 | ||||
| Short-term investments, available-for-sale |
142,647 | 141,592 | ||||||
| Accounts receivable, net of allowance of $23 and $32 |
28,466 | 15,423 | ||||||
| Notes and other receivables |
2,953 | 1,349 | ||||||
| Prepaid expenses and other current assets |
2,526 | 1,767 | ||||||
| Total current assets |
260,342 | 210,067 | ||||||
| Property and equipment, net |
12,315 | 18,078 | ||||||
| Long-term investments, available-for-sale |
— | 13,916 | ||||||
| Goodwill |
44,815 | 43,940 | ||||||
| Other intangible assets, net |
457 | 183 | ||||||
| Other long-term assets |
4,287 | 4,949 | ||||||
| Total assets |
$ | 322,216 | $ | 291,133 | ||||
| LIABILITIES AND STOCKHOLDERS’ EQUITY | ||||||||
| Current liabilities: |
||||||||
| Accounts payable |
$ | 6,736 | $ | 6,518 | ||||
| Accrued expenses and other current liabilities |
34,131 | 19,707 | ||||||
| Liabilities of discontinued operations |
— | 1,109 | ||||||
| Total current liabilities |
40,867 | 27,334 | ||||||
| Long-term liabilities |
1,514 | 1,475 | ||||||
| Total liabilities |
42,381 | 28,809 | ||||||
| Commitments and contingencies (Note 7) |
— | — | ||||||
| Stockholders’ equity: |
||||||||
| Common stock, par value $.0001—authorized, 900,000,000 shares; issued and outstanding, 35,391,122 and 34,796,010 shares |
4 | 3 | ||||||
| Additional paid-in capital |
1,303,667 | 1,292,360 | ||||||
| Accumulated deficit |
(1,025,176 | ) | (1,032,579 | ) | ||||
| Accumulated other comprehensive income |
1,340 | 2,540 | ||||||
| Total stockholders’ equity |
279,835 | 262,324 | ||||||
| Total liabilities and stockholders’ equity |
$ | 322,216 | $ | 291,133 | ||||
See notes to consolidated financial statements.
50
Table of Contents
CONSOLIDATED STATEMENTS OF OPERATIONS AND COMPREHENSIVE INCOME (LOSS)
(amounts in thousands, except per share data)
| Years ended December 31, | ||||||||||||
| 2009 | 2008 | 2007 | ||||||||||
| Revenues |
$ | 207,646 | $ | 156,727 | $ | 140,537 | ||||||
| Operating expenses: |
||||||||||||
| Content and distribution |
126,493 | 75,969 | 61,765 | |||||||||
| Systems and network operations |
9,703 | 11,537 | 9,800 | |||||||||
| Product development |
5,617 | 9,931 | 9,921 | |||||||||
| Sales and marketing |
25,379 | 24,261 | 29,259 | |||||||||
| General and administrative |
23,586 | 24,079 | 105,083 | |||||||||
| Depreciation |
7,141 | 7,335 | 5,542 | |||||||||
| Amortization of intangible assets |
111 | — | — | |||||||||
| Restructuring |
— | 17 | 9,590 | |||||||||
| Other, net |
— | (1,897 | ) | (3,248 | ) | |||||||
| Total operating expenses |
198,030 | 151,232 | 227,712 | |||||||||
| Operating income (loss) |
9,616 | 5,495 | (87,175 | ) | ||||||||
| Loss on investments, net |
(4,714 | ) | (28,520 | ) | (2,117 | ) | ||||||
| Other income, net |
2,682 | 7,149 | 18,226 | |||||||||
| Income (loss) from continuing operations before income taxes |
7,584 | (15,876 | ) | (71,066 | ) | |||||||
| Income tax expense |
(181 | ) | (598 | ) | (13,409 | ) | ||||||
| Income (loss) from continuing operations |
7,403 | (16,474 | ) | (84,475 | ) | |||||||
| Discontinued operations: |
||||||||||||
| Loss from discontinued operations, net of taxes |
— | (1,455 | ) | (25,246 | ) | |||||||
| Gain (loss) on sale of discontinued operations, net of taxes |
— | (770 | ) | 131,454 | ||||||||
| Net income (loss) |
$ | 7,403 | $ | (18,699 | ) | $ | 21,733 | |||||
| Income (loss) per share—Basic: |
||||||||||||
| Income (loss) from continuing operations |
$ | 0.21 | $ | (0.48 | ) | $ | (2.59 | ) | ||||
| Loss from discontinued operations |
— | (0.04 | ) | (0.77 | ) | |||||||
| Gain (loss) on sale of discontinued operations |
— | (0.02 | ) | 4.03 | ||||||||
| Basic net income (loss) per share |
$ | 0.21 | $ | (0.54 | ) | $ | 0.67 | |||||
| Weighted average shares outstanding used in computing basic income (loss) per share |
34,983 | 34,415 | 32,640 | |||||||||
| Income (loss) per share—Diluted: |
||||||||||||
| Income (loss) from continuing operations |
$ | 0.21 | $ | (0.48 | ) | $ | (2.59 | ) | ||||
| Loss from discontinued operations |
— | (0.04 | ) | (0.77 | ) | |||||||
| Gain (loss) on sale of discontinued operations |
— | (0.02 | ) | 4.03 | ||||||||
| Diluted net income (loss) per share |
$ | 0.21 | $ | (0.54 | ) | $ | 0.67 | |||||
| Weighted average shares outstanding used in computing diluted income (loss) per share |
35,431 | 34,415 | 32,640 | |||||||||
| Other comprehensive income (loss): |
||||||||||||
| Net income (loss) |
$ | 7,403 | $ | (18,699 | ) | $ | 21,733 | |||||
| Foreign currency translation adjustment |
(108 | ) | (47 | ) | 168 | |||||||
| Unrealized gain (loss) on investments, available-for-sale |
(943 | ) | 1,109 | (2,081 | ) | |||||||
| Reclassification adjustment for other-than-temporary losses (gains) on investments, available-for-sale, included in net income (loss) |
(335 | ) | 776 | 1,337 | ||||||||
| Cumulative tax effect on unrealized gain on investments, available-for-sale |
186 | — | — | |||||||||
| Comprehensive income (loss) |
$ | 6,203 | $ | (16,861 | ) | $ | 21,157 | |||||
See notes to consolidated financial statements.
51
Table of Contents
CONSOLIDATED STATEMENTS OF STOCKHOLDERS’ EQUITY
Years Ended December 31, 2009, 2008 and 2007
(in thousands)
|
Common stock |
Additional paid-in capital |
Accumulated deficit |
Accumulated other comprehensive income |
Total | ||||||||||||||||||
| Shares | Amount | |||||||||||||||||||||
| Balance, December 31, 2006 |
31,393 | $ | 3 | $ | 1,712,897 | $ | (1,035,613 | ) | $ | 1,278 | $ | 678,565 | ||||||||||
| Common stock issued for stock options and restricted stock units |
1,701 | — | 9,949 | — | — | 9,949 | ||||||||||||||||
| Common stock issued for employee stock purchase plan |
77 | — | 1,382 | — | — | 1,382 | ||||||||||||||||
| Common stock issued for warrants |
1,151 | — | 3,787 | — | — | 3,787 | ||||||||||||||||
| Unrealized loss on available-for-sale investments |
— | — | — | — | (744 | ) | (744 | ) | ||||||||||||||
| Foreign currency translation adjustment |
— | — | — | — | 168 | 168 | ||||||||||||||||
| Excess tax benefits |
— | — | 14,778 | — | — | 14,778 | ||||||||||||||||
| Stock-based compensation |
— | — | 50,283 | — | — | 50,283 | ||||||||||||||||
| Taxes paid on stock issued for equity awards |
— | — | (6,238 | ) | — | — | (6,238 | ) | ||||||||||||||
| Common stock repurchased |
— | — | (114 | ) | — | — | (114 | ) | ||||||||||||||
| Special dividends |
— | — | (507,499 | ) | — | — | (507,499 | ) | ||||||||||||||
| Net income |
— | — | — | 21,733 | — | 21,733 | ||||||||||||||||
| Balance, December 31, 2007 |
34,322 | 3 | 1,279,225 | (1,013,880 | ) | 702 | 266,050 | |||||||||||||||
| Common stock issued for stock options and restricted stock units |
420 | — | 16 | — | — | 16 | ||||||||||||||||
| Common stock issued for employee stock purchase plan |
54 | — | 587 | — | — | 587 | ||||||||||||||||
| Unrealized gain on available-for-sale investments |
— | — | — | — | 1,885 | 1,885 | ||||||||||||||||
| Foreign currency translation adjustment |
— | — | — | — | (47 | ) | (47 | ) | ||||||||||||||
| Tax effect of equity compensation |
— | — | (1,029 | ) | — | — | (1,029 | ) | ||||||||||||||
| Stock-based compensation |
— | — | 15,143 | — | — | 15,143 | ||||||||||||||||
| Taxes paid on stock issued for equity awards |
— | — | (1,582 | ) | — | — | (1,582 | ) | ||||||||||||||
| Net loss |
— | — | — | (18,699 | ) | — | (18,699 | ) | ||||||||||||||
| Balance, December 31, 2008 |
34,796 | 3 | 1,292,360 | (1,032,579 | ) | 2,540 | 262,324 | |||||||||||||||
| Common stock issued for stock options and restricted stock units |
366 | — | 5 | — | — | 5 | ||||||||||||||||
| Common stock issued for employee stock purchase plan |
61 | — | 399 | — | — | 399 | ||||||||||||||||
| Common stock issued for acquisition |
230 | 1 | 809 | — | — | 810 | ||||||||||||||||
| Common stock retired |
(62 | ) | — | — | — | — | — | |||||||||||||||
| Unrealized loss on available-for-sale investments |
— | — | — | — | (1,278 | ) | (1,278 | ) | ||||||||||||||
| Foreign currency translation adjustment |
— | — | — | — | (108 | ) | (108 | ) | ||||||||||||||
| Tax effect of equity compensation |
— | — | 607 | — | 186 | 793 | ||||||||||||||||
| Stock-based compensation |
— | — | 10,838 | — | — | 10,838 | ||||||||||||||||
| Taxes paid on stock issued for equity awards |
— | — | (1,351 | ) | — | — | (1,351 | ) | ||||||||||||||
| Net income |
— | — | — | 7,403 | — | 7,403 | ||||||||||||||||
| Balance, December 31, 2009 |
35,391 | $ | 4 | $ | 1,303,667 | $ | (1,025,176 | ) | $ | 1,340 | $ | 279,835 | ||||||||||
See notes to consolidated financial statements.
52
Table of Contents
CONSOLIDATED STATEMENTS OF CASH FLOWS
(in thousands)
| Years ended December 31, | ||||||||||||
| 2009 | 2008 | 2007 | ||||||||||
| Operating Activities: |
||||||||||||
| Net income (loss) |
$ | 7,403 | $ | (18,699 | ) | $ | 21,733 | |||||
| Adjustments to reconcile net income (loss) to net cash provided (used) by operating activities: |
||||||||||||
| Loss from discontinued operations |
— | 1,455 | 25,246 | |||||||||
| Loss (gain) on sale of discontinued operations |
— | 770 | (131,454 | ) | ||||||||
| Stock-based compensation |
10,568 | 14,304 | 34,058 | |||||||||
| Depreciation and amortization |
7,252 | 7,335 | 5,542 | |||||||||
| Loss on investments, net |
4,714 | 28,520 | 2,182 | |||||||||
| Loss (gain) on disposal of assets, net |
642 | 629 | (161 | ) | ||||||||
| Deferred income taxes |
2,814 | (2,667 | ) | 12,816 | ||||||||
| Restructuring |
— | 17 | 9,590 | |||||||||
| Net gain on sale of assets |
— | (1,897 | ) | (3,409 | ) | |||||||
| Excess tax benefits from stock-based award activity |
(607 | ) | — | (23,700 | ) | |||||||
| Other |
377 | (89 | ) | (35 | ) | |||||||
| Cash provided (used) by changes in operating assets and liabilities: |
||||||||||||
| Accounts receivable |
(13,043 | ) | 1,643 | (3,657 | ) | |||||||
| Notes and other receivables |
(2,104 | ) | 5,228 | (3,941 | ) | |||||||
| Prepaid expenses and other current assets |
(759 | ) | 135 | 1,499 | ||||||||
| Other long-term assets |
712 | 1,784 | (1,862 | ) | ||||||||
| Accounts payable |
641 | 614 | (5,445 | ) | ||||||||
| Accrued expenses and other current and long-term liabilities |
11,390 | (59,264 | ) | 33,722 | ||||||||
| Net cash provided (used) by operating activities |
30,000 | (20,182 | ) | (27,276 | ) | |||||||
| Investing Activities: |
||||||||||||
| Business acquisition, net of cash acquired |
(395 | ) | — | — | ||||||||
| Purchases of property and equipment |
(2,435 | ) | (12,277 | ) | (3,684 | ) | ||||||
| Other long-term assets |
(50 | ) | (199 | ) | — | |||||||
| Proceeds from sale of assets |
623 | 2,550 | 2,838 | |||||||||
| Loan to equity investee |
— | — | (2,000 | ) | ||||||||
| Proceeds from sales and maturities of investments |
196,856 | 43,980 | 294,381 | |||||||||
| Purchases of investments |
(190,178 | ) | (145,338 | ) | (135,354 | ) | ||||||
| Net cash provided (used) by investing activities |
4,421 | (111,284 | ) | 156,181 | ||||||||
| Financing Activities: |
||||||||||||
| Special dividend paid |
— | (299,296 | ) | (208,203 | ) | |||||||
| Proceeds from stock option and warrant exercises |
5 | 16 | 13,736 | |||||||||
| Proceeds from issuance of stock through employee stock purchase plan |
399 | 587 | 1,382 | |||||||||
| Repayment of capital lease obligation |
(564 | ) | (233 | ) | — | |||||||
| Tax payments from shares withheld upon vesting of restricted stock units |
(1,054 | ) | — | — | ||||||||
| Excess tax benefits from stock-based award activity |
607 | — | 23,700 | |||||||||
| Net cash used by financing activities |
(607 | ) | (298,926 | ) | (169,385 | ) | ||||||
| Discontinued operations: |
||||||||||||
| Operating activities |
— | (17,998 | ) | 33,820 | ||||||||
| Investing activities |
— | — | 342,599 | |||||||||
| Net cash provided (used) by discontinued operations |
— | (17,998 | ) | 376,419 | ||||||||
| Net increase (decrease) in cash and cash equivalents |
33,814 | (448,390 | ) | 335,939 | ||||||||
| Cash and cash equivalents, beginning of period |
49,936 | 498,326 | 162,387 | |||||||||
| Cash and cash equivalents, end of period |
$ | 83,750 | $ | 49,936 | $ | 498,326 | ||||||
| Supplemental disclosure of non-cash investing activities: |
||||||||||||
| Stock issued in purchase transaction |
$ | 809 | $ | — | $ | — | ||||||
| Net liabilities assumed in purchase transaction |
(56 | ) | — | — | ||||||||
| Supplemental disclosure of non-cash financing activities: |
||||||||||||
| Special dividend payable at year end |
$ | — | $ | — | $ | 299,296 | ||||||
| Purchases of assets under capital leases |
$ | — | $ | 1,601 | $ | — | ||||||
| Cash paid for: |
||||||||||||
| Income taxes for continuing operations |
$ | 34 | $ | 5,117 | $ | — | ||||||
See notes to consolidated financial statements.
53
Table of Contents
NOTES TO CONSOLIDATED FINANCIAL STATEMENTS
Years Ended December 31, 2009, 2008 and 2007
Note 1: The Company and Basis of Presentation
Description of the business: InfoSpace, Inc. (the “Company” or “InfoSpace”) uses its technology, including metasearch, to power its branded Web sites and provide private-label online search services to its distribution partners.
Principles of consolidation: The consolidated financial statements include the accounts of the Company and its subsidiaries. All significant intercompany accounts and transactions have been eliminated.
Basis of presentation: On October 31, 2007, the Company completed the sale of its directory business to Idearc Inc., for $225.0 million in cash. On December 28, 2007, the Company completed the sale of its mobile business to Motricity, Inc., for $135.0 million in cash. The operating results of the directory and mobile businesses have been presented as discontinued operations for 2008 and 2007.
Business combinations: Business combinations accounted for under the purchase method of accounting include the results of operations of the acquired business from the date of acquisition. Net assets of the business acquired are recorded at their fair value at the date of acquisition.
Segments: The Company’s chief executive officer, who is its chief operating decision maker, reviews financial information presented on a consolidated basis accompanied by disaggregated information for certain measures. This information is used for purposes of allocating resources and evaluating financial performance. The Company’s operations are not organized into components below the consolidated unit level, and operating results are not reported to the chief executive officer for components below the consolidated unit level. Accordingly, the Company’s management considers InfoSpace to be in a single reporting segment structure.
Reclassification: Certain reclassifications of prior period balances have been made for consistent presentation with the current period. These changes consisted of reclassifications to separate intangible assets with definite and indefinite lives from goodwill in the Company’s Balance Sheet as of December 31, 2008 and reclassifications to segregate losses (gains) on disposal of assets in the Company’s Statements of Cash Flows for the years ended December 31, 2007 and 2008. Those reclassifications did not impact previously reported total assets on the Balance Sheets or net cash provided (used) by operating activities in the Statements of Cash Flows.
Subsequent Events: The Company has evaluated the impact of subsequent events on the accompanying Unaudited Condensed Consolidated Financial Statements through the time of filing this Annual Report on Form 10-K. There were no material subsequent events that required recognition or disclosure.
Note 2: Summary of Significant Accounting Policies
Cash equivalents: The Company considers all highly liquid debt instruments with an original maturity of ninety days or less at date of acquisition to be Cash equivalents, which are carried at fair value.
Short-term and long-term investments: The Company principally invests its available cash in investment-grade debt instruments of corporate issuers and in debt instruments of the U.S. Government and its agencies. All debt instruments with maturities greater than ninety days up to one year from the balance sheet date are considered Short-term investments. Other investments maturing after one year from the balance sheet date are generally considered Long-term investments. The Company periodically evaluates whether the declines in fair value of its available-for-sale investments are other than temporary. As of December 31, 2009 and 2008, the
54
Table of Contents
INFOSPACE, INC.
NOTES TO CONSOLIDATED FINANCIAL STATEMENTS—(Continued)
Years Ended December 31, 2009, 2008 and 2007
Company’s Short-term and Long-term investments are classified as available-for-sale and are reported at their fair value, with unrealized gains and temporary impairments reported in Other comprehensive income (loss), and other-than-temporary impairments reported in Loss on investments, net in the Consolidated Statement of Operations.
Property and equipment: Property and equipment are stated at cost. Depreciation is computed under the straight-line method over the following estimated useful lives:
| Computer equipment and software |
3 years | |
| Data center servers |
3 years | |
| Internally developed software |
15 months – 3 years | |
| Office equipment |
7 years | |
| Office furniture |
7 years | |
| Leasehold improvements |
Shorter of lease term or economic life |
The Company has capitalized certain internal use software development costs in accordance with the provisions of Accounting Standards Codification (“ASC”) 350-40, Internal-Use Software. Costs capitalized primarily consist of employee salaries and benefits allocated on a project or product basis. The Company capitalized $1.1 million, $1.7 million, and $1.5 million of internal-use software costs in the years ended December 31, 2009, 2008 and 2007, respectively.
Valuation of goodwill and intangible assets: The Company evaluates goodwill and indefinite-lived intangible assets at least annually to determine whether there has been an impairment of the value of these assets and evaluates impairment whenever events or changes in circumstances, including material changes in the fair value of the Company’s outstanding common stock, indicate that the carrying amount of the Company’s assets might not be recoverable. The Company amortizes definite-lived intangible assets over their expected useful lives, and when events or circumstances indicate that the carrying amount of a long-lived asset or asset group may not be recoverable, the Company performs a test to determine whether the carrying amount of the asset or asset group tested is not recoverable and its carrying amount exceeds its fair value. Any impairment loss relating to Goodwill or Other intangible assets are recognized in the Consolidated Statements of Operations and Comprehensive Income (Loss).
The following table provides information about activity in Goodwill during the period from January 1, 2008 to December 31, 2009 (in thousands):
| Goodwill as of January 1, 2008 and 2009 |
$ | 43,940 | |
| Goodwill associated with 2009 business acquisition |
875 | ||
| Goodwill as of December 31, 2009 |
$ | 44,815 | |
55
Table of Contents
INFOSPACE, INC.
NOTES TO CONSOLIDATED FINANCIAL STATEMENTS—(Continued)
Years Ended December 31, 2009, 2008 and 2007
Other intangible assets consisted of the following (in thousands):
| December 31, 2009 | December 31, 2008 | |||||||||||||||||||
| Gross carrying amount |
Accumulated amortization |
Other intangible assets, net |
Gross carrying amount |
Accumulated amortization |
Other intangible assets, net | |||||||||||||||
| Definite-lived intangible assets: |
||||||||||||||||||||
| Core technology |
$ | 1,085 | $ | (911 | ) | $ | 174 | $ | 800 | $ | (800 | ) | $ | — | ||||||
| Other |
6,667 | (6,667 | ) | — | 6,667 | (6,667 | ) | — | ||||||||||||
| Total definite-lived intangible assets |
7,752 | (7,578 | ) | 174 | 7,467 | (7,467 | ) | — | ||||||||||||
| Indefinite-lived intangible assets |
283 | — | 283 | 183 | — | 183 | ||||||||||||||
| Total |
$ | 8,035 | $ | (7,578 | ) | $ | 457 | $ | 7,650 | $ | (7,467 | ) | $ | 183 | ||||||
Amortization of definite-lived intangible assets held as of December 31, 2009 is expected to be $174,000 in 2010.
Impairment and Allocation Analyses: In the years ended December 31, 2009, 2008 and 2007, the Company conducted its annual impairment analyses for goodwill and indefinite-lived intangible assets as of November 30, 2009, 2008 and 2007 and determined that the carrying value of its goodwill and indefinite-lived intangible assets was not impaired. Before 2008, the annual impairment analyses were based on a valuation of the Company’s reporting units using a combination of the Company’s quoted stock price and projections of future discounted cash flows for each reporting unit. Upon the sale of the mobile business in 2007, the Company determined that it no longer operates separate reporting units. Therefore, the methodology used for the Company’s 2009 and 2008 analyses is primarily based on a comparison of the balance of its stockholders’ equity to the fair value of its outstanding common stock based on the Company’s quoted stock price.
In the year ended December 31, 2007, related to the sale of its directory business, the Company allocated $60.5 million of goodwill to discontinued operations from its former Online segment, based on an analysis using a combination of the revenues, direct contribution to profit and cash flows of the directory and search businesses, and the Company’s quoted stock price.
Other investments: Included in Other long-term assets are the Company’s investment in equity investments of privately-held companies for business and strategic purposes. The Company currently holds equity securities and warrants to purchase equity securities in companies whose securities are not publicly traded. The Company does not exercise significant influence over the operating or financial policies of any of the non-public companies in which it has invested and therefore accounts for such investments under the cost method and warrants are held at their fair value with changes in fair value recorded as Gains or losses on investments in other comprehensive income (loss). The Company periodically evaluates whether the declines in fair value of its equity investments are other-than-temporary, and reports other-than-temporary impairments as Losses on investments, net in the Consolidated Statements of Operations and Comprehensive Income (Loss).
Revenues: The Company generates revenues from its search services. The Company generates revenues primarily from its Web search services when an end user of such services clicks on a paid search link provided by a customer and displayed on one of the Company’s owned and operated Web properties or displayed on a distribution partner’s Web property. The customer that provided the paid search link receives a fee from the advertiser who paid for the click and the customer pays the Company a portion of that fee.
56
Table of Contents
INFOSPACE, INC.
NOTES TO CONSOLIDATED FINANCIAL STATEMENTS—(Continued)
Years Ended December 31, 2009, 2008 and 2007
Search revenue is recorded on a gross basis based on the factors outlined in ASC 605-45-45, Principal Agent Considerations—Overall Considerations of Reporting Revenue Gross as a Principal versus Net as an Agent. The Company is the primary obligor in the revenue-generating relationships with its search engine customers; it separately negotiates each revenue or unit pricing contract independent of any revenue sharing arrangements and assumes the credit risk for amounts invoiced to such customers. Revenues are recognized in the period in which a paid search occurs and are based on the amounts earned by and remitted to the Company. Through its meta-search technology, the Company determines the paid search results, content and information directed to its owned and operated Web sites and its distribution partners’ Web properties. The Company earns revenue from its search engine customers by providing paid search results generated from its owned and operated properties and from its distribution partners’ Web properties based on separately negotiated and agreed-upon terms with each distribution partner.
Content and distribution expenses: Content and distribution expenses consist principally of costs related to revenue sharing arrangements with distribution partners in connection with the search services for Web properties of the Company’s distribution partners and other content or data licenses.
System and network operation expenses: System and network operation expenses are costs associated with the delivery, maintenance and support of the Company’s products, services and infrastructure and principally consist of personnel costs (which include salaries, benefits and other employee related costs, stock-based compensation, and the cost of temporary help and contractors to augment staffing needs), communication costs, such as high-speed Internet access and hosting, equipment maintenance and repair, and professional service fees.
Product development expenses: Product development expenses consist principally of personnel costs (which include salaries, benefits and other employee related costs, stock-based compensation, and the cost of temporary help and contractors to augment staffing needs) for research, development, support and ongoing enhancements of the Company’s products and services.
Sales and marketing expenses: Sales and marketing expenses consist principally of personnel costs (which include salaries, benefits and other employee related costs, stock-based compensation, and the cost of temporary help and contractors to augment staffing needs) and marketing expenses associated with the Company’s owned and operated Web sites (consisting of agency fees, brand promotion expense, market research expense and online direct marketing expense associated with traffic acquisition, including fees paid to search engines). Costs for advertising are recorded as expense when the advertisement appears or electronic impressions are recorded. Advertising expense totaled $15.4 million, $11.4 million, and $4.3 million for the years ended December 31, 2009, 2008 and 2007, respectively.
General and administrative expenses: General and administrative expenses consist principally of personnel costs (which include salaries, benefits and other employee related costs), stock-based compensation, professional service fees (which include legal, tax and audit fees), taxes, license and insurance expenses, certain legal settlements, occupancy and general office expenses, and general business development and management expenses.
Stock-based compensation: The Company measures and recognizes its compensation expense for all share-based payment awards made to employees and directors, including stock option grants and purchases of stock made pursuant to the Company’s 1998 Employee Stock Purchase Plan (the “ESPP”), based on estimated fair values. Expense is recognized on a straight-line basis over the requisite vesting period for each separately vesting portion of the award.
57
Table of Contents
INFOSPACE, INC.
NOTES TO CONSOLIDATED FINANCIAL STATEMENTS—(Continued)
Years Ended December 31, 2009, 2008 and 2007
The Company estimates the fair value of share-based payment awards on the date of grant using the Black-Scholes-Merton option-pricing model. The value of the award’s portion that is ultimately expected to vest is recognized as expense over the requisite service periods in the accompanying Consolidated Financial Statements for the years ended December 31, 2009, 2008 and 2007.
Employee Benefit Plan: The Company has a 401(k) savings plan covering its U.S. based employees. Eligible employees may contribute through payroll deductions. The Company may match the employees’ 401(k) contributions at the discretion of the Company’s Board of Directors. During 2009, 2008 and 2007, the Company’s Board of Directors elected to match a portion of the 401(k) contributions made by employees of the Company. The amount contributed by the Company is equal to a maximum of 50% of employee contributions up to a maximum of 3% of an employee’s salary. For the years ended December 31, 2009, 2008 and 2007, the Company contributed $326,000, $327,000, and $315,000, respectively, for employees of continuing operations.
Restructuring charges: Restructuring charges reflect actual and estimated costs associated with the reductions in workforce and costs associated with the closures of certain Company facilities. In 2007, the Company sold its directory business and the remaining portions of its mobile service business and, as a result, committed to a plan to make operational changes to its business, which included a reduction in workforce and, as part of the workforce reduction, consolidation of facilities. The Company exited portions of its mobile business during 2006 and 2007, which included a plan committed to in 2006 that included a reduction of its workforce and consolidation of its facilities.
Other, net: Other, net consists of gains or charges that are not directly associated with other revenues or operating expense classifications. There were no Other, net charges in the year ended December 31, 2009. Other, net during the years ended December 31, 2008 and 2007 of $1.9 million and $3.2 million, respectively, primarily consisted of the gains on sales of non-core assets.
Other income, net: Other income, net for the years ended December 31, 2009, 2008 and 2007, consists of the following (in thousands):
| Years ended December 31, | ||||||||||||
| 2009 | 2008 | 2007 | ||||||||||
| Interest income |
$ | 3,390 | $ | 7,315 | $ | 18,194 | ||||||
| Gain on contingency resolution |
— | 1,124 | — | |||||||||
| Foreign currency exchange loss |
(66 | ) | (661 | ) | (129 | ) | ||||||
| Gain (loss) on disposal of property and equipment |
(642 | ) | (629 | ) | 161 | |||||||
| Other income, net |
$ | 2,682 | $ | 7,149 | $ | 18,226 | ||||||
Income (loss) from discontinued operations and gain (loss) on sale of discontinued operations: In 2007, the Company completed the sale of its directory and mobile businesses and has reflected the results of operations from these businesses as discontinued operations for all periods presented.
58
Table of Contents
INFOSPACE, INC.
NOTES TO CONSOLIDATED FINANCIAL STATEMENTS—(Continued)
Years Ended December 31, 2009, 2008 and 2007
For the years ended December 31, 2008 and 2007, the Company recorded income from the operating results of its directory and mobile businesses. For the sale of its directory business, the Company recorded a gain on sale of $48,000, net of tax expense of $26,000, and $57.3 million, net of tax expense of $79.2 million in the years ended December 31, 2008 and 2007, respectively. For the sale of its mobile business, the Company recorded a loss on sale of $818,000, net of tax benefit of $780,000, and a gain of $74.2 million, net of tax expense of $38.7 million, in the years ended December 31, 2008 and 2007, respectively. These amounts consist of the following (in thousands):
| Directory |
Years ended December 31, | |||||||
| 2008 | 2007 | |||||||
| Revenue from discontinued operations |
$ | — | $ | 28,882 | ||||
| Income from discontinued operations before taxes |
204 | 11,349 | ||||||
| Income tax expense |
(76 | ) | (4,213 | ) | ||||
| Income from discontinued operations, net of taxes |
$ | 128 | $ | 7,136 | ||||
| Gain on sale of discontinued operations, net of taxes |
$ | 48 | $ | 57,272 | ||||
| Mobile |
Years ended December 31, | |||||||
| 2008 | 2007 | |||||||
| Revenue from discontinued operations |
$ | 127 | $ | 103,488 | ||||
| Loss from discontinued operations before taxes |
(2,098 | ) | (50,100 | ) | ||||
| Income tax benefit |
515 | 17,718 | ||||||
| Loss from discontinued operations, net of taxes |
$ | (1,583 | ) | $ | (32,382 | ) | ||
| Gain (loss) on sale of discontinued operations, net of taxes |
$ | (818 | ) | $ | 74,182 | |||
In 2007, the Company recorded employee expenses of $460,000 for the directory business and $11.6 million for the mobile business related to the cash distributions to shareholders associated with discontinued operations.
There were no assets or liabilities related to the directory business at December 31, 2008. Liabilities from discontinued operations at December 31, 2008 for the mobile business consist of the following (in thousands):
| Mobile |
December 31, 2008 | ||
| Accounts payable |
$ | 31 | |
| Accrued expenses and other current liabilities |
1,078 | ||
| Liabilities of discontinued operations |
$ | 1,109 | |
Net income (loss) per share: Basic net income (loss) per share is computed using the weighted average number of common shares outstanding during the period. Diluted net income (loss) per share is computed using the weighted average number of common shares outstanding plus the number of potentially dilutive shares outstanding during the period. Potentially dilutive shares consist of the incremental common shares issuable upon the exercise of outstanding stock options and warrants using the treasury stock method. Potentially dilutive shares are excluded from the computation of earnings per share if their effect is antidilutive.
59
Table of Contents
INFOSPACE, INC.
NOTES TO CONSOLIDATED FINANCIAL STATEMENTS—(Continued)
Years Ended December 31, 2009, 2008 and 2007
The treasury stock method calculates the dilutive effect for stock options and warrants with an exercise price less than the average stock price during the period presented.
| Years ended December 31, | ||||||
| In thousands |
2009 | 2008 | 2007 | |||
| Weighted average common shares outstanding, basic |
34,983 | 34,415 | 32,640 | |||
| Dilutive stock options and warrants |
448 | — | — | |||
| Weighted average common shares outstanding, diluted |
35,431 | 34,415 | 32,640 | |||
| Antidilutive stock option, restricted stock unit, and warrant equivalents excluded from dilutive share calculation |
1,721 | 930 | 3,034 | |||
| Outstanding stock options and warrants with an exercise price more than the average price during the year not included in dilutive share calculation |
4,888 | 4,865 | 5,283 | |||
Other Comprehensive Income: Comprehensive income includes Net income (loss), plus items that are recorded directly to stockholders’ equity, including foreign currency translation adjustments and the net change in unrealized gains and losses on cash equivalents, short-term and long-term investments. Included in the net change in unrealized gains and losses are realized gains or losses included in the determination of Net income (loss) in the period realized. Amounts reclassified out of Other comprehensive income into Net income (loss) were determined on the basis of specific identification. Components of Accumulated other comprehensive income included on the Consolidated Balance Sheets at December 31, 2009 and 2008 consist of the following (in thousands):
| December 31, | |||||||
| 2009 | 2008 | ||||||
| Unrealized gain on foreign currency translation |
$ | 1,436 | $ | 1,544 | |||
| Unrealized gain (loss) on available-for-sale investments, including tax of $0 and $186 |
(96 | ) | 996 | ||||
| $ | 1,340 | $ | 2,540 | ||||
Foreign currencies: Foreign subsidiary financial statements are denominated in foreign currencies and are translated at the exchange rate on the balance sheet date. Translation adjustments resulting from this process are charged or credited to other comprehensive income. Revenue and expenses are translated at average rates of exchange prevailing during the period. Realized gains and losses on foreign currency transactions are included in Other income, net.
Concentration of credit risk: Financial instruments that potentially subject the Company to concentrations of credit risk consist primarily of cash equivalents, short-term and long-term investments and trade receivables. These instruments are generally unsecured and uninsured. The Company places its cash equivalents and investments with major financial institutions. Accounts receivable are typically unsecured and are derived from revenues earned from customers primarily located in the United States operating in a variety of industries and geographic areas. The Company performs ongoing credit evaluations of its customers and maintains allowances for potential credit losses.
Revenue concentration: The Company derives a significant portion of its revenues from a small number of customers. Revenues from the top two customers of the Company represented 95% or more of total revenues in each of the years ended December 31, 2009, 2008 and 2007, respectively. These customers each accounted for
60
Table of Contents
INFOSPACE, INC.
NOTES TO CONSOLIDATED FINANCIAL STATEMENTS—(Continued)
Years Ended December 31, 2009, 2008 and 2007
more than 10% of total revenues in the years ended December 31, 2009, 2008 and 2007. At December 31, 2009 and 2008, these two customers each accounted for more than 10% of the accounts receivable balance.
As discussed further in “Note 1: The Company and Basis of Presentation,” upon the sale of the mobile business in 2007, the Company determined that it no longer operates separate reporting units. Geographic revenue information, as determined by the location of the customer, is presented below (in thousands):
| Years ended December 31, | |||||||||
| 2009 | 2008 | 2007 | |||||||
| United States |
$ | 204,750 | $ | 152,886 | $ | 136,537 | |||
| International |
2,896 | 3,841 | 4,000 | ||||||
| Total |
$ | 207,646 | $ | 156,727 | $ | 140,537 | |||
Fair value of financial instruments: The Company does not measure the fair value of any financial instrument other than cash equivalents, available-for-sale investments, warrants and its investment in a privately-held company. The carrying values of other financial instruments (accounts receivable, notes and other receivables, and accounts payable) are not recorded at fair value but approximate fair values primarily due to their short-term nature. The carrying values of other current assets and accrued expenses and other current liabilities are also not recorded at fair value but approximate fair values primarily due to their short-term nature.
Derivative instruments: Derivatives within the scope of ASC 815, Derivatives and Hedging, are recorded on the balance sheet at fair value. The Company accounts for such derivatives by recognizing the changes in their fair values as gains or losses on the Company’s Consolidated Statements of Operations and Comprehensive Income (Loss).
Income taxes: The Company accounts for income taxes under the asset and liability method, under which deferred tax assets, including net operating loss carryforwards, and liabilities are determined based on temporary differences between the book and tax basis of assets and liabilities. The Company evaluates the deferred tax assets for future realization and reduces them by a valuation allowance to the extent management of the Company believes that they more likely than not will not be realized. Management considers many factors when assessing the likelihood of future realization of the Company’s deferred tax assets, including recent cumulative earnings experience by taxing jurisdiction, expectations of future taxable income (which includes a consideration of expected future revenue levels, trends in the industry and the current macroeconomic environment), the carryforward periods available for tax reporting purposes, and other relevant factors. Due to the size of the net operating loss carryforwards, their expiration beginning in 2020 and the Company’s recent level of annualized profitability, management has determined the net deferred tax assets were not more likely than not realizable and provided a valuation allowance against its deferred tax assets. At December 31, 2009 and 2008, the Company provided valuation allowances of $319.1 million and $321.7 million, respectively, against its deferred tax assets related to net operating loss carryforwards and other temporary differences. The Company will continue to evaluate the likelihood of the realization of the deferred tax assets. Significant judgment is required in making this assessment, and it is very difficult to predict when, if ever, the Company may conclude that any portion of the deferred tax assets are more likely than not realizable.
Lease accounting: The Company leases office space and computer equipment used in its data centers. All leases are accounted for under the guidance provided by ASC 840, Leases. These leases are classified as either capital leases or operating leases, as appropriate. The amortization of assets under capital leases is included in
61
Table of Contents
INFOSPACE, INC.
NOTES TO CONSOLIDATED FINANCIAL STATEMENTS—(Continued)
Years Ended December 31, 2009, 2008 and 2007
depreciation expense. For the years ended December 31, 2009 and 2008, $535,000 and $341,000 of amortization for assets acquired under capital leases were included in depreciation expense. For the year ended December 31, 2007, the Company did not have any equipment leased under capital leases.
Use of estimates: The preparation of financial statements in conformity with accounting principles generally accepted in the United States of America (“GAAP”) requires management to make estimates and assumptions that affect the reported amounts of assets and liabilities and disclosure of contingent assets and liabilities at the date of the financial statements and the reported amounts of revenues and expenses during the reporting period. Estimates are used for impairment of goodwill and other intangible assets, useful lives of other intangible assets, purchase accounting, valuation of investments and other-than-temporary impairment of investments, revenue recognition, the estimated allowance for sales returns and doubtful accounts, accrued contingencies, stock option valuation, and valuation allowance for deferred tax assets. Actual amounts may differ from estimates.
Recent Accounting Pronouncements: The Company does not expect the adoption of recently issued accounting pronouncements to have a significant impact on its results of operations, financial position or cash flow.
Note 3: Balance Sheet Components
Short-term and long-term investments classified as available-for-sale at December 31, 2009 and 2008 consisted of the following, stated at fair value (in thousands):
| December 31, | ||||||
| 2009 | 2008 | |||||
| U.S. Government securities |
$ | 106,493 | $ | 141,592 | ||
| Corporate notes |
33,550 | — | ||||
| Taxable municipal bonds |
2,604 | — | ||||
| Short-term investments |
142,647 | 141,592 | ||||
| Auction rate securities classified as long-term investments |
— | 13,916 | ||||
| Total investments available-for-sale |
$ | 142,647 | $ | 155,508 | ||
Maturity information was as follows for investments classified as available-for-sale at December 31, 2009 (in thousands):
| Amortized Cost |
Gross Unrealized Gains |
Gross Unrealized Losses |
Fair Value | ||||||||||
| Within one year |
$ | 142,727 | $ | 4 | $ | (84 | ) | $ | 142,647 | ||||
| Greater than one year |
— | — | — | — | |||||||||
| Total |
$ | 142,727 | $ | 4 | $ | (84 | ) | $ | 142,647 | ||||
62
Table of Contents
INFOSPACE, INC.
NOTES TO CONSOLIDATED FINANCIAL STATEMENTS—(Continued)
Years Ended December 31, 2009, 2008 and 2007
At December 31, 2008, there were gross unrealized gains of $1.2 million and no gross unrealized losses.
| December 31, | ||||||||
| 2009 | 2008 | |||||||
| Property and equipment |
(in thousands) | |||||||
| Computer equipment and data center |
$ | 12,310 | $ | 13,917 | ||||
| Purchased software |
4,909 | 7,816 | ||||||
| Internally developed software |
4,873 | 5,632 | ||||||
| Office equipment |
1,613 | 2,212 | ||||||
| Office furniture |
481 | 1,041 | ||||||
| Leasehold improvements and other |
3,134 | 3,091 | ||||||
| 27,320 | 33,709 | |||||||
| Accumulated depreciation |
(15,053 | ) | (16,041 | ) | ||||
| 12,267 | 17,668 | |||||||
| Capital projects in progress |
48 | 410 | ||||||
| $ | 12,315 | $ | 18,078 | |||||
Included in computer equipment and data center was $1.6 million of assets acquired under capital lease. Accumulated depreciation related to assets acquired under capital lease was $877,000 at December 31, 2009.
| December 31, | ||||||
| 2009 | 2008 | |||||
| Accrued expenses and other current liabilities |
(in thousands) | |||||
| Accrued distribution partner obligations |
$ | 22,480 | $ | 11,544 | ||
| Salaries and related expenses |
4,049 | 2,599 | ||||
| Accrued legal and other consulting expenses |
3,667 | 1,360 | ||||
| Customer deposits |
1,623 | 1,537 | ||||
| Accrued rent |
929 | 1,138 | ||||
| Other |
784 | 936 | ||||
| Capital lease obligation |
599 | 593 | ||||
| $ | 34,131 | $ | 19,707 | |||
| December 31, | ||||||
| 2009 | 2008 | |||||
| Long-term liabilities |
(in thousands) | |||||
| Unrecognized tax benefit |
$ | 1,303 | $ | 634 | ||
| Capital lease obligation |
211 | 775 | ||||
| Deferred revenue |
— | 66 | ||||
| $ | 1,514 | $ | 1,475 | |||
63
Table of Contents
INFOSPACE, INC.
NOTES TO CONSOLIDATED FINANCIAL STATEMENTS—(Continued)
Years Ended December 31, 2009, 2008 and 2007
Note 4: Fair Value Measurements
The Company measures its investments using ASC 820, Investments—Debt and Equity Securities. ASC 820 defines fair value, establishes a framework for measuring fair value for the purposes of GAAP, and expands required disclosures about fair value measurements. ASC 820 defines fair value as the price that would be received to sell an asset or paid to transfer a liability in an orderly transaction between market participants at the measurement date. The fair value hierarchy of the Company’s financial assets carried at fair value and measured on a recurring basis is as follows (in thousands):
| Fair value measurements at the reporting date using | ||||||||||||
| December 31, 2009 |
Quoted prices in active markets using identical assets (Level 1) |
Significant other observable inputs (Level 2) |
Significant unobservable inputs (Level 3) | |||||||||
| Cash equivalents |
$ | 75,635 | $ | 75,635 | $ | — | $ | — | ||||
| Available-for-sale securities |
142,647 | 142,647 | — | — | ||||||||
| $ | 218,282 | $ | 218,282 | $ | — | $ | — | |||||
In 2007, the auctions for certain auction rate securities (“ARS”) and a type of ARS also referred to as auction rate preferred securities (“ARPS”) that the Company purchased for $40.4 million began to fail due to insufficient bids from buyers. When the ARS auctions began to fail, the Company initially determined their fair values by using discounted cash flow models. Because those models relied on various observable and unobservable inputs, those ARS and ARPS were classified in the Level 3 input category. The Company incorporated market information into its valuation models when a secondary market began to form.
Changes in the fair values of financial assets measured on a recurring basis by using significant Level 3 inputs in the years ended December 31, 2008 and 2009 are as follows (in thousands):
| Financial assets using significant Level 3 inputs for determining fair value Years ended December 31, 2009 and 2008 |
||||||||||||||||||||||||||||
| ARS | ARPS | Total ARS and ARPS |
Preferred shares |
Equity Investment |
Warrants | Total | ||||||||||||||||||||||
| Balance at January 1, 2008 |
$ | 20,905 | $ | 16,567 | $ | 37,472 | $ | — | $ | 2,000 | $ | 188 | $ | 39,660 | ||||||||||||||
| Other-than-temporary impairment |
(9,689 | ) | (14,643 | ) | (24,332 | ) | — | (2,000 | ) | (188 | ) | (26,520 | ) | |||||||||||||||
| Temporary impairment |
(1,279 | ) | — | (1,279 | ) | — | — | — | (1,279 | ) | ||||||||||||||||||
| Temporary impairment reclassified to other-than-temporary |
1,804 | 251 | 2,055 | — | — | — | 2,055 | |||||||||||||||||||||
| Replacement of ARPS with preferred shares |
— | (365 | ) | (365 | ) | 365 | — | — | — | |||||||||||||||||||
| Balance at December 31, 2008 |
11,741 | 1,810 | 13,551 | 365 | — | — | 13,916 | |||||||||||||||||||||
| Other-than-temporary impairment |
(4,391 | ) | (960 | ) | (5,351 | ) | — | — | — | (5,351 | ) | |||||||||||||||||
| Proceeds from sales of financial assets |
(7,942 | ) | (560 | ) | (8,502 | ) | (700 | ) | — | — | (9,202 | ) | ||||||||||||||||
| Gain (loss) on sales of financial assets |
592 | (290 | ) | 302 | 335 | — | — | 637 | ||||||||||||||||||||
| Balance at December 31, 2009 |
$ | — | $ | — | $ | — | $ | — | $ | — | $ | — | $ | — | ||||||||||||||
64
Table of Contents
INFOSPACE, INC.
NOTES TO CONSOLIDATED FINANCIAL STATEMENTS—(Continued)
Years Ended December 31, 2009, 2008 and 2007
In the year ended December 31, 2009, the Company recorded an other-than-temporary impairment of its available-for-sale investments in Loss on investments, net in the Consolidated Statement of Operations and Comprehensive Income (Loss) of $5.4 million and upon the subsequent sales of those investments, the Company recorded a gain of $637,000 in Loss on Investments, net. In the year ended December 31, 2008, the Company recorded an other-than-temporary impairment of its available-for-sale investments in Loss on investments, net in the Consolidated Statement of Operations and Comprehensive Income (Loss) of $24.3 million, which included $776,000 of impairments previously classified as temporary. The Company recorded ARS and ARPS investment impairments in Loss on investments, net of $2.2 million in the year ended December 31, 2007.
The Company reviews the impairments of its available-for-sale investments in accordance with the provisions of ASC 320, Investments—Debt and Equity Securities, which provides guidance for determining when certain investments are other-than-temporarily impaired. The Company classifies the impairment of any individual available-for-sale investment as either temporary or other-than-temporary. The differentiating factors between temporary and other-than-temporary impairments are primarily the length of the time and the extent to which the fair value has been less than cost, the financial condition and near-term prospects of the issuer and the intent and ability of the Company to retain its investment in the issuer for a period of time sufficient to allow for any anticipated recovery in fair value.
As of December 31, 2007, the Company held warrants to purchase shares in a privately-held company that had a carrying value of $188,000, and an equity investment in the same company that had a carrying value of $2.0 million. The warrants and equity investment are classified in Other long-term assets, in Level 3, because there are significant unobservable inputs associated with them. In the year ended December 31, 2008, the Company recorded a charge of $188,000 related to those warrants and a charge of $2.0 million related to the equity investment in Loss on investments, net in the accompanying Consolidated Statement of Operations and Comprehensive Income (Loss), reducing the carrying value of the warrants and equity investment to zero ($0).
Note 5: Stockholders’ Equity
Stock Incentive Plans
The Company’s stock incentive plans generally provide employees, officers, directors, independent contractors and consultants of the Company an opportunity to purchase shares of stock pursuant to nonqualified stock options (which are options that are not described in Section 422 of the Internal Revenue Code of 1986, as amended). The plans also provide for the sale or granting of stock to eligible individuals in connection with the performance of service for the Company. Finally, the plans authorize the grant of stock appreciation rights, either separately or in tandem with stock options, which entitle holders to cash compensation measured by appreciation in the value of the stock. The stock incentive plans are administered by the Compensation Committee of the Board of Directors, which is composed of non-employee directors. The Company issues new shares upon exercise of options and upon the vesting of restricted stock units (“RSUs”).
1996 Plan: The Company primarily has one stock plan that was used for grants during 2009, 2008 and 2007. On December 5, 2006, the Company’s Restated 1996 Flexible Stock Incentive Program (the “1996 Plan”) was amended to permit grants of RSUs. RSUs granted under the 1996 Plan in 2008 and 2007 typically are scheduled to vest over three years or less, with 33 1/3% vesting one year from the date of grant and the remainder vesting ratably thereafter on a semi-annual basis. If an RSU award is surrendered or for any other reason unused, in whole or in part, the shares that were subject to the award shall continue to be available under the 1996 Plan. Options granted in 2009, 2008 and 2007 under the 1996 Plan vest over a period of up to four years, with either 100%, 50%, 33 1/3%, or 25% vesting one year from the date of grant and the remainder vesting ratably thereafter on a semi-annual basis, and expire seven years from the date of grant. Options granted prior to 2006 under the
65
Table of Contents
INFOSPACE, INC.
NOTES TO CONSOLIDATED FINANCIAL STATEMENTS—(Continued)
Years Ended December 31, 2009, 2008 and 2007
1996 Plan typically vest over four years, with 25% vesting one year from the date of grant and the remainder vesting ratably thereafter on a monthly basis, and expire seven or ten years from the date of grant. The number of shares available for grant pursuant to securities issued under the 1996 Plan increases annually on the first day of January by an amount equal to the lesser of (A) five percent of the Company’s outstanding shares at the end of the Company’s preceding fiscal year, or (B) a lesser amount determined by the Board of Directors. The 1996 Plan limits the number of shares of common stock that may be granted to any one individual pursuant to stock options in any fiscal year of the Company to 800,000 shares, plus an additional 800,000 shares in connection with his or her initial employment with the Company, which initial grant does not count against the limit. If an option is surrendered or for any other reason ceases to be exercisable in whole or in part, the shares which were subject to the option but on that the option has not been exercised shall continue to be available under the 1996 Plan.
2001 Plan: In February 2001, the Company implemented its 2001 Nonstatutory Stock Option Plan (the “2001 Plan”), under which nonqualified stock options to purchase common stock or shares of restricted stock may be granted to employees. Under the 2001 Plan, 2.5 million shares of common stock are authorized for grant of options or issuance of restricted stock. Options granted in 2006 under the 2001 Plan expire seven years from the date of the grant and vest over three years, with 33% vesting one year from the date of grant and the remainder vesting ratably thereafter on a semi-annual basis. Options granted prior to 2006 under the 2001 Plan expire ten years from the date of the grant and vest over two years, with 50% vesting ratably on a monthly basis over the two-year period and the remaining 50% balance vesting at the end of the two-year period.
Plans and awards assumed through acquisition: In addition to the plans described above, the Company has assumed stock incentive plans and awards through acquisitions. The Company assumed the awards outstanding from the stock incentive plan of F-Four, LLC upon the acquisition of its membership interests by the Company on May 22, 2009. The majority of the plans assumed have expired; one plan has options outstanding although the plan has expired. In 2009, the Company assumed awards through an acquisition. Assumed options and RSUs vest over a three-year period, 33 1/3% one year from the date of grant and ratably thereafter on a semi-annual basis and expire seven years from the date of grant. There are no shares available for grant as of December 31, 2009 under any plan assumed through acquisition.
A summary of the general terms of options to purchase common stock and RSUs previously granted under these plans, including options outstanding and available for grant at December 31, 2009, is as follows:
| 1996 Plan | 2001 Plan | Switchboard Plan |
F-Four Awards | |||||
| Requisite service period in years |
4 or less | 3 or less | 4 | 3 | ||||
| Life in years |
7 or 10 | 7 or 10 | 6 | 7 | ||||
| Options and RSUs outstanding at December 31, 2009 |
6,896,459 | 138,765 | 25,000 | 750,000 | ||||
| Options and RSUs available for grant at December 31, 2009 |
2,464,486 | 1,650,503 | — | — |
66
Table of Contents
INFOSPACE, INC.
NOTES TO CONSOLIDATED FINANCIAL STATEMENTS—(Continued)
Years Ended December 31, 2009, 2008 and 2007
Options: Activity and pricing information regarding all options are summarized as follows:
| Options | Weighted average exercise price | |||||
| Outstanding December 31, 2006 |
9,068,818 | $ | 27.75 | |||
| Granted |
100,500 | 23.98 | ||||
| Cancelled |
(2,135,982 | ) | 30.89 | |||
| Exercised |
(608,961 | ) | 16.33 | |||
| Outstanding December 31, 2007 |
6,424,375 | 27.73 | ||||
| Granted |
1,170,000 | 10.36 | ||||
| Cancelled |
(3,404,465 | ) | 32.62 | |||
| Expired |
(9,107 | ) | 18.43 | |||
| Exercised |
(3,365 | ) | 4.67 | |||
| Outstanding December 31, 2008 |
4,177,438 | 19.02 | ||||
| Granted |
3,035,200 | 7.62 | ||||
| Cancelled |
(1,031,738 | ) | 16.77 | |||
| Expired |
(3,851 | ) | 104.92 | |||
| Exercised |
(1,070 | ) | 5.10 | |||
| Outstanding December 31, 2009 |
6,175,979 | $ | 13.74 | |||
| Options exercisable, December 31, 2009 |
3,171,462 | $ | 19.22 | |||
| Options exercisable and expected to vest after December 31, 2009* |
5,341,951 | $ | 14.62 | |||
| * | Options expected to vest reflect an estimated forfeiture rate. |
All grants in 2009, 2008 and 2007 were made at an exercise price equal to the market price at the date of grant. Additional information regarding options outstanding for all plans, excluding the Tandem Plan, as of December 31, 2009, is as follows:
| Options outstanding | Options exercisable | |||||||||||
| Range of exercise prices |
Number outstanding |
Weighted average remaining contractual life (yrs.) |
Weighted average exercise price |
Number exercisable |
Weighted average exercise price | |||||||
| $ 4.70 – 7.99 |
1,331,898 | 6.4 | $ | 7.08 | 8,198 | $ | 6.51 | |||||
| $ 8.00 – 11.99 |
2,599,062 | 5.2 | 8.74 | 1,004,229 | 9.32 | |||||||
| $ 12.00 – 15.99 |
810,596 | 1.4 | 14.33 | 734,361 | 14.55 | |||||||
| $ 16.00 – 19.99 |
3,750 | 1.0 | 18.67 | 3,750 | 18.67 | |||||||
| $ 20.00 – 23.99 |
104,208 | 3.3 | 22.07 | 94,709 | 22.09 | |||||||
| $ 24.00 – 28.99 |
1,036,100 | 2.4 | 24.37 | 1,035,850 | 24.37 | |||||||
| $ 29.00 – 33.99 |
49,500 | 1.9 | 30.96 | 49,500 | 30.96 | |||||||
| $ 34.00 – 585.63 |
240,865 | 1.2 | 49.49 | 240,865 | 49.49 | |||||||
| Total |
6,175,979 | 4.3 | 13.74 | 3,171,462 | 19.22 | |||||||
67
Table of Contents
INFOSPACE, INC.
NOTES TO CONSOLIDATED FINANCIAL STATEMENTS—(Continued)
Years Ended December 31, 2009, 2008 and 2007
Restricted Stock Units: Activity and weighted average grant date fair value information regarding all restricted stock unit grants are summarized as follows:
| Restricted stock |
Weighted average grant date fair value | |||||
| Outstanding December 31, 2006 |
1,355,370 | $ | 20.38 | |||
| Granted |
2,110,965 | 21.43 | ||||
| Forfeited |
(1,057,311 | ) | 20.91 | |||
| Vested |
(1,708,525 | ) | 21.09 | |||
| Outstanding December 31, 2007 |
700,499 | 21.02 | ||||
| Granted |
1,576,172 | 9.75 | ||||
| Forfeited |
(406,282 | ) | 15.37 | |||
| Vested |
(597,884 | ) | 15.02 | |||
| Outstanding December 31, 2008 |
1,272,505 | 11.68 | ||||
| Granted |
1,253,920 | 7.30 | ||||
| Forfeited |
(337,992 | ) | 10.52 | |||
| Vested |
(610,164 | ) | 11.66 | |||
| Outstanding December 31, 2009 |
1,578,269 | $ | 8.46 | |||
| Expected to vest after December 31, 2009* |
1,155,068 | $ | 8.46 | |||
| * | RSUs expected to vest reflect an estimated forfeiture rate. |
Warrants: The Company issued warrants in connection with the Company’s 1998 private placement offerings and agreements to provide white pages directory and classified information services. In May 2007, 1,150,761 shares were issued due to the exercise of warrants. Of these shares, 749,720 shares were issued for an aggregate price of $3.8 million, an average exercise price of $5.05 per share and 401,041 shares were issued pursuant to the net exercise provision of 641,678 warrants. For the years ended December 31, 2009 and 2008, no warrants were exercised and the remaining warrants expired in 2008.
Other Plans:
1998 Employee Stock Purchase Plan: The Company adopted the ESPP in August 1998. The ESPP is intended to qualify under Section 423 of the Code and permits eligible employees of the Company and its subsidiaries to purchase common stock through payroll deductions of up to 15% of their compensation. Under the ESPP, no employee may purchase common stock worth more than $25,000 in any calendar year, valued as of the first day of each offering period. In addition, owners of 5% or more of the Company’s or one of its subsidiary’s common stock may not participate in the ESPP. An aggregate of 1,360,000 shares of common stock are authorized for issuance under the ESPP. The ESPP was implemented with six-month offering periods that begin on each February 1 and August 1. The price of common stock purchased under the ESPP is the lesser of 85% of the fair market value on the first day of an offering period and 85% of the fair market value on the last day of an offering period. The ESPP does not have a fixed expiration date, but may be terminated by the Company’s Board of Directors at any time. There were 60,618, 54,311 and 76,772 shares issued for the ESPP periods that ended in 2009, 2008 and 2007, respectively. During the year ended December 31, 2009, financing cash generated for the purchase of shares through the ESPP amounted to $399,000. The Company issues new shares upon purchase through the ESPP.
68
Table of Contents
INFOSPACE, INC.
NOTES TO CONSOLIDATED FINANCIAL STATEMENTS—(Continued)
Years Ended December 31, 2009, 2008 and 2007
Stock Repurchase Plan: On June 16, 2008, June 8, 2007 and May 30, 2006, the Company’s Board of Directors authorized the Company to repurchase up to $100 million of its common stock in open-market transactions during the succeeding twelve month period. Any repurchased shares would have been retired and resumed the status of authorized but unissued shares of common stock. During 2009, 2008 and 2007, the Company did not repurchase any shares under these plans prior to their expiration.
Dividends:
On May 2, 2007, the Company’s Board of Directors declared a special cash distribution by means of a dividend on the Company’s common stock of $6.30 per share. The special dividend was paid on May 28, 2007 with respect to all shares of common stock outstanding at the close of business on May 18, 2007. On May 18, 2007, there were 33.1 million shares outstanding and, based on those shares, the total amount of the cash distribution was $208.2 million.
On November 14, 2007, the Company’s Board of Directors declared a special cash distribution by means of a dividend on the Company’s common stock of $9.00 per share. The special dividend was paid on January 8, 2008 with respect to all shares of common stock outstanding at the close of business on December 10, 2007. On December 10, 2007, there were 33.3 million shares outstanding. Based on those shares, the total amount of the cash distribution was $299.3 million.
Additionally, on May 2, 2007, the Company’s Board of Directors approved a plan to compensate employees and directors that held in-the-money options to purchase shares of common stock and RSUs for the reduction in value of these awards due to any special cash distribution. The compensation was a combination of $18.9 million in cash and issuance of an additional 368,000 RSUs for employees of continuing operations and the amount was based on, among other factors, the average trading price of the Company’s stock before and after the ex-dividend date and the in-the-money amount for options to purchase shares of common stock. The vesting schedules for RSUs granted under this plan are the same as the existing awards for which they are granted.
Additionally, on November 14, 2007, the Company’s Board of Directors approved a plan to compensate employees and directors that held in-the-money options to purchase shares of common stock and RSUs for the reduction in value of these awards due to any special cash distribution. The compensation was a combination of cash and issuance of additional RSUs and the amount was based on, among other factors, the average trading price of the Company’s stock before and after the ex-dividend date and the in-the-money amount for options to purchase shares of common stock. The vesting schedules for RSUs granted under this plan are the same as the existing awards for which they are granted. The compensation to employees of continuing operations was paid in January 2008, and consisted of $37.4 million in cash payments and 622,000 RSUs.
69
Table of Contents
INFOSPACE, INC.
NOTES TO CONSOLIDATED FINANCIAL STATEMENTS—(Continued)
Years Ended December 31, 2009, 2008 and 2007
Note 6: Stock-based Compensation Expense
For the years ended December 31, 2009, 2008 and 2007, the Company recognized compensation expense related to stock options and RSUs of $10.6 million, $14.3 million, and $34.1 million, respectively. To estimate the compensation cost that was recognized for the years ended December 31, 2009, 2008 and 2007, the Company used the Black-Scholes-Merton option-pricing model with the following weighted-average assumptions for equity awards granted:
| Employee Stock Option Plans | Employee Stock Purchase Plan | |||||||||||
| Years ended December 31, | Years ended December 31, | |||||||||||
| 2009 | 2008 | 2007 | 2009 | 2008 | 2007 | |||||||
| Risk-free interest rate |
0.87% - 2.12% | 2.02% - 2.85% | 4.59% - 5.02% | 0.36% - 1.16% | 2.01% - 3.78% | 5.07% - 5.12% | ||||||
| Expected dividend yield |
0% | 0% | 0% | 0% | 0% | 0% | ||||||
| Volatility |
47% - 56% | 28% - 56% | 48% - 67% | 62% - 63% | 39% - 63% | 41% - 52% | ||||||
| Expected life |
3.2 years | 2.8 years | 2.5 years | 6 months | 6 months | 6 months | ||||||
The risk-free interest rate is based on the implied yield available on U.S. Treasury issues with an equivalent remaining term. The Company paid a special dividend in 2007 and declared another dividend that was paid in January 2008, and may pay special dividends in the future, but does not expect to pay recurring dividends. The expected volatility is based on historical volatility of the Company’s stock for the related expected life of the option. The expected life of the equity award is based on historical experience.
As of December 31, 2009, total unrecognized stock-based compensation cost related to unvested stock options and unvested RSUs was $12.6 million. The balance at December 31, 2009 is expected to be recognized over a weighted average period of approximately 13 months. Total unrecognized stock-based compensation cost related to unvested stock options was $5.4 million, which is expected to be recognized over a weighted average period of approximately 14 months. Total unrecognized stock-based compensation cost related to unvested RSU grants was $7.2 million, which is expected to be recognized over a weighted average period of approximately 11 months.
The Company has included the following amounts for stock-based compensation cost, including the cost related to the ESPP, in the accompanying Consolidated Statements of Operations and Comprehensive Income (Loss) for the years ended December 31, 2009, 2008 and 2007 (amounts in thousands, except per share data):
| Year ended December 31, | |||||||||
| 2009 | 2008 | 2007 | |||||||
| Systems and network operations |
$ | 801 | $ | 1,663 | $ | 1,091 | |||
| Product development |
1,224 | 3,284 | 2,383 | ||||||
| Sales and marketing |
2,036 | 3,551 | 7,948 | ||||||
| General and administrative |
6,507 | 5,806 | 22,636 | ||||||
| Total |
$ | 10,568 | $ | 14,304 | $ | 34,058 | |||
Financing cash flow generated by tax benefits from stock-based award activity in was $607,000 in 2009 and $23.7 million in 2007 and no tax expense was recognized related to stock-based compensation. In 2008, no financing cash flow was generated by tax benefits from stock-based award activity nor was any tax expense recognized related to stock-based compensation. Excluded from the amounts recorded in the above categories of operating expense for the years ended December 31, 2009, 2008 and 2007 are the following amounts included in
70
Table of Contents
INFOSPACE, INC.
NOTES TO CONSOLIDATED FINANCIAL STATEMENTS—(Continued)
Years Ended December 31, 2009, 2008 and 2007
Restructuring, resulting from options held by terminated employees, amounts that were capitalized as part of internally developed software, and amounts that were reclassified as discontinued operations (amounts in thousands):
| Year ended December 31, | |||||||||
| 2009 | 2008 | 2007 | |||||||
| Restructuring |
$ | — | $ | 60 | $ | 670 | |||
| Internally developed software |
270 | 637 | 466 | ||||||
| Discontinued operations—directory business |
— | 52 | 1,630 | ||||||
| Discontinued operations—mobile services business |
— | 89 | 13,459 | ||||||
| Total |
$ | 270 | $ | 838 | $ | 16,225 | |||
Stock-based compensation expense recognized during the years ended December 31, 2009, 2008 and 2007 is based on the grant date fair values estimated using the Black-Scholes-Merton option pricing model. The Company has historically disclosed and currently recognizes stock-based compensation expense over the vesting period for each separately vesting portion of a share-based award as if they were, in substance, a multiple share-based award. The Company estimates forfeitures at the time of grant and revises those estimates, if necessary, in subsequent periods if actual forfeitures differ from those estimates.
The weighted average fair value for options granted in the years ended December 31, 2009, 2008 and 2007 was $2.77, $3.31 and $8.34 per share, respectively. The Company issues new shares upon exercise of options to purchase common stock and vesting of RSUs.
The total intrinsic value of RSUs vested, options exercised and shares purchased pursuant to the ESPP during the years ended December 31, 2009, 2008 and 2007 is supplemental information for the Consolidated Statements of Cash Flows and is presented below (amounts in thousands):
| Year ended December 31, | |||||||||
| 2009 | 2008 | 2007 | |||||||
| RSUs vested |
$ | 3,982 | $ | 4,986 | $ | 17,535 | |||
| Options exercised |
$ | 4 | $ | 19 | $ | 5,230 | |||
| Shares purchased pursuant to ESPP |
$ | 70 | $ | 77 | $ | 313 | |||
Awards outstanding at December 31, 2009 have the following total intrinsic value and weighted average remaining contractual terms:
| Outstanding at December 31, 2009 |
Intrinsic value (in thousands) |
Weighted average remaining contractual term (in years) | |||||
| Options outstanding |
6,175,979 | $ | 2,574 | 4.3 | |||
| Options exercisable and outstanding |
3,171,462 | $ | 65 | 2.2 | |||
| Restricted stock units outstanding |
1,578,269 | $ | 13,526 | 1.1 | |||
Options outstanding at December 31, 2009 and expected to vest in the future, based on the Company’s estimate of its pre-vesting forfeiture rate, have an intrinsic value of $1.9 million and weighted average remaining contractual term of 3.8 years. RSUs expected to vest after December 31, 2009, based on the Company’s estimate of its pre-vesting forfeiture rate, have an intrinsic value of $9.9 million and weighted average remaining contractual term of 1.0 years. Cash generated from the exercise of stock options amounted to $5,000 for the year ended December 31, 2009.
71
Table of Contents
INFOSPACE, INC.
NOTES TO CONSOLIDATED FINANCIAL STATEMENTS—(Continued)
Years Ended December 31, 2009, 2008 and 2007
Note 7: Commitments and Contingencies
The Company has noncancellable operating leases for its corporate facilities. The leases expire through 2013. Rent expense under operating leases totaled $1.1 million, $1.3 million, and $2.7 million for the years ended December 31, 2009, 2008 and 2007, respectively.
The Company’s capital lease commitments and $285,000 of the purchase commitments are included in the Company’s Consolidated Balance Sheets. The Company’s contractual commitments are as follows for the years ending December 31 (in thousands):
| 2010 | 2011 | 2012 | 2013 | 2014 and thereafter |
Total | |||||||||||||
| Operating lease commitments |
$ | 1,890 | $ | 1,653 | $ | 1,592 | $ | 271 | $ | — | $ | 5,406 | ||||||
| Purchase commitments |
1,783 | 1,262 | 1,026 | 493 | — | 4,564 | ||||||||||||
| Capital lease commitments (net of imputed interest and executory costs) |
568 | 210 | — | — | — | 778 | ||||||||||||
| Total |
$ | 4,241 | $ | 3,125 | $ | 2,618 | $ | 764 | $ | — | $ | 10,748 | ||||||
As of December 31, 2009, the Company has pledged $4.7 million as collateral for standby letters of credit and bank guaranties for certain of its property leases, which is included in Other long-term assets.
Litigation
On December 17, 2008, Anne D. Manos filed a shareholder derivative action against current and former officers and directors of the Company, as well as nominal defendant InfoSpace, in the Superior Court of the State of Washington in and for King County (“Court”). Although the Company is a nominal defendant, plaintiff purports to bring the action on behalf of the Company and thus does not seek monetary damages from the Company. Instead, plaintiff seeks to invalidate and recover certain payments made to the defendant officers and directors pursuant to a compensation program established by the Company’s board of directors. Specifically, plaintiff alleges that the defendant officers and directors breached their fiduciary duties by accepting these payments and by approving such compensation program, which was designed to offset the diminution in value to InfoSpace employees’ and board members’ options that occurred as a result of cash distributions to stockholders in May 2007 and January 2008. On February 11, 2009, Ms. Manos filed a First Amended Complaint (“Complaint”), which is substantively identical to her original complaint, adding James N. Mercer as co-plaintiff. On March 20, 2009, the Company moved to dismiss the Complaint based on plaintiffs’ failure to make the requisite pre-filing demand on the Company’s board of directors. The individual defendants also moved to dismiss the Complaint for failure to state a claim for relief. On July 1, 2009, the Court denied the Company’s motion to dismiss. The Court granted in part the individual defendants’ motion and dismissed the non-director officers from the lawsuit after finding that the officers’ acceptance of payments under the compensation program was insufficient to constitute a breach of their fiduciary duties. On July 13, 2009, the directors answered the Complaint, denying all wrongdoing. The Company’s answer to the Complaint is due on February 26, 2010. On June 22, 2009, the Company appointed a Special Litigation Committee to investigate the claims made by the derivative plaintiffs. The case was stayed until February 1, 2010 pending the completion of the Special Litigation Committee’s investigation. No trial date has been set at this time. The Company has entered into indemnification agreements in the ordinary course of business with its officers and directors and may be obligated throughout the pendency of this action to advance payment of legal fees and costs incurred by the defendants pursuant to the Company’s obligations under these indemnification agreements and applicable Delaware law.
72
Table of Contents
INFOSPACE, INC.
NOTES TO CONSOLIDATED FINANCIAL STATEMENTS—(Continued)
Years Ended December 31, 2009, 2008 and 2007
From time to time the Company is subject to various legal proceedings or claims that arise in the ordinary course of business. Although the Company cannot predict the outcome of these matters with certainty, the Company’s management does not believe that the disposition of these ordinary course matters will have a material adverse effect on the Company’s financial position, results of operations or cash flows.
Note 8: Income Taxes
Income tax expense from continuing operations consists of the following for the years ended December 31, 2009, 2008 and 2007 (in thousands):
| Years ended December 31, | ||||||||||||
| 2009 | 2008 | 2007 | ||||||||||
| Current |
||||||||||||
| U.S. federal |
$ | (2,629 | ) | $ | 3,159 | $ | (6,408 | ) | ||||
| State |
5 | 20 | — | |||||||||
| Foreign |
(9 | ) | 86 | 7 | ||||||||
| Total current expense (benefit) |
$ | (2,633 | ) | $ | 3,265 | $ | (6,401 | ) | ||||
| Deferred |
||||||||||||
| U.S. federal |
$ | 2,814 | $ | (2,667 | ) | $ | 19,810 | |||||
| Total deferred expense (benefit) |
2,814 | (2,667 | ) | 19,810 | ||||||||
| Income tax expense, net |
$ | 181 | $ | 598 | $ | 13,409 | ||||||
During 2009, the Company further impaired and sold its portfolio of ARS, which provided a net $6.9 million income tax benefit from the net reduction of its portion of the valuation allowance. Absent the effect of the ARS, the Company’s income tax expense would have been $7.1 million, which would be primarily attributable to $2.7 million from current year operations and an increase of $4.2 million in the current year valuation allowance against the deferred tax assets. The income tax expense from continuing operations differs from the amount computed by applying the statutory federal income tax rate for the years ended December 31, 2009, 2008 and 2007 as follows (in thousands):
| Years ended December 31, | ||||||||||||
| 2009 | 2008 | 2007 | ||||||||||
| Income tax expense (benefit) at federal statutory rate of 35% |
$ | 2,654 | $ | (5,557 | ) | $ | (24,873 | ) | ||||
| Foreign |
(9 | ) | 86 | 7 | ||||||||
| State, net of federal benefit |
3 | 13 | — | |||||||||
| Nondeductible compensation |
11 | 436 | 22,316 | |||||||||
| Increase (decrease) in beginning of year valuation allowance balance |
(2,680 | ) | 5,352 | 16,016 | ||||||||
| Other |
202 | 268 | (57 | ) | ||||||||
| Income tax expense, net |
$ | 181 | $ | 598 | $ | 13,409 | ||||||
The income tax expense from continuing operations reflects a decrease in the valuation allowance during the year ended December 31, 2009 of $2.7 million, while the Consolidated Balance Sheets reflect a decrease in the valuation allowance of $2.5 million. The decrease in the valuation allowance reflected in the income tax
73
Table of Contents
INFOSPACE, INC.
NOTES TO CONSOLIDATED FINANCIAL STATEMENTS—(Continued)
Years Ended December 31, 2009, 2008 and 2007
provision exceeded the decrease in the valuation allowance on the Consolidated Balance Sheets of $159,000. This difference is primarily attributable to the valuation allowance on the two off-setting deferred tax assets. The Company reduced the valuation allowance for the deferred tax assets on the Consolidated Balance Sheets by $1.5 million from settlements of compensation cost, where the compensation cost was in excess of the tax benefit. The Company increased the valuation allowance on the Consolidated Balance Sheets by $1.7 million for the increase in equity-based deferred tax assets.
The tax effect of temporary differences and net operating loss carryforwards from continuing operations that give rise to the Company’s deferred tax assets and liabilities as of December 31, 2009 and 2008 are as follows (in thousands):
| December 31, | ||||||||
| 2009 | 2008 | |||||||
| Deferred tax assets: |
||||||||
| Current |
$ | 2,018 | $ | 11,625 | ||||
| Non-current: |
||||||||
| Net operating loss carryforwards |
293,655 | 289,115 | ||||||
| Tax credit carryforwards |
6,264 | 3,987 | ||||||
| Depreciation and amortization |
9,102 | 9,875 | ||||||
| Other, net |
8,101 | 7,059 | ||||||
| Total non-current |
317,122 | 310,036 | ||||||
| Total gross deferred tax assets |
319,140 | 321,661 | ||||||
| Valuation allowance |
(319,140 | ) | (321,661 | ) | ||||
| Net deferred tax assets |
$ | — | $ | — | ||||
At December 31, 2009 and 2008, the Company provided a valuation allowance against its net deferred tax assets for which significant uncertainty exists regarding the ultimate realization. The Company evaluates its deferred tax assets for future realization and reduces it by a valuation allowance to the extent that realization is not more likely than not. Many factors are considered when assessing the likelihood of future realization of deferred tax assets, including recent cumulative earnings experience by taxing jurisdiction, expectations of future taxable income, the carryforward periods available for tax reporting purposes, trends in the industry and the current macroeconomic environment, and other relevant factors. At December 31, 2009 and 2008, the Company reassessed the realizability of its remaining net deferred tax assets and concluded that, based on available evidence, that realizability was not more likely than not. Accordingly, the Company provided a full valuation allowance on its net deferred tax assets. In the last quarter of 2007, the Company divested a significant portion of its business operations. The net changes in the valuation allowance during the years ended December 31, 2009 and 2008 are shown below (in thousands):
| Valuation allowance | ||||||||
| 2009 | 2008 | |||||||
| Balance at beginning of year |
$ | 321,661 | $ | 324,328 | ||||
| Net changes to deferred tax assets |
(2,521 | ) | (2,667 | ) | ||||
| Balance at end of year |
$ | 319,140 | $ | 321,661 | ||||
| Net change during the year |
$ | (2,521 | ) | $ | (2,667 | ) | ||
74
Table of Contents
INFOSPACE, INC.
NOTES TO CONSOLIDATED FINANCIAL STATEMENTS—(Continued)
Years Ended December 31, 2009, 2008 and 2007
As of December 31, 2009, the Company’s U.S. federal net operating loss carryforward for income tax purposes was $815.0 million, of which $808.3 million relates to tax deductions for stock-based compensation and $6.7 million relates to tax deductions pertaining to the loss realized from the sale of the Company’s ARS investments. When the net operating loss carryforwards related to excess stock-based compensation are recognized, the income tax benefit of those losses is accounted for as a credit to stockholders’ equity on the Consolidated Balance Sheets rather than the Consolidated Statements of Operations and Comprehensive Income (Loss).
If not utilized, the Company’s federal net operating loss carryforwards will expire between 2020 and 2028. Additionally, changes in ownership, as defined by Section 382 of the Internal Revenue Code, may limit the amount of net operating loss carryforwards used in any one year.
A reconciliation of the beginning and ending amounts of unrecognized tax benefits for the years ended December 31, 2009, 2008 and 2007 are as follows (in thousands):
| Unrecognized tax benefits | |||
| Balance at January 1, 2007 and 2008 |
$ | 18,830 | |
| Gross increases for tax positions of prior years |
— | ||
| Gross decreases for tax positions of prior years |
— | ||
| Gross increases for tax positions of current year |
— | ||
| Gross decreases for tax positions of current year |
— | ||
| Settlements |
— | ||
| Lapse of statute of limitations |
— | ||
| Balance at December 31, 2009 |
$ | 18,830 | |
Total amount of unrecognized tax benefits that would affect the Company’s effective tax rate if recognized was $1.3 million and $634,000 as of December 31, 2009 and 2008. The remaining $17.5 million and $18.2 million, if recognized, would create a deferred tax asset subject to a valuation allowance. If the Company released the valuation allowance, the amount would affect the Company’s effective tax rate. The Company believes that its unrecognized tax benefits pertaining to state income taxes over the next twelve months may decrease by $566,000 upon the expiration of the statute of limitations on assessments.
The Company and certain of its subsidiaries file income tax returns in the U.S. federal jurisdiction and various state and foreign jurisdictions. With few exceptions, the Company is no longer subject to U.S. federal, state and local, or non-U.S. income tax examinations by tax authorities for years before 2006, although net operating loss carryforwards and tax credit carryforwards from any year are subject to examination and adjustment for at least three years following the year in which they are fully utilized. As of December 31, 2009, no significant adjustments have been proposed relative to the Company’s tax positions.
The Company recognizes interest and penalties related to uncertain tax positions in interest expense and general and administrative expenses, respectively. As of December 31, 2009 and 2008, the Company had $252,000 and $144,000 of accrued interest related to uncertain tax positions, respectively, which is included in Accrued expenses and other current liabilities in the accompanying Consolidated Balance Sheets.
75
Table of Contents
INFOSPACE, INC.
NOTES TO CONSOLIDATED FINANCIAL STATEMENTS—(Continued)
Years Ended December 31, 2009, 2008 and 2007
Note 9: Restructuring
There were no Restructuring charges for the year ended December 31, 2009. Restructuring charges were $17,000 and $9.6 million for the years ended December 31, 2008 and 2007, respectively.
In 2007, the Company sold its directory and mobile services businesses and, as a result, committed to a plan to make operational changes to its business, which included a reduction in its workforce and, as part of the workforce reduction, consolidation of its facilities. The Company recorded $7.4 million of expense related to that plan in 2007, and $2.2 million of adjustments and additions in 2007 relating to a restructuring plan committed to in 2006, after the Company exited portions of its mobile business.
Restructuring charges for the years ended December 31, 2008 and 2007 consisted of the following (in thousands):
| Years ended December 31, | |||||||
| Type |
2008 | 2007 | |||||
| Employee separation costs |
$ | 52 | $ | 7,963 | |||
| Stock-based compensation |
60 | 670 | |||||
| Losses on contractual commitments |
(88 | ) | 831 | ||||
| Other |
(7 | ) | 126 | ||||
| $ | 17 | $ | 9,590 | ||||
At December 31, 2009, the accrued liability associated with the restructuring related charges was zero ($0) and consisted of the following (in thousands):
| Employee separation |
Contractual commitments |
Facility abandonment |
Total | |||||||||||||
| Reserve balance at December 31, 2007 |
$ | 7,289 | $ | 230 | $ | 109 | $ | 7,628 | ||||||||
| Provision for restructuring |
24 | — | — | 24 | ||||||||||||
| Adjustments |
110 | (86 | ) | (101 | ) | (77 | ) | |||||||||
| Payments in 2008 |
(7,419 | ) | (144 | ) | (8 | ) | (7,571 | ) | ||||||||
| Reserve balance at December 31, 2008 |
4 | — | — | 4 | ||||||||||||
| Adjustments |
(4 | ) | — | — | (4 | ) | ||||||||||
| Reserve balance at December 31, 2009 |
$ | — | $ | — | $ | — | $ | — | ||||||||
The Company does not expect to incur any material restructuring charges in future periods related to initiatives identified to date that have not yet been recognized in the Consolidated Statements of Operations and Comprehensive Income (Loss).
76
Table of Contents
| ITEM 9. | Changes in and Disagreements with Accountants on Accounting and Financial Disclosure |
None.
| ITEM 9A. | Controls and Procedures |
Evaluation of Disclosure Controls and Procedures
Our management evaluated, with the participation of our Chief Executive Officer and our Chief Financial Officer, the effectiveness of our disclosure controls and procedures as of the end of the period covered by this Annual Report on Form 10-K. Based on this evaluation, our Chief Executive Officer and our Chief Financial Officer have concluded that our disclosure controls and procedures are effective to ensure that information we are required to disclose in reports that we file or submit under the Securities Exchange Act of 1934 is accumulated and communicated to our management, including our principal executive and principal financial officers, as appropriate to allow timely decisions regarding required disclosure, and that such information is recorded, processed, summarized and reported within the time periods specified in Securities and Exchange Commission rules and forms.
Management’s Report on Internal Control over Financial Reporting
Our management is responsible for establishing and maintaining adequate internal control over financial reporting, as such term is defined in Exchange Act Rules 13a-15(f). Our internal control over financial reporting is designed to provide reasonable assurance regarding the reliability of financial reporting and the preparation of financial statements for external purposes in accordance with generally accepted accounting principles. Because of its inherent limitations, internal control over financial reporting may not prevent or detect misstatements. Also, projections of any evaluation of effectiveness to future periods are subject to the risk that controls may become inadequate because of changes in conditions, or that the degree of compliance with the policies or procedures may deteriorate.
Under the supervision and with the participation of management, including our Chief Executive Officer and Chief Financial Officer, we conducted an evaluation of the effectiveness of our internal control over financial reporting based on the framework in Internal Control—Integrated Framework issued by the Committee of the Sponsoring Organizations of the Treadway Commission.
Based on our evaluation under the framework in Internal Control—Integrated Framework, our management concluded that our internal control over financial reporting was effective as of December 31, 2009.
Changes in Internal Control over Financial Reporting
There was no change in our internal control over financial reporting that occurred during the fourth quarter of 2009 that has materially affected, or is reasonably likely to materially affect, our internal control over financial reporting.
77
Table of Contents
Report of Independent Registered Public Accounting Firm
To the Board of Directors and Stockholders of
InfoSpace, Inc.
Bellevue, WA
We have audited the internal control over financial reporting of InfoSpace, Inc. and subsidiaries (the “Company”) as of December 31, 2009, based on criteria established in Internal Control—Integrated Framework issued by the Committee of Sponsoring Organizations of the Treadway Commission. The Company’s management is responsible for maintaining effective internal control over financial reporting and for its assessment of the effectiveness of internal control over financial reporting, included in the accompanying Management’s Report on Internal Control over Financial Reporting. Our responsibility is to express an opinion on the Company’s internal control over financial reporting based on our audit.
We conducted our audit in accordance with the standards of the Public Company Accounting Oversight Board (United States). Those standards require that we plan and perform the audit to obtain reasonable assurance about whether effective internal control over financial reporting was maintained in all material respects. Our audit included obtaining an understanding of internal control over financial reporting, assessing the risk that a material weakness exists, testing and evaluating the design and operating effectiveness of internal control based on the assessed risk, and performing such other procedures as we considered necessary in the circumstances. We believe that our audit provides a reasonable basis for our opinion.
A company’s internal control over financial reporting is a process designed by, or under the supervision of, the company’s principal executive and principal financial officers, or persons performing similar functions, and effected by the company’s board of directors, management, and other personnel to provide reasonable assurance regarding the reliability of financial reporting and the preparation of financial statements for external purposes in accordance with generally accepted accounting principles. A company’s internal control over financial reporting includes those policies and procedures that (1) pertain to the maintenance of records that, in reasonable detail, accurately and fairly reflect the transactions and dispositions of the assets of the company; (2) provide reasonable assurance that transactions are recorded as necessary to permit preparation of financial statements in accordance with generally accepted accounting principles, and that receipts and expenditures of the company are being made only in accordance with authorizations of management and directors of the company; and (3) provide reasonable assurance regarding prevention or timely detection of unauthorized acquisition, use, or disposition of the company’s assets that could have a material effect on the financial statements.
Because of the inherent limitations of internal control over financial reporting, including the possibility of collusion or improper management override of controls, material misstatements due to error or fraud may not be prevented or detected on a timely basis. Also, projections of any evaluation of the effectiveness of the internal control over financial reporting to future periods are subject to the risk that the controls may become inadequate because of changes in conditions, or that the degree of compliance with the policies or procedures may deteriorate.
In our opinion, the Company maintained, in all material respects, effective internal control over financial reporting as of December 31, 2009, based on the criteria established in Internal Control—Integrated Framework issued by the Committee of Sponsoring Organizations of the Treadway Commission.
We have also audited, in accordance with the standards of the Public Company Accounting Oversight Board (United States), the consolidated financial statements as of and for the year ended December 31, 2009, of the Company and our report dated February 25, 2010, expressed an unqualified opinion on those financial statements.
/s/ DELOITTE & TOUCHE LLP
Seattle, WA
February 25, 2010
78
Table of Contents
| ITEM 9B. | Other Information |
On February 25, 2010, our Board of Directors approved a new form of indemnification agreement (the “2010 Indemnification Agreement”) to be entered into between the Company and (i) each member of the Board, (ii) each of the Company’s current executive officers, and (iii) any other employees, as the Company’s Board of Directors or Chief Executive Officer deem appropriate from time to time (each such executing individual, an “Indemnitee”).
The 2010 Indemnification Agreement becomes effective for each Indemnitee upon execution and governs the indemnification rights and obligations of the Indemnitee and the Company with respect to Proceedings (as defined in the 2010 Indemnification Agreement) that arose or may arise from an Indemnifying Event (as defined in the 2010 Indemnification Agreement). To the extent that an Indemnitee has previously executed an indemnification agreement with the Company, that previous indemnification agreement will govern the indemnification rights and obligations of the Indemnitee and the Company with respect to Proceedings that arose or may arise from an Indemnifying Event that occurred before the effective date of the 2010 Indemnification Agreement.
Pursuant to the 2010 Indemnification Agreement, the Company is required to, among other things, indemnify the Indemnitee to the fullest extent permitted by Delaware law in the event that the Indemnitee is a party to, witness to, or otherwise involved in any legal matter that relates to the Indemnitee’s status as a director, officer, or employee of the Company. That indemnification obligation includes reimbursing the Indemnitee for any Expenses (as defined in the 2010 Indemnification Agreement) incurred in such matters, payment of losses or settlement amounts, and may include advancement of amounts for Expenses. The indemnification obligation is limited by any determination that the Indemnitee is not entitled to be indemnified under the 2010 Indemnification Agreement, federal law, or Delaware state law, and any advancement is subject to the requirement that the Indemnitee repay the advanced expenses if it is ultimately determined that the Indemnitee was not entitled to be indemnified. The 2010 Indemnification Agreement also limits the period of time in which the Company may bring a legal claim against the Indemnitee to three years from the date of accrual of such claim.
The foregoing description is a summary, does not purport to be a complete description of the 2010 Indemnification Agreement, and is qualified in its entirety by reference to the 2010 Indemnification Agreement, a copy of which is attached hereto as Exhibit 10.18.
79
Table of Contents
PART III
As permitted by the rules of the Securities and Exchange Commission, we have omitted certain information from Part III of this Annual Report on Form 10-K. We intend to file a definitive Proxy Statement with the Securities and Exchange Commission relating to our annual meeting of stockholders not later than 120 days after the end of the fiscal year covered by this Annual Report on Form 10-K, and such information is incorporated by reference herein.
| ITEM 10. | Directors, Executive Officers and Corporate Governance |
Certain information concerning our directors required by this Item is incorporated by reference to our Proxy Statement under the heading “Proposal One—Election of Directors.”
Certain information regarding our executive officers is included in Part I, Item 1 of this report under the caption “Executive Officers and Directors of the Registrant” and is incorporated by reference into this Item.
Other information concerning our officers and directors required by this Item is incorporated by reference to our Proxy Statement under the heading “Additional Information Relating to our Directors and Executive Officers.”
| ITEM 11. | Executive Compensation |
The information required by this Item is incorporated by reference to our Proxy Statement under the heading “Additional Information Relating to Our Directors and Executive Officers.”
| ITEM 12. | Security Ownership of Certain Beneficial Owners and Management and Related Stockholder Matters |
The information required by this Item is incorporated by reference to our Proxy Statement under the headings “Security Ownership of Certain Beneficial Owners and Management” and “Additional Information Relating to Our Directors and Executive Officers—Equity Compensation Plans.”
| ITEM 13. | Certain Relationships and Related Transactions, and Director Independence |
The information required by this Item is incorporated by reference to our Proxy Statement under the headings “Proposal One—Election of Directors” and “Additional Information Relating to Our Directors and Executive Officers.”
| ITEM 14. | Principal Accountant Fees and Services |
The information required by this item is incorporated by reference to our Proxy Statement under the headings “Proposal Two—Ratification of Appointment of Independent Registered Public Accounting Firm—Fees Paid to Independent Registered Public Accounting Firm for 2009 and 2008” and “Audit Committee Report.”
80
Table of Contents
PART IV
| ITEM 15. | Exhibits and Financial Statement Schedules |
(a)
1. Consolidated Financial Statements.
See Index to Consolidated Financial Statements at Item 8 on page 48 of this report.
2. Financial Statement Schedules.
All financial statement schedules required by Item 15(a)(2) have been omitted because they are not applicable or the required information is presented in the Consolidated Financial Statements or Notes thereto.
3. Exhibits.
The exhibits listed in the accompanying index to exhibits are filed or incorporated by reference as part of this report.
(b) Exhibits
See Item 15 (a) above.
(c) Financial Statements and Schedules.
See Item 15 (a) above.
81
Table of Contents
Pursuant to the requirements of Section 13 or 15(d) of the Securities Exchange Act of 1934, as amended, the registrant has duly caused this report to be signed on its behalf by the undersigned, thereunto duly authorized.
| INFOSPACE, INC. | ||
| By: |
/s/ WILLIAM J. LANSING | |
| William J. Lansing Chief Executive Officer and President | ||
| Date: |
February 25, 2010 | |
POWER OF ATTORNEY
KNOW ALL PERSONS BY THESE PRESENTS, that each person whose signature appears below constitutes and appoints David B. Binder and Alesia L. Pinney, jointly and severally, his or her attorneys-in-fact, each with the power of substitution, for him or her in any and all capacities to execute any amendments to this Annual Report on Form 10-K, and to file the same, exhibits thereto and other documents in connection therewith, with the Securities and Exchange Commission, hereby ratifying and confirming all that each of said attorneys-in-fact, or his substitute or substitutes, may lawfully do or cause to be done by virtue hereof.
Pursuant to the requirements of the Securities Exchange Act of 1934, this report has been signed below by the following persons on behalf of the registrant and in the capacities indicated and on the dates indicated.
| Signature |
Title |
Date | ||
| /s/ WILLIAM J. LANSING William J. Lansing |
Chief Executive Officer, President and Director (Principal Executive Officer) |
February 25, 2010 | ||
| /s/ DAVID B. BINDER David B. Binder |
Chief Financial Officer and Treasurer (Principal Financial Officer) |
February 25, 2010 | ||
| /s/ ERIC M. EMANS Eric M. Emans |
Chief Accounting Officer (Principal Accounting Officer) |
February 25, 2010 | ||
| /s/ JAMES F. VOELKER James F. Voelker |
Chairman |
February 25, 2010 | ||
| /s/ JOHN E. CUNNINGHAM, IV John E. Cunningham, IV |
Director |
February 25, 2010 | ||
| /s/ JULES HAIMOVITZ Jules Haimovitz |
Director |
February 25, 2010 | ||
| /s/ RICHARD D. HEARNEY Richard D. Hearney |
Director |
February 25, 2010 | ||
| /s/ ELIZABETH I. HUEBNER Elizabeth I. Huebner |
Director |
February 25, 2010 | ||
| /s/ BRADEN R. KELLY Braden R. Kelly |
Director |
February 25, 2010 | ||
| /s/ WILLIAM J. RUCKELSHAUS William J. Ruckelshaus |
Director |
February 25, 2010 | ||
| /s/ LEWIS M. TAFFER Lewis M. Taffer |
Director |
February 25, 2010 | ||
82
Table of Contents
INDEX TO EXHIBITS
| Exhibit |
Exhibit Description |
Form |
Date of First Filing | Exhibit Number |
Filed Herewith | |||||
| 3.1 | Amended and Restated Certificate of Incorporation | 10-K | March 27, 2003 | 3.1 | ||||||
| 3.2 | Certificate of Amendment to Amended and Restated Certificate of Incorporation | 8-K | June 5, 2009 | 3.1 | ||||||
| 3.3 | Restated Bylaws, as amended | 8-K | November 20, 2007 |
3.2 | ||||||
| 4.1 | Form of Certificate of the Powers, Designations, Preferences and Rights of Series A Preferred Stock | S-1 (No. 333-86313), as amended | September 1, 1999 | 4.1 | ||||||
| 4.2 | Certificate of the Powers, Designations, Preferences and Rights of Series B Preferred Stock | S-1 (No. 333-58048), as amended | March 30, 2001 | 4.2 | ||||||
| 4.3 | Preferred Stock Rights Agreement, dated as of July 19, 2002, between the Company and Mellon Investor Services LLC, including the Form of Certificate of the Powers, Designations, Preferences and Rights of Series C Participating Preferred Stock, the form of Rights Certificate and the Summary of Rights attached thereto as Exhibits A, B, and C, respectively | 8-K | July 24, 2002 | 4.4 | ||||||
| 10.1* | 1998 Employee Stock Purchase Plan | S-1 (No. 333-62323), as amended | August 27, 1998 | 10.3 | ||||||
| 10.2* | InfoSpace, Inc. Restated 1996 Flexible Stock Incentive Plan | 8-K | December 11, 2006 | 10.1 | ||||||
| 10.3* | Form of Restated 1996 Flexible Stock Incentive Plan Nonqualified Stock Option Letter Agreement | 10-K | February 23, 2006 | 10.20 | ||||||
| 10.4* | Terms of Stock Option Grant program for Nonemployee Directors under the Restated 1996 Flexible Stock Incentive Plan | 10-K | March 3, 2005 | 10.24 | ||||||
| 10.5* | Form of Restated 1996 Flexible Stock Incentive Plan Notice of Grant of Restricted Stock Units and Restricted Stock Unit Agreement | 8-K | December 11, 2006 | 10.2 | ||||||
| 10.6* | Form of Restated 1996 Flexible Stock Incentive Plan Notice of Grant of Restricted Stock Units and Restricted Stock Unit Agreement for US-Based Vice President or Above | 10-Q | August 9, 2007 | 10.35 | ||||||
83
Table of Contents
| Exhibit |
Exhibit Description |
Form |
Date of First Filing | Exhibit Number |
Filed Herewith | |||||
| 10.7* | InfoSpace, Inc. Amended and Restated 2001 Nonstatutory Stock Option Plan | 10-Q | August 9, 2007 | 10.6 | ||||||
| 10.8* | Form of Amended and Restated 2001 Nonstatutory Stock Option Plan Notice of Grant of Restricted Stock Units and Restricted Stock Unit Agreement | 10-Q | August 9, 2007 | 10.33 | ||||||
| 10.9* | InfoSpace, Inc. Switchboard Incorporated Stock Incentive Plan | S-8 (333-116641) | June 18, 2004 | 4.1 | ||||||
| 10.10* | Form of InfoSpace, Inc. Restricted Stock Unit Award Tax Withholding Election Form | 10-Q | August 9, 2007 | 10.34 | ||||||
| 10.11* | Description of Acceleration of Vesting of Certain Unvested and “Out-of-the-Money” Stock Options | 8-K | December 20, 2005 | Item 1.01 |
||||||
| 10.12 | Office Lease Agreement, dated March 10, 2000, between InfoSpace, Inc. and Three Bellevue Center, LLC for office space located at 601 108th Avenue N.E., Bellevue, Washington | 10-K | March 30, 2000 | 10.17 | ||||||
| 10.13 | Sixth Amendment to Office Lease Agreement dated September 26, 2005, between InfoSpace, Inc. and Three Bellevue Center LLC | 8-K | September 29, 2005 |
10.28 | ||||||
| 10.14 | Ninth Amendment to Office Lease Agreement effective as of December 21, 2007, between InfoSpace, Inc. and WA—Three Bellevue Center, LLC | 8-K | January 4, 2008 | 10.1 | ||||||
| 10.15 | Eleventh Amendment to Office Lease Agreement, effective as of April 23, 2009, between InfoSpace, Inc. and WA—Three Bellevue Center, LLC | X | ||||||||
| 10.16 | Asset Purchase Agreement between Idearc Inc. and InfoSpace, Inc., dated as of September 15, 2007 | 8-K | September 19, 2007 |
2.1 | ||||||
| 10.17 | Asset Purchase Agreement between InfoSpace, Inc. and Motricity, Inc., dated as of October 15, 2007 | 8-K | October 18, 2007 | 2.1 | ||||||
| 10.18 | Form of Indemnification Agreement between the registrant and each of its directors and executive officers | X | ||||||||
| 10.19* | 2009 InfoSpace Executive Bonus Plan | 8-K | May 15, 2009 | 10.1 | ||||||
84
Table of Contents
| Exhibit |
Exhibit Description |
Form |
Date of First Filing | Exhibit Number |
Filed Herewith | |||||
| 10.20* | Employment Agreement effective as of October 7, 2008 between InfoSpace, Inc. and Michael J. Glover | 10-Q | November 10, 2008 |
10.1 | ||||||
| 10.21* | Employment Agreement, amended and restated effective as of October 28, 2008, between InfoSpace, Inc. and David B. Binder | 10-Q | November 10, 2008 |
10.3 | ||||||
| 10.22* | Employment Agreement, amended and restated effective as of October 28, 2008, between InfoSpace, Inc. and Eric M. Emans | 10-Q | November 10, 2008 |
10.4 | ||||||
| 10.23* | Amended and Restated Employment Agreement, amended and restated as of November 4, 2008, between InfoSpace, Inc. and James F. Voelker | 10-Q | November 10, 2008 |
10.8 | ||||||
| 10.24* | Employment Agreement effective as of February 2, 2009 between InfoSpace, Inc. and William J. Lansing | 8-K | February 5, 2009 | 10.1 | ||||||
| 10.25* | Employment Agreement, effective as of July 20, 2009 between InfoSpace, Inc. and Alesia L. Pinney | 10-Q | August 6, 2009 | 10.2 | ||||||
| 10.26* | Employment Agreement, effective as of May 22, 2009 between InfoSpace, Inc. and Leo S. Chang | X | ||||||||
| 10.27* | Employment Agreement, effective as of May 22, 2009 between InfoSpace, Inc. and John J. Rodkin | X | ||||||||
| 10.28† | Google Services Agreement and Order Form by and between Google Inc. and InfoSpace Sales LLC dated October 1, 2005 | 10-K | March 2, 2009 | 10.36 | ||||||
| 10.29† | Amended and Restated Google Services Agreement by and between Google Inc. and InfoSpace Sales LLC dated October 1, 2005 | 10-K | March 2, 2009 | 10.37 | ||||||
| 10.30† | Amendment Number One to Amended and Restated Google Inc. Services Agreement and Order Form dated November 6, 2006 by and between Google Inc. and InfoSpace Sales LLC | 10-K | March 2, 2009 | 10.38 | ||||||
| 10.31† | Amendment Number Two to Amended and Restated Google Inc. Services Agreement and Order Form dated February 1, 2008 by and between Google Inc. and InfoSpace Sales LLC | 10-K | March 2, 2009 | 10.39 | ||||||
85
Table of Contents
| Exhibit |
Exhibit Description |
Form |
Date of First Filing | Exhibit Number |
Filed Herewith | |||||
| 10.32† | Amendment Number Four to Amended and Restated Google Inc. Services Agreement and Order Form dated December 1, 2008 by and between Google Inc. and InfoSpace Sales LLC | 10-K | March 2, 2009 | 10.40 | ||||||
| 10.33† | Yahoo! Search Marketing—Yahoo! Publisher Network Service Order #1-9935871, dated November 26, 2007, by and among Overture Services, Inc., Overture Search Services (Ireland) Limited, InfoSpace Sales LLC, InfoSpace Europe Limited and InfoSpace, Inc. (as guarantor) | 10-K | March 2, 2009 | 10.41 | ||||||
| 10.34† | Amendment #1 to Yahoo! Search Marketing—Yahoo! Publisher Network Service Order #1-9935871, dated January 31, 2008, by and among Overture Services, Inc., Overture Search Services (Ireland) Limited, InfoSpace Sales LLC, InfoSpace Europe Limited and InfoSpace, Inc. (as guarantor) | 10-K | March 2, 2009 | 10.42 | ||||||
| 10.36† | Amendment #2 to Yahoo! Search Marketing—Yahoo! Publisher Network Service Order #1-9935871, dated November 1, 2008 by and among Yahoo! Inc. (as successor-in-interest to Overture Services, Inc.), Overture Search Services (Ireland) Limited, InfoSpace Sales LLC, InfoSpace Europe Limited and InfoSpace, Inc. (as guarantor) | 10-K | March 2, 2009 | 10.43 | ||||||
| 21.1 | Subsidiaries of the registrant | X | ||||||||
| 23.1 | Consent of Deloitte & Touche LLP, Independent Registered Public Accounting Firm | X | ||||||||
| 24.1 | Power of Attorney (contained on the signature page hereto) | X | ||||||||
| 31.1 | Certification of Principal Executive Officer pursuant to Section 302 of the Sarbanes-Oxley Act of 2002 | X | ||||||||
| 31.2 | Certification of Principal Financial Officer pursuant to Section 302 of the Sarbanes-Oxley Act of 2002 | X | ||||||||
| 32.1 | Certification of Principal Executive Officer pursuant to Section 906 of the Sarbanes-Oxley Act of 2002 | X | ||||||||
86
Table of Contents
| Exhibit |
Exhibit Description |
Form |
Date of First Filing | Exhibit Number |
Filed Herewith | |||||
| 32.2 | Certification of Principal Financial Officer pursuant to Section 906 of the Sarbanes-Oxley Act of 2002 | X |
| * | Indicates a management contract or compensatory plan or arrangement. |
| † | Confidential treatment has been requested for portions of this exhibit. These portions have been omitted from the Annual Report on Form 10-K and submitted separately to the Securities and Exchange Commission. |
87