Attached files
| file | filename |
|---|---|
| EX-99.1 - PRESS RELEASE - HMS HOLDINGS CORP | exh_991.htm |
| 8-K - FORM 8-K - HMS HOLDINGS CORP | f8k_080417.htm |
EXHIBIT 99.2

August 4, 2017 Q2 2017 Investor Presentation
Disclaimers FORWARD - LOOKING STATEMENTS . The financial results in this presentation reflect preliminary results, which are not final until our Form 10 - Q for the quarter ended June 30 , 2017 is filed with the Securities and Exchange Commission . This presentation contains "forward - looking statements" within the meaning of the U . S . Private Securities Litigation Reform Act of 1995 . Such statements reflect our current expectations, projections and assumptions about our business, the economy and future events or conditions . They do not relate strictly to historical or current facts . Forward - looking statements can be identified by words such as “aims,” “anticipates,” “believes,” “estimates,” “expects,” “forecasts,” “intends,” “likely,” “may,” “plans,” “projects,” “seeks,” “targets,” “will,” “would,” “could,” “should,” and similar expressions and references to guidance, although some forward - looking statements may be expressed differently . In particular, these include statements relating to future actions, business plans, objectives and prospects, future operating or financial performance . Factors or events that could cause actual results to differ may emerge from time to time and are difficult to predict . Should known or unknown risks or uncertainties materialize, or should underlying assumptions prove inaccurate, actual results may differ materially from past results and those anticipated, estimated or projected . We caution you not to place undue reliance upon any of these forward - looking statements . Factors that could cause or contribute to such differences, include, but are not limited to : our ability to execute our business plans or growth strategy ; our ability to innovate, develop or implement new or enhanced solutions or services ; the nature of investment and acquisition opportunities we are pursuing, and the successful execution of such investments and acquisitions ; our ability to successfully integrate acquired businesses and realize synergies ; variations in our results of operations ; our ability to accurately forecast the revenue under our contracts and solutions ; our ability to protect our systems from damage, interruption or breach, and to maintain effective information and technology systems and networks ; our ability to protect our intellectual property rights, proprietary technology, information processes, and know - how ; significant competition for our solutions and services ; our failure to maintain a high level of customer retention or the unexpected reduction in scope or termination of key contracts with major customers ; customer dissatisfaction, our non - compliance with contractual provisions or regulatory requirements ; our failure to meet performance standards triggering significant costs or liabilities under our contracts ; our inability to manage our relationships with information and data sources and suppliers ; reliance on subcontractors and other third party providers and parties to perform services ; our ability to continue to secure contracts and favorable contract terms through the competitive bidding process and to prevail in protests or challenges to contract awards ; pending or threatened litigation ; unfavorable outcomes in legal proceedings ; our success in attracting qualified employees and members of our management team ; our ability to generate sufficient cash to cover our interest and principal payments under our credit facility or to borrow, obtain financing, maintain liquidity or use credit ; unexpected changes in our effective tax rates ; unanticipated increases in the number or amount of claims for which we are self - insured ; our ability to successfully remediate material weaknesses in our internal control over financial reporting ; changes in the U . S . healthcare environment or healthcare financing system, including regulatory, budgetary or political actions that affect procurement practices and healthcare spending ; our failure to comply with applicable laws and regulations governing individual privacy and information security or to protect such information from theft and misuse ; negative results of government or customer reviews, audits or investigations ; state or federal limitations related to outsourcing or certain government programs or functions ; restrictions on bidding or performing certain work due to perceived conflicts of interests ; the market price of our common stock and lack of dividend payments ; anti - takeover provisions in our corporate governance documents ; and other factors, risks and uncertainties described in our most recent Annual Report on Form 10 - K and in our other filings with the Securities and Exchange Commission . Any forward - looking statements are made as of the date of this presentation . Except as may be required by law, we disclaim any obligation to publicly update forward - looking statements, whether as a result of new information, future events or otherwise . NON - GAAP FINANCIAL INFORMATION . This presentation contains certain non - GAAP measures . These non - GAAP measures, as calculated by the Company, are not necessarily comparable to similarly titled measures reported by other companies . Additionally, these non - GAAP measures are not measurements of financial performance or liquidity under GAAP and should not be considered alternatives to the Company's other financial information determined under GAAP . See slide 7 for definitions and reconciliations of certain non - GAAP measures . MARKET AND INDUSTRY DATA . This presentation contains market and industry data and forecasts that have been obtained from publicly available information, various industry publications, other published industry sources and our internal data and estimates . We have not independently verified the information and cannot make any representation as to the accuracy or completeness of such information . None of the reports and other materials of third party sources referred to in this presentation were prepared for use in, or in connection with, this presentation . Our internal data and estimates are based upon information obtained from our customers, our partners, trade and business organizations, publicly available information and other contacts in the markets in which we operate and our management’s understanding of industry conditions . Estimates are difficult to develop and inherently uncertain and we cannot assure you that they are accurate . Our estimates involve risks and uncertainties and are subject to change based on various factors, including those discussed above . HMSY Q2 2017 Investor Presentation / August 4, 2017

Presentation Outline HMSY Q2 2017 Investor Presentation / August 4, 2017 Q2 2017 Financials Results ▪ Financial Performance Highlights ▪ Quarterly Financial Information ▪ Quarterly Market and Product Revenue 1 - 3 Commercial Business ▪ 2015 - 2017 Quarterly Revenue ▪ Q2 Commercial Sales 4 - 5 State Government Business ▪ Medicaid Enrollment Growth 6 Reconciliation of Net Income to GAAP EPS (Diluted) / Adjusted EPS (Diluted) 7

HMSY Q2 2017 Investor Presentation / August 4, 2017 / 1 Financial Performance Highlights ▪ GAAP EPS of $0.08 per diluted share ▪ Q2 revenue was $133.3 million - an increase of $11.8 million or 9.7% year - over - year 1 ▪ Record Q2 commercial revenue of $69.4 million increased 29.7% year - over - year ▪ Q2 state government revenue of $57.9 million increased 0.5% year - over - year 2 ▪ Q2 COB revenue of $98.5 million increased 9.8% year - over - year ▪ Q2 analytical services revenue of $34.8 million increased 9.4% year - over - year 3 ▪ Adjusted EPS of $0.16 per diluted share 4 ▪ Q2 capital expenditure was ~$7.0 million compared to $3.1 million in the prior year quarter ▪ Q2 total operating expenses of $119.0 million – an increase of $13.8 million compared to the prior year quarter, due primarily to the Eliza acquisition 5 Q2 2017 Financial Results 1 Medicare RAC revenue was ($0.7) million in Q2’17 compared to $3.8 million in Q2’16 2 State government revenue in Q2’16 included a one - time acceleration of approximately $5.5 million of subrogation related revenue 3 Analytical services include payment integrity, Medicare RAC, health management and member engagement solutions. There was no health management and member engagement revenue in Q2’16 4 Adjusted EPS per diluted share is a non - GAAP measure (see reconciliation on slide 7) 5 Q2’17 total operating expenses include ~$3.5 million in professional fees related to the Eliza acquisition and ~$9 million in compensation and other normal operating expenses for Eliza

HMSY Q2 2017 Investor Presentation / August 4, 2017 / 2 Q2 2017 Financial Results Quarterly Financial Information (Unaudited, $ in thousands, except per share amounts) 1 As revised. Refer to “Part II, Item 8. Consolidated Financial Statements and Supplementary Data, Notes to the Consolidated Financial Statements” footnote 15 “Quarterly Financial Data (Unaudited)” on page 124 in the Company’s 2016 Form 10 - K (see https://www.sec.gov/Archives/edgar/data/1196501/000117184317003514/0001171843 - 17 - 003514 - index.htm ) 2 Diluted adjusted EPS is a non - GAAP measure (see reconciliation on slide 7) Note : Certain amounts in the prior periods have been adjusted to reflect the retrospective application required by the early adoption of AS U N o. 2016 - 09, Compensation – Stock Compensation (Topic 718): Improvements to Employee Share - Based Payment Accountin g, (“ASU 2016 - 09”) related to the recognition of excess tax benefits in the provision for income taxes Revenue $ 121,512 $ 122,860 $ 125,590 $ 113,733 $ 133,313 Cost of services: Compensation 47,343 48,298 47,229 48,920 51,852 Data processing 9,104 9,541 9,068 9,783 11,281 Occupancy 3,631 3,388 3,354 3,547 4,230 Direct project costs 11,473 10,997 9,301 10,443 10,101 Other operating costs 6,407 8,465 7,130 7,202 6,563 Amortization of acquisition related software and intangible assets 7,013 6,390 7,614 6,286 7,372 Total cost of services 84,971 87,079 83,696 86,181 91,399 Selling, general & administrative expenses 20,189 23,131 23,136 23,609 27,552 Total operating expenses 105,160 110,210 106,832 109,790 118,951 Operating income 16,352 12,650 18,758 3,943 14,362 Interest expense (2,100) (2,121) (2,207) (2,286) (2,339) Interest income 60 105 109 155 32 Income before income taxes 14,312 10,634 16,660 1,812 12,055 Income taxes 4,443 (3,412) 7,509 370 5,538 Net income $ 9,869 $ 14,046 $ 9,151 $ 1,442 $ 6,517 Net income per diluted share $ 0.12 $ 0.17 $ 0.11 $ 0.02 $ 0.08 Weighted average common shares, diluted 84,528 84,853 85,822 85,580 85,826 Diluted adjusted EPS 2 $ 0.20 $ 0.24 $ 0.18 $ 0.13 $ 0.16 Q2'17Q2'16 Q3'16 Q4'16 Q1'17 1 1 1 1
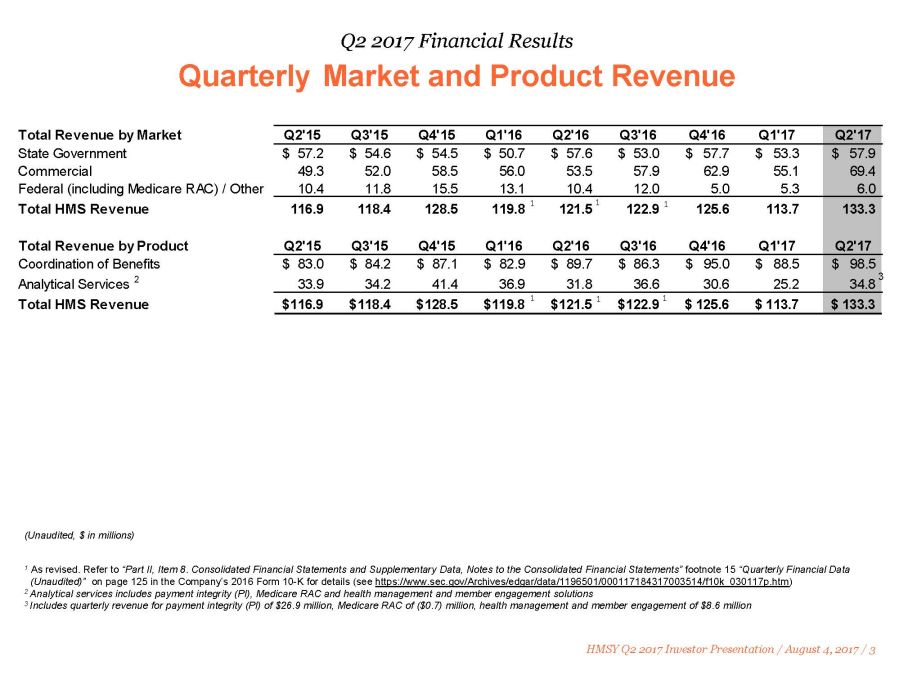
HMSY Q2 2017 Investor Presentation / August 4, 2017 / 3 Q2 2017 Financial Results Quarterly Market and Product Revenue (Unaudited, $ in millions) 1 As revised. Refer to “Part II, Item 8. Consolidated Financial Statements and Supplementary Data, Notes to the Consolidated Financial Statements” footnote 15 “Quarterly Financial Data (Unaudited)” on page 124 in the Company’s 2016 Form 10 - K for details (see https://www.sec.gov/Archives/edgar/data/1196501/000117184317003514/0001171843 - 17 - 003514 - index.htm ) 2 Analytical services includes payment integrity (PI), Medicare RAC and health management and member engagement solutions 3 Includes quarterly revenue for payment integrity (PI ) of $26.9 million, Medicare RAC of ($0.7) million, health management and member engagement of $8.6 million Total Revenue by Market Q2'15 Q3'15 Q4'15 Q1'16 Q2'16 Q3'16 Q4'16 Q1'17 Q2'17 State Government 57.2$ 54.6$ 54.5$ 50.7$ 57.6$ 53.0$ 57.7$ 53.3$ 57.9$ Commercial 49.3 52.0 58.5 56.0 53.5 57.9 62.9 55.1 69.4 Federal (including Medicare RAC) / Other 10.4 11.8 15.5 13.1 10.4 12.0 5.0 5.3 6.0 Total HMS Revenue 116.9 118.4 128.5 119.8 121.5 122.9 125.6 113.7 133.3 Total Revenue by Product Q2'15 Q3'15 Q4'15 Q1'16 Q2'16 Q3'16 Q4'16 Q1'17 Q2'17 Coordination of Benefits 83.0$ 84.2$ 87.1$ 82.9$ 89.7$ 86.3$ 95.0$ 88.5$ 98.5$ Analytical Services 2 33.9 34.2 41.4 36.9 31.8 36.6 30.6 25.2 34.8 Total HMS Revenue 116.9$ 118.4$ 128.5$ 119.8$ 121.5$ 122.9$ 125.6$ 113.7$ 133.3$ 1 1 1 1 1 1 3

HMSY Q2 2017 Investor Presentation / August 4, 2017 / 4 Quarterly Commercial Revenue 2015 - 2017 (Unaudited, $ in thousands) 1 Amounts reflect revised numbers. Refer to “Part II, Item 8. Consolidated Financial Statements and Supplementary Data, Notes to the Consolidated Financial Statements” footnote 15 “Quarterly Financial Data (Unaudited)” on page 124 in the Company’s 2016 Form 10 - K for details ( see https://www.sec.gov/Archives/edgar/data/1196501/000117184317003514/0001171843 - 17 - 003514 - index.htm ) Commercial Business 1 1 1

HMSY Q2 2017 Investor Presentation / August 4, 2017 / 5 ▪ New business: products sold to new commercial members covering ~0.2 million lives added during Q2’17 1 ▪ Additional business: products sold to current commercial customers covering approximately ~14.0 million lives in Q2’17 2 Q2 2017 Commercial Sales 1 New business includes sales to either a totally new customer or a new category of members (e.g. Medicare, Medicaid or ASO) for an existing customer 2 Additional business reflects new product sales to a customer population already covered by other HMS products. In some instances both COB and analytical service solutions were sold to the same customer life in the quarter, but such sales are only counted once for purposes of this calculation 3 Relative percentage of COB and analytical services solutions based on projected revenue for the first twelve months Note: Data as of June 30, 2017 3 3 Commercial Business

State Government Business New Medicaid Enrollment Through May 2017 1 1 CMS Medicaid & CHIP: May 2017 Monthly Applications, Eligibility Determinations and Enrollment Report, July 26, 2017. This analysis compares additional Medicaid enrollment of ~16.7 million lives reported through 5/31/17 to enrollment as of 10/1/13, which was the beginning of Marketplace open enrollment and the CMS baseline for measuring expansion ~14.8M of ~16.7M new CMS - reported 1 Medicaid lives are in HMS customer eligibility files 250,000 or more (23) 100,000 – 249,000 (7) 30,000 – 99,999 (9+DC) 1 – 29,999 (7) No growth (2) No data reported (2) CA NV OR WA ID MT ND SD NE KS OK TX HI AK AZ UT WY CO NM MO IA MN WI MI AR LA MS AL GA FL SC TN NC KY IL IN OH PA NY WV VA ME MD DE NJ CT RI MA VT NH DC HMSY Q2 2017 Investor Presentation / August 4, 2017 / 6

HMSY Q2 2017 Investor Presentation / August 4, 2017 / 7 Reconciliation of Net Income to GAAP EPS (Diluted)/ Adjusted EPS (Diluted) The Company believes that the non - GAAP financial measure above provides useful information to the Company's management, investors and other interested parties about the Company's operating performance because it allows them to compare the Company's operating results during the current periods to prior periods in a more consistent manner . The non - GAAP measure presented in this slide may not be comparable to similarly titled measures used by other companies (Unaudited, $ in thousands, except per share data) As summarized in the following table, diluted earnings per share adjusted for stock - based compensation expense, non - recurring legal fees, amortization of acquisition related software and intangible assets and related taxes (adjusted EPS) was $ 0 . 16 for the second quarter of 2017 1 Tax effect of adjustments is computed as the pre - tax effect of the adjustments multiplied by the adjusted effective tax rate 2 The Company incurred approximately $ 3 . 5 million of transaction expenses related to its acquisition of Eliza Corporation, which closed in the quarter, but those expenses were not discrete adjustments used in the calculation of adjusted EPS 2 Net income $ 9,869 $ 14,046 $ 9,151 $ 1,442 $ 6,517 Stock-based compensation 4,405 2,102 2,530 5,386 3,994 Non-recurring legal fees 315 - - - - Amortization of acquisition related software and intangible assets 7,013 7,015 6,989 6,286 7,372 (4,693) (2,644) (3,236) (2,323) (4,319) Sub-total 16,909 20,519 15,434 10,791 13,564 Weighted average common shares, diluted 84,528 84,853 85,822 85,580 85,826 Diluted GAAP EPS $ 0.12 $ 0.17 $ 0.11 $ 0.02 $ 0.08 Diluted Adjusted EPS $ 0.20 $ 0.24 $ 0.18 $ 0.13 $ 0.16 Q1'17 Q2'17 Income tax related adjustments 1 Q2'16 Q3'16 Q4'16 Note : Certain amounts in the prior periods have been adjusted to reflect the retrospective application required by the early adoption of ASU 2016 - 09 related to the recognition of excess tax benefits in the provision for income taxes and the cash flow presentation of share - based compensation .

Enterprising healthcare

