Attached files
| file | filename |
|---|---|
| EX-99.1 - PRESS RELEASE - Simulations Plus, Inc. | simulations_8k-ex9901.htm |
| 8-K - CURRENT REPORT - Simulations Plus, Inc. | simulations_8k-071017.htm |
Exhibit 99.2
(NASDAQ:SLP) Investor Conference Call July 10, 2017

2 With the exception of historical information, the matters discussed in this presentation are forward - looking statements that involve a number of risks and uncertainties . The actual results of the Company could differ significantly from those statements . Factors that could cause or contribute to such differences include, but are not limited to : continuing demand for the Company’s products, competitive factors, the Company’s ability to finance future growth, the Company’s ability to produce and market new products in a timely fashion, the Company’s ability to continue to attract and retain skilled personnel, and the Company’s ability to sustain or improve current levels of productivity . Further information on the Company’s risk factors is contained in the Company’s quarterly and annual reports and filed with the Securities and Exchange Commission . Safe Harbor Statement

3 Highlights Walter S. Woltosz CEO and Chairman

4 • Major provider of software and consulting solutions for R&D • Earliest drug discovery – when a chemist first draws a molecule • Preclinical development (lab and animals) through first - in - human trials • Safety research and risk assessment • Phase 2 and 3 clinical trials • Beyond patent life to supporting generic companies • Integration of data from multinational R&D efforts • 3QFY17 • Revenues up $736,000 (12.2%) to $6.75 million • Net income up $171,000 (8.9%) to $2.08 million* • Software renewal rates: 89% (accounts); 93%(fees) • 20 new software clients added • Strong consulting pipeline resulted in significant increase in revenues • Current backlog remains high – new hires onboard and contributing • 9MoFY17 • Revenues up $ 1.86 million (11.6%) to $17.87 million • Net income up $476,000 (11.4%) to $4.64 million* • Diluted earnings per share up 9.9% to 27¢ per share* • 63 new software clients added Overview *Reduced by one - time charges associated with acquisition

Acquisition of DILIsym Services, Inc. • DILIsym® is a mechanistic, mathematical model that has been constructed to support pharmaceutical risk assessment and decision making – Intersection of compound distribution and metabolism (PBPK), hepatotoxicity mechanisms, and patient variability • DILIsym has been applied to support decisions related to compound DILI risk throughout the clinical development pipeline – Evaluate and interpret clinical biomarker signals in clinical trials – Optimize clinical trial design (dose selection, monitoring, inclusion/exclusion criteria) – Translate preclinical safety risk to first - in - human clinical trials – Rank compounds by risk – Evaluation of compound risk based on preclinical data • DILIsym simulation results have been included in numerous communications with regulatory agencies – Antimicrobial drugs advisory committee meeting, 2016 – https://www.fda.gov/downloads/AdvisoryCommittees/CommitteesMeetingMaterials/Drugs/Anti - InfectiveDrugsAdvisoryCommittee/UCM536448.pdf • DILIsym Services has joined the Simulations Plus family – Complementary, world class PBPK and DILI prediction capabilities with GastroPlus ™ and DILIsym – Additional synergistic potential for combined predictive abilities of ADMET Predictor™, GastroPlus, and DILIsym 5

The DILI - sim Initiative : P artnership between DILIsym Services and p harmaceutical c ompanies to m inimize DILI • Overall Goals – Improve patient safety – Reduce the need for animal testing – Reduce the cost and time necessary to develop new drugs • History – Officially started in 2011 – 17 major pharmaceutical companies have participated – Members have provided compounds, data, and conducted experiments to support effort – Over $7 million total invested in project 6 DILIsym ®

7 • Now in 3 rd and final year of $200,000/year collaboration for improved ocular dosing simulations • Established consortium of leading pharmaceutical companies • The global ophthalmic drugs market was valued at $16 billion in 2012, and was expected to reach an estimated value of $21.6 billion in 2018 • Prevalence of eye disorders is increasing as the population ages (e.g., diabetic retinopathy, macular degeneration) FDA Office of Generic Drugs (OGD) Funded Collaborations • In year two of 3 - year, $200,000/year collaboration for simulation of long - acting injectable microspheres • Formed consortium of industry partners, FDA scientists, and Simulations Plus • Added intramuscular dosing to GastroPlus (v9.5) • Developed enhancements to DDDPlus to simulate in vitro dissolution/release from polymer microspheres
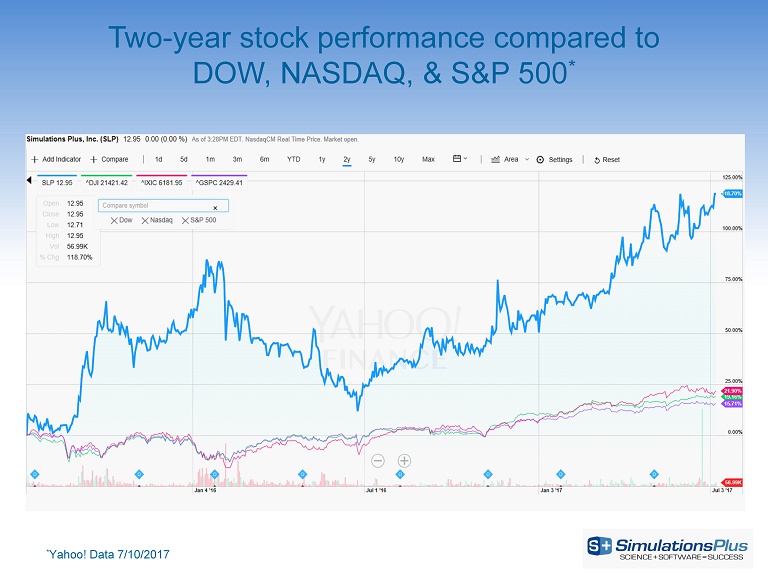
* Yahoo! Data 7/10/2017 Two - year stock performance compared to DOW, NASDAQ, & S&P 500 *

9 Financial Overview John Kneisel Chief Financial Officer
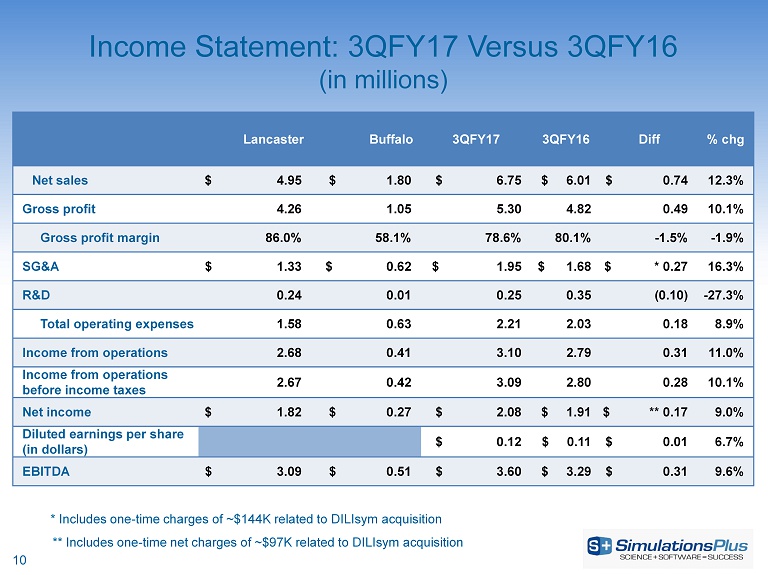
10 Income Statement: 3QFY17 Versus 3QFY16 (in millions) Lancaster Buffalo 3QFY17 3QFY16 Diff % chg Net sales $ 4.95 $ 1.80 $ 6.75 $ 6.01 $ 0.74 12.3% Gross profit 4.26 1.05 5.30 4.82 0.49 10.1% Gross profit margin 86.0% 58.1% 78.6% 80.1% - 1.5% - 1.9% SG&A $ 1.33 $ 0.62 $ 1.95 $ 1.68 $ * 0.27 16.3% R&D 0.24 0.01 0.25 0.35 (0.10) - 27.3% Total operating expenses 1.58 0.63 2.21 2.03 0.18 8.9% Income from operations 2.68 0.41 3.10 2.79 0.31 11.0% Income from operations before income taxes 2.67 0.42 3.09 2.80 0.28 10.1% Net income $ 1.82 $ 0.27 $ 2.08 $ 1.91 $ ** 0.17 9.0% Diluted earnings per share (in dollars) $ 0.12 $ 0.11 $ 0.01 6.7% EBITDA $ 3.09 $ 0.51 $ 3.60 $ 3.29 $ 0.31 9.6% * Includes one - time charges of ~$144K related to DILIsym acquisition ** Includes one - time net charges of ~$97K related to DILIsym acquisition

11 Income Statement: 9MoFY17 Versus 9MoFY16 (in millions) Lancaster Buffalo 9MoFY17 9MoFY16 Diff % chg Net sales $ 12.69 $ 5.19 $ 17.87 $ 16.02 $ 1.86 11.6% Gross profit 10.58 2.95 13.54 12.47 1.06 8.5% Gross profit margin 83.4% 56.9% 75.7% 77.9% - 2.1% - 2.7% SG&A $ 3.92 $ 1.85 $ 5.77 $ 5.08 $ * 0.69 13.5% R&D 0.93 0.03 0.95 1.16 (0.21) - 18.0% Total operating expenses 4.85 1.87 6.72 6.24 0.48 7.7% Income from operations 5.74 1.08 6.82 6.23 0.59 9.4% Income from operations before income taxes 5.76 1.08 6.84 6.21 0.63 10.1% Net income $ 3.95 $ 0.69 $ 4.64 $ 4.16 $ ** 0.48 11.4% Diluted earnings per share (in dollars) $ 0.27 $ 0.24 $ 0.024 9.9% EBITDA $ 7.02 $ 1.37 $ 8.38 $ 6.82 $ 1.56 22.9% * Includes one - time charges of ~$260K related to DILIsym acquisition ** Includes one - time net charges of ~$177K related to DILIsym acquisition

12 Consolidated Revenues: Fiscal Quarter (pro forma prior to 2012; in millions) 2.29 3.12 3.09 1.58 2.64 3.08 3.74 2.00 4.01 4.57 5.94 3.71 4.84 5.16 6.01 3.96 5.42 5.71 6.75 $0 $1 $2 $3 $4 $5 $6 $7 $8 Q1 Q2 Q3 Q4 2013 2014 2015 2016 2017

13 Consolidated Net Income: Fiscal Quarter (pro forma prior to 2012; in millions) $0.59 $1.06 $0.99 $0.24 $0.69 $0.81 $1.31 $0.22 $0.53 $0.97 $1.85 $0.49 $1.11 $1.15 $1.91 $0.79 $1.36 $1.20 $2.08 $ - $0.50 $1.00 $1.50 $2.00 $2.50 Q1 Q2 Q3 Q4 2013 2014 2015 2016 2017

14 Consolidated Diluted Earnings Per Share $0.04 $0.06 $0.06 $0.01 $0.04 $0.05 $0.08 $0.01 $0.03 $0.06 $0.11 $0.03 $0.06 $0.07 $0.11 $0.05 $0.08 $0.07 $0.12 $ - $0.02 $0.04 $0.06 $0.08 $0.10 $0.12 $0.14 Q1 Q2 Q3 Q4 Quarterly EPS FY13 FY14 FY15 FY16 FY17

15 Consolidated EBITDA: Fiscal Quarter (in millions) 1.09 1.76 1.73 0.44 1.20 1.35 2.30 0.67 1.22 1.97 3.33 1.19 2.22 2.18 3.28 1.51 2.48 2.30 3.60 $0 $1 $2 $3 $4 Q1 Q2 Q3 Q4 2013 2014 2015 2016 2017

16 Returning Cash to Shareholders (in millions) 0.8 0.8 2.2 0 0.5 0.5 0.6 0.81 0.81 0.81 0.84 0.84 0.84 0.85 0.85 0.85 0.85 0.85 0.86 0.86 0.86 12.7 11.4 9.3 9.8 10.0 10.1 10.6 11.0 7.8 8.6 5.8 6.1 6.4 8.6 7.2 7.1 8.8 8.0 8.8 7.4 8.2 6.0 $0 $1 $1 $2 $2 $3 $0 $2 $4 $6 $8 $10 $12 $14 Dividend Paid Cash on Hand Cash paid $2.5M TSRL Cash paid $2.1M for Cognigen Cash paid $720K for Cognigen Cash paid out $5MM related to DILIsym acquisition

17 Selected Balance Sheet Items (in millions, except where indicated) May 31, 2017 August 31, 2016 Cash and cash equivalents $ 8.248* $ 8.030* Cash per share ( in Dollars ) $ 0.48 $ 0.47 Total current assets 14.935 12.700 Total assets 29.547 27.814 Total current liabilities 1.267 2.126 Total liabilities 4.322 5.082 Current ratio 11.79x 5.98x Shareholders’ equity 25.225 22.733 Total liabilities and shareholders’ equity 29.547 27.814 Shareholders’ equity per diluted share( in Dollars ) $1.445 $1.335 * Cash as of July 7, 2017 ~$6.0 million.

18 Marketing and Sales Walter S. Woltosz CEO and Chairman

N H O OH O CH 3 CH 3 CH 3 ADMET Predictor™ GastroPlus ™ MedChem Studio™ MedChem Designer™ DDDPlus ™ MembranePlus™ Consulting Services and Collaborations Discovery Preclinical Clinical PKPlus™ KIWI™ Simulations Plus: Your end - to - end M&S solutions provider DILIsym ® NAFLDsym™
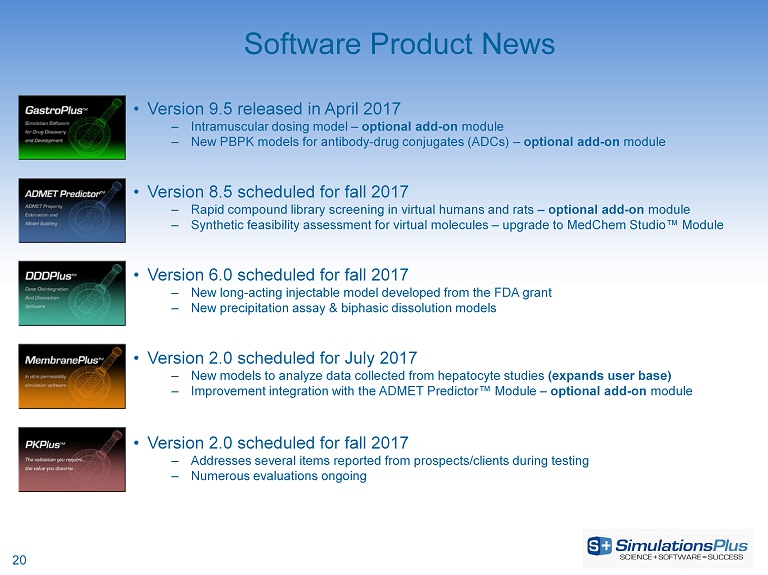
20 • Version 9.5 released in April 2017 ‒ Intramuscular dosing model – optional add - on module ‒ New PBPK models for antibody - drug conjugates (ADCs) – optional add - on module • Version 8.5 scheduled for fall 2017 ‒ Rapid compound library screening in virtual humans and rats – optional add - on module ‒ Synthetic feasibility assessment for virtual molecules – upgrade to MedChem Studio™ Module Software Product News • Version 6.0 scheduled for fall 2017 ‒ New long - acting injectable model developed from the FDA grant ‒ New precipitation assay & biphasic dissolution models • Version 2.0 scheduled for July 2017 ‒ New models to analyze data collected from hepatocyte studies (expands user base) ‒ Improvement integration with the ADMET Predictor™ Module – optional add - on module • Version 2.0 scheduled for fall 2017 ‒ Addresses several items reported from prospects/clients during testing ‒ Numerous evaluations ongoing

3QFY17 Sales Review • Consolidated revenue +12.3% vs. 3QFY16 • Highlights: – Software revenue +5% • 89% renewal rate (accounts) • 93% renewal rate (fees) • 20% increase in license units • 10 new commercial companies • 10 new nonprofit groups – Continued expansion of licenses at China FDA – Consulting revenue +34.9% • +33.9% in Buffalo • +43.5% in Lancaster 58% 11% 29% 2% Consolidated Sales Breakdown Renewal New Consulting Training 0 50 100 150 200 250 Q1 Q2 Q3 Q4 Software License Units/Quarter FY14 FY15 FY16 FY17 21

9MoFY17 Sales Review • Consolidated revenue +11.6% vs. 9MoFY16 • Highlights: – Software revenue +6.7% • 88% renewal rate (accounts) • 95% renewal rate (fees) • 8% increase in license units • 32 new commercial companies • 31 new nonprofit groups – Consulting revenue +23% • +20.6% in Buffalo • +42.6% in Lancaster – Training revenue +25.3% 54% 12% 33% 1% Consolidated Sales Breakdown Renewal New Consulting Training 0 50 100 150 200 250 Q1 Q2 Q3 Q4 Software License Units/Quarter FY14 FY15 FY16 FY17 22
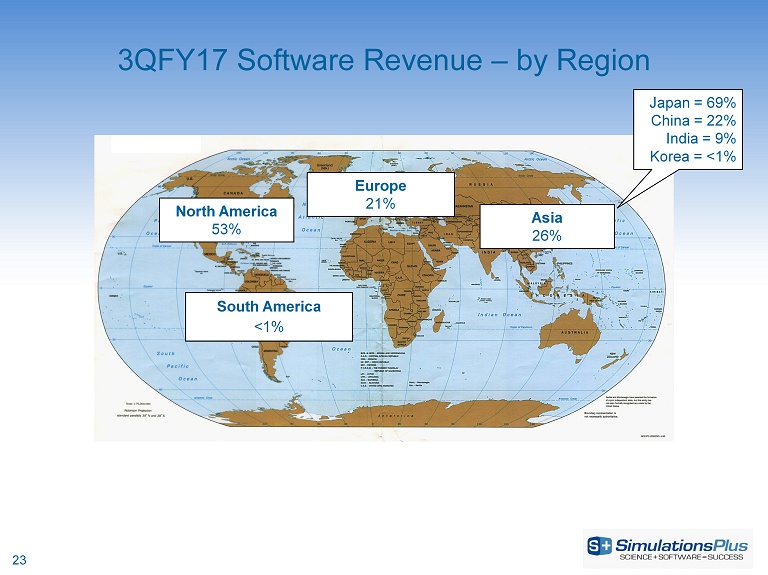
3QFY17 Software Revenue – by Region Europe 21% North America 53% Asia 26% South America <1% Japan = 69% China = 22% India = 9% Korea = <1% 23

9MoFY17 Software Revenue – by Region Europe 24% North America 49% Asia 27% South America <1% Japan = 62% China = 23% India = 17% Korea = <1% 24

3Q17 Marketing Activities Website Content • Continued production of video content for promotional/branding purposes • Increased focus on SEO performance Workshops and Conferences • PBPK and/or population PK data analysis workshops held in San Diego, Germany, Shanghai, and Buffalo – Workshops scheduled in Korea, Boston, and Tokyo in summer/fall • Hosted several onsite trainings at individual companies • Attended 12 scientific conferences; delivered 9 poster/podium presentations Strategic Digital Marketing Initiatives • Hosted 2 webinars on GastroPlus modeling applications • Continued with active social media campaigns – Twitter/LinkedIn/YouTube followers have increased 18% vs. June 2016 – GastroPlus User Group membership increased 13% vs. June 2016 25

26 Buffalo (Cognigen) Division Update Re - imagining the future of science - based research and development Ted Grasela President July 10, 2017

27 Status Report - Consulting • In FY2017 working with 26 companies on 39 drugs, 65 projects – 6 new companies in FY2017 – 36 new projects in FY17 – 22 projects expanded scope in FY17 – 3 projects with reduced scope – 32 outstanding proposals with 20 different companies • In FY2017 presented 9 posters, published 2 peer - reviewed manuscripts; 4 invited presentations, and 1 book chapter published – Working on 21 publications and 5 conference abstracts • Most common therapeutic area is oncology, followed by neurology, endocrinology, and infectious disease – ~45% of projects result directly in regulatory interaction. • Successful recruitment and on - boarding of new scientists to maintain growth

28 • Continued to work on $4.7 million contract with a major foundation to implement a KIWI platform for global teams engaged in model - based drug development; 5 - year term contingent on satisfactory completion of milestones • KIWI platform development continuing • Deploying data repository in July • Establishing KIWI - based collaborations on Global Health projects • Continuing design and development activities • Currently have 9 KIWI licenses • Several KIWI demonstrations ongoing with research groups ranging from academics to large pharma KIWI Update

29 Cognigen continues to grow: • Consulting activities continuing to expand; healthy pipeline of new projects, including collaborations with Lancaster colleagues for PBPK modeling in clinical pharmacology • Excited about collaboration opportunities with our new colleagues at DILIsym • KIWI platform development and deployment continuing; deploying data repository in July, establishing KIWI - based collaborations on Global Health projects, continuing design and development activities • Continued interest in the academic and industry communities regarding licensing the product Summary

30 Final Summary Walter S. Woltosz CEO and Chairman

31 • 3QFY17 • Revenues up 12.2% to $6.75 million • Net income up 8.9% to $2.08 million (diluted earnings = 1 2¢ per share) • 9MoFY17 • Revenues up 11.6% to $17.87 million • Net income up 11.4% to $4.64 million* • D iluted earnings up 9.9% to 27¢ per share* • California and Buffalo divisions both performing well • Expected synergies being realized • Addressing regulatory agency focus on applying PBPK modeling in clinical pharmacology & safety research • New guidance documents issued by FDA and EMA helping drive interest • Executing on 5 - year, $4.7 million contract with major research foundation • Offers potential for additional such contracts with other organizations • New DILIsym Services acquisition will expand offerings into systems toxicology • Exciting opportunities to provide end - to - end solutions for clients in different markets • We believe Simulations Plus continues to lead the trend toward greater use of modeling and simulation in research & development Summary *Reduced by one - time charges for acquisition