Attached files
| file | filename |
|---|---|
| 8-K - 8-K - McEwen Mining Inc. | a17-14299_18k.htm |
Exhibit 99.1
ASSET RICH DEBT FREE LEVERAGE TO GOLD, SILVER & COPPER 2017 Annual Meeting of Shareholders
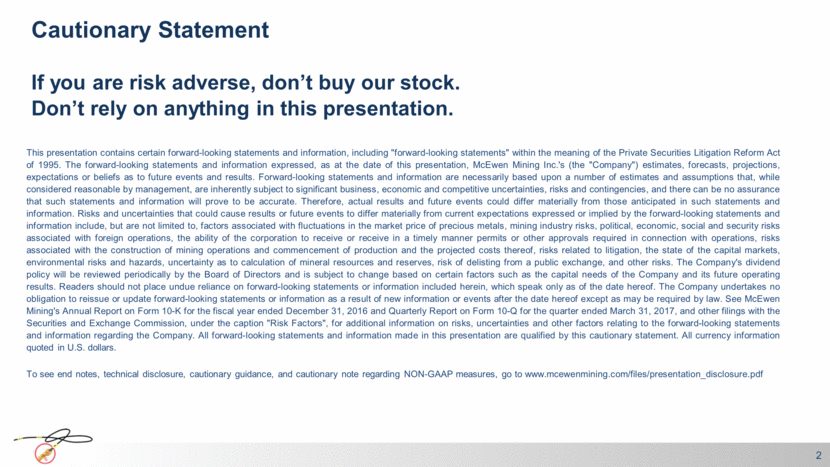
Cautionary Statement 2 This presentation contains certain forward-looking statements and information, including "forward-looking statements" within the meaning of the Private Securities Litigation Reform Act of 1995. The forward-looking statements and information expressed, as at the date of this presentation, McEwen Mining Inc.'s (the "Company") estimates, forecasts, projections, expectations or beliefs as to future events and results. Forward-looking statements and information are necessarily based upon a number of estimates and assumptions that, while considered reasonable by management, are inherently subject to significant business, economic and competitive uncertainties, risks and contingencies, and there can be no assurance that such statements and information will prove to be accurate. Therefore, actual results and future events could differ materially from those anticipated in such statements and information. Risks and uncertainties that could cause results or future events to differ materially from current expectations expressed or implied by the forward-looking statements and information include, but are not limited to, factors associated with fluctuations in the market price of precious metals, mining industry risks, political, economic, social and security risks associated with foreign operations, the ability of the corporation to receive or receive in a timely manner permits or other approvals required in connection with operations, risks associated with the construction of mining operations and commencement of production and the projected costs thereof, risks related to litigation, the state of the capital markets, environmental risks and hazards, uncertainty as to calculation of mineral resources and reserves, risk of delisting from a public exchange, and other risks. The Company's dividend policy will be reviewed periodically by the Board of Directors and is subject to change based on certain factors such as the capital needs of the Company and its future operating results. Readers should not place undue reliance on forward-looking statements or information included herein, which speak only as of the date hereof. The Company undertakes no obligation to reissue or update forward-looking statements or information as a result of new information or events after the date hereof except as may be required by law. See McEwen Mining's Annual Report on Form 10-K for the fiscal year ended December 31, 2016 and Quarterly Report on Form 10-Q for the quarter ended March 31, 2017, and other filings with the Securities and Exchange Commission, under the caption "Risk Factors", for additional information on risks, uncertainties and other factors relating to the forward-looking statements and information regarding the Company. All forward-looking statements and information made in this presentation are qualified by this cautionary statement. All currency information quoted in U.S. dollars. To see end notes, technical disclosure, cautionary guidance, and cautionary note regarding NON-GAAP measures, go to www.mcewenmining.com/files/presentation_disclosure.pdf If you are risk adverse, don’t buy our stock. Don’t rely on anything in this presentation.
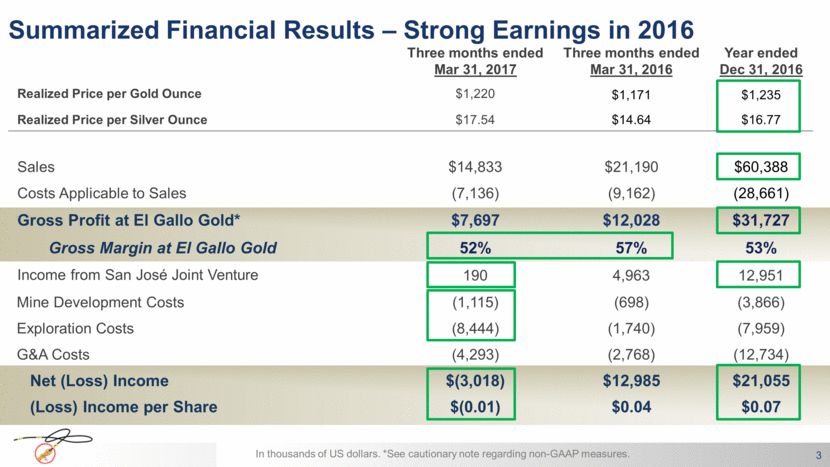
Summarized Financial Results – Strong Earnings in 2016 Three months ended Mar 31, 2017 Three months ended Mar 31, 2016 Year ended Dec 31, 2016 Realized Price per Gold Ounce $1,220 $1,171 $1,235 Realized Price per Silver Ounce $17.54 $14.64 $16.77 Sales $14,833 $21,190 $60,388 Costs Applicable to Sales (7,136) (9,162) (28,661) Gross Profit at El Gallo Gold* $7,697 $12,028 $31,727 Gross Margin at El Gallo Gold 52% 57% 53% Income from San José Joint Venture 190 4,963 12,951 Mine Development Costs (1,115) (698) (3,866) Exploration Costs (8,444) (1,740) (7,959) G&A Costs (4,293) (2,768) (12,734) Net (Loss) Income $(3,018) $12,985 $21,055 (Loss) Income per Share $(0.01) $0.04 $0.07 In thousands of US dollars. *See cautionary note regarding non-GAAP measures. 3
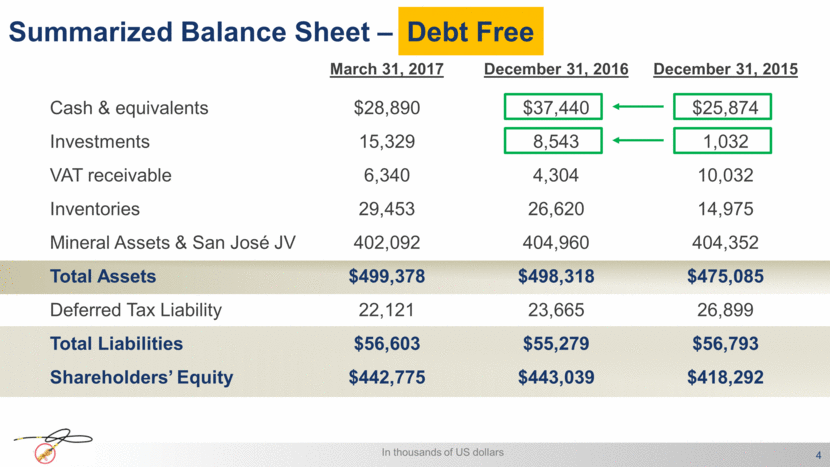
Summarized Balance Sheet – March 31, 2017 December 31, 2016 December 31, 2015 Cash & equivalents $28,890 $37,440 $25,874 Investments 15,329 8,543 1,032 VAT receivable 6,340 4,304 10,032 Inventories 29,453 26,620 14,975 Mineral Assets & San José JV 402,092 404,960 404,352 Total Assets $499,378 $498,318 $475,085 Deferred Tax Liability 22,121 23,665 26,899 Total Liabilities $56,603 $55,279 $56,793 Shareholders’ Equity $442,775 $443,039 $418,292 In thousands of US dollars 4 Debt Free Debt Free
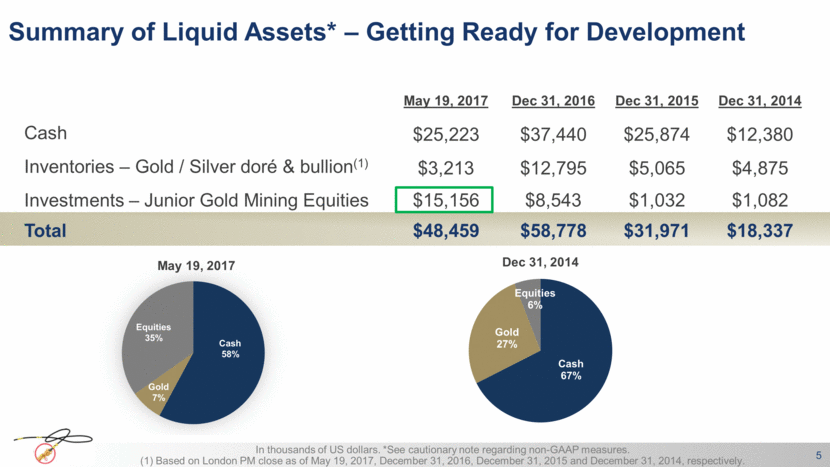
Summary of Liquid Assets* – Getting Ready for Development May 19, 2017 Dec 31, 2016 Dec 31, 2015 Dec 31, 2014 Cash $25,223 $37,440 $25,874 $12,380 Inventories – Gold / Silver doré & bullion(1) $3,213 $12,795 $5,065 $4,875 Investments – Junior Gold Mining Equities $15,156 $8,543 $1,032 $1,082 Total $48,459 $58,778 $31,971 $18,337 In thousands of US dollars. *See cautionary note regarding non-GAAP measures. (1) Based on London PM close as of May 19, 2017, December 31, 2016, December 31, 2015 and December 31, 2014, respectively. 5 Cash 58% Gold 7% Equities 35% May 19, 2017 Cash 67% Gold 27% Equities 6% Dec 31, 2014
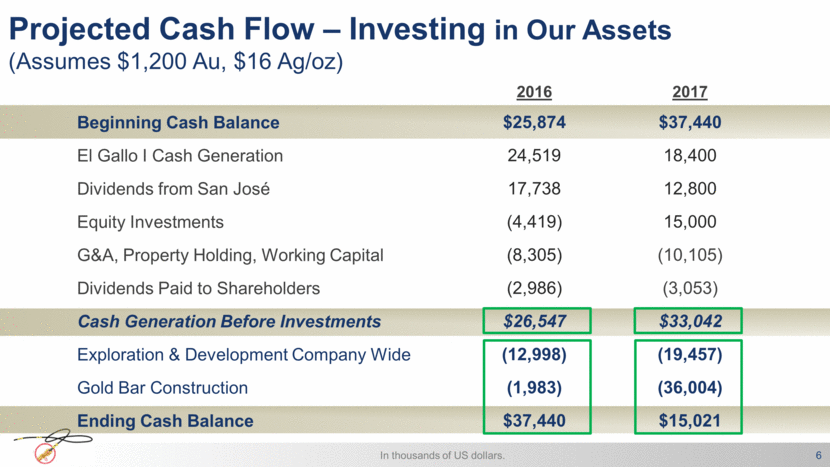
Projected Cash Flow – Investing in Our Assets (Assumes $1,200 Au, $16 Ag/oz) 2016 2017 Beginning Cash Balance $25,874 $37,440 El Gallo I Cash Generation 24,519 18,400 Dividends from San José 17,738 12,800 Equity Investments (4,419) 15,000 G&A, Property Holding, Working Capital (8,305) (10,105) Dividends Paid to Shareholders (2,986) (3,053) Cash Generation Before Investments $26,547 $33,042 Exploration & Development Company Wide (12,998) (19,457) Gold Bar Construction (1,983) (36,004) Ending Cash Balance $37,440 $15,021 In thousands of US dollars. 6
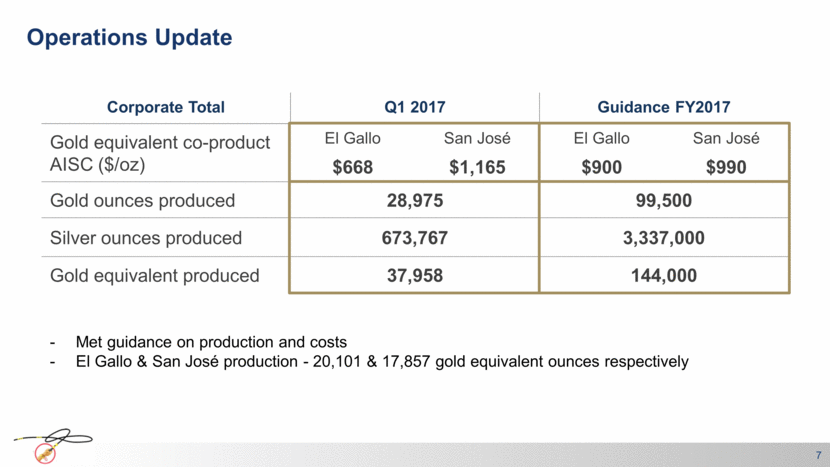
Operations Update Corporate Total Q1 2017 Guidance FY2017 Gold equivalent co-product AISC ($/oz) El Gallo San José El Gallo San José $668 $1,165 $900 $990 Gold ounces produced 28,975 99,500 Silver ounces produced 673,767 3,337,000 Gold equivalent produced 37,958 144,000 7 Met guidance on production and costs El Gallo & San José production - 20,101 & 17,857 gold equivalent ounces respectively
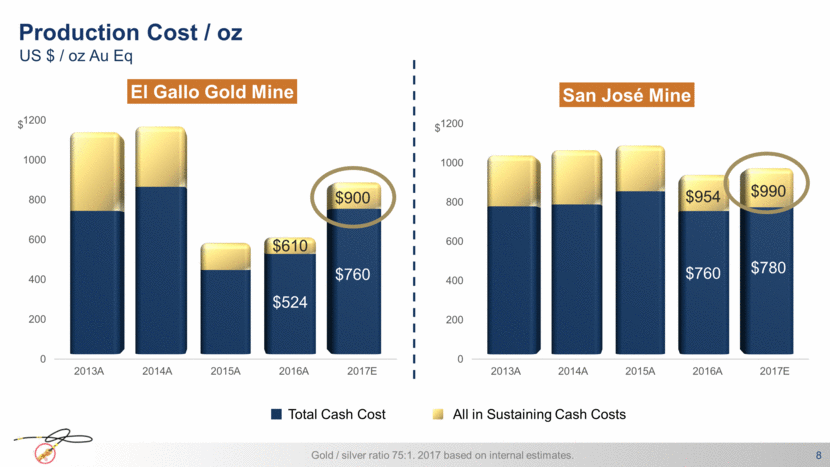
Production Cost / oz 8 US $ / oz Au Eq Gold / silver ratio 75:1. 2017 based on internal estimates. $990 $780 $954 $760 $900 $760 $610 $524 Total Cash Cost All in Sustaining Cash Costs $ $ 0 200 400 600 800 1000 1200 2013A 2014A 2015A 2016A 2017E El Gallo Gold Mine 0 200 400 600 800 1000 1200 2013A 2014A 2015A 2016A 2017E San José Mine
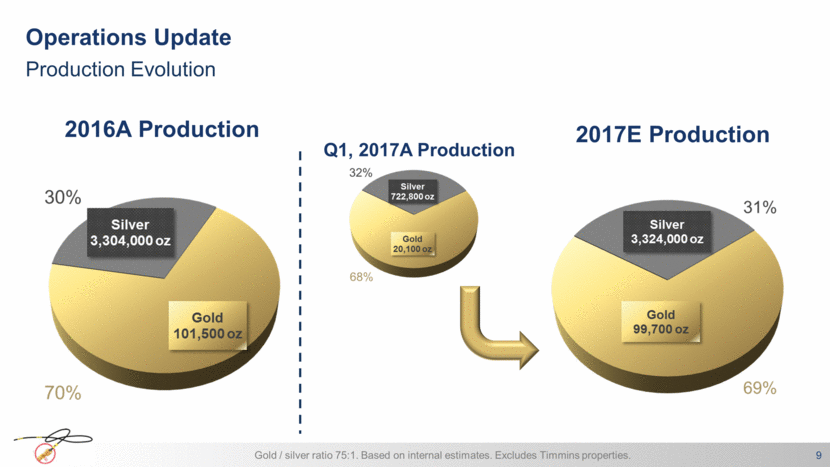
9 Gold / silver ratio 75:1. Based on internal estimates. Excludes Timmins properties. Q1, 2017A Production 2016A Production Operations Update Production Evolution 2017E Production
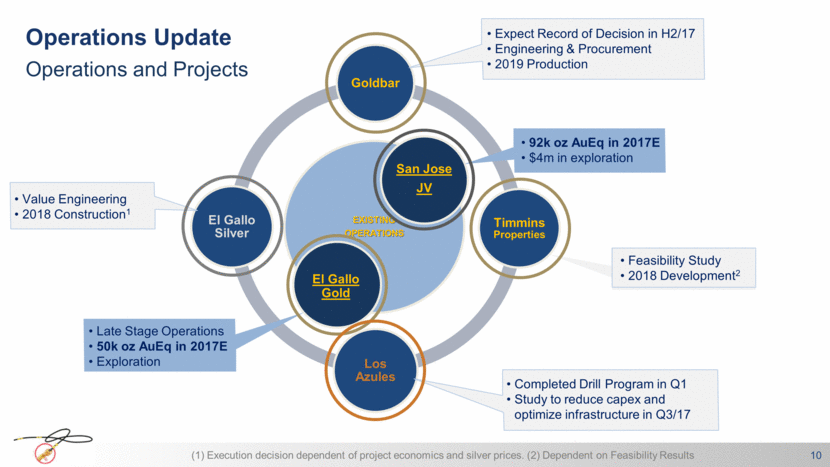
Operations Update 10 El Gallo Gold San Jose JV Value Engineering 2018 Construction1 Expect Record of Decision in H2/17 Engineering & Procurement 2019 Production Completed Drill Program in Q1 Study to reduce capex and optimize infrastructure in Q3/17 92k oz AuEq in 2017E $4m in exploration Feasibility Study 2018 Development2 Late Stage Operations 50k oz AuEq in 2017E Exploration (1) Execution decision dependent of project economics and silver prices. (2) Dependent on Feasibility Results Operations and Projects EXISTING OPERATIONS Goldbar Timmins Properties Los Azules El Gallo Silver
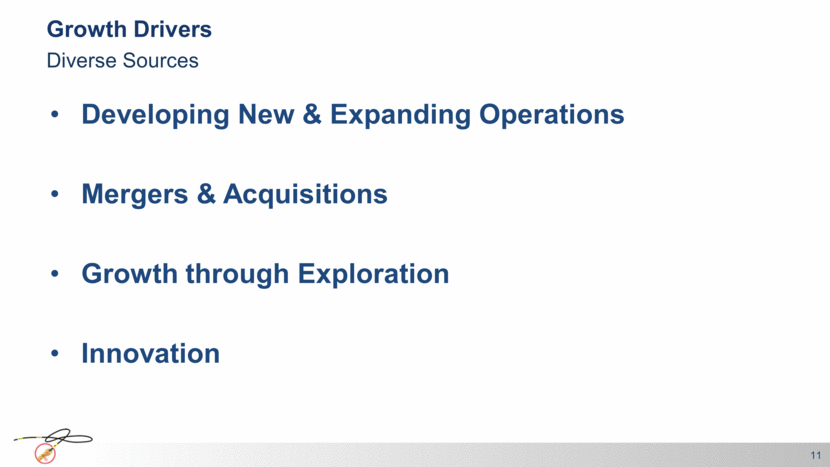
Developing New & Expanding Operations Mergers & Acquisitions Growth through Exploration Innovation 11 Growth Drivers Diverse Sources
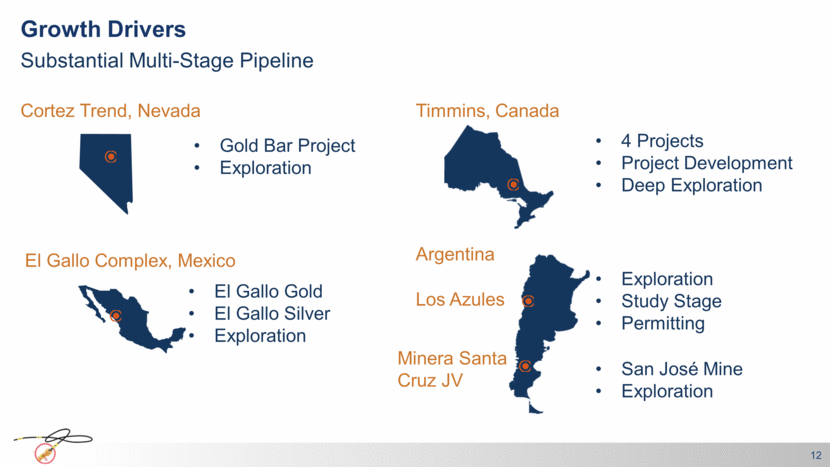
12 Growth Drivers: Growth Drivers Substantial Multi-Stage Pipeline El Gallo Complex, Mexico El Gallo Gold El Gallo Silver Exploration Gold Bar Project Exploration Cortez Trend, Nevada 4 Projects Project Development Deep Exploration Exploration Study Stage Permitting San José Mine Exploration Minera Santa Cruz JV Timmins, Canada Los Azules Argentina
Gold Bar construction expected to start El Gallo Silver construction decision point Exploration at El Gallo District on sulfide mineralization Feasibility for Timmins Properties’ development Los Azules exploration and PEA Production Growth 13 2017 - Entering a New Stage
Construction at Gold Bar - Late 2018 commissioning Expected construction at El Gallo Silver Final stage oxide mining at El Gallo Gold Opportunity for El Gallo heap reprocessing Development of Timmins Properties Initiating Permitting at Los Azules Production Growth 14 2018 – Exciting Transition Year
Full production at Gold Bar High grade production from El Gallo Silver Residual production from El Gallo Gold Production from one of Timmins Properties Los Azules Permitting & Feasibility Production Growth 15 2019 - Step Change in Production
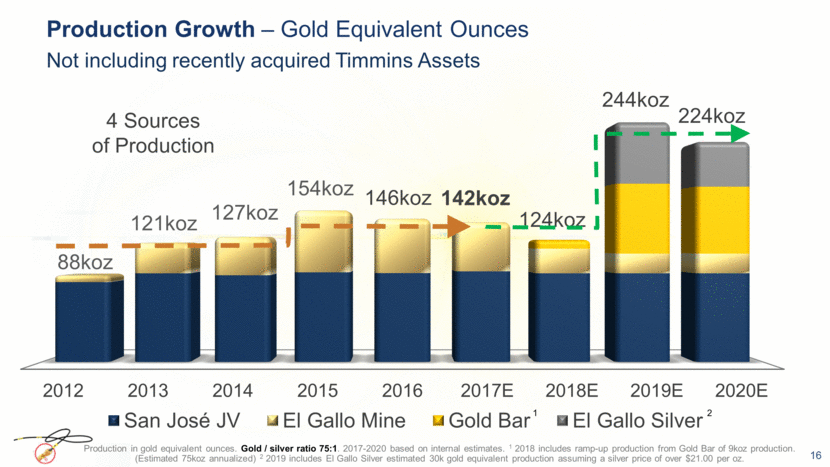
Production Growth – Gold Equivalent Ounces 16 154koz 127koz 121koz 88koz Production in gold equivalent ounces. Gold / silver ratio 75:1. 2017-2020 based on internal estimates. 1 2018 includes ramp-up production from Gold Bar of 9koz production. (Estimated 75koz annualized) 2 2019 includes El Gallo Silver estimated 30k gold equivalent production assuming a silver price of over $21.00 per oz. 142koz 124koz 1 146koz 244koz 2 224koz Not including recently acquired Timmins Assets 4 Sources of Production
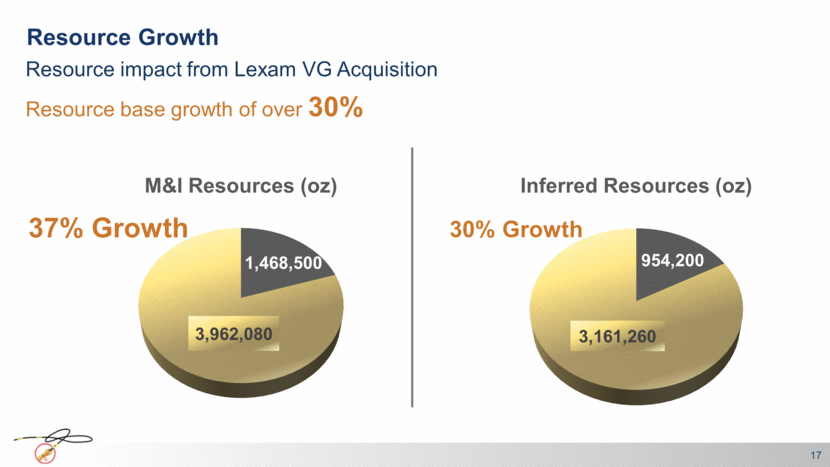
Resource Growth 17 Resource impact from Lexam VG Acquisition 37% Growth 30% Growth Resource base growth of over 30% 954,200 3,161,260 Inferred Resources ( oz ) 1,468,500 3,962,080 M&I Resources ( oz )
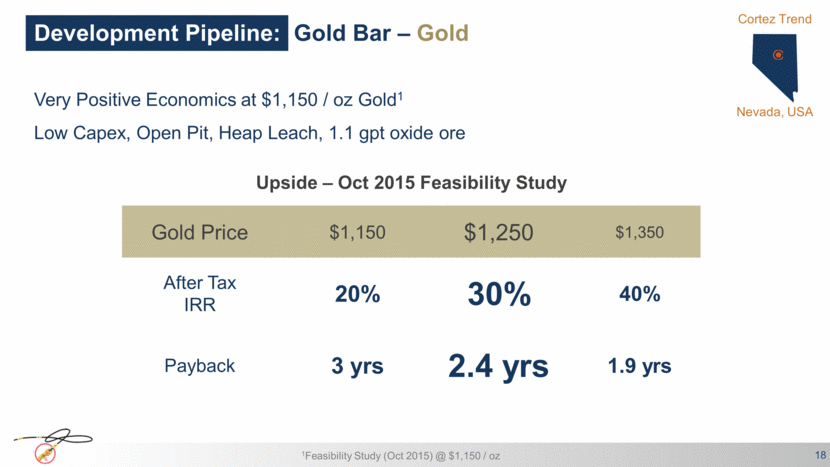
Development Pipeline: Gold Bar – Gold 18 Gold Price $1,150 $1,250 $1,350 After Tax IRR 20% 30% 40% Payback 3 yrs 2.4 yrs 1.9 yrs Very Positive Economics at $1,150 / oz Gold1 Low Capex, Open Pit, Heap Leach, 1.1 gpt oxide ore Upside – Oct 2015 Feasibility Study 1Feasibility Study (Oct 2015) @ $1,150 / oz Cortez Trend Nevada, USA
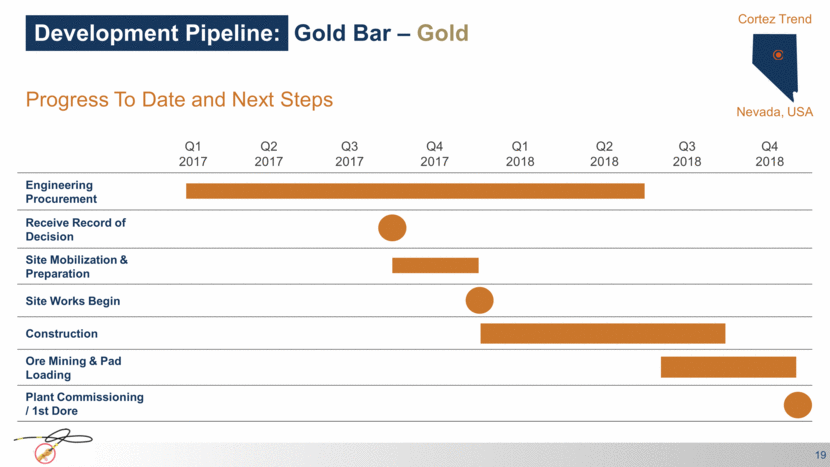
Development Pipeline: Gold Bar – Gold 19 Q1 2017 Q2 2017 Q3 2017 Q4 2017 Q1 2018 Q2 2018 Q3 2018 Q4 2018 Engineering Procurement Receive Record of Decision Site Mobilization & Preparation Site Works Begin Construction Ore Mining & Pad Loading Plant Commissioning / 1st Dore Progress To Date and Next Steps Cortez Trend Nevada, USA
20 Oxide, leachable ore to finish in 2018 Residual heap leaching Options to recover unleached gold and silver in heap Brownfield exploration for sulfide-hosted mineralization Potential conversion into polymetallic operation Development Pipeline: El Gallo – Gold Nearing End of Life Sinaloa State Mexico Samaniego Pit Central Pit
21 Internal studies in progress Capex & Opex Reduction Fast Track Engineering and Construction More robust economics relative to silver price variability Nearing construction decision – expect in Q4, 2017 Strategic development for unlocking district potential Development Pipeline: El Gallo – Silver Operational Continuity & Growth Sinaloa State Mexico
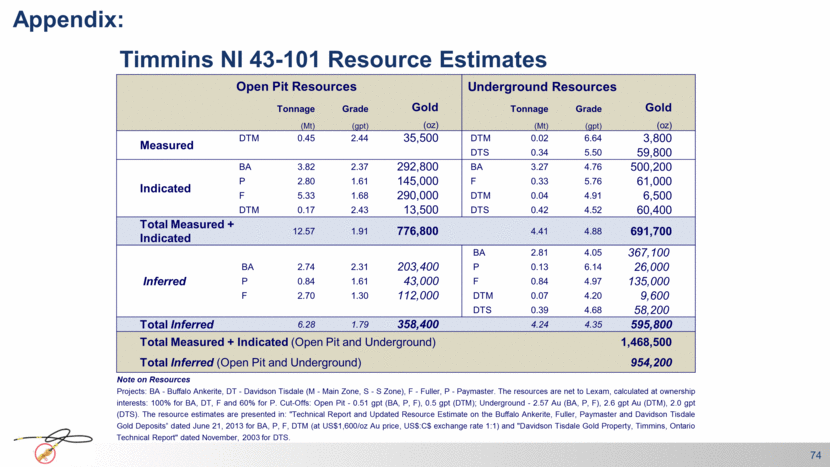
Development Pipeline: Timmins, Canada – Gold Key Features 22 1NI 43-101 Resource, 2013, see appendix for tonnage, grade, ounces Great address Near several producing mines 70 Moz gold produced in Timmins Camp 2. Four Projects Buffalo-Ankerite Fuller Paymaster Davidson-Tisdale Total Resource1 M&I: 1,468,500 oz Au (total open pit and underground) Inferred: 954,200 oz Au (total open pit and underground) 4. Exploration Upside Timmins Timmins Ontario
23 Multiple projects to be developed in sequence = long operating life Internal studies in progress - first feasibility in Q1 2018 Establish optimum development sequence Take advantage of process capacity available in Timmins Permitting in progress Exploration being restarted Development Pipeline: Timmins, Canada – Gold Upcoming Production Plan Timmins Ontario
Los Azules Coquimbo Port Los Azules Copper – Potential Bi-National Project 1000+ kms from Altantic Port in Argentina 200 kms from a Pacific Port in Chile 24 El Pachon
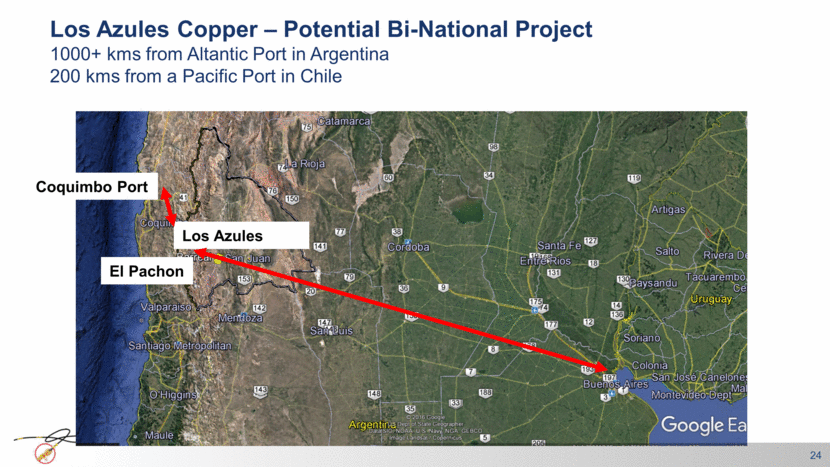
South North 750,000,000 tons @ 0.5% Cu + 750,000,000 tons @ 0.36% Cu = 1,500,000,000 tons @ 0.43% A potential world class copper mine Long Mine Life 150,000 tons of copper per annum in concentrate over 30+ years mine life The Los Azules Mine Site, elevation 3,600metres 25
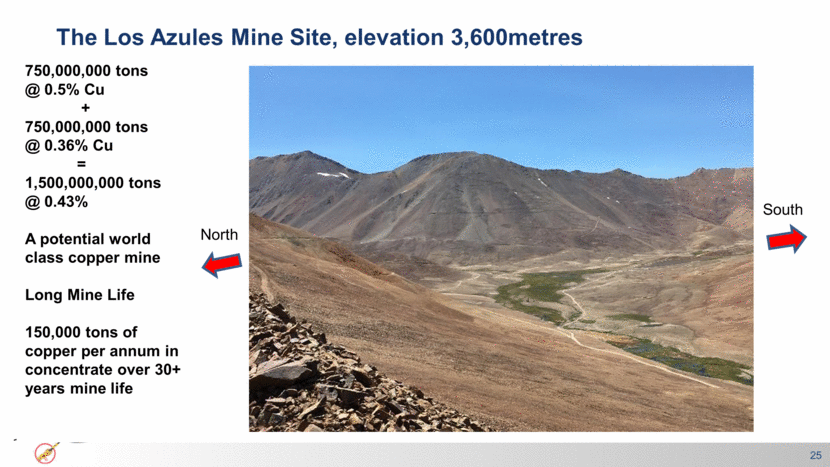
Phased Implementation Approach for Mineral Processing at Los Azules. Phase 1 = 80ktpd, Phase 2 = 40ktpd coming on line in year 5 and funded from cash flows Picture courtesy of Glencore A.G. 2015 26
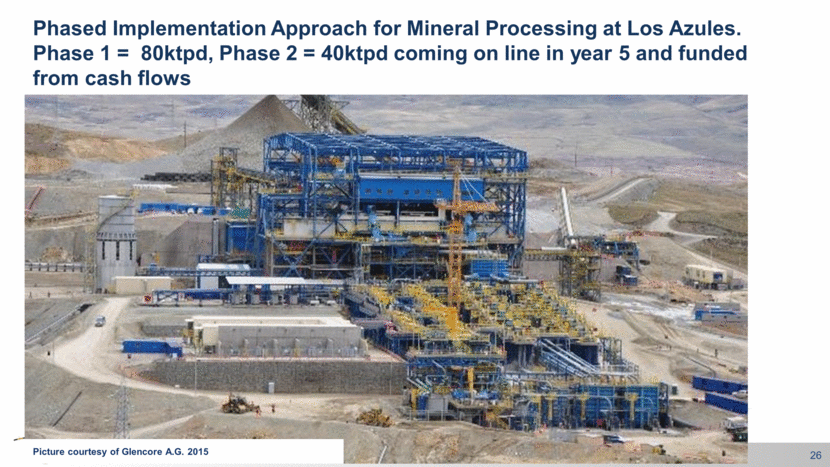
A 3D COMPUTER RENDERING OF THE LOS AZULES LANDSCAPE 2 Miles Los Azules Project 27
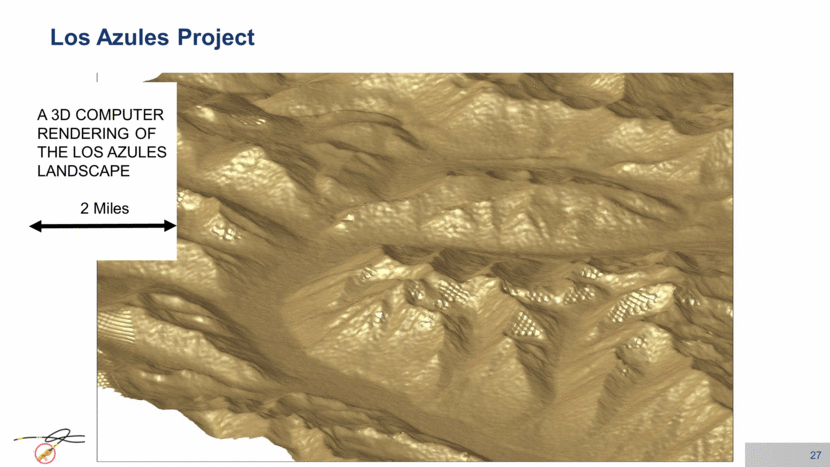
Los Azules Year 2 28
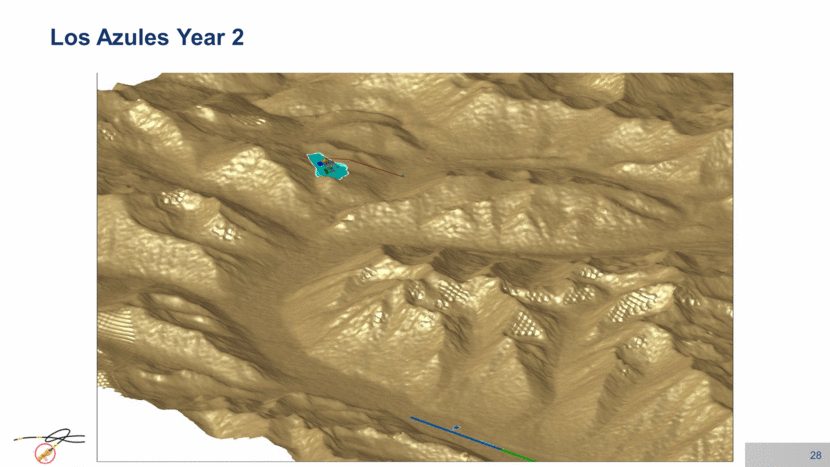
Los Azules – Year 0 Prestripping Done, 1st Phase of Concentrator, Stage 1 of Tailings Dam & Airstrip Completed 29
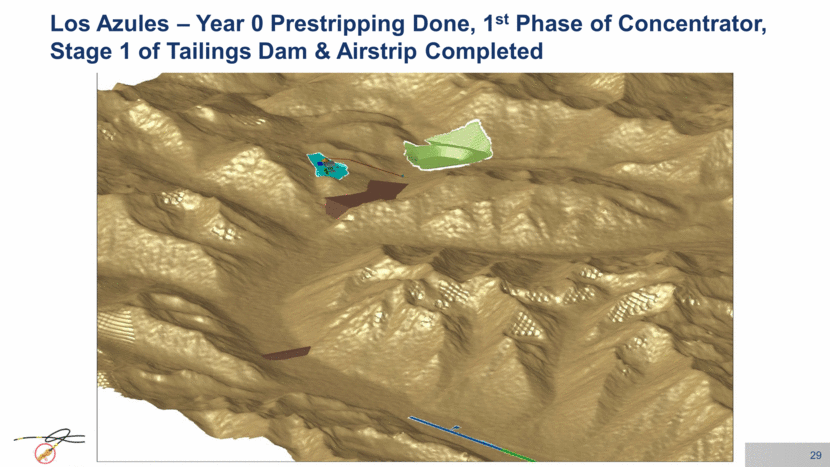
Los Azules Year 5 30
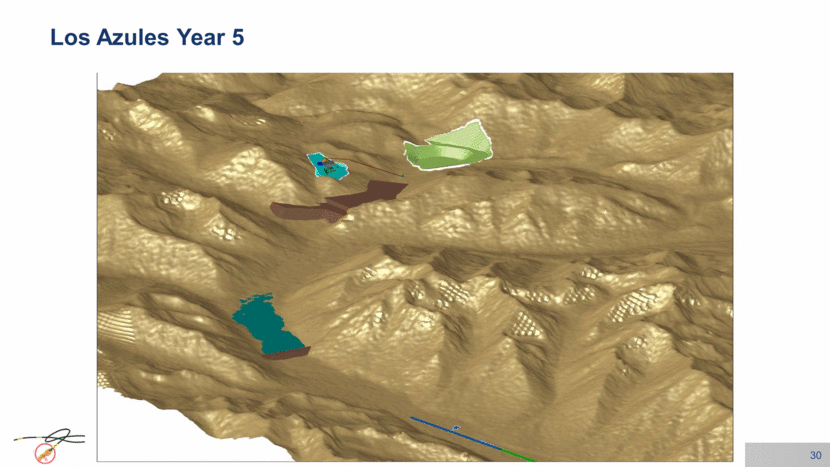
Los Azules Year 10 31
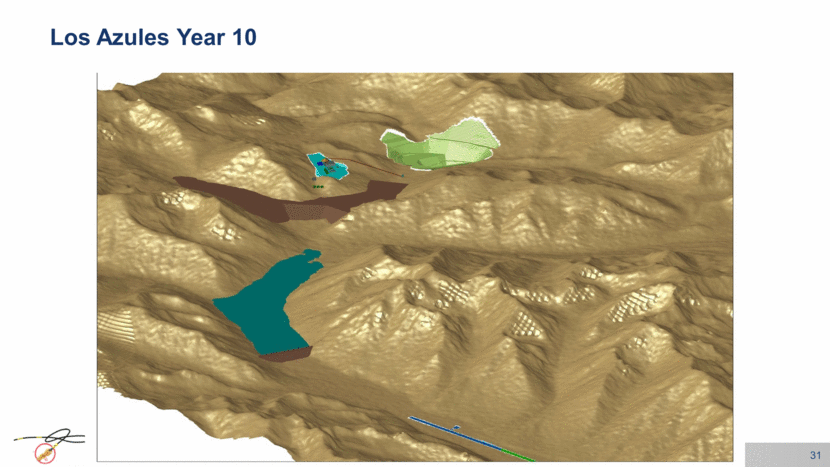
Los Azules Year 20 32
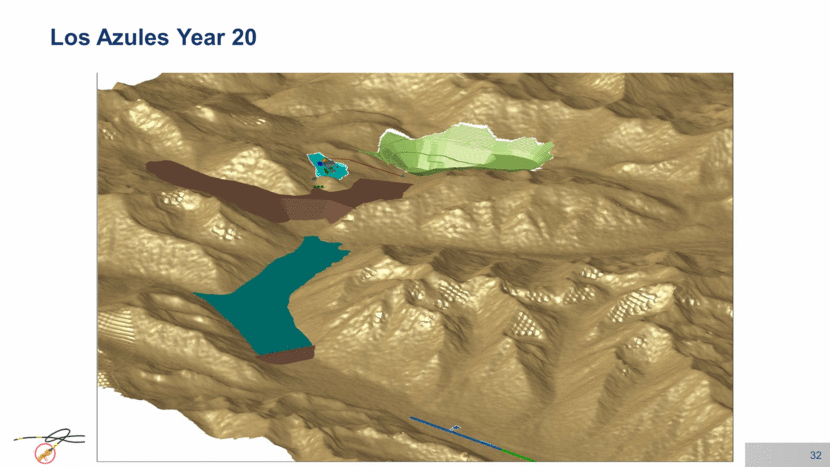
Los Azules Year 30 33
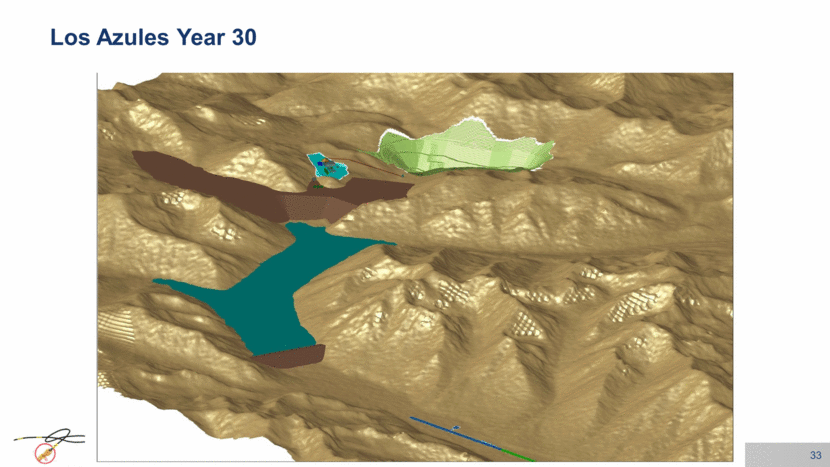
Los Azules Life of Mine – Ready for Rehabiliation 34
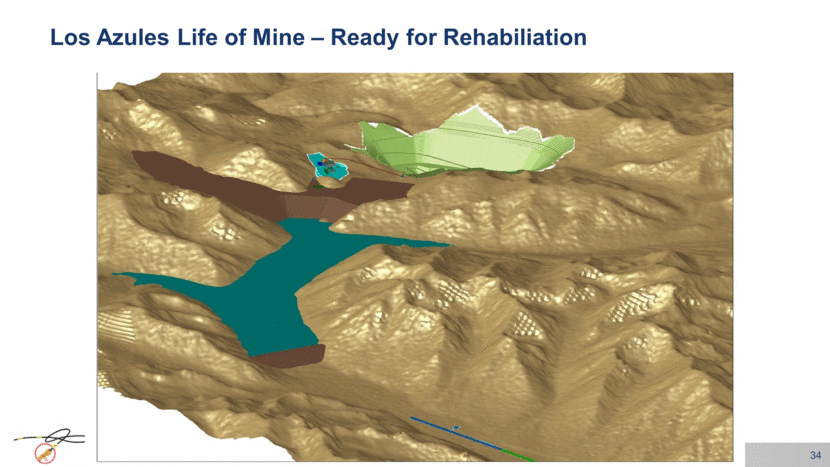
Copper in Concentrate from Phased Implementation at 80-120ktpd Recovery 90% for Cu and 67% for Au & Ag Los Azules = High Potential World Class Copper Resource Life of Mine Average Production Exceeds 150,000 tons per year 35
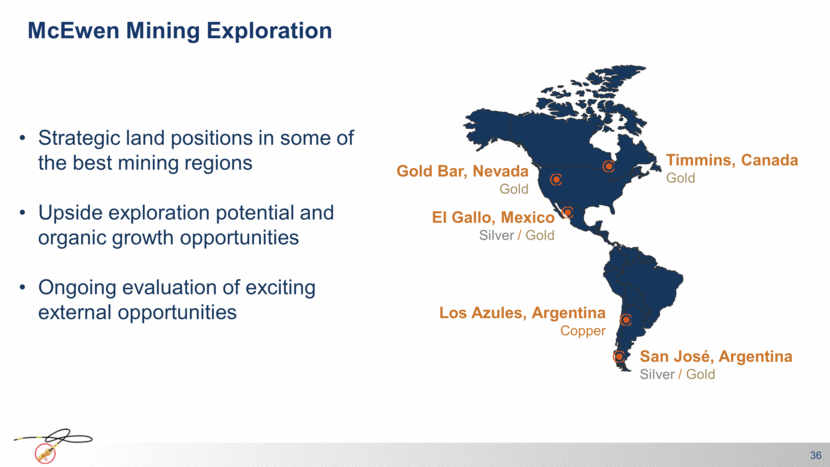
McEwen Mining Exploration Strategic land positions in some of the best mining regions Upside exploration potential and organic growth opportunities Ongoing evaluation of exciting external opportunities San José, Argentina Silver / Gold Timmins, Canada Gold Los Azules, Argentina Copper El Gallo, Mexico Silver / Gold Gold Bar, Nevada Gold 36
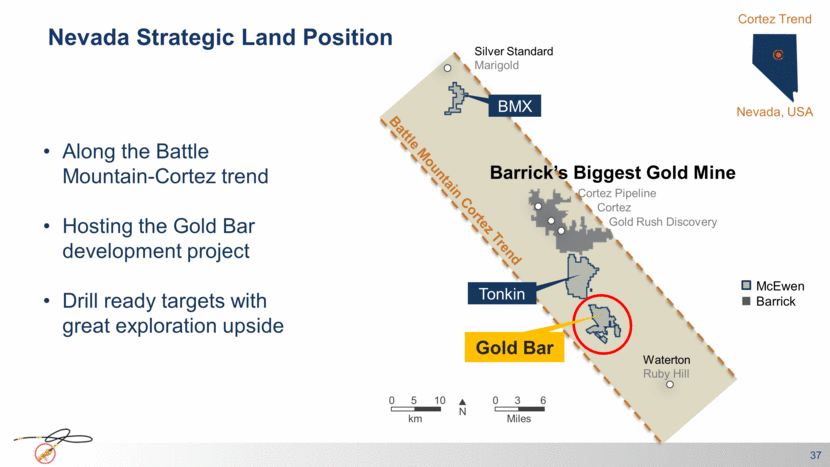
Nevada Strategic Land Position Along the Battle Mountain-Cortez trend Hosting the Gold Bar development project Drill ready targets with great exploration upside 37 BMX Cortez Silver Standard Marigold Waterton Ruby Hill Battle Mountain Cortez Trend Cortez Pipeline Gold Rush Discovery 0 5 10 km N Barrick’s Biggest Gold Mine Cortez Trend Nevada, USA 0 3 6 Miles Gold Bar Tonkin McEwen Barrick
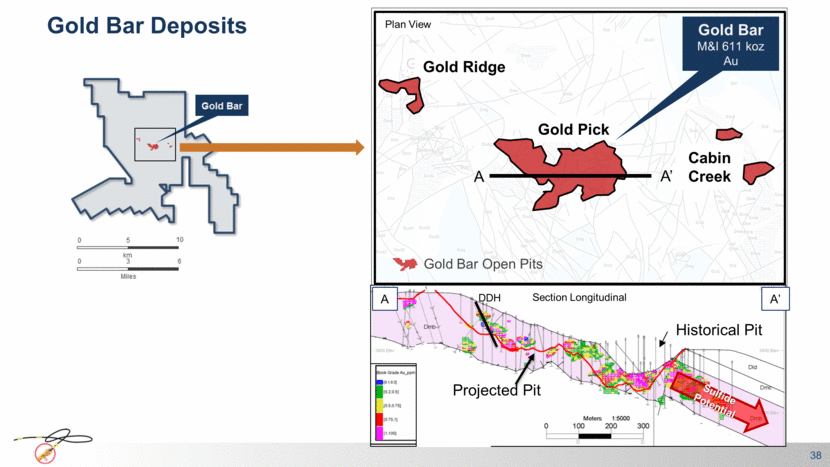
Gold Bar Deposits Sulfide Potential A A’ DDH Historical Pit Section Longitudinal Gold Pick Cabin Creek Gold Ridge Gold Bar M&I 611 koz Au A A’ Plan View 38 Gold Bar Open Pits Projected Pit
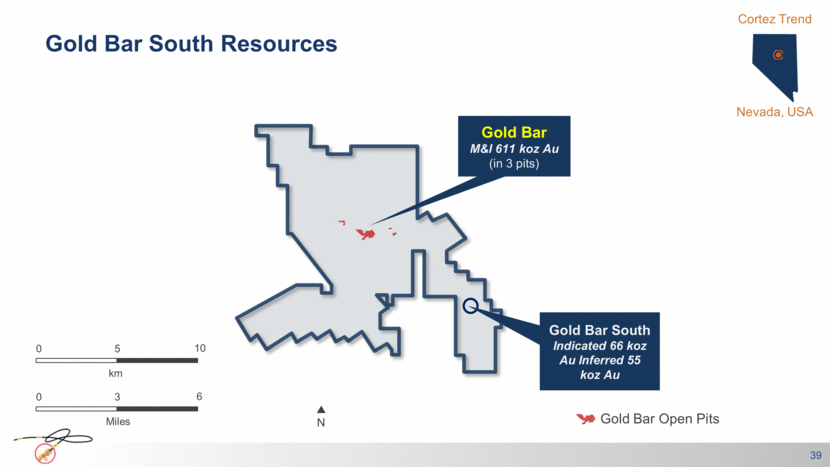
Gold Bar M&I 611 koz Au (in 3 pits) Gold Bar South Resources N 6 3 Miles 0 39 Cortez Trend Nevada, USA 10 5 km 0 Gold Bar Open Pits Gold Bar South Indicated 66 koz Au Inferred 55 koz Au
Gold Bar M&I 611 koz Au (in 3 pits) Gold Bar South Indicated 66 koz Au Inferred 55 koz Au 11 m @ 2.06 gpt 20 m @ 1.09 gpt 11m @ 1.03 gpt 34 m @ 2.16 gpt 20 m @ 1.44 gpt 14 m @ 0.95 gpt 17 m @ 1.58 gpt 20 m @ 0.84 gpt 14 m @ 0.9 gpt 12 m @ 0.96 gpt 8 m @ 1.28 gpt 24 m @ 0.89 gpt Gold Bar Exploration Potential N 6 3 Miles 0 Exploration Targets 40 Cortez Trend Nevada, USA 10 5 km 0 Gold Bar Open Pits
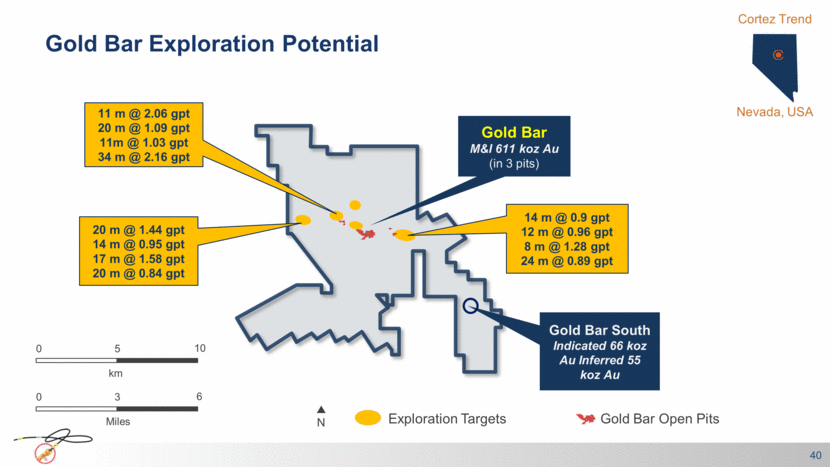
El Gallo Exploration (Mexico) Operation, development and exploration in a well-endowed district Exploration transiting from outcropping oxide to sulfides gold & polymetallic 41 Au Encuentro El Gallo Silver El Gallo Mine Mina Grande Intrusion 0 6 Miles
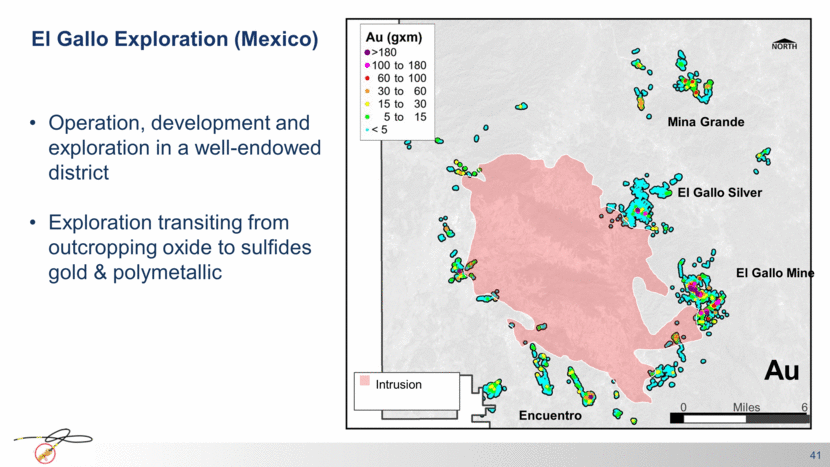
El Gallo Exploration (Mexico) Priority exploration areas: El Gallo Mine Trend Mina Grande Encuentro 42 Au Encuentro El Gallo Silver El Gallo Mine Mina Grande Intrusion Target Area 0 6 Miles
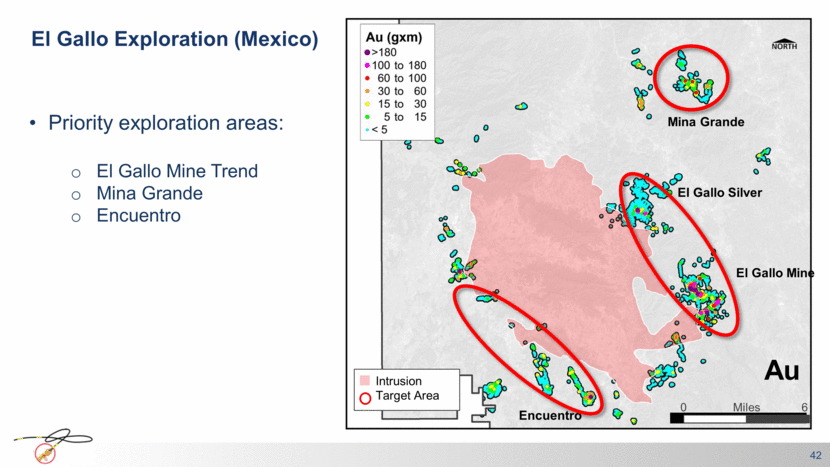
Exploration Potential El Gallo North Extension Potential 43 Section A – A’ Au Cu 13.9m @ 3.81g/t Au 39.5m @ 0.91% Cu Potential North Extension Open Pit A A’ Zones with Au Zones with Cu Zones with Zn Gold and copper mineralization extend north of the active open pit El Gallo Mine
Extensive areas of alteration and mineralization Drilling on extensions of open mineralization and over new targets Mina Grande Target Area -100m Section
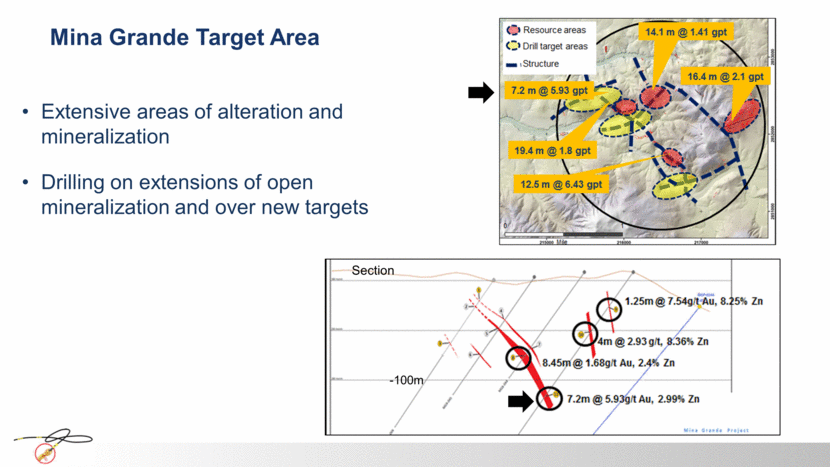
Drilling Highlights Davidson Tisdale 341.1 gpt Au / 3.4 m 197.3 gpt Au / 4.6 m 20.10 gpt Au / 23.1 m 121.2 gpt Au / 3.4 m Fuller Deposit 18.28 gpt Au / 7.9 m 5.76 gpt Au / 16.6 m 12.27 gpt Au / 3.7 m Buffalo Ankerite 13.63 gpt Au / 9.1 m 19.62 gpt Au / 6.3 m 3.88 gpt Au / 26.5 m Paymaster 30.99 gpt Au / 24.7 m 18.80 gpt Au / 8.0 m 5.25 gpt Au / 10.6 m DT F P BA McEwen McEwen / Goldcorp Goldcorp Tahoe Resources Gold Mine Goldcorp Tahoe Resources Gold District 70Moz Located in Timmins Excitement – Location & Grade 45 Timmins Canada A A` SECTION
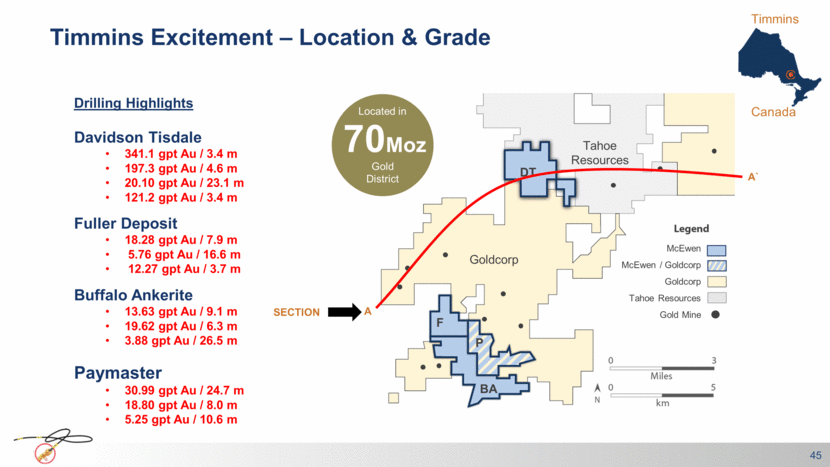
Timmins Historical Gold Production and Exploration Upside 46 Hollinger Davidson Tisdale Longitudinal section McIntyre Coniarum Broulan Reef Bonetal Mine Hallnor Mine Broulan Porcupine Pamour/ Hoyle McEwen Tahoe Goldcorp 38 M oz. Au Production 341.1 gpt Au / 3.4 m 197.3 gpt Au / 4.6 m 20.10 gpt Au / 23.1 m 121.2 gpt Au / 3.4 m Mined out McEwen Resource Exploration Potential A A`
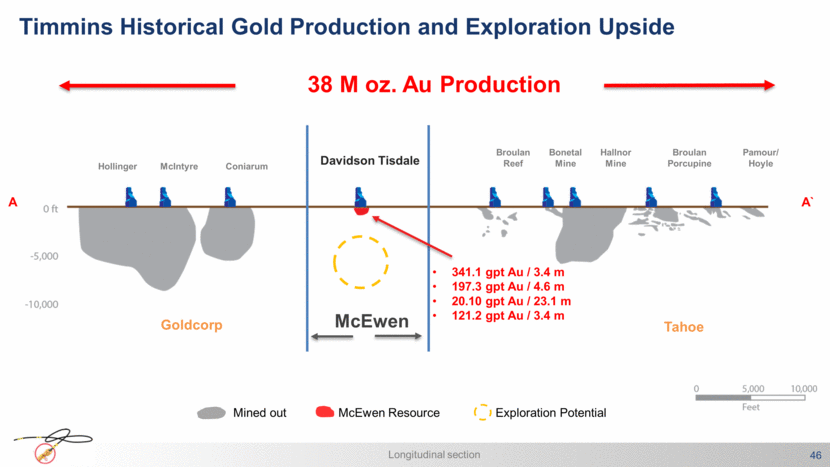
Drilling Highlights Davidson Tisdale 341.1 gpt Au / 3.4 m 197.3 gpt Au / 4.6 m 20.10 gpt Au / 23.1 m 121.2 gpt Au / 3.4 m Fuller Deposit 18.28 gpt Au / 7.9 m 5.76 gpt Au / 16.6 m 12.27 gpt Au / 3.7 m Buffalo Ankerite 13.63 gpt Au / 9.1 m 19.62 gpt Au / 6.3 m 3.88 gpt Au / 26.5 m Paymaster 30.99 gpt Au / 24.7 m 18.80 gpt Au / 8.0 m 5.25 gpt Au / 10.6 m DT F P BA McEwen McEwen / Goldcorp Goldcorp Tahoe Resources Gold Mine Goldcorp Tahoe Resources Gold District 70Moz Located in Timmins Excitement – Location & Grade 47 Timmins Canada B B` SECTION
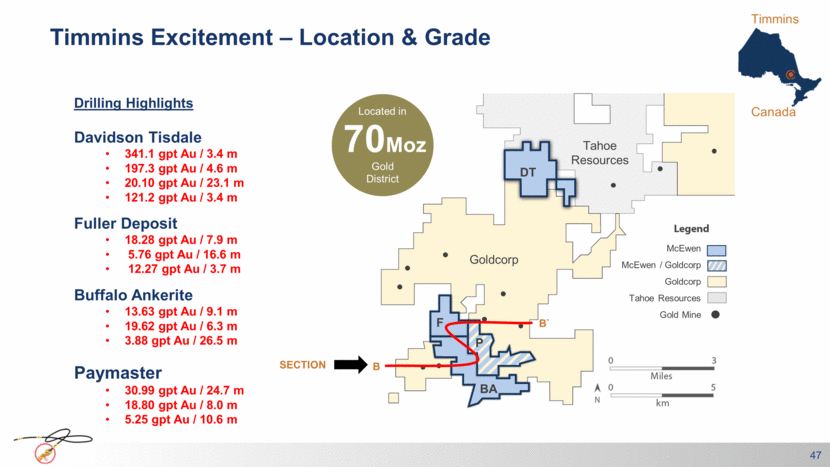
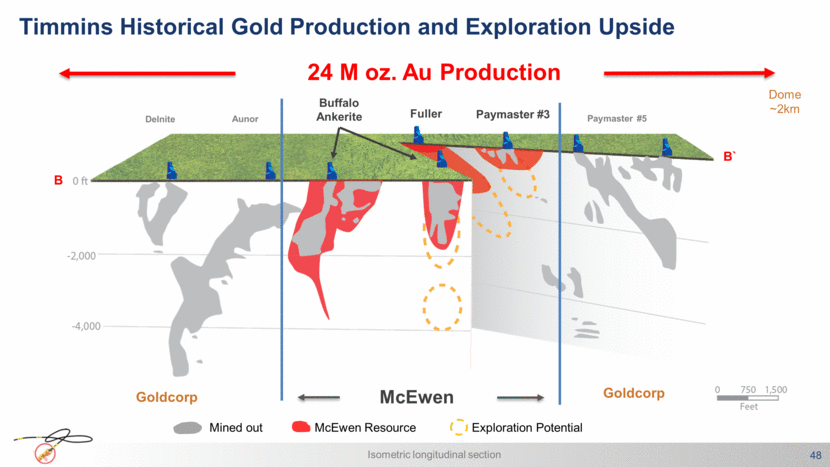
Timmins Historical Gold Production and Exploration Upside 48 Goldcorp McEwen Goldcorp Delnite Aunor Paymaster #5 Mined out McEwen Resource Buffalo Ankerite Fuller Exploration Potential Isometric longitudinal section Paymaster #3 B B` 24 M oz. Au Production Dome ~2km
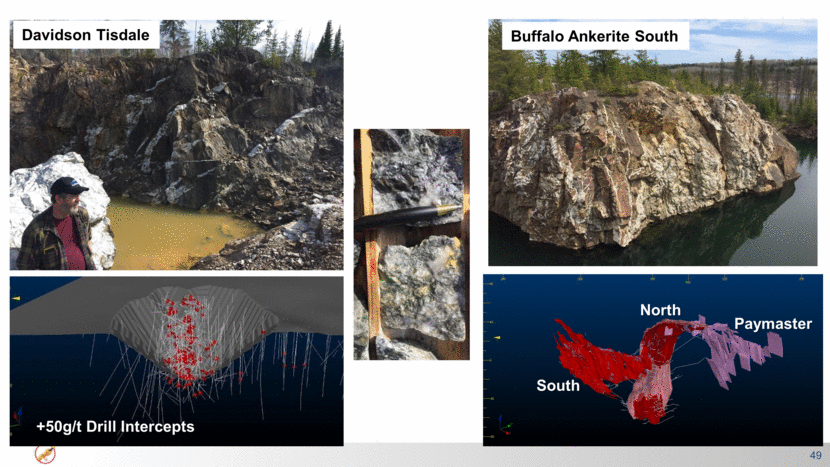
49 Buffalo Ankerite South Davidson Tisdale South North Paymaster +50g/t Drill Intercepts
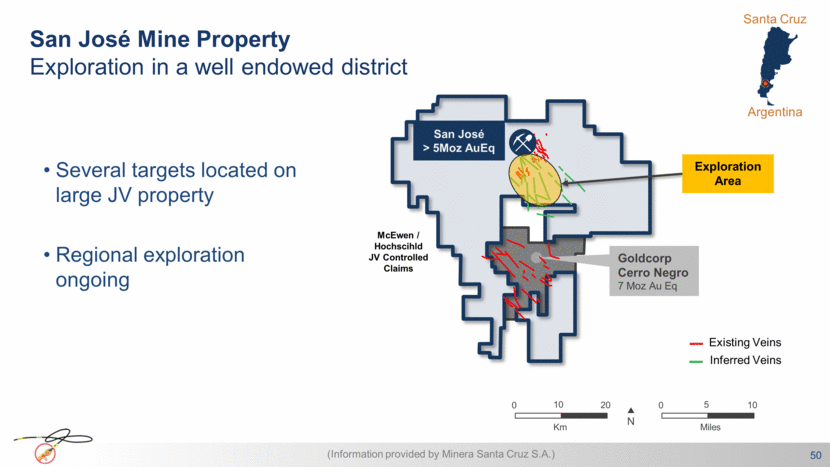
Several targets located on large JV property Regional exploration ongoing (Information provided by Minera Santa Cruz S.A.) San José Mine Property Exploration in a well endowed district 50 Exploration Area San José > 5Moz AuEq Goldcorp Cerro Negro 7 Moz Au Eq McEwen / Hochscihld JV Controlled Claims Existing Veins Inferred Veins Santa Cruz Argentina N 10 Km 0 20 5 Miles 0 10
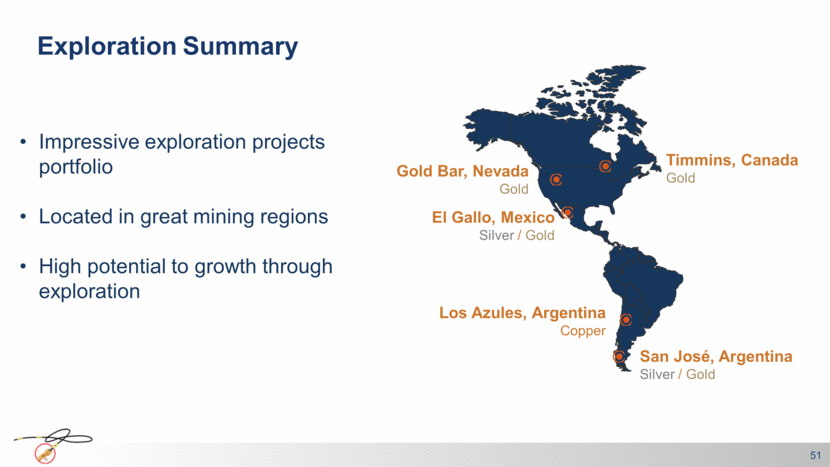
Exploration Summary Impressive exploration projects portfolio Located in great mining regions High potential to growth through exploration 51 San José, Argentina Silver / Gold Los Azules, Argentina Copper El Gallo, Mexico Silver / Gold Gold Bar, Nevada Gold Timmins, Canada Gold
Innovation Thought Leaders Lunch & Learn Series – 26 Videos to Date 52 https://youtu.be/cViAvqL0fRQ?list=PLQkfA4AvQBYOPauF7yCZjXlZtGBp8qZFC McEwen Mining YouTube link Elizabeth Edwards on microbial diversity Ending hearing loss at work Sensor based ore sorting Algae based water treatment for the mining sector

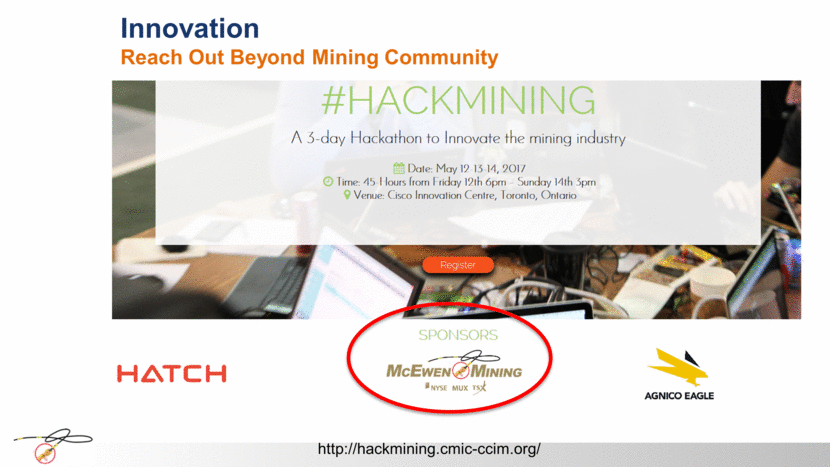
http://hackmining.cmic-ccim.org/ Innovation Reach Out Beyond Mining Community
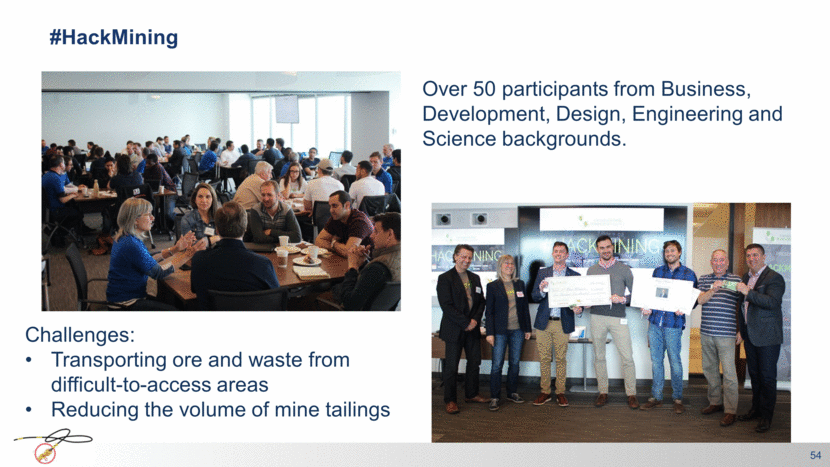
#HackMining 54 Over 50 participants from Business, Development, Design, Engineering and Science backgrounds. Challenges: Transporting ore and waste from difficult-to-access areas Reducing the volume of mine tailings
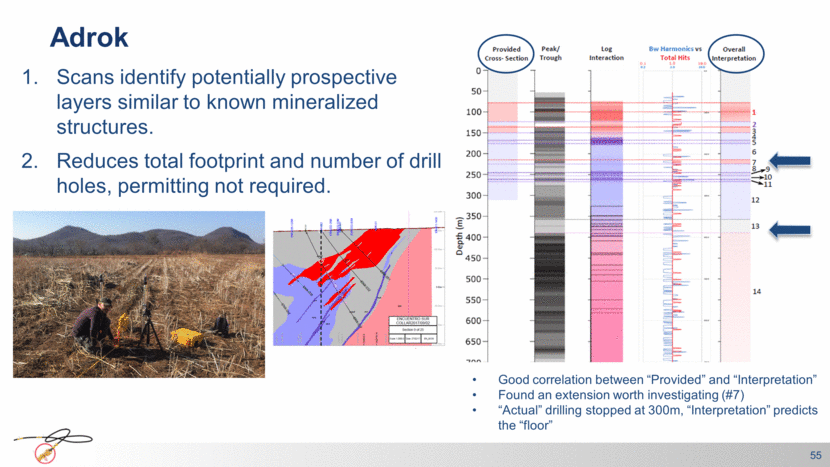
Adrok Scans identify potentially prospective layers similar to known mineralized structures. Reduces total footprint and number of drill holes, permitting not required. 55 Good correlation between “Provided” and “Interpretation” Found an extension worth investigating (#7) “Actual” drilling stopped at 300m, “Interpretation” predicts the “floor”
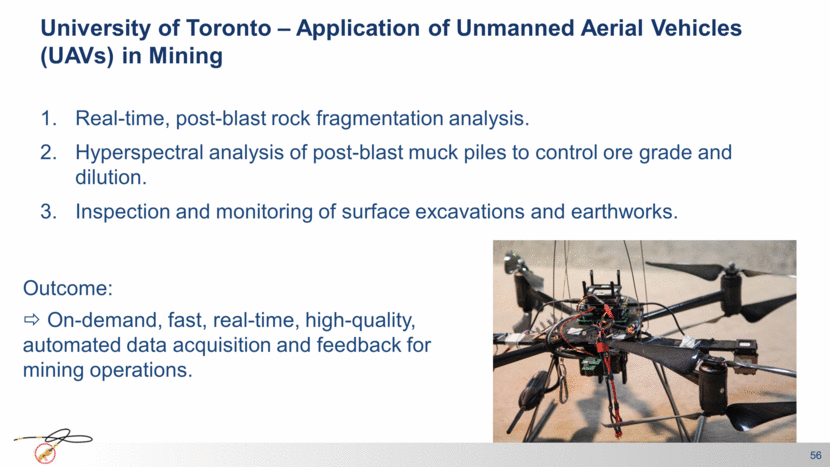
56 University of Toronto – Application of Unmanned Aerial Vehicles (UAVs) in Mining Real-time, post-blast rock fragmentation analysis. Hyperspectral analysis of post-blast muck piles to control ore grade and dilution. Inspection and monitoring of surface excavations and earthworks. 56 Outcome: On-demand, fast, real-time, high-quality, automated data acquisition and feedback for mining operations.
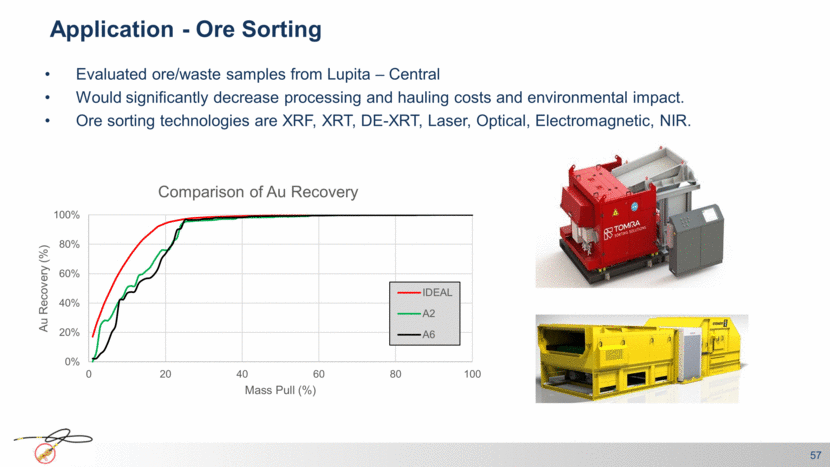
Application - Ore Sorting 57 Evaluated ore/waste samples from Lupita – Central Would significantly decrease processing and hauling costs and environmental impact. Ore sorting technologies are XRF, XRT, DE-XRT, Laser, Optical, Electromagnetic, NIR. 0% 20% 40% 60% 80% 100% 0 20 40 60 80 100 Au Recovery (%) Mass Pull (%) Comparison of Au Recovery IDEAL A2 A6
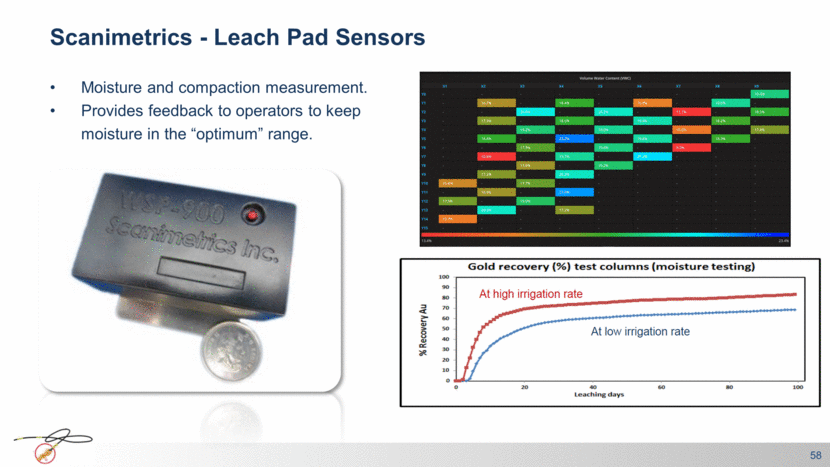
Scanimetrics - Leach Pad Sensors 58 Moisture and compaction measurement. Provides feedback to operators to keep moisture in the “optimum” range.
Innovation = need + idea + implementation 59 More reliable operations More ounces Lower costs Environmental considerations Partner of choice
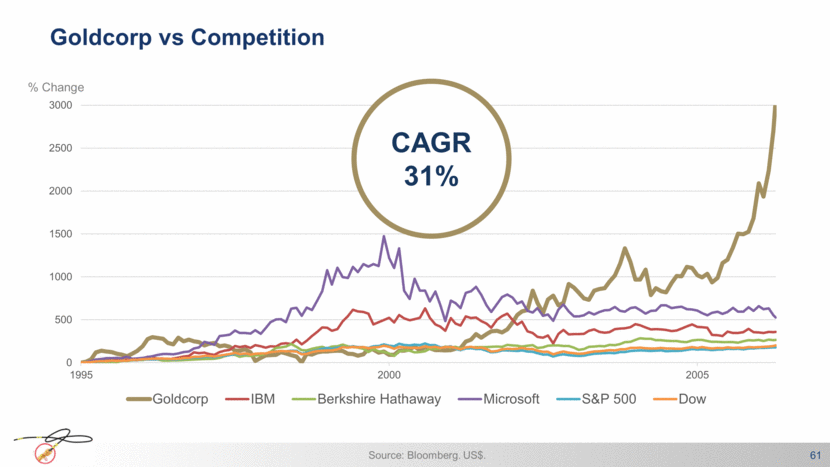
Goldcorp vs Peers 60 % Change CAGR 31% Source: Bloomberg. US$.
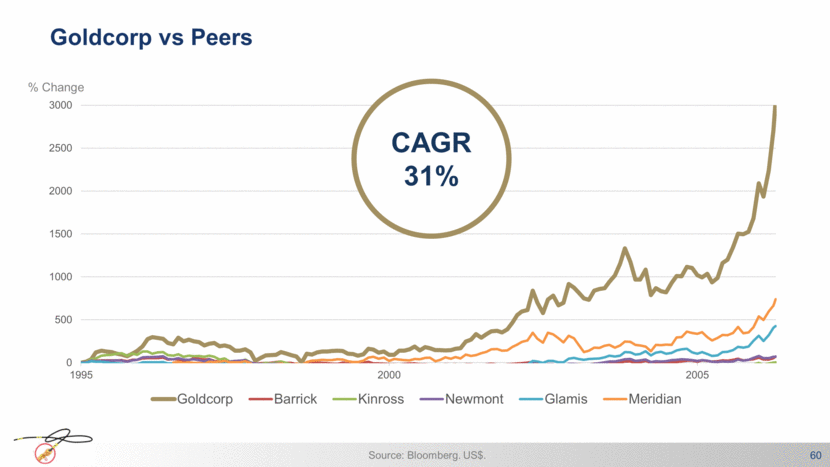
Goldcorp vs Competition 61 CAGR 31% % Change Source: Bloomberg. US$.
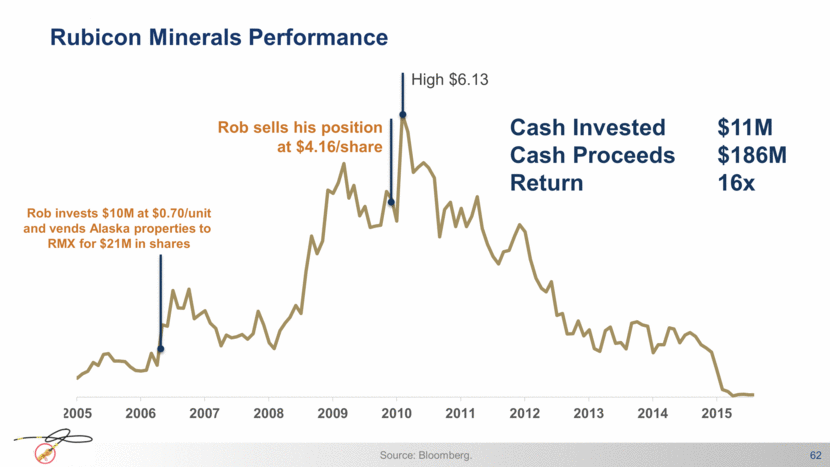
Rubicon Minerals Performance 62 Rob invests $10M at $0.70/unit and vends Alaska properties to RMX for $21M in shares Rob sells his position at $4.16/share Source: Bloomberg. Cash Invested $11M Cash Proceeds $186M Return 16x High $6.13 2005 2006 2007 2008 2009 2010 2011 2012 2013 2014 2015
63
Comments on 64 Gold Silver Copper US Dollar
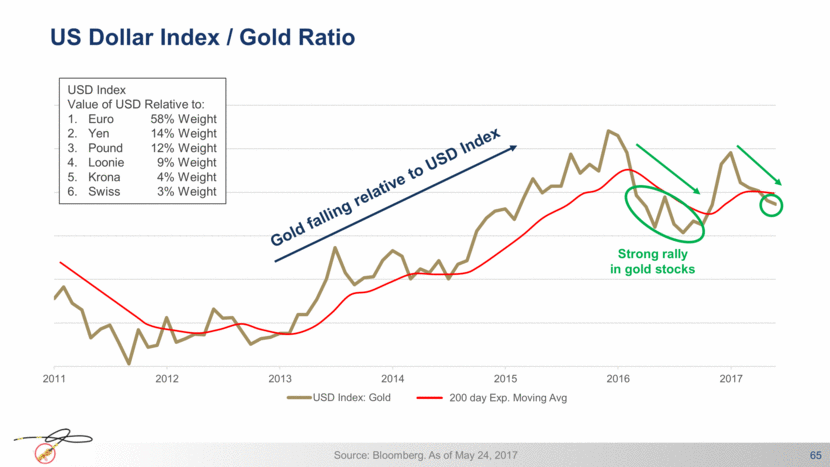
US Dollar Index / Gold Ratio 65 USD Index Value of USD Relative to: Euro 58% Weight Yen 14% Weight Pound 12% Weight Loonie 9% Weight Krona 4% Weight Swiss 3% Weight Gold falling relative to USD Index 200 day Exp. Moving Avg Strong rally in gold stocks Source: Bloomberg. As of May 24, 2017
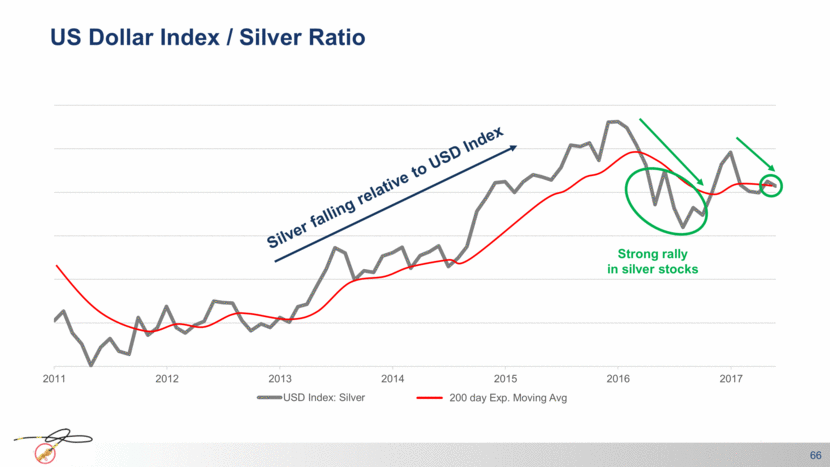
US Dollar Index / Silver Ratio 66 200 day Exp. Moving Avg Silver falling relative to USD Index Strong rally in silver stocks
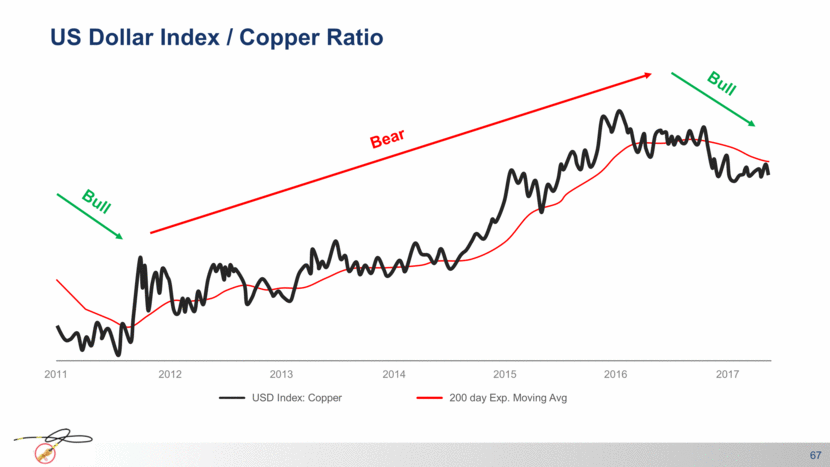
US Dollar Index / Copper Ratio 67 200 day Exp. Moving Avg 2011 2012 2013 2014 2015 2016 2017 Z USD Index: Copper Bull Bull Bear
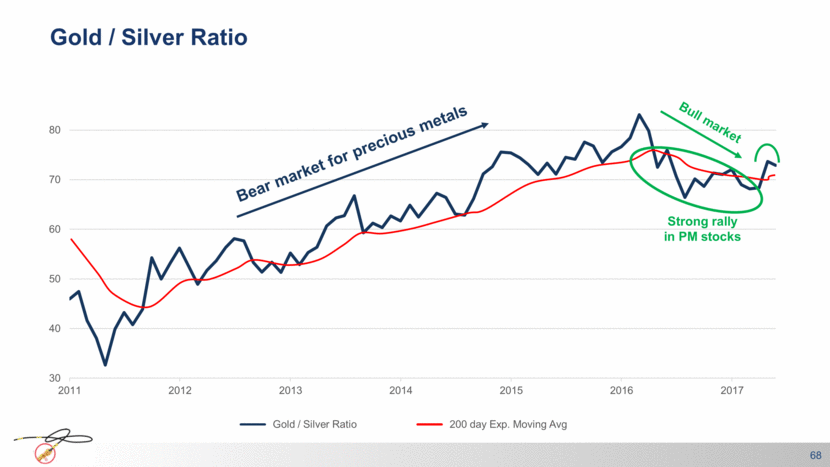
Gold / Silver Ratio 68 200 day Exp. Moving Avg Gold / Silver Ratio Bear market for precious metals Strong rally in PM stocks Bull market
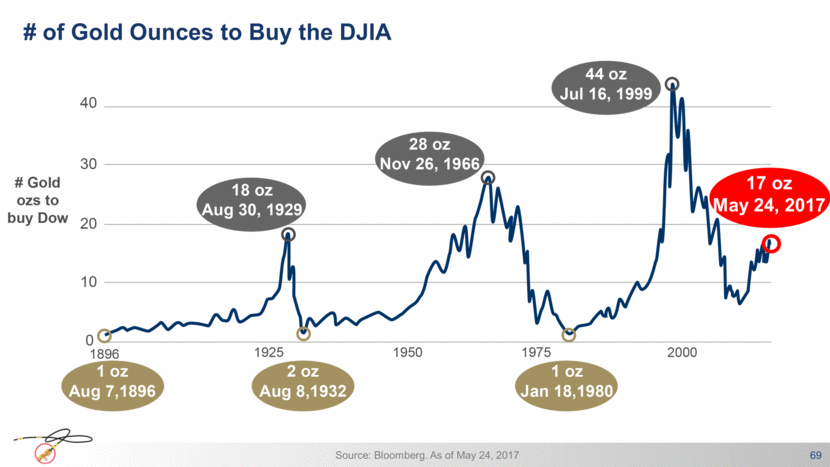
69 # of Gold Ounces to Buy the DJIA Source: Bloomberg. As of May 24, 2017 17 oz May 24, 2017
70 Student Loan $1T Food Stamps Federal Debt $20T Money Printing $4T Home Ownership Velocity of M2 Money Supply One Example of The Developed World’s Attempt to Get the Economy Moving THE IMPACT As of April 27, 2017 Source: Federal Reserve Bank of St. Louis. As of Mar 31, 2017 As of Mar 9, 2017 As of April 27, 2017 As of Aug 5, 2016 As of April 28, 2017

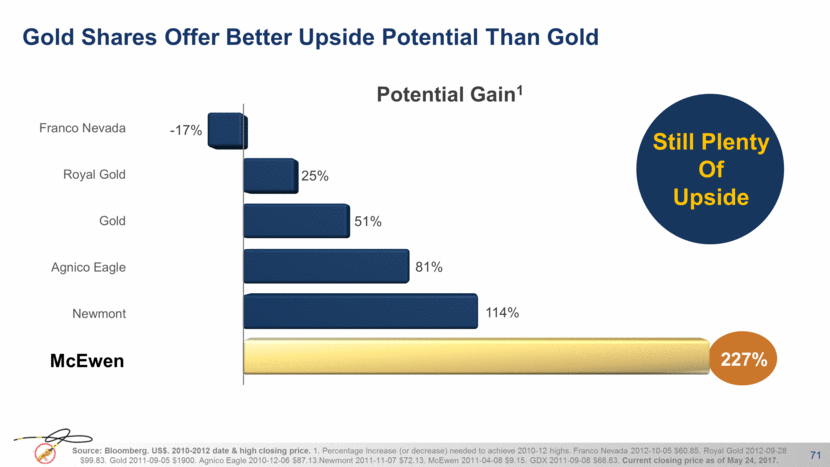
Gold Shares Offer Better Upside Potential Than Gold 71 Source: Bloomberg. US$. 2010-2012 date & high closing price. 1. Percentage Increase (or decrease) needed to achieve 2010-12 highs. Franco Nevada 2012-10-05 $60.85. Royal Gold 2012-09-28 $99.83. Gold 2011-09-05 $1900. Agnico Eagle 2010-12-06 $87.13.Newmont 2011-11-07 $72.13. McEwen 2011-04-08 $9.15. GDX 2011-09-08 $66.63. Current closing price as of May 24, 2017. McEwen Potential Gain1 Still Plenty Of Upside McEwen Newmont Agnico Eagle Gold Royal Gold Franco Nevada 227% 114% 81% 51% 25% - 17%
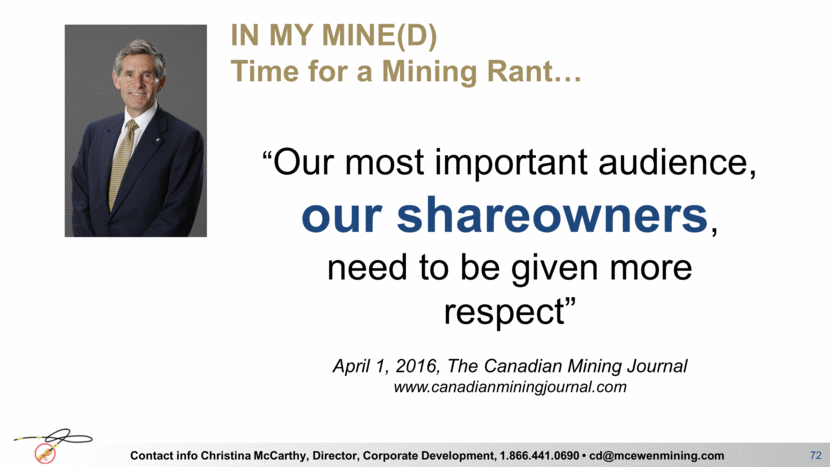
IN MY MINE(D) Time for a Mining Rant 72 “Our most important audience, our shareowners, need to be given more respect” April 1, 2016, The Canadian Mining Journal www.canadianminingjournal.com Contact info Christina McCarthy, Director, Corporate Development, 1.866.441.0690 • cd@mcewenmining.com
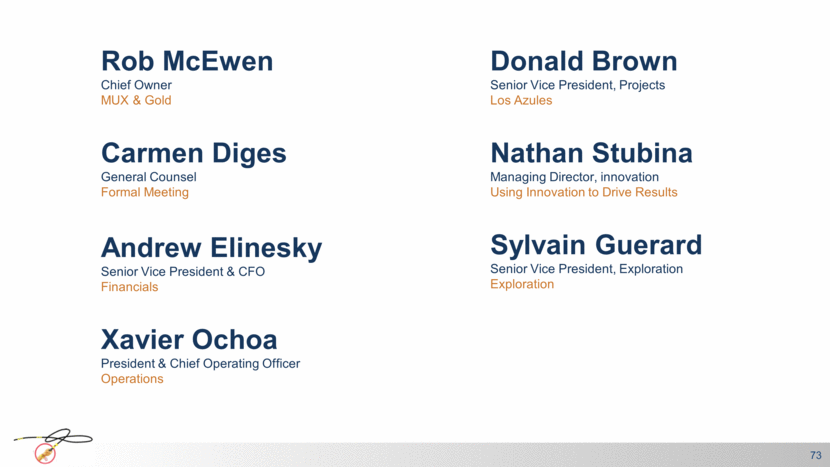
73 Carmen Diges General Counsel Formal Meeting Rob McEwen Chief Owner MUX & Gold Donald Brown Senior Vice President, Projects Los Azules Andrew Elinesky Senior Vice President & CFO Financials Xavier Ochoa President & Chief Operating Officer Operations Nathan Stubina Managing Director, innovation Using Innovation to Drive Results Sylvain Guerard Senior Vice President, Exploration Exploration
Timmins NI 43-101 Resource Estimates Note on Resources Projects: BA - Buffalo Ankerite, DT - Davidson Tisdale (M - Main Zone, S - S Zone), F - Fuller, P - Paymaster. The resources are net to Lexam, calculated at ownership interests: 100% for BA, DT, F and 60% for P. Cut-Offs: Open Pit - 0.51 gpt (BA, P, F), 0.5 gpt (DTM); Underground - 2.57 Au (BA, P, F), 2.6 gpt Au (DTM), 2.0 gpt (DTS). The resource estimates are presented in: "Technical Report and Updated Resource Estimate on the Buffalo Ankerite, Fuller, Paymaster and Davidson Tisdale Gold Deposits” dated June 21, 2013 for BA, P, F, DTM (at US$1,600/oz Au price, US$:C$ exchange rate 1:1) and "Davidson Tisdale Gold Property, Timmins, Ontario Technical Report" dated November, 2003 for DTS. 74 Open Pit Resources Underground Resources Tonnage (Mt) Grade (gpt) Gold (oz) Tonnage (Mt) Grade (gpt) Gold (oz) Measured DTM 0.45 2.44 35,500 DTM 0.02 6.64 3,800 DTS 0.34 5.50 59,800 Indicated BA 3.82 2.37 292,800 BA 3.27 4.76 500,200 P 2.80 1.61 145,000 F 0.33 5.76 61,000 F 5.33 1.68 290,000 DTM 0.04 4.91 6,500 DTM 0.17 2.43 13,500 DTS 0.42 4.52 60,400 Total Measured + Indicated 12.57 1.91 776,800 4.41 4.88 691,700 Inferred BA 2.81 4.05 367,100 BA 2.74 2.31 203,400 P 0.13 6.14 26,000 P 0.84 1.61 43,000 F 0.84 4.97 135,000 F 2.70 1.30 112,000 DTM 0.07 4.20 9,600 DTS 0.39 4.68 58,200 Total Inferred 6.28 1.79 358,400 4.24 4.35 595,800 Total Measured + Indicated (Open Pit and Underground) 1,468,500 Total Inferred (Open Pit and Underground) 954,200 Appendix:
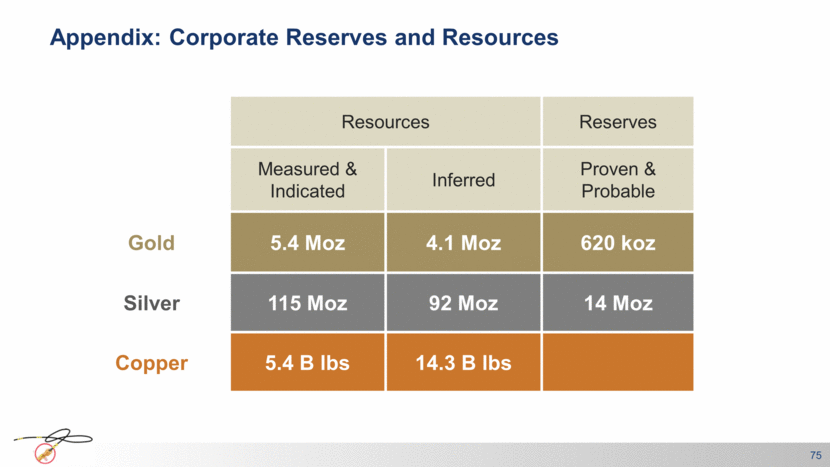
Appendix: Corporate Reserves and Resources 75 Resources Reserves Measured & Indicated Inferred Proven & Probable Gold 5.4 Moz 4.1 Moz 620 koz Silver 115 Moz 92 Moz 14 Moz Copper 5.4 B lbs 14.3 B lbs
