Attached files
| file | filename |
|---|---|
| EX-32.02 - EXHIBIT 32.02 - NortonLifeLock Inc. | a33117exhibit3202.htm |
| EX-32.01 - EXHIBIT 32.01 - NortonLifeLock Inc. | a33117exhibit3201.htm |
| EX-31.02 - EXHIBIT 31.02 - NortonLifeLock Inc. | a33117exhibit3102.htm |
| EX-31.01 - EXHIBIT 31.01 - NortonLifeLock Inc. | a33117exhibit3101.htm |
| EX-23.01 - EXHIBIT 23.01 - NortonLifeLock Inc. | a33117exhibit2301.htm |
| EX-21.01 - EXHIBIT 21.01 - NortonLifeLock Inc. | a33117exhibit2101.htm |
| EX-3.05 - EXHIBIT 3.05 - NortonLifeLock Inc. | a33117exhibit305arbylaws.htm |
UNITED STATES SECURITIES AND EXCHANGE COMMISSION
Washington, D.C. 20549
Form 10-K
(Mark One)
þ | ANNUAL REPORT PURSUANT TO SECTION 13 OR 15(d) OF THE SECURITIES EXCHANGE ACT OF 1934 |
For the Fiscal Year Ended March 31, 2017
or
o | TRANSITION REPORT PURSUANT TO SECTION 13 OR 15(d) OF THE SECURITIES EXCHANGE ACT OF 1934 |
For the Transition Period from to
Commission File Number 000-17781
Symantec Corporation
(Exact name of the registrant as specified in its charter)
Delaware | 77-0181864 | |
(State or other jurisdiction of incorporation or organization) | (I.R.S. employer Identification no.) | |
350 Ellis Street | ||
Mountain View, California | 94043 | |
(Address of principal executive offices) | (zip code) | |
Registrant’s telephone number, including area code:
(650) 527-8000
Securities registered pursuant to Section 12(b) of the Act:
Common Stock, par value $0.01 per share (Title of each class) | The NASDAQ Stock Market LLC (Name of each exchange on which registered) | |
Securities registered pursuant to Section 12(g) of the Act:
None
(Title of class)
Indicate by check mark if the registrant is a well-known seasoned issuer, as defined in Rule 405 of the Securities Act. Yes þ No o
Indicate by check mark if the registrant is not required to file reports pursuant to Section 13 or 15(d) of the Exchange Act. Yes o No þ
Indicate by check mark whether the registrant (1) has filed all reports required to be filed by Section 13 or 15(d) of the Securities Exchange Act of 1934 during the preceding 12 months (or for such shorter period that the registrant was required to file such reports), and (2) has been subject to such filing requirements for the past 90 days. Yes þ No o
Indicate by check mark whether the registrant has submitted electronically and posted on its corporate Web site, if any, every Interactive Data File required to be submitted and posted pursuant to Rule 405 of Regulation S-T (§ 232.405 of this chapter) during the preceding 12 months (or for such shorter period that the registrant was required to submit and post such files). Yes þ No o
Indicate by check mark if disclosure of delinquent filers pursuant to Item 405 of Regulation S-K is not contained herein, and will not be contained, to the best of registrant’s knowledge, in definitive proxy or information statements incorporated by reference in Part III of this Form 10-K or any amendment to this Form 10-K. þ
Indicate by check mark whether the registrant is a large accelerated filer, an accelerated filer, a non-accelerated filer, a smaller reporting company, or an emerging growth company. See the definitions of “large accelerated filer,” “accelerated filer”, “smaller reporting company,” and “emerging growth company” in Rule 12b-2 of the Exchange Act. (Check one):
Large accelerated filer þ | Accelerated filer o | Non-accelerated filer o | Smaller reporting company o | |||
(Do not check if a smaller reporting company) | Emerging growth company o | |||||
If an emerging growth company, indicate by check mark if the registrant has elected not to use the extended transition period for complying with any new or revised financial accounting standards provided pursuant to Section 13(a) of the Exchange Act. o | ||||||
Indicate by check mark whether the registrant is a shell company (as defined in Rule 12b-2 of the Exchange Act). Yes o No þ
Aggregate market value of the voting stock held by non-affiliates of the registrant, based upon the closing sale price of Symantec common stock on September 30, 2016 as reported on the NASDAQ Global Select Market: $15,559,432,822.
Number of shares outstanding of the registrant’s common stock as of April 28, 2017: 608,240,301
DOCUMENTS INCORPORATED BY REFERENCE
Portions of the registrant’s definitive Proxy Statement for the 2017 Annual Meeting of Stockholders are incorporated herein by reference into Part III of this Annual Report on Form 10-K where indicated. Such proxy statement will be filed with the Securities and Exchange Commission within 120 days of the registrant’s fiscal year ended March 31, 2017.
SYMANTEC CORPORATION
FORM 10-K
For the Fiscal Year Ended March 31, 2017
TABLE OF CONTENTS
Page | ||
PART I | ||
Item 1. | ||
Item 1A. | ||
Item 1B. | ||
Item 2. | ||
Item 3. | ||
Item 4. | ||
PART II | ||
Item 5. | ||
Item 6. | ||
Item 7. | ||
Item 7A. | ||
Item 8. | ||
Item 9. | ||
Item 9A. | ||
Item 9B. | ||
PART III | ||
Item 10. | ||
Item 11. | ||
Item 12. | ||
Item 13. | ||
Item 14. | ||
PART IV | ||
Item 15. | ||
“Symantec,” “we,” “us,” “our,” and “the Company” refer to Symantec Corporation and all of its subsidiaries. Symantec, the Symantec Logo and Norton are trademarks or registered trademarks of Symantec in the United States (“U.S.”) and other countries. Other names may be trademarks of their respective owners.
2
FORWARD-LOOKING STATEMENTS AND FACTORS THAT MAY AFFECT FUTURE RESULTS
The discussion below contains forward-looking statements, which are subject to safe harbors under the Securities Act of 1933, as amended (the “Securities Act”) and the Exchange Act of 1934, as amended (the “Exchange Act”). Forward-looking statements include references to our ability to utilize our deferred tax assets, as well as statements including words such as “expects,” “plans,” “anticipates,” “believes,” “estimates,” “predicts,” “projects,” and similar expressions. In addition, projections of our future financial performance, anticipated growth and trends in our businesses and in our industries, the anticipated impacts of acquisitions, and of our restructurings, our intent to pay quarterly cash dividends in the future, the actions we intend to take as part of our new strategy, the expected impact of our new strategy and other characterizations of future events or circumstances are forward-looking statements. These statements are only predictions, based on our current expectations about future events and may not prove to be accurate. We do not undertake any obligation to update these forward-looking statements to reflect events occurring or circumstances arising after the date of this report. These forward-looking statements involve risks and uncertainties, and our actual results, performance, or achievements could differ materially from those expressed or implied by the forward-looking statements on the basis of several factors.
These and other risks are described under Item 1A, Risk Factors. We encourage you to read that section carefully.
3
PART I
Item 1. Business
Overview
Symantec Corporation is a global leader in cybersecurity. We operate our business on a global civilian cyber intelligence threat network that tracks a vast number of threats across the Internet from hundreds of millions of mobile devices, endpoints, and servers across the globe. We believe one of our competitive advantages is our database of threat indicators. This database allows us to reduce the number of false positives and provide faster and better protection for customers through our products. We are leveraging our capabilities to deliver integrated platforms for customers. We are also pioneering solutions in markets such as cloud security, digital safety, advanced threat protection, identity protection, information protection and cyber security services.
Founded in 1982, Symantec has operations in more than 40 countries. Our principal executive offices are located at 350 Ellis Street, Mountain View, California, 94043. Our Internet home page is located at www.symantec.com.
Strategy
Our strategy is to deliver comprehensive cyber security platforms for both enterprises and consumers.
Our enterprise security strategy is to deliver an Integrated Cyber Defense Platform that allows Symantec products to share threat intelligence and improve security outcomes for customers across all control points. Symantec is the leading vendor in protecting users, information, web and messaging across an integrated platform.
Our consumer digital safety strategy is to deliver the most comprehensive consumer digital safety solutions to help people protect their information, identities, devices and families.
Following the completion of the sale of our former information management business (“Veritas”) in the fourth quarter of fiscal 2016, we completed the acquisitions of Blue Coat, Inc. (“Blue Coat”) and LifeLock, Inc. (“LifeLock”) in fiscal 2017 in order to expand our offerings in both our operating segments, as described below.
Business highlights
During fiscal 2017, we took the following actions in support of our business:
• | With the divestiture of Veritas completed, we refocused Symantec as a pure cybersecurity company. In the second fiscal quarter, we completed the acquisition of Blue Coat, a provider of advanced web and cloud security solutions for global enterprises and governments, to complement our Enterprise Security offerings. The aggregate purchase price of the Blue Coat acquisition was $4.7 billion in net consideration, of which $4.5 billion consisted of cash consideration including the repayment of approximately $1.9 billion in Blue Coat’s debt. Following the closing of the Blue Coat acquisition, we appointed Blue Coat’s Chief Executive Officer as our Chief Executive Officer and Blue Coat’s President and Chief Operating Officer as our President and Chief Operating Officer, respectively, in the second quarter of fiscal 2017. In addition, we appointed Blue Coat’s Chief Financial Officer to the position of our Executive Vice President and Chief Financial Officer in the third quarter of fiscal 2017. |
• | In the fourth fiscal quarter, we completed the acquisition of LifeLock, a provider of proactive identity theft protection services for consumers and consumer risk management services for enterprises, for approximately $2.3 billion in net consideration. |
• | We increased the size of our Board of Directors and appointed representatives of Silver Lake Partners and Bain Capital to our Board of Directors. |
▪ | We released new products and services: |
◦ | We launched Symantec Endpoint Protection 14, a solution that fuses endpoint technologies with advanced machine learning and memory exploit mitigation in a single agent, delivering a multi-layered solution designed to stop a wide variety of advanced threats and respond at the endpoint. |
◦ | We introduced Symantec Endpoint Protection Cloud, a new solution for small and mid-sized businesses (SMBs) designed to protect them from targeted attacks and ransomware. Symantec Endpoint Protection Cloud is for organizations with fewer than 1,000 employees that are looking for an effective way to protect corporate and personal devices on the corporate network. |
◦ | We announced Cloud Workload Protection, a solution designed to deliver automated security policy enforcement and protect applications from unknown exploits inside of both Amazon Web Service and Microsoft Azure. Cloud Workload Protection automates security for public cloud workloads delivering metered usage billing, rapid workload discovery, increased visibility and elastic protection to help ensure safe cloud workload adoption. |
▪ | We integrated Blue Coat and Symantec products: |
◦ | We announced the integration of Symantec Data Loss Prevention (“DLP”) with Symantec CloudSOC (formerly Blue Coat’s Elastica CloudSOC Cloud Access Security Broker) and Cloud Data Protection products to address the needs of the cloud generation. This integrated solution provides visibility and control over all sensitive |
4
content that users upload, store and share via the cloud, protecting confidential information through the stages of its lifecycle.
◦ | We integrated our Symantec DLP with our cloud-delivered Web Security Service, providing a seamless platform to help ensure a safe web experience and protect organizational data. |
◦ | We combined Symantec and Blue Coat’s security telemetry which has led to a series of significant protection improvements as well as discoveries of new attack campaigns. |
• | Symantec’s Board of Directors increased the company’s share repurchase authorization by $510 million. In the fourth fiscal quarter, Symantec entered into accelerated stock repurchase agreements to repurchase an aggregate of $500 million of the company’s common stock. |
Operating segments, products and services
Our operating segments are significant strategic business units that offer different products and services distinguished by customer needs. Our operating segments are: Consumer Digital Safety and Enterprise Security.
Consumer Digital Safety
Our Consumer Digital Safety segment focuses on providing a comprehensive Digital Safety solution to protect information, devices, networks and the identities of consumers. This solution includes our Norton-branded services, which provide multi-layer security across major desktop and mobile operating systems, public Wi-Fi connections, and home networks, to defend against increasingly complex online threats to individuals, families and small businesses, and our LifeLock-branded identity protection services. Our LifeLock-branded identity protection services primarily consist of identifying and notifying users of identity-related and other events and assisting users in remediating their impact. With the addition of LifeLock-branded identity protection services, we are providing a comprehensive digital safety platform designed to protect information across devices, customer identities and the connected home and family and accelerating our leadership in Consumer Digital Safety to protect all aspects of consumers’ digital lives.
Enterprise Security
Our Enterprise Security segment protects organizations so they can securely conduct business while leveraging new platforms and data. Our Enterprise Security segment includes our endpoint protection products, endpoint management, messaging protection products, information protection products, cyber security services, website security and advanced web and cloud security offerings. Our enterprise endpoint and network security and management offerings support evolving endpoints and networks, providing advanced threat protection while helping reduce cost and complexity. These solutions are delivered through various methods, such as software, appliance, Software-as-a-Service (“SaaS”) and managed services.
The addition of Blue Coat’s suite of network and cloud security products to our innovative Enterprise Security product portfolio has enhanced our threat protection and information protection products while providing us with complementary products, such as advanced web and cloud security solutions, that address the network and cloud security needs of enterprises. This augmentation of our product portfolio, together with the integration of Blue Coat’s large threat database with our global civilian cyber intelligence threat network, allows us to provide an integrated cyber defense platform, addressing both endpoint and network security, and offer differentiated security solutions. It also positions us well to introduce new cybersecurity solutions that address the ever-evolving threat landscape, the changes introduced by the shift to mobile and cloud along with the adoption of Internet of Things (IoT) devices. Our enhanced portfolio also positions us well to address the challenges created by regulatory and privacy concerns.
Financial information by segment and geographic region
For information regarding our revenue by segment, revenue by geographical area, and property and equipment by geographical area, see Note 2 to the Consolidated Financial Statements in this annual report. For information regarding the amount and percentage of our revenue contributed by each of our segments and our financial information, including information about geographic areas in which we operate, see Item 7, Management’s Discussion and Analysis of Financial Condition and Results of Operations. For information regarding risks associated with our international operations, see Item 1A, Risk Factors.
Sales and go-to-market strategy
Our go-to-market network includes direct sales forces and broad e-commerce capabilities, as well as indirect sales resources that support our global partner ecosystem. We also maintain strategic relationships with a number of original equipment manufacturers (“OEMs”), Internet service providers (“ISPs”), wireless carriers, and retail and online stores through which we market and sell our products.
Consumer
We sell and market our consumer products and services to individuals, households and small businesses globally. We bring these products to market through direct marketing and co-marketing programs supported by our e-commerce and telesales platforms. In addition, we utilize Internet-based resellers, system builders, ISPs, employee benefits providers, wireless carriers, retailers, and OEMs to distribute our offerings worldwide.
5
Commercial
We sell and market our products and related services to small, medium and large customers through field sales and inside sales forces that leverage indirect sales partners around the world that are specifically trained and certified to sell our solutions. These partners include national solution providers, regional solution providers, national account resellers, global/federal system integrators and managed service providers. Our products and services are also available on our e-commerce platform, as well as through authorized distributors and OEMs, which incorporate our technologies into their products, bundle our products with their offerings, or serve as authorized resellers of our products.
Enterprise
We sell and market our products and related services to large enterprises, including government and public sector customers, through our field sales force. This field sales team is responsible for leveraging our global partner ecosystem primarily targeting senior executives and IT department personnel responsible for managing a company’s highest-order IT initiatives.
Research and development
Symantec embraces a global research and development strategy to drive organic innovation. Our engineers and researchers are focused on delivering new versions of existing product lines as well as developing entirely new offerings to drive the company’s leadership in cybersecurity. We also have a technology research organization focused on short, medium, and longer-term applied research projects, with the goal of transferring completed innovations into our product groups for commercialization.
Symantec’s Security Technology and Response organization consists of a global team of security engineers, threat analysts, and researchers that provide the underlying functionality, content, and support for many of our consumer, commercial and enterprise security products. Our security experts analyze threat telemetry collected through our vast cyber intelligence networks to protect our customers against current and emerging threats. Our research and development teams also leverage this vast amount of data and related insights to develop new technologies and approaches, including our Unified Security analytics platform, in order to improve security outcomes for our customers.
Research and development expenses were $823 million, $748 million, and $812 million in fiscal 2017, 2016, and 2015, respectively, representing approximately 20%, 21% and 21% of revenue in fiscal 2017, 2016 and 2015, respectively. The percentage fluctuates between periods as a result of a variety of factors, including changes in sales level and foreign currency exchange rates. We believe that technical leadership is essential to our success, and we expect to continue to commit substantial resources to research and development.
Support
Symantec has support facilities throughout the world, staffed by technical product experts knowledgeable in the operating environments in which our products are deployed. Our technical support experts assist customers with issue resolution and threat detection.
Our consumer support program provides self-help online services and phone, chat, and email support to consumers worldwide. Most of our Norton Security products come with automatic downloads of the latest virus definitions, application bug fixes, and patches, as well as a “Virus Protection Promise,” which in some markets provides free virus removal services to customers whose protected computers become infected. Our LifeLock offerings come with support 24x7x365 and remediation services during normal business hours.
We provide customers various levels of enterprise support offerings. Our enterprise security support program offers annual maintenance support contracts, including content, upgrades, and technical support. Our standard technical support includes: self-service options delivered by telephone or electronically during the contracted-for hours, immediate patches for severe problems, periodic software updates, and access to our technical knowledge base and frequently asked questions.
Significant customers
In each of fiscal 2017, 2016 and 2015, no customer accounted for more than 10% of our total net revenues. Two distributors and one distributor accounted for more than 10% of our gross accounts receivable as of March 31, 2017 and April 1, 2016, respectively.
Acquisitions
Our strategy will be complemented by business combinations that fit strategically and meet specific profitability hurdles. Our acquisitions are designed to enhance the features and functionality of our existing products and extend our product leadership in core markets. We consider time-to-market, synergies with existing products, and potential market share gains when evaluating the economics of acquisitions of technologies, product lines, or companies. We may acquire or dispose of other technologies, products, and companies in the future. See Note 6 to the Consolidated Financial Statements for information regarding our acquisitions in fiscal 2017.
Competition
Our markets are consolidating, highly competitive, and subject to rapid changes in technology. The competitive landscape has changed significantly over the past few years, with new competition arising. Much of the market growth has come from startups whose focus is on solving a specific customer issue or delivering a niche-oriented product and from larger integration providers that increasingly are looking to put various types of protection into their platforms. We are focused on delivering
6
comprehensive customer solutions, integrating across our broad product portfolio and partnering with other technology providers to differentiate ourselves from the competition. We believe that the principal competitive factors necessary to be successful in our industry include product quality and effectiveness, time-to-market, price, reputation, financial stability, breadth of product offerings, customer support, brand recognition, and effective sales and marketing efforts.
In addition to the competition we face from direct competitors, we face indirect or potential competition from retailers, application providers, operating system providers, network equipment manufacturers, and other OEMs who may provide various solutions and functions in their current and future products. We also compete for access to retail distribution channels and for spending at the retail level and in corporate accounts. In addition, we compete with other software companies, operating system providers, network equipment manufacturers, and other OEMs to acquire technologies, products, or companies and to publish software developed by third parties. We also compete with other software companies in our effort to place our products on the computer equipment sold to consumers and enterprises by OEMs.
Most of the channels in which our products are offered are highly competitive. Some of our consumer competitors are intensely focused on customer acquisition, which has led competitors to offer their technology for free, engage in aggressive marketing, or enter into competitive partnerships. We view our competitive landscape as follows:
• | Our primary security competitors are McAfee (formerly Intel Security), Microsoft Corporation (“Microsoft”), and Trend Micro Inc. There are also several freeware providers and regional security companies that we compete against. |
• | For our consumer backup offerings, our primary competitors are Carbonite, Inc. and Dell EMC. |
• | In Identity Protection, our competitors are the credit bureaus that include Experian, Equifax, and TransUnion, as well as others, such as Affinion, EWS, Intersections, CSID, and LexisNexis. |
• | In the Secure Socket Layer Certificate market, our primary competitors are Comodo Group, Inc., DigiCert, Inc. and Let’s Encrypt. |
• | In the email security market, our primary competitors are Proofpoint, Inc. and Microsoft. |
• | Our primary competitors in the managed security services business are SecureWorks Corporation and International Business Machines Corporation (“IBM”). |
• | Our principal competitors in the web security gateway market are McAfee, Zscaler, Inc. (“Zscaler”), Forcepoint LLC and Cisco Systems, Inc. (“Cisco”). In addition, we expect additional competition from other established and emerging companies as the web security gateway market continues to develop and expand through further consolidation. |
• | Our principal competitors in the cloud security services market are Zscaler and Cisco. In addition, we expect additional competition from other established and emerging companies as the market for security-as-a-service continues to develop and expand and as consolidation occurs. |
• | Our principal competitors in the advanced threat protection market and incident response, analytics and forensics market include McAfee, IBM and Dell EMC as well as independent security vendors such as Palo Alto Networks Inc., FireEye, Inc., Niksun and Trend Micro Inc. Further, as new IT budgets are created to support next-generation threat protection, we expect to compete with more highly specialized vendors as well as larger vendors that may continue to acquire or bundle their products. |
• | Our principal competitors in the WAN optimization market are Riverbed Technology, Inc. and Cisco. In addition, we expect additional competition from other established and emerging companies as the WAN optimization market continues to develop and expand and as consolidation occurs. |
Intellectual property
Protective measures
We regard some of the features of our internal operations, software, and documentation as proprietary and rely on copyright, patent, trademark and trade secret laws, confidentiality procedures, contractual arrangements, and other measures to protect our proprietary information. Our intellectual property is an important and valuable asset that enables us to gain recognition for our products, services, and technology and enhance our competitive position.
As part of our confidentiality procedures, we generally enter into non-disclosure agreements with our employees, distributors, and corporate partners and we enter into license agreements with respect to our software, documentation, and other proprietary information. These license agreements are generally non-transferable and have either a perpetual or subscription based time limited term. We also educate our employees on trade secret protection and employ measures to protect our facilities, equipment, and networks.
Trademarks, patents, copyrights, and licenses
Symantec and the Symantec logo are trademarks or registered trademarks in the U.S. and other countries. In addition to Symantec and the Symantec logo, we have used, registered, or applied to register other specific trademarks and service marks to help distinguish our products, technologies, and services from those of our competitors in the U.S. and foreign countries and jurisdictions. We enforce our trademark, service mark, and trade name rights in the U.S. and abroad. The duration of our trademark registrations varies from country to country, and in the U.S. we generally are able to maintain our trademark rights and renew any trademark registrations for as long as the trademarks are in use.
7
We have approximately 2,100 patents, in addition to foreign patents and pending U.S. and foreign patent applications, which relate to various aspects of our products and technology. The duration of our patents is determined by the laws of the country of issuance and for the U.S. is typically 17 years from the date of issuance of the patent or 20 years from the date of filing of the patent application resulting in the patent, which we believe is adequate relative to the expected lives of our products.
Our products are protected under U.S. and international copyright laws and laws related to the protection of intellectual property and proprietary information. We take measures to label such products with the appropriate proprietary rights notices, and we actively enforce such rights in the U.S. and abroad. However, these measures may not provide sufficient protection, and our intellectual property rights may be challenged. In addition, we license some intellectual property from third parties for use in our products, and generally must rely on the third party to protect the licensed intellectual property rights. While we believe that our ability to maintain and protect our intellectual property rights is important to our success, we also believe that our business as a whole is not materially dependent on any particular patent, trademark, license, or other intellectual property right.
Seasonality
As is typical for many large technology companies, our business is seasonal. Orders are generally higher in our third and fourth fiscal quarters and lower in our first and second fiscal quarters. Revenue generally reflects similar seasonal patterns but to a lesser extent than orders because revenue is not recognized until an order is shipped or services are performed and other revenue recognition criteria are met, and because a significant portion of our in-period revenue comes from our deferred revenue balance.
Employees
As of March 31, 2017, we employed more than 13,000 people worldwide.
Available information
Our Internet home page is located at www.symantec.com. We make available free of charge our annual reports on Form 10-K, quarterly reports on Form 10-Q, current reports on Form 8-K, and amendments to those reports as soon as reasonably practicable after we electronically file such material with the Securities and Exchange Commission (“SEC”) on our investor relations website located at www.symantec.com/invest. The information contained, or referred to, on our website is not part of this annual report unless expressly noted. The SEC maintains a website that contains reports, proxy and information statements, and other information regarding our filings at http://www.sec.gov. In addition, you may read and copy any filing that we make with the SEC at the public reference room maintained by the SEC, located at 100 F Street, N.E., Washington, D.C. 20549. Please call the SEC at 1-800-SEC-0330 for further information about the public reference room.
Item 1A. Risk Factors
A description of the risk factors associated with our business is set forth below. The list is not exhaustive and you should carefully consider these risks and uncertainties before investing in our common stock.
If we are unsuccessful at addressing our business challenges, our business and results of operations may be adversely affected and our ability to invest in and grow our business could be limited.
For the last few years, we have experienced a number of transitions as we have attempted to revitalize our business model, improve execution and innovate new products and services. These transitions have involved changes to management and other key personnel, shifts in our strategic direction and, more recently, changes to our corporate structure as a result of the divestiture of Veritas and the acquisition of Blue Coat. In particular, in connection with our acquisition of Blue Coat, we experienced changes to our executive team during the second and third quarters of fiscal 2017, appointing three former Blue Coat executive officers to the positions of Chief Executive Officer, President and Chief Operating Officer, and Executive Vice President and Chief Financial Officer. Transitions of these kind can be disruptive, can result in the loss of institutional focus and employee morale and make the execution of business strategies more difficult. We are also focused on addressing dynamic and accelerating market trends, such as the continued decline in the PC market, the market shifts towards mobility, the continued transition towards cloud-based solutions and architectural shifts in the provision of security, all of which has made it more difficult for us to compete effectively and requires us to improve our product and service offerings. We may experience delays in the anticipated timing of activities related to our efforts to address these challenges and higher than expected or unanticipated execution costs. In addition, we are vulnerable to increased risks associated with these efforts and the broad range of geographic regions in which we and our customers and partners operate. If we do not succeed in these efforts, or if these efforts are more costly or time-consuming than expected, our business and results of operations may be adversely affected, which could limit our ability to invest in and grow our business.
Fluctuations in demand for our products and services are driven by many factors, and a decrease in demand for our products could adversely affect our financial results.
We are subject to fluctuations in demand for our products and services due to a variety of factors, including market transitions, general economic conditions, competition, product obsolescence, technological change, shifts in buying patterns, financial difficulties and budget constraints of our current and potential customers, awareness of security threats to IT systems and other factors. While such factors may, in some periods, increase product sales, fluctuations in demand can also negatively impact our product sales. If demand for our products and solutions declines, whether due to general economic conditions or a shift in buying patterns, our revenues and margins would likely be adversely affected.
Additionally, since Blue Coat’s business historically experienced a major product refresh cycle approximately once every five
8
years, as hardware appliances reach the end of their useful life, we anticipate that we will experience fluctuations in demand as we enter and exit cycles in which many of our customers refresh their install base of hardware appliance products with our latest equipment, replacing older versions of the hardware that have reached the end of their useful life and are no longer supported under maintenance contracts. Our appliances generally have a five year end-of-life date from the date of purchase, which we expect will extend refresh cycles for our hardware appliances over a multi-year period and reduce the impact of a product refresh cycle in any one period. However, we cannot assure you that we will not experience uneven demand for these products in any one period, causing our business and results of operations to be adversely affected.
A refresh cycle also creates an opportunity for our competitors to try to displace our existing product deployments for our customers, who may be more inclined to consider other product solutions at a time when they otherwise need to replace our existing products that have reached the end of their useful life. The extent to which customers decide to refresh by purchasing products from our current or future competitors as opposed to purchasing our new products may significantly impact our current period product revenues as well as future service revenue.
Our business depends on customers renewing their arrangements for maintenance, subscriptions, managed security services and SaaS offerings.
A large portion of our revenue is derived from arrangements for maintenance, subscriptions, managed security services and SaaS offerings, yet existing customers have no contractual obligation to purchase additional solutions after the initial subscription or contract period. Our customers’ renewal rates may decline or fluctuate as a result of a number of factors, including their level of satisfaction with our solutions or our customer support, customer budgets and the pricing of our solutions compared with the solutions offered by our competitors, any of which may cause our revenue to grow more slowly than expected, if at all. Accordingly, we must invest significant time and resources in providing ongoing value to our customers. If these efforts fail, or if our customers do not renew for other reasons, or if they renew on terms less favorable to us, our revenue may decline and our business will suffer.
If we are unable to develop new and enhanced products and services that achieve widespread market acceptance, or if we are unable to continually improve the performance, features, and reliability of our existing products and services or adapt our business model to keep pace with industry trends, our business and operating results could be adversely affected.
Our future success depends on our ability to respond to the rapidly changing needs of our customers by developing or introducing new products, product upgrades and services on a timely basis. We have in the past incurred, and will continue to incur, significant research and development expenses as we strive to remain competitive. Additionally, we must continually address the challenges of dynamic and accelerating market trends, such as the emergence of advanced persistent threats in the security space, the continued decline in the PC market and the market shift towards mobility and the increasing transition towards cloud-based solutions, all of which have made it more difficult for us to compete effectively. For example, we have been increasingly investing in solutions that address the cloud security market, particularly our acquisition of Blue Coat, but we cannot be certain that the cloud security market will develop at a rate or in the manner we expect or that we will be able to compete successfully with more established competitors in the cloud security market. Customers may require features and capabilities that our current solutions do not have. Our failure to develop solutions that satisfy customer preferences in a timely and cost-effective manner may harm our ability to renew our subscriptions with existing customers and to create or increase demand for our solutions and may adversely impact our operating results. New product development and introduction involves a significant commitment of time and resources and is subject to a number of risks and challenges including:
• | Managing the length of the development cycle for new products and product enhancements, which has frequently been longer than we originally expected; |
• | Adapting to emerging and evolving industry standards and to technological developments by our competitors and customers; |
• | Extending the operation of our products and services to new and evolving platforms, operating systems and hardware products, such as mobile devices; |
• | Entering into new or unproven markets with which we have limited experience; |
• | Managing new product and service strategies for the markets in which we operate; |
• | Addressing trade compliance issues affecting our ability to ship our products; |
• | Developing or expanding efficient sales channels; and |
• | Obtaining sufficient licenses to technology and technical access from operating system software vendors on reasonable terms to enable the development and deployment of interoperable products, including source code licenses for certain products with deep technical integration into operating systems. |
If we are not successful in managing these risks and challenges, or if our new products, product upgrades and services are not technologically competitive or do not achieve market acceptance, our business and operating results could be adversely affected.
We operate in a highly competitive environment, and our competitors may gain market share in the markets for our products that could adversely affect our business and cause our revenues to decline.
We operate in intensely competitive markets that experience rapid technological developments, changes in industry
9
standards, changes in customer requirements and frequent new product introductions and improvements. If we are unable to anticipate or react to these competitive challenges or if existing or new competitors gain market share in any of our markets, our competitive position could weaken and we could experience a decline in our sales that could adversely affect our business and operating results. To compete successfully, we must maintain an innovative research and development effort to develop new products and services and enhance existing products and services, effectively adapt to changes in the technology or product rights held by our competitors, appropriately respond to competitive strategies and effectively adapt to technological changes and changes in the ways that our information is accessed, used and stored within our enterprise and consumer markets. If we are unsuccessful in responding to our competitors or to changing technological and customer demands, our competitive position and our financial results could be adversely affected.
Our competitors include software vendors that offer software products that directly compete with our product offerings. In addition to competing with these vendors directly for sales to end-users of our products, we compete with them for the opportunity to have our products bundled with the product offerings of our strategic partners such as computer hardware OEMs and ISPs. Our competitors could gain market share from us if any of these strategic partners replace our products with the products of our competitors or if these partners more actively promote our competitors’ products than our products. In addition, software vendors who have bundled our products with theirs may choose to bundle their software with their own or other vendors’ software or may limit our access to standard product interfaces and inhibit our ability to develop products for their platform. In the future, further product development by these vendors could cause our software applications and services to become redundant, which could significantly impact our sales and financial results.
We face growing competition from network equipment, computer hardware manufacturers, large operating system providers and other technology companies, as well as from companies in the identity threat protection space such as credit bureaus. Many of these competitors are increasingly developing and incorporating into their products data protection software that competes at some levels with our product offerings. Our competitive position could be adversely affected to the extent that our customers perceive the functionality incorporated into these products as replacing the need for our products.
Security protection is also offered by some of our competitors at prices lower than our prices or, in some cases is offered free of charge. Some companies offer the lower-priced or free security products within their computer hardware or software products that we believe are inferior to our products and SaaS offerings. Our competitive position could be adversely affected to the extent that our customers perceive these security products as replacing the need for more effective, full featured products and services, such as those that we provide. The expansion of these competitive trends could have a significant negative impact on our sales and financial results by causing, among other things, price reductions of our products, reduced profitability and loss of market share.
Many of our competitors have greater financial, technical, sales, marketing or other resources than we do and consequently, may have the ability to influence customers to purchase their products instead of ours. Further consolidation within our industry or other changes in the competitive environment could result in larger competitors that compete with us on several levels. We also face competition from many smaller companies that specialize in particular segments of the markets in which we compete.
Reduced trust in our SSL/TLS certificates could adversely affect our website security business.
Our website security business depends on the widespread acceptance of the digital certificates we provide to enable communications security infrastructure. We have in the past issued, and may in the future issue, SSL/TLS certificates out of compliance with the requirements of the Certificate Authority and Browser Forum Baseline Requirements. Failures of this kind could cause popular browsers to reduce or eliminate trust in our SSL/TSL certificates or the related roots or otherwise disrupt our position as a leading certificate authority. For example, Google recently issued a proposal to reduce trust in our SSL/TSL certificates based on our past issuance of non-compliant certificates. If any popular browser reduced trust in our SSL/TSL certificates or roots, it would damage our brand and cause our SSL/TSL certificates to fail to interoperate, resulting in customer attrition for our website security business, which could adversely affect our results of operations and our stock price.
Fluctuations in our quarterly financial results have affected the trading price of our outstanding securities in the past and could affect the trading price of outstanding securities in the future.
Our quarterly financial results have fluctuated in the past and are likely to vary significantly in the future due to a number of factors, many of which are outside of our control. If our quarterly financial results or our predictions of future financial results fail to meet our expectations or the expectations of securities analysts and investors, the trading price of our outstanding securities could be negatively affected. Any volatility in our quarterly financial results may make it more difficult for us to raise capital in the future or pursue acquisitions that involve issuances of our stock. Our operating results for prior periods may not be effective predictors of our future performance.
Factors associated with our industry, the operation of our business, and the markets for our products may cause our quarterly financial results to fluctuate, including:
• | Fluctuations in demand for any of our products and services; |
• | Entry of new competition into our markets; |
• | Competitive pricing pressure for one or more of our classes of products; |
• | Our ability to timely complete the release of new or enhanced versions of our products; |
• | How well we execute our strategy and operating plans and the impact of changes in our business operations or business model that could result in significant restructuring charges; |
10
• | The impact of future acquisitions; |
• | Fluctuations in foreign currency exchange rates; |
• | The number, severity, and timing of threat outbreaks (e.g. worms, viruses, malware, ransomware and other malicious threats); |
• | Our resellers making a substantial portion of their purchases near the end of each quarter; |
• | Enterprise customers’ tendency to negotiate site licenses near the end of each quarter; |
• | Our sales cycle, which may lengthen as the complexity of products and competition in our markets increases; |
• | The timing of and rate and discounts at which customers replace older versions of the hardware that reach end of life; |
• | Cancellation, deferral, or limitation of orders by customers; |
• | Changes in the mix or type of products sold; |
• | Movements in interest rates; |
• | The rate of adoption of new product technologies and new releases of operating systems; |
• | Changes in accounting rules; |
• | Weakness or uncertainty in general economic or industry conditions in any of the multiple markets in which we operate that could reduce customer demand and ability to pay for our products and services; |
• | Political and military instability, which could slow spending within our target markets, delay sales cycles, and otherwise adversely affect our ability to generate revenues and operate effectively; |
• | Budgetary constraints of customers, which are influenced by corporate earnings and government budget cycles and spending objectives; |
• | Disruptions in our business operations or target markets caused by, among other things, earthquakes, floods, or other natural disasters affecting our headquarters located in Silicon Valley, California, an area known for seismic activity, or our other locations worldwide; |
• | Acts of war or terrorism; |
• | Intentional disruptions by third parties; and |
• | Health or similar issues, such as a pandemic. |
Any of the foregoing factors could cause the trading price of our outstanding securities to fluctuate significantly.
Our business models present execution and competitive risks.
In recent years, our SaaS offerings have become increasingly critical in our business. Our competitors are rapidly developing and deploying SaaS offerings for consumers and business customers. Pricing and delivery models are evolving. Devices and form factors influence how users access services in the cloud. We are making significant investments in, and devoting significant resources to develop and deploy, our own SaaS strategies, including our acquisition of Blue Coat in August 2016. We cannot assure you that our investments in and development of SaaS offerings will achieve the expected returns for us or that we will be able to compete successfully in the marketplace. In addition to software development costs, we are incurring costs to build and maintain infrastructure to support SaaS offerings. These costs may reduce the operating margins we have previously achieved. Whether we are successful in this business model depends on our execution in a number of areas, including:
• | Continuing to innovate and bring to market compelling cloud-based experiences that generate increasing traffic and market share; and |
• | Ensuring that our SaaS offerings meet the reliability expectations of our customers and maintain the security of their data. |
We may need to change our pricing models to compete successfully.
The intense competition we face in the sales of our products and services and general economic and business conditions can put pressure on us to change our prices. If our competitors offer deep discounts on certain products or services or develop products that the marketplace considers more valuable, we may need to lower prices or offer other favorable terms in order to compete successfully. Any such changes may reduce margins and could adversely affect operating results. Additionally, the increasing prevalence of cloud and SaaS delivery models offered by us and our competitors may unfavorably impact pricing in both our on-premise enterprise software business and our cloud business, as well as overall demand for our on-premise software product and service offerings, which could reduce our revenues and profitability. Our competitors may offer lower pricing on their support offerings, which could put pressure on us to further discount our product or support pricing.
Any broad-based change to our prices and pricing policies could cause our revenues to decline or be delayed as our sales force implements and our customers adjust to the new pricing policies. We or our competitors may bundle products for promotional purposes or as a long-term go-to-market or pricing strategy or provide guarantees of prices and product implementations. These practices could, over time, significantly constrain the prices that we can charge for certain of our products. If we do not adapt our pricing models to reflect changes in customer use of our products or changes in customer
11
demand, our revenues could decrease. The increase in open source software distribution may also cause us to change our pricing models.
Defects, disruptions or risks related to the provision of our SaaS offerings could impair our ability to deliver our services and could expose us to liability, damage our brand and reputation or otherwise negatively impact our business.
Our SaaS offerings may contain errors or defects that users identify after they begin using them that could result in unanticipated service interruptions, which could harm our reputation and our business. Since our customers use our SaaS offerings for mission-critical protection from threats to electronic information, endpoint devices, and computer networks, any errors, defects, disruptions in service or other performance problems with our SaaS offerings could significantly harm our reputation and may damage our customers’ businesses. If that occurs, customers could elect not to renew, or delay or withhold payment to us, we could lose future sales or customers may make warranty or other claims against us, which could result in an increase in our provision for doubtful accounts, an increase in collection cycles for accounts receivable or the expense and risk of litigation.
We currently serve our SaaS-based customers from hosting facilities located across the globe. Damage to, or failure of, any significant element of these hosting facilities could result in interruptions in our service, which could harm our customers and expose us to liability. Interruptions or failures in our service delivery could cause customers to terminate their subscriptions with us, could adversely affect our renewal rates, and could harm our ability to attract new customers. Our business would also be harmed if our customers believe that our SaaS offerings are unreliable.
We collect, use, disclose, store or otherwise process personal information, which subjects us to privacy and data security laws and contractual commitments, and our actual or perceived failure to comply with such laws and commitments could harm our business.
We collect, use, store or disclose (collectively, “process”) an increasingly large amount of personal information, including from employees and customers, in connection with the operation of our business. The volume, variety and velocity of the personal information we process increased significantly as a result of our acquisition of LifeLock in February 2017, as its identity and fraud protection offerings rely on large data repositories of personal information and consumer transactions. The personal information we process is subject to an increasing number of federal, state, local and foreign laws regarding privacy and data security, as well as contractual commitments. Any failure or perceived failure by us to comply with such obligations may result in governmental enforcement actions, fines, litigation, or public statements against us by consumer advocacy groups or others and could cause our customers to lose trust in us, which could have an adverse effect on our reputation and business. Our customers may also accidentally disclose their passwords or store them on a device that is lost or stolen, creating the perception that our systems are not secure against third-party access.
Additionally, if third parties that we work with, such as vendors or developers, violate applicable laws or our policies, such violations may also place personal information at risk and have an adverse effect on our business. Changes to applicable privacy or data security laws could impact how we process personal information, and therefore limit the effectiveness of our products, services or features, or our ability to develop new products, services or features.
Our acquisitions and divestitures create special risks and challenges that could adversely affect our future financial results.
As part of our business strategy, we may acquire or divest businesses or assets. These activities can involve a number of special risks and challenges, including:
• | Complexity, time and costs associated with managing these transactions, including the integration of acquired business operations, workforce, products, and technologies; |
• | Diversion of management time and attention; |
• | Loss or termination of employees, including costs associated with the termination or replacement of those employees; |
• | Assumption of liabilities of the acquired business or assets, including litigation related to the acquired business or assets; |
• | The addition of acquisition-related debt as well as increased expenses and working capital requirements; |
• | Dilution of stock ownership of existing stockholders; |
• | Increased or unexpected costs, unanticipated delays or failure to meet contractual obligations; and |
• | Substantial accounting charges for restructuring and related expenses, write-off of in-process research and development, impairment of goodwill, amortization of intangible assets, and stock-based compensation expense. |
If integration of our acquired businesses is not successful, we may not realize the potential benefits of an acquisition or suffer other adverse effects. To integrate acquired businesses, we must integrate and manage the personnel and technology systems of the acquired operations. We also must effectively integrate the different cultures of acquired business organizations into our own in a way that aligns various interests, and may need to enter new markets in which we have no or limited experience and where competitors in such markets have stronger market positions. Moreover, to be successful, some acquisitions, particularly acquisitions of large, complex companies, such as Blue Coat and LifeLock, depend on large-scale product, technology and sales force integrations that are difficult to complete on a timely basis or at all, and may be more susceptible to the special risks and
12
challenges described above.
Any of the foregoing, and other factors, could harm our ability to achieve anticipated levels of profitability or other financial benefits from our divested or acquired businesses or assets or to realize other anticipated benefits of divestitures or acquisitions, such as anticipated operating efficiencies or other cost savings.
If we fail to manage our sales and distribution channels effectively, or if our partners choose not to market and sell our products to their customers, our operating results could be adversely affected.
We sell our products to customers around the world through multi-tiered sales and distribution networks.
Sales through these different channels involve distinct risks, including the following:
Direct Sales. A significant portion of our revenues from enterprise products is derived from sales by our direct sales force to end-users. Special risks associated with direct sales include:
• | Longer sales cycles associated with direct sales efforts; |
• | Difficulty in hiring, retaining, and motivating our direct sales force, particularly through periods of transition in our organization; and |
• | Substantial amounts of training for sales representatives to become productive in selling our products and services, including regular updates to cover new and revised products, and associated delays and difficulties in recognizing the expected benefits of investments in new products and updates. |
Indirect Sales Channels. A significant portion of our revenues is derived from sales through indirect channels, including distributors that sell our products to end-users and other resellers. This channel involves a number of risks, including:
• | Our lack of control over the timing of delivery of our products to end-users; |
• | Our resellers and distributors are generally not subject to minimum sales requirements or any obligation to market our products to their customers; |
• | Our reseller and distributor agreements are generally nonexclusive and may be terminated at any time without cause; |
• | Our resellers and distributors frequently market and distribute competing products and may, from time to time, place greater emphasis on the sale of these products due to pricing, promotions, and other terms offered by our competitors; and |
• | The consolidation of electronics retailers has increased their negotiating power with respect to hardware and software providers such as us. |
OEM Sales Channels. A portion of our revenues is derived from sales through our OEM partners that incorporate our products into, or bundle our products with, their products. Our reliance on this sales channel involves many risks, including:
• | Our lack of control over the volume of systems shipped and the timing of such shipments; |
• | Our OEM partners are generally not subject to minimum sales requirements or any obligation to market our products to their customers; |
• | Our OEM partners may terminate or renegotiate their arrangements with us and new terms may be less favorable due to competitive conditions in our markets and other factors; |
• | Sales through our OEM partners are subject to changes in general economic conditions, strategic direction, competitive risks, and other issues that could result in a reduction of OEM sales; |
• | The development work that we must generally undertake under our agreements with our OEM partners may require us to invest significant resources and incur significant costs with little or no assurance of ever receiving associated revenues; |
• | The time and expense required for the sales and marketing organizations of our OEM partners to become familiar with our products may make it more difficult to introduce those products to the market; and |
• | Our OEM partners may develop, market, and distribute their own products and market and distribute products of our competitors, which could reduce our sales. |
If we fail to manage our sales and distribution channels successfully, these channels may conflict with one another or otherwise fail to perform as we anticipate, which could reduce our sales and increase our expenses as well as weaken our competitive position. Some of our distribution partners have experienced financial difficulties in the past, and if our partners suffer financial difficulties in the future because of general economic conditions or for other reasons, these partners may delay paying their obligations to us and we may have reduced sales or increased bad debt expense that could adversely affect our operating results. In addition, reliance on multiple channels subjects us to events that could cause unpredictability in demand, which could increase the risk that we may be unable to plan effectively for the future, and could result in adverse operating results in future periods.
Over the long term we intend to invest in research and development activities, and these investments may achieve delayed, or lower than expected, benefits which could harm our operating results.
While we continue to focus on managing our costs and expenses, over the long term, we also intend to invest significantly in
13
research and development activities as we focus on organic growth through internal innovation in each of our business segments. We believe that we must continue to dedicate a significant amount of resources to our research and development efforts to maintain our competitive position, and that the level of these investments will increase in future periods as the Blue Coat acquisition has expanded our focus areas. We recognize the costs associated with these research and development investments earlier than the anticipated benefits, and the return on these investments may be lower, or may develop more slowly, than we expect. If we do not achieve the benefits anticipated from these investments, or if the achievement of these benefits is delayed, our operating results may be adversely affected.
Changes in industry structure and market conditions could lead to charges related to discontinuances of certain of our products or businesses and asset impairments.
In response to changes in industry and market conditions, we may be required to strategically reallocate our resources and consider restructuring, disposing of or otherwise exiting businesses. Any decision to limit investment in or dispose of or otherwise exit businesses may result in the recording of special charges, such as inventory and technology-related write-offs, workforce reduction costs, charges relating to consolidation of excess facilities or claims from third parties who were resellers or users of discontinued products. Our estimates with respect to the useful life or ultimate recoverability of our carrying basis of assets, including purchased intangible assets, could change as a result of such assessments and decisions. Although in certain instances our supply agreements allow us the option to cancel, reschedule and adjust our requirements based on our business needs prior to firm orders being placed, our loss contingencies may include liabilities for contracts that we cannot cancel, reschedule or adjust with contract manufacturers and suppliers.
Further, our estimates relating to the liabilities for excess facilities are affected by changes in real estate market conditions. Additionally, we are required to evaluate goodwill impairment on an annual basis and between annual evaluations in certain circumstances, and future goodwill impairment evaluations may result in a charge to earnings.
Our inability to successfully recover from a disaster or other business continuity event could impair our ability to deliver our products and services and harm our business.
We are heavily reliant on our technology and infrastructure to provide our products and services to our customers. For example, we host many of our products using third-party data center facilities and we do not control the operation of these facilities. These facilities are vulnerable to damage, interruption or performance problems from earthquakes, hurricanes, floods, fires, power loss, telecommunications failures and similar events. They are also subject to break-ins, computer viruses, sabotage, intentional acts of vandalism and other misconduct. The occurrence of a natural disaster or an act of terrorism, a decision to close the facilities without adequate notice or other unanticipated problems could result in lengthy interruptions in the delivery of our products and services.
Furthermore, our business administration, human resources and finance services depend on the proper functioning of our computer, telecommunication and other related systems and operations. A disruption or failure of these systems or operations because of a disaster or other business continuity event could cause data to be lost or otherwise delay our ability to complete sales and provide the highest level of service to our customers. In addition, we could have difficulty producing accurate financial statements on a timely basis, which could adversely affect the trading value of our stock. Although we endeavor to ensure there is redundancy in these systems and that they are regularly backed-up, there are no assurances that data recovery in the event of a disaster would be effective or occur in an efficient manner, including the operation of our global civilian cyber intelligence threat network.
Any errors, defects, disruptions or other performance problems with our products and services could harm our reputation and may damage our customers’ businesses. For example, we may experience disruptions, outages and other performance problems due to a variety of factors, including infrastructure changes, human or software errors, capacity constraints due to an overwhelming number of users accessing our website simultaneously, fraud or security attacks. In some instances, we may not be able to identify the cause or causes of these performance problems within an acceptable period of time. Interruptions in our products and services, including the operation of our global civilian cyber intelligence threat network, could impact our revenues or cause customers to cease doing business with us. In addition, our business would be harmed if any of events of this nature caused our customers and potential customers to believe our services are unreliable. Our operations are dependent upon our ability to protect our technology infrastructure against damage from business continuity events that could have a significant disruptive effect on our operations. We could potentially lose customer data or experience material adverse interruptions to our operations or delivery of services to our clients in a disaster recovery scenario.
We may experience difficulties in realizing the expected benefits of the acquisition of Blue Coat and LifeLock and may continue to incur significant acquisition-related costs and transition costs in connection with these acquisitions.
We completed the acquisition of Blue Coat in the second quarter of fiscal 2017 and LifeLock in the fourth quarter of fiscal 2017. We have invested and continue to invest substantial monetary and other resources in the integration of these companies. The success of each acquisition depends in part on our ability to realize the anticipated business opportunities, including certain cost savings and operational efficiencies or synergies and growth prospects from combining the respective companies with Symantec in an efficient and effective manner. We may never realize these business opportunities and growth prospects. We may incur additional costs to maintain employee morale and to retain key employees. Management cannot ensure that the elimination of duplicative costs or the realization of other efficiencies will offset the transaction and integration costs in the near term or at all.
Additionally, we may encounter difficulties surrounding the integration of these companies, which could delay or prevent our achievement of the expected benefits from the respective acquisition. Moreover, risks specific to the acquired businesses could
14
also delay or prevent our achievement of the expected benefits from the respective acquisition. For example, since LifeLock’s identity and fraud protection products depend extensively upon continued access to and receipt of credible, timely and complete data from external sources, including data received from customers, vendors who are also competitors and fulfillment partners, the value we derive from the LifeLock acquisition, our competitive position and our business, results of operations, and financial condition could be harmed as a result of our loss of access to data sources or reliance on sources that prove to be ineffective or inaccurate.
As a result of our acquisition of LifeLock, our Consumer Digital Safety segment became subject to increased regulation, which could impede our ability to market and provide our services or adversely affect our business, financial position and results of operations.
As a result of our acquisition of LifeLock, a portion of our Consumer Digital Safety segment became subject to increased regulation, including a wide variety of federal, state, and local laws and regulations, including the Fair Credit Reporting Act, the Gramm-Leach-Bliley Act, the Federal Trade Commission Act (“FTC Act”), and comparable state laws that are patterned after the FTC Act. Moreover, LifeLock entered into consent decrees and similar arrangements with the Federal Trade Commission (the “FTC”) and 35 states’ attorneys general in 2010, and a settlement with the FTC in 2015 relating to allegations that certain of LifeLock’s advertising and marketing practices constituted deceptive acts or practices in violation of the FTC Act, which impose additional restrictions on the LifeLock business within our Consumer Digital Safety segment, including prohibitions against making any misrepresentation of “the means, methods, procedures, effects, effectiveness, coverage, or scope of” LifeLock’s identity theft protection services. Any of the laws and regulations that apply to our business are subject to revision or new or changed interpretations, and we cannot predict the impact of such changes on our business.
Additionally, as a result of our LifeLock acquisition, aspects of our Consumer Digital Safety segment are subject to the broad regulatory, supervisory, and enforcement powers of the Consumer Financial Protection Bureau (CFPB) and may exercise authority with respect to our services, or the marketing and servicing of those services, by overseeing our financial institution or credit reporting agency customers and suppliers, or by otherwise exercising its supervisory, regulatory, or enforcement authority over consumer financial products and services.
Any cost reduction initiatives that we undertake may not deliver the results we expect, and these actions may adversely affect our business.
In May 2016 we announced a fiscal 2017 restructuring plan to be achieved by the end of fiscal 2018. This initiative could result in disruptions to our operations. Any cost-cutting measures could also negatively impact our business by delaying the introduction of new products or technologies, interrupting service of additional products, or impacting employee retention. In addition, we cannot be sure that the cost reduction and streamlining initiatives will be as successful in reducing our overall expenses as we expect or that additional costs will not offset any such reductions or streamlining. If our operating costs are higher than we expect or if we do not maintain adequate control of our costs and expenses, our results of operations will suffer.
Our international operations involve risks that could increase our expenses, adversely affect our operating results, and require increased time and attention of our management.
We derive a substantial portion of our revenues from customers located outside of the U.S. and we have significant operations outside of the U.S., including engineering, sales, customer support, and production. We have expanded through our acquisition of Blue Coat and expect further expansion of our international operations, but such expansion is contingent upon our identification of growth opportunities. Our international operations are subject to risks in addition to those faced by our domestic operations, including:
• | Potential loss of proprietary information due to misappropriation or laws that may be less protective of our intellectual property rights than U.S. laws or that may not be adequately enforced; |
• | Requirements of foreign laws and other governmental controls, including trade and labor restrictions and related laws that reduce the flexibility of our business operations; |
• | Regulations or restrictions on the use, import, or export of encryption technologies that could delay or prevent the acceptance and use of encryption products and public networks for secure communications; |
• | Local business and cultural factors that differ from our normal standards and practices, including business practices that we are prohibited from engaging in by the Foreign Corrupt Practices Act and other anti-corruption laws and regulations; |
• | Central bank and other restrictions on our ability to repatriate cash from our international subsidiaries or to exchange cash in international subsidiaries into cash available for use in the U.S.; |
• | Fluctuations in currency exchange rates, economic instability and inflationary conditions could reduce our customers’ ability to obtain financing for software products or could make our products more expensive or could increase our costs of doing business in certain countries; |
• | Limitations on future growth or inability to maintain current levels of revenues from international sales if we do not invest sufficiently in our international operations; |
• | Longer payment cycles for sales in foreign countries and difficulties in collecting accounts receivable; |
• | Difficulties in staffing, managing, and operating our international operations, including difficulties related to administering our stock plans in some foreign countries; |
15
• | Difficulties in coordinating the activities of our geographically dispersed and culturally diverse operations; |
• | Seasonal reductions in business activity in the summer months in Europe and in other periods in other countries; |
• | Costs and delays associated with developing software and providing support in multiple languages; and |
• | Political unrest, war, or terrorism, or regional natural disasters, particularly in areas in which we have facilities. |
A significant portion of our transactions outside of the U.S. is denominated in foreign currencies. Accordingly, our revenues and expenses will continue to be subject to fluctuations in foreign currency rates. For example, in recent periods the U.S. dollar has strengthened significantly against the Euro and other major currencies, which has adversely impacted our reported international revenue. We expect to be affected by fluctuations in foreign currency rates in the future, especially if international sales continue to grow as a percentage of our total sales or our operations outside the U.S. continue to increase.
The level of corporate income tax from sales to our non-U.S. customers is generally less than the level of tax from sales to our U.S. customers. This benefit is contingent upon existing tax regulations in the U.S. and in the countries in which our international operations are located. Future changes in domestic or international tax regulations could adversely affect our ability to continue to realize these tax benefits.
Our products are complex and operate in a wide variety of environments, systems, applications and configurations, which could result in errors or product failures.
Because we offer very complex products, undetected errors, failures, or bugs may occur, especially when products are first introduced or when new versions are released. Our products are often installed and used in large-scale computing environments with different operating systems, system management software, and equipment and networking configurations, which may cause errors or failures in our products or may expose undetected errors, failures, or bugs in our products. Our customers’ computing environments are often characterized by a wide variety of standard and non-standard configurations that make pre-release testing for programming or compatibility errors very difficult and time-consuming. In addition, despite testing by us and others, errors, failures, or bugs may not be found in new products or releases until after commencement of commercial shipments. In the past, we have discovered software errors, failures, and bugs in certain of our product offerings after their introduction and, in some cases, have experienced delayed or lost revenues as a result of these errors.
Errors, failures, or bugs in products released by us could result in negative publicity, damage to our brand, product returns, loss of or delay in market acceptance of our products, loss of competitive position, or claims by customers or others. Many of our end-user customers use our products in applications that are critical to their businesses and may have a greater sensitivity to defects in our products than to defects in other, less critical, software products. In addition, if an actual or perceived breach of information integrity, security or availability occurs in one of our end-user customer’s systems, regardless of whether the breach is attributable to our products, the market perception of the effectiveness of our products could be harmed. Alleviating any of these problems could require significant expenditures of our capital and other resources and could cause interruptions, delays, or cessation of our product licensing, which could cause us to lose existing or potential customers and could adversely affect our operating results.
If we fail to accurately predict our manufacturing requirements and manage our supply chain we could incur additional costs or experience manufacturing delays that could harm our business.
We generally provide forecasts of our requirements to our supply chain partners on a rolling basis. If our forecast exceeds our actual requirements, a supply chain partner may assess additional charges or we may have liability for excess inventory, each of which could negatively affect our gross margin. If our forecast is less than our actual requirements, the applicable supply chain partner may have insufficient time or components to produce or fulfill our product requirements, which could delay or interrupt manufacturing of our products or fulfillment of orders for our products, and result in delays in shipments, customer dissatisfaction, and deferral or loss of revenue. Further, we may be required to purchase sufficient inventory to satisfy our future needs in situations where a component or product is being discontinued. If we fail to accurately predict our requirements, we may be unable to fulfill those orders or we may be required to record charges for excess inventory. Any of the foregoing could adversely affect our business, financial condition or results of operations.
We are dependent on original design manufacturers, contract manufacturers and third-party logistics providers to design and manufacture our hardware-based products and to fulfill orders for our hardware-based products.
We depend primarily on original design manufacturers (each of which is a third-party original design manufacturer for numerous companies) to co-design and co-develop the hardware platforms for our products. We also depend on independent contract manufacturers (each of which is a third-party contract manufacturer for numerous companies) to manufacture and fulfill our hardware-based products. These supply chain partners are not committed to design or manufacture our products, or to fulfill orders for our products, on a long-term basis in any specific quantity or at any specific price. In addition, certain of our products or key components of our products are currently manufactured by a single third-party supplier. There are alternative suppliers that could provide components, as our agreements do not provide for exclusivity or minimum purchase quantities, but the transition and qualification from one supplier to another could be lengthy, costly and difficult. Also, from time to time, we may be required to add new supply chain partner relationships or new manufacturing or fulfillment sites to accommodate growth in orders or the addition of new products. It is time consuming and costly to qualify and implement new supply chain partner relationships and new manufacturing or fulfillment sites, and such additions increase the complexity of our supply chain management. Our ability to ship products to our customers could be delayed, and our business and results of operations could be adversely affected if we fail to effectively manage our supply chain partner relationships; if one or more of our original design manufacturers does not meet our development schedules; if one or more of our independent contract manufacturers
16
experiences delays, disruptions or quality control problems in manufacturing our products; if one or more of our third-party logistics providers experiences delays or disruptions or otherwise fails to meet our fulfillment schedules; or if we are required to add or replace original design manufacturers, independent contract manufacturers, third-party logistics providers or fulfillment sites.
In addition, these supply chain partners have access to certain of our critical confidential information and could wrongly disclose or misuse such information or be subject to a breach or other compromise that introduces a vulnerability or other defect in the products manufactured by our supply chain partners. While we take precautions to ensure that hardware manufactured by our independent contractors is reviewed, any espionage acts, malware attacks, theft of confidential information or other malicious cyber incidents perpetrated either directly or indirectly through our independent contractors, may compromise our system infrastructure, expose us to litigation and associated expenses and lead to reputational harm that could result in a material adverse effect on our financial condition and operating results. In addition, we are subject to risks resulting from the perception that certain jurisdictions, including China, do not comply with internationally recognized rights of freedom of expression and privacy and may permit labor practices that are deemed unacceptable under evolving standards of social responsibility. If manufacturing or logistics in these foreign countries is disrupted for any reason, including natural disasters, IT system failures, military or government actions or economic, business, labor, environmental, public health, or political issues, or if the purchase or sale of products from such foreign countries is prohibited or disfavored, our business, financial condition and results of operations could be adversely affected.
The Dodd-Frank Wall Street Reform and Consumer Protection Act of 2010 includes disclosure requirements regarding the use of certain minerals mined from the Democratic Republic of Congo (“DRC”) and adjoining countries and procedures pertaining to a manufacturer’s efforts regarding the source of such minerals. SEC rules implementing these requirements and other international standards, such as the Organisation for Economic Co-operation and Development Due Diligence Guidance for Responsible Supply Chains of Minerals from Conflict-Affected and High Risk Areas may have the effect of reducing the pool of suppliers who can supply DRC “conflict free” components and parts, and we may not be able to obtain DRC conflict free products or supplies in sufficient quantities for our products. We may also face reputational challenges with our customers, stockholders and other stakeholders if we are unable to sufficiently verify the origins for the minerals used in our products.
If we do not protect our proprietary information and prevent third parties from making unauthorized use of our products and technology, our financial results could be harmed.
Most of our software and underlying technology is proprietary. We seek to protect our proprietary rights through a combination of confidentiality agreements and procedures and through copyright, patent, trademark and trade secret laws. However, all of these measures afford only limited protection and may be challenged, invalidated or circumvented by third parties. Third parties may copy all or portions of our products or otherwise obtain, use, distribute, and sell our proprietary information without authorization.
Third parties may also develop similar or superior technology independently by designing around our patents. Our shrink- wrap license agreements are not signed by licensees and therefore may be unenforceable under the laws of some jurisdictions. Furthermore, the laws of some foreign countries do not offer the same level of protection of our proprietary rights as the laws of the U.S., and we may be subject to unauthorized use of our products in those countries. The unauthorized copying or use of our products or proprietary information could result in reduced sales of our products. Any legal action to protect proprietary information that we may bring or be engaged in with a strategic partner or vendor could adversely affect our ability to access software, operating system, and hardware platforms of such partner or vendor, or cause such partner or vendor to choose not to offer our products to their customers. In addition, any legal action to protect proprietary information that we may bring or be engaged in, could be costly, may distract management from day-to-day operations, and may lead to additional claims against us, which could adversely affect our operating results.
From time to time we are a party to lawsuits and investigations, which typically require significant management time and attention and result in significant legal expenses, and which could, if not determined favorably, negatively impact our business, financial condition, results of operations, and cash flows.
We have initiated and been named as a party to lawsuits, including patent litigation, class actions and governmental claims and we may be named in additional litigation. The expense of initiating and defending such litigation may be costly and divert management’s attention from the day-to-day operations of our business, which could adversely affect our business, results of operations, and cash flows. In addition, an unfavorable outcome in such litigation could result in significant fines, settlements, monetary damages or injunctive relief that could negatively impact our ability to conduct our business, results of operations, and cash flows.
Third parties claiming that we infringe their proprietary rights could cause us to incur significant legal expenses and prevent us from selling our products.
From time to time, third parties may claim that we have infringed their intellectual property rights, including claims regarding patents, copyrights, and trademarks. Because of constant technological change in the segments in which we compete, the extensive patent coverage of existing technologies, and the rapid rate of issuance of new patents, it is possible that the number of these claims may grow. In addition, former employers of our former, current, or future employees may assert claims that such employees have improperly disclosed to us the confidential or proprietary information of these former employers. Any such claim, with or without merit, could result in costly litigation and distract management from day-to-day operations. If we are not successful in defending such claims, we could be required to stop selling, delay shipments of, or redesign our products, pay monetary amounts as damages, enter into royalty or licensing arrangements, or satisfy indemnification obligations that we have
17
with some of our customers. We cannot assure you that any royalty or licensing arrangements that we may seek in such circumstances will be available to us on commercially reasonable terms or at all. We have made and expect to continue making significant expenditures to investigate, defend and settle claims related to the use of technology and intellectual property rights as part of our strategy to manage this risk.
In addition, we license and use software from third parties in our business. These third party software licenses may not continue to be available to us on acceptable terms or at all, and may expose us to additional liability. This liability, or our inability to use any of this third party software, could result in shipment delays or other disruptions in our business that could materially and adversely affect our operating results.
Adverse global economic events may impact our customers’ ability to do business with us, thereby harming our business, operating results and financial condition.
Adverse macroeconomic conditions could negatively affect our customers, thereby impacting our business, operating results or financial condition. During challenging economic times and periods of high unemployment, current or potential customers may delay or forgo decisions to license new products or additional instances of existing products, upgrade their existing hardware or operating environments (which upgrades are often a catalyst for new purchases of our software), or purchase services. Customers may also have difficulties in obtaining the requisite third-party financing to complete the purchase of our products and services. Any of these scenarios could adversely affect our business.
Our exposure to credit risk and payment delinquencies on our accounts receivable significantly increases in adverse economic conditions.
An adverse macroeconomic environment could subject us to increased credit risk should customers be unable to pay us, or delay paying us, for previously purchased products and services. Our outstanding accounts receivables are generally not secured. In addition, our standard terms and conditions permit payment within a specified number of days following the receipt of our product. Accordingly, reserves for doubtful accounts and write-offs of accounts receivable may increase. In addition, weakness in the market for end users of our products could harm the cash flow of our distributors and resellers who could then delay paying their obligations to us. This would further increase our credit risk exposure and, potentially, cause delays in our recognition of revenue on sales to these customers. Further, while no customer accounted for more than 10% of our total net revenues in any of fiscal 2017, 2016 and 2015, two distributors and one distributor accounted for 10% of our gross accounts receivable as of March 31, 2017 and April 1, 2016, respectively. The loss of this or other large customers could have a negative impact on our business. While we have procedures to monitor and limit exposure to credit risk on our receivables and have not suffered any material losses to date, there can be no assurance such procedures will continue to effectively limit our credit risk and avoid future losses.
Our effective tax rate may increase, which could increase our income tax expense and reduce (increase) our net income (loss).
Our effective tax rate could be adversely affected by several factors, many of which are outside of our control, including:
• | Changes in the relative proportions of revenues and income before taxes in the various jurisdictions in which we operate that have differing statutory tax rates; |
• | Changing tax laws, regulations, and interpretations in multiple jurisdictions in which we operate, including possible corporate tax reform in the U.S., actions resulting from the Organisation for Economic Co-operation and Development’s base erosion and profit shifting project, proposed actions by international bodies, as well as the requirements of certain tax rulings; |
• | The tax effects of purchase accounting for acquisitions and restructuring charges that may cause fluctuations between reporting periods; |
• | Tax assessments, or any related tax interest or penalties that could significantly affect our income tax expense for the period in which the settlements take place; and |
• | Taxes arising in connection with the recent divestiture of Veritas. |
We report our results of operations based on our determination of the aggregate amount of taxes owed in the tax jurisdictions in which we operate. From time to time, we receive notices that a tax authority in a particular jurisdiction believes that we owe a greater amount of tax than we have reported to such authority. We are regularly engaged in discussions and sometimes disputes with these tax authorities. We are engaged in disputes of this nature at this time. If the ultimate determination of our taxes owed in any of these jurisdictions is for an amount in excess of the tax provision we have recorded or reserved for, our operating results, cash flows, and financial condition could be adversely affected.
We cannot predict our future capital needs and we may be unable to obtain financing, which could have a material adverse effect on our business, results of operations and financial condition.
The onset or continuation of adverse economic conditions may make it more difficult to obtain financing for our operations, investing activities (including potential acquisitions or divestitures) or financing activities. Any required financing may not be available on terms acceptable to us, or at all. If we raise additional funds by obtaining loans from third parties, the terms of those financing arrangements may include negative covenants or other restrictions on our business that could impair our financial or operational flexibility, and would also require us to fund additional interest expense. If additional financing is not available when required or is not available on acceptable terms, we may be unable to successfully develop or enhance our software and
18
services through acquisitions in order to take advantage of business opportunities or respond to competitive pressures, which could have a material adverse effect on our software and services offerings, revenues, results of operations and financial condition.
Failure to maintain our credit ratings could adversely affect our liquidity, capital position, ability to hedge certain financial risks, borrowing costs and access to capital markets.
Our credit risk is evaluated by the major independent rating agencies, and such agencies have in the past and could in the future downgrade our ratings. We cannot assure you that we will be able to maintain our current credit ratings, and any additional actual or anticipated changes or downgrades in our credit ratings, including any announcement that our ratings are under further review for a downgrade, may further impact us in a similar manner and may have a negative impact on our liquidity, capital position, ability to hedge certain financial risks and access to capital markets. In addition, changes by any rating agency to our outlook or credit rating could increase the interest we pay on outstanding or future debt.
Our substantial level of indebtedness could adversely affect our financial condition.
As of March 31, 2017, we had an aggregate of $8.3 billion of outstanding indebtedness that will mature between calendar years 2017 and 2025, including approximately $4.6 billion in aggregate principal amount of existing senior notes and $3.7 billion of outstanding term loans under our senior credit facilities, and we may incur additional indebtedness in the future. In addition, as of March 31, 2017, we had $1.0 billion available for borrowing under our revolving credit facility. Our ability to pay interest and repay principal for our substantial level of indebtedness is dependent on our ability to manage our business operations, generate sufficient cash flows to service such debt and the other factors discussed in this section. There can be no assurance that we will be able to manage any of these risks successfully.
Our substantial level of indebtedness could have important consequences, including the following:
• | We must use a substantial portion of our cash flow from operations to pay interest and principal on the term loans and revolving credit facility, our existing notes and other indebtedness, which will reduce funds available to us for other purposes such as working capital, capital expenditures, other general corporate purposes and potential acquisitions; |
• | Our ability to refinance such indebtedness or to obtain additional financing for working capital, capital expenditures, acquisitions or general corporate purposes may be impaired; |
• | We will be exposed to fluctuations in interest rates because borrowings under our senior credit facilities bear interest at variable rates; |
• | Our leverage may be greater than that of some of our competitors, which may put us at a competitive disadvantage and reduce our flexibility in responding to current and changing industry and financial market conditions; |
• | We may be more vulnerable to the current economic downturn and adverse developments in our business; |
• | We may be unable to comply with financial and other restrictive covenants in our debt agreements, which could result in an event of default that, if not cured or waived, may result in acceleration of certain of our debt and would have an adverse effect on our business and prospects and could force us into bankruptcy or liquidation; |
• | In the event of the insolvency, liquidation, reorganization, dissolution or other winding up of our business, if there are not sufficient assets remaining to pay all creditors, then all or a portion of the amounts due on the notes then outstanding would remain unpaid; and |
• | Changes by any rating agency to our outlook or credit rating could negatively affect the value of both our debt and equity securities, adversely affect our access to debt markets, and increase the interest we pay on outstanding or future debt. |
We and our subsidiaries may be able to incur substantial additional indebtedness in the future, subject to the restrictions contained in the existing credit agreements and the terms of our other indebtedness. Our ability to access additional funding under our revolving credit facility will depend upon, among other things, the absence of a default under such facility, including any default arising from a failure to comply with the related covenants. If we are unable to comply with such covenants, our liquidity may be adversely affected. As of March 31, 2017, approximately $3.7 billion of our debt bore interest at variable rates and the adverse effect of a 50-basis point increase in interest rates would have increased such total annual cash interest by approximately $19 million.
Our ability to meet expenses, to remain in compliance with our covenants under our debt instruments and to make future principal and interest payments in respect of our debt depends on, among other things, our operating performance, competitive developments and financial market conditions, all of which are significantly affected by financial, business, economic and other factors. We are not able to control many of these factors. Accordingly, our cash flow may not be sufficient to allow us to pay principal and interest on our debt, including the notes, and meet our other obligations.
Our existing credit agreements impose operating and financial restrictions on us.
The existing credit agreements contain covenants that limit our ability and the ability of our restricted subsidiaries to:
• | Incur additional debt; |
• | Create liens on certain assets to secure debt; |
• | Enter into certain sale and leaseback transactions; |
19
• | Pay dividends on or make other distributions in respect of our capital stock or make other restricted payments; and |
• | Consolidate, merge, sell or otherwise dispose of all or substantially all of our assets. |
All of these covenants may adversely affect our ability to finance our operations, meet or otherwise address our capital needs, pursue business opportunities, react to market conditions or otherwise restrict activities or business plans. A breach of any of these covenants could result in a default in respect of the related indebtedness. If a default occurs, the relevant lenders could elect to declare the indebtedness, together with accrued interest and other fees, to be immediately due and payable and, to the extent such indebtedness is secured in the future, proceed against any collateral securing that indebtedness.
We may not have sufficient cash flows from operating activities to service or repay our indebtedness and meet our other cash needs and may be forced to take other actions to satisfy our obligations under our indebtedness, which may not be successful.
Our ability to make payments on and to refinance our indebtedness will depend on our ability to generate cash in the future. Our ability to generate cash will be subject to general economic, financial, competitive, legislative, regulatory and other factors, some of which are beyond our control. In particular, we have $6,810 million in aggregate principal amount of debt that is maturing within the next five fiscal years, $1,310 million of which is now being classified as current. If prevailing interest rates or other factors at the time of refinancing result in higher interest rates upon refinancing, then the interest expense relating to that refinanced indebtedness would increase. In addition, changes by any rating agency to our outlook or credit rating could increase the interest we pay on outstanding or future debt. Our future cash flow, cash on hand or available borrowings may not be sufficient to meet our obligations and commitments. If we are unable to generate sufficient cash flow from operations in the future to service or repay our indebtedness and to meet our other commitments, we will be required to adopt one or more alternatives, such as refinancing or restructuring our indebtedness, selling material assets or operations or seeking to raise additional debt or equity capital. These actions may not be effected on a timely basis or on satisfactory terms or at all, or these actions may not enable us to continue to satisfy our capital requirements. In addition, the existing credit agreements contain and any of our other debt agreements may contain restrictive covenants that may prohibit us from adopting any of these alternatives. Our failure to comply with these covenants could result in an event of default which, if not cured or waived, could result in the acceleration of all our debts.
In addition, we conduct a significant portion of our operations through our subsidiaries, none of which are generally guarantors of our debt. Accordingly, repayment of our indebtedness will be dependent in part on the generation of cash flow by our subsidiaries and their ability to make such cash available to us by dividend, debt repayment or otherwise. In general our subsidiaries will not have any obligation to pay amounts due on our debt or to make funds available for that purpose. Our subsidiaries may not be able to, or may not be permitted to, make distributions to enable us to make payments in respect of our indebtedness. Each subsidiary is a distinct legal entity, and under certain circumstances legal and contractual restrictions may limit our ability to obtain cash from our subsidiaries. In the event that we do not receive distributions from our subsidiaries, we may be unable to make the required principal and interest payments on our indebtedness. If we cannot make scheduled payments on our debt, we will be in default, and as a result, certain of our creditors could declare all outstanding principal and interest to be due and payable, the lenders under our revolving credit facility could terminate their commitments to loan money and we could be forced into bankruptcy or liquidation.
Our software products, SaaS offerings and website may be subject to intentional disruption that could adversely impact our reputation and future sales.
Despite our precautions and significant ongoing investments to protect against security risks, data protection breaches, cyber-attacks and other intentional disruptions of our products and offerings, we expect to be an ongoing target of attacks specifically designed to impede the performance and availability of our products and offerings and harm our reputation as a company. Similarly, experienced computer programmers may attempt to penetrate our network security or the security of our website and misappropriate proprietary information or cause interruptions of our services, including the operation of our global civilian cyber intelligence threat network.
Because the techniques used by such computer programmers to access or sabotage networks change frequently and may not be recognized until launched against a target, we may be unable to anticipate these techniques. The theft or unauthorized use or publication of our trade secrets and other confidential business information as a result of such an event could adversely affect our competitive position, reputation, brand and future sales of our products and offerings, and our customers may assert claims against us related to resulting losses of confidential or proprietary information. Furthermore, our employees or contractors may, either intentionally or unintentionally, subject us to information security risks and incidents. Our business could be subject to significant disruption, and we could suffer monetary and other losses and reputational harm, in the event of such incidents.
Some of our products contain “open source” software, and any failure to comply with the terms of one or more of these open source licenses could negatively affect our business.
Certain of our products are distributed with software licensed by its authors or other third parties under so-called “open source” licenses, which may include, by way of example, the GNU General Public License, GNU Lesser General Public License, the Mozilla Public License, the BSD License, and the Apache License.
Some of these licenses contain requirements that we make available source code for modifications or derivative works we create based upon the open source software, and that we license such modifications or derivative works under the terms of a particular open source license or other license granting third parties certain rights of further use. By the terms of certain open source licenses, we could be required to release the source code of our proprietary software if we combine our proprietary
20
software with open source software in a certain manner. In addition to risks related to license requirements, usage of open source software can lead to greater risks than use of third party commercial software, as open source licensors generally do not provide warranties or controls on origin of the software. We have established processes to help alleviate these risks, including a review process for screening requests from our development organizations for the use of open source, but we cannot be sure that all open source is submitted for approval prior to use in our products. In addition, many of the risks associated with usage of open source cannot be eliminated, and could, if not properly addressed, negatively affect our business.
If we are unable to adequately address increased customer demands through our technical support services, our relationships with our customers and our financial results may be adversely affected.
We offer technical support services with many of our products. We may be unable to respond quickly enough to accommodate short-term increases in customer demand for support services. We also may be unable to modify the format of our support services to compete with changes in support services provided by competitors or successfully integrate support for our customers. Further customer demand for these services, without corresponding revenues, could increase costs and adversely affect our operating results.
We have outsourced a substantial portion of our worldwide consumer support functions to third party service providers. If these companies experience financial difficulties, do not maintain sufficiently skilled workers and resources to satisfy our contracts, or otherwise fail to perform at a sufficient level under these contracts, the level of support services to our customers may be significantly disrupted, which could materially harm our relationships with these customers.
If we are unable to attract and retain qualified employees, lose key personnel, fail to integrate replacement personnel successfully, or fail to manage our employee base effectively, we may be unable to develop new and enhanced products and services, effectively manage or expand our business, or increase our revenues.
Our future success depends upon our ability to recruit and retain key management, technical, sales, marketing, finance and other personnel. Our officers and other key personnel are employees-at-will, and we cannot assure you that we will be able to retain them. Competition for people with the specific skills that we require is significant, and we face difficulties in attracting, retaining and motivating employees as a result. In connection with the acquisition of Blue Coat, we experienced management turnover and this may lead to employee attrition and related difficulties and these difficulties may continue or increase following our acquisition of LifeLock. In order to attract and retain personnel in a competitive marketplace, we believe that we must provide a competitive compensation package, including cash and equity-based compensation. The volatility in our stock price may from time to time adversely affect our ability to recruit or retain employees. In addition, we may be unable to obtain required stockholder approvals of future increases in the number of shares available for issuance under our equity compensation plans, and accounting rules require us to treat the issuance of equity-based compensation as compensation expense. As a result, we may decide to issue fewer equity-based incentives and may be impaired in our efforts to attract and retain necessary personnel. If we are unable to hire and retain qualified employees, or conversely, if we fail to manage employee performance or reduce staffing levels when required by market conditions, our business and operating results could be adversely affected.
Effective succession planning is also important to our long-term success. Failure to ensure effective transfer of knowledge and smooth transitions involving key employees could hinder our strategic planning and execution. From time to time, key personnel leave our company and the incidence of this increased in recent periods due to the transitions we have experienced over the last few years including the divestiture of Veritas. For example, in connection with the Blue Coat acquisition, we appointed their Chief Executive Officer, President and Chief Operating Officer and Chief Financial Officer to those positions in our company in fiscal 2017. While we strive to reduce the negative impact of changes in our leadership, the loss of any key employee could result in significant disruptions to our operations, including adversely affecting the timeliness of product releases, the successful implementation and completion of company initiatives, the effectiveness of our disclosure controls and procedures and our internal control over financial reporting, and our results of operations. In addition, hiring, training, and successfully integrating replacement sales and other personnel could be time consuming and expensive, may cause additional disruptions to our operations, and may be unsuccessful, which could negatively impact future financial results. These risks may be exacerbated by the uncertainty associated with the transitions we have experienced over the last few years.
Our contracts with the U.S. government include compliance, audit and review obligations. Any failure to meet these obligations could result in civil damages and/or penalties being assessed against us by the government.
We sell products and services through government contracting programs directly and via partners, though we no longer hold a GSA contract. In the ordinary course of business, sales under these government contracting programs may be subject to audit or investigation by the U.S. government. Noncompliance identified as a result of such reviews (as well as noncompliance identified on our own) could subject us to damages and other penalties, which could adversely affect our operating results and financial condition.
Item 1B. Unresolved Staff Comments
None.
21
Item 2. Properties
Our properties consist primarily of owned and leased office facilities for sales, research and development, administrative, customer service, and technical support personnel. Our corporate headquarters is located in Mountain View, California where we occupy facilities totaling approximately 794,000 square feet, of which 723,000 square feet is owned and 71,000 square feet is leased. We also lease an additional 116,000 square feet in the San Francisco Bay Area. Our leased facilities are occupied under agreements that expire on various dates through fiscal 2026. The following table presents the approximate square footage of our facilities as of March 31, 2017:
Approximate Square Footage (1) | |||||
Owned | Leased | ||||
(In thousands) | |||||
Americas (U.S., Canada and Latin America) | 1,512 | 952 | |||
EMEA (Europe, Middle East and Africa) | 177 | 295 | |||
APJ (Asia Pacific and Japan) | — | 1,088 | |||
Total approximate square footage | 1,689 | 2,335 | |||
(1) | Included in the total square footage above are vacant and available-for-lease properties totaling approximately 196,000 square feet. Total square footage excludes approximately 588,000 square feet relating to facilities subleased to third parties. |
We believe that our existing facilities are adequate for our current needs and that the productive capacity of our facilities is substantially utilized.
Item 3. Legal Proceedings
Information with respect to this Item may be found under the heading “Litigation contingencies” in Note 12 to the Consolidated Financial Statements in this Annual Report on Form 10-K which information is incorporated into this Item 3 by reference.
Item 4. Mine Safety Disclosures
Not applicable.
22
PART II
Item 5. Market for Registrant’s Common Equity, Related Stockholder Matters and Issuer Purchases of Equity Securities
Price range of common stock and number of stockholders
Our common stock is traded on the NASDAQ Global Select Market under the symbol “SYMC.” As of March 31, 2017, there were 1,763 stockholders of record. The high and low closing sales prices set forth below are as reported on the NASDAQ Global Select Market during each quarter of the two most recent fiscal years.
2017 | 2016 | ||||||||||||||||||||||||||||||
Fourth Quarter | Third Quarter | Second Quarter | First Quarter | Fourth Quarter | Third Quarter | Second Quarter | First Quarter | ||||||||||||||||||||||||
High | $ | 30.83 | $ | 25.45 | $ | 25.27 | $ | 21.24 | $ | 20.88 | $ | 21.37 | $ | 23.47 | $ | 25.90 | |||||||||||||||
Low | $ | 24.01 | $ | 23.49 | $ | 20.28 | $ | 16.60 | $ | 16.62 | $ | 19.50 | $ | 19.33 | $ | 23.03 | |||||||||||||||
Stock performance graph
The graph below compares the cumulative total stockholder return on our common stock with the cumulative total return on the S&P 500 Composite Index and the S&P Information Technology Index for the five fiscal years ended March 31, 2017 (assuming the initial investment of $100 in our common stock and in each of the other indices on the last day of trading for fiscal 2011, and the reinvestment of all dividends). The comparisons in the graph below are based on historical data and are not indicative of, nor intended to forecast the possible future performance of our common stock.
COMPARISON OF FIVE-YEAR CUMULATIVE TOTAL RETURN
Among Symantec Corporation, the S&P 500 Index
and the S&P Information Technology Index
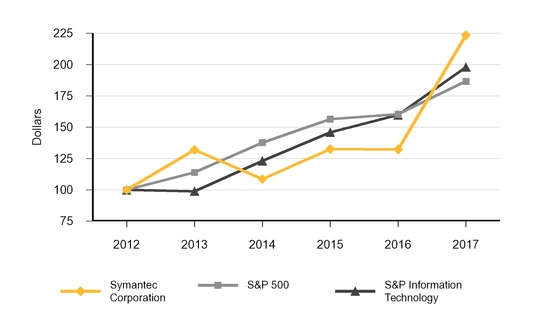
This performance graph shall not be deemed “filed” for purposes of Section 18 of the Exchange Act or otherwise subject to the liabilities under that Section, and shall not be deemed to be incorporated by reference into any filing of Symantec under the Securities Act or the Exchange Act.
Dividends
During fiscal 2017, 2016 and 2015, we declared and paid aggregate cash dividends and dividend equivalents of $222 million or $0.30 per common share, $3.0 billion or $4.60 per common share, and $413 million or $0.60 per common share, respectively. Dividends declared and paid each quarter during fiscal 2017, 2016 and 2015 were $0.075, $0.15 and $0.15 per share, respectively. Additionally, a special dividend of $4.00 per share was declared and paid in the fourth quarter of fiscal 2016. See Note 10 to the Consolidated Financial Statements for additional information regarding our dividends. All future dividends are subject to the approval of our Board of Directors.
23
Repurchases of our equity securities
Through our stock repurchase programs we have repurchased shares of our common stock since the fourth quarter of fiscal 2004. Under these programs, shares may be repurchased on the open market and through accelerated stock repurchase (“ASR”) transactions. Stock repurchases during the three months ended March 31, 2017, were as follows:
(In millions, except per share data) | Total Number of Shares Purchased (1) | Average Price Paid per Share (1) | Total Number of Shares Purchased as Part of Publicly Announced Program | Maximum Dollar Value of Shares That May Yet Be Purchased Under the Plans or Programs (2) | ||||||||||
December 31, 2016 to January 27, 2017 | — | $ | — | — | $ | 1,300 | ||||||||
January 28, 2017 to February 24, 2017 | — | $ | — | — | $ | 1,300 | ||||||||
February 25, 2017 to March 31, 2017 | 14.2 | $ | — | 14.2 | $ | 800 | ||||||||
Total number of shares repurchased | 14.2 | 14.2 | ||||||||||||
(1) | Pursuant to the March 2017 ASR, we made an upfront payment of $500 million and received and retired an initial delivery of 14.2 million shares of our common stock in March 2017. On May 19, 2017, which was in our first quarter of fiscal 2018, the ASR was completed, which, per the terms of the agreements, resulted in us receiving an additional 2.2 million shares of our common stock (these shares were excluded from the table above, as they were received after March 31, 2017). The total shares received under the terms of the ASR were 16.4 million, with an average price paid per share of $30.51. See Note 10 to the Consolidated Financial Statements for additional information regarding our stock repurchase programs. |
(2) | The approximate dollar value of the shares that may yet be purchased under the plans or programs for the period from February 25, 2017 to March 31, 2017 is reduced by the $500 million that reflects the aggregate value of the stock held back by the financial institutions pending final settlement of our ASR agreement. The remaining $800 million authorization, to be completed in future periods, does not have an expiration date. |
Item 6. Selected Financial Data
The following selected consolidated financial data is derived from our Consolidated Financial Statements. This data should be read in conjunction with our Consolidated Financial Statements and related notes included in this annual report and with Item 7. Management’s Discussion and Analysis of Financial Condition and Results of Operations. Historical results may not be indicative of future results.
Five-Year Summary
Summary of operations: | Year Ended (1) | ||||||||||||||||||
(In millions, except per share data) | March 31, 2017 (2) | April 1, 2016 (3) | April 3, 2015 | March 28, 2014 | March 29, 2013 | ||||||||||||||
Net revenues | $ | 4,019 | $ | 3,600 | $ | 3,956 | $ | 4,183 | $ | 4,268 | |||||||||
Operating income (loss) | $ | (100 | ) | $ | 457 | $ | 154 | $ | 144 | $ | (60 | ) | |||||||
Income (loss) from continuing operations | $ | (236 | ) | $ | (821 | ) | $ | 109 | $ | 91 | $ | (138 | ) | ||||||
Income from discontinued operations, net of income taxes (4) | $ | 130 | $ | 3,309 | $ | 769 | $ | 807 | $ | 893 | |||||||||
Net income (loss) | $ | (106 | ) | $ | 2,488 | $ | 878 | $ | 898 | $ | 755 | ||||||||
Income (loss) per share - basic: (5) | |||||||||||||||||||
Continuing operations | $ | (0.38 | ) | $ | (1.23 | ) | $ | 0.16 | $ | 0.13 | $ | (0.20 | ) | ||||||
Discontinued operations | $ | 0.21 | $ | 4.94 | $ | 1.12 | $ | 1.16 | $ | 1.27 | |||||||||
Net income (loss) per share - basic | $ | (0.17 | ) | $ | 3.71 | $ | 1.27 | $ | 1.29 | $ | 1.08 | ||||||||
Income (loss) per share - diluted: (5) | |||||||||||||||||||
Continuing operations | $ | (0.38 | ) | $ | (1.23 | ) | $ | 0.16 | $ | 0.13 | $ | (0.20 | ) | ||||||
Discontinued operations | $ | 0.21 | $ | 4.94 | $ | 1.10 | $ | 1.15 | $ | 1.27 | |||||||||
Net income (loss) per share - diluted | $ | (0.17 | ) | $ | 3.71 | $ | 1.26 | $ | 1.28 | $ | 1.08 | ||||||||
Weighted-average shares outstanding: | |||||||||||||||||||
Basic | 618 | 670 | 689 | 696 | 701 | ||||||||||||||
Diluted | 618 | 670 | 696 | 704 | 701 | ||||||||||||||
Cash dividends declared per common share | $ | 0.30 | $ | 4.60 | $ | 0.60 | $ | 0.60 | $ | — | |||||||||
Consolidated Balance Sheets Data: | |||||||||||||||||||
(In millions) | March 31, 2017 (6) (9) | April 1, 2016 (8) | April 3, 2015 | March 28, 2014 (7) | March 29, 2013 | ||||||||||||||
Total assets | $ | 18,174 | $ | 11,767 | $ | 13,233 | $ | 13,539 | $ | 14,508 | |||||||||
Long-term debt | $ | 6,876 | $ | 2,207 | $ | 1,746 | $ | 2,095 | $ | 2,094 | |||||||||
Total stockholders’ equity | $ | 3,487 | $ | 3,676 | $ | 5,935 | $ | 5,797 | $ | 5,476 | |||||||||
(1) | We have a 52/53-week fiscal year. Our fiscal 2015 was a 53-week year whereas fiscal 2017, 2016, 2014, and 2013, each consisted of 52 weeks. |
(2) | We acquired Blue Coat on August 1, 2016 and LifeLock on February 9, 2017 and the results of operations of those entities are included from their respective dates of acquisition. See Note 6 to the Consolidated Financial Statements for more information. |
(3) | In fiscal 2016, we recorded $1.1 billion in income tax expense related to unremitted earnings of foreign subsidiaries from the proceeds of the sale of Veritas. This charge is presented in loss from continuing operations in the Consolidated Statements of Operations for fiscal 2016. See Note 5 to the Consolidated Financial Statements for more information. |
(4) | In fiscal 2016, we sold the assets of Veritas to Carlyle for a net gain of $3.0 billion, which is presented as part of income from discontinued operations, net of income taxes in the Consolidated Statements of Operations for fiscal 2016. See Note 13 to the Consolidated Financial Statements for more information. |
(5) | Net income per share amounts may not add due to rounding. |
(6) | In fiscal 2017, we acquired total assets of $5.9 billion and $2.9 billion from Blue Coat and LifeLock, respectively. See Note 6 to the Consolidated Financial Statements for more information on our acquisitions. |
(7) | In fiscal 2014, the principal balance on our 1.00% Convertible Senior Notes matured and was settled by a cash payment of $1.0 billion. At the time of issuance of the 1.00% notes, we granted warrants to affiliates of certain initial purchasers of the notes whereby they had the option to purchase up to 52.7 million shares of our common stock. All the warrants expired unexercised during the second quarter of fiscal 2014. In the fourth quarter of fiscal 2016, we issued $500 million in principal amount of 2.50% Convertible Senior Notes, due in April of 2021. |
(8) | In fiscal 2016, the principal balance on our 2.75% Senior Notes due September 15, 2015, matured and was settled by a cash payment of $350 million. |
(9) | In fiscal 2017, we issued $3.8 billion in Senior Term Facilities due at various dates from May 2019 to August 2021, $1.25 billion in 2.0% Convertible Senior Notes due in August of 2021 and $1.1 billion in 5% Senior Notes due in April of 2025. The proceeds from these issuances were used primarily to fund our Blue Coat and LifeLock acquisitions. In addition, we reclassified $710 million to short-term obligations due to our Board’s approval to prepay some of our Senior Term Facility and $600 million of our 2.75% Senior Notes due June 15, 2017. See Note 8 to the Consolidated Financial Statements for more information on the Company’s long-term debt. |
24
Item 7. Management’s Discussion and Analysis of Financial Condition and Results of Operations
Please read the following discussion and analysis of our financial condition and results of operations together with our Consolidated Financial Statements and related Notes thereto included under Item 15 of this Annual Report on Form 10-K.
OVERVIEW
Fiscal calendar and basis of presentation
We have a 52/53-week fiscal year ending on the Friday closest to March 31. Unless otherwise stated, references to years in this report relate to fiscal year and periods ended March 31, 2017, April 1, 2016 and April 3, 2015. Our fiscal 2017 and 2016 were 52-week years whereas our fiscal 2015 was a 53-week year.
The results of Veritas are presented as discontinued operations in our Consolidated Statements of Operations and thus have been excluded from continuing operations and segment results for all reported periods. Accordingly, the following discussion reflects our current segment reporting structure, which was reduced from three to two segments, and segment results for all reported periods have been adjusted to conform to the current segment structure. In addition, the following discussion relates to our continuing operations unless stated otherwise.
Financial highlights and business trends
The following charts provide an overview of key financial metrics for each of the last three fiscal years in millions, except for percentage of revenues.
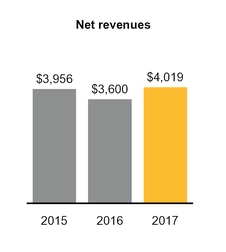
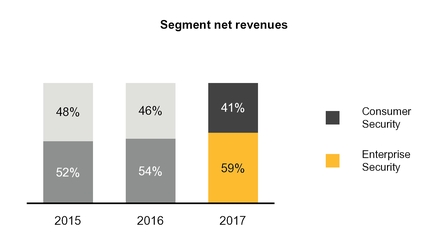
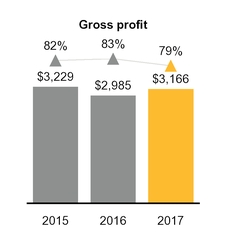
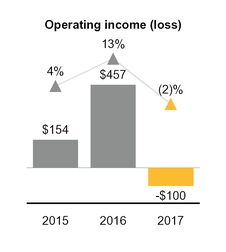
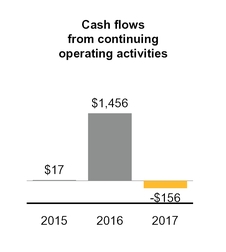
In fiscal 2017, we made two key acquisitions to expand our offerings in both our operating segments:
• | In August 2016, we acquired Blue Coat, a provider of advanced web security solutions for global enterprises and governments. The addition of Blue Coat’s suite of network and cloud security products to our Enterprise Security segment has enhanced our existing portfolio of threat protection and information protection products while positioning us to provide new cybersecurity solutions that address the ever-evolving threat landscape. |
• | In February 2017, we acquired LifeLock, a provider of proactive identity theft protection services for consumers and consumer risk management services for enterprises. The addition of LifeLock’s identity and fraud protection offerings to our Consumer Digital Safety segment allows us to provide a comprehensive digital safety solution designed to protect information across devices and users in the connected home and family. |
25
• | See Note 6 of the Consolidated Financial Statements for additional information about our acquisitions. |
Here are our key financial results for continuing operations in fiscal 2017 as compared to fiscal 2016:
• | Consolidated revenue increased by 12%, primarily driven by a 22% increase in revenue from our Enterprise Security segment due to the acquisition of Blue Coat. |
• | Consumer Digital Safety segment revenue remained relatively flat as the Norton-branded product revenue decline of 4% was largely offset by increased revenue of $67 million due to the acquisition of LifeLock. During fiscal 2017, the Norton-branded product revenue decline improved year-over-year as we benefited from the shift to subscription-based contracts. |
• | Our gross margin decreased four percentage points primarily due to lower relative gross margins on Blue Coat and LifeLock revenue as a result of the impact of acquisition-related write-downs of pre-acquisition deferred revenues. Additionally, our gross margin was negatively impacted by amortization of $122 million of acquired Blue Coat and LifeLock intangible assets and the write-up of acquired inventory of $24 million related to the Blue Coat acquisition. |
• | Our operating margin decreased fifteen percentage points primarily due to increased operating expenses as a result of Blue Coat and LifeLock post-acquisition operating expenses including stock-based compensation from assumed equity awards and amortization of acquired intangible assets. We also incurred acquisition-related and integration expenses of $120 million related to the Blue Coat and LifeLock acquisitions. In addition, restructuring, transition, and other related costs increased year-over-year as a result of the implementation of new cost saving initiatives. |
• | Cash paid for income taxes increased $779 million, primarily due to the one-time payment related to the gain on sale from the divestiture of Veritas during fiscal 2016. |
• | Deferred revenue increased 6% to $2.8 billion from $2.6 billion as of March 31, 2017 and April 1, 2016, respectively, mainly as a result of our Blue Coat and LifeLock acquisitions. The increase was partly offset by the amortization of deferred revenue from Veritas retained contracts. |
We expect our operating margin to fluctuate in future periods as a result of a number of factors, including our operating results and the timing and amount of expenses incurred.
RESULTS OF OPERATIONS
Segment operating results
Enterprise Security Segment by fiscal year
Our Enterprise Security segment protects organizations so they can securely conduct business while leveraging new platforms and data. The following tables are in millions except for percentage of revenues.
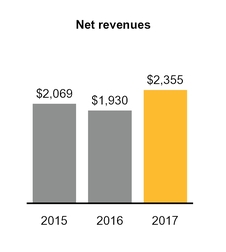
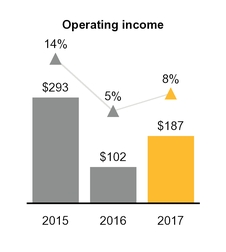
26
2017 compared to 2016
Revenue increased $425 million, or 22%, primarily due to $427 million in revenue from sales of Blue Coat network protection products. Due to the fair value adjustment of deferred revenue as a result of the accounting for the Blue Coat acquisition, we excluded revenue of $116 million in the post-acquisition period. In addition, services revenue increased $16 million while revenue from sales of endpoint management solutions decreased $23 million. Operating income increased $85 million, or 83%, primarily due to increased revenue, a reduction of expenses from new and ongoing cost savings initiatives, and favorable currency fluctuations of $16 million, and a decrease in unallocated corporate charges of $22 million. These increases were partially offset by increased expenses associated with the Blue Coat acquisition in the post-acquisition period, and acquired inventory write-up related to the Blue Coat acquisition of $24 million.
2016 compared to 2015
Revenue decreased $139 million, or 7%, primarily due to unfavorable foreign currency fluctuations of $90 million, as well as decrease in sales of endpoint management solutions and our mail cloud security products. Operating income decreased $191 million, or 65%, primarily due to decreased revenue and increased allocation of stranded costs. These stranded costs consist of overhead expenses resulting from the sale of Veritas and primarily include information technology infrastructure and services, and real estate costs. In addition, revenue decreased partially due to the impact of the additional week from the 53-week fiscal 2015 year.
Consumer Digital Safety Segment by fiscal year
Our Consumer Digital Safety segment focuses making it simple for customers to be productive and protected at home and at work. The following tables are in millions except for percentage of revenues.
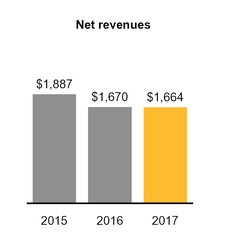
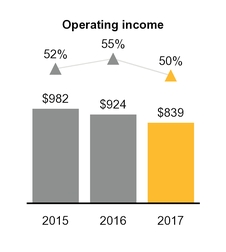
2017 compared to 2016
Revenue decreased $6 million primarily due to a decline in revenue from sales of Norton-branded products of $73 million as the revenue generated from customer additions was not sufficient to replace revenue lost through customer attrition. The decline was largely offset by a $67 million increase in revenue due to the acquisition of LifeLock. Due to the fair value adjustment of deferred revenue as a result of the accounting for the LifeLock acquisition, we excluded revenue of $28 million in the post-acquisition period. While the trend of declining revenues from sales of Norton-branded products continued in fiscal 2017, we began to benefit from the shift to subscription-based contracts, resulting in a lower decline in fiscal 2017 as compared to the prior two fiscal years. Operating income decreased $85 million, or 9%, primarily due to the Norton revenue decline coupled with a loss from LifeLock’s operations. LifeLock’s operating loss was a result of the deferred revenue fair value write-down.
2016 compared to 2015
Revenue decreased $217 million, or 11%, primarily due to new Norton customer acquisition not being sufficient to replace Norton customers lost through natural attrition and a reduction in revenue from OEM arrangements. Unfavorable currency fluctuations of $81 million also contributed to the decline in revenue. Operating income decreased $58 million, or 6%, primarily due to the decreases in revenue in this segment, which were partially offset by reductions in cost of revenue, sales and marketing and research and development expenses.
27
Net revenues by geographical region by fiscal year
Revenue by country as presented below is based on the billing location of the customer.
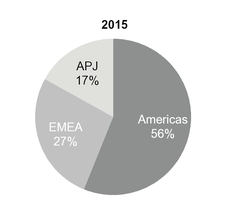
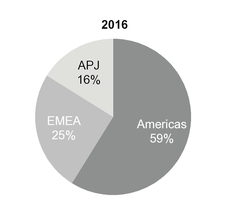
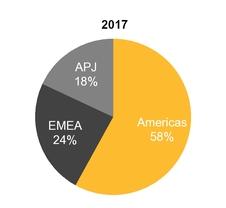
Total: | $ | 3,956 | million | Total: | $ | 3,600 | million | Total: | $ | 4,019 | million | |||||
Note: Americas include U.S., Canada and Latin America; EMEA includes Europe, Middle East and Africa; APJ includes Asia Pacific and Japan.
2017 compared to 2016
Fluctuations in the U.S. dollar compared to foreign currencies favorably impacted our international revenue by approximately $20 million for fiscal 2017 as compared to fiscal 2016. Fiscal 2017 revenue for the APJ region was favorably impacted by foreign currency fluctuations of $33 million. Fiscal 2017 revenue for the EMEA region was unfavorably impacted by foreign currency fluctuations of $13 million.
2016 compared to 2015
Fluctuations in the U.S. dollar compared to foreign currencies unfavorably impacted our international revenue by approximately $171 million for fiscal 2016 as compared to fiscal 2015. Fiscal 2016 revenue for the EMEA and APJ regions decreased primarily due to unfavorable foreign currency fluctuations of $119 million and $49 million, respectively, compared to fiscal 2015.
Our international sales are expected to continue to be a significant portion of our revenue. As a result, we expect revenue to continue to be affected by foreign currency exchange rates as compared to the U.S. dollar. We are unable to predict the extent to which revenue in future periods will be impacted by changes in foreign currency exchange rates. If international sales become a greater portion of our total sales in the future, changes in foreign currency exchange rates may have a potentially greater impact on our revenue and operating results.
Cost of revenues by fiscal year
Cost of revenues consists primarily of technical support costs, costs of billable services, fees to OEMs under revenue-sharing agreements, hardware costs, and fulfillment costs, as well as intangible asset amortization, and is presented below in millions except for percentage of revenues.
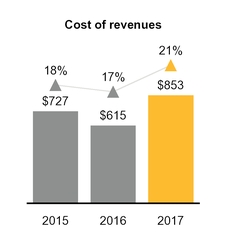
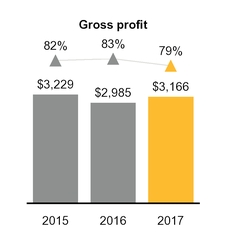
28
2017 compared to 2016
Our cost of revenues increased $238 million primarily due to $122 million of increased amortization related to the acquired Blue Coat and LifeLock intangible assets and other costs related to sales of the acquired Blue Coat and LifeLock products including an acquired product inventory fair value write-up of $24 million. These increases in cost of revenues were partially offset by a decrease in unallocated corporate charges of $22 million.
2016 compared to 2015
Our cost of revenues decreased $112 million primarily due to favorable currency effects, a decrease in OEM royalty fees, and a decrease in service related and content delivery expenses.
Operating expenses by fiscal year
The following charts are in millions except for percentage of revenues.
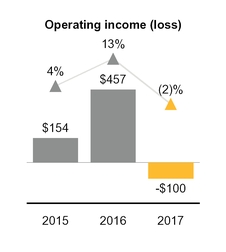
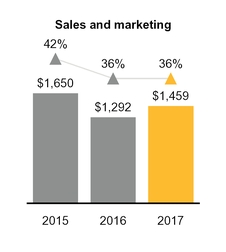
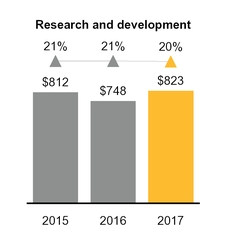
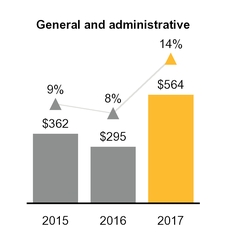
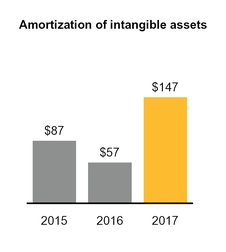
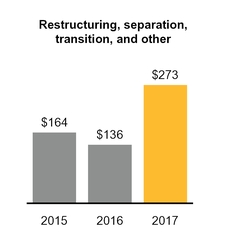
2017 compared to 2016
Sales and marketing expense increased $167 million primarily as a result of the acquisitions of Blue Coat and LifeLock, increased stock-based compensation expense of $54 million and increased integration expense of $24 million. These increases were partially offset by a reduction of expenses from new and ongoing cost savings initiatives and decreased unallocated corporate charges of $88 million.
Research and development expense increased $75 million primarily as a result of the acquisition of Blue Coat and an increase of $54 million of stock-based compensation expense. These increases were partially offset by a reduction of expenses from new and ongoing cost savings initiatives and decreased unallocated corporate charges of $44 million.
General and administrative expense increased $269 million primarily as a result of the acquisition of Blue Coat and an increase of $160 million of stock-based compensation expense. In addition, we incurred increased acquisition-related and integration expenses of $79 million. These increases were partly offset by a reduction of expenses from new and ongoing cost savings initiatives and decreased unallocated corporate charges of $32 million.
Our stock-based compensation in operating expenses increased $268 million primarily due to the equity awards assumed in the Blue Coat and LifeLock acquisitions, and the expected level of achievement for performance-based restricted stock units
29
(“PRUs”) granted in fiscal 2017. Our stock-based compensation expense will continue to fluctuate in future periods as a result of a number of factors including the achievement levels of PRU performance conditions.
Amortization of intangible assets increased $90 million primarily due to the intangible assets of $2.9 billion acquired in the Blue Coat and LifeLock acquisitions.
2016 compared to 2015
Sales and marketing expense decreased $358 million primarily due to a reduction of unallocated corporate charges of $328 million.
Research and development expense decreased $64 million primarily due to a reduction of unallocated corporate charges of $76 million.
General and administrative expenses decreased $67 million primarily due to a reduction of unallocated corporate charges of $91 million, partially offset by an increase in stock-based compensation expense.
Amortization of intangible assets decreased $30 million primarily due to certain intangible assets becoming fully amortized during fiscal 2015.
Restructuring, separation, transition, and other
We initiated a restructuring plan in the first quarter of fiscal 2017 to reduce complexity by means of long-term structural improvements. We expect to reduce headcount and close certain facilities in connection with the restructuring plan. These actions are expected to be completed in fiscal 2018. On an annual basis we expect this restructuring plan to generate net cost efficiencies and cost synergies which, when completed, will favorably impact our continuing operating expenses in excess of $550 million. As of March 31, 2017, in connection with this restructuring plan, we expect to incur approximately $240 million to $290 million in expenses in fiscal 2018.
Additionally, we expect continuing significant transition costs associated with the implementation of a new enterprise resource planning system and costs to automate business processes, as well as significant charges related to the integration of Blue Coat and LifeLock.
See Note 4 to the Consolidated Financial Statements for further information on our restructuring, separation, transition, and other related costs.
Non-operating expense, net by fiscal year
The following charts are in millions.
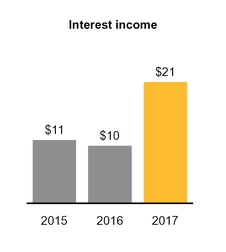
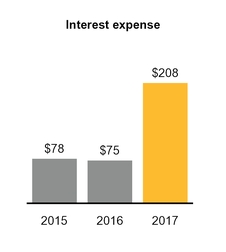
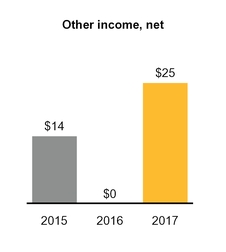
2017 compared to 2016
Non-operating expense, net, increased $97 million to $162 million from $65 million as of March 31, 2017 and April 1, 2016, respectively, primarily driven by an increase in interest expense of $133 million, mainly related to our increased borrowings in fiscal 2017. The non-operating expense, net increase was partially offset by increased income from transition service agreements (“TSA”) of $14 million, pursuant to which we provided Veritas certain limited services. See Note 8 and Note 13 to the Consolidated Financial Statements for more information about our debt and TSAs.
2016 compared to 2015
Non-operating expense, net, increased $12 million primarily due to net foreign currency remeasurement losses.
Provision for income taxes by fiscal year
We are a U.S.-based multinational company subject to tax in multiple U.S. and international tax jurisdictions. A substantial portion of our international earnings were generated from subsidiaries organized in Ireland and Singapore. Our results of operations would be adversely affected to the extent that our geographical mix of income becomes more weighted toward
30
jurisdictions with higher tax rates and would be favorably affected to the extent the relative geographic mix shifts to lower tax jurisdictions. Any change in our mix of earnings is dependent upon many factors and is therefore difficult to predict. See Note 5 to the Consolidated Financial Statements for more information.
The following charts are in millions except for percentages.
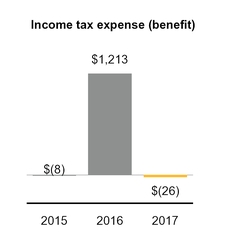
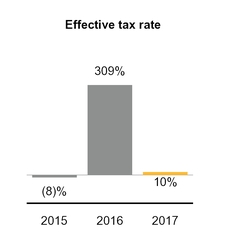
2017 compared to 2016
The decrease in our effective tax rate in 2017 as compared to 2016 was primarily driven by tax expense of $1.1 billion in 2016 for providing U.S. taxes on certain undistributed foreign earnings, primarily those attributable to the sale of Veritas, partially offset by tax expense of $52 million in 2017 related to the loss of tax attributes as a result of restructuring activities.
2016 compared to 2015
The increase in our effective tax rate in 2016 compared to 2015 was primarily driven by $1.1 billion of tax expense in 2016 for providing U.S. taxes on certain undistributed foreign earnings, primarily those attributable to the sale of Veritas.
LIQUIDITY AND CAPITAL RESOURCES
Sources and uses of cash
We have historically relied on cash flow from operations, borrowings under credit facilities, issuances of debt and equity securities, and sale of business, more recently, for our liquidity needs. As of March 31, 2017, we had cash, cash equivalents and short-term investments of $4.3 billion, of which $9 million is included in our other current assets. We also have an unused credit facility of $1.0 billion resulting in a liquidity position of approximately $5.3 billion. As of March 31, 2017, $3.3 billion in cash, cash equivalents, and short-term investments were held by our foreign subsidiaries. We have provided U.S. deferred taxes on a portion of our undistributed foreign earnings sufficient to address the incremental U.S. tax that would be due if we needed such portion of these funds to support our operations in the U.S.
Our principal cash requirements primarily consists of acquisitions, payment of taxes, operating expenses and working capital, capital expenditures, payment of principal and interest on debt, and restructuring and integration costs. Also, we may engage, from time to time, in the open market purchase of our notes prior to their maturity. Furthermore, our capital allocation strategy contemplates a quarterly cash dividend. In addition, we regularly evaluate our ability to repurchase shares of our common stock.
31
Cash flows
The following charts summarize cash provided by (used in) our Consolidated Statements of Cash Flows for fiscal 2015, 2016 and 2017 in millions.
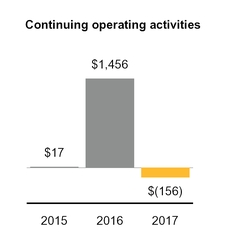
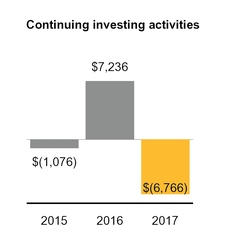
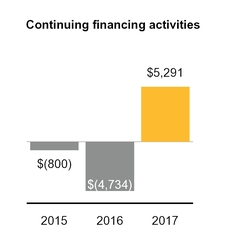
Continuing operating activities
Our primary source of cash from continuing operating activities has been from cash collections from our customers. Due to seasonality, our orders are generally higher in our third and fourth fiscal quarters and lower in our first and second fiscal quarters. We therefore expect cash inflows from continuing operating activities to be affected by fluctuations in billings and timing of collections.
Our primary uses of cash from our continuing operating activities include payments for income taxes, payments for compensation and related costs, payments to our resellers and distribution partners, and other general corporate expenditures.
The change in continuing operating activities in fiscal 2017 compared to fiscal 2016 was primarily due to the cash payment for taxes of $887 million as a result of the gain on sale from the divestiture of Veritas, changes in working capital, and lower income from continuing operations, adjusted for non-cash items.
The change in continuing operating activities in fiscal 2016 compared to fiscal 2015 was primarily due to changes in working capital and higher income from continuing operations, adjusted for non-cash items.
Restructuring Plan. We initiated a restructuring plan in the first quarter of fiscal 2017 to reduce complexity by means of long-term structural improvements. We expect to reduce headcount and close certain facilities in connection with this restructuring plan. The total remaining cash payments in connection with the restructuring plan are expected to be approximately $270 million to $305 million. These actions are expected to be completed in fiscal 2018. See Note 4 to the Consolidated Financial Statements for more information on our restructuring plans.
Continuing investing activities
Our investing cash flows consist primarily of acquisitions, capital expenditures and investment purchases, sales, and maturities. The change in continuing investing activities in fiscal 2017 compared to fiscal 2016 was primarily due to the net cash consideration paid for our acquisitions of Blue Coat and LifeLock during fiscal 2017 of $4.5 billion and $2.2 billion, respectively. In addition, our investing activities decreased due to the absence of proceeds from the divestiture of Veritas of $6.5 billion in fiscal 2016, and reduced proceeds from maturities and sales of short-term investments of $1.3 billion. The decrease was partially offset by reduced purchases of short-term investments of $378 million during fiscal 2016.
The change in continuing investing activities in fiscal 2016 compared to fiscal 2015 was primarily due to proceeds received from the divestiture of Veritas of $6.5 billion, increased proceeds from maturities and sales of short-term investments of $331 million, and decreases in our purchases of short-term investments of $1.4 billion.
Dissenter shares. As of March 31, 2017, we have accrued $68 million for dissenting shareholders as a result of our LifeLock acquisition.
Short-term investments. In order to achieve greater investment diversification and higher yields while maintaining our objectives of preservation of capital, liquidity, and safety, we plan to increase our holdings of short-term investments.
Continuing financing activities
Our financing cash flows consist primarily of issuance and repayment of debt, repurchases of common stock, and payment of dividends and dividend equivalents to stockholders. In fiscal 2017, our financing activities provided $5.3 billion of cash compared to $4.7 billion use of cash in fiscal 2016. The change in fiscal 2017 was primarily driven by our borrowing activities with net proceeds of $6.1 billion partially offset by reduction in stock repurchases of $1.4 billion and decrease in quarterly dividend payments from $0.15 per share in fiscal 2016 to $0.075 per share in fiscal 2017. The dividend payments in fiscal 2016 also included a special dividend of $4.00 per share subsequent to the divestiture of Veritas.
32
The change in continuing financing activities in fiscal 2016 compared to fiscal 2015 was primarily due to increased cash dividends and dividend equivalent payments of $2.6 billion, increased repurchases of common stock of $1.3 billion and an increase in the repayment of maturing senior notes and other obligations of $347 million, partially offset by proceeds from the issuance of convertible senior notes of $500 million.
We have made, and may from time to time in the future make, optional repayments of our debt obligations, which may include repurchases of our outstanding debt, depending on various factors, such as market conditions.
Interest payments on $3.7 billion of our variable-rate borrowings are subject to change based on market interest rates.
Borrowings. Proceeds from and repayments of borrowings fluctuate from year to year based on the amounts paid to fund acquisitions, and debt repayments. The charts below set forth total debt issued, repaid and the amount of unused credit facility for fiscal 2015, 2016 and 2017 in millions.
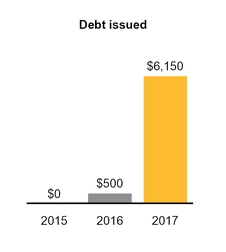
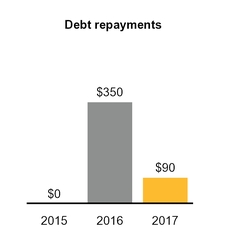
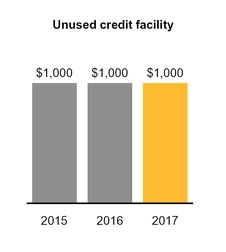
Credit ratings. Our credit ratings were lowered as a result of the debt we incurred due to the LifeLock acquisition. Our borrowing costs depend, in part, on our credit ratings and any further actions taken by these credit rating agencies to lower our credit ratings will likely increase our borrowing costs.
See Note 8 to the Consolidated Financial Statements for further information on our debt repayments and borrowings.
Prepayments of debt. Subsequent to March 31, 2017, we prepaid $710 million of our Senior Term Loan A-5 and $100 million of our Senior Term Loan A-1 on April 5, 2017 and May 5, 2017, respectively.
Share repurchases and dividends. Under our stock repurchase programs, we may purchase shares of our outstanding common stock through open market and through ASR transactions. On November 20, 2016, our Board of Directors increased the authorization under our stock repurchase program by $510 million. In March 2017, we entered into ASR agreements with financial institutions (the “March 2017 ASR”) to repurchase an aggregate $500 million of our common stock. The remaining $800 million authorization, to be completed in future periods, does not have an expiration date.
On May 10, 2017, we declared a cash dividend of $0.075 per share of common stock to be paid on June 21, 2017 to all stockholders of record as of the close of business on June 7, 2017. All shares of common stock issued and outstanding and unvested RSUs and PRUs as of the record date will be entitled to the dividend and dividend equivalents, respectively. Any future dividends and dividend equivalents will be subject to the approval of our Board of Directors.
33
The chart below sets forth information on our share repurchases and dividends and dividend equivalents paid in fiscal 2015, 2016 and 2017 in millions.
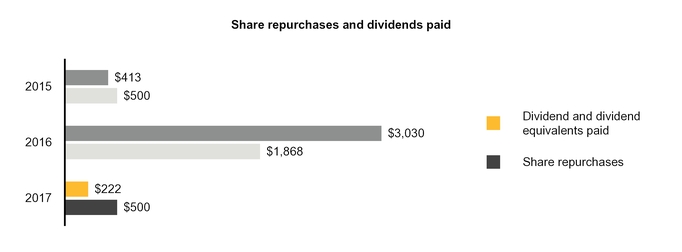
See Note 10 to the Consolidated Financial Statements for more information on our share repurchases and dividends and dividend equivalents.
Contractual obligations
The following is a schedule by years of our significant contractual obligations as of March 31, 2017:
Payments Due by Fiscal Period | |||||||||||||||||||
(In millions) | Total | 2018 | 2019 - 2020 | 2021 - 2022 | Thereafter | ||||||||||||||
Debt (1) | $ | 8,310 | $ | 1,310 | $ | 2,000 | $ | 3,500 | $ | 1,500 | |||||||||
Interest payments on debt (2) | 1,059 | 208 | 405 | 246 | 200 | ||||||||||||||
Purchase obligations (3) | 154 | 125 | 28 | 1 | — | ||||||||||||||
Operating leases (4) | 327 | 88 | 125 | 73 | 41 | ||||||||||||||
Total | $ | 9,850 | $ | 1,731 | $ | 2,558 | $ | 3,820 | $ | 1,741 | |||||||||
(1) | See Note 8 to the Consolidated Financial Statements for further information on our debt. |
(2) | Interest payments were calculated based on the contractual terms of the related Senior Notes, Convertible Senior Notes and Senior Term Facilities. Interest on variable rate debt was calculated using the interest rate in effect as of March 31, 2017. See Note 8 to the Consolidated Financial Statements for further information on the Senior Notes, Convertible Senior Notes and Senior Term Facilities. |
(3) | These amounts are associated with agreements for purchases of goods or services generally including agreements that are enforceable and legally binding and that specify all significant terms, including fixed or minimum quantities to be purchased; fixed, minimum, or variable price provisions; and the approximate timing of the transaction. The table above also includes agreements to purchase goods or services that have cancellation provisions requiring little or no payment. The amounts under such contracts are included in the table above because management believes that cancellation of these contracts is unlikely and we expect to make future cash payments according to the contract terms or in similar amounts for similar materials. |
(4) | We have entered into various non-cancelable operating lease agreements that expire on various dates through fiscal 2026. The amounts in the table above exclude expected sublease income. |
Due to the uncertainty with respect to the timing of future cash flows associated with our unrecognized tax benefits as of March 31, 2017 we are unable to make reasonably reliable estimates of the period of cash settlement with the respective taxing authorities. Therefore, $251 million in long-term income taxes payable has been excluded from the contractual obligations table. See Note 5 to the Consolidated Financial Statements for further information.
Indemnifications
In the ordinary course of business, we may provide indemnifications of varying scope and terms to customers, vendors, lessors, business partners, subsidiaries and other parties with respect to certain matters, including, but not limited to, losses arising out of our breach of agreements or representations and warranties made by us. Refer to Note 12 to the Consolidated Financial Statements for further information on our indemnifications.
34
CRITICAL ACCOUNTING POLICIES AND ESTIMATES
The methods, estimates and judgments that we use in applying our accounting policies have a significant impact on our financial position and the results that we report in our Consolidated Financial Statements. Some of these policies required us to make subjective estimates and apply judgment regarding matters that are inherently uncertain.
Our most critical estimates included:
• | The allocation of revenue to various components of our multiple element arrangements which may contain hardware, software, licenses, maintenance and service contracts. |
• | The valuation and allocation of the purchase price paid for acquired assets and liabilities assumed in connection with our acquisitions, which impacts our gross margin and operating expenses in periods subsequent to the acquisition. |
• | The evaluation of the recoverability of long-lived assets (property, and equipment, identified intangibles, and goodwill), which impacts gross margin or operating expenses when we record impairments or accelerate their depreciation or amortization. |
• | The determination of the fair value of stock options using a Black-Scholes options pricing model, which impact our gross margin and operating expenses over the option’s vesting period. |
• | The recognition and measurement of current and deferred income taxes (including the measurement of current and deferred income taxes, including the measurement of uncertain tax positions), which impact our provision for taxes as well as tax-related assets and liabilities. |
• | The recognition and measurement of loss contingencies, which impact gross margin or operating expenses when we recognize a loss contingency, revise the estimate for a loss contingency, or record an asset impairment. |
See Note 1 to the Consolidated Financial Statements in this annual report for further information on our critical accounting estimates and policies.
Recently issued authoritative guidance
Revenue Recognition - Contracts with Customers. In May 2014, the Financial Accounting Standards Board (“FASB”) issued new authoritative guidance for revenue from contracts with customers. The standard’s core principle is that a company will recognize revenue when it transfers promised goods or services to customers in an amount that reflects the consideration that the company expects to receive in exchange for those goods or services. In doing so, companies will need to use more judgment and make more estimates than under current guidance. These may include identifying performance obligations in the contract, estimating the amount of variable consideration to include in the transaction price, and allocating the transaction price to each separate performance obligation. In March 2016, the FASB clarified implementation guidance on principal versus agent considerations. In April 2016, the FASB issued guidance related to identifying performance obligations and licensing which reduces the cost and complexity of applying certain aspects of the guidance both at implementation and on an ongoing basis.
The new guidance may be applied retrospectively to each prior period presented (“retrospective”) or retrospectively with cumulative effect recognized in retained earnings as of the date of adoption (“modified retrospective”). We expect to adopt the new standard on a modified retrospective basis in the first quarter of fiscal 2019. We are currently evaluating the impact of the adoption of this guidance on our Consolidated Financial Statements.
Financial Instruments - Recognition and Measurement. In January 2016, the FASB issued new authoritative guidance on financial instruments. The new guidance enhances the reporting model for financial instruments, which includes amendments to address aspects of recognition, measurement, presentation and disclosure. The new guidance will be effective for us in our first quarter of fiscal 2019. Early adoption is permitted under limited circumstances but we do not intend to adopt the provisions of the new guidance early. We are currently evaluating the impact of the adoption of this guidance on our Consolidated Financial Statements.
Leases. In February 2016, the FASB issued new guidance on lease accounting which will require lessees to recognize assets and liabilities on their balance sheet for the rights and obligations created by operating leases and will also require disclosures designed to give users of financial statements information on the amount, timing, and uncertainty of cash flows arising from leases. The new guidance will be effective for us in our first quarter of fiscal 2020. Early adoption is permitted but we do not plan to adopt the provisions of the new guidance early. We are currently evaluating the impact of the adoption of this guidance on our Consolidated Financial Statements.
Employee Stock-Based Compensation. In March 2016, the FASB issued new guidance on accounting for employee stock-based compensation, which requires all income tax effects of awards to be recognized in the income statement when the awards vest or are settled, as well as revising guidance related to classification of awards as either equity or liabilities, accounting for forfeitures and classification of excess tax benefits or deficiencies on the statement of cash flows. We are electing to continue to estimate forfeitures to determine the amount of compensation cost to be recognized in each period. We do not anticipate a material impact on the Consolidated Financial Statements from the cumulative effect of these changes. The new guidance will be effective for us in our first quarter of fiscal 2018.
Credit Losses. In June 2016, the FASB issued new authoritative guidance on credit losses which changes the impairment model for most financial assets and certain other instruments. For trade receivables and other instruments, we will be required to use a new forward-looking “expected loss” model. Additionally, for available-for-sale debt securities with unrealized losses, we will measure credit losses in a manner similar to today, except that the losses will be recognized as allowances rather than
35
reductions in the amortized cost of the securities. The standard will be effective for us in our first quarter of fiscal 2021. We are currently evaluating the impact of the adoption of this guidance on our Consolidated Financial Statements.
Income Taxes - Intra-Entity Asset Transfers Other Than Inventory. In October 2016, the FASB issued new authoritative guidance that requires entities to immediately recognize the tax consequences of intercompany asset transfers, excluding inventory, at the transaction date, rather than deferring the tax consequences under current U.S. GAAP. The standard will be effective for us in our first quarter of fiscal 2019, and requires a modified retrospective transition method. We are currently evaluating the impact of the adoption of this guidance and anticipate it will have a material impact on our Consolidated Financial Statements.
Item 7A. Quantitative and Qualitative Disclosures about Market Risk
We are exposed to various market risks related to fluctuations in interest rates and foreign currency exchange rates. We may use derivative financial instruments to mitigate certain risks in accordance with our investment and foreign exchange policies. We do not use derivatives or other financial instruments for trading or speculative purposes.
Interest rate risk
As of March 31, 2017, we had $4.6 billion in principal amount of fixed-rate Senior Notes and Convertible Senior Notes outstanding, with a carrying amount of $4.6 billion and a fair value of $4.6 billion, based on level 2 inputs. As of April 1, 2016, we had $2.3 billion in principal amount of fixed-rate Senior Notes outstanding, with a carrying amount of $2.2 billion and a fair value of $2.3 billion, based on level 2 inputs.
We have considered the historical volatility of interest rates and determined that it is possible that adverse changes in interest rates related to our fixed and variable rate debt could occur. A reasonably possible hypothetical adverse change of 50-basis points could result in a $92 million fair value reduction of our fixed-rate borrowings as of March 31, 2017, compared to a $41 million fair value reduction as of April 1, 2016. A reasonably possible hypothetical adverse change of 50-basis points in the effective interest rate of our $3.7 billion of variable-rate borrowings could result in an incremental $19 million of pre-tax interest expense on an annualized basis.
Foreign currency exchange rate risk
We conduct business in numerous currencies through our worldwide operations and, as such, we are exposed to foreign currency risk. Our entities conduct their businesses in the primary local currency in which they operate, however, they may also conduct business in other currencies. To the extent our entities hold monetary assets or liabilities, earn revenues or incur costs in currencies other than the entity’s functional currency, they are exposed to foreign exchange gains or losses and impacts to margins as a result. As part of our foreign currency risk mitigation strategy, we have entered into foreign exchange forward contracts with up to six months in duration to help mitigate foreign exchange risk, however we are not able to mitigate all of our foreign exchange risk. We have considered historical trends in exchange rates and determined that it is possible that adverse changes in exchange rates for any currency could occur. The estimated impacts of a ten percent appreciation or depreciation of foreign currency are as follows in millions:
March 31, 2017 | April 1, 2016 | |||||||||||||||||||||||
Change in Fair Value Due to 10% | Change in Fair Value Due to 10% | |||||||||||||||||||||||
Foreign Exchange Forward Contract | Notional Amount | Appreciation | Depreciation | Notional Amount | Appreciation | Depreciation | ||||||||||||||||||
Purchased | $ | 492 | $ | 49 | $ | (49 | ) | $ | 693 | $ | 69 | $ | (69 | ) | ||||||||||
Sold | (204 | ) | (20 | ) | 20 | (198 | ) | (19 | ) | 19 | ||||||||||||||
Total net outstanding contracts | $ | 288 | $ | 29 | $ | (29 | ) | $ | 495 | $ | 50 | $ | (50 | ) | ||||||||||
We do not use derivative financial instruments for speculative trading purposes, nor do we hedge our foreign currency exposure in a manner that entirely offsets the effects of the changes in foreign exchange rates.
36
Item 8. Financial Statements and Supplementary Data
The Consolidated Financial Statements and related disclosures included in Part IV, Item 15 of this annual report are incorporated by reference into this Item 8.
Selected Quarterly Financial Data (Unaudited)
Fiscal 2017 | Fiscal 2016 | ||||||||||||||||||||||||||||||
(In millions, except per share data) | Fourth Quarter | Third Quarter | Second Quarter | First Quarter | Fourth Quarter | Third Quarter | Second Quarter | First Quarter | |||||||||||||||||||||||
Net revenues | $ | 1,115 | $ | 1,041 | $ | 979 | $ | 884 | $ | 873 | $ | 909 | $ | 906 | $ | 912 | |||||||||||||||
Gross profit | 856 | 806 | 769 | 735 | 726 | 759 | 746 | 754 | |||||||||||||||||||||||
Operating income (loss) | (178 | ) | (16 | ) | (12 | ) | 106 | 128 | 146 | 100 | 83 | ||||||||||||||||||||
Income (loss) from continuing operations | (177 | ) | (56 | ) | (69 | ) | 66 | (1,013 | ) | 114 | 53 | 25 | |||||||||||||||||||
Income (loss) from discontinued operations, net of income taxes | 34 | 102 | (75 | ) | 69 | 3,058 | 56 | 103 | 92 | ||||||||||||||||||||||
Net income (loss) | (143 | ) | 46 | (144 | ) | 135 | 2,045 | 170 | 156 | 117 | |||||||||||||||||||||
Income (loss) per share - basic: | |||||||||||||||||||||||||||||||
Continuing operations | $ | (0.29 | ) | $ | (0.09 | ) | $ | (0.11 | ) | $ | 0.11 | $ | (1.56 | ) | $ | 0.17 | $ | 0.08 | $ | 0.04 | |||||||||||
Discontinued operations | $ | 0.06 | $ | 0.16 | $ | (0.12 | ) | $ | 0.11 | $ | 4.70 | $ | 0.08 | $ | 0.15 | $ | 0.13 | ||||||||||||||
Net income (loss) per share - basic | $ | (0.23 | ) | $ | 0.07 | $ | (0.23 | ) | $ | 0.22 | $ | 3.15 | $ | 0.26 | $ | 0.23 | $ | 0.17 | |||||||||||||
Income (loss) per share - diluted: | |||||||||||||||||||||||||||||||
Continuing operations | $ | (0.29 | ) | $ | (0.09 | ) | $ | (0.11 | ) | $ | 0.11 | $ | (1.56 | ) | $ | 0.17 | $ | 0.08 | $ | 0.04 | |||||||||||
Discontinued operations | $ | 0.06 | $ | 0.16 | $ | (0.12 | ) | $ | 0.11 | $ | 4.70 | $ | 0.08 | $ | 0.15 | $ | 0.13 | ||||||||||||||
Net income (loss) per share - diluted | $ | (0.23 | ) | $ | 0.07 | $ | (0.23 | ) | $ | 0.22 | $ | 3.15 | $ | 0.25 | $ | 0.23 | $ | 0.17 | |||||||||||||
Note: Net income (loss) per share amounts may not add due to rounding.
Item 9. Changes in and Disagreements with Accountants on Accounting and Financial Disclosure
None.
Item 9A. Controls and Procedures
a) Evaluation of Disclosure Controls and Procedures
The SEC defines the term “disclosure controls and procedures” to mean a company’s controls and other procedures that are designed to ensure that information required to be disclosed in the reports that it files or submits under the Exchange Act is recorded, processed, summarized, and reported, within the time periods specified in the SEC’s rules and forms. “Disclosure controls and procedures” include, without limitation, controls and procedures designed to ensure that information required to be disclosed by an issuer in the reports that it files or submits under the Exchange Act is accumulated and communicated to the issuer’s management, including its principal executive and principal financial officers, or persons performing similar functions, as appropriate to allow timely decisions regarding required disclosure. Our disclosure controls and procedures are designed to provide reasonable assurance that such information is accumulated and communicated to our management. Our management (with the participation of our Chief Executive Officer and Chief Financial Officer) has conducted an evaluation of the effectiveness of our disclosure controls and procedures (as defined in Rules 13a-15(e) and 15d-15(e) of the Securities Exchange Act). Based on such evaluation, our Chief Executive Officer and our Chief Financial Officer have concluded that our disclosure controls and procedures were effective at the reasonable assurance level as of the end of the period covered by this report.
b) Management’s Report on Internal Control over Financial Reporting
Our management is responsible for establishing and maintaining adequate internal control over financial reporting (as defined in Rules 13a-15(f) and 15d-15(f) of the Exchange Act) for Symantec. Our management, with the participation of our Chief Executive Officer and our Chief Financial Officer, has conducted an evaluation of the effectiveness of our internal control over financial reporting as of March 31, 2017, based on criteria established in Internal Control - Integrated Framework (2013) issued by the Committee of Sponsoring Organizations of the Treadway Commission (“COSO”).
In accordance with guidance issued by the Securities and Exchange Commission, companies are permitted to exclude acquisitions from their final assessment of internal control over financial reporting for the first fiscal year in which the acquisition occurred. Our management’s evaluation of internal control over financial reporting excluded the internal control activities of Blue
37
Coat and LifeLock, which we acquired in August 2016 and February 2017, respectively, as discussed in Note 6 to the Consolidated Financial Statements. We have included the financial results of Blue Coat and LifeLock in the Consolidated Financial Statements from the dates of acquisition. Total revenues subject to Blue Coat’s internal control over financial reporting represented approximately 11% of our consolidated revenues for the fiscal year ended March 31, 2017. Total assets subject to Blue Coat’s internal control over financial reporting represented approximately 4% of our consolidated total assets as of March 31, 2017. Total revenues subject to LifeLock’s internal control over financial reporting represented approximately 2% of our consolidated revenues for the fiscal year ended March 31, 2017. Total assets subject to LifeLock’s internal control over financial reporting represented approximately 2% of our consolidated total assets as of March 31, 2017. Blue Coat’s and LifeLock’s goodwill and intangible assets were subject to our management’s evaluation of internal control over financial reporting.
Our management has concluded that, as of March 31, 2017, our internal control over financial reporting was effective at the reasonable assurance level based on these criteria.
The Company’s independent registered public accounting firm has issued an attestation report regarding its assessment of the Company’s internal control over financial reporting as of March 31, 2017, which is included in Part IV, Item 15 of this annual report.
c) Changes in Internal Control over Financial Reporting
There were no changes in our internal control over financial reporting during the quarter ended March 31, 2017, that have materially affected, or are reasonably likely to materially affect, our internal control over financial reporting.
d) Limitations on Effectiveness of Controls
Our management, including our Chief Executive Officer and Chief Financial Officer, does not expect that our disclosure controls and procedures or our internal controls will prevent all errors and all fraud. A control system, no matter how well conceived and operated, can provide only reasonable, not absolute, assurance that the objectives of the control system are met. Further, the design of a control system must reflect the fact that there are resource constraints, and the benefits of controls must be considered relative to their costs. Because of the inherent limitations in all control systems, no evaluation of controls can provide absolute assurance that all control issues and instances of fraud, if any, within our company have been detected. Accordingly, our disclosure controls and procedures provide reasonable assurance of achieving their objectives.
Item 9B. Other Information
The information below is reported in lieu of information that would be reported under Items 5.03 under Form 8-K.
On May 17, 2017, our Board of Directors (the “Board”) adopted amendments to our Bylaws, as amended (the “Bylaws”), to implement proxy access. As amended, the Bylaws include a new Section 1.13 permitting a stockholder, or a group of up to 50 stockholders, owning continuously for at least three years a number of shares of our common stock that constitutes at least 3% of the outstanding shares of our common stock, to nominate and include in our proxy materials director nominees constituting up to the greater of two individuals or 20% of the Board, provided that the stockholder(s) and the nominee(s) satisfy the requirements specified in the Bylaws. The amended Bylaws also reflect certain conforming and clarifying changes in Section 1.12 of the Bylaws.
The description of the Bylaws contained herein is qualified in its entirety by reference to the Bylaws, a copy of which is filed herewith as Exhibit 3.05 and is incorporated herein by reference.
38
PART III
Item 10. Directors, Executive Officers and Corporate Governance
The information required by this item will be included under the caption “Directors, Executive Officers, and Corporate Governance” in our Proxy Statement for the 2017 Annual Meeting of Stockholders to be filed with the SEC within 120 days of the fiscal year ended March 31, 2017 (“2017 Proxy Statement”) and is incorporated herein by reference.
Item 11. Executive Compensation
The information required by this item will be included under the caption “Executive Compensation” in our 2017 Proxy Statement and is incorporated herein by reference.
Item 12. Security Ownership of Certain Beneficial Owners and Management and Related Stockholder Matters
The information required by this item will be included under the caption “Security Ownership of Certain Beneficial Owners and Management and Related Stockholder Matters” in our 2017 Proxy Statement and is incorporated herein by reference.
Item 13. Certain Relationships and Related Transactions, and Director Independence
The information required by this item will be included under the caption “Certain Relationships and Related Transactions, and Director Independence” in our 2017 Proxy Statement and is incorporated herein by reference.
Item 14. Principal Accounting Fees and Services
The information required by this item will be included under the caption “Principal Accountant Fees and Services” in our 2017 Proxy Statement and is incorporated herein by reference.
39
PART IV
Item 15. Exhibits, Financial Statement Schedules
Upon written request, we will provide, without charge, a copy of this annual report, including the Consolidated Financial Statements and financial statement schedule. All requests should be sent to:
Symantec Corporation
Attn: Investor Relations
350 Ellis Street
Mountain View, California 94043
(650) 527-8000
The following documents are filed as part of this report:
Page | ||
1. | Consolidated Financial Statements: | |
Financial statement schedules have been omitted since they are either not required, not applicable, or the information is otherwise included. | ||
2. | ||
40
REPORT OF INDEPENDENT REGISTERED PUBLIC ACCOUNTING FIRM
The Board of Directors and Stockholders
Symantec Corporation:
We have audited the accompanying consolidated balance sheets of Symantec Corporation and subsidiaries as of March 31, 2017 and April 1, 2016, and the related consolidated statements of operations, comprehensive income (loss), stockholders’ equity, and cash flows for each of the years in the three-year period ended March 31, 2017. We also have audited Symantec Corporation’s internal control over financial reporting as of March 31, 2017, based on criteria established in Internal Control - Integrated Framework (2013) issued by the Committee of Sponsoring Organizations of the Treadway Commission (COSO). Symantec Corporation’s management is responsible for these consolidated financial statements, for maintaining effective internal control over financial reporting, and for its assessment of the effectiveness of internal control over financial reporting, included in Management’s Report on Internal Control over Financial Reporting appearing under Item 9A.b). Our responsibility is to express an opinion on these consolidated financial statements and an opinion on Symantec Corporation’s internal control over financial reporting based on our audits.
We conducted our audits in accordance with the standards of the Public Company Accounting Oversight Board (United States). Those standards require that we plan and perform the audits to obtain reasonable assurance about whether the financial statements are free of material misstatement and whether effective internal control over financial reporting was maintained in all material respects. Our audits of the consolidated financial statements included examining, on a test basis, evidence supporting the amounts and disclosures in the financial statements, assessing the accounting principles used and significant estimates made by management, and evaluating the overall financial statement presentation. Our audit of internal control over financial reporting included obtaining an understanding of internal control over financial reporting, assessing the risk that a material weakness exists, and testing and evaluating the design and operating effectiveness of internal control based on the assessed risk. Our audits also included performing such other procedures as we considered necessary in the circumstances. We believe that our audits provide a reasonable basis for our opinions.
A company’s internal control over financial reporting is a process designed to provide reasonable assurance regarding the reliability of financial reporting and the preparation of financial statements for external purposes in accordance with generally accepted accounting principles. A company’s internal control over financial reporting includes those policies and procedures that (1) pertain to the maintenance of records that, in reasonable detail, accurately and fairly reflect the transactions and dispositions of the assets of the company; (2) provide reasonable assurance that transactions are recorded as necessary to permit preparation of financial statements in accordance with generally accepted accounting principles, and that receipts and expenditures of the company are being made only in accordance with authorizations of management and directors of the company; and (3) provide reasonable assurance regarding prevention or timely detection of unauthorized acquisition, use, or disposition of the company’s assets that could have a material effect on the financial statements.
Because of its inherent limitations, internal control over financial reporting may not prevent or detect misstatements. Also, projections of any evaluation of effectiveness to future periods are subject to the risk that controls may become inadequate because of changes in conditions, or that the degree of compliance with the policies or procedures may deteriorate.
In our opinion, the consolidated financial statements referred to above present fairly, in all material respects, the financial position of Symantec Corporation and subsidiaries as of March 31, 2017 and April 1, 2016, and the results of their operations and their cash flows for each of the years in the three-year period ended March 31, 2017, in conformity with U.S. generally accepted accounting principles. Also in our opinion, Symantec Corporation maintained, in all material respects, effective internal control over financial reporting as of March 31, 2017, based on criteria established in Internal Control - Integrated Framework (2013) issued by the Committee of Sponsoring Organizations of the Treadway Commission (COSO).
Symantec Corporation acquired Blue Coat, Inc. (Blue Coat) and LifeLock, Inc. (LifeLock), in August 2016 and February 2017, respectively, as discussed in Note 6 to the Consolidated Financial Statements. Management excluded from its assessment of the effectiveness of Symantec Corporation’s internal control over financial reporting as of March 31, 2017, Blue Coat’s internal control over financial reporting associated with consolidated total assets of approximately 4% and total consolidated revenues of approximately 11% and LifeLock’s internal control over financial reporting associated with consolidated total assets of approximately 2% and consolidated revenues of approximately 2%, included in the consolidated financial statements of Symantec Corporation and subsidiaries as of and for the year ended March 31, 2017. Our audit of internal control over financial reporting of Symantec Corporation also excluded an evaluation of the internal control over financial reporting of Blue Coat and LifeLock.
/s/ KPMG LLP
Santa Clara, California
May 19, 2017
41
SYMANTEC CORPORATION
CONSOLIDATED BALANCE SHEETS
(In millions, except per share amounts which are reflected in thousands, and par value per share amounts)
March 31, 2017 | April 1, 2016 | ||||||
ASSETS | |||||||
Current assets: | |||||||
Cash and cash equivalents | $ | 4,247 | $ | 5,983 | |||
Accounts receivable, net | 649 | 556 | |||||
Other current assets | 428 | 420 | |||||
Total current assets | 5,324 | 6,959 | |||||
Property and equipment, net | 937 | 957 | |||||
Intangible assets, net | 3,004 | 443 | |||||
Goodwill | 8,627 | 3,148 | |||||
Equity investments | 158 | 157 | |||||
Other long-term assets | 124 | 103 | |||||
Total assets | $ | 18,174 | $ | 11,767 | |||
LIABILITIES AND STOCKHOLDERS’ EQUITY | |||||||
Current liabilities: | |||||||
Accounts payable | $ | 180 | $ | 175 | |||
Accrued compensation and benefits | 272 | 219 | |||||
Current portion of long-term debt | 1,310 | — | |||||
Deferred revenue | 2,353 | 2,279 | |||||
Income taxes payable | 30 | 941 | |||||
Other current liabilities | 477 | 419 | |||||
Total current liabilities | 4,622 | 4,033 | |||||
Long-term debt | 6,876 | 2,207 | |||||
Long-term deferred revenue | 434 | 359 | |||||
Long-term deferred tax liabilities | 2,401 | 1,235 | |||||
Long-term income taxes payable | 251 | 160 | |||||
Other long-term obligations | 103 | 97 | |||||
Total liabilities | 14,687 | 8,091 | |||||
Commitments and contingencies | |||||||
Stockholders’ equity: | |||||||
Preferred stock, $0.01 par value: 1,000 shares authorized; 21 shares issued; 0 outstanding | — | — | |||||
Common stock and additional paid-in capital, $0.01 par value: 3,000,000 shares authorized; 608,019 and 612,266 shares issued and outstanding | 4,236 | 4,309 | |||||
Accumulated other comprehensive income | 12 | 22 | |||||
Accumulated deficit | (761 | ) | (655 | ) | |||
Total stockholders’ equity | 3,487 | 3,676 | |||||
Total liabilities and stockholders’ equity | $ | 18,174 | $ | 11,767 | |||
The accompanying Notes to the Consolidated Financial Statements are an integral part of these statements.
42
SYMANTEC CORPORATION
CONSOLIDATED STATEMENTS OF OPERATIONS
(In millions, except per share amounts)
Year Ended | |||||||||||
March 31, 2017 | April 1, 2016 | April 3, 2015 | |||||||||
Net revenues | $ | 4,019 | $ | 3,600 | $ | 3,956 | |||||
Cost of revenues | 853 | 615 | 727 | ||||||||
Gross profit | 3,166 | 2,985 | 3,229 | ||||||||
Operating expenses: | |||||||||||
Sales and marketing | 1,459 | 1,292 | 1,650 | ||||||||
Research and development | 823 | 748 | 812 | ||||||||
General and administrative | 564 | 295 | 362 | ||||||||
Amortization of intangible assets | 147 | 57 | 87 | ||||||||
Restructuring, separation, transition, and other | 273 | 136 | 164 | ||||||||
Total operating expenses | 3,266 | 2,528 | 3,075 | ||||||||
Operating income (loss) | (100 | ) | 457 | 154 | |||||||
Interest income | 21 | 10 | 11 | ||||||||
Interest expense | (208 | ) | (75 | ) | (78 | ) | |||||
Other income, net | 25 | — | 14 | ||||||||
Income (loss) from continuing operations before income taxes | (262 | ) | 392 | 101 | |||||||
Income tax expense (benefit) | (26 | ) | 1,213 | (8 | ) | ||||||
Income (loss) from continuing operations | (236 | ) | (821 | ) | 109 | ||||||
Income from discontinued operations, net of income taxes | 130 | 3,309 | 769 | ||||||||
Net income (loss) | $ | (106 | ) | $ | 2,488 | $ | 878 | ||||
Income (loss) per share - basic: | |||||||||||
Continuing operations | $ | (0.38 | ) | $ | (1.23 | ) | $ | 0.16 | |||
Discontinued operations | $ | 0.21 | $ | 4.94 | $ | 1.12 | |||||
Net income (loss) per share - basic | $ | (0.17 | ) | $ | 3.71 | $ | 1.27 | ||||
Income (loss) per share - diluted: | |||||||||||
Continuing operations | $ | (0.38 | ) | $ | (1.23 | ) | $ | 0.16 | |||
Discontinued operations | $ | 0.21 | $ | 4.94 | $ | 1.10 | |||||
Net income (loss) per share - diluted | $ | (0.17 | ) | $ | 3.71 | $ | 1.26 | ||||
Weighted-average shares outstanding: | |||||||||||
Basic | 618 | 670 | 689 | ||||||||
Diluted | 618 | 670 | 696 | ||||||||
Cash dividends declared per common share | $ | 0.30 | $ | 4.60 | $ | 0.60 | |||||
Note: Net income per share amounts may not add due to rounding.
The accompanying Notes to the Consolidated Financial Statements are an integral part of these statements.
43
SYMANTEC CORPORATION
CONSOLIDATED STATEMENTS OF COMPREHENSIVE INCOME (LOSS)
(In millions)
Year Ended | |||||||||||
March 31, 2017 | April 1, 2016 | April 3, 2015 | |||||||||
Net income (loss) | $ | (106 | ) | $ | 2,488 | $ | 878 | ||||
Other comprehensive loss, net of taxes: | |||||||||||
Foreign currency translation adjustments: | |||||||||||
Translation adjustments | (8 | ) | (6 | ) | (89 | ) | |||||
Reclassification adjustments for (gain) loss included in net income (loss) | — | 1 | (1 | ) | |||||||
Net foreign currency translation adjustments | (8 | ) | (5 | ) | (90 | ) | |||||
Unrealized gain (loss) on available-for-sale securities | (2 | ) | 4 | — | |||||||
Other comprehensive loss, net of taxes | (10 | ) | (1 | ) | (90 | ) | |||||
Comprehensive income (loss) | $ | (116 | ) | $ | 2,487 | $ | 788 | ||||
The accompanying Notes to the Consolidated Financial Statements are an integral part of these statements.
44
SYMANTEC CORPORATION
CONSOLIDATED STATEMENTS OF STOCKHOLDERS’ EQUITY
(In millions)
Year ended | |||||||||||
March 31, 2017 | April 1, 2016 | April 3, 2015 | |||||||||
Common stock and additional paid-in capital | |||||||||||
Balance, beginning of period | $ | 4,309 | $ | 6,101 | $ | 6,751 | |||||
Stock-based compensation | 410 | 245 | 198 | ||||||||
Assumed equity awards in acquisitions | 112 | — | — | ||||||||
Common stock issued under employee stock plans | 95 | 65 | 116 | ||||||||
Direct stock purchase | 43 | — | — | ||||||||
Equity component of convertible notes, net of tax | 12 | 29 | — | ||||||||
Income tax benefit from employee stock transactions | 11 | 17 | 11 | ||||||||
Repurchases of common stock | (500 | ) | (1,868 | ) | (500 | ) | |||||
Dividends paid and accrued | (191 | ) | (212 | ) | (428 | ) | |||||
Tax payments related to restricted stock units | (65 | ) | (68 | ) | (47 | ) | |||||
Balance, end of period | $ | 4,236 | $ | 4,309 | $ | 6,101 | |||||
Accumulated deficit | |||||||||||
Balance, beginning of period | $ | (655 | ) | $ | (270 | ) | $ | (1,148 | ) | ||
Net income (loss) | (106 | ) | 2,488 | 878 | |||||||
Dividends paid and accrued | — | (2,873 | ) | — | |||||||
Balance, end of period | $ | (761 | ) | $ | (655 | ) | $ | (270 | ) | ||
Accumulated other comprehensive income | |||||||||||
Balance, beginning of period | $ | 22 | $ | 104 | $ | 194 | |||||
Other comprehensive loss, net of taxes | (10 | ) | (1 | ) | (90 | ) | |||||
Sale of Veritas | — | (81 | ) | — | |||||||
Balance, end of period | $ | 12 | $ | 22 | $ | 104 | |||||
Total stockholders’ equity | $ | 3,487 | $ | 3,676 | $ | 5,935 | |||||
The accompanying Notes to the Consolidated Financial Statements are an integral part of these statements.
45
Year Ended | |||||||||||
March 31, 2017 | April 1, 2016 | April 3, 2015 | |||||||||
OPERATING ACTIVITIES: | |||||||||||
Net income (loss) | $ | (106 | ) | $ | 2,488 | $ | 878 | ||||
Income from discontinued operations, net of income taxes | (130 | ) | (3,309 | ) | (769 | ) | |||||
Adjustments to continuing operating activities: | |||||||||||
Depreciation and amortization | 530 | 304 | 355 | ||||||||
Stock-based compensation expense | 440 | 161 | 131 | ||||||||
Deferred income taxes | (168 | ) | 1,082 | (29 | ) | ||||||
Other | 32 | 7 | (2 | ) | |||||||
Changes in operating assets and liabilities, net of acquisitions | |||||||||||
Accounts receivable, net | 45 | 38 | (35 | ) | |||||||
Accounts payable | (67 | ) | (69 | ) | (73 | ) | |||||
Accrued compensation and benefits | 20 | (7 | ) | 7 | |||||||
Deferred revenue | 125 | 20 | (83 | ) | |||||||
Income taxes payable | (904 | ) | 693 | (405 | ) | ||||||
Other assets | 117 | (3 | ) | 16 | |||||||
Other liabilities | (90 | ) | 51 | 26 | |||||||
Net cash provided by (used in) continuing operating activities | (156 | ) | 1,456 | 17 | |||||||
Net cash provided by (used in) discontinued operating activities | (64 | ) | (660 | ) | 1,295 | ||||||
Net cash provided by (used in) operating activities | (220 | ) | 796 | 1,312 | |||||||
INVESTING ACTIVITIES: | |||||||||||
Additions to property and equipment | (70 | ) | (272 | ) | (303 | ) | |||||
Payments for acquisitions, net of cash acquired, and purchases of intangibles | (6,736 | ) | (4 | ) | (39 | ) | |||||
Purchases of short-term investments | — | (378 | ) | (1,758 | ) | ||||||
Proceeds from maturities and sales of short-term investments | 31 | 1,355 | 1,024 | ||||||||
Proceeds from divestiture, net of cash contributed and transaction costs | 7 | 6,535 | — | ||||||||
Other | 2 | — | — | ||||||||
Net cash provided by (used in) continuing investing activities | (6,766 | ) | 7,236 | (1,076 | ) | ||||||
Net cash used in discontinued investing activities | — | (63 | ) | (78 | ) | ||||||
Net cash provided by (used in) investing activities | (6,766 | ) | 7,173 | (1,154 | ) | ||||||
FINANCING ACTIVITIES: | |||||||||||
Repayments of debt and other obligations | (107 | ) | (368 | ) | (21 | ) | |||||
Proceeds from issuance of debt, net of issuance costs | 6,069 | 500 | — | ||||||||
Net proceeds from sales of common stock under employee stock plans | 95 | 65 | 116 | ||||||||
Tax payments related to restricted stock units | (65 | ) | (39 | ) | (36 | ) | |||||
Dividends and dividend equivalents paid | (222 | ) | (3,030 | ) | (413 | ) | |||||
Repurchases of common stock | (500 | ) | (1,868 | ) | (500 | ) | |||||
Other | 21 | 6 | 54 | ||||||||
Net cash provided by (used in) continuing financing activities | 5,291 | (4,734 | ) | (800 | ) | ||||||
Net cash used in discontinued financing activities | — | (30 | ) | (11 | ) | ||||||
Net cash provided by (used in) financing activities | 5,291 | (4,764 | ) | (811 | ) | ||||||
Effect of exchange rate fluctuations on cash and cash equivalents | (41 | ) | (96 | ) | (180 | ) | |||||
Change in cash and cash equivalents | (1,736 | ) | 3,109 | (833 | ) | ||||||
Beginning cash and cash equivalents | 5,983 | 2,874 | 3,707 | ||||||||
Ending cash and cash equivalents | $ | 4,247 | $ | 5,983 | $ | 2,874 | |||||
Supplemental disclosures: | |||||||||||
Equity investment in Veritas received as consideration | $ | — | $ | 149 | $ | — | |||||
Income taxes paid, net of refunds | $ | 1,081 | $ | 302 | $ | 353 | |||||
Interest expense paid | $ | 143 | $ | 70 | $ | 75 | |||||
Additions to property and equipment in current liabilities | $ | 33 | $ | 16 | $ | 31 | |||||
The accompanying Notes to the Consolidated Financial Statements are an integral part of these statements.
46
SYMANTEC CORPORATION
Notes to the Consolidated Financial Statements
BASIS OF PRESENTATION
Note 1. Summary of Significant Accounting Policies
Business
Symantec Corporation (“Symantec”, “we,” “us,” “our,” and “the Company” refer to Symantec Corporation and all of its subsidiaries) is a global leader in cybersecurity.
On August 1, 2016, we completed our acquisition of Blue Coat, Inc. (“Blue Coat”). Blue Coat’s results of operations have been included in our Consolidated Statements of Operations beginning August 1, 2016. On February 9, 2017, we completed our acquisition of LifeLock, Inc. (“LifeLock”). LifeLock’s results of operations have been included in our Consolidated Statements of Operations beginning February 9, 2017. See Note 6 for more information on the Blue Coat and LifeLock acquisitions.
On January 29, 2016, we completed the sale of Veritas. The results of Veritas are presented as discontinued operations in our Consolidated Statements of Operations and thus have been excluded from continuing operations and segment results for all reported periods. See Note 13 for more information on our discontinued operations.
Principles of consolidation
The accompanying consolidated financial statements of Symantec and our wholly-owned subsidiaries are prepared in conformity with generally accepted accounting principles in the United States (“U.S. GAAP”). All significant intercompany accounts and transactions have been eliminated in consolidation.
Fiscal calendar
We have a 52/53-week fiscal year ending on the Friday closest to March 31. Our fiscal 2017 and 2016 were 52-week years ended March 31, 2017 and April 1, 2016, respectively, whereas our fiscal 2015 was a 53-week year ended April 3, 2015.
Use of estimates
The preparation of consolidated financial statements in conformity with U.S. GAAP requires management to make estimates and assumptions that affect the amounts reported in the consolidated financial statements and accompanying notes. Estimates are based upon historical factors, current circumstances and the experience and judgment of management. Management evaluates its assumptions and estimates on an ongoing basis and may engage outside subject matter experts to assist in its valuations. Actual results could differ from those estimates. Significant items subject to such estimates and assumptions include those related to the allocation of revenue recognized and deferred amounts, valuation of business combinations including acquired intangible assets and goodwill, loss contingencies, and the recognition and measurement of current and deferred income taxes including the measurement of uncertain tax positions.
Foreign currency translation
Assets and liabilities denominated in foreign currencies are translated using the exchange rate on the balance sheet dates. Revenues and expenses are translated using monthly average exchange rates prevailing during the year. The translation adjustments resulting from this process are included as a component of accumulated other comprehensive income.
Revenue recognition
General
We recognize revenue when persuasive evidence of an arrangement exists, delivery has occurred, the fee is fixed or determinable, and collectability is probable. Revenue is recognized net of allowances for returns, discounts, distributor incentives and end-user rebates, and any taxes collected from customers and subsequently remitted to governmental authorities.
For arrangements that include both software and non-software elements, we allocate revenue to the software deliverables as a group and non-software deliverables based on their relative selling prices. In such circumstances, we use a hierarchy to determine the fair value to be used for the relative selling price allocation: (i) vendor-specific objective evidence of fair value (“VSOE”), (ii) third-party evidence (“TPE”), and (iii) best estimate of selling price (“BESP”). VSOE is based on historical stand-alone sales or the stated renewal rate for maintenance in certain license arrangements. When we are unable to establish a selling price using VSOE or TPE, we use BESP in the allocation of arrangement consideration. The objective of BESP is to determine the price at which we would transact a sale if the product or service were sold on a stand-alone basis. The determination of BESP is made through consultation with and formal approval by our management, taking into consideration the go-to-market strategy, pricing factors, and historical transactions.
For software arrangements that include multiple elements, including perpetual software licenses, maintenance, services, and packaged products with content updates and subscriptions, we allocate and defer revenue for the undelivered items based on VSOE of the fair value of the undelivered elements, and recognize the difference between the total arrangement fee and the amount deferred for the undelivered items as license revenue. When VSOE does not exist for undelivered items, the entire arrangement fee is recognized ratably over the performance period.
For non-software arrangements that include multiple elements, we allocate revenue to each element based upon the relative selling price of each element. We use a hierarchy to determine the fair value to be used for the relative selling price allocation: (i)
47
VSOE, (ii) TPE, and (iii) BESP. The revenue allocated to each element is recognized when all revenue recognition criteria are met for that element.
Consumer Digital Safety
We sell consumer products directly to end-users and consumer packaged software products through a multi-tiered distribution channel. For consumer products that include content updates, we recognize revenue ratably over the term of the subscription upon sell-through to end-users, as the subscription period commences on the date of sale to the end-user. We offer the right of return of our products under various policies and programs with our distributors, resellers, and end-user customers. We estimate and record reserves for product returns as an offset to revenue or deferred revenue.
We offer channel and end-user rebates for our consumer digital safety products. Our estimated reserves for channel volume incentive rebates are based on distributors’ and resellers’ actual performance against the terms and conditions of volume incentive rebate programs, which are typically entered into quarterly. Our reserves for end-user rebates are estimated based on the terms and conditions of the promotional program, actual sales during the promotion, the amount of actual redemptions received, historical redemption trends by product and by type of promotional program, and the value of the rebate. We estimate and record reserves for channel and end-user rebates as an offset to revenue or deferred revenue. As of March 31, 2017 and April 1, 2016, we had reserves for consumer digital safety rebates of $18 million and $20 million, respectively. For consumer products that include content updates, rebates are recorded as a ratable offset to revenue or deferred revenue over the term of the subscription.
Enterprise Security
Revenue for our enterprise security products is earned from arrangements that can include various combinations of software, hardware, and services, and sold directly to end-users or through a multi-tiered distribution channel. We generally do not offer rights of return for enterprise security products and the distribution channel does not hold inventory. As a result, historical returns and related reserves are insignificant.
We offer channel rebates and marketing programs for our enterprise security products. Our estimated reserves for channel volume incentive rebates are based on distributors’ and resellers’ actual performance against the terms and conditions of volume incentive rebate programs, which are typically entered into quarterly. We also consider current market conditions and economic trends when estimating our reserves for rebates. If actual redemptions differ from our estimates, differences may result in the amount and timing of our net revenues for any period presented. As of March 31, 2017 and April 1, 2016, we had reserves for enterprise security rebates and marketing programs of $11 million and $12 million, respectively.
Fair value measurements
For assets and liabilities measured at fair value, fair value is the price that would be received from selling an asset or paid to transfer a liability in an orderly transaction between market participants at the measurement date. When determining fair value, we consider the principal or most advantageous market in which we would transact, and we consider assumptions that market participants would use when pricing the asset or liability.
The three levels of inputs that may be used to measure fair value are:
• | Level 1: Quoted prices in active markets for identical assets or liabilities. |
• | Level 2: Observable inputs other than Level 1 prices, such as quoted prices for similar assets or liabilities, quoted prices in less active markets or model-derived valuations. All significant inputs used in our valuations, such as discounted cash flows, are observable or can be derived principally from or corroborated with observable market data for substantially the full term of the assets or liabilities. |
• | Level 3: Unobservable inputs to the valuation methodology that are significant to the measurement of the fair value of assets or liabilities. We monitor and review the inputs and results of these valuation models to help ensure the fair value measurements are reasonable and consistent with market experience in similar asset classes. |
Assets measured and recorded at fair value
Cash equivalents. We consider all highly liquid investments with an original maturity of three months or less at the time of purchase to be cash equivalents. Cash equivalents are carried at amounts that approximate fair value due to the short period of time to maturity.
Short-term investments. Short-term investments consist of investment and marketable equity securities that are classified as available-for-sale and recognized at fair value using Level 1 and Level 2 inputs, which are quoted using market prices, independent pricing vendors, or other sources, to determine the fair value. Unrealized gains and losses, net of tax, are included in accumulated other comprehensive income. We regularly review our investment portfolio to identify and evaluate investments that have indications of impairment. Factors considered in determining whether a loss is other-than-temporary include: the length of time and extent to which the fair value has been lower than the cost basis, the financial condition and near-term prospects of the investee, credit quality, likelihood of recovery, and our ability to hold the investment for a period of time sufficient to allow for any anticipated recovery in market value.
Non-marketable equity investments
We make equity investments in privately-held companies, which includes the B common shares we received as a portion of the net consideration in the sale of Veritas Technology LLC. These investments are accounted for under the cost method of
48
accounting. We assess the recoverability of these investments by reviewing various indicators of impairment. If indicators are present, a fair value measurement is made by performing a discounted cash flow analysis of the investment. If a decline in value is determined to be other-than-temporary, impairment is recognized and included in other income, net.
Accounts receivable
Accounts receivable are recorded at the invoiced amount and are not interest bearing. We maintain an allowance for doubtful accounts to reserve for potentially uncollectible receivables. We review our accounts receivables by aging category to identify specific customers with known disputes or collectability issues. In addition, we maintain an allowance for all other receivables not included in the specific reserve by applying specific percentages of projected uncollectible receivables to the various aging categories. In determining these percentages, we use judgment based on our historical collection experience and current economic trends. We also offset deferred revenue against accounts receivable when channel inventories are in excess of specified levels and for transactions where collection of a receivable is not considered probable.
As of March 31, 2017 and April 1, 2016, our allowance for doubtful accounts was $8 million and $16 million, respectively.
Property and equipment
Property, equipment, and leasehold improvements are stated at cost, net of accumulated depreciation. We capitalize costs incurred during the application development stage related to the development of internal use software and enterprise cloud computing services. We expense costs incurred related to the planning and post-implementation phases of development as incurred. Depreciation is provided on a straight-line basis over the estimated useful lives. Estimated useful lives for financial reporting purposes are as follows: buildings, 20 to 30 years; building improvements, 7 to 20 years; leasehold improvements, the lesser of the life of the improvement or the initial lease term; computer hardware and software, and office furniture and equipment, 3 to 5 years.
The following table summarizes property and equipment, net of accumulated depreciation by categories for the periods presented:
(In millions) | March 31, 2017 | April 1, 2016 | |||||
Land | $ | 73 | $ | 73 | |||
Computer hardware and software | 1,100 | 987 | |||||
Office furniture and equipment | 99 | 92 | |||||
Buildings | 425 | 426 | |||||
Leasehold improvements | 336 | 310 | |||||
Construction in progress | 22 | 74 | |||||
Gross property and equipment | 2,055 | 1,962 | |||||
Accumulated depreciation | (1,118 | ) | (1,005 | ) | |||
Property and equipment, net | $ | 937 | $ | 957 | |||
Depreciation expense was $199 million, $213 million, and $229 million in fiscal 2017, 2016, and 2015, respectively.
Business combinations
We use the acquisition method of accounting under the authoritative guidance on business combinations. Each acquired company’s operating results are included in our Consolidated Financial Statements starting on the date of acquisition. The purchase price is equivalent to the fair value of consideration transferred. Tangible and identifiable intangible assets acquired and liabilities assumed as of the date of acquisition are recorded at their estimated fair values at acquisition date. Goodwill is recognized for the excess of purchase price over the net fair value of assets acquired and liabilities assumed.
The allocation of purchase price requires management to make significant estimates and assumptions in determining the fair values of the assets acquired and liabilities assumed especially with respect to intangible assets. Critical estimates in valuing intangible assets include, but are not limited to, future cash flows from customer relationships, developed technology, trade names and acquired patents; and discount rates. Management estimates of fair value are based upon assumptions believed to be reasonable, but which are inherently uncertain and unpredictable. Unanticipated events and circumstances may occur which may affect the accuracy or validity of such assumptions, estimates or actual results.
Goodwill
Application of the goodwill impairment test requires us to make certain estimates and judgments, including the identification of reporting units, assignment of assets and liabilities to reporting units, assignment of goodwill to reporting units, and determination of fair value for each reporting unit. We perform an impairment assessment of goodwill at the reporting unit level at least annually on the first day of the fourth quarter of each fiscal year, or more frequently if events or changes in circumstances indicate that the asset may be impaired. To determine a reporting unit’s fair value, we generally use the income approach which is based on the estimated discounted future cash flows of that unit. The estimation of future cash flows requires us to make projections of future revenues and expenses of each reporting unit and establish a weighted-average cost of capital to discount these cash flows. Changes in these key assumptions and estimates or other assumptions used in this process could materially affect our impairment analysis in a given year.
49
The accounting guidance gives us the option to perform a qualitative assessment to determine whether further impairment testing is necessary. The qualitative assessment considers events and circumstances that might indicate that a reporting unit’s fair value is less than its carrying amount. These include macro-economic conditions, such as deterioration in the entity’s operating environment or industry or market considerations; entity-specific events such as increasing costs, declining financial performance, or loss of key personnel; or other events such as the sale of a reporting unit or a sustained decrease in the company’s stock price. If it is determined, as a result of the qualitative assessment, that it is more-likely-than-not that the fair value of a reporting unit is less than its carrying amount, a quantitative test is performed.
For the fiscal year ended March 31, 2017, based on our qualitative assessment, we concluded that it is more likely than not that the fair values are more than their carrying values. Accordingly, there was no indication of impairment, and further quantitative testing was not required.
Long-lived assets
In connection with our acquisitions, we generally recognize assets for customer relationships, developed technology, finite-lived trade names, patents, and indefinite-lived trade names. Finite-lived intangible assets are carried at cost less accumulated amortization. Such amortization is provided on a straight-line basis over the estimated useful lives of the respective assets, generally from 1 to 11 years. Amortization for developed technology is recognized in cost of revenue. Amortization for customer relationships and certain trade names is recognized in operating expenses. Indefinite-lived intangible assets are not subject to amortization but instead tested for impairment annually or more frequently if events or changes in circumstances indicate that the carrying amount of an asset may not be recoverable.
Long-lived assets, including intangible assets and property and equipment, are reviewed for impairment whenever events or changes in circumstances indicate that the carrying amount of an asset or group of assets may not be recoverable. The evaluation is performed at the lowest level of identifiable cash flows independent of other assets. An impairment loss would be recognized when estimated undiscounted future cash flows generated from the assets are less than their carrying amount. Measurement of an impairment loss would be based on the excess of the carrying amount of the asset group over its fair value. Our estimates of future cash flows require significant judgment based on historical and anticipated future operating results and are subject to many factors which are subject to variability and change.
Debt
Our debt includes senior unsecured notes, senior term loans, convertible senior notes, and a senior unsecured revolving credit facility (“revolving credit facility”). Our senior unsecured notes are recorded at par value at issuance less a discount representing the amount by which the face value exceeds the fair value at the date of issuance and an amount which represents issuance costs. Our senior term loans are recorded at par value less debt issuance costs which are recorded as a reduction in the carrying value of the debt. Our convertible senior notes are recorded at par value less the fair value of the equity component of the notes, at their issuance date, determined using level 2 inputs and less any issuance costs. The discount and issuance costs associated with the various notes are amortized using the effective interest rate method over the term of the debt as a non-cash charge to interest expense. Borrowings under our revolving credit facility, if any, are recognized at cost plus accrued interest based upon stated interest rates. Debt maturities are classified as current liabilities on our Consolidated Balance Sheet if we are contractually obligated to repay them in the next twelve months or, prior to the balance sheet date, we have the authorization and intent to repay them prior to their contractual maturities and within the next twelve months.
Restructuring
Restructuring actions generally include significant actions involving employee-related severance charges and contract termination costs. Employee-related severance charges are largely based upon substantive severance plans, while some charges result from mandated requirements in certain foreign jurisdictions. These charges are reflected in the period when both the actions are probable and the amounts are estimable. Contract termination costs for leased facilities primarily reflect costs that will continue to be incurred under the contract for its remaining term without economic benefit to the Company. These charges are reflected in the period when the facility ceases to be used.
Income taxes
We compute the provision for income taxes using the asset and liability method, under which deferred tax assets and liabilities are recognized for the expected future tax consequences of temporary differences between the financial reporting and tax bases of assets and liabilities, and for operating losses and tax credit carryforwards in each jurisdiction in which we operate. We measure deferred tax assets and liabilities using the currently enacted tax rates that apply to taxable income in effect for the years in which those tax assets are expected to be realized or settled. We record a valuation allowance to reduce deferred tax assets to the amount that is believed more likely than not to be realized.
We are subject to tax in multiple U.S. and foreign tax jurisdictions. We are required to estimate the current tax exposure as well as assess the temporary differences between the accounting and tax treatment of assets and liabilities, including items such as accruals and allowances not currently deductible for tax purposes. We apply judgment in the recognition and measurement of current and deferred income taxes which includes the following critical accounting estimates. We assess the likelihood that we will be able to recover our deferred tax assets. If recovery is not likely, we must increase our provision for taxes by recording a valuation allowance against the deferred tax assets that we estimate will not ultimately be recoverable. We believe that we will ultimately recover the deferred tax assets recorded on our Consolidated Balance Sheets.
We use a two-step process to recognize liabilities for uncertain tax positions. The first step is to evaluate the tax position for recognition by determining if the weight of available evidence indicates that it is more likely than not that the position will be
50
sustained on audit, including resolution of related appeals or litigation processes, if any. If we determine that the tax position will more likely than not be sustained on audit, the second step requires us to estimate and measure the tax benefit as the largest amount that is more than 50% likely to be realized upon ultimate settlement. It is inherently difficult and subjective to estimate such amounts, as this requires us to determine the probability of various outcomes. We re-evaluate these uncertain tax positions on a quarterly basis. This evaluation is based on factors including, but not limited to, changes in facts or circumstances, changes in tax law, effectively settled issues under audit, and new audit activity. Such a change in recognition or measurement would result in the recognition of a tax benefit or an additional charge to the tax provision in the period.
Our effective tax rate includes the impact of certain undistributed foreign earnings for which no U.S. taxes have been provided because such earnings are planned to be indefinitely reinvested outside the U.S. While we do not anticipate changing our intention regarding indefinitely reinvested earnings outside the U.S., material changes in our estimates of such earnings or tax legislation that limits or restricts the amount of such earnings could materially impact our income tax provision and effective tax rate. If certain foreign earnings previously treated as indefinitely reinvested outside the U.S. are repatriated, the related U.S. tax liability may be reduced by any foreign income taxes paid on these earnings.
Loss contingencies
We are subject to contingencies that expose us to losses, including various legal and regulatory proceedings, asserted and potential claims, liabilities related to repair or replacement of parts in connection with product defects, as well as product warranties and potential asset impairments that arise in the ordinary course of business. An estimated loss from such contingencies is recognized as a charge to income if it is probable that a liability has been incurred and the amount of the loss can be reasonably estimated. Judgment is required in both the determination of probability and the determination as to whether a loss is reasonably estimable as a critical accounting estimate. We review the status of each significant matter quarterly and we may revise our estimates.
Stock-based compensation
Stock-based compensation expense is measured at the grant date based on the fair value of the award. We recognize stock-based compensation cost over the award’s requisite service period on a straight-line basis. No compensation cost is ultimately recognized for forfeited awards in which employees do not render the requisite service. We estimate forfeitures based on historical experience.
The fair value of each restricted stock unit (“RSU”) and performance-based restricted stock unit (“PRU”) that does not contain a market condition is equal to the market value of our common stock on the date of grant. The fair value of each PRU that contains a market condition is estimated using the Monte Carlo simulation option pricing model. The fair values of RSUs and PRUs are not discounted by the dividend yield because our RSUs and PRUs are entitled to dividend equivalents to be paid in the form of cash upon vesting for each share of the underlying unit. As of March 31, 2017 and April 1, 2016, our total accrued dividend-equivalents rights (“DERs”) were $45 million and $75 million, respectively, which are included in other current liabilities and other long-term obligations on our Consolidated Balance Sheets.
We used the Black-Scholes model to determine the fair value of unvested stock options assumed in the Blue Coat and LifeLock acquisitions. The determination of the fair value of options using an option pricing model is affected by our stock price as well as assumptions regarding a number of complex and subjective variables. Because the options assumed in the Blue Coat and LifeLock acquisitions were all at- or in-the-money and Blue Coat and LifeLock lack sufficient historical exercise data to provide a reasonable basis upon which to estimate expected term, we estimated the expected life of assumed options using the “simplified method”. For vested options, this represents the midpoint between the valuation date and the contractual term. For unvested options, this represents the midpoint between the average vesting time and full contractual term. Expected volatility is based on the average of historical volatility over the most recent period commensurate with the expected life of the option and the implied volatility of traded options. The risk-free interest rate is equal to the U.S. Treasury rates for the period equal to the expected life. The options assumed are without DERs and their fair values are discounted by our dividend yield.
Concentrations of credit risk
A significant portion of our revenue is derived from international sales and independent agents and distributors. Fluctuations of the U.S. dollar against foreign currencies, changes in local regulatory or economic conditions, piracy, or nonperformance by independent agents or distributors could adversely affect our operating results.
Financial instruments that potentially subject us to concentrations of credit risk consist principally of cash and cash equivalents, short-term investments, and trade accounts receivable. Our investment policy limits the amount of credit risk exposure to any one issuer and to any one country. We are exposed to credit risks in the event of default by the issuers to the extent of the amount recorded on our Consolidated Balance Sheets. The credit risk in our trade accounts receivable is substantially mitigated by our credit evaluation process, reasonably short collection terms, and the geographical dispersion of sales transactions. As of March 31, 2017 and April 1, 2016, we had two distributors and one distributor, respectively, that accounted for over 10% of our total accounts receivable. We maintain reserves for potential credit losses and such losses have been within management’s expectations.
Advertising and other promotional costs
Advertising and other promotional costs are charged to operations as incurred and included in sales and marketing expenses. These costs totaled $212 million, $211 million, and $326 million for fiscal 2017, 2016, and 2015, respectively.
51
Sales commissions
Sales commissions that are incremental and directly related to customer sales contracts in which revenue is deferred are accrued and capitalized upon execution of a non-cancelable customer contract, and subsequently expensed over the term of such contract in proportion to the related future revenue streams. For commission costs where revenue is recognized, the related commission costs are recorded in the period of revenue recognition. As of March 31, 2017 and April 1, 2016, we had total deferred commissions of $77 million and $74 million, respectively, which are included in other current assets and other long-term assets on our Consolidated Balance Sheets.
PERFORMANCE & OPERATIONS
Note 2. Segment and Geographic Information
We operate in the following two operating segments, which are the same as our reportable segments:
• | Consumer Digital Safety. Our Consumer Digital Safety segment focuses on providing a Digital Safety solution to protect information, devices, networks, and the identity of consumers. This platform includes our Norton-branded services, which provide multi-layer security and identity protection on major desktop and mobile operating systems, to defend against increasingly complex online threats to individuals, families and small businesses. With the acquisition of LifeLock, a leader in identity protection services, we are accelerating our leadership in Consumer Digital Safety to protect all aspects of the consumer’s digital life. |
• | Enterprise Security. Our Enterprise Security segment protects organizations so they can securely conduct business while leveraging new platforms and data. Our Enterprise Security segment includes our threat protection products, information protection products, cyber security services, website security, and advanced web and cloud security offerings. Our enterprise endpoint and network security and management offerings support evolving endpoints and networks, providing advanced threat protection while helping reduce cost and complexity. These solutions are delivered through various methods, such as software, appliance, SaaS and managed services. |
Our operating segments are based upon the nature of our business and how our business is managed. Our Chief Operating Decision Makers (“CODMs”), comprised of our Chief Executive Officer (“CEO”) and Chief Financial Officer (“CFO”), use operating segment financial information to evaluate segment performance and to allocate resources. Our CODMs do not evaluate operating segments using discrete asset information, and our assets are not discretely identified by segment except for goodwill, as disclosed in Note 7. During the year, our Board appointed Gregory S. Clark, former Blue Coat CEO as our new CEO and Nicholas R. Noviello, former Blue Coat CFO as our new CFO. Despite the CODM changes during fiscal 2017, we did not change the way we report and evaluate segments.
There were no inter-segment sales for the periods presented. The following table summarizes the operating results of our reportable segments:
Year Ended | |||||||||||
(In millions) | March 31, 2017 | April 1, 2016 | April 3, 2015 | ||||||||
Total Segments: | |||||||||||
Net revenues | $ | 4,019 | $ | 3,600 | $ | 3,956 | |||||
Operating income | $ | 1,026 | $ | 1,026 | $ | 1,275 | |||||
Consumer Digital Safety: | |||||||||||
Net revenues | $ | 1,664 | $ | 1,670 | $ | 1,887 | |||||
Operating income | $ | 839 | $ | 924 | $ | 982 | |||||
Enterprise Security: | |||||||||||
Net revenues | $ | 2,355 | $ | 1,930 | $ | 2,069 | |||||
Operating income | $ | 187 | $ | 102 | $ | 293 | |||||
We do not allocate to our operating segments certain operating expenses that we manage separately at the corporate level and are not used in evaluating the results of, or in allocating resources to, our segments. These unallocated expenses consist of stock-based compensation expense, amortization of intangible assets, restructuring, separation, transition, and other charges, and acquisition and integration costs. In addition, corporate charges previously allocated to Veritas prior to its operational separation in the third quarter of fiscal 2016, but not reclassified within discontinued operations, were not reallocated to our segments. See Note 13 for more information on our discontinued operations.
52
The following table provides a reconciliation of our total reportable segments’ operating income to our total operating income (loss):
Year Ended | |||||||||||
(In millions) | March 31, 2017 | April 1, 2016 | April 3, 2015 | ||||||||
Total segment operating income | $ | 1,026 | $ | 1,026 | $ | 1,275 | |||||
Less reconciling items: | |||||||||||
Unallocated corporate charges related to Veritas | — | 186 | 704 | ||||||||
Stock-based compensation | 440 | 161 | 131 | ||||||||
Amortization of intangibles | 293 | 86 | 122 | ||||||||
Restructuring, separation, transition, and other | 273 | 136 | 164 | ||||||||
Acquisition and integration costs | 120 | — | — | ||||||||
Total consolidated operating income (loss) from continuing operations | $ | (100 | ) | $ | 457 | $ | 154 | ||||
Product revenue information
The following table summarizes net revenues by significant product categories:
Year Ended | |||||||||||
(In millions) | March 31, 2017 | April 1, 2016 | April 3, 2015 | ||||||||
Norton | $ | 1,597 | $ | 1,670 | $ | 1,887 | |||||
Threat protection | 804 | 807 | 882 | ||||||||
Blue Coat security | 427 | — | — | ||||||||
Others (1) | 1,191 | 1,123 | 1,187 | ||||||||
Total net revenues | $ | 4,019 | $ | 3,600 | $ | 3,956 | |||||
(1) | No other product category represented more than 10% of the respective totals. |
Geographical information
Net revenues by geography are based on the billing addresses of our customers. The following table represents net revenues by geographic area for the periods presented:
Year Ended | |||||||||||
(In millions) | March 31, 2017 | April 1, 2016 | April 3, 2015 | ||||||||
U.S. | $ | 2,105 | $ | 1,897 | $ | 1,960 | |||||
International (1) | 1,914 | 1,703 | 1,996 | ||||||||
Total net revenues | $ | 4,019 | $ | 3,600 | $ | 3,956 | |||||
(1) | No individual country represented more than 10% of the respective totals. |
The table below represents our property and equipment, net of accumulated depreciation, by geographic area at the end of each period presented. We do not identify or allocate our other assets by geographic area.
(In millions) | March 31, 2017 | April 1, 2016 | |||||
U.S. | $ | 822 | $ | 809 | |||
International (1) | 115 | 148 | |||||
Total property and equipment, net | $ | 937 | $ | 957 | |||
(1) | No individual country represented more than 10% of the respective totals. |
Significant customers
In fiscal 2017, 2016 and 2015, no customer accounted for more than 10% of our total net revenues.
53
Note 3. Net Income Per Share
Basic and diluted net income per share are computed on the basis of the weighted-average number of shares of common stock outstanding during the period. Diluted net income per share also include the incremental effect of dilutive potential common shares outstanding during the period using the treasury stock method. Dilutive potential common shares include the dilutive effect of shares underlying outstanding stock options, RSUs, PRUs, Employee Stock Purchase Plan (“ESPP”) and convertible notes. See Note 11 for more information on our stock-based compensation.
The components of net income per share are as follows:
Year Ended | |||||||||||
(In millions, except per share data) | March 31, 2017 | April 1, 2016 | April 3, 2015 | ||||||||
Income (loss) from continuing operations | $ | (236 | ) | $ | (821 | ) | $ | 109 | |||
Income from discontinued operations, net of tax | 130 | 3,309 | 769 | ||||||||
Net income (loss) | $ | (106 | ) | $ | 2,488 | $ | 878 | ||||
Income (loss) per share - basic: | |||||||||||
Continuing operations | $ | (0.38 | ) | $ | (1.23 | ) | $ | 0.16 | |||
Discontinued operations | $ | 0.21 | $ | 4.94 | $ | 1.12 | |||||
Net income (loss) per share | $ | (0.17 | ) | $ | 3.71 | $ | 1.27 | ||||
Income (loss) per share - diluted: | |||||||||||
Continuing operations | $ | (0.38 | ) | $ | (1.23 | ) | $ | 0.16 | |||
Discontinued operations | $ | 0.21 | $ | 4.94 | $ | 1.10 | |||||
Net income (loss) per share | $ | (0.17 | ) | $ | 3.71 | $ | 1.26 | ||||
Weighted-average outstanding shares - basic | 618 | 670 | 689 | ||||||||
Dilutive potential shares from stock-based compensation | — | — | 7 | ||||||||
Weighted-average shares outstanding - diluted | 618 | 670 | 696 | ||||||||
Note: Net income per share amounts may not add due to rounding.
The following have been excluded from the computation of diluted net income per share because their effect would have been anti-dilutive:
Year Ended | ||||||||
(In millions) | March 31, 2017 | April 1, 2016 | April 3, 2015 | |||||
Convertible shares | 91 | 30 | — | |||||
Restricted and performance-based restricted stock units | 29 | 19 | — | |||||
Stock options and ESPP | 21 | — | 1 | |||||
Total | 141 | 49 | 1 | |||||
Under the treasury stock method, the Convertible Senior Notes will generally have a dilutive impact on earnings when our average stock price for the period exceeds approximately $16.77 per share for the 2.5% Convertible Senior Notes and $20.41 per share for the 2.0% Convertible Senior Notes. The conversion feature of both notes was anti-dilutive during fiscal 2017 due to a loss from continuing operations. The conversion feature of our 2.5% Convertible Senior Notes was also anti-dilutive during fiscal 2016 due to a loss from continuing operations. See Note 8 for more information on our debt.
Note 4. Restructuring, Separation, Transition, and Other Costs
Our restructuring, separation, transition, and other costs and liabilities consist primarily of severance, facilities, separation, transition, and other related costs. Severance costs generally include severance payments, outplacement services, health insurance coverage, and legal costs. Facilities costs generally include rent expense and lease termination costs, less estimated sublease income. Separation and related costs include advisory, consulting, and other costs incurred in connection with the separation of Veritas. Transition costs primarily consist of consulting charges associated with the implementation of new enterprise resource planning systems and costs to automate business processes. Other costs primarily consist of asset write-offs and advisory fees incurred in connection with restructuring events. Restructuring, separation, transition, and other costs are managed at the corporate level and are not allocated to our reportable segments. See Note 2 for information regarding the reconciliation of total segment operating income to total consolidated operating income (loss).
54
Fiscal 2017 Plan
We initiated a restructuring plan in the first quarter of fiscal 2017 to reduce complexity by means of long-term structural improvements (the “Fiscal 2017 Plan”). We expect to reduce headcount and close certain facilities in connection with the restructuring plan. We expect total costs incurred in connection with the Fiscal 2017 Plan to range between $415 million and $465 million, of which approximately $185 million to $195 million is expected to be for severance and termination benefits and $190 million to $215 million is expected to be for other exit and disposal costs primarily consisting of contract termination, relocation costs, and advisory fees. The remainder is expected to be in the form of asset write-offs. These actions are expected to be completed in fiscal 2018. Additionally, we expect continuing significant transition costs associated with the implementation of a new enterprise resource planning system and costs to automate business processes. As of March 31, 2017, liabilities for excess facility obligations at several U.S. and international locations are expected to be paid throughout the respective lease terms, the longest of which extends through fiscal 2022.
Restructuring, separation, transition, and other costs summary
We incurred $94 million in continuing operations transition expense during fiscal 2017. As of March 31, 2017 and April 1, 2016, restructuring and separation liabilities were included in accounts payable, other current liabilities and other long-term obligations in our Consolidated Balance Sheets. Additionally, $10 million of the following restructuring and separation costs is included in income from discontinued operations, net of income taxes.
(In millions) | Balance as of April 1, 2016 | Costs, Net of Adjustments | Cash Payments | Non-Cash Charges | Balance as of March 31, 2017 | Fiscal 2017 Plan Cumulative Incurred to Date | |||||||||||||||||
Fiscal 2017 Plan: | |||||||||||||||||||||||
Severance and termination costs | $ | — | $ | 76 | $ | (56 | ) | $ | — | $ | 20 | $ | 76 | ||||||||||
Other exit and disposal costs | 4 | 75 | (50 | ) | (7 | ) | 22 | 79 | |||||||||||||||
Asset write-offs | — | 23 | — | (23 | ) | — | 23 | ||||||||||||||||
Fiscal 2017 Plan total | 4 | 174 | (106 | ) | (30 | ) | 42 | $ | 178 | ||||||||||||||
Prior year plans | $ | 29 | $ | 15 | $ | (35 | ) | $ | (5 | ) | $ | 4 | |||||||||||
Restructuring and separation plans total | $ | 33 | $ | 189 | $ | (141 | ) | $ | (35 | ) | $ | 46 | |||||||||||
Note 5. Income Taxes
The components of income tax expense (benefit) recorded in continuing operations are as follows:
Year Ended | |||||||||||
(In millions) | March 31, 2017 | April 1, 2016 | April 3, 2015 | ||||||||
Current: | |||||||||||
Federal | $ | 108 | $ | 69 | $ | 4 | |||||
State | 6 | 13 | (18 | ) | |||||||
International | 68 | 46 | 40 | ||||||||
Total | 182 | 128 | 26 | ||||||||
Deferred: | |||||||||||
Federal | (177 | ) | 1,060 | (38 | ) | ||||||
State | (17 | ) | 15 | (4 | ) | ||||||
International | (14 | ) | 10 | 8 | |||||||
Total | (208 | ) | 1,085 | (34 | ) | ||||||
Income tax expense (benefit) | $ | (26 | ) | $ | 1,213 | $ | (8 | ) | |||
Pre-tax income from international operations was $353 million, $125 million, and $41 million for fiscal 2017, 2016, and 2015, respectively.
55
The difference between our effective income tax and the federal statutory income tax is as follows:
Year Ended | |||||||||||
(In millions) | March 31, 2017 | April 1, 2016 | April 3, 2015 | ||||||||
Federal statutory tax expense (benefit) | $ | (92 | ) | $ | 138 | $ | 35 | ||||
Foreign earnings not considered indefinitely reinvested, net | 12 | 1,065 | (8 | ) | |||||||
State taxes, net of federal benefit | (11 | ) | 9 | (13 | ) | ||||||
Foreign earnings taxed at less than the federal rate | 34 | 12 | 34 | ||||||||
Domestic production activities deduction | — | (5 | ) | (1 | ) | ||||||
Federal research and development credit | (9 | ) | (9 | ) | (8 | ) | |||||
Valuation allowance (decrease) increase | (1 | ) | 10 | 1 | |||||||
Nondeductible separation costs | — | 1 | 2 | ||||||||
Change in uncertain tax positions | (24 | ) | (4 | ) | (57 | ) | |||||
Nondeductible transaction costs | 11 | — | — | ||||||||
Write-off of tax attributes due to restructuring | 52 | — | — | ||||||||
Nondeductible officer compensation | 7 | — | — | ||||||||
Other, net | (5 | ) | (4 | ) | 7 | ||||||
Income tax expense (benefit) | $ | (26 | ) | $ | 1,213 | $ | (8 | ) | |||
The principal components of deferred tax assets and liabilities are as follows:
Year Ended | |||||||
(In millions) | March 31, 2017 | April 1, 2016 | |||||
Deferred tax assets: | |||||||
Tax credit carryforwards | $ | 42 | $ | 53 | |||
Net operating loss carryforwards of acquired companies | 82 | 34 | |||||
Other accruals and reserves not currently tax deductible | 127 | 112 | |||||
Deferred revenue | 137 | 89 | |||||
Loss on investments not currently tax deductible | 9 | 14 | |||||
State income taxes | 2 | 8 | |||||
Stock-based compensation | 122 | 39 | |||||
Other | 14 | 9 | |||||
Gross deferred tax assets | 535 | 358 | |||||
Valuation allowance | (38 | ) | (50 | ) | |||
Deferred tax assets, net of valuation allowance | $ | 497 | $ | 308 | |||
Deferred tax liabilities: | |||||||
Property and equipment | $ | (34 | ) | $ | (106 | ) | |
Goodwill | (54 | ) | (50 | ) | |||
Intangible assets | (783 | ) | (11 | ) | |||
Unremitted earnings of foreign subsidiaries | (1,939 | ) | (1,327 | ) | |||
Prepaids and deferred expenses | (24 | ) | (17 | ) | |||
Convertible debt | (21 | ) | — | ||||
Deferred tax liabilities | (2,855 | ) | (1,511 | ) | |||
Net deferred tax liabilities | $ | (2,358 | ) | $ | (1,203 | ) | |
The valuation allowance provided against our deferred tax assets as of March 31, 2017, is mainly attributable to capital losses, state tax credits, and net operating losses in foreign jurisdictions. The valuation allowance decreased by a net of $12 million in fiscal 2017, due to changes in corresponding deferred tax assets primarily related to capital losses and state tax credits.
As of March 31, 2017, we have U.S. federal net operating losses attributable to various acquired companies of approximately $186 million, which, if not used, will expire between fiscal 2018 and 2036. We have U.S. federal research and development credits and alternative minimum tax credits of approximately $4 million and $5 million, respectively. The research and development credits, if not used, will expire between fiscal 2019 and 2036 and the alternative minimum tax credit carryforwards can be carried forward indefinitely. The net operating loss carryforwards, U.S. federal research and development tax credits, and
56
alternative minimum tax credits are subject to an annual limitation under Internal Revenue Code §382, but are expected to be fully realized. We have $14 million of foreign tax credits which, if not used, will expire beginning in fiscal 2027. Furthermore, we have U.S. state net operating loss and credit carryforwards attributable to various acquired companies of approximately $185 million and $28 million, respectively. If not used, our U.S. state net operating losses will expire between fiscal 2018 and 2037 and the majority of our U.S. state credit carryforwards can be carried forward indefinitely. In addition, we have foreign net operating loss carryforwards attributable to various acquired foreign companies of approximately $40 million, the majority of which, under current applicable foreign tax law, can be carried forward indefinitely.
In assessing the ability to realize our deferred tax assets, we considered whether it is more likely than not that some portion or all the deferred tax assets will not be realized. We considered the following: we have historical cumulative book income, as measured by the current and prior two years; we have strong, consistent taxpaying history; we have substantial U.S. federal income tax carryback potential; and we have substantial amounts of scheduled future reversals of taxable temporary differences from our deferred tax liabilities. We have concluded that this positive evidence outweighs the negative evidence and, thus, that the deferred tax assets as of March 31, 2017 are realizable on a “more likely than not” basis.
As of March 31, 2017, no provision has been made for federal or state income taxes on $3.9 billion of cumulative unremitted earnings of certain of our foreign subsidiaries since we plan to indefinitely reinvest these earnings. As of March 31, 2017, the unrecognized deferred tax liability for these earnings was approximately $1.1 billion.
The increase in our effective tax rate in fiscal 2016 compared to fiscal 2015 was primarily driven by $1.1 billion of tax expense for providing U.S. taxes on certain undistributed foreign earnings, primarily those attributable to the sale of Veritas. These undistributed foreign earnings have been excluded from the $3.9 billion noted above of cumulative unremitted earnings of certain of our foreign subsidiaries that we plan to reinvest indefinitely as of March 31, 2017.
The aggregate changes in the balance of gross unrecognized tax benefits were as follows:
Year Ended | |||||||||||
(In millions) | March 31, 2017 | April 1, 2016 | April 3, 2015 | ||||||||
Balance at beginning of year | $ | 197 | $ | 193 | $ | 282 | |||||
Settlements with tax authorities | (23 | ) | (25 | ) | (150 | ) | |||||
Lapse of statute of limitations | (9 | ) | (15 | ) | (13 | ) | |||||
Decrease due to divestiture | — | (7 | ) | — | |||||||
Increase related to prior period tax positions | 21 | 4 | 147 | ||||||||
Decrease related to prior period tax positions | (9 | ) | (7 | ) | (96 | ) | |||||
Increase related to current year tax positions | 38 | 54 | 23 | ||||||||
Increase due to acquisition | 33 | — | — | ||||||||
Net increase (decrease) | 51 | 4 | (89 | ) | |||||||
Balance at end of year | $ | 248 | $ | 197 | $ | 193 | |||||
There was a change of $51 million in gross unrecognized tax benefits during the 2017 fiscal year. This gross liability does not include offsetting tax benefits associated with the correlative effects of potential transfer pricing adjustments, interest deductions, and state income taxes.
Of the total unrecognized tax benefits at March 31, 2017, $176 million, if recognized, would favorably affect the Company’s effective tax rate.
We recognize interest and/or penalties related to uncertain tax positions in income tax expense. At March 31, 2017, before any tax benefits, we had $22 million of accrued interest and penalties on unrecognized tax benefits. Interest included in our provision for income taxes was an expense of $5 million for the year ended March 31, 2017. If the accrued interest and penalties do not ultimately become payable, amounts accrued will be reduced in the period that such determination is made, and reflected as a reduction of the overall income tax provision.
We file income tax returns in the U.S. on a federal basis and in many U.S. state and foreign jurisdictions. Our most significant tax jurisdictions are the U.S., Ireland, and Singapore. Our tax filings remain subject to examination by applicable tax authorities for a certain length of time following the tax year to which those filings relate. Our fiscal years 2014 through 2017 remain subject to examination by the Internal Revenue Service (“IRS”) for U.S. federal tax purposes. Our fiscal years prior to 2014 have been settled and closed with the IRS. Our 2013 through 2017 fiscal years remain subject to examination by the appropriate governmental agencies for Irish tax purposes, and our 2012 through 2017 fiscal years remain subject to examination by the appropriate governmental agencies for Singapore tax purposes.
On March 18, 2015, we settled and effectively settled matters with the IRS for the Symantec 2009 through 2013 fiscal years. The settlement and effective settlement resulted in a benefit to tax expense in fiscal year 2015 of $59 million. Additionally, the Company settled transfer price related matters of $158 million, a portion of which was accounted for against deferred tax liabilities on unremitted foreign earnings. The Company has paid in $155 million to cover the final tax and interest liability on the settlement.
57
The timing of the resolution of income tax examinations is highly uncertain, and the amounts ultimately paid, if any, upon resolution of the issues raised by the taxing authorities may differ materially from the amounts accrued for each year. Although potential resolution of uncertain tax positions involve multiple tax periods and jurisdictions, it is reasonably possible that the gross unrecognized tax benefits related to these audits could decrease (whether by payment, release, or a combination of both) in the next 12 months by $4 million. Depending on the nature of the settlement or expiration of statutes of limitations, we estimate $3 million could affect our income tax provision and therefore benefit the resulting effective tax rate.
We continue to monitor the progress of ongoing income tax controversies and the impact, if any, of the expected tolling of the statute of limitations in various taxing jurisdictions.
NON-CURRENT ASSETS & DEBT
Note 6. Acquisitions
Blue Coat acquisition
On August 1, 2016, we acquired all of the outstanding common stock of Blue Coat, a provider of advanced web security solutions for global enterprises and governments. The addition of Blue Coat’s suite of network and cloud security products to our innovative Enterprise Security product portfolio has enhanced our threat protection and information protection products while providing us with complementary products, such as advanced web and cloud security solutions, that address the network and cloud security needs of enterprises. This augmentation of our product portfolio, together with the integration of Blue Coat’s large threat database with our global civilian cyber intelligence threat network, allows us to provide an integrated cyber defense platform, addressing both endpoint and network security, and offer differentiated security solutions. It also positions us well to introduce new cybersecurity solutions that address the ever-evolving threat landscape, the changes introduced by the shift to mobile and cloud along with the adoption of Internet of Things (IoT) devices. Our enhanced portfolio also positions us well to address the challenges created by regulatory and privacy concerns.
The total consideration for the acquisition of Blue Coat was approximately $4.7 billion, net of cash acquired, and consisted of the following:
(In millions) | August 1, 2016 | ||
Cash and equity consideration for outstanding Blue Coat common shares and restricted stock awards | $ | 2,006 | |
Cash consideration for outstanding Blue Coat debt | 1,910 | ||
Issuance of Symantec 2.0% convertible debt to Bain Capital Funds (selling shareholder) | 750 | ||
Fair value of vested assumed Blue Coat stock options | 102 | ||
Cash consideration for acquiree acquisition-related expenses | 51 | ||
Total consideration | 4,819 | ||
Cash acquired | (146 | ) | |
Net consideration transferred | $ | 4,673 | |
The cash consideration for the retirement of Blue Coat debt included the repayment of the associated principal, accrued interest, premiums, and other costs.
We funded a portion of the total purchase price through debt financing, including borrowings of an aggregate principal amount of $2.8 billion under an amended and restated credit facility and a new term loan facility. On August 1, 2016, we also issued 2.0% Convertible Senior Notes due 2021 for an aggregate principal amount of $1.25 billion, $750 million of which was to a selling shareholder. See Note 8 for more information on these debt instruments.
58
Our preliminary allocation of the purchase price, based on the estimated fair values of the assets acquired and liabilities assumed on the close date, were as follows:
(In millions) | August 1, 2016 | ||
Assets: | |||
Accounts receivable | $ | 125 | |
Other current assets | 65 | ||
Property and equipment | 54 | ||
Intangible assets | 1,608 | ||
Goodwill | 4,083 | ||
Other long-term assets | 9 | ||
Total assets acquired | 5,944 | ||
Liabilities: | |||
Other current liabilities | 111 | ||
Deferred revenue | 220 | ||
Long-term deferred tax liabilities | 921 | ||
Other long-term obligations | 19 | ||
Total liabilities assumed | 1,271 | ||
Total purchase price | $ | 4,673 | |
The allocation of the purchase price was based upon a preliminary valuation, and our estimates and assumptions are subject to refinement within the measurement period (up to one year from the close date). Adjustments to the purchase price allocation may require adjustments to goodwill prospectively. The primary areas of the preliminary purchase price allocation that are not yet finalized are certain tax matters and identification of contingencies.
The preliminary goodwill of $4.1 billion arising from the acquisition is attributed to the expected synergies, including future cost efficiencies, and other benefits that are expected to be generated by combining Symantec and Blue Coat. Substantially all of the goodwill recognized is not expected to be deductible for tax purposes. See Note 7 for more information on goodwill.
Preliminary identified intangible assets and their respective useful lives, as of August 1, 2016, were as follows:
(In millions, except for useful lives) | Fair Value | Weighted-Average Estimated Useful Life | |||
Customer relationships | $ | 844 | 7 years | ||
Developed technology and patents | 739 | 4.3 years | |||
Finite-lived trade names | 4 | 2 years | |||
Product backlog | 2 | 4 months | |||
Total identified finite-lived intangible assets | 1,589 | ||||
In-process research and development | 19 | N/A | |||
Total identified intangible assets | $ | 1,608 | |||
The fair value of in-process research and development was determined using the relief-from-royalty method. A key assumption of this method is a hypothetical technology licensing rate applied to forecasted revenue. The premise associated with this valuation method is that, in lieu of ownership of the asset, a market participant would be willing to pay a licensing fee for the use of that asset.
Impact on operating results
Our results of continuing operations for fiscal 2017 include $427 million of net revenues attributable to Blue Coat products beginning August 1, 2016. It is impracticable to determine the amounts of net income attributable to Blue Coat for fiscal 2017 as we have integrated Blue Coat with our ongoing operations. Net revenues and costs related to the Blue Coat products are included in our Enterprise Security segment results for fiscal 2017. Transaction costs of $48 million incurred by Symantec in connection with the Blue Coat acquisition are included in operating expenses in our Consolidated Statements of Operations for fiscal 2017. See Note 2 for more information on our segments.
LifeLock acquisition
On February 9, 2017, we completed the acquisition of LifeLock, a provider of proactive identity theft protection services for consumers and consumer risk management services for enterprises, for approximately $2.3 billion in total consideration. LifeLock’s services are provided on a monthly or annual subscription basis and primarily consist of identifying and notifying users of identity-related and other events and assisting users in remediating their impact. The addition of LifeLock’s identity and fraud
59
protection offerings to our leading Consumer Digital Safety product portfolio will allow us to provide a comprehensive digital safety solution designed to protect information across devices, customer identities and the connected home and family.
The total consideration for the acquisition of LifeLock was approximately $2.3 billion, net of cash acquired, and consisted of the following:
(In millions) | February 9, 2017 | ||
Cash for outstanding LifeLock common shares and vested equity awards | $ | 2,298 | |
Fair value of vested assumed LifeLock equity awards | 10 | ||
Liability assumed for dissenting shareholders | 68 | ||
Liability assumed for lost shareholders | 1 | ||
Total consideration | 2,377 | ||
Cash acquired | (94 | ) | |
Net consideration transferred | $ | 2,283 | |
We funded a portion of the total purchase price with the issuance of 5.0% Senior Notes due 2025 for an aggregate principal amount of $1.1 billion. See Note 8 for more information on these debt instruments.
Our preliminary allocation of the purchase price, based on the estimated fair values of the assets acquired and liabilities assumed on the close date, were as follows:
(In millions) | February 9, 2017 | ||
Assets: | |||
Accounts receivable | $ | 20 | |
Other current assets | 110 | ||
Property and equipment | 46 | ||
Intangible assets | 1,247 | ||
Goodwill | 1,401 | ||
Deferred tax assets | 16 | ||
Other long-term assets | 13 | ||
Total assets acquired | 2,853 | ||
Liabilities: | |||
Accounts payable | 2 | ||
Deferred revenue | 96 | ||
Income taxes payable | 5 | ||
Other current liabilities | 59 | ||
Long-term deferred tax liabilities | 394 | ||
Other long-term obligations | 14 | ||
Total liabilities assumed | 570 | ||
Total purchase price | $ | 2,283 | |
The allocation of the purchase price was based upon a preliminary valuation, and our estimates and assumptions are subject to refinement within the measurement period (up to one year from the close date). Adjustments to the purchase price allocation may require adjustments to goodwill prospectively. The primary areas of the preliminary purchase price allocation that are not yet finalized are certain tax matters, intangible assets, and identification of contingencies.
The preliminary goodwill of $1.4 billion arising from the acquisition is attributed to the expected synergies, including future cost efficiencies, and other benefits that are expected to be generated by combining Symantec and LifeLock. Substantially all of the goodwill recognized is not expected to be deductible for tax purposes. See Note 7 for more information on goodwill.
60
Preliminary identified intangible assets and their respective useful lives were as follows:
(In millions, except for useful lives) | Fair Value | Weighted-Average Estimated Useful Life | |||
Customer relationships | $ | 532 | 7.0 years | ||
Developed technology | 126 | 5.0 years | |||
Finite-lived trade names and other | 6 | 5.9 years | |||
Total identified finite-lived intangible assets | 664 | ||||
Indefinite-lived trade names | 583 | N/A | |||
Total identified intangible assets | $ | 1,247 | |||
Impact on operating results
Our results of continuing operations for fiscal 2017 include $72 million and $98 million, respectively, of net revenues and a pre-tax loss attributable to LifeLock beginning February 9, 2017. LifeLock’s revenues of $67 million and $5 million are included in our Consumer Digital Safety and Enterprise Security segment results, respectively. Transaction costs of $21 million incurred by Symantec in connection with the LifeLock acquisition are included in operating expenses in our Consolidated Statements of Operations for fiscal 2017. See Note 2 for more information on our segments.
Unaudited combined pro forma information
The unaudited pro forma financial results combine the historical results of Symantec, Blue Coat and LifeLock for fiscal years 2017 and 2016. The results include the effects of pro forma adjustments as if Blue Coat and LifeLock were acquired at the beginning of our 2016 fiscal year. The pro forma results for fiscal years 2017 and 2016 include adjustments for amortization of acquired intangible assets, stock-based compensation, commissions, interest on debt used to finance the acquisition, and acquisition-related transaction costs, as well as for the income tax effect of these pro forma adjustments.
The unaudited pro forma financial results presented below do not include any anticipated synergies or other expected benefits of the acquisitions. These pro forma results are presented for informational purposes only and are not indicative of future operations or results that would have been achieved had the acquisition been completed as of the beginning of our 2016 fiscal year. The following table summarizes the pro forma financial information:
Year Ended | |||||||
(In millions) | March 31, 2017 | April 1, 2016 | |||||
Net revenues | $ | 4,817 | $ | 4,803 | |||
Net income (loss) | $ | (174 | ) | $ | 1,791 | ||
Note 7. Goodwill and Intangible Assets
Goodwill
The changes in the carrying amount of goodwill by segment are as follows:
(In millions) | Consumer Digital Safety | Enterprise Security | Total | ||||||||
Balance as of April 3, 2015 | $ | 1,230 | $ | 1,916 | $ | 3,146 | |||||
Translation adjustments | 1 | 1 | 2 | ||||||||
Balance as of April 1, 2016 | 1,231 | 1,917 | 3,148 | ||||||||
Acquisition of Blue Coat | — | 4,083 | 4,083 | ||||||||
Acquisition of LifeLock | 1,318 | 83 | 1,401 | ||||||||
Translation adjustments | — | (5 | ) | (5 | ) | ||||||
Balance as of March 31, 2017 | $ | 2,549 | $ | 6,078 | $ | 8,627 | |||||
61
Intangible assets, net
March 31, 2017 | April 1, 2016 | ||||||||||||||||||||||
(In millions) | Gross Carrying Amount | Accumulated Amortization | Net Carrying Amount | Gross Carrying Amount | Accumulated Amortization | Net Carrying Amount | |||||||||||||||||
Customer relationships | $ | 1,646 | $ | (322 | ) | $ | 1,324 | $ | 406 | $ | (320 | ) | $ | 86 | |||||||||
Developed technology | 1,006 | (229 | ) | 777 | 144 | (84 | ) | 60 | |||||||||||||||
Finite-lived trade names | 23 | (6 | ) | 17 | 2 | (2 | ) | — | |||||||||||||||
Patents | 21 | (20 | ) | 1 | 21 | (18 | ) | 3 | |||||||||||||||
Other | 2 | — | 2 | — | — | — | |||||||||||||||||
Total finite-lived intangible assets | 2,698 | (577 | ) | 2,121 | 573 | (424 | ) | 149 | |||||||||||||||
Indefinite-lived trade names | 864 | — | 864 | 294 | — | 294 | |||||||||||||||||
In-process research and development | 19 | — | 19 | — | — | — | |||||||||||||||||
Total | $ | 3,581 | $ | (577 | ) | $ | 3,004 | $ | 867 | $ | (424 | ) | $ | 443 | |||||||||
As a result of our acquisitions of Blue Coat and LifeLock, we recorded $1.6 billion and $1.2 billion of acquired intangible assets, respectively, during fiscal 2017. See Note 6 for more information on the Blue Coat and LifeLock acquisitions. As of March 31, 2017, future amortization expense related to intangible assets that have finite lives is as follows by fiscal year:
(In millions) | March 31, 2017 | |||
2018 | $ | 452 | ||
2019 | 426 | |||
2020 | 407 | |||
2021 | 295 | |||
2022 | 235 | |||
Thereafter | 306 | |||
Total | $ | 2,121 | ||
Note 8. Debt
The following table summarizes components of our debt:
(In millions) | March 31, 2017 | April 1, 2016 | Effective Interest Rate | |||||||
2.75% Senior Notes due June 15, 2017 | $ | 600 | $ | 600 | 2.79 | % | ||||
Senior Term Loan A-1 due May 10, 2019 | 1,000 | — | LIBOR plus (1) | |||||||
Senior Term Loan A-2 due August 1, 2019 | 800 | — | LIBOR plus (1) | |||||||
Senior Term Loan A-3 due August 1, 2019 | 200 | — | LIBOR plus (1) | |||||||
4.2% Senior Notes due September 15, 2020 | 750 | 750 | 4.25 | % | ||||||
2.5% Convertible Senior Notes due April 1, 2021 | 500 | 500 | 3.76 | % | ||||||
Senior Term Loan A-5 due August 1, 2021 | 1,710 | — | LIBOR plus (1) | |||||||
2.0% Convertible Senior Notes due August 15, 2021 | 1,250 | — | 2.66 | % | ||||||
3.95% Senior Notes due June 15, 2022 | 400 | 400 | 4.05 | % | ||||||
5.0% Senior Notes due April 15, 2025 | 1,100 | — | 5.23 | % | ||||||
Total principal amount | 8,310 | 2,250 | ||||||||
Less: unamortized discount and issuance costs | (124 | ) | (43 | ) | ||||||
Total debt | 8,186 | 2,207 | ||||||||
Less: current portion | (1,310 | ) | — | |||||||
Total long-term portion | $ | 6,876 | $ | 2,207 | ||||||
(1) | The senior term facilities bear interest at a rate equal to the London InterBank Offered Rate (“LIBOR”) plus a margin based on the debt rating of our non-credit-enhanced, senior unsecured long-term debt. |
62
The future maturities of debt by fiscal year are as follows:
(In millions) | March 31, 2017 | |||
2018 | $ | 1,310 | ||
2019 | — | |||
2020 | 2,000 | |||
2021 | 1,260 | |||
2022 | 2,240 | |||
Thereafter | 1,500 | |||
Total future maturities of debt | $ | 8,310 | ||
2017 Activity
On February 9, 2017, we issued $1.1 billion aggregate principal amount of our 5.0% Senior Notes due April 15, 2025 (the “5.0% Senior Notes”). The 5.0% Senior Notes are governed by a basic and supplemental indenture. The 5.0% Senior Notes bear interest at a rate of 5.00% per year, payable semiannually in arrears on April 15 and October 15 of each year, beginning on October 15, 2017. The 5.0% Senior Notes will mature on April 15, 2025.
We may redeem some or all of the 5.0% Senior Notes at any time prior to April 15, 2020 at a price equal to 100% of the principal amount of the 5.0% Senior Notes redeemed, plus accrued and unpaid interest, if any, and a premium, as described in the supplemental indenture to the 5.0% Senior Notes. On or after April 15, 2020, we may redeem some or all of the 5.0% Senior Notes at the applicable redemption prices set forth in the Supplemental Indenture, plus accrued and unpaid interest. Debt issuance costs of the 5.0% Senior Notes have been recorded as a reduction of the carrying value of the 5.0% Senior Notes on our Consolidated Balance Sheet as of March 31, 2017, and are being amortized as interest expense over the term of the 5.0% Senior Notes. The indentures contain customary events of default. In the case of certain events of bankruptcy or insolvency, the principal amount of the 5.0% Senior Notes, and any unpaid interest accrued thereon, shall automatically become immediately due and payable. We used the proceeds from the 5.0% Senior Notes to finance a portion of the acquisition of LifeLock. LifeLock’s existing revolving credit facility was terminated in connection with the acquisition. See Note 6 for further discussion of the LifeLock acquisition.
On May 10, 2016, we entered into a senior unsecured credit facility, which provided for a $1.0 billion 5 years revolving credit facility (the “Revolving Facility”) and a 3 years term loan (the “Senior Term Loan A-1”) in an amount of $1.0 billion (of which up to $20 million may be in the form of short-term swingline loans), which mature on May 10, 2021 and 2019, respectively. On July 18, 2016, we amended and restated the Revolving Facility and Senior Term Loan A-1 Agreement to provide for, among other things, an additional $800 million 3 years term loan (the “Senior Term Loan A-2”) which matures on August 1, 2019. The amended and restated Revolving Facility and Senior Term Loan A-1/A-2 Agreement became effective on August 1, 2016, concurrently with the closing of the Blue Coat acquisition. The amended and restated Revolving Facility and Senior Term Loan A-1/A-2 Agreement provides that we have the right at any time, subject to customary conditions, and not more than once in any year, to request incremental revolving commitments of at least $100 million, and incremental loans of at least $100 million under the Senior Term Loan A-1, provided that the aggregate amount of all such incremental increases does not exceed $500 million.
On August 1, 2016, we entered into a Term Loan Agreement that provides for a 3 years term loan with a principal amount of $200 million (the “Senior Term Loan A-3”) and a 5 years term loan with a principal amount of $1.8 billion (the “Senior Term Loan A-5”). At the closing of the Blue Coat acquisition, we borrowed the full amounts available under the Senior Term Loan A-3 and the Senior Term Loan A-5 to, among other things, fund the cash consideration for the Blue Coat acquisition and pay transaction-related expenses. On October 3, 2016, we exercised our option to assign the loans under the Senior Term Loan A-3/A-5 Agreement to a foreign subsidiary in accordance with the Term Loan Agreement.
On June 12, 2016, we entered into an investment agreement relating to the issuance of $1.25 billion aggregate principal amount of 2.0% convertible unsecured notes. The notes were issued concurrent with the Blue Coat acquisition. See further description below.
Revolving Facility and Senior Term Loan A-1/A-2 Agreement
Borrowings under the Revolving Facility and Senior Term Loan A-1/A-2 Agreement bear interest at a floating rate of interest plus an applicable margin which is based on our senior unsecured credit agency rating, according to the terms of the agreement. We are obliged to pay commitment fees on the daily amount of the unused revolving commitment at a rate based on our debt ratings. Interest and commitment fees are payable in arrears quarterly. We may voluntarily repay all outstanding loans under the Revolving Facility and Senior Term Loan A-1/A-2 Agreement at any time without premium or penalty according to the terms of the agreement. The Senior Term Loan A-1, Senior Term Loan A-2 and Revolving Facility mature on May 10, 2019, August 1, 2019 and May 10, 2021, respectively.
The Revolving Facility and Term Loan A-1/A-2 Agreement contain a covenant that we maintain a ratio of consolidated funded debt to consolidated adjusted earnings before interest, taxes, depreciation, and amortization (“EBITDA”) of not more than 6.00 to 1.0 through December 31, 2018, then 5.25 to 1.0 thereafter, and restrictions on subsidiary indebtedness, liens, stock repurchases and dividends (with exceptions permitting our regular quarterly dividend). In addition, the Revolving Facility and
63
Senior Term Loan A-1/A-2 Agreement contain a covenant for customary events of default or a change of control, under which our payment obligations may be accelerated and the interest rate applicable to any borrowings will increase by 200 basis points.
Senior Term Loan A-3/A-5 Agreement
The loans under the Senior Term Loan A-3/A-5 Agreement bear interest at a floating rate of interest plus an applicable margin, which is based on our senior unsecured credit agency rating, according to the terms of the agreement. The Senior Term Loan A-3 will mature on August 1, 2019 and has no scheduled payments. The Senior Term Loan A-5 will mature on August 1, 2021. For the duration of the loan, quarterly payments are due on the Senior Term Loan A-5 in aggregate annual amounts equal to 10% of the original principal amount. In accordance with the terms of the Senior Term Loan A-3/A-5 Agreement, the Company may voluntarily repay outstanding principal balances under the Senior Term Loan A-3 and Senior Term Loan A-5 at any time without premium or penalty, and with regard to the Senior Term Loan A-5, prepayments must be applied to reduce the subsequent scheduled and outstanding required payments.
The Senior Term Loan A-3/A-5 Agreement contains customary representations and warranties, affirmative and negative covenants, including a covenant that the Company maintain a ratio of consolidated funded debt to consolidated EBITDA that is less than 6.00 to 1.0 until December 31, 2018, decreasing to 5.25:1.0 thereafter. In addition, the Senior Term Loan A-3/A-5 Agreement contains a covenant for customary events of default, including us experiencing a change of control described in the Revolving Facility and Term Loan A-1/A-2 Agreement, under which our payment obligations may be accelerated and the interest rate applicable to any borrowings under the Senior Term Loan A-3/A-5 Agreement will increase by 200 basis points.
Other Senior Notes
As of March 31, 2017, we had three series of senior notes issued and outstanding (“Other Senior Notes”) in addition to the 5.0% Senior Notes discussed above. The Other Senior Notes are senior unsecured obligations that rank equally in right of payment with all of our existing and future senior, unsecured, unsubordinated obligations. Each series of Other Senior Notes may be redeemed at any time, subject to the make-whole provisions contained in the applicable indenture relating to such series of Other Senior Notes.
Interest on each series of Other Senior Notes is payable semi-annually in arrears, and the 2.75% Senior Notes, 4.2% Senior Notes, and 3.95% Senior Notes bear interest at annual rates of interest of 2.75%, 4.2%, and 3.95%, respectively. Interest is payable on June 15 and December 15 for the 2.75% Senior Notes, September 15 and March 15 for the 4.2% Senior Notes, and June 15 and December 15 for the 3.95% Senior Notes, respectively.
Convertible Senior Notes
As of March 31, 2017, we had two outstanding issuances of convertible notes which are senior unsecured obligations and rank equal in right of payment to all other senior, unsecured, unsubordinated indebtedness. On March 4, 2016, we issued $500 million of convertible notes which mature on April 1, 2021 and bear interest at an annual rate of 2.5% (“2.5% Convertible Notes”). Subsequently, and in connection with the closing of the Blue Coat acquisition, we issued an additional $1.25 billion of convertible notes which mature on August 15, 2021 and bear interest at an annual rate of 2.0% (“2.0% Convertible Notes”). Both the 2.5% Convertible Notes and the 2.0% Convertible Notes (collectively, “Convertible Senior Notes”) have coupon interest payable semiannually in arrears in cash. Interest payments on the Convertible Senior Notes will be due on October 1 and April 1 of each year in the case of the 2.5% Convertible Notes, and February 15 and August 15 in the case of the 2.0% Convertible Notes. Any debt issuance costs for our Convertible Senior Notes have been recorded as a reduction to the Convertible Senior Notes on our Consolidated Balance Sheet as of March 31, 2017, and are being amortized as interest expense. In addition, the fair value of the equity component of our Convertible Senior Notes of $41 million, net of tax was recorded in additional paid-in capital and is also being amortized as interest expense.
Noteholders of the Convertible Senior Notes may convert the notes into our common stock at any time up to the maturity date of each note. The conversion rate for the 2.0% Convertible Notes is 48.9860 shares of common stock per $1,000 principal amount of the notes, which represents an initial conversion price of approximately $20.41 per share. The conversion rate for the 2.5% Convertible Notes is 59.6341 shares of common stock per $1,000 principal amount of the notes, which represents an initial conversion price of approximately $16.77 per share. If holders of the Convertible Senior Notes convert them in connection with a fundamental change, we may be required to provide a make-whole premium in the form of an increased conversion rate, subject to a maximum amount, based on the effective date of the fundamental change as set forth in a table contained in the indenture governing each of the Convertible Senior Notes. A fundamental change, as defined in each of the indentures governing the Convertible Senior Notes, includes a sale of substantially all the Company’s assets, a change of the control of the Company, or a plan for the Company’s liquidation or dissolution. The conversion rates under the Convertible Senior Notes are subject to customary anti-dilution adjustments.
As long as the holders of the Convertible Senior Notes each own at least 4% of our common stock on an as-converted basis, they are entitled to nominate one director to our Board of Directors. As of March 31, 2017, the holders’ percentage interest in our common stock exceeded this threshold. If the Noteholders request a conversion, we have the option to settle the par amount of the Convertible Senior Notes using cash, shares or a combination of cash and shares.
We may redeem the 2.5% Convertible Senior Notes at our option upon the 4-year anniversary of the issuance date of the 2.5% Convertible Senior Notes. The 2.0% Convertible Senior Notes are not redeemable at our option.
64
Note 9. Fair Value Measurements
Assets measured and recorded at fair value on a recurring basis
Our cash equivalents consist primarily of money market funds with original maturities of three months or less at the time of purchase, and the carrying amount is a reasonable estimate of fair value. Our short-term investments consist of investment securities with original maturities greater than three months and marketable equity securities, and are included in our other current assets in the Consolidated Balance Sheets.
The following table summarizes our assets measured at fair value on a recurring basis:
March 31, 2017 | April 1, 2016 | ||||||||||||||||||||||
(In millions) | Fair Value | Cash and Cash Equivalents | Short-term Investments | Fair Value | Cash and Cash Equivalents | Short-term Investments | |||||||||||||||||
Cash | $ | 1,183 | $ | 1,183 | $ | — | $ | 1,072 | $ | 1,072 | $ | — | |||||||||||
Non-negotiable certificates of deposit | 15 | 15 | — | 1 | — | 1 | |||||||||||||||||
Level 1: | |||||||||||||||||||||||
Money market | 2,532 | 2,532 | — | 2,905 | 2,905 | — | |||||||||||||||||
U.S. government securities | 94 | 94 | — | 335 | 310 | 25 | |||||||||||||||||
Marketable equity securities | 9 | — | 9 | 11 | — | 11 | |||||||||||||||||
Total level 1 | 2,635 | 2,626 | 9 | 3,251 | 3,215 | 36 | |||||||||||||||||
Level 2: | |||||||||||||||||||||||
Corporate bonds | — | — | — | 45 | 43 | 2 | |||||||||||||||||
U.S. agency securities | 75 | 75 | — | 526 | 523 | 3 | |||||||||||||||||
Commercial paper | 348 | 348 | — | 1,121 | 1,121 | — | |||||||||||||||||
Negotiable certificates of deposit | — | — | — | 9 | 9 | — | |||||||||||||||||
Total level 2 | 423 | 423 | — | 1,701 | 1,696 | 5 | |||||||||||||||||
Total | $ | 4,256 | $ | 4,247 | $ | 9 | $ | 6,025 | $ | 5,983 | $ | 42 | |||||||||||
There were no transfers between fair value measurement levels during fiscal 2017.
Fair value of debt
As of March 31, 2017 and April 1, 2016, the total fair value of our current and long-term debt was $8.3 billion and $2.3 billion, respectively, based on Level 2 inputs.
EQUITY & OTHER
Note 10. Stockholders’ Equity
Dividends
The following table summarizes dividends declared and paid and dividend equivalents paid for the periods presented:
Year Ended | |||||||||||
(In millions, except per share data) | March 31, 2017 | April 1, 2016 | April 3, 2015 | ||||||||
Dividends declared and paid | $ | 186 | $ | 3,020 | $ | 408 | |||||
Dividend equivalents paid | 36 | 10 | 5 | ||||||||
Total dividends and dividend equivalents paid | $ | 222 | $ | 3,030 | $ | 413 | |||||
Cash dividends declared per common share | $ | 0.30 | $ | 4.60 | $ | 0.60 | |||||
Fiscal 2016 included a special dividend of $4.00 per share that was declared and paid during the fourth quarter of fiscal 2016 and was recorded as a reduction of retained earnings. Our RSUs and PRUs are entitled to dividend equivalents to be paid in the form of cash upon vesting for each share of the underlying unit.
On May 10, 2017, we declared a cash dividend of $0.075 per share of common stock to be paid on June 21, 2017 to all stockholders of record as of the close of business on June 7, 2017. All shares of common stock issued and outstanding and unvested RSUs and PRUs as of the record date will be entitled to the dividend and dividend equivalents, respectively. Any future dividends and dividend equivalents will be subject to the approval of our Board of Directors.
65
Shares outstanding
Shares of our common stock outstanding were as follows:
Year Ended | ||||||||
(In millions) | March 31, 2017 | April 1, 2016 | April 3, 2015 | |||||
Balance, beginning of year | 612 | 684 | 695 | |||||
Common stock issued under employee stock plans | 14 | 12 | 10 | |||||
Direct stock purchase | 3 | — | — | |||||
Repurchases of common stock | (21 | ) | (84 | ) | (21 | ) | ||
Balance, end of year | 608 | 612 | 684 | |||||
Stock repurchases
Under our stock repurchase programs, we may purchase shares of our outstanding common stock through open market and through accelerated stock repurchase (“ASR”) transactions. On November 20, 2016, our Board of Directors increased the authorization under our stock repurchase program by $510 million, bringing the total authorization to $1.3 billion for stock repurchases. The Board of Directors also authorized up to $500 million of the $1.3 billion to be expended before March 31, 2017. In March 2017, we entered into an ASR agreement with financial institutions (the “March 2017 ASR”) to repurchase an aggregate $500 million of our common stock. The remaining $800 million authorization, to be completed in future periods, does not have an expiration date.
Repurchases on open market transactions
The following table summarizes our stock repurchases on open market transactions for the periods presented and excludes the impact of shares purchased under our ASR agreements (except for the remaining authorization amount):
Year Ended | |||||||||||
(In millions, except per share data) | March 31, 2017 | April 1, 2016 | April 3, 2015 | ||||||||
Total number of shares repurchased | — | 17 | 21 | ||||||||
Dollar amount of shares repurchased | $ | — | $ | 368 | $ | 500 | |||||
Average price paid per share | $ | — | $ | 21.69 | $ | 23.73 | |||||
Remaining authorization at end of period | $ | 800 | $ | 790 | $ | 1,158 | |||||
Accelerated stock repurchase agreements
Pursuant to the March 2017 ASR, we made an upfront payment of $500 million and received and retired an initial delivery of 14.2 million shares of our common stock in March 2017. On May 19, 2017, which was in our first quarter of fiscal 2018, the ASR was completed, which, per the terms of the agreements, resulted in us receiving an additional 2.2 million shares of our common stock. The total shares received under the terms of the ASR were 16.4 million, with an average price paid per share of $30.51.
In March 2016, we entered into an ASR agreement with financial institutions (the “March 2016 ASR”) to repurchase an aggregate of $1.0 billion of our common stock. Pursuant to the March 2016 ASR, we made an upfront payment of $1.0 billion and received and retired an initial delivery of 42.4 million shares of our common stock in March 2016. We completed the repurchase and received an additional 6.5 million shares of our common stock in November 2016. The total shares received and retired under the terms of the March 2016 ASR were 48.9 million, with an average price paid per share of $20.44.
In November 2015, we entered into an ASR agreement with a financial institution (the “November 2015 ASR”) to repurchase an aggregate of $500 million of our common stock. Pursuant to the November 2015 ASR, we made an upfront payment of $500 million and received and retired an initial delivery of 19.9 million shares of our common stock in November 2016. We completed the repurchase and received an additional 5.0 million shares of our common stock in January 2016. The total shares received and retired under the terms of the November 2015 ASR were 24.9 million, with an average price paid per share of $20.08.
The upfront payment amounts for the ASRs are included in repurchases of common stock on our Consolidated Statements of Cash Flows for their respective periods.
Accumulated other comprehensive income
The changes in accumulated other comprehensive income (“AOCI”) by component, on a net of tax basis, were as follows:
(In millions) | Foreign Currency Translation Adjustments | Unrealized Gain On Available-For-Sale Securities | Total AOCI | ||||||||
Balance as of April 1, 2016 | $ | 15 | $ | 7 | $ | 22 | |||||
Other comprehensive loss before reclassifications | (8 | ) | (2 | ) | (10 | ) | |||||
Balance as of March 31, 2017 | $ | 7 | $ | 5 | $ | 12 | |||||
66
Note 11. Stock-Based Compensation
Stock incentive plans
2004 and 2013 Equity Incentive Plans
Under both the 2004 Equity Incentive Plan (“2004 Plan”) and the 2013 Equity Incentive Plan (“2013 Plan”) (collectively “the Equity Plans”), we have granted incentive and nonqualified stock options, stock appreciation rights, RSUs, restricted stock awards, and performance-based awards to employees, officers, directors, consultants, independent contractors, and advisors to us. These may also be granted to any parent, subsidiary, or affiliate of ours. The purpose of the Equity Plans has been to attract, retain, and motivate eligible persons whose present and potential contributions are important to our success by offering them an opportunity to participate in our future performance through equity awards. RSUs granted prior to November 2014 generally vest over a four-year period, whereas RSUs granted thereafter generally vest over a three-year period.
Upon adoption, our stockholders approved and reserved 45 million shares of common stock for issuance under the 2013 Plan. As of March 31, 2017, 28 million shares remained available for future grant.
2008 Employee Stock Purchase Plan
Beginning August 16, 2016, eligible employees are offered shares through a 12-month offering period, which consists of two consecutive 6-month purchase periods. Employees may annually contribute up to 10% of their gross compensation, subject to certain limitations, to purchase shares of our common stock at 85% of the lower of either its fair market value on the purchase date or the fair market value at the beginning of the offering period. Prior to August 16, 2016, employees were able to purchase shares of common stock at a price per share equal to 85% of the fair market value on the purchase date at the end of each six month purchase period. As of March 31, 2017, 31 million shares have been issued under this plan and 39 million shares remained available for future issuance.
Acquired plans
Blue Coat acquisition
In connection with the Blue Coat acquisition, we assumed the outstanding equity awards under two of Blue Coat’s equity incentive plans (the Blue Coat, Inc. 2016 Equity Incentive Plan and the Batman Holdings, Inc. 2015 Amended and Restated Equity Incentive Plan (collectively, the “Blue Coat Plans”)), including 7.5 million vested and 12.5 million unvested stock options, 4.8 million unvested RSUs, and 3.0 million unvested PRUs. The total fair value of options assumed was $265 million and the total fair value of RSUs and PRUs assumed was $162 million, before adjusting for estimated forfeitures. Upon vesting, these assumed options will be exercisable into, and these assumed RSUs and PRUs will settle into shares of our common stock. The assumed RSUs and PRUs generally retained the terms and conditions under which they were originally granted. We will not grant additional options or shares under the Blue Coat Plans. Future equity awards by Symantec will be made under our 2013 Plan, as amended. See Note 6 for more information on the Blue Coat acquisition.
Included in the aforementioned assumed Blue Coat equity awards were RSUs and PRUs granted to Gregory S. Clark, former Blue Coat CEO and our current CEO, in connection with the closing of the Blue Coat acquisition. These equity awards were assumed by Symantec on the close date for an equivalent of 1.3 million Symantec RSUs and 1.0 million PRUs. The RSUs vest at various times over 3-years and PRUs are subject to 2-year vesting and the achievement of certain performance metrics during the applicable performance period. These awards had a combined fair value of $46 million, before adjusting for estimated forfeitures, on the close date of the Blue Coat acquisition. In addition, Blue Coat had previously granted Mr. Clark stock options which were assumed by Symantec. Upon assumption of these options, Mr. Clark held 3.9 million unvested options to purchase our common stock with a fair value of $53 million on August 1, 2016, of which $50 million is being recognized as stock-based compensation expense over the 2-year vesting period and the remainder was included as part of the consideration transferred for the acquisition.
LifeLock acquisition
In connection with the LifeLock acquisition, we assumed the outstanding equity awards under LifeLock’s equity incentive plan (the LifeLock, Inc. 2012 Incentive Compensation Plan (the “LifeLock Plan”)), including 4.1 million unvested stock options and 3.1 million unvested RSUs. The total fair value of options assumed was $61 million and the total fair value of RSUs assumed was $91 million, before adjusting for estimated forfeitures. Upon vesting, these assumed options will be exercisable into, and these assumed RSUs will settle into shares of our common stock. The assumed RSUs generally retained the terms and conditions under which they were originally granted. We will not grant additional options or shares under the LifeLock Plan. Future equity awards by Symantec will be made under our 2013 Plan, as amended. See Note 6 for more information on the LifeLock acquisition.
67
Shares reserved
We reserved the following shares of authorized but unissued common stock:
(In millions) | March 31, 2017 | |
Stock purchase plans | 39 | |
Stock award plans | 76 | |
Total | 115 | |
Stock-based compensation expense
The following table sets forth the total stock-based compensation expense recognized in our Consolidated Statements of Operations.
Year Ended | |||||||||||
(Dollars in millions) | March 31, 2017 | April 1, 2016 | April 3, 2015 | ||||||||
Cost of revenue | $ | 21 | $ | 10 | $ | 15 | |||||
Sales and marketing | 107 | 53 | 46 | ||||||||
Research and development | 110 | 56 | 39 | ||||||||
General and administrative | 202 | 42 | 31 | ||||||||
Total stock-based compensation expense from continuing operations | 440 | 161 | 131 | ||||||||
Tax benefit associated with stock-based compensation expense | (149 | ) | (50 | ) | (37 | ) | |||||
Net stock-based compensation expense from continuing operations | 291 | 111 | 94 | ||||||||
Net stock-based compensation expense from discontinued operations | — | 56 | 46 | ||||||||
Net stock-based compensation expense | $ | 291 | $ | 167 | $ | 140 | |||||
Restricted stock units
(In millions, except per share and year data) | Number of Shares | Weighted- Average Grant Date Fair Value | Weighted- Average Remaining Years | Aggregate Intrinsic Value | ||||||||
Outstanding at April 1, 2016 | 17 | $ | 22.72 | |||||||||
Granted and assumed | 18 | $ | 20.56 | |||||||||
Vested and released | (8 | ) | $ | 22.54 | ||||||||
Forfeited | (4 | ) | $ | 21.45 | ||||||||
Outstanding and unvested at March 31, 2017 | 23 | $ | 21.26 | 1.1 | $ | 692 | ||||||
Expected to vest at March 31, 2017 | 19 | 1.0 | $ | 573 | ||||||||
The weighted-average grant date fair value per share of RSUs granted during fiscal 2017, 2016, and 2015, including assumed RSUs was $20.56, $23.20, and $22.66, respectively. The total fair value of RSUs that vested and was released in fiscal 2017, 2016, and 2015 was $181 million, $250 million and $133 million, respectively.
As of March 31, 2017, total unrecognized compensation cost related to RSUs was $278 million, net of estimated forfeitures, which is expected to be recognized over the remaining weighted-average vesting period of 1.8 years.
Performance-based restricted stock units
(In millions, except per share and year data) | Number of Shares | Weighted- Average Grant Date Fair Value | Weighted- Average Remaining Years | Aggregate Intrinsic Value | ||||||||
Outstanding at April 1, 2016 | 2 | $ | 27.13 | |||||||||
Granted and assumed | 5 | $ | 19.99 | |||||||||
Vested and released | (1 | ) | $ | 28.76 | ||||||||
Outstanding and unvested at March 31, 2017 | 6 | $ | 21.05 | 1.0 | $ | 181 | ||||||
Expected to vest at March 31, 2017 | 5 | 1.0 | $ | 166 | ||||||||
68
The weighted-average grant date fair value per share of performance-based restricted stock granted during fiscal 2017, 2016, and 2015, including assumed performance-based restricted stock was $19.99, $27.10, and $26.30, respectively. The total fair value of restricted stock that vested and was released in fiscal 2017, 2016, and 2015 was $14 million, $9 million, and $23 million, respectively.
As of March 31, 2017, total unrecognized compensation cost related to PRUs was $172 million, net of estimated forfeitures, which is expected to be recognized over the remaining weighted-average vesting period of 1.0 years.
Stock options
(In millions, except per share and year data) | Number of Shares | Weighted- Average Exercise Price | Weighted- Average Remaining Years | Aggregate Intrinsic Value | ||||||||
Outstanding at April 1, 2016 | — | $ | — | |||||||||
Assumed | 24 | $ | 8.77 | |||||||||
Exercised | (4 | ) | $ | 7.93 | ||||||||
Outstanding and unvested at March 31, 2017 | 20 | $ | 8.94 | |||||||||
Exercisable at March 31, 2017 | 7 | 8.3 years | $ | 164 | ||||||||
Vested and expected to vest at March 31, 2017 | 18 | 8.4 years | $ | 392 | ||||||||
The total intrinsic value of options exercised during fiscal 2017 was $78 million. As of March 31, 2017, total unrecognized compensation cost adjusted for estimated forfeitures related to unvested stock options was $147 million, net of estimated forfeitures, which is expected to be recognized over the remaining weighted-average vesting period of 1.7 years.
Valuation of stock options
The following assumptions were used to estimate the fair value of stock options assumed in the Blue Coat and LifeLock acquisitions during fiscal 2017:
Expected life | 5.0 years | |
Weighted-average expected volatility | 26.25 | % |
Weighted-average risk-free interest | 1.22 | % |
Expected dividend yield | 1.39 | % |
Note 12. Commitments and Contingencies
Lease commitments
We lease certain of our facilities, equipment, and co-locations under operating leases that expire at various dates through fiscal 2026. We currently sublease some space under various operating leases that will expire on various dates through fiscal 2023. Some of our leases contain renewal options, escalation clauses, rent concessions, and leasehold improvement incentives. Rent expense under operating leases was $79 million, $103 million, and $113 million for fiscal 2017, 2016, and 2015, respectively.
The minimum future rentals on non-cancelable operating leases by fiscal year are as follows:
(In millions) | March 31, 2017 | |||
2018 | $ | 88 | ||
2019 | 74 | |||
2020 | 51 | |||
2021 | 43 | |||
2022 | 30 | |||
Thereafter | 41 | |||
Total minimum future lease payments | 327 | |||
Sublease income | (48 | ) | ||
Total minimum future lease payments, net | $ | 279 | ||
Purchase obligations
We have purchase obligations that are associated with agreements for purchases of goods or services. Management believes that cancellation of these contracts is unlikely and we expect to make future cash payments according to the contract terms.
69
The following reflects unrecognized purchase obligations by fiscal year:
(In millions) | March 31, 2017 | |||
2018 | $ | 125 | ||
2019 | 28 | |||
2020 | 1 | |||
Thereafter | — | |||
Total purchase obligations | $ | 154 | ||
Indemnifications
In the ordinary course of business, we may provide indemnifications of varying scope and terms to customers, vendors, lessors, business partners, subsidiaries and other parties with respect to certain matters, including, but not limited to, losses arising out of our breach of agreements or representations and warranties made by us. In addition, our bylaws contain indemnification obligations to our directors, officers, employees and agents, and we have entered into indemnification agreements with our directors and certain of our officers to give such directors and officers additional contractual assurances regarding the scope of the indemnification set forth in our bylaws and to provide additional procedural protections. We maintain director and officer insurance, which may cover certain liabilities arising from our obligation to indemnify our directors and officers. It is not possible to determine the aggregate maximum potential loss under these indemnification agreements due to the limited history of prior indemnification claims and the unique facts and circumstances involved in each particular agreement. Such indemnification agreements might not be subject to maximum loss clauses. Historically, we have not incurred material costs as a result of obligations under these agreements and we have not accrued any liabilities related to such indemnification obligations in our Consolidated Financial Statements.
In connection with the sale of Veritas, we assigned several leases to Veritas Technologies LLC or its related subsidiaries. As a condition to consenting to the assignments, certain lessors required us to agree to indemnify the lessor under the applicable lease with respect to certain matters, including, but not limited to, losses arising out of Veritas Technologies LLC or its related subsidiaries’ breach of payment obligations under the terms of the lease. As with our other indemnification obligations discussed above and in general, it is not possible to determine the aggregate maximum potential loss under these indemnification agreements due to the limited history of prior indemnification claims and the unique facts and circumstances involved in each particular agreement. As with our other indemnification obligations, such indemnification agreements might not be subject to maximum loss clauses and to date, generally under our real estate obligations, we have not incurred material costs as a result of such obligations under our leases and have not accrued any liabilities related to such indemnification obligations in our Consolidated Financial Statements.
We provide limited product warranties and the majority of our software license agreements contain provisions that indemnify licensees of our software from damages and costs resulting from claims alleging that our software infringes on the intellectual property rights of a third party. Historically, payments made under these provisions have been immaterial. We monitor the conditions that are subject to indemnification to identify if a loss has occurred.
Litigation contingencies
GSA
During the first quarter of fiscal 2013, we were advised by the Commercial Litigation Branch of the Department of Justice’s (“DOJ”) Civil Division and the Civil Division of the U.S. Attorney’s Office for the District of Columbia that the government is investigating our compliance with certain provisions of our U.S. General Services Administration (“GSA”) Multiple Award Schedule Contract No. GS-35F-0240T effective January 24, 2007, including provisions relating to pricing, country of origin, accessibility, and the disclosure of commercial sales practices.
As reported on the GSA’s publicly-available database, our total sales under the GSA Schedule contract were approximately $222 million from the period beginning January 2007 and ending September 2012. We have fully cooperated with the government throughout its investigation and in January 2014, representatives of the government indicated that their initial analysis of our actual damages exposure from direct government sales under the GSA schedule was approximately $145 million; since the initial meeting, the government’s analysis of our potential damages exposure relating to direct sales has increased. The government has also indicated they are going to pursue claims for certain sales to California, Florida, and New York as well as sales to the federal government through reseller GSA Schedule contracts, which could significantly increase our potential damages exposure.
In 2012, a sealed civil lawsuit was filed against Symantec related to compliance with the GSA Schedule contract and contracts with California, Florida, and New York. On July 18, 2014, the Court-imposed seal expired, and the government intervened in the lawsuit. On September 16, 2014, the states of California and Florida intervened in the lawsuit, and the state of New York notified the Court that it would not intervene. On October 3, 2014, the DOJ filed an amended complaint, which did not state a specific damages amount. On October 17, 2014, California and Florida combined their claims with those of the DOJ and the relator on behalf of New York in an Omnibus Complaint, and a First Amended Omnibus Complaint was filed on October 8, 2015; the state claims also do not state specific damages amounts.
70
It is possible that the litigation could lead to claims or findings of violations of the False Claims Act, and could be material to our results of operations and cash flows for any period. Resolution of False Claims Act investigations can ultimately result in the payment of somewhere between one and three times the actual damages proven by the government, plus civil penalties in some cases, depending upon a number of factors. Our current estimate of the low end of the range of the probable estimated loss from this matter is $25 million, which we have accrued. This amount contemplates estimated losses from both the investigation of compliance with the terms of the GSA Schedule contract as well as possible violations of the False Claims Act. There is at least a reasonable possibility that a loss may have been incurred in excess of our accrual for this matter, however, we are currently unable to determine the high end of the range of estimated losses resulting from this matter.
EDS & NDI
On January 24, 2011, a class action lawsuit was filed against us and our previous e-commerce vendor Digital River, Inc.; the lawsuit alleged violations of California’s Unfair Competition Law, the California Legal Remedies Act and unjust enrichment related to prior sales of Extended Download Service (“EDS”) and Norton Download Insurance (“NDI”). On March 31, 2014, the U.S. District Court for the District of Minnesota certified a class of all people who purchased these products between January 24, 2005 and March 10, 2011. In August 2015, the parties executed a settlement agreement pursuant to which we would pay the plaintiffs $30 million, which we accrued. On October 8, 2015, the Court granted preliminary approval of the settlement, which was subsequently paid into escrow by us. The Court granted final approval on April 22, 2016, and entered judgment in the case. Objectors to the settlement have appealed to the Eighth Circuit Court of Appeals, challenging the Court’s approval of the settlement.
Finjan
On August 28, 2013, Finjan, Inc. (“Finjan”) filed a complaint against Blue Coat Systems, Inc. in the U.S. District Court for the Northern District of California alleging that certain Blue Coat products infringe six of Finjan’s U.S. patents. On August 4, 2015, a jury returned a verdict that certain Blue Coat products infringe five of the Finjan patents-in-suit and awarded Finjan lump-sum damages of $40 million. On November 20, 2015, the trial court entered a judgment in favor of Finjan on the jury verdict and certain non-jury legal issues. On July 28, 2016, in its ruling on post-trial motions the trial court denied Blue Coat’s motions seeking a new trial or judgment as a matter of law and denied Finjan’s request for enhanced damages and attorneys’ fees. In August 2016, we completed our acquisition of Blue Coat. We intend to vigorously contest the judgment and have filed an appeal with the Federal Circuit Court of Appeals. Our current best estimated loss and related interest with respect to the jury verdict is $40 million, which was accrued by Blue Coat and assumed by us as a part of the acquisition of Blue Coat.
Other
We are involved in a number of other judicial and administrative proceedings that are incidental to our business. Although adverse decisions (or settlements) may occur in one or more of the cases, it is not possible to estimate the possible loss or losses from each of these cases. The final resolution of these lawsuits, individually or in the aggregate, is not expected to have a material adverse effect on our business, results of operations, financial condition or cash flows.
Note 13. Discontinued Operations
On January 29, 2016, we completed the sale of Veritas. The results of Veritas are presented as discontinued operations in our Consolidated Statements of Operations and thus have been excluded from continuing operations and segment results for all reported periods.
In connection with the divestiture of Veritas, the Company and Veritas entered into Transition Service Agreements (“TSA”) pursuant to which the Company provides Veritas certain limited services including financial support services, information technology services, and access to facilities, and Veritas provides the Company certain limited financial support services. The TSAs commenced with the close of the transaction and expire at various dates through fiscal 2019. During fiscal 2017 and fiscal 2016, we recorded income of approximately $22 million and $8 million, respectively, for all services provided to Veritas, which is presented as part of other income, net in the Consolidated Statements of Operations.
We also have retained various customer relationships and contracts that were reported historically as a part of the Veritas business. Approximately $71 million and $330 million related to these relationships and contracts have been reported as part of our deferred revenue in the Consolidated Balance Sheet as of March 31, 2017 and April 1, 2016, respectively, along with an asset representing the service and maintenance rights we have under an agreement with Veritas of $41 million and $131 million, respectively. These balances will be amortized to discontinued operations through the remaining term of the underlying contracts.
71
The following table presents information regarding certain components of income from discontinued operations, net of income taxes:
Year Ended | |||||||||||
(In millions) | March 31, 2017 | April 1, 2016 | April 3, 2015 | ||||||||
Net revenues | $ | 172 | $ | 1,968 | $ | 2,552 | |||||
Cost of revenues | (15 | ) | (334 | ) | (426 | ) | |||||
Operating expenses | (26 | ) | (1,270 | ) | (1,131 | ) | |||||
Gain on sale of Veritas | 31 | 4,060 | — | ||||||||
Other income (expense), net | 1 | 3 | (3 | ) | |||||||
Income from discontinued operations before income taxes | 163 | 4,427 | 992 | ||||||||
Provision for income taxes | 33 | 1,118 | 223 | ||||||||
Income from discontinued operations, net of income taxes | $ | 130 | $ | 3,309 | $ | 769 | |||||
During fiscal 2017 we received additional payments which represented purchase price adjustments for the sale of Veritas.
Note 14. Subsequent Event
Subsequent to March 31, 2017, we prepaid $710 million of our Senior Term Loan A-5 and $100 million of our Senior Term Loan A-1 on April 5, 2017 and May 5, 2017, respectively.
72
SIGNATURES
Pursuant to the requirements of Section 13 or 15(d) of the Securities Exchange Act of 1934, the Registrant has duly caused this report to be signed on its behalf by the undersigned, thereunto duly authorized, in the City of Mountain View, State of California, on the 19th day of May 2017.
SYMANTEC CORPORATION | ||
By: | /s/ Gregory S. Clark | |
Gregory S. Clark Chief Executive Officer and Director | ||
KNOW ALL PERSONS BY THESE PRESENTS, that each person whose signature appears below constitutes and appoints Gregory S. Clark, Nicholas R. Noviello and Scott C. Taylor, and each or any of them, his attorneys-in-fact, each with the power of substitution, for him in any and all capacities to sign any and all amendments to this report on Form 10-K and any other documents in connection therewith, with the Securities and Exchange Commission, granting unto said attorneys-in-fact, and each of them, full power and authority to do and perform each and every act and thing requisite and necessary to be done in and about the premises, as fully to all intents and purposes as he might or could do in person, hereby ratifying and confirming all that such attorneys-in-fact, or his or their substitute or substitutes, may lawfully do or cause to be done by virtue hereof. This Power of Attorney may be signed in several counterparts.
Pursuant to the requirements of the Securities Exchange Act of 1934, this report has been signed below by the following persons on behalf of the Registrant and in the capacities and on the dates indicated below.
Signature | Title | Date | ||
/s/ Gregory S. Clark | Chief Executive Officer and Director (Principal Executive Officer) | May 19, 2017 | ||
Gregory S. Clark | ||||
/s/ Nicholas R. Noviello | Executive Vice President and Chief Financial Officer (Principal Financial Officer) | May 19, 2017 | ||
Nicholas R. Noviello | ||||
/s/ Mark S. Garfield | Senior Vice President and Chief Accounting Officer (Principal Accounting Officer) | May 19, 2017 | ||
Mark S. Garfield | ||||
/s/ Daniel H. Schulman | Chairman of the Board | May 19, 2017 | ||
Daniel H. Schulman | ||||
/s/ Frank E. Dangeard | Director | May 19, 2017 | ||
Frank E. Dangeard | ||||
/s/ Kenneth Y. Hao | Director | May 19, 2017 | ||
Kenneth Y. Hao | ||||
/s/ David W. Humphrey | Director | May 19, 2017 | ||
David W. Humphrey | ||||
/s/ Geraldine B. Laybourne | Director | May 19, 2017 | ||
Geraldine B. Laybourne | ||||
/s/ David L. Mahoney | Director | May 19, 2017 | ||
David L. Mahoney | ||||
/s/ Robert S. Miller | Director | May 19, 2017 | ||
Robert S. Miller | ||||
/s/ Anita M. Sands | Director | May 19, 2017 | ||
Anita M. Sands | ||||
/s/ V. Paul Unruh | Director | May 19, 2017 | ||
V. Paul Unruh | ||||
/s/ Suzanne M. Vautrinot | Director | May 19, 2017 | ||
Suzanne M. Vautrinot | ||||
73
Schedule II
SYMANTEC CORPORATION
VALUATION AND QUALIFYING ACCOUNTS
All financial statement schedules have been omitted, since the required information is not applicable or is not present in material amounts, and/or changes to such amounts are immaterial to require submission of the schedule, or because the information required is included in the Consolidated Financial Statements and notes thereto included in this Form 10-K.
EXHIBIT INDEX
Exhibit Number | Incorporated by Reference | Filed Herewith | ||||||||||
Exhibit Description | Form | File No. | Exhibit | Filing Date | ||||||||
2.01(§) | Purchase Agreement dated as of August 11, 2015, by and between Symantec Corporation and Havasu Holdings Ltd. | 8-K | 000-17781 | 2.01 | 8/13/2015 | |||||||
2.02 | Amendment, dated January 19, 2016, to the Purchase Agreement dated as of August 11, 2015, by and between Symantec Corporation and Veritas Holdings Ltd. (f/k/a Havasu Holdings Ltd.) | 8-K | 000-17781 | 2.01 | 1/20/2016 | |||||||
2.03(§) | Agreement and Plan of Merger, dated as of June 12, 2016, by and among Symantec Corporation, S-B0616 Merger Sub, Inc. and Blue Coat, Inc. | 8-K | 000-17781 | 2.01 | 6/14/2016 | |||||||
2.04 | Investment Agreement, dated as of June 12, 2016, by and among Symantec Corporation, Bain Capital Fund XI, L.P., Bain Capital Europe Fund IV, L.P. and Silver Lake Partners IV Cayman (AIV II), L.P. (including the form of Indenture attached as Exhibit A thereto). | 8-K | 000-17781 | 2.02 | 6/14/2016 | |||||||
2.05 | Amendment to Investment Agreement, dated as of July 31, 2016, by and among Symantec Corporation, Bain Capital Fund XI, L.P., Bain Capital Europe Fund IV, L.P. and Silver Lake Partners IV Cayman (AIV II), L.P. | 10-Q | 000-17781 | 2.03 | 8/5/2016 | |||||||
2.06(§)(**) | Agreement and Plan of Merger, dated as of November 20, 2016, by and among Symantec Corporation, L1116 Merger Sub, Inc. and LifeLock, Inc. | 8-K | 001-35671 | 2.01 | 11/21/2016 | |||||||
2.07(**) | Amendment No. 1 to Agreement and Plan of Merger, dated as of January 16, 2017, by and among Symantec Corporation, L1116 Merger Sub, Inc. and LifeLock, Inc. | 8-K | 001-35671 | 2.01 | 1/17/2017 | |||||||
2.08 | Form of Support Agreement by and among Symantec Corporation and the stockholders of LifeLock, Inc. listed on Annex A therein. | 8-K | 000-17781 | 2.02 | 11/21/2016 | |||||||
3.01 | Amended and Restated Certificate of Incorporation of Symantec Corporation. | S-8 | 333-119872 | 4.01 | 10/21/2004 | |||||||
3.02 | Certificate of Amendment of Amended and Restated Certificate of Incorporation of Symantec Corporation. | S-8 | 333-126403 | 4.03 | 7/6/2005 | |||||||
3.03 | Certificate of Amendment to Amended and Restated Certificate of Incorporation of Symantec Corporation. | 10-Q | 000-17781 | 3.01 | 8/5/2009 | |||||||
74
Exhibit Number | Incorporated by Reference | Filed Herewith | ||||||||||
Exhibit Description | Form | File No. | Exhibit | Filing Date | ||||||||
3.04 | Certificate of Designations of Series A Junior Preferred Stock of Symantec Corporation dated June 25, 2015. | 8-K | 000-17781 | 3.01 | 6/26/2015 | |||||||
3.05 | Bylaws, as amended, of Symantec Corporation. | X | ||||||||||
4.01 | Form of Common Stock Certificate. | S-3ASR | 333-139230 | 4.07 | 12/11/2006 | |||||||
4.02 | Indenture, dated September 16, 2010, between Symantec Corporation and Wells Fargo Bank, National Association, as trustee. | 8-K | 000-17781 | 4.01 | 9/16/2010 | |||||||
4.03 | Form of Global Note for Symantec’s 4.200% Senior Note due 2020 (contained in Exhibit No. 4.02 of Form 8-K). | 8-K | 000-17781 | 4.04 | 9/16/2010 | |||||||
4.04 | Form of Global Note for Symantec’s 2.750% Senior Notes due 2017 (contained in Exhibit No. 4.02 of Form 8-K). | 8-K | 000-17781 | 4.03 | 6/14/2012 | |||||||
4.05 | Form of Global Note for Symantec’s 3.950% Senior Notes due 2022 (contained in Exhibit No. 4.02 of Form 8-K). | 8-K | 000-17781 | 4.04 | 6/14/2012 | |||||||
4.06 | Indenture, dated as of March 4, 2016, by and between Symantec Corporation and Wells Fargo Bank, National Association, as trustee (including the form of 2.500% Convertible Senior Notes Due 2021). | 8-K | 000-17781 | 10.02 | 3/7/2016 | |||||||
4.07 | Amendment Agreement, dated as of July 18, 2016, by and among Symantec Corporation, Symantec Operating Corporation, the Lenders and the New Term Lenders, Wells Fargo Bank, National Association, and JPMorgan Chase Bank, N.A. | 10-Q | 000-17781 | 4.02 | 8/5/2016 | |||||||
4.08 | Amended and Restated Credit Agreement, effective as of August 1, 2016, among Symantec Corporation, the lenders party thereto (the “Lenders”), Wells Fargo Bank, National Association, as Term Loan A-1/Revolver Administrative Agent and Swingline Lender, JPMorgan Chase Bank, N.A., as Term Loan A-2 Administrative Agent, JPMorgan Chase Bank, N.A., Merrill Lynch, Pierce, Fenner & Smith, Incorporated, Barclays Bank PLC, Citigroup Global Markets Inc., Wells Fargo Securities, LLC, Royal Bank of Canada and Mizuho Bank, Ltd., as Lead Arrangers and Joint Bookrunners in respect of the Term A-2 Facility, Barclays Bank PLC, Citibank, N.A., Wells Fargo Bank, National Association, Royal Bank of Canada, Mizuho Bank, Ltd. And TD Securities (USA) LLC, as Co-Documentation Agents in respect of the Term A-2 Facility, and Bank of America, N.A., as Syndication Agent in respect of Term A-2 Facility. | 10-Q | 000-17781 | 4.03 | 8/5/2016 | |||||||
4.09 | Indenture, dated as of August 1, 2016, by and between Symantec Corporation and Wells Fargo Bank, National Association, as trustee (including the form of 2.00% Convertible Senior Note Due 2021). | 10-Q | 000-17781 | 4.04 | 8/5/2016 | |||||||
75
Exhibit Number | Incorporated by Reference | Filed Herewith | ||||||||||
Exhibit Description | Form | File No. | Exhibit | Filing Date | ||||||||
4.10 | Term Loan Agreement, dated as of August 1, 2016, among Symantec Corporation, JPMorgan Chase Bank, N.A., as Administrative Agent, Bank of America, N.A., as Syndication Agent, and Barclays Bank PLC, Citibank, N.A., Wells Fargo Bank, National Association, Royal Bank of Canada, Mizuho Bank, Ltd., and TD Securities (USA) LLC, as Co-Documentation Agents, JPMorgan Chase Bank, N.A., Merrill Lynch, Pierce, Fenner & Smith Incorporated, Barclays Bank, PLC, Citigroup Global Markets Inc., Wells Fargo Securities, LLC, Royal Bank of Canada and Mizuho Bank, Ltd., as Joint Lead Arrangers and Joint Bookrunners. | 10-Q | 000-17781 | 4.05 | 8/5/2016 | |||||||
4.11 | Assignment and Assumption, dated October 3, 2016, to the Term Loan Agreement dated as of August 1, 2016, among Symantec Corporation, JPMorgan Chase Bank, N.A., as Administrative Agent, Bank of America, N.A., as Syndication Agent, and Barclays Bank PLC, Citibank, N.A., Wells Fargo Bank, National Association, Royal Bank of Canada, Mizuho Bank, Ltd., and TD Securities (USA) LLC, as Co-Documentation Agents, JPMorgan Chase Bank, N.A., Merrill Lynch, Pierce, Fenner & Smith Incorporated, Barclays Bank, PLC, Citigroup Global Markets Inc., Wells Fargo Securities, LLC, Royal Bank of Canada and Mizuho Bank, Ltd., as Joint Lead Arrangers and Joint Bookrunners. | 10-Q | 000-17781 | 4.01 | 2/3/2017 | |||||||
4.12 | First Amendment, dated December 12, 2016, to the Term Loan Agreement, dated as of August 1, 2016, among Symantec Corporation, JPMorgan Chase Bank, N.A., as Administrative Agent, Bank of America, N.A., as Syndication Agent, and Barclays Bank PLC, Citibank, N.A., Wells Fargo Bank, National Association, Royal Bank of Canada, Mizuho Bank, Ltd., and TD Securities (USA) LLC, as Co-Documentation Agents, JPMorgan Chase Bank, N.A., Merrill Lynch, Pierce, Fenner & Smith Incorporated, Barclays Bank, PLC, Citigroup Global Markets Inc., Wells Fargo Securities, LLC, Royal Bank of Canada and Mizuho Bank, Ltd., as Joint Lead Arrangers and Joint Bookrunners. | 10-Q | 000-17781 | 4.02 | 2/3/2017 | |||||||
76
Exhibit Number | Incorporated by Reference | Filed Herewith | ||||||||||
Exhibit Description | Form | File No. | Exhibit | Filing Date | ||||||||
4.13 | First Amendment, dated December 12, 2016, to the Credit Agreement, effective as of August 1, 2016, among Symantec Corporation, the lenders party thereto (the “Lenders”), Wells Fargo Bank, National Association, as Term Loan A-1/Revolver Administrative Agent and Swingline Lender, JPMorgan Chase Bank, N.A., as Term Loan A-2 Administrative Agent, JPMorgan Chase Bank, N.A., Merrill Lynch, Pierce, Fenner & Smith, Incorporated, Barclays Bank PLC, Citigroup Global Markets Inc., Wells Fargo Securities, LLC, Royal Bank of Canada and Mizuho Bank, Ltd., as Lead Arrangers and Joint Bookrunners in respect of the Term A-2 Facility, Barclays Bank PLC, Citibank, N.A., Wells Fargo Bank, National Association, Royal Bank of Canada, Mizuho Bank, Ltd. And TD Securities (USA) LLC, as Co-Documentation Agents in respect of the Term A-2 Facility, and Bank of America, N.A., as Syndication Agent in respect of Term A-2 Facility. | 10-Q | 000-17781 | 4.03 | 2/3/2017 | |||||||
4.14 | Base Indenture, dated as of February 9, 2017, between Symantec Corporation and Wells Fargo Bank, National Association, as trustee. | 8-K | 000-17781 | 4.01 | 2/9/2017 | |||||||
4.15 | First Supplemental Indenture related to the 5% Senior Notes due 2025, dated as of February 9, 2017, between Symantec Corporation and Wells Fargo Bank, National Association, as trustee (including form of 5.00% Senior Note due 2025). | 8-K | 000-17781 | 4.02 | 2/9/2017 | |||||||
10.01(*) | Form of Indemnification Agreement for Officers and Directors, as amended (form for agreements entered into prior to January 17, 2006). | S-1 | 33-28655 | 10.17 | 6/21/1989 | |||||||
10.02(*) | Form of Indemnification Agreement for Officers, Directors and Key Employees (form for agreements entered into between January 17, 2006 and March 6, 2016). | 8-K | 000-17781 | 10.01 | 1/23/2006 | |||||||
10.03(*) | Form of Indemnification Agreement for Officers, Directors and Key Employees, as amended (form for agreements entered into after March 6, 2016). | 8-K | 000-17781 | 10.03 | 3/7/2016 | |||||||
10.04(*) | Symantec Corporation 1996 Equity Incentive Plan, as amended, including form of Stock Option Agreement and form of Restricted Stock Purchase Agreement. | 10-K | 000-17781 | 10.05 | 6/9/2006 | |||||||
10.05(*) | Symantec Corporation Deferred Compensation Plan, restated and amended January 1, 2010, as adopted December 15, 2009. | 10-K | 000-17781 | 10.05 | 5/24/2010 | |||||||
10.06(*) | Brightmail Inc. 1998 Stock Option Plan, including form of Stock Option Agreement and form of Notice of Assumption. | 10-K | 000-17781 | 10.08 | 6/9/2006 | |||||||
10.07(*) | Symantec Corporation 2000 Director Equity Incentive Plan, as amended. | 10-Q | 000-17781 | 10.01 | 11/1/2011 | |||||||
77
Exhibit Number | Incorporated by Reference | Filed Herewith | ||||||||||
Exhibit Description | Form | File No. | Exhibit | Filing Date | ||||||||
10.08(*) | Vontu, Inc. 2002 Stock Option/Stock Issuance Plan, as amended. | 10-K | 000-17781 | 10.10 | 5/20/2016 | |||||||
10.09(*) | Form of Vontu, Inc. Stock Option Agreement. | S-8 | 333-148107 | 99.03 | 12/17/2007 | |||||||
10.10(*) | Symantec Corporation 2004 Equity Incentive Plan, as amended, including Stock Option Grant - Terms and Conditions, form of RSU Award Agreement, form of RSU Award Agreement for Non-Employee Directors and form of PRU Award Agreement. | 10-K | 000-17781 | 10.13 | 5/20/2016 | |||||||
10.11(*) | Symantec Corporation 2008 Employee Stock Purchase Plan, as amended. | 10-Q | 000-17781 | 10.01 | 2/4/2016 | |||||||
10.12(*) | Symantec Corporation 2013 Equity Incentive Plan, as amended, including form of Stock Option Grant - Terms and Conditions and form of RSU Award Agreement. | S-8 | 333-216132 | 99.01 | 2/17/2017 | |||||||
10.13(*) | Form of Symantec Corporation Performance Based Restricted Stock Unit Award Agreement under 2013 Equity Incentive Plan. | 10-Q | 000-17781 | 10.07 | 8/5/2016 | |||||||
10.14(*) | Blue Coat, Inc. 2016 Equity Incentive Plan, including forms of awards thereunder. | S-8 | 333-212847 | 99.01 | 8/2/2016 | |||||||
10.15(*) | Batman Holdings, Inc. 2015 Amended and Restated Equity Incentive Plan, including form of Stock Option Agreement thereunder. | S-8 | 333-212847 | 99.02 | 8/2/2016 | |||||||
10.16(*) | LifeLock, Inc. 2012 Incentive Compensation Plan and forms of option and restricted stock unit award agreements thereunder. | S-8 | 333-216132 | 99.02 | 2/17/2017 | |||||||
10.17(*) | Symantec Senior Executive Incentive Plan, as amended and restated. | 8-K | 000-17781 | 10.03 | 10/25/2013 | |||||||
10.18(*) | Symantec Corporation Executive Retention Plan, as amended and restated. | 10-K | 000-17781 | 10.18 | 5/22/2015 | |||||||
10.19(*) | Symantec Corporation Executive Severance Plan. | 10-K | 000-17781 | 10.19 | 5/22/2015 | |||||||
10.20(*) | Employment Offer Letter, dated February 3, 2014, between Symantec Corporation and Mark Garfield. | 8-K | 000-17781 | 10.01 | 3/10/2014 | |||||||
10.21(*) | Amended Executive Employment Agreement, dated April 28, 2016, by and between Symantec Corporation and Michael A. Brown. | 10-K | 000-17781 | 10.26 | 5/20/2016 | |||||||
10.22(*) | Employment Offer Letter, dated April 27, 2016, between Symantec Corporation and Ajei Gopal. | 10-K | 000-17781 | 10.27 | 5/20/2016 | |||||||
10.23(*) | Employment Letter dated as of June 12, 2016 by and between Gregory S. Clark, Symantec Corporation and Blue Coat, Inc. | 10-Q | 000-17781 | 10.03 | 8/5/2016 | |||||||
10.24(*) | Offer letter dated as of June 12, 2016 by and between Michael Fey and Symantec Corporation. | 10-Q | 000-17781 | 10.04 | 8/5/2016 | |||||||
10.25(*) | Employment Offer letter, dated as of June 12, 2016, by and between Nicholas Noviello and Symantec Corporation. | 8-K | 000-17781 | 10.01 | 11/4/2016 | |||||||
78
Exhibit Number | Incorporated by Reference | Filed Herewith | ||||||||||
Exhibit Description | Form | File No. | Exhibit | Filing Date | ||||||||
10.26(*) | FY17 Executive Annual Incentive Plan - Senior Vice President and Executive Vice President. | 10-Q | 000-17781 | 10.06 | 8/5/2016 | |||||||
10.27(*) | FY17 Executive Annual Incentive Plan - Chief Executive Officer. | 10-Q | 000-17781 | 10.05 | 8/5/2016 | |||||||
10.28 | Assignment of Copyright and Other Intellectual Property Rights, by and between Peter Norton and Peter Norton Computing, Inc., dated August 31, 1990. | S-4 | 33-35385 | 10.37 | 6/13/1990 | |||||||
10.29(†) | Environmental Indemnity Agreement, dated April 23, 1999, between Veritas and Fairchild Semiconductor Corporation, included as Exhibit C to that certain Agreement of Purchase and Sale, dated March 29, 1999, between Veritas and Fairchild Semiconductor of California. | S-1/A | 333-83777 | 10.27 Exhibit C | 8/6/1999 | |||||||
10.30 | Amendment, dated June 20, 2007, to the Amended and Restated Agreement Respecting Certain Rights of Publicity dated as of August 31, 1990, by and between Peter Norton and Symantec Corporation. | 10-Q | 000-17781 | 10.01 | 8/7/2007 | |||||||
10.31 | Amendment, effective December 6, 2010, to the Trademark License Agreement, dated August 9, 2010, by and between VeriSign, Inc. and Symantec Corporation. | 10-Q | 000-17781 | 10.01 | 2/2/2011 | |||||||
10.32 | Investment Agreement, dated as of February 3, 2016, by and among Symantec Corporation and Silver Lake Partners IV Cayman (AIV II), L.P. | 8-K | 000-17781 | 10.01 | 2/9/2016 | |||||||
10.33 | First Amendment to Investment Agreement, dated as of March 2, 2016, by and among Symantec Corporation and Silver Lake Partners IV Cayman (AIV II), L.P. | 8-K | 000-17781 | 10.01 | 3/7/2016 | |||||||
21.01 | Subsidiaries of Symantec Corporation. | X | ||||||||||
23.01 | Consent of Independent Registered Public Accounting Firm. | X | ||||||||||
24.01 | Power of Attorney (see Signature page to this annual report). | X | ||||||||||
31.01 | Certification of Chief Executive Officer pursuant to Section 302 of the Sarbanes-Oxley Act of 2002. | X | ||||||||||
31.02 | Certification of Chief Financial Officer pursuant to Section 302 of the Sarbanes-Oxley Act of 2002. | X | ||||||||||
32.01(††) | Certification of Chief Executive Officer pursuant to Section 906 of the Sarbanes-Oxley Act of 2002. | X | ||||||||||
32.02(††) | Certification of Chief Financial Officer pursuant to Section 906 of the Sarbanes-Oxley Act of 2002. | X | ||||||||||
101.INS | XBRL Instance Document | X | ||||||||||
101.SCH | XBRL Taxonomy Schema Linkbase Document | X | ||||||||||
101.CAL | XBRL Taxonomy Calculation Linkbase Document | X | ||||||||||
79
Exhibit Number | Incorporated by Reference | Filed Herewith | ||||||||||
Exhibit Description | Form | File No. | Exhibit | Filing Date | ||||||||
101.LAB | XBRL Taxonomy Labels Linkbase Document | X | ||||||||||
101.PRE | XBRL Taxonomy Presentation Linkbase Document | X | ||||||||||
101.DEF | XBRL Taxonomy Definition Linkbase Document | X | ||||||||||
* | Indicates a management contract, compensatory plan or arrangement. |
** | Filed by LifeLock, Inc. |
§ | The exhibits and schedules to this agreement have been omitted pursuant to Item 601(b)(2) of Regulation S-K. The Registrant agrees to furnish supplementally copies of any such exhibits and schedules to the SEC upon request. |
† | Filed by Veritas Software Corporation. |
†† | This exhibit is being furnished, rather than filed, and shall not be deemed incorporated by reference into any filing, in accordance with Item 601 of Regulation S-K. |
80