Attached files
| file | filename |
|---|---|
| EX-32.02 - EXHIBIT 32.02 - NortonLifeLock Inc. | a092917exhibit3202.htm |
| EX-32.01 - EXHIBIT 32.01 - NortonLifeLock Inc. | a092917exhibit3201.htm |
| EX-31.02 - EXHIBIT 31.02 - NortonLifeLock Inc. | a092917exhibit3102.htm |
| EX-31.01 - EXHIBIT 31.01 - NortonLifeLock Inc. | a092917exhibit3101.htm |
| EX-10.01 - EXHIBIT 10.01 - NortonLifeLock Inc. | a092917exhibit1001.htm |
| EX-2.1 - EXHIBIT 2.1 - NortonLifeLock Inc. | a092917exhibit21.htm |
UNITED STATES SECURITIES AND EXCHANGE COMMISSION
Washington, D.C. 20549
Form 10-Q
(Mark One)
þ | QUARTERLY REPORT PURSUANT TO SECTION 13 OR 15(d) OF THE SECURITIES EXCHANGE ACT OF 1934 |
For the Quarterly Period Ended September 29, 2017
or
o | TRANSITION REPORT PURSUANT TO SECTION 13 OR 15(d) OF THE SECURITIES EXCHANGE ACT OF 1934 |
For the Transition Period from to
Commission File Number 000-17781

Symantec Corporation
(Exact name of the registrant as specified in its charter)
Delaware | 77-0181864 | |
(State or other jurisdiction of incorporation or organization) | (I.R.S. employer Identification no.) | |
350 Ellis Street | ||
Mountain View, California | 94043 | |
(Address of principal executive offices) | (Zip code) | |
Registrant’s telephone number, including area code:
(650) 527-8000
Indicate by check mark whether the registrant (1) has filed all reports required to be filed by Section 13 or 15(d) of the Securities Exchange Act of 1934 during the preceding 12 months (or for such shorter period that the registrant was required to file such reports), and (2) has been subject to such filing requirements for the past 90 days. Yes þ No o
Indicate by check mark whether the registrant has submitted electronically and posted on its corporate Web site, if any, every Interactive Data File required to be submitted and posted pursuant to Rule 405 of Regulation S-T (§ 232.405 of this chapter) during the preceding 12 months (or for such shorter period that the registrant was required to submit and post such files). Yes þ No o
Indicate by check mark whether the registrant is a large accelerated filer, an accelerated filer, a non-accelerated filer, a smaller reporting company, or an emerging growth company. See the definitions of “large accelerated filer,” “accelerated filer,” “smaller reporting company,” and “emerging growth company” in Rule 12b-2 of the Exchange Act. (Check one):
Large accelerated filer þ | Accelerated filer o | Non-accelerated filer o | Smaller reporting company o | |||
(Do not check if a smaller reporting company) | Emerging growth company o | |||||
If an emerging growth company, indicate by check mark if the registrant has elected not to use the extended transition period for complying with any new or revised financial accounting standards provided pursuant to Section 13(a) of the Exchange Act. o | ||||||
Indicate by check mark whether the registrant is a shell company (as defined in Rule 12b-2 of the Exchange Act). Yes o No þ
The number of shares of Symantec common stock, $0.01 par value per share, outstanding as of October 27, 2017 was 619,982,061 shares.
SYMANTEC CORPORATION
FORM 10-Q
Quarterly Period Ended September 29, 2017
TABLE OF CONTENTS
Page | ||
2
PART I. FINANCIAL INFORMATION
Item 1. Financial Statements
SYMANTEC CORPORATION
CONDENSED CONSOLIDATED BALANCE SHEETS
(Unaudited, in millions, except share amounts which are reflected in thousands, and par value per share amounts)
September 29, 2017 | March 31, 2017 (1) | ||||||
ASSETS | |||||||
Current assets: | |||||||
Cash and cash equivalents | $ | 1,826 | $ | 4,247 | |||
Short-term investments | 200 | 9 | |||||
Accounts receivable, net | 514 | 649 | |||||
Assets held for sale | 746 | — | |||||
Other current assets | 401 | 419 | |||||
Total current assets | 3,687 | 5,324 | |||||
Property and equipment, net | 868 | 937 | |||||
Intangible assets, net | 2,847 | 3,004 | |||||
Goodwill | 8,301 | 8,627 | |||||
Equity investments | 159 | 158 | |||||
Other long-term assets | 134 | 124 | |||||
Total assets | $ | 15,996 | $ | 18,174 | |||
LIABILITIES AND STOCKHOLDERS’ EQUITY | |||||||
Current liabilities: | |||||||
Accounts payable | $ | 187 | $ | 180 | |||
Accrued compensation and benefits | 193 | 272 | |||||
Current portion of long-term debt | 130 | 1,310 | |||||
Deferred revenue | 2,041 | 2,353 | |||||
Income taxes payable | 36 | 30 | |||||
Liabilities held for sale | 303 | — | |||||
Other current liabilities | 397 | 477 | |||||
Total current liabilities | 3,287 | 4,622 | |||||
Long-term debt | 6,079 | 6,876 | |||||
Long-term deferred revenue | 473 | 434 | |||||
Deferred income tax liabilities | 2,239 | 2,401 | |||||
Long-term income taxes payable | 280 | 251 | |||||
Other long-term obligations | 103 | 103 | |||||
Total liabilities | 12,461 | 14,687 | |||||
Commitments and contingencies | |||||||
Stockholders’ equity: | |||||||
Preferred stock, $0.01 par value: 1,000 shares authorized; 21 shares issued; 0 outstanding | — | — | |||||
Common stock and additional paid-in capital, $0.01 par value: 3,000,000 shares authorized; 619,633 and 608,019 shares issued and outstanding as of September 29, 2017 and March 31, 2017, respectively | 4,434 | 4,236 | |||||
Accumulated other comprehensive income | 7 | 12 | |||||
Accumulated deficit | (906 | ) | (761 | ) | |||
Total stockholders’ equity | 3,535 | 3,487 | |||||
Total liabilities and stockholders’ equity | $ | 15,996 | $ | 18,174 | |||
(1) | Derived from audited financial statements. |
The accompanying notes are an integral part of these Condensed Consolidated Financial Statements.
3
SYMANTEC CORPORATION
CONDENSED CONSOLIDATED STATEMENTS OF OPERATIONS
(Unaudited, in millions, except per share amounts)
Three Months Ended | Six Months Ended | ||||||||||||||
September 29, 2017 | September 30, 2016 | September 29, 2017 | September 30, 2016 | ||||||||||||
Net revenues | $ | 1,240 | $ | 979 | $ | 2,415 | $ | 1,863 | |||||||
Cost of revenues | 262 | 210 | 519 | 359 | |||||||||||
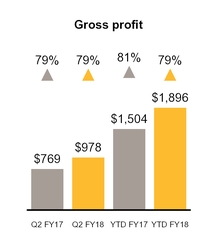
Gross profit | 978 | 769 | 1,896 | 1,504 | |||||||||||
Operating expenses: | |||||||||||||||
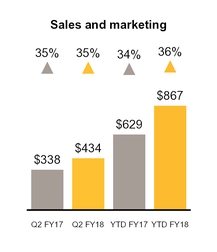
Sales and marketing | 434 | 338 | 867 | 629 | |||||||||||
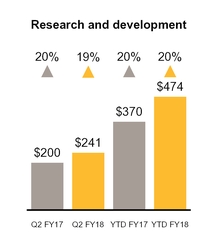
Research and development | 241 | 200 | 474 | 370 | |||||||||||
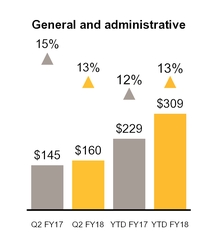
General and administrative | 160 | 145 | 309 | 229 | |||||||||||
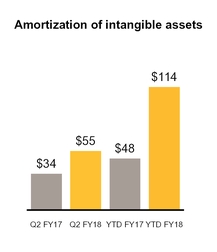
Amortization of intangible assets | 55 | 34 | 114 | 48 | |||||||||||
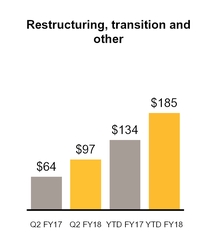
Restructuring, transition and other | 97 | 64 | 185 | 134 | |||||||||||
Total operating expenses | 987 | 781 | 1,949 | 1,410 | |||||||||||
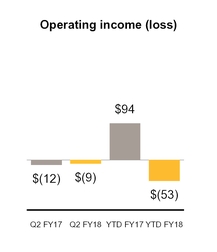
Operating income (loss) | (9 | ) | (12 | ) | (53 | ) | 94 | ||||||||
Interest income | 5 | 4 | 11 | 9 | |||||||||||
Interest expense | (57 | ) | (52 | ) | (141 | ) | (79 | ) | |||||||
Other income (expense), net | (8 | ) | 10 | (20 | ) | 23 | |||||||||
Income (loss) from continuing operations before income taxes | (69 | ) | (50 | ) | (203 | ) | 47 | ||||||||
Income tax expense (benefit) | (53 | ) | 19 | (77 | ) | 50 | |||||||||
Loss from continuing operations | (16 | ) | (69 | ) | (126 | ) | (3 | ) | |||||||
Income (loss) from discontinued operations, net of income taxes | 4 | (75 | ) | (19 | ) | (6 | ) | ||||||||
Net loss | $ | (12 | ) | $ | (144 | ) | $ | (145 | ) | $ | (9 | ) | |||
Income (loss) per share - basic and diluted: | |||||||||||||||
Continuing operations | $ | (0.03 | ) | $ | (0.11 | ) | $ | (0.21 | ) | $ | 0.00 | ||||
Discontinued operations | $ | 0.01 | $ | (0.12 | ) | $ | (0.03 | ) | $ | (0.01 | ) | ||||
Net loss per share - basic and diluted | $ | (0.02 | ) | $ | (0.23 | ) | $ | (0.24 | ) | $ | (0.01 | ) | |||
Weighted-average shares outstanding - basic and diluted | 615 | 620 | 612 | 617 | |||||||||||
Cash dividends declared per common share | $ | 0.075 | $ | 0.075 | $ | 0.15 | $ | 0.15 | |||||||
The accompanying notes are an integral part of these Condensed Consolidated Financial Statements.
4
SYMANTEC CORPORATION
CONDENSED CONSOLIDATED STATEMENTS OF COMPREHENSIVE LOSS
(Unaudited, in millions)
Three Months Ended | Six Months Ended | ||||||||||||||
September 29, 2017 | September 30, 2016 | September 29, 2017 | September 30, 2016 | ||||||||||||
Net loss | $ | (12 | ) | $ | (144 | ) | $ | (145 | ) | $ | (9 | ) | |||
Other comprehensive income (loss), net of taxes: | |||||||||||||||
Foreign currency translation adjustments: | |||||||||||||||
Translation adjustments | — | 2 | (2 | ) | (22 | ) | |||||||||
Reclassification adjustments for gain included in net loss | (3 | ) | — | (3 | ) | — | |||||||||
Net foreign currency translation adjustments | (3 | ) | 2 | (5 | ) | (22 | ) | ||||||||
Unrealized loss on available-for-sale securities | — | — | — | (1 | ) | ||||||||||
Other comprehensive income (loss), net of taxes | (3 | ) | 2 | (5 | ) | (23 | ) | ||||||||
Comprehensive loss | $ | (15 | ) | $ | (142 | ) | $ | (150 | ) | $ | (32 | ) | |||
The accompanying notes are an integral part of these Condensed Consolidated Financial Statements.
5
SYMANTEC CORPORATION
CONDENSED CONSOLIDATED STATEMENTS OF CASH FLOWS
(Unaudited, in millions)
Six Months Ended | |||||||
September 29, 2017 | September 30, 2016 | ||||||
OPERATING ACTIVITIES: | |||||||
Net loss | $ | (145 | ) | $ | (9 | ) | |
Loss from discontinued operations, net of income taxes | 19 | 6 | |||||
Adjustments to continuing operating activities: | |||||||
Depreciation and amortization, including debt issuance costs and discounts | 361 | 205 | |||||
Stock-based compensation expense | 323 | 134 | |||||
Deferred income taxes | (189 | ) | 49 | ||||
Other | 19 | 31 | |||||
Changes in operating assets and liabilities, net of acquisitions: | |||||||
Accounts receivable, net | 115 | 225 | |||||
Accounts payable | 20 | (66 | ) | ||||
Accrued compensation and benefits | (75 | ) | (35 | ) | |||
Deferred revenue | (27 | ) | (213 | ) | |||
Income taxes | (5 | ) | (841 | ) | |||
Other assets | 26 | 6 | |||||
Other liabilities | (21 | ) | (51 | ) | |||
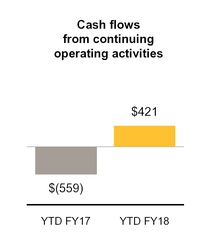
Net cash provided by (used in) continuing operating activities | 421 | (559 | ) | ||||
Net cash used in discontinued operating activities | (31 | ) | (153 | ) | |||
Net cash provided by (used in) operating activities | 390 | (712 | ) | ||||
INVESTING ACTIVITIES: | |||||||
Additions to property and equipment | (72 | ) | (39 | ) | |||
Payments for acquisitions, net of cash acquired | (361 | ) | (4,533 | ) | |||
Proceeds from maturities and sales of short-term investments | — | 31 | |||||
Purchases of short-term investments | (201 | ) | — | ||||
Other | — | 7 | |||||
Net cash used in investing activities | (634 | ) | (4,534 | ) | |||
FINANCING ACTIVITIES: | |||||||
Repayments of debt and other obligations | (2,010 | ) | (17 | ) | |||
Proceeds from issuance of debt, net of issuance costs | — | 4,999 | |||||
Net proceeds from sales of common stock under employee stock benefit plans | 74 | 49 | |||||
Tax payments related to restricted stock units | (83 | ) | (34 | ) | |||
Dividends and dividend equivalents paid | (114 | ) | (120 | ) | |||
Payment for dissenting LifeLock shareholder settlement | (68 | ) | — | ||||
Other | — | 10 | |||||
Net cash provided by (used in) financing activities | (2,201 | ) | 4,887 | ||||
Effect of exchange rate fluctuations on cash and cash equivalents | 34 | (14 | ) | ||||
Change in cash and cash equivalents | (2,411 | ) | (373 | ) | |||
Cash held for sale (1) | (10 | ) | — | ||||
Beginning cash and cash equivalents | 4,247 | 5,983 | |||||
Ending cash and cash equivalents | $ | 1,826 | $ | 5,610 | |||
Supplemental disclosure of cash flow information | |||||||
Income taxes paid, net of refunds | $ | 155 | $ | 977 | |||
(1) | The impact of assets and liabilities reclassified as held for sale during the period was not considered in the changes in operating assets and liabilities within cash flows from operating activities. See Note 13 for information regarding assets and liabilities held for sale. |
The accompanying notes are an integral part of these Condensed Consolidated Financial Statements.
6
SYMANTEC CORPORATION
NOTES TO CONDENSED CONSOLIDATED FINANCIAL STATEMENTS
(Unaudited)
Note 1. Description of Business and Significant Accounting Policies
Business
Symantec Corporation (“Symantec,” “we,” “us,” “our,” and the “Company” refer to Symantec Corporation and all of its subsidiaries) is a global leader in cybersecurity.
On August 1, 2016, we completed our acquisition of Blue Coat, Inc. (“Blue Coat”). On February 9, 2017, we completed our acquisition of LifeLock, Inc. (“LifeLock”). These acquisitions have been included in our consolidated results of operations since their respective acquisition dates. See Note 6 for more information on our acquisitions.
On August 2, 2017, we entered into a definitive agreement to sell our website security and public key infrastructure (“WSS and PKI”) solutions to Thoma Bravo, LLC’s (“Thoma Bravo”) portfolio company DigiCert Parent Inc. (“DigiCert”). As a result, in the second quarter of fiscal 2018, the related assets and liabilities have been classified as held for sale on our Condensed Consolidated Balance Sheets. The transaction closed on October 31, 2017, subsequent to our second quarter of fiscal 2018. See Note 13 and Note 14 for more information on our held for sale classification and related disposition.
Basis of presentation
The accompanying unaudited Condensed Consolidated Financial Statements have been prepared in accordance with generally accepted accounting principles (“GAAP”) in the United States of America (“U.S.”) for interim financial information. In the opinion of management, the unaudited Condensed Consolidated Financial Statements contain all adjustments, consisting only of normal recurring items, except as otherwise noted, necessary for the fair presentation of our financial position, results of operations, and cash flows for the interim periods. These unaudited Condensed Consolidated Financial Statements should be read in conjunction with the audited Consolidated Financial Statements and accompanying Notes thereto included in our Annual Report on Form 10-K for the fiscal year ended March 31, 2017. The results of operations for the three and six months ended September 29, 2017, are not necessarily indicative of the results expected for the entire fiscal year.
We have a 52/53-week fiscal year ending on the Friday closest to March 31. Unless otherwise stated, references to three and six month periods in this report relate to fiscal periods ended September 29, 2017 and September 30, 2016. The six months ended September 29, 2017 and September 30, 2016 each consisted of 26 weeks. Our 2018 fiscal year consists of 52 weeks and ends on March 30, 2018.
Recently adopted authoritative guidance
Employee Stock-Based Compensation. In the first quarter of fiscal 2018, we adopted new guidance to simplify accounting for share-based payment transactions. Prior to adoption, excess tax benefits resulting from the difference between the deduction for tax purposes and the compensation costs recognized for financial reporting were not recognized until the deduction reduced taxes payable. As a result of the new guidance, we now recognize excess tax benefits or deficiencies in the period in which the award vests. We elected to continue to estimate forfeitures rather than record the forfeitures as they occur. We adopted the change in recognizing excess tax benefits using the modified retrospective method. We also elected to retrospectively apply the change in presentation of excess tax benefits recognized related to stock-based compensation expense in our Condensed Consolidated Statements of Cash Flows from financing activities to operating activities. The cumulative effect of adopting the new accounting guidance was not material.
There have been no other material changes in our significant accounting policies as of and for the six months ended September 29, 2017, as compared to the significant accounting policies described in our Annual Report on Form 10-K for the fiscal year ended March 31, 2017.
Note 2. Segment Information
We have the following two reporting segments, which are the same as our operating segments:
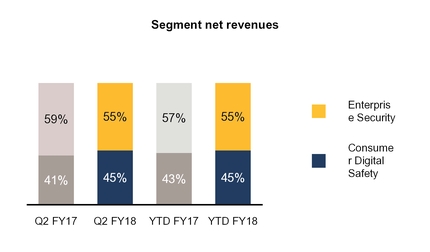
• | Enterprise Security. Our Enterprise Security segment solutions protect organizations so they can securely conduct business while leveraging new platforms and data. Our Enterprise Security segment includes our endpoint protection products, endpoint management, messaging protection products, information protection products, cyber security services, website security and advanced web and cloud security offerings. Our enterprise endpoint, network security and management offerings support evolving endpoints and networks, providing advanced threat protection while helping reduce cost and complexity. These products and solutions are delivered through various methods, such as software, appliance, virtual appliance, Software-as-a-Service (“SaaS”) and managed services. |
7
• | Consumer Digital Safety. Our Consumer Digital Safety segment focuses on providing a comprehensive Digital Safety solution to protect information, devices, networks and the identities of consumers. This solution includes our Norton-branded services, which provide multi-layer security across major desktop and mobile operating systems, public Wi-Fi connections, and home networks, to defend against increasingly complex online threats to individuals, families and small businesses, and our LifeLock-branded identity protection services. Our LifeLock-branded identity protection services primarily consist of identifying and notifying users of identity-related and other events and assisting users in remediating their impact. With the addition of LifeLock-branded identity protection services, we are providing a comprehensive digital safety solution designed to protect information across devices, customer identities and the connected home and family and accelerating our leadership in Consumer Digital Safety to protect all aspects of consumers’ digital lives. |
Operating segments are based upon the nature of our business and how our business is managed. Our Chief Operating Decision Makers (“CODM”), comprised of our Chief Executive Officer (“CEO”) and Chief Financial Officer (“CFO”), use our operating segment financial information to evaluate segment performance and to allocate resources.
There were no inter-segment sales for the periods presented. The following table summarizes the operating results of our reporting segments:
Three Months Ended | Six Months Ended | ||||||||||||||
(In millions) | September 29, 2017 | September 30, 2016 | September 29, 2017 | September 30, 2016 | |||||||||||
Total Segments: | |||||||||||||||
Net revenues | $ | 1,240 | $ | 979 | $ | 2,415 | $ | 1,863 | |||||||
Operating income | $ | 399 | $ | 249 | $ | 723 | $ | 502 | |||||||
Enterprise Security: | |||||||||||||||
Net revenues | $ | 686 | $ | 574 | $ | 1,332 | $ | 1,055 | |||||||
Operating income | $ | 147 | $ | 25 | $ | 241 | $ | 53 | |||||||
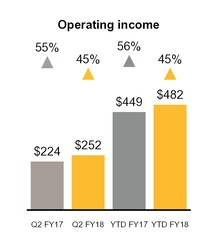
Consumer Digital Safety: | |||||||||||||||
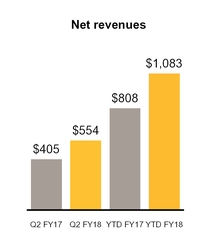
Net revenues | $ | 554 | $ | 405 | $ | 1,083 | $ | 808 | |||||||
Operating income | $ | 252 | $ | 224 | $ | 482 | $ | 449 | |||||||
We do not allocate to our operating segments certain operating expenses that we manage separately at the corporate level and are not used in evaluating the results of, or in allocating resources to, our segments. These unallocated expenses consist of stock-based compensation expense; amortization of intangible assets; restructuring, transition and other charges; and acquisition and integration costs.
The following table provides a reconciliation of our total reportable segments’ operating income to our total operating income (loss):
Three Months Ended | Six Months Ended | ||||||||||||||
(In millions) | September 29, 2017 | September 30, 2016 | September 29, 2017 | September 30, 2016 | |||||||||||
Total segment operating income | $ | 399 | $ | 249 | $ | 723 | $ | 502 | |||||||
Reconciling items: | |||||||||||||||
Stock-based compensation expense | 176 | 85 | 323 | 134 | |||||||||||
Amortization of intangible assets | 116 | 69 | 230 | 89 | |||||||||||
Restructuring, transition and other | 97 | 64 | 185 | 134 | |||||||||||
Acquisition and integration costs | 19 | 43 | 38 | 51 | |||||||||||
Total consolidated operating income (loss) from continuing operations | $ | (9 | ) | $ | (12 | ) | $ | (53 | ) | $ | 94 | ||||
Note 3. Net Loss Per Share
Basic loss per share is computed by dividing net loss by the weighted-average number of common shares outstanding during the period. Diluted loss per share for each period presented is the same as basic loss per share as there is a net loss in the period and inclusion of potentially issuable shares is anti-dilutive.
8
The components of basic and diluted net loss per share are as follows:
Three Months Ended | Six Months Ended | ||||||||||||||
(In millions, except per share data) | September 29, 2017 | September 30, 2016 | September 29, 2017 | September 30, 2016 | |||||||||||
Loss from continuing operations | $ | (16 | ) | $ | (69 | ) | $ | (126 | ) | $ | (3 | ) | |||
Income (loss) from discontinued operations, net of income taxes | 4 | (75 | ) | (19 | ) | (6 | ) | ||||||||
Net loss | $ | (12 | ) | $ | (144 | ) | $ | (145 | ) | $ | (9 | ) | |||
Income (loss) per share - basic and diluted: | |||||||||||||||
Continuing operations | $ | (0.03 | ) | $ | (0.11 | ) | $ | (0.21 | ) | $ | 0.00 | ||||
Discontinued operations | $ | 0.01 | $ | (0.12 | ) | $ | (0.03 | ) | $ | (0.01 | ) | ||||
Net loss per share - basic and diluted | $ | (0.02 | ) | $ | (0.23 | ) | $ | (0.24 | ) | $ | (0.01 | ) | |||
Weighted-average shares outstanding - basic and diluted | 615 | 620 | 612 | 617 | |||||||||||
The following have been excluded from the computation of diluted net loss per share because their effect would have been anti-dilutive:
As of | |||||
(In millions) | September 29, 2017 | September 30, 2016 | |||
Convertible debt | 91 | 91 | |||
Employee equity awards | 54 | 48 | |||
Total | 145 | 139 | |||
Under the treasury stock method, our Convertible Senior Notes will generally have a dilutive impact on net income per share when our average stock price for the period exceeds approximately $16.77 per share for the 2.5% Convertible Senior Notes and $20.41 per share for the 2.0% Convertible Senior Notes. During the three and six months ended September 29, 2017 and September 30, 2016, the conversion feature of both notes was anti-dilutive due to a loss from continuing operations.
Note 4. Restructuring, Transition and Other Costs
Our restructuring, transition and other costs and liabilities consist primarily of severance, facilities, transition and other related costs. Severance costs generally include severance payments, outplacement services, health insurance coverage and legal costs. Included in other exit and disposal costs are advisory fees incurred in connection with restructuring events and facilities costs, which generally include rent expense and lease termination costs, less estimated sublease income. Transition costs primarily consist of consulting charges associated with the implementation of new enterprise resource planning systems, costs to automate business processes and costs associated with divestitures of our product lines and businesses. Restructuring, transition and other costs are managed at the corporate level and are not allocated to our reportable segments. See Note 2 for information regarding the reconciliation of total segment operating income to total consolidated operating income (loss).
Fiscal 2017 Plan
We initiated a restructuring plan in the first quarter of fiscal 2017 to reduce complexity by means of long-term structural improvements (the “Fiscal 2017 Plan”). We have reduced headcount and closed certain facilities in connection with the Fiscal 2017 Plan and expect additional headcount reductions and facilities closures. We expect to incur additional costs of between $165 million and $200 million in connection with the Fiscal 2017 Plan, of which approximately $70 million to $80 million is expected to be incurred for severance and termination benefits and $95 million to $120 million is expected to be incurred for other exit and disposal costs, primarily consisting of contract termination and relocation costs and advisory fees. These actions are expected to be completed in fiscal 2018. As of September 29, 2017, liabilities for excess facility obligations at several locations around the world are expected to be paid throughout the respective lease terms, the longest of which extends through fiscal 2022. In addition to the Fiscal 2017 Plan, we expect continuing significant transition costs, as well as separation costs associated with our divestiture of our WSS and PKI product lines.
9
Restructuring, transition and other costs summary
Our restructuring, transition and other costs are presented in the table below:
(In millions) | Three Months Ended September 29, 2017 | Six Months Ended September 29, 2017 | |||||
Severance and termination benefit costs | $ | 12 | $ | 39 | |||
Other exit and disposal costs | 1 | 17 | |||||
Asset write-offs | 8 | 9 | |||||
Transition costs | 76 | 120 | |||||
Total | $ | 97 | $ | 185 | |||
Restructuring summary
Our restructuring activities are presented in the table below:
(In millions) | Balance as of March 31, 2017 | Costs, Net of Adjustments | Cash Payments | Non-Cash Charges | Balance as of September 29, 2017 | Cumulative Incurred to Date for FY17 Plan | |||||||||||||||||
Severance and termination benefit costs | $ | 20 | $ | 39 | $ | (49 | ) | $ | — | $ | 10 | $ | 115 | ||||||||||
Other exit and disposal costs | 26 | 17 | (20 | ) | (8 | ) | 15 | 96 | |||||||||||||||
Total | $ | 46 | $ | 56 | $ | (69 | ) | $ | (8 | ) | $ | 25 | $ | 211 | |||||||||
The restructuring liabilities are included in accounts payable, other current liabilities and other long-term obligations in our Condensed Consolidated Balance Sheets.
Note 5. Income Taxes
The following table summarizes our effective tax rate for income (loss) from continuing operations for the periods presented:
Three Months Ended | Six Months Ended | ||||||||||||||
(In millions, except percentages) | September 29, 2017 | September 30, 2016 | September 29, 2017 | September 30, 2016 | |||||||||||
Income (loss) from continuing operations before income taxes | $ | (69 | ) | $ | (50 | ) | $ | (203 | ) | $ | 47 | ||||
Income tax expense (benefit) | $ | (53 | ) | $ | 19 | $ | (77 | ) | $ | 50 | |||||
Effective tax rate | 77 | % | (38 | )% | 38 | % | 106 | % | |||||||
Our effective tax rate for loss from continuing operations for the three and six months ended September 29, 2017 differs from the federal statutory income tax rate primarily due to the benefits of lower-taxed international earnings, the research and development tax credit, and excess tax benefits related to stock-based compensation, partially offset by various permanent differences.
Our effective tax rate for income (loss) from continuing operations for the three and six months ended September 30, 2016 differs from the federal statutory income tax rate primarily due to the benefits of lower-taxed international earnings, and the research and development credit, offset by various permanent differences and the tax expense related to the loss of tax attributes due to restructuring activities.
For the three and six months ended September 29, 2017, we recorded an income tax benefit on discontinued operations of $4 million and an income tax expense on discontinued operations of $37 million, respectively. For the three and six months ended September 30, 2016, we recorded income tax expense on discontinued operations of $118 million and $134 million, respectively. See Note 13 for further details regarding discontinued operations.
We are a U.S.-based multinational company subject to tax in multiple U.S. and international tax jurisdictions. A substantial portion of our international earnings were generated from subsidiaries organized in Ireland and Singapore. Our results of operations would be adversely affected to the extent that our geographical mix of income becomes more weighted toward jurisdictions with higher tax rates and would be favorably affected to the extent the relative geographic mix shifts to lower tax jurisdictions. Any change in our mix of earnings is dependent upon many factors and is therefore difficult to predict.
The timing of the resolution of income tax examinations is highly uncertain, and the amounts ultimately paid, if any, upon resolution of the issues raised by the taxing authorities may differ materially from the amounts accrued for each year. Although potential resolution of uncertain tax positions involve multiple tax periods and jurisdictions, it is reasonably possible that the
10
gross unrecognized tax benefits related to these audits could decrease, whether by payment, release, or a combination of both, in the next 12 months by $13 million, which could reduce our income tax provision and therefore benefit the resulting effective tax rate.
We continue to monitor the progress of ongoing income tax controversies and the impact, if any, of the expected expiration of the statute of limitations in various taxing jurisdictions.
Note 6. Acquisitions
Fiscal 2018 acquisitions
Fireglass and Skycure acquisitions
In July 2017, we completed our acquisitions of Israel-based Fireglass, Ltd. (“Fireglass”) and Skycure, Ltd. (“Skycure”). Fireglass provides agentless isolation solutions that prevent ransomware, malware and phishing threats in real-time from reaching user endpoints or the corporate network. With this acquisition, we further strengthened our enterprise security strategy to deliver an Integrated Cyber Defense Platform and extended our participation in the Secure Web Gateway and Email protection markets delivered both on premises and in the cloud. Skycure provides mobile threat defense across modern operating systems. The total aggregate consideration for these acquisitions, primarily consisting of cash, was $345 million, net of $15 million cash acquired.
Our preliminary allocation of the aggregate purchase price for these two acquisitions, based on the estimated fair values of the assets acquired and liabilities assumed in July 2017, and the related weighted-average estimated useful lives, is as follows:
(In millions, except useful lives) | July 24, 2017 | Weighted-Average Estimated Useful Life | |||
Developed technology | $ | 123 | 5.5 years | ||
Customer relationships | 11 | 7 years | |||
Goodwill | 247 | ||||
Long-term deferred tax liabilities | (35 | ) | |||
Other liabilities | (1 | ) | |||
Total purchase price | $ | 345 | |||
The preliminary allocation of the aggregate purchase price for the two acquisitions described above was based upon preliminary valuations, and our estimates and assumptions are subject to refinement within the measurement period (up to one year from the close date). Adjustments to the purchase price allocations may require adjustments to goodwill prospectively. The primary areas of the preliminary purchase price allocations that are not yet finalized are certain tax matters, intangible assets, and identification of contingencies.
The preliminary goodwill arising from the acquisitions is attributed to the expected synergies, including revenue benefits that are expected to be generated by combining Fireglass and Skycure with Symantec. A portion of the goodwill recognized is expected to be deductible for tax purposes. See Note 7 for more information on goodwill.
Pro forma results of operations for these acquisitions have not been presented because they were not material to our consolidated results of operations, either individually or in the aggregate.
Other fiscal 2018 acquisitions
During the six months ended September 29, 2017, in addition to the acquisitions mentioned above, we completed acquisitions of other companies for an aggregate purchase price of $29 million. Of the aggregate purchase price, $27 million was preliminarily recorded to goodwill. The primary areas of the preliminary purchase price allocations that are not yet finalized are certain tax matters, intangible assets, and identification of contingencies. These acquisitions were not material to our consolidated results of operations, either individually or in the aggregate.
Fiscal 2017 Blue Coat acquisition
During our second quarter of fiscal 2017, we acquired all of the outstanding common stock of Blue Coat. The total consideration for the acquisition was approximately $4.67 billion, net of cash acquired. The Blue Coat results are included in our Enterprise Security segment. See Note 2 for more information related to our segments.
11
Unaudited pro forma information
The unaudited pro forma financial results combine the historical results of Symantec and Blue Coat for the three and six months ended September 30, 2016 and include the effects of pro forma adjustments as if Blue Coat were acquired in the beginning of our 2016 fiscal year. The pro forma results for the three and six months ended September 30, 2016 include nonrecurring adjustments to amortization of acquired intangible assets, stock-based compensation, commissions, interest on debt used to finance the acquisition, and acquisition-related transaction costs, as well as the income tax effect of the pro forma adjustments.
The unaudited pro forma financial results presented below do not include any anticipated synergies or other expected benefits of the acquisition. These pro forma results are presented for informational purposes only and are not indicative of future operations or results that would have been achieved had the acquisition been completed as of the beginning of our 2016 fiscal year. The following table summarizes the pro forma financial information:
September 30, 2016 | |||||||
(In millions) | Three months ended | Six months ended | |||||
Net revenues | $ | 1,023 | $ | 2,086 | |||
Net loss | $ | (158 | ) | $ | (119 | ) | |
LifeLock acquisition-related shareholder settlement
On February 9, 2017, we completed the acquisition of LifeLock. In connection with this acquisition, we recognized a liability of $68 million for a claim related to appraisal rights by a LifeLock stockholder, which we settled in the second quarter of fiscal 2018 for $74 million in cash. The $6 million paid in addition to the recognized liability was recorded to general and administrative expense in our Condensed Consolidated Statements of Operations.
Note 7. Goodwill and Intangible Assets
Goodwill
The changes in the carrying amount of goodwill by segment are as follows:
(In millions) | Enterprise Security | Consumer Digital Safety | Total | ||||||||
Net balance as of March 31, 2017 | $ | 6,078 | $ | 2,549 | $ | 8,627 | |||||
Acquisitions | 259 | 15 | 274 | ||||||||
Held for sale | (606 | ) | — | (606 | ) | ||||||
Translation and other adjustments | 6 | — | 6 | ||||||||
Net balance as of September 29, 2017 | $ | 5,737 | $ | 2,564 | $ | 8,301 | |||||
Intangible assets, net
September 29, 2017 | March 31, 2017 | ||||||||||||||||||||||
(In millions) | Gross Carrying Amount | Accumulated Amortization | Net Carrying Amount | Gross Carrying Amount | Accumulated Amortization | Net Carrying Amount | |||||||||||||||||
Customer relationships | $ | 1,463 | $ | (256 | ) | $ | 1,207 | $ | 1,646 | $ | (322 | ) | $ | 1,324 | |||||||||
Developed technology | 1,032 | (268 | ) | 764 | 1,006 | (229 | ) | 777 | |||||||||||||||
Finite-lived trade names and other | 10 | (5 | ) | 5 | 46 | (26 | ) | 20 | |||||||||||||||
Total finite-lived intangible assets | 2,505 | (529 | ) | 1,976 | 2,698 | (577 | ) | 2,121 | |||||||||||||||
Indefinite-lived trade names | 852 | — | 852 | 864 | — | 864 | |||||||||||||||||
In-process research and development | 19 | — | 19 | 19 | — | 19 | |||||||||||||||||
Total intangible assets | $ | 3,376 | $ | (529 | ) | $ | 2,847 | $ | 3,581 | $ | (577 | ) | $ | 3,004 | |||||||||
12
Amortization expense for purchased intangible assets is summarized below:
Three Months Ended | Six Months Ended | Statements of Operations Classification | |||||||||||||||
(In millions) | September 29, 2017 | September 30, 2016 | September 29, 2017 | September 30, 2016 | |||||||||||||
Customer relationships and other | $ | 55 | $ | 34 | $ | 114 | $ | 48 | Operating expenses | ||||||||
Developed technology | 61 | 35 | 116 | 41 | Cost of revenues | ||||||||||||
Total | $ | 116 | $ | 69 | $ | 230 | $ | 89 | |||||||||
As of September 29, 2017, future amortization expense related to intangible assets that have finite lives is as follows by fiscal year:
(In millions) | September 29, 2017 | ||
Remainder of 2018 | $ | 220 | |
2019 | 430 | ||
2020 | 425 | ||
2021 | 318 | ||
2022 | 259 | ||
Thereafter | 324 | ||
Total | $ | 1,976 | |
See Note 6 and Note 13 for more information on our acquisitions and goodwill and intangible assets, respectively, reclassified to assets held for sale.
Note 8. Debt
The following table summarizes components of our debt:
(In millions, except percentages) | September 29, 2017 | March 31, 2017 | Effective Interest Rate | |||||||
2.75% Senior Notes due June 15, 2017 | $ | — | $ | 600 | 2.79 | % | ||||
Senior Term Loan A-1 due May 10, 2019 | 800 | 1,000 | LIBOR plus (1) | |||||||
Senior Term Loan A-2 due August 1, 2019 | 800 | 800 | LIBOR plus (1) | |||||||
Senior Term Loan A-3 due August 1, 2019 | 200 | 200 | LIBOR plus (1) | |||||||
4.2% Senior Notes due September 15, 2020 | 750 | 750 | 4.25 | % | ||||||
2.5% Convertible Senior Notes due April 1, 2021 | 500 | 500 | 3.76 | % | ||||||
Senior Term Loan A-5 due August 1, 2021 | 500 | 1,710 | LIBOR plus (1) | |||||||
2.0% Convertible Senior Notes due August 15, 2021 | 1,250 | 1,250 | 2.66 | % | ||||||
3.95% Senior Notes due June 15, 2022 | 400 | 400 | 4.05 | % | ||||||
5.0% Senior Notes due April 15, 2025 | 1,100 | 1,100 | 5.23 | % | ||||||
Total principal amount | 6,300 | 8,310 | ||||||||
Less: Unamortized discount and issuance costs | (91 | ) | (124 | ) | ||||||
Total debt | 6,209 | 8,186 | ||||||||
Less: Current portion | (130 | ) | (1,310 | ) | ||||||
Total long-term portion | $ | 6,079 | $ | 6,876 | ||||||
(1) | The senior term facilities bear interest at a rate equal to the London Interbank Offered Rate (“LIBOR”) plus a margin of 1.50% to 1.75% based on the current debt rating of our non-credit-enhanced, senior unsecured long-term debt and our underlying loan agreements. |
Based on the closing price of our common stock of $32.81 on September 29, 2017, the if-converted values of our 2.5% and 2.0% Convertible Senior Notes exceed the principal amount by approximately $478 million and $759 million, respectively.
13
The following table sets forth total interest expense recognized related to our 2.5% and 2.0% Convertible Senior Notes:
Three Months Ended | Six Months Ended | ||||||||||||||
(In millions) | September 29, 2017 | September 30, 2016 | September 29, 2017 | September 30, 2016 | |||||||||||
Contractual interest expense | $ | 9 | $ | 7 | $ | 19 | $ | 10 | |||||||
Amortization of debt discount and issuance costs | $ | 4 | $ | 3 | $ | 8 | $ | 6 | |||||||
As of September 29, 2017, the future maturities of debt by fiscal year are as follows:
(In millions) | September 29, 2017 | ||
Remainder of 2018 | $ | 130 | |
2019 | — | ||
2020 | 1,670 | ||
2021 | 1,250 | ||
2022 | 1,750 | ||
Thereafter | 1,500 | ||
Total future maturities of debt | $ | 6,300 | |
Debt repayments
During the first quarter of fiscal 2018, we prepaid principal amounts of $1.2 billion of our Senior Term Loan A-5 and $200 million of our Senior Term Loan A-1. We also repaid in cash at maturity the $600 million remaining principal balance of our 2.75% Senior Notes due June 15, 2017.
Note 9. Fair Value Measurements
Assets measured and recorded at fair value on a recurring basis
Our cash equivalents consist primarily of money market funds whose carrying amount is a reasonable estimate of fair value. Our short-term investments consist of investment securities with original maturities greater than three months and marketable equity securities whose fair value approximates their amortized cost.
The following table summarizes our assets measured at fair value on a recurring basis, by level, within the fair value hierarchy:
September 29, 2017 | March 31, 2017 | ||||||||||||||||||||||
(In millions) | Fair Value | Cash and Cash Equivalents | Short-Term Investments | Fair Value | Cash and Cash Equivalents | Short-Term Investments | |||||||||||||||||
Cash | $ | 732 | $ | 732 | $ | — | $ | 1,183 | $ | 1,183 | $ | — | |||||||||||
Non-negotiable certificates of deposit | 77 | 77 | — | 15 | 15 | — | |||||||||||||||||
Level 1 (Quoted prices in active markets for identical assets): | |||||||||||||||||||||||
Money market funds | 847 | 847 | — | 2,532 | 2,532 | — | |||||||||||||||||
U.S. government securities | 13 | 13 | — | 94 | 94 | — | |||||||||||||||||
Marketable equity securities | — | — | — | 9 | — | 9 | |||||||||||||||||
Total level 1 | 860 | 860 | — | 2,635 | 2,626 | 9 | |||||||||||||||||
Level 2 (Significant other observable inputs): | |||||||||||||||||||||||
Corporate bonds | 187 | 2 | 185 | — | — | — | |||||||||||||||||
U.S. agency securities | 50 | 50 | — | 75 | 75 | — | |||||||||||||||||
Commercial paper | 108 | 105 | 3 | 348 | 348 | — | |||||||||||||||||
Negotiable certificates of deposit | 12 | — | 12 | — | — | — | |||||||||||||||||
Total level 2 | 357 | 157 | 200 | 423 | 423 | — | |||||||||||||||||
Total | $ | 2,026 | $ | 1,826 | $ | 200 | $ | 4,256 | $ | 4,247 | $ | 9 | |||||||||||
14
There were no transfers between fair value measurement levels during the six months ended September 29, 2017.
The following table presents the contractual maturities of our debt investments as of September 29, 2017:
(In millions) | Fair Value | ||
Due in one year or less | $ | 15 | |
Due after one year through five years | 185 | ||
Total | $ | 200 | |
Actual maturities may differ from the contractual maturities because borrowers may have the right to call or prepay certain obligations.
Assets measured and recorded at fair value on a non-recurring basis
Our non-financial assets, which primarily consist of goodwill, other intangible assets, property and equipment and equity investments, are measured at fair value on a non-recurring basis, generally when there is a transaction involving those assets such as a purchase transaction, a business combination or if any indicators for impairment exist. On a periodic basis whenever events or changes in circumstances indicate their carrying value may not be fully recoverable, and at least annually for goodwill and indefinite-lived intangible assets, non-financial assets are assessed for impairment. If applicable, these non-financial assets are written-down to and recorded at fair value.
Fair value of debt
As of September 29, 2017 and March 31, 2017, the total fair value of our debt was $6.4 billion and $8.3 billion, respectively, based on Level 2 inputs.
Note 10. Stockholders' Equity
Dividends
The following table summarizes dividends declared and paid and dividend equivalents paid for the periods presented:
Three Months Ended | Six Months Ended | ||||||||||||||
(In millions, except per share data) | September 29, 2017 | September 30, 2016 | September 29, 2017 | September 30, 2016 | |||||||||||
Dividends declared and paid | $ | 46 | $ | 47 | $ | 92 | $ | 93 | |||||||
Dividend equivalents paid | 2 | 5 | 22 | 27 | |||||||||||
Total dividends and dividend equivalents paid | $ | 48 | $ | 52 | $ | 114 | $ | 120 | |||||||
Cash dividends declared per common share | $ | 0.075 | $ | 0.075 | $ | 0.15 | $ | 0.15 | |||||||
Our restricted stock units and performance based restricted stock units are entitled to dividend equivalents to be paid in the form of cash upon vesting for each share of the underlying unit.
On November 1, 2017, we declared a cash dividend of $0.075 per share of common stock to be paid on December 13, 2017 to all stockholders of record as of the close of business on November 20, 2017. All shares of common stock issued and outstanding and all shares of unvested restricted stock and performance-based stock as of the record date will be entitled to the dividend and dividend equivalents, respectively. Any future dividends and dividend equivalents will be subject to the approval of our Board of Directors.
Stock repurchase program
As of September 29, 2017, the remaining balance of our share repurchase authorization is $800 million and does not have an expiration date.
Accelerated stock repurchase agreement
During the fourth quarter of fiscal 2017, we entered into an accelerated stock repurchase (“ASR”) agreement with financial institutions to repurchase an aggregate of $500 million of our common stock. Pursuant to the ASR agreement, we made an upfront payment of $500 million to the financial institutions and received and retired an initial delivery of 14.2 million shares of our common stock. In the first quarter of fiscal 2018, we completed the ASR and received and retired an additional delivery of 2.2 million shares of our common stock. The total shares received and retired under the terms of the ASR agreement were 16.4 million, with an average price paid per share of $30.51.
15
Changes in accumulated other comprehensive income by component
Components of accumulated other comprehensive income net of taxes were as follows:
(In millions) | Foreign Currency Translation Adjustments | Unrealized Gain on Available-For-Sale Securities | Total | ||||||||
Balance as of March 31, 2017 | $ | 7 | $ | 5 | $ | 12 | |||||
Reclassification to net loss | (3 | ) | — | (3 | ) | ||||||
Other comprehensive loss | (2 | ) | — | (2 | ) | ||||||
Balance as of September 29, 2017 | $ | 2 | $ | 5 | $ | 7 | |||||
Note 11. Stock-Based Compensation
Stock-based compensation expense
The following table presents the stock-based compensation expense recognized in our Condensed Consolidated Statements of Operations:
Three Months Ended | Six Months Ended | ||||||||||||||
(In millions) | September 29, 2017 | September 30, 2016 | September 29, 2017 | September 30, 2016 | |||||||||||
Cost of revenues | $ | 9 | $ | 5 | $ | 15 | $ | 8 | |||||||
Sales and marketing | 50 | 24 | 93 | 38 | |||||||||||
Research and development | 53 | 24 | 94 | 39 | |||||||||||
General and administrative | 64 | 32 | 121 | 49 | |||||||||||
Total stock-based compensation expense | 176 | 85 | 323 | 134 | |||||||||||
Tax benefit associated with stock-based compensation expense | (58 | ) | (25 | ) | (109 | ) | (40 | ) | |||||||
Net stock-based compensation expense | $ | 118 | $ | 60 | $ | 214 | $ | 94 | |||||||
The following table summarizes additional information related to our stock-based compensation:
Six Months Ended | |||||||
(In millions, except per grant data) | September 29, 2017 | September 30, 2016 | |||||
Restricted stock units: | |||||||
Weighted-average fair value per award granted and assumed | $ | 30.23 | $ | 18.59 | |||
Awards granted and assumed | 11.6 | 13.8 | |||||
Total fair value of awards released | $ | 234 | $ | 94 | |||
Total unrecognized compensation expense | $ | 425 | $ | 301 | |||
Weighted-average remaining vesting period | 1.9 years | 2.1 years | |||||
Performance-based restricted stock units: | |||||||
Weighted-average fair value per award granted and assumed | $ | 32.94 | $ | 19.84 | |||
Awards granted and assumed | 3.7 | 4.9 | |||||
Total fair value of awards released | $ | 23 | $ | 13 | |||
Total unrecognized compensation expense | $ | 193 | $ | 68 | |||
Weighted-average remaining vesting period | 1.2 years | 1.4 years | |||||
Stock options: | |||||||
Total intrinsic value of stock options exercised | $ | 103 | $ | 50 | |||
Total unrecognized compensation expense | $ | 106 | $ | 134 | |||
Weighted-average remaining vesting period | 1.3 years | 1.8 years | |||||
16
Note 12. Commitments and Contingencies
Indemnifications
In the ordinary course of business, we may provide indemnifications of varying scope and terms to customers, vendors, lessors, business partners, subsidiaries and other parties with respect to certain matters, including, but not limited to, losses arising out of our breach of agreements or representations and warranties made by us. In addition, our bylaws contain indemnification obligations to our directors, officers, employees and agents, and we have entered into indemnification agreements with our directors and certain of our officers to give such directors and officers additional contractual assurances regarding the scope of the indemnification set forth in our bylaws and to provide additional procedural protections. We maintain director and officer insurance, which may cover certain liabilities arising from our obligation to indemnify our directors and officers. It is not possible to determine the aggregate maximum potential loss under these indemnification agreements due to the limited history of prior indemnification claims and the unique facts and circumstances involved in each particular agreement. Such indemnification agreements might not be subject to maximum loss clauses. Historically, we have not incurred material costs as a result of obligations under these agreements and we have not accrued any liabilities related to such indemnification obligations in our Condensed Consolidated Financial Statements.
In connection with the sale of our former information management business (“Veritas”), we assigned several leases to Veritas Technologies LLC or its related subsidiaries. As a condition to consenting to the assignments, certain lessors required us to agree to indemnify the lessor under the applicable lease with respect to certain matters, including, but not limited to, losses arising out of Veritas Technologies LLC or its related subsidiaries’ breach of payment obligations under the terms of the lease. As with our other indemnification obligations discussed above and in general, it is not possible to determine the aggregate maximum potential loss under these indemnification agreements due to the limited history of prior indemnification claims and the unique facts and circumstances involved in each particular agreement. As with our other indemnification obligations, such indemnification agreements might not be subject to maximum loss clauses and to date, generally under our real estate obligations, we have not incurred material costs as a result of such obligations under our leases and have not accrued any liabilities related to such indemnification obligations in our Condensed Consolidated Financial Statements.
We provide limited product warranties and the majority of our software license agreements contain provisions that indemnify licensees of our software from damages and costs resulting from claims alleging that our software infringes on the intellectual property rights of a third party. Historically, payments made under these provisions have been immaterial. We monitor the conditions that are subject to indemnification to identify if a loss has occurred.
Litigation contingencies
GSA
During the first quarter of fiscal 2013, we were advised by the Commercial Litigation Branch of the Department of Justice’s (“DOJ”) Civil Division and the Civil Division of the U.S. Attorney’s Office for the District of Columbia that the government is investigating our compliance with certain provisions of our U.S. General Services Administration (“GSA”) Multiple Award Schedule Contract No. GS-35F-0240T effective January 24, 2007, including provisions relating to pricing, country of origin, accessibility, and the disclosure of commercial sales practices.
As reported on the GSA’s publicly-available database, our total sales under the GSA Schedule contract were approximately $222 million from the period beginning January 2007 and ending September 2012. We have fully cooperated with the government throughout its investigation and in January 2014, representatives of the government indicated that their initial analysis of our actual damages exposure from direct government sales under the GSA schedule was approximately $145 million; since the initial meeting, the government’s analysis of our potential damages exposure relating to direct sales has increased. The government has also indicated they are going to pursue claims for certain sales to California, Florida, and New York as well as sales to the federal government through reseller GSA Schedule contracts, which could significantly increase our potential damages exposure.
In 2012, a sealed civil lawsuit was filed against Symantec related to compliance with the GSA Schedule contract and contracts with California, Florida, and New York. On July 18, 2014, the Court-imposed seal expired, and the government intervened in the lawsuit. On September 16, 2014, the states of California and Florida intervened in the lawsuit, and the state of New York notified the Court that it would not intervene. On October 3, 2014, the DOJ filed an amended complaint, which did not state a specific damages amount. On October 17, 2014, California and Florida combined their claims with those of the DOJ and the relator on behalf of New York in an Omnibus Complaint, and a First Amended Omnibus Complaint was filed on October 8, 2015; the state claims also do not state specific damages amounts.
It is possible that the litigation could lead to claims or findings of violations of the False Claims Act, and could be material to our results of operations and cash flows for any period. Resolution of False Claims Act investigations can ultimately result in the payment of somewhere between one and three times the actual damages proven by the government, plus civil penalties in some cases, depending upon a number of factors. Our current estimate of the low end of the range of the probable estimated loss from this matter is $25 million, which we have accrued. This amount contemplates estimated losses from both the investigation of compliance with the terms of the GSA Schedule contract as well as possible violations of the False Claims Act. There is at least a reasonable possibility that a loss may have been incurred in excess of our accrual for this matter, however, we are currently unable to determine the high end of the range of estimated losses resulting from this matter.
17
Finjan
On August 28, 2013, Finjan, Inc. (“Finjan”) filed a complaint against Blue Coat Systems, Inc. in the U.S. District Court for the Northern District of California alleging that certain Blue Coat products infringe six of Finjan’s U.S. patents. On August 4, 2015, a jury returned a verdict that certain Blue Coat products infringe five of the Finjan patents-in-suit and awarded Finjan lump-sum damages of $40 million. On November 20, 2015, the trial court entered a judgment in favor of Finjan on the jury verdict and certain non-jury legal issues. On July 28, 2016, in its ruling on post-trial motions the trial court denied Blue Coat’s motions seeking a new trial or judgment as a matter of law and denied Finjan’s request for enhanced damages and attorneys’ fees. In August 2016, we completed our acquisition of Blue Coat. We intend to vigorously contest the judgment and have filed an appeal with the Federal Circuit Court of Appeals. Our current best estimated loss and related interest with respect to the jury verdict is $40 million, which was accrued by Blue Coat and assumed by us as a part of the acquisition of Blue Coat.
Other
We are involved in a number of other judicial and administrative proceedings that are incidental to our business. Although adverse decisions (or settlements) may occur in one or more of the cases, it is not possible to estimate the possible loss or losses from each of these cases. The final resolution of these lawsuits, individually or in the aggregate, is not expected to have a material adverse effect on our business, results of operations, financial condition or cash flows.
Note 13. Divestitures and Assets and Liabilities Held For Sale
Assets and liabilities held for sale
During the second quarter of fiscal 2018, we entered into a definitive agreement to sell our WSS and PKI solutions to DigiCert. As a result of the agreement, in the second quarter of fiscal 2018, the related assets and liabilities have been classified as held for sale on our Condensed Consolidated Balance Sheets as the transaction met all of the held for sale criteria. No loss was recognized on the related assets and liabilities, as the fair value less any costs to sell exceeded their recorded value. The carrying amounts of the major classes of assets and liabilities held for sale consisted of the following:
(In millions) | September 29, 2017 | |||
Assets: | ||||
Accounts receivable, net | $ | 37 | ||
Goodwill and intangible assets, net | 670 | |||
Other assets | 39 | |||
Total assets held for sale | $ | 746 | ||
Liabilities: | ||||
Deferred revenue | $ | 291 | ||
Other liabilities | 12 | |||
Total liabilities held for sale | $ | 303 | ||
We ceased recording depreciation and amortization on equipment and identified intangible assets, respectively, as of the date the assets qualified for held for sale accounting.
The results of operations of our WSS and PKI solutions are included in our Enterprise Security segment. See Note 2 for more information on our segments.
The following table presents the income before income taxes for our WSS and PKI solutions for the periods indicated:
Three Months Ended | Six Months Ended | ||||||||||||||
(In millions) | September 29, 2017 | September 30, 2016 | September 29, 2017 | September 30, 2016 | |||||||||||
Income before income taxes | $ | 23 | $ | 56 | $ | 58 | $ | 107 | |||||||
Discontinued operations
On January 29, 2016, we completed the sale of Veritas. The results of Veritas are presented as discontinued operations in our Condensed Consolidated Statements of Operations and have been excluded from continuing operations and segment results for all reported periods.
18
The following table presents information regarding certain components of income (loss) from discontinued operations, net of income taxes:
Three Months Ended | Six Months Ended | ||||||||||||||
(In millions) | September 29, 2017 | September 30, 2016 | September 29, 2017 | September 30, 2016 | |||||||||||
Net revenues | $ | 18 | $ | 51 | $ | 37 | $ | 123 | |||||||
Cost of revenues | (14 | ) | (6 | ) | (16 | ) | (9 | ) | |||||||
Operating expenses | — | — | (2 | ) | (24 | ) | |||||||||
Gain (loss) on sale of Veritas | (4 | ) | — | (1 | ) | 38 | |||||||||
Other expense, net | — | (2 | ) | — | — | ||||||||||
Income from discontinued operations before income taxes | — | 43 | 18 | 128 | |||||||||||
Income tax expense (benefit) | (4 | ) | 118 | 37 | 134 | ||||||||||
Income (loss) from discontinued operations, net of income taxes | $ | 4 | $ | (75 | ) | $ | (19 | ) | $ | (6 | ) | ||||
Note 14. Subsequent Events
Sale of our website security and public key infrastructure solutions
On October 31, 2017, we completed the sale of our WSS and PKI solutions to DigiCert. Based on the terms of the definitive agreement and subject to adjustment as provided therein, we received consideration of approximately $960 million in cash and approximately a 27% equity interest in the common stock of DigiCert. The equity interest received will be accounted for under the equity method. The gain from the sale will be included in non-operating income in our Condensed Consolidated Statements of Operations during the third quarter of fiscal 2018.
Debt prepayments
During October 2017, subsequent to our second quarter of fiscal 2018, we prepaid $130 million and $250 million of principal on our Senior Term Loan A-3 and Senior Term Loan A-1, respectively.
Item 2. Management’s Discussion and Analysis of Financial Condition and Results of Operations
Forward-looking statements and factors that may affect future results
The discussion below contains forward-looking statements, which are subject to safe harbors under the Securities Act of 1933, as amended (the “Securities Act”) and the Exchange Act of 1934, as amended (the “Exchange Act”). Forward-looking statements include references to our ability to utilize our deferred tax assets, as well as statements including words such as “expects,” “plans,” “anticipates,” “believes,” “estimates,” “predicts,” “projects,” and similar expressions. In addition, projections of our future financial performance, anticipated growth and trends in our businesses and in our industries, the anticipated impacts of acquisitions, divestitures and of our restructurings, our intent to pay quarterly cash dividends in the future, and other characterizations of future events or circumstances are forward-looking statements. These statements are only predictions, based on our current expectations about future events and may not prove to be accurate. We do not undertake any obligation to update these forward-looking statements to reflect events occurring or circumstances arising after the date of this report. These forward-looking statements involve risks and uncertainties, and our actual results, performance, or achievements could differ materially from those expressed or implied by the forward-looking statements on the basis of several factors, including those that we discuss in Risk Factors, set forth in Part I, Item 1A, of our annual report on Form 10-K for the fiscal year ended March 31, 2017 and in Part II Item 1A, of this quarterly report on Form 10-Q. We encourage you to read those sections carefully.
OVERVIEW
Our business
Symantec Corporation is a global leader in cybersecurity. We operate our business on a global civilian cyber intelligence threat network and track a vast number of threats across the Internet from hundreds of millions of mobile devices, endpoints, and servers across the globe. We believe one of our competitive advantages is our database of threat indicators. This database allows us to reduce the number of false positives and provide faster and better protection for customers through our products. We are leveraging our capabilities to deliver integrated solutions for customers. We are also pioneering solutions in markets such as cloud security, digital safety, advanced threat protection, identity protection, information protection and cyber security services.
19
Fiscal calendar
We have a 52/53-week fiscal year ending on the Friday closest to March 31. The three months ended September 29, 2017 (“Q2 FY18”) and September 30, 2016 (“Q2 FY17”) both consisted of 13 weeks. The six months ended September 29, 2017 (“YTD FY18”) and September 30, 2016 (“YTD FY17”) both consisted of 26 weeks. Our 2018 fiscal year consists of 52 weeks and ends on March 30, 2018.
Strategy
Our strategy is to deliver comprehensive cyber security solutions for both enterprises and consumers.
Our enterprise security strategy is to deliver an Integrated Cyber Defense platform that allows Symantec products to share threat intelligence and improve security outcomes for customers across all control points. Symantec is the leading vendor in protecting users, information, web and messaging across an integrated platform.
Our consumer digital safety strategy is to deliver the most comprehensive consumer digital safety solutions to help people protect their information, identities, devices and families.
Our financial highlights and results of operations
Our financial highlights and results of operations discuss our business and overall analysis of financial and other highlights affecting the company and analyze our financial results comparing Q2 FY18 to Q2 FY17 and YTD FY18 to YTD FY17. This interim Management’s Discussion and Analysis of Financial Condition and Results of Operations (“MD&A”) should be read in conjunction with the MD&A in our Annual Report on Form 10-K for the fiscal year ended March 31, 2017.
During Q2 FY18, we entered into a definitive agreement to sell our website security and public key infrastructure (“WSS and PKI”) solutions. As a result, in Q2 FY18, the related assets and liabilities have been classified as held for sale on our Condensed Consolidated Balance Sheets. The transaction closed on October 31, 2017, subsequent to Q2 FY18. See Note 13 and Note 14 to the Condensed Consolidated Financial Statements for more information on our held for sale classification and related disposition. Also during Q2 FY18, we completed our acquisitions of Israel-based Fireglass, Ltd. (“Fireglass”) and Skycure, Ltd. (“Skycure”).
The results of our former information management business (“Veritas”) are presented as discontinued operations in our Condensed Consolidated Statements of Operations and thus have been excluded from continuing operations and segment results for all reported periods.
The following discussion relates to our current segment reporting structure and our continuing operations unless stated otherwise.
Our operating segments
Our operating segments are significant strategic business units that offer different products and services distinguished by customer needs. Our operating segments are: Enterprise Security and Consumer Digital Safety.
• | Enterprise Security. Our Enterprise Security segment solutions protect organizations so they can securely conduct business while leveraging new platforms and data. Our Enterprise Security segment includes our endpoint protection products, endpoint management, messaging protection products, information protection products, cyber security services, website security and advanced web and cloud security offerings. Our enterprise endpoint, network security and management offerings support evolving endpoints and networks, providing advanced threat protection while helping reduce cost and complexity. These products and solutions are delivered through various methods, such as software, appliance, virtual appliance, Software-as-a-Service (“SaaS”) and managed services. |
• | Consumer Digital Safety. Our Consumer Digital Safety segment focuses on providing a comprehensive Digital Safety solution to protect information, devices, networks and the identities of consumers. This solution includes our Norton-branded services, which provide multi-layer security across major desktop and mobile operating systems, public Wi-Fi connections, and home networks, to defend against increasingly complex online threats to individuals, families and small businesses, and our LifeLock-branded identity protection services. Our LifeLock-branded identity protection services primarily consist of identifying and notifying users of identity-related and other events and assisting users in remediating their impact. With the addition of LifeLock-branded identity protection services, we are providing a comprehensive digital safety solution designed to protect information across devices, customer identities and the connected home and family and accelerating our leadership in Consumer Digital Safety to protect all aspects of consumers’ digital lives. |
For more information on our operating segments see Note 2 to the Condensed Consolidated Financial Statements.
20
Financial highlights and business trends
The following charts provide an overview of key financial metrics in millions, except for percentage of revenues.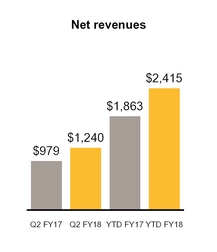
Below are our financial highlights for the three months ended September 29, 2017, compared to the comparable period in the prior year:
• | Revenue increased by 27%, driven by a 20% and 37% increase in revenue from our Enterprise Security and Consumer Digital Safety segments, respectively, primarily due to the contributions from the acquisitions of Blue Coat, Inc. (“Blue Coat”) and LifeLock, Inc. (“LifeLock”), respectively. |
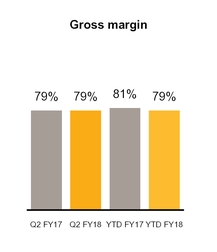
• | Our margins remained flat primarily due to increased revenue offset by increased cost of revenues and operating expenses as a result of our acquisitions of Blue Coat and LifeLock. Cost of revenues increased primarily due to increased amortization of intangible assets of $26 million as a result of our acquisitions of Blue Coat and LifeLock. Operating expenses increased due to increased stock-based compensation and amortization of intangible assets of $87 million and $21 million, respectively, primarily as a result of our acquisitions. Additionally, operating expenses increased due to increased advertising and promotional expense of $59 million, largely related to LifeLock. These increases were partially offset by savings from ongoing cost reduction initiatives. |
Below are our financial highlights for the six months ended September 29, 2017, compared to the comparable period in the prior year:
• | Revenue increased by 30%, driven by a 26% and 34% increase in revenue from our Enterprise Security and Consumer Digital Safety segments, respectively, primarily due to the contributions from the acquisitions of Blue Coat and LifeLock. |
• | Our gross margin decreased by two percentage points primarily due to increased revenue offset by increased cost of revenues from increased amortization of intangible assets of $75 million as a result of our acquisitions of Blue Coat and LifeLock, respectively. |
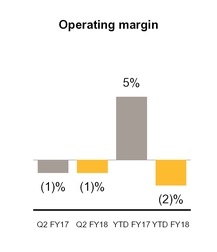
• | Our operating margin was (2)% for YTD FY18, compared to 5% for YTD FY17, primarily due to increased operating expenses including increased stock-based compensation expense and amortization of intangible assets of $182 million and $66 million, respectively, primarily as a result of our acquisitions. Additionally, operating expenses increased due to increased advertising and promotional expenses of $122 million, largely related to LifeLock. These increases were partially offset by savings from ongoing cost reduction initiatives. |
21
• | Cash paid for income taxes decreased $822 million, primarily due to the one-time payment during the first quarter of fiscal 2017 related to the gain on sale from the divestiture of Veritas during fiscal 2016. |
• | During YTD FY18, we repaid debt totaling $2.0 billion as part of our plan to deleverage our balance sheet. |
• | During YTD FY18, we acquired several companies for total cash consideration of $361 million, net of cash acquired. For more information on our acquisitions see Note 6 to the Condensed Consolidated Financial Statements. |
We expect our operating margin to fluctuate in future periods as a result of a number of factors, including our operating results and the timing and amount of expenses incurred.
RESULTS OF OPERATIONS
Segment operating results
Enterprise Security Segment
The following charts are in millions except for percentage of revenues.
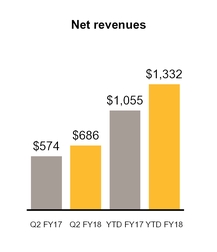
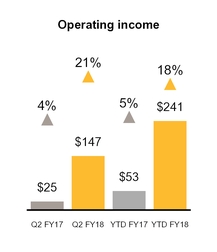
Q2 FY18 compared to Q2 FY17
Revenue increased $112 million, or 20% primarily due to increased revenue from Blue Coat network protection solutions, which were included in our results of operations for two months during Q2 FY17. Due to the fair value adjustments to deferred revenue as a result of our acquisition of Blue Coat, we excluded $15 million of revenue we otherwise would have recognized in Q2 FY18 compared to $36 million that we excluded in Q2 FY17. Operating income increased $122 million, or 488%, primarily due to the contribution from the Blue Coat acquisition.
YTD FY18 compared to YTD FY17
Revenue increased $277 million, or 26% primarily due to increased revenue from Blue Coat network protection solutions. Operating income increased $188 million, or 355%, primarily due to the contribution from the Blue Coat acquisition.
Consumer Digital Safety Segment
The following charts are in millions except for percentage of revenues.
22
Q2 FY18 compared to Q2 FY17
Revenue increased $149 million, or 37%, primarily due to revenue from sales of LifeLock products, which were absent in Q2 FY17. Due to fair value adjustments to deferred revenue as a result of our acquisition of LifeLock, we excluded $21 million of revenue we otherwise would have recognized in Q2 FY18. While the trend of declining revenues from sales of Norton-branded products continued in Q2 FY18, we continued to benefit from the shift to subscription-based contracts and combined packaging of consumer products, resulting in a lower year-over-year decline in Q2 FY18 as compared to Q2 FY17. Operating income increased $28 million, or 13%, primarily due to the contribution from the LifeLock acquisition. The increase was partly offset by increased advertising and promotional expense of $59 million, largely related to LifeLock products.
YTD FY18 compared to YTD FY17
Revenue increased $275 million, or 34%, primarily due to revenue from sales of LifeLock products, which were absent in the first six months of FY17. Due to fair value adjustments to deferred revenue as a result of our acquisition of LifeLock, we excluded $50 million of revenue we otherwise would have recognized in the first six months of FY18. While the trend of declining revenues from sales of Norton-branded products continued in YTD FY18, we continued to benefit from the shift to subscription-based contracts and combined packaging of consumer products, resulting in a lower year-over-year decline in the first six months of FY18 as compared to the first six months of FY17. Operating income increased $33 million, or 7%, primarily due to the contribution from the LifeLock acquisition. The increase was partly offset by increased advertising and promotional expense of $122 million, largely related to LifeLock products.
Net revenues by geographic region
Percentage of revenue by geographic region presented below is based on the billing location of the customer.
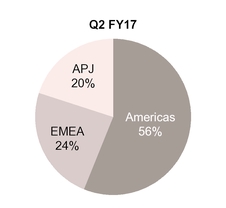

Total: | $ | 979 | million | Total: | $ | 1,240 | million | ||||
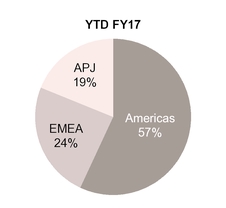
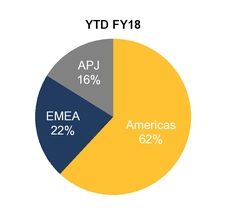
Total: | $ | 1,863 | million | Total: | $ | 2,415 | million | ||||
Note: Americas include U.S., Canada and Latin America; EMEA includes Europe, Middle East and Africa; APJ includes Asia Pacific and Japan
Our percentage of revenues from the Americas for Q2 FY18 and YTD FY18 increased compared to the year ago periods primarily as a result of LifeLock sales which are entirely U.S.-based.
Our international sales are expected to continue to be a significant portion of our revenue. As a result, we expect revenue to continue to be affected by foreign currency exchange rates as compared to the U.S. dollar. We are unable to predict the extent to which revenue in future periods will be impacted by changes in foreign currency exchange rates. If international sales become
23
a greater portion of our total sales in the future, changes in foreign currency exchange rates may have a potentially greater impact on our revenue and operating results.
Cost of revenues
Cost of revenues consists primarily of technical support costs, costs of billable services, fees to original equipment manufacturers under revenue-sharing agreements, hardware costs, and fulfillment costs, as well as intangible asset amortization expense, and is presented below in millions except for percentage of revenues.
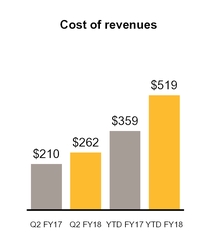
Q2 FY18 compared to Q2 FY17
Our cost of revenues increased $52 million primarily due to costs related to revenue of the acquired Blue Coat and LifeLock products, including $26 million of increased amortization of intangible assets primarily as a result of our Blue Coat and LifeLock acquisitions.
YTD FY18 compared to YTD FY17
Our cost of revenues increased $160 million primarily due to costs related to revenue of the acquired Blue Coat and LifeLock products, including $75 million of increased amortization of intangible assets as a result of our acquisitions.
Operating expenses
The following charts are in millions except for percentage of revenues.
24
Q2 FY18 compared to Q2 FY17
In general, our operating expenses increased in Q2 FY18 compared to Q2 FY17 primarily as a result of increased headcount and facility costs associated with the acquisitions of Blue Coat and LifeLock during fiscal 2017.
Sales and marketing expense increased $96 million primarily as a result of increased expenses from the Blue Coat and LifeLock acquisitions, including an increase of $59 million of advertising and promotional expense, largely related to LifeLock, and $26 million of stock-based compensation expense.
Research and development expense increased $41 million primarily as a result of increased expenses from the Blue Coat and LifeLock acquisitions, including an increase of $29 million of stock-based compensation expense.
General and administrative expense increased $15 million primarily as a result of increased expenses from the Blue Coat and LifeLock acquisitions, including an increase of $32 million of stock-based compensation expense, partially offset by a decrease of $26 million in acquisition related expenses.
Our stock-based compensation expense included in operating expenses increased $87 million primarily due to the equity awards assumed in our acquisitions and the expected level of achievement for performance-based restricted stock units (“PRUs”). Our stock-based compensation expense may fluctuate in future periods as a result of a number of factors including the achievement levels of PRU performance conditions.
Amortization of intangible assets increased $21 million primarily due to the amortization of intangible assets acquired in the Blue Coat and LifeLock acquisitions.
YTD FY18 compared to YTD FY17
In general, our operating expenses increased in YTD FY18 compared to YTD FY17 as a result of increased headcount and facility costs associated with the acquisitions of Blue Coat and LifeLock.
Sales and marketing expense increased $238 million primarily as a result of increased expenses from the Blue Coat and LifeLock acquisitions, including increases of $122 million of advertising and promotional expense, largely related to LifeLock, and $55 million of stock-based compensation expense.
Research and development expense increased $104 million primarily as a result of increased expenses from the Blue Coat and LifeLock acquisitions, including an increase of $55 million of stock-based compensation expense.
General and administrative expense increased $80 million primarily as a result of increased expenses from the Blue Coat and LifeLock acquisitions, including an increase of $72 million of stock-based compensation expense, partially offset by a decrease of $30 million in acquisition related expenses.
Our stock-based compensation expense included in operating expenses increased $182 million primarily due to the equity awards assumed in our acquisitions during fiscal 2017, and the expected level of achievement for PRUs.
Amortization of intangible assets increased $66 million primarily due to the intangible assets acquired in the Blue Coat and LifeLock acquisitions.
25
Restructuring, transition and other
We initiated a restructuring plan in the first quarter of fiscal 2017 to reduce complexity by means of long-term structural improvements. We have reduced headcount and closed certain facilities in connection with the restructuring plan and expect additional charges of approximately $165 million to $200 million related to headcount reductions and facilities closures in the second half of fiscal 2018. These actions are expected to be completed by the fourth quarter of fiscal 2018. During the first six months of FY18, we also incurred additional divestiture costs as a result of the divestiture of our WSS and PKI solutions, as well as costs associated with our other transition and transformation programs including the implementation of a new enterprise resource planning system and costs to automate business processes. On an annual basis, we expect these programs to generate net cost efficiencies and cost synergies which, when completed, will favorably impact our continuing operating expenses under our commitment to realize cost savings of $580 million, including cost synergies from the Blue Coat and LifeLock acquisitions. See Note 4 to the Condensed Consolidated Financial Statements for further information on our restructuring, transition and other costs.
Non-operating expense, net
The following charts are in millions.
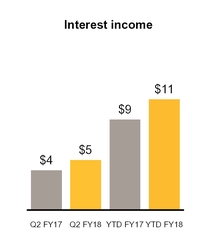
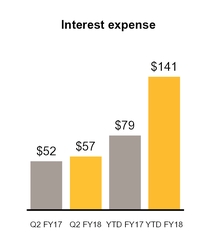
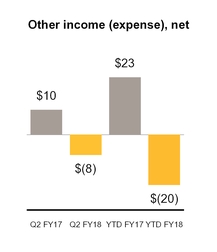
YTD FY18 compared to YTD FY17
Non-operating expense, net, increased $103 million primarily due to increased interest expense of $62 million, mainly related to the timing of the issuance of the borrowings in fiscal 2017. See Note 8 to the Condensed Consolidated Financial Statements for more information about our debt. In addition, non-operating expense, net, increased by $20 million resulting from a net foreign currency loss for YTD FY18 compared to a net gain for YTD FY17 and a $17 million reduction in other income due to the absence of income from transition service agreements related to our Veritas divestiture in YTD FY18 compared to $17 million in income from such arrangements in YTD FY17.
Provision for income taxes
The following charts are in millions except for percentages.
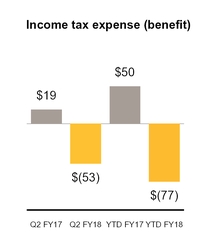
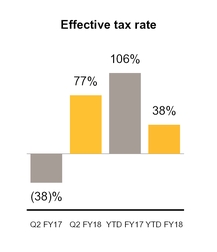
26
Our effective tax rate for loss from continuing operations for Q2 FY18 and YTD FY18 differs from the federal statutory income tax rate primarily due to the benefits of lower-taxed international earnings, the research and development tax credit, and excess tax benefits related to stock-based compensation, partially offset by various permanent differences.
Our effective tax rate for income (loss) from continuing operations for Q2 FY17 and YTD FY17 differs from the federal statutory income tax rate primarily due to the benefits of lower-taxed international earnings and the research and development credit, offset by various permanent differences and tax expense related to the loss of tax attributes due to restructuring activities.
For Q2 FY18 and YTD FY18, we recorded an income tax benefit on discontinued operations of $4 million and income tax expense on discontinued operations of $37 million, respectively. For Q2 FY17 and YTD FY17, we recorded income tax expense on discontinued operations of $118 million and $134 million, respectively. See Note 13 for further details regarding discontinued operations.
We are a U.S.-based multinational company subject to tax in multiple U.S. and international tax jurisdictions. A substantial portion of our international earnings were generated from subsidiaries organized in Ireland and Singapore. Our results of operations would be adversely affected to the extent that our geographical mix of income becomes more weighted toward jurisdictions with higher tax rates and would be favorably affected to the extent the relative geographic mix shifts to lower tax jurisdictions. Any change in our mix of earnings is dependent upon many factors and is therefore difficult to predict.
The timing of the resolution of income tax examinations is highly uncertain, and the amounts ultimately paid, if any, upon resolution of the issues raised by the taxing authorities may differ materially from the amounts accrued for each year. Although potential resolution of uncertain tax positions involve multiple tax periods and jurisdictions, it is reasonably possible that the gross unrecognized tax benefits related to these audits could decrease, whether by payment, release, or a combination of both, in the next 12 months by $13 million, which could reduce our income tax provision and therefore benefit the resulting effective tax rate.
We continue to monitor the progress of ongoing income tax controversies and the impact, if any, of the expected expiration of the statute of limitations in various taxing jurisdictions.
LIQUIDITY AND CAPITAL RESOURCES
Sources and uses of cash
We have historically relied on cash flow from operations, borrowings under credit facilities, issuances of debt, and the sale of a business, for our liquidity needs. As of September 29, 2017, we had cash, cash equivalents and short-term investments of $2.0 billion, of which $1.4 billion was held by our foreign subsidiaries. We have provided U.S. deferred taxes on a portion of our undistributed foreign earnings sufficient to address the incremental U.S. tax that would be due if we needed such portion of these funds to support our operations in the U.S. We also have an unused credit facility of $1.0 billion resulting in a liquidity position of approximately $3.0 billion as of September 29, 2017.
Our principal cash requirements primarily consist of acquisitions, operating expenses, payment of taxes, capital expenditures, and contractual payments of principal and interest on debt. Also, we may engage, from time to time, in the open market purchase of our notes prior to their maturity. Furthermore, our capital allocation strategy contemplates a quarterly cash dividend and an on-going evaluation of our ability to repurchase shares of our common stock.
Cash flows
The following charts summarize, for the periods indicated, selected items in our Condensed Consolidated Statements of Cash Flows for YTD FY17 and YTD FY18, in millions.
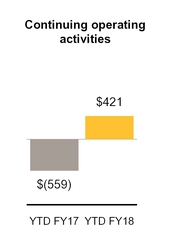
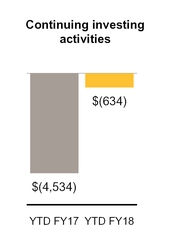
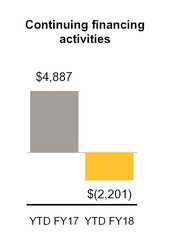
27
Continuing operating activities
Our primary source of cash from continuing operating activities has been cash collections from our customers. Due to seasonality, our orders are generally higher in our third and fourth fiscal quarters and lower in our first and second fiscal quarters. We therefore expect cash inflows from continuing operating activities to be affected by fluctuations in billings and timing of collections.
Our primary uses of cash from our continuing operating activities include payments for compensation and related costs, payments to our resellers and distribution partners, payments for income taxes, and other general corporate expenditures.
The increase in cash from continuing operating activities in YTD FY18 compared to YTD FY17 was primarily due to decreased tax payments, net of refunds, of $822 million mainly related to income taxes paid during the first quarter of fiscal 2017, as well as a smaller decrease in deferred revenue of $186 million, partially offset by decreased income from continuing operations, adjusted for non-cash items.
Restructuring Plan. We initiated a restructuring plan in fiscal 2017 to reduce complexity by means of long-term structural improvements. We expect to reduce headcount and close certain facilities in connection with this restructuring plan. The total remaining cash payments in connection with the restructuring plan are expected to be approximately $185 million to $220 million, which we expect to be primarily incurred in the third and fourth quarters of fiscal 2018. See Note 4 to the Condensed Consolidated Financial Statements for more information on our restructuring plan.
Continuing investing activities
Our investing cash flows consist primarily of acquisitions and purchases of short-term investments. The increase in continuing investing activities in YTD FY18 compared to YTD FY17 was primarily due to a $4.2 billion decrease in cash used for acquisitions reflecting $361 million used in YTD FY18, compared to $4.5 billion used in YTD FY17 for the Blue Coat acquisition. In addition, in YTD FY18 we purchased $201 million of short-term investments.
Short-term investments. In order to achieve greater investment diversification and higher yields while maintaining our objectives of preservation of capital, liquidity, and safety.
Acquisitions. During Q2 FY18 we completed our acquisitions of Fireglass and Skycure as well as other smaller acquisitions for a total of $361 million, net of cash acquired.
Sale of Website Security and related Public Key Infrastructure Solutions. On August 2, 2017, we entered into a definitive agreement to sell our WSS and PKI solutions. On October 31, 2017, we completed the sale of our WSS and PKI solutions to DigiCert. Based on the terms of the definitive agreement and subject to adjustment as provided therein, we received consideration of approximately $960 million in cash and approximately a 27% equity interest in the common stock of DigiCert. The transaction proceeds, net of taxes, fees and other related costs, are expected to be primarily used to repay debt.
Continuing financing activities
Our financing cash flows consist primarily of issuances and repayments of debt, payment of dividends and dividend equivalents to stockholders, and tax payments related to the settlement of restricted stock units (“RSUs”). The change in continuing financing activities in YTD FY18 compared to YTD FY17 was primarily due to reduced borrowings of $5.0 billion, net of issuance costs, increased debt repayments of $2.0 billion, a settlement of our dissenting shareholder liability of $68 million related to the LifeLock acquisition and increased tax payments related to the settlement of RSUs of $49 million.
Borrowings. Proceeds from and repayments of borrowings fluctuate from year to year based on the amounts paid to fund acquisitions, and debt repayments. The charts below set forth the total principal amount of our debt issued, debt repayments and the amount of unused credit facility for YTD FY17 and YTD FY18, in billions.
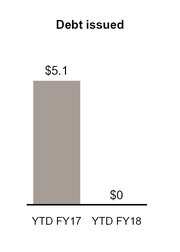
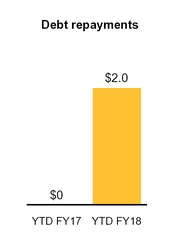
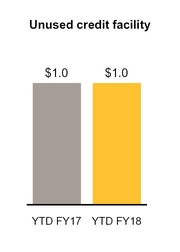
As a part of our plan to deleverage our balance sheet, we may from time to time in the future make optional repayments of our debt obligations, which may include repurchases of our outstanding debt, depending on various factors, such as market
28
conditions. During October 2017, subsequent to our Q2 FY18, we prepaid $130 million and $250 million in principal amounts of our Senior Term Loan A-3 and Senior Term Loan A-1, respectively.
Interest payments on $2.3 billion of our variable-rate borrowings are subject to change based on market interest rates.
See Note 8 and Note 14 to the Condensed Consolidated Financial Statements for further information on our debt and debt prepayments made subsequent to Q2 FY18, respectively.
Dividends. On November 1, 2017, we declared a cash dividend of $0.075 per share of common stock to be paid on December 13, 2017, to all stockholders of record as of the close of business on November 20, 2017. All shares of common stock issued and outstanding and all shares of unvested restricted stock and performance-based stock as of the record date will be entitled to the dividend and dividend equivalents, respectively. Any future dividends and dividend equivalents will be subject to the approval of our Board of Directors.
See Note 10 to the Condensed Consolidated Financial Statements for more information on our dividends and dividend equivalents.
Contractual obligations
Except for the repayment of our Senior Notes, settlement of our Senior Term Facility, related interest payments on borrowings, and purchase obligations, there were no significant changes during the six months ended September 29, 2017 to the contractual obligations disclosed in Management’s Discussion and Analysis of Financial Condition and Results of Operations, set forth in Part II, Item 7, of our Annual Report on Form 10-K for the fiscal year ended March 31, 2017.
The table below sets forth these changes as of September 29, 2017, but does not update the other line items in the contractual obligations table that appear in the section of our Annual Report on Form 10-K described above:
Payments Due by Fiscal Period | |||||||||||||||||||
(In millions) | Total | Remainder of 2018 | 2019 - 2020 | 2021 - 2022 | Thereafter | ||||||||||||||
Debt (1) | $ | 6,300 | $ | 130 | $ | 1,670 | $ | 3,000 | $ | 1,500 | |||||||||
Interest payments on debt (2) | 931 | 119 | 382 | 230 | 200 | ||||||||||||||
Purchase obligations (3) | 278 | 223 | 53 | 2 | — | ||||||||||||||
Total | $ | 7,509 | $ | 472 | $ | 2,105 | $ | 3,232 | $ | 1,700 | |||||||||
(1) | See Note 8 to the Condensed Consolidated Financial Statements for further information on our debt. |
(2) | Interest payments were calculated based on the contractual terms of the related Senior Notes, Convertible Senior Notes and Senior Term Facilities. Interest on variable rate debt was calculated using the interest rate in effect as of September 29, 2017. See Note 8 to the Condensed Consolidated Financial Statements for further information on the Senior Notes, Convertible Senior Notes and Senior Term Facilities. |
(3) | These amounts are associated with agreements for purchases of goods or services generally including agreements that are enforceable and legally binding and that specify all significant terms, including fixed or minimum quantities to be purchased; fixed, minimum or variable price provisions; and the approximate timing of the transaction. The table above also includes agreements to purchase goods or services that have cancellation provisions requiring little or no payment. The amounts under such contracts are included in the table above because management believes that cancellation of these contracts is unlikely and we expect to make future cash payments according to the contract terms or in similar amounts for similar materials. |
Indemnifications
In the ordinary course of business, we may provide indemnifications of varying scope and terms to customers, vendors, lessors, business partners, subsidiaries and other parties with respect to certain matters, including, but not limited to, losses arising out of our breach of agreements or representations and warranties made by us. In addition, our bylaws contain indemnification obligations to our directors, officers, employees and agents, and we have entered into indemnification agreements with our directors and certain of our officers to give such directors and officers additional contractual assurances regarding the scope of the indemnification set forth in our bylaws and to provide additional procedural protections. We maintain director and officer insurance, which may cover certain liabilities arising from our obligation to indemnify our directors and officers. It is not possible to determine the aggregate maximum potential loss under these indemnification agreements due to the limited history of prior indemnification claims and the unique facts and circumstances involved in each particular agreement. Such indemnification agreements might not be subject to maximum loss clauses. Historically, we have not incurred material costs as a result of obligations under these agreements and we have not accrued any liabilities related to such indemnification obligations in our Condensed Consolidated Financial Statements.
In connection with the sale of Veritas, we assigned several leases to Veritas Technologies LLC or its related subsidiaries. As a condition to consenting to the assignments, certain lessors required us to agree to indemnify the lessor under the applicable lease with respect to certain matters, including, but not limited to, losses arising out of Veritas Technologies LLC or its related subsidiaries’ breach of payment obligations under the terms of the lease. As with our other indemnification obligations discussed above and in general, it is not possible to determine the aggregate maximum potential loss under these indemnification
29
agreements due to the limited history of prior indemnification claims and the unique facts and circumstances involved in each particular agreement. As with our other indemnification obligations, such indemnification agreements might not be subject to maximum loss clauses and to date, generally under our real estate obligations, we have not incurred material costs as a result of such obligations under our leases and have not accrued any liabilities related to such indemnification obligations in our Condensed Consolidated Financial Statements.
We provide limited product warranties and the majority of our software license agreements contain provisions that indemnify licensees of our software from damages and costs resulting from claims alleging that our software infringes on the intellectual property rights of a third party. Historically, payments made under these provisions have been immaterial. We monitor the conditions that are subject to indemnification to identify if a loss has occurred.
CRITICAL ACCOUNTING POLICIES AND ESTIMATES
There have been no material changes in the matters for which we make critical accounting estimates in the preparation of our Condensed Consolidated Financial Statements during the six months ended September 29, 2017, as compared to those disclosed in Management’s Discussion and Analysis of Financial Condition and Results of Operations included in our Annual Report on Form 10-K for the fiscal year ended March 31, 2017.
Recently issued authoritative guidance not yet adopted
Revenue Recognition - Contracts with Customers. In May 2014, the Financial Accounting Standards Board (“FASB”) issued new authoritative guidance for revenue from contracts with customers. The standard’s core principle is that a company will recognize revenue when it transfers promised goods or services to customers in an amount that reflects the consideration that the company expects to receive in exchange for those goods or services. In doing so, companies will need to use more judgment and make more estimates than under current guidance. These may include identifying performance obligations in the contract, estimating the amount of variable consideration to include in the transaction price, and allocating the transaction price to each separate performance obligation. In March 2016, the FASB clarified implementation guidance on principal versus agent considerations. In April 2016, the FASB issued guidance related to identifying performance obligations and licensing which reduces the cost and complexity of applying certain aspects of the guidance both at implementation and on an ongoing basis.
The new guidance may be applied retrospectively to each prior period presented (“retrospective”) or retrospectively with cumulative effect recognized in retained earnings as of the date of adoption (“modified retrospective”). We expect to adopt the new standard on a modified retrospective basis in our first quarter of fiscal 2019.
We are continuing to assess the impact of this standard on our financial position, results of operations and related disclosures and have not yet determined whether the effect will be material. We do not expect that the adoption of this standard will have a material impact on our operating cash flows. We believe that the new guidance will impact our following policies and disclosures:
• | the pattern and timing of the recognition of revenue for certain license fees; |
• | the allocation of revenue across performance obligations in multiple element arrangements; and |
• | required disclosures, including information about the transaction price allocated to remaining performance obligations and expected timing of revenue recognition. |
We will continue to assess the impact of new guidance including any changes to systems, processes and the control environment as we work through the adoption, and there remain areas still to be fully concluded upon.
Financial Instruments - Recognition and Measurement. In January 2016, the FASB issued new authoritative guidance on financial instruments. The new guidance enhances the reporting model for financial instruments, which includes amendments to address aspects of recognition, measurement, presentation and disclosure. The new guidance will be effective for us in our first quarter of fiscal 2019. Early adoption is permitted under limited circumstances but we do not intend to adopt the provisions of the new guidance early. We are currently evaluating the impact of the adoption of this guidance on our Consolidated Financial Statements.
Leases. In February 2016, the FASB issued new guidance on lease accounting which will require lessees to recognize assets and liabilities on their balance sheet for the rights and obligations created by operating leases and will also require disclosures designed to give users of financial statements information on the amount, timing, and uncertainty of cash flows arising from leases. The new guidance will be effective for us in our first quarter of fiscal 2020. Early adoption is permitted but we do not plan to adopt the provisions of the new guidance early. We are currently evaluating the impact of the adoption of this guidance on our Consolidated Financial Statements. We are currently in the assessment phase to determine the adoption methodology and are evaluating the impact of this new standard on our consolidated financial statements and disclosures. We expect that most of our operating lease commitments will be subject to the new standard and recognized as lease liabilities and right-of-use assets upon adoption, which will increase the total assets and total liabilities we report. We are evaluating the impact to our consolidated financial statements as it relates to other aspects of the business.
Credit Losses. In June 2016, the FASB issued new authoritative guidance on credit losses which changes the impairment model for most financial assets and certain other instruments. For trade receivables and other instruments, we will be required to use a new forward-looking “expected loss” model. Additionally, for available-for-sale debt securities with unrealized losses, we will measure credit losses in a manner similar to today, except that the losses will be recognized as allowances rather than
30
reductions in the amortized cost of the securities. The standard will be effective for us in our first quarter of fiscal 2021. We are currently evaluating the impact of the adoption of this guidance on our Consolidated Financial Statements.
Income Taxes - Intra-Entity Asset Transfers Other Than Inventory. In October 2016, the FASB issued new authoritative guidance that requires entities to immediately recognize the tax consequences of intercompany asset transfers, excluding inventory, at the transaction date, rather than deferring the tax consequences under current U.S. GAAP. The standard will be effective for us in our first quarter of fiscal 2019, and requires a modified retrospective transition method. We are currently evaluating the impact of the adoption of this guidance and anticipate it will have a material impact on our Consolidated Financial Statements.
Although there are several other new accounting pronouncements issued or proposed by the FASB that we have adopted or will adopt, as applicable, we do not believe any of these accounting pronouncements has had or will have a material impact on our consolidated financial position, operating results or disclosures.
Item 3. Quantitative and Qualitative Disclosures about Market Risk
Interest rate risk
There have been no significant changes in our interest rate risk during the six months ended September 29, 2017, as compared to the interest rate risk exposures discussed in Management’s Discussion and Analysis of Financial Condition and Results of Operations, set forth in Part II, Item 7A, of our Annual Report on Form 10-K for the fiscal year ended March 31, 2017.
Foreign currency exchange rate risk
There have been no significant changes to the estimated fair value change to our foreign currency hedging derivatives for a given change in foreign currency exchange rates during the six months ended September 29, 2017, as compared to that discussed in Part II, Item 7A of our Annual Report on Form 10-K for the fiscal year ended March 31, 2017.
Item 4. Controls and Procedures
(a) Evaluation of Disclosure Controls and Procedures
The Securities and Exchange Commission (“SEC”) defines the term “disclosure controls and procedures” to mean a company’s controls and other procedures that are designed to ensure that information required to be disclosed in the reports that it files or submits under the Exchange Act is recorded, processed, summarized, and reported, within the time periods specified in the SEC’s rules and forms. “Disclosure controls and procedures” include, without limitation, controls and procedures designed to ensure that information required to be disclosed by an issuer in the reports that it files or submits under the Exchange Act is accumulated and communicated to the issuer’s management, including its principal executive and principal financial officers, or persons performing similar functions, as appropriate to allow timely decisions regarding required disclosure. Our disclosure controls and procedures are designed to provide reasonable assurance that such information is accumulated and communicated to our management. Our management (with the participation of our Chief Executive Officer (“CEO”) and Chief Financial Officer (“CFO”)) has conducted an evaluation of the effectiveness of our disclosure controls and procedures (as defined in Rules 13a-15(e) and 15d-15(e) of the Securities Exchange Act). Based on such evaluation, our CEO and our CFO have concluded that our disclosure controls and procedures were effective at the reasonable assurance level as of the end of the period covered by this report.
(b) Changes in Internal Control over Financial Reporting
There were no changes in our internal control over financial reporting during the three months ended September 29, 2017, that have materially affected, or are reasonably likely to materially affect, our internal control over financial reporting.
(c) Limitations on Effectiveness of Controls
Our management, including our CEO and CFO, does not expect that our disclosure controls and procedures or our internal controls will prevent all errors and all fraud. A control system, no matter how well conceived and operated, can provide only reasonable, not absolute, assurance that the objectives of the control system are met. Further, the design of a control system must reflect the fact that there are resource constraints, and the benefits of controls must be considered relative to their costs. Because of the inherent limitations in all control systems, no evaluation of controls can provide absolute assurance that all control issues and instances of fraud, if any, within our company have been detected. Accordingly, our disclosure controls and procedures provide reasonable assurance of achieving their objectives.
31
PART II. OTHER INFORMATION
Item 1. Legal Proceedings
Information with respect to this Item may be found under the heading “Litigation contingencies” in Note 12 to the Condensed Consolidated Financial Statements in this Form 10-Q, which information is incorporated herein by reference.
Item 1A. Risk Factors
A description of the risks associated with our business, financial condition and results of operations is set forth in Part 1, Item 1A, of our Annual Report on Form 10-K for the fiscal year ended March 31, 2017. There have been no material changes in our risks from such description.
Item 2. Unregistered Sales of Equity Securities and Use of Proceeds
(a) On July 24, 2017, we issued 1.7 million restricted shares of our common stock to two individuals in connection with our acquisition of Fireglass, Ltd. These restricted shares will be released to the individuals through three annual installments subject to the individuals’ continued employment at Symantec.
Additionally, on July 24, 2017, pursuant to the terms of that certain Share Purchase agreement, dated as of July 10, 2017 (the “Purchase Agreement”), by and among FS Acquisitions Ltd., Skycure, Ltd. (“Skycure”), the shareholders named therein, Shareholder Representative Services LLC and us, we purchased all of the outstanding shares of Skycure in exchange for cash and shares of our common stock. The portion of the purchase price payable in the form of shares of our common stock (the “Deferred Payout”) is an amount equal to up to $21.1 million in shares and is payable to two former shareholders of Skycure (the “Sellers”). Subject to satisfaction of service conditions, these shares are payable in quarterly installments (the “Quarterly Payment”), the amounts of which are determined at the end of each quarterly period based on the average of the daily closing price per share of our common stock on The Nasdaq Global Select Market for the ten trading days immediately preceding the applicable payment date. The first Quarterly Payments will be issued to the Sellers in the third quarter of fiscal 2018.
The sale of the above securities were deemed to be exempt from registration under the Securities Act in reliance upon Section 4(a)(2) of the Securities Act (or Regulation D or Regulation S promulgated thereunder) as transactions by an issuer not involving any public offering.
(b) None.
(c) None.
32
Item 6. Exhibits
Exhibit Number | Incorporated by Reference | Filed with this 10-Q | ||||||||||
Exhibit Description | Form | File Number | Exhibit | File Date | ||||||||
2.01§ | X | |||||||||||
10.01* | X | |||||||||||
31.01 | X | |||||||||||
31.02 | X | |||||||||||
32.01† | X | |||||||||||
32.02† | X | |||||||||||
101.INS | XBRL Instance Document | X | ||||||||||
101.SCH | XBRL Taxonomy Schema Linkbase Document | X | ||||||||||
101.CAL | XBRL Taxonomy Calculation Linkbase Document | X | ||||||||||
101.DEF | XBRL Taxonomy Definition Linkbase Document | X | ||||||||||
101.LAB | XBRL Taxonomy Labels Linkbase Document | X | ||||||||||
101.PRE | XBRL Taxonomy Presentation Linkbase Document | X | ||||||||||
§ | The disclosure letters and related schedules are not being filed herewith. The Registrant agrees to furnish supplementally a copy of any such schedules to the Securities and Exchange Commission upon request. |
* | Indicates a management contract or compensatory plan or arrangement. |
† | This exhibit is being furnished rather than filed, and shall not be deemed incorporated by reference into any filing, in accordance with Item 601 of Regulation S-K. |
33
SIGNATURES
Pursuant to the requirements of the Securities Exchange Act of 1934, as amended, the Registrant has duly caused this report to be signed on its behalf by the undersigned, thereunto duly authorized.
SYMANTEC CORPORATION | ||
(Registrant) | ||
By: | /s/ Gregory S. Clark | |
Gregory S. Clark Chief Executive Officer and Director | ||
By: | /s/ Nicholas R. Noviello | |
Nicholas R. Noviello Executive Vice President and Chief Financial Officer | ||
November 3, 2017
34