Attached files
| file | filename |
|---|---|
| EX-99.1 - EX-99.1 - JANUS CAPITAL GROUP INC | a17-8912_3ex99d1.htm |
| 8-K - 8-K - JANUS CAPITAL GROUP INC | a17-8912_38k.htm |
Exhibit 99.2
First Quarter 2017 Earnings Presentation April 20, 2017 Dick Weil Chief Executive Officer Jennifer McPeek Chief Financial Officer

Forward-looking statements This communication contains “forward-looking statements” within the meaning of the federal securities laws, including Section 27A of the Securities Act of 1933, as amended, and Section 21E of the Securities Exchange Act of 1934, as amended. These forward-looking statements may include: management plans relating to the Transaction; the expected timing of the completion of the Transaction; the ability to complete the Transaction; the ability to obtain any required regulatory, shareholder or other approvals; any statements of the plans and objectives of management for future operations, products or services, including the execution of integration plans relating to the Transaction; any statements of expectation or belief; projections related to certain financial metrics; and any statements of assumptions underlying any of the foregoing. Forward-looking statements are typically identified by words such as “believe,” “expect,” “anticipate,” “intend,” “plan,” “seek,” “target,” “outlook,” “estimate,” “forecast,” “project” and other similar words and expressions, and variations or negatives of these words. Forward-looking statements by their nature address matters that are, to different degrees, subject to numerous assumptions, known and unknown risks and uncertainties, which change over time and are beyond our control. Forward-looking statements speak only as of the date they are made and investors and security holders are cautioned not to place undue reliance on any such forward-looking statements. Janus Capital Group Inc. (“Janus Capital Group”) does not assume any duty and does not undertake to update forward-looking statements, whether as a result of new information, future developments or otherwise, should circumstances change, nor does Janus Capital Group intend to do so, except as otherwise required by securities and other applicable laws. Because forward-looking statements are subject to assumptions and uncertainties, actual results or future events could differ, possibly materially, from those that Janus Capital Group anticipated in its forward-looking statements and future results could differ materially from historical performance. Factors that could cause or contribute to such differences include, but are not limited to, those included under Item 1A “Risk Factors” in Janus Capital Group’s Annual Report on Form 10-K and those disclosed in Janus Capital Group’s other periodic reports filed with the Securities and Exchange Commission (“SEC”), as well as the possibility: that expected benefits of the Transaction may not materialize in the timeframe expected or at all, or may be more costly to achieve; that the Transaction may not be timely completed, if at all; that prior to the completion of the Transaction or thereafter, Janus Capital Group’s businesses may not perform as expected due to transaction-related uncertainty or other factors; that the parties are unable to successfully implement integration strategies related to the Transaction; that required regulatory, shareholder or other approvals are not obtained or other customary closing conditions are not satisfied in a timely manner or at all; reputational risks and the reaction of the companies’ shareholders, customers, employees and other constituents to the Transaction; and diversion of management time on merger-related matters. All subsequent written and oral forward-looking statements concerning the proposed transaction or other matters attributable to Janus Capital Group or any other person acting on their behalf are expressly qualified in their entirety by the cautionary statements referenced above. For any forward-looking statements made in this communication or in any documents, Janus Capital Group claims the protection of the safe harbor for forward-looking statements contained in the Private Securities Litigation Reform Act of 1995. Annualized, pro forma, projected and estimated numbers are used for illustrative purposes only, are not forecasts and may not reflect actual results.
Additional information This communication is being made in respect of the proposed Transaction involving Janus Capital Group and Henderson Group plc (“Henderson Group”). This material is not a substitute for the definitive proxy statement or any other documents which Janus Capital Group and Henderson Group may send to their respective shareholders in connection with the proposed Transaction. This communication shall not constitute an offer to sell or the solicitation of an offer to buy any securities. In connection with the proposed Transaction, Henderson Group has filed and the SEC has declared effective, a definitive registration statement on Form F-4 that contains a proxy statement of Janus Capital Group and other documents regarding the proposed Transaction with the SEC. Before making any voting or investment decision, the respective investors and shareholders of Janus Capital Group and Henderson Group are urged to carefully read the entire registration statement of Henderson Group, including the proxy statement of Janus Capital Group, and any other relevant documents filed by either company with the SEC, as well as any amendments or supplements to those documents, because they will contain important information about Janus Capital Group, Henderson Group and the proposed Transaction. Investors and security holders are also urged to carefully review and consider each of Janus Capital Group’s public filings with the SEC, including but not limited to its Annual Reports on Form 10-K, its proxy statements, its Current Reports on Form 8-K and its Quarterly Reports on Form 10-Q. Copies of the proxy statement have been mailed to the shareholders of Janus Capital Group. Copies of the proxy statement also may be obtained free of charge at the SEC’s web site at http://www.sec.gov, or by directing a request to Janus Capital Group Inc. 151 Detroit Street, Denver, Colorado 80206. Participants in the Solicitation This communication shall not constitute an offer to sell or the solicitation of an offer to sell or the solicitation of an offer to buy any securities, nor shall there be any sale of securities in any jurisdiction in which such offer, solicitation or sale would be unlawful prior to registration or qualification under the securities laws of any such jurisdiction. No offer of securities shall be made except by means of a prospectus meeting the requirements of Section 10 of the Securities Act of 1933, as amended, and otherwise in accordance with applicable law.
Executive summary 1Q 2017 EPS of $0.17, adjusted 1Q 2017 EPS of $0.23, compared to 4Q 2016 EPS of $0.17 and adjusted 4Q 2016 EPS of $0.20(1) 1Q 2017 total company long-term net flows were $(4.7) billion, compared to net flows of $(0.3) billion in 4Q 2016, driven primarily by outflows from INTECH INTECH net flows during the quarter were $(3.8) billion, compared to $(1.6) billion in 4Q 2016; outflows in 1Q 2017 included two large outflows totaling $3.3 billion The U.S. Intermediary channel had 1Q 2017 Fundamental Equity net flows of $0.6 billion, a 7% organic growth rate, which compared favorably on a relative basis to meaningful outflows across the U.S. active equity mutual fund industry Perkins net flows were $0.2 billion in 1Q 2017, an organic growth rate of 6% Improved performance in fundamental equity strategies had a modest impact on performance fees Pending the upcoming shareholder vote on April 25th, the merger with Henderson remains on track for a May 30th closing Note: 1Q 2017 and 4Q 2016 adjusted EPS exclude $0.06 and $0.03 associated with merger-related expenses, respectively. See detail to non-GAAP adjustments on p. 23.
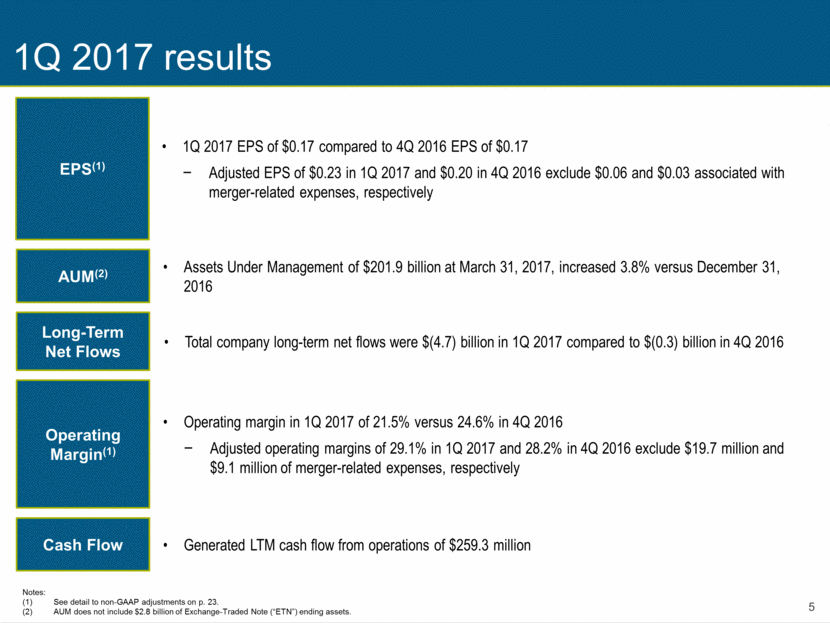
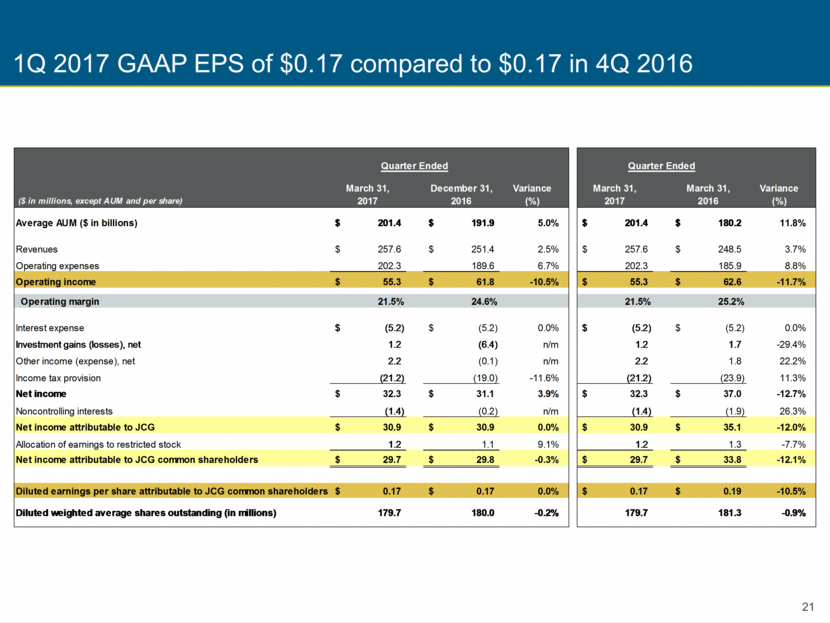
1Q 2017 results 1Q 2017 EPS of $0.17 compared to 4Q 2016 EPS of $0.17 Adjusted EPS of $0.23 in 1Q 2017 and $0.20 in 4Q 2016 exclude $0.06 and $0.03 associated with merger-related expenses, respectively Assets Under Management of $201.9 billion at March 31, 2017, increased 3.8% versus December 31, 2016 Operating margin in 1Q 2017 of 21.5% versus 24.6% in 4Q 2016 Adjusted operating margins of 29.1% in 1Q 2017 and 28.2% in 4Q 2016 exclude $19.7 million and $9.1 million of merger-related expenses, respectively Total company long-term net flows were $(4.7) billion in 1Q 2017 compared to $(0.3) billion in 4Q 2016 Generated LTM cash flow from operations of $259.3 million EPS(1) AUM(2) Long-Term Net Flows Operating Margin(1) Cash Flow Notes: See detail to non-GAAP adjustments on p. 23. AUM does not include $2.8 billion of Exchange-Traded Note (“ETN”) ending assets.
1Q 2017 Results Jennifer McPeek Chief Financial Officer
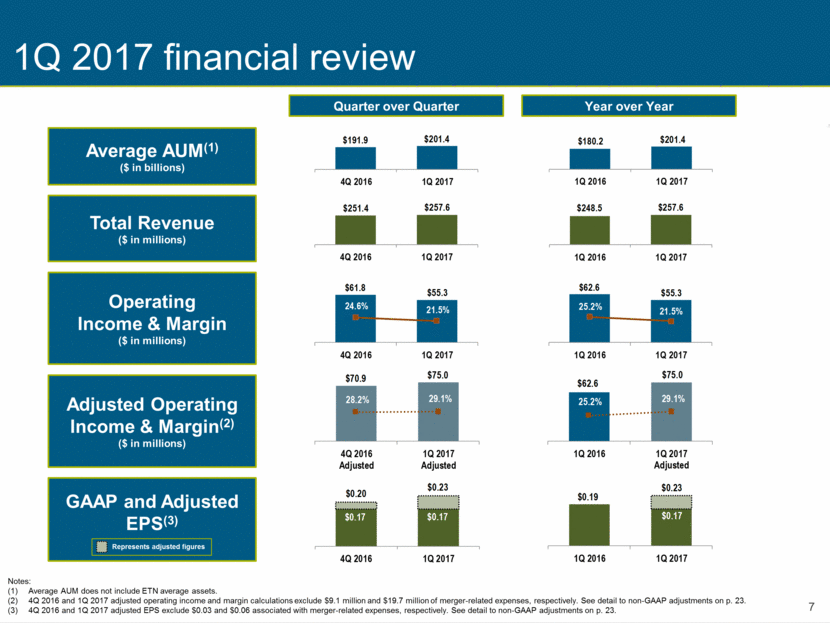
1Q 2017 financial review GAAP and Adjusted EPS(3) Average AUM(1) ($ in billions) Total Revenue ($ in millions) Operating Income & Margin ($ in millions) Quarter over Quarter Year over Year Notes: Average AUM does not include ETN average assets. 4Q 2016 and 1Q 2017 adjusted operating income and margin calculations exclude $9.1 million and $19.7 million of merger-related expenses, respectively. See detail to non-GAAP adjustments on p. 23. 4Q 2016 and 1Q 2017 adjusted EPS exclude $0.03 and $0.06 associated with merger-related expenses, respectively. See detail to non-GAAP adjustments on p. 23. Adjusted Operating Income & Margin(2) ($ in millions) Represents adjusted figures $0.17 $0.19 $0.23 1Q 2016 1Q 2017 $0.17 $0.17 $0.20 $0.23 4Q 2016 1Q 2017 $70.9 $75.0 28.2% 29.1% 4Q 2016 Adjusted 1Q 2017 Adjusted $62.6 $75.0 25.2% 29.1% 1Q 2016 1Q 2017 Adjusted $191.9 $201.4 4Q 2016 1Q 2017 $180.2 $201.4 1Q 2016 1Q 2017 $248.5 $257.6 1Q 2016 1Q 2017 $251.4 $257.6 4Q 2016 1Q 2017 $62.6 $55.3 25.2% 21.5% 1Q 2016 1Q 2017 $61.8 $55.3 24.6% 21.5% 4Q 2016 1Q 2017
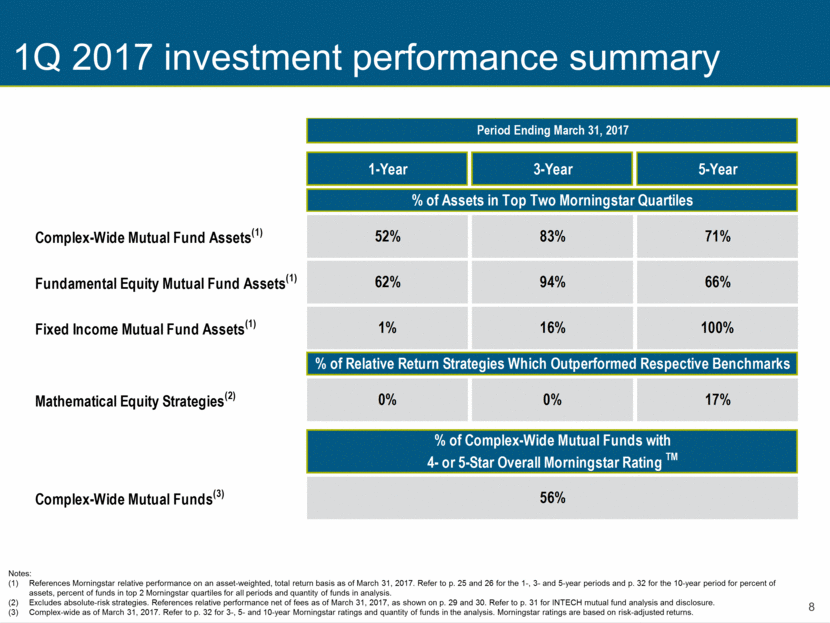
1Q 2017 investment performance summary Notes: References Morningstar relative performance on an asset-weighted, total return basis as of March 31, 2017. Refer to p. 25 and 26 for the 1-, 3- and 5-year periods and p. 32 for the 10-year period for percent of assets, percent of funds in top 2 Morningstar quartiles for all periods and quantity of funds in analysis. Excludes absolute-risk strategies. References relative performance net of fees as of March 31, 2017, as shown on p. 29 and 30. Refer to p. 31 for INTECH mutual fund analysis and disclosure. Complex-wide as of March 31, 2017. Refer to p. 32 for 3-, 5- and 10-year Morningstar ratings and quantity of funds in the analysis. Morningstar ratings are based on risk-adjusted returns. Period Ending March 31, 2017 1-Year 3-Year 5-Year % of Assets in Top Two Morningstar Quartiles Complex-Wide Mutual Fund Assets (1) 52% 83% 71% Fundamental Equity Mutual Fund Assets (1) 62% 94% 66% Fixed Income Mutual Fund Assets (1) 1% 16% 100% % of Relative Return Strategies Which Outperformed Respective Benchmarks Mathematical Equity Strategies (2) 0% 0% 17% % of Complex-Wide Mutual Funds with 4- or 5-Star Overall Morningstar Rating TM Complex-Wide Mutual Funds (3) 56%
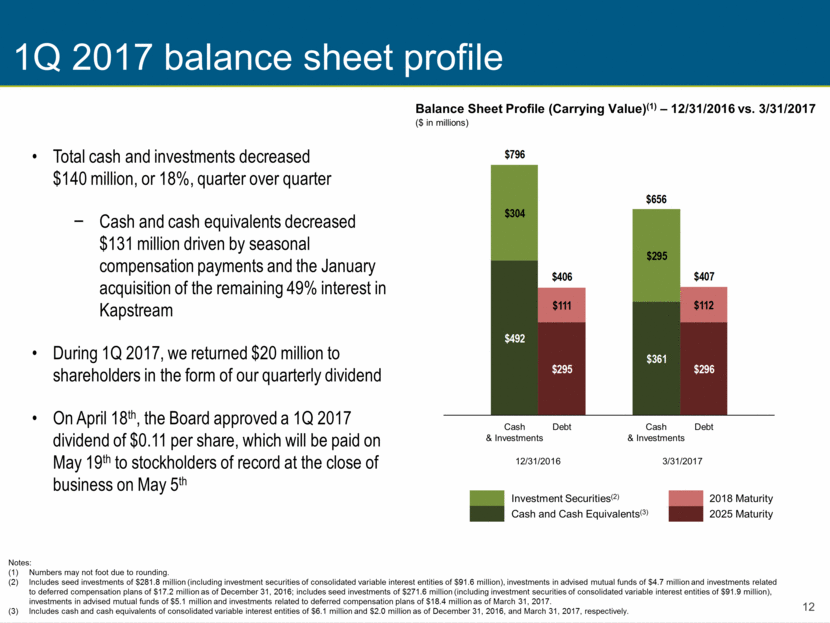
1Q 2017 long-term net flow summary Note: Long-term flows exclude money market and ETN flows. Annualized sales and redemption rates calculated as a percentage of beginning of period assets. 1Q 2017 gross sales and redemptions exclude an intra-strategy transfer of $1.6 billion from a Danish krone-denominated account into a U.S. dollar-denominated account. 22% 21% 17% 26% 24% Total Company Long-Term Flows(1,2) ($ in billions) Gross Redemptions Gross Sales Net Sales Annualized Redemption Rate Annualized Gross Sales Rate 18% 21% 20% 25% 25% 22% 20% 23% 24% 28% 18% 11% 5% 9% 13% 12% 17% 19% 22% 46% 33% 33% 24% 46% 31% 33% 30% 25% 37% 34% Fundamental Equity ($ in billions) Mathematical Equity(2) ($ in billions) Fixed Income ($ in billions) 22% 21% 22% 27% 34% $3.6 $3.7 $2.8 $5.5 $3.6 ($3.7) ($3.3) ($2.9) ($4.4) ($3.9) ($0.1) $0.4 ($0.1) $1.1 ($0.3) ($12) ($6) $0 $6 $12 1Q16 2Q16 3Q16 4Q16 1Q17 $2.1 $1.3 $0.6 $1.1 $1.5 ($1.4) ($2.0) ($2.4) ($2.7) ($5.3) $0.7 ($0.7) ($1.8) ($1.6) ($3.8) ($10) ($5) $0 $5 $10 1Q16 2Q16 3Q16 4Q16 1Q17 $4.3 $4.9 $4.8 $6.1 $6.2 ($5.2) ($4.6) ($5.3) ($5.9) ($6.8) ($0.9) $0.3 ($0.5) $0.2 ($0.6) ($20) ($10) $0 $10 $20 1Q16 2Q16 3Q16 4Q16 1Q17 $10.0 $9.9 $8.2 $12.7 $11.3 ($10.3) ($9.9) ($10.6) ($13.0) ($16.0) ($0.3) $0.0 ($2.4) ($0.3) ($4.7) ($32) ($16) $0 $16 $32 1Q16 2Q16 3Q16 4Q16 1Q17
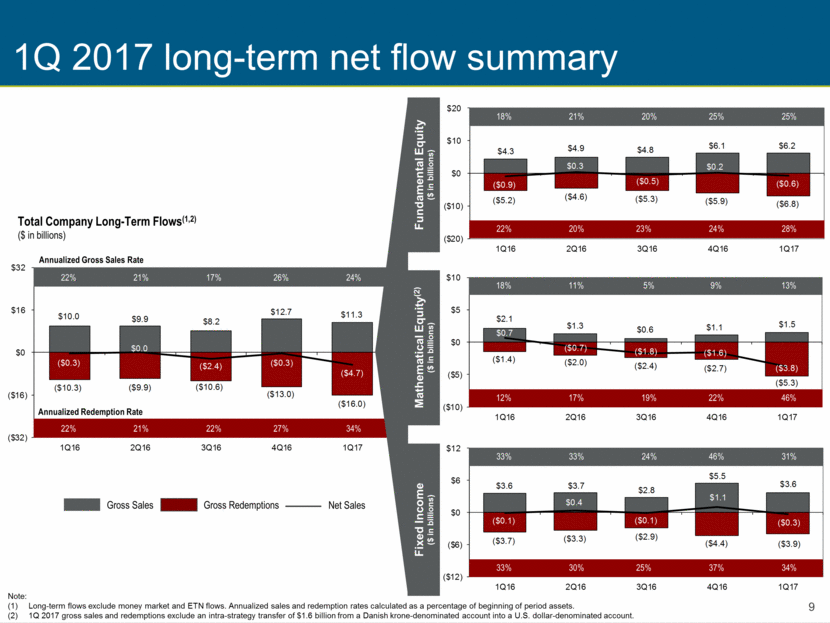
1Q 2017 total revenue Total Revenue ($ in millions) Note: Includes mutual fund and private account performance fees. (1) Management Fees Shareowner Servicing Fees and Other Performance Fees Total revenue improved 2.5% quarter over quarter The increase in management fees corresponded to a 5.0% increase in average AUM Mutual fund performance fees improved modestly due to stronger Fundamental Equity investment performance Separate account performance fees have declined in recent quarters, due primarily to underperformance in INTECH’s strategies $42.2 $41.5 ($14.1) ($13.7) $223.3 $229.8 $251.4 $257.6 4Q 2016 1Q 2017
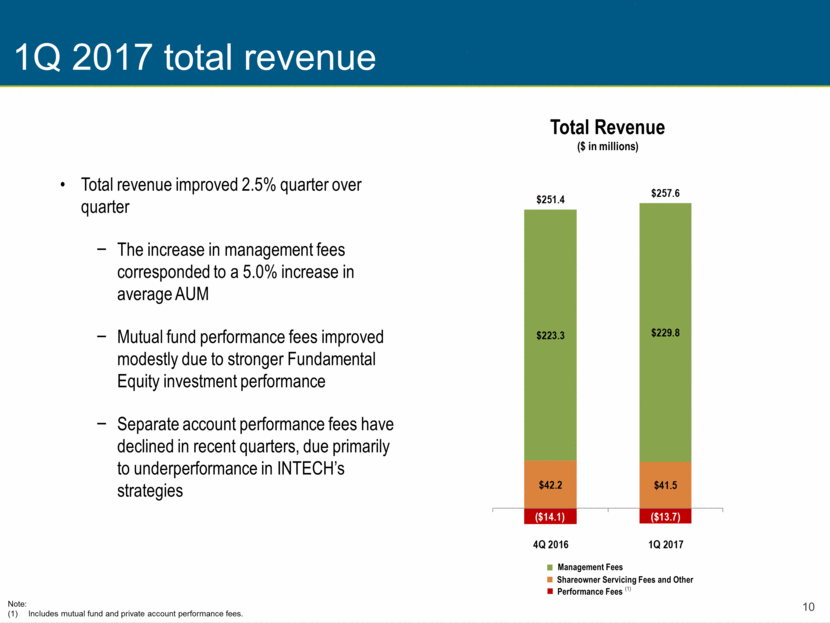
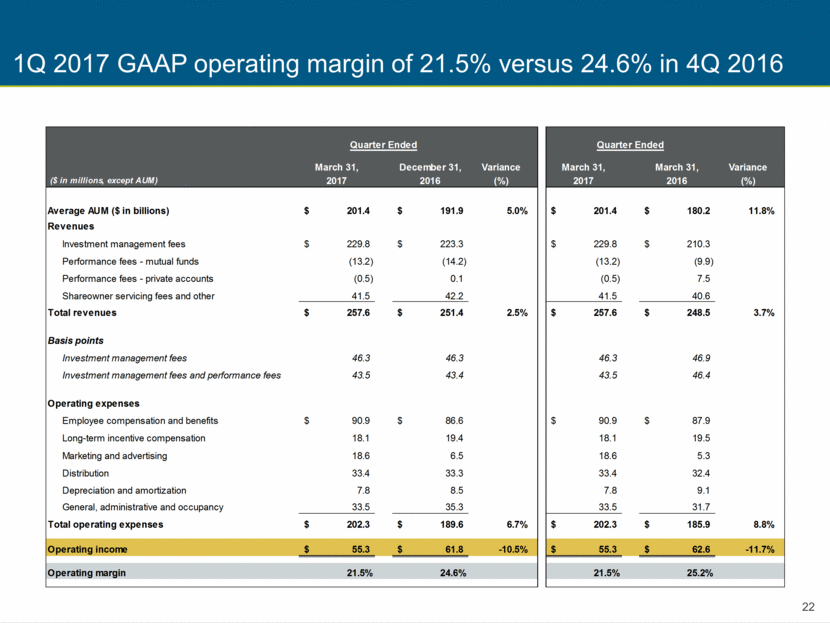
1Q 2017 operating expenses Operating Expenses ($ in millions) 1Q 2017 operating expenses increased 6.7% quarter over quarter Merger-related expenses were $19.7 million in 1Q 2017 compared to $9.1 million in the prior quarter; the increase was driven by $14.5 million of Marketing & Advertising expenses primarily due to the fund proxy Excluding merger costs, quarter-over-quarter operating expenses increased slightly primarily due to seasonal compensation payments 1Q 2017 adjusted operating margin, excluding merger-related expenses, of 29.1% improved from 28.2% in 4Q 2016(1) Notes: See detail to non-GAAP adjustments on p. 23. 2017 annual long-term incentive compensation is currently expected to be $75-80 million. (2) $79.9 $71.2 $17.7 $16.4 $8.2 $6.2 $39.6 $35.5 $8.4 $8.1 $28.4 $25.3 2Q 2011 3Q 2011 Employee Compensation & Benefits Long - Term Incentive Compensation Marketing & Advertising Distribution Depreciation & Amortization G&A $35.3 $33.5 $8.5 $7.8 $33.3 $33.4 $6.5 $18.6 $19.4 $18.1 $86.6 $90.9 $189.6 $202.3 4Q 2016 1Q 2017
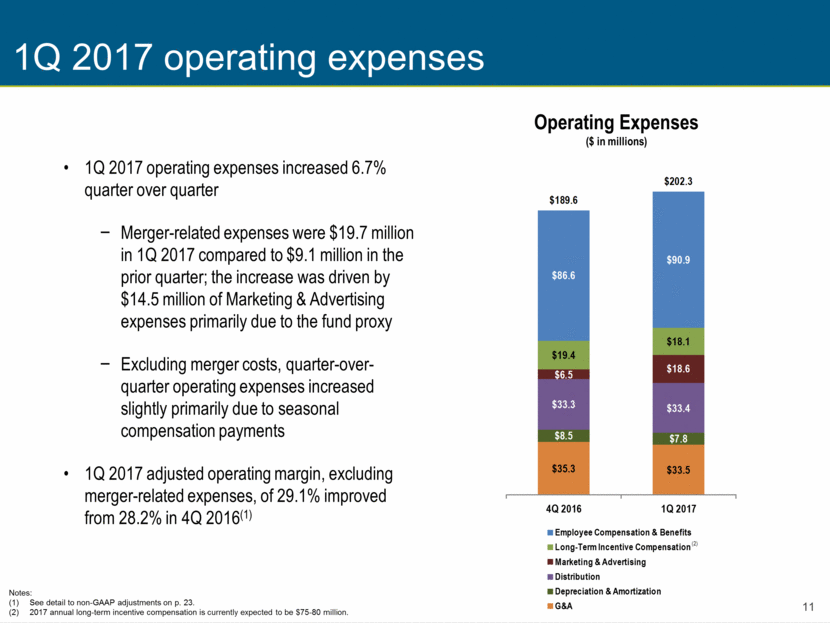
1Q 2017 balance sheet profile 3/31/2017 2018 Maturity Investment Securities(2) 12/31/2016 Cash & Investments Debt Debt Cash and Cash Equivalents(3) Notes: Numbers may not foot due to rounding. Includes seed investments of $281.8 million (including investment securities of consolidated variable interest entities of $91.6 million), investments in advised mutual funds of $4.7 million and investments related to deferred compensation plans of $17.2 million as of December 31, 2016; includes seed investments of $271.6 million (including investment securities of consolidated variable interest entities of $91.9 million), investments in advised mutual funds of $5.1 million and investments related to deferred compensation plans of $18.4 million as of March 31, 2017. Includes cash and cash equivalents of consolidated variable interest entities of $6.1 million and $2.0 million as of December 31, 2016, and March 31, 2017, respectively. 2025 Maturity Cash & Investments Balance Sheet Profile (Carrying Value)(1) – 12/31/2016 vs. 3/31/2017 ($ in millions) Total cash and investments decreased $140 million, or 18%, quarter over quarter Cash and cash equivalents decreased $131 million driven by seasonal compensation payments and the January acquisition of the remaining 49% interest in Kapstream During 1Q 2017, we returned $20 million to shareholders in the form of our quarterly dividend On April 18th, the Board approved a 1Q 2017 dividend of $0.11 per share, which will be paid on May 19th to stockholders of record at the close of business on May 5th $492 $361 $304 $295 $796 $656 $295 $296 $111 $112 $406 $407
Topics of Discussion Dick Weil Chief Executive Officer

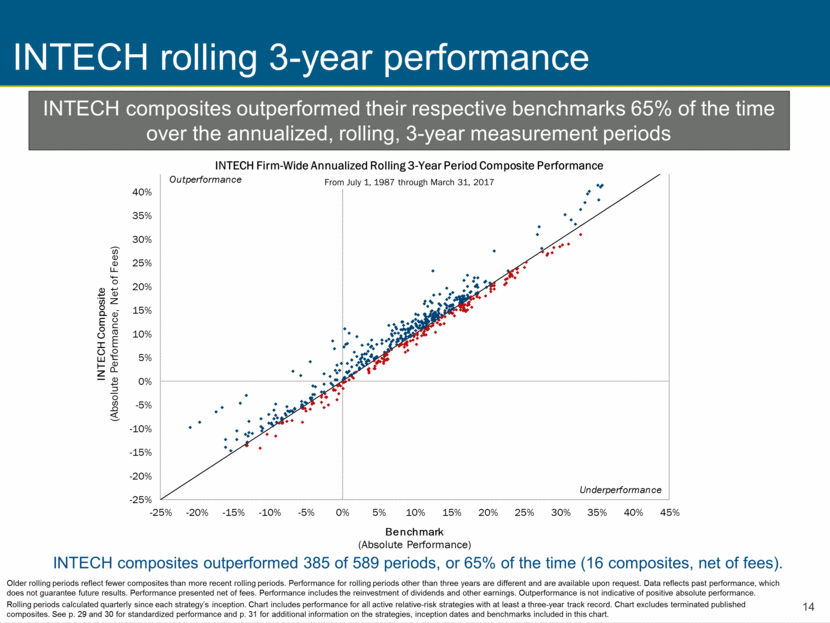
INTECH Firm-Wide Annualized Rolling 3-Year Period Composite Performance INTECH rolling 3-year performance Older rolling periods reflect fewer composites than more recent rolling periods. Performance for rolling periods other than three years are different and are available upon request. Data reflects past performance, which does not guarantee future results. Performance presented net of fees. Performance includes the reinvestment of dividends and other earnings. Outperformance is not indicative of positive absolute performance. Rolling periods calculated quarterly since each strategy’s inception. Chart includes performance for all active relative-risk strategies with at least a three-year track record. Chart excludes terminated published composites. See p. 29 and 30 for standardized performance and p. 31 for additional information on the strategies, inception dates and benchmarks included in this chart. INTECH composites outperformed their respective benchmarks 65% of the time over the annualized, rolling, 3-year measurement periods From July 1, 1987 through March 31, 2017 INTECH composites outperformed 385 of 589 periods, or 65% of the time (16 composites, net of fees). -25% -20% -15% -10% -5% 0% 5% 10% 15% 20% 25% 30% 35% 40% 45% -25% -20% -15% -10% -5% 0% 5% 10% 15% 20% 25% 30% 35% 40% 45% Benchmark (Absolute Performance) INTECH strategies outperformed 385 of 589 periods, or 65% of the time (16 composites, net of fees). Underperformance Outperformance INTECH Composite (Absolute Performance, Net of Fees) Annualized Rolling Three - Year Performance
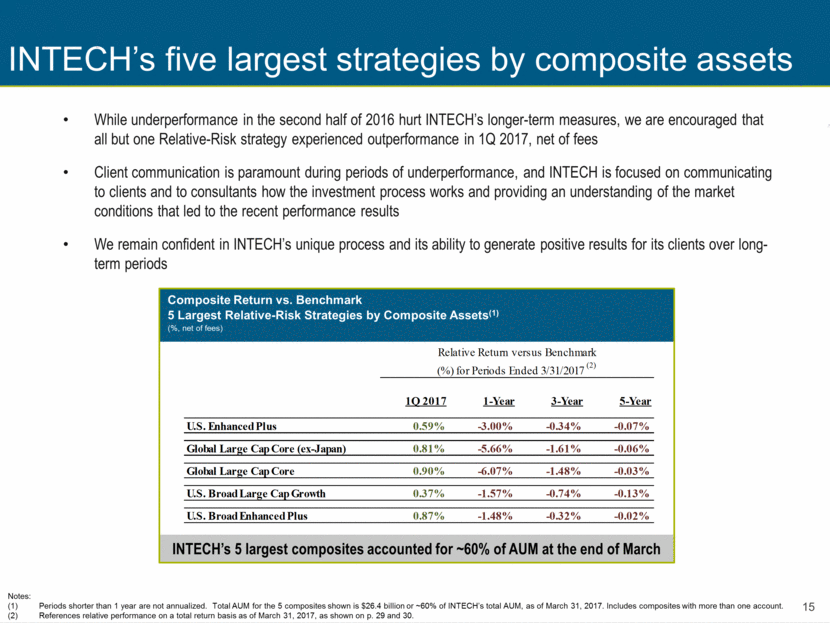
INTECH’s 5 largest composites accounted for ~60% of AUM at the end of March Composite Return vs. Benchmark 5 Largest Relative-Risk Strategies by Composite Assets(1) (%, net of fees) INTECH’s five largest strategies by composite assets While underperformance in the second half of 2016 hurt INTECH’s longer-term measures, we are encouraged that all but one Relative-Risk strategy experienced outperformance in 1Q 2017, net of fees Client communication is paramount during periods of underperformance, and INTECH is focused on communicating to clients and to consultants how the investment process works and providing an understanding of the market conditions that led to the recent performance results We remain confident in INTECH’s unique process and its ability to generate positive results for its clients over long-term periods Notes: Periods shorter than 1 year are not annualized. Total AUM for the 5 composites shown is $26.4 billion or ~60% of INTECH’s total AUM, as of March 31, 2017. Includes composites with more than one account. References relative performance on a total return basis as of March 31, 2017, as shown on p. 29 and 30. 1Q 2017 1-Year 3-Year 5-Year U.S. Enhanced Plus 0.59% -3.00% -0.34% -0.07% Global Large Cap Core (ex-Japan) 0.81% -5.66% -1.61% -0.06% Global Large Cap Core 0.90% -6.07% -1.48% -0.03% U.S. Broad Large Cap Growth 0.37% -1.57% -0.74% -0.13% U.S. Broad Enhanced Plus 0.87% -1.48% -0.32% -0.02% Relative Return versus Benchmark (%) for Periods Ended 3/31/2017 (2)
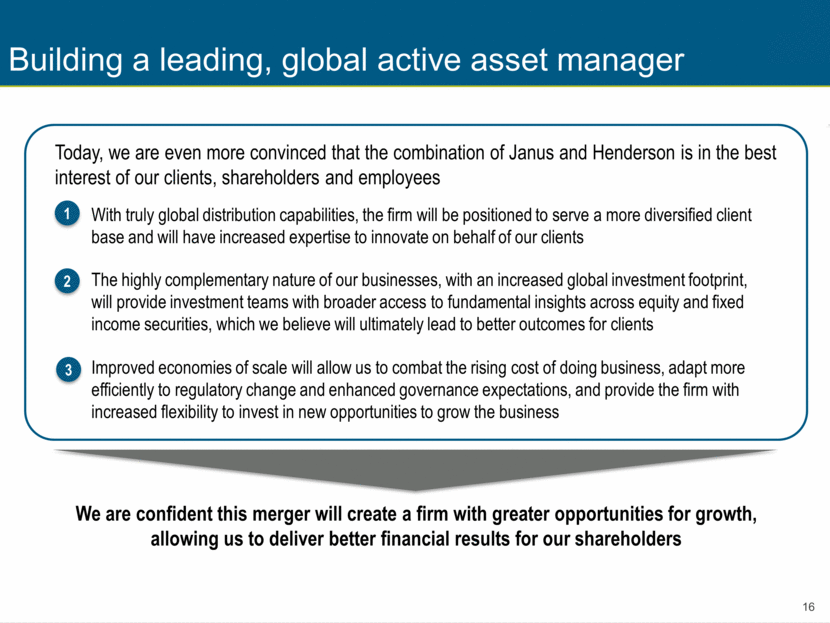
Building a leading, global active asset manager The highly complementary nature of our businesses, with an increased global investment footprint, will provide investment teams with broader access to fundamental insights across equity and fixed income securities, which we believe will ultimately lead to better outcomes for clients With truly global distribution capabilities, the firm will be positioned to serve a more diversified client base and will have increased expertise to innovate on behalf of our clients Improved economies of scale will allow us to combat the rising cost of doing business, adapt more efficiently to regulatory change and enhanced governance expectations, and provide the firm with increased flexibility to invest in new opportunities to grow the business Today, we are even more convinced that the combination of Janus and Henderson is in the best interest of our clients, shareholders and employees 2 1 3 We are confident this merger will create a firm with greater opportunities for growth, allowing us to deliver better financial results for our shareholders
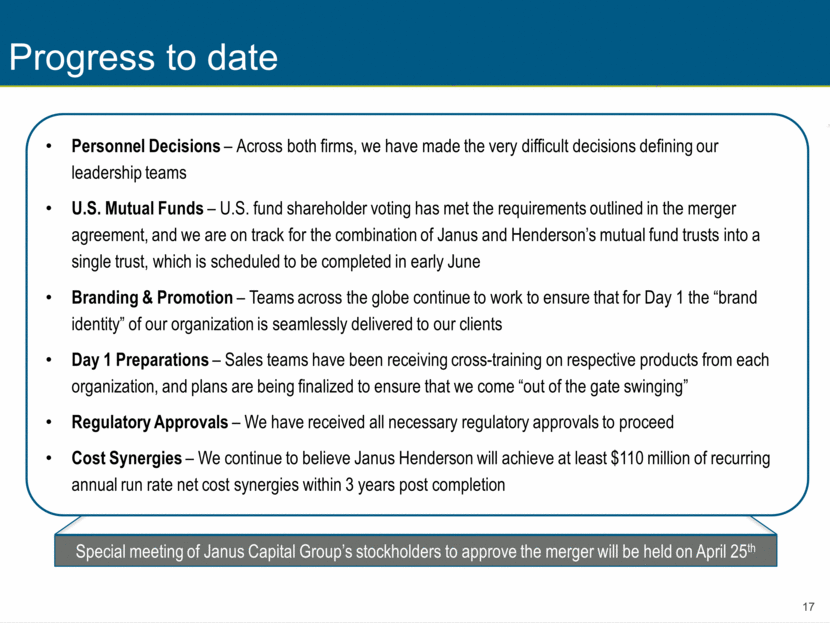
Special meeting of Janus Capital Group’s stockholders to approve the merger will be held on April 25th Progress to date Personnel Decisions – Across both firms, we have made the very difficult decisions defining our leadership teams U.S. Mutual Funds – U.S. fund shareholder voting has met the requirements outlined in the merger agreement, and we are on track for the combination of Janus and Henderson’s mutual fund trusts into a single trust, which is scheduled to be completed in early June Branding & Promotion – Teams across the globe continue to work to ensure that for Day 1 the “brand identity” of our organization is seamlessly delivered to our clients Day 1 Preparations – Sales teams have been receiving cross-training on respective products from each organization, and plans are being finalized to ensure that we come “out of the gate swinging” Regulatory Approvals – We have received all necessary regulatory approvals to proceed Cost Synergies – We continue to believe Janus Henderson will achieve at least $110 million of recurring annual run rate net cost synergies within 3 years post completion
Q&A Jennifer McPeek Chief Financial Officer Dick Weil Chief Executive Officer

Appendix
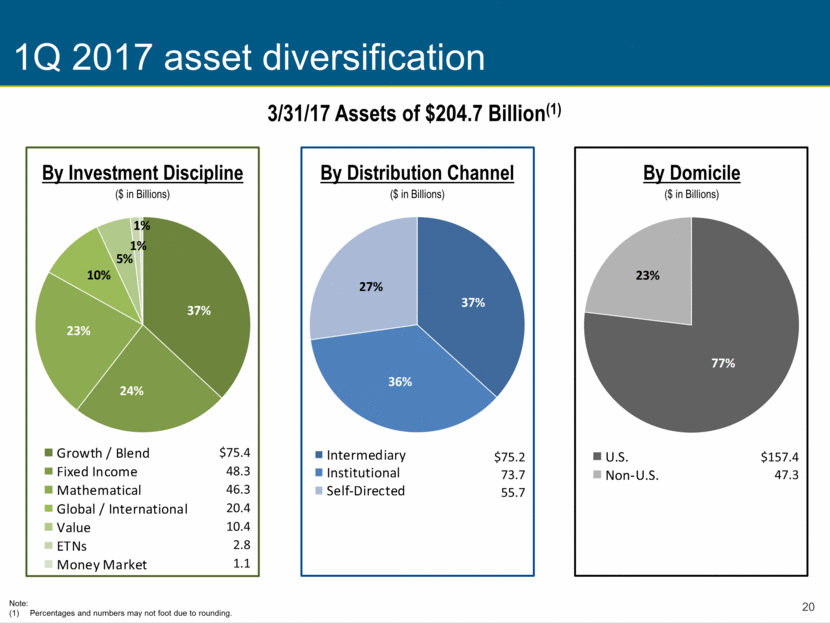
1Q 2017 asset diversification 3/31/17 Assets of $204.7 Billion(1) By Investment Discipline ($ in Billions) Note: Percentages and numbers may not foot due to rounding. By Distribution Channel ($ in Billions) By Domicile ($ in Billions) $75.4 48.3 46.3 20.4 10.4 2.8 1.1 $75.2 73.7 55.7 $157.4 47.3 37% 24% 23% 10% 5% 1% 1% Growth / Blend Fixed Income Mathematical Global / International Value ETNs Money Market 37% 36% 27% Intermediary Institutional Self-Directed 77% 23% U.S. Non-U.S.
1Q 2017 GAAP EPS of $0.17 compared to $0.17 in 4Q 2016 March 31, December 31, Variance March 31, March 31, Variance ($ in millions, except AUM and per share) 2017 2016 (%) 2017 2016 (%) Average AUM ($ in billions) 201.4 $ 191.9 $ 5.0% 201.4 $ 180.2 $ 11.8% Revenues 257.6 $ 251.4 $ 2.5% 257.6 $ 248.5 $ 3.7% Operating expenses 202.3 189.6 6.7% 202.3 185.9 8.8% Operating income 55.3 $ 61.8 $ -10.5% 55.3 $ 62.6 $ -11.7% Operating margin 21.5% 24.6% 21.5% 25.2% Interest expense (5.2) $ (5.2) $ 0.0% (5.2) $ (5.2) $ 0.0% Investment gains (losses), net 1.2 (6.4) n/m 1.2 1.7 -29.4% Other income (expense), net 2.2 (0.1) n/m 2.2 1.8 22.2% Income tax provision (21.2) (19.0) -11.6% (21.2) (23.9) 11.3% Net income 32.3 $ 31.1 $ 3.9% 32.3 $ 37.0 $ -12.7% Noncontrolling interests (1.4) (0.2) n/m (1.4) (1.9) 26.3% Net income attributable to JCG 30.9 $ 30.9 $ 0.0% 30.9 $ 35.1 $ -12.0% Allocation of earnings to restricted stock 1.2 1.1 9.1% 1.2 1.3 -7.7% Net income attributable to JCG common shareholders 29.7 $ 29.8 $ -0.3% 29.7 $ 33.8 $ -12.1% Diluted earnings per share attributable to JCG common shareholders 0.17 $ 0.17 $ 0.0% 0.17 $ 0.19 $ -10.5% Diluted weighted average shares outstanding (in millions) 179.7 180.0 -0.2% 179.7 181.3 -0.9% Quarter Ended Quarter Ended
1Q 2017 GAAP operating margin of 21.5% versus 24.6% in 4Q 2016 March 31, December 31, Variance March 31, March 31, Variance ($ in millions, except AUM) 2017 2016 (%) 2017 2016 (%) Average AUM ($ in billions) 201.4 $ 191.9 $ 5.0% 201.4 $ 180.2 $ 11.8% Revenues Investment management fees 229.8 $ 223.3 $ 229.8 $ 210.3 $ Performance fees - mutual funds (13.2) (14.2) (13.2) (9.9) Performance fees - private accounts (0.5) 0.1 (0.5) 7.5 Shareowner servicing fees and other 41.5 42.2 41.5 40.6 Total revenues 257.6 $ 251.4 $ 2.5% 257.6 $ 248.5 $ 3.7% Basis points Investment management fees 46.3 46.3 46.3 46.9 Investment management fees and performance fees 43.5 43.4 43.5 46.4 Operating expenses Employee compensation and benefits 90.9 $ 86.6 $ 90.9 $ 87.9 $ Long-term incentive compensation 18.1 19.4 18.1 19.5 Marketing and advertising 18.6 6.5 18.6 5.3 Distribution 33.4 33.3 33.4 32.4 Depreciation and amortization 7.8 8.5 7.8 9.1 General, administrative and occupancy 33.5 35.3 33.5 31.7 Total operating expenses 202.3 $ 189.6 $ 6.7% 202.3 $ 185.9 $ 8.8% Operating income 55.3 $ 61.8 $ -10.5% 55.3 $ 62.6 $ -11.7% Operating margin 21.5% 24.6% 21.5% 25.2% Quarter Ended Quarter Ended
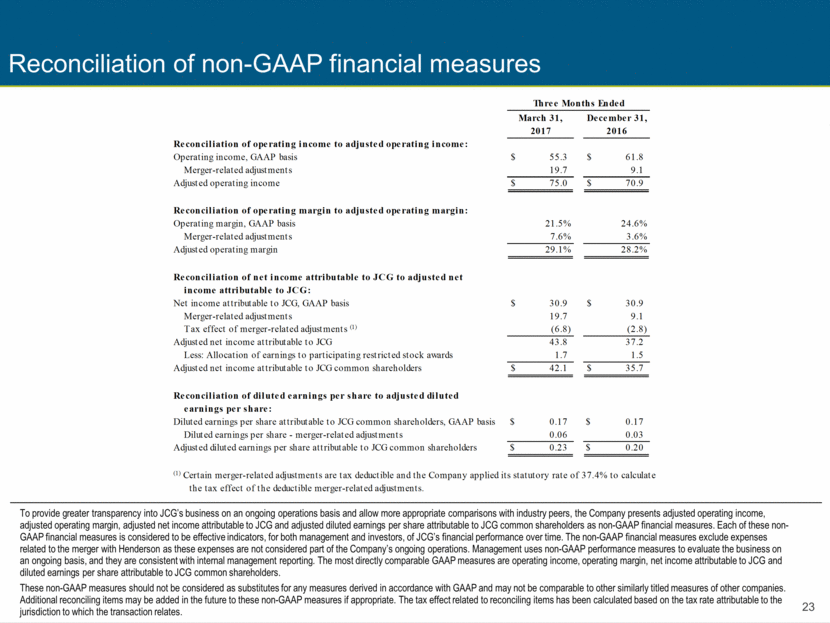
Reconciliation of non-GAAP financial measures To provide greater transparency into JCG’s business on an ongoing operations basis and allow more appropriate comparisons with industry peers, the Company presents adjusted operating income, adjusted operating margin, adjusted net income attributable to JCG and adjusted diluted earnings per share attributable to JCG common shareholders as non-GAAP financial measures. Each of these non-GAAP financial measures is considered to be effective indicators, for both management and investors, of JCG’s financial performance over time. The non-GAAP financial measures exclude expenses related to the merger with Henderson as these expenses are not considered part of the Company’s ongoing operations. Management uses non-GAAP performance measures to evaluate the business on an ongoing basis, and they are consistent with internal management reporting. The most directly comparable GAAP measures are operating income, operating margin, net income attributable to JCG and diluted earnings per share attributable to JCG common shareholders. These non-GAAP measures should not be considered as substitutes for any measures derived in accordance with GAAP and may not be comparable to other similarly titled measures of other companies. Additional reconciling items may be added in the future to these non-GAAP measures if appropriate. The tax effect related to reconciling items has been calculated based on the tax rate attributable to the jurisdiction to which the transaction relates. Reconciliation of operating income to adjusted operating income: Operating income, GAAP basis $ 55.3 $ 61.8 Merger-related adjustments 19.7 9.1 Adjusted operating income $ 75.0 $ 70.9 Reconciliation of operating margin to adjusted operating margin: Operating margin, GAAP basis 21.5% 24.6% Merger-related adjustments 7.6% 3.6% Adjusted operating margin 29.1% 28.2% Reconciliation of net income attributable to JCG to adjusted net income attributable to JCG: Net income attributable to JCG, GAAP basis $ 30.9 $ 30.9 Merger-related adjustments 19.7 9.1 Tax effect of merger-related adjustments (1) (6.8) (2.8) Adjusted net income attributable to JCG 43.8 37.2 Less: Allocation of earnings to participating restricted stock awards 1.7 1.5 Adjusted net income attributable to JCG common shareholders $ 42.1 $ 35.7 Reconciliation of diluted earnings per share to adjusted diluted earnings per share: Diluted earnings per share attributable to JCG common shareholders, GAAP basis $ 0.17 $ 0.17 Diluted earnings per share - merger-related adjustments 0.06 0.03 Adjusted diluted earnings per share attributable to JCG common shareholders $ 0.23 $ 0.20 the tax effect of the deductible merger-related adjustments. Three Months Ended March 31, December 31, 2017 2016 (1) Certain merger-related adjustments are tax deductible and the Company applied its statutory rate of 37.4% to calculate
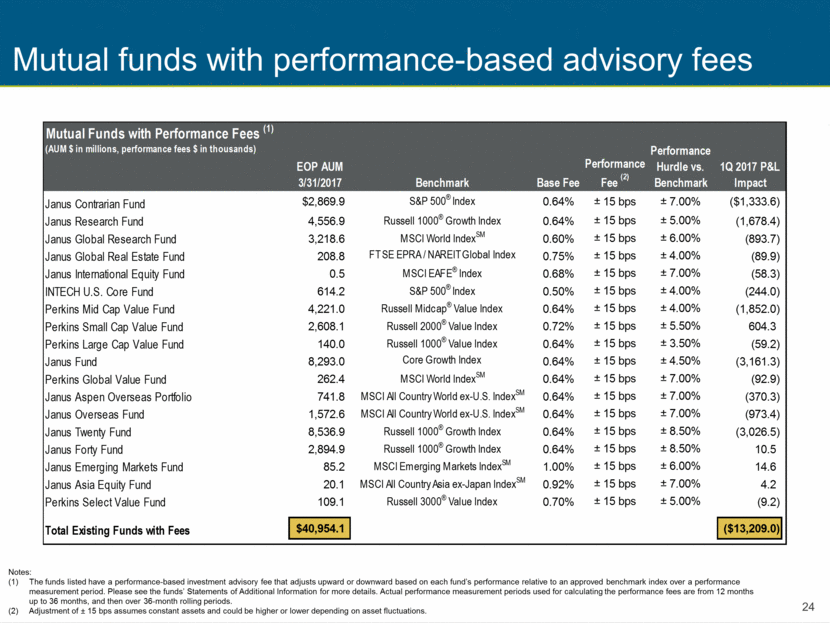
Mutual funds with performance-based advisory fees Notes: The funds listed have a performance-based investment advisory fee that adjusts upward or downward based on each fund’s performance relative to an approved benchmark index over a performance measurement period. Please see the funds’ Statements of Additional Information for more details. Actual performance measurement periods used for calculating the performance fees are from 12 months up to 36 months, and then over 36-month rolling periods. Adjustment of ± 15 bps assumes constant assets and could be higher or lower depending on asset fluctuations. Mutual Funds with Performance Fees (1) (AUM $ in millions, performance fees $ in thousands) EOP AUM 3/31/2017 Benchmark Base Fee Performance Fee (2) Performance Hurdle vs. Benchmark 1Q 2017 P&L Impact Janus Contrarian Fund $2,869.9 S&P 500 ® Index 0.64% ± 15 bps ± 7.00% ($1,333.6) Janus Research Fund 4,556.9 Russell 1000 ® Growth Index 0.64% ± 15 bps ± 5.00% (1,678.4) Janus Global Research Fund 3,218.6 MSCI World Index SM 0.60% ± 15 bps ± 6.00% (893.7) Janus Global Real Estate Fund 208.8 FTSE EPRA / NAREITGlobal Index 0.75% ± 15 bps ± 4.00% (89.9) Janus International Equity Fund 0.5 MSCI EAFE ® Index 0.68% ± 15 bps ± 7.00% (58.3) INTECH U.S. Core Fund 614.2 S&P 500 ® Index 0.50% ± 15 bps ± 4.00% (244.0) Perkins Mid Cap Value Fund 4,221.0 Russell Midcap ® Value Index 0.64% ± 15 bps ± 4.00% (1,852.0) Perkins Small Cap Value Fund 2,608.1 Russell 2000 ® Value Index 0.72% ± 15 bps ± 5.50% 604.3 Perkins Large Cap Value Fund 140.0 Russell 1000 ® Value Index 0.64% ± 15 bps ± 3.50% (59.2) Janus Fund 8,293.0 Core Growth Index 0.64% ± 15 bps ± 4.50% (3,161.3) Perkins Global Value Fund 262.4 MSCI World Index SM 0.64% ± 15 bps ± 7.00% (92.9) Janus Aspen Overseas Portfolio 741.8 MSCI All Country World ex-U.S. Index SM 0.64% ± 15 bps ± 7.00% (370.3) Janus Overseas Fund 1,572.6 MSCI All Country World ex-U.S. Index SM 0.64% ± 15 bps ± 7.00% (973.4) Janus Twenty Fund 8,536.9 Russell 1000 ® Growth Index 0.64% ± 15 bps ± 8.50% (3,026.5) Janus Forty Fund 2,894.9 Russell 1000 ® Growth Index 0.64% ± 15 bps ± 8.50% 10.5 Janus Emerging Markets Fund 85.2 MSCI Emerging Markets Index SM 1.00% ± 15 bps ± 6.00% 14.6 Janus Asia Equity Fund 20.1 MSCI All Country Asia ex-Japan Index SM 0.92% ± 15 bps ± 7.00% 4.2 Perkins Select Value Fund 109.1 Russell 3000 ® Value Index 0.70% ± 15 bps ± 5.00% (9.2) Total Existing Funds with Fees $40,954.1 ($13,209.0)
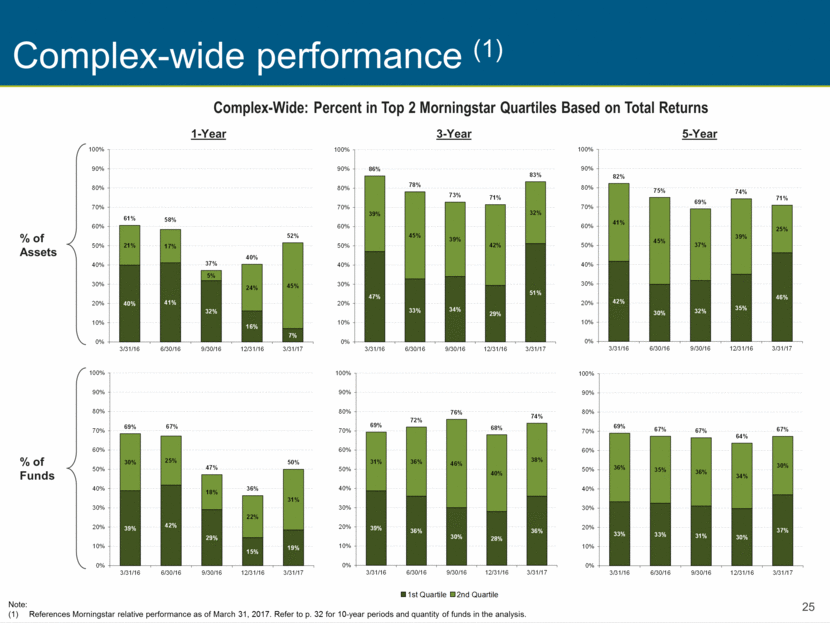
Complex-Wide: Percent in Top 2 Morningstar Quartiles Based on Total Returns 1-Year 3-Year 5-Year % of Funds % of Assets Complex-wide performance (1) Note: References Morningstar relative performance as of March 31, 2017. Refer to p. 32 for 10-year periods and quantity of funds in the analysis. 46% 61% 63% 61% 48% 24% 27% 31% 33% 39% 88% 94% 88% 94% 71% 0% 10% 20% 30% 40% 50% 60% 70% 80% 90% 100% 3/31/09 6/30/09 9/30/09 12/31/09 3/31/10 Percent of Janus Managed Equity JIF Funds . 1st Quartile 2nd Quartile 46% 61% 63% 61% 48% 24% 27% 31% 33% 39% 88% 94% 88% 94% 71% 0% 10% 20% 30% 40% 50% 60% 70% 80% 90% 100% 3/31/09 6/30/09 9/30/09 12/31/09 3/31/10 Percent of Janus Managed Equity JIF Funds . 1st Quartile 2nd Quartile 39% 42% 29% 15% 19% 30% 25% 18% 22% 31% 69% 67% 47% 36% 50% 0% 10% 20% 30% 40% 50% 60% 70% 80% 90% 100% 3/31/16 6/30/16 9/30/16 12/31/16 3/31/17 39% 36% 30% 28% 36% 31% 36% 46% 40% 38% 69% 72% 76% 68% 74% 0% 10% 20% 30% 40% 50% 60% 70% 80% 90% 100% 3/31/16 6/30/16 9/30/16 12/31/16 3/31/17 33% 33% 31% 30% 37% 36% 35% 36% 34% 30% 69% 67% 67% 64% 67% 0% 10% 20% 30% 40% 50% 60% 70% 80% 90% 100% 3/31/16 6/30/16 9/30/16 12/31/16 3/31/17 40% 41% 32% 16% 7% 21% 17% 5% 24% 45% 61% 58% 37% 40% 52% 0% 10% 20% 30% 40% 50% 60% 70% 80% 90% 100% 3/31/16 6/30/16 9/30/16 12/31/16 3/31/17 47% 33% 34% 29% 51% 39% 45% 39% 42% 32% 86% 78% 73% 71% 83% 0% 10% 20% 30% 40% 50% 60% 70% 80% 90% 100% 3/31/16 6/30/16 9/30/16 12/31/16 3/31/17 42% 30% 32% 35% 46% 41% 45% 37% 39% 25% 82% 75% 69% 74% 71% 0% 10% 20% 30% 40% 50% 60% 70% 80% 90% 100% 3/31/16 6/30/16 9/30/16 12/31/16 3/31/17
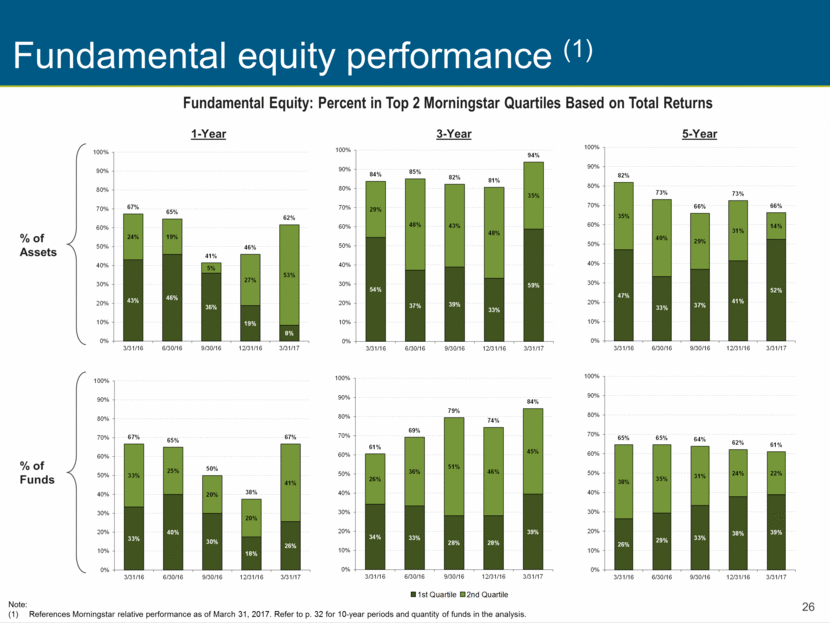
Fundamental Equity: Percent in Top 2 Morningstar Quartiles Based on Total Returns Fundamental equity performance (1) 1-Year 3-Year 5-Year % of Funds % of Assets Note: References Morningstar relative performance as of March 31, 2017. Refer to p. 32 for 10-year periods and quantity of funds in the analysis. 46% 61% 63% 61% 48% 24% 27% 31% 33% 39% 88% 94% 88% 94% 71% 0% 10% 20% 30% 40% 50% 60% 70% 80% 90% 100% 3/31/09 6/30/09 9/30/09 12/31/09 3/31/10 Percent of Janus Managed Equity JIF Funds . 1st Quartile 2nd Quartile 33% 40% 30% 18% 26% 33% 25% 20% 20% 41% 67% 65% 50% 38% 67% 0% 10% 20% 30% 40% 50% 60% 70% 80% 90% 100% 3/31/16 6/30/16 9/30/16 12/31/16 3/31/17 34% 33% 28% 28% 39% 26% 36% 51% 46% 45% 61% 69% 79% 74% 84% 0% 10% 20% 30% 40% 50% 60% 70% 80% 90% 100% 3/31/16 6/30/16 9/30/16 12/31/16 3/31/17 26% 29% 33% 38% 39% 38% 35% 31% 24% 22% 65% 65% 64% 62% 61% 0% 10% 20% 30% 40% 50% 60% 70% 80% 90% 100% 3/31/16 6/30/16 9/30/16 12/31/16 3/31/17 43% 46% 36% 19% 8% 24% 19% 5% 27% 53% 67% 65% 41% 46% 62% 0% 10% 20% 30% 40% 50% 60% 70% 80% 90% 100% 3/31/16 6/30/16 9/30/16 12/31/16 3/31/17 54% 37% 39% 33% 59% 29% 48% 43% 48% 35% 84% 85% 82% 81% 94% 0% 10% 20% 30% 40% 50% 60% 70% 80% 90% 100% 3/31/16 6/30/16 9/30/16 12/31/16 3/31/17 47% 33% 37% 41% 52% 35% 40% 29% 31% 14% 82% 73% 66% 73% 66% 0% 10% 20% 30% 40% 50% 60% 70% 80% 90% 100% 3/31/16 6/30/16 9/30/16 12/31/16 3/31/17
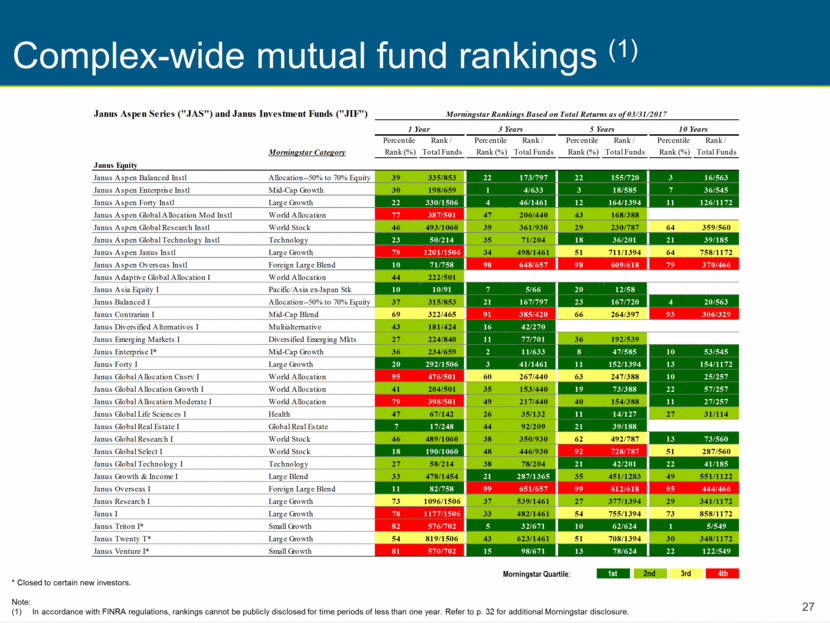
Complex-wide mutual fund rankings (1) Morningstar Quartile: 1st 2nd 3rd 4th * Closed to certain new investors. Note: In accordance with FINRA regulations, rankings cannot be publicly disclosed for time periods of less than one year. Refer to p. 32 for additional Morningstar disclosure. Janus Aspen Series ("JAS") and Janus Investment Funds ("JIF") Percentile Rank / Percentile Rank / Percentile Rank / Percentile Rank / Morningstar Category Rank (%) Total Funds Rank (%) Total Funds Rank (%) Total Funds Rank (%) Total Funds Janus Equity Janus Aspen Balanced Instl Allocation--50% to 70% Equity 39 335/853 22 173/797 22 155/720 3 16/563 Janus Aspen Enterprise Instl Mid-Cap Growth 30 198/659 1 4/633 3 18/585 7 36/545 Janus Aspen Forty Instl Large Growth 22 330/1506 4 46/1461 12 164/1394 11 126/1172 Janus Aspen Global Allocation Mod Instl World Allocation 77 387/501 47 206/440 43 168/388 / Janus Aspen Global Research Instl World Stock 46 493/1060 39 361/930 29 230/787 64 359/560 Janus Aspen Global Technology Instl Technology 23 50/214 35 71/204 18 36/201 21 39/185 Janus Aspen Janus Instl Large Growth 79 1201/1506 34 498/1461 51 711/1394 64 758/1172 Janus Aspen Overseas Instl Foreign Large Blend 10 71/758 98 648/657 98 609/618 79 370/466 Janus Adaptive Global Allocation I World Allocation 44 222/501 / / / Janus Asia Equity I Pacific/Asia ex-Japan Stk 10 10/91 7 5/66 20 12/58 / Janus Balanced I Allocation--50% to 70% Equity 37 315/853 21 167/797 23 167/720 4 20/563 Janus Contrarian I Mid-Cap Blend 69 322/465 91 385/420 66 264/397 93 306/329 Janus Diversified Alternatives I Multialternative 43 181/424 16 42/270 / / Janus Emerging Markets I Diversified Emerging Mkts 27 224/840 11 77/701 36 192/539 / Janus Enterprise I* Mid-Cap Growth 36 234/659 2 11/633 8 47/585 10 53/545 Janus Forty I Large Growth 20 292/1506 3 41/1461 11 152/1394 13 154/1172 Janus Global Allocation Cnsrv I World Allocation 95 476/501 60 267/440 63 247/388 10 25/257 Janus Global Allocation Growth I World Allocation 41 204/501 35 153/440 19 73/388 22 57/257 Janus Global Allocation Moderate I World Allocation 79 398/501 49 217/440 40 154/388 11 27/257 Janus Global Life Sciences I Health 47 67/142 26 35/132 11 14/127 27 31/114 Janus Global Real Estate I Global Real Estate 7 17/248 44 92/209 21 39/188 / Janus Global Research I World Stock 46 489/1060 38 350/930 62 492/787 13 73/560 Janus Global Select I World Stock 18 190/1060 48 446/930 92 728/787 51 287/560 Janus Global Technology I Technology 27 58/214 38 78/204 21 42/201 22 41/185 Janus Growth & Income I Large Blend 33 478/1454 21 287/1365 35 451/1283 49 551/1122 Janus Overseas I Foreign Large Blend 11 82/758 99 651/657 99 612/618 95 444/466 Janus Research I Large Growth 73 1096/1506 37 539/1461 27 377/1394 29 341/1172 Janus I Large Growth 78 1177/1506 33 482/1461 54 755/1394 73 858/1172 Janus Triton I* Small Growth 82 576/702 5 32/671 10 62/624 1 5/549 Janus Twenty T* Large Growth 54 819/1506 43 623/1461 51 708/1394 30 348/1172 Janus Venture I* Small Growth 81 570/702 15 98/671 13 78/624 22 122/549 Morningstar Rankings Based on Total Returns as of 03/31/2017 3 Years 1 Year 5 Years 10 Years
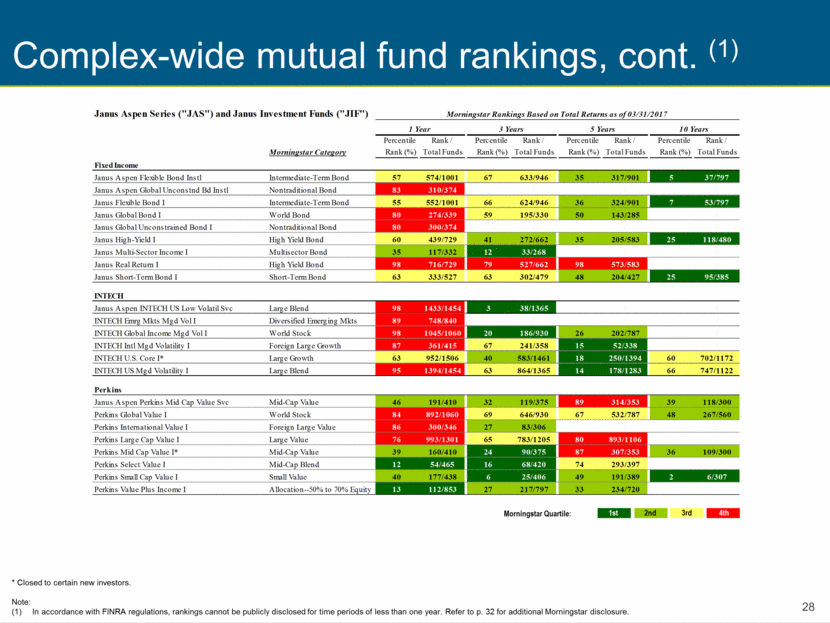
Complex-wide mutual fund rankings, cont. (1) Morningstar Quartile: 1st 2nd 3rd 4th * Closed to certain new investors. Note: In accordance with FINRA regulations, rankings cannot be publicly disclosed for time periods of less than one year. Refer to p. 32 for additional Morningstar disclosure. Janus Aspen Series ("JAS") and Janus Investment Funds ("JIF") Percentile Rank / Percentile Rank / Percentile Rank / Percentile Rank / Morningstar Category Rank (%) Total Funds Rank (%) Total Funds Rank (%) Total Funds Rank (%) Total Funds Fixed Income Janus Aspen Flexible Bond Instl Intermediate-Term Bond 57 574/1001 67 633/946 35 317/901 5 37/797 Janus Aspen Global Unconstnd Bd Instl Nontraditional Bond 83 310/374 / / / Janus Flexible Bond I Intermediate-Term Bond 55 552/1001 66 624/946 36 324/901 7 53/797 Janus Global Bond I World Bond 80 274/339 59 195/330 50 143/285 / Janus Global Unconstrained Bond I Nontraditional Bond 80 300/374 / / / Janus High-Yield I High Yield Bond 60 439/729 41 272/662 35 205/583 25 118/480 Janus Multi-Sector Income I Multisector Bond 35 117/332 12 33/268 / / Janus Real Return I High Yield Bond 98 716/729 79 527/662 98 573/583 / Janus Short-Term Bond I Short-Term Bond 63 333/527 63 302/479 48 204/427 25 95/385 INTECH Janus Aspen INTECH US Low Volatil Svc Large Blend 98 1433/1454 3 38/1365 / / INTECH Emrg Mkts Mgd Vol I Diversified Emerging Mkts 89 748/840 / / / INTECH Global Income Mgd Vol I World Stock 98 1045/1060 20 186/930 26 202/787 / INTECH Intl Mgd Volatility I Foreign Large Growth 87 361/415 67 241/358 15 52/338 / INTECH U.S. Core I* Large Growth 63 952/1506 40 583/1461 18 250/1394 60 702/1172 INTECH US Mgd Volatility I Large Blend 95 1394/1454 63 864/1365 14 178/1283 66 747/1122 Perkins Janus Aspen Perkins Mid Cap Value Svc Mid-Cap Value 46 191/410 32 119/375 89 314/353 39 118/300 Perkins Global Value I World Stock 84 892/1060 69 646/930 67 532/787 48 267/560 Perkins International Value I Foreign Large Value 86 300/346 27 83/306 / / Perkins Large Cap Value I Large Value 76 993/1301 65 783/1205 80 893/1106 / Perkins Mid Cap Value I* Mid-Cap Value 39 160/410 24 90/375 87 307/353 36 109/300 Perkins Select Value I Mid-Cap Blend 12 54/465 16 68/420 74 293/397 Perkins Small Cap Value I Small Value 40 177/438 6 25/406 49 191/389 2 6/307 Perkins Value Plus Income I Allocation--50% to 70% Equity 13 112/853 27 217/797 33 234/720 Morningstar Rankings Based on Total Returns as of 03/31/2017 1 Year 3 Years 5 Years 10 Years
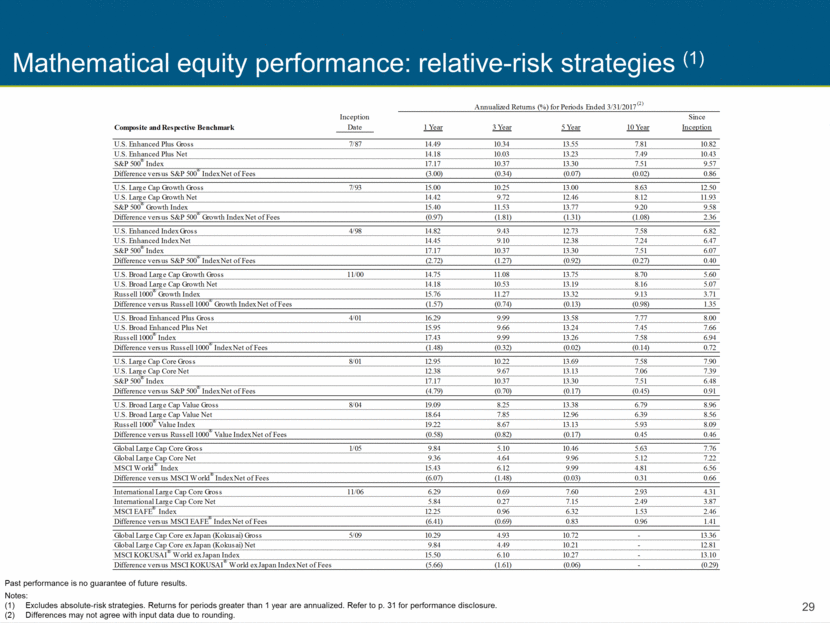
Mathematical equity performance: relative-risk strategies (1) Past performance is no guarantee of future results. Notes: Excludes absolute-risk strategies. Returns for periods greater than 1 year are annualized. Refer to p. 31 for performance disclosure. Differences may not agree with input data due to rounding. Inception Since Composite and Respective Benchmark Date 1 Year 3 Year 5 Year 10 Year Inception U.S. Enhanced Plus Gross 7/87 14.49 10.34 13.55 7.81 10.82 U.S. Enhanced Plus Net 14.18 10.03 13.23 7.49 10.43 S&P 500 ® Index 17.17 10.37 13.30 7.51 9.57 Difference versus S&P 500 ® Index Net of Fees (3.00) (0.34) (0.07) (0.02) 0.86 U.S. Large Cap Growth Gross 7/93 15.00 10.25 13.00 8.63 12.50 U.S. Large Cap Growth Net 14.42 9.72 12.46 8.12 11.93 S&P 500 ® Growth Index 15.40 11.53 13.77 9.20 9.58 Difference versus S&P 500 ® Growth Index Net of Fees (0.97) (1.81) (1.31) (1.08) 2.36 U.S. Enhanced Index Gross 4/98 14.82 9.43 12.73 7.58 6.82 U.S. Enhanced Index Net 14.45 9.10 12.38 7.24 6.47 S&P 500 ® Index 17.17 10.37 13.30 7.51 6.07 Difference versus S&P 500 ® Index Net of Fees (2.72) (1.27) (0.92) (0.27) 0.40 U.S. Broad Large Cap Growth Gross 11/00 14.75 11.08 13.75 8.70 5.60 U.S. Broad Large Cap Growth Net 14.18 10.53 13.19 8.16 5.07 Russell 1000 ® Growth Index 15.76 11.27 13.32 9.13 3.71 Difference versus Russell 1000 ® Growth Index Net of Fees (1.57) (0.74) (0.13) (0.98) 1.35 U.S. Broad Enhanced Plus Gross 4/01 16.29 9.99 13.58 7.77 8.00 U.S. Broad Enhanced Plus Net 15.95 9.66 13.24 7.45 7.66 Russell 1000 ® Index 17.43 9.99 13.26 7.58 6.94 Difference versus Russell 1000 ® Index Net of Fees (1.48) (0.32) (0.02) (0.14) 0.72 U.S. Large Cap Core Gross 8/01 12.95 10.22 13.69 7.58 7.90 U.S. Large Cap Core Net 12.38 9.67 13.13 7.06 7.39 S&P 500 ® Index 17.17 10.37 13.30 7.51 6.48 Difference versus S&P 500 ® Index Net of Fees (4.79) (0.70) (0.17) (0.45) 0.91 U.S. Broad Large Cap Value Gross 8/04 19.09 8.25 13.38 6.79 8.96 U.S. Broad Large Cap Value Net 18.64 7.85 12.96 6.39 8.56 Russell 1000 ® Value Index 19.22 8.67 13.13 5.93 8.09 Difference versus Russell 1000 ® Value Index Net of Fees (0.58) (0.82) (0.17) 0.45 0.46 Global Large Cap Core Gross 1/05 9.84 5.10 10.46 5.63 7.76 Global Large Cap Core Net 9.36 4.64 9.96 5.12 7.22 MSCI World ® Index 15.43 6.12 9.99 4.81 6.56 Difference versus MSCI World ® Index Net of Fees (6.07) (1.48) (0.03) 0.31 0.66 International Large Cap Core Gross 11/06 6.29 0.69 7.60 2.93 4.31 International Large Cap Core Net 5.84 0.27 7.15 2.49 3.87 MSCI EAFE ® Index 12.25 0.96 6.32 1.53 2.46 Difference versus MSCI EAFE ® Index Net of Fees (6.41) (0.69) 0.83 0.96 1.41 Global Large Cap Core ex Japan (Kokusai) Gross 5/09 10.29 4.93 10.72 - 13.36 Global Large Cap Core ex Japan (Kokusai) Net 9.84 4.49 10.21 - 12.81 MSCI KOKUSAI ® World ex Japan Index 15.50 6.10 10.27 - 13.10 Difference versus MSCI KOKUSAI ® World ex Japan Index Net of Fees (5.66) (1.61) (0.06) - (0.29) Annualized Returns (%) for Periods Ended 3/31/2017 (2)
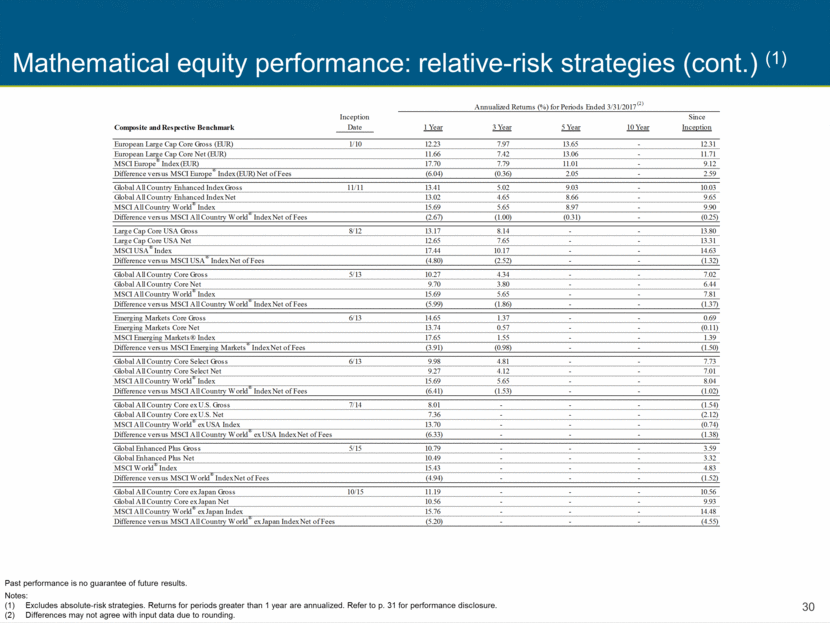
Mathematical equity performance: relative-risk strategies (cont.) (1) Past performance is no guarantee of future results. Notes: Excludes absolute-risk strategies. Returns for periods greater than 1 year are annualized. Refer to p. 31 for performance disclosure. Differences may not agree with input data due to rounding. Inception Since Composite and Respective Benchmark Date 1 Year 3 Year 5 Year 10 Year Inception European Large Cap Core Gross (EUR) 1/10 12.23 7.97 13.65 - 12.31 European Large Cap Core Net (EUR) 11.66 7.42 13.06 - 11.71 MSCI Europe ® Index (EUR) 17.70 7.79 11.01 - 9.12 Difference versus MSCI Europe ® Index (EUR) Net of Fees (6.04) (0.36) 2.05 - 2.59 Global All Country Enhanced Index Gross 11/11 13.41 5.02 9.03 - 10.03 Global All Country Enhanced Index Net 13.02 4.65 8.66 - 9.65 MSCI All Country World ® Index 15.69 5.65 8.97 - 9.90 Difference versus MSCI All Country World ® Index Net of Fees (2.67) (1.00) (0.31) - (0.25) Large Cap Core USA Gross 8/12 13.17 8.14 - - 13.80 Large Cap Core USA Net 12.65 7.65 - - 13.31 MSCI USA ® Index 17.44 10.17 - - 14.63 Difference versus MSCI USA ® Index Net of Fees (4.80) (2.52) - - (1.32) Global All Country Core Gross 5/13 10.27 4.34 - - 7.02 Global All Country Core Net 9.70 3.80 - - 6.44 MSCI All Country World ® Index 15.69 5.65 - - 7.81 Difference versus MSCI All Country World ® Index Net of Fees (5.99) (1.86) - - (1.37) Emerging Markets Core Gross 6/13 14.65 1.37 - - 0.69 Emerging Markets Core Net 13.74 0.57 - - (0.11) MSCI Emerging Markets® Index 17.65 1.55 - - 1.39 Difference versus MSCI Emerging Markets ® Index Net of Fees (3.91) (0.98) - - (1.50) Global All Country Core Select Gross 6/13 9.98 4.81 - - 7.73 Global All Country Core Select Net 9.27 4.12 - - 7.01 MSCI All Country World ® Index 15.69 5.65 - - 8.04 Difference versus MSCI All Country World ® Index Net of Fees (6.41) (1.53) - - (1.02) Global All Country Core ex U.S. Gross 7/14 8.01 - - - (1.54) Global All Country Core ex U.S. Net 7.36 - - - (2.12) MSCI All Country World ® ex USA Index 13.70 - - - (0.74) Difference versus MSCI All Country World ® ex USA Index Net of Fees (6.33) - - - (1.38) Global Enhanced Plus Gross 5/15 10.79 - - - 3.59 Global Enhanced Plus Net 10.49 - - - 3.32 MSCI World ® Index 15.43 - - - 4.83 Difference versus MSCI World ® Index Net of Fees (4.94) - - - (1.52) Global All Country Core ex Japan Gross 10/15 11.19 - - - 10.56 Global All Country Core ex Japan Net 10.56 - - - 9.93 MSCI All Country World ® ex Japan Index 15.76 - - - 14.48 Difference versus MSCI All Country World ® ex Japan Index Net of Fees (5.20) - - - (4.55) Annualized Returns (%) for Periods Ended 3/31/2017 (2)
Mathematical equity performance disclosure For the period ending March 31, 2017, 0%, 40%, 25% and 33% of the mathematical equity mutual funds were beating their benchmarks on a 1-, 3-, 5-year and since-fund inception basis. Funds included in the analysis and their inception dates are: INTECH U.S. Core Fund – Class I (2/03); INTECH U.S. Managed Volatility Fund – Class I (12/05); INTECH International Managed Volatility Fund – Class I (5/07), INTECH Global Income Managed Volatility Fund – Class I (12/11), Janus Aspen INTECH U.S. Low Volatility Portfolio – Service Shares (9/12) and INTECH Emerging Markets Managed Volatility Fund – Class I (12/14). INTECH's focus on managed volatility may keep the Fund from achieving excess returns over its index. The strategy may underperform during certain periods of up markets and may not achieve the desired level of protection in down markets. The proprietary mathematical process used by INTECH may not achieve the desired results. Since the portfolios are regularly re-balanced, this may result in a higher portfolio turnover rate, higher expenses and potentially higher net taxable gains or losses compared to a "buy and hold" or index fund strategy. Past performance cannot guarantee future results. Investing involves risk, including the possible loss of principal and fluctuation of value. Non-U.S. investments are subject to certain risks of overseas investing, including currency fluctuations and changes in political and economic conditions, which could result in significant market fluctuations. These risks are magnified in emerging markets. Performance results reflect the reinvestment of dividends and other earnings. Composite performance results shown are time-weighted rates of return using daily valuation, include the effect of transaction costs (commissions, exchange fees, etc.), and are gross of non-reclaimable withholding taxes, if any. The composites include all actual fee-paying accounts managed on a fully discretionary basis according to the investment strategy from inception date, including those no longer under management. Portfolios meeting such criteria enter the composite upon the full first month under management. Reporting currency is USD, unless otherwise noted. The gross performance results presented do not reflect the deduction of investment advisory fees. Returns will be reduced by such advisory fees and other contractual expenses as described in each client’s individual contract. The net performance results presented reflect the deduction of model investment advisory fees, and not the advisory fees actually charged to the accounts in the composite. Prior to December 31, 2004, the model advisory fees deducted reflect the maximum fixed fee in effect for each strategy. Beginning January 1, 2005, the model advisory fees deducted reflect the standard fee schedule in effect during the period shown, applied to each account in the composite on a monthly basis. Standard fee schedules are available upon request. Actual advisory fees paid may vary among clients invested in the same strategy, which may be higher or lower than the model advisory fees. Some accounts may utilize a performance-based fee. For U.S. Large Cap Growth from inception to 12/31/05, the composite’s benchmark was the S&P 500/Barra Growth Index (“Barra Growth Index”). In 2005, S&P announced index name and methodology changes affecting the Barra Growth Index, which later became the S&P 500/Citigroup Growth Index (“Citigroup Growth Index”). During the transitional period, from 1/1/06 to 3/31/06, the benchmark return consisted partially of the return of the Barra Growth Index and the Citigroup Growth Index. On 4/1/06, the composite’s benchmark was changed to the Citigroup Growth Index. Effective 12/9/2009, the Citigroup Growth Index's name was changed to S&P 500 Growth Index. The S&P 500 Growth Index is a market-capitalization-weighted index developed by Standard and Poor's consisting of those stocks within the S&P 500 Index that exhibit strong growth characteristics. The index measures the performance of the growth style of investing in large cap U.S. stocks. The S&P 500 Growth Index will be reconstituted annually. Prior to May 21, 2010, with respect to non-U.S. securities traded on non-U.S. exchanges, INTECH used fair value prices that reflected current market conditions at the end of regular trading hours of the NYSE, normally 4:00 PM ET, rather than unadjusted closing prices in local markets. Therefore, the prices as well as foreign exchange rates used to calculate the U.S. dollar market values of securities may have differed from those used by an index. Indices generally use the unadjusted closing price in local markets instead of fair value pricing. As of May 21, 2010, prices for non-U.S. securities traded on non-U.S. exchanges are typically valued as of the close of their respective local markets. However, if a significant event takes place between the close of the local market and the close of the U.S. domestic market, a security may be fair valued. Non-U.S. securities are translated into U.S. dollars using the 4:00 P.M. London spot rate. With respect to European Large Cap Core, prices assigned to investments are published prices on their primary markets or exchanges since the composite’s inception. The returns for the indices shown do not include any transaction costs, management fees or other costs, and are gross of dividend tax withholdings. Mathematical equity strategies included in the investment performance summaries include those strategies with at least a 1-year track record. Absolute-risk strategies are excluded. MSCI makes no express or implied warranties or representations and shall have no liability whatsoever with respect to any MSCI data contained herein. The MSCI data may not be further redistributed or used as a basis for other indices or any securities or financial products This report has not been approved, reviewed or produced by MSCI.
Other important disclosures Data presented reflects past performance, which is no guarantee of future results. Due to market volatility, current performance may be higher or lower than the performance shown. Call 877.33JANUS (52687) or visit janus.com/advisor/mutual-funds for performance, rankings and ratings current to the most recent month-end. Janus Capital Group Inc. (“JCG”) provides investment advisory services through its primary subsidiaries, Janus Capital Management LLC (“Janus”), INTECH Investment Management LLC (“INTECH”) and Perkins Investment Management LLC (“Perkins”). “Complex-Wide Mutual Funds” means all affiliated mutual funds managed by Janus, INTECH and Perkins. “Fundamental Equity Mutual Funds” means all mutual funds managed by Janus or Perkins that invest in equity securities. “Fixed Income Mutual Funds” means all mutual funds managed by Janus that invest primarily in fixed income securities. “Mathematical Equity Strategies” means all relative-risk, discretionary managed accounts (not mutual funds) that are advised or sub-advised by INTECH. Mutual fund relative performance analysis shown is for each Fund's Class I Shares in the Janus investment fund (“JIF”) trust and Institutional Shares in the Janus Aspen Series (“JAS”) trust or, if not available, in the Fund’s “parent” share class (that with the longest history). These share classes may not be eligible for purchase by all investors. Other share classes may have higher sales and management fees, which can result in differences in performance. Morningstar Comparative Performance Morningstar performance on an asset-weighted basis is calculated by taking all funds and assigning the assets under management ("AUM") in each respective fund to either the 1st, 2nd, 3rd or 4th quartile bucket based on each fund's respective Morningstar relative ranking. The total AUM of each quartile’s bucket is then divided by complex-wide total AUM to arrive at the respective percent of AUM in each bucket. The Morningstar percentile ranking is based on a fund’s total return (including income and capital gains, if any, and excluding sales charges) relative to all funds in the same category for the period. The highest (or most favorable) percentile rank is 1%, and the lowest (or least favorable) percentile rank is 100%. The top-performing funds in a category will always receive a rank of 1. For the 1-, 3-, 5- and 10-year periods ending March 31, 2017, 50%, 74%, 67% and 74% of the 54, 50, 46 and 35 Complex-Wide mutual funds; 67%, 84%, 61% and 76% of the 39, 38, 36 and 29 Fundamental Equity mutual funds; 11%, 29%, 83% and 100% of the 9, 7, 6 and 4 Fixed Income mutual funds outperformed the majority of their Morningstar peers based on total returns. On an asset-weighted basis, 84% of the Complex-Wide mutual fund assets, 83% of the Fundamental Equity mutual fund assets and 100% of the Fixed Income mutual fund assets outperformed the majority of their Morningstar peers based on total returns for the 10-year period. The Morningstar RatingTM for funds, or "star rating," is calculated for managed products (including mutual funds, variable annuity and variable life subaccounts, exchange-traded funds, closed-end funds, and separate accounts) with at least a three-year history. Exchange-traded funds and open-ended mutual funds are considered a single population for comparative purposes. It is calculated based on a Morningstar Risk-Adjusted Return measure that accounts for variation in a managed product's monthly excess performance, placing more emphasis on downward variations and rewarding consistent performance. The top 10% of products in each product category receive 5 stars, the next 22.5% receive 4 stars, the next 35% receive 3 stars, the next 22.5% receive 2 stars, and the bottom 10% receive 1 star. The Overall Morningstar Rating for a managed product is derived from a weighted average of the performance figures associated with its three-, five-, and 10-year (if applicable) Morningstar Rating metrics. The weights are: 100% three-year rating for 36-59 months of total returns, 60% five-year rating/40% three-year rating for 60-119 months of total returns, and 50% 10-year rating/30% five-year rating/20% three-year rating for 120 or more months of total returns. While the 10-year overall star rating formula seems to give the most weight to the 10-year period, the most recent three-year period actually has the greatest impact because it is included in all three rating periods. For the period ending March 31, 2017, 44%, 52% and 57% of Complex-Wide mutual funds had a 4- or 5-star Morningstar rating for the 3-, 5- and 10-year periods based on risk-adjusted returns for 50, 46 and 35 funds, respectively. 50 funds were included in the analysis for the Overall period.
Other important disclosures Index performance does not reflect the expenses of managing a portfolio as an index is unmanaged and not available for direct investment. Russell 1000® Growth Index measures the performance of those Russell 1000 companies with higher price-to-book ratios and higher forecasted growth values. Russell 1000® Value Index measures the performance of those Russell 1000 companies with lower price-to-book ratios and lower forecasted growth values. Russell Midcap® Value Index measures the performance of those Russell Midcap® companies with lower price-to-book ratios and lower forecasted growth rates. Russell 2000® Value Index measures the performance of those Russell 2000® companies with lower price-to-book ratios and lower forecasted growth values. S&P 500® Index reflects U.S. large-cap equity performance and represents broad U.S. equity market performance. MSCI World IndexSM is a market capitalization weighted index composed of companies representative of the market structure of Developed Market countries in North America, Europe and the Asia/Pacific Region. MSCI EAFE® Index is a market capitalization weighted index composed of companies representative of the market structure of Developed Market countries in Europe, Australasia and the Far East. MSCI All Country World Index is a free float-adjusted market capitalization weighted index that is designed to measure performance of global developed and emerging equity markets. MSCI All Country World ex USA IndexSM is an unmanaged, free float-adjusted, market capitalization weighted index composed of stocks of companies located in countries throughout the world, excluding the United States. It is designed to measure equity market performance in global developed and emerging markets outside the United States. The index includes reinvestment of dividends, net of foreign withholding taxes. Russell 1000 Index measures performance of the 1,000 largest companies in the Russell 3000 Index. Core Growth Index is an internally calculated, hypothetical combination of unmanaged indices that combines total returns from the Russell 1000® Growth Index (50%) and the S&P 500® Index (50%). MSCI USA Index is a free float-adjusted market capitalization index that is designed to measure large and mid cap U.S. equity market performance. MSCI KOKUSAI World ex Japan Index is a free float-adjusted market capitalization index that is designed to measure the equity market performance of developed markets excluding Japan. MSCI Europe Index is a free float-adjusted market capitalization weighted index that is designed to measure the equity market performance of the developed markets in Europe. MSCI Emerging Markets Index is a free float-adjusted market capitalization index that is designed to measure equity market performance in the global emerging markets. MSCI All Country World ex Japan Index is a free float-adjusted market capitalization-weighted index that is designed to measure performance of global developed and emerging equity markets excluding Japan. FTSE EPRA/NAREIT Developed Index is a global market capitalization weighted index composed of listed real estate securities from developed market countries in North America, Europe, and Asia. MSCI All Country Asia ex Japan IndexSM reflects the equity market performance of Asia, excluding Japan. Russell 3000® Value Index measures the performance of the broad value segment of the U.S. equity universe. It includes those Russell 3000 companies with lower price-to-book ratios and lower forecasted growth values. Please consider the charges, risks, expenses and investment objectives carefully before investing. For a prospectus or, if available, a summary prospectus containing this and other information, please call Janus at 877.335.2687 or download the file from janus.com/info. Read it carefully before you invest or send money. Funds distributed by Janus Distributors LLC. C-0417-9384 07-15-17
