Attached files
| file | filename |
|---|---|
| EX-32.2 - EX-32.2 - JANUS CAPITAL GROUP INC | a2230904zex-32_2.htm |
| EX-32.1 - EX-32.1 - JANUS CAPITAL GROUP INC | a2230904zex-32_1.htm |
| EX-31.2 - EX-31.2 - JANUS CAPITAL GROUP INC | a2230904zex-31_2.htm |
| EX-31.1 - EX-31.1 - JANUS CAPITAL GROUP INC | a2230904zex-31_1.htm |
| EX-23.1 - EX-23.1 - JANUS CAPITAL GROUP INC | a2230904zex-23_1.htm |
| EX-21.1 - EX-21.1 - JANUS CAPITAL GROUP INC | a2230904zex-21_1.htm |
| EX-12.1 - EX-12.1 - JANUS CAPITAL GROUP INC | a2230904zex-12_1.htm |
| EX-10.17 - EX-10.17 - JANUS CAPITAL GROUP INC | a2230904zex-10_17.htm |
| EX-10.13.9 - EX-10.13.9 - JANUS CAPITAL GROUP INC | a2230904zex-10_139.htm |
| EX-10.12.2 - EX-10.12.2 - JANUS CAPITAL GROUP INC | a2230904zex-10_122.htm |
| EX-10.11.1 - EX-10.11.1 - JANUS CAPITAL GROUP INC | a2230904zex-10_111.htm |
| EX-10.9.6 - EX-10.9.6 - JANUS CAPITAL GROUP INC | a2230904zex-10_96.htm |
| EX-10.9.5 - EX-10.9.5 - JANUS CAPITAL GROUP INC | a2230904zex-10_95.htm |
| EX-10.9.4 - EX-10.9.4 - JANUS CAPITAL GROUP INC | a2230904zex-10_94.htm |
Use these links to rapidly review the document
TABLE OF CONTENTS
ITEM 8. FINANCIAL STATEMENTS AND SUPPLEMENTARY DATA
UNITED STATES
SECURITIES AND EXCHANGE COMMISSION
WASHINGTON, D.C. 20549
FORM 10-K
ý ANNUAL REPORT PURSUANT TO SECTION 13 OR 15(d) OF THE SECURITIES EXCHANGE ACT OF 1934
For the fiscal year ended December 31, 2016
OR
o TRANSITION REPORT PURSUANT TO SECTION 13 OR 15(d) OF THE SECURITIES EXCHANGE ACT OF 1934
For the transition period from to
Commission File Number 001-15253

Janus Capital Group Inc.
(Exact name of registrant as specified in its charter)
| Delaware (State or other jurisdiction of incorporation or organization) |
43-1804048 (I.R.S. Employer Identification No.) |
|
151 Detroit Street, Denver, Colorado (Address of principal executive offices) |
80206 (Zip Code) |
(303) 333-3863
(Registrant's telephone number, including area code)
Securities registered pursuant to Section 12(b) of the Act:
Title of Each Class
|
Name of Each Exchange on Which Registered
|
|
|---|---|---|
| Common Stock, $ 0.01 Per Share Par Value | New York Stock Exchange | |
Securities registered pursuant to Section 12(g) of the Act: None |
||
Indicate by check mark if the registrant is a well-known seasoned issuer, as defined in Rule 405 of the Securities Act. Yes ý No o
Indicate by check mark if the registrant is not required to file reports pursuant to Section 13 or Section 15(d) of the Act. Yes o No ý
Indicate by check mark whether the registrant: (1) has filed all reports required to be filed by Section 13 or 15(d) of the Securities Exchange Act of 1934 during the preceding 12 months (or for such shorter period that the Company was required to file such reports), and (2) has been subject to the filing requirements for the past 90 days. Yes ý No o
Indicate by check mark whether the registrant has submitted electronically and posted on its corporate Web site, if any, every Interactive Data File required to be submitted and posted pursuant to Rule 405 of Regulation S-T (§232.405 of this chapter) during the preceding 12 months (or for such shorter period that the registrant was required to submit and post such files). Yes ý No o
Indicate by check mark if disclosure of delinquent filers pursuant to Item 405 of Regulation S-K (§229.405 of this chapter) is not contained herein, and will not be contained, to the best of registrant's knowledge, in definitive proxy or information statements incorporated by reference in Part III of this Form 10-K or any amendment to this Form 10-K. ý
Indicate by check mark whether the registrant is a large accelerated filer, an accelerated filer, a non-accelerated filer, or a smaller reporting company. See the definitions of "large accelerated filer," "accelerated filer" and "smaller reporting company" in Rule 12b-2 of the Exchange Act. (Check one):
| Large accelerated filer ý | Accelerated filer o | Non-accelerated filer o (Do not check if a smaller reporting company) |
Smaller reporting company o |
Indicate by check mark whether the registrant is a shell company (as defined in Rule 12b-2 of the Exchange Act). Yes o No ý
As of June 30, 2016, the aggregate market value of common equity held by non-affiliates was $2,595,834,364. As of February 10, 2017, there were 184,300,141 shares of the Company's common stock, $0.01 par value per share, issued and outstanding.
DOCUMENTS INCORPORATED BY REFERENCE
Part III of this report is incorporated by reference to the registrant's definitive proxy statement for the 2017 Annual Meeting of Stockholders or will be provided in an amendment filed on Form 10-K/A.
JANUS CAPITAL GROUP INC.
2016 FORM 10-K ANNUAL REPORT
1
This Annual Report on Form 10-K contains "forward-looking statements" within the meaning of the federal securities laws, including the Private Securities Litigation Reform Act of 1995, as amended, Section 21E of the Securities Exchange Act of 1934 ("Exchange Act"), as amended, and Section 27A of the Securities Act of 1933, as amended. In addition, Janus Capital Group Inc. and its subsidiaries (collectively, "JCG" or the "Company") may make other written and oral communications from time to time (including, without limitation, in the Company's 2016 Annual Report to Stockholders) that contain such statements. Forward-looking statements include statements as to industry trends, future expectations of the Company and other matters that do not relate strictly to historical facts and are based on certain assumptions by management. These statements are often identified by the use of words such as "may," "will," "expects," "believes," "anticipates," "intends," "could," "should," "plans," "projects," "estimates," "continue," "seeks," "targets" or "outlook," and similar words, expressions and variations. These statements are based on the beliefs and assumptions of Company management based on information currently available to management. Such forward-looking statements are subject to risks, uncertainties and other factors that could cause actual results to differ materially from future results expressed or implied by such forward-looking statements. Important factors that could cause actual results to differ materially from the forward-looking statements include, among others, the risks described in Part I, Item 1A, Risk Factors, and elsewhere in this report and other documents filed or furnished by JCG from time to time with the Securities and Exchange Commission ("SEC"). JCG cautions readers to carefully consider such factors. Furthermore, such forward-looking statements speak only as of the date on which such statements are made. The Company does not assume any duty and does not undertake to update forward-looking statements, to report events or to report the occurrence of unanticipated events, whether as a result of new information, future developments or otherwise, should circumstances change, nor does the Company intend to do so, except as otherwise required by securities and other applicable laws and regulations.
JCG provides investment management, administration, distribution and related services to financial advisors, individuals and institutional clients through mutual funds, separate accounts, other pooled investment vehicles, exchange-traded products ("ETPs") and subadvised relationships (collectively referred to as "investment products") in both domestic and international markets. JCG provides investment management competencies across a range of disciplines, including fundamental U.S. and global equities (growth and value), mathematical equities, fixed income and alternatives, through its subsidiaries, Janus Capital Management LLC ("Janus"), INTECH Investment Management LLC ("INTECH") and Perkins Investment Management LLC ("Perkins"). These subsidiaries specialize in specific investment styles, and each has its own unique and independent perspective. JCG's investment products are distributed through three primary channels: intermediary, institutional and self-directed. Each distribution channel focuses on specific investor groups and the unique requirements of each group. As of December 31, 2016, JCG's complex-wide assets totaled $196.8 billion for mutual fund shareholders, clients and institutions around the globe.
JCG's complex-wide assets include all assets under management and exchange traded notes ("ETNs"). ETNs are not included in assets under management as the Company is not the named adviser or subadviser to ETNs. Assets under management primarily consist of domestic and international equity and fixed income securities. Accordingly, fluctuations in domestic and international financial markets, relative investment performance, sales and redemptions of investment products, and changes in the composition of assets under management are all factors that have a direct effect on JCG's operating results.
2
Operating revenues are generally based upon a percentage of the market value of assets under management and are calculated as a percentage of the daily average asset balance in accordance with contractual agreements. Certain investment products are also subject to performance fees, which vary based on a product's relative performance as compared to a benchmark index and the level of assets subject to such fees.
Although JCG manages and distributes a wide range of investment products and services, the Company's management directs JCG's operations as one business, the investment management business, and thus operates in one business segment.
Merger Agreement
On October 3, 2016, JCG and Henderson Group plc ("Henderson") entered into an Agreement and Plan of Merger (the "Merger Agreement") relating to the business combination of JCG and Henderson. The merger was unanimously approved by the board of directors of both JCG and Henderson. The combined company will be named Janus Henderson Group plc ("Janus Henderson") and will apply for admission to trade on the New York Stock Exchange ("NYSE") as its primary listing, while retaining Henderson's existing listing on the Australian Securities Exchange ("ASX"). Janus Henderson intends to comply with all applicable U.S. and Australian security reporting requirements. The merger will be effected via a share exchange with each share of JCG common stock converted into the right to receive 4.7190 newly issued shares of Henderson. Henderson and JCG shareholders are expected to own approximately 57% and 43%, respectively, of Janus Henderson ordinary shares upon closing.
The closing of the merger is subject to, among other things, (a) the approval of the shareholders of JCG of the merger; (b) the approval of the shareholders of Henderson of (i) the merger, (ii) the name change of Henderson, (iii) the amended and restated memorandum and articles of association of Henderson, (iv) the delisting of Henderson ordinary shares from the London Stock Exchange and (v) the payment of a dividend in respect to the second half of the 2016 fiscal year; (c) the receipt of the required regulatory approvals, including the approval of the Financial Industry Regulatory Authority, Inc. ("FINRA") and the United Kingdom ("U.K.") Financial Conduct Authority; (d) the approval by the board of trustees and shareholders for JCG-advised U.S. mutual funds of new investment advisory agreements with JCG to take effect at the closing of the merger representing at least 67.5% of the assets under management of those funds as of September 30, 2016; (e) the effectiveness of the registration statement relating to the issuance of Henderson ordinary shares in connection with the merger and absence of any stop order or proceedings by the SEC; (f) approval for listing on the NYSE of the Henderson ordinary shares; and (g) the absence of governmental restraints or prohibitions preventing the consummation of the merger. The obligation of each of JCG and Henderson to consummate the merger is also conditioned on, among other things, the truth and correctness of the representations and warranties made by the other party as of the closing date (subject to certain "materiality" and "material adverse effect" qualifiers). Subject to the satisfaction or, if applicable, waiver of these conditions, the merger is expected to close on or about May 30, 2017.
JCG incurred $13.3 million of merger-related expenses in 2016. The merger expenses are included in (a) general, administrative and occupancy and (b) marketing and advertising on JCG's Consolidated Statements of Comprehensive Income.
Subsidiaries
Janus
Janus has managed primarily growth equity portfolios since 1969 with the introduction of the Janus Fund. Janus has leveraged its research-driven investment philosophy and culture to other areas of
3
the markets, including fundamental fixed income, global macro fixed income, diversified alternatives and ETPs. Independent thinking and fundamental research are at the core of Janus' investment culture across its investment product teams. Janus believes its depth of research, willingness to make concentrated investments when Janus believes it has a research edge and commitment to delivering strong long-term results for its investors differentiate Janus from its competitors.
At December 31, 2016, Janus managed $89.7 billion of long-term equity assets, $40.0 billion of fixed income assets and $1.1 billion of money market assets, or approximately 67% of total Company assets under management.
INTECH
INTECH has managed institutional portfolios since 1987, establishing one of the industry's longest continuous performance records of mathematical equity investment strategies. INTECH's unique investment process is based on a mathematical theorem that seeks to add value for clients by capitalizing on the volatility in stock price movements. INTECH's goal is to achieve long-term returns that outperform a specified benchmark index while controlling risks and trading costs. At December 31, 2016, INTECH managed $46.7 billion, or approximately 24% of total Company assets under management.
Perkins
Perkins has managed value-disciplined investment products since 1980, focusing on building diversified portfolios of what it believes to be high-quality, undervalued stocks with favorable reward characteristics. With its fundamental research and careful consideration for downside risk, Perkins has established a reputation as a leading value manager. Perkins offers value equity investment products across a range of U.S. asset classes and global equities. At December 31, 2016, Perkins managed $9.8 billion, or approximately 5% of total Company assets under management.
Kapstream
Kapstream Capital Pty Limited ("Kapstream") has managed global macro fixed income products since 2006 with the introduction of the Kapstream Absolute Return Income Fund. In July 2015, JCG closed the acquisition of a controlling 51% voting interest in Kapstream. Kapstream is part of the Company's global macro fixed income team and remains a separate, autonomous and distinct capability from the fundamental fixed income team. At December 31, 2016, Kapstream managed $7.2 billion, or approximately 4% of total Company assets under management.
On January 31, 2017, JCG acquired the remaining 49% voting interest in Kapstream. The noncontrolling interests were held by the founders of Kapstream, who are current JCG employees. The transaction included initial upfront cash consideration of $42.5 million and contingent consideration payable in the form of mutual fund share awards ("MFSAs"). Payment of the MFSAs is contingent on all Kapstream products and certain Janus products reaching defined revenue targets on the first, second and third anniversaries of January 31, 2017. The MFSAs will be payable in three equal installments of $14.2 million on the anniversary dates and are indexed to the performance of the Kapstream Absolute Return Income Fund. Upon vesting, the holders of MFSAs receive the value of the awards adjusted for gains or losses attributable to the mutual fund to which the awards were indexed, subject to tax withholding.
VelocityShares
VS Holdings, Inc. ("VelocityShares") has been providing sophisticated investors with unique solutions for portfolio and trading risk management since 2009. VelocityShares is a sponsor of unique ETPs that are institutionally focused and offer sophisticated volatility management solutions.
4
The majority of ETPs represents tactical trading products serving short-term investors and traders in the form of ETNs. JCG acquired VelocityShares in December 2014. VelocityShares-branded ETNs had $2.3 billion in complex-wide assets as of December 31, 2016. ETNs are not included in assets under management.
Distribution Channels
JCG distributes its products through three channels: intermediary, institutional and self-directed. Each channel is discussed below.
Intermediary Channel
The intermediary channel distributes mutual funds and exchange-traded funds ("ETFs") through financial intermediaries including banks, broker-dealers, financial advisors, variable insurance trusts and retirement platforms. International mutual funds are also part of the intermediary channel and are offered through Janus Capital Funds plc, a Dublin-domiciled mutual fund trust. Significant investments have been made to grow the Company's presence in the financial advisor subchannel, including increasing the number of external and internal wholesalers, enhancing the Company's technology platform and recruiting highly seasoned client relationship managers. At December 31, 2016, assets in the intermediary channel totaled $76.5 billion, or 39% of total complex-wide assets.
Institutional Channel
The institutional channel serves corporations, endowments, foundations, Taft-Hartley funds, public fund clients and sovereign entities, with distribution direct to the plan sponsor and through consultants. Although the current asset base in this channel is weighted heavily toward INTECH's mathematical products, the Company has steadily increased its fixed income penetration, growing fixed income assets to $14.9 billion (including international institutional fixed income assets), an increase of approximately 8% compared to December 31, 2015. At December 31, 2016, assets in the institutional channel totaled $67.4 billion, or 34% of total complex-wide assets.
Self-Directed Channel
The self-directed channel serves existing individual investors who invest in JCG products through a mutual fund supermarket or directly with JCG. ETNs associated with VelocityShares are also part of the self-directed channel. At December 31, 2016, assets in the self-directed channel totaled $52.9 billion, or 27% of total complex-wide assets.
The investment management industry is relatively mature and saturated with competitors that provide services similar to JCG. As such, JCG encounters significant competition in all areas of its business. JCG competes with other investment managers, mutual fund advisers, brokerage and investment banking firms, insurance companies, hedge funds, venture capitalists, banks and other financial institutions, many of which are larger, have proprietary access to certain distribution channels, have a broader range of product choices and investment capabilities, and have greater capital resources. Additionally, the marketplace for investment products is rapidly changing, investors are becoming more sophisticated, the demand for and access to investment advice and information is becoming more widespread, passive investment strategies are becoming more prevalent, and more investors are demanding investment vehicles that are customized to their individual requirements.
JCG believes its ability to successfully compete in the investment management industry significantly depends upon its ability to achieve consistently strong investment performance, provide exceptional
5
client service and strategic partnerships, and develop and innovate products that will best serve its clients.
The investment management industry is subject to extensive federal, state and international laws and regulations intended to benefit and protect the shareholders of investment products such as those managed by JCG's subsidiaries and advisory clients of JCG's subsidiaries. The costs of complying with such laws and regulations have significantly increased and may continue to contribute significantly to the costs of doing business as a global investment adviser. These laws and regulations generally grant supervisory agencies broad administrative powers, including the power to limit or restrict the conduct of businesses and to impose sanctions for failure to comply with laws and regulations. Possible consequences for failure to comply include, but are not limited to, voiding of investment advisory and subadvisory agreements, the suspension of individual employees (particularly investment management and sales personnel), limitations on engaging in certain lines of business for specified periods of time, revocation of registrations, disgorgement of profits, and imposition of censures and fines. Further, failure to comply with such laws and regulations may provide the basis for civil litigation that may also result in significant costs and reputational harm to JCG.
U.S. Regulation
JCG and certain of its U.S. subsidiaries are subject to laws and regulations from a number of government agencies and regulatory bodies, including, but not limited to, the SEC, the U.S. Department of Labor ("DOL"), FINRA and the U.S. Commodity Futures Trading Commission ("CFTC").
Investment Advisers Act of 1940
Certain subsidiaries of JCG are registered investment advisers under the Investment Advisers Act of 1940, as amended (the "Investment Advisers Act") and, as such, are regulated by the SEC. The Investment Advisers Act requires registered investment advisers to comply with numerous and pervasive obligations, including, among others, recordkeeping requirements, operational procedures, registration and reporting requirements, and disclosure obligations. Certain subsidiaries of JCG are also registered with regulatory authorities in various countries and states, and thus are subject to the oversight and regulation by such countries' and states' regulatory agencies.
Investment Company Act of 1940
Certain of JCG's subsidiaries act as the adviser or subadviser to mutual funds and ETFs, which are registered with the SEC pursuant to the Investment Company Act of 1940, as amended (the "1940 Act"). Certain of JCG's subsidiaries also serve as adviser or subadviser to investment products that are not required to be registered under the 1940 Act. As an adviser or subadviser to a registered investment company, these subsidiaries must comply with the requirements of the 1940 Act and related regulations, including, among others, requirements relating to operations, fees charged, sales, accounting, recordkeeping, disclosure and governance. In addition, the adviser or subadviser to a registered investment company generally has obligations with respect to the qualification of the registered investment company under the Internal Revenue Code of 1986, as amended (the "Code").
6
Broker-Dealer Regulations
JCG's limited purpose broker-dealer subsidiary, Janus Distributors LLC ("JD"), is registered with the SEC under the Exchange Act and is a member of FINRA, the securities industry's domestic self-regulatory organization. JD is the general distributor and agent for the sale and distribution of shares of domestic mutual funds that are directly advised or serviced by certain of JCG's subsidiaries, as well as the distribution of certain commingled funds and ETPs. The SEC imposes various requirements on JD's operations, including disclosure, recordkeeping and accounting. FINRA has established conduct rules for all securities transactions among broker-dealers and private investors, trading rules for the over-the-counter markets and operational rules for its member firms. The SEC and FINRA also impose net capital requirements on registered broker-dealers.
JD is subject to regulation under state law. The federal securities laws prohibit states from imposing substantive requirements on broker-dealers that exceed those under federal law. This does not preclude the states from imposing registration requirements on broker-dealers that operate within their jurisdiction or from sanctioning broker-dealers and their employees for engaging in misconduct.
ERISA
Certain JCG subsidiaries are also subject to the Employee Retirement Income Security Act of 1974, as amended ("ERISA"), and related regulations to the extent they are considered "fiduciaries" under ERISA with respect to some of their clients. ERISA-related provisions of the Code and regulations issued by the DOL impose duties on persons who are fiduciaries under ERISA and prohibit some transactions involving the assets of each ERISA plan that is a client of a JCG subsidiary as well as some transactions by the fiduciaries (and several other related parties) to such plans.
CFTC
The CFTC has regulations that require Janus to register as a commodity pool operator ("CPO") and become a member of the National Futures Association ("NFA") in connection with the operation of certain of the Company's products. The regulations generally impose certain registration, reporting and disclosure requirements on CPOs and products that utilize futures, swaps and other derivatives that are subject to CFTC regulation. The CFTC or NFA may institute proceedings to enforce applicable rules and regulations, and violations may result in fines, censure or the termination of CPO registration and NFA membership.
Dodd-Frank Wall Street Reform and Consumer Protection Act
The Dodd-Frank Wall Street Reform and Consumer Protection Act (the "Dodd-Frank Act") was signed into law in July 2010. The Dodd-Frank Act established enhanced regulatory requirements for non-bank financial institutions designated as "systemically important" by the Financial Stability Oversight Council ("FSOC"). Subsequently, in April 2012, the FSOC issued a final rule and interpretive guidance related to the process by which it will designate non-bank financial companies as systemically important financial institutions ("SIFI"). Certain non-bank financial companies have since been designated as SIFIs, and additional non-bank financial companies, including large asset management companies, may be designated as SIFIs in the future. If JCG were designated a SIFI, it would be subject to enhanced prudential measures, which could include capital and liquidity requirements, leverage limits, enhanced public disclosures and risk management requirements, annual stress testing by the Federal Reserve, credit exposure and concentration limits, and supervisory and other requirements. These heightened regulatory requirements could adversely affect the Company's business and operations. JCG is not a designated SIFI.
7
International Regulation
JCG's product offerings and international business activities expose the Company to international regulation. The Company's international subsidiaries are subject to the laws and regulations of non-U.S. jurisdictions and non-U.S. regulatory agencies and bodies, including the following:
- •
- Australian Securities and Investments Commission
- •
- Authorité des Marchés Financiers of France
- •
- Canadian Provincial Securities Commissions
- •
- Central Bank of Ireland
- •
- Commissione Nazionale per le Societa e la Borsa of Italy
- •
- Dubai Financial Services Authority
- •
- Federal Financial Supervisory Authority of Germany
- •
- Financial Conduct Authority in the United Kingdom
- •
- Financial Market Supervisory Authority of Switzerland
- •
- Financial Services Agency of Japan
- •
- Financial Supervisory Commission of Taiwan
- •
- Financial Supervisory Service and the Financial Services Commission of Korea
- •
- Monetary Authority of Singapore
- •
- Netherlands Authority for the Financial Markets
- •
- Securities and Futures Commission of Hong Kong
These regulatory agencies have broad supervisory and disciplinary powers, including, among others, the power to temporarily or permanently revoke the authorization to conduct regulated business, suspend registered employees, and censure and fine both regulated businesses and their registered employees.
Many of the non-U.S. securities exchanges and regulatory authorities have imposed rules (and others may impose rules) relating to capital requirements applicable to JCG's foreign subsidiaries. These rules, which specify minimum capital requirements, are designed to measure general financial integrity and liquidity, and require that a minimum amount of assets be kept in relatively liquid form.
As of December 31, 2016, JCG had 1,277 full-time employees. None of these employees are represented by a labor union.
Copies of JCG's filings with the SEC can be obtained from the SEC's Public Reference Room at 100 F Street, N.E., Washington, DC 20549. Information can be obtained about the operation of the Public Reference Room by calling the SEC at (800) SEC-0330. The SEC also maintains an Internet site that contains reports, proxy and information statements, and other information regarding issuers that file electronically with the SEC at http://www.sec.gov.
8
JCG makes available free of charge its annual reports on Form 10-K, quarterly reports on Form 10-Q and current reports on Form 8-K and amendments thereto as soon as reasonably practical after such filing has been made with the SEC. Reports may be obtained through the Investor Relations section of JCG's website (http://ir.janus.com) or by contacting JCG at (888) 834-2536. The contents of JCG's website are not incorporated herein for any purpose.
JCG's Officer Code of Ethics for Chief Executive Officer and Senior Financial Officers (including its Chief Executive Officer, Chief Financial Officer and Chief Accounting Officer) (the "Officer Code"); Corporate Code of Business Conduct for all employees; corporate governance guidelines; and the charters of key committees of the Board of Directors (including the Audit, Compensation, and Nominating and Corporate Governance committees) are available on the Investor Relations section of JCG's website (http://ir.janus.com), and printed copies are available to any shareholder upon request by calling JCG at (888) 834-2536. Any future amendments to or waivers of the Officer Code will be posted to the Investor Relations section of JCG's website.
ADDITIONAL FINANCIAL INFORMATION
See additional financial information about geographical areas in Part II, Item 8, Financial Statements and Supplementary Data, Note 21 — Geographic Information.
JCG faces numerous risks, uncertainties and other factors that are substantial and inherent to its business, including risks related to the merger with Henderson, market and investment performance risks, operational and technology risks, and legal and regulatory risks. The following are significant factors that could affect JCG's business.
Risks related to the merger with Henderson
The Merger Agreement may be terminated in accordance with its terms and the merger may not be completed.
The closing of the merger is subject to the satisfaction or waiver of a number of conditions. Those conditions include: (a) the approval of the shareholders of JCG of the merger; (b) the approval of the shareholders of Henderson of (i) the merger, (ii) the name change of Henderson, (iii) the amended and restated memorandum and articles of association of Henderson, (iv) the delisting of Henderson ordinary shares from the London Stock Exchange and (v) the payment of a dividend in respect to the second half of the 2016 fiscal year; (c) the receipt of the required regulatory approvals, including the approval of FINRA and the U.K. Financial Conduct Authority; (d) the approval by the board of trustees and shareholders for JCG-advised U.S. mutual funds of new investment advisory agreements with JCG to take effect at the closing of the merger representing at least 67.5% of the assets under management of those funds as of September 30, 2016; (e) the effectiveness of the registration statement relating to the issuance of Henderson ordinary shares in connection with the merger and absence of any stop order or proceedings by the SEC; (f) approval for listing on the NYSE of the Henderson ordinary shares; and (g) the absence of governmental restraints or prohibitions preventing the consummation of the merger. The obligation of each of JCG and Henderson to consummate the merger is also conditioned on, among other things, the truth and correctness of the representations and warranties made by the other party as of the closing date (subject to certain "materiality" and "material adverse effect" qualifiers). These conditions to the closing may not be fulfilled and, accordingly, the merger may not be completed.
If the merger is not completed by September 30, 2017, either JCG or Henderson may choose not to proceed with the merger. In addition, the parties can mutually decide to terminate the Merger Agreement at any time prior to consummation of the merger, before or after the required JCG and
9
Henderson shareholder approvals. In addition, JCG or Henderson may elect to terminate the Merger Agreement in certain other circumstances.
If the Merger Agreement is terminated, JCG may incur substantial fees in connection with termination of the Merger Agreement and will not recognize the anticipated benefits of the merger.
Termination of the Merger Agreement could negatively impact JCG.
If the Merger Agreement is terminated and the merger is not consummated, JCG may be adversely affected. JCG may be adversely impacted by the failure to pursue other beneficial opportunities during the pendency of the merger, by the failure to obtain the anticipated benefits of completing the merger, by payment of certain costs relating to the merger, and by the focus of its management on the merger for an extended period of time rather than on normal business operations or opportunities or by the loss of certain senior managers as a consequence of the merger not completing. The market price of JCG common stock might decline as a result of any such failures to the extent that the current market price reflects a market assumption that the merger will be completed. Any of these factors, among others, could have a material impact on the business, prospects, financial condition and results of operations of JCG.
In addition, if the Merger Agreement is terminated under certain circumstances, JCG may be required to pay Henderson a termination fee of $34,000,000 in cash or to pay Henderson's expenses in the amount of up to $10,000,000 in cash, depending on the circumstances surrounding the termination (and in each case subject to certain adjustments that may be required in respect of applicable taxes).
JCG may also be negatively impacted if JCG becomes subject to litigation related to entering into or failing to consummate the merger, including direct actions by JCG stockholders against the directors and/or officers of JCG for breaches of fiduciary duty and derivative actions brought by JCG stockholders in the name of JCG.
JCG will be subject to business uncertainties while the merger is pending.
Uncertainty about the closing or effect of the merger may affect the relationship between JCG and its customers, including through reduced net flows during the pendency of the merger. This uncertainty may also affect the relationship between JCG and its business counterparties. Any such impact may have an adverse effect on JCG. These uncertainties may cause parties that deal with JCG to seek to change existing business relationships with it and to delay or defer decisions concerning JCG. Changes to existing business relationships, including termination or modification, could negatively affect JCG's assets under management, revenue, earnings and cash flow, as well as the market price of JCG's common stock.
JCG may face challenges in attracting and retaining key personnel during the pendency of the merger.
JCG is dependent on the experience and industry knowledge of its officers, key management personnel and other key employees to operate and execute its business plans. Such dependency is heightened as a result of the Merger Agreement. Current and prospective employees of JCG may experience uncertainty about their role within the combined company during and following the merger, which may have an adverse effect on the ability of JCG to attract or retain key management personnel and other key employees. If key employees depart because of issues related to the uncertainty and difficulty of integration or a desire not to remain with JCG, JCG could be negatively impacted. Accordingly, no assurance can be given that JCG will be able to attract or retain key management personnel and other key employees of JCG to the same extent that JCG has previously been able to attract or retain its employees. Adverse effects arising from the pendency of
10
the merger could be exacerbated by any delays in consummation of the merger or termination of the Merger Agreement.
JCG will be subject to certain contractual restrictions while the merger is pending.
The Merger Agreement restricts JCG from making certain acquisitions and divestitures, entering into certain contracts, incurring certain indebtedness and expenditures, repurchasing or issuing securities outside of existing equity awards, and taking other specified actions without the consent of Henderson until the earlier of the closing of the merger or the termination of the Merger Agreement. These restrictions may prevent JCG from pursuing attractive business opportunities that may arise prior to the closing of the merger and could have the effect of delaying or preventing other strategic transactions. Adverse effects arising from the pendency of the merger could be exacerbated by any delays in consummation of the merger or termination of the Merger Agreement.
Third parties may terminate or alter existing contracts or relationships with JCG.
JCG has contracts with customers, vendors, distributors, affiliates, landlords, licensors, and other business partners which may require JCG to obtain consent from these other parties in connection with the merger. If these consents cannot be obtained, the counterparties to these contracts and other third parties with which JCG currently has relationships may have the ability to terminate, reduce the scope of or otherwise materially adversely alter their relationships with JCG in anticipation of the merger. The pursuit of such rights may result in JCG suffering a loss of potential future revenue or incurring liabilities in connection with a breach of such agreements and losing rights that are material to its business. Such disruptions could also result from a delay in the closing of the merger.
JCG will incur significant transaction costs in connection with the merger.
JCG has incurred and expects to incur significant non-recurring costs associated with the merger. These costs and expenses include financial advisory, legal, accounting, consulting and other advisory fees and expenses, reorganization and restructuring costs, severance/employee benefit related expenses, public company filing fees and other regulatory expenses, printing expenses and other related charges. Some of these costs are payable by JCG regardless of whether the merger is completed.
The Merger Agreement contains provisions that may discourage other companies from trying to enter into a strategic transaction with JCG for greater consideration.
Notwithstanding that such provisions are to be disregarded in respect of both parties to the extent that the U.K. Panel on Takeovers and Mergers determines that they are prohibited by Rule 21.2 of the City Code, certain provisions of the Merger Agreement may discourage third parties from submitting business combination proposals to JCG during the pendency of the Merger Agreement that might have otherwise resulted in greater value to JCG stockholders than the merger. These provisions include a general prohibition on JCG, its controlled affiliates, directors, officer employees and representatives, from soliciting, initiating or knowingly encouraging, or, subject to certain exceptions, entering into discussions with any third party regarding any alternative transactions, subject to limited exceptions. In addition, Dai-ichi Life Holdings Inc. ("Dai-ichi Life"), JCG's largest shareholder, has committed to vote its shares of JCG's common stock in favor of the merger. This may discourage a third-party from pursuing a strategic transaction with JCG.
If, in certain permitted circumstances, the JCG board (i) withdraws, qualifies or modifies, or proposes publicly to withdraw, qualify or modify, or fails to make, in each case in any manner adverse to Henderson, its approval or recommendation of the merger or (ii) approves or recommends, or
11
proposes publicly to approve or recommend, any alternative transaction, JCG will still be required to submit the merger to a vote of its stockholders at the special meeting unless the Merger Agreement is earlier terminated by the other party in accordance with its terms.
The Merger Agreement provides that, upon termination of the Merger Agreement under specified circumstances, including (i) a change in the recommendation of the Board of Directors of JCG, (ii) a failure to obtain the requisite approvals of the stockholders of JCG, (iii) a material breach by JCG or (iv) because the merger is not consummated by the September 30, 2017 (the "Outside Date"), and in the cases set forth in clauses (ii), (iii) and (iv) above, at a time when there was an offer or proposal for an alternative transaction with respect to JCG and JCG enters into or consummates an alternative transaction, in the case of clause (ii) or (iii), within 12 months following such date of termination or in the case of clause (iv), within 12 months from the Outside Date, JCG will pay to the other party a termination fee equal to $34,000,000 in cash.
In addition, the Merger Agreement provides that if JCG or Henderson terminates the Merger Agreement because of a failure of the stockholders of JCG to approve the merger at the JCG stockholder meeting, JCG will reimburse Henderson for its actual out-of-pocket fees and expenses up to an aggregate amount equal to $10,000,000 in cash.
If the Merger Agreement is terminated and JCG determines to seek another strategic transaction, JCG may not be able to negotiate a transaction on terms comparable to, or more favorable than, the terms of the Merger Agreement.
Market and investment performance risks
JCG's revenues and profits are primarily dependent on the value, composition and relative investment performance of its investment products.
Any decrease in the value, relative investment performance or amount of assets under management will cause a decline in revenues and operating results. Assets under management may decline for various reasons, many of which are not under JCG's control.
Factors that could cause assets under management and revenues to decline include the following:
- •
- Declines in equity markets. JCG's assets under management are concentrated
in the U.S. equity markets and, to a lesser extent, in the international equity markets. As such, declines in the financial markets as a whole or the market segments in which JCG's investment products
are concentrated will cause assets under management to decrease.
- •
- Declines in fixed income markets. In the case of fixed income investment
products, which invest in high-quality short-term instruments as well as other fixed income securities of varying quality and duration, the value of the assets may decline as a result of changes in
interest rates, available liquidity in the markets in which a security trades, an issuer's actual or perceived creditworthiness, or an issuer's ability to meet its obligations.
- •
- Redemptions and other withdrawals. Investors may reduce their investments
in specific JCG investment products or in the markets in which JCG's investment products are concentrated in response to adverse market conditions, inconsistent investment performance, the pursuit of
other investment opportunities (including passive investment strategies) or other factors.
- •
- Operations in international markets. The investment products managed by JCG may have significant investments in international markets that are subject to risk of loss from political or diplomatic developments, government policies, civil unrest, currency fluctuations and changes in legislation related to foreign ownership. International markets, particularly emerging markets and frontier markets, which are often smaller and may not have the liquidity of established markets,
12
may lack established regulations and may experience significantly more volatility than established markets.
- •
- Relative investment performance. JCG's investment products are often judged on their performance as compared to benchmark indices or peer groups, or on an absolute return basis. Any period of underperformance of investment products may result in the loss of existing assets and affect JCG's ability to attract new assets. In addition, approximately 34% of the Company's assets under management at December 31, 2016, are subject to performance fees. Performance fees are based on each product's investment performance as compared to an established benchmark index over a specified period of time. If investment products subject to performance fees underperform their respective benchmark index for a defined period, JCG's revenues and thus results of operations may be adversely affected. In addition, performance fees subject JCG's revenues to increased volatility.
Changes in the value of seeded investment products could affect JCG's non-operating income or earnings and could increase the volatility of its earnings.
JCG periodically adds new investment strategies to its investment product offerings by providing the initial cash investment or "seeding" to facilitate the launch of the product. JCG may also provide substantial supplemental capital to an existing investment product in order to accelerate the growth of a strategy and attract outside investment in the product. A decline in the valuation of these seeded investments could increase the volatility of JCG's earnings and result in a decline in earnings and financial condition.
JCG's financial results could be adversely affected by the financial stability of other financial institutions.
JCG routinely executes transactions with various counterparties in the financial services industry. Historical market volatility highlights the interconnection of the global markets and demonstrates how the deteriorating financial condition of one institution may materially and adversely affect the performance of other institutions. JCG may be exposed to operational, credit or other risks in the event that a counterparty with whom the Company transacts defaults on its obligations or if there are other unrelated systemic failures in the markets.
JCG has significant goodwill and intangible assets that are subject to impairment.
Goodwill and intangible assets totaled $1.9 billion at December 31, 2016. The value of these assets may not be realized for a variety of reasons, including, but not limited to, significant redemptions, loss of clients, damage to brand name and unfavorable economic conditions. JCG has recorded goodwill and intangible asset impairments in the past and could incur similar charges in the future. JCG reviews the carrying value of goodwill and intangible assets not subject to amortization on an annual basis, or more frequently if indications exist, suggesting that the fair value of its intangible assets may be below their carrying value. JCG evaluates the value of intangible assets subject to amortization whenever events or changes in circumstances indicate that the carrying amount of an asset may not be recoverable. Should such reviews indicate impairment, a reduction of the carrying value of goodwill or intangible assets could occur, resulting in a charge that may, in turn, adversely affect JCG's assets under management, results of operations and financial condition.
13
Operational and technology risks
JCG's business may be vulnerable to failures or breaches in support systems and client services functions, and may be subject to cyberattacks.
The ability to consistently and reliably obtain securities pricing information, process client transactions and provide reports and other client services to the shareholders of funds and other investment products managed by JCG is essential to JCG's operations. Any delays, errors or inaccuracies in obtaining pricing information, processing client transactions or providing reports, and any other inadequacies in other client services functions could discourage clients, result in financial loss and potentially give rise to regulatory action and claims against JCG. Any failures of the Company's systems could adversely affect JCG's results of operations and financial condition, assets under management, and ability to maintain confidential information relating to its clients and business operations.
JCG's client services capabilities as well as JCG's ability to obtain prompt and accurate securities pricing information and to process client transactions and reports are significantly dependent on communication and information systems and services provided by third-party vendors. Also, JCG's established disaster recovery plans could suffer failures or interruptions due to various natural or man-made causes, and backup procedures and capabilities may not be adequate to avoid extended interruptions. Furthermore, JCG places significant reliance on its automated systems, thereby increasing the related risks if such systems were to fail. A failure of third-party systems or services, disaster recovery plans or automated systems could adversely affect JCG's assets under management, results of operations and financial condition.
JCG maintains confidential information relating to its clients and business operations. Authorized persons could inadvertently or intentionally release confidential or proprietary information. JCG's systems could be infiltrated by unauthorized users or damaged by computer viruses or other malicious software code as a result of cyberattacks by computer programmers and hackers. While JCG has established business continuity plans and risk management systems designed to prevent or reduce the severity of any such improprieties or cyberattacks, there are inherent limitations in such plans and systems, including the possibility that certain risks have not been identified. JCG also cannot directly control any cybersecurity plans and systems put in place by third-party service providers. Unauthorized or inadvertent disclosure of confidential or proprietary information, or cyberattacks could be detrimental to JCG's reputation and lead to legal claims, negative publicity, regulatory action, increased costs or loss of revenue, among other things, all of which could adversely affect JCG's assets under management, results of operations and financial condition.
JCG operates in a highly competitive environment and its current fee structure may be reduced.
The investment management business is highly competitive and has relatively low barriers to entry. JCG's current fee structure may be subject to downward pressure due to these factors. Moreover, in recent years there has been a trend toward lower fees in the investment management industry. Fee reductions on existing or future new business as well as changes in regulations pertaining to its fee structure could adversely affect JCG's results of operations and financial condition. Additionally, JCG competes with investment management companies on the basis of investment performance, fees, diversity of products, distribution capability, reputation and the ability to develop new investment products to meet the changing needs of investors. Failure to adequately compete could adversely affect JCG's assets under management, results of operations and financial condition.
14
JCG's results are dependent on its ability to attract and retain key personnel.
The investment management business is highly dependent on the ability to attract, retain and motivate highly skilled and often highly specialized technical, executive, sales and investment management personnel. The market for qualified investment and sales professionals is extremely competitive and is increasingly characterized by the frequent movement of portfolio managers, analysts and salespersons among different firms. Any changes to management structure, shifts in corporate culture, changes to corporate governance authority, or adjustments or reductions to compensation could affect JCG's ability to retain key personnel and could result in legal claims. If JCG is unable to retain key personnel, it could adversely affect JCG's assets under management, results of operations and financial condition.
INTECH's investment process is highly dependent on key employees and proprietary software.
INTECH's investment process is based on complex and proprietary mathematical models that seek to outperform various indices by capitalizing on the volatility in stock price movements while controlling trading costs and overall risk relative to the index. The maintenance of such models for current products and the development of new products are highly dependent on certain key INTECH employees. If INTECH is unable to retain key personnel or properly transition key personnel responsibilities to others, or if the mathematical investment strategies fail to produce the intended results, INTECH may not be able to maintain its historical level of investment performance, which could adversely affect JCG's assets under management, results of operations and financial condition.
JCG's international operations are subject to foreign risks, including political, regulatory, economic and currency risks.
JCG operates offices and advises clients outside of the U.S. and is thereby subject to risks inherent in doing business internationally. These risks may include changes in applicable laws and regulatory requirements; difficulties in staffing and managing foreign operations; difficulties in collecting investment management fees receivable; different, and in some cases less stringent, legal, regulatory and accounting regimes; political instability; fluctuations in currency exchange rates; expatriation controls; expropriation risks; and potential adverse tax consequences. These or other risks related to JCG's international operations could adversely affect the Company's assets under management, results of operations and financial condition.
JCG's business is dependent on investment management agreements that are subject to termination, non-renewal or reductions in fees.
JCG derives revenue from investment management agreements with mutual funds and other investment products. With respect to investment management agreements with mutual funds, these agreements may be terminated by either party with notice, or terminated in the event of an "assignment" (as defined in the 1940 Act), and must be approved and renewed annually by the independent members of each fund's board of directors, its trustees, or its shareowners, as required by law. In addition, the board of directors or trustees of certain funds generally may terminate these investment management agreements upon written notice for any reason and without penalty. The termination of or failure to renew one or more of these agreements or the reduction of the fee rates applicable to such agreements could have a material adverse effect on JCG's assets under management, results of operations and financial condition.
15
JCG's indebtedness could adversely affect its financial condition and results of operations.
JCG's indebtedness could limit its ability to obtain additional financing for working capital, capital expenditures, acquisitions, debt servicing requirements or other purposes. Debt servicing requirements increase JCG's vulnerability to adverse economic, market and industry conditions, and limit JCG's flexibility in planning for or reacting to changes in business operations or to the asset management industry. Any or all of the above events and factors could adversely affect JCG's assets under management, results of operations and financial condition.
Acquisitions expose JCG to risks inherent in acquiring a company.
JCG has and may acquire or invest in businesses that the Company believes will add value to its business and generate positive net returns. These acquisitions and investments may not be effective and could result in decreased earnings and harm to the Company's competitive position in the investment management industry.
Any strategic transaction can involve a number of risks, such as additional demands on JCG's existing employees and unanticipated problems regarding integration of products, technologies and new employees. As a result, the Company may not be able to realize all of the benefits that it hoped to achieve from such transactions. In addition, entering new jurisdictions or managing new products involves numerous risks such as adhering to new regulations, foreign currency exposure and the integration of new products into JCG's existing operations. JCG may be required to spend additional time or money on integration, which could decrease its earnings and prevent the Company from focusing on the development and expansion of its existing business and services.
As discussed above in Risks related to the merger with Henderson, the Merger Agreement restricts JCG from making certain acquisitions without the consent of Henderson.
Any damage to JCG's reputation could harm its business and lead to a loss of assets under management, revenues and net income.
JCG's reputation is critical to the success of its business. Any damage to the Company's reputation could impede its ability to attract and retain clients and key personnel, and could adversely affect JCG's assets under management, results of operations and financial condition.
JCG is dependent upon third-party distribution channels to access clients and potential clients.
JCG's ability to market and distribute its investment products is significantly dependent on access to the client base of insurance companies, defined contribution plan administrators, securities firms, broker-dealers, financial advisors, banks and other distribution channels. These companies generally offer their clients various investment products in addition to, and in competition with, JCG. Further, the separate account business uses referrals from financial planners, investment advisers and other professionals. JCG cannot be certain that it will continue to have access to these third-party distribution channels or have an opportunity to offer some or all of its investment products through these channels. In addition, JCG's existing relationships with third-party distributors and access to new distributors could be adversely affected by recent consolidation within the financial services industry. Consolidation may result in increased distribution costs, a reduction in the number of third parties distributing JCG's investment products or increased competition to access third-party distribution channels. The inability to access clients through third-party distribution channels could adversely affect JCG's business prospects, assets under management, results of operations and financial condition.
16
JCG may be unable to develop new products, and the development of new products may expose JCG to additional costs or operational risks.
JCG's success is partially dependent on its ability to develop, launch, market and manage new investment products. New investment products require an initial cash investment, innovation, time and the appropriate resources as well as ongoing support. The initial cash investment or "seeding" utilizes capital and liquidity that would otherwise be available for other corporate purposes. JCG may also be required to provide additional support to seeded investment products after the initial cash investment. Numerous risks and uncertainties are associated with all stages of the seeded investment product life cycle, including shifting client or market preferences, the introduction of competing products and compliance with regulatory requirements. A failure to successfully manage these risks or to innovate and introduce new seeded investment products may adversely affect JCG's business prospects, assets under management, results of operations and financial condition.
JCG is periodically involved in various legal proceedings and regulatory matters and may be involved in such proceedings in the future.
JCG and its employees are periodically involved in various legal proceedings and regulatory matters. These matters could adversely affect JCG's assets under management, results of operations and financial condition. Additionally, JCG and its employees have received and may receive in the future requests for information in connection with certain investigations or proceedings from various governmental and regulatory authorities. These investigations or proceedings may result in increased costs or reputational harm to the Company, which may adversely affect JCG's business prospects, assets under management, results of operations and financial condition.
The regulatory environment in which JCG operates has changed and may continue to change.
JCG may be adversely affected as a result of new or revised legislation or regulations, or by changes in the interpretation or enforcement of existing laws and regulations. The Company has increased its product offerings and international business activities over the past several years, resulting in increased exposure to international regulation. The costs and burdens of compliance with these and other new reporting and operational requirements and regulations have increased significantly and may continue to increase the cost of operating mutual funds and other investment products, which could adversely affect JCG's assets under management, results of operations and financial condition. (See Part I, Item 1, Business — Regulation)
ITEM 1B. UNRESOLVED STAFF COMMENTS
None.
JCG's headquarters are located in Denver, Colorado. JCG leases office space from non-affiliated companies for administrative, investment and client servicing operations in the following locations:
Domestic properties
- •
- Boston, Massachusetts
- •
- Chicago, Illinois
- •
- Darien, Connecticut
17
- •
- Denver, Glendale and Aurora, Colorado
- •
- Newport Beach, California
- •
- Princeton, New Jersey
- •
- San Francisco, California
- •
- West Palm Beach, Florida
International properties
- •
- Dubai
- •
- Frankfurt
- •
- Hong Kong
- •
- London
- •
- Melbourne
- •
- Milan
- •
- Paris
- •
- Singapore
- •
- Sydney
- •
- Taipei
- •
- The Hague
- •
- Tokyo
- •
- Zurich
In the opinion of management, the space and equipment owned or leased by the Company are adequate for existing operating needs.
The information set forth in response to Item 103 of Regulation S-K under "Legal Proceedings" is incorporated by reference from Part II, Item 8, Financial Statements and Supplementary Data, Note 18 — Commitments and Contingencies.
ITEM 4. MINE SAFETY DISCLOSURES
Not applicable.
18
ITEM 5. MARKET FOR REGISTRANT'S COMMON EQUITY, RELATED STOCKHOLDER MATTERS AND ISSUER PURCHASES OF EQUITY SECURITIES
JCG Common Stock
JCG's common stock is traded on the NYSE (symbol: JNS). The following table presents the high and low sale prices as reported on the NYSE composite tape for each completed quarter in 2016 and 2015.
| |
2016 | 2015 | |||||||||||
|---|---|---|---|---|---|---|---|---|---|---|---|---|---|
Quarter
|
High | Low | High | Low | |||||||||
First |
$ | 14.69 | $ | 11.47 | $ | 18.59 | $ | 15.56 | |||||
Second |
$ | 15.71 | $ | 13.14 | $ | 18.75 | $ | 16.66 | |||||
Third |
$ | 15.10 | $ | 13.63 | $ | 17.29 | $ | 13.29 | |||||
Fourth |
$ | 15.70 | $ | 12.36 | $ | 16.01 | $ | 13.37 | |||||
The following graph illustrates the cumulative total shareholder return (rounded to the nearest whole dollar) of JCG's common stock over the five-year period ending December 31, 2016, the last trading day of 2016, and compares it to the cumulative total return on the Standard and Poor's ("S&P") 500 Index and the S&P Diversified Financials Index. The comparison assumes a $100 investment on December 31, 2011, in JCG's common stock and in each of the foregoing indices and assumes reinvestment of dividends, if any. This data is not intended to forecast future performance of JCG's common stock.
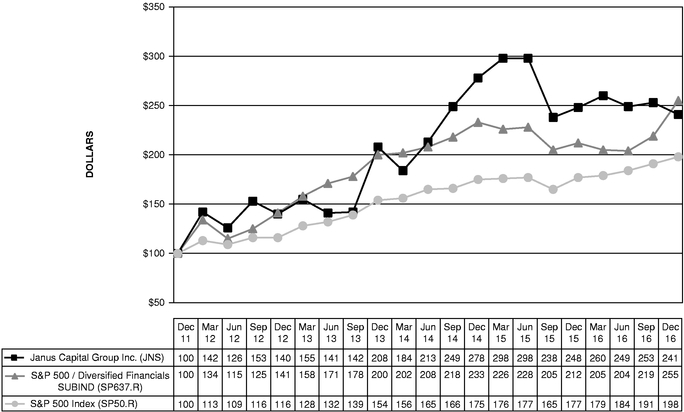
On December 31, 2016, there were approximately 2,114 holders of record of JCG's common stock.
19
Dividends
The payment of cash dividends is within the discretion of JCG's Board of Directors and depends on many factors, including, but not limited to, JCG's results of operations, financial condition, capital requirements, restrictions imposed by financing arrangements, general business conditions and legal requirements. Dividends are subject to quarterly declaration by JCG's Board of Directors.
On April 21, 2016, JCG's Board of Directors approved an increase of $0.02 per share, or 22%, in the Company's regular quarterly dividend. The approved quarterly rate of $0.11 per share represents an expected annualized dividend rate of $0.44 per share of common stock.
The Merger Agreement requires JCG to operate its business in the ordinary course and, subject to certain exceptions, may prevent JCG from taking certain actions without the approval of Henderson, including, but not limited to, dividend payments. However, under the terms of the Merger Agreement, subject to the approval of the JCG Board of Directors, JCG is permitted to pay a cash dividend in respect to the fourth quarter of 2016.
On January 19, 2017, JCG's Board of Directors declared a regular quarterly cash dividend of $0.11 per share in respect to the fourth quarter 2016. The quarterly dividend will be paid on February 17, 2017, to shareholders of record at the close of business on February 6, 2017.
Subsequent to the Merger Agreement, JCG and Henderson agreed to separately pay regular quarterly cash dividends in respect to the first quarter 2017 during the second quarter 2017, subject to respective board approvals.
The following cash dividends were declared and paid during 2016:
Dividend per share |
Date declared |
Dividends paid (in millions) |
Date paid | |||
|---|---|---|---|---|---|---|
| $ 0.09 | January 19 | $ 16.7 | February 25 | |||
| $ 0.11 | April 21 | $ 20.3 | May 20 | |||
| $ 0.11 | July 21 | $ 20.1 | August 19 | |||
| $ 0.11 | October 20 | $ 20.1 | November 18 |
JCG declared and paid three $0.09 per share dividends and one $0.08 per share dividend in 2015. JCG declared and paid three $0.08 per share dividends and one $0.07 per share dividend in 2014.
Common Stock Repurchases
JCG's Board of Directors authorized a $500 million share repurchase program in July 2008. During the year ended December 31, 2016, JCG repurchased 3,772,389 shares of its common stock at an average price of $13.95 per share and a total cost of $52.6 million as part of the share repurchase program. The share repurchase program is conducted within the parameters of Rule 10b5-1 under the Exchange Act. After the Merger Agreement, JCG ceased share repurchases and does not intend on utilizing the share repurchase program while the merger progresses toward the expected close date on or about May 30, 2017.
JCG also repurchased 406,659 shares of common stock from Dai-ichi Life on August 1, 2016, for a total cost of $5.9 million in order for Dai-ichi Life to comply with the ownership limit obligations under the investment agreement between JCG and Dai-ichi Life. At December 31, 2016, Dai-ichi Life owned approximately 20% of the outstanding common shares of the Company.
In addition to the share repurchase program, during the year ended December 31, 2016, JCG withheld 1,085,600 shares from employees as part of a share withholding program to satisfy the employees' minimum statutory income tax liabilities attributable to the vesting of restricted stock. The withheld shares had a value of $13.6 million and were deposited into treasury shares.
20
The following table presents total 2016 JCG common stock repurchases by month as part of the share repurchase programs:
Period
|
Total number of shares purchased |
Average price paid per share |
Total number of shares purchased as part of publicly announced programs |
Approximate dollar value of shares that may yet be purchased under the programs (end of month) |
|||||||||
|---|---|---|---|---|---|---|---|---|---|---|---|---|---|
January |
| 2,046 | $ | 13.53 | | — | $ | 313 million | |||||
February |
1,754,714 | 12.29 | 817,725 | $ | 303 million | ||||||||
March |
| 786,024 | | 14.01 | | 786,024 | $ | 292 million | |||||
April |
549,462 | 14.75 | 542,005 | $ | 284 million | ||||||||
May |
| 542,518 | | 14.51 | | 542,518 | $ | 276 million | |||||
June |
567,800 | 14.53 | 567,800 | $ | 268 million | ||||||||
July |
| 531,678 | | 14.52 | | 516,317 | $ | 260 million | |||||
August |
407,079 | 14.50 | 406,659 | $ | 254 million | ||||||||
September |
| — | | 0.00 | | — | $ | 254 million | |||||
October |
1,719 | 16.06 | — | $ | 254 million | ||||||||
November |
| — | | 0.00 | | — | $ | 254 million | |||||
December |
121,608 | 13.41 | — | $ | 254 million | ||||||||
| | | | | | | | | | | | | | |
Total |
| 5,264,648 | $ | 13.70 | | 4,179,048 | | ||||||
| | | | | | | | | | | | | | |
| | | | | | | | | | | | | | |
| | | | | | | | | | | | | | |
21
ITEM 6. SELECTED FINANCIAL DATA
The selected financial data below was derived from the Company's consolidated financial statements and should be read in conjunction with Part II, Item 7, Management's Discussion and Analysis of Financial Condition and Results of Operations, and Part II, Item 8, Financial Statements and Supplementary Data.
| |
Year ended December 31, | |||||||||||||||
|---|---|---|---|---|---|---|---|---|---|---|---|---|---|---|---|---|
| |
2016 | 2015 | 2014 | 2013 | 2012 | |||||||||||
| |
(dollars in millions, except per share data and where noted) |
|||||||||||||||
Income statement data: |
| | | | | |||||||||||
Operating revenues |
$ | 1,010.7 | $ | 1,076.2 | $ | 953.2 | $ | 873.9 | $ | 850.0 | ||||||
Operating income |
$ | 261.6 | $ | 322.3 | $ | 289.7 | $ | 239.1 | $ | 214.5 | ||||||
Adjusted operating income (1) |
$ | 274.9 | $ | 322.3 | $ | 289.7 | $ | 239.1 | $ | 214.5 | ||||||
Operating margin |
| 25.9 | % | | 29.9 | % | | 30.4 | % | | 27.4 | % | | 25.2 | % | |
Adjusted operating margin (1) |
27.2 | % | 29.9 | % | 30.4 | % | 27.4 | % | 25.2 | % | ||||||
Net income attributable to JCG |
$ | 146.1 | $ | 155.8 | $ | 154.4 | $ | 114.7 | $ | 102.3 | ||||||
Adjusted net income attributable to JCG (1) |
$ | 156.6 | $ | 178.6 | $ | 154.4 | $ | 114.7 | $ | 102.3 | ||||||
Per share data: |
|
|
|
|
|
|||||||||||
Basic earnings per share |
$ | 0.79 | $ | 0.84 | $ | 0.82 | $ | 0.62 | $ | 0.56 | ||||||
Diluted earnings per share |
$ | 0.78 | $ | 0.80 | $ | 0.81 | $ | 0.62 | $ | 0.55 | ||||||
Adjusted diluted earnings per share (1) |
$ | 0.83 | $ | 0.92 | $ | 0.81 | $ | 0.62 | $ | 0.55 | ||||||
Dividends declared and paid |
$ | 0.42 | $ | 0.35 | $ | 0.31 | $ | 0.21 | $ | 0.29 | ||||||
Balance sheet data: |
||||||||||||||||
Total assets |
$ | 2,949.9 | $ | 2,871.5 | $ | 2,790.5 | $ | 2,743.5 | $ | 2,657.5 | ||||||
Long-term debt (including current portion) |
$ |
406.3 |
$ |
406.1 |
$ |
447.8 |
$ |
540.8 |
$ |
542.2 |
||||||
Deferred income taxes, net |
$ | 502.8 | $ | 498.9 | $ | 478.4 | $ | 447.7 | $ | 436.0 | ||||||
Other non-current liabilities |
$ | 46.7 | $ | 46.2 | $ | 41.2 | $ | 32.4 | $ | 41.8 | ||||||
Redeemable noncontrolling interests |
$ |
43.1 |
$ |
21.8 |
$ |
5.4 |
$ |
7.3 |
$ |
42.9 |
||||||
Other data: |
||||||||||||||||
Cash flows provided by operating activities |
$ | 262.2 | $ | 274.4 | $ | 218.4 | $ | 224.1 | $ | 208.9 | ||||||
Assets under management (in billions): |
||||||||||||||||
Ending AUM (2) |
$ | 194.5 | $ | 189.1 | $ | 183.1 | $ | 173.9 | $ | 156.8 | ||||||
Average AUM (2) |
$ | 189.3 | $ | 190.6 | $ | 175.8 | $ | 165.4 | $ | 156.3 | ||||||
Long-term net flows (2) (3) |
$ | (3.0 | ) | $ | (2.6 | ) | $ | (4.9 | ) | $ | (19.7 | ) | $ | (12.0 | ) | |
- (1)
- Item
represents a non-GAAP financial measure. See Part II, Item 7, Management's Discussion and Analysis of Financial Condition and Results of
Operations — Non-GAAP Financial Measures, for the definition of these measures and the related reconciliation reference.
- (2)
- Does
not include VelocityShares ETNs. VelocityShares was acquired in 2014; prior to that JCG did not offer ETNs.
- (3)
- Long-term net flows represent total Company net sales and redemptions, excluding money market and ETNs.
22
ITEM 7. MANAGEMENT'S DISCUSSION AND ANALYSIS OF FINANCIAL CONDITION AND RESULTS OF OPERATIONS
JCG finished 2016 with assets under management of $194.5 billion, an increase of 2.9% from the end of 2015, as a result of market appreciation partially offset by long-term net outflows. Long-term net flows deteriorated in 2016 driven by net redemptions in mathematical equity strategies of $3.4 billion, net redemptions in JCG's fundamental equity strategies of $0.9 billion, partially offset by net sales in fixed income strategies of $1.3 billion.
Total operating revenue for JCG in 2016 of $1,010.7 million decreased $65.5 million from 2015 as a result of decreased investment management fees in 2016 due to lower average assets under management and a product mix shift to lower yielding products. Increased negative mutual fund performance fees in 2016 also contributed to the year-over-year decrease in total operating revenue.
JCG realized operating margins of 25.9% and 29.9% for 2016 and 2015, respectively. Merger-related expenses of $13.3 million in the second half of 2016 had a negative impact on operating margin for 2016. Operating margin, adjusted for merger-related expenses, for the year ended December 31, 2016, was 27.2%. See Non-GAAP Financial Measures discussion.
Net income attributable to JCG for 2016 totaled $146.1 million, or $0.78 per diluted share, compared with $155.8 million, or $0.80 per diluted share, for 2015. Net income attributable to JCG, adjusted for merger-related costs, for the year ended December 31, 2016, totaled $156.6 million, or $0.83 per diluted share on an adjusted basis. Net income attributable to JCG, adjusted for the loss on early extinguishment of debt, for the year ended December 31, 2015, totaled $178.6 million, or $0.92 per diluted share on an adjusted basis. See Non-GAAP Financial Measures discussion.
JCG continued to execute on a number of strategic priorities in 2016. A summary of accomplishments include the following:
- •
- Announced business combination of JCG and Henderson — The merger of the two
firms is transformative, accelerating the Company's strategic efforts around growth, diversification and globalization.
- •
- The merger will create a combined company with highly complementary businesses that have a larger geographic footprint, compatible cultures and
a shared focus on delivering excellent investment performance and service to clients.
- •
- The combined company would accelerate both JCG's and Henderson's objectives to achieve growth, diversification and globalization, creating a
more global active investment manager with enhanced scale and market position.
- •
- The merger is expected to combine the talent pools of both organizations to build a strong global team with enhanced capabilities to innovate
on behalf of clients and to create a leading independent active asset manager with a globally relevant brand, footprint, investment proposition and client service capability.
- •
- The combined company is expected to have an expanded client-facing team that will permit it to deepen client relationships and increase growth
opportunities across a wider range of investment products and geographies.
- •
- The combined company will have a more diversified revenue mix across products, geographies and clients giving it a greater ability to maintain revenue levels and profitability across market cycles than JCG on a standalone basis.
23
- •
- Gaining market share in the U.S. intermediary channel — JCG's investments in
the U.S. intermediary business are translating into market share gains. In 2016, this channel had $2.8 billion of net inflows, an approximate 5% annual organic growth rate, which compared
favorably on a relative basis to meaningful outflows across the U.S. active mutual fund industry.
- •
- Continuing to grow the fixed income franchise — In 2016, JCG realized net
inflows of $1.3 billion, an annual organic growth rate of approximately 3%, marking the eighth consecutive year of organic growth for this business. Growth during 2016 came from both retail and
institutional clients in both U.S. and non-U.S. markets.
- •
- Further expanding non-U.S. distribution capabilities and product offerings — The non-U.S. business had full-year 2016 net inflows of
$2.7 billion, an approximate 6% organic growth rate, representing the sixth consecutive year of organic growth
for this business. JCG's strategic alliance with Dai-ichi Life continues to assist with the Company's ongoing growth in Japan.
- •
- Maintaining a strong balance sheet — JCG's balance sheet continues to be strong with $795.7 million of cash and investment securities and $416.6 million of outstanding debt (outstanding debt represents total principal outstanding).
Investment Performance of Assets Under Management
Investment products are generally evaluated based on their investment performance relative to other investment products with similar disciplines and strategies or benchmark indices.
The following table is a summary of investment performance as of December 31, 2016:
| |
Percentage of mutual fund assets outperforming majority of Morningstar peers (1) |
|||||||||
|---|---|---|---|---|---|---|---|---|---|---|
| |
1-Year | 3-Year | 5-Year | |||||||
Complex-wide mutual fund assets |
| 40 | % | | 71 | % | | 74 | % | |
Fundamental equity mutual fund assets |
46 | % | 81 | % | 73 | % | ||||
Fixed income mutual fund assets |
| 11 | % | | 16 | % | | 84 | % | |
| |
Percentage of relative return strategies outperforming respective benchmarks (2) |
|||||||||
|---|---|---|---|---|---|---|---|---|---|---|
| |
1-Year | 3-Year | 5-Year | |||||||
Mathematical equity strategies |
| 0 | % | | 6 | % | | 15 | % | |
| |
Percentage of complex-wide mutual funds with 4- or 5-star Overall Morningstar RatingTM |
|
|---|---|---|
Complex-wide mutual funds |
58% |
- (1)
- References
Morningstar relative performance on an asset-weighted, total return basis.
- (2)
- References performance of relative return strategies, net of fees.
Fundamental equity investment performance was disappointing on 1-year basis due to underperformance in 2016 but remained strong on a 3-year and 5-year basis. The Company's largest Janus equity funds underperformed during 2016 while Perkins saw a continuation of better performance in 2016.
24
Mathematical equity strategies investment performance in 2016 was disappointing and negatively affected the percentage of relative return strategies outperforming respective benchmarks on a 1-year, 3-year and 5-year basis.
Assets Under Management and ETNs
Total Company assets under management increased $5.4 billion, or 2.9%, from 2015 largely due to market appreciation of $8.6 billion, partially offset by long-term net outflows of $3.0 billion. Long-term net flows represent total Company net sales and redemptions, excluding money market assets. Money market net outflows were $0.2 billion in 2016.
Fundamental equity net outflows were $0.9 billion in 2016 compared with $1.5 billion in 2015. The decrease in net outflows was primarily driven by improved investment performance and decreased redemptions in 2016.
Positive net flows for fixed income continued in 2016 with net inflows of $1.3 billion compared to $3.3 billion in 2015. The year-over-year change in net inflows was driven by increased redemptions.
Mathematical equity net outflows were $3.4 billion in 2016 compared with $4.4 billion in 2015. Net outflows continue to be primarily driven by investment underperformance.
ETN assets contributed $2.3 billion to complex-wide assets, a decrease of $0.9 billion from 2015 primarily due to increased redemptions in 2016.
The following table presents the components of JCG's assets under management for the years ended December 31, 2016, 2015 and 2014 (in billions):
| |
Year ended December 31, | |||||||||
|---|---|---|---|---|---|---|---|---|---|---|
| |
2016 | 2015 | 2014 | |||||||
Beginning of year assets |
$ | 189.1 | $ | 183.1 | $ | 173.9 | ||||
Long-term sales (1) |
||||||||||
Fundamental equity |
| 20.1 | | 24.9 | | 18.6 | ||||
Fixed income |
15.6 | 16.2 | 13.7 | |||||||
Mathematical equity |
| 5.1 | | 6.6 | | 6.6 | ||||
Long-term redemptions (1) |
||||||||||
Fundamental equity |
| (21.0 | ) | | (26.4 | ) | | (26.2 | ) | |
Fixed income |
(14.3 | ) | (12.9 | ) | (9.3 | ) | ||||
Mathematical equity |
| (8.5 | ) | | (11.0 | ) | | (8.3 | ) | |
| | | | | | | | | | | |
Long-term net flows (1) |
||||||||||
Fundamental equity |
| (0.9 | ) | | (1.5 | ) | | (7.6 | ) | |
Fixed income |
1.3 | 3.3 | 4.4 | |||||||
Mathematical equity |
| (3.4 | ) | | (4.4 | ) | | (1.7 | ) | |
| | | | | | | | | | | |
Total long-term net flows |
(3.0 | ) | (2.6 | ) | (4.9 | ) | ||||
Net money market flows |
| (0.2 | ) | | — | | (0.1 | ) | ||
Acquisition |
— | 7.1 | — | |||||||
Market/fund performance |
| 8.6 | | 1.5 | | 14.2 | ||||
| | | | | | | | | | | |
End of year assets (2) |
$ | 194.5 | $ | 189.1 | $ | 183.1 | ||||
| | | | | | | | | | | |
| | | | | | | | | | | |
| | | | | | | | | | | |
- (1)
- Excludes money market flows. Sales and redemptions of money market funds are presented net on a separate line due to the short-term nature of the investments.
25
- (2)
- Excludes ETN assets of $2.3 billion, $3.2 billion and $2.4 billion as of December 31, 2016, 2015 and 2014, respectively.
| |
Year ended December 31, | |||||||||
|---|---|---|---|---|---|---|---|---|---|---|
| |
2016 | 2015 | 2014 | |||||||
Average assets under management: (1) |
| | | |||||||
Fundamental equity |
$ | 94.7 | $ | 99.5 | $ | 94.0 | ||||
Fixed income |
| 45.7 | | 39.5 | | 31.3 | ||||
Mathematical equity |
47.6 | 50.3 | 49.1 | |||||||
Money market |
| 1.3 | | 1.3 | | 1.4 | ||||
| | | | | | | | | | | |
Total |
$ | 189.3 | $ | 190.6 | $ | 175.8 | ||||
| | | | | | | | | | | |
| | | | | | | | | | | |
| | | | | | | | | | | |
- (1)
- Excludes ETN assets.
Assets and Flows by Investment Discipline
JCG, through its subsidiaries, offers investment products based on a diversified set of investment disciplines. Assets and flows by investment discipline are as follows (in billions):
| |
Growth / Core (1) (4) |
Global / International (4) |
Mathematical Equity |
Fixed Income (1) |
Value | Total Company (Excluding Money Market and ETNs) |
ETNs (2) | Money Market |
Total Company |
|||||||||||||||||||
|---|---|---|---|---|---|---|---|---|---|---|---|---|---|---|---|---|---|---|---|---|---|---|---|---|---|---|---|---|
December 31, 2016 |
$ | 70.1 | $ | 19.6 | $ | 46.7 | $ | 47.2 | $ | 9.8 | $ | 193.4 | $ | 2.3 | $ | 1.1 | $ | 196.8 | ||||||||||
Sales |
14.9 | 2.9 | 5.1 | 15.6 | 2.3 | 40.8 | 12.3 | 0.7 | 53.8 | |||||||||||||||||||
Redemptions |
| (13.2 | ) | | (5.5 | ) | | (8.5 | ) | | (14.3 | ) | | (2.3 | ) | | (43.8 | ) | | (13.1 | ) | | (0.9 | ) | | (57.8 | ) | |
| | | | | | | | | | | | | | | | | | | | | | | | | | | | | |
Net sales (redemptions) |
1.7 | (2.6 | ) | (3.4 | ) | 1.3 | — | (3.0 | ) | (0.8 | ) | (0.2 | ) | (4.0 | ) | |||||||||||||
Market/fund performance |
| 3.9 | | (0.7 | ) | | 2.5 | | 1.5 | | 1.4 | | 8.6 | | (0.1 | ) | | — | | 8.5 | ||||||||
| | | | | | | | | | | | | | | | | | | | | | | | | | | | | |
December 31, 2015 |
$ | 64.5 | $ | 22.9 | $ | 47.6 | $ | 44.4 | $ | 8.4 | $ | 187.8 | $ | 3.2 | $ | 1.3 | $ | 192.3 | ||||||||||
| | | | | | | | | | | | | | | | | | | | | | | | | | | | | |
Sales |
| 13.7 | | 9.4 | | 6.6 | | 16.2 | | 1.8 | | 47.7 | | 12.6 | | 0.7 | | 61.0 | ||||||||||
Redemptions |
(14.0 | ) | (7.2 | ) | (11.0 | ) | (12.9 | ) | (5.2 | ) | (50.3 | ) | (9.3 | ) | (0.7 | ) | (60.3 | ) | ||||||||||
| | | | | | | | | | | | | | | | | | | | | | | | | | | | | |
Net sales (redemptions) |
| (0.3 | ) | | 2.2 | | (4.4 | ) | | 3.3 | | (3.4 | ) | | (2.6 | ) | | 3.3 | | — | | 0.7 | ||||||
Market/fund performance |
1.4 | (0.1 | ) | 1.0 | (0.4 | ) | (0.4 | ) | 1.5 | (2.5 | ) | — | (1.0 | ) | ||||||||||||||
Acquisitions (3) |
| — | | — | | — | | 7.1 | | — | | 7.1 | | — | | — | | 7.1 | ||||||||||
| | | | | | | | | | | | | | | | | | | | | | | | | | | | | |
December 31, 2014 |
$ | 63.4 | $ | 20.8 | $ | 51.0 | $ | 34.4 | $ | 12.2 | $ | 181.8 | $ | 2.4 | $ | 1.3 | $ | 185.5 | ||||||||||
| | | | | | | | | | | | | | | | | | | | | | | | | | | | | |
Sales |
| 10.5 | | 5.6 | | 6.6 | | 13.7 | | 2.5 | | 38.9 | | 1.1 | | 0.6 | | 40.6 | ||||||||||
Redemptions |
(13.7 | ) | (5.2 | ) | (8.3 | ) | (9.3 | ) | (7.3 | ) | (43.8 | ) | (0.4 | ) | (0.7 | ) | (44.9 | ) | ||||||||||
| | | | | | | | | | | | | | | | | | | | | | | | | | | | | |
Net sales (redemptions) |
| (3.2 | ) | | 0.4 | | (1.7 | ) | | 4.4 | | (4.8 | ) | | (4.9 | ) | | 0.7 | | (0.1 | ) | | (4.3 | ) | ||||
Market/fund performance |
6.2 | 0.7 | 5.1 | 1.1 | 1.1 | 14.2 | (0.6 | ) | — | 13.6 | ||||||||||||||||||
Acquisitions (2) |
| — | | — | | — | | — | | — | | — | | 2.3 | | — | | 2.3 | ||||||||||
| | | | | | | | | | | | | | | | | | | | | | | | | | | | | |
December 31, 2013 |
$ | 60.4 | $ | 19.7 | $ | 47.6 | $ | 28.9 | $ | 15.9 | $ | 172.5 | $ | — | $ | 1.4 | $ | 173.9 | ||||||||||
- (1)
- Growth/Core
and Fixed Income disciplines reflect an even split of the Janus Balanced Fund between the two categories.
- (2)
- VelocityShares
was acquired in the fourth quarter 2014; prior to that JCG did not offer ETNs.
- (3)
- Kapstream
was acquired on July 1, 2015.
- (4)
- Assets and flows for all time periods reflect a recategorization of the Janus Global Real Estate Fund from the Growth / Core to Global / International discipline.
26
Valuation of Assets Under Management
The fair value of assets under management is derived from the cash and investment securities underlying JCG's investment products. Investment security values are determined using unadjusted or adjusted quoted market prices and independent third-party price quotes in active markets. The fair value of the vast majority of the equity securities underlying JCG's investment products is derived from readily available and reliable market price quotations while the fair value of a majority of the fixed income securities is derived from evaluated pricing from independent third-party providers. JCG uses adjusted market prices to value certain international equity securities in its domestic and non-domestic mutual funds to adjust for stale pricing that may occur between the close of certain foreign exchanges and the NYSE. Security prices are adjusted based upon historical impacts for similar post-close activity. For fixed income securities with maturities of 60 days or less, the amortized cost method is used to determine the value. Securities for which market prices are not readily available or are considered unreliable are internally valued using appropriate methodologies for each security type or by engaging third-party specialists.
The pricing policies for mutual funds advised by JCG's subsidiaries (the "Funds") are established by the Funds' Independent Board of Trustees and are designed to test and validate fair value measurements. Responsibility for pricing securities held within separate and subadvised accounts may be delegated by the separate or subadvised clients to JCG or another party.
JCG performs a number of procedures to validate the pricing received from third-party providers. For actively traded equity securities, prices are received daily from both a primary and secondary vendor. For fixed income securities, prices are received daily from a primary vendor and weekly from a secondary vendor. Prices from the primary and secondary vendors are compared to identify any discrepancies. In the event of a discrepancy, a price challenge may be issued to both vendors. Securities with significant day-to-day price changes require additional research, which may include a review of all news pertaining to the issue and issuer and any corporate actions. All fixed income prices are reviewed by JCG's fixed income trading desk to incorporate market activity information available to JCG's traders. In the event the traders have received price indications from market makers for a particular issue, this information is transmitted to the pricing vendors.
All pricing vendors are subject to an annual on-site due diligence review that includes a detailed discussion about the methodologies used, particularly for evaluated prices, and any changes to the methodologies.
JCG is generally not the pricing agent for securities held within separate and subadvised accounts. However, JCG does perform a daily reconciliation between the pricing performed by the pricing agent and the pricing applied based on JCG's procedures. Any pricing discrepancies are resolved with the client designated pricing agent.
Operating Revenues
Operating revenues are generally based upon a percentage of the market value of assets under management and are calculated as a percentage of the daily average asset balance in accordance with contractual agreements. Certain mutual funds and separate accounts are also subject to performance fees, which vary based on a product's relative performance as compared to an established benchmark index over a specified period of time and the level of assets subject to such fees. Assets under management primarily consist of domestic and international equity and debt securities. Accordingly, fluctuations in domestic and international financial markets, relative investment performance, sales and redemptions of investment products, and changes in the composition of assets under management are all factors that have a direct effect on JCG's operating
27
results. The following graph depicts the direct relationship between average assets under management and operating revenues:
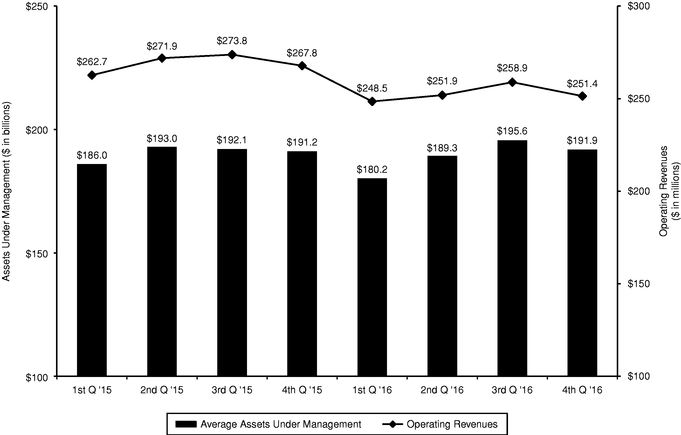
Operating Revenues
| |
Year ended December 31, | |
|
|||||||||||||
|---|---|---|---|---|---|---|---|---|---|---|---|---|---|---|---|---|
| |
2016 vs. 2015 |
2015 vs. 2014 |
||||||||||||||
| |
2016 | 2015 | 2014 | |||||||||||||
Operating revenues (in millions): |
| | | | | |||||||||||
Investment management fees |
$ | 878.2 | $ | 913.7 | $ | 849.1 | (3.9 | )% | 7.6 | % | ||||||
Performance fees |
| (36.6 | ) | | (9.8 | ) | | (48.0 | ) | | (273.5 | )% | | 79.6 | % | |
Shareowner servicing fees and other |
169.1 | 172.3 | 152.1 | (1.9 | )% | 13.3 | % | |||||||||
| | | | | | | | | | | | | | | | | |
Total operating revenues |
$ | 1,010.7 | $ | 1,076.2 | $ | 953.2 | | (6.1 | )% | | 12.9 | % | ||||
| | | | | | | | | | | | | | | | | |
| | | | | | | | | | | | | | | | | |
| | | | | | | | | | | | | | | | | |
Investment Management Fees
Investment management fees decreased $35.5 million from 2015 to 2016 primarily due to a 0.7% decrease in average assets under management and a product mix shift to lower yielding products.
Investment management fees increased $64.6 million from 2014 to 2015 primarily as a result of an 8.4% increase in average assets under management driven by market appreciation, the addition of $7.1 billion in assets under management related to the Kapstream acquisition, and a reduction in long-term net outflows.
28
Performance Fees
Performance fee revenue is derived from certain mutual funds and separate accounts. Performance fee revenue consisted of the following for the years ended December 31, 2016, 2015 and 2014 (in millions):
| |
Year ended December 31, | |||||||||
|---|---|---|---|---|---|---|---|---|---|---|
| |
2016 | 2015 | 2014 | |||||||
Mutual fund performance fees |
$ | (46.4 | ) | $ | (28.8 | ) | $ | (59.7 | ) | |
Separate account performance fees |
9.8 | 19.0 | 11.7 | |||||||
| | | | | | | | | | | |
Total performance fees |
$ | (36.6 | ) | $ | (9.8 | ) | $ | (48.0 | ) | |
| | | | | | | | | | | |
| | | | | | | | | | | |
| | | | | | | | | | | |
Negative mutual fund performance fees are driven by underperformance of certain mutual funds against their respective benchmarks. Negative mutual fund performance fees increased by $17.6 million from 2015 to 2016, primarily due to underperformance of certain funds against their respective benchmarks.
Negative mutual fund performance fees improved $30.9 million from 2014 to 2015, primarily as a result of improved investment performance and the roll-off of historical underperformance of certain mutual funds against their respective benchmarks.
Separate account performance fees relate largely to assets managed by INTECH. The decline in separate account performance fees is primarily due to the underperformance of INTECH accounts against their respective benchmarks. Separate account performance fees are recognized on a quarterly or annual basis.
Refer to Item 7A — Quantitative and Qualitative Disclosures about Market Risk, for a detailed discussion regarding the calculation of performance fees.
A summary of mutual fund and separate account assets subject to performance fees as of December 31, 2016 and 2015, is as follows (in billions):
| |
December 31, | ||||||
|---|---|---|---|---|---|---|---|
| |
2016 | 2015 | |||||
Mutual fund assets |
$ | 39.2 | $ | 42.0 | |||
Separate account assets |
$ | 25.9 | $ | 21.5 | |||
Shareowner Servicing Fees and Other
Shareowner servicing fees and other largely comprises transfer agent fees and revenue on VelocityShares-branded products. Shareowner servicing fees and other increased $20.2 million from 2014 to 2015 due to a full year of VelocityShares revenue included in 2015 and an increase in transfer agent fees due to an increase in average assets under management in 2015.
29
Operating Expenses
| |
Year ended December 31, | |
|
|||||||||||||
|---|---|---|---|---|---|---|---|---|---|---|---|---|---|---|---|---|
| |
2016 vs. 2015 |
2015 vs. 2014 |
||||||||||||||
| |
2016 | 2015 | 2014 | |||||||||||||
Operating Expenses (in millions): |
| | | | | |||||||||||
Employee compensation and benefits |
$ | 344.0 | $ | 352.5 | $ | 322.8 | (2.4 | )% | 9.2 | % | ||||||
Long-term incentive compensation |
| 78.9 | | 76.8 | | 51.3 | | 2.7 | % | | 49.7 | % | ||||
Marketing and advertising |
23.0 | 22.0 | 19.5 | 4.5 | % | 12.8 | % | |||||||||
Distribution |
| 133.0 | | 141.0 | | 131.0 | | (5.7 | )% | | 7.6 | % | ||||
Depreciation and amortization |
35.5 | 33.0 | 25.6 | 7.6 | % | 28.9 | % | |||||||||
General, administrative and occupancy |
| 134.7 | | 128.6 | | 113.3 | | 4.7 | % | | 13.5 | % | ||||
| | | | | | | | | | | | | | | | | |
Total operating expenses |
$ | 749.1 | $ | 753.9 | $ | 663.5 | (0.6 | )% | 13.6 | % | ||||||
| | | | | | | | | | | | | | | | | |
| | | | | | | | | | | | | | | | | |
| | | | | | | | | | | | | | | | | |
Employee Compensation and Benefits
Employee compensation and benefits decreased $8.5 million from 2015 to 2016 principally due to lower incentive compensation as a result of lower operating income. The company-wide incentive compensation plan is designed to link variable compensation to operating income. Higher incentive compensation on higher operating income contributed to the $29.7 million increase from 2014 to 2015.
Long-Term Incentive Compensation
Long-term incentive compensation increased $2.1 million from 2015 to 2016 primarily due to $18.1 million of expense associated with new awards granted in 2016 and $2.6 million of forfeiture rate adjustments, partially offset by $17.6 million of vesting of awards granted in prior years and changes in long-term incentive compensation vesting assumptions.
Long-term incentive compensation increased $25.5 million from 2014 to 2015 primarily due to $20.5 million of expense from new awards granted during 2015. Also contributing to the variance were increases of $12.2 million in senior profits interests awards expense for INTECH and $12.0 million for the reduction of Perkins senior profits interests expense in 2014. These increases were partially offset by decreases of $16.2 million from the vesting of awards granted in previous years and a decrease of $2.4 million due to mark-to-market adjustments for changes in fair value of mutual fund share awards and investments related to deferred compensation plans.
JCG generally grants long-term incentive awards in January or February of each year. The 2017 annual grant totaled $57.2 million and will generally be recognized ratably over a four-year period. Long-term incentive compensation expense for the year ended December 31, 2017, is currently expected to be approximately $75 million to $80 million.
Refer to Item 7 — Liquidity and Capital Resources, for a detailed discussion of the INTECH long-term incentive awards.
Distribution
Distribution represents fees paid to financial intermediaries for distribution of JCG's investment products. Distribution decreased $8.0 million from 2015 to 2016 primarily due to a decrease in average assets under management. Distribution increased $10.0 million from 2014 to 2015 primarily due to an increase in average assets under management. Distribution fees are calculated based on a contractual percentage of the market value of assets under management distributed through third-party intermediaries.
30
Depreciation and Amortization
Depreciation and amortization increased $2.5 million from 2015 to 2016 primarily due to a leasehold improvement impairment charge of $3.7 million recognized during the year ended December 31, 2016, increased amortization of intangibles related to the Kapstream acquisition partially offset by decreased amortization of deferred commissions. Depreciation and amortization increased $7.4 million from 2014 to 2015 primarily due to increased amortization of deferred commissions driven by higher mutual fund sales on certain share classes, the amortization of intangibles related to the Kapstream acquisition and increased depreciation from property, equipment and software purchases.
General, Administrative and Occupancy
General, administrative and occupancy increased $6.1 million from 2015 to 2016 primarily due to $12.4 million in merger-related expenses recognized in the second half of 2016 partially offset by the recognition of a $2.8 million loss on the reimbursement to a certain Janus mutual fund for an operational error in the third quarter 2015, $2.1 million of investment bank advisory fees and other deal costs related to the Kapstream acquisition in 2015, and a $2.0 million year-over-year decrease in the fair value and monthly accretion of the liabilities to their future values of the VelocityShares and Kapstream contingent consideration.
General, administrative and occupancy increased $15.3 million from 2014 to 2015. JCG recognized $5.2 million and $1.2 million in VelocityShares and Kapstream contingent consideration fair value adjustments, respectively, in 2015, including the monthly accretion of the contingent consideration. The Company also recognized $2.1 million in investment bank advisory fees and other deal costs related to the Kapstream acquisition and $2.8 million related to a third quarter 2015 operational error.
Non-Operating Income and Expenses
| |
Year ended December 31, | |
|
|||||||||||||
|---|---|---|---|---|---|---|---|---|---|---|---|---|---|---|---|---|
| |
2016 vs. 2015 |
2015 vs. 2014 |
||||||||||||||
| |
2016 | 2015 | 2014 | |||||||||||||
Non-operating income and expenses (in millions): |
| | | | | |||||||||||
Interest expense |
$ | (20.8 | ) | $ | (27.7 | ) | $ | (33.1 | ) | (24.9 | )% | (16.3 | )% | |||
Investment losses, net |
| (6.3 | ) | | (8.2 | ) | | (1.9 | ) | | (23.2 | )% | | 331.6 | % | |
Investment gains within consolidated VIEs, net |
3.8 | — | — | n/m | n/m | |||||||||||
Other income, net |
| 3.9 | | 3.2 | | 3.0 | | 21.9 | % | | 6.7 | % | ||||
Loss on early extinguishment of debt |
— | (36.3 | ) | — | n/m | n/m | ||||||||||
Income tax provision |
| (90.9 | ) | | (94.0 | ) | | (102.3 | ) | | (3.3 | )% | | (8.1 | )% | |
Net income attributable to noncontrolling interests |
(5.2 | ) | (3.5 | ) | (1.0 | ) | 48.6 | % | 250.0 | % | ||||||
n/m — Not meaningful
Interest Expense and Loss on Early Extinguishment of Debt
Interest expense decreased $6.9 million from 2015 to 2016 primarily due to lower interest expense as a result of the Company's third quarter 2015 debt restructuring. In July 2015, JCG issued $300.0 million of 4.875% Senior Notes due 2025 ("2025 Senior Notes"). The proceeds from the 2025 Senior Notes and cash on hand were used to redeem the Company's outstanding 2017 Senior Notes, in August 2015. JCG recognized a loss on early extinguishment of debt of $36.3 million in the third quarter 2015 as a result of the redemption.
31
Interest expense decreased $5.4 million from 2014 to 2015 primarily due to interest expense savings realized in conjunction with the Company's third quarter 2015 debt restructuring. The decrease was also driven by the repayment of debt during 2014, including the 6.119% Senior Notes that matured in April 2014, and the remainder of the 3.250% Convertible Senior Notes that matured in July 2014.
Investment Losses, Net
The components of investment losses, net for the years ended December 31, 2016, 2015 and 2014, are as follows (in millions):
| |
Year ended December 31, | |||||||||
|---|---|---|---|---|---|---|---|---|---|---|
| |
2016 | 2015 | 2014 | |||||||
Seeded investment products |
$ | 6.6 | $ | (11.1 | ) | $ | 8.6 | |||
Noncontrolling interests in seeded investment products |
(0.7 | ) | 0.4 | (0.6 | ) | |||||
Investments in advised mutual funds |
| 0.5 | | (0.2 | ) | | (0.1 | ) | ||
Economic hedge of certain seeded investment products |
(13.7 | ) | 2.6 | (11.2 | ) | |||||
Economic hedge of deferred compensation plans |
| 0.8 | | 0.1 | | 1.3 | ||||
Other |
0.2 | — | 0.1 | |||||||
| | | | | | | | | | | |
Investment losses, net |
$ | (6.3 | ) | $ | (8.2 | ) | $ | (1.9 | ) | |
| | | | | | | | | | | |
| | | | | | | | | | | |
| | | | | | | | | | | |
Investment losses, net decreased $1.9 million from 2015 to 2016, primarily due to the economic hedge of certain seeded investment products partially offset by fair value adjustments associated with seeded investment products.
Investment losses, net increased $6.3 million from 2014 to 2015, primarily due to fair value adjustments associated with seeded investment products partially offset by the economic hedge of certain seeded investment products.
The economic hedge of certain seeded investment products is part of the Company's seed capital hedging strategy to mitigate a portion of the earnings volatility created by the fair value accounting of seeded investment products. JCG may modify or discontinue this hedging strategy at any time.
Investment Gains within Consolidated VIEs, Net
Investment gains within consolidated variable interest entities ("VIEs"), net increased $3.8 million from 2015 to 2016. In January 2016, the Company adopted the recently amended consolidation guidance issued by the Financial Accounting Standards Board. Prior to January 2016, none of the Company's affiliates or seeded investment products were designated as VIEs.
32
Other Income, Net
The components of other income, net for the years ended December 31, 2016, 2015 and 2014, are as follows (in millions):
| |
Year ended December 31, | |||||||||
|---|---|---|---|---|---|---|---|---|---|---|
| |
2016 | 2015 | 2014 | |||||||
Dividend income |
$ | 4.4 | $ | 8.1 | $ | 5.6 | ||||
Interest income |
0.9 | 0.7 | 0.6 | |||||||
Foreign currency losses, net |
| (1.4 | ) | | (5.8 | ) | | (3.2 | ) | |
Other, net |
— | 0.2 | — | |||||||
| | | | | | | | | | | |
Total other income, net |
$ | 3.9 | $ | 3.2 | $ | 3.0 | ||||
| | | | | | | | | | | |
| | | | | | | | | | | |
| | | | | | | | | | | |
Dividend income relates to dividends received from certain seeded investment products. As of December 31, 2016, foreign currency losses, net includes translation of certain seeded investment products denominated in a foreign currency, the economic hedge of certain seeded investment products and the translation of financial statements of certain international subsidiaries.
Foreign currency losses, net of $5.8 million for the year ended December 31, 2015, relate largely to foreign currency losses on Australian dollars that were held in advance of the Kapstream acquisition and were subject to mark-to-market adjustments during the second quarter 2015.
Income Tax Provision
JCG's effective tax rate was 37.5%, 37.1% and 39.7% for the years ended December 31, 2016, 2015 and 2014, respectively. JCG's income tax provision for the years ended December 31, 2016, 2015 and 2014, includes the following (in millions):
| |
Year ended December 31, |
|||||||||
|---|---|---|---|---|---|---|---|---|---|---|
| |
2016 | 2015 | 2014 | |||||||
Reversal of income tax contingency reserves as a result of the expiration of statutes of limitations and audit settlements |
$ | 1.8 | $ | 0.9 | $ | 1.0 | ||||
Tax benefit from the reversal of income tax contingency reserves |
$ | 1.2 | $ | 0.5 | $ | 0.6 | ||||
Tax expense related to the expiration and vesting of certain equity-based compensation awards |
$ | — | $ | — | $ | 7.8 | ||||
Tax expense related to non-deductible merger costs |
$ | 2.1 | $ | — | $ | — | ||||
The change in the effective tax rates for the three years presented was primarily due to contingent consideration adjustments in each year that resulted in a comparative reduction to the effective tax rate partially offset by non-deductible costs associated with the Merger Agreement. In addition, as of January 1, 2016, the Company's statutory tax rate changed from 37.25% to 37.40% as a result of changes related to state taxes.
The Company's consolidated financial statements are prepared in conformity with accounting principles generally accepted in the United States of America ("GAAP"). To provide greater transparency into JCG's business on an ongoing operations basis and allow more appropriate comparisons with industry peers, the Company presents adjusted operating income, adjusted operating margin, adjusted net income attributable to JCG and adjusted diluted earnings per share
33
attributable to JCG common shareholders as non-GAAP financial measures. Each of these non-GAAP financial measures is considered to be effective indicators, for both management and investors, of JCG's financial performance over time. The non-GAAP financial measures exclude expenses in 2016 related to the merger with Henderson and the loss on early extinguishment of debt in 2015 as these items are not considered part of the Company's ongoing operations. Management uses non-GAAP performance measures to evaluate the business on an ongoing basis, and they are consistent with internal management reporting. The most directly comparable GAAP measures are operating income, operating margin, net income attributable to JCG and diluted earnings per share attributable to JCG common shareholders.
These non-GAAP measures should not be considered as substitutes for any measures derived in accordance with GAAP and may not be comparable to other similarly titled measures of other companies. Additional reconciling items may be added in the future to these non-GAAP measures if deemed appropriate. The tax effect related to reconciling items has been calculated based on the tax rate attributable to the jurisdiction to which the transaction relates.
The following are reconciliations of GAAP basis operating income, operating margin, net income attributable to JCG and diluted earnings per share attributable to JCG common shareholders to adjusted operating income, adjusted operating margin, adjusted net income attributable to JCG and adjusted diluted earnings per share attributable to JCG common shareholders for the years ended December 31, 2016 and 2015. The Company did not adjust its GAAP basis figures for the years ended December 31, 2014, 2013 and 2012 as the amounts in these periods reflect the JCG's
34
business on an ongoing operations basis. Amounts are presented in millions, except per share data and operating profit percentages.
| |
Year ended December 31, |
||||||
|---|---|---|---|---|---|---|---|
| |
2016 | 2015 | |||||
Reconciliation of operating income to adjusted operating income: |
| | |||||
Operating income, GAAP basis |
$ | 261.6 | $ | 322.3 | |||
Merger-related adjustments |
| 13.3 | | — | |||
| | | | | | | | |
Adjusted operating income |
$ | 274.9 | $ | 322.3 | |||
| | | | | | | | |
| | | | | | | | |
| | | | | | | | |
Reconciliation of operating margin to adjusted operating margin: |
| | |||||
Operating margin, GAAP basis |
25.9 | % | 29.9 | % | |||
Merger-related adjustments |
| 1.3 | % | | — | ||
| | | | | | | | |
Adjusted operating margin |
27.2 | % | 29.9 | % | |||
| | | | | | | | |
| | | | | | | | |
| | | | | | | | |
Reconciliation of net income attributable to JCG to adjusted net income attributable to JCG: |
| | |||||
Net income attributable to JCG, GAAP basis |
$ | 146.1 | $ | 155.8 | |||
Merger-related adjustments |
| 13.3 | | — | |||
Tax effect of merger-related adjustments (1) |
(2.8 | ) | — | ||||
Loss on early extinguishment of debt (2) |
| — | | 36.3 | |||
Tax effect of loss on early extinguishment of debt |
— | (13.5 | ) | ||||
| | | | | | | | |
Adjusted net income attributable to JCG |
| 156.6 | | 178.6 | |||
Less: Allocation of earnings to participating restricted stock awards |
5.9 | 6.4 | |||||
| | | | | | | | |
Adjusted net income attributable to JCG common shareholders |
$ | 150.7 | $ | 172.2 | |||
| | | | | | | | |
| | | | | | | | |
| | | | | | | | |
Reconciliation of diluted earnings per share to adjusted earnings per share: |
|||||||
Diluted earnings per share attributable to JCG common shareholders, GAAP basis |
$ | 0.78 | $ | 0.80 | |||
Diluted earnings per share — merger-related adjustments |
0.05 | — | |||||
Diluted earnings per share — loss on early extinguishment of debt |
| — | | 0.12 | |||
| | | | | | | | |
Adjusted diluted earnings per share attributable to JCG common shareholders |
$ | 0.83 | $ | 0.92 | |||
| | | | | | | | |
| | | | | | | | |
| | | | | | | | |
- (1)
- Certain
merger-related adjustments are tax deductible and the Company applied its statutory rate of 37.4% to calculate the tax effect of the deductible
merger-related adjustments.
- (2)
- Represents the loss on early extinguishment of the Company's 6.700% Senior Notes in 2015.
LIQUIDITY AND CAPITAL RESOURCES
JCG's capital structure, together with available cash balances, cash flows generated from operations, existing capacity under the Company's credit facility, and further capital and credit
35
market activities, if necessary, should provide JCG with sufficient resources to meet present and future cash needs, including operating, debt and other obligations as they come due and anticipated future capital requirements.
The Merger Agreement requires JCG to operate its business in the ordinary course and, subject to certain exceptions, may prevent JCG from taking certain actions without the approval of Henderson, including, but not limited to, dividend payments, debt repurchases, certain restructurings and credit facility draws. However, under the terms of the Merger Agreement, subject to the approval of the JCG Board of Directors, JCG is permitted to pay a cash dividend in respect to the fourth quarter 2016.
Short-Term Liquidity and Capital Resources
The following table summarizes key balance sheet data relating to JCG's liquidity and capital resources as of December 31, 2016 and 2015 (in millions):
| |
December 31, | ||||||
|---|---|---|---|---|---|---|---|
| |
2016 | 2015 | |||||
Cash and cash equivalents: |
| | |||||
Cash and cash equivalents held domestically |
$ | 400.0 | $ | 283.5 | |||
Cash and cash equivalents held outside the United States (1) |
| 85.9 | | 79.7 | |||
Cash and cash equivalents held by VRE (2) |
— | 1.2 | |||||
| | | | | | | | |
Cash and cash equivalents |
| 485.9 | | 364.4 | |||
Cash and cash equivalents held by VIE (2) |
6.1 | — | |||||
Total cash and cash equivalents |
$ | 492.0 | $ | 364.4 | |||
| | | | | | | | |
| | | | | | | | |
| | | | | | | | |
Investment management fees and other receivables |
$ | 129.6 | $ | 137.8 | |||
Investment securities: |
|
|
|||||
Seeded investment products (3) |
$ | 190.2 | $ | 306.6 | |||
Investments in advised mutual funds and the economic hedging of deferred compensation plans |
| 21.9 | | 20.5 | |||
| | | | | | | | |
|
212.1 | 327.1 | |||||
Investment securities held by VIEs |
| 91.6 | | — | |||
| | | | | | | | |
Total Investment securities |
$ | 303.7 | $ | 327.1 | |||
| | | | | | | | |
| | | | | | | | |
| | | | | | | | |
Long-term debt (including current portion) |
$ | 406.3 | $ | 402.3 | |||
- (1)
- As
of December 31, 2016 and 2015, cash held outside of the United States may not be entirely available for general corporate purposes due to approximately
$28 million of capital requirements associated with foreign subsidiaries of JCG for both periods.
- (2)
- Cash
and cash equivalents held by consolidated seeded investment products are not available for general corporate purposes.
- (3)
- Includes noncontrolling interests in consolidated seeded investment products of $33.1 million and $13.8 million, respectively.
Cash and cash equivalents consist primarily of cash on hand and short-term investments with an initial maturity of three months or less when purchased, including investments in money market funds. JCG believes that existing cash and cash from operations should be sufficient to satisfy its
36
short-term capital requirements. Expected short-term uses of cash include ordinary operating expenditures, seed capital investments, dividend payments, income tax payments, interest payments on outstanding debt, contingent consideration payments and expenditures related to the Merger Agreement. Subject to the terms of the Merger Agreement, JCG may use available cash for general corporate purposes and acquisitions.
As of December 31, 2016, the 0.750% Convertible Senior Notes due 2018 ("2018 Convertible Notes"), did not meet the criteria for early conversion and are not convertible during the first quarter 2017. The 2018 Convertible Notes conversion criteria are reassessed on a quarterly basis. Fluctuations in the price of JCG's common stock may cause reclassification of the 2018 Convertible Notes between long-term debt and current portion of long-term debt on JCG's Consolidated Balance Sheets on a quarter-to-quarter basis. As a result of the merger, the 2018 Convertible Notes may be converted, regardless of whether or not the conversion criteria have been satisfied, for a period of 35 trading days in advance of and 35 trading days following the merger completion.
Common Stock Repurchases
As part of its capital and liquidity management, JCG has in the past maintained a share repurchase program to offset dilution resulting from stock-based compensation and to return capital to shareholders. The share repurchase program has been conducted within the parameters of Rule 10b5-1 under the Exchange Act. During the year ended December 31, 2016, JCG repurchased 3,772,389 shares of its common stock at an average price of $13.95 per share and a total cost of $52.6 million as part of the share repurchase program. Subsequent to the Merger Agreement, JCG ceased share repurchases and does not intend on utilizing the share repurchase program while the merger progresses toward the expected close date on or about May 30, 2017.
JCG also repurchased 406,659 shares of common stock from Dai-ichi Life on August 1, 2016, for a total cost of $5.9 million in order for Dai-ichi Life to comply with the ownership limit obligations under the investment agreement between JCG and Dai-ichi Life. At December 31, 2016, Dai-ichi Life owned approximately 20% of the outstanding common shares of the Company.
In addition to the share repurchase program, during the year ended December 31, 2016, JCG withheld 1,085,600 shares from employees as part of a share withholding program to satisfy the employees' minimum statutory income tax liabilities attributable to the vesting of restricted stock. The withheld shares had a value of $13.6 million and were deposited into treasury shares.
Total common stock repurchases from the share repurchase program, shares repurchased from Dai-ichi Life and shares withheld from employees as part of the share withholding program during the years ended December 31, 2016 and 2015, were as follows:
| |
Year ended December 31, | |||
|---|---|---|---|---|
| |
2016 | 2015 | ||
Total cost (in millions) |
$ 72.1 | $ 91.8 | ||
Shares repurchased |
5,264,648 | 5,799,593 | ||
Average price per share |
$ 13.70 | $ 15.82 | ||
As of December 31, 2016, approximately $254 million is available for share repurchases under the current authorization.
37
Dividends
Dividends paid during the year ended December 31, 2016, are summarized as follows:
| Dividend per share |
Date declared | Dividends paid (in millions) |
Date paid | |||||
|---|---|---|---|---|---|---|---|---|
| $ | 0.09 | January 19 | $ | 16.7 | February 25 | |||
| $ | 0.11 | April 21 | $ | 20.3 | May 20 | |||
| $ | 0.11 | July 21 | $ | 20.1 | August 19 | |||
| $ | 0.11 | October 20 | $ | 20.1 | November 18 | |||
On April 21, 2016, JCG's Board of Directors approved an increase of $0.02 per share, or 22%, in the Company's regular quarterly dividend. The approved quarterly rate of $0.11 per share represents an expected annualized dividend rate of $0.44 per share of common stock.
The Merger Agreement requires JCG to operate its business in the ordinary course and, subject to certain exceptions, may prevent JCG from taking certain actions without the approval of Henderson, including, but not limited to, dividend payments. However, under the terms of the Merger Agreement, subject to the approval of the JCG Board of Directors, JCG is permitted to pay a cash dividend in respect to the fourth quarter 2016.
On January 19, 2017, JCG's Board of Directors declared a regular quarterly cash dividend of $0.11 per share in respect to the fourth quarter 2016, which will be paid on February 17, 2017, to shareholders of record at the close of business on February 6, 2017.
Subsequent to the Merger Agreement, JCG and Henderson agreed to separately pay regular quarterly cash dividends in respect to the first quarter 2017 during the second quarter 2017, subject to respective board approvals.
Long-Term Liquidity and Capital Resources
The following table presents contractual obligations and associated maturities at December 31, 2016 (in millions):
| |
Less than 1 year |
1 to 3 years | 3 to 5 years | More than 5 years |
|||||||||
|---|---|---|---|---|---|---|---|---|---|---|---|---|---|
Debt |
$ | — | $ | 153.2 | $ | — | $ | 300.0 | |||||
Interest payments |
15.5 | 30.1 | 29.3 | 57.3 | |||||||||
Capital leases |
| 1.4 | | 2.3 | | 0.6 | | — | |||||
Operating leases |
16.5 | 26.8 | 19.3 | 31.7 | |||||||||
| | | | | | | | | | | | | | |
Total |
$ | 33.4 | $ | 212.4 | $ | 49.2 | $ | 389.0 | |||||
| | | | | | | | | | | | | | |
| | | | | | | | | | | | | | |
| | | | | | | | | | | | | | |
Debt maturing in 1 to 3 years represents the fair value of the 2018 Convertible Notes as of December 31, 2016. The information presented above does not include commitments for capital expenditures in the normal course of business. JCG expects to fund its long-term commitments using existing cash or cash generated from operations, refinancing debt or accessing capital and credit markets as necessary.
2018 Convertible Notes
The 2018 Convertible Notes will mature on July 15, 2018, unless earlier converted or repurchased. Holders of the 2018 Convertible Notes may convert the notes during a particular calendar quarter if the last reported sale price of JCG's common stock is greater than or equal to 130% of the applicable conversion price for at least 20 trading days during a period of 30 consecutive trading
38
days ending on the last trading day of the preceding quarter. As of December 31, 2016, the 2018 Convertible Notes did not meet the criteria for early conversion and are not convertible during the first quarter 2017. As a result of the merger, the 2018 Convertible Notes may be converted, regardless of whether or not the conversion criteria have been satisfied, for a period of 35 trading days in advance of and 35 trading days following the merger completion. See Part II, Item 8, Financial Statements and Supplementary Data, Note 10 — Debt, for a further discussion of the 2018 Convertible Notes and the associated convertible note hedge and warrants.
Perkins Senior Profits Interests Awards
On December 31, 2008, Perkins granted senior profits interests awards designed to retain and incentivize key employees to grow the business. These awards vested on the fifth anniversary of grant and were entitled to a total of 5% of Perkins' annual taxable income. These awards had a formula-driven terminal value based on revenue and relative investment performance of products managed by Perkins. Participants carried a put right that would require JCG to terminate the awards in exchange for the then-applicable formula price on December 31, 2014, the sixth anniversary of grant. The value of the put right at December 31, 2014, was $5.9 million. On January 27, 2015, participants exercised their right to put the senior profits interests awards to JCG. The Company settled the awards with a $5.9 million cash payment to participants on February 13, 2015.
On November 18, 2013, Perkins granted additional senior profits interests awards, which fully vest on December 31, 2018, and are entitled to a total of 10% of Perkins' annual taxable income. The entitlement to a percentage of Perkins' annual taxable income over the vesting period is tiered and starts at 2% in 2015 and increases 2% each year thereafter until reaching 10% after fully vesting on December 31, 2018. In addition, these awards have a formula-driven terminal value based on Perkins' revenue. JCG can call and terminate any or all of the awards on December 31, 2018, and each year thereafter. Holders of such interests can require JCG to purchase the interests in exchange for the then-applicable formula price on December 31, 2018. The senior profits interests awards are also subject to termination at premiums or discounts to the formula at the option of JCG or certain employees, as applicable, upon certain corporate or employment-related events affecting Perkins or certain employees. As of December 31, 2016, the formula-driven value was zero and there was no liability on JCG's Consolidated Balance Sheets associated with the Perkins senior profits interests awards granted in 2013.
INTECH Long-Term Incentive Awards
In October 2014, INTECH granted long-term incentive awards to retain and incentivize employees. The awards consist of appreciation rights, profits interests and phantom interests and are designed to give recipients an equity-like stake in INTECH. The appreciation rights have a grant date fair value of $23.2 million, which will be amortized on a straight-line basis over the 10-year vesting schedule, and are exercisable upon termination of employment from INTECH and to the extent vested. The profits interests and phantom interests awards entitle recipients to 9.1% of INTECH's pre-incentive profits and replace a portion of the prior discretionary bonus pool. Additional phantom interests were granted to certain employees in 2016 and 2015. As of December 31, 2016, total profits interests and phantom interests awards entitle recipients to 9.1% of INTECH's pre-incentive profits.
Additional appreciation rights were granted in February 2015 and March 2016 as part of the annual grant. The grant date fair value of the 2015 and 2016 appreciation rights was $2.0 million and $2.6 million, respectively, which will be amortized on a straight-line basis over the four-year vesting schedule. The appreciation rights are exercisable upon termination of employment from INTECH and to the extent vested. Upon exercise, the appreciation rights are settled in INTECH equity.
39
INTECH profits interests and phantom interests entitle holders to periodic distributions of a portion of INTECH operating income. Distributions are made during employment and, for profits interests, post-employment for up to 10 years. Phantom interests are entitled to a one-time distribution at termination of employment. Compensation expense for post-employment distributions is based upon the present value of expected future distributions and is being recognized pro rata over the 10-year vesting schedule for profits interests and five years for phantom interests. The present value of these payments was determined using a 2% discount rate, which represented the interest rate on a 20-year U.S. Treasury note. As of December 31, 2016, the total undiscounted estimated post-employment payments for profits interests and phantom interests was $58.1 million (the majority will not be paid until 10 to 20 years after the grant date). The estimated post-employment payments will be evaluated and adjusted quarterly, as necessary, with changes recorded in results of operations. As of December 31, 2016, the carrying value of the liability associated with the INTECH profits interests and phantom interests was $10.8 million and is included in other non-current assets on JCG's Consolidated Balance Sheets.
Contingent Consideration
Contingent consideration was a component of the purchase price of both Kapstream and VelocityShares.
The Kapstream contingent cash consideration associated with the acquisition of a controlling 51% voting interest in Kapstream is payable in Australian dollars at 18 and 36 months after acquisition if certain Kapstream assets under management reach defined targets. The fair value of the contingent consideration is calculated on a quarterly basis by forecasting certain Kapstream assets under management over the contingency period and determining whether the forecasted amounts meet the defined targets. Forecasted contingent payments are then discounted back to the valuation date using an 8.5% discount rate. Significant unobservable inputs used in the valuation are considered non-public data and limited to forecasted Kapstream assets under management. The fair value of the contingent cash consideration is included in accounts payable and accrued liabilities and other non-current liabilities on JCG's Consolidated Balance Sheets.
In December 2016, Kapstream assets under management reached defined targets for the 18-month anniversary of the acquisition, and JCG paid contingent consideration of $5.6 million in February 2017. As of December 31, 2016, the total maximum payment over the remaining contingent consideration period (36-month anniversary) is $3.7 million.
On January 31, 2017, JCG acquired the remaining 49% voting interest in Kapstream. The noncontrolling interests were held by the founders of Kapstream, who are current JCG employees. The transaction included initial upfront cash consideration of $42.5 million and contingent consideration payable in the form of mutual fund share awards. Payment of the mutual fund share awards is contingent on all Kapstream products and certain Janus products reaching defined revenue targets on the first, second and third anniversaries of January 31, 2017. The awards will be payable in three equal installments of $14.2 million on the anniversary dates and are indexed to the performance of the Kapstream Absolute Return Income Fund. Upon vesting, the holders receive the value of the awards adjusted for gains or losses attributable to the mutual fund to which the awards were indexed, subject to tax withholding.
The VelocityShares cash payments are contingent on certain VelocityShares' ETPs reaching defined net revenue targets on the first, second, third and fourth anniversaries of the acquisition, in amounts up to $10.0 million each for the first and second anniversaries, and $8.0 million each for the third and fourth anniversaries. The fair value of the contingent cash consideration is calculated on a quarterly basis by forecasting net ETP revenue, as defined by the purchase agreement, over the contingency period, and determining whether net forecasted ETP revenue targets are achieved.
40
Forecasted contingent payments are then discounted back to the valuation date using a 15% discount rate. Significant unobservable inputs used in the valuation are considered non-public data and limited to forecasted gross revenues and certain expense items, which are deducted from these revenues. Increases in forecasted net ETP revenue would increase the fair value of the consideration, subject to payment limitations, while decreases in forecasted net ETP revenue would decrease the fair value. The fair value of the contingent cash consideration is included in accounts payable and accrued liabilities and other non-current liabilities on JCG's Consolidated Balance Sheets.
In November 2015 and 2016, VelocityShares reached the defined net ETP revenue targets for the first and second anniversaries of the acquisition, and JCG paid contingent consideration of $10.0 million in both December 2015 and January 2017. The contingent consideration payments represent the maximum amount for the first and second anniversaries. As of December 31, 2016, the total maximum payment over the remaining contingent consideration period (third and fourth anniversaries of the acquisition) is $16.0 million.
INTECH Noncontrolling Interests
INTECH ownership interests held by a founding member had an estimated fair value of $4.1 million and $5.2 million as of December 31, 2016 and 2015, respectively, representing approximately 1.1% and 1.0% aggregate ownership of INTECH, respectively. This founding member is entitled to retain his remaining INTECH interests until his death and has the option to require JCG to purchase from him his ownership interests of INTECH at fair value.
Long-Term Incentive Stock Plans
On May 10, 2005, JCG shareholders approved the 2005 Long-Term Incentive Stock Plan ("2005 Plan"), which allowed the Board of Directors to grant up to 15.0 million shares of equity-based awards, including stock options and restricted stock. Subsequent to the annual grant in January 2017, 3.3 million shares of stock options and less than 0.1 million shares of restricted stock are available to be granted under the 2005 Plan.
On April 29, 2010, JCG shareholders approved the 2010 Long-Term Incentive Stock Plan ("2010 Plan"), which allows JCG to grant up to 4.4 million shares of equity-based awards, including stock options and restricted stock. On April 26, 2012, JCG shareholders approved an amendment to the 2010 Plan to increase the number of shares available to grant by 9.0 million shares for a total of 13.4 million shares of equity-based awards available to grant under the 2010 Plan. On April 24, 2015, JCG shareholders approved an amendment to the 2010 Plan to increase the number of shares available to grant by 11.0 million shares for a total of 24.4 million shares of equity-based awards available to grant under the 2010 Plan. Subsequent to the annual grant in January 2017, approximately 4.9 million shares of equity-based awards are available to be granted under the 2010 Plan.
JCG also has an Employment Inducement Award Plan ("EIA Plan") with 0.8 million shares of equity-based awards available to be granted as of December 31, 2016. The EIA Plan is not a shareholder-approved plan.
Off-Balance Sheet Arrangements
Other than certain lease agreements, JCG is not party to any off-balance sheet arrangements that may provide, or require the Company to provide, financing, liquidity, market or credit risk support that
41
is not reflected in JCG's consolidated financial statements. Refer to the preceding contractual obligation table for future obligations associated with operating leases.
Credit Facility
At December 31, 2016, JCG had a $200 million, unsecured, revolving credit facility (the "Credit Facility") with JPMorgan Chase Bank, N.A., as administrative agent and swingline lender. The Credit Facility can be used by JCG and its subsidiaries for working capital needs and general corporate purposes. The Credit Facility bears interest on borrowings outstanding at the London Interbank Offered Rate plus a spread, which is based on JCG's credit rating. JCG is required to pay a quarterly commitment fee on any unused portion of the Credit Facility, which is also based on JCG's credit rating. The Credit Facility has a maturity date of November 23, 2018.
The Credit Facility contains financial covenants with respect to leverage and interest coverage. The financing leverage ratio cannot exceed 3.00x, and the interest coverage ratio must equal or exceed 4.00x. At December 31, 2016, JCG's financing leverage ratio was 1.22x and the interest coverage ratio was 20.02x. JCG was in compliance with all covenants, and there were no borrowings under the Credit Facility at December 31, 2016, or during the year ended December 31, 2016.
A summary of cash flow data for the years ended December 31, 2016, 2015 and 2014, is as follows (in millions):
| |
Year ended December 31, | |||||||||
|---|---|---|---|---|---|---|---|---|---|---|
| |
2016 | 2015 | 2014 | |||||||
Cash flows provided by (used for): |
| | | |||||||
Operating activities |
$ | 262.2 | $ | 274.4 | $ | 218.4 | ||||
Investing activities |
| 13.3 | | (150.7 | ) | | 67.5 | |||
Financing activities |
(153.3 | ) | (207.2 | ) | (177.4 | ) | ||||
Effect of exchange rate changes on cash and cash equivalents |
| (0.7 | ) | | (4.6 | ) | | (0.5 | ) | |
| | | | | | | | | | | |
Net change in cash and cash equivalents |
121.5 | (88.1 | ) | 108.0 | ||||||
Cash balance at beginning of period |
| 364.4 | | 452.5 | | 344.5 | ||||
| | | | | | | | | | | |
Cash balance at end of period |
$ | 485.9 | $ | 364.4 | $ | 452.5 | ||||
| | | | | | | | | | | |
| | | | | | | | | | | |
| | | | | | | | | | | |
Operating Activities
Fluctuations in operating cash flows are attributable to changes in net income and working capital items, which can vary from period to period based on the amount and timing of cash receipts and payments.
42
Investing Activities
Cash provided by (used for) investing activities for the years ended December 31, 2016, 2015 and 2014, is as follows (in millions):
| |
Year ended December 31, | |||||||||
|---|---|---|---|---|---|---|---|---|---|---|
| |
2016 | 2015 | 2014 | |||||||
Purchases and settlements of investment securities: |
| | | |||||||
Seeded investment products |
$ | (81.3 | ) | $ | (77.6 | ) | $ | (144.1 | ) | |
Investments related to deferred compensation plans |
| (0.5 | ) | | (0.5 | ) | | (0.1 | ) | |
Seed capital derivative instruments |
(32.6 | ) | (12.9 | ) | (24.4 | ) | ||||
Other long-term investments |
| (8.0 | ) | | — | | — | |||
| | | | | | | | | | | |
Total purchases and settlements of investment securities |
(122.4 | ) | (91.0 | ) | (168.6 | ) | ||||
Proceeds from sales, settlements and maturities of investment securities: |
| | | |||||||
Seeded investment products |
122.7 | 52.4 | 178.5 | |||||||
Investments related to deferred compensation plans |
| 0.6 | | 1.1 | | 44.4 | ||||
Seed capital derivative instruments |
14.4 | 14.1 | 13.9 | |||||||
Debt securities |
| — | | — | | 100.0 | ||||
| | | | | | | | | | | |
Total proceeds from sales, settlements and maturities of investment securities |
137.7 | 67.6 | 336.8 | |||||||
Sales (purchases) of securities by consolidated seeded investment products, net |
| 7.3 | | (32.2 | ) | | (60.9 | ) | ||
Purchase of property, equipment and software |
(9.3 | ) | (13.7 | ) | (11.4 | ) | ||||
Acquisition of Kapstream, net of cash acquired of $7.3 million |
| — | | (81.4 | ) | | — | |||
Acquisition of VelocityShares, net of cash acquired of $4.3 million |
— | — | (28.4 | ) | ||||||
| | | | | | | | | | | |
Cash provided by (used for) investing activities |
$ | 13.3 | $ | (150.7 | ) | $ | 67.5 | |||
| | | | | | | | | | | |
| | | | | | | | | | | |
| | | | | | | | | | | |
Cash provided by investing activities totaled $13.3 million during the year ended December 31, 2016, compared to cash used for investing activities of $150.7 during the same period in 2015. The year-over-year change was primarily due to the acquisition of Kapstream. Purchases and sales of investment securities also contributed to the year-over-year change. JCG periodically adds new investment strategies to its investment product offerings by providing the initial cash investment or "seeding." The primary purpose of seeded investment products is to generate an investment performance track record in a product to attract third-party investors. JCG may redeem invested seed capital for a variety of reasons, including when third-party investments in the relevant product are sufficient to sustain the investment strategy. Redemptions of seed capital substantially increased in 2016 due to the aforementioned reasons. Other long-term investments for the year-ended December 31, 2016, included an investment in a boutique asset management firm in June 2016.
Sales and purchases of securities by consolidated seeded investment products can fluctuate based on third-party investments and redemptions in the consolidated seeded investment products and is offset in cash provided by (used for) financing activities.
43
Financing Activities
Cash used for financing activities for the years ended December 31, 2016, 2015 and 2014, is as follows (in millions):
| |
Year ended December 31, | |||||||||
|---|---|---|---|---|---|---|---|---|---|---|
| |
2016 | 2015 | 2014 | |||||||
Repurchase of common stock |
$ | (72.1 | ) | $ | (91.8 | ) | $ | (87.2 | ) | |
Dividends paid to JCG shareholders |
(77.2 | ) | (65.2 | ) | (58.4 | ) | ||||
Proceeds from stock option exercises and employee stock purchases |
| 8.1 | | 11.0 | | 8.4 | ||||
Third-party investments (redemptions) in consolidated seeded investment products, net |
(7.3 | ) | 32.2 | 60.9 | ||||||
Repayment of long-term debt |
| — | | (380.3 | ) | | (98.9 | ) | ||
Proceeds from the issuance of debt |
— | 297.1 | — | |||||||
Contingent consideration |
| — | | (8.6 | ) | | — | |||
Other financing activities |
(4.8 | ) | (1.6 | ) | (2.2 | ) | ||||
| | | | | | | | | | | |
Cash used for financing activities |
$ | (153.3 | ) | $ | (207.2 | ) | $ | (177.4 | ) | |
| | | | | | | | | | | |
| | | | | | | | | | | |
| | | | | | | | | | | |
Cash used for financing activities totaled $153.3 million during the year ended December 31, 2016, compared to $207.2 million during the same period in 2015. The year-over-year change in cash used for financing activities is primarily due to the repayment of long-term debt and proceeds received from the issuance of debt in 2015, and third-party investments and redemptions in consolidated seeded investment products, which can fluctuate based on third-party activity and are offset in cash provided by (used for) investing activities. Also contributing to the year-over-year change is a decrease in cash used for the repurchase of common stock. JCG has maintained a share repurchase program to return capital to shareholders and offset dilution associated with the vesting of restricted stock. After the Merger Agreement, JCG ceased share repurchases and does not intend on utilizing the share repurchase program while the merger progresses toward the expected close date of May 30, 2017.
Cash used for financing activities totaled $207.2 million during the year ended December 31, 2015, compared to $177.4 million during the same period in 2014. The year-over-year change in cash used for financing activities is primarily due to the repayment of long-term debt in 2015 and 2014, proceeds received from the issuance of debt in 2015 and third-party investments and redemptions in consolidated seeded investment products, which can fluctuate based on third-party activity and are offset in cash used for investing activities.
Money Market Funds Advised by JCG
JCG advises money market funds that seek to provide capital preservation and liquidity, with current income as a secondary objective. JCG attempts to limit the money market funds' exposure to losses by investing in high-quality securities with short-term durations that present minimal credit risk. Adverse events or circumstances related to individual securities or the market in which the securities trade may cause other-than-temporary declines in value. JCG continuously evaluates the securities held by the money market funds to determine if any holdings are distressed or may become distressed in the near future. In such circumstances, JCG would consider whether taking any action, including, but not limited to, a potential election by JCG to provide support to the money market funds that could result in additional impairments and financial losses for the Company, would be appropriate. Under certain situations, JCG may elect to support one or more of the money market funds to enable them to maintain a net asset value equal to $1 through a variety of means, including but not limited to, purchasing securities held by the money market funds, reimbursing for any losses
44
incurred or providing a letter of credit. However, JCG is not contractually or legally obligated to provide support, and has not provided support, to the money market funds. JCG's money market assets of $1.1 billion at December 31, 2016, have remained relatively stable over the past few years.
CRITICAL ACCOUNTING POLICIES AND ESTIMATES
JCG's consolidated financial statements and accompanying notes have been prepared in accordance with GAAP. The preparation of consolidated financial statements in conformity with GAAP requires management to make estimates and assumptions that affect the reported amounts of assets and liabilities, the disclosure of contingent assets and liabilities at the date of the consolidated financial statements, and the reported amounts of revenues and expenses during the reporting periods.
JCG continually evaluates the accounting policies and estimates used to prepare the consolidated financial statements. In general, management's estimates are based on historical experience, information from third-party professionals, as appropriate, and various other assumptions that are believed to be reasonable under current facts and circumstances. Actual results could differ from those estimates made by management. JCG's critical accounting policies and estimates include investment securities, goodwill and intangible assets, post-employment benefits, equity compensation, income taxes and contingent consideration.
Valuation of Investment Securities
JCG records investment securities classified as trading and available-for-sale at fair value and investment securities classified as held-to-maturity at amortized cost. Fair value is generally determined using observable market data based on recent trading activity. Where observable market data is unavailable due to a lack of trading activity, JCG uses internally developed models to estimate fair value and independent third parties to validate assumptions, when appropriate. Estimating fair value requires significant management judgment, including benchmarking to similar instruments with observable market data and applying appropriate discounts that reflect differences between the securities that JCG is valuing and the selected benchmark. Depending on the type of securities owned by JCG, other valuation methodologies may be required. Any variation in the assumptions used to approximate fair value could have a material adverse effect on the Company's consolidated financial condition and results of operations.
JCG periodically evaluates the carrying value of investment securities classified as available-for-sale or held-to-maturity for potential impairment. In determining if an impairment exists, JCG considers the duration, extent and circumstances of any decline in fair value.
For equity securities, JCG evaluates the securities in an unrealized loss position in the available-for-sale portfolio for other-than-temporary impairment on the basis of the duration of the decline in value of the security and severity of that decline as well as JCG's intent and ability to hold these securities for a period of time sufficient to allow for any anticipated recovery in the market value. If it is determined that the impairment on an equity security is other-than-temporary, an impairment loss equal to the difference between the carrying value of the security and its fair value is recognized within investment losses, net on JCG's Consolidated Statements of Comprehensive Income. There were no other-than-temporary impairments of investment securities for the years ended December 31, 2016, 2015 and 2014.
Accounting for Goodwill and Intangible Assets
Goodwill and intangible assets constitute $1.9 billion, or approximately 66%, of total assets at December 31, 2016. Goodwill and intangible assets require significant management estimates and
45
judgment, including the valuation and expected life determination in connection with the initial purchase price allocation and the ongoing evaluation for impairment. JCG separately tests goodwill and indefinite-lived intangible assets for impairment annually or more frequently if events or changes in circumstances indicate that the asset may be impaired.
In connection with the purchase price allocation of acquisitions in which a majority interest is obtained, JCG relies on in-house financial expertise or uses a third-party expert, if considered necessary. Valuations generally rely on management's estimates and judgments as to financial forecasts, including revenue, growth rates and operating margins over a range of possible assumptions for various products, distribution channels and business strategies.
Goodwill represents the excess of cost over the fair value of the identifiable net assets of acquired companies and is not amortized. Goodwill is tested for impairment by comparing the fair value of the reporting unit associated with the goodwill to the reporting unit's recorded value. If the fair value of the reporting unit is less than its recorded value, a process similar to a purchase price allocation is undertaken to determine the amount, if any, of the goodwill impairment. All assets, including previously unrecognized intangible assets and liabilities, are allocated based on their respective fair values and any unallocated value is assigned to goodwill. Because the allocation of fair value may include intangible assets not previously recognized, the amount of the goodwill impairment charge may significantly exceed the difference between the fair value of the reporting unit and its recorded value. For purposes of testing goodwill for impairment, JCG's single operating segment, its investment management business, also represents its reporting unit.
Indefinite-lived intangible assets primarily represent trademarks and investment management agreements. Investment management agreements without a contractual termination date are classified as indefinite-lived intangible assets based upon the following: (i) there is no legal or statutory limitation on the contract period to manage these investment products; (ii) JCG expects to, and has the ability to operate these investment products indefinitely; (iii) the investment products have multiple investors and are not reliant on an individual investor or small group of investors for their continued operation; (iv) the current competitive environment does not indicate a finite life; and (v) there is a high likelihood of continued renewal based on historical experience. The assumption that investment management agreements are indefinite-lived assets is reviewed at least annually or more frequently if facts and circumstances indicate that the useful life is no longer indefinite. Indefinite-lived intangible assets are tested for impairment by comparing the fair value of the assets to their recorded values.
To complete the tests for potential impairment of goodwill and indefinite-lived intangible assets, JCG uses a discounted cash flow analysis that requires assumptions regarding projected future earnings and discount rates. In projecting future earnings, JCG considers equity and fixed income market performance, performance compared to peers, significant changes in the underlying business and products, material and ongoing industry or economic trends, and other factors that may influence future earnings. Changes in the assumptions underlying the discounted cash flow analyses could materially affect JCG's impairment conclusion.
An investment management agreement impairment charge of $0.3 million was recognized in depreciation and amortization on the Consolidated Statements of Comprehensive Income during the year ended December 31, 2016. The impairment charge occurred prior to the annual impairment assessment in October 2016.
Due to the significance of the goodwill and identified indefinite-lived intangible assets to JCG's Consolidated Balance Sheets, an impairment charge could have a material adverse effect on the Company's consolidated financial condition and results of operations.
46
The annual October 2016, 2015 and 2014 tests of goodwill and indefinite-lived intangible assets indicated that estimated fair values exceeded their respective carrying values, and as such, no impairment charges were recognized. The impairment tests included certain underlying key assumptions regarding future overall market trends and Company operating performance. If actual future market results and Company operating performance vary unfavorably to those included in the Company's financial forecast, the Company may be subject to impairment charges related to its goodwill and indefinite-lived intangible assets.
Definite-lived intangible assets represent client relationships, which are amortized over their estimated lives using the straight-line method. The estimated lives of client relationships vary and range from 10 years to 17 years. Definite-lived intangible assets are tested only when there are indications of impairment. To complete the tests for potential impairment of definite-lived intangible assets, JCG uses a two-step process. The first step compares the fair value of the asset, based on undiscounted cash flows, to the recorded value of the asset. If the recorded value of the asset exceeds the fair value, a second step must be performed. The second step compares the fair value of the asset, based on discounted cash flows, to the carrying value of the asset. No impairment charges were recognized during the years ended December 31, 2016, 2015 and 2014.
Post-Employment Benefits
In October 2014, INTECH granted long-term incentive awards to retain and incentivize employees. The awards consisted of appreciation rights, profits interests and phantom interests, and were designed to give recipients an equity-like stake in INTECH. Profits interests and phantom interests entitle holders to periodic distributions of a portion of INTECH operating income. Distributions are made during employment and, for profits interests, post-employment for up to 10 years. Phantom interests are entitled to a one-time distribution at termination of employment. Compensation expense for post-employment distributions is based upon the present value of expected future distributions and is recognized pro rata over the 10-year vesting schedule for profits interests and five years for phantom interests. The present value of these payments was determined using a 2% discount rate, which represents the interest rate on a 20-year U.S. Treasury note. As of December 31, 2016, the total undiscounted estimated post-employment payments for profits interests and phantom interests is $58.1 million (the majority will not be paid until 10 to 20 years after the grant date). The estimated post-employment payments are evaluated and adjusted quarterly, as necessary, with changes recorded in operating expenses.
Equity Compensation
JCG uses the Black-Scholes option pricing model to estimate the fair value of the INTECH appreciation rights. The assumptions used in the Black-Scholes option pricing model include dividend yield, expected volatility, risk-free interest rate and expected life. The dividend yield and expected volatility were determined using historical data from publicly traded peers. The risk-free interest rate is based on the 10-year U.S. Treasury note at the time of the grant. The expected life of the appreciation rights was estimated based upon the assumption that recipients terminate upon vesting and exercise 20% of their rights each year over the following five years. See Part II, Item 8, Financial Statements and Supplementary Data, Note 14 — Long-Term Incentive Compensation, for more information regarding the INTECH appreciation rights.
JCG granted price-vesting units to its Chief Executive Officer on December 31, 2016, 2015, 2014 and 2013. There are performance and service conditions associated with the vesting of the price-vesting units. See Part II, Item 8, Financial Statements and Supplementary Data, Note 14 — Long-Term Incentive Compensation, for more information regarding the price-vesting units.
47
JCG records equity compensation net of estimated forfeitures over the vesting term. Determining the forfeiture estimate requires significant judgment about the number of actual awards that will ultimately vest over the term of the award. The estimate is reviewed quarterly and any change in actual forfeitures in comparison to estimates may cause an increase or decrease in the expense recognized in that period and future periods.
Income Taxes
Significant management judgment is required in developing JCG's provision for income taxes, including the valuation allowances that might be required against deferred tax assets and the evaluation of various income tax contingencies.
Valuation Allowance
JCG has not recorded a valuation allowance on its deferred tax assets of $64.6 million as of December 31, 2016, based on management's belief that future income will more likely than not be sufficient to realize the benefit of the Company's deferred tax assets over time. In the event that actual results differ from these estimates, or if JCG's historical trend of positive income changes, JCG may be required to record a valuation allowance on deferred tax assets, which could have a material adverse effect on the Company's consolidated financial condition and results of operations.
Income Tax Contingencies
At December 31, 2016, JCG had an accrued liability of $4.7 million related to tax contingencies for issues that may be raised by various taxing authorities. JCG accrued additional reserves for income tax contingencies in the amount of $1.1 million and removed reserves of $1.8 million in 2016, creating a net tax benefit of $0.4 million. JCG anticipates that its income tax contingency reserves will decrease by approximately $1.2 million in the next 12 months, primarily from the expiration of statutes of limitations and the resolution of audits. At any one time, tax returns filed in previous years are subject to audit by various taxing authorities. As a result of these audits and negotiations, additional tax assessments may be proposed or tax contingencies recorded in prior years may be reversed.
Contingent Consideration
Refer to Liquidity and Capital Resources for a detailed discussion of contingent consideration.
Recent Accounting Pronouncements
Information regarding recent accounting pronouncements is incorporated by reference from Part II, Item 8, Financial Statements and Supplementary Data, Note 3 — Recent Accounting Pronouncements.
ITEM 7A. QUANTITATIVE AND QUALITATIVE DISCLOSURES ABOUT MARKET RISK
The following information, together with information included in other parts of this Management's Discussion and Analysis of Financial Condition and Results of Operations, describes the key aspects of market risk that impacts JCG's financial statements.
Investment Management Fees
Operating revenues are generally based upon a percentage of the market value of assets under management and are calculated as a percentage of the daily average asset balance in accordance with contractual agreements. Accordingly, fluctuations in the financial markets have a direct effect on
48
JCG's operating results. In addition, fluctuations in interest rates may affect the value of assets under management in fixed income investment products. Although fluctuations in the financial markets have a direct effect on JCG's operating results, assets under management may overperform or underperform the financial markets. As such, quantifying the impact of the correlation between assets under management and JCG's operating results may be misleading. However, the graph in Part II, Item 7, Management's Discussion and Analysis of Financial Condition and Results of Operations — Operating Revenues, presents the historical relationship between operating revenues and average assets under management.
Performance Fees
Performance fee revenue is derived from certain mutual funds and separate accounts. As a result, JCG's revenues are subject to volatility beyond market-based fluctuations discussed in the investment management fees section above.
JCG applies Method 1 as contemplated by U.S. generally accepted accounting principles when recognizing performance fees related to mutual funds and separate accounts. A detailed discussion of performance fees related to mutual funds and separate accounts is outlined below.
Mutual Funds
The investment management fee paid by each mutual fund subject to a performance fee is the base management fee plus or minus a performance fee adjustment as determined by the relative investment performance of the fund compared to a specified benchmark index. Under the performance-based fee structure, the investment advisory fee paid by each fund consists of two components: 1) a base fee calculated by applying the contractual fixed rate of the advisory fee to the fund's average daily net assets during the previous month, plus or minus 2) a performance fee adjustment calculated by applying a variable rate of up to 0.15% to the fund's average daily net assets during the performance measurement period. The performance measurement period begins as a trailing period ranging from 12 to 18 months, and each subsequent month is added to each successive performance measurement period until a 36 month period is achieved. At that point, the measurement period becomes a rolling 36 month period.
When current fund net assets vary from fund net assets over the performance measurement period, the performance fee adjustment, as a percentage of fund current assets, may vary significantly. Under circumstances involving underperformance by a rapidly shrinking fund, the dollar amount of the negative performance fee adjustment could be more than the dollar amount of the positive base fee.
JCG recognized mutual fund performance fees of negative $46.4 million, negative $28.8 million and negative $59.7 million for the years ended December 31, 2016, 2015 and 2014, respectively. At December 31, 2016 and 2015, $39.2 billion and $42.0 billion of assets under management were subject to mutual fund performance fees, respectively. The addition of performance fees to funds without such fees is subject to the approval of both a majority of the shareholders of such Funds and the Funds' Independent Board of Trustees.
Separate Accounts
Separate account performance fees are specified in certain client contracts and are based on investment performance as compared to an established benchmark index over a specified period of time. Performance fees are recognized quarterly or annually at the end of the contractual period if the stated performance criteria are achieved. Certain separate account performance fees are subject to clawback of previously recognized fees; however, such amounts are and have been insignificant.
49
JCG recognized separate account performance fees of $9.8 million, $19.0 million and $11.7 million for the years ended December 31, 2016, 2015 and 2014, respectively. At December 31, 2016 and 2015, $25.9 billion and $21.5 billion of assets under management were subject to separate account performance fees, respectively.
Investment Securities
At December 31, 2016, JCG was exposed to equity market price risk as a result of investment securities on its Consolidated Balance Sheets. The following is a summary of the effect that a hypothetical 10% increase or decrease in equity prices would have on JCG's investment securities subject to equity price fluctuations as of December 31, 2016 (in millions):
| |
Fair value |
Fair value assuming a 10% increase |
Fair value assuming a 10% decrease |
|||||||
|---|---|---|---|---|---|---|---|---|---|---|
Trading securities: |
| | | |||||||
Seeded investment products |
$ | 146.4 | $ | 161.0 | $ | 131.8 | ||||
Investments related to deferred compensation plans |
| 11.7 | | 12.9 | | 10.5 | ||||
Investments in advised mutual funds |
4.7 | 5.2 | 4.2 | |||||||
Available-for-sale securities: |
| | | |||||||
Seeded investment products |
12.0 | 13.2 | 10.8 | |||||||
| | | | | | | | | | | |
Total investment securities |
$ | 174.8 | $ | 192.3 | $ | 157.3 | ||||
| | | | | | | | | | | |
| | | | | | | | | | | |
| | | | | | | | | | | |
At December 31, 2016, JCG was exposed to interest rate risk and credit spread risk as a result of investment securities on its Consolidated Balance Sheets. The following is a summary of JCG's fixed income securities and the effect that a hypothetical 100 basis point increase and decrease in interest rates would have on the fair value as of December 31, 2016 (in millions):
| |
Fair value | Fair value assuming a 100 basis point increase in interest rates |
Fair value assuming a 100 basis point decrease in interest rates |
|||||||
|---|---|---|---|---|---|---|---|---|---|---|
Trading securities: |
| | | |||||||
Seeded investment products |
$ | 109.2 | $ | 101.4 | $ | 117.0 | ||||
Investments related to deferred compensation plans |
| 5.5 | | 5.3 | | 5.7 | ||||
Available-for-sale securities: |
||||||||||
Seeded investment products |
| 14.2 | | 13.9 | | 14.5 | ||||
| | | | | | | | | | | |
Total investment securities |
$ | 128.9 | $ | 120.6 | $ | 137.2 | ||||
| | | | | | | | | | | |
| | | | | | | | | | | |
| | | | | | | | | | | |
Derivative Instruments
The Company maintains an economic hedge program that uses derivative instruments to hedge against market volatility of certain seeded investments. Fluctuations in equity markets, debt markets and commodity markets are hedged by index and commodity futures ("futures") and credit default swaps. Certain foreign currency translation associated with the Company's seeded investment products is also hedged using foreign currency forward contracts.
JCG reassessed its hedging strategy in 2016, which resulted in a reduction in the use of index swaps and an increase in the use of futures and credit default swaps to hedge against market
50
volatility of certain seeded investment products. As of December 31, 2016, JCG was not using index swaps as part of the economic hedge program.
JCG was party to the following derivative instruments as of December 31, 2016 and 2015:
| |
December 31, 2016 | December 31, 2015 | |||||||||||
|---|---|---|---|---|---|---|---|---|---|---|---|---|---|
| |
Number of contracts |
Notional value (in millions) |
Number of contracts |
Notional value (in millions) |
|||||||||
Futures |
| 50 | $ | 171.7 | | 38 | $ | 91.7 | |||||
Credit default swaps |
2 | $ | 128.5 | 2 | $ | 66.5 | |||||||
Foreign currency forward contracts |
| 2 | $ | 34.1 | | — | $ | — | |||||
Index swaps |
— | $ | — | 6 | $ | 34.4 | |||||||
The derivative instruments are not designated as hedges for accounting purposes. Changes in fair value of the index swaps, futures, and credit default swaps are recognized in investment losses, net on JCG's Consolidated Statements of Comprehensive Income while changes in the fair value of the foreign currency forward contracts are recognized in other income, net on JCG's Consolidated Statements of Comprehensive Income.
Mutual Fund Share Awards
During 2016, 2015 and 2014, JCG granted $26.1 million, $23.2 million and $22.7 million, respectively, in compensation-related awards that are indexed to certain mutual funds managed by the Company. Upon vesting, participants receive the value of the award adjusted for gains or losses attributable to the mutual funds to which the awards were indexed, subject to tax withholding. Mark-to-market adjustments on mutual fund share awards create volatility within long-term incentive compensation expense on JCG's Consolidated Statements of Comprehensive Income. The level of volatility depends upon the amount of mutual fund share awards and the market and investment performance of products to which the awards are indexed.
Deferred Compensation
JCG maintains deferred compensation plans for certain highly compensated employees and members of its Board of Directors. Eligible participants may defer a portion of their compensation and have the ability to earn a return by indexing their deferrals to mutual funds managed by the Company. The Company makes no contributions to the plan. To protect against market variability of the liability, the Company creates an economic hedge by investing in mutual funds that are consistent with the deferred amounts and mutual fund elections of the participants. Such investments remain assets of JCG. Changes in market value of the liability to participants are recognized as compensation in JCG's Consolidated Statements of Comprehensive Income, and changes in the market value of the economic hedge are recognized as investment losses, net in JCG's Consolidated Statements of Comprehensive Income. At December 31, 2016 and 2015, investments related to deferred compensation plans totaled $17.2 million and $16.3 million, respectively.
Foreign Currency Exchange Sensitivity
Certain JCG subsidiaries conduct business in foreign countries. With respect to these operations, matters arise as to financial accounting and reporting for foreign currency transactions and for translating foreign currency financial statements into U.S. dollars. The exposure to foreign currency fluctuations is not material as the majority of the revenue earned and associated expenses incurred by international subsidiaries are denominated in U.S. dollars. However, the acquisition of Kapstream in July 2015 added additional foreign currency exchange exposure as its revenue and expenses are translated from Australian dollars to U.S. dollars. The exposure to foreign currency fluctuations may increase in the future as JCG continues to grow its international business and launch new products denominated in currencies other than the U.S. dollar.
51
ITEM 8. FINANCIAL STATEMENTS AND SUPPLEMENTARY DATA
| |
Page | |
|---|---|---|
Financial Statements: |
||
Reports of Independent Registered Public Accounting Firm — Deloitte & Touche LLP |
53 | |
Management Report on Internal Control Over Financial Reporting |
55 | |
Consolidated Balance Sheets as of December 31, 2016 and 2015 |
56 | |
Consolidated Statements of Comprehensive Income for the Years Ended December 31, 2016, 2015 and 2014 |
57 | |
Consolidated Statements of Cash Flows for the Years Ended December 31, 2016, 2015 and 2014 |
58 | |
Consolidated Statements of Changes in Equity for the Years Ended December 31, 2016, 2015 and 2014 |
59 | |
Notes to Consolidated Financial Statements |
60 | |
Financial Statement Schedules: |
||
All schedules are omitted because they are not applicable or are insignificant, or the required information is shown in the consolidated financial statements or notes thereto. |
52
REPORT OF INDEPENDENT REGISTERED PUBLIC ACCOUNTING FIRM
To
the Board of Directors and Stockholders of
Janus Capital Group Inc.
Denver, CO
We have audited the accompanying consolidated balance sheets of Janus Capital Group Inc. and subsidiaries (the "Company") as of December 31, 2016 and 2015, and the related consolidated statements of comprehensive income, stockholders' equity, and cash flows for each of the three years in the period ended December 31, 2016. These financial statements are the responsibility of the Company's management. Our responsibility is to express an opinion on these financial statements based on our audits.
We conducted our audits in accordance with the standards of the Public Company Accounting Oversight Board (United States). Those standards require that we plan and perform the audit to obtain reasonable assurance about whether the financial statements are free of material misstatement. An audit includes examining, on a test basis, evidence supporting the amounts and disclosures in the financial statements. An audit also includes assessing the accounting principles used and significant estimates made by management, as well as evaluating the overall financial statement presentation. We believe that our audits provide a reasonable basis for our opinion.
In our opinion, such consolidated financial statements present fairly, in all material respects, the financial position of Janus Capital Group Inc. and subsidiaries as of December 31, 2016 and 2015, and the results of their operations and their cash flows for each of the three years in the period ended December 31, 2016, in conformity with accounting principles generally accepted in the United States of America.
We have also audited, in accordance with the standards of the Public Company Accounting Oversight Board (United States), the Company's internal control over financial reporting as of December 31, 2016, based on the criteria established in Internal Control — Integrated Framework (2013) issued by the Committee of Sponsoring Organizations of the Treadway Commission and our report dated February 16, 2017 expressed an unqualified opinion on the Company's internal control over financial reporting.
/s/ DELOITTE & TOUCHE LLP
Denver,
CO
February 16, 2017
53
REPORT OF INDEPENDENT REGISTERED PUBLIC ACCOUNTING FIRM
To
the Board of Directors and Stockholders of
Janus Capital Group Inc.
Denver, CO
We have audited the internal control over financial reporting of Janus Capital Group Inc. and subsidiaries (the "Company") as of December 31, 2016, based on criteria established in Internal Control — Integrated Framework (2013) issued by the Committee of Sponsoring Organizations of the Treadway Commission. The Company's management is responsible for maintaining effective internal control over financial reporting and for its assessment of the effectiveness of internal control over financial reporting, included in the accompanying Management Report on Internal Control Over Financial Reporting. Our responsibility is to express an opinion on the Company's internal control over financial reporting based on our audit.
We conducted our audit in accordance with the standards of the Public Company Accounting Oversight Board (United States). Those standards require that we plan and perform the audit to obtain reasonable assurance about whether effective internal control over financial reporting was maintained in all material respects. Our audit included obtaining an understanding of internal control over financial reporting, assessing the risk that a material weakness exists, testing and evaluating the design and operating effectiveness of internal control based on the assessed risk, and performing such other procedures as we considered necessary in the circumstances. We believe that our audit provides a reasonable basis for our opinion.
A company's internal control over financial reporting is a process designed by, or under the supervision of, the company's principal executive and principal financial officers, or persons performing similar functions, and effected by the company's board of directors, management, and other personnel to provide reasonable assurance regarding the reliability of financial reporting and the preparation of financial statements for external purposes in accordance with generally accepted accounting principles. A company's internal control over financial reporting includes those policies and procedures that (1) pertain to the maintenance of records that, in reasonable detail, accurately and fairly reflect the transactions and dispositions of the assets of the company; (2) provide reasonable assurance that transactions are recorded as necessary to permit preparation of financial statements in accordance with generally accepted accounting principles, and that receipts and expenditures of the company are being made only in accordance with authorizations of management and directors of the company; and (3) provide reasonable assurance regarding prevention or timely detection of unauthorized acquisition, use, or disposition of the company's assets that could have a material effect on the financial statements.
Because of the inherent limitations of internal control over financial reporting, including the possibility of collusion or improper management override of controls, material misstatements due to error or fraud may not be prevented or detected on a timely basis. Also, projections of any evaluation of the effectiveness of the internal control over financial reporting to future periods are subject to the risk that the controls may become inadequate because of changes in conditions, or that the degree of compliance with the policies or procedures may deteriorate.
In our opinion, the Company maintained, in all material respects, effective internal control over financial reporting as of December 31, 2016, based on the criteria established in Internal Control — Integrated Framework (2013) issued by the Committee of Sponsoring Organizations of the Treadway Commission.
We have also audited, in accordance with the standards of the Public Company Accounting Oversight Board (United States), the consolidated financial statements as of and for the year ended December 31, 2016 of the Company and our report dated February 16, 2017, expressed an unqualified opinion on those consolidated financial statements.
/s/ DELOITTE & TOUCHE LLP
Denver,
CO
February 16, 2017
54
MANAGEMENT REPORT ON INTERNAL CONTROL OVER FINANCIAL REPORTING
Janus Capital Group Inc. ("JCG") management is responsible for establishing and maintaining adequate internal control over JCG's financial reporting, as defined in Rules 13a-15(f) and 15d-15(f) under the Securities Exchange Act of 1934. JCG's internal control system was designed to provide reasonable assurance to JCG's management and Board of Directors regarding the preparation and fair presentation of published financial statements. There are inherent limitations in the effectiveness of any internal control, including the possibility of human error and the circumvention or overriding of controls. Accordingly, even effective internal controls can provide only reasonable assurances with respect to financial statement preparation. Further, because of changes in conditions, the effectiveness of internal controls may vary over time.
JCG management has assessed the effectiveness of JCG's internal controls over financial reporting as of December 31, 2016. In making this assessment, JCG management used the framework set forth in the Committee of Sponsoring Organizations of the Treadway Commission in Internal Control — Integrated Framework (2013).
Based on the assessment using those criteria, JCG management believes that as of December 31, 2016, internal control over financial reporting is effective.
JCG's independent registered public accounting firm audited the financial statements included in the Annual Report on Form 10-K and has issued an audit report on management's assessment of JCG's internal control over financial reporting. This report appears on page 46 of this Annual Report on Form 10-K.
February 16, 2017
55
JANUS CAPITAL GROUP INC.
CONSOLIDATED BALANCE SHEETS
(Dollars in Millions, Except Share Data)
| |
December 31, 2016 |
December 31, 2015 |
|||||
|---|---|---|---|---|---|---|---|
ASSETS |
| | |||||
Current assets: |
|||||||
Cash and cash equivalents |
$ | 485.9 | $ | 364.4 | |||
Investment securities |
212.1 | 327.1 | |||||
Investment management fees and other receivables |
| 129.6 | | 137.8 | |||
Other current assets |
37.4 | 40.0 | |||||
Assets of consolidated VIEs: |
| | |||||
Cash and cash equivalents |
6.1 | — | |||||
Investment securities |
| 91.6 | | — | |||
Accounts receivable |
0.3 | — | |||||
| | | | | | | | |
Total current assets |
| 963.0 | | 869.3 | |||
Non-current assets: |
|||||||
Property, equipment and software, net |
| 34.2 | | 38.7 | |||
Intangible assets, net |
1,339.0 | 1,352.5 | |||||
Goodwill |
| 601.9 | | 602.8 | |||
Other non-current assets |
11.8 | 4.4 | |||||
| | | | | | | | |
Total assets |
$ | 2,949.9 | $ | 2,867.7 | |||
| | | | | | | | |
| | | | | | | | |
| | | | | | | | |
LIABILITIES |
|||||||
Current liabilities: |
|
|
|||||
Accounts payable and accrued liabilities |
$ | 92.7 | $ | 81.1 | |||
Accrued compensation and benefits |
| 138.5 | | 145.3 | |||
Current portion of long-term debt |
— | 107.5 | |||||
Liabilities of consolidated VIEs: |
| | |||||
Accounts payable and accrued liabilities |
0.5 | — | |||||
| | | | | | | | |
Total current liabilities |
| 231.7 | | 333.9 | |||
Non-current liabilities: |
|||||||
Long-term debt |
| 406.3 | | 294.8 | |||
Deferred income taxes, net |
502.8 | 498.9 | |||||
Other non-current liabilities |
| 46.7 | | 46.2 | |||
| | | | | | | | |
Total liabilities |
1,187.5 | 1,173.8 | |||||
Commitments and contingencies (See Note 18) |
|
|
|||||
REDEEMABLE NONCONTROLLING INTERESTS |
43.1 |
21.8 |
|||||
| | | | | | | | |
EQUITY |
|
|
|||||
Preferred stock ($1.00 par, 10,000,000 shares authorized, none issued) |
— | — | |||||
Common stock ($0.01 par, 1,000,000,000 shares authorized; 182,671,008 and 183,660,673 shares outstanding, respectively) |
| 1.8 | | 1.8 | |||
Retained earnings |
1,636.5 | 1,589.8 | |||||
Accumulated other comprehensive loss, net of tax |
| (7.9 | ) | | (8.9 | ) | |
| | | | | | | | |
Total JCG shareholders' equity |
1,630.4 | 1,582.7 | |||||
Noncontrolling interests |
| 88.9 | | 89.4 | |||
| | | | | | | | |
Total equity |
1,719.3 | 1,672.1 | |||||
| | | | | | | | |
Total liabilities, redeemable noncontrolling interests and equity |
$ | 2,949.9 | $ | 2,867.7 | |||
| | | | | | | | |
| | | | | | | | |
| | | | | | | | |
The accompanying notes are an integral part of these consolidated financial statements.
56
JANUS CAPITAL GROUP INC.
CONSOLIDATED STATEMENTS OF COMPREHENSIVE INCOME
(Dollars in Millions, Except per Share Data)
| |
Year ended December 31, | |||||||||
|---|---|---|---|---|---|---|---|---|---|---|
| |
2016 | 2015 | 2014 | |||||||
Operating revenues: |
| | | |||||||
Investment management fees |
$ | 878.2 | $ | 913.7 | $ | 849.1 | ||||
Performance fees |
| (36.6 | ) | | (9.8 | ) | | (48.0 | ) | |
Shareowner servicing fees and other |
169.1 | 172.3 | 152.1 | |||||||
| | | | | | | | | | | |
Total operating revenues |
| 1,010.7 | | 1,076.2 | | 953.2 | ||||
| | | | | | | | | | | |
Operating expenses: |
||||||||||
Employee compensation and benefits |
| 344.0 | | 352.5 | | 322.8 | ||||
Long-term incentive compensation |
78.9 | 76.8 | 51.3 | |||||||
Marketing and advertising |
| 23.0 | | 22.0 | | 19.5 | ||||
Distribution |
133.0 | 141.0 | 131.0 | |||||||
Depreciation and amortization |
| 35.5 | | 33.0 | | 25.6 | ||||
General, administrative and occupancy |
134.7 | 128.6 | 113.3 | |||||||
| | | | | | | | | | | |
Total operating expenses |
| 749.1 | | 753.9 | | 663.5 | ||||
| | | | | | | | | | | |
Operating income |
261.6 |
322.3 |
289.7 |
|||||||
Interest expense |
|
(20.8 |
) |
|
(27.7 |
) |
|
(33.1 |
) |
|
Investment losses, net |
(6.3 | ) | (8.2 | ) | (1.9 | ) | ||||
Investment gains within consolidated VIEs, net |
| 3.8 | | — | | — | ||||
Other income, net |
3.9 | 3.2 | 3.0 | |||||||
Loss on early extinguishment of debt |
| — | | (36.3 | ) | | — | |||
| | | | | | | | | | | |
Income before taxes |
242.2 | 253.3 | 257.7 | |||||||
Income tax provision |
| (90.9 | ) | | (94.0 | ) | | (102.3 | ) | |
| | | | | | | | | | | |
Net income |
151.3 | 159.3 | 155.4 | |||||||
Net income attributable to noncontrolling interests |
| (5.2 | ) | | (3.5 | ) | | (1.0 | ) | |
| | | | | | | | | | | |
Net income attributable to JCG |
$ | 146.1 | $ | 155.8 | $ | 154.4 | ||||
| | | | | | | | | | | |
| | | | | | | | | | | |
| | | | | | | | | | | |
Earnings per share attributable to JCG common shareholders: |
|
|
|
|||||||
Basic |
$ | 0.79 | $ | 0.84 | $ | 0.82 | ||||
Diluted |
$ | 0.78 | $ | 0.80 | $ | 0.81 | ||||
Other comprehensive income (loss), net of tax: |
||||||||||
Net unrealized gain (loss) on available-for-sale securities |
$ | 1.1 | $ | (2.2 | ) | $ | 1.9 | |||
Foreign currency translation adjustment |
(1.2 | ) | (4.3 | ) | — | |||||
Reclassifications for items included in net income |
| 0.5 | | (1.0 | ) | | (2.2 | ) | ||
| | | | | | | | | | | |
Total other comprehensive income (loss), net of tax |
0.4 | (7.5 | ) | (0.3 | ) | |||||
| | | | | | | | | | | |
Comprehensive income |
|
151.7 |
|
151.8 |
|
155.1 |
||||
Comprehensive income attributable to noncontrolling interests |
(4.6 | ) | (3.5 | ) | (1.0 | ) | ||||
| | | | | | | | | | | |
Comprehensive income attributable to JCG |
$ | 147.1 | $ | 148.3 | $ | 154.1 | ||||
| | | | | | | | | | | |
| | | | | | | | | | | |
| | | | | | | | | | | |
The accompanying notes are an integral part of these consolidated financial statements.
57
JANUS CAPITAL GROUP INC.
CONSOLIDATED STATEMENTS OF CASH FLOWS
(Dollars in Millions)
| |
Year ended December 31, | |||||||||
|---|---|---|---|---|---|---|---|---|---|---|
| |
2016 | 2015 | 2014 | |||||||
CASH FLOWS PROVIDED BY (USED FOR): |
| | | |||||||
Operating activities: |
||||||||||
Net income |
$ | 151.3 | $ | 159.3 | $ | 155.4 | ||||
Adjustments to reconcile net income to net cash provided by operating activities: |
||||||||||
Depreciation and amortization |
| 35.5 | | 33.0 | | 25.6 | ||||
Deferred income taxes |
3.3 | 23.9 | 20.1 | |||||||
Amortization of stock-based compensation |
| 56.2 | | 52.2 | | 19.8 | ||||
Investment losses, net |
6.3 | 8.2 | 1.9 | |||||||
Investment gains within consolidated VIEs, net |
| (3.8 | ) | | — | | — | |||
Amortization of debt discounts, premiums and deferred issuance costs |
4.5 | 4.3 | 8.1 | |||||||
Loss on extinguishment of debt |
| — | | 36.3 | | — | ||||
Payment of deferred commissions, net |
(6.2 | ) | (11.4 | ) | (7.2 | ) | ||||
Other, net |
| 7.4 | | 5.2 | | 0.5 | ||||
Changes in operating assets and liabilities: |
||||||||||
Investment management fees and other receivables |
| 8.2 | | (2.5 | ) | | (20.8 | ) | ||
Other assets |
9.1 | (25.4 | ) | (13.0 | ) | |||||
Accounts payable and accrued liabilities |
| (1.7 | ) | | (4.2 | ) | | (5.4 | ) | |
Accrued compensation and benefits |
(6.6 | ) | (0.6 | ) | 20.0 | |||||
Other liabilities |
| (1.3 | ) | | (3.9 | ) | | 13.4 | ||
| | | | | | | | | | | |
Net operating activities |
262.2 | 274.4 | 218.4 | |||||||
| | | | | | | | | | | |
Investing activities: |
|
|
|
|||||||
Acquisitions, net of cash acquired of $0, $7.3 million and $4.3 million, respectively |
— | (81.4 | ) | (28.4 | ) | |||||
Purchase of property, equipment and software |
| (9.3 | ) | | (13.7 | ) | | (11.4 | ) | |
Purchases and settlements of investment securities |
(67.6 | ) | (91.0 | ) | (168.6 | ) | ||||
Purchases and settlements of investments by consolidated VIEs |
| (54.8 | ) | | — | | — | |||
Proceeds from sales, settlements and maturities of investment securities |
89.1 | 67.6 | 336.8 | |||||||
Proceeds from sales, settlements and maturities of investments by consolidated VIEs |
| 48.6 | | — | | — | ||||
Sales (purchases) of securities by consolidated seeded investment products, net |
7.3 | (32.2 | ) | (60.9 | ) | |||||
| | | | | | | | | | | |
Net investing activities |
| 13.3 | | (150.7 | ) | | 67.5 | |||
| | | | | | | | | | | |
Financing activities: |
||||||||||
Repayment of long-term debt |
| — | | (380.3 | ) | | (98.9 | ) | ||
Proceeds from issuance of debt |
— | 297.1 | — | |||||||
Debt issuance costs |
| — | | (2.6 | ) | | — | |||
Purchase of noncontrolling interests |
— | (0.4 | ) | (1.5 | ) | |||||
Distributions to noncontrolling interests |
| (6.6 | ) | | (6.7 | ) | | (1.6 | ) | |
Contingent consideration |
— | (8.6 | ) | — | ||||||
Third-party investments (redemptions) in consolidated seeded investment products, net |
| (7.3 | ) | | 32.2 | | 60.9 | |||
Proceeds from stock option exercises and employee stock purchases |
8.1 | 11.0 | 8.4 | |||||||
Excess tax benefit from equity-based compensation |
| 3.2 | | 9.1 | | 2.1 | ||||
Principal payments under capital lease obligations |
(1.4 | ) | (1.0 | ) | (1.2 | ) | ||||
Repurchase of common stock |
| (72.1 | ) | | (91.8 | ) | | (87.2 | ) | |
Dividends paid to JCG shareholders |
(77.2 | ) | (65.2 | ) | (58.4 | ) | ||||
| | | | | | | | | | | |
Net financing activities |
| (153.3 | ) | | (207.2 | ) | | (177.4 | ) | |
| | | | | | | | | | | |
Cash and cash equivalents: |
||||||||||
Effect of foreign exchange rate changes |
| (0.7 | ) | | (4.6 | ) | | (0.5 | ) | |
| | | | | | | | | | | |
Net change |
121.5 | (88.1 | ) | 108.0 | ||||||
At beginning of year |
| 364.4 | | 452.5 | | 344.5 | ||||
| | | | | | | | | | | |
At end of year |
$ | 485.9 | $ | 364.4 | $ | 452.5 | ||||
| | | | | | | | | | | |
| | | | | | | | | | | |
| | | | | | | | | | | |
Supplemental cash flow information: |
|
|
|
|||||||
Cash paid for interest |
$ | 15.5 | $ | 17.2 | $ | 27.2 | ||||
Cash paid for income taxes, net of refunds |
$ | 74.1 | $ | 90.4 | $ | 89.7 | ||||
The accompanying notes are an integral part of these consolidated financial statements.
58
JANUS CAPITAL GROUP INC.
CONSOLIDATED STATEMENTS OF CHANGES IN EQUITY
(Amounts in Millions)
| |
Shares | Common stock |
Retained earnings |
Accumulated other comprehensive income (loss) |
Nonredeemable noncontrolling interests |
Total equity |
|||||||||||||
|---|---|---|---|---|---|---|---|---|---|---|---|---|---|---|---|---|---|---|---|
Balance at December 31, 2013 |
| 188.6 | $ | 1.9 | $ | 1,496.0 | $ | (1.1 | ) | $ | 13.7 | $ | 1,510.5 | ||||||
Net income |
— | — | 154.4 | — | 1.1 | 155.5 | |||||||||||||
Other comprehensive income (loss) |
| — | | — | | — | | (0.3 | ) | | — | | (0.3 | ) | |||||
Amortization of stock-based compensation |
— | — | 25.9 | — | 1.6 | 27.5 | |||||||||||||
Issuance and forfeitures of restricted stock awards, net |
| 2.7 | | — | | — | | — | | — | | — | |||||||
Stock option exercises and employee stock purchases |
0.9 | — | 8.4 | — | — | 8.4 | |||||||||||||
Changes in noncontrolling interests in consolidated investment products |
| — | | — | | — | | — | | 32.2 | | 32.2 | |||||||
Distributions to noncontrolling interests |
— | — | — | — | (1.0 | ) | (1.0 | ) | |||||||||||
Change in fair value of INTECH redeemable noncontrolling interests |
| — | | — | | 1.2 | | — | | — | | 1.2 | |||||||
Vesting of nonredeemable noncontrolling interests |
— | — | — | — | 0.6 | 0.6 | |||||||||||||
Purchase of noncontrolling interests |
| — | | — | | — | | — | | (0.9 | ) | | (0.9 | ) | |||||
Repurchase of common stock |
(7.0 | ) | — | (87.2 | ) | — | — | (87.2 | ) | ||||||||||
Dividends paid to JCG shareholders |
| — | | — | | (58.4 | ) | | — | | — | | (58.4 | ) | |||||
| | | | | | | | | | | | | | | | | | | | |
Balance at December 31, 2014 |
185.2 | 1.9 | 1,540.3 | (1.4 | ) | 47.3 | 1,588.1 | ||||||||||||
Net income |
| — | | — | | 155.8 | | — | | 2.4 | | 158.2 | |||||||
Other comprehensive income (loss) |
— | — | — | (7.5 | ) | (4.1 | ) | (11.6 | ) | ||||||||||
Amortization of stock-based compensation |
| — | | — | | 35.0 | | — | | 1.2 | | 36.2 | |||||||
Issuance and forfeitures of restricted stock awards, net |
2.9 | — | — | — | (0.6 | ) | (0.6 | ) | |||||||||||
Stock option exercises and employee stock purchases |
| 1.4 | | — | | 11.0 | | — | | — | | 11.0 | |||||||
Tax impact of stock-based compensation |
— | — | 3.9 | — | — | 3.9 | |||||||||||||
Noncontrolling interest from the acquisition of Kapstream |
| — | | — | | — | | — | | 85.7 | | 85.7 | |||||||
Changes in noncontrolling interests in consolidated investment products |
— | — | — | — | (41.1 | ) | (41.1 | ) | |||||||||||
Distributions to noncontrolling interests |
| — | | — | | — | | — | | (1.0 | ) | | (1.0 | ) | |||||
Change in fair value of INTECH redeemable noncontrolling interests |
— | — | 0.7 | — | — | 0.7 | |||||||||||||
Purchase of noncontrolling interests |
| — | | — | | — | | — | | (0.4 | ) | | (0.4 | ) | |||||
Repurchase of common stock |
(5.8 | ) | (0.1 | ) | (91.7 | ) | — | — | (91.8 | ) | |||||||||
Dividends paid to JCG shareholders |
| — | | — | | (65.2 | ) | | — | | — | | (65.2 | ) | |||||
| | | | | | | | | | | | | | | | | | | | |
Balance at December 31, 2015 |
183.7 | 1.8 | 1,589.8 | (8.9 | ) | 89.4 | 1,672.1 | ||||||||||||
Net income |
| — | | — | | 146.1 | | — | | 5.5 | | 151.6 | |||||||
Other comprehensive income (loss) |
— | — | — | 1.0 | (0.6 | ) | 0.4 | ||||||||||||
Amortization of stock-based compensation |
| — | | — | | 40.1 | | — | | 0.5 | | 40.6 | |||||||
Amortization of INTECH appreciation rights |
— | — | — | — | 0.1 | 0.1 | |||||||||||||
Issuance and forfeitures of restricted stock awards, net |
| 3.1 | | — | | — | | — | | — | | — | |||||||
Stock option exercises and employee stock purchases |
1.2 | — | 8.1 | — | — | 8.1 | |||||||||||||
Tax impact of stock-based compensation |
| — | | — | | 0.6 | | — | | — | | 0.6 | |||||||
Noncontrolling interest from the acquisition of Kapstream |
— | — | — | — | — | — | |||||||||||||
Distributions to noncontrolling interests |
| — | | — | | — | | — | | (6.0 | ) | | (6.0 | ) | |||||
Change in fair value of INTECH redeemable noncontrolling interests |
— | — | 1.1 | — | — | 1.1 | |||||||||||||
Purchase of noncontrolling interests |
| — | | — | | — | | — | | — | | — | |||||||
Repurchase of common stock |
(5.3 | ) | — | (72.1 | ) | — | — | (72.1 | ) | ||||||||||
Dividends paid to JCG shareholders |
| — | | — | | (77.2 | ) | | — | | — | | (77.2 | ) | |||||
| | | | | | | | | | | | | | | | | | | | |
Balance at December 31, 2016 |
182.7 | $ | 1.8 | $ | 1,636.5 | $ | (7.9 | ) | $ | 88.9 | $ | 1,719.3 | |||||||
| | | | | | | | | | | | | | | | | | | | |
| | | | | | | | | | | | | | | | | | | | |
| | | | | | | | | | | | | | | | | | | | |
The accompanying notes are an integral part of these consolidated financial statements.
59
NOTES TO CONSOLIDATED FINANCIAL STATEMENTS
Note 1 — Description of the Business
Janus Capital Group Inc. and its subsidiaries (collectively, "JCG" or the "Company") derive revenue from providing investment management, administration, distribution and related services to financial advisors, individuals and institutional investors through mutual funds, separate accounts, other pooled investment vehicles, subadvised relationships and exchange-traded products ("ETPs") (collectively referred to as "investment products") in both domestic and international markets. Revenues are generally based upon a percentage of the market value of assets under management and are calculated as a percentage of the daily average asset balance in accordance with contractual agreements. Certain investment products are also subject to performance fees, which vary based on a product's relative performance as compared to a benchmark index and the level of assets subject to such fees. JCG's complex-wide assets include all assets under management and exchange-traded notes ("ETNs"). ETNs are not included in assets under management as the Company is not the named adviser or subadviser to its branded products. Assets under management primarily consist of domestic and international equity and fixed income securities. Accordingly, fluctuations in domestic and international financial markets, relative investment performance, sales and redemptions of investment products, and changes in the composition of assets under management are all factors that have a direct effect on JCG's operating results. A significant portion of JCG's revenue is derived from contracts to manage mutual funds, which are subject to annual review and approval by each fund's Board of Trustees or its shareholders, or both.
JCG's significant subsidiaries at December 31, 2016, include:
- •
- Janus Capital Management LLC ("Janus") (wholly-owned subsidiary) —
Janus offers growth and core equity, global and international equity as well as ETPs, balanced and fixed income investment products.
- •
- INTECH Investment Management LLC ("INTECH") (97.1% owned
subsidiary) — INTECH offers risk-managed investment products that are based on a mathematical theorem that seeks to add value for clients by capitalizing on
the volatility in stock price movements. INTECH's goal is to achieve long-term returns that outperform a specified benchmark index, while controlling risks and trading costs. INTECH manages and
subadvises institutional and separate accounts, and subadvises certain Janus mutual funds.
- •
- Perkins Investment Management LLC ("Perkins") (wholly-owned
subsidiary) — Perkins offers value-disciplined investment products, including small, mid and large cap and global value investment products.
- •
- Kapstream Capital Pty Limited ("Kapstream") (51% owned subsidiary) — Kapstream offers global macro fixed income products. In January 2017, JCG acquired the remaining 49% noncontrolling interest in Kapstream. Refer to Note 5 — Acquisitions for further discussion.
Note 2 — Summary of Significant Accounting Policies
Basis of Presentation
The consolidated financial statements have been prepared according to generally accepted accounting principles in the United States of America ("GAAP"). The Company's consolidated financial statements include all majority-owned subsidiaries and consolidated seeded investment products, and intercompany accounts and transactions have been eliminated in consolidation. Events subsequent to the balance sheet date have been evaluated for inclusion in the accompanying consolidated financial statements through the issuance date.
60
Accounting Estimates
The preparation of consolidated financial statements in conformity with GAAP requires management to make estimates and assumptions that affect the reported amounts of assets and liabilities, the disclosure of contingent assets and liabilities at the date of the consolidated financial statements, and the reported amounts of revenues and expenses during the reporting period. Actual results could differ from those estimates and the differences could be material. JCG's significant estimates relate to investment securities, goodwill and intangible assets, post-employment benefits, contingent consideration, equity compensation and income taxes.
Segment Information
The Company's management directs JCG's operations as one business, the investment management business, and thus operates in one business segment. JCG's Chief Operating Decision Maker (Chief Executive Officer) reviews the Company's financial performance at an aggregate level. All of the products and services provided by the Company relate to investment management and are subject to similar regulatory frameworks. Further, JCG's investment management, sales, distribution and administrative teams are generally not aligned with specific product lines or distribution channels.
Consolidation
In January 2016, the Company adopted the recently amended consolidation guidance issued by the Financial Accounting Standards Board ("FASB") on a modified retrospective basis. The amended guidance modified the analysis for determining if an entity is a VIE. The amended VIE analysis changed the assessment of kick-out rights and fees paid to a service provider when decision-making over an entity's most significant activities has been outsourced. Additionally, limited partnerships and similar entities are considered VIEs under the amended guidance unless limited partners hold substantive kick-out rights or participation rights.
JCG adopted the amended consolidation accounting guidance effective January 1, 2016. Upon adoption, JCG designated a number of its seeded investment products as VIEs, which are generally subject to consolidation by the Company at lower ownership percentages compared to the 50% threshold applied for voting rights entities ("VREs") and are also subject to specific disclosure requirements. As a result of the adoption, the Company consolidated four additional seeded investment products as of January 1, 2016.
Analysis
JCG performs an analysis of investment products and affiliated entities which the Company has a financial interest to determine if the affiliate or product is a VIE or a VRE. Factors considered in this assessment include the entity's legal organization, the entity's capital structure and equity ownership, and any de facto agent implications of the Company's involvement with the entity. Investment products that are determined to be VIEs are consolidated if the Company is the primary beneficiary of the entity. VREs are consolidated if the Company holds the majority voting interest. Upon the occurrence of certain events (such as contributions and redemptions, either by JCG or third parties, or amendments to the governing documents of the Company's investment products), management reviews and reconsiders its previous conclusion regarding the status of an entity as a VIE or a VRE. Additionally, management continually reconsiders whether JCG is considered a VIE's primary beneficiary, and thus consolidates such entity.
61
Variable Interest Entities
Certain investment products for which a controlling financial interest is achieved through arrangements that do not involve or are not directly linked to voting interests are considered VIEs. JCG reviews factors, including whether or not (i) the entity has equity that is sufficient to permit the entity to finance its activities without additional subordinated support from other parties and (ii) the equity holders at risk have the obligation to absorb losses, the right to receive residual returns and the right to direct the activities of the entity that most significantly impact the entity's economic performance, to determine if the investment product is a VIE. JCG re-evaluates such factors as facts and circumstances change.
JCG consolidates a VIE if JCG is the VIE's primary beneficiary. The primary beneficiary of a VIE is defined as the variable interest holder that has a controlling financial interest in the VIE. A controlling financial interest is defined as (i) the power to direct the activities of the VIE that most significantly impact its economic performance and (ii) the obligation to absorb losses of the entity or the right to receive benefits from the entity that potentially could be significant to the VIE.
JCG is the manager of various types of seeded investment products, which may be considered VIEs. The Company's involvement in financing the operations of the VIEs is generally limited to its investments in the entities. As a result of the adoption of amended consolidation guidance effective January 1, 2016, the Company consolidated certain seeded investment products that were not previously consolidated. Prior to January 1, 2016, none of the Company's affiliates or seeded investment products were designated as VIEs.
Voting Rights Entities
JCG consolidates seeded investment products accounted for as VREs when it is considered to control such products, which generally exists if JCG has a greater than 50% voting equity interest.
Cash and Cash Equivalents
Cash and cash equivalents consist of cash held at banks in the U.S. and outside the U.S., and short-term investments with an initial maturity of three months or less when purchased. JCG's cash equivalents consist primarily of commercial paper, Federal Home Loan Bank bonds and certificates of deposit, and totaled $365.6 million and $246.9 million at December 31, 2016 and 2015, respectively. At December 31, 2016 and 2015, approximately $28 million of cash held outside the U.S. was not available for general corporate purposes due to capital requirements associated with foreign subsidiaries of JCG. In addition, $6.1 million of cash associated with consolidated VIEs and $1.2 million of cash associated with consolidated VREs at December 31, 2016 and 2015, respectively, was not available for general corporate purposes.
Property, Equipment and Software
Property, equipment and software purchases are recorded at cost. Depreciation is recorded using the straight-line method over the estimated useful life of the related assets (or the lease term, if shorter). Depreciation expense totaled $14.3 million, $11.5 million and $10.4 million for the years
62
ended December 31, 2016, 2015 and 2014, respectively. Property, equipment and software are summarized as follows (in millions):
| |
|
December 31, | |||||||
|---|---|---|---|---|---|---|---|---|---|
| |
Depreciation period |
||||||||
| |
2016 | 2015 | |||||||
Furniture, fixtures, computer equipment and software |
3-7 years | $ | 235.4 | $ | 228.0 | ||||
Leasehold improvements |
3-24 years | 38.2 | 39.5 | ||||||
| | | | | | | | | | |
Property, equipment and software, gross |
| | 273.6 | | 267.5 | ||||
Accumulated depreciation |
(239.4 | ) | (228.8 | ) | |||||
| | | | | | | | | | |
Property, equipment and software, net |
| $ | 34.2 | $ | 38.7 | ||||
| | | | | | | | | | |
| | | | | | | | | | |
| | | | | | | | | | |
Computer equipment includes hardware capital leases and represented $12.8 million and $12.0 million of the gross property, equipment and software balance on the Consolidated Balance Sheets at December 31, 2016 and 2015, respectively.
Purchased software is recorded at cost and depreciated over its estimated useful life. Internal and external costs incurred in connection with developing or obtaining software for internal use are expensed as incurred during the preliminary project stage, as are training and maintenance costs. Internal and external costs incurred for internal use software during the application development stage are capitalized until such time that the software is substantially complete and ready for its intended use. Application development stage costs are depreciated on a straight-line basis over the estimated useful life of the software.
Capitalized software costs totaled $11.5 million and $13.0 million at December 31, 2016 and 2015, respectively, and are presented within property, equipment and software, net on the Consolidated Balance Sheets.
JCG evaluates its long-lived assets for impairment whenever events or changes in circumstances indicate that the carrying amount of an asset may not be recoverable. The evaluation is based on an estimate of the future cash flows expected to result from the use of the asset and its eventual disposition. If expected future undiscounted cash flows are less than the carrying amount of the asset, an impairment loss is recognized in an amount equal to the excess of the carrying amount of the asset over the fair value of the asset.
A leasehold improvement impairment charge of $3.7 million was recognized in depreciation and amortization on the Consolidated Statements on Comprehensive Income during the year ended December 31, 2016. There were no impairments of long-lived assets for the years ended December 31, 2015 and 2014.
Deferred Commissions
Sales commissions paid to financial intermediaries on sales of certain mutual fund shares are deferred and amortized over various periods, not exceeding four years, based on the estimated recoverability of the asset through distribution fee payments and contingent deferred sales charges. Contingent deferred sales charges received from early redemptions reduce the unamortized deferred commissions balance. Amortization expense for the years ended December 31, 2016, 2015 and 2014, totaled $8.4 million, $10.2 million and $5.6 million, respectively, and is included in depreciation and amortization on JCG's Consolidated Statements of Comprehensive Income.
63
Deferred commissions, which are recorded as components of other current assets and other non-current assets on the Consolidated Balance Sheets, are summarized as follows as of December 31, 2016 and 2015 (in millions):
| |
December 31, | ||||||
|---|---|---|---|---|---|---|---|
| |
2016 | 2015 | |||||
Deferred commissions — current |
$ | 2.7 | $ | 4.8 | |||
Deferred commissions — non-current |
0.3 | 0.5 | |||||
| | | | | | | | |
Total |
$ | 3.0 | $ | 5.3 | |||
| | | | | | | | |
| | | | | | | | |
| | | | | | | | |
Investment Securities
JCG classifies investment securities as trading, available-for-sale or held-to-maturity at the time of purchase and periodically re-evaluates such classifications. Trading securities are carried on JCG's Consolidated Balance Sheets at fair value and consist primarily of investments related to seeded investment products, investments in advised mutual funds and investments related to the economic hedging of deferred compensation.
Seeded Investment Products
JCG periodically adds new investment strategies to its investment product offerings by providing the initial cash investment or "seeding." The primary purpose of seeded investment products is to generate an investment performance track record in a product to attract third-party investors. JCG's initial investment in a new product represents 100% ownership in that product. Seeded investment products are initially consolidated and the individual securities within the portfolio are accounted for as trading securities. Noncontrolling interests in seeded investment products represent third-party ownership interests and are part of investment securities on JCG's Consolidated Balance Sheets. These assets are not available for general corporate purposes and may be redeemed by the third parties at any time.
JCG's unconsolidated seeded investments products are classified as equity method and are carried on JCG's Consolidated Balance Sheets at fair value due to the nature of the underlying investments. The change in fair value of the unconsolidated seeded investment products is recorded in investment losses, net on JCG's Consolidated Statements of Comprehensive Income.
Refer to the consolidation discussion in this note for information regarding the consolidation of JCG's investment securities.
JCG may redeem invested seed capital for a variety of reasons, including when third-party investments in the relevant product are sufficient to sustain the given investment strategy. The length of time JCG holds a majority interest in a product varies based on a number of factors, including, but not limited to, market demand, market conditions and investment performance.
Available-for-Sale Securities
Investment securities classified as available-for-sale consist of unconsolidated seeded investment products and are carried on JCG's Consolidated Balance Sheets at fair value. Changes in fair value are reflected as a component of other comprehensive income (loss), net of tax on JCG's Consolidated Statements of Comprehensive Income until realized. Accumulated gains and losses are reclassified to earnings when the securities are sold on a first-in, first-out cost basis.
64
Investments in Advised Mutual Funds and Investments Related to the Economic Hedging of Deferred Compensation
JCG grants mutual fund share awards to employees that are indexed to certain funds managed by JCG. Upon vesting, participants receive the value of the mutual fund share awards adjusted for gains or losses attributable to the mutual funds to which the award was indexed, subject to tax withholding.
The Company maintains deferred compensation plans for certain highly compensated employees and members of its Board of Directors. Eligible participants may defer a portion of their compensation and have the ability to earn a return by indexing their deferrals to mutual funds managed by the Company and its subsidiaries. The Company makes no contributions to the plan. To protect against market variability of the liability, the Company creates an economic hedge by investing in mutual funds that are consistent with the deferred amounts and mutual fund elections of the participants. Such investments remain assets of JCG. Changes in market value of the liability to participants are recognized as long-term incentive compensation in JCG's Consolidated Statements of Comprehensive Income, and changes in the market value of the mutual fund securities are recognized in investment losses, net on JCG's Consolidated Statements of Comprehensive Income.
Impairment Evaluation
JCG periodically evaluates the carrying value of investment securities classified as available-for-sale or held-to-maturity for potential impairment. In determining if an impairment exists, JCG considers the duration, extent and circumstances of any decline in fair value.
JCG evaluates the securities in an unrealized loss position in the available-for-sale portfolio for other-than-temporary impairment ("OTTI") on the basis of the duration of the decline in value of the security and severity of that decline as well as JCG's intent and ability to hold these securities for a period of time sufficient to allow for any anticipated recovery in the market value. If it is determined that the impairment of a security is other-than-temporary, an impairment loss equal to the difference between the carrying value of the security and its fair value is recognized within investment losses, net on JCG's Consolidated Statements of Comprehensive Income. There were no OTTI of investment securities for the years ended December 31, 2016, 2015 and 2014.
Derivative Instruments
The Company maintains an economic hedge program that uses derivative instruments to hedge against market volatility of certain seed investments. Fluctuations in equity markets, debt markets and commodity markets are hedged by using index and commodity futures ("futures") and credit default swaps. Certain foreign currency translation associated with the Company's seeded investment products is also hedged by using foreign currency forward contracts. These derivative instruments are not classified as hedges for accounting purposes. The Company records all derivatives in other current assets and accounts payable and accrued liabilities on JCG's Consolidated Balance Sheets and measures those investments at fair value. Changes in the value of the futures and credit default swaps are recognized as a component of investment losses, net while changes in fair value of the foreign currency forward contracts are recognized in other income, net on JCG's Consolidated Statements of Comprehensive Income.
The Company's consolidated seeded investment products may also be party to derivative instruments from time to time. These derivative instruments are disclosed separately from the Company's derivative instruments related to its economic hedge program. Refer to Note 7 — Investment Securities.
65
Fair Value Measurements
Fair value of assets and liabilities is determined using observable market data based on recent trading activity. Where observable market data is unavailable due to a lack of trading activity, JCG utilizes internally developed models to estimate fair value and independent third parties to validate assumptions, when appropriate. Estimating fair value requires significant management judgment, including benchmarking to similar instruments with observable market data and applying appropriate discounts that reflect differences between the securities that JCG is valuing and the selected benchmark. Depending on the type of securities owned by JCG, other valuation methodologies may be required.
Measurements of fair value are classified within a hierarchy based upon the transparency of inputs used in the valuation of an asset or liability. Classification within the hierarchy is based upon the lowest level of input that is significant to the fair value measurement.
The valuation hierarchy contains three levels:
- •
- Level 1 — Valuation inputs are unadjusted quoted market prices for identical assets or liabilities in active markets.
- •
- Level 2 — Valuation inputs are quoted market prices for identical assets or liabilities in markets that are not
active, quoted market prices for similar assets and liabilities in active markets, and other observable inputs directly or indirectly related to the asset or liability being measured.
- •
- Level 3 — Valuation inputs are unobservable and significant to the fair value measurement.
Refer to Note 9 — Fair Value Measurements for additional information.
Income Taxes
Deferred income tax assets and liabilities are recorded for the temporary differences between the financial statement and income tax bases of assets and liabilities as measured by the enacted income tax rates that may be in effect when these differences reverse. The effect of changes in tax rates on deferred tax assets and liabilities is recognized in the period that includes the enactment date. Significant management judgment is required in developing JCG's provision for income taxes, including the valuation allowances that might be required against deferred tax assets and the evaluation of various income tax contingencies.
The accounting guidance for uncertainty in income taxes sets forth a specific method for the financial statement recognition and measurement of a tax position taken or expected to be taken on a tax return. The tax contingencies liability relates primarily to general state tax items and has been recorded in accounts payable and accrued liabilities, and other non-current liabilities on JCG's Consolidated Balance Sheets, as appropriate.
Taxing authorities generally charge interest and may assess penalties in the event that a tax position taken is subsequently reversed upon examination. JCG has accrued interest on its uncertain tax provisions based on the rates specified by the applicable taxing authorities and has recorded the interest as a component of the tax provision. Accrued interest of $0.6 million, $0.8 million and $0.8 million was included in the liability for tax contingencies at December 31, 2016, 2015 and 2014, respectively. Any potential penalties associated with a tax contingency will also be included as a component of the tax provision in the period in which the assessment of a penalty becomes likely. JCG does not believe that it is subject to any penalties related to its tax contingencies and, therefore, has not accrued a liability for tax penalties.
66
In the event of an overpayment of income taxes, taxing authorities generally pay interest from the date of the overpayment. JCG records interest income from taxing authorities as a component of the income tax provision.
Goodwill and Intangible Assets, Net
Goodwill represents the excess of cost over the fair value of the identifiable net assets of acquired companies. Identifiable intangible assets generally represent the acquisition cost of client relationships, investment management agreements and trademarks. Goodwill and indefinite-lived intangible assets are tested for impairment annually as of October 1 or more frequently if events or circumstances indicate that the carrying value may not be recoverable. Intangible assets subject to amortization are tested for impairment whenever events or circumstances indicate that the carrying value may not be recoverable. Goodwill and intangible assets require significant management estimates and judgment, including the valuation and expected life determination in connection with the initial purchase price allocation and the ongoing evaluation for impairment.
Noncontrolling Interests and Redeemable Noncontrolling Interests
Noncontrolling interests that are not subject to redemption rights are classified in permanent equity. Redeemable noncontrolling interests are classified outside of permanent equity on the Consolidated Balance Sheets and are measured at estimated fair value as of the balance sheet dates. Changes in fair value of redeemable noncontrolling interests are recognized as increases or decreases to redeemable noncontrolling interests with an offsetting charge to retained earnings. Earnings attributable to noncontrolling interests that are and are not subject to redemption rights are combined in JCG's Consolidated Statements of Comprehensive Income. Acquisitions of entities in which JCG holds an existing controlling interest are treated as a reduction of noncontrolling interests or redeemable noncontrolling interests in an amount equal to the purchase price. See Note 13 — Noncontrolling Interests for further discussion of noncontrolling interests.
Revenue Recognition
Investment management fees, and shareowner servicing fees and other are recognized as services are provided. These revenues are generally determined in accordance with contracts based upon a percentage of average assets under management. Shareholder servicing fees and other largely comprises transfer agent fees and revenue on VelocityShares-branded products.
Performance fee revenue is derived from certain mutual funds and separate accounts. JCG applies Method 1 as contemplated by GAAP when recognizing performance fees related to mutual funds and separate accounts. A detailed discussion of performance fees related to mutual funds and separate accounts is outlined below.
Mutual Funds
The investment management fee paid by each mutual fund subject to a performance fee is the base management fee plus or minus a performance fee adjustment as determined by the relative investment performance of the fund compared to a specified benchmark index. Under the performance-based fee structure, the investment advisory fee paid by each fund consists of two components: (1) a base fee calculated by applying the contractual fixed rate of the advisory fee to the fund's average daily net assets during the previous month, plus or minus (2) a performance fee adjustment calculated by applying a variable rate of up to 0.15% to the fund's average daily net assets during the performance measurement period. The performance measurement period begins as a trailing period ranging from 12 to 18 months, and each subsequent month is added to each
67
successive performance measurement period until a 36-month period is achieved. At that point, the measurement period becomes a rolling 36-month period.
When current fund net assets vary from fund net assets over the performance measurement period, the performance fee adjustment, as a percentage of fund current assets, may vary significantly. Under circumstances involving underperformance by a rapidly shrinking fund, the dollar amount of the negative performance fee adjustment could be more than the dollar amount of the positive base fee.
JCG recognized mutual fund performance fees of negative $46.4 million, negative $28.8 million and negative $59.7 million for the years ended December 31, 2016, 2015 and 2014, respectively. Negative mutual fund performance fees are driven by underperformance of certain mutual funds against their respective benchmark index. At December 31, 2016 and 2015, $39.2 billion and $42.0 billion of assets under management were subject to mutual fund performance fees, respectively. The addition of performance fees to all funds without such fees is subject to the approval of both a majority of the shareholders of such Funds and the Funds' Independent Board of Trustees.
Separate Accounts
Separate account performance fees are specified in certain client contracts and are based on investment performance as compared to an established benchmark index over a specified period of time. Performance fees are recognized quarterly or annually at the end of the contractual period if the stated performance criteria are achieved. Certain separate account performance fees are subject to clawback of previously recognized fees; however, such amounts are and have been insignificant.
JCG recognized separate account performance fees of $9.8 million, $19.0 million and $11.7 million for the years ended December 31, 2016, 2015 and 2014, respectively. At December 31, 2016 and 2015, $25.9 billion and $21.5 billion of assets under management were subject to separate account performance fees, respectively.
Marketing
Marketing and promotional costs are generally expensed as incurred.
Stock-Based Compensation
Stock-based compensation cost is based on the grant date fair value of awards expected to vest at the end of the stated service period and consists of the total value of the awards less an estimate for forfeitures. The grant date fair value for stock options is determined using the Black-Scholes option pricing model, and the grant date fair value of restricted stock is determined from the market price on the date of grant. The Black-Scholes model requires management to estimate certain variables, including the lives of options from grant date to exercise date, the volatility of the underlying shares and future dividend rates.
JCG estimates, at the time of grant, the amount of awards that are not expected to vest based on historical forfeiture rates and subsequently records adjustments, as appropriate.
Earnings Per Share
JCG calculates basic and diluted earnings per share using the two-class method, as common shares and participating restricted stock awards are paid nonforfeitable dividends. Under the two-class method, net income attributable to JCG is adjusted for the allocation of earnings to participating restricted stock awards. In addition, the weighted-average diluted common shares outstanding are calculated using the two-class method.
68
Contingent Consideration
The July 2015 transaction to acquire a controlling 51% voting interest in Kapstream Capital Pty Limited ("Kapstream") included contingent cash consideration. The contingent cash consideration is payable in Australian dollars at 18 and 36 months after acquisition if certain Kapstream assets under management reach defined targets. Refer to Note 5 — Acquisitions for a detailed discussion on the contingent consideration related to the acquisition of a controlling 51% voting interest in Kapstream.
The acquisition of VS Holdings Inc. ("VelocityShares") in 2014 included contingent cash consideration. The payments are contingent on certain VelocityShares' ETPs reaching defined net revenue targets on the first, second, third and fourth anniversaries of the acquisition, in amounts up to $10.0 million each for the first and second anniversaries, and $8.0 million each for the third and fourth anniversaries. Refer to Note 5 — Acquisitions for a detailed discussion of the contingent consideration related to the acquisition of VelocityShares.
Note 3 — Recent Accounting Pronouncements
In May 2014, the FASB issued a new revenue recognition standard. The standard's core principle is that a company will recognize revenue to depict the transfer of goods or services to customers in an amount that reflects the consideration to which the entity expects to be entitled in exchange for those goods or services. In addition, the standard specifies the accounting for certain costs to obtain or fulfill a contract with a customer and expands disclosure requirements for revenue recognition. The revenue standard is effective for annual reporting periods beginning after December 15, 2017, including interim periods within that reporting period. Early adoption is permitted for annual reporting periods beginning after December 15, 2016, including interim reporting periods within those annual periods. The Company is evaluating the effect of adopting this new accounting standard and is currently focused on the assessment of its mutual fund performance fees and the related applicability of the new guidance. The Company's evaluation is ongoing and not complete. The Company does not expect significant changes in revenue recognition for the majority of its revenues as a result of adopting the standard.
In April 2015, the FASB issued an amendment to its debt standard requiring debt issuance costs related to a recognized debt liability to be presented in the balance sheet as a direct deduction from the carrying amount of that debt liability, consistent with the presentation of debt discounts and premiums. The standard is effective for annual reporting periods beginning after December 15, 2015, including interim periods within that reporting period. The Company retrospectively adopted this new accounting standard during the first quarter 2016 and reclassified the December 31, 2015, debt issuance cost balances of $1.4 million and $2.4 million from other current assets and other non-current assets to current portion of long-term debt and long-term debt, respectively, on JCG's Consolidated Balance Sheets.
In January 2016, the Company adopted the recently amended consolidation guidance issued by the FASB on a modified retrospective basis. Refer to Note 2 — Summary of Significant Accounting Policies for further discussion.
In January 2016, the FASB issued amendments to its financial instruments standard, including changes relating to the accounting for equity investments, and the presentation and disclosure requirements for financial instruments. Under the amended guidance, all equity investments in unconsolidated entities (other than those accounted for using the equity method of accounting) will generally be measured at fair value through earnings. There will no longer be an available-for-sale classification (changes in fair value reported in other comprehensive income) for equity securities with readily determinable fair values. The amended guidance also requires financial assets and financial liabilities to be presented separately in the notes to the consolidated financial statements, grouped by measurement category (e.g., fair value, amortized cost, lower of cost or market) and
69
form of financial asset (e.g., loans, securities). The standard is effective for fiscal years beginning after December 15, 2017, including interim periods within those fiscal years. The Company is evaluating the effect of adopting this new accounting standard.
In February 2016, the FASB issued a new standard on accounting for leases. The new standard represents a significant change to lease accounting and introduces a lessee model that brings most leases on to the balance sheet. The standard also aligns certain of the underlying principles of the new lessor model with those in the FASB's new revenue recognition standard. Furthermore, the new standard addresses other concerns related to the current leases model. The standard is effective for calendar periods beginning on January 1, 2019. The Company is evaluating the effect of adopting this new accounting standard.
In March 2016, the FASB issued an amendment to its principal-versus-agent guidance in the FASB's new revenue standard. The key provisions of the amendment are assessing the nature of the entity's promise to the customer, identifying the specified goods or services, application of the control principle and indicators of control. The amendment is effective for annual reporting periods beginning after December 15, 2017, including interim periods within those annual reporting periods. In addition, entities are required to adopt the amendment by using the same transition method they used to adopt the new revenue standard. The Company is evaluating the effect of adopting this new accounting standard.
In March 2016, the FASB issued an Accounting Standards Update ("ASU") that simplified several aspects of the accounting for employee share-based payment transactions, including the accounting for income taxes, forfeitures and statutory tax withholding requirements as well as classification in the statement of cash flows. The ASU is effective for annual reporting periods beginning after December 15, 2016, including interim periods within those annual reporting periods. The adoption of this standard will not have a material impact on the Company's financial statements.
In August 2016, the FASB issued an ASU to clarify guidance on the classification of certain cash receipts and cash payments in the statement of cash flows. The FASB issued the ASU with the intent of reducing diversity in practice regarding eight types of cash flows. The ASU is effective for annual reporting periods beginning after December 15, 2017, including interim periods within those annual reporting periods. The Company is evaluating the effect of adopting this new accounting standard.
In November 2016, the FASB issued an ASU to clarify guidance on the classification and presentation of restricted cash in the statement of cash flows. The ASU is effective for annual reporting periods beginning after December 15, 2017, including interim periods within those annual reporting periods. The Company is evaluating the effect of adopting this new accounting standard.
In January 2017, the FASB issued an ASU which simplifies the accounting for goodwill impairments by eliminating step two from the goodwill impairment test. The ASU requires goodwill impairments to be measured on the basis of the fair value of the reporting unit relative to the reporting unit's carrying amount rather than on the basis of the implied amount of goodwill relative to the goodwill balance of the reporting unit. The ASU is effective for annual and interim impairment tests for periods beginning after December 15, 2021. Early adoption is allowed for annual and interim impairment tests occurring after January 1, 2017. The Company is evaluating the effect of adopting this new accounting standard.
On October 3, 2016, JCG and Henderson Group plc ("Henderson") entered into an Agreement and Plan of Merger (the "Merger Agreement") relating to the business combination of JCG and Henderson. Under the terms of the agreement, the businesses of JCG and Henderson will be
70
combined under Henderson, which will be renamed Janus Henderson Group plc ("Janus Henderson"). The merger will be effected via a share exchange, with each share of JCG common stock converted into the right to receive 4.7190 Henderson ordinary shares. Janus Henderson shares will be delivered to JCG shareholders as merger consideration, with Janus Henderson applying for admission to trade on the New York Stock Exchange ("NYSE") as its primary listing and with the existing listing on the Australian Securities Exchange retained. Henderson and JCG shareholders are expected to own approximately 57% and 43%, respectively, of Janus Henderson shares upon closing.
The closing of the merger is subject to, among other things, (a) the approval of the shareholders of JCG of the merger; (b) the approval of the shareholders of Henderson of (i) the merger, (ii) the name change of Henderson, (iii) the amended and restated memorandum and articles of association of Henderson, (iv) the delisting of Henderson ordinary shares from the London Stock Exchange and (v) the payment of a dividend in respect to the second half of the 2016 fiscal year; (c) the receipt of the required regulatory approvals, including the approval of Financial Industry Regulatory Authority, Inc. ("FINRA") and the United Kingdom ("U.K.") Financial Conduct Authority; (d) the approval by the board of trustees and shareholders for JCG-advised U.S. mutual funds of new investment advisory agreements with JCG to take effect at the closing of the merger representing at least 67.5% of the assets under management of those funds as of September 30, 2016; (e) the effectiveness of the registration statement relating to the issuance of Henderson ordinary shares in connection with the merger and absence of any stop order or proceedings by the SEC; (f) approval for listing on the NYSE of the Henderson ordinary shares; and (g) the absence of governmental restraints or prohibitions preventing the consummation of the merger. The obligation of each of JCG and Henderson to consummate the merger is also conditioned on, among other things, the truth and correctness of the representations and warranties made by the other party as of the closing date (subject to certain "materiality" and "material adverse effect" qualifiers). Subject to the satisfaction or, if applicable, waiver of these conditions, the merger is expected to close on or about May 30, 2017.
JCG incurred $13.3 million of merger-related expenses during the year ended December 31, 2016; $12.4 million is included in general, administrative and occupancy and $0.9 million is included in marketing and advertising on the Consolidated Statements of Comprehensive Income, respectively.
Acquisition of Kapstream
On July 1, 2015, JCG announced and closed the acquisition of a controlling 51% voting interest in Kapstream, a global macro fixed income asset manager located in Australia. The transaction included initial upfront cash consideration of $84.1 million and contingent cash consideration with a present value of $6.0 million, with the contingent consideration payable at 18 and 36 months after acquisition if certain Kapstream assets under management reach defined targets. Fair value adjustments to the contingent consideration during the years ended December 31, 2016 and 2015, resulted in a $1.4 million decrease and $1.2 million increase to the liability and expense, including the monthly accretion of the liability to the future value of the consideration, respectively. At December 31, 2016, the fair value of the contingent consideration is included in accounts payable and accrued liabilities, and other non-current liabilities on JCG's Consolidated Balance Sheets.
In December 2016, Kapstream assets under management reached defined targets for the 18-month anniversary of the acquisition and JCG paid contingent consideration of $5.6 million in February 2017. As of December 31, 2016, the total maximum payment over the remaining contingent consideration period (36-month anniversary) is $3.7 million.
71
The Company also acquired certain distribution rights for an additional cash consideration of $3.9 million. The Company incurred $2.1 million in investment bank advisory fees and other deal costs during the second quarter 2015 related to the acquisition. The deal costs are included in general, administrative and occupancy on JCG's Consolidated Statements of Comprehensive Income.
The total purchase price was allocated as follows (in millions):
| |
Final purchase price allocation |
|||
|---|---|---|---|---|
Assets: |
| |||
Cash and cash equivalents |
$ | 7.3 | ||
Investment securities |
| 4.4 | ||
Accounts receivable |
4.6 | |||
Intangible assets |
| 111.6 | ||
Goodwill |
97.3 | |||
Other current assets |
| 3.1 | ||
Other non-current assets, net |
0.1 | |||
Liabilities: |
| |||
Contingent consideration |
(6.0 | ) | ||
Deferred income taxes |
| (33.5 | ) | |
Other accrued liabilities |
(10.2 | ) | ||
Noncontrolling interests |
| (85.7 | ) | |
| | | | | |
Net assets acquired |
$ | 93.0 | ||
| | | | | |
| | | | | |
| | | | | |
Goodwill represents the excess of cost over the fair value of the identifiable net assets acquired and is largely attributable to the existing workforce of Kapstream. The acquisition will expand JCG's fixed income capabilities and reinforce the Company's efforts to build a global macro fixed income team. The goodwill recognized as a result of the acquisition is not deductible for tax purposes.
The intangible assets include investment management agreements, client relationships and a trademark. The client relationships have an estimated useful life of 10 years and are being amortized over the 10-year period. The investment management agreements and trademark have an indefinite life and as such, are not being amortized.
Noncontrolling interests were recognized on the Consolidated Balance Sheets for the 49% interest in Kapstream held by Kapstream management. The fair value of the noncontrolling interests as of the acquisition date of July 1, 2015, was $85.7 million.
Kapstream's functional currency is the Australian dollar. Assets and liabilities of Kapstream are translated into U.S. dollars at current exchange rates as of the end of each accounting period. Related revenue and expenses are translated at average exchange rates during the accounting period. Net translation gains and losses are excluded from income and recorded in other comprehensive income (loss), net of tax on the Company's Consolidated Statements of Comprehensive Income. JCG recognized Kapstream foreign currency translation losses of $0.6 million and $4.3 million for the years ended December 31, 2016 and 2015, respectively.
On January 31, 2017, JCG acquired the remaining 49% voting interest in Kapstream. The noncontrolling interests were held by the founders of Kapstream, who are current JCG employees. The transaction included initial upfront cash consideration of $42.5 million and contingent consideration payable in the form of mutual fund share awards. Payment of the mutual fund share awards is contingent on all Kapstream products and certain Janus products reaching defined revenue targets on the first, second and third anniversaries of January 31, 2017. The awards will be
72
payable in three equal installments of $14.2 million on the anniversary dates and are indexed to the performance of the Kapstream Absolute Return Income Fund. Upon vesting, the holders receive the value of the awards adjusted for gains or losses attributable to the mutual fund to which the awards were indexed, subject to tax withholding.
Acquisition of VelocityShares
On October 13, 2014, the Company entered into an agreement to acquire 100% of the outstanding voting equity interests of VelocityShares. VelocityShares is a sponsor of ETPs, including rules-based ETFs, which provide volatility management solutions to institutional clients. The majority of these assets represent tactical trading products serving short-term investors and traders in the form of ETNs. The acquisition of VelocityShares has facilitated JCG's entrance into the ETP business.
On December 1, 2014, JCG announced the closing of the VelocityShares acquisition. The transaction included initial upfront cash consideration of $32.7 million with up to an additional $36.0 million in contingent cash consideration if certain revenue targets are achieved over a four-year period. The contingent consideration is payable on the first, second, third and fourth anniversaries of the acquisition, in amounts up to $10.0 million each for the first and second anniversaries, and $8.0 million each for the third and fourth anniversaries. The total maximum payment over the entire contingent consideration period is $36.0 million.
The payments are contingent on certain VelocityShares' ETPs reaching defined net revenue targets on the first, second, third and fourth anniversaries of the acquisition. Fair value adjustments to the contingent consideration during the years ended December 31, 2016 and 2015, resulted in increases of $5.8 million and $5.2 million to the liability and expense, including the monthly accretion of the liability to the future value of the consideration, respectively. As of December 31, 2016, the contingent consideration had a fair value $18.9 million; $16.4 million is included in accounts payable and accrued liabilities, and $2.5 million is included in other non-current liabilities on JCG's Consolidated Balance Sheets. VelocityShares reached the defined net ETP revenue targets for the first and second anniversaries of the acquisition and JCG paid contingent consideration of $10.0 million in both December 2015 and January 2017. The contingent consideration payments represent the maximum amount for the first and second anniversaries. As of December 31, 2016, the total maximum payment over the remaining contingent consideration period (third and fourth anniversaries of the acquisition) is $16.0 million.
The total purchase price, including the upfront payment and the present value of the expected contingent payments, was allocated as follows (in millions):
| |
Purchase price allocation |
|||
|---|---|---|---|---|
Assets: |
| |||
Intangible assets |
$ | 36.9 | ||
Goodwill |
| 21.5 | ||
Cash acquired |
4.3 | |||
Liabilities: |
| |||
Deferred tax liability |
(11.0 | ) | ||
Other liabilities, net |
| (1.1 | ) | |
| | | | | |
Net assets acquired |
$ | 50.6 | ||
| | | | | |
| | | | | |
| | | | | |
73
Variable Interest Entities
Consolidated Variable Interest Entities
JCG's consolidated VIEs as of December 31, 2016, include certain consolidated seeded investment products in which the Company has an investment and acts as the investment manager. The assets of these VIEs are not available to JCG or the creditors of JCG. JCG may not, under any circumstances, access cash and cash equivalents held by consolidated VIEs to use in its operating activities or otherwise. In addition, the investors in these VIEs have no recourse to the credit of the Company.
Consolidated VIE assets and liabilities are presented after intercompany eliminations at December 31, 2016 and 2015, in the following table (in millions):
| |
December 31, 2016 |
December 31, 2015 |
|||||
|---|---|---|---|---|---|---|---|
Investment securities |
$ | 91.6 | $ | — | |||
Cash and cash equivalents |
6.1 | — | |||||
Accounts receivable |
| 0.3 | | — | |||
Accounts payable and accrued liabilities |
(0.5 | ) | — | ||||
| | | | | | | | |
Total |
| 97.5 | | — | |||
Noncontrolling interests in consolidated VIEs |
(31.9 | ) | — | ||||
| | | | | | | | |
JCG's net interest in consolidated VIEs |
$ | 65.6 | $ | — | |||
| | | | | | | | |
| | | | | | | | |
| | | | | | | | |
Unconsolidated Variable Interest Entities
At December 31, 2016, JCG's carrying value of investment securities included on the Consolidated Balance Sheets pertaining to unconsolidated VIEs was $7.7 million. JCG's total exposure to unconsolidated VIEs represents the value of its economic ownership interest in the investment securities.
Voting Rights Entities
Consolidated Voting Rights Entities
The following table presents the balances related to consolidated VREs that were recorded on JCG's Consolidated Balance Sheets, including JCG's net interest in the consolidated VREs (in millions):
| |
December 31, 2016 |
December 31, 2015 |
|||||
|---|---|---|---|---|---|---|---|
Investment securities |
$ | 6.3 | $ | 34.5 | |||
Cash and cash equivalents |
— | 1.2 | |||||
Accounts receivable and other current assets |
| 0.1 | | — | |||
Accounts payable and accrued liabilities |
(0.2 | ) | — | ||||
| | | | | | | | |
Total |
| 6.2 | | 35.7 | |||
Noncontrolling interests in consolidated VREs |
(1.2 | ) | (13.8 | ) | |||
| | | | | | | | |
JCG's net interest in consolidated VREs |
$ | 5.0 | $ | 21.9 | |||
| | | | | | | | |
| | | | | | | | |
| | | | | | | | |
JCG's total exposure to consolidated VREs represents the value of its economic ownership interest in these seeded investment products. Valuation changes associated with investments held at fair
74
value by these consolidated VREs are reflected in investment losses, net on the Company's Consolidated Statements of Comprehensive Income. Valuation changes are partially offset in net income attributable to noncontrolling interests for the portion not attributable to JCG. Refer to Note 7 — Investment Securities.
JCG may not, under any circumstances, access cash and cash equivalents held by consolidated VREs to use in its operating activities or otherwise.
Unconsolidated Variable Rights Entities
At December 31, 2016, JCG's carrying value of investment securities included on the Consolidated Balance Sheets pertaining to unconsolidated VREs was $73.5 million. JCG's total exposure to unconsolidated VIEs represents the value of its economic ownership interest in the investment securities.
Note 7 — Investment Securities
JCG's investment securities as of December 31, 2016 and 2015, are summarized as follows (in millions):
| |
December 31, | ||||||
|---|---|---|---|---|---|---|---|
| |
2016 | 2015 | |||||
Trading securities: |
| | |||||
Seeded investment products |
$ | 255.6 | $ | 235.6 | |||
Investments in advised mutual funds |
| 4.7 | | 4.2 | |||
Investments related to deferred compensation plans |
17.2 | 16.3 | |||||
| | | | | | | | |
Total trading securities |
| 277.5 | | 256.1 | |||
| | | | | | | | |
Available-for-sale securities: |
|||||||
Seeded investment products |
| 26.2 | | 71.0 | |||
| | | | | | | | |
Total investment securities |
$ | 303.7 | $ | 327.1 | |||
| | | | | | | | |
| | | | | | | | |
| | | | | | | | |
Trading Securities
Seeded investment products classified as trading securities consisted of the following as of December 31, 2016 and 2015:
| |
December 31, 2016 | December 31, 2015 | |||||||||||
|---|---|---|---|---|---|---|---|---|---|---|---|---|---|
| |
Fair value (in millions) |
Number of products |
Fair value (in millions) |
Number of products |
|||||||||
Mutual funds advised by the Company: |
| | | | |||||||||
Consolidated VREs |
$ | 6.2 | 1 | $ | 35.7 | 8 | |||||||
Consolidated VIEs |
| 91.6 | | 11 | | — | | — | |||||
Unconsolidated VREs (1) |
55.0 | 5 | 99.7 | 7 | |||||||||
| | | | | | | | | | | | | | |
Total mutual funds advised by the Company |
| 152.8 | | 17 | | 135.4 | | 15 | |||||
Separate accounts |
77.0 | 27 | 86.8 | 25 | |||||||||
Pooled investment funds |
| 25.8 | | 18 | | 13.4 | | 10 | |||||
| | | | | | | | | | | | | | |
Total trading securities |
$ | 255.6 | 62 | $ | 235.6 | 50 | |||||||
| | | | | | | | | | | | | | |
| | | | | | | | | | | | | | |
| | | | | | | | | | | | | | |
- (1)
- Represents unconsolidated seeded investment products for which JCG's ownership percentage is between 20% and 50%. The investments are classified as equity method, which approximates fair value due to the nature of the underlying investments.
75
Net unrealized gains and (losses) recognized on trading securities still held as of December 31, 2016, 2015 and 2014, are summarized as follows (in millions):
| |
Year ended December 31, | |||||||||
|---|---|---|---|---|---|---|---|---|---|---|
| |
2016 | 2015 | 2014 | |||||||
Net unrealized gains (losses) on trading securities still held at period end |
$ | 9.4 | $ | (9.5 | ) | $ | 4.3 | |||
Available-for-Sale Securities
Seeded investment products classified as available-for-sale securities consisted of the following as of December 31, 2016 and 2015:
| |
December 31, 2016 | December 31, 2015 | |||||||||||
|---|---|---|---|---|---|---|---|---|---|---|---|---|---|
| |
Fair value (in millions) |
Number of products |
Fair value (in millions) |
Number of products |
|||||||||
Mutual funds advised by the Company: |
| | | | |||||||||
Unconsolidated VREs |
$ | 18.5 | 19 | $ | 71.0 | 41 | |||||||
Unconsolidated VIEs |
| 7.7 | | 22 | | — | | — | |||||
| | | | | | | | | | | | | | |
Total mutual funds advised by the Company |
$ | 26.2 | 41 | $ | 71.0 | 41 | |||||||
| | | | | | | | | | | | | | |
| | | | | | | | | | | | | | |
| | | | | | | | | | | | | | |
The following is a summary of available-for-sale securities at December 31, 2016 and 2015 (in millions):
| |
|
Gross unrealized investment |
|
|
||||||||||||
|---|---|---|---|---|---|---|---|---|---|---|---|---|---|---|---|---|
| |
|
Foreign currency translation |
|
|||||||||||||
| |
Cost | Gains | Losses | Fair value | ||||||||||||
December 31, 2016: |
| | | | | |||||||||||
Unconsolidated VREs |
$ | 18.8 | $ | 0.1 | $ | (0.4 | ) | $ | — | $ | 18.5 | |||||
Unconsolidated VIEs |
$ | 8.9 | $ | 0.3 | $ | (1.0 | ) | $ | (0.5 | ) | $ | 7.7 | ||||
December 31, 2015: |
||||||||||||||||
Unconsolidated VREs |
$ | 75.0 | $ | 0.3 | $ | (3.9 | ) | $ | (0.4 | ) | $ | 71.0 | ||||
Unconsolidated VIEs |
$ | — | $ | — | $ | — | $ | — | $ | — | ||||||
The Company reviewed the gross unrealized losses on available-for-sale securities and determined that the losses were not other-than-temporary. The Company considered the duration, extent and circumstances of any decline in fair value as well as JCG's intent and ability to hold these securities for a period of time sufficient to allow for any anticipated recovery in the market value. No OTTI charges were recognized for the years ended December 31, 2016, 2015 or 2014.
Realized gains and losses as a result of sales of seeded investment products classified as available-for-sale securities were recognized within investment losses, net on JCG's Consolidated Statements of Comprehensive Income. The following is a summary of realized gains (losses) as a
76
result of sales of seeded investment products classified as available-for-sale securities for the years ended December 31, 2016, 2015 and 2014 (in millions):
| |
Year ended December 31, | |||||||||
|---|---|---|---|---|---|---|---|---|---|---|
| |
2016 | 2015 | 2014 | |||||||
Realized gains |
$ | — | $ | — | $ | 2.8 | ||||
Realized losses |
(0.7 | ) | — | (0.1 | ) | |||||
| | | | | | | | | | | |
Net realized gains (losses) |
$ | (0.7 | ) | $ | — | $ | 2.7 | |||
| | | | | | | | | | | |
| | | | | | | | | | | |
| | | | | | | | | | | |
Derivative Instruments
The Company maintains an economic hedge program that uses derivative instruments to hedge against market volatility of certain seeded investments. Fluctuations in equity markets, debt markets and commodity markets are hedged by using futures and credit default swaps. Certain foreign currency translation associated with the Company's seeded investment products is also hedged using foreign currency forward contracts.
JCG reassessed its hedging strategy in 2016, which resulted in a reduction in the use of index swaps and an increase in the use of futures and credit default swaps to hedge against market volatility of certain seeded investment products. As of December 31, 2016, JCG was not using index swaps as part of the economic hedge program.
JCG was party to the following derivative instruments as of December 31, 2016 and 2015:
| |
December 31, 2016 | December 31, 2015 | |||||||||||
|---|---|---|---|---|---|---|---|---|---|---|---|---|---|
| |
Number of contracts |
Notional value (in millions) |
Number of contracts |
Notional value (in millions) |
|||||||||
Futures |
| 50 | $ | 171.7 | | 38 | $ | 91.7 | |||||
Credit default swaps |
2 | $ | 128.5 | 2 | $ | 66.5 | |||||||
Foreign currency forward contracts |
| 2 | $ | 34.1 | | — | $ | — | |||||
Index swaps |
— | $ | — | 6 | $ | 34.4 | |||||||
The derivative instruments are not designated as hedges for accounting purposes. Changes in fair value of the futures, credit default swaps and index swaps are recognized in investment losses, net on JCG's Consolidated Statements of Comprehensive Income while changes in the fair value of the foreign currency forward contracts are recognized in other income, net on JCG's Consolidated Statements of Comprehensive Income.
Futures and credit default swaps are subject to a master netting arrangement and the values of the individual contracts are combined and are included on a net basis in other current assets or accounts payable and accrued liabilities on JCG's Consolidated Balance Sheets. Foreign currency forward contracts are not subject to a master netting arrangement, and as such, the fair values of individual contracts are not netted and are included separately within either other current assets or accounts payable and accrued liabilities on JCG's Consolidated Balance Sheets.
The Company posted $8.0 million and $3.3 million in cash collateral and margin with the counterparty of the futures and credit default swaps as of December 31, 2016 and 2015, respectively. The cash collateral and margin are included in other current assets on JCG's Consolidated Balance Sheets.
77
The following tables illustrate the effect of offsetting derivative instruments on JCG's Consolidated Balance Sheets as of December 31, 2016 and 2015 (in millions):
| |
December 31, 2016 | ||||||||||||
|---|---|---|---|---|---|---|---|---|---|---|---|---|---|
| |
Gross amounts | Gross amounts offset by derivative instruments |
Gross amounts offset by cash collateral |
Net amounts | |||||||||
Assets: |
| | | | |||||||||
Futures |
$ | 0.8 | $ | (0.8 | ) | $ | — | $ | — | ||||
Foreign currency forward contracts |
| 0.3 | | — | | — | | 0.3 | |||||
| | | | | | | | | | | | | | |
Total assets |
$ | 1.1 | $ | (0.8 | ) | $ | — | $ | 0.3 | ||||
| | | | | | | | | | | | | | |
| | | | | | | | | | | | | | |
| | | | | | | | | | | | | | |
Liabilities: |
| | | | |||||||||
Futures |
$ | 1.1 | $ | (0.8 | ) | $ | (0.3 | ) | $ | — | |||
Credit default swaps |
| 2.4 | | — | | (1.3 | ) | | 1.1 | ||||
| | | | | | | | | | | | | | |
Total liabilities |
$ | 3.5 | $ | (0.8 | ) | $ | (1.6 | ) | $ | 1.1 | |||
| | | | | | | | | | | | | | |
| | | | | | | | | | | | | | |
| | | | | | | | | | | | | | |
| |
December 31, 2015 | ||||||||||||
|---|---|---|---|---|---|---|---|---|---|---|---|---|---|
| |
Gross amounts | Gross amounts offset by derivative instruments |
Gross amounts offset by cash collateral |
Net amounts | |||||||||
Assets: |
| | | | |||||||||
Futures |
$ | 0.3 | $ | (0.1 | ) | $ | — | $ | 0.2 | ||||
Liabilities: |
| | | | |||||||||
Index swaps |
$ | 0.1 | $ | — | $ | — | $ | 0.1 | |||||
Futures |
| 0.1 | | (0.1 | ) | | — | | — | ||||
Credit default swaps |
0.5 | — | (0.5 | ) | — | ||||||||
| | | | | | | | | | | | | | |
Total liabilities |
$ | 0.7 | $ | (0.1 | ) | $ | (0.5 | ) | $ | 0.1 | |||
| | | | | | | | | | | | | | |
| | | | | | | | | | | | | | |
| | | | | | | | | | | | | | |
JCG recognized the following net gains (losses) on hedged seed investments and associated futures, credit default swaps and index swaps for the years ended December 31, 2016, 2015 and 2014 (in millions):
| |
Year ended December 31, | |||||||||
|---|---|---|---|---|---|---|---|---|---|---|
| |
2016 | 2015 | 2014 | |||||||
Hedged seeded investments classified as trading securities(1) |
$ | 10.0 | $ | (2.1 | ) | $ | 7.3 | |||
Hedged seeded investments classified as available-for-sale securities(1) |
0.4 | (1.6 | ) | 2.9 | ||||||
| | | | | | | | | | | |
Total hedged seeded investments |
| 10.4 | | (3.7 | ) | | 10.2 | |||
Futures |
(9.0 | ) | (0.1 | ) | (8.2 | ) | ||||
Credit default swaps |
| (3.6 | ) | | (0.2 | ) | | — | ||
Index swaps |
(0.9 | ) | 2.9 | (3.0 | ) | |||||
Other |
| (0.2 | ) | | — | | — | |||
| | | | | | | | | | | |
Total |
$ | (3.3 | ) | $ | (1.1 | ) | $ | (1.0 | ) | |
| | | | | | | | | | | |
| | | | | | | | | | | |
| | | | | | | | | | | |
- (1)
- Includes net gains (losses) associated with hedged equity, fixed income and asset allocation seeded investment products. Hedging activity is limited to the systematic market risk associated with equity products and the interest rate and credit risk associated with fixed income products.
78
JCG recognized the following net losses on hedged seed investments denominated in a foreign currency and net gains on associated foreign currency forward contracts for the years ended December 31, 2016, 2015 and 2014 (in millions):
| |
Year ended December 31, | |||||||||
|---|---|---|---|---|---|---|---|---|---|---|
| |
2016 | 2015 | 2014 | |||||||
Foreign currency translation |
$ | (2.5 | ) | $ | (0.4 | ) | $ | (1.9 | ) | |
Foreign currency forward contracts |
2.3 | 0.2 | 1.3 | |||||||
| | | | | | | | | | | |
Total |
$ | (0.2 | ) | $ | (0.2 | ) | $ | (0.6 | ) | |
| | | | | | | | | | | |
| | | | | | | | | | | |
| | | | | | | | | | | |
Derivative Instruments in Consolidated Seeded Investment Products
Certain of the Company's consolidated seeded investment products utilize derivative instruments to contribute to the achievement of defined investment objectives. These derivative instruments are classified within investment securities on JCG's Consolidated Balance Sheets. Gains and losses on these derivative instruments are classified within investment losses, net on JCG's Consolidated Statements of Comprehensive Income. The consolidated seeded investment products posted $2.1 million and $4.7 million in cash collateral and margin with the counterparty of the derivative instruments as of December 31, 2016 and 2015, respectively.
JCG's consolidated seeded investment products were party to the following derivative instruments as of December 31, 2016 and 2015:
| |
December 31, 2016 | December 31, 2015 | |||||||||||
|---|---|---|---|---|---|---|---|---|---|---|---|---|---|
| |
Number of contracts |
Notional value (in millions) |
Number of contracts |
Notional value (in millions) |
|||||||||
Swaps |
| 67 | $ | 35.5 | | 96 | $ | 40.9 | |||||
Futures |
123 | $ | 25.3 | 75 | $ | 20.8 | |||||||
Foreign currency forward contracts |
| 161 | $ | 32.0 | | 61 | $ | 9.9 | |||||
Options |
29 | $ | 0.1 | 66 | $ | 0.2 | |||||||
The following tables illustrate the effect of offsetting derivative instruments within consolidated seeded investment products on JCG's Consolidated Balance Sheets as of December 31, 2016 and 2015 (in millions):
| |
December 31, 2016 | ||||||||||||
|---|---|---|---|---|---|---|---|---|---|---|---|---|---|
| |
Gross amounts | Gross amounts offset by derivative instruments |
Gross amounts offset by cash collateral |
Net amounts | |||||||||
Assets: |
| | | | |||||||||
Swaps |
$ | 0.7 | $ | — | $ | — | $ | 0.7 | |||||
Futures |
| 0.4 | | (0.4 | ) | | — | | — | ||||
Foreign currency forward contracts |
0.2 | (0.2 | ) | — | — | ||||||||
| | | | | | | | | | | | | | |
Total |
$ | 1.3 | $ | (0.6 | ) | $ | — | $ | 0.7 | ||||
| | | | | | | | | | | | | | |
| | | | | | | | | | | | | | |
| | | | | | | | | | | | | | |
Liabilities: |
|||||||||||||
Swaps |
$ | — | $ | — | $ | — | $ | — | |||||
Futures |
0.5 | (0.4 | ) | (0.1 | ) | — | |||||||
Foreign currency forward contracts |
| 0.2 | | (0.2 | ) | | — | | — | ||||
| | | | | | | | | | | | | | |
Total |
$ | 0.7 | $ | (0.6 | ) | $ | (0.1 | ) | $ | — | |||
| | | | | | | | | | | | | | |
| | | | | | | | | | | | | | |
| | | | | | | | | | | | | | |
79
| |
December 31, 2015 | ||||||||||||
|---|---|---|---|---|---|---|---|---|---|---|---|---|---|
| |
Gross amounts | Gross amounts offset by derivative instruments |
Gross amounts offset by cash collateral |
Net amounts | |||||||||
Assets: |
| | | | |||||||||
Swaps |
$ | 0.9 | $ | (0.5 | ) | $ | — | $ | 0.4 | ||||
Futures |
| 0.1 | | (0.1 | ) | | — | | — | ||||
Foreign currency forward contracts |
0.1 | (0.1 | ) | — | — | ||||||||
| | | | | | | | | | | | | | |
Total |
$ | 1.1 | $ | (0.7 | ) | $ | — | $ | 0.4 | ||||
| | | | | | | | | | | | | | |
| | | | | | | | | | | | | | |
| | | | | | | | | | | | | | |
Liabilities: |
|||||||||||||
Swaps |
$ | 0.6 | $ | (0.6 | ) | $ | — | $ | — | ||||
Futures |
0.3 | (0.1 | ) | (0.2 | ) | — | |||||||
Foreign currency forward contracts |
| 0.1 | | (0.1 | ) | | — | | — | ||||
| | | | | | | | | | | | | | |
Total |
$ | 1.0 | $ | (0.8 | ) | $ | (0.2 | ) | $ | — | |||
| | | | | | | | | | | | | | |
| | | | | | | | | | | | | | |
| | | | | | | | | | | | | | |
As of December 31, 2016 and 2015, certain consolidated seeded investment products sold credit protection through the use of credit default swap contracts. The contracts provide alternative credit risk exposure to individual companies and countries outside of traditional bond markets. The terms of the credit default swap contracts range from one to five years.
As sellers in credit default swap contracts, the consolidated seeded investment products would be required to pay the notional value of a referenced debt obligation to the counterparty in the event of a default on the debt obligation by the issuer. The notional value represents the estimated maximum potential undiscounted amount of future payments required upon the occurrence of a credit default event. As of December 31, 2016 and 2015, the notional value of the agreements was $8.5 million and $11.3 million, respectively. The credit default swap contracts include recourse provisions that allow for recovery of a certain percentage of amounts paid upon the occurrence of a credit default event. As of December 31, 2016 and 2015, the fair value of the credit default swap contracts selling protection was $0.1 million for both periods.
Investment Losses, Net
Investment losses, net on JCG's Consolidated Statements of Comprehensive Income included the following for the years ended December 31, 2016, 2015 and 2014 (in millions):
| |
Year ended December 31, | |||||||||
|---|---|---|---|---|---|---|---|---|---|---|
| |
2016 | 2015 | 2014 | |||||||
Seeded investment products |
$ | 6.6 | $ | (11.1 | ) | $ | 8.6 | |||
Noncontrolling interests in seeded investment products |
(0.7 | ) | 0.4 | (0.6 | ) | |||||
Investments in advised mutual funds |
| 0.5 | | (0.2 | ) | | (0.1 | ) | ||
Economic hedge of certain seeded investment products |
(13.7 | ) | 2.6 | (11.2 | ) | |||||
Economic hedge of deferred compensation plans |
| 0.8 | | 0.1 | | 1.3 | ||||
Other |
0.2 | — | 0.1 | |||||||
| | | | | | | | | | | |
Investment losses, net |
$ | (6.3 | ) | $ | (8.2 | ) | $ | (1.9 | ) | |
| | | | | | | | | | | |
| | | | | | | | | | | |
| | | | | | | | | | | |
80
Purchases, Sales, Settlements and Maturities
Cash flows related to investment securities for the years ended December 31, 2016, 2015 and 2014, are summarized as follows (in millions):
| |
Year ended December 31, | ||||||||||||||||||
|---|---|---|---|---|---|---|---|---|---|---|---|---|---|---|---|---|---|---|---|
| |
2016 | 2015 | 2014 | ||||||||||||||||
| |
Purchases and settlements |
Sales, settlements and maturities |
Purchases and settlements |
Sales, settlements and maturities |
Purchases and settlements |
Sales, settlements and maturities |
|||||||||||||
Trading securities |
$ | (79.4 | ) | $ | 70.9 | $ | (66.6 | ) | $ | 53.4 | $ | (143.5 | ) | $ | 148.0 | ||||
Available-for-sale securities |
(2.4 | ) | 52.4 | (11.5 | ) | 0.1 | (0.7 | ) | 174.9 | ||||||||||
Derivative instruments: |
| | | | | | |||||||||||||
Seed capital economic hedge |
(32.6 | ) | 14.4 | (12.9 | ) | 14.1 | (24.4 | ) | 13.9 | ||||||||||
| | | | | | | | | | | | | | | | | | | | |
Total cash flows |
$ | (114.4 | ) | $ | 137.7 | $ | (91.0 | ) | $ | 67.6 | $ | (168.6 | ) | $ | 336.8 | ||||
| | | | | | | | | | | | | | | | | | | | |
| | | | | | | | | | | | | | | | | | | | |
| | | | | | | | | | | | | | | | | | | | |
Note 8 — Goodwill and Intangible Assets
JCG's goodwill and intangible assets are summarized below (in millions):
| |
December 31, 2015 |
Impairment | Amortization | Foreign currency translation |
December 31, 2016 |
|||||||||||
|---|---|---|---|---|---|---|---|---|---|---|---|---|---|---|---|---|
Indefinite-lived intangible assets: |
| | | | | |||||||||||
Investment management agreements |
$ | 997.6 | $ | (0.3 | ) | $ | — | $ | (0.7 | ) | $ | 996.6 | ||||
Trademarks |
| 273.5 | | — | | — | | — | | 273.5 | ||||||
Definite-lived intangible assets: |
||||||||||||||||
Client relationships |
| 211.6 | | — | | — | | (0.3 | ) | | 211.3 | |||||
Accumulated amortization |
(130.2 | ) | — | (12.5 | ) | 0.3 | (142.4 | ) | ||||||||
| | | | | | | | | | | | | | | | | |
Net intangible assets |
$ | 1,352.5 | $ | (0.3 | ) | $ | (12.5 | ) | $ | (0.7 | ) | $ | 1,339.0 | |||
| | | | | | | | | | | | | | | | | |
| | | | | | | | | | | | | | | | | |
| | | | | | | | | | | | | | | | | |
Goodwill |
$ | 602.8 | $ | — | $ | — | $ | (0.9 | ) | $ | 601.9 | |||||
| | | | | | | | | | | | | | | | | |
| | | | | | | | | | | | | | | | | |
| | | | | | | | | | | | | | | | | |
The majority of goodwill and intangible assets were generated from the 2001 buyout of the founder of Janus and acquisitions of interests in INTECH, Perkins, Kapstream and VelocityShares. Intangible assets acquired as a result of these transactions include trademarks, investment management agreements and client relationships.
Foreign currency translation relates to the Kapstream intangible assets and goodwill that are translated from Australian dollar to U.S. dollar at the end of each period.
Definite-lived intangible assets represent client relationships, which are amortized over their estimated lives using the straight-line method. The estimated lives of the client relationships vary and range from 10 years to 17 years.
An investment management agreement impairment charge of $0.3 million was recognized in depreciation and amortization on the Consolidated Statements on Comprehensive Income during the year ended December 31, 2016. There were no intangible asset impairment charges recognized during the years ended December 31, 2015 and 2014.
81
Amortization expense was $12.8 million, $11.3 million and $9.6 million for the years ended December 31, 2016, 2015 and 2014, respectively. Expected future amortization expense is summarized below (in millions):
Year ended December 31,
|
Amount | |||
|---|---|---|---|---|
2017 |
$ | 12.5 | ||
2018 |
9.8 | |||
2019 |
| 7.6 | ||
2020 |
5.5 | |||
2021 |
| 5.0 | ||
Thereafter |
29.8 | |||
| | | | | |
Total |
$ | 70.2 | ||
| | | | | |
| | | | | |
| | | | | |
Impairment Testing
The October 2016 tests of goodwill and indefinite-lived intangible assets indicated that estimated fair values of the reporting unit exceeded their respective carrying values, and as such, no impairment charges were recognized. The October 2016 tests included certain underlying key assumptions regarding future overall market trends and Company operating performance. If actual future market results and Company operating performance vary significantly and unfavorably to those included in the Company's financial forecast, the Company may be subject to impairment charges related to its goodwill and indefinite-lived intangible assets.
No impairment charges were recognized as a result of the October 2015 and 2014 tests of goodwill and indefinite-lived intangible assets.
82
Note 9 — Fair Value Measurements
The following table presents assets, liabilities and redeemable noncontrolling interests presented in the consolidated financial statements or disclosed in the notes to the consolidated financial statements at fair value on a recurring basis as of December 31, 2016 (in millions):
| |
Fair value measurements using: | |
|||||||||||
|---|---|---|---|---|---|---|---|---|---|---|---|---|---|
| |
Quoted prices in active markets for identical assets and liabilities (Level 1) |
Significant other observable inputs (Level 2) |
Significant unobservable inputs (Level 3) |
Total | |||||||||
Assets: |
| | | | |||||||||
Cash equivalents |
$ | 78.5 | $ | 287.1 | $ | — | $ | 365.6 | |||||
Futures |
| 0.8 | | — | | — | | 0.8 | |||||
Foreign currency forward contracts |
0.3 | — | — | 0.3 | |||||||||
Trading securities: |
| | | | |||||||||
Seeded investment products: |
|||||||||||||
Consolidated VREs |
| 0.3 | | 5.9 | | — | | 6.2 | |||||
Consolidated VIEs |
13.2 | 75.1 | 3.3 | 91.6 | |||||||||
Unconsolidated VREs |
| 55.0 | | — | | — | | 55.0 | |||||
Separate accounts |
47.5 | 29.5 | — | 77.0 | |||||||||
Pooled investment funds |
| 3.2 | | 22.6 | | — | | 25.8 | |||||
Investments in advised mutual funds |
4.7 | — | — | 4.7 | |||||||||
Investments related to deferred compensation plans |
| 17.2 | | — | | — | | 17.2 | |||||
Available-for-sale securities: |
|||||||||||||
Seeded investment products: |
| | | | |||||||||
Unconsolidated VREs |
18.5 | — | — | 18.5 | |||||||||
Unconsolidated VIEs |
| 7.7 | | — | | — | | 7.7 | |||||
| | | | | | | | | | | | | | |
Total investment securities |
167.3 | 133.1 | 3.3 | 303.7 | |||||||||
| | | | | | | | | | | | | | |
Total assets |
$ | 246.9 | $ | 420.2 | $ | 3.3 | $ | 670.4 | |||||
| | | | | | | | | | | | | | |
| | | | | | | | | | | | | | |
| | | | | | | | | | | | | | |
Liabilities: |
|||||||||||||
Futures |
$ | 1.1 | $ | — | $ | — | $ | 1.1 | |||||
Credit default swaps |
2.4 | — | — | 2.4 | |||||||||
Long-term debt (1) |
| — | | 463.1 | | — | | 463.1 | |||||
Kapstream contingent consideration |
— | — | 5.5 | 5.5 | |||||||||
VelocityShares contingent consideration |
| — | | — | | 18.9 | | 18.9 | |||||
| | | | | | | | | | | | | | |
Total liabilities |
$ | 3.5 | $ | 463.1 | $ | 24.4 | $ | 491.0 | |||||
| | | | | | | | | | | | | | |
| | | | | | | | | | | | | | |
| | | | | | | | | | | | | | |
Redeemable noncontrolling interests: |
| | | | |||||||||
Consolidated seeded investment products |
$ | 6.6 | $ | 26.1 | $ | 0.4 | $ | 33.1 | |||||
INTECH |
| — | | — | | 10.0 | | 10.0 | |||||
| | | | | | | | | | | | | | |
Total redeemable noncontrolling interests |
$ | 6.6 | $ | 26.1 | $ | 10.4 | $ | 43.1 | |||||
| | | | | | | | | | | | | | |
| | | | | | | | | | | | | | |
| | | | | | | | | | | | | | |
- (1)
- Carried at amortized cost and disclosed at fair value.
83
The following table presents assets, liabilities and redeemable noncontrolling interests presented in the consolidated financial statements or disclosed in the notes to the consolidated financial statements at fair value on a recurring basis as of December 31, 2015 (in millions):
| |
Fair value measurements using: | |
|||||||||||
|---|---|---|---|---|---|---|---|---|---|---|---|---|---|
| |
Quoted prices in active markets for identical assets and liabilities (Level 1) |
Significant other observable inputs (Level 2) |
Significant unobservable inputs (Level 3) |
Total | |||||||||
Assets: |
| | | | |||||||||
Cash equivalents |
$ | 57.4 | $ | 189.5 | $ | — | $ | 246.9 | |||||
Futures |
| 0.3 | | — | | — | | 0.3 | |||||
Trading securities: |
|||||||||||||
Seeded investment products: |
| | | | |||||||||
Consolidated VREs |
10.9 | 24.8 | — | 35.7 | |||||||||
Unconsolidated VREs |
| 99.7 | | — | | — | | 99.7 | |||||
Separate accounts |
46.7 | 40.1 | — | 86.8 | |||||||||
Pooled investment funds |
| 13.1 | | 0.3 | | — | | 13.4 | |||||
Investments in advised mutual funds |
4.2 | — | — | 4.2 | |||||||||
Investments related to deferred compensation plans |
| 16.3 | | — | | — | | 16.3 | |||||
Available-for-sale securities: |
|||||||||||||
Seeded investment products: |
| | | | |||||||||
Unconsolidated VREs |
71.0 | — | — | 71.0 | |||||||||
| | | | | | | | | | | | | | |
Total investment securities |
| 261.9 | | 65.2 | | — | | 327.1 | |||||
| | | | | | | | | | | | | | |
Total assets |
$ | 319.6 | $ | 254.7 | $ | — | $ | 574.3 | |||||
| | | | | | | | | | | | | | |
| | | | | | | | | | | | | | |
| | | | | | | | | | | | | | |
Liabilities: |
| | | | |||||||||
Index swaps |
$ | — | $ | 0.1 | $ | — | $ | 0.1 | |||||
Futures |
| 0.1 | | — | | — | | 0.1 | |||||
Credit default swaps |
— | 0.5 | — | 0.5 | |||||||||
Current portion of long-term debt (1) |
| — | | 158.6 | | — | | 158.6 | |||||
Long-term debt (1) |
— | 307.6 | — | 307.6 | |||||||||
Kapstream contingent consideration |
| — | | — | | 6.9 | | 6.9 | |||||
VelocityShares contingent consideration |
— | — | 13.1 | 13.1 | |||||||||
| | | | | | | | | | | | | | |
Total liabilities |
$ | 0.1 | $ | 466.8 | $ | 20.0 | $ | 486.9 | |||||
| | | | | | | | | | | | | | |
| | | | | | | | | | | | | | |
| | | | | | | | | | | | | | |
Redeemable noncontrolling interests: |
|||||||||||||
Consolidated seeded investment products |
$ | 6.1 | $ | 7.7 | $ | — | $ | 13.8 | |||||
INTECH |
— | — | 8.0 | 8.0 | |||||||||
| | | | | | | | | | | | | | |
Total redeemable noncontrolling interests |
$ | 6.1 | $ | 7.7 | $ | 8.0 | $ | 21.8 | |||||
| | | | | | | | | | | | | | |
| | | | | | | | | | | | | | |
| | | | | | | | | | | | | | |
- (1)
- Carried at amortized cost and disclosed at fair value.
Level 1 Fair Value Measurements
JCG's Level 1 fair value measurements consist mostly of seeded investment products, investments in advised mutual funds, cash equivalents and investments related to deferred compensation plans with quoted market prices in active markets. The fair value level of consolidated seeded investment products is determined by the underlying securities of the product. The fair value level of unconsolidated seeded investment products is determined using the respective net asset value
84
("NAV") of each product. The NAV represents a quoted price in an active market and is not used as a practical expedient. All seeded investment products for which the NAV is used to determine their fair value are classified as Level 1 and primarily represent seeded mutual funds where JCG's ownership level is under 50% or where JCG is not considered the primary beneficiary.
Level 2 Fair Value Measurements
JCG's Level 2 fair value measurements consist mostly of cash equivalents, consolidated seeded investment products and JCG's long-term debt. Cash equivalents are short-term, highly liquid investments with an initial maturity of three months or less when purchased and consist primarily of commercial paper, certificates of deposit and other short-term investments. The fair value of consolidated seeded investment products in which JCG's ownership level is above 50%, or JCG is the primary beneficiary, is determined by the underlying securities of the product. The fair value of JCG's long-term debt is determined using broker quotes and recent trading activity, which are considered Level 2 inputs.
Level 3 Fair Value Measurements
JCG's Level 3 recurring fair value measurements largely represent redeemable noncontrolling interests in INTECH and contingent consideration related to the acquisition of Kapstream and VelocityShares.
INTECH
Redeemable noncontrolling interests in INTECH are measured at fair value on a quarterly basis or more frequently if events or circumstances indicate that a material change in the fair value of INTECH has occurred. The fair value of INTECH is determined using a valuation methodology that incorporates observable metrics from publicly traded peer companies as valuation comparables and adjustments related to investment performance and changes in assets under management.
Contingent Consideration
The fair value of the Kapstream contingent consideration is calculated on a quarterly basis by forecasting certain Kapstream assets under management over the contingency period and determining whether the forecasted amounts meet the defined targets. Forecasted contingent payments are then discounted back to the valuation date using an 8.5% discount rate. Significant unobservable inputs used in the valuation are limited to forecasted Kapstream assets under management.
The fair value of the VelocityShares contingent consideration is calculated on a quarterly basis by forecasting net ETP revenue, as defined by the purchase agreement, over the contingency period, and determining whether net forecasted ETP revenue targets are achieved. Forecasted contingent payments are then discounted back to the valuation date using a 15% discount rate. Significant unobservable inputs used in the valuation are considered non-public data and limited to forecasted gross revenues and certain expense items, which are deducted from these revenues. Increases in forecasted net ETP revenue would increase the fair value of the consideration, subject to payment limitations, while decreases in forecasted net ETP revenue would decrease the fair value.
The change in fair value related to VelocityShares and Kapstream contingent consideration is unrealized and included in general, administrative and occupancy on the Consolidated Statements of Comprehensive Income.
85
Seeded Investment Products
As of December 31, 2016, a single security within the portfolio of a consolidated seeded investment product was valued using significant unobservable inputs, resulting in Level 3 classification. The fair value of the security was $3.3 million. As of December 31, 2015, none of the securities within the portfolios of consolidated seeded investment product were classified as Level 3.
JCG's Level 3 recurring fair value measurements as of December 31, 2016 and 2015, are as follows (in millions):
| |
Year ended December 31, | ||||||||||||||||||
|---|---|---|---|---|---|---|---|---|---|---|---|---|---|---|---|---|---|---|---|
| |
2016 | 2015 | |||||||||||||||||
| |
Redeemable noncontrolling interests in INTECH |
VelocityShares contingent consideration |
Kapstream contingent consideration |
Redeemable noncontrolling interests in INTECH |
VelocityShares contingent consideration |
Kapstream contingent consideration |
|||||||||||||
Beginning of year fair value |
$ | 8.0 | $ | 13.1 | $ | 6.9 | $ | 5.4 | $ | 17.9 | $ | — | |||||||
Distributions |
(0.6 | ) | — | — | (0.7 | ) | (10.0 | ) | — | ||||||||||
Current earnings |
| 0.4 | | — | | — | | 0.6 | | — | | — | |||||||
Amortization of INTECH appreciation rights |
3.3 | — | — | 3.4 | — | — | |||||||||||||
Issuance |
| — | | — | | — | | — | | — | | 6.0 | |||||||
Foreign currency translation |
— | — | — | — | — | (0.3 | ) | ||||||||||||
Change in fair value |
| (1.1 | ) | | 5.8 | | (1.4 | ) | | (0.7 | ) | | 5.2 | | 1.2 | ||||
| | | | | | | | | | | | | | | | | | | | |
End of year fair value |
$ | 10.0 | $ | 18.9 | $ | 5.5 | $ | 8.0 | $ | 13.1 | $ | 6.9 | |||||||
| | | | | | | | | | | | | | | | | | | | |
| | | | | | | | | | | | | | | | | | | | |
| | | | | | | | | | | | | | | | | | | | |
Nonrecurring Fair Value Measurements
Nonrecurring Level 3 fair value measurements include goodwill and intangible assets. JCG measures the fair value of the reporting unit and intangible assets using a discounted cash flow analysis that requires assumptions regarding projected future earnings and discount rates. Because of the significance of the unobservable inputs in the fair value measurements of these assets and liabilities, such measurements have been classified as Level 3.
Transfers between Fair Value Levels
The underlying securities of mutual funds and separate accounts may trade on foreign stock exchanges. In some cases, the closing price of such securities may be adjusted to capture the effects of any post-closing activity affecting the markets in which they trade. Security prices are adjusted based upon historical impacts for similar post-close activity. These adjustments result in the securities being classified as Level 2 and may also result in movements of securities between Level 1 and Level 2.
86
Transfers are recognized at the end of each reporting period. Transfers between Level 1 and Level 2 classifications for the years ended December 31, 2016 and 2015, are summarized as follows (in millions):
| |
Year ended December 31, |
||||||
|---|---|---|---|---|---|---|---|
| |
2016 | 2015 | |||||
Transfers from Level 1 to Level 2 |
$ | 3.9 | $ | — | |||
Transfers from Level 2 to Level 1 |
$ | — | $ | 0.1 | |||
In addition to the transfers disclosed above, the deconsolidation of a seeded investment product can cause changes to its fair value level classification. Upon deconsolidation, the entire seeded investment product is valued using the NAV rather than valued using its underlying securities. Generally, seeded investment products that use the NAV to determine their fair value are classified as Level 1. During the year ended December 31, 2016 and 2015, certain seeded investment products were deconsolidated, and $7.9 million and $44.3 million of Level 2 assets were reclassified to Level 1, respectively.
Debt at December 31, 2016 and 2015, consisted of the following (in millions):
| |
December 31, 2016 | December 31, 2015 | |||||||||||
|---|---|---|---|---|---|---|---|---|---|---|---|---|---|
| |
Carrying value |
Fair value |
Carrying value |
Fair value |
|||||||||
4.875% Senior Notes due 2025 |
$ | 295.3 | $ | 309.9 | $ | 294.8 | $ | 307.6 | |||||
0.750% Convertible Senior Notes due 2018 |
111.0 | 153.2 | 107.5 | 158.6 | |||||||||
| | | | | | | | | | | | | | |
Total debt |
| 406.3 | | 463.1 | | 402.3 | | 466.2 | |||||
| | | | | | | | | | | | | | |
Less: Current maturities |
— | — | 107.5 | 158.6 | |||||||||
| | | | | | | | | | | | | | |
Total long-term debt |
$ | 406.3 | $ | 463.1 | $ | 294.8 | $ | 307.6 | |||||
| | | | | | | | | | | | | | |
| | | | | | | | | | | | | | |
| | | | | | | | | | | | | | |
4.875% Senior Notes Due 2025
In July 2015, JCG issued $300.0 million of 4.875% Senior Notes due 2025 ("2025 Senior Notes"), which pay interest at 4.875% semiannually on February 1 and August 1 of each year and mature on August 1, 2025. The carrying value of the 2025 Senior Notes includes unamortized debt issuance costs and debt discount at December 31, 2016, of $2.2 million and $2.5 million, respectively, which are being amortized over the remaining life of the notes. The unamortized debt issuance costs and debt discount are recorded as a contra liability within long-term debt on JCG's Consolidated Balance Sheets.
0.750% Convertible Senior Notes Due 2018
Holders of the 0.750% Convertible Senior Notes due 2018 ("2018 Convertible Notes"), may convert the notes to equity during a particular calendar quarter if the last reported sale price of JCG's common stock is greater than or equal to 130% of the applicable conversion price for at least 20 trading days during a period of 30 consecutive trading days ending on the last trading day of the preceding quarter. As of December 31, 2016, the 2018 Convertible Notes did not meet the criteria for early conversion and are not convertible during the first quarter 2017. The 2018 Convertible Notes conversion criteria are reassessed on a quarterly basis. Fluctuations in the price of JCG's common stock may cause reclassification of the 2018 Convertible Notes between long-term debt and current portion of long-term debt on JCG's Consolidated Balance Sheets on a quarter-to-quarter
87
basis. As a result of the merger, the 2018 Convertible Notes may be converted, regardless of whether or not the conversion criteria have been satisfied, for a period of 35 trading days in advance of and 35 trading days following the merger completion.
The initial conversion rate of the 2018 Convertible Notes was 92.06 shares of JCG common stock per $1,000 principal amount of the 2018 Convertible Notes, which was equivalent to an initial conversion price of approximately $10.86 per share of common stock. The initial conversion rate was most recently adjusted during the fourth quarter 2016 when JCG paid a quarterly cash dividend of $0.11 per share, which was greater than the quarterly dividend of $0.07 per share at the time of issuance. As a result of the quarterly cash dividends paid through November 18, 2016, the conversion rate increased to 93.65 shares of JCG common stock per $1,000 principal amount of 2018 Convertible Notes, equivalent to a conversion price of approximately $10.68 per share of common stock.
The carrying value of the 2018 Convertible Notes includes unamortized debt issuance costs and debt discount at December 31, 2016, of $0.9 million and $4.7 million, respectively, which will be amortized over the remaining life of the notes. The unamortized debt issuance costs and debt discount are recorded as a contra liability within long-term debt on JCG's Consolidated Balance Sheets.
Convertible Note Hedge and Warrants
In connection with the 2018 Convertible Notes issuance in June 2013, JCG entered into convertible note hedge and warrant transactions which, in combination, are intended to reduce the potential for future dilution to existing shareholders by effectively increasing the initial conversion price of the 2018 Convertible Notes to JCG from $10.86 to $12.60 per share of common stock.
The initial $10.86 and $12.60 per share of common stock exercise prices of the call options and warrants, respectively, were adjusted as a result of quarterly cash dividends paid through November 18, 2016, which were greater than the quarterly dividend of $0.07 per share at the time of issuance. As a result of the adjustment, the exercise price of the call options changed to $10.68 per share of common stock, and the exercise price of the warrants changed to $12.39 per share of common stock.
The convertible note hedge and warrant transactions consisted of two separate instruments: purchased call options and the sale of warrants. The call options represent the same number of shares of JCG's common stock underlying the 2018 Convertible Notes with an initial strike price of $10.86 per share of common stock, which was equal to the conversion price of the 2018 Convertible Notes at the time of issuance. The call options cost $16.1 million. To offset the cost of the call options, JCG sold warrants to the counterparty of the call options for the same number of shares of JCG's common stock underlying the 2018 Convertible Notes with an exercise price of $12.60 per share of common stock. The proceeds from the sale of the warrants totaled $10.5 million. The call options and warrants may be settled in cash or stock at JCG's election and are indexed to JCG's equity, and as such, changes in fair value of these financial instruments are not recognized in the Company's consolidated financial statements. On issuance, the Company recorded the purchase of call options and sale of warrants as a decrease and increase in equity, respectively.
6.700% Senior Notes Due 2017
In August 2015, JCG redeemed all of the outstanding 2017 Senior Notes using the proceeds from the 2025 Senior Notes and cash on hand. The redemption included payment of the principal balance and the present value of future interest payments of the 2017 Senior Notes. JCG recognized a loss on early extinguishment of debt of $36.3 million during the third quarter 2015 related to the redemption.
88
Credit Facility
At December 31, 2016, JCG had a $200 million, unsecured, revolving credit facility (the "Credit Facility") with JPMorgan Chase Bank, N.A., as administrative agent and swingline lender. The Credit Facility can be used by JCG and its subsidiaries for working capital needs and general corporate purposes. The Credit Facility bears interest on borrowings outstanding at the London Interbank Offered Rate plus a spread, which is based on JCG's long-term unsecured debt credit rating ("credit rating"). JCG is required to pay a quarterly commitment fee on any unused portion of the Credit Facility, which is also based on JCG's credit rating. Under the Credit Facility, the financing leverage ratio cannot exceed 3.00x, and the interest coverage ratio must equal or exceed 4.00x. At December 31, 2016, JCG's financing leverage ratio was 1.22x and the interest coverage ratio was 20.02x. JCG was in compliance with all covenants, and there were no borrowings under the Credit Facility at December 31, 2016, or during the year ended December 31, 2016. The Credit Facility has a maturity date of November 23, 2018.
Aggregate Maturities of Indebtedness
The aggregate amounts of debt maturing or callable in the next five years are as follows (in millions):
Year ended December 31,
|
Amount | |||
|---|---|---|---|---|
2017 |
$ | — | ||
2018 (1) |
153.2 | |||
2019 |
| — | ||
2020 |
— | |||
2021 |
| — | ||
Thereafter |
300.0 | |||
| | | | | |
Total |
$ | 453.2 | ||
| | | | | |
| | | | | |
| | | | | |
- (1)
- Represents the fair value of the 2018 Convertible Notes as of December 31, 2016.
JCG's components of income before taxes for the years ended December 31, 2016, 2015 and 2014, are as follows (in millions):
| |
Year ended December 31, | |||||||||
|---|---|---|---|---|---|---|---|---|---|---|
| |
2016 | 2015 | 2014 | |||||||
Domestic |
$ | 211.0 | $ | 227.9 | $ | 245.3 | ||||
International |
31.2 | 25.4 | 12.4 | |||||||
| | | | | | | | | | | |
Total |
$ | 242.2 | $ | 253.3 | $ | 257.7 | ||||
| | | | | | | | | | | |
| | | | | | | | | | | |
| | | | | | | | | | | |
89
JCG's provision for income taxes for the years ended December 31, 2016, 2015 and 2014, is summarized as follows (in millions):
| |
Year ended December 31, | |||||||||
|---|---|---|---|---|---|---|---|---|---|---|
| |
2016 | 2015 | 2014 | |||||||
Current: |
| | | |||||||
Federal |
$ | 70.1 | $ | 63.3 | $ | 72.7 | ||||
State and local |
| 7.8 | | 0.9 | | 7.0 | ||||
International |
9.6 | 5.9 | 2.5 | |||||||
| | | | | | | | | | | |
Total current |
| 87.5 | | 70.1 | | 82.2 | ||||
| | | | | | | | | | | |
Deferred: |
||||||||||
Federal |
| 4.2 | | 18.9 | | 18.4 | ||||
State and local |
0.3 | 4.9 | 1.9 | |||||||
International |
| (1.1 | ) | | 0.1 | | (0.2 | ) | ||
| | | | | | | | | | | |
Total deferred |
3.4 | 23.9 | 20.1 | |||||||
| | | | | | | | | | | |
Total income tax provision |
$ | 90.9 | $ | 94.0 | $ | 102.3 | ||||
| | | | | | | | | | | |
| | | | | | | | | | | |
| | | | | | | | | | | |
JCG's deferred income tax assets (liabilities) as of December 31, 2016 and 2015, are summarized as follows (in millions):
| |
December 31, | ||||||
|---|---|---|---|---|---|---|---|
| |
2016 | 2015 | |||||
Deferred income tax assets: |
| | |||||
Accrued compensation and benefits |
$ | 44.9 | $ | 42.0 | |||
Accrued liabilities |
| 2.4 | | 2.7 | |||
Investments |
4.0 | 4.6 | |||||
Tax attributes |
| 7.2 | | 5.6 | |||
Deferred rent |
3.5 | 3.9 | |||||
Other |
| 2.6 | | 1.5 | |||
| | | | | | | | |
Total deferred income tax assets |
64.6 | 60.3 | |||||
| | | | | | | | |
Deferred income tax liabilities: |
| | |||||
Intangible assets |
(558.2 | ) | (546.6 | ) | |||
Prepaid expenses |
| (6.1 | ) | | (7.5 | ) | |
Other |
(3.1 | ) | (5.1 | ) | |||
| | | | | | | | |
Total deferred income tax liabilities |
| (567.4 | ) | | (559.2 | ) | |
| | | | | | | | |
Deferred income taxes, net |
$ | (502.8 | ) | $ | (498.9 | ) | |
| | | | | | | | |
| | | | | | | | |
| | | | | | | | |
90
JCG's effective income tax rate differs from the statutory federal income tax rate for the years ended December 31, 2016, 2015 and 2014, as follows:
| |
Year ended December 31, |
|||||||||
|---|---|---|---|---|---|---|---|---|---|---|
| |
2016 | 2015 | 2014 | |||||||
Federal statutory rate |
| 35.0 | % | | 35.0 | % | | 35.0 | % | |
State and local tax rate, net of federal benefit |
2.4 | 2.3 | 2.3 | |||||||
Noncontrolling interests |
| (0.4 | ) | | (0.5 | ) | | (0.1 | ) | |
Tax adjustments |
(0.7 | ) | (1.2 | ) | (0.5 | ) | ||||
Equity-based compensation |
| — | | — | | 3.0 | ||||
Other |
1.2 | 1.5 | — | |||||||
| | | | | | | | | | | |
Total effective income tax rate |
| 37.5 | % | | 37.1 | % | | 39.7 | % | |
| | | | | | | | | | | |
| | | | | | | | | | | |
| | | | | | | | | | | |
The accounting guidance for uncertainty in income taxes sets forth a specific method for the financial statement recognition and measurement of a tax position taken or expected to be taken on a tax return. The tax contingencies liability relates primarily to general state tax items and has been recorded in accounts payable and accrued liabilities, and other non-current liabilities on JCG's Consolidated Balance Sheets, as appropriate.
A reconciliation of the beginning and ending liability for the years ended December 31, 2016, 2015 and 2014, is as follows (in millions):
| |
Year ended December 31, | |||||||||
|---|---|---|---|---|---|---|---|---|---|---|
| |
2016 | 2015 | 2014 | |||||||
Beginning of year |
$ | 5.4 | $ | 5.4 | $ | 5.6 | ||||
Additions for tax positions of current year |
0.8 | 0.6 | 0.8 | |||||||
Additions for tax positions of prior years |
| 0.3 | | 0.3 | | — | ||||
Reduction due to statute expirations |
(1.8 | ) | (0.6 | ) | (1.0 | ) | ||||
Reduction due to settlement of audits |
| — | | (0.3 | ) | | — | |||
| | | | | | | | | | | |
End of year |
$ | 4.7 | $ | 5.4 | $ | 5.4 | ||||
| | | | | | | | | | | |
| | | | | | | | | | | |
| | | | | | | | | | | |
A deferred tax asset of $1.6 million is associated with the tax contingencies liability at December 31, 2016. If the tax contingencies liability and related deferred tax asset are reversed in future periods, the income tax provision would be favorably affected by $3.1 million. As of December 31, 2016, JCG had $4.7 million of accrued reserves for income tax contingencies. JCG accrued additional reserves for income tax contingencies in the amount of $1.1 million and removed reserves of $1.8 million in 2016, creating a net tax benefit of $0.4 million. JCG anticipates that its income tax contingency reserves will decrease by approximately $1.2 million in the next 12 months primarily from the expiration of statutes of limitations and the resolution of audits. Accrued reserves for income tax contingencies are presented in accounts payable and accrued liabilities on JCG's Consolidated Balance Sheets.
Tax returns filed in previous years are subject to audit by various federal, state and international taxing authorities, and as a result of such audits, additional tax assessments may be proposed. As of December 31, 2016, tax years from 2010 and forward remain subject to audit.
Taxing authorities generally charge interest and may assess penalties in the event that a tax position taken is subsequently reversed upon examination. JCG has accrued interest on its uncertain tax provisions based on the rates specified by the applicable taxing authorities and has recorded the interest as a component of the tax provision. At December 31, 2016, 2015 and 2014, $0.6 million, $0.8 million and $0.8 million, respectively, of accrued interest is included in the liability for tax
91
contingencies. Any potential penalties associated with a tax contingency will also be included as a component of the tax provision in the period in which the assessment of a penalty becomes likely. JCG does not believe that it is subject to any penalties related to its tax contingencies and, therefore, has not accrued a liability for tax penalties.
In the event of an overpayment of income taxes, taxing authorities generally pay interest from the date of the overpayment. JCG records interest income from taxing authorities as a component of the income tax provision.
JCG considers the undistributed earnings of its foreign subsidiaries as of December 31, 2016, to be indefinitely reinvested outside the U.S. on the basis of estimates that future domestic cash generation will be sufficient to meet future domestic cash needs and JCG's specific plans for reinvestment of the undistributed earnings. It is not practicable to estimate the amount of tax that might be payable on JCG's undistributed earnings.
Note 12 — Other Financial Statement Captions
Other current assets on JCG's Consolidated Balance Sheets at December 31, 2016 and 2015, are composed of the following (in millions):
| |
December 31, | ||||||
|---|---|---|---|---|---|---|---|
| |
2016 | 2015 | |||||
Derivative assets |
$ | 14.9 | $ | 3.8 | |||
Prepaid information technology maintenance |
3.2 | 3.2 | |||||
Prepaid insurance |
| 3.0 | | 3.0 | |||
Other prepaid assets |
13.4 | 10.7 | |||||
Deferred commissions |
| 2.7 | | 4.8 | |||
Income tax receivable |
— | 11.7 | |||||
Other current assets |
| 0.2 | | 2.8 | |||
| | | | | | | | |
Total other current assets |
$ | 37.4 | $ | 40.0 | |||
| | | | | | | | |
| | | | | | | | |
| | | | | | | | |
Accounts payable and accrued liabilities on JCG's Consolidated Balance Sheets at December 31, 2016 and 2015, are composed of the following (in millions):
| |
December 31, | ||||||
|---|---|---|---|---|---|---|---|
| |
2016 | 2015 | |||||
Accounts payable |
$ | 7.0 | $ | 6.9 | |||
Deferred compensation liability |
23.1 | 23.0 | |||||
Contingent consideration |
| 19.1 | | 11.9 | |||
Accrued marketing and distribution |
13.6 | 14.6 | |||||
Interest payable |
| 6.5 | | 6.5 | |||
Derivative liabilities |
4.8 | 0.5 | |||||
Income tax contingencies |
| 1.2 | | 2.2 | |||
Income tax payable |
1.7 | — | |||||
Other accrued liabilities |
| 15.7 | | 15.5 | |||
| | | | | | | | |
Total accounts payable and accrued liabilities |
$ | 92.7 | $ | 81.1 | |||
| | | | | | | | |
| | | | | | | | |
| | | | | | | | |
92
Other income, net on JCG's Consolidated Statements of Comprehensive Income for the years ended December 31, 2016, 2015 and 2014, is composed of the following (in millions):
| |
Year ended December 31, | |||||||||
|---|---|---|---|---|---|---|---|---|---|---|
| |
2016 | 2015 | 2014 | |||||||
Dividend income |
$ | 4.4 | $ | 8.1 | $ | 5.6 | ||||
Interest income |
0.9 | 0.7 | 0.6 | |||||||
Foreign currency losses, net |
| (1.4 | ) | | (5.8 | ) | | (3.2 | ) | |
Other, net |
— | 0.2 | — | |||||||
| | | | | | | | | | | |
Total other income, net |
$ | 3.9 | $ | 3.2 | $ | 3.0 | ||||
| | | | | | | | | | | |
| | | | | | | | | | | |
| | | | | | | | | | | |
Note 13 — Noncontrolling Interests
Noncontrolling interests in net income for the years ended December 31, 2016, 2015 and 2014, consisted of the following (in millions):
| |
Year ended December 31, | |||||||||
|---|---|---|---|---|---|---|---|---|---|---|
| |
2016 | 2015 | 2014 | |||||||
Redeemable noncontrolling interests in: |
| | | |||||||
Seeded investment products |
$ | (0.7 | ) | $ | 0.4 | $ | — | |||
INTECH |
| 0.4 | | 0.6 | | 0.5 | ||||
Nonredeemable noncontrolling interests in: |
||||||||||
Seeded investment products |
| — | | — | | (0.6 | ) | |||
Kapstream |
4.7 | 1.4 | — | |||||||
INTECH |
| 0.8 | | 1.1 | | 1.1 | ||||
| | | | | | | | | | | |
Net income attributable to noncontrolling interests |
$ | 5.2 | $ | 3.5 | $ | 1.0 | ||||
| | | | | | | | | | | |
| | | | | | | | | | | |
| | | | | | | | | | | |
Nonredeemable Noncontrolling Interests
Nonredeemable noncontrolling interests as of December 31, 2016 and 2015, are summarized as follows (in millions):
| |
December 31, | ||||||
|---|---|---|---|---|---|---|---|
| |
2016 | 2015 | |||||
Nonredeemable noncontrolling interests in: |
| | |||||
Kapstream |
$ | 82.4 | $ | 82.9 | |||
INTECH |
| 6.5 | | 6.5 | |||
| | | | | | | | |
Total nonredeemable noncontrolling interests |
$ | 88.9 | $ | 89.4 | |||
| | | | | | | | |
| | | | | | | | |
| | | | | | | | |
On July 1, 2015, JCG announced and closed the acquisition of a 51% interest in Kapstream. The nonredeemable noncontrolling interests balance for Kapstream represents the 49% interest owned by Kapstream management. On January 31, 2017, JCG acquired the remaining 49% voting interest in Kapstream. The noncontrolling interests were held by the founders of Kapstream, who are current JCG employees. Refer to Note 5 — Acquisitions for additional information.
93
Redeemable Noncontrolling Interests
As of December 31, 2016 and 2015, redeemable noncontrolling interests are summarized as follows (in millions):
| |
December 31, | ||||||
|---|---|---|---|---|---|---|---|
| |
2016 | 2015 | |||||
Consolidated seeded investment products: |
| | |||||
Consolidated VREs |
$ | 1.2 | $ | 13.8 | |||
Consolidated VIEs |
| 31.9 | | — | |||
INTECH: |
|||||||
Appreciation rights |
| 6.7 | | 3.4 | |||
Founding member ownership interests |
4.1 | 5.2 | |||||
Undistributed earnings |
| (0.8 | ) | | (0.6 | ) | |
| | | | | | | | |
Total redeemable noncontrolling interests |
$ | 43.1 | $ | 21.8 | |||
| | | | | | | | |
| | | | | | | | |
| | | | | | | | |
Consolidated Seeded Investment Products
Redeemable noncontrolling interests in consolidated seeded investment products may fluctuate from period to period and are impacted by changes in JCG's relative ownership percentage of seeded products, changes in the amount of third-party investment in seeded products and volatility in the market value of the seeded products' underlying securities. Third-party redemption of investments are redeemed from the respective product's net assets and cannot be redeemed from the assets of other seeded products or from the assets of JCG.
The following table presents a rollforward of noncontrolling interests in consolidated seeded investment products for the years ended December 31, 2016, 2015 and 2014 (in millions):
| |
Year ended December 31, | |||||||||
|---|---|---|---|---|---|---|---|---|---|---|
| |
2016 | 2015 | 2014 | |||||||
Beginning of period balance |
$ | 13.8 | $ | 41.1 | $ | 8.8 | ||||
Changes in market value: |
||||||||||
Consolidated VREs |
| — | | 0.3 | | (0.6 | ) | |||
Consolidated VIEs |
(0.7 | ) | — | — | ||||||
Changes in ownership: |
| | | |||||||
Consolidated VREs |
0.8 | (27.6 | ) | 32.9 | ||||||
Consolidated VIEs |
| 19.2 | | — | | — | ||||
| | | | | | | | | | | |
End of period balance |
$ | 33.1 | $ | 13.8 | $ | 41.1 | ||||
| | | | | | | | | | | |
| | | | | | | | | | | |
| | | | | | | | | | | |
Changes in ownership reflect third-party investment in consolidated seeded investment products, additional seed capital investment by JCG or seed capital redemptions by JCG.
INTECH
INTECH ownership interests held by a founding member had an estimated fair value of $4.1 million and $5.2 million as of December 31, 2016 and 2015, respectively, representing approximately 1.1% and 1.0% aggregate ownership of INTECH, respectively. This founding member is entitled to retain his remaining INTECH interests until his death and has the option to require JCG to purchase from him his ownership interests of INTECH at fair value.
INTECH appreciation rights were granted in March 2016, February 2015 and October 2014 to retain and incentivize employees. The appreciation rights had a grant date fair value of $27.8 million. The
94
appreciation rights granted in 2016 and 2015 are being amortized on a straight-line basis over a four-year vesting period while the appreciation rights granted in 2014 are being amortized on a straight-line basis over a 10-year vesting period. All appreciation rights are exercisable upon termination of employment from INTECH to the extent vested. Upon exercise, the appreciation rights are settled in INTECH equity.
Note 14 — Long-Term Incentive Compensation
The components of JCG's long-term incentive compensation expense for the years ended December 31, 2016, 2015 and 2014, are summarized as follows (in millions):
| |
Year ended December 31, | |||||||||
|---|---|---|---|---|---|---|---|---|---|---|
| |
2016 | 2015 | 2014 | |||||||
Restricted stock awards |
$ | 39.7 | $ | 35.1 | $ | 27.0 | ||||
Mutual fund share awards |
23.5 | 25.3 | 32.4 | |||||||
Profits interests and other |
| 15.6 | | 16.2 | | (8.5 | ) | |||
Stock options |
0.1 | 0.2 | 0.4 | |||||||
| | | | | | | | | | | |
Total long-term incentive compensation |
$ | 78.9 | $ | 76.8 | $ | 51.3 | ||||
| | | | | | | | | | | |
| | | | | | | | | | | |
| | | | | | | | | | | |
Historical long-term incentive awards have been granted with ratable vesting schedules between three and 10 years. The awards granted in 2016, 2015 and 2014 were generally granted with a four-year ratable vesting schedule and are generally not subject to accelerated vesting.
At December 31, 2016, unrecognized and unearned compensation, net of estimated forfeitures and excluding mark-to-market adjustments on mutual fund share awards, and the weighted-average number of years over which the compensation cost will be recognized are summarized as follows (in millions):
| |
Unrecognized compensation |
Weighted- average years |
|||||
|---|---|---|---|---|---|---|---|
Restricted stock awards |
$ | 86.6 | | 2.7 | |||
Profits interests and other |
65.5 | 7.1 | |||||
Mutual fund share awards |
| 41.0 | | 2.3 | |||
Stock options |
— | 0.1 | |||||
| | | | | | | | |
Total |
$ | 193.1 | | 4.1 | |||
| | | | | | | | |
| | | | | | | | |
| | | | | | | | |
Unrecognized INTECH interests included in restricted stock awards in the table above totaled $1.0 million and will be recognized over a weighted-average period of 2.1 years.
JCG generally grants annual long-term incentive awards in January or February of each year. The 2017 annual grant, not included in the table above, totaled $57.2 million and will generally be recognized ratably over a four-year period. The 2017 annual grant is not subject to performance-based accelerated vesting.
Upon closing of the merger with Henderson, each share of JCG common stock will be converted into the right to receive 4.7190 newly issued shares of Henderson.
Stock Options
Stock options were last granted to employees in 2013 with no stock options granted since. Stock options granted prior to February 2006 have a maximum contractual term of 10 years, and options granted thereafter have a maximum contractual term of seven years.
95
The table below summarizes JCG's outstanding options, exercisable options and options vested or expected to vest for the years ended December 31, 2016, 2015 and 2014:
| |
2016 | 2015 | 2014 | ||||||||||||||||
|---|---|---|---|---|---|---|---|---|---|---|---|---|---|---|---|---|---|---|---|
| |
Shares | Weighted- average exercise price |
Shares | Weighted- average exercise price |
Shares | Weighted- average exercise price |
|||||||||||||
Outstanding at January 1 |
| 1,934,662 | $ | 9.13 | | 4,641,563 | $ | 13.84 | | 8,985,562 | $ | 14.91 | |||||||
Granted |
— | $ | — | — | $ | — | — | $ | — | ||||||||||
Exercised |
| (1,464,575 | ) | $ | 8.68 | | (1,276,322 | ) | $ | 7.62 | | (808,583 | ) | $ | 9.18 | ||||
Forfeited |
— | $ | — | — | $ | — | (7,179 | ) | $ | 10.60 | |||||||||
Expired |
| — | $ | — | | (1,430,579 | ) | $ | 25.74 | | (3,528,237 | ) | $ | 17.65 | |||||
| | | | | | | | | | | | | | | | | | | | |
Outstanding at December 31 |
470,087 | $ | 10.55 | 1,934,662 | $ | 9.13 | 4,641,563 | $ | 13.84 | ||||||||||
| | | | | | | | | | | | | | | | | | | | |
| | | | | | | | | | | | | | | | | | | | |
| | | | | | | | | | | | | | | | | | | | |
Exercisable (1) |
| 458,723 | $ | 10.57 | | 1,874,055 | $ | 9.14 | | 3,295,557 | $ | 8.89 | |||||||
| | | | | | | | | | | | | | | | | | | | |
| | | | | | | | | | | | | | | | | | | | |
| | | | | | | | | | | | | | | | | | | | |
Vested or expected to vest |
470,087 | $ | 10.55 | 1,934,662 | $ | 9.13 | 4,641,563 | $ | 13.84 | ||||||||||
| | | | | | | | | | | | | | | | | | | | |
| | | | | | | | | | | | | | | | | | | | |
| | | | | | | | | | | | | | | | | | | | |
- (1)
- The number of exercisable options represents instruments for which all vesting criteria have been satisfied and whose exercise price was below the closing price of the Company's common stock as of the end of the period. As of December 31, 2016 and 2015, the exercise prices of all outstanding options were below the closing price of the Company's stock. As of December 31, 2014, there were 1.2 million options outstanding for which all vesting criteria had been satisified but for which exercise prices were above the closing price of the Company's common stock.
The following table summarizes the intrinsic value of exercised, outstanding and exercisable options at December 31, 2016, 2015 and 2014 (in millions):
| |
December 31, | |||||||||
|---|---|---|---|---|---|---|---|---|---|---|
| |
2016 | 2015 | 2014 | |||||||
Exercised |
$ | 6.8 | $ | 12.0 | $ | 3.3 | ||||
Outstanding |
$ | 1.3 | $ | 9.6 | $ | 20.1 | ||||
Exercisable |
$ | 1.2 | $ | 9.3 | $ | 23.9 | ||||
The following table summarizes the information about stock options that were outstanding at December 31, 2016:
| |
Options outstanding | Options exercisable | |||||||||||||||||
|---|---|---|---|---|---|---|---|---|---|---|---|---|---|---|---|---|---|---|---|
Range of exercise prices |
Number of options outstanding |
Weighted- average remaining contractual life (years) |
Weighted- average exercise price |
Number of options exercisable |
Weighted- average remaining contractual life (years) |
Weighted- average exercise price |
|||||||||||||
| $5 to $10 | | 196,970 | | 2.32 | $ | 8.85 | | 185,606 | | 2.27 | $ | 8.79 | |||||||
| $10 to $15 | 273,117 | 0.10 | $ | 11.78 | 273,117 | 0.10 | $ | 11.78 | |||||||||||
| | | | | | | | | | | | | | | | | | | | |
| $5 to $15 | | 470,087 | | 1.03 | $ | 10.55 | | 458,723 | | 0.98 | $ | 10.57 | |||||||
| | | | | | | | | | | | | | | | | | | | |
| | | | | | | | | | | | | | | | | | | | |
| | | | | | | | | | | | | | | | | | | | |
96
Restricted Stock Awards
The table below summarizes unvested restricted stock awards for the years ended December 31, 2016, 2015 and 2014:
| |
2016 | 2015 | 2014 | ||||||||||||||||
|---|---|---|---|---|---|---|---|---|---|---|---|---|---|---|---|---|---|---|---|
| |
Shares | Weighted- average grant date fair value |
Shares | Weighted- average grant date fair value |
Shares | Weighted- average grant date fair value |
|||||||||||||
Unvested at January 1 |
| 8,204,368 | $ | 13.73 | | 7,800,654 | $ | 11.11 | | 5,838,290 | $ | 9.71 | |||||||
Granted |
3,357,566 | $ | 12.49 | 3,081,054 | $ | 17.63 | 4,361,560 | $ | 12.45 | ||||||||||
Vested |
| (2,745,814 | ) | $ | 12.12 | | (2,479,700 | ) | $ | 10.45 | | (1,884,731 | ) | $ | 10.08 | ||||
Forfeited |
(239,699 | ) | $ | 12.91 | (197,640 | ) | $ | 12.94 | (514,465 | ) | $ | 10.20 | |||||||
| | | | | | | | | | | | | | | | | | | | |
Unvested at December 31 |
| 8,576,421 | $ | 13.79 | | 8,204,368 | $ | 13.73 | | 7,800,654 | $ | 11.11 | |||||||
| | | | | | | | | | | | | | | | | | | | |
| | | | | | | | | | | | | | | | | | | | |
| | | | | | | | | | | | | | | | | | | | |
The total fair value of restricted stock that vested during the years ended December 31, 2016, 2015 and 2014, was $34.5 million, $42.0 million and $21.6 million, respectively.
Price-Vesting Units
JCG granted 97,747 price-vesting units to its Chief Executive Officer on December 31, 2013, valued at $1.2 million. These price-vesting units may or may not vest, in whole or in part, three years after the date of grant, depending on JCG's three-year operating profit margin performance during the vesting period. As of December 31, 2016, the three-year adjusted operating margin was 29.2%, which resulted in 53,110 price-vesting units vesting in December 2016.
JCG granted 137,178 price-vesting units to its Chief Executive Officer on December 31, 2014, valued at $2.2 million. These price-vesting units may or may not vest, in whole or in part, three years after the date of grant, depending on JCG's three-year operating profit margin performance during the vesting period. If JCG's three-year operating margin performance is less than or equal to 24%, none of the shares will vest. Alternatively, if JCG's three-year operating margin performance equals 28%, 100% of the shares will vest. If JCG's three-year operating margin performance is greater than or equal to 32%, 200% of the shares will vest. All intermediate amounts between 24%, 28% and 32% will be interpolated on a straight-line basis. Upon the closing date of the merger with Henderson, the price-vesting units will be measured based on operating profit margin performance through the date of the Company's latest quarterly financial statements and will convert into a time-based award vesting on December 31, 2017.
JCG granted 138,901 price-vesting units to its Chief Executive Officer on December 31, 2015, valued at $1.9 million. These price-vesting units may or may not vest in whole or in part, three years after the date of grant, depending on JCG's three-year Total Shareholder Return ("TSR") performance relative to a peer group during the vesting period. Upon the closing date of the merger with Henderson, the performance criteria will remain in place through the life of the price-vesting units.
JCG granted 134,666 price-vesting units to its Chief Executive Officer on December 31, 2016, valued at $1.8 million. These price-vesting units may or may not vest in whole or in part, three years after the date of grant, depending on JCG's three-year TSR performance relative to a peer group during the vesting period. Upon the closing date of the merger with Henderson, the performance criteria will remain in place through the life of the price-vesting units.
97
Mutual Fund Share Awards
During 2016, 2015 and 2014, JCG granted employees $26.1 million, $23.2 million and $22.7 million, respectively, in awards that are indexed to certain mutual funds managed by the Company. The performance-based mutual fund share awards vest five years after the grant date if certain performance criteria are achieved. Upon vesting, participants receive the value of the award adjusted for gains or losses attributable to the mutual funds to which the award was indexed, subject to tax withholding.
At December 31, 2016, the cost basis of unvested awards totaled $61.4 million.
Perkins Senior Profits Interests Awards
On December 31, 2008, Perkins granted senior profits interests awards designed to retain and incentivize key employees to grow the business. These awards vested on the fifth anniversary of grant and were entitled to a total of 5% of Perkins' annual taxable income. These awards had a formula-driven terminal value based on revenue and relative investment performance of products managed by Perkins. Participants carried a put right that would require JCG to terminate the awards in exchange for the then-applicable formula price on December 31, 2014, the sixth anniversary of grant. The value of the put right at December 31, 2014, was $5.9 million. On January 27, 2015, participants exercised their right to put the senior profits interests awards to JCG. The Company settled the awards with a $5.9 million cash payment to participants on February 13, 2015.
On November 18, 2013, Perkins granted additional senior profits interests awards, which fully vest on December 31, 2018, and are entitled to a total of 10% of Perkins' annual taxable income. The entitlement to a percentage of Perkins' annual taxable income over the vesting period is tiered and starts at 2% in 2015 and increases 2% each year thereafter until reaching 10% after fully vesting on December 31, 2018. In addition, these awards have a formula-driven terminal value based on Perkins' revenue. JCG can call and terminate any or all of the awards on December 31, 2018, and each year thereafter. Holders of such interests can require JCG to purchase the interests in exchange for the then-applicable formula price on December 31, 2018. The senior profits interests are also subject to termination at premiums or discounts to the formula at the option of JCG or certain employees, as applicable, upon certain corporate or employment-related events affecting Perkins or certain employees. As of December 31, 2016, the formula-driven value was zero and there was no liability on JCG's Consolidated Balance Sheets associated with the Perkins senior profits interests awards granted in 2013.
INTECH Long-Term Incentive Awards
In October 2014, INTECH granted long-term incentive awards to retain and incentivize employees. The awards consist of appreciation rights, profits interests and phantom interests, and are designed to give recipients an equity-like stake in INTECH. The appreciation rights have a grant date fair value of $23.2 million, which will be amortized on a straight-line basis over the 10-year vesting schedule, and are exercisable upon termination of employment from INTECH and to the extent vested. The profits interests and phantom interests awards entitle recipients to 9.1% of INTECH's pre-incentive profits and replace a portion of the prior discretionary bonus pool. Additional phantom interests were granted to certain employees in 2016 and 2015. As of December 31, 2016, total profits interests and phantom interests awards entitle recipients to 9.1% of INTECH's pre-incentive profits.
Additional appreciation rights were granted in February 2015 and March 2016 as part of the annual grant. The appreciation rights will be amortized on a straight-line basis over the four-year vesting schedule and are exercisable upon termination of employment from INTECH and to the extent vested. Upon exercise, the appreciation rights are settled in INTECH equity. The fair values of the
98
appreciation rights granted in 2016, 2015 and 2014 were estimated using the Black-Scholes option pricing model with the following assumptions:
| |
Assumptions | |||||||||
|---|---|---|---|---|---|---|---|---|---|---|
| |
October 2014 grant |
February 2015 grant |
March 2016 grant |
|||||||
Dividend yield |
| 1.98 | % | | 2.56 | % | | 2.89 | % | |
Expected volatility |
34 | % | 30 | % | 28 | % | ||||
Risk-free interest rate |
| 2.53 | % | | 1.81 | % | | 1.93 | % | |
Expected life (in years) |
12 | 6 | 6 | |||||||
Grant date fair value (in millions) |
$ | 23.2 | $ | 2.0 | $ | 2.6 | ||||
The dividend yield and expected volatility were determined using historical data from publicly traded peers. The risk-free interest rate for the 2014 grant is based on the 10-year U.S. Treasury note at the time of the grant while the risk-free interest rates for the 2015 and 2016 grants are based on the average of the five-year and seven-year U.S. Treasury notes at the time of the grant. The expected life of the appreciation rights was estimated based upon the assumption that recipients terminate upon vesting and exercise a certain percentage of their rights each year over the following four years.
INTECH profits interests and phantom interests entitle holders to periodic distributions of a portion of INTECH operating income. Distributions are made during employment and, for profits interests, post-employment for up to 10 years. Phantom interests are entitled to a one-time distribution at termination of employment. Compensation expense for post-employment distributions is based upon the present value of expected future distributions and will be recognized pro rata over the 10-year vesting schedule for profits interests and five years for phantom interests. The present value of these payments was determined using a 2% discount rate, which represents the interest rate on a 20-year U.S. Treasury note. As of December 31, 2016, the total undiscounted estimated post-employment payments for profits interests and phantom interests was $58.1 million (the majority will not be paid until 10 to 20 years after the grant date). The estimated post-employment payments will be evaluated and adjusted quarterly, as necessary, with changes recorded in results of operations. As of December 31, 2016, the carrying value of the liability associated with the INTECH profits interests and phantom interests was $10.8 million and is included in other non-current assets on JCG's Consolidated Balance Sheets.
Long-Term Incentive Stock Plans
On May 10, 2005, JCG shareholders approved the 2005 Long-Term Incentive Stock Plan ("2005 Plan"), which allowed the Board of Directors to grant up to 15.0 million shares of equity-based awards, including stock options and restricted stock. Subsequent to the annual grant in January 2016, 3.3 million shares of stock options and less than 0.1 million shares of restricted stock are available to be granted under the 2005 Plan.
On April 29, 2010, JCG shareholders approved the 2010 Long-Term Incentive Stock Plan ("2010 Plan"), which allows JCG to grant up to 4.4 million shares of equity-based awards, including stock options and restricted stock. On April 26, 2012, JCG shareholders approved an amendment to the 2010 Plan to increase the number of shares available to grant by 9.0 million shares. On April 24, 2015, JCG shareholders approved an amendment to the 2010 Plan to increase the number of shares available to grant by 11.0 million shares for a total of 24.4 million shares of equity-based awards available to grant under the 2010 Plan. Subsequent to the annual grant in January 2017, approximately 4.9 million shares of equity-based awards are available to be granted under the 2010 Plan.
99
JCG also has a 2012 Employment Inducement Award Plan ("EIA Plan") with 0.8 million shares of equity-based awards available to be granted as of December 31, 2016. The EIA Plan is not a shareholder-approved plan.
Note 15 — Employee Benefit Plans
Substantially all full-time employees of JCG are eligible to participate in a Company-sponsored 401(k), Employee Stock Ownership Plan ("ESOP") and profit-sharing plan (collectively, the "401(k) Plan"). During the years ended December 31, 2016, 2015 and 2014, JCG matched a maximum of 4.5%, 4% and 4% of employee eligible compensation in the 401(k) Plan, respectively. Effective January 1, 2017, JCG increased its matching contribution to 5.0% of employee-eligible compensation in the 401(k) Plan.
Eligible employees with Janus before January 1, 2014, vest immediately in Company-matched 401(k) contributions while employees who started employment after January 1, 2014, vest ratably over five years. Contributions to the ESOP and the profit-sharing components of the 401(k) Plan are made at the discretion of the Compensation Committee of the Board of Directors. There were no contributions made to the ESOP and profit-sharing plans for 2016, 2015 or 2014. Participants vest ratably in the discretionary ESOP and profit-sharing contributions over a five-year period. Expenses related to the 401(k) Plan and equivalent plans internationally are included in employee compensation and benefits on JCG's Consolidated Statements of Comprehensive Income and were $8.0 million, $6.8 million and $6.3 million during the years ended December 31, 2016, 2015 and 2014, respectively.
The Company also maintains deferred compensation plans for certain highly compensated employees and members of its Board of Directors. At December 31, 2016 and 2015, the fair value of investments related to deferred compensation plans totaled $17.2 million and $16.3 million, respectively. See Note 2 — Summary of Significant Accounting Policies for further discussion of the Company's deferred compensation plans.
Note 16 — Accumulated Other Comprehensive Loss
Changes in accumulated other comprehensive loss, net of tax, for the years ended December 31, 2016 and 2015, are as follows (in millions):
| |
Year ended December 31, | ||||||||||||||||||
|---|---|---|---|---|---|---|---|---|---|---|---|---|---|---|---|---|---|---|---|
| |
2016 | 2015 | |||||||||||||||||
| |
Available-for-sale securities |
Foreign currency |
Total | Available-for-sale securities |
Foreign currency |
Total | |||||||||||||
Beginning balance |
$ | (2.3 | ) | $ | (6.6 | ) | $ | (8.9 | ) | $ | 0.9 | $ | (2.3 | ) | $ | (1.4 | ) | ||
Other comprehensive income (loss) before reclassifications |
1.1 | (0.6 | ) | 0.5 | (2.2 | ) | (4.3 | ) | (6.5 | ) | |||||||||
Amounts reclassified from accumulated other comprehensive loss to: |
| | | | | | |||||||||||||
Investment losses, net |
0.5 | — | 0.5 | (1.0 | ) | — | (1.0 | ) | |||||||||||
| | | | | | | | | | | | | | | | | | | | |
Total other comprehensive income (loss), net of tax |
| 1.6 | | (0.6 | ) | | 1.0 | | (3.2 | ) | | (4.3 | ) | | (7.5 | ) | |||
| | | | | | | | | | | | | | | | | | | | |
Ending balance |
$ | (0.7 | ) | $ | (7.2 | ) | $ | (7.9 | ) | $ | (2.3 | ) | $ | (6.6 | ) | $ | (8.9 | ) | |
| | | | | | | | | | | | | | | | | | | | |
| | | | | | | | | | | | | | | | | | | | |
| | | | | | | | | | | | | | | | | | | | |
100
The components of other comprehensive income (loss), net of tax for the years ended December 31, 2016, 2015 and 2014, are as follows (in millions):
Year ended December 31, 2016
|
Pre-tax amount |
Tax expense |
Net amount | |||||||
|---|---|---|---|---|---|---|---|---|---|---|
Net unrealized gain on available-for-sale securities |
$ | 1.7 | $ | (0.6 | ) | $ | 1.1 | |||
Foreign currency translation adjustments |
(0.6 | ) | — | (0.6 | ) | |||||
Reclassification for items included in net income |
| 0.7 | | (0.2 | ) | | 0.5 | |||
| | | | | | | | | | | |
Total other comprehensive income |
$ | 1.8 | $ | (0.8 | ) | $ | 1.0 | |||
| | | | | | | | | | | |
| | | | | | | | | | | |
| | | | | | | | | | | |
Year ended December 31, 2015
|
Pre-tax amount |
Tax benefit |
Net amount | |||||||
|---|---|---|---|---|---|---|---|---|---|---|
Net unrealized loss on available-for-sale securities |
$ | (3.6 | ) | $ | 1.4 | $ | (2.2 | ) | ||
Foreign currency translation adjustments |
(4.3 | ) | — | (4.3 | ) | |||||
Reclassification for items included in net income |
| (1.6 | ) | | 0.6 | | (1.0 | ) | ||
| | | | | | | | | | | |
Total other comprehensive loss |
$ | (9.5 | ) | $ | 2.0 | $ | (7.5 | ) | ||
| | | | | | | | | | | |
| | | | | | | | | | | |
| | | | | | | | | | | |
Year ended December 31, 2014
|
Pre-tax amount |
Tax benefit (expense) |
Net amount | |||||||
|---|---|---|---|---|---|---|---|---|---|---|
Net unrealized gain on available-for-sale securities |
$ | 3.0 | $ | (1.1 | ) | $ | 1.9 | |||
Reclassification for items included in net income |
(3.5 | ) | 1.3 | (2.2 | ) | |||||
| | | | | | | | | | | |
Total other comprehensive loss |
$ | (0.5 | ) | $ | 0.2 | $ | (0.3 | ) | ||
| | | | | | | | | | | |
| | | | | | | | | | | |
| | | | | | | | | | | |
For the year ended December 31, 2016, foreign currency translation adjustments in the tables above exclude a $0.6 million loss that was allocated to nonredeemable noncontrolling interests.
Note 17 — Earnings and Dividends Per Share
Earnings Per Share
The following is a summary of the earnings per share calculation for the years ended December 31, 2016, 2015 and 2014 (in millions, except per share data):
| |
Year ended December 31, | |||||||||
|---|---|---|---|---|---|---|---|---|---|---|
| |
2016 | 2015 | 2014 | |||||||
Net income attributable to JCG |
$ | 146.1 | $ | 155.8 | $ | 154.4 | ||||
Less: Allocation of earnings to participating restricted stock awards |
5.5 | 5.5 | 5.1 | |||||||
| | | | | | | | | | | |
Net income attributable to JCG common shareholders |
$ | 140.6 | $ | 150.3 | $ | 149.3 | ||||
| | | | | | | | | | | |
| | | | | | | | | | | |
| | | | | | | | | | | |
Weighted-average common shares outstanding — basic |
177.0 | 179.7 | 182.2 | |||||||
Diluted effect of: |
| | | |||||||
2018 Convertible Notes |
2.6 | 3.7 | 1.5 | |||||||
Stock warrants |
| 1.2 | | 2.5 | | — | ||||
Stock options, restricted stock and other |
0.4 | 0.9 | 1.2 | |||||||
| | | | | | | | | | | |
Weighted-average diluted common shares outstanding — diluted |
| 181.2 | | 186.8 | | 184.9 | ||||
| | | | | | | | | | | |
| | | | | | | | | | | |
| | | | | | | | | | | |
Earnings per share: |
||||||||||
Basic earnings per share |
$ | 0.79 | $ | 0.84 | $ | 0.82 | ||||
| | | | | | | | | | | |
| | | | | | | | | | | |
| | | | | | | | | | | |
Diluted earnings per share |
$ | 0.78 | $ | 0.80 | $ | 0.81 | ||||
| | | | | | | | | | | |
| | | | | | | | | | | |
| | | | | | | | | | | |
101
The following stock options, unvested nonparticipating restricted stock units and price-vesting units are anti-dilutive and have not been included in the weighted-average diluted shares outstanding calculation (in millions):
| |
Year ended December 31, | |||||||||
|---|---|---|---|---|---|---|---|---|---|---|
| |
2016 | 2015 | 2014 | |||||||
Employee stock options |
| — | | — | | 1.5 | ||||
Unvested nonparticipating restricted stock units and price-vesting units |
0.1 | 0.2 | 0.4 | |||||||
All shares held in the JCG ESOP are treated as outstanding for purposes of computing basic earnings per share.
Dividends Per Share
The Merger Agreement requires JCG to operate its business in the ordinary course and, subject to certain exceptions, may prevent JCG from taking certain actions without the approval of Henderson, including, but not limited to, dividend payments. However, under the terms of the Merger Agreement, subject to the approval of the JCG Board of Directors, JCG is permitted to pay a cash dividend in respect to the fourth quarter 2016.
The following is a summary of cash dividends declared and paid for the years ended December 31, 2016, 2015 and 2014:
| |
Year ended December 31, | |||||||||
|---|---|---|---|---|---|---|---|---|---|---|
| |
2016 | 2015 | 2014 | |||||||
Dividends paid per share |
$ | 0.42 | $ | 0.35 | $ | 0.31 | ||||
On January 19, 2017, JCG's Board of Directors declared a regular quarterly cash dividend of $0.11 per share. The quarterly dividend will be paid on February 17, 2017, to shareholders of record at the close of business on February 6, 2017.
Note 18 — Commitments and Contingencies
Operating and Capital Leases
JCG rents office space and equipment under the terms of various operating lease agreements. As of December 31, 2016, future minimum rental commitments under non-cancelable operating and capital leases are as follows (in millions):
Year ended December 31,
|
Amount | |||
|---|---|---|---|---|
2017 |
$ | 17.9 | ||
2018 |
16.3 | |||
2019 |
| 12.8 | ||
2020 |
10.5 | |||
2021 |
| 9.4 | ||
Thereafter |
31.7 | |||
| | | | | |
Total |
$ | 98.6 | ||
| | | | | |
| | | | | |
| | | | | |
Rent expense was $17.5 million, $17.9 million and $17.0 million for the years ended December 31, 2016, 2015 and 2014, respectively.
102
JCG's capital lease obligations represent leased computer equipment. The carrying value of the obligations at December 31, 2016 and 2015, totaled $4.3 million and $5.6 million, respectively, and is included in accounts payable and accrued liabilities, and other non-current liabilities on JCG's Consolidated Balance Sheets. The related lease terms extend through December 31, 2021.
Contingent Consideration
In connection with the acquisition of VelocityShares in 2014 and a controlling 51% voting interest in Kapstream in 2015, JCG is required to pay contingent consideration, subject to achieving certain performance targets. As of December 31, 2016, the total maximum payments over the remaining contingent consideration periods are $25.0 million. Refer to Note 5 — Acquisitions for additional information on contingent consideration.
Merger Agreement
The Merger Agreement contains mutual customary representations and warranties made by each of JCG and Henderson, and also contains mutual customary pre-closing covenants, including covenants, among others, (i) to operate its businesses in the ordinary course consistent with past practice and to refrain from taking certain actions without the other party's consent, (ii) not to solicit, initiate, knowingly encourage or knowingly take any other action designed to facilitate, and, subject to certain exceptions, not to participate in any discussions or negotiations, or cooperate in any way with respect to, any inquiries or the making of, any proposal of an alternative transaction, (iii) subject to certain exceptions, not to withdraw, qualify or modify the support of its board of directors for the Merger Agreement and the merger, as applicable, and (iv) to use their respective reasonable best efforts to obtain governmental, regulatory and third party approvals. In addition, the Merger Agreement contains covenants that require each of JCG and Henderson to call and hold a special stockholder meeting and, subject to certain exceptions, require each of the board of directors of JCG and Henderson to recommend to its stockholders to approve the merger and, with respect to the Board of Directors of JCG, to adopt the Merger Agreement.
The Merger Agreement also contains certain termination rights for each of JCG and Henderson, including in the event that (i) the merger is not consummated on or before September 30, 2017 (the "Outside Date"), (ii) the required approvals of the stockholders of JCG or the shareholders of Henderson are not obtained at the respective stockholder meetings or (iii) if any restraint having the effect of preventing the consummation of the merger shall have become final and non-appealable or if any governmental entity that must grant a requisite regulatory approval has denied approval of the merger. In addition, JCG and Henderson can each terminate the Merger Agreement prior to the stockholder meeting of the other party if, among other things, the other party's board of directors has changed its recommendation that its stockholders approve the merger, as applicable, and adopt the Merger Agreement, or has failed to make or reaffirm such recommendation in certain circumstances.
The Merger Agreement further provides that, upon termination of the Merger Agreement under specified circumstances, including (i) a change in the recommendation of the board of directors of JCG or Henderson or (ii) a termination of the Merger Agreement by JCG or Henderson because of (a) a failure to obtain the requisite approvals of the stockholders of the other party, (b) a material breach by the other party or (c) because the merger is not consummated by the Outside Date, in each case set forth in this clause (ii), at a time when there was an offer or proposal for an alternative transaction with respect to such party and such party enters into or consummates an alternative transaction, in the case of clause (a) or (b), within 12 months following such date of termination or in the case of clause (c), within 12 months from the Outside Date, JCG or Henderson, as the case may be, will pay to the other party a termination fee equal to $34,000,000 in cash.
103
The Merger Agreement provides that if Henderson or JCG terminates the Merger Agreement because of a failure of the shareholders of the other party to approve the merger at the applicable shareholder meeting, Henderson or JCG, as the case may be, will reimburse the other party for its actual out-of-pocket fees and expenses up to an aggregate amount equal to $10.0 million.
The foregoing description of the Merger Agreement does not purport to be complete and is qualified in its entirety to the full text of the Merger Agreement.
Litigation and Other Regulatory Matters
JCG is periodically involved in various legal proceedings and other regulatory matters. Although there can be no assurances, based on information currently available, management believes that it is probable that the ultimate outcome of matters that are pending or threatened will not have a material effect on JCG's consolidated financial statements.
Investment Management Agreements
Most of JCG's revenues are derived pursuant to investment management agreements with its investment advisory clients. Investment management agreements with mutual funds may be terminated by either party with notice, or terminated in the event of an "assignment" (as defined in the Investment Company Act of 1940 as amended (the "1940 Act")), and must be approved and renewed annually by the disinterested members of each fund's trustees, or its shareowners, as required by law. Generally, any change in control of JCG would constitute an assignment under the 1940 Act. In addition, a mutual fund's trustees or directors may terminate these investment management agreements upon written notice for any reason.
Note 19 — Related Party Transactions
JCG earns fees from the various registered investment companies for which it acts as investment adviser. Investment management fees and other receivables include amounts due from these investment companies. The table below presents this related party activity for the years ended and as of December 31, 2016, 2015 and 2014 (in millions):
| |
Year ended December 31, | |||||||||
|---|---|---|---|---|---|---|---|---|---|---|
| |
2016 | 2015 | 2014 | |||||||
Investment management, performance and shareowner servicing fees |
$ | 808.9 | $ | 862.1 | $ | 762.1 | ||||
12b-1 plan fees earned (1) |
$ | 6.0 | $ | 6.6 | $ | 5.0 | ||||
| |
As of December 31, | |||||||||
|---|---|---|---|---|---|---|---|---|---|---|
| |
2016 | 2015 | 2014 | |||||||
Accounts receivable from registered investment companies |
$ | 75.4 | $ | 81.0 | $ | 76.9 | ||||
- (1)
- The annual marketing or distribution fees on a mutual fund.
Dai-ichi Life Holdings Inc. ("Dai-ichi Life") is a significant shareholder of the Company. Investment management fees from Dai-ichi Life and its affiliates (included in the table above) for the years ended December 31, 2016, 2015 and 2014, were $20.5 million, $19.4 million and $14.7 million, respectively.
104
Note 20 — Shareholder Rights Plan
JCG does not currently have a Shareholder Rights Plan ("Rights Plan") in place as JCG's Board of Directors let the previous Rights Plan expire by its terms in June 2010. The Board of Directors reserves the right to implement a new Rights Plan at any time.
Note 21 — Geographic Information
The following summary provides information concerning JCG's principal geographic areas for the years ended and as of December 31, 2016, 2015 and 2014 (in millions):
| |
Year ended December 31, | |||||||||
|---|---|---|---|---|---|---|---|---|---|---|
Operating revenues
|
2016 | 2015 | 2014 | |||||||
U.S. |
$ | 840.2 | $ | 909.1 | $ | 827.7 | ||||
International |
170.5 | 167.1 | 125.5 | |||||||
| | | | | | | | | | | |
Total |
$ | 1,010.7 | $ | 1,076.2 | $ | 953.2 | ||||
| | | | | | | | | | | |
| | | | | | | | | | | |
| | | | | | | | | | | |
| |
As of December 31, | |||||||||
|---|---|---|---|---|---|---|---|---|---|---|
Long-lived assets
|
2016 | 2015 | 2014 | |||||||
U.S. |
$ | 1,740.8 | $ | 1,742.2 | $ | 1,736.5 | ||||
International |
177.2 | 178.4 | 4.6 | |||||||
| | | | | | | | | | | |
Total |
$ | 1,918.0 | $ | 1,920.6 | $ | 1,741.1 | ||||
| | | | | | | | | | | |
| | | | | | | | | | | |
| | | | | | | | | | | |
International revenues and assets are attributed to countries based on the location in which revenues are earned, primarily the U.K. and Australia.
Note 22 — Selected Quarterly Financial Data (Unaudited)
| |
2016 | |||||||||||||||
|---|---|---|---|---|---|---|---|---|---|---|---|---|---|---|---|---|
(in millions, except per share amounts)
|
First quarter |
Second quarter |
Third quarter |
Fourth quarter |
Full year | |||||||||||
Operating revenue |
$ | 248.5 | $ | 251.9 | $ | 258.9 | $ | 251.4 | $ | 1,010.7 | ||||||
Operating income |
62.6 | 67.9 | 69.3 | 61.8 | 261.6 | |||||||||||
Net income |
| 37.0 | | 40.2 | | 43.0 | | 31.1 | | 151.3 | ||||||
Net income attributable to noncontrolling interests |
(1.9 | ) | (1.2 | ) | (1.9 | ) | (0.2 | ) | (5.2 | ) | ||||||
Net income attributable to JCG |
| 35.1 | | 39.0 | | 41.1 | | 30.9 | | 146.1 | ||||||
Basic earnings per share attributable to JCG common shareholders |
$ | 0.19 | $ | 0.21 | $ | 0.22 | $ | 0.17 | $ | 0.79 | ||||||
Diluted earnings per share attributable to JCG common shareholders |
$ | 0.19 | $ | 0.21 | $ | 0.22 | $ | 0.17 | $ | 0.78 | ||||||
105
| |
2015 | |||||||||||||||
|---|---|---|---|---|---|---|---|---|---|---|---|---|---|---|---|---|
(in millions, except per share amounts)
|
First quarter |
Second quarter |
Third quarter |
Fourth quarter |
Full year | |||||||||||
Operating revenue |
$ | 262.7 | $ | 271.9 | $ | 273.8 | $ | 267.8 | $ | 1,076.2 | ||||||
Operating income |
76.0 | 82.1 | 83.4 | 80.8 | 322.3 | |||||||||||
Net income |
| 46.2 | | 44.9 | | 19.9 | | 48.3 | | 159.3 | ||||||
Net income attributable to noncontrolling interests |
(1.6 | ) | (0.2 | ) | — | (1.7 | ) | (3.5 | ) | |||||||
Net income attributable to JCG |
| 44.6 | | 44.7 | | 19.9 | | 46.6 | | 155.8 | ||||||
Basic earnings per share attributable to JCG common shareholders |
$ | 0.24 | $ | 0.24 | $ | 0.11 | $ | 0.25 | $ | 0.84 | ||||||
Diluted earnings per share attributable to JCG common shareholders |
$ | 0.23 | $ | 0.23 | $ | 0.10 | $ | 0.25 | $ | 0.80 | ||||||
106
ITEM 9. CHANGES IN AND DISAGREEMENTS WITH ACCOUNTANTS ON ACCOUNTING AND FINANCIAL DISCLOSURE
None.
ITEM 9A. CONTROLS AND PROCEDURES
Evaluation of Controls and Procedures
As of December 31, 2016, JCG's management evaluated the effectiveness of the design and operation of its disclosure controls and procedures (as such term is defined in Rules 13a-15(e) and 15d-15(e) under the Exchange Act). Disclosure controls and procedures are designed by the Company to seek to ensure that it records, processes, summarizes and reports in a timely manner the information it must disclose in reports that it files with or submits to the U.S. Securities and Exchange Commission. Richard M. Weil, Chief Executive Officer, and Jennifer J. McPeek, Executive Vice President and Chief Financial Officer, reviewed and participated in management's evaluation of the disclosure controls and procedures. Based on this evaluation, Mr. Weil and Ms. McPeek concluded that as of the date of their evaluation, JCG's disclosure controls and procedures were effective.
There has been no change in JCG's internal controls over financial reporting (as such term is defined in Rules 13a-15(f) and 15d-15(f) under the Exchange Act) during the fourth quarter 2016 that has materially affected, or is reasonably likely to materially affect, JCG's internal controls over financial reporting.
JCG's Management Report on Internal Control over Financial Reporting and Deloitte & Touche LLP's Report of Independent Registered Public Accounting Firm, which contains its attestation on JCG's internal control over financial reporting, are incorporated by reference from Part II, Item 8, Financial Statements and Supplementary Data.
None.
The information required under Part III (Items 10,11, 12,13 and 14) is incorporated by reference to the Company's definitive proxy statement for the 2017 Annual Meeting of stockholders or will be contained in the Company's Form 10-K/A, which will be filed no later than 120 days after the end of the fiscal year covered by this Form 10-K.
ITEM 15. EXHIBITS AND FINANCIAL STATEMENT SCHEDULES
(a) List of Documents Filed as Part of This Report
- (1)
- Financial Statements
The financial statements and related notes, together with the report of Deloitte & Touche LLP dated February 16, 2017, appear in Part II, Item 8, Financial Statements and Supplementary Data.
107
- (2)
- Financial Statement Schedules
The schedules and exhibits for which provision is made in the applicable accounting regulation of the U.S. Securities and Exchange Commission appear in Part II, Item 8, Financial Statements and Supplementary Data, under the Index to Financial Statements.
- (3)
- List of Exhibits
(b) Exhibits
The Company has incorporated by reference herein certain exhibits as specified below pursuant to Rule 12b-32 under the Exchange Act.
| (2) Plan of acquisition, reorganization, arrangement, liquidation or succession | ||
2.1 |
Agreement and Plan of Merger, dated October 3, 2016, by and among Janus Capital Group Inc., Henderson Group plc and Horizon Orbit Corp, is hereby incorporated by reference from Exhibit 2.1 to JCG's Current Report on Form 8-K, dated October 3, 2016 (File No. 001-15253) |
|
(3) Articles of Incorporation and Bylaws |
||
3.1.1 |
Delaware Certificate of Incorporation as Amended and Restated on June 14, 2000, is hereby incorporated by reference from Exhibit 3.1.1 to JCG's Registration Statement on Form 10 declared effective on June 15, 2000 (File No. 001-15253) |
|
3.1.2 |
Certificate of Designation dated June 15, 2000, establishing Series A Preferred Stock, is hereby incorporated by reference from Exhibit 3.1.2 to JCG's Registration Statement on Form 10 declared effective on June 15, 2000 (File No. 001-15253) |
|
3.1.3 |
Certificate of Amendment of the Amended and Restated Certificate of Incorporation of Janus Capital Group Inc. is hereby incorporated by reference from Exhibit 3.1 to JCG's Current Report on Form 8-K, dated May 18, 2012 (File No. 001-15253) |
|
3.2 |
Bylaws of Janus Capital Group Inc. as Amended and Restated on October 21, 2008, is hereby incorporated by reference from Exhibit 3.1 to JCG's Form 10-Q for the quarterly period ended September 30, 2008 (File No. 001-15253) |
|
3.2.1 |
First Amendment to the Amended and Restated Bylaws of Janus Capital Group Inc. is hereby incorporated by reference from Exhibit 3.2 to JCG's Current Report on Form 8-K, dated May 18, 2012 (File No. 001-15253) |
|
3.2.2 |
Second Amendment to the Amended and Restated Bylaws of Janus Capital Group Inc. is hereby incorporated by reference from Appendix A to JCG's 2016 Proxy Statement on Schedule 14A (File No. 001-15253) * |
|
3.3 |
Certificate of Ownership and Merger, merging Janus Capital Corporation with and into Stilwell Financial Inc., is hereby incorporated by reference from Exhibit 3.1 to JCG's Registration Statement on Form S-4 declared effective on February 11, 2003 (File No. 333-102783) |
|
(4) Instruments Defining the Rights of Security Holders, Including Indentures |
||
4.1 |
Form of Certificate representing Common Stock is hereby incorporated by reference from Exhibit 4.1 to JCG's Registration Statement on Form 10 declared effective on June 15, 2000 (File No. 001-15253) |
108
| 4.2 | Article FOURTH, Article FIFTH, Article SIXTH, Article SEVENTH and Article ELEVENTH of Exhibit 3.1.1 above are hereby incorporated by reference | |
4.3 |
Article II; Article III, Section 2; and Article V of Exhibit 3.2 above are hereby incorporated by reference |
|
4.5 |
Indenture dated as of November 6, 2001 (2001 Indenture), between Janus Capital Group Inc. and The Bank of New York Trust Company N.A. (as successor to The Chase Manhattan Bank), is hereby incorporated by reference from Exhibit 4.1 to JCG's Current Report on Form 8-K, dated November 6, 2001 (File No. 001-15253) |
|
4.5.1 |
First Supplemental Indenture to the 2001 Indenture, dated as of June 14, 2007, between the Company and The Bank of New York Trust Company, N.A. (as successor to the Chase Manhattan Bank), is hereby incorporated by reference from Exhibit 4.5 to JCG's Current Report on Form 8-K, dated June 14, 2007 (File No. 001-15253) |
|
4.5.2 |
Second Supplemental Indenture to the 2001 Indenture, dated July 21, 2009, between Janus Capital Group Inc. and The Bank of New York Mellon Trust Company, N.A., is hereby incorporated by reference from Exhibit 4.2 to JCG's Current Report on Form 8-K, dated July 23, 2009 (File No. 001-15253) |
|
4.5.3 |
Officers' Certificate pursuant to the 2001 Indenture (as per Exhibit 4.5.1 above) is hereby incorporated by reference from Exhibit 4.2 to JCG's Current Report on Form 8-K, dated November 6, 2001 (File No. 001-15253) |
|
4.5.4 |
Third Supplemental Indenture to the 2001 Indenture, dated June 19, 2013, between Janus Capital Group Inc. and The Bank of New York Mellon Trust Company N.A., is hereby incorporated by reference from Exhibit 4.5.4 to JCG's Annual Report on Form 10-K for the year ended December 31, 2013 (File No. 001-15253) |
|
4.8 |
6.700% Senior Notes Due 2017 Prospectus Supplement (to Prospectus dated June 5, 2007) is hereby incorporated by reference from Form 424B5, filed June 11, 2007 (File No. 333-143510) |
|
4.9.1 |
Officers' Certificate pursuant to the Indenture establishing the terms of the 2017 Senior Notes (as per Exhibit 4.8 above) is hereby incorporated by reference from Exhibit 4.2 to JCG's Current Report on Form 8-K, dated June 14, 2007 (File No. 001-15253) |
|
4.10 |
Form of 0.75% Convertible Senior Notes due 2018, is hereby incorporated by reference from Exhibit 4.10.1 to JCG's Annual Report on Form 10-K for the year ended December 31, 2013 (File No. 001-15253) |
|
4.10.1 |
Officers' Certificate pursuant to the Indenture establishing the terms of the 2018 Notes (as per Exhibit 4.10 above) is hereby incorporated by reference from Exhibit 4.10.1 to JCG's Annual Report on Form 10-K for the year ended December 31, 2013 (File No. 001-15253) |
|
4.11 |
4.875% Senior Notes Due 2025 Prospectus Supplement (to Prospectus dated March 14, 2013) is hereby incorporated by reference from Form 424B5 filed July 30, 2015 (File No. 333-187263) |
|
4.11.1 |
Officer's Certificate pursuant to the Indenture establishing the terms of the 2025 Senior Notes is hereby incorporated by reference from Exhibit 4.1 to JCG's Current Report on Form 8-K, dated July 28, 2015 (File No. 001-15253) |
|
4.11.2 |
Form of Global Notes for the 2025 Senior Notes is hereby incorporated by reference from Exhibit 4.2 to JCG's Current Report on Form 8-K, dated July 31, 2015 (File No. 001-15253) |
109
| (10) Material Contracts | ||
10.1 |
Representative Director Indemnification Agreement is hereby incorporated by reference from Exhibit 10.1 to JCG's Registration Statement on Form 10 declared effective on June 15, 2000 (File No. 001-15253) |
|
10.2 |
$200 million Five-Year Unsecured Revolving Credit Facility Agreement, dated as of November 25, 2013, among Janus Capital Group Inc., the lenders party thereto, JPMorgan Chase Bank, N.A., as administrative agent, and Wells Fargo Bank, National Association as syndication agent, is hereby incorporated by reference from Exhibit 10.2 to JCG's Annual Report on Form 10-K for the year ended December 31, 2013 (File No. 001-15253) |
|
10.3 |
Amended and Restated Limited Liability Company Agreement of Janus Capital Management LLC, dated as of March 13, 2002, is hereby incorporated by reference to JCG's Annual Report on Form 10-K for the year ended December 31, 2002 (File No. 001-15253) |
|
10.4 |
Janus Capital Group Inc. Amended and Restated 2004 Employment Inducement Award Plan, effective as of January 22, 2008, is hereby incorporated by reference from Exhibit 10.2 to JCG's Form 10-Q for the quarterly period ended September 30, 2008 (File No. 001-15253)* |
|
10.5 |
Janus Capital Group Inc. 2012 Employment Inducement Award Plan, effective as of January 24, 2012, and amended and restated effective November 28, 2014 is hereby incorporated by reference from Exhibit 4.1 to JCG's Form S-8 filed on December 1, 2014 (File No. 333-200662)* |
|
10.6 |
Janus Capital Group Inc. Second Amended and Restated Mutual Fund Share Investment Plan, effective July 22, 2013, is hereby incorporated by reference from Exhibit 10.9.1 to JCG's Annual Report on Form 10-K for the year ended December 31, 2013 (File No. 001-15253) |
|
10.7 |
Janus Capital Group Inc. Management Incentive Compensation Plan, effective January 1, 2013, is hereby incorporated by reference from Appendix A to JCG's 2013 Proxy Statement on Schedule 14A (File No. 001-15253)* |
|
10.8 |
Janus Capital Group Inc. 401(k) and Employee Stock Ownership Plan ("Janus 401(k) Plan"), as amended and restated effective January 1, 2014, is hereby incorporated by reference from Exhibit 10.8 to JCG's Annual Report on Form 10-K for the year ended December 31, 2014 (File No. 001-15253) |
|
10.9.1 |
Amendment No. 1 to Janus 401(k) Plan, effective January 1, 2014, is hereby incorporated by reference from Exhibit 10.9 to JCG's Annual Report on Form 10-K for the year ended December 31, 2014 (File No. 001-15253) |
|
10.9.2 |
Amendment No. 2 to Janus 401(k) Plan, effective January 1, 2015, is hereby incorporated by reference from Exhibit 10.9.2 to JCG's Annual Report on Form 10-K for the year ended December 31, 2015 (File No. 001-15253) |
|
10.9.3 |
Amendment No. 3 to Janus 401(k) Plan, effective January 1, 2016, is hereby incorporated by reference from Exhibit 10.9.3 to JCG's Annual Report on Form 10-K for the year ended December 31, 2015 (File No. 001-15253) |
|
10.9.4 |
Amendment No. 4 to Janus 401(k) Plan, effective July 22, 2016, is attached to this Form 10-K as Exhibit 10.9.4 |
110
| 10.9.5 | Amendment No. 5 to Janus 401(k) Plan, effective September 1, 2016, is attached to this Form 10-K as Exhibit 10.9.5 | |
10.9.6 |
Amendment No. 6 to Janus 401(k) Plan, effective August 31, 2016, is attached to this Form 10-K as Exhibit 10.9.6 |
|
10.10 |
Janus Capital Group Inc. Amended and Restated Income Deferral Program, effective as of January 22, 2008, is hereby incorporated by reference from Exhibit 10.1 to JCG's Form 10-Q for the quarterly period ended September 30, 2008 (File No. 001-15253)* |
|
10.11 |
Amendment No. 1 to the Janus Capital Group Inc. Amended and Restated Income Deferral Program, effective July 19, 2010, is hereby incorporated by reference from Exhibit 10.4 to JCG's 10-Q for the quarterly period ended June 30, 2010 (File No. 001-15253)* |
|
10.11.1 |
Amendment No. 2 to the Janus Capital Group Inc. Amended and Restated Income Deferral Program, effective December 12, 2016, is attached to this Form 10-K as Exhibit 10.11.1 |
|
10.12 |
Janus Capital Group Inc. Amended and Restated Directors' Deferred Fee Plan, effective as of October 20, 2008, is hereby incorporated by reference from Exhibit 10.3 to JCG's Form 10-Q for the quarterly period ended September 30, 2008 (File No. 001-15253)* |
|
10.12.1 |
Amendment to Amended and Restated Directors' Deferred Fee Plan, effective as of December 19, 2013, is hereby incorporated by reference from Exhibit 10.15.1 to JCG's Annual Report on Form 10-K for the year ended December 31, 2013 (File No. 001-15253)* |
|
10.12.2 |
Amendment No. 2 to Amended and Restated Directors' Deferred Fee Plan, effective as of December 12, 2016, is attached to this Form 10-K as Exhibit 10.12.2 |
|
10.13.1 |
Form of Long-Term Incentive Acceptance Form with Appendix A (Restricted Stock), Appendix B (Stock Options) and Appendix C (Mutual Fund Units), effective for awards granted to executive officers in 2009, is hereby incorporated by reference from Exhibit 10.17.2 to JCG's Annual Report on Form 10-K for the year ended December 31, 2008 (File No. 001-15253)* |
|
10.13.2 |
Form of Long-Term Incentive Acceptance Form with Appendix A (Restricted Stock), Appendix B (Stock Options) and Appendix C (Mutual Fund Units), effective for awards granted to executive officers in 2010, is hereby incorporated by reference from Exhibit 10.17.3 to JCG's Annual Report on Form 10-K for the year ended December 31, 2009 (File No. 001-15253)* |
|
10.13.3 |
Form of Long-Term Incentive Acceptance Form for Restricted Stock and Mutual Fund Units, effective for awards granted to executive officers in 2011, is hereby incorporated by reference from Exhibit 10.7.5 to JCG's Annual Report on Form 10-K for the year ended December 31, 2010 (File No. 001-15253)* |
|
10.13.4 |
Form of Long-Term Incentive Acceptance Form for Stock Options, Restricted Stock and Mutual Fund Units, effective for awards granted to executive officers in 2012, is hereby incorporated by reference from Exhibit 10.16.4 to JCG's Annual Report on Form 10-K for the year ended December 31, 2011 (File No. 001-15253)* |
|
10.13.5 |
Form of Long-Term Incentive Acceptance Form for Restricted Stock, Stock Options and Mutual Fund Units, effective for awards granted to executive officers in 2013, is hereby incorporated by reference from Exhibit 10.16.5 to JCG's Annual Report on Form 10-K for the year ended December 31, 2012 (File No. 001-15253)* |
111
| 10.13.6 | Form of Performance Share Unit Award, effective for awards granted to the Company's Chief Executive Officer in 2013, is hereby incorporated by reference from Exhibit 10.16.7 to JCG's Annual Report on Form 10-K for the year ended December 31, 2013 (File No. 001-15253)* | |
10.13.7 |
Form of Performance Share Unit Award, effective for awards granted to the Company's Chief Executive Officer in 2014, is hereby incorporated by reference from Exhibit 10.13.7 to JCG's Annual Report on Form 10-K for the year ended December 31, 2014 (File No. 001-15253)* |
|
10.13.8 |
Form of Performance Share Unit Award, effective for awards granted to the Company's Chief Executive Officer in 2015, is hereby incorporated by reference from Exhibit 10.13.8 to JCG's Annual Report on Form 10-K for the year ended December 31, 2015 (File No. 001-15253)* |
|
10.13.9 |
Form of Performance Share Unit Award, effective for awards granted to the Company's Chief Executive Officer in 2016, is attached to this Form 10-K as Exhibit 10.13.9* |
|
10.14 |
Amended and Restated Janus Capital Group Inc. 2005 Long-Term Incentive Stock Plan, effective January 22, 2008, is hereby incorporated by reference from Exhibit 10.2 to JCG's Annual Report on Form 10-K for the year ended December 31, 2007 (File No. 001-15253)* |
|
10.15 |
Janus Capital Group Inc. Amended and Restated 2010 Long-Term Incentive Stock Plan, effective July 22, 2013, is hereby incorporated by reference from Exhibit 10.18.3 to JCG's Annual Report on Form 10-K for the year ended December 31, 2013 (File No. 001-15253)* |
|
10.15.1 |
Amendment to the Amended and Restated 2010 Long-Term Incentive Stock Plan, effective April 24, 2015, is hereby incorporated by reference from Appendix A to JCG's 2015 Proxy Statement on Schedule 14A (File No. 001-15253)* |
|
10.16 |
Change in Control Agreement by and between Janus Capital Group Inc. and Richard M. Weil, dated February 1, 2010, is hereby incorporated by reference from Exhibit 10.2 to JCG's Form 8-K, dated February 4, 2010 (File No. 001-15253)* |
|
10.17 |
Change in Control Agreement by and between Jennifer McPeek and Janus Management Holdings Corporation, dated November 22, 2016, is attached to this Form 10-K as Exhibit 10.17 |
|
10.18 |
Summary of Janus Capital Group Inc. Outside Director Compensation Program effective May 1, 2015, is hereby incorporated by reference from Exhibit 10.17 to JCG's Annual Report on Form 10-K for the year ended December 31, 2015 (File No. 001-15253)* |
|
10.19 |
Offer letter for Richard M. Weil dated January 6, 2010, is hereby incorporated by reference from Exhibit 10.30 to JCG's Annual Report on Form 10-K for the year ended December 31, 2009 (File No. 001-15253)* |
|
10.20 |
Janus Capital Variable Compensation Program, dated January 1, 2015, is hereby incorporated by reference from Exhibit 10.19 to JCG's Annual Report on Form 10-K for the year ended December 31, 2015 (File No. 001-15253)* |
|
10.21 |
Investment and Strategic Cooperation Agreement by and between Janus Capital Group Inc. and The Dai-Ichi Life Insurance Company, Limited, dated August 10, 2012, is hereby incorporated by reference from Exhibit 10.1 to JCG's Current Report on Form 8-K, dated August 10, 2012 (File No. 001-15253) |
112
| 10.21.1 | Voting and Support Agreement, dated October 3, 2016, by and among Janus Capital Group Inc., Henderson Group plc and Dai-ichi Life Holdings, Inc., is hereby incorporated by reference from Exhibit 10.1 to JCG's Current Report on Form 8-K, dated October 3, 2016 (File No. 001-15253) | |
10.21.2 |
Amended and Restated Investment and Strategic Cooperation Agreement, dated October 3, 2016, by and among Janus Capital Group Inc., Henderson Group plc and Dai-ichi Life Holdings, Inc., is hereby incorporated by reference from Exhibit 10.1 to JCG's Current Report on Form 8-K, dated October 3, 2016 (File No. 001-15253) |
|
*Compensatory plan or agreement. |
||
(12) Statements Re: Computation of Ratios |
||
12.1 |
The Computation of Ratio of Earnings to Fixed Charges prepared pursuant to Item 601(b)(12) of Regulation S-K is attached to this Annual Report on Form 10-K as Exhibit 12.1 |
|
(21) Subsidiaries of the Company |
||
21.1 |
The List of the Subsidiaries of the Company prepared pursuant to Item 601(b)(21) of Regulation S-K is attached to this Annual Report on Form 10-K as Exhibit 21.1 |
|
(23) Consents of Experts and Counsel |
||
23.1 |
The Consent of Independent Registered Public Accounting Firm prepared pursuant to Item 601(b)(23) of Regulation S-K is attached to this Annual Report on Form 10-K as Exhibit 23.1 |
|
(31) Rule 13a-14(a)/15d-14(a) Certifications |
||
31.1 |
Certification of Richard M. Weil, Chief Executive Officer of Registrant |
|
31.2 |
Certification of Jennifer J. McPeek, Executive Vice President and Chief Financial Officer of Registrant |
|
(32) Section 1350 Certificates |
||
32.1 |
Certification of Richard M. Weil, Chief Executive Officer of Registrant, pursuant to 18 U.S.C. Section 1350, as adopted pursuant to Section 906 of the Sarbanes-Oxley Act of 2002 |
|
32.2 |
Certification of Jennifer J. McPeek, Executive Vice President and Chief Financial Officer of Registrant, pursuant to 18 U.S.C. Section 1350, as adopted pursuant to Section 906 of the Sarbanes-Oxley Act of 2002 |
|
(100) XBRL Exhibits |
||
101.INS |
XBRL Insurance Document |
|
101.SCH |
XBRL Taxonomy Extension Schema Document |
|
101.CAL |
XBRL Taxonomy Extension Calculation Linkbase Document |
|
101.DEF |
XBRL Taxonomy Extension Definition Linkbase Document |
|
101.LAB |
XBRL Taxonomy Extension Label Linkbase Document |
|
101.PRE |
XBRL Taxonomy Extension Presentation Linkbase Document |
113
(c) Exhibits
JANUS CAPITAL GROUP INC.
2016 FORM 10-K ANNUAL REPORT
INDEX TO EXHIBITS
| Exhibit No. | Document | Regulation S-K Item 601(b) Exhibit No. |
||
|---|---|---|---|---|
| 10.9.4 | Amendment No. 4 to Janus 401(k) Plan, effective July 22, 2016, is attached to this Form 10-K as Exhibit 10.9.4 | 10 | ||
10.9.5 |
Amendment No. 5 to Janus 401(k) Plan, effective September 1, 2016, is attached to this Form 10-K as Exhibit 10.9.5 |
10 |
||
10.9.6 |
Amendment No. 6 to Janus 401(k) Plan, effective August 31, 2016, is attached to this Form 10-K as Exhibit 10.9.6 |
10 |
||
10.11.1 |
Amendment No. 2 to the Janus Capital Group Inc. Amended and Restated Income Deferral Program, effective December 12, 2016, is attached to this Form 10-K as Exhibit 10.11.1 |
10 |
||
10.12.2 |
Amendment No. 2 to Amended and Restated Directors' Deferred Fee Plan, effective as of December 12, 2016, is attached to this Form 10-K as Exhibit 10.12.2 |
10 |
||
10.13.9 |
Form of Performance Share Unit Award, effective for awards granted to the Company's Chief Executive Officer in 2016, is attached to this Form 10-K as Exhibit 10.13.9* |
10 |
||
10.17 |
Change in Control Agreement by and between Jennifer McPeek and Janus Management Holdings Corporation, dated November 22, 2016, is attached to this Form 10-K as Exhibit 10.17 |
10 |
||
12.1 |
The Computation of Ratio of Earnings to Fixed Charges prepared pursuant to Item 601(b)(12) of Regulation S-K |
12 |
||
21.1 |
The List of the Subsidiaries of the Company prepared pursuant to Item 601(b)(21) of Regulation S-K |
21 |
||
23.1 |
The Consent of Independent Registered Public Accounting Firm — Deloitte & Touche LLP |
23 |
||
31.1 |
Certification of Richard M. Weil, Chief Executive Officer of Registrant |
31 |
||
31.2 |
Certification of Jennifer J. McPeek, Executive Vice President and Chief Financial Officer of Registrant |
31 |
||
32.1 |
Certification of Richard M. Weil, Chief Executive Officer of Registrant, pursuant to 18 U.S.C. Section 1350, as adopted pursuant to Section 906 of the Sarbanes-Oxley Act of 2002 |
32 |
||
32.2 |
Certification of Jennifer J. McPeek, Executive Vice President and Chief Financial Officer of Registrant, pursuant to 18 U.S.C. Section 1350, as adopted pursuant to Section 906 of the Sarbanes-Oxley Act of 2002 |
32 |
||
101.INS |
XBRL Insurance Document |
101 |
114
| Exhibit No. | Document | Regulation S-K Item 601(b) Exhibit No. |
||
|---|---|---|---|---|
| 101.SCH | XBRL Taxonomy Extension Schema Document | 101 | ||
101.CAL |
XBRL Taxonomy Extension Calculation Linkbase Document |
101 |
||
101.DEF |
XBRL Taxonomy Extension Definition Linkbase Document |
101 |
||
101.LAB |
XBRL Taxonomy Extension Label Linkbase Document |
101 |
||
101.PRE |
XBRL Taxonomy Extension Presentation Linkbase Document |
101 |
115
Pursuant to the requirements of Section 13 or 15(d) of the Securities Exchange Act of 1934, the Registrant has duly caused this report to be signed on its behalf by the undersigned, thereunto duly authorized.
| Janus Capital Group Inc. | ||||
By: |
/s/ RICHARD M. WEIL Richard M. Weil Chief Executive Officer |
|||
February 16, 2017
The officers and directors of Janus Capital Group Inc., whose signatures appear below, hereby constitute and appoint David W. Grawemeyer or Jennifer J. McPeek, and each of them (with full power to each of them to act alone), the true and lawful attorney-in-fact to sign and execute, on behalf of the undersigned, any amendment(s) to this Form 10-K Annual Report for the year ended December 31, 2016, and any instrument or document filed as part of, as an exhibit to or in connection with any amendment, and each of the undersigned does hereby ratify and confirm as his or her own act and deed all that said attorneys shall do or cause to be done by virtue thereof.
Pursuant to the requirements of the Securities Exchange Act of 1934, this report has been signed below by the following persons on behalf of the Registrant and in the capacities indicated on February 16, 2017.
Signature
|
Title
|
|
|---|---|---|
| /s/ RICHARD M. WEIL Richard M. Weil |
Director and Chief Executive Officer (Principal Executive Officer) |
|
/s/ JENNIFER J. MCPEEK Jennifer J. McPeek |
Executive Vice President and Chief Financial Officer (Principal Financial Officer) |
|
/s/ BRENNAN A. HUGHES Brennan A. Hughes |
Senior Vice President, Chief Accounting Officer and Treasurer (Principal Accounting Officer) |
|
/s/ GLENN S. SCHAFER Glenn S. Schafer |
Chairman of the Board |
|
/s/ JEFFREY J. DIERMEIER Jeffrey J. Diermeier |
Director |
|
/s/ EUGENE FLOOD, JR. Eugene Flood, Jr. |
Director |
116
Signature
|
Title
|
|
|---|---|---|
| /s/ RICHARD FREDERICKS Richard Fredericks |
Director | |
/s/ DEBORAH R. GATZEK Deborah R. Gatzek |
Director |
|
/s/ LAWRENCE E. KOCHARD Lawrence E. Kochard |
Director |
|
/s/ ARNOLD A. PINKSTON Arnold A. Pinkston |
Director |
|
/s/ BILLIE I. WILLIAMSON Billie I. Williamson |
Director |
|
/s/ TATSUSABURO YAMAMOTO Tatsusaburo Yamamoto |
Director |
117