Attached files
| file | filename |
|---|---|
| EX-32.2 - EXHIBIT 32.2 - Sierra Income Corp | sic-ex312x1231x16.htm |
| EX-32.1 - EXHIBIT 32.1 - Sierra Income Corp | sic-ex321x123116.htm |
| EX-31.1 - EXHIBIT 31.1 - Sierra Income Corp | sic-ex311x123116.htm |
| EX-21.1 - EXHIBIT 21.1 - Sierra Income Corp | sic-ex211x123116.htm |
UNITED STATES
SECURITIES AND EXCHANGE COMMISSION
WASHINGTON, DC 20549
_____________________________________________________
Form 10-K
_____________________________________________________
(Mark One)
x | ANNUAL REPORT PURSUANT TO SECTION 13 OR 15(d) OF THE SECURITIES EXCHANGE ACT OF 1934 |
For the fiscal year ended December 31, 2016
or
o | TRANSITION REPORT PURSUANT TO SECTION 13 OR 15(d) OF THE SECURITIES EXCHANGE ACT OF 1934 |
For the transition period from to
Commission file number: 814-00924
_____________________________________________________
Sierra Income Corporation
(Exact Name of Registrant as Specified in its Charter)
_____________________________________________________
Maryland | 45-2544432 | |
(State or Other Jurisdiction of Incorporation or Organization) | (I.R.S. Employer Identification No.) | |
280 Park Avenue, 6th Floor East, New York, NY 10017 | 10017 | |
(Address of Principal Executive Offices) | (Zip Code) | |
(212) 759-0777
(Registrant’s Telephone Number, Including Area Code)
___________________________________________________
Securities registered pursuant to Section 12(b) of the Act:
None
Securities registered pursuant to Section 12(g) of the Act:
Common Stock, par value $0.001 per share
_____________________________________________________
Indicate by check mark if the registrant is a well-known seasoned issuer, as defined in Rule 405 of the Securities Act. Yes o No x
Indicate by check mark if the registrant is not required to file reports pursuant to Section 13 or 15(d) of the Act. Yes o No x
Indicate by check mark whether the registrant: (1) has filed all reports required to be filed by Section 13 or 15(d) of the Securities Exchange Act of 1934 during the preceding 12 months (or for such shorter period that the registrant was required to file such reports), and (2) has been subject to such filing requirements for the past 90 days. Yes x No ¨
Indicate by check mark if disclosure of delinquent filers pursuant to Item 405 of Regulation S-K is not contained herein, and will not be contained, to the best of the registrant’s knowledge, in definitive proxy or information statements incorporated by reference in Part III of this Form 10-K or any amendment to this Form 10-K. x
Indicate by check mark whether the registrant has submitted electronically and posted on its corporate Web site, if any, every Interactive Data File required to be submitted and posted pursuant to Rule 405 of Regulation S-T (§232.405 of this chapter) during the preceding 12 months (or for such shorter period that the registrant was required to submit and post such files). Yes o No o
Indicate by check mark whether the registrant is a large accelerated filer, an accelerated filer, a non-accelerated filer or a smaller reporting company. See definitions of “large accelerated filer”, “accelerated filer” and “smaller reporting company” in Rule 12b-2 of the Exchange Act. (Check one):
Large accelerated filer | o | Accelerated filer | o | |||
Non-accelerated filer | x | Smaller reporting company | o | |||
Indicate by check mark whether the registrant is a shell company (as defined in Rule 12b-2 of the Securities Exchange Act of 1934). Yes o No x
There is no established market for the Registrant’s shares of common stock. The Registrant is currently conducting an ongoing public offering of its shares of common stock pursuant to a Registration Statement on Form N-2, which shares are being sold at a price of $9.05 per share, with discounts available for certain categories of purchasers, or at a price necessary to ensure that shares are not sold at a price per share, after deduction of selling commissions and dealer manager fees, that is below net asset value per share.
As of March 6, 2017, the Registrant had 95,838,652 shares of common stock, $0.001 par value, outstanding.
_____________________________________________________
DOCUMENTS INCORPORATED BY REFERENCE
Portions of the registrant’s proxy statement to be filed with the Securities and Exchange Commission pursuant to Regulation 14A in connection with the registrant’s 2017 Annual Meeting of Stockholders, which will be filed subsequent to the date hereof, are incorporated by reference into Part III of this Form 10-K. Such proxy statement will be filed with the Securities and Exchange Commission not later than 120 days following the end of the Registrant’s fiscal year ended December 31, 2016.
SIERRA INCOME CORPORATION
TABLE OF CONTENTS
Page | |
2
PART I
In this annual report on Form 10-K, except as otherwise indicated, the terms:
• | “we”, “us”, “our”, “Sierra” and the “Company” refer to Sierra Income Corporation, a Maryland corporation. |
• | “SIC Advisors” and the “Advisor” refer to SIC Advisors LLC, our investment advisor. SIC Advisors is a majority owned subsidiary of Medley LLC, which is controlled by Medley Management Inc., a publicly traded asset management firm, which in turn is controlled by Medley Group LLC, an entity wholly-owned by the senior professionals of Medley LLC. |
• | “Medley” refers, collectively, to the activities and operations of Medley Capital LLC, Medley LLC, Medley Management Inc., Medley Group LLC, associated investment funds and their respective affiliates. |
Item 1. Business
GENERAL
Sierra Income Corporation is a non-diversified closed-end management investment company incorporated in Maryland that has elected to be treated and is regulated as a business development company (“BDC”) under the Investment Company Act of 1940, as amended (the “1940 Act”). The Company has elected and qualified to be treated for U.S. federal income tax purposes as a regulated investment company (“RIC”) under subchapter M of the Internal Revenue Code of 1986, as amended (the “Code”), and expects to continue to operate in a manner such as to qualify for the tax treatment applicable to RICs. We are externally managed and advised by our investment adviser, SIC Advisors LLC (“SIC Advisors”) pursuant to an investment advisory agreement (the "Investment Advisory Agreement").
Our investment objective is to generate current income, and to a lesser extent, long-term capital appreciation. We intend to meet our investment objective by primarily lending to, and investing in, the debt of privately owned U.S. middle market companies, which we define as companies with annual revenue between $50 million and $1 billion. We intend to focus primarily on making investments in first lien senior secured debt, second lien secured debt, and to a lesser extent, subordinated debt, of middle market companies in a broad range of industries. We expect that the majority of our debt investments will bear interest at floating interest rates, but our portfolio may also include fixed-rate investments. We will originate transactions sourced through SIC Advisors’ existing network, and, to a lesser extent, expect to acquire debt securities through the secondary market. We may make equity investments in companies that we believe will generate appropriate risk adjusted returns, although we do not expect such investments to be a substantial portion of our portfolio.
Our Advisor
Our investment activities are managed by our investment adviser, SIC Advisors, which is a registered investment adviser under the Investment Advisers Act of 1940, as amended (the “Advisers Act”), and a majority owned subsidiary of Medley, LLC. SIC Advisors is responsible for sourcing potential investments, conducting due diligence on prospective investments, analyzing investment opportunities, structuring investments and monitoring our portfolio on an ongoing basis.
Our investment management team, which is provided by our Advisor (“SIC Advisors’ Investment Team” or the “Investment Team”), has on average over 20 years of experience in the credit business, including originating, underwriting, principal investing and loan structuring. Our Advisor, through Medley, has access to over 90 employees, including over 45 investment, origination and credit management professionals, and over 45 operations, marketing and distribution professionals, each with extensive experience in their respective disciplines.
Medley Capital LLC serves as our administrator provides office space to us and provides us with equipment and other office services. The responsibilities of our administrator include overseeing our financial records, preparing reports to our stockholders and reports filed with the Securities and Exchange Commission (the “SEC”) and generally monitoring the payment of our expenses and the performance of administrative and professional services rendered to us by others. See “Administration Agreement and Fees” below.
Formation
Sierra Income Corporation was incorporated under the general corporation laws of the State of Maryland on June 13, 2011.
On April 17, 2012, we successfully reached our minimum escrow requirement and officially commenced our operations by issuing 1,108,033 shares of common stock to SIC Advisors for gross proceeds of $10,000,000. Most recently, at a meeting held on March 1, 2017, our board of directors approved an extension of our offering for an additional year, which will extend the offering through April 17, 2018, unless further extended. As of March 6, 2017, we have sold a total of 95,838,652 shares of common stock for total gross proceeds of $906 million. The proceeds from the issuance of common stock are presented in our consolidated statements
3
of changes in net assets and consolidated statements of cash flows and are presented net of selling commissions and dealer manager fees.
Investment Process
We believe our Advisor, which is provided for by Medley, has cultivated a disciplined and repeatable process for executing, monitoring, structuring and exiting investments.
Identification and Sourcing. Our Advisor’s experience and reputation have allowed it to generate what we believe to be a substantial and continuous flow of attractive investment opportunities. Our Advisor maintains a strong and diverse network which results in sustained and high quality deal flow. We believe that the breadth and depth of experience of SIC Advisors’ Investment Team across strategies and asset classes, coupled with significant relationships built over the last 20 years, make them particularly qualified to uncover, evaluate and aggressively pursue what we believe to be attractive investment opportunities. We believe that SIC Advisors’ Investment Team, by leveraging the broader Medley platform deal flow network has compiled a robust pipeline of transactions ready for possible inclusion in our portfolio.
Disciplined Underwriting. SIC Advisors’ Investment Team performs thorough due diligence and focuses on several key criteria in its underwriting process, including strong underlying business fundamentals, a meaningful equity cushion, experienced management, conservative valuation and the ability to deleverage through cash flows. We expect to often be the agent for the loans we originate and accordingly control the loan documentation and negotiation of covenants, which will allow us to maintain consistent underwriting standards. Our Advisor’s underwriting process also involves engagement of industry experts and third party consultants.
Prior to making an investment, the Investment Team subjects each potential borrower to an extensive credit review process, which typically begins with an analysis of the market opportunity, business fundamentals, company operating metrics and historical and projected financial analysis. The Investment Team also compares liquidity, operating margin trends, leverage, free cash flow and fixed charge coverage ratios for each potential investment to industry metrics. Areas of additional underwriting focus include management or sponsor (typically a private equity firm) experience, management compensation, competitive landscape, regulatory environment, pricing power, defensibility of market share and tangible asset values. Background checks are conducted and tax compliance information may also be requested on management teams and key employees. In addition, the Investment Team contacts customers, suppliers and competitors and performs on-site visits as part of a routine business due diligence process.
The Investment Team routinely uses third party consultants and market studies to corroborate valuation and industry specific due diligence, as well as provide quality of earnings analysis. Experienced legal counsel is engaged to evaluate and mitigate regulatory, insurance, tax or other company-specific risks.
After the Investment Team completes its final due diligence, each proposed investment is presented to our Advisor’s investment committee (the “Investment Committee”) and subjected to extensive discussion and follow-up analysis, if necessary. A formal memorandum for each investment opportunity typically includes the results of business due diligence, multi-scenario financial analysis, risk-management assessment, results of third-party consulting work, background checks (where applicable) and structuring proposals. Our Advisor’s Investment Committee requires a majority vote to approve any investment, although unanimous agreement is sought.
Active Credit Management. Our Advisor employs active credit management. Our Advisor’s process includes frequent interaction with management, monthly or quarterly review of financial information and attendance at board of directors’ meetings as observers. The Investment Team also evaluates financial reporting packages provided by portfolio companies that detail operational and financial performance. Data is entered in our Advisor’s Asset Management System (“AMS”), its proprietary, centralized electronic credit management database. AMS creates a centralized, dynamic electronic repository for all of our portfolio company data. Our Advisor’s AMS system generates comprehensive, standardized reports which aggregate operational updates, portfolio company financial performance, asset valuations, macro trends, management call notes and account history. AMS enables the Investment Team to have real-time access to the most recent information on our portfolio investments.
In addition to the data provided by our borrowers, our Advisor may also utilize various third parties to provide checks and balances throughout the credit management process. Independent valuation firms may be engaged to provide appraisals of asset and collateral values or external forensic accounting groups may be engaged to verify portfolio company financial reporting or perform cash reconciliation. Our Advisor believes this hands-on approach to credit management is a key contributor to our investment performance.
4
Investment Structure
For newly originated investments, SIC Advisors strives to negotiate an optimal combination of current and deferred interest payments, equity participation and prepayment penalties, along with suitable covenants and creditor rights which will generally be greater than the rights normally obtained by institutional investors in comparable transactions and may include such provisions as: specific rights to consult with and advise management, the right to inspect company books, records or facilities, as well as the right to review balance sheets and/or statements of income and cash flows of the company. SIC Advisors determines whether the investment structure, particularly the amount of debt, is appropriate for the portfolio company’s business, sometimes reassessing the investment’s risk/return profile and adjusting pricing and other terms as necessary. The Investment Team has in-depth restructuring, liquidation and bankruptcy experience which is vital to success as a lender over market cycles.
Investment Committee
The purpose of the Investment Committee is to evaluate and approve all investments by SIC Advisors’ Investment Team. The Investment Committee is comprised of members selected from senior members of SIC Advisors’ Investment Team. Approval of an investment requires a majority vote of the Investment Committee, although unanimous agreement is sought. The committee process is intended to bring the diverse experience and perspectives of the committee members to the analysis and consideration of every investment. The Investment Committee also serves to provide consistency and adherence to SIC Advisors’ investment philosophies and policies. The Investment Committee also determines appropriate investment sizing and suggests ongoing monitoring requirements.
In addition to reviewing investments, the Investment Committee meetings serve as a forum to discuss credit views and outlooks. Potential transactions and deal flow are also reviewed on a regular basis. Members of the Investment Committee are encouraged to share information and views on credits with the committee early in their analysis and throughout the evaluation process. This process improves the quality of the analysis and assists the deal team members to work more efficiently.
Managerial Assistance
As a BDC, we offer, and must provide upon request, managerial assistance to certain of our portfolio companies. This assistance could involve, among other things, monitoring the operations of our portfolio companies, participating in board and management meetings, consulting with and advising officers of portfolio companies and providing other organizational and financial guidance. We may receive fees for these services and will reimburse Medley, as our administrator, for its allocated costs in providing such assistance subject to review and approval by our board of directors. Medley will provide such managerial assistance on our behalf to portfolio companies that request this assistance.
Competition
Our primary competitors to provide financing to private and middle-market companies are public and private funds, commercial banks, commercial finance companies, other BDCs, small business investment companies (“SBIC”) and private equity and hedge funds. Some competitors may have access to funding sources that are not available to us. In addition, some of our competitors may have higher risk tolerances or different risk assessments, which could allow them to consider a wider variety of investments and establish more relationships than us. Furthermore, many of our competitors are not subject to the regulatory restrictions that the 1940 Act imposes on us as a BDC or to the distribution and other requirements we must satisfy to maintain our favorable RIC tax status.
Staffing
We do not currently have any employees and do not expect to have any employees. Services necessary for our business are provided by individuals who are employees of SIC Advisors and Medley, pursuant to the terms of the Investment Advisory Agreement and the Administration Agreement. Our day-to-day investment operations are managed by our Advisor. In addition, we reimburse Medley for our allocable portion of expenses incurred by it in performing its obligations under the administration agreement, including our allocable portion of the cost of our officers and their respective staffs.
Administration
We have entered into an administration agreement with Medley Capital LLC (the “Administration Agreement”) pursuant to which Medley Capital LLC furnishes us with administrative services necessary to conduct our day-to-day operations. Medley Capital LLC is reimbursed for administrative expenses it incurs on our behalf in performing its obligations. Such costs are reasonably allocated to us on the basis of assets, revenues, time records or other reasonable methods. We do not reimburse Medley Capital LLC for any services for which it receives a separate fee or for rent, depreciation, utilities, capital equipment or other administrative items allocated to a controlling person of Medley Capital LLC. Medley Capital LLC is an affiliate of SIC Advisors. See “Administration Agreement and Fees.”
5
Information Available
We maintain a website at http://www.sierraincomecorp.com. We make available, free of charge, on our website, our annual report on Form 10-K, quarterly reports on Form 10-Q, current reports on Form 8-K and amendments to those reports as soon as reasonably practicable after we electronically file such material with, or furnish it to, the SEC. Information contained on our website is not incorporated by reference into this annual report on Form 10-K and you should not consider information contained on our website to be part of this annual report on Form 10-K or any other report we file with the SEC.
You may also read and copy any materials we file with the SEC at the SEC’s Public Reference Room located at 100 F Street, NE, Washington, DC 20549. You may obtain information on the operation of the Public Reference Room by calling the SEC at 1-800-SEC-0330. In addition, any materials we file with the SEC are available on the EDGAR Database on the SEC’s Internet site at http://www.sec.gov.
INVESTMENTS
We have built a portfolio that includes senior secured first lien term loans, senior secured second lien term loans, senior secured first lien notes and warrants/equity.
The following table shows the investment portfolio composition by industry grouping at fair value as of December 31, 2016, exclusive of the underlying total return swap portfolio:
Fair Value | Percentage | |||||
Services: Business | $ | 149,451,149 | 15.2 | % | ||
Multi-Sector Holdings | 130,182,237 | 13.3 | ||||
Banking, Finance, Insurance & Real Estate | 72,938,844 | 7.4 | ||||
Aerospace & Defense | 70,126,640 | 7.1 | ||||
Hotel, Gaming & Leisure | 69,640,838 | 7.1 | ||||
Healthcare & Pharmaceuticals | 69,382,894 | 7.1 | ||||
Retail | 61,292,231 | 6.2 | ||||
Construction & Building | 58,267,425 | 5.9 | ||||
Telecommunications | 37,580,414 | 3.8 | ||||
Energy: Oil & Gas | 33,048,939 | 3.4 | ||||
Transportation: Cargo | 28,493,057 | 2.9 | ||||
High Tech Industries | 25,888,925 | 2.6 | ||||
Automotive | 24,222,630 | 2.5 | ||||
Wholesale | 21,660,294 | 2.2 | ||||
Metals & Mining | 20,518,139 | 2.1 | ||||
Media: Advertising, Printing & Publishing | 19,306,587 | 2.0 | ||||
Beverage & Food | 19,282,080 | 2.0 | ||||
Media: Broadcasting & Subscription | 15,830,498 | 1.6 | ||||
Media: Diversified & Production | 15,733,786 | 1.6 | ||||
Chemicals, Plastics & Rubber | 15,726,190 | 1.6 | ||||
Capital Equipment | 12,088,629 | 1.2 | ||||
Transportation: Consumer | 7,280,374 | 0.7 | ||||
Services: Consumer | 5,201,522 | 0.5 | ||||
Total | $ | 983,144,322 | 100.0 | % | ||
The following table sets forth certain information for each portfolio company in which we had an investment as of December 31, 2016. Other than these portfolio investments, our only formal relationships with our portfolio companies are the managerial assistance that we may provide upon their request and the board observer or participation rights we may receive in connection with our investment portfolio.
6
Company(1) | Industry | Type of Investment | Maturity | Par Amount | Cost | Fair Value | % of Net Assets(2) | ||||||||||||
Non-controlled/non-affiliated investments – 114.5% | |||||||||||||||||||
AAAHI Acquisition Corporation | Transportation: Consumer | Senior Secured First Lien Term Loan LIBOR + 7.000%, 1.000% Floor(3)(4)(5) | 12/15/2021 | 7,280,374 | 7,280,374 | 7,280,374 | 0.9% | ||||||||||||
7,280,374 | 7,280,374 | 7,280,374 | |||||||||||||||||
AAR Intermediate Holdings, LLC | Energy: Oil & Gas | Senior Secured First Lien Term Loan LIBOR + 5.000%, 1.000% Floor(3) (4) (5) | 9/30/2021 | 150,935 | 150,935 | 150,935 | 0.0% | ||||||||||||
Senior Secured First Lien Term Loan LIBOR + 5.000%, 1.000% Floor(3) (4) | 9/30/2021 | 3,144,481 | 3,144,481 | 3,144,481 | 0.4% | ||||||||||||||
Senior Secured First Lien Term Loan LIBOR + 8.000%, 1.000% Floor, PIK(3) (4) | 9/30/2021 | 6,457,851 | 5,254,799 | 5,211,292 | 0.7% | ||||||||||||||
Membership Units (4) (6) (7) | — | — | — | 0.0% | |||||||||||||||
9,753,267 | 8,550,215 | 8,506,708 | |||||||||||||||||
Access Media Holdings, LLC | Media: Broadcasting & Subscription | Senior Secured First Lien Term Loan 5.000%, 5.000% PIK(4) | 7/22/2020 | 7,026,014 | 7,026,014 | 6,868,420 | 0.9% | ||||||||||||
Common Stock (4) (6) (7) | — | — | — | 0.0% | |||||||||||||||
Preferred Equity Series A (4) (6) (7) | — | 1,400,000 | — | 0.0% | |||||||||||||||
Preferred Equity Series AA (4) (6) (7) | — | 647,500 | — | 0.0% | |||||||||||||||
7,026,014 | 9,073,514 | 6,868,420 | |||||||||||||||||
Advanced Diagnostic Holdings, LLC | Healthcare & Pharmaceuticals | Senior Secured First Lien Term Loan LIBOR + 8.750%, 0.875% Floor(3) (4) | 12/11/2020 | 15,262,608 | 15,262,608 | 15,567,860 | 2.0% | ||||||||||||
15,262,608 | 15,262,608 | 15,567,860 | |||||||||||||||||
Alpha Media LLC | Media: Broadcasting & Subscription | Senior Secured First Lien Term Loan LIBOR 5 6.000%, 1.000% Floor(8)(5) | 2/25/2022 | 9,384,375 | 9,012,061 | 8,962,078 | 1.2% | ||||||||||||
9,384,375 | 9,012,061 | 8,962,078 | |||||||||||||||||
Amerijet Holdings Inc. | Transportation: Cargo | Senior Secured First Lien Term Loan LIBOR + 8.000%, 1.000% Floor(3) (4) | 7/15/2021 | 16,087,500 | 16,087,500 | 16,087,500 | 2.1% | ||||||||||||
16,087,500 | 16,087,500 | 16,087,500 | |||||||||||||||||
AMMC CLO 17, Limited Series 2015-17A | Multi-Sector Holdings | Subordinated Note 21.670% effective yield(6) (9) (10) | 11/15/2027 | 5,000,000 | 3,553,568 | 4,181,250 | 0.5% | ||||||||||||
5,000,000 | 3,553,568 | 4,181,250 | |||||||||||||||||
Anaren, Inc. | Aerospace & Defense | Senior Secured Second Lien Term Loan LIBOR + 8.250%, 1.000% Floor(3) | 8/18/2021 | 10,000,000 | 9,929,667 | 10,002,500 | 1.3% | ||||||||||||
10,000,000 | 9,929,667 | 10,002,500 | |||||||||||||||||
APCO Holdings, Inc. | Automotive | Senior Secured First Lien Term Loan LIBOR + 6.000%, 1.000% Floor(4) (8) | 1/31/2022 | 4,351,318 | 4,236,463 | 4,369,201 | 0.6% | ||||||||||||
4,351,318 | 4,236,463 | 4,369,201 | |||||||||||||||||
Apidos CLO XXIV, Series 2016-24A | Multi-Sector Holdings | Subordinated Note 16.535% effective yield(4) (6) (9) (10) | 1/20/2023 | 25,471,800 | 21,625,558 | 21,977,069 | 2.8% | ||||||||||||
25,471,800 | 21,625,558 | 21,977,069 | |||||||||||||||||
Associated Asphalt Partners, LLC | Chemicals, Plastics & Rubber | Senior Secured First Lien Note 8.500%(9) | 2/15/2018 | 1,778,000 | 1,782,303 | 1,795,780 | 0.2% | ||||||||||||
1,778,000 | 1,782,303 | 1,795,780 | |||||||||||||||||
Astro AB Borrower, Inc.(11) | Banking, Finance, Insurance & Real Estate | Senior Secured Second Lien Term Loan LIBOR + 8.750%, 1.000% Floor(3) | 4/30/2023 | 6,000,000 | 5,898,052 | 6,060,000 | 0.8% | ||||||||||||
6,000,000 | 5,898,052 | 6,060,000 | |||||||||||||||||
7
Asurion, LLC(11) | Banking, Finance, Insurance & Real Estate | Senior Secured Second Lien Term Loan LIBOR + 7.500%, 1.000% Floor(3) | 3/3/2021 | 7,000,000 | 6,952,364 | 7,087,500 | 0.9% | ||||||||||||
7,000,000 | 6,952,364 | 7,087,500 | |||||||||||||||||
Atrium Innovations, Inc. | Healthcare & Pharmaceuticals | Senior Secured Second Lien Term Loan LIBOR + 6.750%, 1.000% Floor(3) (6) | 8/13/2021 | 5,000,000 | 4,982,828 | 5,000,000 | 0.6% | ||||||||||||
5,000,000 | 4,982,828 | 5,000,000 | |||||||||||||||||
Aviation Technical Services, Inc. | Aerospace & Defense | Senior Secured Second Lien Term Loan LIBOR + 8.500%, 1.000% Floor(3)(4)(17) | 3/31/2022 | 25,000,000 | 25,000,000 | 25,500,000 | 3.3% | ||||||||||||
25,000,000 | 25,000,000 | 25,500,000 | |||||||||||||||||
Backcountry.com, LLC | Retail | Senior Secured First Lien Term Loan LIBOR + 7.250%, 1.000% Floor(3) (4) (17) | 6/30/2020 | 34,589,843 | 34,589,843 | 34,935,742 | 4.5% | ||||||||||||
34,589,843 | 34,589,843 | 34,935,742 | |||||||||||||||||
Birch Communications, Inc. | Telecommunications | Senior Secured First Lien Term Loan LIBOR + 7.250%, 1.000% Floor(4) (8) | 7/17/2020 | 13,816,112 | 13,647,092 | 13,633,601 | 1.8% | ||||||||||||
13,816,112 | 13,647,092 | 13,633,601 | |||||||||||||||||
Black Angus Steakhouses LLC | Hotel, Gaming & Leisure | Revolving Credit Facility LIBOR + 9.000%, 1.000% Floor(3) (4) (5) (17) | 4/24/2020 | 669,643 | 669,643 | 613,326 | 0.1% | ||||||||||||
Senior Secured First Lien Term Loan LIBOR + 9.000%, 1.000% Floor(3) (4) (17) | 4/24/2020 | 19,637,277 | 19,637,277 | 19,141,828 | 2.5% | ||||||||||||||
20,306,920 | 20,306,920 | 19,755,154 | |||||||||||||||||
Brundage-Bone Concrete Pumping, Inc. | Construction & Building | Senior Secured First Lien Note 10.375%(9) | 9/1/2021 | 7,500,000 | 7,607,418 | 8,025,000 | 1.0% | ||||||||||||
7,500,000 | 7,607,418 | 8,025,000 | |||||||||||||||||
Charming Charlie LLC | Retail | Senior Secured First Lien Term Loan LIBOR + 8.000%, 1.000% Floor(3) | 12/24/2019 | 7,908,765 | 7,920,847 | 6,334,209 | 0.8% | ||||||||||||
7,908,765 | 7,920,847 | 6,334,209 | |||||||||||||||||
ConvergeOne Holdings Corp.(11) | Telecommunications | Senior Secured Second Lien Term Loan LIBOR + 9.000%, 1.000% Floor(3) (4) | 6/17/2021 | 12,500,000 | 12,410,777 | 12,500,000 | 1.6% | ||||||||||||
12,500,000 | 12,410,777 | 12,500,000 | |||||||||||||||||
Cornerstone Chemical Company | Chemicals, Plastics & Rubber | Senior Secured First Lien Note 9.375%(9) | 3/15/2018 | 4,970,000 | 4,874,178 | 4,963,788 | 0.6% | ||||||||||||
4,970,000 | 4,874,178 | 4,963,788 | |||||||||||||||||
CP Opco, LLC | Services: Consumer | Revolver LIBOR + 4.500%, 1.000% Floor(3) (4) (5) | 3/31/2019 | 128,039 | 128,039 | 128,039 | 0.0% | ||||||||||||
Revolver ABR + 3.500%, 3.750% Floor(3) (4) (5) | 3/31/2019 | 210,935 | 210,935 | 210,935 | 0.0% | ||||||||||||||
Senior Secured First Lien Term Loan LIBOR + 6.500%, 1.000% Floor, PIK(3) (4) | 3/31/2019 | 504,597 | 504,597 | 504,597 | 0.1% | ||||||||||||||
Senior Secured First Lien Term Loan LIBOR + 6.500%, 1.000% Floor, PIK(3) (4) | 3/31/2019 | 210,249 | 210,249 | 210,249 | 0.0% | ||||||||||||||
Senior Secured First Lien Term Loan LIBOR + 9.500%, 1.000% Floor, PIK(3) (4) (12) | 3/31/2019 | 1,487,033 | 717,016 | 743,516 | 0.1% | ||||||||||||||
Preferred Units LIBOR + 9.500%, 1.000% Floor, PIK(4) (12) | 3/31/2019 | 205 | — | — | 0.0% | ||||||||||||||
Common Units (4) (7) | — | — | — | 0.0% | |||||||||||||||
2,541,058 | 1,770,836 | 1,797,336 | |||||||||||||||||
CRGT Inc. | High Tech Industries | Senior Secured First Lien Term Loan LIBOR + 6.500%, 1.000% Floor(4) (8) | 12/19/2020 | 3,966,456 | 3,966,456 | 3,966,456 | 0.5% | ||||||||||||
8
3,966,456 | 3,966,456 | 3,966,456 | |||||||||||||||||
DHISCO Electronic Distribution, Inc. | Hotel, Gaming & Leisure | Senior Secured First Lien Term Loan LIBOR + 6.500%, 1.500% Floor(3) (4) | 11/10/2019 | 2,380,952 | 2,380,952 | 2,380,952 | 0.3% | ||||||||||||
Senior Secured First Lien Term Loan LIBOR + 11.250% PIK, 1.500% Floor(3) (4) (12) | 11/10/2019 | 6,680,333 | 2,940,892 | 2,956,515 | 0.4% | ||||||||||||||
Senior Secured First Lien Term Loan LIBOR + 9.000% PIK, 1.500% Floor(3) (4) | 11/10/2019 | 8,369,792 | 8,369,792 | 8,369,792 | 1.1% | ||||||||||||||
Senior Secured First Lien Term Loan LIBOR + 10.250%, PIK 1.500% Floor(3) (4) | 11/10/2019 | 7,177,827 | 7,177,827 | 7,177,827 | 0.9% | ||||||||||||||
Common Units, Class A (4) (7) | — | 769,231 | — | 0.0% | |||||||||||||||
24,608,904 | 21,638,694 | 20,885,086 | |||||||||||||||||
Drew Marine Partners, LP | Transportation: Cargo | Senior Secured Second Lien Term Loan LIBOR + 7.000%, 1.000% Floor(3) | 5/19/2021 | 10,000,000 | 10,054,556 | 9,872,800 | 1.3% | ||||||||||||
10,000,000 | 10,054,556 | 9,872,800 | |||||||||||||||||
Dryden 38 Senior Loan Fund - Series 2015-38A | Multi-Sector Holdings | Subordinated Note 17.689% effective yield(6) (9) (10) | 7/15/2027 | 7,000,000 | 5,011,083 | 5,225,150 | 0.7% | ||||||||||||
7,000,000 | 5,011,083 | 5,225,150 | |||||||||||||||||
Dryden 43 Senior Loan Fund - Series 2016-43A | Multi-Sector Holdings | Subordinated Note 18.086% effective yield(4) (6) (9) (10) | 7/20/2029 | 3,620,000 | 2,932,200 | 3,250,579 | 0.4% | ||||||||||||
3,620,000 | 2,932,200 | 3,250,579 | |||||||||||||||||
Dryden 49 Senior Loan Fund | Multi-Sector Holdings | Preferred Shares(4) (6) | — | 14,500,000 | 14,500,000 | 1.9% | |||||||||||||
— | 14,500,000 | 14,500,000 | |||||||||||||||||
Dynamic Energy Services International LLC | Energy: Oil & Gas | Senior Secured First Lien Term Loan 13.500% PIK + LIBOR(4) (8) | 3/6/2018 | 8,662,161 | 8,662,161 | 7,373,318 | 1.0% | ||||||||||||
8,662,161 | 8,662,161 | 7,373,318 | |||||||||||||||||
EarthLink, Inc. | Telecommunications | Senior Secured First Lien Note 7.375%(6) (9) (13) | 6/1/2020 | 2,450,000 | 2,442,601 | 2,575,563 | 0.3% | ||||||||||||
2,450,000 | 2,442,601 | 2,575,563 | |||||||||||||||||
Elite Comfort Solutions LLC | Chemicals, Plastics & Rubber | Senior Secured First Lien Term Loan LIBOR + 6.500%, 1.000% Floor(3) (5) | 1/15/2021 | 8,858,643 | 8,858,643 | 8,966,622 | 1.2% | ||||||||||||
8,858,643 | 8,858,643 | 8,966,622 | |||||||||||||||||
First Boston Construction Holdings, LLC | Banking, Finance, Insurance & Real Estate | Senior Secured First Lien Note 12.000%(4) (5) | 12/31/2020 | 6,105,000 | 6,105,000 | 6,105,000 | 0.8% | ||||||||||||
Preferred Equity (4) (7) | — | 1,526,250 | 1,526,250 | 0.2% | |||||||||||||||
6,105,000 | 7,631,250 | 7,631,250 | |||||||||||||||||
FKI Security Group, LLC | Capital Equipment | Senior Secured First Lien Term Loan LIBOR + 8.500%, 1.000% Floor(3) (4) | 3/30/2020 | 11,937,500 | 11,937,500 | 12,088,629 | 1.6% | ||||||||||||
11,937,500 | 11,937,500 | 12,088,629 | |||||||||||||||||
Frontier Communications Corp. | Telecommunications | Senior Secured First Lien Note 10.500%(6) (9) (13) | 9/15/2022 | 2,000,000 | 2,000,000 | 2,107,500 | 0.3% | ||||||||||||
2,000,000 | 2,000,000 | 2,107,500 | |||||||||||||||||
Gastar Exploration Inc. | Energy: Oil & Gas | Senior Secured First Lien Note 8.625%(9) (13) | 5/15/2018 | 5,400,000 | 5,405,735 | 5,325,750 | 0.7% | ||||||||||||
5,400,000 | 5,405,735 | 5,325,750 | |||||||||||||||||
Genex Holdings, Inc.(11) | Banking, Finance, Insurance & Real Estate | Senior Secured Second Lien Term Loan LIBOR + 7.750%, 1.000% Floor(3) | 5/30/2022 | 9,500,000 | 9,525,097 | 9,500,000 | 1.2% | ||||||||||||
9,500,000 | 9,525,097 | 9,500,000 | |||||||||||||||||
GK Holdings, Inc. | Services: Business | Senior Secured Second Lien Term Loan LIBOR + 9.500%, 1.000% Floor(3) | 1/30/2022 | 10,000,000 | 10,000,000 | 10,200,000 | 1.3% | ||||||||||||
9
10,000,000 | 10,000,000 | 10,200,000 | |||||||||||||||||
Green Field Energy Services, Inc. | Energy: Oil & Gas | Senior Secured First Lien Note 13.000%(4) (9) (12) | 11/15/2016 | 766,615 | 754,615 | 157,156 | 0.0% | ||||||||||||
Warrants (4) (7) | — | 29,000 | — | 0.0% | |||||||||||||||
766,615 | 783,615 | 157,156 | |||||||||||||||||
HBC Holdings LLC | Wholesale | Senior Secured First Lien Term Loan LIBOR + 5.750%, 1.000% Floor(3) (4) | 3/30/2020 | 13,162,500 | 13,162,500 | 12,461,860 | 1.6% | ||||||||||||
13,162,500 | 13,162,500 | 12,461,860 | |||||||||||||||||
Heligear Acquisition Co. | Aerospace & Defense | Senior Secured First Lien Note 10.250%(4) (9) | 10/15/2019 | 15,000,000 | 15,000,000 | 15,785,550 | 2.0% | ||||||||||||
15,000,000 | 15,000,000 | 15,785,550 | |||||||||||||||||
Hill International, Inc. | Construction & Building | Senior Secured First Lien Term Loan LIBOR + 6.750%, 1.000% Floor(3) (4) (17) | 9/28/2020 | 16,617,500 | 16,617,500 | 16,617,500 | 2.2% | ||||||||||||
16,617,500 | 16,617,500 | 16,617,500 | |||||||||||||||||
Holland Acquisition Corp. | Energy: Oil & Gas | Senior Secured First Lien Term Loan LIBOR + 9.000%, 1.000% Floor(3) | 5/29/2018 | 4,515,605 | 4,482,170 | 2,791,682 | 0.4% | ||||||||||||
4,515,605 | 4,482,170 | 2,791,682 | |||||||||||||||||
Hylan Datacom & Electrical LLC | Construction & Building | Senior Secured First Lien Term Loan LIBOR + 7.500%, 1.000% Floor(3) (4) | 7/25/2021 | 15,799,862 | 15,799,862 | 15,799,862 | 2.0% | ||||||||||||
15,799,862 | 15,799,862 | 15,799,862 | |||||||||||||||||
Ignite Restaurant Group, Inc. | Hotel, Gaming & Leisure | Senior Secured First Lien Term Loan LIBOR + 7.000%, 1.000% Floor(3) | 2/13/2019 | 8,385,496 | 8,316,629 | 8,009,658 | 1.0% | ||||||||||||
8,385,496 | 8,316,629 | 8,009,658 | |||||||||||||||||
IHS Intermediate, Inc. | Services: Business | Senior Secured Second Lien Term Loan LIBOR + 8.250%, 1.000% Floor(3) | 7/20/2022 | 25,000,000 | 25,000,000 | 25,163,250 | 3.3% | ||||||||||||
25,000,000 | 25,000,000 | 25,163,250 | |||||||||||||||||
Impact Sales, LLC | Services: Business | Senior Secured First Lien Term Loan LIBOR + 7.000%, 1.000% Floor(3) (4) (5) | 12/30/2021 | 4,687,500 | 4,687,500 | 4,687,500 | 0.6% | ||||||||||||
4,687,500 | 4,687,500 | 4,687,500 | |||||||||||||||||
Interface Security Systems Holdings, Inc. | Services: Consumer | Senior Secured First Lien Note 9.250%(9) | 1/15/2018 | 3,417,000 | 3,434,380 | 3,404,186 | 0.4% | ||||||||||||
3,417,000 | 3,434,380 | 3,404,186 | |||||||||||||||||
Invision Diversified, LLC | Services: Business | Senior Secured First Lien Term Loan LIBOR + 9.000%, 1.000% Floor(3) (4) (17) | 6/30/2020 | 24,491,435 | 24,491,435 | 24,807,130 | 3.2% | ||||||||||||
24,491,435 | 24,491,435 | 24,807,130 | |||||||||||||||||
IronGate Energy Services, LLC | Energy: Oil & Gas | Senior Secured First Lien Note 11.000%(9) (12) | 7/1/2018 | 3,000,000 | 2,973,811 | 975,000 | 0.1% | ||||||||||||
3,000,000 | 2,973,811 | 975,000 | |||||||||||||||||
Isola USA Corp.(11) | High Tech Industries | Senior Secured First Lien Term Loan LIBOR + 8.250%, 1.000% Floor(3) | 11/29/2018 | 5,493,504 | 5,551,082 | 5,113,299 | 0.7% | ||||||||||||
5,493,504 | 5,551,082 | 5,113,299 | |||||||||||||||||
Jordan Reses Supply Company, LLC | Healthcare & Pharmaceuticals | Senior Secured Second Lien Term Loan LIBOR + 11.000%, 1.000% Floor(3) (4) | 4/24/2020 | 5,000,000 | 5,000,000 | 5,050,000 | 0.7% | ||||||||||||
5,000,000 | 5,000,000 | 5,050,000 | |||||||||||||||||
Liquidnet Holdings, Inc. | Banking, Finance, Insurance & Real Estate | Senior Secured First Lien Term Loan LIBOR + 6.750%, 1.000% Floor(3) | 5/22/2019 | 6,125,000 | 6,075,286 | 6,160,586 | 0.8% | ||||||||||||
6,125,000 | 6,075,286 | 6,160,586 | |||||||||||||||||
Livingston International Inc.(11) | Transportation: Cargo | Senior Secured Second Lien Term Loan LIBOR + 8.250%, 1.250% Floor(3) (6) | 4/17/2020 | 2,658,504 | 2,655,528 | 2,532,757 | 0.3% | ||||||||||||
2,658,504 | 2,655,528 | 2,532,757 | |||||||||||||||||
10
Loar Group Inc. | Aerospace & Defense | Senior Secured Second Lien Term Loan LIBOR + 9.250%, 1.000% Floor(8) | 7/12/2022 | 15,000,000 | 15,000,000 | 15,450,000 | 2.0% | ||||||||||||
15,000,000 | 15,000,000 | 15,450,000 | |||||||||||||||||
LSF9 Atlantis Holdings, LLC | Retail | Senior Secured First Lien Term Loan LIBOR + 9.000%, 1.000% Floor(3) (4) | 1/15/2021 | 9,625,000 | 9,546,319 | 9,739,634 | 1.3% | ||||||||||||
9,625,000 | 9,546,319 | 9,739,634 | |||||||||||||||||
LTCG Holdings Corp. | Banking, Finance, Insurance & Real Estate | Senior Secured First Lien Term Loan LIBOR + 5.000%, 1.000% Floor(3) | 6/6/2020 | 2,838,571 | 2,829,766 | 2,664,170 | 0.3% | ||||||||||||
2,838,571 | 2,829,766 | 2,664,170 | |||||||||||||||||
Miller Heiman, Inc. | Services: Business | Senior Secured First Lien Term Loan LIBOR + 6.000%, 1.000% Floor(3) (12) | 9/30/2019 | 23,593,750 | 23,593,750 | 12,976,563 | 1.7% | ||||||||||||
23,593,750 | 23,593,750 | 12,976,563 | |||||||||||||||||
Nathan's Famous, Inc. | Beverage & Food | Senior Secured First Lien Note 10.000%(13) | 3/15/2020 | 7,000,000 | 7,000,000 | 7,612,500 | 1.0% | ||||||||||||
7,000,000 | 7,000,000 | 7,612,500 | |||||||||||||||||
Nation Safe Drivers Holdings, Inc. | Banking, Finance, Insurance & Real Estate | Senior Secured Second Lien Term Loan LIBOR + 8.000%, 2.000% Floor(3) (4) | 9/29/2020 | 20,676,479 | 20,676,479 | 20,883,243 | 2.7% | ||||||||||||
20,676,479 | 20,676,479 | 20,883,243 | |||||||||||||||||
New Media Holdings II LLC | Media: Advertising, Printing & Publishing | Senior Secured First Lien Term Loan LIBOR + 6.250%, 1.000% Floor(3) | 6/4/2020 | 18,043,921 | 18,029,645 | 18,043,921 | 2.3% | ||||||||||||
18,043,921 | 18,029,645 | 18,043,921 | |||||||||||||||||
Novetta Solutions, LLC | High Tech Industries | Senior Secured Second Lien Term Loan LIBOR + 8.500%, 1.000% Floor(3) | 10/16/2023 | 11,000,000 | 10,905,938 | 10,499,170 | 1.4% | ||||||||||||
11,000,000 | 10,905,938 | 10,499,170 | |||||||||||||||||
Nuspire, LLC | High Tech Industries | Senior Secured First Lien Term Loan LIBOR + 6.500%, 1.000% Floor(3) (4) (5) | 11/8/2021 | — | — | — | 0.0% | ||||||||||||
Senior Secured First Lien Term Loan LIBOR + 6.500%, 1.000% Floor(3) (4) | 11/8/2022 | 6,310,000 | 6,310,000 | 6,310,000 | 0.8% | ||||||||||||||
6,310,000 | 6,310,000 | 6,310,000 | |||||||||||||||||
Omnitracs, Inc. | Telecommunications | Senior Secured Second Lien Term Loan LIBOR + 7.750%, 1.000% Floor(3) | 5/25/2021 | 7,000,000 | 7,010,819 | 6,763,750 | 0.9% | ||||||||||||
7,000,000 | 7,010,819 | 6,763,750 | |||||||||||||||||
Oxford Mining Company, LLC | Metals & Mining | Senior Secured First Lien Term Loan LIBOR + 8.500%, 0.750% Floor, 3.000% PIK(3) (4) | 12/31/2018 | 20,756,843 | 20,756,842 | 20,518,139 | 2.7% | ||||||||||||
20,756,843 | 20,756,842 | 20,518,139 | |||||||||||||||||
Path Medical, LLC | Healthcare & Pharmaceuticals | Senior Secured First Lien Term Loan LIBOR + 9.500%, 1.000% Floor(4) (8) | 10/11/2021 | 16,195,000 | 15,560,824 | 15,542,666 | 2.0% | ||||||||||||
Warrants (4) (7) | — | 669,709 | 669,709 | 0.1% | |||||||||||||||
16,195,000 | 16,230,533 | 16,212,375 | |||||||||||||||||
Payless Inc. | Retail | Senior Secured Second Lien Term Loan LIBOR + 7.500%, 1.000% Floor(3) | 3/11/2022 | 6,000,000 | 6,014,579 | 900,000 | 0.1% | ||||||||||||
6,000,000 | 6,014,579 | 900,000 | |||||||||||||||||
Preferred Proppants, LLC(11) | Construction & Building | Senior Secured First Lien Term Loan LIBOR + 5.750%, 1.000% Floor(3) | 7/27/2020 | 3,979,645 | 2,738,781 | 3,357,825 | 0.4% | ||||||||||||
3,979,645 | 2,738,781 | 3,357,825 | |||||||||||||||||
Press Ganey Holding, Inc(11) | Healthcare & Pharmaceuticals | Senior Secured Second Lien Term Loan LIBOR + 7.250%, 1.000% Floor(3) | 10/21/2024 | 6,500,000 | 6,473,059 | 6,472,505 | 0.8% | ||||||||||||
11
6,500,000 | 6,473,059 | 6,472,505 | |||||||||||||||||
PT Network, LLC | Healthcare & Pharmaceuticals | Senior Secured First Lien Term Loan LIBOR + 6.500%, 1.000% Floor(3) (4) (5) | 11/30/2021 | 4,833,334 | 4,833,334 | 4,833,334 | 0.6% | ||||||||||||
4,833,334 | 4,833,334 | 4,833,334 | |||||||||||||||||
Reddy Ice Corporation | Beverage & Food | Senior Secured Second Lien Term Loan LIBOR + 9.500%, 1.250% Floor(4) (8) | 11/1/2019 | 2,000,000 | 2,000,000 | 1,720,000 | 0.2% | ||||||||||||
2,000,000 | 2,000,000 | 1,720,000 | |||||||||||||||||
Research Now Group, Inc. | Services: Business | Senior Secured Second Lien Term Loan LIBOR + 8.750%, 1.000% Floor(3) | 3/18/2022 | 15,000,000 | 15,000,000 | 14,983,200 | 1.9% | ||||||||||||
15,000,000 | 15,000,000 | 14,983,200 | |||||||||||||||||
Response Team Holdings, LLC | Construction & Building | Preferred Equity 12% PIK(4) (6) (12) | — | 3,384,734 | 967,238 | 0.1% | |||||||||||||
Warrants (4) (6) (7) | — | 257,407 | — | 0.0% | |||||||||||||||
— | 3,642,141 | 967,238 | |||||||||||||||||
Rhombus Cinema Holdings, LP | Media: Diversified & Production | Preferred Equity 10.000% PIK(4) (6) | — | 4,584,207 | 5,051,193 | 0.7% | |||||||||||||
Equity (4) (6) (7) | — | 3,162,793 | 3,162,793 | 0.4% | |||||||||||||||
— | 7,747,000 | 8,213,986 | |||||||||||||||||
School Specialty, Inc. | Wholesale | Senior Secured First Lien Term Loan LIBOR + 8.500%, 1.000% Floor(3) | 6/11/2019 | 9,198,434 | 9,169,670 | 9,198,434 | 1.2% | ||||||||||||
9,198,434 | 9,169,670 | 9,198,434 | |||||||||||||||||
Ship Supply Acquisition Corporation | Services: Business | Senior Secured First Lien Term Loan LIBOR + 8.000%, 1.000% Floor(3) (4) | 7/31/2020 | 23,437,500 | 23,437,500 | 22,970,391 | 3.0% | ||||||||||||
23,437,500 | 23,437,500 | 22,970,391 | |||||||||||||||||
Sizzling Platter, LLC | Hotel, Gaming & Leisure | Senior Secured First Lien Term Loan LIBOR + 7.500%, 1.000% Floor(3) | 4/28/2020 | 15,000,000 | 15,000,000 | 15,091,200 | 2.0% | ||||||||||||
15,000,000 | 15,000,000 | 15,091,200 | |||||||||||||||||
SMART Financial Operations, LLC | Retail | Senior Secured First Lien Term Loan LIBOR + 10.000%, 1.000% Floor(3) (4) (5) | 11/22/2021 | 3,700,000 | 3,700,000 | 3,700,000 | 0.5% | ||||||||||||
Equity (4) (7) | — | 1,000,000 | 1,000,000 | 0.1% | |||||||||||||||
3,700,000 | 4,700,000 | 4,700,000 | |||||||||||||||||
Southwest Dealer Services, Inc. | Automotive | Senior Secured First Lien Term Loan LIBOR + 6.000%, 1.000% Floor(3) (4) (17) | 3/16/2020 | 2,538,823 | 2,538,823 | 2,535,878 | 0.3% | ||||||||||||
2,538,823 | 2,538,823 | 2,535,878 | |||||||||||||||||
Survey Sampling International, LLC | Services: Business | Senior Secured Second Lien Term Loan LIBOR + 9.000%, 1.000% Floor(3) | 12/16/2021 | 24,000,000 | 24,000,000 | 24,000,000 | 3.1% | ||||||||||||
24,000,000 | 24,000,000 | 24,000,000 | |||||||||||||||||
Techniplas, LLC | Automotive | Senior Secured First Lien Note 10.000%(9) | 5/1/2020 | 6,000,000 | 6,000,000 | 5,218,500 | 0.7% | ||||||||||||
6,000,000 | 6,000,000 | 5,218,500 | |||||||||||||||||
The Garretson Resolution Group, Inc. | Services: Business | Senior Secured First Lien Term Loan LIBOR + 6.500%, 1.000% Floor(3) | 5/22/2021 | 9,625,000 | 9,587,577 | 9,663,115 | 1.2% | ||||||||||||
9,625,000 | 9,587,577 | 9,663,115 | |||||||||||||||||
Touchtunes Interactive Networks, Inc. | Media: Diversified & Production | Senior Secured Second Lien Term Loan LIBOR + 8.250%, 1.000% Floor(3) | 5/27/2022 | 7,500,000 | 7,500,000 | 7,519,800 | 1.0% | ||||||||||||
7,500,000 | 7,500,000 | 7,519,800 | |||||||||||||||||
Transocean Phoenix 2 Ltd. | Energy: Oil & Gas | Senior Secured First Lien Note 7.750%(4) (9) (13) | 10/15/2024 | 7,500,000 | 7,387,506 | 7,919,325 | 1.0% | ||||||||||||
7,500,000 | 7,387,506 | 7,919,325 | |||||||||||||||||
12
TravelCLICK, Inc.(11) | Hotel, Gaming & Leisure | Senior Secured Second Lien Term Loan LIBOR + 7.750%, 1.000% Floor(3) | 11/6/2021 | 6,000,000 | 5,935,400 | 5,899,740 | 0.8% | ||||||||||||
6,000,000 | 5,935,400 | 5,899,740 | |||||||||||||||||
Truco Enterprises, LP | Beverage & Food | Senior Secured First Lien Term Loan 8.240% Fixed(4) (8) | 4/26/2021 | 9,949,580 | 9,949,580 | 9,949,580 | 1.3% | ||||||||||||
9,949,580 | 9,949,580 | 9,949,580 | |||||||||||||||||
True Religion Apparel, Inc. | Retail | Senior Secured Second Lien Term Loan LIBOR + 10.000%, 1.000% Floor(3) | 1/30/2020 | 4,000,000 | 3,899,083 | — | 0.0% | ||||||||||||
4,000,000 | 3,899,083 | — | |||||||||||||||||
U.S. Auto Sales, Inc. | Banking, Finance, Insurance & Real Estate | Senior Secured Second Lien Term Loan LIBOR + 11.750%, 1.000% Floor(4) (8) (17) | 6/5/2020 | 5,500,000 | 5,500,000 | 5,452,095 | 0.7% | ||||||||||||
5,500,000 | 5,500,000 | 5,452,095 | |||||||||||||||||
U.S. Well Services, LLC | Energy: Oil & Gas | Warrants (7) | — | 173 | — | 0.0% | |||||||||||||
— | 173 | — | |||||||||||||||||
Valence Surface Technologies, Inc. | Aerospace & Defense | Senior Secured First Lien Term Loan LIBOR + 5.500%, 1.000% Floor(4) (8) | 6/13/2019 | 3,499,128 | 3,486,054 | 3,388,590 | 0.4% | ||||||||||||
3,499,128 | 3,486,054 | 3,388,590 | |||||||||||||||||
Velocity Pooling Vehicle, LLC | Automotive | Senior Secured Second Lien Term Loan LIBOR + 7.250%, 1.000% Floor(3) (4) | 5/13/2022 | 20,625,000 | 18,591,706 | 10,996,425 | 1.4% | ||||||||||||
20,625,000 | 18,591,706 | 10,996,425 | |||||||||||||||||
Verso Corporation | Media: Advertising, Printing & Publishing | Common Stock (7) (15) | — | 2,238,108 | 1,262,666 | 0.2% | |||||||||||||
— | 2,238,108 | 1,262,666 | |||||||||||||||||
VOYA CLO 2016-2, LTD. | Multi-Sector Holdings | Subordinated Note 16.185% effective yield(6) (9) (10) | 7/19/2028 | 22,842,661 | 19,918,800 | 20,551,542 | 2.7% | ||||||||||||
22,842,661 | 19,918,800 | 20,551,542 | |||||||||||||||||
Watermill-QMC Midco, Inc. | Automotive | Partnership Interest (4) (6) (7) | — | 850,136 | 1,102,626 | 0.1% | |||||||||||||
— | 850,136 | 1,102,626 | |||||||||||||||||
Z Gallerie, LLC | Retail | Senior Secured First Lien Term Loan LIBOR + 6.500%, 1.000% Floor(4) (8) | 10/8/2020 | 4,682,646 | 4,645,211 | 4,682,647 | 0.6% | ||||||||||||
4,682,646 | 4,645,211 | 4,682,647 | |||||||||||||||||
Total non-controlled/non-affiliated investments | $ | 921,626,572 | $ | 885,400,856 | 114.5% | ||||||||||||||
Controlled/affiliated investments – 9.5%(16) | |||||||||||||||||||
Capstone Nutrition | Healthcare & Pharmaceuticals | Senior Secured First Lien Term Loan LIBOR + 12.500%, 1.000% Floor, PIK(4) (8) (12) | 4/28/2019 | 25,327,876 | 22,770,855 | 16,246,819 | 2.1% | ||||||||||||
Common Stock (4) (7) | — | 300,002 | — | 0.0% | |||||||||||||||
Common Stock, Class B (4) (7) | — | 9 | — | 0.0% | |||||||||||||||
Common Stock, Class C (4) (7) | — | — | — | 0.0% | |||||||||||||||
25,327,876 | 23,070,866 | 16,246,819 | |||||||||||||||||
MCM Capital Office Park Holdings LLC | Banking, Finance, Insurance & Real Estate | Equity (6) (7) | — | 7,500,000 | 7,500,000 | 1.0% | |||||||||||||
— | 7,500,000 | 7,500,000 | |||||||||||||||||
Nomida LLC | Construction & Building | Equity (6) (7) | — | 5,400,000 | 5,400,000 | 0.7% | |||||||||||||
Senior Secured First Lien Term Loan 10.000%(6) | 12/1/2020 | 8,100,000 | 8,100,000 | 8,100,000 | 1.0% | ||||||||||||||
8,100,000 | 13,500,000 | 13,500,000 | |||||||||||||||||
13
Sierra Senior Loan Strategy JV I LLC(5)(6) | Multi-Sector Holdings | Equity | 60,785,000 | 60,785,000 | 60,496,647 | 7.8% | |||||||||||||
60,785,000 | 60,785,000 | 60,496,647 | |||||||||||||||||
Total controlled/affiliated investments | $ | 104,855,866 | $ | 97,743,466 | 12.6% | ||||||||||||||
Money market fund – 3.0% | |||||||||||||||||||
Federated Institutional Prime Obligations Fund (15) | Money Market 0.49% | 22,966,981 | 22,966,981 | 22,966,981 | 3.0% | ||||||||||||||
Total money market fund | $ | 22,966,981 | $ | 22,966,981 | 3.0% | ||||||||||||||
Derivative Instrument - Long Exposure | Notional Amount | Unrealized Appreciation (Depreciation) | |||||||||||||||||
Total return swap with Citibank, N.A. (Note 5) | Total Return Swap | 227,513,679 | (13,647,330) | ||||||||||||||||
$ | 227,513,679 | $ | (13,647,330 | ) | |||||||||||||||
(1) | All of the Company's investments are domiciled in the United States except for Atrium Innovations, Inc. and Livingston International, Inc., which are domiciled in Canada. |
(2) | Percentage is based on net assets of $773,113,087 as of December 31, 2016. |
(3) | The interest rate on these loans is subject to a base rate plus 3 Month “3M” LIBOR, which at December 31, 2016 was 1.00%. As the interest rate is subject to a minimum LIBOR floor which was greater than the 3M LIBOR rate at December 31, 2016, the prevailing rate in effect at December 31, 2016 was the base rate plus the LIBOR floor. |
(4) | An affiliated Company that is managed by an affiliate of SIC Advisors LLC also holds an investment in this security. |
(5) | The investment has an unfunded commitment as of December 31, 2016. For further details (see Note 11). Fair value includes an analysis of the unfunded commitment. |
(6) | The investment is not a qualifying asset under Section 55 of the Investment Company Act of 1940 (the "1940 Act"), as amended. Non-qualifying assets represent 22.4% of the Company's portfolio at fair value. |
(7) | Security is non-income producing. |
(8) | The interest rate on these loans is subject to a base rate plus 1 Month "1M" LIBOR, which at December 31, 2016 was 0.77%. As the interest rate is subject to a minimum LIBOR floor which was greater than the 1M LIBOR rate at December 31, 2016, the prevailing rate in effect at December 31, 2016 was the base rate plus the LIBOR floor. |
(9) | Securities are exempt from registration under Rule 144A of the Securities Act of 1933. These securities represent a fair value of $113,438,688 or 14.7% of net assets as of December 31, 2016 and are considered restricted. |
(10) | This investment is in the equity class of a collateralized loan obligation ("CLO") security. The CLO equity investments are entitled to recurring distributions which are generally equal to the excess cash flow generated from the underlying investments after payment of the contractual payments to debt holders and fund expenses. The current estimated yield is based on the current projections of this excess cash flow taking into account assumptions which have been made regarding expected prepayments, losses and future reinvestment rates. These assumptions are periodically reviewed and adjusted. Ultimately, the actual yield may be higher or lower than the estimated yield if actual results differ from those used for the assumptions. |
(11) | Security is also held in the underlying portfolio of the total return swap with Citibank, N.A. (see Note 5) or the Sierra Senior Loan Strategy JV I LLC portfolio (see Note 3). The Company's total exposure to Astro AB Borrower, APCO Holdings, Inc., Inc., Asurion LLC, ConvergeOne Holdings Corp., Genex Holdings, Inc., Isola USA Corp., Livingston International, Inc., Preferred Sands Holding Company, LLC, Press Ganey Holdings, and TravelCLICK, Inc. is $7,020,932 or 0.9%, 9,123,869 or 1.2%, $8,082,500 or 1.0%, $14,962,500 or 1.9%, $12,427,662 or 1.6%, $8,708,549 or 1.1%, $4,502,200 or 0.6%, $6,199,301 or 0.8%, $15,930,005 or 2.1%, and $10,585,217 or 1.4%, respectively, of Net Assets as of December 31, 2016. |
(12) | The investment was on non-accrual status as of December 31, 2016. |
(13) | Represents securities in Level 2 in the ASC 820 table (see Note 4). |
(14) | The interest rate on these loans is subject to a base rate plus 6 month "6M" LIBOR, which at December 31, 2016 was 1.32%. As the interest rate is subject to a minimum LIBOR floor which was greater than the 6M LIBOR rate at December 31, 2016, the prevailing rate in effect at December 31, 2016 was the base rate plus the LIBOR floor. |
(15) | Represents securities in Level 1 in the ASC 820 table (see Note 4). |
(16) | Control Investments are defined by the Investment Company Act of 1940 ("1940 Act") as investments in companies in which the Company owns more than 25% of the voting securities or maintains greater than 50% of the board representation. |
(17) | A portion of this investment was sold via a participation agreement |
As of December 31, 2016, the weighted average yield based upon original cost on our portfolio investments, including the yield on the equity component of the total return swap ("TRS") that Arbor Funding LLC ("Arbor"), our wholly-owned financing ubsidiary entered into with Citiban, N.A. ("Citibank"), was approximately 9.6% and approximately 84% of our portfolio investments were senior secured. As of December 31, 2016, 89% of our income-bearing investment portfolio bore interest based on fixed rates, such as LIBOR or the Alternate Base Rate ("ABR"), and 11% bore interest at fixed rates. The weighted average yield on income-producing investments is computed based upon the contractual interest payments and principal amortizations due at maturity for each individual investment, which amount is divided by the total cost borne by us on such income-producing investments as of the end of the applicable reporting period. The yield on our portfolio investments is higher than what our investors will realize because it does not reflect our expenses and the sales load paid by investors.
Overview of Portfolio Companies
Set forth below is a brief description of the business of our portfolio companies as of December 31, 2016.
14
Portfolio Company | Brief Description of Portfolio Company | |
AAAHI Acquisition Corporation | AAAHI Acquisition Corporation (“All Aboard”) is a leading provider of passenger transport services to customers throughout the U.S. Sun Belt Region. All Aboard is comprised of six local operating units, the largest of which include: Hotard, All Aboard America!, and Sun Diego. | |
AAR Intermediate Holdings, LLC | AAR Intermediate Holdings, LLC (“AAR”) provides field support services to oil and gas independent producers, drilling companies and midstream companies in the Denver-Julesburg Basin, with headquarters in the heart of the Wattenberg region in Greeley, CO. AAR builds, repairs, modifies and maintains oil and gas production equipment, sites, wells and pipelines. | |
Access Media Holding LLC | Access Media Holdings, LLC (d/b/a Access Media 3, Inc.), headquartered in Oak Brook, IL, is a triple-play provider of digital satellite television, high speed internet and voice services to the residential multi-dwelling unit market in the United States. | |
Advanced Diagnostic Holdings LLC | Advanced Diagnostic Holdings, LLC, founded in 2003 and headquartered in Tampa, FL, is a provider of specialty neuro and musculoskeletal diagnostic imaging services to physicians and chiropractors. | |
Alpha Media LLC | Alpha Media LLC, headquartered in Portland, OR, is a radio broadcast media company. Alpha Media’s formats include Top 40, Adult Contemporary, Spanish, Urban, News Talk, Sports, Rock, Country and more. | |
Amerijet Holdings Inc. | Amerijet Holdings Inc., headquartered in Fort. Lauderdale, FL, is a leading provider of air cargo and logistics to and from the Caribbean, Mexico and Latin America. | |
AMMC CLO 17, Limited Series 2015-17A | AMMC CLO 17, Limited Series 2015-17A is a collateralized loan obligation vehicle invested in a diversified portfolio of primarily senior secured first lien bank loans and, to a limited extent, senior unsecured loans, second lien loans and first lien last out loans. | |
Anaren, Inc. | Anaren, Inc., founded in 1967 and headquartered in East Syracuse, NY, is a leading provider of highly integrated microwave components, assemblies and subsystems for the aerospace, satellite, defense, wireless infrastructure, medical and industrial electronics end-markets worldwide. | |
APCO Holdings, Inc. | APCO Holdings, Inc., founded in 1984 and headquartered in Norcross, GA, is a marketer and third-party administrator of vehicle service contracts and other related ancillary products sold by automotive dealers. | |
Apidos CLO XXIV, Series 2016-24A | Apidos CLO XXIV, Series 2016-24A is a collateralized loan obligation vehicle invested in a diversified portfolio of primarily senior secured first lien bank loans and, to a limited extent, senior unsecured loans, second lien loans and first lien last-out loans. | |
Associated Asphalt Partners, LLC | Associated Asphalt Partners, LLC, founded in 1948 and headquartered in Roanoke, VA, is an asphalt reseller. Associated Asphalt stores, blends, transports, and sells a diverse mix of performance grade asphalt. | |
Astro AB Borrower, Inc. | Astro AB Borrower, Inc (d/b/a American Beacon), headquartered in Irving, TX, is an asset management firm that provides institutional-quality equity, fixed income, alternative and cash solutions to retail and institutional clients. | |
Asurion LLC | Asurion LLC, headquartered in Nashville, TN, is a provider of technology protection services to the wireless, retail, and home service provider industries. | |
Atrium Innovations, Inc. | Atrium Innovations, Inc., founded in 1999 and headquartered in Quebec, Canada, is a globally recognized leader in the development, manufacturing, and commercialization of vitamins, minerals and supplements. Atrium sells these products under several major brands with leading market positions, primarily marketed to healthcare practitioners and health food stores in North America and Europe. | |
Aviation Technical Services, Inc. | Aviation Technical Services, Inc., founded in 1970 and headquartered in Everett, WA, is a provider of commercial aerospace aftermarket services to the North American maintenance, repair and overhaul market. | |
Backcountry.com, LLC | Backcountry.com, LLC, founded in 1996 in Park City, UT, is an online specialty retailer for outdoor adventure, cycling, motorcycle and action sports gear and clothing. | |
15
Portfolio Company | Brief Description of Portfolio Company | |
Birch Communications, Inc. | Birch Communications, Inc., founded in 1996 and headquartered in Atlanta, GA, is a provider of IP-based voice and data communications, cloud and managed services to small and medium sized business as well as certain mid-market and enterprise customers. | |
Black Angus Steakhouses LLC | Black Angus Steakhouses LLC, founded in 1964 and headquartered in Los Altos, CA, operates restaurants across six states including California, Arizona, Alaska, New Mexico, Washington, and Hawaii. | |
Brundage-Bone Concrete Pumping, Inc. | Brundage-Bone Concrete Pumping, Inc., founded in 1983 and headquartered in Denver, CO., is the largest concrete pumping services in the United States. | |
Capstone Nutrition | Capstone Nutrition (“Capstone”) which is headquartered in Ogden, UT, is a pure-play developer and manufacturer in the nutrition industry. Since 1992, Capstone has been developing, producing, and packaging capsule, tablet, and powder products for a variety of customers in the United States and internationally. | |
Charming Charlie LLC | Charming Charlie LLC is a destination retailer of fashion jewelry and accessories. Charming Charlie is known for its fun, friendly, and fabulous brand which permeates its in-store and online experience. | |
ConvergeOne Holdings Corp. | ConvergeOne Holdings Corporation, which is headquartered in Eagan, MN, is an independent provider of innovative communications solutions and managed services to large and medium sized enterprises globally. | |
Cornerstone Chemical Company | Cornerstone Chemical Company (“Cornerstone”), headquartered in Waggaman, LA, is a North American producer of critical intermediate and specialty chemicals including AN and melamine, which are marketed globally. Cornerstone is also a producer of sulfuric acid for the merchant market in the Gulf of Mexico region. | |
CP Opco, LLC | CP OPCO LLC, founded in 1978 and headquartered in Inglewood, CA, offers its customers a complete solution, pairing a broad portfolio of event rental products and temporary structures with value-added event services. | |
CRGT Inc. | CRGT Inc., headquartered in Fairfax, VA, is a provider of Agile software development, data analytics, mobility, cyber security, and infrastructure solutions. | |
DHISCO Electronic Distribution, Inc. | DHISCO Electronic Distribution, Inc. which is headquartered in Dallas, TX, is a full service platform that assists lodging providers in the distribution of hotel information to end consumers through various distribution channels. | |
Drew Marine Partners, LP | Drew Marine Partners, LP, founded in 1928 and headquartered in Whippany, NJ, provides vessel performance products and fire, safety and rescue solutions products to maritime transportation vessels and offshore oil rigs. | |
Dryden 38 Senior Loan Fund, Series 2015-38A | Dryden 38 Senior Loan Fund, Series 2015-38A is a collateralized loan obligation vehicle invested in a diversified portfolio of primarily senior secured first lien bank loans and, to a limited extent, senior unsecured loans, second lien loans and first lien last out loans. | |
Dryden 43 Senior Loan Fund, Series 2016-43A | Dryden 43 Senior Loan Fund, Series 2016-43A is a collateralized loan obligation vehicle invested in a diversified portfolio of primarily senior secured first lien bank loans and, to a limited extent, senior unsecured loans, second lien loans and first lien last out loans. | |
Dryden 49 Senior Loan Fund | Dryden 49 Senior Loan Fund is a collateralized loan obligation vehicle invested in a diversified portfolio of primarily senior secured first lien bank loans and, to a limited extent, senior unsecured loans, second lien loans and first lien last out loans. | |
Dynamic Energy Services International LLC | Dynamic Energy Services International LLC, which is headquartered in Wayne, PA, is a provider of full-service fabrication, construction and maintenance services to a broad range of worldwide markets including oil and gas, industrial and petrochemical markets. | |
EarthLink, Inc. | Earthlink, Inc., headquartered in Atlanta, GA, is a network services provider dedicated to delivering superior customer experiences in a cloud connected world. | |
Elite Comfort Solutions LLC | Elite Comfort Solutions LLC is a specialty foam manufacturer and fabrication processer, producing a range of consumer-facing products including bed-in-a-box, toppers, and pillows. | |
16
Portfolio Company | Brief Description of Portfolio Company | |
First Boston Construction Holdings, LLC | First Boston Construction Holdings, LLC, an affiliate of The Grossman Companies with offices in Quincy, MA and Southport, CT, extends private loans to builders, developers and real estate investors in the Northeast region of the United States. | |
FKI Security Group LLC | FKI Security Group LLC, founded in 1951 and headquartered in New Albany, IN, is a global manufacturer and national service provider of security, safety and asset protection products used in a variety of industries, including the financial services, government, retail, education, and medical end-markets. | |
Frontier Communications Corp. | Frontier Communications Corp. (“Frontier”), headquartered in Denver, CO, is a telephone company in the United States, mainly serving rural areas and smaller communities. Frontier offers wireline voice, data and video services to residential and business customers. | |
Gastar Exploration Inc. | Gastar Exploration Inc., founded in 1987 and based in Houston, TX, is an independent oil and gas exploration and production company. | |
Genex Holdings, Inc. | Genex Holdings, Inc., headquartered in Wayne, PA, is a national provider of case management solutions to the workers’ compensation industry. | |
GK Holdings, Inc. | GK Holdings, Inc., headquartered in Cary, NC, is a worldwide provider of IT and business skills learning solutions participating in the global corporate training market. | |
Green Field Energy Services, Inc. | Green Field Energy Services, Inc., formed in 1969, is an independent oilfield services company. The company’s Plan of Reorganization was confirmed in 2014. | |
HBC Holdings LLC | HBC Holdings LLC (d/b/a World & Main LLC), headquartered in Moody, AL, develops, markets and distributes products to leading retailers, wholesalers, home centers, discount stores, food and drug chains, municipalities, eRetailers, catalog companies and independent hardware stores. | |
Heligear Acquisition Co. | Heligear Acquisition Co. (d/b/a Northstar Aerospace), headquartered in Burr Ridge, IL, is an independent manufacturer of flight-critical aerospace gears and power transmission systems for domestic and international military and commercial aircraft applications. | |
Hill International, Inc. | Hill International, Inc., (“Hill”), headquartered in Marlton, NJ and established in 1976, is a construction management firm. Hill helps clients manage their construction projects and programs more effectively so that projects are finished on time, within budget and with minimal claims. | |
Holland Acquisition Corp. | Holland Acquisitions Corp. (“Holland”), founded in 1985 and headquartered in Fort Worth, TX, is a provider of land services to blue-chip clients throughout the United States. Holland offers a full-suite of land services in all three stages of the energy production cycle: upstream, midstream and downstream. | |
Hylan Datacom & Electrical LLC | Hylan Datacom & Electrical LLC, headquartered in Holmdel, NJ, is a specialty design, engineering and construction company providing telecommunications, electrical and utility services to customers in New York City and the greater Tri-State area. | |
Ignite Restaurant Group, Inc. | Ignite Restaurant Group, Inc. (“IRG”), headquartered in Houston, TX, operates and franchises over 350 restaurants throughout the U.S. and internationally. IRG offers a variety of chef-inspired food and beverages in a distinctive, casual, high-energy atmosphere. | |
IHS Intermediate, Inc. | IHS Intermediate, Inc. (d/b/a Interactive Health), headquartered in Schaumburg, IL, is a provider of customized corporate health and wellness improvement services. Interactive Health provides a suite of comprehensive, end-to-end services designed to improve personal health, lowering healthcare costs for employers, increasing employee productivity, and reducing health related absences. | |
Impact Sales, LLC | Impact Sales, LLC is a Boise, Idaho based sales and marketing agency providing outsourced sales, marketing and merchandising services to consumer packaged goods manufacturers. | |
Interface Security Systems Holdings, Inc. | Interface Security Systems Holdings, Inc., founded in 1995 and based in St. Louis, MO, is a national provider of physical security and secured managed network services to primarily large, commercial multi-site customers. | |
17
Portfolio Company | Brief Description of Portfolio Company | |
Invision Diversified, LLC | Invision Diversified, LLC (“Invision”), headquartered in Chicago, IL, is the parent company of five low-volatility, high recurring revenue and strong free cash flow-generating services businesses. Invision’s services businesses provide largely nondiscretionary outsourced business services to a broad base of longstanding, high quality customers in over 20 different end-markets. | |
IronGate Energy Services, LLC | IronGate Energy Services, LLC, headquartered in Minneapolis, MN, is an independent provider of rental and tubular services to oil and gas drilling operators in the United States and Mexico. | |
Isola USA Corp. | Isola USA Corp., founded in Germany in 1912, is a global material science company that designs, develops, and manufactures copper-clad laminate and prepreg used to fabricate advanced multilayer printed circuit boards. | |
Jordan Reses Supply Company, LLC | Jordan Reses Supply Company, LLC, founded in 1985 and headquartered in Ann Arbor, MI, is a national distributor of respiratory equipment solely focused on serving the Veterans Affairs and the federal government. | |
Liquidnet Holdings, Inc. | Liquidnet Holdings, Inc., headquartered in New York, NY and founded in 2001, operates a global institutional equities trading network that many asset managers trust to execute their block trades with maximum anonymity and minimal price impact. | |
Livingston International, Inc. | Livingston International, Inc. is a pure-play, non-asset-based customs broker with its U.S. headquarters based in Chicago, IL. | |
Loar Group, Inc | Loar Group, Inc. (“Loar”), headquartered in New York, NY, is a components manufacture in the North American aerospace & defense industry. Loar produces flight-critical, niche components which are used across the aircraft, including both airframe and engine applications. | |
LSF9 Atlantis Holdings, LLC. | LSF9 Atlantis Holdings, LLC (d/b/a A2Z Wireless Holdings, Inc. or “A2Z”), founded in 1996 and headquartered in Greenville, NC, is a leading retailer of Verizon wireless products and services. A2Z operates Verizon-branded retail stores that offer a comprehensive mix of wireless devices, including smartphones, feature phones, tablets, mobile broadband, and wearables, as well as, a broad range of accessories and device insurance coverage. | |
LTCG Holdings Corp. | LTCG Holdings Corp. (“LTCG”), headquartered in Eden Prairie, MN, provides business process outsourcing and assessment services for the long-term care insurance industry. LTCG offers end-to-end LTCI BPO services including: (i) application processing, underwriting and policy issuance; (ii) policy administration; (iii) claims processing and care management; (iv) assessments; and (v) professional services. | |
MCM Capital Office Park Holdings LLC | Capital Office Park Holdings is a commercial real estate portfolio in the Washington, DC metro area. The portfolio consists of six office buildings, a bank pad site and a residential development opportunity. | |
Miller Heiman, Inc. | Miller Heiman, Inc., headquartered in Reno, NV, provides global sales organizations with an objective source of industry knowledge and insight to help organizations overhaul their sales techniques re-energize their sales force and fine-tune their customer interactions. | |
Nathan’s Famous, Inc. | Nathan’s Famous, Inc., founded in 1916 and headquartered in Jericho, NY, is a licensor, wholesaler and retailer of food products marketed under Nathan’s Famous brand in the U.S. and internationally. | |
Nation Safe Drivers Holdings, Inc. | Nation Safe Drivers Holdings, Inc., headquartered in Boca Raton, FL, is a provider of towing and roadside assistance services, as well as supplemental insurance related products. | |
New Media Holdings II LLC | New Media Holdings II LLC, headquartered in New York, NY, is a publisher of locally-based print and online media in the United States. | |
Nomida LLC | Nomida LLC is a fully entitled, 40,800 sq. ft. for-sale multifamily development located in Chicago, IL. The site is centrally located in Wicker Park and will consist of 24 loft-style condominiums approximately 1,700 sq. ft. in size, with parking available for all residents. | |
Novetta Solutions, LLC | Novetta Solutions, LLC, headquartered in McLean, VA, is an advanced analytics company focused on technology-intensive national security solutions, providing services to government and commercial organizations. | |
18
Portfolio Company | Brief Description of Portfolio Company | |
Nuspire, LLC | Nuspire, LLC, headquartered in Commerce, MI, is a managed security services provider delivering superior threat detection and remediation through a skilled team of experts, advanced R&D, and proprietary solutions that merge big data and deep human analytics. | |
Omnitracs, Inc. | Omnitracs, Inc., headquartered in Dallas, TX, is a provider of satellite and terrestrial-based connectivity and location solutions to transportation and logistics companies. | |
Oxford Mining Company, LLC | Oxford Mining Company, LLC (d/b/a Westmoreland Resource Partners, L.P. or "Westmoreland"), headquartered in Columbus, OH, is a producer of high-value thermal coal and surface-mined coal. Westmoreland operates active surface mines with mining complexes principally in Ohio, Kentucky, West Virginia and Pennsylvania. | |
Path Medical LLC | Path Medical, LLC, with locations in southern Florida, Tampa, FL and Orlando, FL, is a provider of fully-integrated acute trauma treatment and diagnostic imaging solutions to patients injured in automobile and non-work related accidents. | |
Payless Inc. | Payless Inc. (“Payless”), founded in 1956 and headquartered in Topeka, KS, sells low-cost, high-quality family footwear. In addition to footwear, Payless also sells a broad array of accessories such as handbags, jewelry, bath-and-beauty products, and hosiery. | |
Preferred Sands Holding Company, LLC | Preferred Sands Holding Company, LLC, headquartered in Radnor, PA, is a provider of high quality raw and resin coated frac sand for use in the oil and gas industry. | |
Press Ganey Holdings, Inc. | Press Ganey Holdings, Inc., headquartered in South Bend, IN, is a provider of patient experience and caregiver measurement, performance analytics and strategic advisory solutions for healthcare organizations across the continuum of care. | |
PT Network, LLC | PT Network, LLC (d/b/a Pivot Physical Therapy), is a regional outpatient physical therapy and sports medicine operator with clinics in most of the Mid-Atlantic region. | |
Reddy Ice Corporation | Reddy Ice Corporation, headquartered in Dallas, TX, is a manufacturer and distributor of packaged ice in the U.S., with a top market share in the majority of its footprint, which spans 34 states. | |
Research Now Group, Inc. | Research Now Group, Inc., founded in 1999 and headquartered in Plano, TX, collects data through online and mobile surveys utilizing proprietary consumer and business panels. | |
Response Team Holdings, LLC | Response Team Holdings, LLC, founded in 2010 and headquartered in Raleigh, NC, provides mitigation, restoration, and ancillary services to single and multi-family prospects, healthcare organizations, schools, municipalities, and commercial businesses. | |
Rhombus Cinema Holdings, LP | Rhombus Cinema Holdings, LP, headquartered in Beverly Hills, CA, is an innovator and licensor of stereoscopic (3D) and other visual technologies for use in the cinema and on consumer electronic devices. | |
School Specialty, Inc. | School Specialty, Inc., headquartered in Greenville, WI, provides proprietary and branded products that are supported by customized value-added service solutions. | |
Ship Supply Acquisition Corporation | Ship Supply Acquisition Corporation, founded in 1968 and headquartered in Miami, FL, is a logistics services business that provides products and maritime services for commercial and military marine vessels. | |
Sierra Senior Loan Strategy JV I LLC | Sierra Senior Loan Strategy JV I LLC generates current income and capital appreciation by investing primarily in the debt of privately-held middle market companies in the United States with a focus on senior secured first lien term loans. See "Note 3 - Investments" in "Item 8 - Consolidated Financial Statements and Supplementary Data." | |
Sizzling Platter, LLC | Sizzling Platter, LLC, founded in 1963 and headquartered in Murray, UT, is a restaurant management company that operates Dunkin’ Donuts, Little Caesars, Red Robin Gourmet Burgers, and Sizzler Family Steakhouse brands. | |
SMART Financial Operations, LLC | SMART Financial Investors, LLC, headquartered in Orlando, FL, is the parent company of three distinct retail pawn store chains and one pawn industry consulting firm located throughout the United States and Edmonton, Alberta. | |
19
Portfolio Company | Brief Description of Portfolio Company | |
Southwest Dealer Services, Inc. | Southwest Dealer Services, Inc. (“SWDS”), founded in 1988, offers auto security products, vehicle service contracts, guaranteed auto protection, and other ancillary F&I products to automobile dealers primarily across the Southwestern and Midwestern portions of the United States. SWDS also sells its products through two nationally recognized brands; KARR Security Systems and Century Auto. | |
Survey Sampling International, LLC | Survey Sampling International, LLC, founded in 1977 and based in Shelton, CT, is a provider of global data collection services utilized by market research firms, consulting firms, corporate end-users, and public opinion firms to conduct survey research. | |
Techniplas LLC | Techniplas LLC, founded in 2010 and headquartered in Nashotah, WI, is a global producer of highly engineered and technically complex plastic modules and subsystems for niche applications primarily in the global automotive industry. | |
The Garretson Resolution Group, Inc | The Garretson Resolution Group, Inc, founded in 1998 and based in Cincinnati, OH, is a provider of technology-enabled outsourced legal and compliance services. | |
TouchTunes Interactive Networks, Inc. | TouchTunes Interactive Networks, Inc., headquartered in New York, NY, is an in-venue interactive music and entertainment platform, featured in bars and restaurants across North America and Europe. | |
Transocean Phoenix 2 Ltd. | Transocean Phoenix 2 Ltd., headquartered in Houston, TX, is a leading international provider of offshore contract E&P drilling services for oil and gas wells with a focus on the global offshore drilling market. | |
TravelCLICK, Inc. | TravelCLICK, Inc., headquartered in New York, NY, is a provider of cloud-based reservation systems, SaaS-based business intelligence and digital media solutions. | |
Truco Enterprises, LP | Truco Enterprises, LP, founded in 1991 and headquartered in Dallas, TX, manufactures and distributes tortilla chips under the On the Border brand. | |
True Religion Apparel, Inc. | True Religion Apparel, Inc. (“True Religion”), headquartered in Vernon, CA, designs, manufactures, and markets the True Religion brand. True Religion’s product line is sold in branded retail and outlet stores, as well as department stores and boutiques in the U.S. and abroad. | |
U.S. Auto Sales Inc. | U.S. Auto Sales, Inc., founded in 1992 and headquartered in Lawrenceville, GA, sells and provides in-house financing of used vehicles to consumers underserved by traditional credit providers. | |
U.S. Well Services, LLC | US Well Services, LLC is a Houston, TX, based oilfield service provider contracted to engage in pressure pumping and related services, including high-pressure hydraulic fracturing in unconventional oil and natural gas basins. | |
Valence Surface Technologies, Inc. | Valence Surface Technologies, Inc., headquartered in The Woodlands, TX, is an independently owned aerospace and defense metal processing company with a focus on highly-complex flight critical parts servicing the commercial aerospace, defense, satellite and UAV markets. | |
Velocity Pooling Vehicle, LLC | Velocity Pooling Vehicle, LLC, headquartered in Indianapolis, IN is a manufacturer comprised of a group of highly recognizable brands serving nearly all product categories in the powersports aftermarket industry and a distributor of proprietary and sourced brands to a variety of dealers and retailers. | |
Verso Corporation | Verso Corporation, headquartered in Memphis, TN, is a North American producer of coated papers including coated groundwood, coated freesheet, supercalendered and specialty products. | |
VOYA CLO 2016-2, LTD. | VOYA CLO 2016-2, LTD. is a collateralized loan obligation vehicle invested in a diversified portfolio of primarily senior secured first lien bank loans and, to a limited extent, senior unsecured loans, second lien loans and first lien last, out loans. | |
Watermill-QMC Midco, Inc | Watermill-QMC Midco, Inc (d/b/a Quality Metalcraft, Inc.), founded in 1964 and headquartered in Livonia, MI, is a provider of complex assemblies for specialty automotive production, prototype and factory assist applications. | |
Z Gallerie, LLC | Z Gallerie, LLC, headquartered in Gardena, CA, is a lifestyle retailer offering a variety of home goods including furniture, artwork, lighting, tabletop items, textiles and decorative accessories. | |
20
INVESTMENT ADVISORY AGREEMENT AND FEES
Investment Advisory Fees
We pay SIC Advisors a fee for its services under the Investment Advisory Agreement consisting of two components: a management fee and an incentive fee. We believe that this fee structure benefits stockholders by aligning the compensation of our Advisor with our overall investment performance. The cost of both the management fee and the incentive fee are ultimately borne by our stockholders.
Base Management Fee
The base management fee is calculated at an annual rate of 1.75% of our gross assets payable quarterly in arrears. For purposes of calculating the base management fee, the term “gross assets” includes any assets acquired with the proceeds of leverage. The Advisor benefits when we incur debt or use leverage. The base management fee is calculated based on our gross assets at the end of each completed calendar quarter. Base management fees for any partial quarter are appropriately prorated.
Incentive Fee
The incentive fee is divided into two parts: (i) a subordinated incentive fee on income and (ii) an incentive fee on capital gains. Each part of the incentive fee is outlined below.
The subordinated incentive fee on income is earned on pre-incentive fee net investment income and is determined and payable in arrears as of the end of each calendar quarter during which the Investment Advisory Agreement is in effect. If the Investment Advisory Agreement is terminated, the fee will also become payable as of the effective date of the termination.
The subordinated incentive fee on income for each quarter is calculated as follows:
• | No subordinated incentive fee on income is payable in any calendar quarter in which the pre-incentive fee net investment income does not exceed a quarterly return to investors of 1.75% per quarter on our net assets at the end of the immediately preceding fiscal quarter. We refer to this as the quarterly preferred return. |
• | All of our pre-incentive fee net investment income, if any, that exceeds the quarterly preferred return, but is less than or equal to 2.1875% on our net assets at the end of the immediately preceding fiscal quarter in any quarter, is payable to the Advisor. We refer to this portion of our subordinated incentive fee on income as the catch up. It is intended to provide an incentive fee of 20% on all of our pre-incentive fee net investment income when our pre-incentive fee net investment income exceeds 2.1875% on our net assets at the end of the immediately preceding fiscal quarter in any quarter. |
• | For any quarter in which our pre-incentive fee net investment income exceeds 2.1875% on our net assets at the end of the immediately preceding fiscal quarter, the subordinated incentive fee on income equals 20% of the amount of our pre-incentive fee net investment income, because the preferred return and catch up will have been achieved. |
• | Pre-incentive fee net investment income is defined as interest income, dividend income and any other income accrued during the calendar quarter, minus our operating expenses for the quarter, including the base management fee, expenses payable under the Administration Agreement, any interest expense and dividends paid on any issued and outstanding preferred stock, but excluding the incentive fee. Pre-incentive fee net investment income does not include any realized capital gains, realized capital losses or unrealized capital appreciation or depreciation. |
The following is a graphical representation of the calculation of the quarterly subordinated incentive fee on income:
21
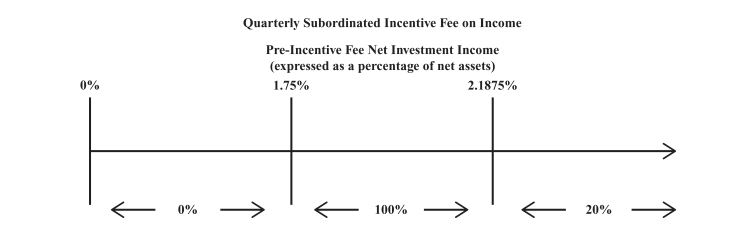
Percentage of Pre-Incentive Fee Net Investment Income Allocated to Quarterly Incentive Fee
The incentive fee on capital gains is earned on investments sold and is determined and payable in arrears as of the end of each calendar year during which the Investment Advisory Agreement is in effect. In the case the Investment Advisory Agreement is terminated, the fee will also become payable as of the effective date of such termination. The fee equals 20% of our realized capital gains, less the aggregate amount of any previously paid incentive fee on capital gains. Incentive fee on capital gains is equal to our realized capital gains on a cumulative basis from inception, computed net of all realized capital losses and unrealized capital depreciation on a cumulative basis. In order to provide an incentive for our Advisor to successfully execute a merger transaction involving us that is financially accretive and/or otherwise beneficial to our stockholders even if our Advisor will not act as an investment adviser to the surviving entity in the merger, we may seek exemptive relief from the SEC to allow us to pay our Advisor an incentive fee on capital gains in connection with our merger with and into another entity. Absent the receipt of such relief, our Advisor will not be entitled to an incentive fee on capital gains or any other incentive fee in connection with any such merger transaction.
Because of the structure of the subordinated incentive fee on income and the incentive fee on capital gains, it is possible that we may pay such fees in a quarter where we incur a net loss. For example, if we receive pre-incentive fee net investment income in excess of the 1.75% on our net assets at the end of the immediately preceding fiscal quarter for a quarter, we will pay the applicable incentive fee even if we have incurred a net loss in the quarter due to a realized or unrealized capital loss. Our Advisor will not be under any obligation to reimburse us for any part of the incentive fee it receives that is based on prior period accrued income that we never receive as a result of a subsequent decline in the value of our portfolio.
The fees that are payable under the Investment Advisory Agreement for any partial period will be appropriately prorated. The fees will also be calculated using a detailed policy and procedure approved by our Advisor and our board of directors, including a majority of the independent directors, and such policy and procedure will be consistent with the description of the calculation of the fees set forth above.
Our Advisor may elect to defer or waive all or a portion of the fees that would otherwise be paid to it in its sole discretion. Any portion of a fee not taken as to any month, quarter or year will be deferred without interest and may be taken in any such other month prior to the occurrence of a liquidity event as our Advisor may determine in its sole discretion.
Reimbursements of Organizational and Offering Expense
Under the terms of the investment advisory agreement, SIC Advisors bears all organizational and offering expenses on our behalf. Since June 2, 2014, the date that we raised $300 million in gross proceeds in connection with the sale of shares of our common stock, SIC Advisors has no longer been obligated to bear, pay or otherwise be responsible for any ongoing organization and offering expenses on our behalf, and we have been responsible for paying or otherwise incurring all such ongoing organizational and offering expenses. Pursuant to the terms of the Investment Advisory Agreement, we have agreed to reimburse SIC Advisors for any such organizational and offering expenses incurred by SIC Advisors not to exceed 1.25% of the gross subscriptions raised by us over the course of the offering period, which was initially scheduled to terminate two years from the initial offering date, unless extended. Most recently, at a meeting held on March 1, 2017, our board of directors approved another extension of our offering for an additional year which will extend the offering through April 17, 2018, unless further extended. Notwithstanding the foregoing, in the event that organizational and offering expenses, together with sales commissions, the dealer manager fee and any discounts paid to members of the Financial Industry Regulatory Authority, exceed 15% of the gross proceeds from the sale of shares of our common stock pursuant to our registration statement or otherwise at the time of the completion of our offering, then SIC Advisors shall be required to pay or, if already paid by us, reimburse us for amounts exceeding such 15% limit.
22
Advisory Services
Under the terms of the Investment Advisory Agreement, our Advisor is responsible for the following:
• | determining the composition and allocation of our portfolio, the nature and timing of the changes to our portfolio and the manner of implementing such changes; |
• | identifying, evaluating, negotiating and structuring the investments we make; |
• | performing due diligence on prospective portfolio companies; |
• | executing, closing, servicing and monitoring the investments we make; |
• | determining the securities and other assets that we will purchase, retain or sell; and |
• | providing us with such other investment advisory, research and related services as we may, from time to time, reasonably require for the investment of our capital. |
Under the Investment Advisory Agreement, SIC Advisors has a fiduciary responsibility for the safeguarding and use of all of our funds and assets. SIC Advisors is also subject to liability under both the 1940 Act and the Advisors Act for a breach of these fiduciary duties.
SIC Advisors is primarily responsible for initially identifying, evaluating, negotiating and structuring our investments. These activities are carried out by its Investment Team and subject to the oversight of SIC Advisors’ senior investment personnel. Each investment that we make will require the majority vote of the Investment Committee before the investment may be made. Certain affiliated co-investment transactions may require the additional approval of our independent directors.
SIC Advisors’ services under the Investment Advisory Agreement are not exclusive, and it is free to furnish similar services to other entities so long as its services to us are not impaired.
Indemnification of Our Advisor
The Investment Advisory Agreement provides that the Advisor and its officers, directors, persons associated with SIC Advisors, stockholders (and owners of the stockholders), controlling persons and agents are entitled to indemnification from us for any damages, liabilities, costs and expenses (including reasonable attorneys’ fees and amounts reasonably paid in settlement) incurred by them in or by reason of any pending, threatened or completed action, suit, investigation or other proceedings arising out of or otherwise based on the performance of any of SIC Advisors’ duties or obligations under the Investment Advisory Agreement, as applicable, or otherwise as our investment adviser, (i) to the extent such damages, liabilities, cost and expenses (A) are not fully reimbursed by insurance and (B) do not arise by reason of misfeasance, bad faith, or negligence in SIC Advisors’ performance of such duties or obligations, or SIC Advisors’ reckless disregard of such duties or obligations, and (ii) otherwise to the fullest extent such indemnification is consistent with the provisions of our articles of incorporation, the 1940 Act, the laws of the State of Maryland and other applicable law.
The Investment Advisory Agreement further provides that SIC Advisors and its officers, directors, persons associated with SIC Advisors, stockholders (and owners of the stockholders), controlling persons and agents are not entitled to indemnification for any liability or loss suffered by them, nor will they be held harmless for any loss or liability suffered by us, unless (i) SIC Advisors has determined, in good faith, that the course of conduct which caused the loss or liability was in our best interests; (ii) SIC Advisors was acting on behalf of or performing services for us; (iii) such liability or loss was not the result of misconduct or negligence by SIC Advisors; and (iv) such indemnification or agreement to hold harmless is recoverable only out of our net assets and not from stockholders.
Term; Effective Date
The Investment Advisory Agreement was initially approved by our board of directors on April 5, 2012 and, pursuant to the 1940 Act, remained in effect for a period of two years. Unless earlier terminated as described below, the Investment Advisory Agreement will remain in effect from year-to-year thereafter if approved annually at an in-person meeting of our board of directors by a majority of our directors who are not "interested persons" as defined in the 1940 Act, of the Company or the Adviser, and either our board of directors or the holders of a majority of our outstanding voting securities.
Most recently, our board of directors held an in-person meeting on March 1, 2017, in order to consider and approve the annual approval and continuation of the Investment Advisory Agreement. In its consideration of the Investment Advisory Agreement, the board of directors focused on information it had received relating to, among other things: (a) the nature, quality and extent of the advisory and other services to be provided to us by SIC Advisors; (b) comparative data with respect to advisory fees or similar expenses paid by other BDCs with similar investment objectives; (c) our projected operating expenses and expense ratio compared
23
to BDCs with similar investment objectives; (d) any existing and potential sources of indirect income to SIC Advisors from its relationships with us and the profitability of those relationships; (e) information about the services to be performed and the personnel performing such services under the Investment Advisory Agreement; (f) the organizational capability and financial condition of SIC Advisors and its affiliates; and (g) various other factors.
Based on the information reviewed and the discussions, the board of directors, including a majority of the non-interested directors, concluded that the investment management fee rates and terms are reasonable in relation to the services to be provided and approved the Investment Advisory Agreement for a period of one additional year, which will expire on April 17, 2018. The Investment Advisory Agreement will automatically terminate in the event of its assignment. In accordance with the 1940 Act, we may terminate the Investment Advisory Agreement with SIC Advisors upon 60 days’ written notice. The decision to terminate the agreement may be made by a majority of our independent directors or the holders of a majority of the outstanding shares of our common stock. In addition, SIC Advisors may terminate the Investment Advisory Agreement with us upon 120 days’ written notice.
ADMINISTRATION AGREEMENT AND FEES
Administrative Services
Under the terms of the Administration Agreement, and on our behalf, Medley Capital LLC performs or oversees the performance of various administrative services that we require. These include investor services, general ledger accounting, fund accounting, maintaining required financial records, calculating our net asset value, filing tax returns, preparing and filing SEC reports, preparing, printing and disseminating stockholder reports and generally overseeing the payment of our expenses and the performance of administrative and professional services rendered to us by others. Medley provides us with facilities and access to personnel necessary for our business and these services. For providing these services, facilities and personnel, we reimburse Medley for administrative expenses it incurs in performing its obligations.
Additionally, as a BDC, we must offer managerial assistance to our portfolio companies. This managerial assistance may include monitoring the operations of our portfolio companies, participating in board and management meetings, consulting with and advising officers of our portfolio companies and providing other organizational and financial guidance. Medley will make available such managerial assistance, on our behalf, to our portfolio companies whether or not they request this assistance. We may receive fees for these services and will reimburse Medley for its allocated costs in providing such assistance, subject to review and approval by our board of directors.
Term; Effective Date
The Administration Agreement became effective on April 17, 2012, the date that we met our minimum offering requirement. Pursuant to its terms, and unless earlier terminated as described below, the Administration Agreement will remain in effect from year-to-year if approved annually by a majority of our directors who are not "interested persons" as defined in the 1940 Act, of the Company or Medley Capital LLC, and either the holders of a majority of our outstanding voting securities or our board of directors. Most recently, on March 1, 2017, our board of directors held an in-person meeting in order to consider the annual approval and continuation of our Administration Agreement. Based on the information relating to the terms of the Administration Agreement and the discussions held, the board of directors, including a majority of the non-interested directors, approved the Administration Agreement as being in the best interests of our stockholders. Specifically the board of directors approved the extension of the Administration Agreement for a period of one additional year, which will expire on April 17, 2018.
We may terminate the Administration Agreement with Medley Capital LLC on 60 days’ written notice without penalty. Medley Capital LLC may terminate the Administration Agreement on 120 days’ written notice without penalty.
REGULATION
General
We have elected to be regulated as a BDC under the 1940 Act and have also elected to be treated for tax purposes as a RIC under Subchapter M of the Code. BDCs are closed-end funds that elect to be regulated as BDCs under the 1940 Act. As such, BDCs are subject to only certain provisions of the 1940 Act. BDCs are provided greater flexibility under the 1940 Act than are other investment companies in dealing with their portfolio companies, issuing securities, and compensating their managers. BDCs can be internally or externally managed and may qualify to elect to be taxed as RICs for federal tax purposes. The 1940 Act contains prohibitions and restrictions relating to transactions between BDCs and their affiliates (including any investment advisors or sub-advisors), principal underwriters, and affiliates of those affiliates or underwriters. The 1940 Act requires that a majority of a BDC’s directors be persons other than “interested persons,” as that term is defined in the 1940 Act. In addition, the 1940 Act provides that we may not change the nature of our business so as to cease to be, or withdraw our election as a BDC unless approved by a majority of our outstanding voting securities. The 1940 Act defines “a majority of the outstanding voting securities” as the lesser of: (1) 67%
24
or more of the voting securities present at a meeting if the holders of more than 50% of our outstanding voting securities are present or represented by proxy or (2) more than 50% of our voting securities.
We are generally not able to issue and sell our common stock at a price below net asset value per share. We may, however, sell our common stock, or warrants, options, or rights to acquire our common stock, at a price below the then-current net asset value of our common stock if our board of directors determines that such sale is in our best interests and the best interests of our stockholders, and our stockholders approve such sale. In addition, we may generally issue new shares of our common stock at a price below net asset value in rights offerings to existing stockholders, in payment of dividends, and in certain other limited circumstances.
We may invest up to 100% of our assets in securities acquired directly from issuers in privately negotiated transactions. With respect to such securities, we may, for the purpose of public resale, be deemed an “underwriter” as that term is defined in the Securities Act of 1933, as amended (the “Securities Act”). We do not intend to acquire securities issued by any investment company that exceed the limits imposed by the 1940 Act.
As a BDC, we will not generally be permitted to invest in any portfolio company in which our Advisor or any of their affiliates currently have a controlling interest or to make any co-investments with our Advisor or any of its affiliates without an exemptive order from the SEC. We may, however, invest alongside our Advisor and its affiliates’ other clients in certain circumstances where doing so is consistent with applicable law and SEC staff interpretations. For example, we may invest alongside such other clients’ accounts consistent with guidance promulgated by the SEC Staff permitting us and such other clients’ accounts to purchase interests in a single class of privately placed securities so long as certain conditions are met, including that no investment advisor, acting on our behalf or on behalf of other clients, negotiates any term other than price. We may also invest alongside such other clients as otherwise permissible under regulatory guidance, applicable regulations and our Advisor’s allocation policies. In addition, on November 25, 2013, we received an exemptive order from the SEC that permits us to participate in negotiated co-investment transactions with certain affiliates, each of whose investment adviser is Medley, LLC or an investment adviser controlled by Medley, LLC in a manner consistent with our investment objective, strategies and restrictions, as well as regulatory requirements and other pertinent factors (the “Exemptive Order”). Co-investment under the Exemptive Order is subject to certain conditions therein, including the condition that, in the case of each co-investment transaction, our board of directors determines that it would be advantageous for us to co-invest in a manner described in the Exemptive Order.
Opportunities for co-investments may arise when SIC Advisors or an affiliated adviser becomes aware of investment opportunities that may be appropriate for us and other clients, or affiliated funds. Without the Exemptive Order, we would be substantially limited in our ability to co-invest in privately negotiated transactions with affiliated funds, as a BDC.
Under the Exemptive Order, investment opportunities that are presented to affiliated funds must be referred to us and vice versa. For each such referral, SIC Advisors independently analyzes and evaluates whether the co-investment transaction is appropriate for us. In addition, co-investment transactions under the Exemptive Order are generally subject to the review and approval by our independent directors, which we refer to as the independent director committee. For each co-investment transaction under the Exemptive Order, we follow the conditions of the Exemptive Order, which are designed to ensure the fairness to us of the co-investment transaction. However, neither we nor the affiliated funds are obligated to invest or co-invest when investment opportunities are referred to us or them.
On July 26, 2016, the Company, SIC Advisors and certain other affiliated funds and investment advisers filed an exemptive application for a co-investment order that would supersede the Exemptive Order and allow affiliated registered investment companies to participate in co-investment transactions with us that would otherwise be prohibited under Section 17(d) and 57(a)(4) and Rule 17d-1. The Exemptive Order will remain in effect unless and until the revised application is approved by the SEC. The terms of the revised application are substantially similar to the Exemptive Order.
Business Development Company Regulation: Qualifying Assets
Under the 1940 Act, a BDC may not acquire any asset other than assets of the type listed in Section 55(a) of the 1940 Act, which are referred to as qualifying assets, unless, at the time the acquisition is made, qualifying assets represent at least 70% of the company’s total assets. As discussed in greater detail below, the 1940 Act defines qualifying assets as principally including certain investments by a BDC in eligible portfolio companies. An eligible portfolio company is defined under the 1940 Act as any issuer which:
1. | is organized under the laws of, and has its principal place of business in, the United States; | |
2. | is not an investment company (other than a small business investment company wholly owned by the BDC) or a company that would be an investment company but for certain exclusions under the 1940 Act; and | |
25
3. | satisfies any of the following: | |
a. | does not have any class of securities that is traded on a national securities exchange; | |
b. | has a class of securities listed on a national securities exchange, but has an aggregate market value of outstanding voting and non-voting common equity of less than $250 million; | |
c. | is controlled by a BDC, either alone or as part of a group acting together, and the BDC has an affiliated person who is a director of the eligible portfolio company; or | |
d. | is a small and solvent company having total assets of not more than $4 million and capital and surplus of not less than $2 million. | |
As relevant to our proposed business, the principal categories of qualifying assets under the 1940 Act are the following:
1. | Securities purchased in transactions not involving any public offering from the issuer of such securities, which issuer (subject to certain limited exceptions) is an eligible portfolio company, or from any person who is, or has been during the preceding 13 months, an affiliated person of an eligible portfolio company, or from any other person, subject to such rules as may be prescribed by the SEC. | |
2. | Securities of any eligible portfolio company that we control. | |
3. | Securities purchased in a private transaction from a U.S. issuer that is not an investment company or from an affiliated person of the issuer, or in transactions incident thereto, if the issuer is in bankruptcy and subject to reorganization or if the issuer, immediately prior to the purchase of its securities was unable to meet its obligations as they came due without material assistance other than conventional lending or financing arrangements. | |
4. | Securities of an eligible portfolio company purchased from any person in a private transaction if there is no ready market for such securities and we already own 60% of the outstanding equity of the eligible portfolio company. | |
5. | Securities received in exchange for or distributed on or with respect to securities described in (1) through (4) above, or pursuant to the exercise of warrants or rights relating to such securities. | |
6. | Cash, cash equivalents, U.S. government securities, or high-quality debt securities maturing in one year or less from the time of investment. | |
In addition, a BDC must have been organized and have its principal place of business in the United States and be operated for the purpose of making investments in the types of securities described in (1), (2) or (3) above.
For purposes of Section 55(a) under the 1940 Act, we will treat each asset underlying the TRS as a qualifying asset if the obligor on such asset is an eligible portfolio company and as a non-qualifying asset if the obligor is not an eligible portfolio company. We may, however, accord different treatment to the TRS in the future in accordance with any applicable new rules or interpretations adopted by the staff of the SEC.
Business Development Company Regulation: Control and Managerial Assistance to Portfolio Companies
BDCs generally must offer to make available to the issuer of the securities significant managerial assistance, except in circumstances where either (i) the BDC controls such issuer of securities or (ii) the BDC purchases such securities in conjunction with one or more other persons acting together and one of the other persons in the group makes available such managerial assistance. Making available managerial assistance includes any arrangement whereby the BDC, through its directors, officers, or employees, offers to provide, and, if accepted, does so provide, significant guidance and counsel concerning the management, operations or business objectives and policies of a portfolio company.
Temporary Investments
Pending investment in other types of “qualifying assets,” as described above, our investments may consist of cash, cash equivalents, U.S. government securities, or high-quality debt securities maturing in one year or less from the time of investment so that 70% of our total assets are qualifying assets. Typically, we intend to invest in U.S. Treasury bills or in repurchase agreements, provided that such agreements are fully collateralized by cash or securities issued by the U.S. government or its agencies. A repurchase agreement involves the purchase by an investor, such as us, of a specified security and the simultaneous agreement by the seller to repurchase it at an agreed-upon future date and at a price that is greater than the purchase price by an amount that reflects an agreed-upon interest rate. There is no percentage restriction on the proportion of our assets that may be invested in such repurchase agreements. However, if more than 25% of our total assets constitute repurchase agreements from a single counterparty, we may not meet the diversification requirements in order to qualify to be taxed as a RIC for U.S. federal income tax purposes. Thus, we do not intend to
26
enter into repurchase agreements with a single counterparty in excess of this limit. We expect that our Advisor will monitor the creditworthiness of the counterparties with which we enter into repurchase agreement transactions.
Warrants and Options
Under the 1940 Act, a BDC is subject to restrictions on the amount of warrants, options, restricted stock or rights to purchase shares of capital stock that it may have outstanding at any time. Under the 1940 Act, we may generally only offer warrants provided that (i) the warrants expire by their terms within ten years, (ii) the exercise or conversion price is not less than the current market value at the date of issuance, (iii) our stockholders authorize the proposal to issue such warrants, and our board of directors approves such issuance on the basis that the issuance is in the best interests of us and our stockholders and (iv) if the warrants are accompanied by other securities, the warrants are not separately transferable unless no class of such warrants and the securities accompanying them has been publicly distributed. The 1940 Act also provides that the amount of our voting securities that would result from the exercise of all outstanding warrants, as well as options and rights, at the time of issuance may not exceed 25% of our outstanding voting securities. In particular, the amount of capital stock that would result from the conversion or exercise of all outstanding warrants, options or rights to purchase capital stock cannot exceed 25% of the BDC’s total outstanding shares of capital stock.
Senior Securities
We are permitted, under specified conditions, to issue multiple classes of debt and one class of stock senior to our common stock if our asset coverage, as defined in the 1940 Act, is at least equal to 200% immediately after each such issuance. In addition, while any senior securities remain outstanding, we must prohibit any distribution to our stockholders or the repurchase of such securities or shares unless we meet the applicable asset coverage ratios at the time of the distribution or repurchase. We may also borrow amounts up to 5% of the value of our total assets for temporary or emergency purposes without regard to asset coverage.
For purposes of the asset coverage ratio test applicable to us as a BDC, we will treat the outstanding notional amount of the TRS, less the initial amount of any cash collateral required to be posted by Arbor under the TRS, as a senior security for the life of that instrument. We may, however, accord different treatment to the TRS in the future in accordance with any applicable new rules or interpretations adopted by the staff of the SEC.
Code of Ethics
We have adopted a code of ethics, which we call our “Code of Business Conduct and Ethics,” which covers ethics and business conduct. This document applies to our directors, officers and employees. Our Code of Business Conduct and Ethics is publicly available on the Corporate Governance section of our website under "Corporate Governance" at http://www.sierraincomecorp.com/CorporateGovernance.html. We will report any amendments to or waivers of a required provision of our Code of Business Conduct and Ethics on our website or in a Current Report on Form 8-K. You may read and copy any materials we file with the SEC at the SEC’s Public Reference Room at 100 F Street, NE, Washington, DC 20549. You may obtain information regarding the Public Reference Room by calling the SEC at 1-800-SEC-0330. Information contained on our website is not incorporated by reference into this Annual Report on Form 10-K, and you should not consider that information to be part of this Annual Report on Form 10-K.
Compliance Policies and Procedures
We and our Advisor have each adopted and implemented written compliance policies and procedures reasonably designed to prevent violation of the federal securities laws and are required to review these compliance policies and procedures annually for their adequacy and the effectiveness of their implementation. Our chief compliance officer is responsible for administering our compliance policies and procedures and our Advisor’s chief compliance officer is responsible for administering the compliance policies and procedures for the Advisor.
Proxy Voting Policies and Procedures
We have delegated our proxy voting responsibility to SIC Advisors. SIC Advisors will vote proxies according to our proxy voting policies and procedures which are set forth below. These guidelines are reviewed periodically by the Advisor as well as our board of directors, and, accordingly, are subject to change.
As an investment advisor registered under the 1940 Act, SIC Advisors has a fiduciary duty to act solely in the best interests of its clients. As part of this duty, it recognizes that it must vote client securities in a timely manner free of conflicts of interest and in the best interests of its clients. These policies and procedures for voting proxies for the investment advisory clients of SIC Advisors are intended to comply with Section 206 of, and Rule 206(4)-6 under, the 1940 Act.
27
Proxy Policies
SIC Advisors will vote proxies relating to our securities in a manner that it believes, in its discretion, to be in the best interest of our stockholders. It will review on a case-by-case basis each proposal submitted for a stockholder vote taking into account relevant factors, including: (1) the impact on the value of the securities; (2) the anticipated costs and benefits associated with the proposal; (3) the effect on liquidity; and (4) customary industry and business practices. Although SIC Advisors will generally vote against proposals that may have a negative impact on its clients’ portfolio securities, it may vote for such a proposal if there exists compelling long-term reasons to do so.
The proxy voting decisions of SIC Advisors are made by its portfolio managers and investment professionals under the supervision of SIC Advisors legal/compliance department. To ensure that its vote is not the product of a conflict of interest, it will require that: (a) the recommended vote be approved by a member of SIC Advisors legal/compliance department prior to being submitted to the custodian; (b) associates involved in the decision making process or vote administration are prohibited from revealing how SIC Advisors intends to vote on a proposal in order to reduce any attempted influence from interested parties; and (c) where a material conflict of interest exists, the chief compliance officer designate an individual or group who can impartially help decide how to resolve such conflict.
Proxy Voting Records
You may obtain information, without charge, regarding how SIC Advisors voted proxies with respect to our portfolio securities by making a written request for proxy voting information to: Chief Compliance Officer, c/o Sierra Income Corporation at 280 Park Ave, 6th Floor East, New York, NY 10017.
Securities Exchange Act and Sarbanes-Oxley Act
We are subject to the reporting and disclosure requirements of the Exchange Act, including the filing of quarterly, annual and current reports, proxy statements and other required items. In addition, we are subject to the Sarbanes-Oxley Act of 2002, which imposes a wide variety of regulatory requirements on publicly-held companies and their insiders. Many of these requirements will affect us. For example:
• | pursuant to Rule 13a-14 of the Exchange Act, our chief executive officer and chief financial officer are required to certify the accuracy of the financial statements contained in our periodic reports; |
• | pursuant to Item 307 of Regulation S-K, our periodic reports are required to disclose our conclusions about the effectiveness of our disclosure controls and procedures; |
• | pursuant to Rule 13a-15 of the Exchange Act, our management is required to prepare a report regarding its assessment of our internal control over financial reporting; and |
• | pursuant to Item 308 of Regulation S-K and Rule 13a-15 of the Exchange Act, our periodic reports must disclose whether there were significant changes in our internal control over financial reporting or in other factors that could significantly affect these controls subsequent to the date of their evaluation, including any corrective actions with regard to significant deficiencies and material weaknesses. |
The Sarbanes-Oxley Act requires us to review our policies and procedures to determine whether we comply with the Sarbanes-Oxley Act and its regulations. We intend to monitor our compliance with all regulations that are adopted under the Sarbanes-Oxley Act and will take actions necessary to ensure that we are in compliance.
Other
We are required to provide and maintain a bond issued by a reputable fidelity insurance company to protect us against larceny and embezzlement.
Election to Be Taxed as a RIC
We have elected and intend to continue to qualify to be treated as a RIC under Subchapter M of the Code. As a RIC, we generally do not have to pay corporate-level U.S. federal income taxes on any income that we distribute to our stockholders from our tax earnings and profits. To maintain our qualification as a RIC, we must, among other things, meet certain source-of-income and asset diversification requirements (as described below). In addition, in order to obtain and maintain RIC tax treatment, we must distribute to our stockholders, for each taxable year, at least 90% of our “investment company taxable income,” which is generally our net ordinary income plus the excess, if any, of realized net short-term capital gains over realized net long-term capital losses, or the Annual Distribution Requirement.
28
Taxation as a Regulated Investment Company
If we:
• | maintain our qualification as a RIC; and |
• | satisfy the Annual Distribution Requirement, |
then we will not be subject to U.S. federal income tax on the portion of our income we distribute (or are deemed to distribute) to stockholders. We will be subject to U.S. federal income tax at the regular corporate rates on any income or capital gains not distributed (or deemed distributed) to our stockholders.
We will be subject to a 4% nondeductible U.S. federal excise tax on certain undistributed income unless we distribute in a timely manner an amount at least equal to the sum of (1) 98% of our net ordinary income for each calendar year, (2) 98.2% of our capital gain net income for the one-year period ending October 31 in that calendar year and (3) any income recognized, but not distributed, in preceding years and on which we paid no U.S. federal income tax, or the Excise Tax Avoidance Requirement. We generally will endeavor in each taxable year to avoid any U.S. federal excise tax on our earnings.
In order to maintain our qualification as a RIC for U.S. federal income tax purposes, we must, among other things:
• | continue to qualify as a BDC under the 1940 Act at all times during each taxable year; |
• | derive in each taxable year at least 90% of our gross income from dividends, interest, payments with respect to certain securities, loans, gains from the sale of stock or other securities, net income from certain “qualified publicly traded partnerships,” or other income derived with respect to our business of investing in such stock or securities, or the 90% Income Test; and |
• | diversify our holdings so that at the end of each quarter of the taxable year: |
• | at least 50% of the value of our assets consists of cash, cash equivalents, U.S. Government securities, securities of other RICs, and other securities if such other securities of any one issuer do not represent more than 5% of the value of our assets or more than 10% of the outstanding voting securities of the issuer; and |
• | no more than 25% of the value of our assets is invested in the securities, other than U.S. government securities or securities of other RICs, of one issuer, of two or more issuers that are controlled, as determined under applicable Code rules, by us and that are engaged in the same or similar or related trades or businesses or of certain “qualified publicly traded partnerships,” or the Diversification Tests. |
For U.S. federal income tax purposes, we may be required to recognize taxable income in circumstances in which we do not receive a corresponding payment in cash. For example, if we hold debt obligations that are treated under applicable tax rules as having original issue discount (such as debt instruments with PIK interest or, in certain cases, increasing interest rates or debt instruments that were issued with warrants), we must include in income each year a portion of the original issue discount that accrues over the life of the obligation, regardless of whether cash representing such income is received by us in the same taxable year. We may also have to include in income other amounts that we have not yet received in cash, such as deferred loan origination fees that are paid after origination of the loan or are paid in non-cash compensation such as warrants or stock. We anticipate that a portion of our income may constitute original issue discount or other income required to be included in taxable income prior to receipt of cash.
Because any original issue discount or other amounts accrued will be included in our investment company taxable income for the year of the accrual, we may be required to make a distribution to our stockholders in order to satisfy the Annual Distribution Requirement, even though we will not have received any corresponding cash amount. As a result, we may have difficulty meeting the annual distribution requirement necessary to obtain and maintain RIC tax treatment under the Code. We may have to sell some of our investments at times and/or at prices we would not consider advantageous, raise additional debt or equity capital or forgo new investment opportunities for this purpose. If we are not able to obtain cash from other sources, we may fail to qualify for RIC tax treatment and thus become subject to corporate-level U.S. federal income tax. Our ability to dispose of assets to meet our distribution requirements may be limited by (1) the illiquid nature of our portfolio and/or (2) other requirements relating to our status as a RIC, including the Diversification Tests. If we dispose of assets in order to meet the Annual Distribution Requirement or the Excise Tax Avoidance Requirement, we may make such dispositions at times that, from an investment standpoint, are not advantageous.
Under the 1940 Act, we are not permitted to make distributions to our stockholders while our debt obligations and other senior securities are outstanding unless certain “asset coverage” tests are met. See “Regulation — Senior Securities.” As a result, we may be prohibited from making distributions necessary to satisfy the Annual Distribution Requirement. Even if we are not prohibited from making distributions, our ability to raise additional capital to satisfy the Annual Distribution Requirement may be limited. If
29
we are not able to make sufficient distributions to satisfy the Annual Distribution Requirement, we may fail to qualify for RIC tax treatment and thus become subject to corporate-level U.S. federal income tax.
Certain of our investment practices may be subject to special and complex U.S. federal income tax provisions that may, among other things, (1) treat dividends that would otherwise constitute qualified dividend income as non-qualified dividend income, (2) disallow, suspend or otherwise limit the allowance of certain losses or deductions, (3) convert lower-taxed long-term capital gain into higher-taxed short-term capital gain or ordinary income, (4) convert an ordinary loss or a deduction into a capital loss (the deductibility of which is more limited), (5) cause us to recognize income or gain without receipt of a corresponding distribution of cash, (6) adversely affect the time as to when a purchase or sale of stock or securities is deemed to occur, (7) adversely alter the characterization of certain complex financial transactions and (8) produce income that will not be qualifying income for purposes of the 90% Income Test. We intend to monitor its transactions and may make certain tax elections to mitigate the potential adverse effect of these provisions, but there can be no assurance that any adverse effects of these provisions will be mitigated.
If we purchase shares in a “passive foreign investment company” (a “PFIC”), we may be subject to U.S. federal income tax on its allocable share of a portion of any “excess distribution” received on, or any gain from the disposition of, such shares even if our allocable share of such income is distributed as a taxable dividend to its stockholders. Additional charges in the nature of interest generally will be imposed on us in respect of deferred taxes arising from any such excess distribution or gain. If we invest in a PFIC and elects to treat the PFIC as a “qualified electing fund” under the Code (a “QEF”), in lieu of the foregoing requirements, we will be required to include in income each year our proportionate share of the ordinary earnings and net capital gain of the QEF, even if such income is not distributed by the QEF. Alternatively, we may be able to elect to mark-to-market at the end of each taxable year its shares in a PFIC; in this case, we will recognize as ordinary income our allocable share of any increase in the value of such shares, and as ordinary loss our allocable share of any decrease in such value to the extent that any such decrease does not exceed prior increases included in its income. Under either election, we may be required to recognize in a year income in excess of distributions from PFICs and proceeds from dispositions of PFIC stock during that year, and such income will nevertheless be subject to the Annual Distribution Requirement and will be taken into account for purposes of the 4% U.S. federal excise tax. In addition, under recently proposed regulations, income required to be included as a result of a QEF election would not be qualifying income for purposes of the 90% Income Test unless we receive a distribution of such income from the PFIC in the same taxable year to which the inclusion relates.
Failure to Maintain Our Qualification as a RIC
If we fail to satisfy the 90% Income Test or the Diversification Tests for any taxable year, we may nevertheless continue to qualify as a RIC for such year if certain relief provisions are applicable (which may, among other things, require us to pay certain corporate-level U.S. federal income taxes or to dispose of certain assets).
If we were unable to qualify for treatment as a RIC and the foregoing relief provisions are not applicable, we would be subject to tax on all of our taxable income at regular corporate rates, regardless of whether we make any distributions to our stockholders. Distributions would not be required, and any distributions made in taxable years beginning on or before December 31, 2012 would be taxable to our stockholders as ordinary dividend income that, subject to certain limitations, may be eligible for the 15% maximum rate to the extent of our current and accumulated earnings and profits provided certain holding period and other requirements were met. Subject to certain limitations under the Code, corporate distributees would be eligible for the dividends-received deduction. Distributions in excess of our current and accumulated earnings and profits would be treated first as a return of capital to the extent of the stockholder’s tax basis, and any remaining distributions would be treated as a capital gain. To requalify as a RIC in a subsequent taxable year, we would be required to satisfy the RIC qualification requirements for that year and dispose of any earnings and profits from any year in which we failed to qualify as a RIC. Subject to a limited exception applicable to RICs that qualified as such under Subchapter M of the Code for at least one year prior to disqualification and that requalify as a RIC no later than the second year following the nonqualifying year, we could be subject to tax on any unrealized net built-in gains in the assets held by us during the period in which we failed to qualify as a RIC that are recognized within the subsequent 5 years, unless we made a special election to pay corporate-level U.S. federal income tax on such built-in gain at the time of our requalification as a RIC.
Item 1A.
RISK FACTORS
Investing in our common stock involves a number of significant risks. In addition to the other information contained in this annual report on Form 10-K, you should consider carefully the following information before making an investment in our common stock. The risks below are not the only risks we face. Additional risks and uncertainties not presently known to us or not presently deemed material by us may also impair our operations and performance. If any of the following events occur, our business, financial condition and results of operations could be materially and adversely affected. In such case, the net asset value of our common stock could decline, and you may lose all or part of your investment.
30
Risks Relating to Our Business and Structure
The capital markets may experience periods of disruption and instability. Such market conditions may materially and adversely affect debt and equity capital markets, which may have a negative impact on our business, financial condition and operations.
From time to time, capital markets may experience periods of disruption and instability. The U.S. and global capital markets experienced extreme volatility and disruption during the economic downturn that began in mid-2007, and the U.S. economy was in a recession for several consecutive calendar quarters during the same period. In 2010, a financial crisis emerged in Europe, triggered by high budget deficits and rising direct and contingent sovereign debt, which created concerns about the ability of certain nations to continue to service their sovereign debt obligations. Risks resulting from such debt crisis, including any austerity measures taken in exchange for bailout of certain nations, and any future debt crisis in Europe or any similar crisis elsewhere could have a detrimental impact on the global economic recovery, sovereign and non-sovereign debt in certain countries and the financial condition of financial institutions generally. In the second quarter of 2015, stock prices in China experienced a significant drop, resulting primarily from continued sell-off of shares trading in Chinese markets. In August 2015, Chinese authorities sharply devalued China’s currency. In addition, the referendum by British voters to exit the European Union (‘‘Brexit’’) in June 2016 has led to further disruption and instability in the global markets, and the implications of the United Kingdom's pending withdrawal from the European Union are unclear at present. There can be no assurance these market conditions will not continue or worsen in the future. These market conditions have historically and could again have a material adverse effect on debt and equity capital markets in the United States and Europe, which could have a materially negative impact on our business, financial condition and results of operations. We and other companies in the financial services sector may have to access, if available, alternative markets for debt and equity capital.
As a result of the 2016 U.S. election, the Republican Party currently controls both the executive and legislative branches of government, which increases the likelihood that legislation may be adopted that could significantly affect the regulation of U.S. financial markets. Areas subject to potential change, amendment or repeal include the Dodd-Frank Act and the authority of the Federal Reserve and the Financial Stability Oversight Council. The United States may also potentially withdraw from or renegotiate various trade agreements and take other actions that would change current trade policies of the United States. We cannot predict which, if any, of these actions will be taken or, if taken, their effect on the financial stability of the United States. Such actions could have a significant adverse effect on our business, financial condition and results of operations. We cannot predict the effects of these or similar events in the future on the U.S. economy and securities markets or on our investments. We monitor developments and seek to manage our investments in a manner consistent with achieving our investment objective, but there can be no assurance that we will be successful in doing so.
Equity capital may be difficult to raise during periods of adverse or volatile market conditions because, subject to some limited exceptions, as a BDC, we are generally not able to issue additional shares of our common stock at a price less than net asset value without first obtaining approval for such issuance from our stockholders and our independent directors. Volatility and dislocation in the capital markets can also create a challenging environment in which to raise or access debt capital. The reappearance of market conditions similar to those experienced from 2008 through 2009 for any substantial length of time could make it difficult to extend the maturity of or refinance our existing indebtedness or obtain new indebtedness with similar terms and any failure to do so could have a material adverse effect on our business. The debt capital that will be available to us in the future, if at all, may be at a higher cost and on less favorable terms and conditions than what we currently experience. If we are unable to raise or refinance debt, then our equity investors may not benefit from the potential for increased returns on equity resulting from leverage and we may be limited in our ability to make new commitments or to fund existing commitments to our portfolio companies. Significant changes or volatility in the capital markets may also have a negative effect on the valuations of our investments. While most of our investments are not publicly traded, applicable accounting standards require us to assume as part of our valuation process that our investments are sold in a principal market to market participants (even if we plan on holding an investment through its maturity).
Significant changes in the capital markets may also affect the pace of our investment activity and the potential for liquidity events involving our investments. Thus, the illiquidity of our investments may make it difficult for us to sell such investments to access capital if required, and as a result, we could realize significantly less than the value at which we have recorded our investments if we were required to sell them for liquidity purposes. An inability to raise or access capital could have a material adverse effect on our business, financial condition or results of operations.
Significant developments stemming from the United Kingdom’s referendum on membership in the European Union could have a material adverse effect on us.
On June 23, 2016, the United Kingdom held a referendum in which a majority of voters voted in favor of leaving the European Union (“Brexit”), and, accordingly, on February 1, 2017, the U.K. Parliament voted in favor of allowing the U.K. government to begin the formal process of Brexit. Brexit has created political and economic uncertainty, particularly in the United Kingdom and the European
31
Union, and this uncertainty may last for years. Negotiations are expected to commence to determine the future terms of the United Kingdom’s relationship with the European Union. Events that could occur in the future as a consequence of the United Kingdom’s withdrawal, including the possible breakup of the United Kingdom, may continue to cause significant volatility in global financial markets, including in global currency and credit markets. This volatility could cause a slowdown in economic activity in the United Kingdom, Europe or globally, which could adversely affect our operating results and growth prospects. Any of these effects of Brexit, and others we cannot anticipate, could have unpredictable consequences for credit markets and adversely affect our business, results of operations and financial performance.
The downgrade of the U.S. credit rating and economic crisis in Europe could negatively impact our business, financial condition and earnings.
U.S. debt ceiling and budget deficit concerns together with signs of deteriorating sovereign debt conditions in Europe continue to present the possibility of a credit-rating downgrade, economic slowdowns, or a recession for the United States. The impact of any further downgrades to the U.S. government’s sovereign credit rating or downgraded sovereign credit ratings of European countries or the Russian Federation, or their perceived creditworthiness could adversely affect the U.S. and global financial markets and economic conditions. These developments, along with any further European sovereign debt issues, could cause interest rates and borrowing costs to rise, which may negatively impact our ability to access the debt markets on favorable terms. Continued adverse economic conditions could have a material adverse effect on our business, financial condition and results of operations.
In October 2014, the Federal Reserve announced that it was concluding its bond-buying program. It is unknown what effect, if any, the conclusion of this program will have on credit markets and the value of our investments. These and any future developments and reactions of the credit markets toward these developments could cause interest rates and borrowing costs to rise, which may negatively impact our ability to obtain debt financing on favorable terms. On December 14, 2016, the Federal Reserve raised the target range for the federal funds rate to a range between 0.50% to 0.75%. However, if key economic indicators, such as the unemployment rate or inflation, do not progress at a rate consistent with the Federal Reserve’s objectives, the target range for the federal funds rate may increase and cause interest rates and borrowing costs to rise, which may negatively impact our ability to access the debt markets on favorable terms. Any continued adverse economic conditions could have material adverse effect on our business, financial condition and results of operations.
Rising interest rates may adversely affect the value of our portfolio investments which could have an adverse effect on our business, financial condition and results of operations.
Our debt investments may be based on floating rates, such as LIBOR, EURIBOR, the Federal Funds Rate or the Prime Rate. General interest rate fluctuations may have a substantial negative impact on our investments, the value of our shares and our rate of return on invested capital. A reduction in the interest rates on new investments relative to interest rates on current investments could also have an adverse impact on our net interest income. An increase in interest rates could decrease the value of any investments we hold which earn fixed interest rates, including subordinated loans, senior and junior secured and unsecured debt securities and loans and high yield bonds, and also could increase our interest expense, thereby decreasing our net income. Also, an increase in interest rates available to investors could make investment in our shares less attractive if we are not able to increase our distribution rate, which could reduce the value of our shares.
Because we may borrow funds and may issue preferred shares to finance investments, our net investment income may depend, in part, upon the difference between the rate at which we borrow funds or pay distributions on preferred shares and the rate that our investments yield. As a result, we can offer no assurance that a significant change in market interest rates will not have a material adverse effect on our net investment income. In periods of rising interest rates, our cost of funds would increase except to the extent we have issued fixed rate debt or preferred shares, which could reduce our net investment income.
You should also be aware that a change in the general level of interest rates can be expected to lead to a change in the interest rate we receive on many of our debt investments. Accordingly, a change in the interest rate could make it easier for us to meet or exceed the performance threshold and may result in a substantial increase in the amount of incentive fees payable to our Advisor with respect to the portion of the incentive fee based on income.
Changes relating to the LIBOR calculation process may adversely affect the value of our portfolio of LIBOR-indexed, floating-rate debt securities.
In the recent past, concerns have been publicized that some of the member banks surveyed by the British Bankers’ Association (‘‘BBA’’) in connection with the calculation of LIBOR across a range of maturities and currencies may have been under-reporting or otherwise manipulating the inter-bank lending rate applicable to them in order to profit on their derivatives positions or to avoid an
32
appearance of capital insufficiency or adverse reputational or other consequences that may have resulted from reporting inter-bank lending rates higher than those they actually submitted. A number of BBA member banks entered into settlements with their regulators and law enforcement agencies with respect to alleged manipulation of LIBOR, and investigations by regulators and governmental authorities in various jurisdictions are ongoing.
Actions by the BBA, regulators or law enforcement agencies as a result of these or future events, may result in changes to the manner in which LIBOR is determined. Potential changes, or uncertainty related to such potential changes may adversely affect the market for LIBOR-based securities, including our portfolio of LIBOR-indexed, floating-rate debt securities. In addition, any further changes or reforms to the determination or supervision of LIBOR may result in a sudden or prolonged increase or decrease in reported LIBOR, which could have an adverse impact on the market for LIBOR-based securities or the value of our portfolio of LIBOR-indexed, floating-rate debt securities.
Our business and operation could be negatively affected if we become subject to any securities litigation or stockholder activism, which could cause us to incur significant expense, hinder execution of investment strategy and impact our stock price.
In the past, following periods of volatility in the market price of a company’s securities, securities class-action litigation has often been brought against that company. Stockholder activism, which could take many forms or arise in a variety of situations, has been increasing in the BDC space recently. While we are currently not subject to any securities litigation or stockholder activism, due to the potential volatility of our stock price and for a variety of other reasons, we may in the future become the target of securities litigation or stockholder activism. Securities litigation and stockholder activism, including potential proxy contests, could result in substantial costs and divert management’s and our board of directors’ attention and resources from our business. Additionally, such securities litigation and stockholder activism could give rise to perceived uncertainties as to our future, adversely affect our relationships with service providers and make it more difficult to attract and retain qualified personnel. Also, we may be required to incur significant legal fees and other expenses related to any securities litigation and activist stockholder matters. Further, our stock price could be subject to significant fluctuation or otherwise be adversely affected by the events, risks and uncertainties of any securities litigation and stockholder activism.
We are highly dependent on information systems and systems failures could significantly disrupt our business, which may, in turn, negatively affect the market price of our common stock and our ability to pay dividends.
Our business is highly dependent on our and third parties’ communications and information systems. Any failure or interruption of those systems, including as a result of the termination of an agreement with any third-party service providers, could cause delays or other problems in our activities. Our financial, accounting, data processing, backup or other operating systems and facilities may fail to operate properly or become disabled or damaged as a result of a number of factors including events that are wholly or partially beyond our control and adversely affect our business. There could be:
• sudden electrical or telecommunications outages;
• natural disasters such as earthquakes, tornadoes and hurricanes;
• disease pandemics;
• events arising from local or larger scale political or social matters, including terrorist acts; and
• cyber-attacks.
These events, in turn, could have a material adverse effect on our operating results and negatively affect the market price of our common stock and our ability to pay dividends to our stockholders.
We face cybersecurity risks. If we are unable to maintain the availability of our electronic data systems and safeguard the security of our data, our ability to conduct business may be compromised, which could impair our liquidity, disrupt our business, damage our reputation and cause losses.
Cybersecurity refers to the combination of technologies, processes, and procedures established to protect information technology systems and data from unauthorized access, attack, or damage. We are subject to cybersecurity risks and third parties with which we do business may also be sources of cybersecurity or other technological risk. Information cybersecurity risks have significantly increased in recent years and, while we have not experienced any material losses relating to cyber attacks or other information security breaches, we could suffer such losses in the future. Our computer systems, software and networks may be vulnerable to unauthorized access, computer viruses or other malicious code and other events that could have a security impact. If one or more of such events occur, this
33
potentially could jeopardize confidential and other information, including nonpublic personal information and sensitive business data, processed and stored in, and transmitted through, our computer systems and networks, or otherwise cause interruptions or malfunctions in our operations or the operations of our customers or counterparties, which could result in significant losses or reputational damage. This could result in significant losses, reputational damage, litigation, regulatory fines or penalties, or otherwise adversely affect our business, financial condition or results of operations. Privacy and information security laws and regulation changes, and compliance with those changes, may result in cost increases due to system changes and the development of new administrative processes. In addition, we may be required to expend significant additional resources to modify our protective measures and to investigate and remediate vulnerabilities or other exposures arising from operational and security risks. We currently do not maintain insurance coverage relating to cybersecurity risks, and we may be required to expend significant additional resources to modify our protective measures or to investigate and remediate vulnerabilities or other exposures, and we may be subject to litigation and financial losses that are not fully insured.
Cybersecurity failures or breaches by our Advisor, other service providers (including, but not limited to, accountants, custodians, transfer agents and administrators), and the issuers of securities in which we invest also have the ability to cause disruptions and impact business operations, potentially resulting in financial losses, interference with our ability to calculate net asset value, impediments to trading, the inability of our stockholders to transact business, violations of applicable privacy and other laws, regulatory fines, penalties, reputational damage, reimbursement or other compensation costs, or additional compliance costs. In addition, substantial costs may be incurred in order to prevent any cyber incidents in the future.
We outsource certain functions and these relationships allow for the storage and processing of our information, as well as customer, counterparty, employee and borrower information. While we engage in actions to reduce our exposure resulting from outsourcing, ongoing threats may result in unauthorized access, loss, exposure or destruction of data, or other cybersecurity incidents, with increased costs and other consequences, including those described above.
Difficult market and political conditions may adversely affect our business in many ways, including by reducing the value or hampering the performance of the investments made by our portfolio companies, each of which could materially and adversely affect our business, results of operations and financial condition.
Our business is materially affected by conditions in the global financial markets and economic and political conditions throughout the world, such as interest rates, availability and cost of credit, inflation rates, economic uncertainty, changes in laws (including laws relating to our taxation, taxation of our investors, the possibility of changes to tax laws in either the United States or any non-U.S. jurisdiction and regulations on asset managers), trade barriers, commodity prices, currency exchange rates and controls and national and international political circumstances (including wars, terrorist acts and security operations). These factors are outside of our control and may affect the level and volatility of asset prices and the liquidity and value of investments, and we may not be able to or may choose not to manage our exposure to these conditions. Ongoing developments in the U.S. and global financial markets following the turmoil in the global capital markets and the financial services industry in late 2008 and early 2009 continue to illustrate that the current environment is still one of uncertainty and instability for investment management businesses. In the future, the U.S. government may not be able to meet its debt payments unless the federal debt ceiling is raised. The federal debt limit has been suspended since November 2, 2015, but the limit is set to be reinstated on March 15, 2017. If legislation increasing the debt ceiling is not enacted, as needed, and the debt ceiling is reached, the U.S. federal government may stop or delay making payments on its obligations, which could negatively impact the U.S. economy. These and other conditions in the global financial markets and the global economy may result in adverse consequences for our portfolio companies, including by reducing the value or hampering the performance of the investments made by our portfolio companies, each of which could materially affect our business, results of operations and financial condition.
A failure on our part to maintain our status as a BDC would significantly reduce our operating flexibility.
If we fail to maintain our status as a BDC, we might be regulated as a closed-end investment company that is required to register under the 1940 Act, which would subject us to additional regulatory restrictions and significantly decrease our operating flexibility. In addition, any such failure could cause an event of default under our outstanding indebtedness, which could have a material adverse effect on our business, financial condition or results of operations.
We may suffer credit losses.
Private debt in the form of secured loans to corporate and asset-based borrowers is highly speculative and involves a high degree of risk of credit loss, and therefore an investment in our securities may not be suitable for someone with a low tolerance for risk. These risks are likely to increase during an economic recession, such as the economic recession or downturn that the United States and many other countries have recently experienced or are experiencing.
34
Price declines in the corporate leveraged loan market may adversely affect the fair value of our portfolio, reducing our net asset value through increased net unrealized depreciation.
Prior to the onset of the financial crisis that began in 2007, securitized investment vehicles, hedge funds and other highly leveraged non-bank financial institutions comprised the majority of the market for purchasing and holding senior and subordinated debt. As the trading price of the loans underlying these portfolios began to deteriorate beginning in the first quarter of 2007, we believe that many institutions were forced to raise cash by selling their interests in performing assets in order to satisfy margin requirements or the equivalent of margin requirements imposed by their lenders. This resulted in a forced deleveraging cycle of price declines, compulsory sales, and further price declines, with falling underlying credit values, widespread redemption requests, and other constraints resulting from the credit crisis generating further selling pressure.
Conditions in the medium- and large-sized U.S. corporate debt market may experience similar or worse disruption or deterioration in the future, which may cause pricing levels to similarly decline or be volatile. As a result, our net asset value could decline through an increase in unrealized depreciation and incurrence of realized losses in connection with the sale of our investments, which could have a material adverse impact on our business, financial condition and results of operations.
Our ability to achieve our investment objective depends on our Advisor’s ability to manage and support our investment process. If the Advisor was to lose a significant number of its key professionals, our ability to achieve our investment objective could be significantly harmed.
We have no internal management capacity or employees other than our appointed executive officers and are dependent upon the investment expertise, skill and network of business contacts of our Advisor to achieve our investment objective. Our Advisor will evaluate, negotiate, structure, execute, monitor, and service our investments. Our future success depends to a significant extent on the continued service and coordination of our Advisor, including its key professionals. The departure of a significant number of our Advisor’s key professionals could have a material adverse effect on our ability to achieve our investment objective. Our ability to achieve our investment objective also depends on the ability of our Advisor to identify, analyze, invest in, finance, and monitor companies that meet our investment criteria. Our Advisor’s capabilities in structuring the investment process, providing competent, attentive and efficient services to us, and facilitating access to financing on acceptable terms depend on the involvement of investment professionals in an adequate number and of adequate sophistication to match the corresponding flow of transactions. To achieve our investment objective, our Advisor may need to retain, hire, train, supervise, and manage new investment professionals to participate in our investment selection and monitoring process. Our Advisor may not be able to find qualified investment professionals in a timely manner or at all. Any failure to do so could have a material adverse effect on our business, financial condition and results of operations.
In addition, the Investment Advisory Agreement has termination provisions that allow the agreement to be terminated by us on 60 days’ notice or by SIC Advisors on 120 days’ notice without penalty.
We depend upon senior management personnel of SIC Advisors for our future success, and if SIC Advisors is unable to retain qualified personnel or if SIC Advisors loses any member of its senior management team, our ability to achieve our investment objective could be significantly harmed.
We depend on our investment management team, or the Investment Team, which is provided by SIC Advisors, for the identification, final selection, structuring, closing and monitoring of our investments. Our Investment Team is integral to our asset management activities and has critical industry experience and relationships that we will rely on to implement our business plan. Our future success depends on our Investment Team’s continued service to SIC Advisors. The departure of any of the members of SIC Advisors’ Investment Team could have a material adverse effect on our ability to achieve our investment objective. As a result, we may not be able to operate our business as we expect, and our ability to compete could be harmed, which could cause our operating results to suffer. In addition, we can offer no assurance that SIC Advisors will remain our investment adviser or our administrator.
Our investment adviser may not be able to achieve the same or similar returns as those achieved in the past by our senior management and Investment Team.
The track record and achievements of the senior management and Investment Team of SIC Advisors are not necessarily indicative of future results that will be achieved by our investment adviser. As a result, our investment adviser may not be able to achieve the same or similar returns as those achieved by our senior management and Investment Team during their tenure with SIC Advisors or while they were employed at prior positions.
Because we expect to distribute substantially all of our net investment income and net realized capital gains to our stockholders, we will need additional capital to finance our growth and such capital may not be available on favorable terms or at all.
35
We have elected and qualified to be taxed for U.S. federal income tax purposes as a RIC under Subchapter M of the Code. As a RIC, we must meet certain requirements, including source-of-income, asset diversification and distribution requirements in order to not have to pay corporate-level U.S. federal income taxes on income we distribute to our stockholders as dividends, which allows us to substantially reduce or eliminate our corporate-level U.S. federal income tax liability. As a BDC, we are generally required to meet a coverage ratio of total assets to total senior securities, which includes all of our borrowings and any preferred stock we may issue in the future, of at least 200% at the time we issue any debt or preferred stock. This requirement limits the amount of our leverage. Because we will continue to need capital to grow our investment portfolio, this limitation may prevent us from incurring debt or issuing preferred stock and require us to raise additional equity at a time when it may be disadvantageous to do so. We cannot assure you that debt and equity financing will be available to us on favorable terms, or at all, and debt financings may be restricted by the terms of any of our outstanding borrowings. In addition, as a BDC, we are generally not permitted to issue common stock priced below NAV without stockholder approval. If additional funds are not available to us, we could be forced to curtail or cease new lending and investment activities, and our NAV could decline.
The amount of any distributions we pay is uncertain. We may not be able to pay you distributions or be able to sustain them and our distributions may not grow over time.
We began declaring semi-monthly distributions, which are paid on a monthly basis, to our stockholders beginning in July 2012 and intend to continue declaring semi-monthly distributions to stockholders, to the extent that we have assets legally available for distribution. We cannot assure you that we will achieve investment results that will allow us to make a targeted level of cash distributions or year-to-year increases in cash distributions. All distributions that we make will be at the discretion of our board of directors and will depend on our earnings, our financial condition, maintenance of our RIC status and other factors as our board of directors may deem to be relevant. Our ability to pay distributions might be adversely affected by the impact of the risks described in this annual report on Form 10-K. In addition, the inability to satisfy the asset coverage test applicable to us as a BDC may limit our ability to pay distributions. As a result, we cannot assure you that we will pay distributions to our stockholders in the future.
Our distribution proceeds may exceed our earnings, particularly during the period before we have substantially invested the net proceeds from our offering. We have not established any limit on the extent to which we may use borrowings, if any, or proceeds from our offering to fund distributions, which may reduce the amount of capital we ultimately invest in assets.
The distributions we pay to our stockholders may exceed earnings, particularly during the period before we have substantially invested the net proceeds from our offering. In the event that we encounter delays in locating suitable investment opportunities, we may pay our distributions from the proceeds of our offering or from borrowings in anticipation of future cash flow, which may constitute a return of your capital and will lower your tax basis in your shares. Distributions from the proceeds of our offering or from borrowings also could reduce the amount of capital we ultimately invest in portfolio companies. Accordingly, stockholders who receive the payment of a dividend or other distribution from us should not assume that such dividend or other distribution is the result of a net profit earned by us.
You will have limited opportunities to sell your shares and, to the extent you are able to sell your shares under our share repurchase program, you may not be able to recover the amount of your investment in our shares.
Our share repurchase program includes numerous restrictions that limit your ability to sell your shares. Unless our board of directors determines otherwise, we limit the number of shares to be repurchased during any calendar year to the number of shares we can repurchase with the proceeds we receive from the issuance of shares of our common stock under our distribution reinvestment plan. At the discretion of our board of directors, we may also use cash on hand, cash available from borrowings and cash from the sale of our investments as of the end of the applicable quarter to repurchase shares. We limit repurchases in each quarter to 2.5% of the weighted average number of shares of our common stock outstanding in the prior four calendar quarters. To the extent that the number of shares put to us for repurchase exceeds the number of shares that we are able to purchase, we will repurchase shares on a pro rata basis, not on a first-come, first-served basis. Further, we will have no obligation to repurchase shares if the repurchase would violate the restrictions on distributions under federal law or Maryland law, which prohibits distributions that would cause a corporation to fail to meet statutory tests of solvency. These limits may prevent us from accommodating all repurchase requests made in any year. In addition, our board of directors may suspend or terminate the share repurchase program. We will notify you of such developments: (i) in our periodic or current reports or (ii) by means of a separate mailing to you. In addition, we will have discretion to suspend or terminate the program, and to cease repurchases. Further, the program may have many limitations and should not be relied upon as a method to sell shares promptly and at a desired price.
Because our business model depends to a significant extent upon relationships with corporations, financial institutions and investment firms, the inability of our Advisor to maintain or develop these relationships, or the failure of these relationships to generate investment opportunities, could adversely affect our business.
36
SIC Advisors depends on its relationships with corporations, financial institutions and investment firms, and we rely indirectly to a significant extent upon these relationships to provide us with potential investment opportunities. If SIC Advisors fails to maintain its existing relationships or develop new relationships or sources of investment opportunities, we may not be able to grow our investment portfolio. In addition, individuals with whom SIC Advisors have relationships are not obligated to provide us with investment opportunities, and, therefore, there is no assurance that such relationships will generate investment opportunities for us.
A significant portion of our investment portfolio is recorded at fair value as determined in good faith by our board of directors and, as a result, there will be uncertainty as to the value of our portfolio investments.
The debt and equity securities in which we invest for which market quotations are not readily available will be valued at fair
value as determined in good faith by or under the direction of our board of directors. Most, if not all, of our investments (other than cash and cash equivalents) will be classified as Level 3 under Accounting Standards Codification Topic 820 — Fair Value Measurements and Disclosures. This means that our portfolio valuations will be based on unobservable inputs and our own assumptions about how market participants would price the asset or liability in question. We expect that inputs into the determination of fair value of our portfolio investments will require significant management judgment or estimation. Even if observable market data are available, such information may be the result of consensus pricing information or broker quotes, which include a disclaimer that the broker would not be held to such a price in an actual transaction. The non-binding nature of consensus pricing and/or quotes accompanied by disclaimers materially reduces the reliability of such information. We have retained the services of an independent service provider to review the valuation of these loans and securities. The types of factors that the board of directors may take into account in determining the fair value of our investments generally include, as appropriate, comparison to publicly traded securities including such factors as yield, maturity and measures of credit quality, the enterprise value of a portfolio company, the nature and realizable value of any collateral, the portfolio company’s ability to make payments and its earnings and discounted cash flow, the markets in which the portfolio company does business and other relevant factors. Because such valuations, and particularly valuations of private securities and private companies, are inherently uncertain, may fluctuate over short periods of time and may be based on estimates, our determinations of fair value may differ materially from the values that would have been used if a ready market for these loans and securities existed. Our net asset value could be adversely affected if our determinations regarding the fair value of our investments were materially higher than the values that we ultimately realize upon the disposal of such loans and securities.
Our board of directors may change our operating policies and strategies without prior notice or stockholder approval, the effects of which may be adverse to our stockholders.
Our board of directors has the authority to modify or waive our current operating policies, investment criteria and strategies without prior notice and without stockholder approval. We cannot predict the effect any changes to our current operating policies, investment criteria and strategies would have on our business, net asset value, operating results and the value of our common stock. However, the effects might be adverse, which could negatively impact our ability to pay you distributions and cause you to lose all or part of your investment. Moreover, we have significant flexibility in investing the net proceeds of any offering and may use the net proceeds from an offering in ways with which investors may not agree.
If SIC Advisors is unable to manage our investments effectively, we may be unable to achieve our investment objective.
Our ability to achieve our investment objective will depend on our ability to manage our business, which will depend, in turn, on the ability of SIC Advisors to identify, invest in and monitor companies that meet our investment criteria. Accomplishing this result largely will be a function of SIC Advisors’ investment process and, in conjunction with its role as our administrator, its ability to provide competent, attentive and efficient services to us.
SIC Advisors’ senior management team is comprised of members of the senior management team for Medley LLC, and they manage other investment funds. They may also be required to provide managerial assistance to our portfolio companies. These demands on their time may distract them or slow our rate of investment. Any failure to manage our business effectively could have a material adverse effect on our business, financial condition and results of operations.
We may experience fluctuations in our quarterly results.
We could experience fluctuations in our quarterly operating results due to a number of factors, including our ability or inability to make investments in companies that meet our investment criteria, the interest rate payable and default rates on the debt securities we acquire, the level of our expenses, variations in and the timing of the recognition of realized and unrealized gains or losses, the degree to which we encounter competition in our markets, and general economic conditions. As a result of these factors, results for any previous period should not be relied upon as indicative of performance in future periods. These occurrences could have a material adverse effect on our results of operations, the value of your investment in us and our ability to pay distributions to you and our other stockholders.
37
Any unrealized losses we experience on our portfolio may be an indication of future realized losses, which could reduce our income available for distribution.
As a BDC, we are required to carry our investments at market value or, if no market value is ascertainable, at the fair value as determined in good faith by our board of directors. Decreases in the market values or fair values of our investments are recorded as unrealized depreciation. Any unrealized losses in our portfolio could be an indication of a portfolio company’s inability to meet its repayment obligations to us with respect to the affected investments. This could result in realized losses in the future and ultimately in reductions of our income available for distribution in future periods. In addition, decreases in the market value or fair value of our investments will reduce our net asset value. See "Management's Discussion and Analysis of Financial Condition and Results of Operations - Valuation of Investments."
We are uncertain of our sources for funding our future capital needs. If we cannot obtain debt or equity financing on acceptable terms, our ability to acquire investments and to expand our operations will be adversely affected.
The net proceeds from the sale of shares of our common stock will be used for our investment opportunities, operating expenses and for payment of various fees and expenses such as management fees, incentive fees and other fees. Any working capital reserves we maintain may not be sufficient for investment purposes, and we may require debt or equity financing to operate. In addition, we are required to distribute at least 90% of our net ordinary income and net short-term capital gains in excess of net long-term capital losses, if any, to our stockholders to maintain our RIC status. Accordingly, in the event that we need additional capital in the future for investments or for any other reason we may need to borrow from financial institutions in order to obtain such additional capital. These sources of funding may not be available to us due to unfavorable economic conditions, which could increase our funding costs, limit our access to the capital markets or result in a decision by lenders not to extend credit to us. Consequently, if we cannot obtain debt or equity financing on acceptable terms, our ability to acquire investments and to expand our operations will be adversely affected. As a result, we would be less able to achieve portfolio diversification and our investment objective, which may negatively impact our results of operations and reduce our ability to make distributions to our stockholders.
We are a non-diversified investment company within the meaning of the 1940 Act, and therefore we are not limited with respect to the proportion of our assets that may be invested in securities of a single issuer.
We are classified as a non-diversified investment company within the meaning of the 1940 Act, which means that we are not limited by the 1940 Act with respect to the proportion of our assets that we may invest in securities of a single issuer. We are also not adopting any policy restricting the percentage of our assets that may be invested in a single portfolio company. To the extent that we assume large positions in the securities of a small number of issuers, or within a particular industry, our net asset value may fluctuate to a greater extent than that of a diversified investment company as a result of changes in the financial condition or the market’s assessment of the issuer. We may also be more susceptible to any single economic or regulatory occurrence than a diversified investment company. Beyond our income tax diversification requirements applicable to RICs under Subchapter M of the Code, we do not have fixed guidelines for diversification, and our investments could be concentrated in relatively few portfolio companies. See ‘‘Business - Taxation as a Regulated Investment Company’’
If we internalize our management functions, your interest in us could be diluted, we could incur other significant costs associated with being self-managed and may not be able to retain or replace key personnel, and we may have increased exposure to litigation as a result of internalizing our management functions.
We may internalize management functions provided by our Advisor. Our board of directors may decide in the future to acquire assets and personnel from our Advisor or its affiliates for consideration that would be negotiated at that time. There can be no assurances that we would be successful in retaining our Advisor’s key personnel in the event of a management internalization transaction. In the event we were to acquire our Advisor we cannot be sure of the form or amount of consideration or other terms relating to any such acquisition, which could take many forms, including cash payments, promissory notes and/or shares of our stock. The payment of such consideration could reduce our net investment income.
We cannot reasonably estimate the amount of fees to our Advisor we would avoid paying, and the costs we would incur, if we acquired our Advisor, or acquired assets and personnel from it. If the expenses we assume as a result of management internalization are higher than the expenses we avoid paying to our Advisor, our net investment income would be lower than it otherwise would have been had we not acquired these entities, or acquired assets and personnel from these entities.
Additionally, if we internalize our management functions, we could have difficulty integrating these functions. Currently, the officers and associates of Medley perform general and administrative functions, including accounting and financial reporting. We may fail to properly identify the appropriate mix of personnel and capital needs to operate as a stand-alone entity. An inability to manage
38
an internalization transaction effectively could result in our incurring additional costs and divert our management’s attention from effectively managing our portfolio or our operations.
In recent years, external advisory and management structures have been the subject of stockholder litigation stemming from the assumption that internal management structures are more cost-efficient and that managers in an internal structure are more accountable to the relevant company. Stockholder litigation can be costly and time-consuming, and there can be no assurance that any litigation expenses we might incur would not be significant or that the outcome of litigation would be favorable to us. Any amounts we are required to expend defending any such litigation will reduce our net investment income.
Risks Related to SIC Advisors and its Respective Affiliates
Our dealer manager may face conflicts of interest as a result of a compensation arrangement between one of its affiliates and SIC Advisors.
In exchange for the provision of certain non-investment advisory services to SIC Advisors, and pursuant to a written agreement, an affiliate of the dealer manager, Strategic Capital, is entitled to receive up to 20% of the gross cash proceeds received by SIC Advisors from the management and incentive fees payable by us to SIC Advisors in its capacity as our investment adviser. The purpose of this arrangement is to permit our Advisor to capitalize upon the expertise of the executives of Strategic Capital and its affiliates in providing administrative and operational services with respect to non-exchange traded investment vehicles similar to us. Strategic Capital holds a non-voting interest in SIC Advisors which entitles it to 20% of the net proceeds received in connection with the sale or other strategic transaction involving SIC Advisors.
As a result of this compensation arrangement, our dealer manager has a financial interest in the performance of the assets recommended by SIC Advisors. The dealer manager may face conflicts of interest as a result and may have an incentive to influence our Advisor to select investments that may not be in our best interest.
Our incentive fee structure may create incentives for SIC Advisors that are not fully aligned with the interests of our stockholders.
In the course of our investing activities, we will pay management and incentive fees to SIC Advisors. These fees are based on our gross assets. As a result, investors in our common stock will invest on a ‘‘gross’’ basis and receive distributions on a ‘‘net’’ basis after expenses, resulting in a lower rate of return than one might achieve through direct investments. Because these fees are based on our gross assets, SIC Advisors will benefit when we incur debt or use leverage. Additionally, under the incentive fee structure, SIC Advisors may benefit when capital gains are recognized and, because SIC Advisors determines when a holding is sold, SIC Advisors controls the timing of the recognition of such capital gains. Our board of directors is charged with protecting our interests by monitoring how SIC Advisors addresses these and other conflicts of interests associated with its management services and compensation. While they are not expected to review or approve borrowings or incurrence of leverage in the ordinary course, our independent directors approve our credit facilities, including the maximum amount of leverage we may employ, and will periodically review SIC Advisors’ services and fees as well as its portfolio management decisions and portfolio performance through their quarterly review of our portfolio and annual review of our investment advisory and administration agreements. In connection with these reviews, our independent directors will consider whether our fees and expenses (including those related to leverage) remain appropriate. As a result of this arrangement, SIC Advisors or its affiliates may from time to time have interests that differ from those of our stockholders, giving rise to a conflict.
The part of the incentive fee payable to SIC Advisors that relates to our net investment income will be computed and paid on income that may include interest income that has been accrued but not yet received in cash. This fee structure may be considered to involve a conflict of interest for SIC Advisors to the extent that it may encourage SIC Advisors to favor debt financings that provide for deferred interest, rather than current cash payments of interest. SIC Advisors may have an incentive to invest in deferred interest securities in circumstances where it would not have done so but for the opportunity to continue to earn the incentive fee even when the issuers of the deferred interest securities would not be able to make actual cash payments to us on such securities. This risk could be increased because SIC Advisors is not obligated to reimburse us for any incentive fees received even if we subsequently incur losses or never receive in cash the deferred income that was previously accrued.
SIC Advisors and its affiliates, including our officers and some of our directors, face conflicts of interest caused by compensation arrangements with us, which could result in actions that are not in the best interests of our stockholders.
SIC Advisors and its affiliates receive substantial fees from us in return for their services, and these fees could influence the advice provided to us. Among other matters, because the base management fee that we pay to SIC Advisors is based on our gross assets, SIC Advisors may benefit if we incur indebtedness.
39
There are significant potential conflicts of interest that could affect our investment returns.
There may be times when SIC Advisors, its senior management and Investment Team, and members of its Investment Committee have interests that differ from those of our stockholders, giving rise to a conflict of interest. In particular, certain private investment funds managed by the senior members of SIC Advisors hold controlling or minority equity interests, or have the right to acquire such equity interests, in some of our portfolio companies. As a result, the senior members of SIC Advisors may face conflicts of interests in connection with making business decisions for these portfolio companies to the extent that such decisions affect the debt and equity holders in these portfolio companies differently. In addition, the senior members of SIC Advisors may face conflicts of interests in connection with making investment or other decisions, including granting loan waivers or concessions on our behalf with respect to these portfolio companies given that they also manage private investment funds that hold the equity interests in these portfolio companies.
The time and resources that individuals associated with SIC Advisors devote to us may be diverted, and we may face additional competition due to the fact that SIC Advisors is not prohibited from raising money for or managing another entity that makes the same types of investments that we target.
SIC Advisors is not prohibited from raising money for and managing future investment entities that make the same types of investments as those we target. The time and resources that our Advisor devotes to us may be diverted, and during times of intense activity in other programs it may devote less time and resources to our business than is necessary or appropriate. As a result of these competing demands on their time and the fact that they may engage in other business activities on behalf of themselves and others, these individuals face conflicts of interest in allocating their time. These conflicts of interest could result in declines in the returns on our investments and the value of your investment. In addition, we may compete with any such investment entity for the same investors and investment opportunities. While we may co-invest with such investment entities to the extent permitted by the 1940 Act and the rules and regulations thereunder, the 1940 Act imposes significant limits on co-investment. In this regard, the Exemptive Order allows us additional latitude to co-invest with certain affiliates. Nevertheless, the Exemptive Order requires us to meet certain conditions in order to invest in certain portfolio companies in which our affiliates are investing or are invested. Affiliates of SIC Advisors, whose primary business includes the origination of investments, engage in investment advisory businesses with accounts that compete with us.
SIC Advisors may, from time to time, possess material non-public information, limiting our investment discretion.
SIC Advisors and members of its senior management and Investment Team and Investment Committee may serve as directors of, or in a similar capacity with, companies in which we invest, the securities of which are purchased or sold on our behalf. In the event that material nonpublic information is obtained with respect to such companies, we could be prohibited for a period of time from purchasing or selling the securities of such companies by law or otherwise, and this prohibition may have an adverse effect on us.
We may be obligated to pay our Advisor incentive compensation even if we incur a net loss due to a decline in the value of our portfolio.
Our Investment Advisory Agreement entitles SIC Advisors to receive an incentive fee based on our net investment income regardless of any capital losses. In such case, we may be required to pay SIC Advisors an incentive fee for a fiscal quarter even if there is a decline in the value of our portfolio or if we incur a net loss for that quarter.
Any incentive fee payable by us that relates to our net investment income may be computed and paid on income that may include interest that has been accrued but not yet received. If a portfolio company defaults on a loan that is structured to provide accrued interest, it is possible that accrued interest previously included in the calculation of the incentive fee will become uncollectible. SIC Advisors is not obligated to reimburse us for any part of the incentive fee it received that was based on accrued income that we never received as a result of a subsequent default, and such circumstances would result in our paying an incentive fee on income we never receive.
For U.S. federal income tax purposes, we are required to recognize taxable income in some circumstances in which we do not receive a corresponding payment in cash (such as deferred interest that is accrued as original issue discount) and to make distributions with respect to such income to maintain our status as a RIC. Under such circumstances, we may have difficulty meeting the annual distribution requirement necessary to obtain and maintain RIC tax treatment under the Code. This difficulty in making the required distribution may be amplified to the extent that we are required to pay an incentive fee with respect to such accrued income. As a result, we may have to sell some of our investments at times and/or at prices we would not consider advantageous, raise additional debt or equity capital, or forgo new investment opportunities for this purpose. If we are not able to obtain cash from other sources, we may fail to qualify for RIC tax treatment and thus become subject to corporate-level U.S. federal income tax. For additional discussion regarding the tax implications of being a RIC, see ‘‘Business - Taxation as a Regulated Investment Company.’’
The management and incentive fees we pay to our Advisor may induce our Advisor to make speculative investments.
40
The incentive fee payable by us to SIC Advisors may create an incentive for SIC Advisors to make investments on our behalf that are risky or more speculative than would be the case in the absence of such compensation arrangements. The way in which the incentive fee is determined may encourage SIC Advisors to use leverage to increase the return on our investments. In addition, the fact that our management fee is payable based upon our gross assets, which would include any borrowings for investment purposes, may encourage SIC Advisors to use leverage to make additional investments. Under certain circumstances, the use of leverage may increase the likelihood of default, which would disfavor holders of our common stock. Such a practice could result in our investing in more speculative securities than would otherwise be the case, which could result in higher investment losses, particularly during cyclical economic downturns.
There are certain risks relating to the investment that SIC Advisors made in us.
SIC Advisors purchased 1,108,033.24 shares of our common stock for aggregate gross proceeds to us of $10,000,000, which issuance was made immediately after our prior registration statement was declared effective by the SEC. Thus, SIC Advisors is a significant stockholder. As a result and given the fact that SIC Advisors is our investment advisor and certain of its principals serve as our executive officers and members of our board of directors, SIC Advisors will be able to exert significant influence over our management and policies. As a result, SIC Advisors, or any person or entity to which such shares may be transferred, may ultimately have the ability to take actions with respect to their voting of such shares that may not be in our or our stockholders’ best interest.
Our ability to enter into transactions with our affiliates will be restricted, which may limit the scope of investments available to us.
We are prohibited under the 1940 Act from participating in certain transactions with certain of our affiliates without the prior approval of a majority of the independent directors and, in some cases, the SEC. Any person that owns, directly or indirectly, 5% or more of our outstanding voting securities will be our affiliate for purposes of the 1940 Act, and we will generally be prohibited from buying or selling any securities from or to such affiliate, absent the prior approval of our board of directors. The 1940 Act also prohibits certain ‘‘joint’’ transactions with certain of our affiliates, which in certain circumstances could include investments in the same portfolio company (whether at the same or different times to the extent the transaction involves jointness), without prior approval of our board of directors and, in some cases, the SEC. If a person acquires more than 25% of our voting securities, we will be prohibited from buying or selling any security from or to such person or certain of that person’s affiliates, or entering into prohibited joint transactions with such persons, absent the prior approval of the SEC. Similar restrictions limit our ability to transact business with our Advisor as well as our officers or directors or their affiliates. The SEC has interpreted the BDC regulations governing transactions with affiliates to prohibit certain ‘‘joint transactions’’ involving entities that share a common investment advisor. As a result of these restrictions, we may be prohibited from buying or selling any security (other than any security of which we are the issuer) from or to any portfolio company that is controlled by a fund managed by our Advisor or its respective affiliates without the prior approval of the SEC, which may limit the scope of investment opportunities that would otherwise be available to us.
We may, however, invest alongside other clients of our Advisor and its affiliates, including other entities they manage in certain circumstances where doing so is consistent with applicable law, the Exemptive Order and SEC staff interpretations and guidance. For example, we may co-invest with such accounts consistent with guidance promulgated by the SEC staff permitting us and such other accounts to purchase interests in a single class of privately placed securities so long as certain conditions are met, including that our investment adviser, acting on our behalf and on behalf of other clients, negotiates no term other than price. We may also co-invest with our investment adviser’s other clients as otherwise permissible under regulatory guidance, applicable regulations and our Advisor’s allocation policy. Under this allocation policy, a fixed percentage of each opportunity, which may vary based on asset class and investment objectives, among other things, will be offered to us and similar eligible accounts, as periodically determined by our Advisor and approved by our board of directors, including our independent directors. The allocation policy further provides that allocations among us and these other accounts will generally be made pro rata based on each account’s capital available for investment, as determined, in our case, by our Advisor. It is our policy to base our determinations as to the amount of capital available for investment based on such factors as the amount of cash on-hand, existing commitments and reserves, if any, the targeted leverage level, the targeted asset mix and diversification requirements and other investment policies and restrictions set by our board of directors or imposed by applicable laws, rules, regulations or interpretations. We expect that these determinations will be made similarly for other accounts. However, we can offer no assurance that investment opportunities will be allocated to us fairly or equitably in the short-term or over time.
In situations where co-investment with other clients of our Advisor or its affiliates is not permitted under the 1940 Act and related rules, existing or future staff guidance, or the terms and conditions of the Exemptive Order, our Advisor will need to decide which client or clients will proceed with the investment. Under our Advisor’s allocation policy, such determinations will be made based on the principle that investment opportunities shall be offered to eligible clients on an alternating basis that will be fair and equitable over time. As a result, we will not have an entitlement to make a co-investment in these circumstances and, to the extent that another client elects to proceed with the investment, we will not be permitted to participate. Moreover, except in certain circumstances, we will be
41
unable to invest in any issuer in which a client of our Advisor or its affiliate holds a controlling interest. These restrictions may limit the scope of investment opportunities that would otherwise be available to us.
We may make investments that could give rise to a conflict of interest.
We do not expect to invest in, or hold securities of, companies that are controlled by our Advisor’s affiliates’ clients. However, our Advisor’s affiliates’ clients may invest in, and gain control over, one of our portfolio companies. If our Advisor’s affiliates’ client, or clients, gains control over one of our portfolio companies, it may create conflicts of interest and may subject us to certain restrictions under the 1940 Act. As a result of these conflicts and restrictions, our Advisor may be unable to implement our investment strategy as effectively as they could have in the absence of such conflicts or restrictions. For example, as a result of a conflict or restriction, our Advisor may be unable to engage in certain transactions that they would otherwise pursue. In order to avoid these conflicts and restrictions, our Advisor may choose to exit these investments prematurely and, as a result, we would forego any positive returns associated with such investments. In addition, to the extent that another client holds a different class of securities than us as a result of such transactions, our interests may not be aligned.
There may be conflicts related to obligations SIC Advisors’ senior management and Investment Team and members of its Investment Committee have to other clients.
The members of the senior management and Investment Teams and the Investment Committee of SIC Advisors serve or may serve as officers, directors or principals of entities that operate in the same or a related line of business as we do, or of investment funds managed by SIC Advisors or its affiliates. In serving in these multiple capacities, they may have obligations to other clients or investors in those entities, the fulfillment of which may not be in our best interests or in the best interest of our stockholders. For example, the personnel that comprise SIC Advisors’ Investment Team have management responsibilities for other investment funds, accounts or other investment vehicles managed by affiliates of SIC Advisors.
Our investment objective may overlap with the investment objectives of such investment funds, accounts or other investment vehicles. For example, affiliates of SIC Advisors currently manage private funds and managed accounts that are seeking new capital commitments and will pursue an investment strategy similar to our strategy, and we may compete with these and other entities managed by affiliates of SIC Advisors for capital and investment opportunities. As a result, those individuals may face conflicts in the allocation of investment opportunities among us and other investment funds or accounts advised by principals of, or affiliated with, SIC Advisors.
We have received an Exemptive Order from the SEC that permits us to co-invest with certain other investment funds managed by SIC Advisors or its affiliates, subject to the conditions included therein. In situations where we cannot co-invest with other investment funds managed by SIC Advisors or its affiliates, the investment policies and procedures of SIC Advisors generally require that such opportunities be offered to us and such other investment funds on an alternating basis. However, there can be no assurance that we will be able to participate in all investment opportunities that are suitable to us.
Our ability to sell or otherwise exit investments in which affiliates of SIC Advisors also have an investment may be restricted.
We may be considered affiliates with respect to certain of our portfolio companies. Certain private funds advised by the senior members of SIC Advisors also hold interests in these portfolio companies and as such these interests may be considered a joint enterprise under applicable regulations. To the extent that our interests in these portfolio companies may need to be restructured in the future or to the extent that we choose to exit certain of these transactions, our ability to do so will be limited.
Risks Related to BDCs
We may face increasing competition for investment opportunities, which could delay deployment of our capital, reduce returns and result in losses.
We compete for investments with other BDCs and investment funds (including registered investment companies, private equity funds and mezzanine funds), as well as traditional financial services companies such as commercial banks and other sources of funding. Moreover, alternative investment vehicles, such as hedge funds, have begun to invest in areas in which they have not traditionally invested, including making investments in our target market of privately owned U.S. companies. As a result of these new entrants, competition for investment opportunities in privately owned U.S. companies may intensify. Many of our competitors are substantially larger and have considerably greater financial, technical, and marketing resources than we do. For example, some competitors may have a lower cost of capital and access to funding sources that are not available to us. In addition, some of our competitors may have higher risk tolerances or different risk assessments than we have. These characteristics could allow our competitors to consider a wider variety of investments, establish more relationships and offer better pricing and more flexible structuring than we are able to do.
42
We do not seek to compete primarily based on the interest rates we offer, and we believe that some of our competitors make loans with interest rates that are comparable to or lower than the rates we offer. We may lose investment opportunities if we do not match our competitors’ pricing, terms, and structure criteria. If we are forced to match these criteria to make investments, we may not be able to achieve acceptable returns on our investments or may bear substantial risk of capital loss. A significant increase in the number and/or the size of our competitors in this target market could force us to accept less attractive investment terms. Furthermore, many of our competitors are not subject to the regulatory restrictions that the 1940 Act imposes on us as a BDC or the source of income, asset diversification and distribution requirements we must satisfy to maintain our RIC status. The competitive pressures we face may have a material adverse effect on our business, financial condition, results of operations, and cash flows. As a result of this competition, we may not be able to take advantage of attractive investment opportunities from time to time. Also, we may not be able to identify and make investments that are consistent with our investment objective.
The requirement that we invest a sufficient portion of our assets in qualifying assets could preclude us from investing in accordance with our current business strategy; conversely, the failure to invest a sufficient portion of our assets in qualifying assets could result in our failure to maintain our status as a BDC.
As a BDC, the 1940 Act prohibits us from acquiring any assets other than certain qualifying assets unless, at the time of and after giving effect to such acquisition, at least 70% of our total assets are qualifying assets. Therefore, we may be precluded from investing in what we believe are attractive investments if such investments are not qualifying assets. Conversely, if we fail to invest a sufficient portion of our assets in qualifying assets, we could lose our status as a BDC, which would have a material adverse effect on our business, financial condition, and result of operations. Similarly, these rules could prevent us from making additional investments in existing portfolio companies, which could result in the dilution of our position.
Changes in laws or regulations governing our operations may adversely affect our business or cause us to alter our business strategy.
We and our portfolio companies will be subject to regulation at the local, state, and federal level. Changes to the laws and regulations governing our permitted investments may require a change to our investment strategy. Such changes could differ materially from our strategies and plans as set forth in this annual report on Form 10-K and may shift our investment focus from the areas of expertise of our Advisor. Thus, any such changes, if they occur, could have a material adverse effect on our results of operations and the value of your investment.
Regulations governing our operation as a BDC and RIC will affect our ability to raise capital and the way in which we raise additional capital or borrow for investment purposes, which may have a negative effect on our growth. As a BDC, the necessity of raising additional capital may expose us to risks, including the typical risks associated with leverage.
As a result of the annual distribution requirement to qualify as a RIC, we may need to access the capital markets periodically to raise cash to fund new investments. We may issue ‘‘senior securities,’’ including borrowing money from banks or other financial institutions only in amounts such that our asset coverage, as defined in the 1940 Act, equals at least 200% after such incurrence or issuance. If we issue senior securities, we will be exposed to typical risks associated with leverage, including an increased risk of loss. Our ability to issue different types of securities is also limited. Compliance with these requirements may unfavorably limit our investment opportunities and reduce our ability in comparison to other companies to profit from favorable spreads between the rates at which we can borrow and the rates at which we can lend. As a BDC, we therefore intend to issue equity continuously at a rate more frequent than our privately owned competitors, which may lead to greater stockholder dilution.
We may borrow for investment purposes. If the value of our assets declines, we may be unable to satisfy the asset coverage test, which would prohibit us from paying distributions and could prevent us from qualifying as a RIC, which would generally result in a corporate-level U.S. federal income tax on any income and net gains. If we cannot satisfy the asset coverage test, we may be required to sell a portion of our investments and, depending on the nature of our debt financing, repay a portion of our indebtedness at a time when such sales may be disadvantageous. Also, any amounts that we use to service our indebtedness would not be available for distributions to our common stockholders.
In addition, we anticipate that as market conditions permit, we may securitize our loans to generate cash for funding new investments. To securitize loans, we may create a wholly owned subsidiary, contribute a pool of loans to the subsidiary and have the subsidiary issue primarily investment grade debt securities to purchasers who we would expect to be willing to accept a substantially lower interest rate than the loans earn. We would retain all or a portion of the equity in the securitized pool of loans. Our retained equity would be exposed to any losses on the portfolio of loans before any of the debt securities would be exposed to such losses. Accordingly, if the pool of loans experienced a low level of losses due to defaults, we would earn an incremental amount of income on our retained equity but we would be exposed, up to the amount of equity we retained, to that proportion of any losses we would have experienced if we had continued to hold the loans in our portfolio. We would not treat the debt issued by such a subsidiary as senior securities.
43
Pending legislation may allow us to incur additional leverage.
As a BDC, we are generally not permitted to incur indebtedness unless immediately after such borrowing we have an asset coverage for total borrowings of at least 200% (i.e., the amount of debt may not exceed 50% of the value of our assets). Recent legislation, if passed, would modify this section of the 1940 Act and increase the amount of debt that BDCs may incur by modifying the percentage from 200% to 150%. As a result, we may be able to incur additional indebtedness in the future and therefore your risk of an investment in our securities may increase. We can make no assurance as to the ultimate outcome of this legislation.
Risks Related to our Investments
Our investments in prospective portfolio companies may be risky, and we could lose all or part of our investment.
We intend to pursue a strategy focused on investing primarily in the debt of privately owned U.S. companies with a focus on transactions sourced through the network of SIC Advisors.
• | Senior Secured Debt and Second Lien Secured Debt. When we invest in senior secured term debt and second lien secured debt, we will generally take a security interest in the available assets of these portfolio companies, including the equity interests of their subsidiaries. There is a risk that the collateral securing our investments may decrease in value over time or lose its entire value, may be difficult to sell in a timely manner, may be difficult to appraise and may fluctuate in value based upon the success of the business and market conditions, including as a result of the inability of the portfolio company to raise additional capital. Also, in some circumstances, our security interest could be subordinated to claims of other creditors. In addition, deterioration in a portfolio company’s financial condition and prospects, including its inability to raise additional capital, may be accompanied by deterioration in the value of the collateral for the debt security. Consequently, the fact that debt is secured does not guarantee that we will receive principal and interest payments according to the investment terms, or at all, or that we will be able to collect on the investment should we be forced to enforce our remedies. |
• | Subordinated Debt. Our subordinated debt investments will generally be subordinated to senior debt and will generally be unsecured. This may result in a heightened level of risk and volatility or a loss of principal, which could lead to the loss of the entire investment. These investments may involve additional risks that could adversely affect our investment returns. To the extent interest payments associated with such debt are deferred, such debt may be subject to greater fluctuations in valuations, and such debt could subject us and our stockholders to non-cash income. Since we will not receive any principal repayments prior to the maturity of some of our subordinated debt investments, such investments will be of greater risk than amortizing loans. |
• | Equity Investments. We expect to make selected equity investments. In addition, when we invest in senior and subordinated debt, we may acquire warrants or options to purchase equity securities or benefit from other types of equity participation. Our goal is ultimately to dispose of these equity interests and realize gains upon our disposition of such interests. However, the equity interests we receive may not appreciate in value and, in fact, may decline in value. Accordingly, we may not be able to realize gains from our equity interests, and any gains that we do realize on the disposition of any equity interests may not be sufficient to offset any other losses we experience. Most loans in which we invest will not be rated by any rating agency and, if they were rated, they would be rated as below investment grade quality. Loans rated below investment grade quality are generally regarded as having predominantly speculative characteristics and may carry a greater risk with respect to a borrower’s capacity to pay interest and repay principal. |
To the extent original issue discount constitutes a portion of our income, we will be exposed to risks associated with the deferred receipt of cash representing such income.
Our investments may include original issue discount instruments. To the extent original issue discount constitutes a portion of our income, we will be exposed to typical risks associated with such income being required to be included in taxable and accounting income prior to receipt of cash, including the following:
• | Original issue discount instruments may create heightened credit risks because the inducement to trade higher rates for the deferral of cash payments typically represents, to some extent, speculation on the part of the borrower. |
• | For accounting purposes, cash distributions to stockholders representing original issue discount income do not come from paid-in capital, although they may be paid from the offering proceeds. Thus, although a distribution of original |
44
issue discount income comes from the cash invested by the stockholders, the 1940 Act does not require that stockholders be given notice of this fact.
• | Original issue discount creates risk of non-refundable cash payments to the Advisor based on non-cash accruals that may never be realized. |
• | Interest rates payable on original issue discount instruments, including payment-in-kind loans, or PIK loans, are higher because the deferred interest payments are discounted to reflect the time-value of money and because PIK instruments generally represent a significantly higher credit risk than coupon loans. |
• | Original issue discount and PIK instruments may have unreliable valuations because the accruals require judgments about collectability of the deferred payments and the value of the associated collateral. |
• | An election to defer PIK interest payments by adding them to the principal of such instruments increases the Company’s gross assets, which increases future base management fees, and, because interest payments will then be payable on a larger principal amount, the election also increases the Advisor’s future income incentive fees at a compounding rate. |
• | Market prices of PIK instruments and other zero coupon instruments are affected to a greater extent by interest rate changes, and may be more volatile than instruments that pay interest periodically in cash. While PIK instruments are usually less volatile than zero coupon debt instruments, PIK instruments are generally more volatile than cash-pay securities. |
• | The deferral of PIK interest on a loan increases its loan-to-value ratio, which is a measure of the riskiness of a loan. |
• | Even if the conditions for income accrual under GAAP are satisfied, a borrower could still default when actual payment is due upon the maturity of such loan. |
• | The required recognition of original issue discount, including PIK, interest for U.S. federal income tax purposes may have a negative impact on liquidity, because it represents a non-cash component of the Company’s investment company taxable income that must, nevertheless, be distributed in cash to investors to avoid it being subject to corporate-level taxation. |
Our portfolio companies may incur debt that ranks equally with, or senior to, our investments in such companies.
We intend to pursue a strategy focused on investing primarily in the debt of privately owned U.S. companies with a focus on transactions sourced through the network of SIC Advisors. Our portfolio companies may have, or may be permitted to incur, other debt that ranks equally with, or senior to, the debt in which we invest. By their terms, such debt instruments may entitle the holders to receive payment of interest or principal on or before the dates on which we are entitled to receive payments with respect to the debt instruments in which we invest. Also, in the event of insolvency, liquidation, dissolution, reorganization or bankruptcy of a portfolio company, holders of debt instruments ranking senior to our investment in that portfolio company would typically be entitled to receive payment in full before we receive any distribution. After repaying such senior creditors, such portfolio company may not have any remaining assets to use for repaying its obligation to us. In the case of debt ranking equally with debt instruments in which we invest, we would have to share on an equal basis any distributions with other creditors holding such debt in the event of an insolvency, liquidation, dissolution, reorganization or bankruptcy of the relevant portfolio company.
Subordinated liens on collateral securing debt that we will make to our portfolio companies may be subject to control by senior creditors with first priority liens. If there is a default, the value of the collateral may not be sufficient to repay in full both the first priority creditors and us.
Certain debt investments that we will make in portfolio companies will be secured on a second priority basis by the same collateral securing senior secured debt of such companies. The first priority liens on the collateral will secure the portfolio company’s obligations under any outstanding senior debt and may secure certain other future debt that may be permitted to be incurred by the company under the agreements governing the debt. The holders of obligations secured by the first priority liens on the collateral will generally control the liquidation of and be entitled to receive proceeds from any realization of the collateral to repay their obligations in full before us. In addition, the value of the collateral in the event of liquidation will depend on market and economic conditions, the availability of buyers and other factors. There can be no assurance that the proceeds, if any, from the sale or sales of all of the collateral would be sufficient to satisfy the debt obligations secured by the second priority liens after payment in full of all obligations secured by the first priority liens on the collateral. If such proceeds are not sufficient to repay amounts outstanding under the debt obligations secured by
45
the second priority liens, then we, to the extent not repaid from the proceeds of the sale of the collateral, will only have an unsecured claim against the company’s remaining assets, if any.
We may also make unsecured debt investments in portfolio companies, meaning that such investments will not benefit from any interest in collateral of such companies. Liens on such portfolio companies’ collateral, if any, will secure the portfolio company’s obligations under its outstanding secured debt and may secure certain future debt that is permitted to be incurred by the portfolio company under its secured debt agreements. The holders of obligations secured by such liens will generally control the liquidation of, and be entitled to receive proceeds from, any realization of such collateral to repay their obligations in full before us. In addition, the value of such collateral in the event of liquidation will depend on market and economic conditions, the availability of buyers and other factors. There can be no assurance that the proceeds, if any, from sales of such collateral would be sufficient to satisfy our unsecured debt obligations after payment in full of all secured debt obligations. If such proceeds were not sufficient to repay the outstanding secured debt obligations, then our unsecured claims would rank equally with the unpaid portion of such secured creditors’ claims against the portfolio company’s remaining assets, if any.
The rights we may have with respect to the collateral securing the debt investments we make in our portfolio companies with senior debt outstanding may also be limited pursuant to the terms of one or more inter-creditor agreements that we enter into with the holders of senior debt. Under such an inter-creditor agreement, at any time that obligations that have the benefit of the first priority liens are outstanding, any of the following actions that may be taken in respect of the collateral will be at the direction of the holders of the obligations secured by the first priority liens: the ability to cause the commencement of enforcement proceedings against the collateral; the ability to control the conduct of such proceedings; the approval of amendments to collateral documents; releases of liens on the collateral; and waivers of past defaults under collateral documents. We may not have the ability to control or direct such actions, even if our rights are adversely affected.
There may be circumstances where our debt investments could be subordinated to claims of other creditors or we could be subject to lender liability claims.
If one of our portfolio companies were to go bankrupt, depending on the facts and circumstances, including the extent to which we actually provided managerial assistance to that portfolio company or a representative of us or SIC Advisors sat on the board of directors of such portfolio company, a bankruptcy court might re-characterize our debt investment and subordinate all or a portion of our claim to that of other creditors. In situations where a bankruptcy carries a high degree of political significance, our legal rights may be subordinated to other creditors.
In addition, lenders in certain cases can be subject to lender liability claims for actions taken by them when they become too involved in the borrower’s business or exercise control over a borrower. It is possible that we could become subject to a lender’s liability claim, including as a result of actions taken if we render significant managerial assistance to, or exercise control or influence over the board of directors of, the borrower.
We generally will not control the business operations of our portfolio companies and, due to the illiquid nature of our holdings in our portfolio companies, may not be able to dispose of our interest in our portfolio companies.
We do not expect to control most of our portfolio companies, even though we may have board representation or board observation rights, and our debt agreements may impose certain restrictive covenants on our borrowers. As a result, we are subject to the risk that a portfolio company in which we invest may make business decisions with which we disagree and the management of such company, as representatives of the holders of their common equity, may take risks or otherwise act in ways that do not serve our interests as debt investors. Due to the lack of liquidity for our investments in private companies, we may not be able to dispose of our interests in our portfolio companies as readily as we would like or at an appropriate valuation. As a result, a portfolio company may make decisions that could decrease the value of our portfolio holdings.
The lack of liquidity in our investments may adversely affect our business.
We anticipate that our investments generally will be made in private companies. Substantially all of these securities will be subject to legal and other restrictions on resale or will be otherwise less liquid than publicly traded securities. The illiquidity of our investments may make it difficult for us to sell such investments if the need arises. In addition, if we are required to liquidate all or a portion of our portfolio quickly, we may realize significantly less than the value at which we had previously recorded our investments. In addition, we may face other restrictions on our ability to liquidate an investment in a portfolio company to the extent that we or our investment adviser has material non-public information regarding such portfolio company.
Economic recessions or downturns could impair our portfolio companies and harm our operating results.
46
Many of our portfolio companies are susceptible to economic slowdowns or recessions and may be unable to repay our debt investments during these periods. Therefore, our non-performing assets are likely to increase, and the value of our portfolio is likely to decrease during these periods. Adverse economic conditions may also decrease the value of any collateral securing our senior secured or second lien secured debt. A severe recession may further decrease the value of such collateral and result in losses of value in our portfolio and a decrease in our revenues, net income, assets and net worth. Unfavorable economic conditions also could increase our funding costs, limit our access to the capital markets or result in a decision by lenders not to extend credit to us on terms we deem acceptable. These events could prevent us from increasing investments and harm our operating results.
A covenant breach by our portfolio companies may harm our operating results.
A portfolio company’s failure to satisfy financial or operating covenants imposed by us or other lenders could lead to defaults and, potentially, termination of its debt and foreclosure on its secured assets, which could trigger cross-defaults under other agreements and jeopardize a portfolio company’s ability to meet its obligations under the debt or equity securities that we hold. We may incur expenses to the extent necessary to seek recovery upon default or to negotiate new terms, which may include the waiver of certain financial covenants, with a defaulting portfolio company.
An investment strategy focused primarily on privately held companies presents certain challenges, including the lack of available information about these companies.
We intend to invest primarily in privately held companies. Investments in private companies pose certain incremental risks as compared to investments in public companies including that they:
• | have reduced access to the capital markets, resulting in diminished capital resources and ability to withstand financial distress; |
• | may have limited financial resources and may be unable to meet their obligations under their debt securities that we hold, which may be accompanied by a deterioration in the value of any collateral and a reduction in the likelihood of us realizing any guarantees we may have obtained in connection with our investment; |
• | may have shorter operating histories, narrower product lines and smaller market shares than larger businesses, which tend to render them more vulnerable to competitors’ actions and changing market conditions, as well as general economic downturns; |
• | are more likely to depend on the management talents and efforts of a small group of persons; therefore, the death, disability, resignation or termination of one or more of these persons could have a material adverse impact on our portfolio company and, in turn, on us; and |
• | generally have less predictable operating results, may from time to time be parties to litigation, may be engaged in rapidly changing businesses with products subject to a substantial risk of obsolescence, and may require substantial additional capital to support their operations, finance expansion or maintain their competitive position. In addition, our executive officers, directors and members of the Advisor’s management may, in the ordinary course of business, be named as defendants in litigation arising from our investments in the portfolio companies. |
In addition, investments in private companies tend to be less liquid. The securities of private companies are not publicly traded or actively traded on the secondary market and are, instead, traded on a privately negotiated over-the-counter secondary market for institutional investors. These privately negotiated over-the-counter secondary markets may be inactive during an economic downturn or a credit crisis. In addition, the securities in these companies will be subject to legal and other restrictions on resale or will otherwise be less liquid than publicly traded securities. Also, under the 1940 Act, if there is no readily available market for these investments, we are required to carry these investments at fair value as determined by our board of directors. As a result if we are required to liquidate all or a portion of our portfolio quickly, we may realize significantly less than the value at which we had previously recorded these investments. We may also face other restrictions on our ability to liquidate an investment in a portfolio company to the extent that we, SIC Advisors or any of their respective affiliates have material nonpublic information regarding such portfolio company or where the sale would be an impermissible joint transaction. The reduced liquidity of our investments may make it difficult for us to dispose of them at a favorable price, and, as a result, we may suffer losses.
Finally, little public information generally exists about private companies and these companies may not have third-party debt ratings or audited financial statements. We must therefore rely on the ability of SIC Advisors to obtain adequate information through due diligence to evaluate the creditworthiness and potential returns from investing in these companies. Additionally, these companies and their financial information will not generally be subject to the Sarbanes-Oxley Act and other rules that govern public companies.
47
If we are unable to uncover all material information about these companies, we may not make a fully informed investment decision, and we may lose money on our investments.
Our failure to make follow-on investments in our portfolio companies could impair the value of our portfolio; our ability to make follow-on investments in certain portfolio companies may be restricted.
Following an initial investment in a portfolio company, provided that there are no restrictions imposed by the 1940 Act, we may make additional investments in that portfolio company as ‘‘follow-on’’ investments in order to: (1) increase or maintain in whole or in part our equity ownership percentage; (2) exercise warrants, options or convertible securities that were acquired in the original or subsequent financing; or (3) attempt to preserve or enhance the value of our initial investment.
We have the discretion to make any follow-on investments, subject to the availability of capital resources. We may elect not to make follow-on investments or otherwise lack sufficient funds to make those investments. Our failure to make follow-on investments may, in some circumstances, jeopardize the continued viability of a portfolio company and our initial investment, or may result in a missed opportunity for us to increase our participation in a successful operation. Even if we have sufficient capital to make a desired follow-on investment, we may elect not to make such follow-on investment because we may not want to increase our concentration of risk, because we prefer other opportunities, because we are inhibited by compliance with BDC requirements or because we desire to maintain our RIC status. We also may be restricted from making follow-on investments in certain portfolio companies to the extent that affiliates of ours hold interests in such companies.
Our ability to invest in public companies may be limited in certain circumstances.
To maintain our status as a BDC, we are not permitted to acquire any assets other than ‘‘qualifying assets’’ specified in the 1940 Act unless, at the time the acquisition is made, at least 70% of our total assets are qualifying assets (with certain limited exceptions). Subject to certain exceptions for follow-on investments and distressed companies, an investment in an issuer that has outstanding securities listed on a national securities exchange may be treated as qualifying assets only if such issuer has a market capitalization that is less than $250 million at the time of such investment. In addition, we may invest up to 30% of our portfolio in opportunistic investments which will be intended to diversify or complement the remainder of our portfolio and to enhance our returns to stockholders. These investments may include private equity investments, securities of public companies that are broadly traded and securities of non-U.S. companies. We expect that these public companies generally will have debt securities that are non-investment grade.
Our investments in foreign securities may involve significant risks in addition to the risks inherent in U.S. investments.
Our investment strategy contemplates that a portion of our investments may be in securities of foreign companies. Investing in foreign companies may expose us to additional risks not typically associated with investing in U.S. companies. These risks include changes in exchange control regulations, political and social instability, expropriation, imposition of foreign taxes, less liquid markets and less available information than is generally the case in the United States, higher transaction costs, less government supervision of exchanges, brokers and issuers, less developed bankruptcy laws, difficulty in enforcing contractual obligations, lack of uniform accounting and auditing standards and greater price volatility. Although it is anticipated that most of our investments will be denominated in U.S. dollars, our investments that are denominated in a foreign currency will be subject to the risk that the value of a particular currency may change in relation to the U.S. dollar. Among the factors that may affect currency values are trade balances, the level of short-term interest rates, differences in relative values of similar assets in different currencies, long-term opportunities for investment and capital appreciation and political developments. We may employ hedging techniques to minimize these risks, but we can offer no assurance that we will, in fact, hedge currency risk or, that if we do, such strategies will be effective. As a result, a change in currency exchange rates may adversely affect our profitability.
Prepayments of our debt investments by our portfolio companies could adversely impact our results of operations and reduce our return on equity.
We are subject to the risk that the investments we make in our portfolio companies may be repaid prior to maturity. When this occurs, we will generally reinvest these proceeds in temporary investments, pending their future investment in new portfolio companies. These temporary investments will typically have substantially lower yields than the debt being prepaid and we could experience significant delays in reinvesting these amounts. Any future investment in a new portfolio company may also be at lower yields than the debt that was repaid. As a result, our results of operations could be materially adversely affected if one or more of our portfolio companies elect to prepay amounts owed to us. Additionally, prepayments, net of prepayment fees, could negatively impact our return on equity.
We may acquire indirect interests in loans rather than direct interests, which would subject us to additional risk.
48
We may make or acquire loans or investments through participation agreements. A participation agreement typically results in a contractual relationship only with the counterparty to the participation agreement and not with the borrower. SIC Advisors has adopted best execution procedures and guidelines to mitigate credit and counterparty risk when we acquire a loan through a participation agreement. In investing through participations, we will generally not have a right to enforce compliance by the borrower with the terms of the loan agreement against the borrower, and we may not directly benefit from the collateral supporting the debt obligation in which it has purchased the participation. As a result, we will be exposed to the credit risk of both the borrower and the counterparty selling the participation. In the event of insolvency of the counterparty, we, by virtue of holding participation interests in the loan, may be treated as its general unsecured creditor. In addition, although we may have certain contractual rights under the loan participation that require the counterparty to obtain our consent prior to taking various actions relating to the loan, we cannot guarantee that the counterparty will seek such consent prior to taking various actions. Further, in investing through participation agreements, we may not be able to conduct the due diligence on the borrower or the quality of the loan with respect to which it is buying a participation that we would otherwise conduct if we were investing directly in the loan, which may result in us being exposed to greater credit or fraud risk with respect to the borrower or the loan than we expected when initially purchasing the participation. See ‘‘Risks Related to SIC Advisors and its Respective Affiliates — There are significant potential conflicts of interest that could affect our investment returns’’ above.
We have entered into total return swap agreements or other derivative transactions which expose us to certain risks, including market risk, liquidity risk and other risks similar to those associated with the use of leverage.
Our wholly-owned, special purpose financing subsidiary, Arbor, has entered into a TRS for a portfolio of senior secured assets with Citibank, N.A., or Citibank. See ‘‘Management’s Discussion and Analysis of Financial Condition and Results of Operations — Off-Balance Sheet Arrangements’’ for a more detailed discussion of the terms of the TRS between Arbor and Citibank.
A TRS is a contract in which one party agrees to make periodic payments to another party based on the change in the market value of the assets underlying the TRS, which may include a specified security, basket of securities or securities indices during the specified period, in return for periodic payments based on a fixed or variable interest rate. A TRS effectively adds leverage to a portfolio by providing investment exposure to a security or market without owning or taking physical custody of such security or investing directly in such market. Because of the unique structure of a TRS, a TRS often offers lower financing costs than are offered through more traditional borrowing arrangements.
The TRS with Citibank enables us, through our ownership of Arbor, to obtain the economic benefit of owning the assets subject to the TRS, despite the fact that such assets will not be directly held or otherwise owned by us or Arbor, in return for an interest-type payment to Citibank. Accordingly, the TRS is analogous to us borrowing funds to acquire assets and incurring interest expense to a lender.
The TRS is subject to market risk, liquidity risk and risk of imperfect correlation between the value of the TRS and the assets underlying the TRS. In addition, we may incur certain costs in connection with the TRS that could, in the aggregate, be significant.
A TRS is also subject to the risk that a counterparty will default on its payment obligations thereunder or that we will not be able to meet our obligations to the counterparty. In the case of the TRS with Citibank, Arbor is required to post cash collateral amounts to secure its obligations to Citibank under the TRS. Citibank, however, is not required to collateralize any of its obligations to Arbor under the TRS. Arbor bears the risk of depreciation with respect to the value of the assets underlying the TRS and is required, under the terms of the TRS, to post additional collateral on a dollar-for-dollar basis in the event of depreciation in the value of the underlying assets after such value decreases below a specified amount. The amount of collateral required to be posted by Arbor is determined primarily on the basis of the aggregate value of the underlying assets.
Arbor is required to initially cash collateralize a specified percentage of each asset (generally 25% of the market value of such asset) included under the TRS in accordance with margin requirements described in the TRS Agreement. The limit on the additional collateral that Arbor may be required to post pursuant to the TRS is equal to the difference between the full notional amount of the assets underlying the TRS and the amount of cash collateral already posted by Arbor (determined without consideration of the initial cash collateral posted for each asset included in the TRS). Arbor’s maximum liability under the TRS is the amount of any decline in the aggregate value of the assets subject to the TRS, less the amount of the cash collateral previously posted by Arbor. Therefore, the absolute risk of loss with respect to the TRS is the notional amount of the TRS.
In addition to customary events of default and termination events, the agreements governing the TRS with Citibank, which are collectively referred to herein as the TRS Agreement, contain the following termination events: (a) a failure to satisfy the portfolio criteria for at least 30 days; (b) a failure to post initial cash collateral or additional collateral as required by the TRS Agreement; (c) a default by Arbor or us with respect to indebtedness in an amount equal to or greater than the lesser of $10.0 million and 2% of our net asset value at such time; (d) a merger of Arbor or us meeting certain criteria; (e) either us or Arbor amending its constituent documents to alter our investment strategy in a manner that has or could reasonably be expected to have a material adverse effect; (f) SIC Advisors
49
ceasing to be the investment manager of Arbor or having authority to enter into transactions under the TRS Agreement on behalf of Arbor, and not being replaced by an entity reasonably acceptable to Citibank; (g) SIC Advisors ceasing to be our investment adviser; (h) Arbor failing to comply with its investment strategies or restrictions to the extent such non-compliance has or could reasonably be expected to have a material adverse effect; (i) Arbor becoming liable in respect of any obligation for borrowed money, other than arising under the TRS Agreement; (j) our dissolution or liquidation; (k) there occurring, without the prior consent of Citibank, any material change to or departure from our policies or the policies of Arbor that may not be changed without the vote of our stockholders and that relates to Arbor’s performance of its obligations under the TRS Agreement; and (l) our violating certain provisions of the 1940 Act or our election to be regulated as a BDC under the 1940 Act being revoked or withdrawn.
In addition to the rights of Citibank to terminate the TRS following an event of default or termination event as described above, Citibank may terminate the TRS on or after the second anniversary of the effective date of the TRS. SIC Advisors may terminate the TRS on behalf of Arbor at any time upon providing 10 days prior notice to Citibank. Any termination by SIC Advisors on behalf of Arbor prior to the second anniversary of the effective date of the TRS will result in payment of an early termination fee to Citibank. Under the terms of the TRS, the early termination fee will equal the present value of the following two cash flows: (a) interest payments at a rate equal to 1.65% based on 70% of the maximum notional amount of $300,000,000, payable from the later of the first anniversary of the effective date of the TRS or the termination date until the second anniversary of the effective date of the TRS and (b) interest payments at a rate equal to 0.15% based on the maximum notional amount of $300,000,000, payable from the later of the first anniversary of the effective date of the TRS or the termination date until the second anniversary of the effective date of the TRS. Other than during the first 365 days and the last 60 days of the term of the TRS, Arbor is required to pay a minimum usage fee of 1.65% on the amount equal to 85% of the average daily unused portion of the maximum amount permitted under the TRS. Arbor will also pay Citibank customary fees in connection with the establishment and maintenance of the TRS.
Upon any termination of the TRS, Arbor will be required to pay Citibank the amount of any decline in the aggregate value of the assets subject to the TRS or, alternatively, will be entitled to receive the amount of any appreciation in the aggregate value of such assets. In the event that Citibank chooses to exercise its termination rights, it is possible that Arbor will owe more to Citibank or, alternatively, will be entitled to receive less from Citibank than it would have if Arbor controlled the timing of such termination due to the existence of adverse market conditions at the time of such termination.
In addition, because a TRS is a form of synthetic leverage, such arrangements are subject to risks similar to those associated with the use of leverage. See ‘‘— Risks Relating to Debt Financing’’ below.
Hedging transactions may expose us to additional risks.
We may engage in currency or interest rate hedging transactions. If we engage in hedging transactions, we may expose ourselves to risks associated with such transactions. We may utilize instruments such as forward contracts, currency options and interest rate swaps, caps, collars and floors to seek to hedge against fluctuations in the relative values of our portfolio positions from changes in currency exchange rates and market interest rates. Hedging against a decline in the values of our portfolio positions does not eliminate the possibility of fluctuations in the values of such positions or prevent losses if the values of such positions decline. However, such hedging can establish other positions designed to gain from those same developments, thereby offsetting the decline in the value of such portfolio positions. Such hedging transaction may also limit the opportunity for gain if the values of the underlying portfolio positions should increase. Moreover, it may not be possible to hedge against an exchange rate or interest rate fluctuation that is so generally anticipated that we are not able to enter into a hedging transaction at an acceptable price.
While we may enter into transactions to seek to reduce currency exchange rate and interest rate risks, unanticipated changes in currency exchange rates or interest rates may result in poorer overall investment performance than if we had not engaged in any such hedging transactions. In addition, the degree of correlation between price movements of the instruments used in a hedging strategy and price movements in the portfolio positions being hedged may vary. Moreover, for a variety of reasons, we may not seek or be able to establish a perfect correlation between such hedging instruments and the portfolio holdings being hedged. Any such imperfect correlation may prevent us from achieving the intended hedge and expose us to risk of loss. In addition, it may not be possible to hedge fully or perfectly against currency fluctuations affecting the value of securities denominated in non-U.S. currencies because the value of those securities is likely to fluctuate as a result of factors not related to currency fluctuations.
The disposition of our investments may result in contingent liabilities.
We currently expect that a significant portion of our investments will involve lending directly to private companies. In connection with the disposition of an investment in private securities, we may be required to make representations about the business and financial affairs of the portfolio company typical of those made in connection with the sale of a business. We may also be required to indemnify the purchasers of such investment to the extent that any such representations turn out to be inaccurate or with respect to certain potential
50
liabilities. These arrangements may result in contingent liabilities that ultimately yield funding obligations that must be satisfied through our return of certain distributions previously made to us.
If we invest in the securities and obligations of distressed and bankrupt issuers, we might not receive interest or other payments.
We may invest in the securities and obligations of distressed and bankrupt issuers, including debt obligations that are in covenant or payment default. Such investments generally are considered speculative. The repayment of defaulted obligations is subject to significant uncertainties. Defaulted obligations might be repaid only after lengthy workout or bankruptcy proceedings, during which the issuer of those obligations might not make any interest or other payments. We may not realize gains from our equity investments.
Risks Relating to Debt Financing
At December 31, 2016, we had $385.7 million of outstanding indebtedness under the senior secured syndicated revolving credit facility with ING Capital LLC (the "ING Credit Facility") and a revolving credit facility with JP Morgan Chase through Alpine Funding LLC ("Alpine"), our wholly-owned special purpose financing subsidiary (the "Alpine Credit Facility") (such credit facilities, collectively referred to as the “Credit Facilities”).
Illustration. The following table illustrates the effect of leverage on returns from an investment in our common stock assuming various annual returns, net of expenses. The calculations in the table below are hypothetical and actual returns may be higher or lower than those appearing below. The calculation assumes (i) $1,183.7 million in total assets, (ii) a weighted average cost of funds of 3.8%, (iii) $390.0 million in debt outstanding and (iv) $773.1 million in stockholders’ equity. In order to compute the “Corresponding return to stockholders,” the “Assumed Return on Our Portfolio (net of expenses)” is multiplied by the assumed total assets to obtain an assumed return to us. From this amount, the interest expense is calculated by multiplying the assumed weighted average cost of funds times the assumed debt outstanding, and the product is subtracted from the assumed return to us in order to determine the return available to stockholders. The return available to stockholders is then divided by our stockholders’ equity to determine the “Corresponding return to stockholders.” Actual interest payments may be different.
Assumed Return on Our Portfolio (net of expenses) | (10)% | (5)% | 0% | 5% | 10% | |||||||||
Corresponding return to stockholders(1) | (17.2 | )% | (9.6 | )% | (1.9 | )% | 5.7 | % | 13.4 | % | ||||
____________________________
(1) | In order for us to cover our annual interest payments on indebtedness, we must achieve annual returns on our December 31, 2016 total assets of at least 1.9%. |
In addition, we have entered into a total return swap with Citi which provides us with exposure to a portfolio of loans with a maximum aggregate market value of $300.0 million. See “Risk Factors — Risks Related to Our Investments — We have entered into total return swap agreements or other derivative transactions which expose us to certain risks, including market risk, liquidity risk and other risks similar to those associated with the use of leverage.”
Because we use borrowed funds to make investments or fund our business operations, we are exposed to risks typically associated with leverage which increase the risk of investing in us.
We intend to borrow funds through draws from our ING Credit Facility to leverage our capital structure, which is generally considered a speculative investment technique. As a result:
• | our common shares may be exposed to an increased risk of loss because a decrease in the value of our investments may have a greater negative impact on the value of our common shares than if we did not use leverage; |
• | if we do not appropriately match the assets and liabilities of our business, adverse changes in interest rates could reduce or eliminate the incremental income we make with the proceeds of any leverage; |
• | our ability to pay dividends on our common stock may be restricted if our asset coverage ratio, as provided in the 1940 Act, is not at least 200% and any amounts used to service indebtedness or preferred stock would not be available for such dividends; |
• | the ING Credit Facility is subject to periodic renewal by our lenders, whose continued participation cannot be guaranteed; |
• | the ING Credit Facility contains covenants restricting our operating flexibility; and |
51
• | we, and indirectly our stockholders, bear the cost of issuing and paying interest or dividends on such securities. |
Covenants in the Credit Facilities may restrict our financial and operating flexibility.
We maintain the ING Credit Facility with certain lenders party thereto from time to time and ING Capital LLC, as administrative agent, and a the Alpine Credit Facility. The Credit Facilities are secured by substantially all of our assets, subject to certain exclusions. Availability of loans under the Credit Facilities are linked to the valuation of the collateral pursuant to a borrowing base mechanism. Borrowings under the Credit Facilities are subject to, among other things, a minimum borrowing/collateral base. Substantially all of our assets are pledged as collateral under the Credit Facilities. The Credit Facilities require us to, among other things (i) make representations and warranties regarding the collateral as well as our business and operations, (ii) agree to certain indemnification obligations, and (iii) agree to comply with various affirmative and negative covenants. The documents for each of the Credit Facilities also include default provisions such as the failure to make timely payments under the Credit Facilities, as the case may be, the occurrence of a change in control, and our failure to materially perform under the operative agreements governing the Credit Facilities, which, if not complied with, could accelerate repayment under the Credit Facilities, thereby materially and adversely affecting our liquidity, financial condition and results of operations.
As a result of such covenants and restrictions in the Credit Facilities, we will be limited in how we conduct our business and we may be unable to raise additional debt or equity financing to take advantage of new business opportunities. In addition, our ability to satisfy the financial requirements required by the Credit Facilities can be affected by events beyond our control and we cannot assure you that we will meet these requirements. We cannot assure you that we will be able to maintain compliance with these covenants in the future and, if we fail to do so, we may be in default under the Credit Facilities, and we may be prohibited from undertaking actions that are necessary or desirable to maintain and expand our business.
Default under the Credit Facilities could allow the lender(s) to declare all amounts outstanding to be immediately due and payable. If the lender(s) declare amounts outstanding under the Credit Facilities to be due, the lender(s) could proceed against the assets pledged to secure the debt under the Credit Facilities. Any event of default, therefore, could have a material adverse effect on our business if the lender(s) determine to exercise their rights.
Because we use debt to finance our investments, changes in interest rates will affect our cost of capital and net investment income.
Because we borrow money to make investments, our net investment income will depend, in part, upon the difference between the rate at which we borrow funds and the rate at which we invest those funds. As a result, we can offer no assurance that a significant change in market interest rates will not have a material adverse effect on our net investment income in the event we use our existing debt to finance our investments. In periods of rising interest rates, our cost of funds will increase to the extent we access the ING Credit Facility, since the interest rate on the ING Credit Facility is floating, which could reduce our net investment income to the extent any debt investments have fixed interest rates. We expect that our long-term fixed-rate investments will be financed primarily with issuances of equity and long-term debt securities. We may use interest rate risk management techniques in an effort to limit our exposure to interest rate fluctuations. Such techniques may include various interest rate hedging activities to the extent permitted by the 1940 Act.
You should also be aware that a rise in the general level of interest rates typically leads to higher interest rates applicable to our debt investments. Accordingly, an increase in interest rates may result in an increase of the amount of incentive fees payable to SIC Advisors.
If we borrow money, the potential for gain or loss on amounts invested in us will be magnified and may increase the risk of investing in us. Borrowed money may also adversely affect the return on our assets, reduce cash available for distribution to our stockholders, and result in losses.
The use of borrowings, also known as leverage, increases the volatility of investments by magnifying the potential for gain or loss on invested equity capital. Our use of leverage to partially finance our investments, through borrowing from banks and other lenders, increases the risks of investing in our common stock. If the value of our assets decreases, leveraging would cause net asset value to decline more sharply than it otherwise would have had we not leveraged. Similarly, any decrease in our income would cause net income to decline more sharply than it would have had we not borrowed. Such a decline could negatively affect our ability to make distributions to our stockholders. In addition, our stockholders will bear the burden of any increase in our expenses as a result of our use of leverage, including interest expenses and any increase in the management or incentive fees payable to the Advisor.
We use leverage to finance our investments. The amount of leverage that we employ depends on our Advisor and our board of directors’ assessment of market and other factors at the time of the relevant borrowing. There can be no assurance that leveraged financing will in the future be available to us on favorable terms or at all. However, to the extent of our use of leverage to finance our
52
assets, our financing costs will reduce cash available for distributions to stockholders. Moreover, we may not be able to meet our financing obligations and, to the extent that we cannot, we risk the loss of some or all of our assets to liquidation or sale to satisfy the obligations. In such an event, we may be forced to sell assets at significantly depressed prices due to market conditions or otherwise, which may result in losses.
As a BDC, we generally are required to meet a coverage ratio of total assets to total borrowings and other senior securities, which include all of our borrowings and any preferred stock that we may issue in the future, of at least 200%. If this ratio declines below 200%, we cannot incur additional debt and could be required to sell a portion of our investments to repay some debt when it is disadvantageous to do so. This could have a material adverse effect on our operations, and we may not be able to make distributions. The amount of leverage that we will employ will be subject to oversight by our board of directors, a majority of whom will be independent directors with no material interests in such transactions.
We will be exposed to risks associated with changes in interest rates.
We are subject to financial market risks, including changes in interest rates. Because we use debt to finance investments, our net investment income depends, in part, upon the difference between the rate at which we borrow funds and the rate at which we invest those funds. As a result, we can offer no assurance that a significant change in market interest rates will not have a material adverse effect on our net investment income. In periods of rising interest rates when we have debt outstanding, our cost of funds will increase, which could reduce our net investment income.
In addition, due to the continuing effects of the prolonged economic crisis and recession that began in 2007, interest rates have recently been at or near historic lows. In the event of a significant rising interest rate environment, our portfolio companies with adjustable-rate debt could see their payments increase and there may be a significant increase in the number of our portfolio companies who are unable or unwilling to repay their debt. Investments in companies with adjustable-rate debt may also decline in value in response to rising interest rates if the rates at which they pay interest do not rise as much, or as quickly, as market interest rates in general. Similarly, during periods of rising interest rates, our investments with fixed rates may decline in value because they are locked in at below market yield.
We may use interest rate risk management techniques in an effort to limit our exposure to interest rate fluctuations. These techniques may include various interest rate hedging activities to the extent such activities are not prohibited by the 1940 Act. These activities may limit our ability to participate in the benefits of lower interest rates with respect to the hedged portfolio. Adverse developments resulting from changes in interest rates or hedging transactions could have a material adverse effect on our business, financial condition and results of operations.
Risks Related to an Investment in our Common Stock
The success of our offering is dependent, in part, on the ability of the dealer manager to implement its business strategy, to hire and retain key employees and to successfully establish, operate and maintain a network of broker-dealers. Our dealer manager also serves as the dealer manager for the distribution of securities of other issuers and may experience conflicts of interest as a result.
The success of our offering and our ability to implement our business strategy is dependent upon the ability of our dealer manager to hire and retain key employees, establish, operate and maintain a network of licensed securities broker-dealers and other agents and implement its business strategy. If the dealer manager is unable to hire qualified employees, build a sufficient network of broker-dealers and implement its business strategy, we may not be able to raise adequate proceeds through our offering to implement our investment strategy.
In addition, the dealer manager serves as the dealer manager for or participate in the distribution of the securities of other issuers. As a result, the dealer manager may experience conflicts of interest in allocating its time between our offering and such other issuers, which could adversely affect our ability to raise adequate proceeds through our offering and implement our investment strategy. Further, the participating broker-dealers retained by the dealer manager may have numerous competing investment products, some with similar or identical investment strategies and areas of focus as us, which they may elect to emphasize to their retail clients.
Investors will not know the purchase price per share at the time they submit their subscription agreements and could receive fewer shares of common stock than anticipated if our board of directors determines to increase the offering price to comply with the requirement that we avoid selling shares below net asset value.
The purchase price at which investors purchase shares of our common stock will be determined at each weekly closing date to ensure that the sales price is equal to or greater than the net asset value of our shares, after deducting selling commissions and dealer
53
manager fees. As a result, an investor's purchase price may be higher than the prior subscription closing price per share, and therefore you may receive a smaller number of shares than if an investor had subscribed at the prior subscription closing price.
Investors will not know the purchase price per share at the time they submit their subscription agreements and could pay a premium for their shares of common stock if our board of directors does not decrease the offering price in the event of a decline to our net asset value per share.
The purchase price at which an investor purchases shares will be determined at each weekly closing date to ensure that the sales price is equal to or greater than the net asset value of our shares, after deducting selling commissions and dealer manager fees. In the event of a decrease to our net asset value per share, an investor could pay a premium of more than 2.5% for its shares of common stock if our board of directors does not decrease the offering price. A decline in our net asset value per share to an amount more than 2.5% below our current offering price, net of selling commissions and dealer manager fees, creates a rebuttable presumption that there has been a material change in the value of our assets such that a reduction in the offering price per share is warranted. This presumption may only be rebutted if our board of directors, in consultation with our management, reasonably and in good faith determines that the decline in net asset value per share is the result of a temporary movement in the credit markets or the value of our assets, rather than a more fundamental shift in the valuation of our portfolio. In the event that (i) net asset value per share decreases to more than 5% below our current net offering price and (ii) our board of directors believes that such decrease in net asset value per share is the result of a non-temporary movement in the credit markets or the value of our assets, our board of directors will undertake to establish a new net offering price that is not more than 2.5% above our net asset value per share. If our board of directors determines that the decline in our net asset value per share is the result of a temporary movement in the credit markets or the value of our assets, investors will purchase shares at an offering price per share, net of selling commissions and dealer manager fees, which represents a premium to the net asset value per share of greater than 2.5%.
If we are unable to raise substantial funds in our ongoing, continuous ‘‘best efforts’’ offering, we will be limited in the number and type of investments we may make, and the value of your investment in us may be reduced in the event our assets under-perform.
Our continuous offering is being made on a best efforts basis, whereby our dealer manager and participating broker-dealers are only required to use their best efforts to sell our shares and have no firm commitment or obligation to purchase any of the shares. To the extent that less than the maximum number of shares is subscribed for, the opportunity for diversification of our investments may be decreased and the returns achieved on those investments may be reduced as a result of allocating all of our expenses among a smaller capital base.
Our shares are not listed on an exchange or quoted through a quotation system and will not be listed for the foreseeable future, if ever. Therefore, our stockholders will have limited liquidity and may not receive a full return of invested capital upon selling their shares.
Our shares are illiquid investments for which there is not a secondary market nor is it expected that any will develop in the future. A future liquidity event could include: (i) a listing of our shares on a national securities exchange; (ii) a merger or another transaction approved by our board of directors in which our stockholders will receive cash or shares of a listed company; or (iii) a sale of all or substantially all of our assets either on a complete portfolio basis or individually followed by a liquidation. Certain types of liquidity events, such as a listing, would allow us to retain our investment portfolio intact while providing our stockholders with access to a trading market for their securities. Provided we offer Class T shares, a Class T share will convert into a Class A share upon the earliest of (i) a Class T share reaching the applicable Sales Charge Cap, (ii) our dealer manager advising us that the aggregate underwriting compensation payable from all sources (determined in accordance with applicable FINRA rules) would be in excess of 10% of the gross proceeds of our offering and (iii) a liquidity event.
There can be no assurance that a suitable transaction will be available or that market conditions will be favorable during that timeframe. Prior to a liquidity event, our share repurchase program may provide a limited opportunity for you to have your shares of common stock repurchased, subject to certain restrictions and limitations, at a price which may reflect a discount from the purchase price you paid for the shares being repurchased.
Also, since a portion of the public offering price from the sale of shares in our offering will be used to pay expenses and fees, the full offering price paid by the stockholders will not be invested in portfolio companies. As a result, you may not receive a return of all of your invested capital. If we do not successfully complete a liquidity event, liquidity for an investor’s shares will be limited to participation in our share repurchase program. In addition, any shares repurchased pursuant to our share repurchase program may be purchased at a price which may reflect a discount from the purchase price stockholders paid for the shares being repurchased and Class T shares may be subject to a contingent deferred sales charge. See ‘‘Share Repurchase Program’’, in Note 13 to our consolidated financial statements, for a detailed description of our proposed share repurchase program.
54
If our shares are listed on a national securities exchange or quoted through a quotation system, we cannot assure you a public trading market will develop or, if one develops, that such trading market can be sustained. Shares of companies offered in an initial public offering often trade at a discount to the initial offering price due to underwriting discounts and related offering expenses. Also, shares of closed-end investment companies, including BDCs, frequently trade at a discount from their net asset value. This characteristic of closed-end investment companies is separate and distinct from the risk that our net asset value per share of common stock may decline. We cannot predict whether our common stock, if listed, will trade at, above or below net asset value.
Our ability to conduct our continuous offering successfully is dependent, in part, on the ability of our dealer manager to successfully establish, operate and maintain relationships with a network of broker-dealers, which will in turn sell a sufficient number of shares of our common stock for us to achieve our investment objective.
Our dealer manager may not be able to sell a sufficient number of shares to allow us to have adequate funds to purchase a diversified portfolio of investments and generate income sufficient to cover our expenses.
The success of our public offering, and correspondingly our ability to implement our business strategy, is dependent upon the ability of our dealer manager to establish and maintain relationships with a network of licensed securities broker-dealers and other agents to sell our shares. If our dealer manager fails to perform, we may not be able to raise adequate proceeds through our public offering to implement our investment strategy. If we are unsuccessful in implementing our investment strategy, you could lose all or a part of your investment.
We are not obligated to complete a liquidity event; therefore, it will be difficult for an investor to sell his or her shares.
There can be no assurance that we will complete a liquidity event. If we do not successfully complete a liquidity event, liquidity for an investor’s shares will be limited to our share repurchase program, which we have no obligation to maintain.
The timing of our repurchase offers pursuant to our share repurchase program may be at a time that is disadvantageous to our stockholders.
When we make quarterly repurchase offers pursuant to the share repurchase program, we may offer to repurchase shares at a price that is lower than the price that investors paid for shares in our offering. As a result, to the extent investors paid an offering price that includes the related sales load and to the extent investors have the ability to sell their shares pursuant to our share repurchase program, then the price at which an investor may sell shares, which will be at a price equal to our most recently disclosed net asset value per share immediately prior to the date of repurchase, may be lower than what an investor paid in connection with the purchase of shares in our offering.
We may be unable to invest a significant portion of the net proceeds of our offering on acceptable terms in an acceptable timeframe.
Delays in investing the net proceeds of our offering may impair our performance. We cannot assure you we will be able to identify any investments that meet our investment objective or that any investment that we make will produce a positive return. We may be unable to invest the net proceeds of our offering on acceptable terms within the time period that we anticipate or at all, which could harm our financial condition and operating results.
Before making investments, we will invest the net proceeds of our public offering primarily in cash, cash equivalents, U.S. government securities, repurchase agreements, and other high-quality debt instruments maturing in one year or less from the time of investment. This will produce returns that are significantly lower than the returns, which we expect to achieve when our portfolio is fully invested in securities meeting our investment objective. As a result, any distributions that we pay while our portfolio is not fully invested in securities meeting our investment objective may be lower than the distributions that we may be able to pay when our portfolio is fully invested in securities meeting our investment objective.
A stockholder’s interest in us will be diluted if we issue additional shares, which could reduce the overall value of an investment in us.
Our investors do not have preemptive rights to any shares we issue in the future. Our articles of incorporation authorizes us to issue up to 250,000,000 shares of common stock. Pursuant to our articles of incorporation, a majority of our entire board of directors may amend our articles of incorporation to increase the number of authorized shares of stock without stockholder approval. After an investor purchases shares, our board may elect to sell additional shares in the future, issue equity interests in private offerings, or issue share-based awards to our independent directors or persons associated with the Advisor. To the extent we issue additional equity interests at or below net asset value, after an investor purchases our shares, an investor’s percentage ownership interest in us will be diluted. In
55
addition, depending upon the terms and pricing of any additional offerings and the value of our investments, an investor may also experience dilution in the net asset and fair value of his or her shares.
Under the 1940 Act, we generally are prohibited from issuing or selling our common stock at a price below net asset value per share, which may be a disadvantage as compared with certain public companies. We may, however, sell our common stock, or warrants, options, or rights to acquire our common stock, at a price below the current net asset value of our common stock if our board of directors and independent directors determine that such sale is in our best interests and the best interests of our stockholders, and our stockholders, including a majority of those stockholders that are not affiliated with us, approve such sale. In any such case, the price at which our securities are to be issued and sold may not be less than a price that, in the determination of our board of directors, closely approximates the fair value of such securities (less any distributing commission or discount). If we raise additional funds by issuing common stock or senior securities convertible into, or exchangeable for, our common stock, then the percentage ownership of our stockholders at that time will decrease and you will experience dilution.
Preferred stock could be issued with rights and preferences that would adversely affect holders of our common stock.
Our offering does not include an offering of preferred stock. However, under the terms of our articles of incorporation, our board of directors is authorized to issue shares of preferred stock in one or more series without stockholder approval, which could potentially adversely affect the interests of existing stockholders. In the event we issue preferred stock, the relevant prospectus will be supplemented accordingly; however, doing so would not require a stockholder vote, unless we seek to issue preferred stock that is convertible into our common stock.
If we issue preferred stock, the net asset value and market value of our common stock may become more volatile.
If we issue preferred stock, we cannot assure you that such issuance would result in a higher yield or return to the holders of our common stock. The issuance of preferred stock would likely cause the net asset value and market value of our common stock to become more volatile. If the dividend rate on the preferred stock were to approach the net rate of return on our investment portfolio, the benefit of leverage to the holders of our common stock would be reduced. If the dividend rate on the preferred stock were to exceed the net rate of return on our portfolio, the leverage would result in a lower rate of return to the holders of our common stock than if we had not issued preferred stock. Any decline in the net asset value of our investments would be borne entirely by the holders of our common stock. Therefore, if the market value of our portfolio were to decline, the leverage would result in a greater decrease in net asset value to the holders of our common stock than if we were not leveraged through the issuance of preferred stock. This greater net asset value decrease would also tend to cause a greater decline in the market price for our common stock. We might be in danger of failing to maintain the required asset coverage of the preferred stock or of losing our ratings on the preferred stock or, in an extreme case, our current investment income might not be sufficient to meet the dividend requirements on the preferred stock. In order to counteract such an event, we might need to liquidate investments in order to fund a redemption of some or all of the preferred stock. In addition, we would pay (and the holders of our common stock would bear) all costs and expenses relating to the issuance and ongoing maintenance of the preferred stock, including higher advisory fees if our total return exceeds the dividend rate on the preferred stock. Holders of preferred stock may have different interests than holders of our common stock and may at times have disproportionate influence over our affairs.
Holders of any preferred stock we might issue would have the right to elect members of the board of directors and class voting rights on certain matters.
Holders of any preferred stock we might issue, voting separately as a single class, would have the right to elect two members of the board of directors at all times and in the event dividends become two full years in arrears, would have the right to elect a majority of our directors until such arrearage is completely eliminated. In addition, preferred stockholders would have class voting rights on certain matters, including changes in fundamental investment restrictions and conversion to open-end status, and accordingly would be able to veto any such changes. Restrictions imposed on the declarations and payment of dividends or other distributions to the holders of our common stock and preferred stock, both by the 1940 Act and by requirements imposed by rating agencies or the terms of our credit facilities, might impair our ability to maintain our qualification as a RIC for U.S. federal income tax purposes. While we would intend to redeem our preferred stock to the extent necessary to enable us to distribute our income as required to maintain our qualification as a RIC, there can be no assurance that such actions could be effected in time to meet the tax requirements.
Certain provisions of the Maryland Corporation Law could deter takeover attempts.
Our bylaws exempt us from the Maryland Control Share Acquisition Act, which significantly restricts the voting rights of control shares of a Maryland corporation acquired in a control share acquisition. If our board of directors were to amend our bylaws to repeal this exemption from the Maryland Control Share Acquisition Act, that statute may make it more difficult for a third party to obtain control of us and increase the difficulty of consummating such a transaction. Although we do not presently intend to adopt such an
56
amendment to our bylaws, there can be no assurance that we will not so amend our bylaws at some time in the future. We will not, however, amend our bylaws to make us subject to the Maryland Control Share Acquisition Act without our board of directors determining that doing so would not conflict with the 1940 Act and obtaining confirmation from the SEC that it does not object to that determination.
Additionally, our board of directors may, without stockholder action, authorize the issuance of shares of stock in one or more classes or series, including preferred stock. Our board of directors may also, without stockholder action, amend our articles of incorporation to increase the number of shares of stock of any class or series that we have authority to issue. These anti-takeover provisions may inhibit a change of control in circumstances that could give the holders of our common stock the opportunity to realize a premium over the value of our common stock.
Investing in our common stock involves a high degree of risk.
The investments we make in accordance with our investment objective may result in a higher amount of risk and volatility or loss of principal than alternative investment options. Our investments in portfolio companies may be highly speculative and aggressive and, therefore, an investment in our common stock may not be suitable for someone with lower risk tolerance.
The net asset value of our common stock may fluctuate significantly.
The net asset value and liquidity, if any, of the market for shares of our common stock may be significantly affected by numerous factors, some of which are beyond our control and may not be directly related to our operating performance. These factors include:
• | significant volatility in the market price and trading volume of securities of BDCs or other companies in our sector, which are not necessarily related to the operating performance of the companies; |
• | changes in regulatory policies or tax guidelines, particularly with respect to RICs or BDCs; |
• | loss of RIC or BDC status; |
• | changes in earnings or variations in operating results; |
• | changes in the value of our portfolio of investments; |
• | changes in accounting guidelines governing valuation of our investments; |
• | any shortfall in revenue or net income or any increase in losses from levels expected by investors; |
• | departure of SIC Advisors or certain of its respective key personnel; |
• | operating performance of companies comparable to us; |
• | general economic trends and other external factors; and |
• | loss of a major funding source. |
The price which you pay for our shares may not reflect our current net asset value at the time of your subscription.
In the event of a material decline in our net asset value per share, which we consider to be a 2.5% decrease below our current net offering price, and subject to certain conditions, we will reduce our offering price accordingly. Therefore, the net proceeds per share, net of all sales load, from a new investor may be in excess of the then current net asset value per share. Also, we will file a supplement to any relevant prospectus with the SEC or amend our registration statement if our net asset value per share: (i) declines more than 10% from the net asset value per share as of the effective date of the relevant registration statement or (ii) increases to an amount that is greater than the net proceeds per share as stated in the prospectus.
U.S. Federal Income Tax Risks
We will be subject to corporate-level U.S. federal income tax if we are unable to qualify for the tax treatment applicable to RICs under Subchapter M of the Code or to satisfy RIC distribution requirements.
To maintain RIC tax treatment under the Code, we must meet the following minimum annual distribution, income source and asset diversification requirements. See ‘‘Business - Taxation as a Regulated Investment Company.’’
57
The minimum annual distribution requirement for a RIC will be satisfied if we distribute to our stockholders on an annual basis at least 90% of our net ordinary taxable income and realized net short-term capital gains in excess of realized net long-term capital losses, if any. We would also be taxed on any retained income and/or gains, including any short-term capital gains or long-term capital gains. We must also satisfy an additional annual distribution requirement during each calendar year in order to avoid a 4% excise tax on the amount of the under-distribution. Because we may use debt financing, we are subject to an asset coverage ratio requirement under the 1940 Act and may in the future become subject to certain financial covenants under loan and credit agreements that could, under certain circumstances, restrict us from making distributions necessary to satisfy the distribution requirements. If we are unable to obtain cash from other sources, we could fail to qualify for RIC tax treatment, or could be required to retain a portion of our income or gains, and thus become subject to corporate-level U.S. federal income tax.
The income source requirement will be satisfied if we obtain at least 90% of our income for each year from dividends, interest, gains from the sale of stock or securities, or similar sources. The asset diversification requirement will be satisfied if we meet certain asset diversification requirements at the end of each quarter of our taxable year. To satisfy this requirement, at least 50% of the value of our assets must consist of cash, cash equivalents, U.S. Government securities, securities of other RICs, and other acceptable securities; and no more than 25% of the value of our assets can be invested in the securities, other than U.S. government securities or securities of other RICs, of one issuer, of two or more issuers that are controlled, as determined under applicable Code rules, by us and that are engaged in the same or similar or related trades or businesses or of certain ‘‘qualified publicly traded partnerships.’’ Failure to meet these requirements may result in our having to dispose of certain investments quickly in order to prevent the loss of RIC status. Because most of our investments will be in private companies, and therefore will be relatively illiquid, any such dispositions could be made at disadvantageous prices and could result in substantial losses.
If we fail to qualify for or maintain RIC tax treatment for any reason and are subject to corporate income tax, the resulting corporate taxes could substantially reduce our net assets, the amount of income available for distribution, and the amount of our distributions. Such a failure would have a material adverse effect on our results of operations and financial conditions, and thus, our stockholders.
If we do not qualify as a ‘‘publicly offered regulated investment company,’’ as defined in the Code, you will be taxed as though you received a distribution of some of our expenses.
A ‘‘publicly offered regulated investment company’’ is a RIC whose shares are either (i) continuously offered pursuant to a public offering, (ii) regularly traded on an established securities market or (iii) held by at least 500 persons at all times during the taxable year. If we are not a publicly offered RIC for any period, a non-corporate stockholder’s allocable portion of our affected expenses, including our management fees, will be treated as an additional distribution to the stockholder and will be deductible by such stockholder only to the extent permitted under the limitations described below. For non-corporate stockholders, including individuals, trusts, and estates, significant limitations generally apply to the deductibility of certain expenses of a non-publicly offered RIC, including advisory fees. In particular, these expenses, referred to as miscellaneous itemized deductions, are deductible to an individual only to the extent they exceed 2% of such a stockholder’s adjusted gross income, and are not deductible for alternative minimum tax purposes. While we anticipate that we will constitute a publicly offered RIC after our first tax year, there can be no assurance that we will in fact so qualify for any of our taxable years.
We may have difficulty paying our required distributions if we recognize income before or without receiving cash representing such income.
For U.S. federal income tax purposes, we may be required to recognize taxable income in circumstances in which we do not receive a corresponding payment in cash. For example, if we hold debt obligations that are treated under applicable tax rules as having original issue discount (such as debt instruments with PIK, interest or, in certain cases, increasing interest rates or debt instruments that were issued with warrants), we must include in income each year a portion of the original issue discount that accrues over the life of the obligation, regardless of whether cash representing such income is received by us in the same taxable year. We may also have to include in income other amounts that we have not yet received in cash, such as deferred loan origination fees that are paid after origination of the loan or are paid in non-cash compensation such as warrants or stock. Furthermore, we may invest in non-U.S. corporations (or other non-U.S. entities treated as corporations for U.S. federal income tax purposes) that could be treated under the Code and U.S. Treasury regulations as ‘‘passive foreign investment companies’’ and/or ‘‘controlled foreign corporations.’’ The rules relating to investment in these types of non-U.S. entities are designed to ensure that U.S. taxpayers are either, in effect, taxed currently (or on an accelerated basis with respect to corporate level events) or taxed at increased tax rates at distribution or disposition. In certain circumstances this could require us to recognize income where we do not receive a corresponding payment in cash. We anticipate that a portion of our income may constitute original issue discount or other income required to be included in taxable income prior to receipt of cash. Further, we may elect to amortize market discounts and include such amounts in our taxable income in the current year, instead of upon disposition, as an election not to do so would limit our ability to deduct interest expenses for tax purposes.
58
Because any original issue discount or other amounts accrued will be included in our investment company taxable income for the year of the accrual, we may be required to make a distribution to our stockholders in order to satisfy the annual distribution requirement, even if we will not have received any corresponding cash amount. As a result, we may have difficulty meeting the tax requirement to distribute at least 90% of our net ordinary income and realized net short-term capital gains in excess of realized net long-term capital losses, if any, to maintain RIC tax treatment under the Code. We may have to sell some of our investments at times and/or at prices we would not consider advantageous, raise additional debt or equity capital, make a partial share distribution, or forgo new investment opportunities for this purpose. If we are not able to obtain cash from other sources, and choose not to make a qualifying share distribution, we may fail to qualify for RIC tax treatment and thus become subject to corporate-level U.S. federal income tax. See ‘‘Tax Matters.’’
Item 1B. Unresolved Staff Comments
None.
Item 2. Properties
We do not own any real estate or other physical properties materially important to our operation. Our headquarters are currently located at 280 Park Avenue, 6th Floor East, New York, NY 10017. Our administrator furnishes us office space and we reimburse it for such costs on an allocated basis.
Item 3. Legal Proceedings
There are no material pending legal proceedings to which we or any of our subsidiaries are a party or of which any of our property or any of our subsidiaries' property is the subject.
Item 4. Mine Safety Disclosures
Not Applicable
PART II
Item 5. Market for Registrant’s Common Equity, Related Stockholder Matters and Issuer Purchases of Equity Securities.
Market Information
There is currently no market for our common stock, and we do not expect that a market for our shares will develop in the foreseeable future. No shares of our common stock have been authorized for issuance under any equity compensation plans. Under Maryland law, our stockholders generally will not be personally liable for our debts or obligations.
As of March 6, 2017, we are offering our shares on a continuous basis at an offering price of $9.05 per share; however, to the extent that our net asset value increases, we intend to sell at a price necessary to ensure that shares are not sold at a price per share, after deduction of selling commissions and dealer manager fees, that is below our net asset value per share. In the event of a material decline in our net asset value per share, which we consider to be a 2.5% decrease below our current net offering price, and subject to certain conditions, we will reduce our offering price accordingly. Therefore, persons who tender subscriptions for our shares in our offering must submit subscriptions for a certain dollar amount, rather than a number of our shares and, as a result, may receive fractional shares.
In connection with each closing on the sale of shares offered in our continuous public offering, our board of directors or a committee thereof is required, within 48 hours of the time that each closing and sale is made, to make the determination that we are not selling shares at a price per share which, after deducting selling commissions and dealer manager fees, is below our then current net asset value per share. Our board of directors will consider the following factors, among others, in making such determination:
• | the net asset value per share of our shares disclosed in the most recent periodic report we filed with the SEC; |
• | our management’s assessment of whether any material change in the net asset value per share has occurred (including through the realization of net gains on the sale of our portfolio investments) from the period beginning on the date of the most recently disclosed net asset value per share to the period ending two days prior to the date of the closing on and sale of our shares; and |
• | the magnitude of the difference between the net asset value per share disclosed in the most recent periodic report we filed with the SEC and our management’s assessment of any material change in the net asset value per share |
59
since the date of the most recently disclosed net asset value per share, and the offering price of our shares at the date of closing.
Importantly, this determination does not require that we calculate net asset value in connection with each closing and sale of our shares, but instead it involves the determination by our board of directors or a committee thereof that we are not selling our shares at a price which, after deducting selling commissions and dealer manager fees, is below the then current net asset value per share at the time at which the closing and sale is made.
Moreover, to the extent that there is even a remote possibility that we may (i) issue our shares at a price which, after deducting selling commissions and dealer manager fees, is below the then current net asset value per share of our shares at the time at which the closing and sale is made or (ii) trigger the undertaking (which we provided to the SEC in our registration statement) to suspend the offering of our shares pursuant to our continuous public offering if the net asset value per share fluctuates by certain amounts in certain circumstances until our prospectus is amended, our board of directors or a committee thereof will elect, in the case of clause (i) above, either to postpone the closing until such time that there is no longer the possibility of the occurrence of such event or to undertake to determine net asset value within two days prior to any such sale to ensure that such sale will not be at a price which, after deducting selling commissions and dealer manager fees, is below our then current net asset value per share, and, in the case of clause (ii) above, to comply with such undertaking or to undertake to determine net asset value to ensure that such undertaking has not been triggered.
In addition, a decline in our net asset value per share to an amount more than 2.5% below our current offering price, net of selling commissions and dealer manager fees, creates a rebuttable presumption that there has been a material change in the value of our assets such that a reduction in the offering price per share is warranted. This presumption may only be rebutted if our board of directors, in consultation with our management, reasonably and in good faith determines that the decline in net asset value per share is the result of a temporary movement in the credit markets or the value of our assets, rather than a more fundamental shift in the valuation of our portfolio. In the event that (i) net asset value per share decreases to more than 2.5% below our current net offering price and (ii) our board of directors believes that such decrease in the net asset value per share is the result of a non-temporary movement in the credit markets or the value of our assets, our board of directors will undertake to establish a new net offering price that is not more than 5% above our net asset value per share. If our board of directors determines that the decline in our net asset value per share is the result of a temporary movement in the credit markets or the value of our assets, investors will purchase shares at an offering price per share, net of selling commissions and dealer manager fees, which represents a premium to the net asset value per share of greater than 2.5%.
Set forth below is a chart describing the classes of our securities outstanding as of March 6, 2017:
Title of Class | Amount Authorized | Amount Held by Us or for Our Account | Amount Outstanding | |||||
Common Stock | 250,000,000 | — | 95,838,652 | |||||
As of March 6, 2017, we had 20,300 record holders of our common stock.
Distributions
Our dividends, if any, are determined by the board of directors. We have elected to be treated as a RIC under Subchapter M of the Code. To maintain RIC tax treatment, we must, among others things, distribute at least 90% of our net ordinary income and net short-term capital gains in excess of net long-term capital losses, if any, to our stockholders. In order to avoid certain excise taxes imposed on RICs, we currently intend to distribute during each calendar year an amount at least equal to the sum of: (i) 98% of our ordinary income for the calendar year, (ii) 98.2% of our capital gains in excess of capital losses for the one-year period generally ending on October 31 of the calendar year (unless an election is made by us to use our taxable year) and (iii) any ordinary income and net capital gains for preceding years that were not distributed during such years and on which we paid no U.S. federal income tax.
The following table reflects the cash distributions per share that the Company has declared or paid to its stockholders subsequent to December 31, 2016 and for the years ended December 31, 2016 and 2015. Stockholders of record as of each respective record date were entitled to receive the distribution. As of March 6, 2017, these distributions represent an annualized yield of 7.07% based on our offering price of $9.05 per share:
60
Record Date | Payment Date | Amount per share | |||
January 15 and 30, 2015 | January 30, 2015 | $ | 0.03333 | ||
February 13 and 27, 2015 | February 27, 2015 | 0.03333 | |||
March 13 and 31, 2015 | March 31, 2015 | 0.03333 | |||
April 15 and 30, 2015 | April 30, 2015 | 0.03333 | |||
May 15 and 29, 2015 | May 29, 2015 | 0.03333 | |||
June 15 and 30, 2015 | June 30, 2015 | 0.03333 | |||
July 15 and 31, 2015 | July 31, 2015 | 0.03333 | |||
August 14 and 31, 2015 | August 31, 2015 | 0.03333 | |||
September 15 and 30, 2015 | September 30, 2015 | 0.03333 | |||
October 15 and 30, 2015 | October 30, 2015 | 0.03333 | |||
November 13 and 30, 2015 | November 30, 2015 | 0.03333 | |||
December 15 and 31, 2015 | December 31, 2015 | 0.03333 | |||
January 15 and 29, 2016 | January 29, 2016 | 0.03333 | |||
February 12 and 29, 2016 | February 29, 2016 | 0.03333 | |||
March 15 and 31, 2016 | March 31, 2016 | 0.03333 | |||
April 15 and 29, 2016 | April 29, 2016 | 0.03333 | |||
May 13 and 31, 2016 | May 31, 2016 | 0.03333 | |||
June 15 and 30, 2016 | June 30, 2016 | 0.03333 | |||
July 15 and 29, 2016 | July 29, 2016 | 0.03333 | |||
August 15 and 31, 2016 | August 31, 2016 | 0.03333 | |||
September 15 and 30, 2016 | September 30, 2016 | 0.03333 | |||
October 14 and 31, 2016 | October 31, 2016 | 0.02667 | |||
November 15 and 30, 2016 | November 30, 2016 | 0.02667 | |||
December 15 and 31, 2016 | December 31, 2016 | 0.02667 | |||
January 13 and 31, 2017 | January 31, 2017 | 0.02667 | |||
February 15 and 28, 2017 | February 28, 2017 | 0.02667 | |||
March 15 and 31, 2017 | March 31, 2017 | 0.02667 | |||
From time to time, but not less than quarterly, we will review our accounts to determine whether distributions to our stockholders are appropriate. We may in the future fund our cash distributions to stockholders from any sources of funds available to us, including offering proceeds and borrowings. We have not established limits on the amount of funds we may use from available sources to make distributions. SIC Advisors has no obligation to make expense support payments pursuant to the Expense Support and Reimbursement Agreement after December 31, 2016, the date on which such agreement expired.
The following table reflects, for U.S. Federal Income tax purposes, the sources of the cash distributions that the Company has paid on its common stock during the years ended December 31, 2016, 2015 and 2014:
Years Ended December 31, | ||||||||||||||||||||
2016 | 2015 | 2014 | ||||||||||||||||||
Source of Distribution | Distribution Amount(1) | Percentage | Distribution Amount | Percentage | Distribution Amount | Percentage | ||||||||||||||
Net investment income | $ | 68,596,940 | 100.0 | % | $ | 40,302,852 | 70.9 | % | $ | 20,880,983 | 72.5 | % | ||||||||
Net realized gain | — | — | 441,052 | 0.8 | 1,192,159 | 4.2 | ||||||||||||||
Return of capital (other) | — | — | 16,060,726 | 28.3 | 6,719,353 | 23.3 | ||||||||||||||
Distributions on a tax basis: | $ | 68,596,940 | 100.0 | % | $ | 56,804,630 | 100.0 | % | $ | 28,792,495 | 100.0 | % | ||||||||
We have adopted an “opt in” distribution reinvestment plan pursuant to which our common stockholders may elect to have the full amount of any cash distributions reinvested in additional shares of our common stock. As a result, if we declare a cash dividend or other distribution, each stockholder that has “opted in” to our dividend reinvestment plan will have their distributions automatically reinvested in additional shares of our common stock rather than receiving cash distributions. Stockholders who receive distributions in the form of shares of common stock will be subject to the same federal, state and local tax consequences as if they received cash distributions.
61
Sales of Unregistered Securities
None.
Issuer Purchases of Equity Securities
In June 2013, we commenced a share repurchase program pursuant to which it intends to conduct quarterly share repurchases of up to 2.5% of the weighted average number of outstanding shares of our common stock in the prior four calendar quarters or 10% of the weighted average number of outstanding shares in the prior 12-month period. The purpose of the share repurchase program is to allow stockholders to sell their shares back to us at a price equal to the most recently disclosed net asset value per share of our common stock immediately prior to the date of repurchase. Shares will be purchased from stockholders participating in the program on a pro rata basis. Unless our board of directors determines otherwise, the number of shares to be repurchased during any calendar year will be limited to the proceeds received in association with the sale of shares of common stock under the distribution reinvestment plan.
The table below provides information concerning our repurchases of shares of our common stock during the quarter ended December 31, 2016 pursuant to our share repurchase program:
Period | Total Number of Shares Purchased(1) | Average Price Paid per Share | Total Number of Shares Purchased as Part of Publicly Announced Plans or Programs | Maximum Number of Shares that May Yet Be Purchased Under the Plan or Program | |||||||||
October 1 to December 31, 2016 | 1,081,335 | $ | 8.14 | 1,077,352 | — | (2) | |||||||
Total | 1,081,335 | $ | 8.14 | 1,077,352 | — | (2) | |||||||
_______________________
(1) | "Total Number of Shares Purchased" includes repurchases of shares of common stock from certain shareholders due to death. During the three months ended December 31, 2016, the Company repurchased 3,983 shares common stock from certain shareholders due to death. See Note 13 to our consolidated financial statements for more information. |
(2) | A description of the maximum number of shares that may be purchased under our share repurchase program is included in the narrative preceding this table. |
Item 6. Selected Financial Data
The following selected consolidated financial data for the years ended December 31, 2016, 2015, 2014, 2013 and for the period from April 17, 2012 (commencement of operations) to December 31, 2012 is derived from our consolidated financial statements, which have been audited by Ernst & Young LLP, our independent registered public accounting firm. The data should be read in conjunction with our consolidated financial statements and related notes thereto and “Item 7. Management’s Discussion and Analysis of Financial Condition and Results of Operations” included elsewhere in this annual report on Form 10-K.
62
As of and for the years ended December 31, | For the Period from April 17, 2012 (commencement of operations) through December 31, | ||||||||||||||||||
2016 | 2015 | 2014 | 2013 | 2012 | |||||||||||||||
Statement of Operations data: | |||||||||||||||||||
Total investment income | $ | 99,780,496 | $ | 85,639,700 | $ | 39,391,455 | $ | 8,007,002 | $ | 1,235,116 | |||||||||
Base management fees | 19,928,802 | 17,234,293 | 8,976,657 | 1,906,386 | 319,530 | ||||||||||||||
Incentive fee | 9,281,479 | 4,434,352 | (183,617 | ) | 182,989 | 628 | |||||||||||||
All other expenses - Net of expense reimbursement | 10,605,743 | 17,470,552 | 11,032,000 | 574,082 | 424,926 | ||||||||||||||
Net investment income | 59,964,472 | 46,500,503 | 19,566,415 | 5,343,545 | 490,032 | ||||||||||||||
Unrealized appreciation/(depreciation) on total investments | 22,484,721 | (67,923,168 | ) | (12,525,678 | ) | 839,817 | (19,160 | ) | |||||||||||
Net realized gain/(loss) on total investments | (13,120,398 | ) | 11,309,852 | 7,011,513 | 97,424 | 22,298 | |||||||||||||
Net increase/(decrease) in net assets resulting from operations | 69,328,795 | (10,112,813 | ) | 14,052,250 | 6,280,786 | 493,170 | |||||||||||||
Per share data:(1) | |||||||||||||||||||
Net asset value per common share at year end | $ | 8.17 | $ | 8.16 | $ | 8.97 | $ | 9.18 | $ | 8.96 | |||||||||
Net investment income | 0.66 | 0.66 | 0.55 | 0.72 | 0.21 | ||||||||||||||
Net realized gains/(losses) on total investments | (0.15 | ) | 0.16 | 0.20 | 0.01 | 0.01 | |||||||||||||
Net unrealized appreciation/(depreciation) on total investments | 0.25 | (0.96 | ) | (0.35 | ) | 0.12 | (0.01 | ) | |||||||||||
Net increase/decrease in net assets resulting from operations | 0.77 | (0.14 | ) | 0.40 | 0.85 | 0.48 | |||||||||||||
Dividends declared (2) | 0.76 | 0.80 | 0.80 | 0.80 | 0.40 | ||||||||||||||
Issuance of common stock above net asset value (3) | 0.01 | 0.13 | 0.19 | 0.17 | — | ||||||||||||||
Balance Sheet data at year end: | |||||||||||||||||||
Total investment portfolio at fair value | $ | 983,144,322 | $ | 907,362,444 | $ | 616,915,093 | $ | 137,801,537 | $ | 30,580,211 | |||||||||
Cash collateral on total return swap | 79,620,942 | 77,029,970 | 56,877,928 | 6,706,159 | — | ||||||||||||||
Total investments | 1,062,765,264 | 984,392,414 | 673,793,021 | 144,507,696 | 30,580,211 | ||||||||||||||
Cash and cash equivalents | 99,400,794 | 93,658,142 | 65,749,154 | 34,939,948 | 6,651,767 | ||||||||||||||
Other assets | 21,565,190 | 19,895,635 | 16,523,457 | 6,759,194 | 1,608,400 | ||||||||||||||
Total assets | 1,183,731,248 | 1,097,946,191 | 756,065,632 | 186,206,838 | 38,840,378 | ||||||||||||||
Total liabilities | 410,618,161 | 420,582,689 | 266,870,037 | 32,054,426 | 18,217,396 | ||||||||||||||
Total net assets | 773,113,087 | 677,363,502 | 489,195,595 | 154,152,412 | 20,622,982 | ||||||||||||||
Other data (unaudited): | |||||||||||||||||||
Weighted average yield on total investments (4) | 10.4 | % | 11.5 | % | 10.8 | % | 10.0 | % | 11.0 | % | |||||||||
Number of companies in investment portfolio at year end | 99 | 89 | 73 | 49 | 34 | ||||||||||||||
_______________________
(1) | The per share data was derived by using the weighted average shares outstanding during the years ended December 31, 2016, 2015, 2014, 2013, and the period from April 17, 2012 (commencement of operations) through Decmeber 31, 2012, which were 90,424,090, 76,648,292, 35,425,825, 7,426,660 and 1,452,160, respectively |
(2) | The per share data for dividends reflects the actual amount of dividends paid per share during the applicable period. |
(3) | Shares issued under the dividend reinvestment plan as well as the continuance issuance of shares of common stock may cause an incremental increase/decrease in net asset value per share due to the effect of issuing shares at amounts that differ from the prevailing net asset value at each issuance. |
(4) | The weighted average yield represents amortized total investments yield to maturity including the yield of cash collateral on the total return swap. |
63
Item 7. Management’s Discussion and Analysis of Financial Condition and Results of Operations.
The following discussion and analysis should be read in conjunction with our financial statements and related notes and other financial information appearing elsewhere in this annual report on Form 10-K.
Except as otherwise specified, references to “we,” “us,” “our,” or the “Company,” refers to Sierra Income Corporation. “SIC Advisors” or “Adviser” refers to SIC Advisors LLC, our investment adviser. SIC Advisors is a majority owned subsidiary of Medley LLC, which is controlled by Medley Management Inc., a publicly traded asset management firm, which in turn is controlled by Medley Group LLC, an entity wholly-owned by the senior professionals of Medley LLC. “Medley” refers, collectively, to the activities and operations of Medley Capital LLC, Medley LLC, Medley Management Inc., Medley Group LLC, SIC Advisors, associated investment funds and their respective affiliates.
Some of the statements in this annual report on Form 10-K constitute forward-looking statements, which relate to future events or our performance or financial condition. The forward-looking statements contained in this annual report on Form 10-K involve risks and uncertainties, including, but not limited to, statements as to:
• | our future operating results; |
• | our business prospects and the prospects of our portfolio companies; |
• | changes in the economy; |
• | risks associated with possible disruptions in our operations or the economy generally; |
• | the effect of investments that we expect to make; |
• | our contractual arrangements and relationships with third parties; |
• | actual and potential conflicts of interest with SIC Advisors and its affiliates; |
• | the dependence of our future success on the general economy and its effect on the industries in which we invest; |
• | the ability of our portfolio companies to achieve their objectives; |
• | the use of borrowed money to finance a portion of our investments; |
• | the adequacy of our financing sources and working capital; |
• | the timing of cash flows, if any, from the operations of our portfolio companies; |
• | the ability of SIC Advisors to locate suitable investments for us and to monitor and administer our investments; |
• | the ability of SIC Advisors and its affiliates to attract and retain highly talented professionals; |
• | our ability to maintain our qualification as a RIC and as a BDC; and |
• | the effect of changes in laws or regulations affecting our operations. |
Such forward-looking statements may include statements preceded by, followed by or that otherwise include the words “trend,” “opportunity,” “pipeline,” “believe,” “comfortable,” “expect,” “anticipate,” “current,” “intention,” “estimate,” “position,” “assume,” “potential,” “outlook,” “continue,” “remain,” “maintain,” “sustain,” “seek,” “achieve,” and similar expressions, or future or conditional verbs such as “will,” “would,” “should,” “could,” “may,” or similar expressions. The forward-looking statements contained in this quarterly report involve risks and uncertainties. Our actual results could differ materially from those implied or expressed in the forward-looking statements for any reason, including the factors set forth in “Risk Factors” in Item 1A of Part 1 of this annual report on Form 10-K.
We have based the forward-looking statements included in this report on information available to us on the date of this report, and we assume no obligation to update any such forward-looking statements. Actual results could differ materially from those anticipated in our forward-looking statements, and future results could differ materially from historical performance. Although we undertake no obligation to revise or update any forward-looking statements, whether as a result of new information, future events or otherwise, you are advised to consult any additional disclosures that we may make directly to you or through reports that we have filed or in the future may file with the SEC, including quarterly reports on Form 10-Q, annual reports on Form 10-K, and current reports on Form 8-K.
Overview
We are an externally managed non-diversified closed-end management investment company that has elected to be treated as a BDC under the 1940 Act. We are externally managed by SIC Advisors LLC, or SIC Advisors, which is a registered investment adviser under the Advisers Act. SIC Advisors is responsible for sourcing potential investments, conducting due diligence on
64
prospective investments, analyzing investment opportunities, structuring investments and monitoring our portfolio on an ongoing basis. In addition, we have qualified and intend to continue to qualify to be treated, for U.S. federal income tax purposes, as a RIC under subchapter M of the Code.
On April 17, 2012, we successfully reached the minimum escrow requirement and officially commenced operations by receiving gross proceeds of $10 million in exchange for 1,108,033.24 shares of our common stock sold to SIC Advisors.
Under our Investment Advisory Agreement, we pay SIC Advisors a base management fee as well as an incentive fee based on our investment performance. Also, under the Administration Agreement, we reimburse Medley for the allocable portion of overhead and other expenses incurred by Medley Capital LLC in performing its obligations under the Administration Agreement, including our allocable portion of the costs of compensation and related expenses of our chief compliance officer, chief financial officer and their respective staffs.
We intend to meet our investment objective by primarily lending to, and investing in, the debt of privately owned U.S. middle market companies, which we define as companies with annual revenue between $50 million and $1 billion. We intend to focus primarily on making investments in first lien senior secured debt, second lien secured debt, and to a lesser extent, subordinated debt, of middle market companies in a broad range of industries. We expect that the majority of our debt investments will bear interest at floating interest rates, but our portfolio may also include fixed-rate investments. We will originate transactions sourced through SIC Advisors’ existing network, and, to a lesser extent, expect to acquire debt securities through the secondary market. We may make equity investments in companies that we believe will generate appropriate risk adjusted returns, although we do not expect such investments to be a substantial portion of our portfolio.
The level of our investment activity depends on many factors, including the amount of debt and equity capital available to prospective portfolio companies, the level of merger, acquisition and refinancing activity for such companies, the availability of credit to finance transactions, the general economic environment and the competitive environment for the types of investments we make. Based on prevailing market conditions, we anticipate that we will invest the proceeds from each subscription closing generally within 30-90 days. The precise timing will depend on the availability of investment opportunities that are consistent with our investment objectives and strategies. Any distributions we make during such period may be substantially lower than the distributions that we expect to pay when our portfolio is fully invested.
As a BDC, we are required to comply with certain regulatory requirements. For instance, we generally have to invest at least 70% of our total assets in “qualifying assets,” including securities of private or thinly traded public U.S. companies, cash, cash equivalents, U.S. government securities and high-quality debt investments that mature in one year or less. In addition, we are only allowed to borrow money such that our asset coverage, as defined in the 1940 Act, equals at least 200% after such borrowing, with certain limited exceptions. To obtain and maintain our RIC status, we must meet specified source-of-income and asset diversification requirements. To be eligible for tax treatment under Subchapter M for U.S. federal income tax purposes, we must distribute at least 90% of our net ordinary income and realized net short-term capital gains in excess of realized net long-term capital losses, if any, for the taxable year.
Revenues
We generate revenue in the form of interest on the debt securities that we hold and distributions and capital gains on other interests that we acquire in our portfolio companies. We expect that the senior debt we invest in will generally have stated terms of three to ten years and that the subordinated debt we invest in will generally have stated terms of five to ten years. Our senior and subordinated debt investments bear interest at a fixed or floating rate. Interest on debt securities is generally payable monthly, quarterly or semiannually. In addition, some of our investments provide for deferred interest payments or PIK interest. The principal amount of the debt securities and any accrued but unpaid interest generally will become due at the maturity date. In addition, we may generate revenue in the form of commitment and other fees in connection with transactions. Original issue discounts and market discounts or premiums will be capitalized, and we will accrete or amortize such amounts as interest income. We will record prepayment premiums on loans and debt securities as fee income. Dividend income, if any, will be recognized on an accrual basis to the extent that we expect to collect such amounts.
Expenses
Our primary annual operating expenses consist of the payment of advisory fees and the reimbursement of expenses under our Investment Advisory Agreement with SIC Advisors and our Administration Agreement with Medley Capital LLC. We bear other expenses, which include, among other things:
• | corporate, organizational and offering expenses relating to offerings of our common stock, subject to limitations included in our Investment Advisory Agreement; |
65
• | the cost of calculating our net asset value, including the related fees and cost of any third-party valuation services; |
• | the cost of effecting sales and repurchases of shares of our common stock and other securities; |
• | fees payable to third parties relating to, or associated with, monitoring our financial and legal affairs, making investments, and valuing investments, including fees and expenses associated with performing due diligence reviews of prospective investments; |
• | interest payable on debt, if any, incurred to finance our investments; |
• | transfer agent and custodial fees; |
• | fees and expenses associated with marketing efforts subject to limitations included in the Investment Advisory Agreement; |
• | federal and state registration fees and any stock exchange listing fees; |
• | federal, state and local taxes; |
• | independent directors’ fees and expenses, including travel expenses; |
• | costs of director and stockholder meetings, proxy statements, stockholders’ reports and notices; |
• | costs of fidelity bonds, directors and officers/errors and omissions liability insurance and other types of insurance; |
• | direct costs, including those relating to printing of stockholder reports and advertising or sales materials, mailing, long distance telephone and staff subject to limitations included in the Investment Advisory Agreement; |
• | fees and expenses associated with independent audits and outside legal costs, including compliance with the Sarbanes-Oxley Act of 2002, the 1940 Act and applicable federal and state securities laws; |
• | brokerage commissions for our investments; |
• | all other expenses incurred by us or SIC Advisors in connection with administering our investment portfolio, including expenses incurred by SIC Advisors in performing certain of its obligations under the Investment Advisory Agreement; and |
• | the reimbursement of the compensation of our chief financial officer and chief compliance officer, whose compensation is paid by Medley, to the extent that each such reimbursement amount is annually approved by our independent director committee and subject to the limitations included in our Administration Agreement. |
Administrative Services
We reimburse Medley Capital LLC for the administrative expenses necessary for its performance of services to us. However, such reimbursement is made at an amount equal to the lower of Medley Capital LLC’s actual costs or the amount that we would be required to pay for comparable administrative services in the same geographic location. Also, such costs will be reasonably allocated to us on the basis of assets, revenues, time records or other reasonable methods. We will not reimburse Medley Capital LLC for any services for which it receives a separate fee or for rent, depreciation, utilities, capital equipment or other administrative items allocated to a controlling person of Medley Capital LLC.
Portfolio and Investment Activity
As of December 31, 2016, our investment portfolio consisted of investments in 99 portfolio companies with a fair value of $983.1 million, and was comprised of 50.2% senior secured first lien term loans, 26.4% senior secured second lien term loans, 7.3% senior secured first lien notes, 6.2% Sierra Senior Loan Strategy JV I LLC, 5.6% subordinated notes, and 4.3% warrants and equity.
As of December 31, 2015, our investment portfolio consisted of investments in 89 portfolio companies with a fair value of $907.4 million, and was comprised of 56.1% senior secured first lien term loans, 31.4% senior secured second lien term loans, 7.5% senior secured first lien notes, 3.6% Sierra Senior Loan Strategy JV I LLC and 1.4% warrants and equity.
As of December 31, 2016, our income-bearing investment portfolio, which represented 97.8% of our total portfolio, had a weighted average yield based upon the cost of our portfolio investments of approximately 9.3%, and 11.0% of our income-bearing portfolio bore interest based on fixed rates, and 89.0% of our income-bearing portfolio bore interest on floating rates, such as LIBOR.
As of December 31, 2015, our income-bearing investment portfolio, which represented 95.1% of our total portfolio, had a weighted average yield based upon the cost of our portfolio investments of approximately 9.4%, and 12.9% of our income-bearing
66
portfolio bore interest based on fixed rates, and 87.1% of our income-bearing portfolio bore interest on floating rates, such as LIBOR.
For the year ended December 31, 2016, we invested $268.7 of principal in directly originated transactions across 45 portfolio companies and $70.6 million of principal in syndicated transactions across 14 portfolio companies. As of December 31, 2016, the investment portfolio was comprised of $885.4 million of principal in directly originated transactions across 71 portfolio companies and $149.1 million of principal in syndicated transactions across 28 portfolio companies.
The following table shows the amortized cost and the fair value of our investment portfolio, not including cash and cash equivalents, as of December 31, 2016:
Amortized Cost | Percentage | Fair Value | Percentage | ||||||||||
Senior secured first lien term loans | $ | 515,753,491 | 50.2 | % | $ | 493,340,277 | 50.2 | % | |||||
Senior secured first lien notes | 72,767,547 | 7.1 | 71,970,598 | 7.3 | |||||||||
Senior secured second lien term loans | 275,915,932 | 26.9 | 260,008,735 | 26.4 | |||||||||
Subordinated notes | 53,041,209 | 5.2 | 55,185,590 | 5.6 | |||||||||
Sierra Senior Loan Strategy JV I LLC | 60,785,000 | 5.9 | 60,496,647 | 6.2 | |||||||||
Warrants/equity | 48,219,259 | 4.7 | 42,142,475 | 4.3 | |||||||||
Total | $ | 1,026,482,438 | 100.0 | % | $ | 983,144,322 | 100.0 | % | |||||
For the year ended December 31, 2015, we invested $493.9 million of principal in directly originated transactions across 34 portfolio companies and $31.0 million of principal in syndicated transactions across 5 portfolio companies. As of December 31, 2015, the investment portfolio was comprised of $830.4 million of principal in directly originated transactions across 66 portfolio companies and $124.6 million of principal in syndicated transactions across 23 portfolio companies.
The following table shows the amortized cost and the fair value of our investment portfolio, not including cash and cash equivalents, as of December 31, 2015:
Amortized Cost | Percentage | Fair Value | Percentage | ||||||||||
Senior secured first lien term loans | $ | 538,120,165 | 56.1 | % | $ | 514,638,093 | 56.7 | % | |||||
Senior secured second lien term loans | 300,961,738 | 31.4 | 278,645,462 | 30.7 | |||||||||
Senior secured first lien notes | 72,512,631 | 7.5 | 66,472,862 | 7.3 | |||||||||
Senior secured second lien notes | 34,272,500 | 3.6 | 34,362,191 | 3.8 | |||||||||
Warrants/Equity | 13,545,553 | 1.4 | 13,243,836 | 1.5 | |||||||||
Total | $ | 959,412,587 | 100.0 | % | $ | 907,362,444 | 100.0 | % | |||||
The following table shows weighted average current yield to maturity, including the yield of cash collateral on total return swap, based on fair value at December 31, 2016 and 2015:
2016 | 2015 | ||||||||||
Percentage of Total Investments | Weighted Average Current Yield for Total Investments | Percentage of Total Investments | Weighted Average Current Yield for Total Investments | ||||||||
Senior secured first lien term loans | 48.1 | % | 9.5 | % | 55.0 | % | 11.1 | % | |||
Senior secured first lien notes | 7.0 | 8.8 | 32.4 | 13.3 | |||||||
Senior secured second lien term loans | 25.3 | 10.7 | 7.3 | 11.9 | |||||||
Subordinated notes | 5.4 | 17.0 | — | — | |||||||
Sierra Senior Loan Strategy JV I LLC | 5.9 | 10.3 | 3.8 | 5.4 | |||||||
Warrants/Equity | 8.3 | 12.5 | 1.5 | 13.6 | |||||||
Total | 100.0 | % | 10.4 | % | 100.0 | % | 11.5 | % | |||
67
The following table shows the portfolio composition by industry grouping, including the TRS underlying loans, based on fair value at December 31, 2016:
Investments at Fair Value(1) | Percentage of Total Portfolio(1) | Value of TRS Underlying Loans | Percentage of TRS Underlying Loans | Total Investments at Fair Value including the value of TRS Underlying Loans | Percentage of Total Portfolio Including the value of TRS Underlying Loans | |||||||||||||||
Services: Business | $ | 149,451,149 | 15.2 | % | $ | 23,571,092 | 11.0 | % | $ | 173,022,241 | 14.5 | % | ||||||||
Multi-Sector Holdings | 130,182,237 | 13.3 | — | — | 130,182,237 | 10.9 | ||||||||||||||
Banking, Finance, Insurance & Real Estate | 72,938,844 | 7.4 | 20,713,321.0 | 9.7 | 93,652,165 | 7.8 | ||||||||||||||
Hotel, Gaming & Leisure | 69,640,838 | 7.1 | 19,867,696 | 9.3 | 89,508,534 | 7.5 | ||||||||||||||
Healthcare & Pharmaceuticals | 69,382,893 | 7.1 | 13,393,023 | 6.3 | 82,775,916 | 6.9 | ||||||||||||||
Aerospace & Defense | 70,126,640 | 7.1 | 4,656,652 | 2.2 | 74,783,292 | 6.2 | ||||||||||||||
Retail | 61,292,231 | 6.2 | 11,005,219 | 5.2 | 72,297,450 | 6.0 | ||||||||||||||
Construction & Building | 58,267,425 | 5.9 | 2,999,433 | 1.4 | 61,266,858 | 5.1 | ||||||||||||||
Transportation: Cargo | 28,493,057 | 2.9 | 13,276,638.0 | 6.2 | 41,769,695 | 3.5 | ||||||||||||||
High Tech Industries | 25,888,925 | 2.6 | 15,474,967 | 7.2 | 41,363,892 | 3.5 | ||||||||||||||
Energy: Oil & Gas | 33,048,939 | 3.4 | 7,413,640 | 3.5 | 40,462,579 | 3.4 | ||||||||||||||
Telecommunications | 37,580,414 | 3.8 | 2,487,500.0 | 1.2 | 40,067,914 | 3.3 | ||||||||||||||
Media: Advertising, Printing & Publishing | 19,306,587 | 2.0 | 12,000,704.0 | 5.6 | 31,307,291 | 2.6 | ||||||||||||||
Capital Equipment | 12,088,629 | 1.2 | 16,029,467 | 7.5 | 28,118,096 | 2.4 | ||||||||||||||
Wholesale | 21,660,294 | 2.2 | 4,976,467 | 2.3 | 26,636,761 | 2.2 | ||||||||||||||
Automotive | 24,222,630 | 2.5 | — | — | 24,222,630 | 2.0 | ||||||||||||||
Beverage & Food | 19,282,080 | 2.0 | 2,912,490 | 1.4 | 22,194,570 | 1.9 | ||||||||||||||
Media: Diversified & Production | 15,733,786 | 1.6 | 4,925,156.0 | 2.3 | 20,658,942 | 1.7 | ||||||||||||||
Metals & Mining | 20,518,139 | 2.1 | — | — | 20,518,139 | 1.7 | ||||||||||||||
Media: Broadcasting & Subscription | 15,830,499 | 1.6 | 4,618,688 | 2.2 | 20,449,187 | 1.7 | ||||||||||||||
Chemicals, Plastics & Rubber | 15,726,190 | 1.6 | — | — | 15,726,190 | 1.3 | ||||||||||||||
Services: Consumer | 5,201,522 | 0.5 | 8,838,651.0 | 4.1 | 14,040,173 | 1.2 | ||||||||||||||
Containers, Packaging & Glass | — | — | 10,642,499.0 | 5.0 | 10,642,499 | 0.9 | ||||||||||||||
Transportation: Consumer | 7,280,374 | 0.7 | — | — | 7,280,374 | 0.6 | ||||||||||||||
Energy: Electricity | — | — | 5,564,390.0 | 2.6 | 5,564,390 | 0.5 | ||||||||||||||
Consumer goods: Non-Durable | — | — | 5,091,975.0 | 2.4 | 5,091,975 | 0.4 | ||||||||||||||
Utilities: Electric | — | — | 3,033,750.0 | 1.4 | 3,033,750 | 0.3 | ||||||||||||||
Total | $ | 983,144,322 | 100.0 | % | $ | 213,493,418 | 100.0 | % | $ | 1,196,637,740 | 100.0 | % | ||||||||
_______________________
(1) | Does not include TRS underlying loans |
68
The following table shows the portfolio composition by industry grouping, including the TRS underlying loans, based on
fair value at December 31, 2015:
Investments at Fair Value(1) | Percentage of Total Portfolio(1) | Value of TRS Underlying Loans | Percentage of TRS Underlying Loans | Total Investments at Fair Value including the value of TRS Underlying Loans | Percentage of Total Portfolio Including the value of TRS Underlying Loans | |||||||||||||||
Services: Business | $ | 158,521,476 | 17.5 | % | $ | 15,194,373 | 8.5 | % | $ | 173,715,849 | 15.9 | % | ||||||||
Hotel, Gaming & Leisure | 75,913,663 | 8.4 | 29,906,528 | 16.6 | 105,820,191 | 9.7 | ||||||||||||||
Automobile | 88,543,148 | 9.8 | — | — | 88,543,148 | 8.2 | ||||||||||||||
High Tech Industries | 66,253,186 | 7.3 | 16,948,017 | 9.5 | 83,201,203 | 7.7 | ||||||||||||||
Banking, Finance, Insurance & Real Estate | 67,384,528 | 7.4 | 8,315,423 | 4.7 | 75,699,951 | 7.0 | ||||||||||||||
Construction & Building | 57,914,053 | 6.4 | 3,205,125 | 1.8 | 61,119,178 | 5.6 | ||||||||||||||
Retail | 57,645,912 | 6.3 | 3,376,088 | 1.9 | 61,022,000 | 5.6 | ||||||||||||||
Aerospace & Defense | 51,868,704 | 5.7 | 4,597,884 | 2.6 | 56,466,588 | 5.2 | ||||||||||||||
Healthcare & Pharmaceuticals | 46,118,747 | 5.1 | — | — | 46,118,747 | 4.2 | ||||||||||||||
Media: Advertising, Printing & Publishing | 24,572,808 | 2.7 | 20,326,577 | 11.4 | 44,899,385 | 4.1 | ||||||||||||||
Telecommunications | 30,687,067 | 3.4 | 8,080,376 | 4.5 | 38,767,443 | 3.6 | ||||||||||||||
Multi-Sector Holdings | 34,362,191 | 3.8 | — | — | 34,362,191 | 3.2 | ||||||||||||||
Wholesale | 33,495,926 | 3.7 | — | — | 33,495,926 | 3.1 | ||||||||||||||
Capital Equipment | 14,479,785 | 1.6 | 18,022,877 | 10.1 | 32,502,662 | 3.0 | ||||||||||||||
Metals & Mining | 19,383,182 | 2.1 | 8,700,000 | 4.9 | 28,083,182 | 2.6 | ||||||||||||||
Energy: Oil & Gas | 25,360,825 | 2.8 | 2,451,826 | 1.3 | 27,812,651 | 2.6 | ||||||||||||||
Transportation: Cargo | 11,993,622 | 1.3 | 12,102,615 | 6.8 | 24,096,237 | 2.2 | ||||||||||||||
Media: Broadcasting & Subscription | 16,358,521 | 1.8 | — | — | 16,358,521 | 1.5 | ||||||||||||||
Services: Consumer | 6,348,660 | 0.7 | 8,783,745 | 4.9 | 15,132,405 | 1.4 | ||||||||||||||
Containers, Packaging & Glass | — | — | 14,627,000 | 8.2 | 14,627,000 | 1.3 | ||||||||||||||
Beverage & Food | 8,893,800 | 1.0 | — | — | 8,893,800 | 0.8 | ||||||||||||||
Media: Diversified & Production | 7,222,625 | 0.8 | — | — | 7,222,625 | 0.7 | ||||||||||||||
Consumer goods: Non-durable | — | — | 4,094,175.0 | 2.3 | 4,094,175 | 0.4 | ||||||||||||||
Chemicals, Plastics & Rubber | 4,040,015 | 0.4 | — | — | 4,040,015 | 0.4 | ||||||||||||||
Total | $ | 907,362,444 | 100.0 | % | $ | 178,732,629 | 100.0 | % | $ | 1,086,095,073 | 100.0 | % | ||||||||
_______________________
(1)Does not include TRS underlying loans
SIC Advisors regularly assesses the risk profile of our portfolio investments and rates each of them based on the categories set forth below, which we refer to as SIC Advisors’ investment credit rating. Credit Ratings are assigned to each of the investments in our portfolio that are directly held by the Company, but exclude any off-balance sheet interests of the Company, such as the loans underlying the TRS.:
Investment Performance Rating | Definition |
1 | Investments that are performing above expectations. |
2 | Investments that are performing within expectations, with risks that are neutral or favorable compared to risks at the time of origination or purchase. All new loans are rated ‘2’. |
3 | Investments that are performing below expectations and that require closer monitoring, but where no loss of interest, dividend or principal is expected. Companies rated ‘3’ may be out of compliance with financial covenants, however, loan payments are generally not past due. |
4 | Investments that are performing below expectations and for which risk has increased materially since origination or purchase. Some loss of interest or dividend is expected, but no loss of principal. In addition to the borrower being generally out of compliance with debt covenants, loan payments may be past due (but generally not more than 180 days past due). |
5 | Investments that are performing substantially below expectations and whose risks have increased substantially since origination or purchase. Most or all of the debt covenants are out of compliance and payments are substantially delinquent. Some loss of principal is expected. |
69
The following table shows the distribution of our investment portfolio, not including cash and cash equivalents, on the 1 to 5 investment performance rating scale at fair value as of December 31, 2016 and 2015:
2016 | 2015 | ||||||||||||
Investment Performance Rating | Investments at Fair Value | Percentage | Investments at Fair Value | Percentage | |||||||||
1 | $ | 57,356,293 | 5.8 | % | $ | 20,205,473 | 2.2 | % | |||||
2 | 798,629,992 | 81.3 | 839,707,875 | 92.6 | |||||||||
3 | 77,762,796 | 7.9 | 43,643,216 | 4.8 | |||||||||
4 | 35,294,284 | 3.6 | 144,856 | 0.0 | |||||||||
5 | 14,100,957 | 1.4 | 3,661,024 | 0.4 | |||||||||
Total | $ | 983,144,322 | 100.0 | % | $ | 907,362,444 | 100.0 | % | |||||
Results of Operations
The following table shows operating results for the years ended December 31, 2016, 2015 and 2014:
2016 | 2015 | 2014 | |||||||||
Total investment income | $ | 99,780,496 | $ | 85,639,700 | $ | 39,391,455 | |||||
Total expenses, net | 39,816,024 | 39,139,197 | 19,825,040 | ||||||||
Net investment income | 59,964,472 | 46,500,503 | 19,566,415 | ||||||||
Net realized gain/(loss) from investments and total return swap | (13,120,398 | ) | 11,309,852 | 7,011,513 | |||||||
Net unrealized appreciation/(depreciation) on investments and total return swap | 22,430,516 | (67,710,941 | ) | (12,525,678 | ) | ||||||
Change in Provision for deferred taxes on unrealized gain on investments | 54,205 | (212,227 | ) | — | |||||||
Net increase/(decrease) in net assets resulting from operations | $ | 69,328,795 | $ | (10,112,813 | ) | $ | 14,052,250 | ||||
Investment Income
Total investment income increased $14,140,796, or 16.5%, to $99,780,496 for the year ended December 31, 2016 compared to $85,639,700 for the year ended December 31, 2015. Total investment income consisted primarily of portfolio interest, which increased $16,032,803, or 21.4%, to $91,019,173 for the year ended December 31, 2016 compared to $74,986,370 for the year ended December 31, 2015. This increase was primarily due to a $185,857,102, or 22.3%, increase in our average investment portfolio. Fee income decreased $1,947,361, or 18.3%, to $8,703,896 for the year ended December 31, 2016 compared to $10,651,257 for the year ended December 31, 2015, primarily due to a decrease in fees associated with loan originations and loan prepayments.
Total investment income increased $46,248,245, or 117.4%, to $85,639,700 for the year ended December 31, 2015 compared to $39,391,455 for the year ended December 31, 2014. Total investment income consisted primarily of portfolio interest, which increased $43,539,000, or 138.5%, to $74,986,370 for the year ended December 31, 2015 compared to $31,447,370 for the year ended December 31, 2014. This increase was primarily due to a $489,638,483 or 143.1% increase in our average investment portfolio. Fee income increased $2,707,397, or 34.1%, to $10,651,257 for the year ended December 31, 2015 compared to $7,943,860 for the year ended December 31, 2014, primarily due to increased fees associated with loan originations and loan prepayments.
70
Operating Expenses
The following table shows operating expenses for the years ended December 31, 2016, 2015 and 2014:
2016 | 2015 | 2014 | |||||||||
Base management fees | $ | 19,928,802 | $ | 17,234,293 | $ | 8,976,657 | |||||
Interest and financing expenses | 13,493,775 | 9,962,405 | 3,138,389 | ||||||||
Incentive fees | 9,281,479 | 4,434,352 | (183,617 | ) | |||||||
General and administrative expenses | 5,678,299 | 4,503,310 | 3,119,964 | ||||||||
Administrator expenses | 2,847,745 | 2,261,789 | 1,300,971 | ||||||||
Offering costs | 2,572,234 | 4,208,013 | 2,355,985 | ||||||||
Professional fees | 2,106,819 | 2,374,675 | 1,698,537 | ||||||||
Organizational and offering costs reimbursed to Affiliate | — | 443,687 | 4,640,250 | ||||||||
Total expenses | $ | 55,909,153 | $ | 45,422,524 | $ | 25,047,136 | |||||
Total expenses increased $10,486,629, or 23.1%, to $55,909,153 for the year ended December 31, 2016 as compared to the year ended December 31, 2015. Total expenses increased by $20,375,388, or 81.3%, to $45,422,524 for the year ended December 31, 2015 as compared to the year ended December 31, 2014. The primary contributors to the increase in expenses are base management fees and interest and financing expenses.
Base management fees increased $2,694,509, or 15.6%, to $19,928,802 for the year ended December 31, 2016 as compared to the year ended December 31, 2015 primarily due to an increase in our average gross assets of $153,971,970, or 15.6%. Base management fees increased $8,257,636, or 92.0%, to $17,234,293 for the year ended December 31, 2015 as compared to the year ended December 31, 2014 primarily due to an increase in our average gross assets of $471,864,916, or 92.0%.
Interest and financing expenses increased $3,531,370, or 35.4%, to $13,493,775 for the year ended December 31, 2016 as compared to the year ended December 31, 2015 primarily due to an increase in our average borrowings outstanding of $69,409,569, or 24.7%. Interest and financing expenses increased $6,824,016, or 217.4%, to $9,962,405 for the year ended December 31, 2015 as compared to the year ended December 31, 2014 primarily due to an increase in our average borrowings outstanding of $187,252,894, or 200.8%.
Expense Support and Reimbursement Agreement
From June 29, 2012 through December 31, 2016, we were party to an Expense Support and Reimbursement Agreement with SIC Advisors (the “Expense Support Agreement”). During the term of the Expense Support Agreement, SIC Advisors reimbursed us for operating expenses in an amount equal to the difference between our distributions paid to stockholders in each month, less the sum of our net investment income, net realized capital gains and dividends paid to us from our portfolio companies, not included in net income and net realized capital gains, during such period (“Expense Support Reimbursement”). To the extent that no dividends or other distributions were paid to our stockholders in any given month, then the Expense Support Reimbursement for such month was equal to such amount necessary in order for available operating funds for the month to equal zero. From April 1, 2016 until the expiration of the Expense Support Agreement on December 31, 2016, SIC Advisors made expense support payments on a discretionary basis by making an election on the last day of each month to fund an expense support payment in an amount equal to the difference between our distributions paid to stockholders during such month less the sum of our net investment income, net realized capital gains and dividends paid to us from our portfolio companies, not included in net income and net realized capital gains during such period.
The purpose of the Expense Support Agreement was to cover distributions to stockholders so as to ensure that the distributions did not constitute a return of capital for GAAP purposes and to reduce operating expenses until we had raised sufficient capital to be able to absorb such expenses. The Expense Support Agreement expired on December 31, 2016.
Pursuant to the Expense Support Agreement, we will reimburse SIC Advisors for expense support payments it previously made following any calendar quarter for which we received net investment income, net realized capital gains and dividends from our portfolio companies (not included in net income and net realized capital gains) in excess of the distributions paid to our stockholders during such calendar quarter (the “Excess Operating Funds”). Any such reimbursement will be made within three years of the date that the expense support payment obligation was incurred by SIC Advisors, subject to the conditions described below. The amount of the reimbursement during any calendar quarter will equal the lesser of (i) the Excess Operating Funds received during the quarter and (ii) the aggregate amount of all expense payments made by SIC Advisors that have not yet been reimbursed. In addition, we will only make reimbursement payments to the extent our current annualized “operating expense ratio” is equal to or less than our operating expense ratio for the quarter during which the corresponding expense obligation was incurred and to the extent the annualized rate of its regular cash dividends to our stockholders for the month is equal to or greater than the
71
annualized rate of our regular cash distributions to stockholders for the month during which the corresponding expense payment was incurred
As of December 31, 2016, we recorded $7,892,273 in our consolidated statement of assets and liabilities as due from affiliate relating to the Expense Support Agreement. For the year ended December 31, 2016, we recorded a net expense support reimbursement of $16,093,129 on the consolidated statement of operations. Expense reimbursements to SIC Advisors will be accrued as they become probable and estimable. For the year ended December 31, 2016, gross expenses before expense reimbursement from SIC Advisors pursuant to the Expense Support Agreement were $55,909,153 and net expenses after taking into account the expense reimbursement from SIC Advisors were $39,816,024.
As of December 31, 2015, we recorded $7,314,867 in our consolidated statement of assets and liabilities as due from affiliate relating to the Expense Support Agreement. For the year ended December 31, 2015, we recorded a net expense support reimbursement of $6,283,327 on the consolidated statement of operations. Expense reimbursements to SIC Advisors will be accrued as they become probable and estimable. For the year ended December 31, 2015, gross expenses before expense reimbursement from SIC Advisors pursuant to the Expense Support were $45,422,524 and net expenses after taking into account the expense reimbursement from SIC Advisors, were $39,139,197.
Net Realized Gains/Losses from Investments
We measure realized gains or losses by the difference between the net proceeds from the disposition and the amortized cost basis of an investment, without regard to unrealized gains or losses previously recognized.
During the years ended December 31, 2016, 2015 and 2014 we recognized net realized losses of $13,120,398, net realized gains of $11,309,852 and net realized gains of $7,011,513, respectively, on total investments.
Net Unrealized Appreciation/Depreciation on Investments
Net change in unrealized appreciation/depreciation on investments reflects the net change in the fair value of our total investments. For the years ended December 31, 2016, 2015 and 2014, we had unrealized appreciation of $22,484,721, unrealized depreciation of $67,923,168 and unrealized depreciation of $12,525,678, respectively, on total investments.
Changes in Net Assets from Operations
For the year ended December 31, 2016 , we recorded a net increase in net assets resulting from operations of $69,328,795 versus a net decrease in net assets resulting from operations of $10,112,813 for the year ended December 31, 2015. Based on 90,424,090 and 70,648,292 weighted average common shares outstanding for the years ended December 31, 2016 and 2015, respectively, our per share net increase in net assets resulting from operations was $0.77 for the year ended December 31, 2016 versus a per share net decrease in net assets from operations of $0.14 for the year ended December 31, 2015.
For the year ended December 31, 2015, we recorded a net decrease in net assets resulting from operations of $10,112,813 versus a net increase in net assets resulting from operations of $14,052,250 for the year ended December 31, 2014. Based on 70,648,292 and 35,425,825 weighted average common shares outstanding for the years ended December 31, 2015 and 2014, respectively, our per share net decrease in net assets resulting from operations was $0.14 for the year ended December 31, 2015 versus a per share net increase in net assets from operations of $0.40 for the year ended December 31, 2014.
Financial Condition, Liquidity and Capital Resources
As a BDC, we distribute substantially all of our net income to our stockholders and have an ongoing need to raise additional capital for investment purposes. To fund growth, we have a number of alternatives available to increase capital; including raising equity, increasing debt, and funding from operational cash flow.
Our liquidity and capital resources have been generated primarily from the net proceeds of our public offering of common stock, use of our credit facilities and our TRS.
As of December 31, 2016 and 2015, we had $99.4 million and $93.7 million, respectively, in cash and cash equivalents. In the future, we may generate cash from future offerings of securities, future borrowings and cash flows from operations, including interest earned from the temporary investment of cash in U.S. government securities and other high-quality debt investments that mature in one year or less. Our primary use of funds is investments in our targeted asset classes, cash distributions to our stockholders, and other general corporate purposes.
In order to satisfy the Code requirements applicable to a RIC, we intend to distribute to our stockholders substantially all of our taxable income, but we may also elect to periodically spillover certain excess undistributed taxable income from one tax year
72
into the next tax year. In addition, as a BDC, we generally are required to meet a coverage ratio of total assets to total senior securities, which include borrowings and any preferred stock we may issue in the future, of at least 200%. This requirement limits the amount that we may borrow.
The following table shows our net borrowings for the years ended December 31, 2016 and 2015:
2016 | 2015 | ||||||||||||||||||||||
Total Commitment | Balance Outstanding | Unused Commitment | Total Commitment | Balance Outstanding | Unused Commitment | ||||||||||||||||||
ING Credit Facility | $ | 175,000,000 | $ | 150,000,000 | $ | 25,000,000 | $ | 170,000,000 | $ | 145,000,000 | $ | 25,000,000 | |||||||||||
Alpine Credit Facility | 300,000,000 | 240,000,000 | 60,000,000 | 300,000,000 | 240,000,000 | 60,000,000 | |||||||||||||||||
Total before deferred financing costs | 475,000,000 | 390,000,000 | 85,000,000 | 470,000,000 | 385,000,000 | 85,000,000 | |||||||||||||||||
Unamortized deferred financing costs | — | (4,340,533 | ) | — | — | (3,239,404 | ) | — | |||||||||||||||
Total borrowings outstanding, net | $ | 475,000,000 | $ | 385,659,467 | $ | 85,000,000 | $ | 470,000,000 | $ | 381,760,596 | $ | 85,000,000 | |||||||||||
On August 12, 2016, we amended our ING Credit Facility pursuant to a Senior Secured Revolving Credit Agreement (the “Revolving Credit Agreement”) with certain lenders party thereto from time to time and ING Capital LLC, as administrative agent. The ING Credit Facility matures on August 12, 2020 and is secured by substantially all of our assets, subject to certain exclusions as further set forth in an Amended and Restated Guarantee, Pledge and Security Agreement (the “Security Agreement”) entered into in connection with the Revolving Credit Agreement, among us, the Subsidiary Guarantors party thereto, ING Capital LLC, as Administrative Agent, each Financial Agent and Designated Indebtedness Holder party thereto and ING Capital LLC, as Collateral Agent. The ING Credit Facility also includes usual and customary representations, covenants and events of default for senior secured revolving credit facilities of this nature. On February 13, 2015, commitments to the ING credit facility were expanded from $150 million to $170 million. On August 12, 2016, commitments to the ING credit facility were expanded from $170 million to $175 million.
The ING Credit Facility allows for us, at our option, to borrow money at a rate of either (i) an alternate base rate plus 1.50% per annum or (ii) LIBOR plus 2.50% per annum. The interest rate margins are subject to certain step-downs upon the satisfaction of certain conditions described in the Revolving Credit Agreement. The alternate base rate will be the greatest of (i) the U.S. Prime Rate set forth in the Wall Street Journal, (ii) the federal funds effective rate plus 1/2 of 1%, and (iii) three month LIBOR plus 1%. As of December 31, 2016 and 2015, the commitment under the ING Credit Facility was $175 million and $170 million, respectively, and the ING Credit Facility includes an accordion feature that allows for potential future expansion of the ING Credit Facility up to a total of $500 million. Availability of loans under the ING Credit Facility is linked to the valuation of the collateral pursuant to a borrowing base mechanism.
We are also required to pay a commitment fee to the lenders based on the daily unused portion of the aggregate commitments under the ING Credit Facility. The commitment fee is (i) 1.50% if the used portion of the aggregate commitments is less than or equal to 40%, (ii) 0.75% if the used portion of the aggregate commitments is greater than 40% and less than or equal to 65% or (iii) 0.50% if the used portion of the aggregate commitments is greater than 65%. The ING Credit Facility provides that we may use the proceeds of the facility for general corporate purposes, including making investments in accordance with our investment objective and strategy. As of December 31, 2016, our borrowings under the ING Facility totaled $150,000,000 and were recorded as part of revolving credit facility payable on our consolidated statements of assets and liabilities.
On July 23, 2014, our wholly-owned, special purpose financing subsidiary, Alpine, entered into the Alpine Credit Facility pursuant to a Loan Agreement with JPMorgan Chase Bank, National Association (“JPMorgan”), as administrative agent and lender, the Financing Providers from time to time party thereto, SIC Advisors LLC, as the portfolio manager, and the Collateral Administrator, Collateral Agent and Securities Intermediary party thereto (the “Loan Agreement”). Alpine’s obligations to JPMorgan under the Alpine Credit Facility are secured by a first priority security interest in substantially all of the assets of Alpine, including its portfolio of loans. The obligations of Alpine under the Alpine Credit Facility are non-recourse to the Company.
Borrowings under the Alpine Credit Facility are subject to compliance with a net asset value coverage ratio with respect to the current value of Alpine’s portfolio and various eligibility criteria must be satisfied with respect to the initial acquisition of each loan in Alpine’s portfolio. Any amounts borrowed under the Alpine Credit Facility will mature, and all accrued and unpaid interest thereunder will be due and payable, on July 23, 2019. As of December 31, 2016, Alpine’s borrowings under the Alpine Credit Facility totaled $240 million and were recorded as part of revolving credit facility payable on our consolidated statements of assets and liabilities.
See Note 6 to our consolidated financial statements as of December 31, 2016 for more information on the Credit Facilities.
73
Contractual Obligations
The following table shows our payment obligations for repayment of debt, which total our contractual obligations at December 31, 2016:
Payment Due By Period | |||||||||||||||||||
Total | Less than 1 Year | 1 - 3 Years | 3 - 5 Years | More than 5 Years | |||||||||||||||
ING Credit Facility | $ | 150,000,000 | $ | — | $ | — | $ | 150,000,000 | $ | — | |||||||||
Alpine Credit Facility | 240,000,000 | — | 240,000,000 | — | — | ||||||||||||||
Total Contractual Obligations | $ | 390,000,000 | $ | — | $ | 240,000,000 | $ | 150,000,000 | $ | — | |||||||||
We have entered into certain contracts under which we have material future commitments. On April 5, 2012, we entered into the Investment Advisory Agreement with SIC Advisors in accordance with the 1940 Act. The Investment Advisory Agreement became effective as of April 17, 2012, the date that we met the minimum offering requirement. Pursuant to the 1940 Act, the initial term of the Investment Advisory Agreement was for two years from its effective date, with one-year renewals subject to approval by our board of directors, a majority of whom must be independent directors. On March 1, 2017, the board of directors approved the renewal of the Investment Advisory Agreement for an additional one-year term at an in-person meeting. SIC Advisors serves as our investment advisor in accordance with the terms of the Investment Advisory Agreement. Payments under our Investment Advisory Agreement in each reporting period consist of (i) a management fee equal to a percentage of the value of our gross assets and (ii) an incentive fee based on our performance.
On April 5, 2012, we entered into the Administration Agreement with Medley Capital LLC with an initial term of two years, pursuant to which Medley Capital LLC furnishes us with administrative services necessary to conduct our day-to-day operations. On March 1, 2017, the board of directors approved the renewal of the Administration Agreement for an additional one-year term at an in-person meeting. Medley Capital LLC is reimbursed for administrative expenses it incurs on our behalf in performing its obligations. Such costs are reasonably allocated to us on the basis of assets, revenues, time records or other reasonable methods. We do not reimburse Medley Capital LLC for any services for which it receives a separate fee or for rent, depreciation, utilities, capital equipment or other administrative items allocated to a controlling person of Medley Capital LLC.
If any of our contractual obligations discussed above are terminated, our costs may increase under any new agreements that we enter into as replacements. We would also likely incur expenses in locating alternative parties to provide the services we expect to receive under the investment advisory agreement and administration agreement. Any new investment advisory agreement would also be subject to approval by our stockholders.
Off-Balance Sheet Arrangements
On August 27, 2013, Arbor Funding LLC (“Arbor”), a wholly-owned financing subsidiary of the Company, entered into a total return swap (“TRS”) with Citibank, N.A. (“Citibank”).
On March 21, 2016, Arbor entered into the Fourth Amended and Restated Confirmation Letter Agreement (the “Fourth Amended Confirmation Agreement”) with Citibank. The Fourth Amended Confirmation Agreement extended the term of the TRS from March 21, 2016 through March 21, 2019 and increased the interest rate payable to Citi from LIBOR plus 1.35% per annum to LIBOR plus 1.65% per annum. Other than the foregoing, the Fourth Amended Confirmation Agreement did not change any of the other terms of the TRS.
The TRS with Citibank enables Arbor to obtain the economic benefit of the loans underlying the TRS, despite the fact that such loans will not be directly held or otherwise owned by Arbor, in return for an interest-type payment to Citibank. Accordingly, the TRS is analogous to Arbor utilizing leverage to acquire loans and incurring an interest expense to a lender.
SIC Advisors acts as the investment manager of Arbor and has discretion over the composition of the basket of loans underlying the TRS. The terms of the TRS are governed by an ISDA 2002 Master Agreement, the Schedule thereto and Credit Support Annex to such Schedule, and the Confirmation exchanged thereunder, between Arbor and Citibank, which collectively establish the TRS, and are collectively referred to herein as the “TRS Agreement”.
Transactions in total return swap contracts during the year ended December 31, 2016 were $6,812,173 in realized gains and $13,718,489 in unrealized appreciation, which is recorded on the consolidated statements of operations.
74
Transactions in total return swap contracts during the year ended December 31, 2015 were $11,574,160 in realized gains and $19,714,222 in unrealized depreciation, which is recorded on the consolidated statements of operations.
Our derivative asset from Citibank, net of amounts available for offset under a master netting agreement as of December 31, 2016 was $1,289,163, which is recorded on the consolidated statements of assets and liabilities as receivable due on total return swap.
For the years ended December 31, 2016 and 2015, the average notional par amount of total return swap contracts was $214.1 million and $222.6 million, respectively.
On March 27, 2015, Sierra Income Corporation and Great American Life Insurance Company (“GALIC”) entered into a limited liability company operating agreement to co-manage Sierra Senior Loan Strategy JV I LLC (“Sierra JV”). Sierra Income Corporation and GALIC have committed to provide $100 million of equity to Sierra JV, with Sierra Income Corporation providing $87.5 million and GALIC providing $12.5 million. Sierra JV commenced operations on July 15, 2015. On August 4, 2015, Sierra JV entered into a senior secured revolving credit facility (the “JV Facility”) led by Credit Suisse, AG with initial commitments of $100 million. On December 29, 2015, the JV Facility was amended and the commitment increased to $135 million. As of December 31, 2016, there was $123.9 million outstanding under the JV Facility and the Sierra JV had total assets at fair value of $183.7 million. As of December 31, 2016, Sierra JV’s portfolio was comprised of 100.0% of senior secured first lien term loans to 40 different borrowers with one loan on non-accrual status.
We have determined that the Sierra JV is an investment company under ASC 946, however in accordance with such guidance, we will generally not consolidate its investment in a company other than a wholly owned investment company subsidiary or a controlled operating company whose business consists of providing services to us. Accordingly, we do not consolidate our interest in the Sierra JV.
Distributions
We have elected and intend to continue to qualify to be treated, for U.S. federal income tax purposes, as a RIC under subchapter M of the Code. To obtain and maintain RIC tax treatment, we must, among others things, distribute at least 90% of our net ordinary income and net short-term capital gains in excess of net long-term capital losses, if any, to our stockholders. In order to avoid certain U.S. federal excise taxes imposed on RICs, we must distribute during each calendar year an amount at least equal to the sum of: (i) 98% of our ordinary income for the calendar year, (ii) 98.2% of our capital gains in excess of capital losses for the one-year period generally ending on October 31 of the calendar year (unless an election is made by us to use our taxable year) and (iii) any ordinary income and net capital gains for preceding years that were not distributed during such years and on which we paid no U.S. federal income tax.
While we intend to distribute any income and capital gains in the manner necessary to minimize imposition of the 4% U.S. federal excise tax, sufficient amounts of our taxable income and capital gains may not be distributed to avoid entirely the imposition of the tax. In that event, we will be liable for the tax only on the amount by which we do not meet the foregoing distribution requirement.
We currently intend to distribute net capital gains (i.e., net long-term capital gains in excess of net short-term capital losses), if any, at least annually out of the assets legally available for such distributions. However, we may decide in the future to retain such capital gains for investment and elect to treat such gains as deemed distributions to you. If this happens, you will be treated for U.S. federal income tax purposes as if you had received an actual distribution of the capital gains that we retain and reinvested the net after tax proceeds in us. In this situation, you would be eligible to claim a tax credit (or, in certain circumstances, a tax refund) equal to your allocable share of the tax we paid on the capital gains deemed distributed to you. We can offer no assurance that we will continue to achieve results that will permit the payment of any cash distributions and, if we issue senior securities, we may be prohibited from making distributions if doing so causes us to fail to maintain the asset coverage ratios stipulated by the 1940 Act or if distributions are limited by the terms of any of our borrowings.
Subject to our board of directors’ discretion and applicable legal restrictions, we expect to authorize and pay monthly distributions to our stockholders. Any distributions to our stockholders will be declared out of assets legally available for distribution. We expect to continue making monthly distributions unless our results of operations, our general financial condition, general economic conditions, or other factors prohibit us from doing so. From time to time, but not less than quarterly, we will review our accounts to determine whether distributions to our stockholders are appropriate. We have not established limits on the amount of funds we may use from available sources to make distributions. From the commencement of our offering through December 31, 2016, a portion of our distributions were comprised in part of expense support payments made by SIC Advisors that may be subject to repayment by us within three years of the date of such support payment. The purpose of this arrangement was to cover distributions to stockholders so as to ensure that the distributions did not constitute a return of capital for GAAP purposes. In the future, we may have distributions which could be characterized as a return of capital. Such distributions are not based on our investment
75
performance and can only be sustained if we achieve positive investment performance in future periods and/or SIC Advisors elects to make Expense Support Payments under an Expense Support Agreement. Any future reimbursements to SIC Advisors will reduce the net investment income that may otherwise be available for distribution to stockholders. There can be no assurance that we will achieve the performance necessary to sustain our distributions or that we will be able to pay distributions at all. SIC Advisors has no obligation to enter into a renewed Expense Support Agreement. For the year ended December 31, 2016 and 2015, if net Expense Support Payments of $16,093,129 and 6,283,327 were not made by SIC Advisors, approximately 23% and 11% of the distributions would have been a return of capital for GAAP purposes, respectively.
Our distributions may exceed our earnings, which we refer to as a return of capital, especially during the period before we have invested substantially all of the proceeds of our offering. As a result, a portion of the distributions we make may represent a return of capital. Our use of the term “return of capital” merely means distributions in excess of our earnings and as such may constitute a return on your individual investments and does not mean a return on capital. Therefore stockholders are advised that they should be aware of the differences with our use of the term “return of capital” and “return on capital.”
The following table reflects the cash distributions per share that we have declared or paid to our stockholders for the current and prior fiscal years. Stockholders of record as of each respective record date were entitled to receive the distribution.
Record Date | Payment Date | Amount per share | |||
January 15 and 30, 2015 | January 30, 2015 | $ | 0.03333 | ||
February 13 and 27, 2015 | February 27, 2015 | 0.03333 | |||
March 13 and 31, 2015 | March 31, 2015 | 0.03333 | |||
April 15 and 30, 2015 | April 30, 2015 | 0.03333 | |||
May 15 and 29, 2015 | May 29, 2015 | 0.03333 | |||
June 15 and 30, 2015 | June 30, 2015 | 0.03333 | |||
July 15 and 31, 2015 | July 31, 2015 | 0.03333 | |||
August 14 and 31, 2015 | August 31, 2015 | 0.03333 | |||
September 15 and 30, 2015 | September 30, 2015 | 0.03333 | |||
October 15 and 30, 2015 | October 30, 2015 | 0.03333 | |||
November 13 and 30, 2015 | November 30, 2015 | 0.03333 | |||
December 15 and 31, 2015 | December 31, 2015 | 0.03333 | |||
January 15 and 29, 2016 | January 29, 2016 | 0.03333 | |||
February 12 and 29, 2016 | February 29, 2016 | 0.03333 | |||
March 15 and 31, 2016 | March 31, 2016 | 0.03333 | |||
April 15 and 29, 2016 | April 29, 2016 | 0.03333 | |||
May 13 and 31, 2016 | May 31, 2016 | 0.03333 | |||
June 15 and 30, 2016 | June 30, 2016 | 0.03333 | |||
July 15 and 29, 2016 | July 29, 2016 | 0.03333 | |||
August 15 and 31, 2016 | August 31, 2016 | 0.03333 | |||
September 15 and 30, 2016 | September 30, 2016 | 0.03333 | |||
October 14 and 31, 2016 | October 31, 2016 | 0.02667 | |||
November 15 and 30, 2016 | November 30, 2016 | 0.02667 | |||
December 15 and 31, 2016 | December 31, 2016 | 0.02667 | |||
We have adopted an “opt in” distribution reinvestment plan pursuant to which our common stockholders may elect to have the full amount of any cash distributions reinvested in additional shares of our common stock. As a result, if we declare a cash distribution, stockholders that have “opted in” to our distribution reinvestment plan will have their distribution automatically reinvested in additional shares of our common stock rather than receiving cash dividends. Stockholders who receive distributions in the form of shares of common stock will be subject to the same federal, state and local tax consequences as if they received cash distributions.
Each year a statement on Internal Revenue Service Form 1099-DIV (or such successor form) identifying the source of the distribution (i.e., paid from ordinary income, paid from net capital gain on the sale of securities, or a return of capital) will be mailed to our stockholders. The tax basis of shares must be reduced by the amount of any return of capital distributions, which will result in an increase in the amount of any taxable gain (or a reduction in any deductible loss) on the sale of shares.
76
Related Party Transactions
On October 19, 2011, SIC Advisors entered into a subscription agreement to purchase 110.80 shares of common stock for cash consideration of $1,000. The consideration represents $9.025 per share.
On April 17, 2012, SIC Advisors purchased 1,108,033.24 shares of our common stock for aggregate gross proceeds of $10,000,000. The consideration represents $9.025 per share.
We have entered into an Investment Advisory Agreement with SIC Advisors in which our senior management holds an equity interest and were party to the Expense Support Agreement through December 31, 2016. Members of our senior management also serve as principals of other investment managers affiliated with SIC Advisors that do, and may in the future, manage investment funds, accounts or other investment vehicles with investment objectives similar to ours.
We have entered into an Administration Agreement with Medley Capital LLC, pursuant to which Medley Capital LLC furnishes us with administrative services necessary to conduct our day-to-day operations. Medley Capital LLC is reimbursed for administrative expenses it incurs on our behalf. We do not reimburse Medley Capital LLC for any services for which it receives a separate fee or for rent, depreciation, utilities, capital equipment or other administrative items allocated to a controlling person of Medley Capital LLC. Medley Capital LLC is an affiliate of SIC Advisors.
We have entered into a dealer manager agreement with SC Distributors, LLC who receives a dealer manager fee of up to 2.75% of gross proceeds raised in the offering. An affiliated entity of SC Distributors, LLC owns an equity interest in SIC Advisors, which provides the right to receive a fixed percentage of the management fees received by SIC Advisors.
We have entered into a license agreement with SIC Advisors under which SIC Advisors has agreed to grant us a non-exclusive, royalty-free license to use the name “Sierra” for specified purposes in our business. Under this agreement, we will have a right to use the “Sierra” name, subject to certain conditions, for so long as SIC Advisors or one of its affiliates remains our investment advisor. Other than with respect to this limited license, we will have no legal right to the “Sierra” name.
Management Fee
We pay SIC Advisors a fee for its services under the Investment Advisory Agreement. The fee consists of two components: a base management fee and an incentive fee.
The base management fee is calculated at an annual rate of 1.75% of our gross assets and is payable quarterly in arrears. The incentive fee consists of:
• | An incentive fee on net investment income (“subordinated incentive fee on income”) is calculated and payable quarterly in arrears and is based upon pre-incentive fee net investment income for the immediately preceding quarter. No subordinated incentive fee on income is payable in any calendar quarter in which pre-incentive fee net investment income does not exceed a quarterly return to stockholders of 1.75% per quarter on our net assets at the end of the immediately preceding fiscal quarter, or the preferred quarterly return. All pre-incentive fee net investment income, if any, that exceeds the quarterly preferred return, but is less than or equal to 2.1875% of net assets at the end of the immediately preceding fiscal quarter in any quarter, will be payable to SIC Advisors. We refer to this portion of our subordinated incentive fee on income as the catch up. It is intended to provide an incentive fee of 20% on pre-incentive fee net investment income when pre-incentive fee net investment income exceeds 2.1875% of net assets at the end of the immediately preceding quarter in any quarter. For any quarter in which our pre-incentive fee net investment income exceeds 2.1875% of net assets at the end of the immediately preceding quarter, the subordinated incentive fee on income shall equal 20% of the amount of pre-incentive fee net investment income, because the preferred return and catch up will have been achieved. |
• | A capital gains incentive fee will be earned on realized investments and shall be payable in arrears as of the end of each calendar year during which the IAA is in effect. If the IAA is terminated, the fee will become payable as of the effective date of such termination. The capital gains incentive fee is based on our realized capital gains on a cumulative basis from inception, computed net of all realized capital losses and unrealized capital depreciation on a cumulative basis, which we refer to as “net realized capital gains.” The capital gains incentive fee equals’ 20% of net realized capital gains, less the aggregate amount of any previously paid capital gains incentive fee. |
Under the terms of the investment advisory agreement, SIC Advisors bears all organization and offering expenses on our behalf. Since June 2, 2014, the date that we raised $300 million in gross proceeds in connection with the sale of shares of our common stock, SIC Advisors has no longer been obligated to bear, pay or otherwise be responsible for any ongoing organization and offering expenses on our behalf, and we have been responsible for paying or otherwise incurring all such organization and
77
offering expenses. Pursuant to the terms of the Investment Advisory Agreement, we have agreed to reimburse SIC Advisors for any such organizational and offering expenses incurred by SIC Advisors not to exceed 1.25% of the gross subscriptions raised by us over the course of the offering period, which was initially scheduled to terminate two years from the initial offering date, unless extended. Most recently, at a meeting held on March 1, 2017, our board of directors approved another extension of our offering for an additional year, which will extend the offering through April 17, 2018, unless further extended. Notwithstanding the foregoing, in the event that organizational and offering expenses, together with sales commissions, the dealer manager fee and any discounts paid to members of the Financial Industry Regulatory Authority, exceed 15% of the gross proceeds from the sale of shares of our common stock pursuant to our registration statement or otherwise at the time of the completion of our offering, then SIC Advisors shall be required to pay or, if already paid by us, reimburse us for amounts exceeding such 15% limit.
Critical Accounting Policies
This discussion of our expected operating plans is based upon our expected consolidated financial statements, which will be prepared in accordance with accounting principles generally accepted in the United States, or GAAP. The preparation of these consolidated financial statements will require our management to make estimates and assumptions that affect the reported amounts of assets, liabilities, revenues and expenses. Changes in the economic environment, financial markets and any other parameters used in determining such estimates could cause actual results to differ. In addition to the discussion below, we will describe our critical accounting policies in the notes to our future consolidated financial statements.
Valuation of Investments
We apply fair value accounting to all of its financial instruments in accordance with the 1940 Act and ASC Topic 820 — Fair Value Measurements and Disclosures (“ASC 820”). ASC 820 defines fair value, establishes a framework used to measure fair value and requires disclosures for fair value measurements. In accordance with ASC 820, we have categorized its financial instruments carried at fair value, based on the priority of the valuation technique, into a three-level fair value hierarchy as identified below and discussed in Note 4.
• | Level 1 — Quoted prices are available in active markets for identical investments as of the reporting date. Publicly listed equities and publicly listed derivatives will be included in Level 1. In addition, securities sold, but not yet purchased and call options will be included in Level 1. We will not adjust the quoted price for these investments, even in situations where we hold a large position and a sale could reasonably affect the quoted price. |
• | Level 2 — Pricing inputs are other than quoted prices in active markets, which are either directly or indirectly observable as of the reporting date, and fair value is determined through the use of models or other valuation methodologies. In certain cases, debt and equity securities are valued on the basis of prices from an orderly transaction between market participants provided by reputable dealers or pricing services. In determining the value of a particular investment, pricing services may use certain information with respect to transactions in such investments, quotations from dealers, pricing matrices, market transactions in comparable investments, and various relationships between investments. Investments which are generally expected to be included in this category include corporate bonds and loans, convertible debt indexed to publicly listed securities, and certain over-the-counter derivatives. |
• | Level 3 — Pricing inputs are unobservable for the investment and include situations where there is little, if any, market activity for the investment. The inputs into the determination of fair value require significant judgment or estimation. Investments that are expected to be included in this category are our private portfolio companies. |
Fair value is a market-based measure considered from the perspective of the market participant who holds the financial instrument rather than an entity specific measure. Therefore, when market assumptions are not readily available, our own assumptions are set to reflect those that management believes market participants would use in pricing the financial instrument at the measurement date.
Investments for which market quotations are readily available are valued at such market quotations, which are generally obtained from an independent pricing service or multiple broker-dealers or market makers. We weight the use of third-party broker quotes, if any, in determining fair value based on our understanding of the level of actual transactions used by the broker to develop the quote and whether the quote was an indicative price or binding offer. However, debt investments with remaining maturities within 60 days that are not credit impaired are valued at cost plus accreted discount, or minus amortized premium, which approximates fair value. Investments for which market quotations are not readily available are valued at fair value as determined by our board of directors based upon input from management and third party valuation firms. Because these investments are illiquid and because there may not be any directly comparable companies whose financial instruments have observable market values,
78
these loans are valued using a fundamental valuation methodology, consistent with traditional asset pricing standards, that is objective and consistently applied across all loans and through time.
We use third-party valuation firms to assist the board of directors in the valuation of its portfolio investments. The valuation reports generated by the third-party valuation firms consider the evaluation of financing and sale transactions with third parties, expected cash flows and market based information, including comparable transactions, performance multiples, and movement in yields of debt instruments, among other factors. Based on market data obtained from the third-party valuation firms, we use a combined market yield analysis and an enterprise model of valuation. In applying the market yield analysis, the value of our loans are determined based upon inputs such as the coupon rate, current market yield, interest rate spreads of similar securities, the stated value of the loan, and the length to maturity. In applying the enterprise model, we use a waterfall analysis which takes into account the specific capital structure of the borrower and the related seniority of the instruments within the borrower’s capital structure into consideration. To estimate the enterprise value of the portfolio company, we weigh some or all of the traditional market valuation methods and factors based on the individual circumstances of the portfolio company in order to estimate the enterprise value. The methodologies for performing investments may be based on, among other things: valuations of comparable public companies, recent sales of private and public comparable companies, discounting the forecasted cash flows of the portfolio company, third party valuations of the portfolio company, considering offers from third parties to buy the company, estimating the value to potential strategic buyers and considering the value of recent investments in the equity securities of the portfolio company. For non-performing investments, we may estimate the liquidation or collateral value of the portfolio company’s assets and liabilities using an expected recovery model. We may estimate the fair value of warrants based on a model such as the Black-Scholes model or simulation models or a combination thereof.
We undertake a multi-step valuation process each quarter when valuing investments for which market quotations are not readily available, as described below:
• | our quarterly valuation process begins with each portfolio investment being initially valued by the valuation professionals; |
• | conclusions are then documented and discussed with senior management; and |
• | an independent valuation firm engaged by our board of directors prepares an independent valuation report for approximately one third of the portfolio investments each quarter on a rotating quarterly basis on non fiscal year-end quarters, such that each of these investments will be valued by an independent valuation firm at least twice per annum when combined with the fiscal year-end review of all the investments by independent valuation firms, exclusive of the TRS underlying portfolio. |
In addition, all of our investments are subject to the following valuation process:
• | management reviews preliminary valuations and their own independent assessment; |
• | the audit committee of our board of directors reviews the preliminary valuations of senior management and independent valuation firms; and |
• | our board of directors discusses valuations and determines the fair value of each investment in our portfolio in good faith based on the input of SIC Advisors, the respective independent valuation firms and the audit committee. |
Due to the inherent uncertainty of determining the fair value of investments that do not have a readily available market value, the fair value of our investments may differ significantly from the values that would have been used had a readily available market value existed for such investments, and the differences could be material.
The valuation procedures described are generally applied to the loans underlying the TRS, except that such assets are not reviewed by independent third party valuation firms. We will value the TRS in accordance with the TRS Agreement. Pursuant to the TRS Agreement, the value of the TRS will be based on the increase or decrease in the value of the assets underlying the TRS, together with accrued interest income, interest expense and certain other expenses incurred under the TRS. The assets underlying the TRS will be valued by Citibank. Citibank will base its valuation on the indicative bid prices provided by an independent third-party pricing service. Bid prices reflect the highest price that market participants may be willing to pay. These valuations will be sent to us for review and testing. Our board of directors will review and approve the value of the TRS, as well as the value of the assets underlying the TRS, on a quarterly basis as part of their quarterly determination of net asset value. To the extent our board of directors has any questions or concerns regarding the valuation of the assets underlying the TRS, such valuation will be discussed or challenged pursuant to the terms of the TRS. For additional disclosures on the TRS, see “- Off-Balance Sheet Arrangements.”
Our investments in subordinated notes are carried at fair value, which is based on a discounted cash flow model. The discounted cash flow model models both the underlying collateral (“assets”) and the liabilities of the collateralized loan obligation (“CLO”) capital structure. The discounted cash flow model uses a set of assumptions including projected default rates, recovery
79
rates, reinvestment rates and prepayment rates in order to arrive at estimated cash flows of the assets. The discounted cash flow model distributes the asset cash flows to the liability structure based on the payment priorities and discounts them back using appropriate market discount rates based on discount rates for comparable CLOs. The assumptions are based on available market data as well as management estimates. Additional data is used to validate the results from the discounted cash flow method, such as analysis of relevant data observed in the CLO market, review of quotes, where available, recent acquisitions and observable transactions in the subordinated notes, among other factors.
Revenue Recognition
We record interest income on an accrual basis to the extent that we expect to collect such amounts. For loans and debt securities with contractual PIK interest, which represents contractual interest accrued and added to the principal balance, we generally will not accrue PIK interest for accounting purposes if the portfolio company valuation indicates that such PIK interest is not collectible. We do not accrue as a receivable interest on loans and debt securities or accounting purposes if we have reason to doubt our ability to collect such interest. Original issue discounts, market discounts or premiums are accreted or amortized using the effective interest method as interest income. We record prepayment premiums on loans and debt securities as fee income. Dividend income, if any, is recognized on an accrual basis to the extent that we expect to collect such amount.
Net Realized Gains or Losses and Net Change in Unrealized Appreciation or Depreciation
We measure net realized gains or losses by the difference between the net proceeds from the repayment or sale and the amortized cost basis of the investment, without regard to unrealized appreciation or depreciation previously recognized, but considering unamortized upfront fees and prepayment penalties. Net change in unrealized appreciation or depreciation reflects the change in portfolio investment values during the reporting period, including any reversal of previously recorded unrealized appreciation or depreciation, when gains or losses are realized.
Payment-in-Kind Interest
We have investments in our portfolio that contain a PIK interest provision. Any PIK interest is added to the principal balance of such investments and is recorded as income, if the portfolio company valuation indicates that such PIK interest is collectible. In order to maintain our status as a RIC, substantially all of this income must be paid out to stockholders in the form of dividends, even if we have not collected any cash.
Organization and Offering Expenses
We have been responsible for all ongoing organization and offering expenses since June 2, 2014.
U.S. Federal Income Taxes
We have elected to be treated for U.S. federal income tax purposes, and intend to qualify annually, as a RIC under Subchapter M of the Code. As a RIC, we generally will not have to pay corporate-level U.S. federal income taxes on any ordinary income or capital gains that we distribute to our stockholders from our tax earnings and profits. To obtain and maintain our RIC tax treatment, we must, among other things, meet specified source-of-income and asset diversification requirements and distribute annually at least 90% of our ordinary income and realized net short-term capital gains in excess of realized net long-term capital losses, if any.
Recent Developments
On January 12, 2017, our board of directors declared a series of semi-monthly distributions for January, February and March 2017 in the amount of $0.02667 per share. These distributions represent an annualized yield of 7.07% based on our then-current offering price of $9.05 per share. Stockholders of record as of each respective record date will be entitled to receive the distribution. Below are the details for each respective distribution:
Amount Per Share | Record Date | Payment Date | ||
$0.02667 | January 13, 2017 | January 31, 2017 | ||
$0.02667 | January 31, 2017 | January 31, 2017 | ||
$0.02667 | February 15, 2017 | February 28, 2017 | ||
$0.02667 | February 28, 2017 | February 28, 2017 | ||
$0.02667 | March 15, 2017 | March 31, 2017 | ||
$0.02667 | March 31, 2017 | March 31, 2017 | ||
80
In addition, we have issued common shares and received gross proceeds of approximately $5.8 million subsequent to December 31, 2016 through March 6, 2017.
Item 7A: Quantitative and Qualitative Disclosures About Market Risk
We are subject to financial market risks, including changes in interest rates. As of December 31, 2016, 89.0% of our portfolio investments (based on fair value) paid variable interest rates, 11.0% paid fixed interest rates, 2.2% were non-income producing equity or other investments and the remaining 97.8% were income producing equity/other investments. A rise in the general level of interest rates can be expected to lead to higher interest rates applicable to any variable rate investments we hold and to declines in the value of any fixed rate investments we hold. However, many of our variable rate investments provide for an interest rate floor, which may prevent our interest income from increasing until benchmark interest rates increase beyond a threshold amount. To the extent that a substantial portion of our investments may be in variable rate investments, an increase in interest rates beyond this threshold would make it easier for us to meet or exceed the hurdle rate applicable to the subordinated incentive fee on income under the Investment Advisory Agreement we have entered into with SIC Advisors, and may result in a substantial increase in our net investment income and to the amount of incentive fees payable to SIC Advisors with respect to our increased pre-incentive fee net investment income.
Under the terms of the TRS between Arbor and Citibank, Arbor will pay fees to Citibank at a floating rate based on LIBOR in exchange for the right to receive the economic benefit of a portfolio of assets having a maximum notional amount of $300 milion. Our interest expense will also be affected by changes in the published LIBOR rate in connection with our Credit Facilities. We expect any future credit facilities, total return swap agreements or other financing arrangements that we or any of our subsidiaries may enter into will also be based on a floating interest rate. As a result, we are subject to risks relating to changes in market interest rates. In periods of rising interest rates, when we or our subsidiaries have debt outstanding or financing arrangements in effect, our cost of funds would increase, which could reduce our net investment income, especially to the extent we hold fixed rate investments.
In addition, any investments we make that are denominated in a foreign currency will be subject to risks associated with changes in currency exchange rates. These risks include the possibility of significant fluctuations in the foreign currency markets, the imposition or modification of foreign exchange controls and potential illiquidity in the secondary market. These risks will vary depending upon the currency or currencies involved.
Based on our Consolidated Statement of Assets and Liabilities as of December 31, 2016, the following table shows the approximate annual impact on the change in net assets resulting from operations of hypothetical base rate changes in interest rates, assuming no changes in our investment portfolio and capital structure:
Increase in | |||||||||||
Basis point increase | Interest Income (1) | Interest Expense | Interest Income | ||||||||
100 | $ | 9,246,053 | $ | 3,900,000 | $ | 5,346,053 | |||||
200 | 18,391,693 | 7,800,000 | 10,591,693 | ||||||||
300 | 27,539,276 | 11,700,000 | 15,839,276 | ||||||||
400 | 36,686,858 | 15,600,000 | 21,086,858 | ||||||||
500 | 45,834,441 | 19,500,000 | 26,334,441 | ||||||||
(1) Assumes no defaults or prepayments by portfolio companies over the next twelve months.
We expect that our long-term investments will be financed primarily with equity and debt. If deemed prudent, we may use interest rate risk management techniques in an effort to minimize our exposure to interest rate fluctuations. These techniques may include various interest rate hedging activities to the extent permitted by the 1940 Act. Adverse developments resulting from changes in interest rates or hedging transactions could have a material adverse effect on our business, financial condition and results of operations. During the years ended December 31, 2016, 2015 and 2014, we did not engage in interest rate hedging activities.
In addition, we may have risk regarding portfolio valuation. See “Item 7. Management’s Discussion and Analysis of Financial Condition and Results of Operations-Critical Accounting Policies-Valuation of Investments” and “Item 1A. Risk Factors.”
81
Item 8. Consolidated Financial Statements and Supplementary Data
INDEX TO CONSOLIDATED FINANCIAL STATEMENTS
Page | |
F-1 | |
F-2 | |
F-3 | |
F-4 | |
F-5 | |
F-7 | |
F-24 | |
82
Report of Independent Registered Public Accounting Firm
To the Board of Directors and Shareholders of Sierra Income Corporation
We have audited the accompanying consolidated statements of assets and liabilities of Sierra Income Corporation (the “Company”), including the consolidated schedules of investments, as of December 31, 2016 and 2015, and the related consolidated statements of operations, changes in net assets, and cash flows, for each of the three years in the period ended December 31, 2016. These financial statements are the responsibility of the Company’s management. Our responsibility is to express an opinion on these financial statements based on our audits.
We conducted our audits in accordance with the standards of the Public Company Accounting Oversight Board (United States). Those standards require that we plan and perform the audit to obtain reasonable assurance about whether the financial statements are free of material misstatement. We were not engaged to perform an audit of the Company’s internal control over financial reporting. Our audits included consideration of internal control over financial reporting as a basis for designing audit procedures that are appropriate in the circumstances, but not for the purpose of expressing an opinion on the effectiveness of the Company’s internal control over financial reporting. Accordingly, we express no such opinion. An audit also includes examining, on a test basis, evidence supporting the amounts and disclosures in the financial statements, assessing the accounting principles used and significant estimates made by management, and evaluating the overall financial statement presentation. Our procedures included confirmation of investments owned as of December 31, 2016 by correspondence with the custodian, directly with counterparties and management of the portfolio companies, debt agents, and brokers or by other appropriate auditing procedures where replies were not received, as applicable. We believe that our audits provide a reasonable basis for our opinion.
In our opinion, the financial statements referred to above present fairly, in all material respects, the consolidated financial position of Sierra Income Corporation at December 31, 2016 and 2015, and the consolidated results of its operations, changes in net assets, and cash flows, for each of the three years in the period ended December 31, 2016 in conformity with U.S. generally accepted accounting principles.
/s/ Ernst and Young LLP
New York, New York
March 6, 2017
F- 1
Sierra Income Corporation
Consolidated Statements of Assets and Liabilities
As of | |||||||
December 31, 2016 | December 31, 2015 | ||||||
ASSETS | |||||||
Investments at fair value | |||||||
Non-controlled/non-affiliated investments (amortized cost of $921,626,572 and $911,640,087, respectively) | $ | 885,400,856 | $ | 859,500,211 | |||
Controlled/affiliated investments (amortized cost of $104,855,866 and $47,772,500, respectively) | 97,743,466 | 47,862,233 | |||||
Total investments at fair value | 983,144,322 | 907,362,444 | |||||
Cash and cash equivalents | 99,400,794 | 93,658,142 | |||||
Cash collateral on total return swap (Note 5) | 79,620,942 | 77,029,970 | |||||
Interest receivable from non-controlled/non-affiliated investments | 10,251,559 | 7,354,828 | |||||
Due from affiliate (Note 7) | 7,892,273 | 7,314,867 | |||||
Receivable due on total return swap (Note 5) | 1,289,163 | 1,493,253 | |||||
Interest receivable from controlled/affiliated investments | 1,028,321 | 101,250 | |||||
Receivable for Company shares sold | 533,123 | — | |||||
Unsettled trades receivable | 368,819 | 270,936 | |||||
Prepaid expenses and other assets | 201,932 | 121,098 | |||||
Total assets | $ | 1,183,731,248 | $ | 1,094,706,788 | |||
LIABILITIES | |||||||
Revolving credit facilities payable (net of deferred financing costs of $4,340,533 and $3.239.404, respectively) (Note 6) | $ | 385,659,467 | $ | 381,760,596 | |||
Unrealized depreciation on total return swap (Note 5) | 13,647,330 | 27,365,819 | |||||
Base Management fee payable (Note 7) | 5,138,107 | 4,686,096 | |||||
Accounts payable and accrued expenses | 1,839,497 | 2,181,149 | |||||
Incentive fees payable (Note 7) | 1,405,419 | 1,795,268 | |||||
Interest payable | 1,230,530 | 1,281,471 | |||||
Administrator fees payable | 850,678 | 517,930 | |||||
Unsettled trades payable | 466,727 | — | |||||
Deferred tax liability | 244,622 | 298,827 | |||||
Due to affiliate (Note 7) | 135,784 | 695,533 | |||||
Total liabilities | $ | 410,618,161 | $ | 420,582,689 | |||
Commitments (Note 11) | |||||||
NET ASSETS | |||||||
Common shares, par value $0.001 per share, 250,000,000 common shares authorized, 94,666,418 and 82,623,649 common shares issued and outstanding, respectively | $ | 94,666 | $ | 82,624 | |||
Capital in excess of par value | 830,738,206 | 732,493,115 | |||||
Accumulated distribution in excess of net realized gain/(loss) from investments and total return swap | (20,333,057 | ) | (1,797 | ) | |||
Accumulated undistributed net investment income | 19,756,740 | 21,178,346 | |||||
Net unrealized depreciation on investments and total return swap, net of provision for taxes of $54,205 and $(212,227), respectively | (57,143,468 | ) | (79,628,189 | ) | |||
Total net assets | 773,113,087 | 674,124,099 | |||||
Total liabilities and net assets | $ | 1,183,731,248 | $ | 1,094,706,788 | |||
NET ASSET VALUE PER COMMON SHARE | $ | 8.17 | $ | 8.16 | |||
See accompanying notes to the consolidated financial statements.
F- 2
Sierra Income Corporation
Consolidated Statements of Operations
For the years ended December 31, | |||||||||||
2016 | 2015 | 2014 | |||||||||
INVESTMENT INCOME | |||||||||||
Interest from investments | |||||||||||
Non-controlled/non-affiliated investments: | |||||||||||
Cash | $ | 82,231,788 | $ | 71,911,830 | $ | 31,064,590 | |||||
Payment-in-kind | 2,718,606 | 2,973,290 | 382,780 | ||||||||
Controlled/affiliated investments: | |||||||||||
Cash | 5,557,250 | 101,250 | — | ||||||||
Payment-in-kind | 511,529 | — | — | ||||||||
Total interest income | 91,019,173 | 74,986,370 | 31,447,370 | ||||||||
Fee income (Note 12) | 8,703,896 | 10,651,257 | 7,943,860 | ||||||||
Interest from cash and cash equivalents | 57,427 | 2,073 | 225 | ||||||||
Total investment income | 99,780,496 | 85,639,700 | 39,391,455 | ||||||||
EXPENSES | |||||||||||
Base management fee | 19,928,802 | 17,234,293 | 8,976,657 | ||||||||
Interest and financing expenses | 13,493,775 | 9,962,405 | 3,138,389 | ||||||||
Incentive fee | 9,281,479 | 4,434,352 | (183,617 | ) | |||||||
General and administrative expenses | 5,678,299 | 4,503,310 | 3,119,964 | ||||||||
Administrator expenses | 2,847,745 | 2,261,789 | 1,300,971 | ||||||||
Offering costs | 2,572,234 | 4,208,013 | 2,355,985 | ||||||||
Professional fees | 2,106,819 | 2,374,675 | 1,698,537 | ||||||||
Organizational and offering costs reimbursed to Affiliate (Note 7) | — | 443,687 | 4,640,250 | ||||||||
Total expenses | 55,909,153 | 45,422,524 | 25,047,136 | ||||||||
Net expense support reimbursement (Note 7) | (16,093,129 | ) | (6,283,327 | ) | (5,222,096 | ) | |||||
Net expenses | 39,816,024 | 39,139,197 | 19,825,040 | ||||||||
NET INVESTMENT INCOME | 59,964,472 | 46,500,503 | 19,566,415 | ||||||||
REALIZED AND UNREALIZED GAIN/(LOSS) ON INVESTMENTS | |||||||||||
Net realized gain/(loss) from non-controlled/non-affiliated investments | (19,932,571 | ) | (264,308 | ) | 623,653 | ||||||
Net realized gain on total return swap (Note 5) | 6,812,173 | 11,574,160 | 6,387,860 | ||||||||
Net change in unrealized appreciation/(depreciation) on non-controlled/non-affiliated investments | 15,914,160 | (48,086,452 | ) | (4,522,685 | ) | ||||||
Net change in unrealized appreciation/(depreciation) on controlled/affiliated investments | (7,202,133 | ) | 89,733 | — | |||||||
Net change in unrealized appreciation/(depreciation) on total return swap (Note 5) | 13,718,489 | (19,714,222 | ) | (8,002,993 | ) | ||||||
Change in provision for deferred taxes on unrealized gain/(loss) on investments | 54,205 | (212,227 | ) | — | |||||||
Net gain/(loss) on investments | 9,364,323 | (56,613,316 | ) | (5,514,165 | ) | ||||||
NET INCREASE/(DECREASE) IN NET ASSETS RESULTING FROM OPERATIONS | $ | 69,328,795 | $ | (10,112,813 | ) | $ | 14,052,250 | ||||
WEIGHTED AVERAGE - BASIC AND DILUTED EARNINGS PER COMMON SHARE | $ | 0.77 | $ | (0.14 | ) | $ | 0.40 | ||||
WEIGHTED AVERAGE - BASIC AND DILUTED NET INVESTMENT INCOME PER COMMON SHARE | $ | 0.66 | $ | 0.66 | $ | 0.55 | |||||
WEIGHTED AVERAGE COMMON STOCK OUTSTANDING - BASIC AND DILUTED (Note 10) | 90,424,090 | 70,648,292 | 35,425,825 | ||||||||
See accompanying notes to the consolidated financial statements.
F- 3
Sierra Income Corporation
Consolidated Statements of Changes in Net Assets
For the years ended December 31, | |||||||||||
2016 | 2015 | 2014 | |||||||||
INCREASE/(DECREASE) FROM OPERATIONS | |||||||||||
Net investment income | $ | 59,964,472 | $ | 46,500,503 | $ | 19,566,415 | |||||
Net realized gain/(loss) on investments | (19,932,571 | ) | (264,308 | ) | 623,653 | ||||||
Net realized gain on total return swap (Note 5) | 6,812,173 | 11,574,160 | 6,387,860 | ||||||||
Net change in unrealized appreciation/(depreciation) on investments | 8,712,027 | (47,996,719 | ) | (4,522,685 | ) | ||||||
Net change in unrealized appreciation/(depreciation) on total return swap (Note 5) | 13,718,489 | (19,714,222 | ) | (8,002,993 | ) | ||||||
Change in provision for deferred taxes on unrealized gain on investments | 54,205 | (212,227 | ) | — | |||||||
Net increase/(decrease) in net assets resulting from operations | 69,328,795 | (10,112,813 | ) | 14,052,250 | |||||||
SHAREHOLDER DISTRIBUTIONS | |||||||||||
Distributions from net investment income (Note 2) | (68,596,940 | ) | (40,302,852 | ) | (15,570,452 | ) | |||||
Distributions from return of capital (Note 2) | — | (16,060,726 | ) | (6,719,353 | ) | ||||||
Distributions from net realized gains | — | (441,052 | ) | (6,502,690 | ) | ||||||
Net decrease in net assets from shareholder distributions | (68,596,940 | ) | (56,804,630 | ) | (28,792,495 | ) | |||||
COMMON SHARE TRANSACTIONS | |||||||||||
Issuance of common shares, net of underwriting costs | 97,948,176 | 234,419,750 | 339,513,689 | ||||||||
Issuance of common shares pursuant to distribution reinvestment plan | 32,478,892 | 27,227,730 | 13,160,550 | ||||||||
Repurchase of common shares | (32,169,935 | ) | (7,125,851 | ) | (4,416,354 | ) | |||||
Net increase in net assets resulting from common share transactions | 98,257,133 | 254,521,629 | 348,257,885 | ||||||||
Total increase in net assets | 98,988,988 | 187,604,186 | 333,517,640 | ||||||||
Net assets at beginning of year | 674,124,099 | 486,519,913 | 153,002,273 | ||||||||
Net assets at end of year(1) | $ | 773,113,087 | $ | 674,124,099 | $ | 486,519,913 | |||||
Net asset value per common share | $ | 8.17 | $ | 8.16 | $ | 8.97 | |||||
Common shares outstanding, beginning of year | 82,623,649 | 54,260,324 | 16,663,500 | ||||||||
Issuance of common shares | 11,996,965 | 26,083,095 | 36,646,905 | ||||||||
Issuance of common shares pursuant to distribution reinvestment plan | 3,991,569 | 3,088,090 | 1,428,312 | ||||||||
Repurchase of common shares | (3,945,765 | ) | (807,860 | ) | (478,393 | ) | |||||
Common shares outstanding, end of year | 94,666,418 | 82,623,649 | 54,260,324 | ||||||||
DISTRIBUTIONS DECLARED PER COMMON SHARE | $ | 0.76 | $ | 0.80 | $ | 0.80 | |||||
(1) | Net assets at end of year include distribution in excess of net investment income and accumulated undistributed net investment income/(loss) of $19,756,740, $21,178,346 and $9,518,341 for the years ended December 31, 2016, 2015 and 2014, respectively. |
See accompanying notes to the consolidated financial statements.
F- 4
Sierra Income Corporation
Consolidated Statements of Cash Flows
For the years ended December 31, | |||||||||||
2016 | 2015 | 2014 | |||||||||
Cash flows from operating activities | |||||||||||
NET INCREASE/(DECREASE) IN NET ASSETS RESULTING FROM OPERATIONS: | $ | 69,328,795 | $ | (10,112,813 | ) | $ | 14,052,250 | ||||
ADJUSTMENT TO RECONCILE NET INCREASE/(DECREASE) IN NET ASSETS FROM OPERATIONS TO NET CASH USED IN OPERATING ACTIVITIES: | |||||||||||
Payment-in-kind interest income | (3,230,135 | ) | (2,973,290 | ) | (382,780 | ) | |||||
Net amortization of premium on investments | (879,328 | ) | (658,312 | ) | (259,197 | ) | |||||
Amortization of deferred financing costs | 1,318,653 | 1,228,474 | (1,525,543 | ) | |||||||
Net realized (gain)/loss on investments | 19,932,571 | 264,308 | (623,653 | ) | |||||||
Net change in unrealized (appreciation)/depreciation on investments | (8,712,027 | ) | 47,996,719 | 4,522,685 | |||||||
Net change in unrealized (appreciation)/depreciation on total return swap (Note 5) | (13,718,489 | ) | 19,714,222 | 8,002,993 | |||||||
Purchases and originations | (330,626,275 | ) | (524,893,684 | ) | (608,324,075 | ) | |||||
Proceeds from sale of investments and principal repayments | 247,733,316 | 189,816,908 | 125,953,464 | ||||||||
(Increase)/decrease in operating assets: | |||||||||||
Cash collateral on total return swap (Note 5) | (2,590,972 | ) | (20,152,042 | ) | (50,171,769 | ) | |||||
Unsettled trades receivable | (97,883 | ) | 153,705 | 71,609 | |||||||
Due from affiliate (Note 7) | (577,406 | ) | (318,937 | ) | (4,402,941 | ) | |||||
Interest receivable from non-controlled/non-affiliated investments | (2,896,731 | ) | (2,141,223 | ) | (3,224,477 | ) | |||||
Interest receivable from controlled/affiliated investments | (927,071 | ) | (101,250 | ) | — | ||||||
Receivable for Company shares sold | (533,123 | ) | — | — | |||||||
Receivable due on total return swap (Note 5) | 204,090 | (397,671 | ) | (940,265 | ) | ||||||
Prepaid expenses and other assets | (80,834 | ) | 280,599 | (94,042 | ) | ||||||
Increase/(decrease) in operating liabilities: | |||||||||||
Unsettled trades payable | 466,727 | (16,935,000 | ) | 1,442,500 | |||||||
Management fee payable | 452,011 | 1,414,709 | 2,456,732 | ||||||||
Accounts payable and accrued expenses | (341,652 | ) | (246,694 | ) | 1,931,950 | ||||||
Incentive fees payable | (389,849 | ) | 1,795,268 | (182,989 | ) | ||||||
Administrator fees payable | 332,748 | 67,872 | 297,896 | ||||||||
Interest payable | (50,941 | ) | 632,974 | 615,442 | |||||||
Deferred tax liability | (54,205 | ) | 212,277 | 86,600 | |||||||
Due to affiliate (Note 7) | (559,749 | ) | (879,204 | ) | 1,541,426 | ||||||
NET CASH USED IN OPERATING ACTIVITIES | (26,497,759 | ) | (316,232,135 | ) | (509,156,184 | ) | |||||
Cash flows from financing activities: | |||||||||||
Borrowings under revolving credit facility | 130,000,000 | 408,500,000 | 321,500,000 | ||||||||
Repayments of revolving credit facility | (125,000,000 | ) | (260,000,000 | ) | (101,000,000 | ) | |||||
Proceeds from issuance of common stock, net of underwriting costs | 97,948,176 | 234,419,750 | 339,513,689 | ||||||||
Payment of cash distributions | (36,118,048 | ) | (29,576,900 | ) | (15,631,945 | ) | |||||
Financing costs paid | (2,419,782 | ) | (2,075,876 | ) | — | ||||||
Repurchase of common shares | (32,169,935 | ) | (7,125,851 | ) | (4,416,354 | ) | |||||
NET CASH PROVIDED BY FINANCING ACTIVITIES | 32,240,411 | 344,141,123 | 539,965,390 | ||||||||
TOTAL INCREASE IN CASH | 5,742,652 | 27,908,988 | 30,809,206 | ||||||||
F- 5
For the years ended December 31, | |||||||||||
2016 | 2015 | 2014 | |||||||||
CASH AT BEGINNING OF YEAR | 93,658,142 | 65,749,154 | 34,939,948 | ||||||||
CASH AT END OF YEAR | $ | 99,400,794 | $ | 93,658,142 | $ | 65,749,154 | |||||
Supplemental Information: | |||||||||||
Cash paid during the year for interest | $ | 13,544,716 | $ | 9,329,431 | $ | 2,522,947 | |||||
Supplemental non-cash information: | |||||||||||
Non-cash purchase of investments | $ | 32,805,477 | $ | — | $ | — | |||||
Non-cash sale of investments | 32,805,477 | — | — | ||||||||
Payment-in-kind interest income | 3,230,135 | 2,973,290 | 382,780 | ||||||||
Amortization of deferred financing costs | 1,318,653 | 1,228,474 | 1,525,543 | ||||||||
Net amortization of premium on investments | 879,328 | 658,312 | 259,197 | ||||||||
Issuance of common shares in connection with distribution reinvestment plan | $ | 32,478,892 | $ | 27,227,730 | $ | 13,160,550 | |||||
See accompanying notes to the consolidated financial statements.
F- 6
Sierra Income Corporation
Consolidated Schedule of Investments
As of December 31, 2016
Company(1) | Industry | Type of Investment | Maturity | Par Amount | Cost | Fair Value | % of Net Assets(2) | ||||||||||||
Non-controlled/non-affiliated investments – 114.5% | |||||||||||||||||||
AAAHI Acquisition Corporation | Transportation: Consumer | Senior Secured First Lien Term Loan LIBOR + 7.000%, 1.000% Floor(3)(4)(5) | 12/15/2021 | 7,280,374 | 7,280,374 | 7,280,374 | 0.9% | ||||||||||||
7,280,374 | 7,280,374 | 7,280,374 | |||||||||||||||||
AAR Intermediate Holdings, LLC | Energy: Oil & Gas | Senior Secured First Lien Term Loan LIBOR + 5.000%, 1.000% Floor(3) (4) (5) | 9/30/2021 | 150,935 | 150,935 | 150,935 | 0.0% | ||||||||||||
Senior Secured First Lien Term Loan LIBOR + 5.000%, 1.000% Floor(3) (4) | 9/30/2021 | 3,144,481 | 3,144,481 | 3,144,481 | 0.4% | ||||||||||||||
Senior Secured First Lien Term Loan LIBOR + 8.000%, 1.000% Floor, PIK(3) (4) | 9/30/2021 | 6,457,851 | 5,254,799 | 5,211,292 | 0.7% | ||||||||||||||
Membership Units (4) (6) (7) | — | — | — | 0.0% | |||||||||||||||
9,753,267 | 8,550,215 | 8,506,708 | |||||||||||||||||
Access Media Holdings, LLC | Media: Broadcasting & Subscription | Senior Secured First Lien Term Loan 5.000%, 5.000% PIK(4) | 7/22/2020 | 7,026,014 | 7,026,014 | 6,868,420 | 0.9% | ||||||||||||
Common Stock (4) (6) (7) | — | — | — | 0.0% | |||||||||||||||
Preferred Equity Series A (4) (6) (7) | — | 1,400,000 | — | 0.0% | |||||||||||||||
Preferred Equity Series AA (4) (6) (7) | — | 647,500 | — | 0.0% | |||||||||||||||
7,026,014 | 9,073,514 | 6,868,420 | |||||||||||||||||
Advanced Diagnostic Holdings, LLC | Healthcare & Pharmaceuticals | Senior Secured First Lien Term Loan LIBOR + 8.750%, 0.875% Floor(3) (4) | 12/11/2020 | 15,262,608 | 15,262,608 | 15,567,860 | 2.0% | ||||||||||||
15,262,608 | 15,262,608 | 15,567,860 | |||||||||||||||||
Alpha Media LLC | Media: Broadcasting & Subscription | Senior Secured First Lien Term Loan LIBOR 5 6.000%, 1.000% Floor(8)(5) | 2/25/2022 | 9,384,375 | 9,012,061 | 8,962,078 | 1.2% | ||||||||||||
9,384,375 | 9,012,061 | 8,962,078 | |||||||||||||||||
Amerijet Holdings Inc. | Transportation: Cargo | Senior Secured First Lien Term Loan LIBOR + 8.000%, 1.000% Floor(3) (4) | 7/15/2021 | 16,087,500 | 16,087,500 | 16,087,500 | 2.1% | ||||||||||||
16,087,500 | 16,087,500 | 16,087,500 | |||||||||||||||||
AMMC CLO 17, Limited Series 2015-17A | Multi-Sector Holdings | Subordinated Note 21.670% effective yield(6) (9) (10) | 11/15/2027 | 5,000,000 | 3,553,568 | 4,181,250 | 0.5% | ||||||||||||
5,000,000 | 3,553,568 | 4,181,250 | |||||||||||||||||
Anaren, Inc. | Aerospace & Defense | Senior Secured Second Lien Term Loan LIBOR + 8.250%, 1.000% Floor(3) | 8/18/2021 | 10,000,000 | 9,929,667 | 10,002,500 | 1.3% | ||||||||||||
10,000,000 | 9,929,667 | 10,002,500 | |||||||||||||||||
APCO Holdings, Inc. | Automotive | Senior Secured First Lien Term Loan LIBOR + 6.000%, 1.000% Floor(4) (8) | 1/31/2022 | 4,351,318 | 4,236,463 | 4,369,201 | 0.6% | ||||||||||||
4,351,318 | 4,236,463 | 4,369,201 | |||||||||||||||||
Apidos CLO XXIV, Series 2016-24A | Multi-Sector Holdings | Subordinated Note 16.535% effective yield(4) (6) (9) (10) | 1/20/2023 | 25,471,800 | 21,625,558 | 21,977,069 | 2.8% | ||||||||||||
25,471,800 | 21,625,558 | 21,977,069 | |||||||||||||||||
Associated Asphalt Partners, LLC | Chemicals, Plastics & Rubber | Senior Secured First Lien Note 8.500%(9) | 2/15/2018 | 1,778,000 | 1,782,303 | 1,795,780 | 0.2% | ||||||||||||
1,778,000 | 1,782,303 | 1,795,780 | |||||||||||||||||
Astro AB Borrower, Inc.(11) | Banking, Finance, Insurance & Real Estate | Senior Secured Second Lien Term Loan LIBOR + 8.750%, 1.000% Floor(3) | 4/30/2023 | 6,000,000 | 5,898,052 | 6,060,000 | 0.8% | ||||||||||||
6,000,000 | 5,898,052 | 6,060,000 | |||||||||||||||||
F- 7
Company(1) | Industry | Type of Investment | Maturity | Par Amount | Cost | Fair Value | % of Net Assets(2) | ||||||||||||
Asurion, LLC(11) | Banking, Finance, Insurance & Real Estate | Senior Secured Second Lien Term Loan LIBOR + 7.500%, 1.000% Floor(3) | 3/3/2021 | 7,000,000 | 6,952,364 | 7,087,500 | 0.9% | ||||||||||||
7,000,000 | 6,952,364 | 7,087,500 | |||||||||||||||||
Atrium Innovations, Inc. | Healthcare & Pharmaceuticals | Senior Secured Second Lien Term Loan LIBOR + 6.750%, 1.000% Floor(3) (6) | 8/13/2021 | 5,000,000 | 4,982,828 | 5,000,000 | 0.6% | ||||||||||||
5,000,000 | 4,982,828 | 5,000,000 | |||||||||||||||||
Aviation Technical Services, Inc. | Aerospace & Defense | Senior Secured Second Lien Term Loan LIBOR + 8.500%, 1.000% Floor(3)(4)(17) | 3/31/2022 | 25,000,000 | 25,000,000 | 25,500,000 | 3.3% | ||||||||||||
25,000,000 | 25,000,000 | 25,500,000 | |||||||||||||||||
Backcountry.com, LLC | Retail | Senior Secured First Lien Term Loan LIBOR + 7.250%, 1.000% Floor(3) (4) (17) | 6/30/2020 | 34,589,843 | 34,589,843 | 34,935,742 | 4.5% | ||||||||||||
34,589,843 | 34,589,843 | 34,935,742 | |||||||||||||||||
Birch Communications, Inc. | Telecommunications | Senior Secured First Lien Term Loan LIBOR + 7.250%, 1.000% Floor(4) (8) | 7/17/2020 | 13,816,112 | 13,647,092 | 13,633,601 | 1.8% | ||||||||||||
13,816,112 | 13,647,092 | 13,633,601 | |||||||||||||||||
Black Angus Steakhouses LLC | Hotel, Gaming & Leisure | Revolving Credit Facility LIBOR + 9.000%, 1.000% Floor(3) (4) (5) (17) | 4/24/2020 | 669,643 | 669,643 | 613,326 | 0.1% | ||||||||||||
Senior Secured First Lien Term Loan LIBOR + 9.000%, 1.000% Floor(3) (4) (17) | 4/24/2020 | 19,637,277 | 19,637,277 | 19,141,828 | 2.5% | ||||||||||||||
20,306,920 | 20,306,920 | 19,755,154 | |||||||||||||||||
Brundage-Bone Concrete Pumping, Inc. | Construction & Building | Senior Secured First Lien Note 10.375%(9) | 9/1/2021 | 7,500,000 | 7,607,418 | 8,025,000 | 1.0% | ||||||||||||
7,500,000 | 7,607,418 | 8,025,000 | |||||||||||||||||
Charming Charlie LLC | Retail | Senior Secured First Lien Term Loan LIBOR + 8.000%, 1.000% Floor(3) | 12/24/2019 | 7,908,765 | 7,920,847 | 6,334,209 | 0.8% | ||||||||||||
7,908,765 | 7,920,847 | 6,334,209 | |||||||||||||||||
ConvergeOne Holdings Corp.(11) | Telecommunications | Senior Secured Second Lien Term Loan LIBOR + 9.000%, 1.000% Floor(3) (4) | 6/17/2021 | 12,500,000 | 12,410,777 | 12,500,000 | 1.6% | ||||||||||||
12,500,000 | 12,410,777 | 12,500,000 | |||||||||||||||||
Cornerstone Chemical Company | Chemicals, Plastics & Rubber | Senior Secured First Lien Note 9.375%(9) | 3/15/2018 | 4,970,000 | 4,874,178 | 4,963,788 | 0.6% | ||||||||||||
4,970,000 | 4,874,178 | 4,963,788 | |||||||||||||||||
CP Opco, LLC | Services: Consumer | Revolver LIBOR + 4.500%, 1.000% Floor(3) (4) (5) | 3/31/2019 | 128,039 | 128,039 | 128,039 | 0.0% | ||||||||||||
Revolver ABR + 3.500%, 3.750% Floor(3) (4) (5) | 3/31/2019 | 210,935 | 210,935 | 210,935 | 0.0% | ||||||||||||||
Senior Secured First Lien Term Loan LIBOR + 6.500%, 1.000% Floor, PIK(3) (4) | 3/31/2019 | 504,597 | 504,597 | 504,597 | 0.1% | ||||||||||||||
Senior Secured First Lien Term Loan LIBOR + 6.500%, 1.000% Floor, PIK(3) (4) | 3/31/2019 | 210,249 | 210,249 | 210,249 | 0.0% | ||||||||||||||
Senior Secured First Lien Term Loan LIBOR + 9.500%, 1.000% Floor, PIK(3) (4) (12) | 3/31/2019 | 1,487,033 | 717,016 | 743,516 | 0.1% | ||||||||||||||
Preferred Units LIBOR + 9.500%, 1.000% Floor, PIK(4) (12) | 3/31/2019 | 205 | — | — | 0.0% | ||||||||||||||
Common Units (4) (7) | — | — | — | 0.0% | |||||||||||||||
2,541,058 | 1,770,836 | 1,797,336 | |||||||||||||||||
CRGT Inc. | High Tech Industries | Senior Secured First Lien Term Loan LIBOR + 6.500%, 1.000% Floor(4) (8) | 12/19/2020 | 3,966,456 | 3,966,456 | 3,966,456 | 0.5% | ||||||||||||
3,966,456 | 3,966,456 | 3,966,456 | |||||||||||||||||
DHISCO Electronic Distribution, Inc. | Hotel, Gaming & Leisure | Senior Secured First Lien Term Loan LIBOR + 6.500%, 1.500% Floor(3) (4) | 11/10/2019 | 2,380,952 | 2,380,952 | 2,380,952 | 0.3% | ||||||||||||
F- 8
Company(1) | Industry | Type of Investment | Maturity | Par Amount | Cost | Fair Value | % of Net Assets(2) | ||||||||||||
Senior Secured First Lien Term Loan LIBOR + 11.250% PIK, 1.500% Floor(3) (4) (12) | 11/10/2019 | 6,680,333 | 2,940,892 | 2,956,515 | 0.4% | ||||||||||||||
Senior Secured First Lien Term Loan LIBOR + 9.000% PIK, 1.500% Floor(3) (4) | 11/10/2019 | 8,369,792 | 8,369,792 | 8,369,792 | 1.1% | ||||||||||||||
Senior Secured First Lien Term Loan LIBOR + 10.250%, PIK 1.500% Floor(3) (4) | 11/10/2019 | 7,177,827 | 7,177,827 | 7,177,827 | 0.9% | ||||||||||||||
Common Units, Class A (4) (7) | — | 769,231 | — | 0.0% | |||||||||||||||
24,608,904 | 21,638,694 | 20,885,086 | |||||||||||||||||
Drew Marine Partners, LP | Transportation: Cargo | Senior Secured Second Lien Term Loan LIBOR + 7.000%, 1.000% Floor(3) | 5/19/2021 | 10,000,000 | 10,054,556 | 9,872,800 | 1.3% | ||||||||||||
10,000,000 | 10,054,556 | 9,872,800 | |||||||||||||||||
Dryden 38 Senior Loan Fund - Series 2015-38A | Multi-Sector Holdings | Subordinated Note 17.689% effective yield(6) (9) (10) | 7/15/2027 | 7,000,000 | 5,011,083 | 5,225,150 | 0.7% | ||||||||||||
7,000,000 | 5,011,083 | 5,225,150 | |||||||||||||||||
Dryden 43 Senior Loan Fund - Series 2016-43A | Multi-Sector Holdings | Subordinated Note 18.086% effective yield(4) (6) (9) (10) | 7/20/2029 | 3,620,000 | 2,932,200 | 3,250,579 | 0.4% | ||||||||||||
3,620,000 | 2,932,200 | 3,250,579 | |||||||||||||||||
Dryden 49 Senior Loan Fund | Multi-Sector Holdings | Preferred Shares(4) (6) | — | 14,500,000 | 14,500,000 | 1.9% | |||||||||||||
— | 14,500,000 | 14,500,000 | |||||||||||||||||
Dynamic Energy Services International LLC | Energy: Oil & Gas | Senior Secured First Lien Term Loan 13.500% PIK + LIBOR(4) (8) | 3/6/2018 | 8,662,161 | 8,662,161 | 7,373,318 | 1.0% | ||||||||||||
8,662,161 | 8,662,161 | 7,373,318 | |||||||||||||||||
EarthLink, Inc. | Telecommunications | Senior Secured First Lien Note 7.375%(6) (9) (13) | 6/1/2020 | 2,450,000 | 2,442,601 | 2,575,563 | 0.3% | ||||||||||||
2,450,000 | 2,442,601 | 2,575,563 | |||||||||||||||||
Elite Comfort Solutions LLC | Chemicals, Plastics & Rubber | Senior Secured First Lien Term Loan LIBOR + 6.500%, 1.000% Floor(3) (5) | 1/15/2021 | 8,858,643 | 8,858,643 | 8,966,622 | 1.2% | ||||||||||||
8,858,643 | 8,858,643 | 8,966,622 | |||||||||||||||||
First Boston Construction Holdings, LLC | Banking, Finance, Insurance & Real Estate | Senior Secured First Lien Note 12.000%(4) (5) | 12/31/2020 | 6,105,000 | 6,105,000 | 6,105,000 | 0.8% | ||||||||||||
Preferred Equity (4) (7) | — | 1,526,250 | 1,526,250 | 0.2% | |||||||||||||||
6,105,000 | 7,631,250 | 7,631,250 | |||||||||||||||||
FKI Security Group, LLC | Capital Equipment | Senior Secured First Lien Term Loan LIBOR + 8.500%, 1.000% Floor(3) (4) | 3/30/2020 | 11,937,500 | 11,937,500 | 12,088,629 | 1.6% | ||||||||||||
11,937,500 | 11,937,500 | 12,088,629 | |||||||||||||||||
Frontier Communications Corp. | Telecommunications | Senior Secured First Lien Note 10.500%(6) (9) (13) | 9/15/2022 | 2,000,000 | 2,000,000 | 2,107,500 | 0.3% | ||||||||||||
2,000,000 | 2,000,000 | 2,107,500 | |||||||||||||||||
Gastar Exploration Inc. | Energy: Oil & Gas | Senior Secured First Lien Note 8.625%(9) (13) | 5/15/2018 | 5,400,000 | 5,405,735 | 5,325,750 | 0.7% | ||||||||||||
5,400,000 | 5,405,735 | 5,325,750 | |||||||||||||||||
Genex Holdings, Inc.(11) | Banking, Finance, Insurance & Real Estate | Senior Secured Second Lien Term Loan LIBOR + 7.750%, 1.000% Floor(3) | 5/30/2022 | 9,500,000 | 9,525,097 | 9,500,000 | 1.2% | ||||||||||||
9,500,000 | 9,525,097 | 9,500,000 | |||||||||||||||||
GK Holdings, Inc. | Services: Business | Senior Secured Second Lien Term Loan LIBOR + 9.500%, 1.000% Floor(3) | 1/30/2022 | 10,000,000 | 10,000,000 | 10,200,000 | 1.3% | ||||||||||||
10,000,000 | 10,000,000 | 10,200,000 | |||||||||||||||||
Green Field Energy Services, Inc. | Energy: Oil & Gas | Senior Secured First Lien Note 13.000%(4) (9) (12) | 11/15/2016 | 766,615 | 754,615 | 157,156 | 0.0% | ||||||||||||
Warrants (4) (7) | — | 29,000 | — | 0.0% | |||||||||||||||
766,615 | 783,615 | 157,156 | |||||||||||||||||
F- 9
Company(1) | Industry | Type of Investment | Maturity | Par Amount | Cost | Fair Value | % of Net Assets(2) | ||||||||||||
HBC Holdings LLC | Wholesale | Senior Secured First Lien Term Loan LIBOR + 5.750%, 1.000% Floor(3) (4) | 3/30/2020 | 13,162,500 | 13,162,500 | 12,461,860 | 1.6% | ||||||||||||
13,162,500 | 13,162,500 | 12,461,860 | |||||||||||||||||
Heligear Acquisition Co. | Aerospace & Defense | Senior Secured First Lien Note 10.250%(4) (9) | 10/15/2019 | 15,000,000 | 15,000,000 | 15,785,550 | 2.0% | ||||||||||||
15,000,000 | 15,000,000 | 15,785,550 | |||||||||||||||||
Hill International, Inc. | Construction & Building | Senior Secured First Lien Term Loan LIBOR + 6.750%, 1.000% Floor(3) (4) (17) | 9/28/2020 | 16,617,500 | 16,617,500 | 16,617,500 | 2.2% | ||||||||||||
16,617,500 | 16,617,500 | 16,617,500 | |||||||||||||||||
Holland Acquisition Corp. | Energy: Oil & Gas | Senior Secured First Lien Term Loan LIBOR + 9.000%, 1.000% Floor(3) | 5/29/2018 | 4,515,605 | 4,482,170 | 2,791,682 | 0.4% | ||||||||||||
4,515,605 | 4,482,170 | 2,791,682 | |||||||||||||||||
Hylan Datacom & Electrical LLC | Construction & Building | Senior Secured First Lien Term Loan LIBOR + 7.500%, 1.000% Floor(3) (4) | 7/25/2021 | 15,799,862 | 15,799,862 | 15,799,862 | 2.0% | ||||||||||||
15,799,862 | 15,799,862 | 15,799,862 | |||||||||||||||||
Ignite Restaurant Group, Inc. | Hotel, Gaming & Leisure | Senior Secured First Lien Term Loan LIBOR + 7.000%, 1.000% Floor(3) | 2/13/2019 | 8,385,496 | 8,316,629 | 8,009,658 | 1.0% | ||||||||||||
8,385,496 | 8,316,629 | 8,009,658 | |||||||||||||||||
IHS Intermediate, Inc. | Services: Business | Senior Secured Second Lien Term Loan LIBOR + 8.250%, 1.000% Floor(3) | 7/20/2022 | 25,000,000 | 25,000,000 | 25,163,250 | 3.3% | ||||||||||||
25,000,000 | 25,000,000 | 25,163,250 | |||||||||||||||||
Impact Sales, LLC | Services: Business | Senior Secured First Lien Term Loan LIBOR + 7.000%, 1.000% Floor(3) (4) (5) | 12/30/2021 | 4,687,500 | 4,687,500 | 4,687,500 | 0.6% | ||||||||||||
4,687,500 | 4,687,500 | 4,687,500 | |||||||||||||||||
Interface Security Systems Holdings, Inc. | Services: Consumer | Senior Secured First Lien Note 9.250%(9) | 1/15/2018 | 3,417,000 | 3,434,380 | 3,404,186 | 0.4% | ||||||||||||
3,417,000 | 3,434,380 | 3,404,186 | |||||||||||||||||
Invision Diversified, LLC | Services: Business | Senior Secured First Lien Term Loan LIBOR + 9.000%, 1.000% Floor(3) (4) (17) | 6/30/2020 | 24,491,435 | 24,491,435 | 24,807,130 | 3.2% | ||||||||||||
24,491,435 | 24,491,435 | 24,807,130 | |||||||||||||||||
IronGate Energy Services, LLC | Energy: Oil & Gas | Senior Secured First Lien Note 11.000%(9) (12) | 7/1/2018 | 3,000,000 | 2,973,811 | 975,000 | 0.1% | ||||||||||||
3,000,000 | 2,973,811 | 975,000 | |||||||||||||||||
Isola USA Corp.(11) | High Tech Industries | Senior Secured First Lien Term Loan LIBOR + 8.250%, 1.000% Floor(3) | 11/29/2018 | 5,493,504 | 5,551,082 | 5,113,299 | 0.7% | ||||||||||||
5,493,504 | 5,551,082 | 5,113,299 | |||||||||||||||||
Jordan Reses Supply Company, LLC | Healthcare & Pharmaceuticals | Senior Secured Second Lien Term Loan LIBOR + 11.000%, 1.000% Floor(3) (4) | 4/24/2020 | 5,000,000 | 5,000,000 | 5,050,000 | 0.7% | ||||||||||||
5,000,000 | 5,000,000 | 5,050,000 | |||||||||||||||||
Liquidnet Holdings, Inc. | Banking, Finance, Insurance & Real Estate | Senior Secured First Lien Term Loan LIBOR + 6.750%, 1.000% Floor(3) | 5/22/2019 | 6,125,000 | 6,075,286 | 6,160,586 | 0.8% | ||||||||||||
6,125,000 | 6,075,286 | 6,160,586 | |||||||||||||||||
Livingston International Inc.(11) | Transportation: Cargo | Senior Secured Second Lien Term Loan LIBOR + 8.250%, 1.250% Floor(3) (6) | 4/17/2020 | 2,658,504 | 2,655,528 | 2,532,757 | 0.3% | ||||||||||||
2,658,504 | 2,655,528 | 2,532,757 | |||||||||||||||||
Loar Group Inc. | Aerospace & Defense | Senior Secured Second Lien Term Loan LIBOR + 9.250%, 1.000% Floor(8) | 7/12/2022 | 15,000,000 | 15,000,000 | 15,450,000 | 2.0% | ||||||||||||
15,000,000 | 15,000,000 | 15,450,000 | |||||||||||||||||
LSF9 Atlantis Holdings, LLC | Retail | Senior Secured First Lien Term Loan LIBOR + 9.000%, 1.000% Floor(3) (4) | 1/15/2021 | 9,625,000 | 9,546,319 | 9,739,634 | 1.3% | ||||||||||||
9,625,000 | 9,546,319 | 9,739,634 | |||||||||||||||||
F- 10
Company(1) | Industry | Type of Investment | Maturity | Par Amount | Cost | Fair Value | % of Net Assets(2) | ||||||||||||
LTCG Holdings Corp. | Banking, Finance, Insurance & Real Estate | Senior Secured First Lien Term Loan LIBOR + 5.000%, 1.000% Floor(3) | 6/6/2020 | 2,838,571 | 2,829,766 | 2,664,170 | 0.3% | ||||||||||||
2,838,571 | 2,829,766 | 2,664,170 | |||||||||||||||||
Miller Heiman, Inc. | Services: Business | Senior Secured First Lien Term Loan LIBOR + 6.000%, 1.000% Floor(3) (12) | 9/30/2019 | 23,593,750 | 23,593,750 | 12,976,563 | 1.7% | ||||||||||||
23,593,750 | 23,593,750 | 12,976,563 | |||||||||||||||||
Nathan's Famous, Inc. | Beverage & Food | Senior Secured First Lien Note 10.000%(13) | 3/15/2020 | 7,000,000 | 7,000,000 | 7,612,500 | 1.0% | ||||||||||||
7,000,000 | 7,000,000 | 7,612,500 | |||||||||||||||||
Nation Safe Drivers Holdings, Inc. | Banking, Finance, Insurance & Real Estate | Senior Secured Second Lien Term Loan LIBOR + 8.000%, 2.000% Floor(3) (4) | 9/29/2020 | 20,676,479 | 20,676,479 | 20,883,243 | 2.7% | ||||||||||||
20,676,479 | 20,676,479 | 20,883,243 | |||||||||||||||||
New Media Holdings II LLC | Media: Advertising, Printing & Publishing | Senior Secured First Lien Term Loan LIBOR + 6.250%, 1.000% Floor(3) | 6/4/2020 | 18,043,921 | 18,029,645 | 18,043,921 | 2.3% | ||||||||||||
18,043,921 | 18,029,645 | 18,043,921 | |||||||||||||||||
Novetta Solutions, LLC | High Tech Industries | Senior Secured Second Lien Term Loan LIBOR + 8.500%, 1.000% Floor(3) | 10/16/2023 | 11,000,000 | 10,905,938 | 10,499,170 | 1.4% | ||||||||||||
11,000,000 | 10,905,938 | 10,499,170 | |||||||||||||||||
Nuspire, LLC | High Tech Industries | Senior Secured First Lien Term Loan LIBOR + 6.500%, 1.000% Floor(3) (4) (5) | 11/8/2021 | — | — | — | 0.0% | ||||||||||||
Senior Secured First Lien Term Loan LIBOR + 6.500%, 1.000% Floor(3) (4) | 11/8/2022 | 6,310,000 | 6,310,000 | 6,310,000 | 0.8% | ||||||||||||||
6,310,000 | 6,310,000 | 6,310,000 | |||||||||||||||||
Omnitracs, Inc. | Telecommunications | Senior Secured Second Lien Term Loan LIBOR + 7.750%, 1.000% Floor(3) | 5/25/2021 | 7,000,000 | 7,010,819 | 6,763,750 | 0.9% | ||||||||||||
7,000,000 | 7,010,819 | 6,763,750 | |||||||||||||||||
Oxford Mining Company, LLC | Metals & Mining | Senior Secured First Lien Term Loan LIBOR + 8.500%, 0.750% Floor, 3.000% PIK(3) (4) | 12/31/2018 | 20,756,843 | 20,756,842 | 20,518,139 | 2.7% | ||||||||||||
20,756,843 | 20,756,842 | 20,518,139 | |||||||||||||||||
Path Medical, LLC | Healthcare & Pharmaceuticals | Senior Secured First Lien Term Loan LIBOR + 9.500%, 1.000% Floor(4) (8) | 10/11/2021 | 16,195,000 | 15,560,824 | 15,542,666 | 2.0% | ||||||||||||
Warrants (4) (7) | — | 669,709 | 669,709 | 0.1% | |||||||||||||||
16,195,000 | 16,230,533 | 16,212,375 | |||||||||||||||||
Payless Inc. | Retail | Senior Secured Second Lien Term Loan LIBOR + 7.500%, 1.000% Floor(3) | 3/11/2022 | 6,000,000 | 6,014,579 | 900,000 | 0.1% | ||||||||||||
6,000,000 | 6,014,579 | 900,000 | |||||||||||||||||
Preferred Proppants, LLC(11) | Construction & Building | Senior Secured First Lien Term Loan LIBOR + 5.750%, 1.000% Floor(3) | 7/27/2020 | 3,979,645 | 2,738,781 | 3,357,825 | 0.4% | ||||||||||||
3,979,645 | 2,738,781 | 3,357,825 | |||||||||||||||||
Press Ganey Holding, Inc(11) | Healthcare & Pharmaceuticals | Senior Secured Second Lien Term Loan LIBOR + 7.250%, 1.000% Floor(3) | 10/21/2024 | 6,500,000 | 6,473,059 | 6,472,505 | 0.8% | ||||||||||||
6,500,000 | 6,473,059 | 6,472,505 | |||||||||||||||||
PT Network, LLC | Healthcare & Pharmaceuticals | Senior Secured First Lien Term Loan LIBOR + 6.500%, 1.000% Floor(3) (4) (5) | 11/30/2021 | 4,833,334 | 4,833,334 | 4,833,334 | 0.6% | ||||||||||||
4,833,334 | 4,833,334 | 4,833,334 | |||||||||||||||||
Reddy Ice Corporation | Beverage & Food | Senior Secured Second Lien Term Loan LIBOR + 9.500%, 1.250% Floor(4) (8) | 11/1/2019 | 2,000,000 | 2,000,000 | 1,720,000 | 0.2% | ||||||||||||
2,000,000 | 2,000,000 | 1,720,000 | |||||||||||||||||
Research Now Group, Inc. | Services: Business | Senior Secured Second Lien Term Loan LIBOR + 8.750%, 1.000% Floor(3) | 3/18/2022 | 15,000,000 | 15,000,000 | 14,983,200 | 1.9% | ||||||||||||
F- 11
Company(1) | Industry | Type of Investment | Maturity | Par Amount | Cost | Fair Value | % of Net Assets(2) | ||||||||||||
15,000,000 | 15,000,000 | 14,983,200 | |||||||||||||||||
Response Team Holdings, LLC | Construction & Building | Preferred Equity 12% PIK(4) (6) (12) | — | 3,384,734 | 967,238 | 0.1% | |||||||||||||
Warrants (4) (6) (7) | — | 257,407 | — | 0.0% | |||||||||||||||
— | 3,642,141 | 967,238 | |||||||||||||||||
Rhombus Cinema Holdings, LP | Media: Diversified & Production | Preferred Equity 10.000% PIK(4) (6) | — | 4,584,207 | 5,051,193 | 0.7% | |||||||||||||
Equity (4) (6) (7) | — | 3,162,793 | 3,162,793 | 0.4% | |||||||||||||||
— | 7,747,000 | 8,213,986 | |||||||||||||||||
School Specialty, Inc. | Wholesale | Senior Secured First Lien Term Loan LIBOR + 8.500%, 1.000% Floor(3) | 6/11/2019 | 9,198,434 | 9,169,670 | 9,198,434 | 1.2% | ||||||||||||
9,198,434 | 9,169,670 | 9,198,434 | |||||||||||||||||
Ship Supply Acquisition Corporation | Services: Business | Senior Secured First Lien Term Loan LIBOR + 8.000%, 1.000% Floor(3) (4) | 7/31/2020 | 23,437,500 | 23,437,500 | 22,970,391 | 3.0% | ||||||||||||
23,437,500 | 23,437,500 | 22,970,391 | |||||||||||||||||
Sizzling Platter, LLC | Hotel, Gaming & Leisure | Senior Secured First Lien Term Loan LIBOR + 7.500%, 1.000% Floor(3) | 4/28/2020 | 15,000,000 | 15,000,000 | 15,091,200 | 2.0% | ||||||||||||
15,000,000 | 15,000,000 | 15,091,200 | |||||||||||||||||
SMART Financial Operations, LLC | Retail | Senior Secured First Lien Term Loan LIBOR + 10.000%, 1.000% Floor(3) (4) (5) | 11/22/2021 | 3,700,000 | 3,700,000 | 3,700,000 | 0.5% | ||||||||||||
Equity (4) (7) | — | 1,000,000 | 1,000,000 | 0.1% | |||||||||||||||
3,700,000 | 4,700,000 | 4,700,000 | |||||||||||||||||
Southwest Dealer Services, Inc. | Automotive | Senior Secured First Lien Term Loan LIBOR + 6.000%, 1.000% Floor(3) (4) (17) | 3/16/2020 | 2,538,823 | 2,538,823 | 2,535,878 | 0.3% | ||||||||||||
2,538,823 | 2,538,823 | 2,535,878 | |||||||||||||||||
Survey Sampling International, LLC | Services: Business | Senior Secured Second Lien Term Loan LIBOR + 9.000%, 1.000% Floor(3) | 12/16/2021 | 24,000,000 | 24,000,000 | 24,000,000 | 3.1% | ||||||||||||
24,000,000 | 24,000,000 | 24,000,000 | |||||||||||||||||
Techniplas, LLC | Automotive | Senior Secured First Lien Note 10.000%(9) | 5/1/2020 | 6,000,000 | 6,000,000 | 5,218,500 | 0.7% | ||||||||||||
6,000,000 | 6,000,000 | 5,218,500 | |||||||||||||||||
The Garretson Resolution Group, Inc. | Services: Business | Senior Secured First Lien Term Loan LIBOR + 6.500%, 1.000% Floor(3) | 5/22/2021 | 9,625,000 | 9,587,577 | 9,663,115 | 1.2% | ||||||||||||
9,625,000 | 9,587,577 | 9,663,115 | |||||||||||||||||
Touchtunes Interactive Networks, Inc. | Media: Diversified & Production | Senior Secured Second Lien Term Loan LIBOR + 8.250%, 1.000% Floor(3) | 5/27/2022 | 7,500,000 | 7,500,000 | 7,519,800 | 1.0% | ||||||||||||
7,500,000 | 7,500,000 | 7,519,800 | |||||||||||||||||
Transocean Phoenix 2 Ltd. | Energy: Oil & Gas | Senior Secured First Lien Note 7.750%(4) (9) (13) | 10/15/2024 | 7,500,000 | 7,387,506 | 7,919,325 | 1.0% | ||||||||||||
7,500,000 | 7,387,506 | 7,919,325 | |||||||||||||||||
TravelCLICK, Inc.(11) | Hotel, Gaming & Leisure | Senior Secured Second Lien Term Loan LIBOR + 7.750%, 1.000% Floor(3) | 11/6/2021 | 6,000,000 | 5,935,400 | 5,899,740 | 0.8% | ||||||||||||
6,000,000 | 5,935,400 | 5,899,740 | |||||||||||||||||
Truco Enterprises, LP | Beverage & Food | Senior Secured First Lien Term Loan 8.240% Fixed(4) (8) | 4/26/2021 | 9,949,580 | 9,949,580 | 9,949,580 | 1.3% | ||||||||||||
9,949,580 | 9,949,580 | 9,949,580 | |||||||||||||||||
True Religion Apparel, Inc. | Retail | Senior Secured Second Lien Term Loan LIBOR + 10.000%, 1.000% Floor(3) | 1/30/2020 | 4,000,000 | 3,899,083 | — | 0.0% | ||||||||||||
4,000,000 | 3,899,083 | — | |||||||||||||||||
U.S. Auto Sales, Inc. | Banking, Finance, Insurance & Real Estate | Senior Secured Second Lien Term Loan LIBOR + 11.750%, 1.000% Floor(4) (8) (17) | 6/5/2020 | 5,500,000 | 5,500,000 | 5,452,095 | 0.7% | ||||||||||||
5,500,000 | 5,500,000 | 5,452,095 | |||||||||||||||||
U.S. Well Services, LLC | Energy: Oil & Gas | Warrants (7) | — | 173 | — | 0.0% | |||||||||||||
F- 12
Company(1) | Industry | Type of Investment | Maturity | Par Amount | Cost | Fair Value | % of Net Assets(2) | ||||||||||||
— | 173 | — | |||||||||||||||||
Valence Surface Technologies, Inc. | Aerospace & Defense | Senior Secured First Lien Term Loan LIBOR + 5.500%, 1.000% Floor(4) (8) | 6/13/2019 | 3,499,128 | 3,486,054 | 3,388,590 | 0.4% | ||||||||||||
3,499,128 | 3,486,054 | 3,388,590 | |||||||||||||||||
Velocity Pooling Vehicle, LLC | Automotive | Senior Secured Second Lien Term Loan LIBOR + 7.250%, 1.000% Floor(3) (4) | 5/13/2022 | 20,625,000 | 18,591,706 | 10,996,425 | 1.4% | ||||||||||||
20,625,000 | 18,591,706 | 10,996,425 | |||||||||||||||||
Verso Corporation | Media: Advertising, Printing & Publishing | Common Stock (7) (15) | — | 2,238,108 | 1,262,666 | 0.2% | |||||||||||||
— | 2,238,108 | 1,262,666 | |||||||||||||||||
VOYA CLO 2016-2, LTD. | Multi-Sector Holdings | Subordinated Note 16.185% effective yield(6) (9) (10) | 7/19/2028 | 22,842,661 | 19,918,800 | 20,551,542 | 2.7% | ||||||||||||
22,842,661 | 19,918,800 | 20,551,542 | |||||||||||||||||
Watermill-QMC Midco, Inc. | Automotive | Partnership Interest (4) (6) (7) | — | 850,136 | 1,102,626 | 0.1% | |||||||||||||
— | 850,136 | 1,102,626 | |||||||||||||||||
Z Gallerie, LLC | Retail | Senior Secured First Lien Term Loan LIBOR + 6.500%, 1.000% Floor(4) (8) | 10/8/2020 | 4,682,646 | 4,645,211 | 4,682,647 | 0.6% | ||||||||||||
4,682,646 | 4,645,211 | 4,682,647 | |||||||||||||||||
Total non-controlled/non-affiliated investments | $ | 921,626,572 | $ | 885,400,856 | 114.5% | ||||||||||||||
Controlled/affiliated investments – 9.5%(16) | |||||||||||||||||||
Capstone Nutrition | Healthcare & Pharmaceuticals | Senior Secured First Lien Term Loan LIBOR + 12.500%, 1.000% Floor, PIK(4) (8) (12) | 4/28/2019 | 25,327,876 | 22,770,855 | 16,246,819 | 2.1% | ||||||||||||
Common Stock (4) (7) | — | 300,002 | — | 0.0% | |||||||||||||||
Common Stock, Class B (4) (7) | — | 9 | — | 0.0% | |||||||||||||||
Common Stock, Class C (4) (7) | — | — | — | 0.0% | |||||||||||||||
25,327,876 | 23,070,866 | 16,246,819 | |||||||||||||||||
MCM Capital Office Park Holdings LLC | Banking, Finance, Insurance & Real Estate | Equity (6) (7) | — | 7,500,000 | 7,500,000 | 1.0% | |||||||||||||
— | 7,500,000 | 7,500,000 | |||||||||||||||||
Nomida LLC | Construction & Building | Equity (6) (7) | — | 5,400,000 | 5,400,000 | 0.7% | |||||||||||||
Senior Secured First Lien Term Loan 10.000%(6) | 12/1/2020 | 8,100,000 | 8,100,000 | 8,100,000 | 1.0% | ||||||||||||||
8,100,000 | 13,500,000 | 13,500,000 | |||||||||||||||||
Sierra Senior Loan Strategy JV I LLC(5)(6) | Multi-Sector Holdings | Equity | 60,785,000 | 60,785,000 | 60,496,647 | 7.8% | |||||||||||||
60,785,000 | 60,785,000 | 60,496,647 | |||||||||||||||||
Total controlled/affiliated investments | $ | 104,855,866 | $ | 97,743,466 | 12.6% | ||||||||||||||
Money market fund – 3.0% | |||||||||||||||||||
Federated Institutional Prime Obligations Fund(15) | Money Market 0.49% | 22,966,981 | 22,966,981 | 22,966,981 | 3.0% | ||||||||||||||
Total money market fund | $ | 22,966,981 | $ | 22,966,981 | 3.0% | ||||||||||||||
Derivative Instrument - Long Exposure | Notional Amount | Unrealized Appreciation (Depreciation) | |||||||||||||||||
Total return swap with Citibank, N.A. (Note 5) | Total Return Swap | 227,513,679 | (13,647,330) | ||||||||||||||||
$ | 227,513,679 | $ | (13,647,330 | ) | |||||||||||||||
___________________________________
F- 13
(1) | All of the Company's investments are domiciled in the United States except for Atrium Innovations, Inc. and Livingston International, Inc., which are domiciled in Canada. |
(2) | Percentage is based on net assets of $773,113,087 as of December 31, 2016. |
(3) | The interest rate on these loans is subject to a base rate plus 3 Month “3M” LIBOR, which at December 31, 2016 was 1.00%. As the interest rate is subject to a minimum LIBOR floor which was greater than the 3M LIBOR rate at December 31, 2016, the prevailing rate in effect at December 31, 2016 was the base rate plus the LIBOR floor. |
(4) | An affiliated Company that is managed by an affiliate of SIC Advisors LLC also holds an investment in this security. |
(5) | The investment has an unfunded commitment as of December 31, 2016. For further details (see Note 11). Fair value includes an analysis of the unfunded commitment. |
(6) | The investment is not a qualifying asset under Section 55 of the Investment Company Act of 1940 (the "1940 Act"), as amended. Non-qualifying assets represent 22.4% of the Company's portfolio at fair value. |
(7) | Security is non-income producing. |
(8) | The interest rate on these loans is subject to a base rate plus 1 Month "1M" LIBOR, which at December 31, 2016 was 0.77%. As the interest rate is subject to a minimum LIBOR floor which was greater than the 1M LIBOR rate at December 31, 2016, the prevailing rate in effect at December 31, 2016 was the base rate plus the LIBOR floor. |
(9) | Securities are exempt from registration under Rule 144A of the Securities Act of 1933. These securities represent a fair value of $113,438,688 or 14.7% of net assets as of December 31, 2016 and are considered restricted. |
(10) | This investment is in the equity class of a collateralized loan obligation ("CLO") security. The CLO equity investments are entitled to recurring distributions which are generally equal to the excess cash flow generated from the underlying investments after payment of the contractual payments to debt holders and fund expenses. The current estimated yield is based on the current projections of this excess cash flow taking into account assumptions which have been made regarding expected prepayments, losses and future reinvestment rates. These assumptions are periodically reviewed and adjusted. Ultimately, the actual yield may be higher or lower than the estimated yield if actual results differ from those used for the assumptions. |
(11) | Security is also held in the underlying portfolio of the total return swap with Citibank, N.A. (see Note 5) or the Sierra Senior Loan Strategy JV I LLC portfolio (see Note 3). The Company's total exposure to Astro AB Borrower, APCO Holdings, Inc., Inc., Asurion LLC, ConvergeOne Holdings Corp., Genex Holdings, Inc., Isola USA Corp., Livingston International, Inc., Preferred Sands Holding Company, LLC, Press Ganey Holdings, and TravelCLICK, Inc. is $7,020,932 or 0.9%, 9,123,869 or 1.2%, $8,082,500 or 1.0%, $14,962,500 or 1.9%, $12,427,662 or 1.6%, $8,708,549 or 1.1%, $4,502,200 or 0.6%, $6,199,301 or 0.8%, $15,930,005 or 2.1%, and $10,585,217 or 1.4%, respectively, of Net Assets as of December 31, 2016. |
(12) | The investment was on non-accrual status as of December 31, 2016. |
(13) | Represents securities in Level 2 in the ASC 820 table (see Note 4). |
(14) | The interest rate on these loans is subject to a base rate plus 6 month "6M" LIBOR, which at December 31, 2016 was 1.32%. As the interest rate is subject to a minimum LIBOR floor which was greater than the 6M LIBOR rate at December 31, 2016, the prevailing rate in effect at December 31, 2016 was the base rate plus the LIBOR floor. |
(15) | Represents securities in Level 1 in the ASC 820 table (see Note 4). |
(16) | Control Investments are defined by the Investment Company Act of 1940 ("1940 Act") as investments in companies in which the Company owns more than 25% of the voting securities or maintains greater than 50% of the board representation. |
(17) | A portion of this investment was sold via a participation agreement |
See accompanying notes to consolidated financial statements.
F- 14
Sierra Income Corporation
Consolidated Schedule of Investments
As of December 31, 2015
Company(1) | Industry | Type of Investment | Maturity | Par Amount | Cost | Fair Value | % of Net Assets(2) | ||||||||||||||
Non-controlled/non-affiliated investments – 127.5% | |||||||||||||||||||||
AAR Intermediate Holdings, LLC | Energy: Oil & Gas | Senior Secured First Lien Term Loans LIBOR + 14.000%, 1.000% Floor(3)(4)(5) | 3/30/2019 | $ | 11,622,797 | $ | 11,082,071 | $ | 6,241,367 | 0.9 | % | ||||||||||
Warrants to purchase 0.625% of outstanding company equity(4)(6) | 3/30/2019 | — | 790,778 | — | — | % | |||||||||||||||
11,622,797 | 11,872,849 | 6,241,367 | |||||||||||||||||||
Access Media Holding LLC | Media: Broadcasting & Subscription | Common Stock(4)(6) | — | — | — | — | % | ||||||||||||||
Preferred Equity 12.000%(4) | 1,432,412 | 1,432,413 | 500,893 | 0.1 | % | ||||||||||||||||
Senior Secured First Lien Term Loans 5.000%, 5.000% PIK(4) | 7/22/2020 | 6,678,501 | 6,678,501 | 6,678,501 | 1.0 | % | |||||||||||||||
8,110,913 | 8,110,914 | 7,179,394 | |||||||||||||||||||
Advanced Diagnostic Holdings LLC | Healthcare & Pharmaceuticals | Senior Secured First Lien Term Loans LIBOR + 8.750%, 0.875% Floor(3)(4) | 12/11/2020 | 15,554,250 | 15,554,250 | 15,554,250 | 2.3 | % | |||||||||||||
15,554,250 | 15,554,250 | 15,554,250 | |||||||||||||||||||
AESC Holding Corp., Inc. | Retail | Senior Secured Second Lien Term Loans LIBOR + 9.000%, 1.000% Floor(3)(4) | 5/27/2019 | 7,000,000 | 7,000,000 | 7,000,000 | 1.0 | % | |||||||||||||
7,000,000 | 7,000,000 | 7,000,000 | |||||||||||||||||||
Alpha Media LLC | Media: Broadcasting & Subscription | Senior Secured First Lien Term Loans LIBOR + 6.500%, 1.000% Floor(8)(9) | 4/30/2021 | 9,179,127 | 9,179,127 | 9,179,127 | 1.4 | % | |||||||||||||
9,179,127 | 9,179,127 | 9,179,127 | |||||||||||||||||||
American Beacon Advisors, Inc.(10) | Banking, Finance, Insurance & Real Estate | Senior Secured Second Lien Term Loans LIBOR + 8.750%, 1.000% Floor(9) | 4/30/2023 | 6,000,000 | 5,886,884 | 5,937,982 | 0.9 | % | |||||||||||||
6,000,000 | 5,886,884 | 5,937,982 | |||||||||||||||||||
Anaren, Inc. | Aerospace & Defense | Senior Secured Second Lien Term Loans LIBOR + 8.250%, 1.000% Floor(9) | 8/18/2021 | 10,000,000 | 9,918,443 | 9,642,999 | 1.4 | % | |||||||||||||
10,000,000 | 9,918,443 | 9,642,999 | |||||||||||||||||||
Aperture Group, LLC | Banking, Finance, Insurance & Real Estate | Senior Secured First Lien Term Loans LIBOR + 6.250%, 1.000% Floor(3) | 8/29/2019 | 2,431,439 | 2,422,081 | 2,431,439 | 0.4 | % | |||||||||||||
2,431,439 | 2,422,081 | 2,431,439 | |||||||||||||||||||
Associated Asphalt Partners, LLC | Chemicals, Plastics & Rubber | Senior Secured First Lien Notes 8.500%(7)(11) | 2/15/2018 | 1,778,000 | 1,785,989 | 1,786,890 | 0.3 | % | |||||||||||||
1,778,000 | 1,785,989 | 1,786,890 | |||||||||||||||||||
Asurion, LLC(10) | Banking, Finance, Insurance & Real Estate | Senior Secured Second Lien Term Loans LIBOR + 7.500%, 1.000% Floor(9) | 3/3/2021 | 7,000,000 | 6,942,069 | 6,100,440 | 0.9 | % | |||||||||||||
7,000,000 | 6,942,069 | 6,100,440 | |||||||||||||||||||
See accompanying notes to consolidated financial statements.
F- 15
Company(1) | Industry | Type of Investment | Maturity | Par Amount | Cost | Fair Value | % of Net Assets(2) | ||||||||||||||
Atrium Innovations, Inc.(12) | Healthcare & Pharmaceuticals | Senior Secured Second Lien Term Loans LIBOR + 6.750%, 1.000% Floor(9) | 8/13/2021 | $ | 5,000,000 | $ | 4,979,955 | $ | 4,256,250 | 0.6 | % | ||||||||||
5,000,000 | 4,979,955 | 4,256,250 | |||||||||||||||||||
Aviation Technical Services, Inc. | Aerospace & Defense | Senior Secured Second Lien Term Loans LIBOR + 8.500%, 1.000% Floor(3)(4) | 3/31/2022 | 22,500,000 | 22,500,000 | 22,500,000 | 3.3 | % | |||||||||||||
22,500,000 | 22,500,000 | 22,500,000 | |||||||||||||||||||
Backcountry.com, LLC | Retail | Senior Secured First Lien Term Loans LIBOR + 7.250%, 1.000% Floor(3)(4) | 6/30/2020 | 35,029,079 | 35,029,079 | 34,971,465 | 5.2 | % | |||||||||||||
35,029,079 | 35,029,079 | 34,971,465 | |||||||||||||||||||
Bennu Oil & Gas, LLC | Energy: Oil & Gas | Senior Secured Second Lien Term Loans LIBOR + 8.500%, 1.250% Floor, 2.500% PIK(9) | 11/1/2018 | 5,574,581 | 5,571,210 | 1,700,247 | 0.3 | % | |||||||||||||
5,574,581 | 5,571,210 | 1,700,247 | |||||||||||||||||||
Birch Communications, Inc. | Telecommunications | Senior Secured First Lien Term Loans LIBOR + 6.750%, 1.000% Floor(4)(9) | 7/18/2020 | 14,531,250 | 14,306,446 | 14,089,203 | 2.1 | % | |||||||||||||
14,531,250 | 14,306,446 | 14,089,203 | |||||||||||||||||||
Black Angus Steakhouses LLC | Hotel, Gaming & Leisure | Senior Secured First Lien Term Loans LIBOR + 9.000%, 1.000% Floor(3)(4)(8) | 4/24/2020 | 21,043,527 | 21,043,527 | 20,959,730 | 3.1 | % | |||||||||||||
21,043,527 | 21,043,527 | 20,959,730 | |||||||||||||||||||
Brundage-Bone Concrete Pumping, Inc. | Construction & Building | Senior Secured First Lien Notes 10.375%(7) | 9/1/2021 | 7,500,000 | 7,625,073 | 7,428,542 | 1.1 | % | |||||||||||||
7,500,000 | 7,625,073 | 7,428,542 | |||||||||||||||||||
Capstone Nutrition | Healthcare & Pharmaceuticals | Common Stock(4)(6) | — | 300,000 | — | — | % | ||||||||||||||
Common Stock, Class B(4)(6) | — | 9 | 9 | — | % | ||||||||||||||||
Common Stock, Class C(4)(6) | — | — | — | — | % | ||||||||||||||||
Senior Secured First Lien Term Loans LIBOR + 11.500%, 1.000% Floor, 1.000% PIK(4)(9) | 4/28/2019 | 18,702,625 | 18,702,625 | 13,839,943 | 2.1 | % | |||||||||||||||
18,702,625 | 19,002,634 | 13,839,952 | |||||||||||||||||||
Charming Charlie, Inc. | Retail | Senior Secured First Lien Term Loans LIBOR + 8.000%, 1.000% Floor(9) | 12/24/2019 | 8,855,113 | 8,870,568 | 8,323,648 | 1.2 | % | |||||||||||||
8,855,113 | 8,870,568 | 8,323,648 | |||||||||||||||||||
Collective Brands Finance, Inc.(10) | Retail | Senior Secured Second Lien Term Loans LIBOR + 7.500%, 1.000% Floor(9) | 3/11/2022 | 6,000,000 | 6,016,708 | 2,517,288 | 0.4 | % | |||||||||||||
6,000,000 | 6,016,708 | 2,517,288 | |||||||||||||||||||
ContMid Intermediate, Inc. | Automotive | Senior Secured Second Lien Term Loans LIBOR + 9.000%, 1.000% Floor(3)(4) | 10/25/2019 | 27,908,193 | 27,908,193 | 27,648,200 | 4.1 | % | |||||||||||||
27,908,193 | 27,908,193 | 27,648,200 | |||||||||||||||||||
See accompanying notes to consolidated financial statements.
F- 16
Company(1) | Industry | Type of Investment | Maturity | Par Amount | Cost | Fair Value | % of Net Assets(2) | ||||||||||||||
ConvergeOne Holdings Corp. | Telecommunications | Senior Secured Second Lien Term Loans LIBOR + 8.000%, 1.000% Floor(3)(4) | 6/17/2021 | $ | 12,500,000 | $ | 12,395,454 | $ | 12,109,427 | 1.8 | % | ||||||||||
12,500,000 | 12,395,454 | 12,109,427 | |||||||||||||||||||
Cornerstone Chemical Company | Chemicals, Plastics & Rubber | Senior Secured First Lien Notes 9.375%(7)(11) | 3/15/2018 | 2,500,000 | 2,562,636 | 2,253,125 | 0.3 | % | |||||||||||||
2,500,000 | 2,562,636 | 2,253,125 | |||||||||||||||||||
CP OpCo, LLC | Services: Consumer | Senior Secured First Lien Term Loans LIBOR + 6.750%, 1.000% Floor(4)(9) | 9/30/2020 | 3,000,000 | 3,000,000 | 3,000,000 | 0.4 | % | |||||||||||||
3,000,000 | 3,000,000 | 3,000,000 | |||||||||||||||||||
CRGT, Inc. | High Tech Industries | Senior Secured First Lien Term Loans LIBOR + 6.500%, 1.000% Floor(4)(9) | 12/19/2020 | 4,813,291 | 4,813,291 | 4,791,015 | 0.7 | % | |||||||||||||
4,813,291 | 4,813,291 | 4,791,015 | |||||||||||||||||||
DHISCO Electronic Distribution, Inc. | Hotel, Gaming & Leisure | Senior Secured First Lien Term Loans LIBOR + 9.000% PIK, 1.500% Floor(3)(4) | 2/10/2018 | 4,030,023 | 4,030,023 | 4,022,550 | 0.6 | % | |||||||||||||
Senior Secured First Lien Term Loans LIBOR + 9.000%, 1.500% Floor(3)(4) 8) | 11/10/2019 | 19,523,810 | 19,523,810 | 19,569,138 | 2.9 | % | |||||||||||||||
Warrants to purchase 4.2% of the outstanding equity(4) 6) | 2/10/2018 | — | 769,231 | 1,640,082 | 0.2 | % | |||||||||||||||
23,553,833 | 24,323,064 | 25,231,770 | |||||||||||||||||||
Drew Marine Partners, LP | Transportation: Cargo | Senior Secured Second Lien Term Loans LIBOR + 7.000%, 1.000% Floor(9) | 5/19/2021 | 10,000,000 | 10,066,712 | 9,539,857 | 1.4 | % | |||||||||||||
10,000,000 | 10,066,712 | 9,539,857 | |||||||||||||||||||
Dynamic Energy Services International LLC | Energy: Oil & Gas | Senior Secured First Lien Term Loans LIBOR + 8.500%, 1.000% Floor(4)(13) | 3/6/2018 | 9,125,000 | 9,125,000 | 8,841,760 | 1.3 | % | |||||||||||||
9,125,000 | 9,125,000 | 8,841,760 | |||||||||||||||||||
EarthLink, Inc.(12) | Telecommunications | Senior Secured First Lien Notes 7.375%(7)(11) | 6/1/2020 | 2,450,000 | 2,440,823 | 2,495,937 | 0.4 | % | |||||||||||||
2,450,000 | 2,440,823 | 2,495,937 | |||||||||||||||||||
First Boston Construction Holdings, LLC | Banking, Finance, | Preferred Equity(4)(6) | — | 878,907 | 878,907 | 0.1 | % | ||||||||||||||
Insurance & Real Estate | Senior Secured First Lien Notes 12.000%(4)(8) | 12/31/2020 | 3,515,625 | 3,515,625 | 3,515,629 | 0.5 | % | ||||||||||||||
3,515,625 | 4,394,532 | 4,394,536 | |||||||||||||||||||
FKI Security Group LLC | Capital Equipment | Senior Secured First Lien Term Loans LIBOR + 8.500%, 1.000% Floor(3)(4) | 3/30/2020 | 14,812,500 | 14,812,500 | 14,479,785 | 2.1 | % | |||||||||||||
14,812,500 | 14,812,500 | 14,479,785 | |||||||||||||||||||
Frontier Communications Corp.(12) | Telecommunications | Senior Secured First Lien Notes 10.250%(7)(11) | 9/15/2022 | 2,000,000 | 2,000,000 | 1,992,500 | 0.3 | % | |||||||||||||
2,000,000 | 2,000,000 | 1,992,500 | |||||||||||||||||||
See accompanying notes to consolidated financial statements.
F- 17
Company(1) | Industry | Type of Investment | Maturity | Par Amount | Cost | Fair Value | % of Net Assets(2) | ||||||||||||||
Gastar Exploration USA, Inc. | Energy: Oil & Gas | Senior Secured First Lien Notes 8.625%(7)(11) | 5/15/2018 | $ | 5,400,000 | $ | 5,409,861 | $ | 2,828,250 | 0.4 | % | ||||||||||
5,400,000 | 5,409,861 | 2,828,250 | |||||||||||||||||||
Genex Holdings, Inc.(10) | Banking, Finance, Insurance & Real Estate | Senior Secured Second Lien Term Loans LIBOR + 7.750%, 1.000% Floor(9) | 5/30/2022 | 9,500,000 | 9,528,566 | 9,269,729 | 1.4 | % | |||||||||||||
9,500,000 | 9,528,566 | 9,269,729 | |||||||||||||||||||
GK Holdings, Inc. | Services: Business | Senior Secured Second Lien Term Loans LIBOR + 9.500%, 1.000% Floor(3) | 1/20/2022 | 10,000,000 | 10,000,000 | 9,505,351 | 1.4 | % | |||||||||||||
10,000,000 | 10,000,000 | 9,505,351 | |||||||||||||||||||
Green Field Energy Services, Inc. | Energy: Oil & Gas | Senior Secured First Lien Notes 13.000%(4)(5)(7) | 11/15/2016 | 766,616 | 754,768 | 157,156 | — | % | |||||||||||||
Warrants/Equity(4)(6) | — | 29,000 | — | — | % | ||||||||||||||||
766,616 | 783,768 | 157,156 | |||||||||||||||||||
GTCR Valor Companies, Inc. | High Tech Industries | Senior Secured First Lien Term Loans LIBOR + 5.000%, 1.000% Floor(9) | 5/30/2021 | 2,913,869 | 2,889,196 | 2,893,847 | 0.4 | % | |||||||||||||
Senior Secured Second Lien Term Loans LIBOR + 8.500%, 1.000% Floor(9) | 11/30/2021 | 4,000,000 | 3,965,863 | 3,876,807 | 0.6 | % | |||||||||||||||
6,913,869 | 6,855,059 | 6,770,654 | |||||||||||||||||||
HBC Holdings, LLC | Wholesale | Senior Secured First Lien Term Loans LIBOR + 5.750%, 1.000% Floor(4)(9) | 3/30/2020 | 14,812,500 | 14,812,500 | 14,025,813 | 2.1 | % | |||||||||||||
14,812,500 | 14,812,500 | 14,025,813 | |||||||||||||||||||
Heligear Acquisition Co. | Aerospace & Defense | Senior Secured First Lien Notes 10.250%(4)(7) | 10/15/2019 | 15,000,000 | 15,000,000 | 15,209,164 | 2.3 | % | |||||||||||||
15,000,000 | 15,000,000 | 15,209,164 | |||||||||||||||||||
Hill International, Inc.(12) | Construction & Building | Senior Secured First Lien Term Loans LIBOR + 6.750%, 1.000% Floor(4)(9) | 9/26/2020 | 16,787,500 | 16,787,500 | 16,524,481 | 2.5 | % | |||||||||||||
16,787,500 | 16,787,500 | 16,524,481 | |||||||||||||||||||
Holland Acquisition Corp. | Energy: Oil & Gas | Senior Secured First Lien Term Loans LIBOR + 9.000%, 1.000% Floor(9) | 5/29/2018 | 4,550,691 | 4,497,331 | 3,952,221 | 0.6 | % | |||||||||||||
4,550,691 | 4,497,331 | 3,952,221 | |||||||||||||||||||
Ignite Restaurant Group, Inc. | Hotel, Gaming & Leisure | Senior Secured First Lien Term Loans LIBOR + 7.000%, 1.000% Floor(9) | 2/13/2019 | 9,310,973 | 9,204,898 | 9,192,804 | 1.4 | % | |||||||||||||
9,310,973 | 9,204,898 | 9,192,804 | |||||||||||||||||||
IHS Intermediate, Inc. | Services: Business | Senior Secured Second Lien Term Loans LIBOR + 8.250%, 1.000% Floor(9) | 7/20/2022 | 25,000,000 | 25,000,000 | 25,000,000 | 3.7 | % | |||||||||||||
25,000,000 | 25,000,000 | 25,000,000 | |||||||||||||||||||
Interface Security Systems, Inc. | Services: Consumer | Senior Secured First Lien Notes 9.250%(7)(11) | 1/15/2018 | 3,417,000 | 3,449,657 | 3,348,660 | 0.5 | % | |||||||||||||
3,417,000 | 3,449,657 | 3,348,660 | |||||||||||||||||||
See accompanying notes to consolidated financial statements.
F- 18
Company(1) | Industry | Type of Investment | Maturity | Par Amount | Cost | Fair Value | % of Net Assets(2) | ||||||||||||||
Invision Diversified, LLC | Services: Business | Senior Secured First Lien Term Loans LIBOR + 8.500%, 1.000% Floor(3)(4) | 6/30/2020 | $ | 24,875,000 | $ | 24,875,000 | $ | 24,658,836 | 3.7 | % | ||||||||||
24,875,000 | 24,875,000 | 24,658,836 | |||||||||||||||||||
IPS Corporation | Wholesale | Senior Secured First Lien Term Loans LIBOR + 6.250%, 1.000% Floor(14) | 2/5/2021 | 9,875,139 | 9,875,139 | 9,527,050 | 1.4 | % | |||||||||||||
9,875,139 | 9,875,139 | 9,527,050 | |||||||||||||||||||
IronGate Energy Services, LLC | Energy: Oil & Gas | Senior Secured First Lien Notes 11.000%(7) | 7/1/2018 | 3,000,000 | 2,968,199 | 1,639,824 | 0.2 | % | |||||||||||||
3,000,000 | 2,968,199 | 1,639,824 | |||||||||||||||||||
Isola USA Corp.(10) | High Tech Industries | Senior Secured First Lien Term Loans LIBOR + 8.250%, 1.000% Floor(9) | 11/29/2018 | 5,723,899 | 5,815,211 | 5,046,729 | 0.7 | % | |||||||||||||
5,723,899 | 5,815,211 | 5,046,729 | |||||||||||||||||||
JAC Holding Corp. | Automotive | Senior Secured First Lien Notes 11.500%(4)(7) | 10/1/2019 | 12,000,000 | 12,000,000 | 12,182,259 | 1.8 | % | |||||||||||||
12,000,000 | 12,000,000 | 12,182,259 | |||||||||||||||||||
Jordan Reses Supply Company, LLC | Healthcare & Pharmaceuticals | Senior Secured Second Lien Term Loans LIBOR + 11.000%, 1.000% Floor(3)(4) | 4/24/2020 | 5,000,000 | 5,000,000 | 4,996,309 | 0.7 | % | |||||||||||||
5,000,000 | 5,000,000 | 4,996,309 | |||||||||||||||||||
Liquidnet Holdings, Inc. | Banking, Finance, Insurance & Real Estate | Senior Secured First Lien Term Loans LIBOR + 6.750%, 1.000% Floor(9) | 5/22/2019 | 6,475,000 | 6,404,231 | 6,266,994 | 0.9 | % | |||||||||||||
6,475,000 | 6,404,231 | 6,266,994 | |||||||||||||||||||
Livingston International, Inc.(10)(12) | Transportation: Cargo | Senior Secured Second Lien Term Loans LIBOR + 7.750%, 1.250% Floor(9) | 4/18/2020 | 2,658,504 | 2,654,864 | 2,453,765 | 0.4 | % | |||||||||||||
2,658,504 | 2,654,864 | 2,453,765 | |||||||||||||||||||
LTCG Holdings Corp. | Banking, Finance, Insurance & Real Estate | Senior Secured First Lien Term Loans LIBOR + 5.000%, 1.000% Floor(9) | 6/6/2020 | 2,838,571 | 2,827,577 | 2,635,361 | 0.4 | % | |||||||||||||
2,838,571 | 2,827,577 | 2,635,361 | |||||||||||||||||||
Miller Heiman, Inc. | Services: Business | Senior Secured First Lien Term Loans LIBOR + 5.750%, 1.000% Floor(9) | 9/30/2019 | 24,062,500 | 24,062,500 | 22,595,225 | 3.4 | % | |||||||||||||
24,062,500 | 24,062,500 | 22,595,225 | |||||||||||||||||||
Nathan’s Famous, Inc. | Beverage & Food | Senior Secured First Lien Notes 10.000% | 3/15/2020 | 7,000,000 | 7,000,000 | 7,344,926 | 1.1 | % | |||||||||||||
7,000,000 | 7,000,000 | 7,344,926 | |||||||||||||||||||
Nation Safe Drivers Holdings, Inc. | Banking, Finance, Insurance & Real Estate | Senior Secured Second Lien Term Loans LIBOR + 8.000%, 2.000% Floor(4)(9) | 9/29/2020 | 20,676,479 | 20,676,479 | 20,357,441 | 3.0 | % | |||||||||||||
20,676,479 | 20,676,479 | 20,357,441 | |||||||||||||||||||
New Media Holdings II, LLC | Media: Advertising, Printing & Publishing | Senior Secured First Lien Term Loans LIBOR + 6.250%, 1.000% Floor(9) | 6/4/2020 | 18,228,044 | 18,210,156 | 17,977,409 | 2.7 | % | |||||||||||||
18,228,044 | 18,210,156 | 17,977,409 | |||||||||||||||||||
See accompanying notes to consolidated financial statements.
F- 19
Company(1) | Industry | Type of Investment | Maturity | Par Amount | Cost | Fair Value | % of Net Assets(2) | ||||||||||||||
Newpage Corp. | Media: Advertising, Printing & Publishing | Senior Secured First Lien Term Loans LIBOR + 8.250%, 1.250% Floor(5)(9) | 2/11/2021 | $ | 9,750,000 | $ | 9,648,176 | $ | 3,503,868 | 0.5 | % | ||||||||||
9,750,000 | 9,648,176 | 3,503,868 | |||||||||||||||||||
Northern Lights MIDCO, LLC | Banking, Finance, Insurance & Real Estate | Senior Secured First Lien Term Loans LIBOR + 9.500%, 1.500% Floor(3)(4) | 11/21/2019 | 4,523,750 | 4,523,750 | 4,588,252 | 0.7 | % | |||||||||||||
4,523,750 | 4,523,750 | 4,588,252 | |||||||||||||||||||
Novetta Solutions LLC | High Tech Industries | Senior Secured Second Lien Term Loans LIBOR + 8.500%, 1.000% Floor(3) | 10/15/2023 | 11,000,000 | 10,892,695 | 10,890,000 | 1.6 | % | |||||||||||||
11,000,000 | 10,892,695 | 10,890,000 | |||||||||||||||||||
Omnitracs, Inc. | High Tech Industries | Senior Secured Second Lien Term Loans LIBOR + 7.750%, 1.000% Floor(9) | 5/25/2021 | 7,000,000 | 7,012,936 | 6,710,175 | 1.0 | % | |||||||||||||
7,000,000 | 7,012,936 | 6,710,175 | |||||||||||||||||||
Oxford Mining Company, LLC | Metals & Mining | Senior Secured First Lien Term Loans LIBOR + 8.500%, 0.750% Floor, 3.000% PIK(4)(9) | 12/31/2018 | 20,288,028 | 20,288,028 | 19,383,182 | 2.9 | % | |||||||||||||
20,288,028 | 20,288,028 | 19,383,182 | |||||||||||||||||||
Physiotherapy Corporation | Healthcare & Pharmaceuticals | Senior Secured First Lien Term Loans LIBOR + 4.750%, 1.000% Floor(9) | 6/4/2021 | 7,481,250 | 7,481,250 | 7,471,986 | 1.1 | % | |||||||||||||
7,481,250 | 7,481,250 | 7,471,986 | |||||||||||||||||||
Reddy Ice Corporation | Beverage & Food | Senior Secured Second Lien Term Loans LIBOR + 9.500%, 1.250% Floor(4)(9) | 11/1/2019 | 2,000,000 | 2,000,000 | 1,548,874 | 0.2 | % | |||||||||||||
2,000,000 | 2,000,000 | 1,548,874 | |||||||||||||||||||
Research Now Group, Inc. | Services: Business | Senior Secured Second Lien Term Loans LIBOR + 8.750%, 1.000% Floor(9) | 3/18/2022 | 15,000,000 | 15,000,000 | 14,283,218 | 2.1 | % | |||||||||||||
15,000,000 | 15,000,000 | 14,283,218 | |||||||||||||||||||
Response Team Holdings, LLC | Construction & Building | Preferred Equity 12% PIK(4) | 3/28/2019 | 3,430,847 | 3,173,440 | 3,267,264 | 0.5 | % | |||||||||||||
Senior Secured First Lien Term Loans LIBOR + 8.500%, 2.000% Floor, 1.000% PIK(3)(4) | 3/28/2019 | 16,161,908 | 16,161,908 | 16,298,673 | 2.4 | % | |||||||||||||||
Warrants to purchase 3.70% of the outstanding common units(4)(6) | — | 257,407 | 895,051 | 0.1 | % | ||||||||||||||||
19,592,755 | 19,592,755 | 20,460,988 | |||||||||||||||||||
School Specialty, Inc. | Wholesale | Senior Secured First Lien Term Loans LIBOR + 8.500%, 1.000% Floor(3) | 6/11/2019 | 10,087,334 | 10,035,592 | 9,943,063 | 1.5 | % | |||||||||||||
10,087,334 | 10,035,592 | 9,943,063 | |||||||||||||||||||
Ship Supply Acquisition Corporation | Services: Business | Senior Secured First Lien Term Loans LIBOR + 8.000%, 1.000% Floor(3)(4)(8) | 7/31/2020 | 24,687,500 | 24,687,500 | 24,687,499 | 3.7 | % | |||||||||||||
24,687,500 | 24,687,500 | 24,687,499 | |||||||||||||||||||
See accompanying notes to consolidated financial statements.
F- 20
Company(1) | Industry | Type of Investment | Maturity | Par Amount | Cost | Fair Value | % of Net Assets(2) | ||||||||||||||
Sizzling Platter, LLC | Hotel, Gaming & Leisure | Senior Secured First Lien Term Loans LIBOR + 7.500%, 1.000% Floor(9) | 4/28/2020 | $ | 15,000,000 | $ | 15,000,000 | $ | 14,865,921 | 2.2 | % | ||||||||||
15,000,000 | 15,000,000 | 14,865,921 | |||||||||||||||||||
Software Paradigms International Group, LLC | High Tech Industries | Senior Secured First Lien Term Loans LIBOR + 8.000%, 1.000% Floor(4)(8)(9) | 5/22/2020 | 32,098,298 | 32,098,298 | 32,044,613 | 4.8 | % | |||||||||||||
32,098,298 | 32,098,298 | 32,044,613 | |||||||||||||||||||
Southwest Dealer Services, Inc. | Automotive | Senior Secured First Lien Term Loans LIBOR + 6.000%, 1.000% Floor(3)(4) | 3/16/2020 | 2,677,738 | 2,677,738 | 2,635,463 | 0.4 | % | |||||||||||||
2,677,738 | 2,677,738 | 2,635,463 | |||||||||||||||||||
Survey Sampling International, LLC | Services: Business | Senior Secured Second Lien Term Loans LIBOR + 9.000%, 1.000% Floor(9) | 12/16/2021 | 24,000,000 | 24,000,000 | 22,978,470 | 3.4 | % | |||||||||||||
24,000,000 | 24,000,000 | 22,978,470 | |||||||||||||||||||
Techniplas LLC | Automotive | Senior Secured First Lien Notes 10.000%(7)(11) | 5/1/2020 | 6,000,000 | 6,000,000 | 4,290,000 | 0.6 | % | |||||||||||||
6,000,000 | 6,000,000 | 4,290,000 | |||||||||||||||||||
The Garretson Resolution Group, Inc. | Services: Business | Senior Secured First Lien Term Loans LIBOR + 6.500%, 1.000% Floor(3) | 5/22/2021 | 9,875,000 | 9,829,704 | 9,865,262 | 1.5 | % | |||||||||||||
9,875,000 | 9,829,704 | 9,865,262 | |||||||||||||||||||
TouchTunes Interactive Networks, Inc. | Media: Diversified & Production | Senior Secured Second Lien Term Loans LIBOR + 8.250%, 1.000% Floor(9) | 5/29/2022 | 7,500,000 | 7,500,000 | 7,222,625 | 1.1 | % | |||||||||||||
7,500,000 | 7,500,000 | 7,222,625 | |||||||||||||||||||
TravelCLICK, Inc.(10) | Hotel, Gaming & Leisure | Senior Secured Second Lien Term Loans LIBOR + 7.750%, 1.000% Floor(9) | 11/6/2021 | 6,000,000 | 5,924,246 | 5,663,438 | 0.8 | % | |||||||||||||
6,000,000 | 5,924,246 | 5,663,438 | |||||||||||||||||||
True Religion Apparel, Inc. | Retail | Senior Secured Second Lien Term Loans LIBOR + 10.000%, 1.000% Floor(13) | 1/30/2020 | 4,000,000 | 3,875,200 | 144,856 | — | % | |||||||||||||
4,000,000 | 3,875,200 | 144,856 | |||||||||||||||||||
U.S. Auto Sales Inc. | Banking, Finance, Insurance & Real Estate | Senior Secured Second Lien Term Loans LIBOR + 10.500%, 1.000% Floor(3)(4) | 6/8/2020 | 5,500,000 | 5,500,000 | 5,402,354 | 0.8 | % | |||||||||||||
5,500,000 | 5,500,000 | 5,402,354 | |||||||||||||||||||
U.S. Well Services, LLC | Energy: Oil & Gas | Warrants(6) | 2/21/2019 | — | 173 | — | — | % | |||||||||||||
— | 173 | — | |||||||||||||||||||
Valence Surface Technologies, Inc. | Aerospace & Defense | Senior Secured First Lien Term Loans LIBOR + 5.500%, 1.000% Floor(9) | 6/13/2019 | 4,682,801 | 4,658,352 | 4,516,541 | 0.7 | % | |||||||||||||
4,682,801 | 4,658,352 | 4,516,541 | |||||||||||||||||||
Velocity Pooling Vehicle, LLC | Automotive | Senior Secured Second Lien Term Loans LIBOR + 7.250%, 1.000% Floor(4)(9) | 5/14/2022 | 20,625,000 | 18,245,261 | 14,441,745 | 2.1 | % | |||||||||||||
20,625,000 | 18,245,261 | 14,441,745 | |||||||||||||||||||
See accompanying notes to consolidated financial statements.
F- 21
Company(1) | Industry | Type of Investment | Maturity | Par Amount | Cost | Fair Value | % of Net Assets(2) | ||||||||||||||
Vestcom International, Inc. | Services: Business | Senior Secured Second Lien Term Loans LIBOR + 7.750%, 1.000% Floor(13) | 9/30/2022 | $ | 5,000,000 | $ | 5,000,000 | $ | 4,947,615 | 0.7 | % | ||||||||||
5,000,000 | 5,000,000 | 4,947,615 | |||||||||||||||||||
Watermill-QMC Midco, Inc. | Automotive | Equity(4)(6) | — | 514,195 | 661,630 | 0.1 | % | ||||||||||||||
Senior Secured First Lien Term Loans 12.000%, 1.000% PIK(4) | 6/30/2020 | 26,657,799 | 26,657,799 | 26,683,851 | 4.0 | % | |||||||||||||||
26,657,799 | 27,171,994 | 27,345,481 | |||||||||||||||||||
YP LLC(10) | Media: Advertising, Printing & Publishing | Senior Secured First Lien Term Loans LIBOR + 6.750%, 1.250% Floor(9) | 6/4/2018 | 3,130,435 | 3,153,210 | 3,091,531 | 0.5 | % | |||||||||||||
3,130,435 | 3,153,210 | 3,091,531 | |||||||||||||||||||
Z Gallerie, LLC | Retail | Senior Secured First Lien Term Loans LIBOR + 6.500%, 1.000% Floor(13) | 10/8/2020 | 4,730,307 | 4,684,722 | 4,688,655 | 0.7 | % | |||||||||||||
4,730,307 | 4,684,722 | 4,688,655 | |||||||||||||||||||
Total non-controlled/non-affiliated investments | $ | 911,640,087 | $ | 859,500,211 | 127.5 | % | |||||||||||||||
Controlled/affiliated investments(15) – 7.1%(1)(2) | |||||||||||||||||||||
Nomida LLC | Construction & | Equity(6) | — | 5,400,000 | 5,400,000 | 0.8 | % | ||||||||||||||
Building | Senior Secured First Lien Term Loans 10.000% | 12/1/2020 | 8,100,000 | 8,100,000 | 8,100,042 | 1.2 | % | ||||||||||||||
8,100,000 | 13,500,000 | 13,500,042 | |||||||||||||||||||
Sierra Senior Loan Strategy JV I LLC | Multi-Sector Holdings | Equity | 34,272,500 | 34,272,500 | 34,362,191 | 5.1 | % | ||||||||||||||
34,272,500 | 34,272,500 | 34,362,191 | |||||||||||||||||||
Total controlled/affiliated investments | $ | 47,772,500 | $ | 47,862,233 | 7.1 | % | |||||||||||||||
Money market fund – 2.3% | |||||||||||||||||||||
Federated Prime Obligations Fund | Money Market 0.01% | $ | 15,456,069 | $ | 15,456,069 | $ | 15,456,069 | 2.3 | % | ||||||||||||
Total money market fund | $ | 15,456,069 | $ | 15,456,069 | 2.3 | % | |||||||||||||||
Derivative Instrument - Long Exposure | Notional Amount | Unrealized Appreciation (Depreciation) | |||||||||||||||||||
Total return swap with Citibank, N.A. (Note 5) | Total Return Swap | $ | 206,455,990 | $ | (27,365,819 | ) | |||||||||||||||
$ | 206,455,990 | $ | (27,365,819 | ) | |||||||||||||||||
See accompanying notes to consolidated financial statements.
F- 22
___________________________________
(1) | All of the Company’s investments are domiciled in the United States except for Atrium Innovations, Inc. and Livingston International, Inc. which are domiciled in Canada. |
(2) | Percentage is based on net assets of $674,124,099 as of December 31, 2015. |
(3) | The interest rate on these loans is subject to a base rate plus 1 Month (“1M”) LIBOR, which at December 31, 2015 was 0.43%. As the interest rate is subject to a minimum LIBOR floor which was greater than the 1M LIBOR rate at December 31, 2015, the prevailing rate in effect at December 31, 2015 was the base rate plus the LIBOR floor. |
(4) | An affiliated fund that is managed by an affiliate of SIC Advisors LLC also holds an investment in this security. |
(5) | The investment was on non-accrual status as of December 31, 2015. Security is non-income producing. |
(6) | Securities are exempt from registration under Rule 144A of the Securities Act of 1933. These securities represent a fair value of $55,612,309 and 14.8% of net assets as of December 31, 2015 and are considered restricted. |
(7) | The investment has an unfunded commitment as of December 31, 2015. For further details see Note 11. Fair value includes an analysis of the unfunded commitment. |
(8) | The interest rate on these loans is subject to a base rate plus 3 Month (“3M”) LIBOR, which at December 31, 2015 was 0.61%. As the interest rate is subject to a minimum LIBOR floor which was greater than the 3M LIBOR rate at December 31, 2015, the prevailing rate in effect at December 31, 2015 was the base rate plus the LIBOR floor. |
(9) | Security is also held in the underlying portfolio of the total return swap with Citibank, N.A. (see Note 5). The Company’s total exposure to American Beacon Advisors, Inc., Asurion, LLC, Collective Brands Finance, Inc., Genex Holdings, Inc., Isola USA Corp., Livingston International, Inc., TravelCLICK, Inc., and YP LLC is $6,930,495 or 1.0%, $10,824,121 or 1.6%, $8,405,126 or 1.2%, $12,227,341 or 1.8%, $8,814,354 or 1.3%, $4,423,208 or 0.7%, $15,382,512 or 2.3%, $6,245,444 or 0.9%, respectively, of Net Assets as of December 31, 2016. |
(10) | Represents securities in Level 2 in the ASC 820 table (see Note 4). |
(11) | The investment is not a qualifying asset under Section 55 of the Investment Company Act of 1940, as amended. Non-qualifying assets represent 4.1% of the Company’s portfolio at fair value. |
(12) | The interest rate on these loans is subject to a base rate plus 6 Month (“6M”) LIBOR, which at December 31, 2015 was 0.85%. As the interest rate is subject to a minimum LIBOR floor which was greater than the 6M LIBOR rate at December 31, 2015, the prevailing rate in effect at December 31, 2015 was the base rate plus the LIBOR floor. |
(13) | The interest rate on these loans is subject to a base rate plus 2 Month (“2M”) LIBOR, which at December 31, 2015 was 0.51%. As the interest rate is subject to a minimum LIBOR floor which was greater than the 2M LIBOR rate at December 31, 2015, the prevailing rate in effect at December 31, 2015 was the base rate plus the LIBOR floor. |
(14) | Control Investments are defined by the Investment Company Act of 1940 (“1940 Act”) as investments in companies in which the Company owns more than 25% of the voting securities or maintains greater than 50% of the board representation. |
See accompanying notes to consolidated financial statements.
F- 23
SIERRA INCOME CORPORATION
Notes to Consolidated Financial Statements
December 31, 2016
Note 1. Organization
Sierra Income Corporation (the “Company”) was incorporated under the general corporation laws of the State of Maryland on June 13, 2011 and formally commenced operations on April 17, 2012. The Company is an externally managed, non-diversified closed-end management investment company that has elected to be treated as a business development company (“BDC”) under the Investment Company Act of 1940 (the "1940 Act"). The Company is externally managed by SIC Advisors LLC (“SIC Advisors”), a registered investment adviser under the Investment Advisers Act of 1940, as amended (the “Advisers Act”). SIC Advisors is a majority owned subsidiary of Medley LLC, which is controlled by Medley Management Inc., a publicly traded asset management firm (NYSE: MDLY), which in turn is controlled by Medley Group LLC, an entity wholly-owned by the senior professionals of Medley LLC. The term “Medley” refers to the collective activities of Medley Capital LLC, Medley LLC, Medley Management Inc., Medley Group LLC, SIC Advisors, associated investment funds and their respective affiliates. The Company has elected and intends to continue to qualify to be treated for U.S. federal income tax purposes as a regulated investment company (“RIC”) under subchapter M of the Internal Revenue Code of 1986, as amended (the “Code”). The Company’s fiscal year-end is December 31st.
On April 17, 2012, the Company successfully reached its minimum escrow requirement and officially commenced operations by issuing 1,108,033 shares of common stock to SIC Advisors for gross proceeds of $10,000,000. The Company’s offering period is currently scheduled to terminate on April 17, 2018, unless further extended. As of December 31, 2016, the Company has sold a total of 94,666,418 shares of common stock, which includes shares issued as part of the distribution reinvestment plan (see Note 13), for total proceeds of $975 million, which includes the shares sold to SIC Advisors. The proceeds from the issuance of common stock are presented in the Company’s consolidated statements of changes in net assets and consolidated statements of cash flows and are presented net of selling commissions and dealer manager fees.
On August 15, 2013, the Company formed Arbor Funding LLC ("Arbor"), a wholly-owned financing subsidiary (see Note 5).
On June 18, 2014, the Company formed Alpine Funding LLC ("Alpine"), a wholly-owned financing subsidiary (see Note 6).
The Company has formed and expects to continue to form certain taxable subsidiaries (the “Taxable Subsidiaries”), which are taxed as corporations for U.S. federal income tax purposes. These Taxable Subsidiaries allow the Company to hold equity securities of portfolio companies organized as pass-through entities while continuing to satisfy the requirements of a RIC under the Code.
The Company’s investment objective is to generate current income, and to a lesser extent, long-term capital appreciation. The Company intends to meet its investment objective by investing primarily in the debt of privately owned U.S. companies with a focus on senior secured debt, second lien debt and, to a lesser extent, subordinated debt. The Company will originate transactions sourced through SIC Advisors’ direct origination network, and also expects to acquire debt securities through the secondary market. The Company may make equity investments in companies that it believes will generate appropriate risk adjusted returns, although it does not expect such investments to be a substantial portion of the portfolio.
Note 2. Significant Accounting Policies
Basis of Presentation
The Company follows the accounting and reporting guidance in the Financial Accounting Standards Board Accounting Standards Codification ("ASC") Topic 946 - Financial Services, Investment Companies ("ASC 946"). The accompanying consolidated financial statements have been prepared on the accrual basis of accounting in conformity with U.S. generally accepted accounting principles (“GAAP”) and includes the accounts of the Company and its wholly-owned subsidiaries, Alpine, Arbor, and the Taxable Subsidiaries. All intercompany balances and transactions have been eliminated in consolidation. All references made to the “Company,” “we,” and “us” herein include Sierra Income Corporation and its consolidated subsidiaries, except as stated otherwise.
Additionally, the accompanying consolidated financial statements of the Company and related financial information have been prepared pursuant to the requirements for reporting on Form 10-K and Article 6 of Regulation S-X. In the opinion of management, the audited financial results included herein contain all adjustments and reclassifications, which are of a normal recurring nature, that are necessary for the fair presentation of financial statements for the periods included herein.
Cash and Cash Equivalents
The Company considers cash equivalents to be highly liquid investments or investments with original maturities of three months or less. Cash and cash equivalents include deposits in a money market account. The Company deposits its cash in major United States financial institutions which, at times, may be in excess of the Federal Deposit Insurance Corporation insurance limits.
F- 24
Offering Costs
Offering costs incurred directly by the Company are expensed in the period incurred. See Note 7 regarding offering costs paid for by SIC Advisors and any related reimbursements by the Company.
Use of Estimates in the Preparation of Financial Statements
The preparation of financial statements in conformity with GAAP requires management to make estimates and assumptions that affect the reported amounts of assets and liabilities, and disclosure of contingent assets and liabilities at the date of the financial statements and the reported amounts of revenues and expenses during the reporting period. Actual results could differ from those estimates
Deferred Financing Costs
Financing costs, incurred in connection with the Company’s credit facilities (see Note 6), are deferred and amortized over the life of each facility, respectively.
Indemnification
In the normal course of business, the Company enters into contractual agreements that provide general indemnifications against losses, costs, claims and liabilities arising from the performance of individual obligations under such agreements. The Company has had no claims or payments pursuant to such agreements. The Company’s individual maximum exposure under these arrangements is unknown, as this would involve future claims that may be made against the Company that have not yet occurred. However, based on management’s experience, the Company expects the risk of loss to be remote.
Revenue Recognition
Interest income, adjusted for amortization of premiums and accretion of discounts, is recorded on an accrual basis. The Company records amortized or accreted discounts or premiums as interest income using the effective interest method. Dividend income, which represents dividends from equity investments and distributions from subsidiaries, if any, is recognized on an accrual basis to the extent that the Company expects to collect such amount.
Fee income associated with investments in portfolio companies are recognized as income in the period that the Company becomes entitled to such fees. Other fees related to loan administration requirements are capitalized as deferred revenue and recorded into income over the respective period.
Prepayment penalties received by the Company for debt instruments paid back to the Company prior to the maturity date are recorded as income upon receipt.
The Company holds debt investments that contain a payment-in-kind (“PIK”) interest provision. PIK interest, which represents contractually deferred interest added to the investment balance that is generally due at maturity, is recorded on the accrual basis to the extent such amounts are expected to be collected. PIK interest is not accrued if the Company does not expect the issuer to be able to pay all principal and interest when due. For the years ended December 31, 2016, 2015 and 2014 the Company earned $3,230,135, $2,973,290 and $382,780 in PIK interest, respectively.
Investment transactions are accounted for on a trade-date basis. Realized gains or losses on investments are measured by the difference between the net proceeds from the disposition and the amortized cost basis of investment, without regard to unrealized gains or losses previously recognized. During the years ended December 31, 2016 and 2015, the Company recognized $15,548,224 and $0 in realized losses related to certain non-cash restructuring transactions, which is recorded on the consolidated statements of operations as a component of net realized gain/(loss) from non-controlled/non-affiliated investments. The Company reports changes in fair value of investments that are measured at fair value as a component of the net change in unrealized appreciation/(depreciation) on investments in the consolidated statements of operations. For total return swap transactions (see Note 5), periodic payments are received or made at the end of each settlement period, but prior to settlement are recorded as realized gains or losses on total return swap in the consolidated statements of operations.
Management reviews all loans that become 90 days or more past due on principal and interest or when there is reasonable doubt that principal or interest will be collected for possible placement on management's designation of non-accrual status. Accrued interest is generally reserved when a loan is placed on non-accrual status. Interest payments received on non-accrual loans may be recognized as income or applied to principal depending upon management’s judgment regarding collectability. Non-accrual loans are restored to accrual status when past due principal and interest is paid and, in management’s judgment, are likely to remain current, although the Company may make exceptions to this general rule if the loan has sufficient collateral value and is in the process of collection. As of December 31, 2016, seven portfolio investments were on non-accrual status with a cost of $57,135,673 and a fair value of $35,022,807 or 3.56% of the fair value of the Company's portfolio. As of December 31, 2015, three portfolio investments
F- 25
were on non-accrual status with a cost of $21,485,015 and a fair value of $9,902,391 or 1.09% of the fair value of the Company's portfolio.
Interest income from investments in the “equity” class of a CLO security (typically subordinated notes) is recorded based upon an estimation of an effective yield to expected maturity utilizing assumed cash flows in accordance with ASC 325-40, Beneficial Interests in Securitized Financial Assets. The Company monitors the expected cash flows from these investments, including the expected residual payments, and the effective yield is determined and updated periodically.
Investment Classification
The Company classifies its investments in accordance with the requirements of the 1940 Act. Under the 1940 Act, the Company would be deemed to “control” a portfolio company if it owns more than 25% of its outstanding voting securities and/or had the power to exercise control over the management or policies of such portfolio company. The Company refers to such investments in portfolio companies that it “controls” as “Controlled Investments.” Under the 1940 Act, the Company would be deemed to be an “Affiliated Person” of a portfolio company if it owns at least 5%, but no more than 25%, of the portfolio company’s outstanding voting securities or if it is under common control with such portfolio company. The Company refers to such investments in Affiliated Persons as “Affiliated Investments.”
Valuation of Investments
The Company applies fair value accounting to all of its financial instruments in accordance with the 1940 Act and ASC Topic 820 - Fair Value Measurements and Disclosures (“ASC 820”). ASC 820 defines fair value, establishes a framework used to measure fair value and requires disclosures for fair value measurements. In accordance with ASC 820, the Company has categorized its financial instruments carried at fair value, based on the priority of the valuation technique, into a three-level fair value hierarchy as discussed in Note 4. Fair value is a market-based measure considered from the perspective of the market participant who holds the financial instrument rather than an entity specific measure. Therefore, when market assumptions are not readily available, the Company’s own assumptions are set to reflect those that management believes market participants would use in pricing the financial instrument at the measurement date.
Investments for which market quotations are readily available are valued at such market quotations, which are generally obtained from an independent pricing service or multiple broker-dealers or market makers. The Company weighs the use of third-party broker quotations, if any, in determining fair value based on management's understanding of the level of actual transactions used by the broker to develop the quote and whether the quote was an indicative price or binding offer. However, debt investments with remaining maturities within 60 days that are not credit impaired are valued at cost plus accreted discount, or minus amortized premium, which approximates fair value. Investments for which market quotations are not readily available are valued at fair value as determined by the Company’s board of directors based upon input from management and third party valuation firms. Because these investments are illiquid and because there may not be any directly comparable companies whose financial instruments have observable market values, these loans are valued using a fundamental valuation methodology, consistent with traditional asset pricing standards, that is objective and consistently applied across all loans and through time.
Investments in investment companies are valued at fair value. Fair values are generally determined utilizing the net asset value ("NAV") supplied by, or on behalf of, management of each investment company, which is net of management and incentive fees or allocations charged by the investment company and is in accordance with the "practical expedient", as defined by ASC 820. NAVs received by, or on behalf of, management of each investment company are based on the fair value of the investment company's underlying investments in accordance with policies established by management of each investment company, as described in each of their financial statements and offering memorandum.
The methodologies utilized by the Company in estimating its fair value of its investments categorized as Level 3 generally fall into the following two categories:
• | The “Market Approach” uses prices and other relevant information generated by market transactions involving identical or comparable assets, liabilities, or a group of assets and liabilities, such as a business. |
• | The “Income Approach” converts future amounts (for example, cash flows or income and expenses) to a single current (that is, discounted) amount. When the Income Approach is used, the fair value measurement reflects current market expectations about those future amounts. |
The Company uses third-party valuation firms to assist the board of directors in the valuation of its portfolio investments. The valuation reports generated by the third-party valuation firms consider the evaluation of financing and sale transactions with third parties, expected cash flows and market based information, including comparable transactions, performance multiples, and movement in yields of debt instruments, among other factors. Based on market data obtained from the third-party valuation firms, the Company uses a combined market yield analysis and an enterprise model of valuation. In applying the market yield analysis, the value of the
F- 26
Company’s loans is determined based upon inputs such as the coupon rate, current market yield, interest rate spreads of similar securities, the stated value of the loan, and the length to maturity. In applying the enterprise model, the Company uses a waterfall analysis which takes into account the specific capital structure of the borrower and the related seniority of the instruments within the borrower’s capital structure into consideration. To estimate the enterprise value of the portfolio company, the Company weighs some or all of the traditional market valuation methods and factors based on the individual circumstances of the portfolio company in order to estimate the enterprise value. The methodologies for performing investments may be based on, among other things: valuations of comparable public companies, recent sales of private and public comparable companies, discounting the forecasted cash flows of the portfolio company, third party valuations of the portfolio company, considering offers from third parties to buy the company, estimating the value to potential strategic buyers and considering the value of recent investments in the equity securities of the portfolio company. For non-performing investments, the Company may estimate the liquidation or collateral value of the portfolio company’s assets and liabilities using an expected recovery model. The Company may estimate the fair value of warrants based on a model such as the Black-Scholes model or simulation models or a combination thereof.
The methodologies and information that the Company utilizes when applying the Market Approach for performing investments includes, among other things:
• | valuations of comparable public companies (“Guideline Comparable Approach”); |
• | recent sales of private and public comparable companies (“Guideline Comparable Approach”); |
• | recent acquisition prices of the company, debt securities or equity securities (“Acquisition Price Approach”); |
• | external valuations of the portfolio company, offers from third parties to buy the company (“Estimated Sales Proceeds Approach”); |
• | subsequent sales made by the company of its investments (“Expected Sales Proceeds Approach”); and |
• | estimating the value to potential buyers. |
The methodologies and information that the Company utilizes when applying the Income Approach for performing investments includes:
• | discounting the forecasted cash flows of the portfolio company or securities (“Discounted Cash Flow” or “DCF” Approach”); and |
• | Black-Scholes model or simulation models or a combination thereof (Income Approach – Option Model) with respect to the valuation of warrants. |
Over-the-counter derivative contracts, such as total return swaps (see Note 5) are fair valued using models that measure the change in fair value of reference assets underlying the swaps offset against any fees payable to the swap counterparty. The fair values of the reference assets underlying the swaps are determined using similar methods as described above for debt and equity investments where the Company also invests directly in such assets
The Company undertakes a multi-step valuation process each quarter when valuing investments for which market quotations are not readily available, as described below:
• | the Company’s quarterly valuation process begins with each portfolio investment being initially valued by the valuation professionals; |
• | conclusions are then documented and discussed with senior management; and |
• | an independent valuation firm engaged by the Company’s board of directors prepares an independent valuation report for approximately one-third of the portfolio investments each quarter on a rotating quarterly basis on non-fiscal year-end quarters, such that each of these investments will be valued by an independent valuation firm at least twice per annum when combined with the fiscal year-end review of all the investments by independent valuation firms. |
In addition, all of the Company’s investments are subject to the following valuation process:
• | management reviews preliminary valuations and its own independent assessment; |
• | the independent audit committee of the Company’s board of directors reviews the preliminary valuations of senior management and independent valuation firms; and |
• | the Company’s board of directors discusses valuations and determines the fair value of each investment in the Company’s portfolio in good faith based on the input of SIC Advisors, the respective independent valuation firms and the audit committee. |
F- 27
The Company’s investments in subordinated notes are carried at fair value, which is based on a discounted cash flow model. The discounted cash flow model models both the underlying collateral (“assets”) and the liabilities of the collateralized loan obligation (“CLO”) capital structure. The discounted cash flow model uses a set of assumptions including projected default rates, recovery rates, reinvestment rates and prepayment rates in order to arrive at estimated cash flows of the assets. The discounted cash flow model distributes the asset cash flows to the liability structure based on the payment priorities and discounts them back using appropriate market discount rates based on discount rates for comparable CLOs. The assumptions are based on available market data as well as management estimates. Additional data is used to validate the results from the discounted cash flow method, such as analysis of relevant data observed in the CLO market, review of quotes, where available, recent acquisitions and observable transactions in the subordinated notes, among other factors.
Due to the inherent uncertainty of determining the fair value of investments that do not have a readily available market value, the fair value of the Company’s investments may differ significantly from the values that would have been used had a readily available market value existed for such investments, and the differences could be material.
Fair Value of Financial Instruments
The carrying amounts of certain of the Company’s financial instruments, including cash and accounts payable and accrued expenses, approximate fair value due to their short-term nature. The carrying amounts and fair values of the Company’s long-term obligations are discussed in Note 4.
U.S. Federal Income Taxes
The Company has elected to be treated as a RIC under subchapter M of the Code and operate in a manner so as to qualify for the tax treatment applicable to RICs. In order to qualify as a RIC, among other things, the Company is required to meet certain source of income and asset diversification requirements and timely distribute to its stockholders at least 90% of the sum of its investment company taxable income ("ICTI") including PIK, as defined by the Code, and net tax-exempt interest income (which is the excess of the Company’s gross tax-exempt interest income over certain disallowed deductions) for each taxable year in order to be eligible for tax treatment under subchapter M of the Code. Depending on the level of ICTI earned in a tax year, the Company may choose to carry forward ICTI in excess of current year dividend distributions into the next tax year. Any such carryover ICTI must be distributed before the end of that next tax year through a dividend declared prior to filing the final tax return related to the year which generated such ICTI.
The Company will be subject to a nondeductible U.S. federal excise tax of 4% on undistributed income if it does not distribute at least 98% of its ordinary income in any calendar year and 98.2% of its capital gain net income for each one-year period ending on October 31 of such calendar year. To the extent the Company determines that its estimated current year annual taxable income will be in excess of estimated current year dividend distributions for U.S. federal excise tax purposes, the Company accrues U.S. federal excise tax, if any, on estimated excess taxable income as taxable income is earned.
The Company’s Taxable Subsidiaries accrue income taxes payable based on the applicable corporate rates on the unrealized gains generated by the investments held by the Taxable Subsidiaries. As of December 31, 2016 and 2015, the Company recorded a deferred tax liability of $244,622 and $298,827, respectively, on the consolidated statements of assets and liabilities. The change in deferred tax liabilities is included as a component of net gain/(loss) on investments and total return swap on investments in the consolidated statements of operations.
ICTI generally differs from net investment income for financial reporting purposes due to temporary and permanent differences in the recognition of income and expenses. The Company may be required to recognize ICTI in certain circumstances in which it does not receive cash. For example, if the Company holds debt obligations that are treated under applicable tax rules as having original issue discount, the Company must include in ICTI each year a portion of the original issue discount that accrues over the life of the obligation, regardless of whether cash representing such income is received by the Company in the same taxable year. The Company may also have to include in ICTI other amounts that it has not yet received in cash, such as 1) PIK interest income and 2) interest income from investments that have been classified as non-accrual for financial reporting purposes. Interest income on non-accrual investments is not recognized for financial reporting purposes, but generally is recognized in ICTI. Because any original issue discount or other amounts accrued will be included in the Company’s ICTI for the year of accrual, the Company may be required to make a distribution to its stockholders in order to satisfy the minimum distribution requirements, even though the Company will not have received and may not ever receive any corresponding cash amount. ICTI also excludes net unrealized appreciation or depreciation, as investment gains or losses are not included in taxable income until they are realized.
Although the Company files federal and state tax returns, the Company's major tax jurisdiction is the United States federal jurisdiction. The Company’s federal tax returns from inception-to-date remain subject to examination by the Internal Revenue Service.
The Company accounts for income taxes in conformity with ASC Topic 740 - Income Taxes (“ASC 740”). ASC 740 provides guidelines for how uncertain tax positions should be recognized, measured, presented and disclosed in financial statements. ASC
F- 28
740 requires the evaluation of tax positions taken or expected to be taken in the course of preparing the Company’s tax returns to determine whether the tax positions are “more-likely-than-not” to be sustained by the applicable tax authority. Tax positions deemed to meet the “more-likely-than-not” threshold would be recorded as a tax benefit or expense in the current period. The Company recognizes interest and penalties, if any, related to unrecognized tax benefits as income tax expense in the consolidated statements of operations. There were no interest or penalties due to material uncertain income tax positions at December 31, 2016, 2015 and 2014.
Permanent differences between ICTI and net investment income for financial reporting purposes are reclassified among capital accounts in the financial statements to reflect their tax character. Differences in classification may also result from the treatment of short-term gains as ordinary income for tax purposes. During the years ended December 31, 2016, 2015 and 2014, the Company reclassified for book purposes amounts arising from permanent book/tax differences related to the different tax treatment of realized gain/(loss) on swaps, defaulted bonds, partnership basis adjustments and certain fee income as follows:
As of December 31, 2016 | As of December 31, 2015 | As of December 31, 2014 | |||||||||
Capital in excess of par value | $ | — | $ | — | $ | 6,728 | |||||
Accumulated undistributed net investment income (loss) | 7,210,862 | 5,462,354 | 5,771,555 | ||||||||
Accumulated net realized gain (loss) from investments | (7,210,862 | ) | (5,462,354 | ) | (5,778,283 | ) | |||||
The following table reflects, for U.S. federal income tax purposes, the sources of the cash distributions that the Company has paid on its common stock during the years ended December 31, 2016, 2015 and 2014:
2016 | 2015 | 2014 | ||||||||||||||||||
Source of Distribution | Distribution Amount | Percentage | Distribution Amount | Percentage | Distribution Amount | Percentage | ||||||||||||||
Ordinary income | $68,596,940 | 100.0 | % | $40,302,852 | 70.9 | % | $20,880,983 | 72.5 | % | |||||||||||
Net realized gain | — | — | 441,052 | 0.8 | 1,192,159 | 4.2 | ||||||||||||||
Return of capital (other) | — | — | 16,060,726 | 28.3 | 6,719,353 | 23.3 | ||||||||||||||
Distributions on a tax basis: | $ | 68,596,940 | 100.0 | % | $ | 56,804,630 | 100.0 | % | $ | 28,792,495 | 100.0 | % | ||||||||
For U.S. federal income tax purposes, the cost of investments owned as of December 31, 2016, 2015 and 2014 was $1,026,556,117, $954,019,208 and $615,465,538, respectively. For the year ended December 31, 2016, gross unrealized appreciation and depreciation for U.S. federal income tax purposes were $10,295,224 and $53,707,019, respectively, resulting in net unrealized depreciation of $43,411,795. For the year ended December 31, 2015, gross unrealized appreciation and depreciation for U.S. federal income tax purposes were $3,009,097 and $49,665,861, respectively, resulting in net unrealized depreciation of $46,656,764. For the year ended December 31, 2014, gross unrealized appreciation and depreciation for U.S. federal income tax purposes were $2,524,081 and $1,074,526, respectively, resulting in net unrealized appreciation of $1,449,555.
The following table shows the components of distributable earnings on a tax basis detailed below differ from the amounts reflected in the Company’s consolidated statements of assets and liabilities by temporary and other book/tax differences, primarily relating to the tax treatment of defaulted bonds, unamortized upfront fees, partnership basis adjustments, dividend income reversal, outstanding loan fees and swap mark to market as of December 31, 2016, 2015 and 2014:
2016 | 2015 | 2014 | |||||||||
Ordinary income | $ | 5,591,260 | $ | — | $ | — | |||||
Other temporary differences | (1,281 | ) | (1,798 | ) | (2,315 | ) | |||||
Post October loss deferrals | — | (11,580,851 | ) | (9,376,397 | ) | ||||||
Short term capital loss carryover | (1,509,069 | ) | — | — | |||||||
Long term capital loss carryover | (18,198,466 | ) | |||||||||
Unrealized appreciation (depreciation) | (43,602,229 | ) | (46,868,991 | ) | 1,783,789 | ||||||
Components of tax distributable earnings at year end | $ | (57,719,785 | ) | $ | (58,451,640 | ) | $ | (7,594,923 | ) | ||
Segments
The Company invests in various industries. The Company separately evaluates the performance of each of its investment relationships. However, because each of these investment relationships has similar business and economic characteristics, they have
F- 29
been aggregated into a single investment segment. All applicable segment disclosures are included in or can be derived from the Company’s consolidated financial statements. See Note 3.
Company Investment Risk, Concentration of Credit Risk, and Liquidity Risk
SIC Advisors has broad discretion in making investments for the Company. Investments generally consist of debt instruments that may be affected by business, financial market or legal uncertainties. Prices of investments may be volatile, and a variety of factors that are inherently difficult to predict, such as domestic or international economic and political developments, may significantly affect the results of the Company’s activities and the value of its investments. In addition, the value of the Company’s portfolio may fluctuate as the general level of interest rates fluctuates.
The value of the Company’s investments in loans and bonds may be detrimentally affected to the extent, among other things, that a borrower defaults on its obligations, there is insufficient collateral and/or there are extensive legal and other costs incurred in collecting on a defaulted loan, observable secondary or primary market yields for similar instruments issued by comparable companies increase materially or risk premiums required in the market between smaller companies, such as the Company’s borrowers, and those for which market yields are observable, increase materially.
The Company’s assets may, at any time, include securities and other financial instruments or obligations that are illiquid or thinly traded, making purchase or sale of such securities and financial instruments at desired prices or in desired quantities difficult. Furthermore, the sale of any such investments may be possible only at substantial discounts, and it may be extremely difficult to value any such investments accurately.
Recent Accounting Pronouncements
In May 2014, the FASB issued ASU 2014-09, Revenue from Contracts with Customers (Topic 606), which provides that an entity should recognize revenue to depict the transfer of promised goods or services to customers in an amount that reflects the consideration to which the entity expects to be entitled in exchange for such goods or services. To achieve this core principle, an entity should apply the following steps: (1) identify the contracts with a customer, (2) identify the performance obligations in the contracts, (3) determine the transaction prices, (4) allocate the transaction prices to the performance obligations in the contracts, and (5) recognize revenue when, or as, the entity satisfies a performance obligation. The guidance also requires advanced disclosures regarding the nature, amount, timing and uncertainty of revenue and cash flows arising from an entity's contracts with customers.
In March 2016, the FASB issued ASU 2016-08, Revenue from Contracts with Customers (Topic 606): Principal versus Agent Considerations (Reporting Revenue Gross versus Net), which clarified the implementation guidance on principal versus agent considerations. In April 2016, the FASB issued ASU 2016-10, Revenue from Contracts with Customers (Topic 606): Identifying Performance Obligations and Licensing, which clarified the implementation guidance regarding performance obligations and licensing arrangements. The new standard will become effective for the Company on January 1, 2018, with early application permitted to the effective date of January 1, 2017. The Company is evaluating the effect that ASU 2014-09 will have on its consolidated financial statements and related disclosures. The Company has not yet selected a transition method nor has it determined the effect of the standard on its ongoing financial reporting.
F- 30
Note 3. Investments
The following table summarizes the amortized cost and the fair value of the Company’s portfolio investments as of December 31, 2016:
Amortized Cost | Percentage | Fair Value | Percentage | ||||||||||
Senior secured first lien term loans | $ | 515,753,491 | 50.2 | % | $ | 493,340,277 | 50.2 | % | |||||
Senior secured second lien term loans | 275,915,932 | 26.9 | 260,008,735 | 26.4 | |||||||||
Senior secured first lien notes | 72,767,547 | 7.1 | 71,970,598 | 7.3 | |||||||||
Subordinated notes | 53,041,209 | 5.2 | 55,185,590 | 5.6 | |||||||||
Sierra Senior Loan Strategy JV I LLC | 60,785,000 | 5.9 | 60,496,647 | 6.2 | |||||||||
Warrants/Equity | 48,219,259 | 4.7 | 42,142,475 | 4.3 | |||||||||
Total | $ | 1,026,482,438 | 100.0 | % | $ | 983,144,322 | 100.0 | % | |||||
The following table summarizes the amortized cost and the fair value of the Company’s portfolio investments as of December 31, 2015:
Amortized Cost | Percentage | Fair Value | Percentage | ||||||||||
Senior secured first lien term loans | $ | 538,120,165 | 56.1 | % | $ | 514,638,093 | 56.7 | % | |||||
Senior secured second lien term loans | 300,961,738 | 31.4 | 278,645,462 | 30.7 | |||||||||
Senior secured first lien notes | 72,512,631 | 7.5 | 66,472,862 | 7.3 | |||||||||
Sierra Senior Loan Strategy JV I LLC | 34,272,500 | 3.6 | 34,362,191 | 3.8 | |||||||||
Warrants/Equity | 13,545,553 | 1.4 | 13,243,836 | 1.5 | |||||||||
Total | $ | 959,412,587 | 100.0 | % | $ | 907,362,444 | 100.0 | % | |||||
F- 31
The following table shows the composition of the Company’s portfolio investments by industry classification at fair value at December 31, 2016:
Amortized Cost | Percentage | Fair Value | Percentage | ||||||||||
Services: Business | $ | 159,797,762 | 15.6 | % | $ | 149,451,149 | 15.2 | % | |||||
Multi-Sector Holdings | 128,326,209 | 12.5 | 130,182,237 | 13.3 | |||||||||
Banking, Finance, Insurance & Real Estate | 72,588,294 | 7.1 | 72,938,844 | 7.4 | |||||||||
Aerospace & Defense | 68,415,721 | 6.7 | 70,126,640 | 7.1 | |||||||||
Hotel, Gaming & Leisure | 71,197,643 | 6.9 | 69,640,838 | 7.1 | |||||||||
Healthcare & Pharmaceuticals | 75,853,228 | 7.4 | 69,382,894 | 7.1 | |||||||||
Retail | 71,315,882 | 6.9 | 61,292,231 | 6.2 | |||||||||
Construction & Building | 59,905,702 | 5.8 | 58,267,425 | 5.9 | |||||||||
Telecommunications | 37,511,289 | 3.7 | 37,580,414 | 3.8 | |||||||||
Energy: Oil & Gas | 38,245,386 | 3.7 | 33,048,939 | 3.4 | |||||||||
Transportation: Cargo | 28,797,584 | 2.8 | 28,493,057 | 2.9 | |||||||||
High Tech Industries | 26,733,476 | 2.6 | 25,888,925 | 2.6 | |||||||||
Automotive | 32,217,128 | 3.1 | 24,222,630 | 2.5 | |||||||||
Wholesale | 22,332,170 | 2.2 | 21,660,294 | 2.2 | |||||||||
Metals & Mining | 20,756,842 | 2.0 | 20,518,139 | 2.1 | |||||||||
Media: Advertising, Printing & Publishing | 20,267,753 | 2.0 | 19,306,587 | 2.0 | |||||||||
Beverage & Food | 18,949,580 | 1.8 | 19,282,080 | 2.0 | |||||||||
Media: Broadcasting & Subscription | 18,085,575 | 1.8 | 15,830,498 | 1.6 | |||||||||
Media: Diversified & Production | 15,247,000 | 1.5 | 15,733,786 | 1.6 | |||||||||
Chemicals, Plastics & Rubber | 15,515,124 | 1.5 | 15,726,190 | 1.6 | |||||||||
Capital Equipment | 11,937,500 | 1.2 | 12,088,629 | 1.2 | |||||||||
Transportation: Consumer | 7,280,374 | 0.7 | 7,280,374 | 0.7 | |||||||||
Services: Consumer | 5,205,216 | 0.5 | 5,201,522 | 0.5 | |||||||||
Total | $ | 1,026,482,438 | 100.0 | % | $ | 983,144,322 | 100.0 | % | |||||
F- 32
The following table shows the composition of the Company’s portfolio investments by industry classification at fair value at December 31, 2015:
Amortized Cost | Percentage | Fair Value | Percentage | ||||||||||
Services: Business | $ | 162,454,704 | 16.9 | % | $ | 158,521,476 | 17.5 | % | |||||
Automotive | 94,003,186 | 9.8 | 88,543,148 | 9.8 | |||||||||
Hotel, Gaming & Leisure | 75,495,735 | 7.9 | 75,913,663 | 8.4 | |||||||||
Banking, Finance, Insurance & Real Estate | 69,106,169 | 7.2 | 67,384,528 | 7.4 | |||||||||
High Tech Industries | 67,487,490 | 7.0 | 66,253,186 | 7.3 | |||||||||
Construction & Building | 57,505,328 | 6.0 | 57,914,053 | 6.4 | |||||||||
Retail | 65,476,277 | 6.8 | 57,645,912 | 6.3 | |||||||||
Aerospace & Defense | 52,076,795 | 5.4 | 51,868,704 | 5.7 | |||||||||
Healthcare & Pharmaceuticals | 52,018,089 | 5.4 | 46,118,747 | 5.1 | |||||||||
Multi-Sector Holdings | 34,272,500 | 3.6 | 34,362,191 | 3.8 | |||||||||
Wholesale | 34,723,231 | 3.6 | 33,495,926 | 3.7 | |||||||||
Telecommunications | 31,142,723 | 3.3 | 30,687,067 | 3.4 | |||||||||
Energy: Oil & Gas | 40,228,391 | 4.2 | 25,360,825 | 2.8 | |||||||||
Media: Advertising, Printing & Publishing | 31,011,542 | 3.2 | 24,572,808 | 2.7 | |||||||||
Metals & Mining | 20,288,028 | 2.1 | 19,383,182 | 2.1 | |||||||||
Media: Broadcasting & Subscription | 17,290,041 | 1.8 | 16,358,521 | 1.8 | |||||||||
Capital Equipment | 14,812,500 | 1.6 | 14,479,785 | 1.6 | |||||||||
Transportation: Cargo | 12,721,576 | 1.3 | 11,993,622 | 1.3 | |||||||||
Beverage & Food | 9,000,000 | 0.9 | 8,893,800 | 1.0 | |||||||||
Media: Diversified & Production | 7,500,000 | 0.8 | 7,222,625 | 0.8 | |||||||||
Services: Consumer | 6,449,657 | 0.7 | 6,348,660 | 0.7 | |||||||||
Chemicals, Plastics & Rubber | 4,348,625 | 0.5 | 4,040,015 | 0.4 | |||||||||
Total | $ | 959,412,587 | 100.0 | % | $ | 907,362,444 | 100.0 | % | |||||
See Note 5 for industry classifications of the underlying TRS reference assets as of December 31, 2016 and 2015.
The following table shows the composition of the Company’s portfolio investments by geography classification at fair value as of December 31, 2016:
Geography | Fair Value | Percentage | ||||
United States | $ | 975,611,565 | 99.2 | % | ||
Canada | 7,532,757 | 0.8 | ||||
Total | $ | 983,144,322 | 100.0 | % | ||
The following table shows the composition of the Company’s portfolio investments by geography classification at fair value as of December 31, 2015:
Geography | Fair Value | Percentage | ||||
United States | $ | 900,652,429 | 99.3 | % | ||
Canada | 6,710,015 | 0.7 | ||||
Total | $ | 907,362,444 | 100.0 | % | ||
F- 33
Transactions With Affiliated Companies
During the year ended December 31, 2016, the Company had investments in portfolio companies designated as controlled/affiliated investments under the 1940 Act. Transactions with controlled/affiliated investments were as follows:
Name of Investment | Fair Value at December 31, 2015 | Purchases/ (Sales) of Investments In Affiliates | Transfers In/(Out) of Investments In Affiliates | Net change in unrealized appreciation/ (depreciation) | Realized Gain/(Loss) | Fair Value at December 31, 2016 | Income Earned | ||||||||||||||||||||
Controlled/affiliated Investments | |||||||||||||||||||||||||||
Capstone Nutrition | $ | — | $ | 4,068,230 | $ | 13,839,952 | $ | (1,661,363 | ) | — | $ | 16,246,819 | $ | — | |||||||||||||
MCM Capital Office Park Holdings LLC | — | 7,500,000 | — | — | — | 7,500,000 | — | ||||||||||||||||||||
Nomida LLC(1) | 13,500,042 | — | — | (42 | ) | — | 13,500,000 | 823,500 | |||||||||||||||||||
Sierra Senior Loan Strategy JV I LLC(2) | 34,362,191 | 26,512,500 | — | (378,044 | ) | — | 60,496,647 | 4,733,750 | |||||||||||||||||||
Total | $ | 47,862,233 | $ | 38,080,730 | $ | 13,839,952 | $ | (2,039,449 | ) | $ | — | $ | 97,743,466 | $ | 5,557,250 | ||||||||||||
_______________________________
(1) | Nomida is a non-public real estate investment formed by the Company to purchase and develop a residential property. The Company is the sole equity shareholder of Nomida and has provided 100% of the debt financing to the entity. The Company acts as Nomida’s sole member responsible for Nomida’s daily operations. In addition, the Chief Financial Officer and Secretary of the Company also serves as President of Nomida. The assets of Nomida are comprised of a residential development property in the city of Chicago, IL and the proceeds of the loan from the Company; the liabilities of Nomida consist of the loan payable to the Company. Nomida is currently in the process of completing a development plan for the property and interviewing a property management company to assist with the construction of the project. |
(2) | The Company and GALIC are the members of Sierra JV, a joint venture formed as a Delaware limited liability company that is not consolidated by either member for financial reporting purposes. The members of Sierra JV make capital contributions as investments by Sierra JV are completed, and all portfolio and other material decisions regarding Sierra JV must be submitted to Sierra JV’s board of managers, which is comprised of an equal number of members appointed by each of the Company and GALIC. Approval of Sierra JV’s board of managers requires the unanimous approval of a quorum of the board of managers, with a quorum consisting of equal representation of members appointed by each of the Company and GALIC. Because management of Sierra JV is shared equally between the Company and GALIC, the Company does not have operational control over the Sierra JV for purposes of the 1940 Act or otherwise. |
Purchases/(sales) of investments in controlled affiliates are included in the purchases and sales presented on the consolidated statements of cash flows for the year ended December 31, 2016. Transfers in/(out) of affiliates represents the fair value for the month an investment became or was removed as an affiliated investment. Income received from controlled affiliates is included in total investment income on the consolidated statements of operations for the year ended December 31, 2016.
During the year ended December 31, 2015, the Company had investments in portfolio companies designated as controlled/affiliated investments under the 1940 Act. Transactions with controlled/affiliated investments were as follows:
Name of Investment | Fair Value at December 31, 2014 | Purchases (Sales) of/Advances (Distributions) to Affiliates | Transfers In/(Out) of Affiliates | Net change in unrealized appreciation/ (depreciation) | Realized Gain/(Loss) | Fair Value at December 31, 2015 | Income Earned | ||||||||||||||||||||
Controlled/affiliated Investments | |||||||||||||||||||||||||||
Nomida LLC, Equity(1) | $ | — | $ | 5,400,000 | $ | — | $ | — | $ | — | $ | 5,400,000 | $ | — | |||||||||||||
Nomida LLC, Senior secured first lien term loan(1) | — | 8,100,000 | — | 42 | — | 8,100,042 | 101,250 | ||||||||||||||||||||
Sierra Senior Loan Strategy JV I LLC(2) | — | 34,272,500 | — | 89,691 | — | 34,362,191 | — | ||||||||||||||||||||
Total | $ | — | $ | 47,772,500 | $ | — | $ | 89,733 | $ | — | $ | 47,862,233 | $ | 101,250 | |||||||||||||
_______________________________
(1) | Nomida LLC (“Nomida”) is a non-public real estate investment formed by the Company to purchase and develop a residential property. The Company is the sole equity shareholder of Nomida and has provided 100% of the debt financing to the entity. The Company acts as Nomida’s sole member responsible for Nomida’s daily operations. In addition, the Chief Financial Officer and Secretary of the Company also serves as President of Nomida. The assets of Nomida are comprised of a residential development property in the city of Chicago, IL and the proceeds of the loan from the Company; the liabilities of Nomida consist of the loan payable to the Company. Nomida is currently in the process of completing a development plan for the property and interviewing a property management company to assist with the construction of the project. |
F- 34
(2) | The Company and Great American Life Insurance Company (“GALIC”) are the members of Sierra Senior Loan Strategy JV I LLC (“Sierra JV”), a joint venture formed as a Delaware limited liability company that is not consolidated by either member for financial reporting purposes. The members of Sierra JV make capital contributions as investments by Sierra JV are completed, and all portfolio and other material decisions regarding Sierra JV must be submitted to Sierra JV’s board of managers, which is comprised of an equal number of members appointed by each of the Company and GALIC. Approval of Sierra JV’s board of managers requires the unanimous approval of a quorum of the board of managers, with a quorum consisting of equal representation of members appointed by each of the Company and GALIC. Because management of Sierra JV is shared equally between the Company and GALIC, the Company does not have operational control over the Sierra JV for purposes of the 1940 Act or otherwise. |
In connection with certain of the Company’s investments, the Company receives warrants which are obtained for the objective of increasing the total investment returns and are not held for hedging purposes. For the years ended December 31, 2016 and 2015, the total fair value of warrants were $669,709 and $2,535,133, respectively, and were included in investments at fair value on the consolidated statements of assets and liabilities. Total realized and change in unrealized gains (losses) related to warrants for the years ended December 31, 2016 and 2015 were $(2,535,133) and $0, respectively and were recorded on the consolidated statements of operations in those accounts. The warrants are received in connection with individual investments and are not subject to master netting arrangements.
As of December 31, 2016 the Company held loans it has made directly to 71 investee companies with aggregate principal amounts of $885.4 million. As of December 31, 2015, the Company held loans it has made directly to 66 investee companies with aggregate principal amounts of $835.8 million. During the years ended December 31, 2016 and 2015, the Company made 59 and 34 loans to investee companies, respectively, with aggregate principal amounts of $339.3 million and $493.9 million, respectively. The details of the Company’s loans have been disclosed on the consolidated schedule of investments as well as in Note 4.
In addition to the loans that the Company has provided, the Company has unfunded commitments to provide additional financings through undrawn term loans or revolving lines of credit. The details of such arrangements are disclosed in Note 11.
Sierra Senior Loan Strategy JV I LLC
On March 27, 2015, the Company and GALIC entered into a limited liability company operating agreement to co-manage Sierra JV. All portfolio and other material decisions regarding Sierra JV must be submitted to Sierra JV's board of managers, which is comprised of four members, two of whom are selected by the Company and the other two are selected by GALIC. The Company has concluded that it does not operationally control Sierra JV. As the Company does not operationally control Sierra JV, it does not consolidate the operations of Sierra JV within the consolidated financial statements. As a practical expedient, the Company uses NAV to determine the fair value of its investment in Sierra JV; therefore, this investment has been presented as a reconciling item within the fair value hierarchy (see Note 4).
As of December 31, 2016 and 2015, Sierra JV had total capital commitments of $100 million with the Company providing $87.5 million and GALIC providing $12.5 million. Approximately $69.5 million and $39.2 million was funded as of December 31, 2016 and December 31, 2015 relating to these commitments, of which $60.9 million and $34.3 million were from the Company, respectively. The Company does not have the right to withdraw any of their respective capital commitment, unless in connection with a transfer of its membership interests. The Company may transfer full membership interests as long as it is approved by all members and transferred in a transaction exempt from the registration requirements of the Securities Act of 1933, as amended, or applicable state securities laws.
On August 4, 2015, Sierra JV entered into a senior secured revolving credit facility (the “JV Facility”) led by Credit Suisse, AG with commitments of $100 million subject to certain leverage and borrowing base restrictions. On December 29, 2015, the JV Facility was amended and the total commitments were increased to $135 million. The JV Facility will bear interest at a rate of LIBOR (with no minimum) + 2.50% per annum. The revolving loan period ends on December 29, 2018 and the final maturity date is December 29, 2020. As of December 31, 2016 and 2015, $123.9 million and $52.7 million were outstanding under the JV Facility, respectively.
As of December 31, 2016, Sierra JV's portfolio consisted of investments in 40 portfolio companies with a fair value of $183.7 million and was comprised of 100.0% of senior secured first lien term loans. As of December 31, 2015, the Sierra JV portfolio consisted of investments in 17 portfolio companies with a fair value of $88.2 million and was comprised of 100.0% of senior secured first lien term loans.
F- 35
The following table shows a summary of Sierra JV's portfolio:
December 31, 2016 | December 31, 2015 | ||||||
Senior secured loans(1) | $ | 187,314,127 | $ | 89,192,602 | |||
Common Stock | — | — | |||||
Weighted average current interest rate on senior secured loans(2) | 6.73 | % | 6.85 | % | |||
Number of borrowers in the Sierra JV | 40 | 17 | |||||
Largest loan to a single borrower(1) | $ | 10,000,000 | $ | 6,000,000 | |||
Total of five largest loans to borrowers(1) | $ | 39,387,481 | $ | 29,889,852 | |||
______________________________
(1) | At par value. |
(2) | Computed as the (a) annual stated interest rate on accruing senior secured loans, divided by (b) total senior secured loans at principal amount. |
The following is a listing of the individual investments in Sierra JV's portfolio as of December 31, 2016:
Company | Industry | Type of Investment | Coupon Rate | Maturity | Par Amount | Cost | Fair Value(1) | ||||||||||
4 Over International, LLC | Media: Advertising, Printing & Publishing | Senior Secured First Lien Term loans(4) | LIBOR + 6.000%, 1.000% Floor | 6/7/2022 | $2,475,000 | $2,475,000 | $2,475,000 | ||||||||||
AccentCare, Inc. | Healthcare & Pharmaceuticals | Senior Secured First Lien Term loans(4) | LIBOR + 5.750%, 1.000% Floor | 9/3/2021 | 4,582,500 | 4,546,589 | 4,582,500 | ||||||||||
Amplify Snack Brands, Inc. | Beverage & Food | Senior Secured First Lien Term loans(4) | LIBOR + 5.500%, 1.000% Floor | 9/2/2023 | 5,985,000 | 5,927,893 | 5,810,418 | ||||||||||
APCO Holdings, Inc. | Automotive | Senior Secured First Lien Term loans(4) | LIBOR + 6.000%, 1.000% Floor | 1/31/2022 | 4,834,797 | 4,711,696 | 4,854,668 | ||||||||||
API Technologies Corp. | Aerospace & Defense | Senior Secured First Lien Term loans(2)(4) | LIBOR + 6.500%, 1.000% Floor | 4/22/2022 | 5,970,000 | 5,863,757 | 5,915,434 | ||||||||||
Blount International, Inc. | Capital Equipment | Senior Secured First Lien Term loans(4) | LIBOR + 6.250%, 1.000% Floor | 4/12/2023 | 1,995,000 | 1,959,438 | 1,981,634 | ||||||||||
Cardenas Markets LLC | Retail | Senior Secured First Lien Term loans(4) | LIBOR + 5.750%, 1.000% Floor | 11/29/2023 | 6,500,000 | 6,435,814 | 6,435,000 | ||||||||||
CD&R TZ Purchaser, Inc. | Services: Consumer | Senior Secured First Lien Term loans(4) | LIBOR + 6.000%, 1.000% Floor | 7/21/2023 | 6,483,750 | 6,392,086 | 6,289,238 | ||||||||||
CP OpCo, LLC | Services: Consumer | Senior Secured First Lien Term loans(3)(4) | LIBOR + 4.500%, 1.000% Floor | 3/31/2019 | 564,956 | 564,956 | 564,956 | ||||||||||
CP OpCo, LLC | Services: Consumer | Senior Secured First Lien Term loans(4) | LIBOR + 4.500%, 1.000% Floor | 3/31/2019 | 840,996 | 840,996 | 840,996 | ||||||||||
CP OpCo, LLC | Services: Consumer | Senior Secured First Lien Term loans(4)(5) | LIBOR + 4.500%, 1.000% Floor | 3/31/2019 | 350,415 | 350,415 | 350,415 | ||||||||||
CP OpCo, LLC | Services: Consumer | Senior Secured First Lien Term loans(4)(5) | LIBOR + 6.000%, 1.000% Floor | 3/31/2019 | 2,478,388 | 1,195,026 | 1,239,194 | ||||||||||
CP OpCo, LLC | Services: Consumer | Senior Secured First Lien Term loans(4)(5) | LIBOR + 6.000%, 1.000% Floor | 3/31/2019 | 1,558,081 | — | — | ||||||||||
CP OpCo, LLC | Services: Consumer | Common Units | — | — | — | — | — | ||||||||||
CRGT Inc. | High Tech Industries | Senior Secured First Lien Term loans(4) | LIBOR + 6.500%, 1.000% Floor | 12/19/2020 | 4,068,160 | 4,060,486 | 4,068,160 | ||||||||||
Elite Comfort Solutions LLC | Chemicals, Plastics & Rubber | Senior Secured First Lien Term loans(4) | LIBOR + 6.500%, 1.000% Floor | 1/15/2021 | 10,000,000 | 10,000,000 | 10,100,000 | ||||||||||
Explorer Holdings, Inc. | Healthcare & Pharmaceuticals | Senior Secured First Lien Term loans(4) | LIBOR + 5.000%, 1.000% Floor | 5/2/2023 | 1,243,750 | 1,232,468 | 1,252,208 | ||||||||||
GK Holdings, Inc. | Services: Business | Senior Secured First Lien Term loan(4) | LIBOR + 5.500%, 1.000% Floor | 1/20/2021 | 4,029,298 | 4,009,681 | 4,109,884 | ||||||||||
GTCR Valor Companies, Inc. | Media: Diversified & Production | Senior Secured First Lien Term loans(4) | LIBOR + 6.000%, 1.000% Floor | 6/16/2023 | 8,955,000 | 8,621,284 | 8,843,063 | ||||||||||
Harbortouch Payments, LLC | Banking, Finance, Insurance & Real Estate | Senior Secured First Lien Term loans(4) | LIBOR + 4.750%, 1.000% Floor | 10/31/2023 | 3,000,000 | 2,971,068 | 2,970,000 | ||||||||||
High Ridge Brands Co. | Consumer Goods: Non-Durable | Senior Secured First Lien Term loans(4) | LIBOR + 5.250%, 1.000% Floor | 6/30/2022 | 3,109,375 | 3,064,948 | 3,062,734 | ||||||||||
F- 36
Company | Industry | Type of Investment | Coupon Rate | Maturity | Par Amount | Cost | Fair Value(1) | ||||||||||
HNC Holdings, Inc. | Construction & Building | Senior Secured First Lien Term loans(4) | LIBOR + 4.500%, 1.000% Floor | 10/5/2023 | 165,000 | 164,199 | 166,650 | ||||||||||
Imagine! Print Solutions, LLC | Media: Advertising, Printing & Publishing | Senior Secured First Lien Term loans(4) | LIBOR + 6.000%, 1.000% Floor | 3/30/2022 | 5,961,841 | 5,913,053 | 6,021,459 | ||||||||||
Keurig Green Mountain, Inc. | Beverage & Food | Senior Secured First Lien Term loans(4) | LIBOR + 5.500%, 1.000% Floor | 3/3/2023 | 3,100,783 | 3,063,634 | 3,100,783 | ||||||||||
Keystone Peer Review Organization Holdings, Inc. | Healthcare & Pharmaceuticals | Senior Secured First Lien Term loans(4) | ABR + 4.00%, 3.75% ABR Floor | 12/28/2022 | 6,000,000 | 6,000,000 | 5,940,000 | ||||||||||
Kraton Polymers LLC | Chemicals, Plastics & Rubber | Senior Secured First Lien Term loans(4) | LIBOR + 5.000%, 1.000% Floor | 1/6/2022 | 5,000,000 | 4,828,278 | 5,050,000 | ||||||||||
MB Aerospace ACP Holdings II Corp. | Aerospace and Defense | Senior Secured First Lien Term loans(4) | LIBOR + 5.500%, 1.000% Floor | 12/15/2022 | 6,932,481 | 6,872,697 | 6,932,481 | ||||||||||
MWI Holdings, Inc. | Capital Equipment | Senior Secured First Lien Term loans(4) | LIBOR + 5.500%, 1.000% Floor | 6/29/2020 | 3,980,000 | 3,944,879 | 3,970,050 | ||||||||||
New Media Holdings II LLC | Media: Advertising, Printing & Publishing | Senior Secured First Lien Term loans(4) | LIBOR + 6.250%, 1.000% Floor | 6/4/2020 | 5,909,552 | 5,888,526 | 5,909,552 | ||||||||||
O2 Partners, LLC | Consumer Goods: Non-Durable | Senior Secured First Lien Term loans(4) | LIBOR + 5.000%, 1.000% Floor | 10/7/2022 | 6,483,750 | 6,421,171 | 6,418,913 | ||||||||||
Pomeroy Group LLC | Services: Business | Senior Secured First Lien Term loans(4) | LIBOR + 6.000%, 1.000% Floor | 11/30/2021 | 5,170,611 | 5,027,692 | 5,015,493 | ||||||||||
PT Network, LLC | Healthcare & Pharmaceuticals | Senior Secured First Lien Term loans(4) | LIBOR + 6.500%, 1.000% Floor | 11/30/2021 | 3,000,000 | 3,000,000 | 3,000,000 | ||||||||||
Quorum Health Corporation | Healthcare & Pharmaceuticals | Senior Secured First Lien Term loans(4) | LIBOR + 5.750%, 1.000% Floor | 4/29/2022 | 4,440,779 | 4,361,538 | 4,340,862 | ||||||||||
SCS Holdings I Inc. | Wholesale | Senior Secured First Lien Term loans(4) | LIBOR + 4.250%, 1.000% Floor | 10/30/2022 | 3,933,849 | 3,867,902 | 3,924,014 | ||||||||||
Southwest Dealer Services, Inc. | Automotive | Senior Secured First Lien Term loans(4) | LIBOR + 6.000%, 1.000% Floor | 3/16/2020 | 4,620,675 | 4,620,675 | 4,615,315 | ||||||||||
Sundial Group Holdings LLC | Consumer Goods: Non-Durable | Senior Secured First Lien Term loans(4) | LIBOR + 6.250%, 1.000% Floor | 10/19/2021 | 5,775,000 | 5,682,389 | 5,775,000 | ||||||||||
Survey Sampling International, LLC | Services: Business | Senior Secured First Lien Term loans(4) | LIBOR + 6.000%, 1.000% Floor | 12/16/2020 | 2,977,265 | 2,952,089 | 2,996,349 | ||||||||||
TaxAct, Inc. | Banking, Finance, Insurance & Real Estate | Senior Secured First Lien Term loans(4) | LIBOR + 6.000%, 1.000% Floor | 1/3/2023 | 3,009,259 | 2,938,091 | 3,009,259 | ||||||||||
The Garretson Resolution Group, Inc. | Services: Business | Senior Secured First Lien Term loans(4) | LIBOR + 6.500%, 1.000% Floor | 5/22/2021 | 4,843,750 | 4,843,750 | 4,862,931 | ||||||||||
TrialCard Incorporated | Services: Consumer | Senior Secured First Lien Term loans(4) | LIBOR + 5.250%, 1.000% Floor | 10/26/2021 | 7,000,000 | 6,932,567 | 7,000,000 | ||||||||||
Valence Surface Technologies, Inc. | Aerospace and Defense | Senior Secured First Lien Term loans(4) | LIBOR + 5.500%, 1.000% Floor | 6/13/2019 | 3,688,249 | 3,664,493 | 3,571,737 | ||||||||||
VCVH Holding Corp. | Healthcare & Pharmaceuticals | Senior Secured First Lien Term loans(4) | LIBOR + 5.000%, 1.000% Floor | 6/1/2023 | 5,970,000 | 5,914,339 | 5,910,300 | ||||||||||
Victory Capital Operating, LLC | Banking, Finance, Insurance & Real Estate | Senior Secured First Lien Term loans(4) | LIBOR + 7.500%, 1.000% Floor | 10/29/2021 | 1,621,005 | 1,598,430 | 1,637,215 | ||||||||||
Western Digital Corporation | High Tech Industries | Senior Secured First Lien Term loans(4) | LIBOR + 3.750%, 0.750% Floor | 4/29/2023 | 3,781,000 | 3,707,843 | 3,818,810 | ||||||||||
Z Gallerie, LLC | Retail | Senior Secured First Lien Term loans(4) | LIBOR + 6.500%, 1.000% Floor | 10/8/2020 | 4,924,812 | 4,924,812 | 4,924,812 | ||||||||||
Total | $187,314,127 | $182,356,648 | $183,657,487 | ||||||||||||||
___________________________
(1) | Represents the fair value in accordance with ASC820 as determined by the Board of managers of Sierra JV. The approval of the fair value of the portfolio investments held by Sierra JV is not included in the valuation process of the Board of Directors of the Company described elsewhere herein. |
(2) | The interest rate on these loans is subject to a base rate plus 1 Month (“1M”) LIBOR, which at December 31, 2016 was 0.77%. As the interest rate is subject to a minimum LIBOR floor which was greater than the 1M LIBOR rate at December 31, 2016, the prevailing rate in effect at December 31, 2016 was the base rate plus the LIBOR floor. |
F- 37
(3) | The interest rate on a portion of these loans is subject to a base rate plus Alternate Base Rate ("ABR"). As the interest rate is subject to a minimum ABR Floor which was greater than the ABR rate at December 31, 2016, the prevailing rate in effect at December 31, 2016 was the base rate plus the ABR Floor. |
(4) | The interest rate on these loans is subject to a base rate plus 3 Month (“3M”) LIBOR, which at December 31, 2016 was 1.00%. As the interest rate is subject to a minimum LIBOR floor which was greater than the 3M LIBOR rate at December 31, 2016, the prevailing rate in effect at December 31, 2016 the base rate plus the LIBOR floor. |
(5) | The investment was on non-accrual status as of December 31, 2016 |
The following is a listing of the individual investments in Sierra JV's portfolio as of December 31, 2015:
Company | Industry | Type of Investment | Coupon Rate | Maturity | Par Amount | Cost | Fair Value(1) | |||||||||
AccentCare, Inc. | Healthcare & Pharmaceuticals | Senior Secured First Lien Term loans(4) | LIBOR + 5.750%, 1.000% Floor | 9/3/2021 | $4,700,000 | $4,655,267 | $4,653,000 | |||||||||
Aperture Group, LLC | Banking, Finance, Insurance & Real Estate | Senior Secured First Lien Term loans(2) | LIBOR + 6.250%, 1.000% Floor | 8/29/2019 | 4,987,406 | 4,987,406 | 4,987,406 | |||||||||
CP Opco, LLC | Services: Consumer | Senior Secured First Lien Term loans(4) | LIBOR + 6.750%, 1.000% Floor | 9/30/2020 | 5,000,000 | 4,972,077 | 5,000,000 | |||||||||
CRGT Inc. | High Tech Industries | Senior Secured First Lien Term loans(4) | LIBOR + 6.500%, 1.000% Floor | 12/19/2020 | 4,936,709 | 4,925,042 | 4,913,861 | |||||||||
GTCR Valor Companies, Inc. | High Tech Industries | Senior Secured First Lien Term loans(4) | LIBOR + 5.000%, 1.000% Floor | 5/30/2021 | 4,987,394 | 4,978,088 | 4,953,124 | |||||||||
IPS Corporation | Wholesale | Senior Secured First Lien Term loans(3) | LIBOR + 6.250%, 1.000% Floor | 2/5/2021 | 4,974,878 | 4,974,878 | 4,799,514 | |||||||||
LanguageLine Inc. | Telecommunications | Senior Secured First Lien Term loans(4) | LIBOR + 5.500%, 1.000% Floor | 7/7/2021 | 5,920,000 | 5,934,647 | 5,870,687 | |||||||||
MB Aerospace ACP Holdings Corp. | Aerospace & Defense | Senior Secured First Lien Term loans(4) | LIBOR + 5.500%, 1.000% Floor | 12/15/2022 | 6,000,000 | 5,940,000 | 5,940,000 | |||||||||
New Media Holdings II LLC | Media: Advertising, Printing & Publishing | Senior Secured First Lien Term loans(4) | LIBOR + 6.250%, 1.000% Floor | 6/4/2020 | 5,969,852 | 5,942,413 | 5,887,766 | |||||||||
Physiotherapy Corporation | Healthcare & Pharmaceuticals | Senior Secured First Lien Term loans(4) | LIBOR + 4.750%, 1.000% Floor | 6/4/2021 | 4,987,500 | 4,987,500 | 4,981,324 | |||||||||
Quanex Building Products Corporation | Construction & Building | Senior Secured First Lien Term loans(2) | LIBOR + 5.250%, 1.000% Floor | 11/2/2022 | 6,000,000 | 5,975,115 | 5,970,120 | |||||||||
Sirius Computer Solutions, Inc. | Wholesale | Senior Secured First Lien Term loans(2) | LIBOR + 5.000%, 1.000% Floor | 10/30/2022 | 4,943,820 | 4,846,701 | 4,844,944 | |||||||||
Southwest Dealer Services, Inc. | Automotive | Senior Secured First Lien Term loans(2) | LIBOR + 6.000%, 1.000% Floor | 3/16/2020 | 4,936,709 | 4,936,709 | 4,858,771 | |||||||||
Sundial Brands LLC | Consumer goods: Non-durable | Senior Secured First Lien Term loans(4) | LIBOR + 6.250%, 1.000% Floor | 10/19/2021 | 6,000,000 | 5,883,680 | 5,880,000 | |||||||||
The Garretson Resolution Group, Inc. | Services: Business | Senior Secured First Lien Term loans(2) | LIBOR + 6.500%, 1.000% Floor | 5/22/2021 | 4,937,500 | 4,937,500 | 4,932,631 | |||||||||
Valence Surface Technologies, Inc. | Aerospace & Defense | Senior Secured First Lien Term Loans(4) | LIBOR + 5.500%, 1.000% Floor | 6/13/2019 | 4,935,897 | 4,891,126 | 4,760,652 | |||||||||
Z Gallerie LLC | Retail | Senior Secured First Lien Term loans(5) | LIBOR + 6.500%, 1.000% Floor | 10/8/2020 | 4,974,937 | 4,974,937 | 4,931,131 | |||||||||
Total | $89,192,602 | $88,743,086 | $88,164,931 | |||||||||||||
___________________________
(1) | Represents the fair value in accordance with ASC820 as determined by the Board of managers of Sierra JV. The approval of the fair value of the portfolio investments held by Sierra JV is not included in the valuation process of the Board of Directors of the Company described elsewhere herein. |
(2) | The interest rate on these loans is subject to a base rate plus 1 Month (“1M”) LIBOR, which at December 31, 2015 was 0.43%. As the interest rate is subject to a minimum LIBOR floor which was greater than the 1M LIBOR rate at December 31, 2015, the prevailing rate in effect at December 31, 2015 was the base rate plus the LIBOR floor. |
(3) | The interest rate on these loans is subject to a base rate plus 2 Month (“2M”) LIBOR, which at December 31, 2015 was 0.51%. As the interest rate is subject to a minimum LIBOR floor which was greater than the 2M LIBOR rate at December 31, 2015, the prevailing rate in effect at December 31, 2015 was the base rate plus the LIBOR floor. |
F- 38
(4) The interest rate on these loans is subject to a base rate plus 3 Month (“3M”) LIBOR, which at December 31, 2015 was 0.61%. As the interest rate is subject to a minimum LIBOR floor which was greater than the 3M LIBOR rate at December 31, 2015, the prevailing rate in effect at December 31, 2015 the base rate plus the LIBOR floor.
(5) | The interest rate on these loans is subject to a base rate plus 6 Month (“6M”) LIBOR, which at December 31, 2015 was 0.85%. As the interest rate is subject to a minimum LIBOR floor which was greater than the 6M LIBOR rate at December 31, 2015, the prevailing rate in effect at December 31, 2015 was the base rate plus the LIBOR floor. |
Below is certain summarized financial Information for the Sierra JV as of December 31, 2016 and 2015 and for the year ended December 31, 2016 and for the period from July 15, 2015 (commencement of operations) through December 31, 2015:
As of December 31, 2016 | As of December 31, 2015 | ||||||
Selected Consolidated Statement of Assets and Liabilities Information: | |||||||
Investments in loans at fair value (cost: $88,743,086) | $ | 183,657,486 | $ | 88,164,931 | |||
Cash and cash equivalents | 8,222,344 | 12,185,795 | |||||
Other Assets | 700,902 | 263,302 | |||||
Total Assets | $ | 192,580,732 | $ | 100,614,028 | |||
Unsettled trades payable | — | 9,912,697 | |||||
Senior credit facility payable(net of deferred financing costs of $1,286,453 and $1,704,278, respectively) | 122,624,547 | 50,986,722 | |||||
Other liabilities | 442,541 | 302,280 | |||||
Interest payable | 369,942 | 144,637 | |||||
Total liabilities | $ | 123,437,030 | $ | 61,346,336 | |||
Members’ capital | 69,143,702 | 39,267,692 | |||||
Total liabilities and members' capital | $ | 192,580,732 | $ | 100,614,028 | |||
Year ended December 31, 2016 | Period from July 15, 2015 (commencement of operations) through December 31, 2015 | ||||||
Selected Consolidated Statement of Operations Information: | |||||||
Total investment income | $ | 10,387,435 | $ | 1,675,790 | |||
Total expenses | (4,985,788 | ) | (1,000,357 | ) | |||
Net unrealized appreciation/(depreciation) of investments | 1,878,994 | (578,155 | ) | ||||
Net realized gain/(loss) of investments | (2,294,629 | ) | 1,843 | ||||
Net income/(loss) | $ | 4,986,012 | $ | 99,121 | |||
Note 4. Fair Value Measurements
The Company follows ASC 820 for measuring the fair value of portfolio investments. Fair value is the price that would be received in the sale of an asset or paid to transfer a liability in an orderly transaction between market participants at the measurement date. Where available, fair value is based on observable market prices or parameters, or derived from such prices or parameters. Where observable prices or inputs are not available, valuation models are applied. These valuation models involve some level of management estimation and judgment, the degree of which is dependent on the price transparency for the instruments or market and the instruments’ complexity. The Company’s fair value analysis includes an analysis of the value of any unfunded loan commitments. Financial investments recorded at fair value in the consolidated financial statements are categorized for disclosure purposes based upon the level of judgment associated with the inputs used to measure
their value. The valuation hierarchical levels are based upon the transparency of the inputs to the valuation of the investment as of the measurement date. The three levels are defined as follows. Investments which are valued using NAV as a practical expedient are excluded from this hierarchy:
• | Level 1 — Valuations based on quoted prices in active markets for identical assets or liabilities at the measurement date. |
• | Level 2 — Valuations based on inputs other than quoted prices in active markets included in Level 1, which are either directly or indirectly observable at the measurement date. This category includes quoted prices for similar assets or liabilities in active markets, quoted prices for identical or similar assets or liabilities in non-active markets including actionable bids from third parties for privately held assets or liabilities, and observable inputs other than quoted prices such as yield curves and forward currency rates that are entered directly into valuation models to determine the value of derivatives or other assets or liabilities. |
F- 39
• | Level 3 — Valuations based on inputs that are unobservable and where there is little, if any, market activity at the measurement date. The inputs for the determination of fair value may require significant management judgment or estimation and is based upon management’s assessment of the assumptions that market participants would use in pricing the assets or liabilities. These investments include debt and equity investments in private companies or assets valued using the Market or Income Approach and may involve pricing models whose inputs require significant judgment or estimation because of the absence of any meaningful current market data for identical or similar investments. The inputs in these valuations may include, but are not limited to, capitalization and discount rates, beta and Earnings Before Interest, Taxes, Depreciation and Amortization ("EBITDA") multiples. The information may also include pricing information or broker quotes which include a disclaimer that the broker would not be held to such a price in an actual transaction. The non-binding nature of consensus pricing and/or quotes accompanied by disclaimer would result in classification as Level 3 information, assuming no additional corroborating evidence. |
In addition to using the above inputs in investment valuations, the Company employs the valuation policy approved by the board of directors that is consistent with ASC 820 (see Note 2). Consistent with the Company’s valuation policy, the Company evaluates the source of inputs, including any markets in which the Company’s investments are trading, in determining fair value.
The following table presents the fair value measurements of the Company’s total investments, by major class according to the fair value hierarchy, as of December 31, 2016:
Type of Investment (1) | Level 1 | Level 2 | Level 3 | Total | |||||||||||
Asset | |||||||||||||||
Senior secured first lien term loans | $ | — | $ | — | $ | 493,340,277 | $ | 493,340,277 | |||||||
Senior secured first lien notes | — | 25,540,638 | 46,429,960 | 71,970,598 | |||||||||||
Senior secured second lien term loans | — | — | 260,008,735 | 260,008,735 | |||||||||||
Subordinated notes | — | — | 55,185,590 | 55,185,590 | |||||||||||
Warrants/Equity | 1,262,666 | — | 40,879,809 | 42,142,475 | |||||||||||
Money market fund | 22,966,981 | — | — | 22,966,981 | |||||||||||
Total | $ | 24,229,647 | $ | 25,540,638 | $ | 895,844,371 | $ | 945,614,656 | |||||||
Sierra Senior Loan Strategy JV I LLC | $ | 60,496,647 | |||||||||||||
Total Investments, at fair value | $ | 1,006,111,303 | |||||||||||||
________________________________
(1) | Certain investments that are measured at fair value using NAV have not been categorized in the fair value hierarchy. The fair value amounts presented in |
the table are intended to permit reconciliation of the fair value hierarchy to the amount presented in the Consolidated Statements of Assets and Liabilities.
Derivative Instrument-Long Exposure | Level 1 | Level 2 | Level 3 | Total | |||||||||||
Liability | |||||||||||||||
Total return swap with Citibank, N.A. | $ | — | $ | — | $ | 13,647,330 | $ | 13,647,330 | |||||||
The following table presents the fair value measurements of the Company’s total investments, by major class according to the fair value hierarchy, as of December 31, 2015:
Type of Investment | Level 1 | Level 2 | Level 3 | Total | |||||||||||
Asset | |||||||||||||||
Senior secured first lien term loans | $ | — | $ | — | $ | 514,638,093 | $ | 514,638,093 | |||||||
Senior secured first lien notes | — | 18,995,362 | 47,477,500 | 66,472,862 | |||||||||||
Senior secured second lien term loans | — | — | 278,645,462 | 278,645,462 | |||||||||||
Warrants/equity | — | — | 13,243,836 | 13,243,836 | |||||||||||
Money market fund | 15,456,069 | — | — | 15,456,069 | |||||||||||
Total | $ | 15,456,069 | $ | 18,995,362 | $ | 854,004,891 | $ | 888,456,322 | |||||||
Sierra Senior Loan Strategy JV I LLC | $34,362,191 | ||||||||||||||
Total Investments, at fair value | $922,818,513 | ||||||||||||||
________________________________
(1) | Certain investments that are measured at fair value using NAV have not been categorized in the fair value hierarchy. The fair value amounts presented in |
the table are intended to permit reconciliation of the fair value hierarchy to the amount presented in the Consolidated Statements of Assets and Liabilities.
F- 40
Derivative Instrument-Long Exposure | Level 1 | Level 2 | Level 3 | Total | |||||||||||
Liability | |||||||||||||||
Total return swap with Citibank, N.A. | $ | — | $ | — | $ | 27,365,819 | $ | 27,365,819 | |||||||
The following table provides a reconciliation of the beginning and ending balances for total investments that use Level 3 inputs for the year ended December 31, 2016 based on the fair value hierarchy at December 31, 2016:
Senior Secured First Lien Notes | Senior Secured First Lien Term Loans | Senior Secured Second Lien Term Loans | Subordinated Notes | Warrants/ Equity | Total Return Swap | Total | |||||||||||||||||||||
Balance, December 31, 2015 | $ | 47,477,500 | $ | 514,638,093 | $ | 278,645,462 | $ | — | $ | 13,243,836 | $ | (27,365,819 | ) | $ | 826,639,072 | ||||||||||||
Purchases | 4,849,425 | 213,298,187 | 30,261,251 | 53,639,058 | 33,365,624 | — | 335,413,545 | ||||||||||||||||||||
Sales | (12,030,303 | ) | (224,233,991 | ) | (50,736,362 | ) | (597,849 | ) | (318,131 | ) | — | (287,916,636 | ) | ||||||||||||||
Transfers in | 11,678,675 | — | — | — | — | — | 11,678,675 | ||||||||||||||||||||
Transfers out | (7,344,926 | ) | — | — | — | — | — | (7,344,926 | ) | ||||||||||||||||||
Amortization of discount/(premium) | 20,332 | 407,833 | 450,402 | — | — | — | 878,567 | ||||||||||||||||||||
Paid-in-kind interest income | — | 2,932,203 | 119,049 | — | 178,883 | — | 3,230,135 | ||||||||||||||||||||
Net realized gains (losses) | 30,303 | (14,770,906 | ) | (5,140,146 | ) | — | (790,778 | ) | — | (20,671,527 | ) | ||||||||||||||||
Net change in unrealized appreciation/ (depreciation) | 1,748,954 | 1,068,858 | 6,409,079 | 2,144,381 | (4,799,625 | ) | 13,718,489 | 20,290,136 | |||||||||||||||||||
Balance, December 31, 2016 | $ | 46,429,960 | $ | 493,340,277 | $ | 260,008,735 | $ | 55,185,590 | $ | 40,879,809 | $ | (13,647,330 | ) | $ | 882,197,041 | ||||||||||||
Change in net unrealized appreciation (depreciation) in investments held as of December 31, 2016(1) | $ | 794,310 | $ | (13,312,068 | ) | $ | 234,141 | $ | 2,144,381 | $ | (5,817,214 | ) | $ | 13,718,489 | $ | (2,237,961 | ) | ||||||||||
__________________________
(1) Amount is included in the related amount on investments and derivative instruments in the condensed consolidated statements of operations.
Transfers between levels of the fair value hierarchy are reported at the beginning of the reporting period in which they occur. During the year ended December 31, 2016, the Company recorded $7,344,926 in transfers from Level 3 to Level 2 due to an increase in observable inputs in market data and no other transfers between levels. During the year ended December 31, 2016, the Company recorded $11,678,675 in transfers from Level 2 to Level 3 due to a decrease in observable inputs in market data and no other transfers between levels.
The following table provides a reconciliation of the beginning and ending balances for total investments that use Level 3 inputs for the year ended December 31, 2015 based on the fair value hierarchy at December 31, 2015:
F- 41
Senior Secured First Lien Notes(1) | Senior Secured Second Lien Notes(2) | Senior Secured First Lien Term Loans | Warrants/ Equity | Total Return Swap | Total | ||||||||||||||||||
Balance, December 31, 2014 | $ | 43,912,887 | $ | 339,094,785 | $ | 217,951,068 | $ | 5,161,466 | $ | (7,651,597 | ) | $ | 598,468,609 | ||||||||||
Purchases | 17,515,625 | 319,093,252 | 106,750,688 | 8,188,095 | — | 451,547,660 | |||||||||||||||||
Sales | (8,345,000 | ) | (123,394,242 | ) | (26,686,126 | ) | — | — | (158,425,368 | ) | |||||||||||||
Transfers in | 1,050,888 | — | — | — | — | 1,050,888 | |||||||||||||||||
Transfers out | (5,478,171 | ) | — | — | — | — | (5,478,171 | ) | |||||||||||||||
Amortization of discount/(premium) | (2,198 | ) | 281,722 | 423,675 | — | — | 703,199 | ||||||||||||||||
Paid-in-kind interest income | — | 2,451,346 | 104,864 | 422,098 | — | 2,978,308 | |||||||||||||||||
Net realized gains (losses) | (753,996 | ) | 130,359 | 260,269 | — | — | (363,368 | ) | |||||||||||||||
Net change in unrealized appreciation/ (depreciation) | (422,535 | ) | (23,019,129 | ) | (20,158,976 | ) | (527,823 | ) | (19,714,222 | ) | (63,842,685 | ) | |||||||||||
Balance, December 31, 2015 | $ | 47,477,500 | $ | 514,638,093 | $ | 278,645,462 | $ | 13,243,836 | $ | (27,365,819 | ) | $ | 826,639,072 | ||||||||||
Change in net unrealized appreciation (depreciation) in investments held as of December 31, 2015(2) | $ | (458,450 | ) | $ | (24,840,061 | ) | $ | (19,293,757 | ) | $ | (464,653 | ) | $ | (19,714,222 | ) | $ | (64,771,143 | ) | |||||
________________________________
(1) | Includes assets previously classified as senior secured first lien notes. |
(2) Amount is included in the related amount on investments and derivative instruments in the condensed consolidated statements of operations.
Transfers between levels of the fair value hierarchy are reported at the beginning of the reporting period in which they occur. During the year ended December 31, 2015, the Company recorded $5,478,171 in transfers from Level 3 to Level 2 due to an increase in observable inputs in market data and no other transfers between levels. During the year ended December 31, 2015, the Company recorded $1,050,888 in transfers from Level 2 to Level 3 due to a decrease in observable inputs in market data and no other transfers between levels.
F- 42
The following table presents the quantitative information about Level 3 fair value measurements of the Company’s total investments, as of December 31, 2016:
Company | Fair Value | Valuation techniques | Unobservable input(1) | Range (weighted average) | |||||
Senior Secured First Lien Term Loan | $ | 339,728,530 | Income Approach (DCF) | Market yield | 7.44% - 18.50% (9.65%) | ||||
Senior Secured First Lien Term Loan | 7,373,318 | Market Approach (Guideline Comparable) | 2016 and NTM Revenue Multiple | 0.50x - 0.75x (0.63x)/0.50x - 0.75x (0.63x) | |||||
Senior Secured First Lien Term Loan | 6,868,420 | Market Approach (Guideline Comparable) | Revenue Generating Units | $393.75 - $525.00 ($459.38) | |||||
Senior Secured First Lien Term Loan | 23,280,607 | Market Approach (Guideline Comparable)/Income Approach (DCF) | NTM Revenue Multiple, NTM EBITDA Multiple Discount Rate | 0.40x - 1.25x (1.09x) / 5.00x - 7.00x (6.57x) / 17.50% - 20.00% (18.93%) | |||||
Senior Secured First Lien Term Loan | 20,885,087 | Market Approach (Guideline Comparable) | NTM Revenue Multiple, Discount Rate | 2.75x-3.25x (3.00x) /14.00%-16.00% (15.00%) | |||||
Senior Secured First Lien Term Loan | 16,246,819 | Market Approach (Guideline Comparable)/Income Approach (DCF) | Run-Rate Revenue Multiple, Run-Rate EBITDA Multiple, Discount Rate | 0.50x - 1.00x (0.75x)/5.50x - 6.50x (6.00x)/18.50% - 21.50% (20.00%) | |||||
Senior Secured First Lien Term Loan | 2,791,682 | Market Approach (Guideline Comparable) | NTM Revenue Multiple, NTM EBITDA Multiple | 0.5x - 1.00x (0.75x) /4.00x-5.00x (4.50x) | |||||
Senior Secured First Lien Term Loan | 84,190,814 | Recent Arms-length transaction | Recent Arms-length transaction | N/A | |||||
Senior Secured First Lien Notes | 32,142,804 | Income Approach (DCF) | Market yield | 7.57% - 115.94% (12.85%) | |||||
Senior Secured First Lien Notes | 6,105,000 | Recent Arms-length transaction | Recent Arms-length transaction | N/A | |||||
Senior Secured First Lien Notes | 157,156 | Enterprise Valuation Analysis | Estimated Liquidation Proceeds | $45.9M - $73.2M ($59.7M) | |||||
Senior Secured Second Lien Term Loan | 242,539,805 | Income Approach (DCF) | Market yield | 8.29% - 10.05% (73.13%) | |||||
Senior Secured Second Lien Term Loan | 6,472,505 | Recent Arms-length transaction | Recent Arms-length transaction | N/A | |||||
Senior Secured Second Lien Term Loan | — | Market Approach (Guideline Comparable) | LTM Revenue Multiple, LTM EBITDA Multiple | 0.5 - 1.0x (0.75x) / 6.0x - 7.0x (6.5x) | |||||
Senior Secured Second Lien Term Loan | 10,996,425 | Market Approach (Guideline Comparable)/Income Approach (DCF) | LTM Revenue Multiple, NTM Revenue Multiple, LTM EBITDA Multiple, NTM EBITDA Multiple, Discount Rate | 0.40x-0.60x(0.50x) /0.40x-0.60x(0.50x) / 8.25x-9.25x (8.75x)/ 7.50x-8.50x (8.00x)/17.50%-21.50% (19.50%) | |||||
Equity/Warrants | — | Enterprise Valuation Analysis | Estimated Liquidation Proceeds | $45.9M - $73.2M ($59.7M) | |||||
Equity/Warrants | 967,238 | Market Approach (Guideline Comparable)/Income Approach (DCF) | LTM EBITDA, Run-Rate Multiple, Discount rate | 7.00x - 8.00x (7.50x)/7.00x - 8.00x (7.50x) / 16.00%-18.00% (17.00%) | |||||
Equity/Warrants | 5,051,193 | Income Approach (DCF) | Market Yield | 17.45%-17.45% (17.45%) | |||||
Equity/Warrants | — | Market Approach (Guideline Comparable)/Income Approach (DCF) | NTM Revenue Multiple, NTM EBITDA Multiple, Discount Rate | 0.40x - 1.00x (0.90x)/5.00x - 7.00x (6.65x)/17.50% - 18.00% (17.59%) | |||||
Equity/Warrants | — | Market Approach (Guideline Comparable)/Income Approach (DCF) | Run-Rate Revenue Multiple, Run-Rate EBITDA Multiple, Discount Rate | 0.50x - 1.00x (0.75x)/5.50x - 6.50x (6.00x)/18.50% - 21.50% (20.00%) | |||||
Equity/Warrants | — | Market Approach (Guideline Comparable) | Revenue Generating Units | $393.75 - $525.00 ($459.38) | |||||
Equity/Warrants | — | Market Approach (Guideline Comparable) | NTM Revenue Multiple, Discount Rate | 2.75x-3.25x (3.00x) /14.00%-16.00% (15.00%) | |||||
Equity/Warrants | — | Market Approach (Guideline Comparable) | LTM EBITDA Multiple | 12.5x - 13.5x (0.0x) | |||||
Equity/Warrants | 4,265,419 | Market Approach (Guideline Comparable) / Precedent Transaction | LTM and NTM EBITDA Multiple | 4.50x-8.00x (7.10x) /4.50x-7.50x (6.72x) | |||||
Equity/Warrants | 16,095,959 | Recent Arms-length transaction | Recent Arms-length transaction | N/A | |||||
Subordinated Notes | 55,185,590 | Income Approach (DCF) | Discount Rate | 11.50% - 15.00% (13.21%) | |||||
Subordinated Notes | 14,500,000 | Recent Arms-length transaction | Recent Arms-length transaction | N/A | |||||
Total | $ | 895,844,371 | |||||||
Total Return Swap | (13,647,330 | ) | Income Approach (DCF) | Market yield | 4.43% - 73.13% (9.56%) | ||||
Total | $ | 882,197,041 | |||||||
_________________________________
(1) | Represents amounts used when the Company has determined that market participants would use such multiples when measuring the fair value of these investments. |
F- 43
The following table presents the quantitative information about Level 3 fair value measurements of the Company’s total investments, as of December 31, 2015:
Company | Fair Value | Valuation techniques | Unobservable input(1) | Range (weighted average) | |||||
Senior Secured First Lien Term Loans | $ | 439,536,490 | Income Approach (DCF) | Market yield | 6.48% - 47.96% (10.41%) | ||||
Senior Secured First Lien Term Loans | 6,241,367 | Market Approach (Guideline Comparable) | 2015 Revenue Multiple and 2015 EBITDA Multiple | 0.50x - 1.00x (1.00x)/3.50x - 4.50x (4.50x) | |||||
Senior Secured First Lien Term Loans | 13,839,943 | Market Approach (Guideline Comparable) | LTM EBITDA Multiple | 5.75x - 6.25x (5.75x) | |||||
Senior Secured First Lien Term Loans | 6,678,501 | Market Approach (Guideline Comparable) | 2015 Revenue Multiple, 2015 EBITDA Multiple, RGU Price | 1.00x - 1.25x (1.13x)/12.00x - 13.00x (12.50x)/$393.75 - $525.00 ($459.38) | |||||
Senior Secured First Lien Term Loans | 48,341,792 | Recent Arms-length transaction | Recent Arms-length transaction | N/A | |||||
Senior Secured Second Lien Notes | 43,804,716 | Income Approach (DCF) | Market yield | 9.81% - 41.99% (12.94%) | |||||
Senior Secured Second Lien Notes | 3,515,627 | Recent Arms-length transaction | Recent Arms-length transaction | N/A | |||||
Senior Secured Second Lien Notes | 157,156 | Enterprise Valuation Analysis | EBITDA Multiple/Estimated Liquidation Proceeds | 0.00x - 0.00 (0.00x) / $44.9M -$73.2M ($59.7M) | |||||
Senior Secured Second Lien Term Loan | 203,968,614 | Income Approach (DCF) | Market yield | 9.80% - 30.00% (11.55%) | |||||
Senior Secured Second Lien Term Loan | 14,441,745 | Income Approach (DCF) | Market yield/Cost of equity | 14.42% -14.42% (14.42%); 18.00% - 20.00% (19.00%) | |||||
Senior Secured Second Lien Term Loan | 1,700,247 | Market Approach (Guideline Comparable) | Run-Rate EBITDA Multiple | 3.50x - 4.50x (4.50x) | |||||
Senior Secured Second Lien Term Loan | 144,856 | Market Approach (Guideline Comparable) | LTM and 2016 EBITDA Multiple | 6.00x - 7.00x (7.00x)/6.00x - 7.00x (7.00x) | |||||
Senior Secured Second Lien Term Loan | 58,390,000 | Recent Arms-length transaction | Recent Arms-length transaction | N/A | |||||
Equity/Warrants | — | Enterprise Valuation Analysis | EBITDA Multiple/Estimated Liquidation Proceeds | 0.00x - 0.00 (0.00x) / $44.9M - $73.2M ($59.7M) | |||||
Equity/Warrants | 3,267,264 | Income Approach (DCF) | Market Yield | 13.56% - 13.56% (13.56%) | |||||
Equity/Warrants | 500,892 | Market Approach (Guideline Comparable) | 2015 Revenue Multiple, 2015 EBITDA Multiple, RGU Price | 1.00x - 1.25x (1.13x)/12.00x - 13.00x (12.50x)/$393.75 -$525.00 ($459.38) | |||||
Equity/Warrants | 2,535,132 | Market Approach (Guideline Comparable | LTM and NTM EBITDA Multiple | 7.75x - 8.00x (7.84x)/7.00x - 7.50x (7.32x) | |||||
Equity/Warrants | — | Market Approach (Guideline Comparable) | 2015 Revenue Multiple and 2015 EBITDA Multiple | 0.50x - 1.00x (1.00x)/3.50x - 4.50x (4.50x) | |||||
Equity/Warrants | — | Market Approach (Guideline Comparable) | LTM and NTM EBITDA Multiple | 6.50x - 7.50x (7.00x)/6.50x - 7.50x (7.00x) | |||||
Equity/Warrants | — | Market Approach (Guideline Comparable) | EBITDA Multiple | 12.5x - 13.5x (13.5x) | |||||
Equity/Warrants | 661,640 | Market Approach (Guideline Comparable) | LTM EBITDA Multiple | 0.00x - 5.75x (4.0x) | |||||
Equity/Warrants | 6,278,907 | Recent Arms-length transaction | Recent Arms-length transaction | N/A | |||||
Total | $ | 854,004,889 | |||||||
Total Return Swap | (27,365,819 | ) | Income Approach (DCF) | Market yield of underlying assets | 6.19% - 74.34% (11.12%) | ||||
Total | $ | 826,639,070 | |||||||
_________________________________
(1) | Represents amounts used when the Company has determined that market participants would use such multiples when measuring the fair value of these investments. |
The significant unobservable inputs used in the fair value measurement of the Company’s debt and derivative investments are market yields. Increases in market yields would result in lower fair value measurements.
The significant unobservable inputs used in the fair value measurement of the Company’s warrants/equity investments are comparable company multiples of Revenue or Earnings Before Interest Taxes Depreciation and Amortization (“EBITDA”) for the latest twelve months (“LTM”), next twelve months (“NTM”) or a reasonable period a market participant would consider. Increases in EBITDA multiples in isolation would result in higher fair value measurement.
F- 44
Note 5. Total Return Swap
On August 27, 2013, the Company, through its wholly-owned financing subsidiary, Arbor, entered into a total return swap (“TRS”) with Citibank, N.A. (“Citibank”) that is indexed to a basket of loans.
The TRS with Citibank enables Arbor, to obtain the economic benefit of the loans underlying the TRS, despite the fact that such loans will not be directly held or otherwise owned by Arbor, in return for an interest-type payment to Citibank.
SIC Advisors acts as the investment manager of Arbor and has discretion over the composition of the basket of loans underlying the TRS. The terms of the TRS are governed by an ISDA 2002 Master Agreement, the Schedule thereto and Credit Support Annex to such Schedule, and the Confirmation exchanged thereunder, between Arbor and Citibank, which collectively establish the TRS, and are collectively referred to herein as the “TRS Agreement”. On March 21, 2014, Arbor amended and restated its Confirmation Letter Agreement (the “Amended Confirmation Agreement”) with Citibank. The Amended Confirmation Agreement increased the maximum market value (determined at the time each such loan becomes subject to the TRS) of the portfolio of loans that Arbor may select from $100 million to $200 million, and increased the interest rate payable to Citibank from LIBOR plus 1.30% per annum to LIBOR plus 1.35% per annum. Other than the foregoing, the Amended Confirmation Agreement did not change any of the other terms of the TRS.
On July 23, 2014, Arbor entered into the Second Amended and Restated Confirmation Letter Agreement (the “Second Amended Confirmation Agreement”) with CitiBank. The Second Amended Confirmation Agreement increased the maximum market value (determined at the time each such loan becomes subject to the TRS) of the portfolio of loans that Arbor may select from $200 million to $350 million. Other than the foregoing, the Second Amended Confirmation Agreement did not change any of the other terms of the TRS.
On June 8, 2015, Arbor entered into the Third Amended and Restated Confirmation Letter Agreement (the “Third Amended Confirmation Agreement”) with CitiBank. The Third Amended Confirmation Agreement decreased the maximum market value (determined at the time each such loan becomes subject to the TRS) of the portfolio of loans that Arbor may select from $350 million to $300 million. Other than the foregoing, the Third Amended Confirmation Agreement did not change any of the other terms of the TRS.
On March 21, 2016, Arbor entered into the Fourth Amended and Restated Confirmation Letter Agreement (the “Fourth Amended Confirmation Agreement”) with Citibank. The Fourth Amended Confirmation Agreement extended the term of the TRS from March 21, 2016 through March 21, 2019 and increased the interest rate payable to Citi from LIBOR plus 1.35% per annum to LIBOR plus 1.65% per annum. Other than the foregoing, the Fourth Amended Confirmation Agreement did not change any of the other terms of the TRS.
Pursuant to the terms of the TRS Agreement, as amended and subject to conditions customary for transactions of this nature, Arbor may select a portfolio of loans with a maximum market value (determined at the time each such loan becomes subject to the TRS) of $300 million, which is also referred to as the maximum notional amount of the TRS. Arbor receives from Citibank a periodic payment on set dates that is based upon any coupons, both earned and accrued, generated by the loans underlying the TRS, subject to limitations described in the Amended TRS Agreement as well as any fees associated with the loans included in the portfolio. Arbor pays to Citibank interest at a rate equal to one-month LIBOR plus 1.65% per annum. In addition, upon the termination or repayment of any loan subject to the TRS, Arbor either receives from Citibank the appreciation in the value of such loan, or pays to Citibank any depreciation in the value of such loan.
Citibank may terminate the TRS on or after the second anniversary of the effectiveness of the TRS. SIC Advisors may terminate the TRS on behalf of Arbor at any time upon providing 10 days prior notice to Citibank. Any termination by SIC Advisors on behalf of Arbor prior to the second anniversary of the effectiveness of the TRS will result in payment of an early termination fee to Citibank. The early termination fee shall equal the present value of the following two cash flows: (a) interest payments at a rate equal 1.65% based on 70% of the maximum notional amount of $300 million, payable from the later of the first anniversary of the effectiveness of the TRS or the termination date until the second anniversary of the effectiveness of the TRS and (b) interest payments at a rate equal to 0.15% based on the maximum notional amount of $300 million, payable from the later of the first anniversary of the effectiveness of the TRS or the termination date until the second anniversary of the effectiveness of the TRS.
Arbor is required to pay a minimum usage fee in connection with the TRS of 1.65% on the amount equal to 85% of the average daily unused portion of the maximum amount permitted under the TRS. Such minimum usage fee will not apply during the first 365 days and last 60 days of the term of the TRS. Arbor will also pay Citibank customary fees in connection with the establishment and maintenance of the TRS. During the years ended December 31, 2016 and 2015, Arbor paid $687,131 and $636,962 in minimum usage fees, respectively.
F- 45
Arbor is required to initially cash collateralize a specified percentage of each loan (generally 25% to 35% of the market value of such loan) included under the TRS in accordance with margin requirements described in the Amended TRS Agreement. As of December 31, 2016 and 2015, Arbor has posted $79,620,942 and $77,029,970, respectively, in collateral to Citibank in relation to the TRS which is recorded on the consolidated statements of assets and liabilities as cash collateral on total return swap. Arbor may be required to post additional collateral from time to time as a result of a decline in the mark-to-market value of the portfolio of loans subject to the TRS. The obligations of Arbor under the Amended TRS Agreement are non-recourse to the Company and the Company’s exposure under the Amended TRS Agreement is limited to the value of the Company’s investment in Arbor, which generally equals the value of cash collateral provided by Arbor under the Amended TRS Agreement.
In connection with the TRS, Arbor has made customary representations and warranties and is required to comply with various covenants, reporting requirements and other customary requirements for similar transactions. In addition to customary events of default and termination events included in the form ISDA 2002 Master Agreement, the Amended TRS Agreement contains the following termination events: (a) a failure to satisfy the portfolio criteria for at least 30 days; (b) a failure to post initial cash collateral or additional collateral as required by the Amended TRS Agreement; (c) a default by Arbor or the Company with respect to indebtedness in an amount equal to or greater than the lesser of $10,000,000 and 2% of the Company’s NAV at such time; (d) a merger of Arbor or the Company meeting certain criteria; (e) the Company or Arbor amending their respective constituent documents to alter their investment strategy in a manner that has or could reasonably be expected to have a material adverse effect; and (f) SIC Advisors ceasing to be the investment manager of Arbor or to have authority to enter into transactions under the Amended TRS Agreement on behalf of Arbor, and not being replaced by an entity reasonably acceptable to Citibank. As of December 31, 2016 and December 31, 2015, the Company did not have any derivatives with contingent features in net liability positions; therefore, if a trigger event had occurred, no amount would have been required to be posted by the Company.
The Company’s maximum credit risk exposure as of December 31, 2016 and 2015 is $80,910,105 and $78,523,223, respectively, which is recorded on the consolidated statements of assets and liabilities as cash collateral on total return swap and receivable due on total return swap.
The Company’s receivable from Citibank represents realized amounts from payments on underlying loans in the total return swap portfolio which as of December 31, 2016 and 2015 was $1,289,163 and $1,493,253, respectively, which is recorded on the consolidated statements of assets and liabilities as receivable due on total return swap. The Company does not offset collateral posted in relation to the TRS with any unrealized appreciation or depreciation outstanding in the consolidated statements of assets and liabilities as of December 31, 2016 or December 31, 2015.
Transactions in total return swap contracts during the years ended December 31, 2016, 2015 and 2014 resulted in $6,812,173, $11,574,160 and $6,387,860 in realized gains and $13,718,489, $(19,714,222) and $8,002,993 in unrealized gains/(losses), respectively, which is recorded on the consolidated statements of operations.
The Company held only one derivative position as of the years ended December 31, 2016 and 2015 which is and was subject to a Master Agreement (“MA”). The following table represents the Company’s gross and net amounts after offset under MA of the derivative assets and liabilities presented by derivative type net of the related collateral pledged by the Company as of December 31, 2016 and 2015:
Gross Derivative Assets/ (Liabilities) Subject to MA | Derivative Amount Available for Offset | Net Amount Presented in the Consolidated Statements of Assets and Liabilities | Cash Collateral Received | Net Amount of Derivative Assets/(Liabilities) | |||||||||||||||
December 31, 2016 | |||||||||||||||||||
Total Return Swap(1) | $ | (13,647,330 | ) | $ | — | $ | (13,647,330 | ) | $ | — | $ | (13,647,330 | ) | ||||||
December 31, 2015 | |||||||||||||||||||
Total Return Swap(1) | $ | (27,365,819 | ) | $ | — | $ | (27,365,819 | ) | $ | — | $ | (27,365,819 | ) | ||||||
______________________________
(1) | Cash was posted for initial margin requirements for the total return swap as of December 31, 2016 and 2015 and is reported on the consolidated statements of assets and liabilities as cash collateral on total return swap. |
The following table shows the volume of the Company’s derivative transactions during the years ended December 31, 2016 and 2015:
2016 | 2015 | ||||||
Average notional par amount of contracts | $ | 214,114,353 | $ | 222,622,738 | |||
F- 46
The following is a summary of the TRS reference assets as of December 31, 2016:
Company(1) | Industry | Type of Investment | Maturity | Par Amount | Initial Notional Cost(2) | Fair Value | Unrealized Appreciation/(Depreciation) | ||||||||||
Acrisure, LLC | Banking, Finance, Insurance & Real Estate | Senior Secured First Lien Term Loans(7) LIBOR + 4.750%, 1.000% Floor | 11/22/2023 | 2,500,000 | 2,475,000 | 2,527,350 | 52,350 | ||||||||||
Albertson's LLC | Retail | Senior Secured First Lien Term Loans(3)(5) LIBOR + 3.000%, 0.750% Floor | 8/25/2021 | 2,000,000 | 2,000,000 | 2,022,080 | 22,080 | ||||||||||
AMC Entertainment Holdings, Inc. | Hotel, Gaming & Leisure | Senior Secured First Lien Term Loans(5) LIBOR + 2.750%, 0.750% Floor | 12/15/2023 | 2,000,000 | 1,995,000 | 2,018,500 | 23,500 | ||||||||||
AMF Bowling Centers, Inc | Services: Consumer | Senior Secured First Lien Term Loans(7) LIBOR + 5.000%, 1.000% Floor | 9/19/2023 | 6,842,500 | 6,739,863 | 6,821,151 | 81,288 | ||||||||||
Amplify Snack Brands, Inc. | Beverage & Food | Senior Secured First Lien Term Loans(7) LIBOR + 5.500%, 1.000% Floor | 9/2/2023 | 3,000,000 | 2,970,000 | 2,912,490 | (57,510 | ) | |||||||||
Answsers Corporation | High Tech Industries | Senior Secured First Lien Term Loans(5) LIBOR + 5.250%, 1.000% Floor | 10/1/2021 | 14,775,000 | 14,257,875 | 7,313,625 | (6,944,250 | ) | |||||||||
ANVC Merger Corp. | Aerospace & Defense | Senior Secured First Lien Term Loans(7) LIBOR + 4.500%, 1.000% Floor | 2/18/2021 | 4,691,841 | 4,644,923 | 4,656,653 | 11,730 | ||||||||||
AP Gaming I, LLC | Hotel, Gaming & Leisure | Senior Secured First Lien Term Loans(7) LIBOR + 8.250%, 1.000% Floor | 12/21/2020 | 10,645,102 | 10,476,828 | 10,574,099 | 97,271 | ||||||||||
Astro AB Borrower, Inc. | Banking, Finance, Insurance & Real Estate | Senior Secured First Lien Term Loans(7) LIBOR + 4.500%, 1.000% Floor | 4/30/2022 | 965,761 | 960,932 | 974,211 | 13,279 | ||||||||||
Asurion, LLC | Banking, Finance, Insurance & Real Estate | Senior Secured First Lien Term Loans(5) LIBOR + 3.750%, 1.000% Floor | 11/3/2023 | 1,000,000 | 995,000 | 1,013,750 | 18,750 | ||||||||||
Atkore International, Inc | Wholesale | Senior Secured First Lien Term Loans(3)(7) LIBOR + 3.000%, 1.000% Floor | 12/22/2023 | 3,000,000 | 2,992,500 | 3,022,500 | 30,000 | ||||||||||
ConvergeOne Holdings Corp. | Telecommunications | Senior Secured First Lien Term Loans(7) LIBOR + 5.375%, 1.000% Floor | 6/17/2020 | 2,500,000 | 2,462,500 | 2,487,500 | 25,000 | ||||||||||
CSP Technologies North America, LLC | Containers, Packaging & Glass | Senior Secured First Lien Term Loans(7) LIBOR + 6.000%, 1.000% Floor | 1/29/2022 | 9,780,882 | 9,585,265 | 9,634,169 | 48,904 | ||||||||||
Encompass Digital Media, Inc | Media: Broadcasting & Subscription | Senior Secured First Lien Term Loans(7) LIBOR + 4.500%, 1.000% Floor | 6/6/2021 | 4,887,500 | 4,863,063 | 4,618,688 | (244,375 | ) | |||||||||
EVO Payments International, LLC | Banking, Finance, Insurance & Real Estate | Senior Secured First Lien Term Loans(3) LIBOR + 5.000%, 1.000% Floor | 12/22/2023 | 3,000,000 | 2,970,000 | 2,970,000 | — | ||||||||||
Fieldwood Energy LLC | Energy: Oil & Gas | Senior Secured First Lien Term Loans(7) LIBOR + 7.000%, 1.000% Floor | 8/31/2020 | 1,222,222 | 1,100,000 | 1,155,000 | 55,000 | ||||||||||
Fieldwood Energy LLC | Energy: Oil & Gas | Senior Secured First Lien Term Loans(7) LIBOR + 7.125%, 1.250% Floor | 9/30/2020 | 1,650,000 | 1,641,125 | 1,431,375 | (209,750 | ) | |||||||||
F- 47
Company(1) | Industry | Type of Investment | Maturity | Par Amount | Initial Notional Cost(2) | Fair Value | Unrealized Appreciation/(Depreciation) | ||||||||||
Fieldwood Energy LLC | Energy: Oil & Gas | Senior Secured Second Lien Term Loans(7) LIBOR + 7.125%, 1.250% Floor | 9/30/2020 | 2,596,305 | 2,676,375 | 1,817,414 | (858,961 | ) | |||||||||
First Data Corporation | Banking, Finance, Insurance & Real Estate | Senior Secured First Lien Term Loans(5) LIBOR + 3.000%, 0.000% Floor | 7/8/2022 | 1,000,000 | 1,000,000 | 1,010,210 | 10,210 | ||||||||||
Flex Acquisition Company, Inc. | Containers, Packaging & Glass | Senior Secured First Lien Term Loans(3)(7) LIBOR + 3.250%, 1.000% Floor | 12/29/2023 | 1,000,000 | 995,000 | 1,008,330 | 13,330 | ||||||||||
Four Seasons Holdings Inc. | Hotel, Gaming & Leisure | Senior Secured First Lien Term Loans(7) LIBOR + 3.000%, 0.750% Floor | 11/30/2023 | 1,000,000 | 995,000 | 1,011,250 | 16,250 | ||||||||||
Genex Services, Inc. | Banking, Finance, Insurance & Real Estate | Senior Secured First Lien Term Loans(5) LIBOR + 4.250%, 1.000% Floor | 5/28/2021 | 2,942,374 | 2,927,662 | 2,920,306 | (7,356 | ) | |||||||||
GTCR Valor Companies, Inc. | Media: Diversified & Production | Senior Secured First Lien Term Loans(7) LIBOR + 6.000%, 1.000% Floor | 6/16/2023 | 4,987,500 | 4,788,000 | 4,925,156 | 137,156 | ||||||||||
Harbortouch Payments, LLC | Banking, Finance, Insurance & Real Estate | Senior Secured First Lien Term Loans(7) LIBOR + 4.750%, 1.000% Floor | 10/13/2023 | 5,000,000 | 4,950,000 | 4,950,000 | — | ||||||||||
HNC Holdings, Inc. | Construction & Building | Senior Secured First Lien Term Loans(7) LIBOR + 4.500%, 1.000% Floor | 10/5/2023 | 572,000 | 569,140 | 577,720 | 8,580 | ||||||||||
Hudson Products Holdings Inc | Capital Equipment | Senior Secured First Lien Term Loans(7) LIBOR + 4.000%, 1.000% Floor | 3/15/2019 | 1,862,892 | 1,853,578 | 1,632,360 | (221,218 | ) | |||||||||
Imagine! Print Solutions, LLC | Media: Advertising, Printing & Publishing | Senior Secured First Lien Term Loans(7) LIBOR + 6.000%, 1.000% Floor | 3/30/2022 | 4,977,182 | 4,916,266 | 5,026,954 | 110,688 | ||||||||||
Iqor US Inc. | Services: Business | Senior Secured First Lien Term Loans(7) LIBOR + 5.000%, 1.000% Floor | 4/1/2021 | 7,591,111 | 7,439,289 | 7,230,533 | (208,756 | ) | |||||||||
Isola USA Corp. | High Tech Industries | Senior Secured First Lien Term Loans(7) LIBOR + 8.250%, 1.000% Floor | 11/29/2018 | 3,697,045 | 3,595,250 | 3,441,172 | (154,078 | ) | |||||||||
J.D. Power and Associates | Services: Consumer | Senior Secured First Lien Term Loans(7) LIBOR + 4.250%, 1.000% Floor | 9/7/2023 | 2,000,000 | 1,990,000 | 2,017,500 | 27,500 | ||||||||||
Kronos Incorporated | Services: Business | Senior Secured First Lien Term Loans(7) LIBOR + 4.000%, 1.000% Floor | 11/1/2023 | 3,000,000 | 2,985,000 | 3,035,160 | 50,160 | ||||||||||
Kronos Incorporated | Services: Business | Senior Secured Second Lien Term Loans(7) LIBOR + 8.250%, 1.000% Floor | 11/1/2024 | 2,000,000 | 1,980,000 | 2,058,760 | 78,760 | ||||||||||
Lightstone HoldCo LLC | Utilities: Electric | Senior Secured First Lien Term Loans(3) LIBOR + 5.500%, 1.000% Floor | 1/30/2024 | 2,739,130 | 2,684,348 | 2,769,946 | 85,598 | ||||||||||
Lightstone HoldCo LLC | Utilities: Electric | Senior Secured First Lien Term Loans(3) LIBOR + 5.500%, 1.000% Floor | 1/30/2024 | 260,870 | 255,652 | 263,804 | 8,152 | ||||||||||
F- 48
Company(1) | Industry | Type of Investment | Maturity | Par Amount | Initial Notional Cost(2) | Fair Value | Unrealized Appreciation/(Depreciation) | ||||||||||
Livingston International, Inc. | Transportation: Cargo | Senior Secured Second Lien Term Loans(1)(4)(7) LIBOR + 8.250%, 1.250% Floor | 4/17/2020 | 1,954,783 | 1,969,443 | 1,862,321 | (107,122 | ) | |||||||||
MPH Acquisition Holdings LLC | Healthcare & Pharmaceuticals | Senior Secured First Lien Term Loans(7) LIBOR + 4.000%, 1.000% Floor | 6/7/2023 | 2,870,317 | 2,855,965 | 2,917,993 | 62,028 | ||||||||||
MWI Holdings, Inc. | Capital Equipment | Senior Secured First Lien Term Loans(7) LIBOR + 5.500%, 1.000% Floor | 6/29/2020 | 3,990,000 | 3,950,100 | 3,980,025 | 29,925 | ||||||||||
Nine West Holdings, Inc. | Consumer goods: Non-durable | Senior Secured First Lien Term Loans(7) LIBOR + 3.750%, 1.000% Floor | 10/8/2019 | 5,865,000 | 5,850,338 | 3,606,975 | (2,243,363 | ) | |||||||||
O2 Partners, LLC | Consumer goods: Non-durable | Senior Secured First Lien Term Loans(6) LIBOR + 5.000%, 1.000% Floor | 10/7/2022 | 1,500,000 | 1,485,000 | 1,485,000 | — | ||||||||||
Payless Inc. | Retail | Senior Secured First Lien Term Loans(7) LIBOR + 4.000%, 1.000% Floor | 3/11/2021 | 5,850,000 | 5,828,063 | 3,017,606 | (2,810,457 | ) | |||||||||
Petco Animal Supplies, Inc. | Retail | Senior Secured First Lien Term Loans(7) LIBOR + 4.000%, 1.000% Floor | 1/26/2023 | 5,940,050 | 5,821,249 | 5,965,533 | 144,284 | ||||||||||
Polycom, Inc. | Wholesale | Senior Secured First Lien Term Loans(7) LIBOR + 6.500%, 1.000% Floor | 9/27/2023 | 1,946,667 | 1,868,800 | 1,953,967 | 85,167 | ||||||||||
Preferred Proppants, LLC | Construction & Building | Senior Secured First Lien Term Loans(7) LIBOR + 5.750%, 1.000% Floor | 7/27/2020 | 2,870,178 | 2,841,476 | 2,421,713 | (419,763 | ) | |||||||||
Press Ganey Holdings, Inc. | Healthcare & Pharmaceuticals | Senior Secured First Lien Term Loans(5) LIBOR + 3.250%, 1.000% Floor | 10/23/2023 | 3,000,000 | 2,985,000 | 3,015,000 | 30,000 | ||||||||||
Press Ganey Holdings, Inc. | Healthcare & Pharmaceuticals | Senior Secured Second Lien Term Loans(5) LIBOR + 7.250%, 1.000% Floor | 10/21/2024 | 6,500,000 | 6,472,500 | 6,472,505 | 5 | ||||||||||
Rackspace Hosting, Inc. | Services: Business | Senior Secured First Lien Term Loans(3) LIBOR + 3.500%, 1.000% Floor | 11/3/2023 | 1,000,000 | 1,000,000 | 1,000,000 | — | ||||||||||
Rackspace Hosting, Inc. | Services: Business | Senior Secured First Lien Term Loans(7) LIBOR + 4.000%, 1.000% Floor | 11/3/2023 | 2,500,000 | 2,487,500 | 2,530,200 | 42,700 | ||||||||||
SCS Holdings I Inc. | High Tech Industries | Senior Secured First Lien Term Loans(5) LIBOR + 4.250%, 1.000% Floor | 10/30/2022 | 1,500,000 | 1,496,250 | 1,496,250 | — | ||||||||||
Sungard Availability Services Capital Inc. | Services: Business | Senior Secured First Lien Term Loans(5) LIBOR + 5.000%, 1.000% Floor | 4/1/2019 | 7,989,438 | 7,956,046 | 7,716,439 | (239,607 | ) | |||||||||
TaxACT Inc. | Banking, Finance, Insurance & Real Estate | Senior Secured First Lien Term Loans(5) LIBOR + 6.000%, 1.000% Floor | 1/3/2023 | 2,705,882 | 2,634,706 | 2,705,882 | 71,176 | ||||||||||
Tensar Corporation | Capital Equipment | Senior Secured First Lien Term Loans(7) LIBOR + 4.750%, 1.000% Floor | 7/9/2021 | 11,574,536 | 11,458,791 | 10,417,083 | (1,041,708 | ) | |||||||||
F- 49
Company(1) | Industry | Type of Investment | Maturity | Par Amount | Initial Notional Cost(2) | Fair Value | Unrealized Appreciation/(Depreciation) | ||||||||||
TravelCLICK, Inc | Hotel, Gaming & Leisure | Senior Secured First Lien Term Loans(5) LIBOR + 4.500%, 1.250% Floor | 5/6/2021 | 4,732,805 | 4,685,477 | 4,738,721 | 53,244 | ||||||||||
tronc, Inc. | Media: Advertising, Printing & Publishing | Senior Secured First Lien Term Loans(4)(5) LIBOR + 4.750%, 1.000% Floor | 8/4/2021 | 7,000,000 | 6,930,000 | 6,973,750 | 43,750 | ||||||||||
UFC Holdings, LLC | Hotel, Gaming & Leisure | Senior Secured First Lien Term Loans(7) LIBOR + 4.000%, 1.000% Floor | 8/18/2023 | 1,000,000 | 995,000 | 1,012,000 | 17,000 | ||||||||||
UFC Holdings, LLC | Hotel, Gaming & Leisure | Senior Secured Second Lien Term Loans(7) LIBOR + 7.500%, 1.000% Floor | 8/18/2024 | 500,000 | 495,000 | 513,125 | 18,125 | ||||||||||
US Shipping Partners LP | Transportation: Cargo | Senior Secured First Lien Term Loans(5) LIBOR + 4.250%, 1.000% Floor | 6/26/2021 | 1,856,284 | 1,842,362 | 1,786,673 | (55,689 | ) | |||||||||
VCVH Holding Corp. | Healthcare & Pharmaceuticals | Senior Secured First Lien Term Loans(7) LIBOR + 5.000%, 1.000% Floor | 6/1/2023 | 997,500 | 987,525 | 987,525 | — | ||||||||||
Veresen Midstream Limited Partnership | Energy: Oil & Gas | Senior Secured First Lien Term Loans(7) LIBOR + 4.250%, 1.000% Floor | 3/31/2022 | 2,992,405 | 2,956,197 | 3,009,851 | 53,654 | ||||||||||
Victory Capital Operating, LLC | Banking, Finance, Insurance & Real Estate | Senior Secured First Lien Term Loans(7) LIBOR + 7.500%, 1.000% Floor | 10/29/2021 | 1,625,357 | 1,600,977 | 1,641,611 | 40,634 | ||||||||||
Vistra Operations Company LLC | Energy: Electricity | Senior Secured First Lien Term Loans(7) LIBOR + 4.000%, 1.000% Floor | 8/4/2023 | 3,257,143 | 3,224,571 | 3,294,307 | 69,736 | ||||||||||
Vistra Operations Company LLC | Energy: Electricity | Senior Secured First Lien Term Loans(7) LIBOR + 4.000%, 1.000% Floor | 8/4/2023 | 742,857 | 735,429 | 751,334 | 15,905 | ||||||||||
Vistra Operations Company LLC | Energy: Electricity | Senior Secured First Lien Term Loans(3)(5) LIBOR + 3.250%, 0.750% Floor | 12/14/2023 | 1,500,000 | 1,496,250 | 1,518,750 | 22,500 | ||||||||||
Western Digital Corporation | High Tech Industries | Senior Secured First Lien Term Loans(5) LIBOR + 3.750%, 0.750% Floor | 4/29/2023 | 3,192,000 | 3,148,110 | 3,223,920 | 75,810 | ||||||||||
YRC Worldwide Inc. | Transportation: Cargo | Senior Secured First Lien Term loans(4)(7) LIBOR + 7.000%, 1.000% Floor | 2/13/2019 | 9,737,187 | 9,725,122 | 9,627,643 | (97,479 | ) | |||||||||
Total | $230,377,606 | $227,513,681 | $213,493,418 | $(14,020,263) | |||||||||||||
Total accrued interest income, net of expenses | 372,933 | ||||||||||||||||
Total unrealized depreciation on total return swap | $(13,647,330) | ||||||||||||||||
_____________________________
(1) | All investments are domiciled in the United States except for Livingston International, Inc., which is domiciled in Canada. |
(2) | Represents the initial amount of par of an investment in which the TRS is referenced. |
(3) | The referenced asset or portion thereof is unsettled as of December 31, 2016. |
(4) | The investment is not a qualifying asset under the Investment Company Act of 1940, as amended. |
(5) | The interest rate on these loans is subject to a base rate plus 1 Month (“1M”) LIBOR, which at December 31, 2016 was 0.77%. As the interest rate is subject to a minimum LIBOR floor which was greater than the 1M LIBOR rate at December 31, 2016, the prevailing rate in effect at December 31, 2016 was the base rate plus the LIBOR floor. |
(6) | The interest rate on these loans is subject to a base rate plus 2 Month (“2M”) LIBOR, which at December 31, 2016 was 0.82%. As the interest rate is subject to a minimum LIBOR floor which was greater than the 2M LIBOR rate at December 31, 2016, the prevailing rate in effect at December 31, 2016 was the base rate plus the LIBOR floor. |
(7) | The interest rate on these loans is subject to a base rate plus 3 Month (“3M”) LIBOR, which at December 31, 2016 was 1.00%. As the interest rate is subject to a minimum LIBOR floor which was greater than the 3M LIBOR rate at December 31, 2016, the prevailing rate in effect at December 31, 2016 was the base rate plus the LIBOR floor. |
F- 50
The following is a summary of the TRS reference assets as of December 31, 2015:
Company(1) | Industry(4) | Type of Investment | Maturity | Par Amount | Initial Notional Cost(2) | Fair Value | Unrealized Appreciation/ (Depreciation) | |||||||||||||
American Beacon Advisors Inc | Banking, Finance, Insurance & Real Estate | Senior Secured First Lien Term Loan LIBOR + 4.500%, 1.000% Floor(7) | 4/30/2022 | 997,500 | $ | 992,513 | $ | 984,204 | $ | (8,309 | ) | |||||||||
Answers Corporation | High Tech Industries | Senior Secured First Lien Term Loan LIBOR + 5.250%, 1.000% Floor(5) | 10/1/2021 | 14,887,500 | 14,366,438 | 9,974,625 | (4,391,813 | ) | ||||||||||||
ANVC Merger Corp. | Aerospace & Defense | Senior Secured First Lien Term Loan LIBOR + 4.500%, 1.000% Floor(7) | 2/18/2021 | 4,740,086 | 4,692,685 | 4,597,883 | (94,802 | ) | ||||||||||||
AP Gaming I, LLC | Hotel, Gaming & Leisure | Senior Secured Second Lien Term Loan LIBOR + 8.250%, 1.000% Floor(7) | 12/20/2020 | 14,263,492 | 13,988,219 | 13,710,781 | (277,438 | ) | ||||||||||||
Asurion, LLC | Banking, Finance, Insurance & Real Estate | Senior Secured First Lien Term Loan LIBOR + 3.750%, 1.250% Floor(7) | 5/24/2019 | 4,724,269 | 4,723,681 | 4,415,727 | (307,954 | ) | ||||||||||||
Atkore International, Inc | Metals & Mining | Senior Secured Second Lien Term Loan LIBOR + 6.750%, 1.000% Floor(7) | 10/9/2021 | 10,000,000 | 10,032,500 | 8,700,000 | (1,332,500 | ) | ||||||||||||
Bowlmor AMF Corporation | Services: Consumer | Senior Secured First Lien Term Loan LIBOR + 6.250%, 1.000% Floor(7) | 9/18/2021 | 8,910,000 | 8,776,350 | 8,783,745 | 7,395 | |||||||||||||
CJ Holding Co. | Energy: Oil & Gas | Senior Secured First Lien Term Loan LIBOR + 5.500%, 1.000% Floor(4)(5) | 3/24/2020 | 2,985,000 | 2,567,100 | 1,814,880 | (752,220 | ) | ||||||||||||
CSP Technologies North America, LLC | Containers, Packaging & Glass | Senior Secured First Lien Term Loan LIBOR + 6.000%, 1.000% Floor(7) | 1/29/2022 | 9,925,000 | 9,726,500 | 9,726,500 | — | |||||||||||||
Collective Brands Finance Inc. | Retail | Senior Secured First Lien Term Loan LIBOR + 4.000%, 1.000% Floor(7) | 3/11/2021 | 5,910,000 | 5,887,838 | 3,376,088 | (2,511,750 | ) | ||||||||||||
Encompass Digital Media, Inc | Telecommunications | Senior Secured First Lien Term Loan LIBOR + 4.500%, 1.000% Floor(5) | 6/6/2021 | 4,937,500 | 4,912,813 | 4,814,063 | (98,750 | ) | ||||||||||||
Fieldwood Energy LLC | Energy: Oil & Gas | Senior Secured Second Lien Term Loan LIBOR + 7.125%, 1.250% Floor(8) | 9/30/2020 | 4,246,305 | 4,317,500 | 636,946 | (3,680,554 | ) | ||||||||||||
Genex Services, Inc. | Banking, Finance, Insurance & Real Estate | Senior Secured First Lien Term Loan LIBOR + 4.250%, 1.000% Floor(5) | 5/30/2021 | 2,972,475 | 2,957,612 | 2,915,492 | (42,120 | ) | ||||||||||||
Hudson Products Holdings Inc | Capital Equipment | Senior Secured First Lien Term Loan LIBOR + 4.000%, 1.000% Floor(7) | 3/15/2019 | 1,872,446 | 1,863,083 | 1,569,727 | (293,356 | ) | ||||||||||||
Iqor US Inc. | Services: Business | Senior Secured First Lien Term Loan LIBOR + 5.000%, 1.000% Floor(7) | 4/1/2021 | 7,668,571 | 7,515,200 | 6,045,365 | (1,469,835 | ) | ||||||||||||
Isola USA | High Tech Industries | Senior Secured First Lien Term Loan LIBOR + 8.250%, 1.000% Floor(7) | 11/29/2018 | 3,825,000 | 3,767,625 | 3,372,417 | (395,208 | ) | ||||||||||||
Language Line LLC | Telecommunications | Senior Secured First Lien Term Loan LIBOR + 5.500%, 1.000% Floor(7) | 7/7/2021 | 3,293,750 | 3,260,813 | 3,266,314 | 5,501 | |||||||||||||
Livingston International, Inc. | Transportation: Cargo | Senior Secured Second Lien Term Loan LIBOR + 7.750%, 1.250% Floor(1)(4)(7) | 4/18/2020 | 1,954,783 | 1,969,443 | 1,804,239 | (165,204 | ) | ||||||||||||
Maxim Crane Works LP | Capital Equipment | Senior Secured Second Lien Term Loan LIBOR + 9.250%, 1.000% Floor(5) | 11/26/2018 | 6,500,000 | 6,590,000 | 6,370,000 | (220,000 | ) | ||||||||||||
Mohegan Tribal Gaming | Hotel, Gaming & Leisure | Senior Secured First Lien Term Loan LIBOR + 4.500%, 1.000% Floor(7) | 11/19/2019 | 6,937,197 | 6,805,555 | 6,771,189 | (34,366 | ) | ||||||||||||
Nine West Holdings, Inc. | Consumer goods: Non-durable | Senior Secured First Lien Term Loan LIBOR + 3.750%, 1.000% Floor(7) | 10/8/2019 | 5,925,000 | 5,910,188 | 4,094,175 | (1,816,013 | ) | ||||||||||||
Packaging Coordinators, Inc. | Containers, Packaging & Glass | Senior Secured First Lien Term Loan LIBOR + 4.250%, 1.000% Floor(7) | 8/1/2021 | 4,950,000 | 4,900,500 | 4,900,500 | — | |||||||||||||
F- 51
Company(1) | Industry(4) | Type of Investment | Maturity | Par Amount | Initial Notional Cost(2) | Fair Value | Unrealized Appreciation/ (Depreciation) | |||||||||||||
Preferred Sands Holding Company, LLC | Construction & Building | Senior Secured First Lien Term Loan LIBOR + 5.750%, 1.000% Floor(7) | 7/27/2020 | 6,930,000 | 6,860,700 | 3,205,125 | (3,655,575 | ) | ||||||||||||
Sungard Availability Services Capital Inc. | Services: Business | Senior Secured First Lien Term Loan LIBOR + 5.000%, 1.000% Floor(5) | 3/31/2019 | 10,592,195 | 10,545,854 | 9,149,008 | (1,396,846 | ) | ||||||||||||
Tensar Corp. | Capital Equipment | Senior Secured First Lien Term Loan LIBOR + 4.750%, 1.000% Floor(7) | 7/9/2021 | 11,880,000 | 11,761,200 | 10,083,150 | (1,678,050 | ) | ||||||||||||
Thomson Multimedia | Media: Advertising, Printing & Publishing | Senior Secured First Lien Term Loan LIBOR + 6.000%, 1.000% Floor(5) | 3/31/2020 | 8,771,899 | 8,879,253 | 8,530,672 | (348,581 | ) | ||||||||||||
TravelCLICK, Inc | Hotel, Gaming & Leisure | Senior Secured First Lien Term Loan LIBOR + 4.500%, 1.250% Floor(5) | 5/12/2021 | 9,817,247 | 9,719,074 | 9,424,557 | (294,517 | ) | ||||||||||||
Tribune Publishing Co. | Media: Advertising, Printing & Publishing | Senior Secured First Lien Term Loan LIBOR + 4.750%, 1.000% Floor(5) | 8/4/2021 | 9,500,000 | 9,424,000 | 8,704,375 | (719,625 | ) | ||||||||||||
TTM Technologies Inc. | High Tech Industries | Senior Secured First Lien Term Loan LIBOR + 5.000%, 1.000% Floor(4)(7) | 5/7/2021 | 3,990,000 | 3,850,350 | 3,600,975 | (249,375 | ) | ||||||||||||
US Shipping Partners LP | Transportation: Cargo | Senior Secured First Lien Term Loan LIBOR + 4.250%, 1.000% Floor(7) | 6/26/2021 | 1,926,818 | 1,912,367 | 1,772,673 | (139,694 | ) | ||||||||||||
YP LLC | Media: Advertising, Printing & Publishing | Senior Secured First Lien Term Loan LIBOR + 6.750%, 1.250% Floor(5) | 6/4/2018 | 3,130,435 | 3,153,913 | 3,091,531 | (62,382 | ) | ||||||||||||
YRC Worldwide Inc. | Transportation: Cargo | Senior Secured First Lien Term Loan LIBOR + 7.250%, 1.000% Floor(4)(5) | 2/13/2019 | 9,837,312 | 9,825,123 | 8,525,703 | (1,299,420 | ) | ||||||||||||
$ | 206,455,990 | $ | 178,732,629 | $ | (27,723,361 | ) | ||||||||||||||
Total accrued interest income, net of expenses | 357,542 | |||||||||||||||||||
Total unrealized depreciation on total return swap | $ | (27,365,819 | ) | |||||||||||||||||
(1) | All investments are domiciled in the United States except for Livingston International, Inc., which is domiciled in Canada. |
(2) | Represents the initial amount of par of an investment in which the TRS is referenced. |
(3) | The referenced asset or portion thereof is unsettled as of December 31, 2015. |
(4) | The investment is not a qualifying asset under the Investment Company Act of 1940, as amended. |
(5) | The interest rate on these loans is subject to a base rate plus 1 Month ("1M") LIBOR, which at December 31, 2015 was 0.43%. As the interest rate is subject to a minimum LIBOR floor which was greater than the 1M LIBOR rate at December 31, 2015, the prevailing rate in effect at December 31, 2015 was the base rate plus the LIBOR floor. |
(6) | The interest rate on these loans is subject to a base rate plus 2 Month ("2M") LIBOR, which at December 31, 2015 was 0.51%. As the interest rate is subject to a minimum LIBOR floor which was greater than the 2M LIBOR rate at December 31, 2015, the prevailing rate in effect at December 31, 2015 was the base rate plus the LIBOR floor. |
(7) | The interest rate on these loans is subject to a base rate plus 3 Month ("3M") LIBOR, which at December 31, 2015 was 0.61%. As the interest rate is subject to a minimum LIBOR floor which was greater than the 3M LIBOR rate at December 31, 2015, the prevailing rate in effect at December 31, 2015 was the base rate plus the LIBOR floor. |
(8) | The interest rate on these loans is subject to a base rate plus 6 Month ("6M") LIBOR, which at December 31, 2015 was 0.85%. As the interest rate is subject to a minimum LIBOR floor which was greater than the 6M LIBOR rate at December 31, 2015, the prevailing rate in effect at December 31, 2015 was the base rate plus the LIBOR floor. |
F- 52
Note 6. Borrowings
The following table shows the Company's outstanding debt as of December 31, 2016 and 2015:
2016 | 2015 | ||||||||||||||||||||||
Total Commitment | Balance Outstanding | Unused Commitment | Total Commitment | Balance Outstanding | Unused Commitment | ||||||||||||||||||
ING Credit Facility | $ | 175,000,000 | $ | 150,000,000 | $ | 25,000,000 | $ | 170,000,000 | $ | 145,000,000 | $ | 25,000,000 | |||||||||||
Alpine Credit Facility | 300,000,000 | 240,000,000 | 60,000,000 | 300,000,000 | 240,000,000 | 60,000,000 | |||||||||||||||||
Total before deferred financing costs | 475,000,000 | 390,000,000 | 85,000,000 | 470,000,000 | 385,000,000 | 85,000,000 | |||||||||||||||||
Unamortized deferred financing costs | — | (4,340,533 | ) | — | — | (3,239,404 | ) | — | |||||||||||||||
Total borrowings outstanding, net | $ | 475,000,000 | $ | 385,659,467 | $ | 85,000,000 | $ | 470,000,000 | $ | 381,760,596 | $ | 85,000,000 | |||||||||||
As a BDC, the Company is only allowed to employ leverage to the extent that its asset coverage, as defined in the 1940 Act, equals at least 200% after giving effect to such leverage. The amount of leverage that the Company employs at any time depends on its assessment of the market and other factors at the time of any proposed borrowing.
The fair value of the Company’s debt obligation is determined in accordance with ASC 820, which defines fair value in terms of the price that would be paid to transfer a liability in an orderly transaction between market participants at the measurement date under current market conditions. The fair value of the Company’s margin borrowings are estimated based upon market interest rates for its own borrowings or entities with similar credit risk, adjusted for nonperformance risk, if any. The Company’s debt obligation is recorded at its carrying value, which approximates fair value.
ING Credit Facility
On August 12, 2016, the Company amended its existing senior secured syndicated revolving credit facility (the “ING Credit Facility”) pursuant to a Senior Secured Revolving Credit Agreement (the “Revolving Credit Agreement”) with certain lenders party thereto from time to time and ING Capital LLC, as administrative agent. The ING Credit Facility matures on August 12, 2020 and is secured by substantially all of the Company’s assets, subject to certain exclusions as further set forth in an Amended and Restated Guarantee, Pledge and Security Agreement (the “Security Agreement”) entered into in connection with the Revolving Credit Agreement, among the Company, the subsidiary guarantors party thereto, ING Capital LLC, as Administrative Agent, each Financial Agent and Designated Indebtedness Holder party thereto and ING Capital LLC, as Collateral Agent. The ING Credit Facility also includes usual and customary representations, covenants and events of default for senior secured revolving credit facilities of this nature. On February 13, 2015 commitments to the ING credit facility were expanded from $150,000,000 to $170,000.000. On August 12, 2016, commitments to the ING credit facility were expanded from $170,000,000 to $175,000,000.
The ING Credit Facility allows for the Company, at its option, to borrow money at a rate of either (i) an alternate base rate plus 1.50% per annum or (ii) LIBOR plus 2.50% per annum. The interest rate margins are subject to certain step-downs upon the satisfaction of certain conditions described in the Revolving Credit Agreement. The alternate base rate will be the greatest of (i) the U.S. Prime Rate set forth in the Wall Street Journal, (ii) the federal funds effective rate plus 1/2 of 1%, and (iii) three month LIBOR plus 1.00%. As of December 31, 2016 and 2015, the commitment under the ING Credit Facility was $175,000,000 and $170,000,000, respectively, and the ING Credit Facility includes an accordion feature that allows for potential future expansion of the ING Credit Facility up to a total of $500,000,000. Availability of loans under the ING Credit Facility is linked to the valuation of the collateral pursuant to a borrowing base mechanism.
The Company is also required to pay a commitment fee to the lenders based on the daily unused portion of the aggregate commitments under the ING Credit Facility. The commitment fee is (i) 1.50% if the used portion of the aggregate commitments is less than or equal to 40%, (ii) 0.75% if the used portion of the aggregate commitments is greater than 40% and less than or equal to 65% or (iii) 0.50% if the used portion of the aggregate commitments is greater than 65%. The ING Credit Facility provides that the Company may use the proceeds of the facility for general corporate purposes, including making investments in accordance with the Company’s investment objective and strategy.
Borrowings under the Revolving Credit Agreement are subject to, among other things, a minimum borrowing base. Substantially all of the Company’s assets are pledged as collateral under the Revolving Credit Agreement. The ING Credit Facility requires the Company to, among other things (i) make representations and warranties regarding the collateral as well the Company’s business and operations, (ii) agree to certain indemnification obligations, and (iii) agree to comply with various affirmative and negative covenants. The documents for the Revolving Credit Agreement also include default provisions, such as the failure to make timely payments under the Revolving Credit Agreement, the occurrence of a change in control, and the failure by
F- 53
the Company to materially perform under the operative agreements governing the Revolving Credit Agreement, which, if not complied with, could accelerate repayment under the Revolving Credit Agreement, thereby materially and adversely affecting the Company’s liquidity, financial condition and results of operations.
In connection with the security interest established under the Security Agreement, the Company, ING Capital LLC, in its capacity as collateral agent, and State Street Bank and Trust Company, in its capacity as the Company’s custodian, entered into a control agreement dated as of December 4, 2013, in order to, among other things, perfect the security interest granted pursuant to the Security Agreement in, and provide for control over, the related collateral.
As of December 31, 2016 and 2015, the carrying amount of the Company’s borrowings under the ING Credit Facility approximated their fair value. The fair value of the Company’s debt obligation is determined in accordance with ASC 820, which defines fair value in terms of the price that would be paid to transfer a liability in an orderly transaction between market participants at the measurement date under current market conditions. The fair value of the Company’s borrowing under the ING Credit Facility is estimated based upon market interest rates of the Company’s borrowing or entities with similar credit risk, adjusted for nonperformance risk, if any. At December 31, 2016 and 2015, the ING Credit Facility would be deemed to be Level 3, as defined in Note 4.
As of December 31, 2016 and 2015, $2,746,766 and $1,061,595, respectively, of financing costs related to the ING Credit Facility have been capitalized and are being amortized over the respective terms. For the years ended December 31, 2016 and 2015, the Company recorded $4,842,767 and $4,118,971, respectively, of interest and financing expenses related to the ING Credit Facility, of which $4,108,157 and $3,431,490, respectively, was attributable to interest and $734,610 and $687,481, respectively was attributable to amortization of deferred financing costs, respectively. As of December 31, 2016 and 2015, the Company’s outstanding borrowings under the ING Credit Facility were $150,000,000 and $145,000,000, respectively. For the years ended December 31, 2016 and 2015 the Company’s weighted average outstanding debt balance and interest rate on the ING Credit Facility was $109,931,694 and 3.7% and $97,547,945 and 3.5%, respectively.
Alpine Credit Facility
On July 23, 2014, the Company’s wholly-owned, special purpose financing subsidiary, Alpine, entered into a revolving credit facility (the “Alpine Credit Facility”) pursuant to a Loan Agreement with JPMorgan Chase Bank, National Association (“JPMorgan”), as administrative agent and lender, the Financing Providers from time to time party thereto, SIC Advisors, as the portfolio manager, and the Collateral Administrator, Collateral Agent and Securities Intermediary party thereto (the “Loan Agreement”). Alpine’s obligations to JPMorgan under the Alpine Credit Facility are secured by a first priority security interest in substantially all of the assets of Alpine, including its portfolio of loans. The obligations of Alpine under the Alpine Credit Facility are non-recourse to the Company.
The Alpine Credit Facility provides for borrowings in an aggregate principal amount up to $300,000,000 on a committed basis. Borrowings under the Alpine Credit Facility are subject to compliance with a net asset value coverage ratio with respect to the current value of Alpine’s portfolio and various eligibility criteria must be satisfied with respect to the initial acquisition of each loan in Alpine’s portfolio. Any amounts borrowed under the Alpine Credit Facility will mature, and all accrued and unpaid interest thereunder will be due and payable, on July 23, 2019.
Pricing under the Alpine Credit Facility for each one month calculation period is based on LIBOR for an interest period of one month, plus a spread of 3.25% per annum. If LIBOR is unavailable, pricing will be determined at the prime rate offered by JPMorgan or the federal funds effective rate, plus a spread of 3.25% per annum. Interest is payable monthly in arrears. Since February 23, 2015, Alpine has been required to pay a commitment fee equal to 0.50% on the average daily unused amount of the financing commitments to the extent $150,000,000 has not been borrowed. Alpine also paid a set-up fee and incurred certain other customary costs and expenses in connection with obtaining the Alpine Credit Facility on July 23, 2014, and its first amendment which increased the aggregate principal amount from $150,000,000 to $300,000,000 on February 6, 2015.
Borrowings of Alpine are considered borrowings of the Company for purposes of complying with the asset coverage requirements under the 1940 Act, applicable to business development companies.
Pursuant to a Sale and Contribution Agreement entered into between the Company and Alpine (the “Sale Agreement”) in connection with the Alpine Credit Facility, the Company may sell loans or contribute cash or loans to Alpine from time to time and will retain a residual interest in any assets contributed through its ownership of Alpine or will receive fair market value for any assets sold to Alpine. In certain circumstances the Company may be required to repurchase certain loans sold to Alpine. In addition to the acquisition of loans pursuant to the Sale Agreement, Alpine may purchase additional assets from various sources. Alpine has appointed SIC Advisors to manage its portfolio of assets pursuant to the terms of a Portfolio Management Agreement between SIC Advisors and Alpine.
F- 54
As of December 31, 2016, the carrying amount of the Company’s borrowings under the Alpine Credit Facility approximated the fair value of the Company’s debt obligation. The fair value of the Company’s debt obligation is determined in accordance with ASC 820, which defines fair value in terms of the price that would be paid to transfer a liability in an orderly transaction between market participants at the measurement date under current market conditions. The fair value of the Company’s borrowings under the Alpine Credit Facility is estimated based upon market interest rates of the Company’s borrowings or entities with similar credit risk, adjusted for nonperformance risk, if any. At December 31, 2016, the Alpine Credit Facility would be deemed to be Level 3, as defined in Note 4.
As of December 31, 2016 and 2015, $1,593,767 and $2,177,809, respectively, of financing costs related to the Alpine Credit Facility has been capitalized and is being amortized over the respective terms. For the years ended December 31, 2016 and 2015, the Company recorded $9,969,661 and $7,071,908, respectively, of interest and financing expenses related to the Alpine Credit Facility, of which $9,385,618 and $6,530,916, respectively, was attributable to interest and $584,043 and $540,992 was attributable to amortization of deferred financing costs. For the years ended December 31, 2016 and 2015, the Company’s weighted average outstanding debt balance and interest rate on the Alpine Credit Facility was $240,000,000 and 3.8% and $182,974,180 and 3.5%, respectively.
Note 7. Agreements
Investment Advisory Agreement
On April 5, 2012, the Company entered into an investment advisory agreement (“IAA”) with SIC Advisors to manage the Company’s investment activities. The IAA became effective as of April 17, 2012, the date that the Company met its minimum offering requirement. Pursuant to the 1940 Act, the initial term of the IAA was for two years from its effective date, with one-year renewals subject to approval by the Company’s board of directors, a majority of whom must be independent directors. On March 2, 2016, the Company’s board of directors approved the renewal of the IAA for an additional one-year term at an in-person meeting. Pursuant to the IAA, SIC Advisors implements the Company’s business strategy on a day-to-day basis and performs certain services for the Company, subject to oversight by the Company’s board of directors. SIC Advisors is responsible for, among other duties, determining investment criteria, sourcing, analyzing and executing investment transactions, asset sales, financings and performing asset management duties. Under the IAA, the Company has agreed to pay SIC Advisors a management fee for investment advisory and management services consisting of a base management fee and an incentive fee.
The base management fee is calculated at an annual rate of 1.75% of the Company’s gross assets payable quarterly in arrears. For purposes of calculating the base management fee, the term “gross assets” includes any assets acquired with the proceeds of leverage. “Gross assets” also includes any cash collateral posted with respect to the TRS, adjusted for realized and unrealized appreciation. For the first quarter of the Company’s operations, the base management fee was calculated based on the initial value of the Company’s gross assets. Subsequently, the base management fee is calculated based on the gross assets at the end of each completed calendar quarter. Base management fees for any partial quarter are appropriately prorated. For the years ended December 31, 2016, 2015, and 2014, the Company recorded an expense for base management fees of $19,928,802, $17,234,293 and$8,976,657, respectively, of which $5,138,107 and $4,686,096 were payable at December 31, 2016 and 2015, respectively.
The incentive fee consists of the following two parts:
An incentive fee on net investment income (“Subordinated Incentive Fee on Income”) is calculated and payable quarterly in arrears and is based upon pre-incentive fee net investment income for the immediately preceding quarter. No Subordinated Incentive Fee on Income is payable in any calendar quarter in which pre-incentive fee net investment income does not exceed a quarterly return to stockholders of 1.75% per quarter on the Company’s net assets at the end of the immediately preceding fiscal quarter (the “Preferred Quarterly Return”). All pre-incentive fee net investment income, if any, that exceeds the Preferred Quarterly Return, but is less than or equal to 2.1875% of net assets at the end of the immediately preceding fiscal quarter in any quarter, will be payable to SIC Advisors. The Company refers to this portion of its Subordinated Incentive Fee on Income as the “Catch Up”. It is intended to provide an incentive fee of 20% on pre-incentive fee net investment income when pre-incentive fee net investment income exceeds 2.1875% of net assets at the end of the immediately preceding quarter in any quarter. For any quarter in which the Company’s pre-incentive fee net investment income exceeds 2.1875% of net assets at the end of the immediately preceding quarter, the Subordinated Incentive Fee on Income shall equal 20% of the amount of pre-incentive fee net investment income, because the Preferred Quarterly Return and Catch Up will have been achieved. There is no incentive fee on net investment income earned on the TRS.
For the years ended December 31, 2016, 2015 and 2014 the Company recorded a Subordinated Incentive Fee on Income of $9,281,479, $4,434,352 and $(183,617), respectively. As of December 31, 2016 and 2015, the Company recorded an incentive fee on net income payable of $1,405,419 and $1,795,268, respectively.
A capital gains incentive fee will be earned on realized investments and shall be payable in arrears as of the end of each calendar year during which the IAA is in effect. If the IAA is terminated, the fee will also become payable as of the effective date of such
F- 55
termination. The fee equals 20% of the realized capital gains, less the aggregate amount of any previously paid capital gains incentive fees. The incentive fee on capital gains is equal to realized capital gains on a cumulative basis from inception, computed net of all realized capital losses and unrealized capital depreciation on a cumulative basis.
Under GAAP the Company calculates capital gains incentive fees as if the Company had realized all assets at their fair values and liabilities at their settlement amounts as of the reporting date. GAAP requires that the capital gains incentive fee accrual assume the cumulative aggregate unrealized capital appreciation is realized, even though such unrealized capital appreciation is not payable under the IAA. Accordingly, the Company accrues a provisional capital gains incentive fee taking into account any unrealized gains or losses. There can be no assurance that such unrealized capital appreciation will be realized in the future and that the provisional capital gains incentive fee will become payable.
For the years ended December 31, 2016, 2015 and 2014, the Company recorded no capital gains incentive fee. As of December 31, 2016 and 2015, the Company recorded no capital gains incentive fee payable.
Prior to June 2, 2014, SIC Advisors bore all organizational and offering expenses, as defined in the IAA, on behalf of the Company until the Company’s gross proceeds in connection with the sale of its common stock exceeded $300,000,000. Beginning June 2, 2014, the Company became responsible for all ongoing organization and offering expenses.
Pursuant to the terms of the IAA, the Company has agreed to reimburse SIC Advisors for any such organizational and offering expenses incurred by SIC Advisors (“O&O Reimbursable Expenses”) prior to June 2, 2014 not to exceed 1.25% of the gross subscriptions raised by the Company over the course of the offering period, which is currently scheduled to terminate April 17, 2018, unless further extended.
In the event that other organizational and offering expenses exceed 5.25% of the gross proceeds from the sale of shares of the Company’s common stock pursuant to its public offering or one or more private offerings at the time of the completion of the offering or other organizational and offering expenses, together with selling commissions, dealer manager fees and any discounts paid to members of the Financial Industry Regulatory Authority, exceed 15% of the gross proceeds from the sale of shares of the Company’s common stock pursuant to its public offering or one or more private offerings at the time of the completion of the offering, then SIC Advisors shall be required to pay without reimbursement from the Company, or, if already paid by the Company, reimburse the Company, for amounts exceeding such 5.25% and 15% limit, as appropriate.
As of February 2015, SIC Advisors has been fully reimbursed for all O&O Reimbursable Expenses from inception to date, which totaled $5,602,303. For the years ended December 31, 2016, 2015 and 2014, SIC Advisors incurred O&O Reimbursable Expenses of $0, $0 and $1,880,248, respectively. For the years ended December 31, 2016, 2015, and 2014 the Company reimbursed SIC Advisors $0, $443,687 and $4,640,250, respectively. As of December 31, 2016 and 2015, no amounts have been accrued related to O&O Expenses to be reimbursed to SIC Advisors.
Administration Agreement
On April 5, 2012, the Company entered into an administration agreement (the “Administration Agreement”) with Medley Capital LLC, pursuant to which Medley Capital LLC furnishes the Company with administrative services necessary to conduct its day-to-day operations. On February 28, 2013, Medley Capital LLC entered into a Sub-Administration Agreement with State Street Bank Global Fund Accounting and Custody to perform certain financial, accounting, administrative and other services on behalf of the Company. On March 2, 2016, the Company’s board of directors approved the renewal of the Administration Agreement for an additional one-year term at an in-person meeting. Medley Capital LLC is reimbursed for administrative expenses it incurs on the Company’s behalf in performing its obligations. Such costs are reasonably allocated to the Company on the basis of assets, revenues, time records or other reasonable methods. The Company does not reimburse Medley Capital LLC for any services for which it receives a separate fee or for rent, depreciation, utilities, capital equipment or other administrative items allocated to a controlling person of Medley Capital LLC. For the years ended December 31, 2016, 2015 and 2014 the Company recorded an expenses of $2,847,745, $2,261,789 and $1,300,971, respectively, relating to administrator expenses. As of December 31, 2016 and 2015, the Company had $850,678 and $517,930, respectively, in administrator expenses payable.
Expense Support and Reimbursement Agreement
From June 29, 2012 through December 31, 2016, the Company was party to an Expense Support and Reimbursement Agreement with SIC Advisors (the “Expense Support Agreement”). During the term of the Expense Support Agreement, SIC Advisors reimbursed the Company for operating expenses in an amount equal to the difference between the Company’s distributions paid to its stockholders in each month, less the sum of the Company’s net investment income, net realized capital gains and dividends paid to the Company from its portfolio companies, not included in net income and net realized capital gains, during such period (“Expense Support Reimbursement”). To the extent that no dividends or other distributions were paid to the Company’s stockholders in any given month, then the Expense Support Reimbursement for such month was equal to such amount necessary in order for available operating funds
F- 56
for the month to equal zero. From April 1, 2016 until the expiration of the Expense Support Agreement on December 31, 2016, SIC Advisors made expense support payments on a discretionary basis by making an election on the last day of each month to fund an expense support payment in an amount equal to the difference between the Company’s distributions paid to stockholders during such month less the sum of the Company’s net investment income, net realized capital gains and dividends paid to the Company from its portfolio companies, not included in net income and net realized capital gains during such period.
The purpose of the Expense Support Agreement was to cover distributions to stockholders so as to ensure that the distributions did not constitute a return of capital for GAAP purposes and to reduce operating expenses until the Company had raised sufficient capital to be able to absorb such expenses. The Expense Support Agreement expired on December 31, 2016.
Pursuant to the Expense Support Agreement, the Company will reimburse SIC Advisors for expense support payments it previously made following any calendar quarter for which the Company received net investment income, net realized capital gains and dividends from its portfolio companies (not included in net income and net realized capital gains) in excess of the distributions paid to the Company’s stockholders during such calendar quarter (the “Excess Operating Funds”). Any such reimbursement will be made within three years of the date that the expense support payment obligation was incurred by SIC Advisors, subject to the conditions described below. The amount of the reimbursement during any calendar quarter will equal the lesser of (i) the Excess Operating Funds received during the quarter and (ii) the aggregate amount of all expense payments made by SIC Advisors that have not yet been reimbursed. In addition, the Company will only make reimbursement payments to the extent its current annualized “operating expense ratio” (as described in footnote 1 to the table below) is equal to or less than its operating expense ratio for the quarter during which the corresponding expense obligation was incurred and to the extent the annualized rate of its regular cash dividends to the Company’s stockholders for the month is equal to or greater than the annualized rate of the Company’s regular cash distributions to stockholders for the month during which the corresponding expense payment was incurred.
For the years ended December 31, 2016, 2015 and 2014, the Company recorded net Expense Support Reimbursements of $16,093,129, $6,283,327 and $5,222,096, respectively, on the consolidated statements of operations and gross Expense Support Reimbursements of $16,228,913, $8,744,627 and $6,759,600, respectively. Repayments of amounts paid by SIC Advisors to the Company under the Expense Support Agreement will be accrued as they become probable and estimable. As of December 31, 2016 and 2015, the Company recorded $7,892,273 and $7,314,867, respectively, in its consolidated statements of assets and liabilities as due from affiliate relating to the Expense Support Agreement. The Company refers to Expense Support Reimbursements that are eligible for reimbursement to SIC Advisors by virtue of having satisfied the conditions described above as a “Crystalized Reimbursement.” As of December 31, 2016 and 2015, the Company recorded $135,784 and $2,461,300, respectively, of Crystalized Reimbursements, of which $0 and $1,765,768 was paid to the Company, and $135,784 and $695,533 was included in Due to Affiliate on the respective consolidated statements of assets and liabilities. As of December 31, 2016, 2015 and 2014, the total amounts eligible for reimbursement of the Company to SIC Advisors net of Crystalized Reimbursements was $31,474,331, $16,824,125 and $10,540,799, respectively.
F- 57
The following table provides information regarding liabilities incurred by SIC Advisors pursuant to the Expense Support Agreement as well as other information relating to the Company’s ability to reimburse SIC Advisors for such payments:
Quarter Ended | Amount of Expense Payment Obligation | Amount Repaid to SIC Advisors | Operating Expense Ratio(1) | Annualized Distribution Rate(2) | Eligible to be Repaid Through | |||||||||||
June 30, 2012 | $ | 454,874 | $ | 454,874 | 6.13 | % | 8.00 | % | June 30, 2015 | |||||||
September 30, 2012 | 437,303 | 437,303 | 4.05 | % | 8.00 | % | September 30, 2015 | |||||||||
December 31, 2012 | 573,733 | 573,733 | 3.91 | % | 8.00 | % | December 31, 2015 | |||||||||
March 31, 2013 | 685,404 | 685,404 | 1.71 | % | 8.00 | % | March 31, 2016 | |||||||||
June 30, 2013 | 732,425 | 732,425 | 1.00 | % | 7.84 | % | June 30, 2016 | |||||||||
September 30, 2013(3) | 1,262,848 | 1,078,500 | 0.83 | % | 7.84 | % | September 30, 2016 | |||||||||
December 31, 2013(3) | 1,258,575 | — | 0.45 | % | 7.84 | % | December 31, 2016 | |||||||||
March 31, 2014 | 1,313,470 | — | 0.45 | % | 7.80 | % | March 31, 2017 | |||||||||
June 30, 2014 | 2,143,066 | — | 0.38 | % | 7.80 | % | June 30, 2017 | |||||||||
September 30, 2014 | 1,717,593 | 123,025 | 0.38 | % | 7.77 | % | September 30, 2017 | |||||||||
December 31, 2014 | 1,585,471 | — | 0.47 | % | 8.00 | % | December 31, 2017 | |||||||||
March 31, 2015 | 1,993,518 | — | 0.43 | % | 8.00 | % | March 31, 2018 | |||||||||
June 30, 2015 | 2,148,462 | — | 0.31 | % | 8.00 | % | June 30, 2018 | |||||||||
September 30, 2015 | 627,752 | — | 0.32 | % | 8.25 | % | September 30, 2018 | |||||||||
December 31, 2015 | 3,974,895 | — | 0.40 | % | 8.65 | % | December 31, 2018 | |||||||||
March 31, 2016 | 5,204,896 | — | 0.37 | % | 8.89 | % | March 31, 2019 | |||||||||
June 30, 2016 | 5,634,390 | — | 0.29 | % | 8.89 | % | June 30, 2019 | |||||||||
September 30, 2016 | 5,389,627 | — | 0.45 | % | 8.84 | % | September 30, 2019 | |||||||||
December 31, 2016 | $ | — | — | 0.32 | % | 7.07 | % | N/A | ||||||||
_____________________________
(1) | “Operating Expense Ratio” is as of the date the expense support payment obligation was incurred by the Company’s Advisor and includes all expenses borne by the Company, except for organizational and offering expenses, base management and incentive fees owed to SIC Advisors, and interest expense, as a percentage of net assets. |
(2) | “Annualized Distribution Rate” equals the annualized rate of distributions paid to stockholders based on the amount of the regular cash distribution paid immediately prior to the date the expense support payment obligation was incurred by SIC Advisors. “Annualized Distribution Rate” does not include special cash or stock distributions paid to stockholders. |
(3) | The unreimbursed part of the expense payment obligation has expired as of December 31, 2016 |
Note 8. Related Party Transactions
On October 19, 2011, SIC Advisors entered into a subscription agreement to purchase 110.80 shares of common stock for cash consideration of $1,000. The consideration represents $9.025 per share.
On March 31, 2012, SIC Advisors entered into a subscription agreement to purchase 1,108,033.24 shares of common stock for cash consideration of $10,000,000. The purchase was made on April 17, 2012. The consideration represents $9.025 per share.
Due from affiliate relates to amounts due from SIC Advisors pursuant to the Expense Support Agreement as discussed in Note 7.
Due to affiliate relates to reimbursements of organizational and offering expenses and expense support reimbursement pursuant to the IAA paid to/from SIC Advisors as discussed in Note 7.
An affiliate of the Company’s dealer manager has an ownership interest in SIC Advisors.
Opportunities for co-investments may arise when SIC Advisors or an affiliated adviser becomes aware of investment opportunities that may be appropriate for the Company and other clients or affiliated funds. The Company obtained an exemptive order from the SEC on November 25, 2013 (the “Exemptive Order”). The Exemptive Order permits the Company to participate in negotiated co-investment transactions with certain affiliates, each of whose investment adviser is Medley LLC, the parent company of SIC Advisors, or an investment adviser controlled by Medley LLC, in a manner consistent with its investment objective, strategies and restrictions, as well as regulatory requirements and other pertinent factors. Co-investment under the Exemptive Order is subject to certain conditions therein, including the condition that, in the case of each co-investment transaction, the Company’s board of directors determines that it would be advantageous for the Company to co-invest in a manner described in the Exemptive Order. Before receiving the Exemptive Order, the Company only participated in co-investments that were allowed under existing regulatory guidance, such as syndicated loan transactions where price was the only negotiated term, which limited the types of investments that
F- 58
the Company could make. On July 26, 2016, the Company, SIC Advisors and certain other affiliated funds and investment advisers filed an exemptive application for a co-investment order that would supersede the Exemptive Order and allow affiliated registered investment companies to participate in co-investment transactions with us that would otherwise be prohibited under Section 17(d) and 57(a)(4) and Rule 17d-1. The Exemptive Order will remain in effect unless and until the revised application is approved by the SEC. The terms of the revised application are substantially similar to the Exemptive Order.
Please see footnote 4 to the consolidated schedule of investments as of December 31, 2016 and 2015 for disclosures regarding securities also held by affiliated funds.
Note 9. Directors Fees
Prior to April 1, 2015, the Company’s independent directors each received an annual retainer fee of $30,000 and further received a fee of $2,500 ($1,000 for telephonic attendance) for each regularly scheduled board meeting and a fee of $1,000 for each special board meeting and all committee meetings as well as reimbursement of reasonable and documented out-of-pocket expenses incurred in connection with attending each board or committee meeting. In addition, the chairman of the audit committee received an annual retainer of $10,000, while the chairman of any other committee received an annual retainer of $2,500. Effective April 1, 2015, the Company’s independent directors each receive an annual retainer of $50,000 and further receive a fee of $4,000 ($2,000 for telephonic attendance) for each regularly scheduled board meeting and a fee of $2,000 for each special board meeting and all committee meetings as well as reimbursement of reasonable and documented out-of-pocket expenses incurred in connection with attending each board or committee meeting. In addition, the chairman of the audit committee receives an annual retainer of $15,000, while the chairman of any other committee receives an annual retainer of $5,000. Effective January 21, 2016, the lead independent director receives an annual retainer of $10,000. For the years ended December 31, 2016, 2015, and 2014, the Company recorded directors' fees expenses in General and Administrative expenses on the consolidated statements of operations of $285,972, $247,625, and $174,600, respectively, of which no amount was payable at December 31, 2016, 2015 and 2014.
Note 10. Earnings Per Share
In accordance with the provisions of ASC Topic 260 - Earnings per Share, basic earnings per share is computed by dividing earnings available to common shareholders by the weighted average number of shares outstanding during the period. Other potentially dilutive common shares, and the related impact to earnings, are considered when calculating earnings per share on a diluted basis.
The following table sets forth the computation of the weighted average basic and diluted net increase in net assets per share from operations for the years ended December 31, 2016, 2015 and 2014:
2016 | 2015 | 2014 | |||||||||
Net increase/(decrease) in net assets from operations | $ | 69,328,795 | $ | (10,112,813 | ) | $ | 14,052,250 | ||||
Weighted average common stock outstanding | 90,424,090 | 70,648,292 | 35,425,825 | ||||||||
Weighted average basic and diluted net increase/(decrease) in net assets per share from operations | $ | 0.77 | $ | (0.14 | ) | $ | 0.40 | ||||
Note 11. Commitments
As of December 31, 2016 and 2015, the Company had $26,944,304 and $14,170,243, respectively, of unfunded commitments under loan and financing agreements. These amounts are primarily composed of commitments for senior secured term loans, revolvers, and additional capital contributions for the Sierra JV. The unrealized gain or loss associated with unfunded commitments is recorded in the financial statements and reflected as an adjustment to the valuation of the related security in the Consolidated Schedule of Investments. The par amount of the unfunded commitments are not recognized by the Company until the commitment is funded.
F- 59
As of December 31, | |||||||
2016 | 2015 | ||||||
AAAHI Acquisition Corporation | $ | 2,219,626 | $ | — | |||
AAR Intermediate Holdings, LLC | 477,961 | — | |||||
Alpha Media LLC | — | 1,645,313 | |||||
Black Angus Steakhouses LLC | 3,794,643 | 3,571,429 | |||||
CP Opco, LLC | 9,291 | — | |||||
DHISCO Electronic Distribution, Inc. | — | 1,904,762 | |||||
Elite Comfort Solutions LLC | 4,438,616 | — | |||||
First Boston Construction Holdings, LLC | 600,000 | 2,636,719 | |||||
Impact Sales, LLC | 1,562,500 | — | |||||
Nuspire, LLC | 2,500,000 | — | |||||
PT Network, LLC | 4,166,667 | — | |||||
Ship Supply Acquisition Corporation | — | 3,048,780 | |||||
Sierra Senior Loan Strategy JV I LLC | 875,000 | — | |||||
SMART Financial Operations, LLC | 6,300,000 | — | |||||
Software Paradigms International Group, LLC | — | 1,363,240 | |||||
Total Commitments | $ | 26,944,304 | $ | 14,170,243 | |||
Note 12. Fee Income
Fee income consists of origination/fee, amendment fee, prepayment penalty, administrative agent fee, transaction break-up fee and other miscellaneous fees. Origination fees, prepayment fees, amendment fees, and other similar fees are non-recurring fee sources. Such fees are received on a transaction by transaction basis and do not constitute a regular stream of income. The following tables summarize the Company’s fee income for the years ended December 31, 2016, 2015 and 2014:
2016 | 2015 | 2014 | |||||||||
Origination fee | $ | 3,109,643 | $ | 8,083,671 | $ | 6,495,134 | |||||
Prepayment fee | 4,384,637 | 1,169,104 | 889,548 | ||||||||
Amendment fee | 1,000,804 | 1,233,349 | 214,517 | ||||||||
Administrative agent fee | 82,998 | 32,152 | 26,738 | ||||||||
Other fees | 125,814 | 132,981 | 317,923 | ||||||||
Other fee income | $ | 8,703,896 | $ | 10,651,257 | $ | 7,943,860 | |||||
Note 13. Distributions and Share Repurchase Plan Distributions
Distributions to common stockholders are recorded on the ex-dividend date. The amount to be paid out as a distribution is determined by the Company’s board of directors.
The Company has adopted an “opt in” distribution reinvestment plan (“DRIP”) pursuant to which the Company’s common stockholders may elect to have the full amount of any cash distributions reinvested in additional shares of the Company’s common stock. As a result, if the Company declares a cash dividend or other distribution, each stockholder that has “opted in” to the Company’s reinvestment plan will have their distributions automatically reinvested in additional shares of the Company’s common stock rather than receiving cash distributions. Stockholders who receive distributions in the form of shares of common stock will be subject to the same federal, state and local tax consequences as if they received cash distributions. For the year ended December 31, 2016, the Company distributed a total of $68,596,940, of which $36,118,048 was in cash and $32,478,892 was in the form of common shares associated with the DRIP. For the year ended December 31, 2015, the Company distributed a total of $56,804,630, of which $29,576,900 was in cash and $27,227,730 was in the form of common shares associated with the DRIP. For the year ended December 31, 2014, the Company distributed a total of $28,792,495, of which $15,631,945 was in cash and $13,160,550 was in the form of common shares associated with the DRIP.
F- 60
The following table reflects the cash distributions per share that the Company has declared or paid to its stockholders for the current and prior fiscal years. Stockholders of record as of each respective record date were entitled to receive the distribution.
Record Date | Payment Date | Amount per share | ||||
January 15 and 30, 2015 | January 30, 2015 | $ | 0.03333 | |||
February 13 and 27, 2015 | February 27, 2015 | 0.03333 | ||||
March 13 and 31, 2015 | March 31, 2015 | 0.03333 | ||||
April 15 and 30, 2015 | April 30, 2015 | 0.03333 | ||||
May 15 and 29, 2015 | May 29, 2015 | 0.03333 | ||||
June 15 and 30, 2015 | June 30, 2015 | 0.03333 | ||||
July 15 and 31, 2015 | July 31, 2015 | 0.03333 | ||||
August 14 and 31, 2015 | August 31, 2015 | 0.03333 | ||||
September 15 and 30, 2015 | September 30, 2015 | 0.03333 | ||||
October 15 and 30, 2015 | October 30, 2015 | 0.03333 | ||||
November 13 and 30, 2015 | November 30, 2015 | 0.03333 | ||||
December 15 and 31, 2015 | December 31, 2015 | 0.03333 | ||||
January 15 and 29, 2016 | January 29, 2016 | 0.03333 | ||||
February 12 and 29, 2016 | February 29, 2016 | 0.03333 | ||||
March 15 and 31, 2016 | March 31, 2016 | 0.03333 | ||||
April 15 and 29, 2016 | April 29, 2016 | 0.03333 | ||||
May 13 and 31, 2016 | May 31, 2016 | 0.03333 | ||||
June 15 and 30, 2016 | June 30, 2016 | 0.03333 | ||||
July 15 and 29, 2016 | July 29, 2016 | 0.03333 | ||||
August 15 and 31, 2016 | August 31, 2016 | 0.03333 | ||||
September 15 and 30, 2016 | September 30, 2016 | 0.03333 | ||||
October 14 and 31, 2016 | October 31, 2016 | 0.02667 | ||||
November 15 and 30, 2016 | November 30, 2016 | 0.02667 | ||||
December 15 and 30, 2016 | December 31, 2016 | 0.02667 | ||||
The Company’s distributions may be funded from offering proceeds or borrowings, which may constitute a return of capital and reduce the amount of capital available to the Company for investment. Any capital returned to stockholders through distributions will be distributed after payment of fees and expenses.
The Company’s previous distributions to stockholders may have been funded from temporary Expense Support Reimbursements that may be subject to repayment to SIC Advisors, See Note 7. The portion of these distributions derived from temporary Expense Support Reimbursements were not based on the Company's investment performance and may not continue in the future. If SIC Advisors had not agreed to make Expense Support Reimbursements, these distributions would have come from paid-in-capital. The reimbursement of these payments owed to SIC Advisors will reduce the future distributions to which stockholders would otherwise be entitled. The Expense Support Agreement expired on December 31, 2016, and was not renewed. See Note 7 for more information.
The determination of the tax attributes (i.e., paid from ordinary income, paid from net capital gains on the sale of securities, and/or a return of paid-in-capital surplus which is a nontaxable distribution) of distributions is made annually as of the end of the Company’s fiscal year based upon its taxable income earned and distributions paid during the fiscal year.
Share Repurchase Program
In June 2013, the Company commenced a share repurchase program pursuant to which it intends to conduct quarterly share repurchases of up to 2.5% of the weighted average number of outstanding shares of its common stock in the prior four calendar quarters or 10% of the weighted average number of outstanding shares in the prior 12-month period. The purpose of the share repurchase program is to allow stockholders to sell their shares back to the Company at a price equal to the most recently disclosed NAV per share of the Company's common stock immediately prior to the date of repurchase. Shares will be purchased from stockholders participating in the program on a pro rata basis. Unless the Company's board of directors determines otherwise, the number of shares to be repurchased during any calendar year will be limited to the proceeds received in association with the sale of shares of common stock under the distribution reinvestment plan.
F- 61
The following table reflects activity under the Company’s Share Repurchase Plan:
Offer Date | Quantity Offered | Price per Share | Repurchase Date | Repurchase Quantity | |||||||||
6/4/2013 | 16,652 | $ | 9.18 | — | — | ||||||||
8/8/2013 | 32,627 | 9.13 | 9/27/2013 | 3,642 | |||||||||
11/7/2013 | 60,966 | 9.14 | 12/19/2013 | 5,826 | |||||||||
3/12/2014 | 120,816 | 9.18 | 4/25/2014 | 9,835 | |||||||||
5/6/2014 | 199,476 | 9.20 | 6/13/2014 | 17,777 | |||||||||
8/5/2014 | 294,068 | 9.25 | 9/12/2014 | 35,887 | |||||||||
11/5/2014 | 411,894 | 9.22 | 12/24/2014 | 411,894 | |||||||||
3/4/2015 | 535,571 | 8.97 | 4/24/2015 | 68,472 | |||||||||
5/6/2015 | 620,420 | 8.98 | 6/24/2015 | 90,916 | |||||||||
8/5/2015 | 727,654 | 8.96 | 9/29/2015 | 328,353 | |||||||||
11/3/2015 | 853,688 | 8.56 | 12/23/2015 | 285,559 | |||||||||
3/2/2016 | 959,436 | 8.16 | 4/29/2016 | 959,436 | |||||||||
5/5/2016 | 1,005,447 | 8.04 | 6/30/2016 | 855,215 | |||||||||
8/4/2016 | 1,048,412 | 8.11 | 9/28/2016 | 1,048,407 | |||||||||
11/25/2016 | 1,077,370 | $ | 8.14 | 12/27/2016 | 1,077,352 | ||||||||
In the event of the death or disability of a stockholder, the Company will repurchase the shares held by such stockholder at a price equal to the NAV per share of our shares as disclosed in the periodic report the Company files with the SEC immediately following the date of the death or disability of such stockholder. During the years ended December 31, 2016, 2015 and 2014, the Company repurchased 5,355, 34,560 and 3,000 shares of certain shareholders due to death.
F- 62
Note 14. Financial Highlights
The following is a schedule of financial highlights of the Company for the years ended December 31, 2016, 2015, 2014, 2013 and the period from April 17, 2012 (commencement of operations) through December 31, 2012:
2016 | 2015 | 2014 | 2013 | For the Period from April 17, 2012 (commencement of operations) through December 31, 2012 | |||||||||||||||
Per Share Data:(1) | |||||||||||||||||||
Net asset value at beginning of period | $ | 8.16 | $ | 8.97 | $ | 9.18 | $ | 8.96 | $ | 9.03 | |||||||||
Net investment income/(loss) | 0.66 | 0.66 | 0.55 | 0.72 | 0.33 | ||||||||||||||
Net realized gains/(losses) on investments and total return swap | (0.15 | ) | 0.16 | 0.20 | 0.01 | 0.01 | |||||||||||||
Net unrealized appreciation/(depreciation) on investments and total return swap | 0.25 | (0.96 | ) | (0.35 | ) | 0.12 | (0.01 | ) | |||||||||||
Net increase/(decrease) in net assets | 0.76 | (0.14 | ) | 0.40 | 0.85 | 0.33 | |||||||||||||
Distributions from return of capital | — | — | (0.19 | ) | — | — | |||||||||||||
Distributions declared from net investment income(2) | (0.76 | ) | (0.80 | ) | (0.61 | ) | (0.80 | ) | (0.39 | ) | |||||||||
Distributions from net realized capital gains | — | — | — | — | (0.01 | ) | |||||||||||||
Total distributions to shareholders | $ | (0.76 | ) | $ | (0.80 | ) | $ | (0.80 | ) | $ | (0.80 | ) | $ | (0.40 | ) | ||||
Issuance of common shares above net asset value(3) | 0.01 | 0.13 | 0.19 | 0.17 | — | ||||||||||||||
Net asset value at end of period | $ | 8.17 | $ | 8.16 | $ | 8.97 | $ | 9.18 | $ | 8.96 | |||||||||
Total return based on net asset value(4)(5) | 9.87 | % | (0.46 | )% | 6.48 | % | 11.75 | % | 3.35 | % | |||||||||
Portfolio turnover rate | 26.33 | % | 23.66 | % | 37.17 | % | 51.30 | % | 18.86 | % | |||||||||
Shares outstanding at end of period | 94,666,418 | 82,623,649 | 54,260,324 | 16,663,500 | 2,300,573 | ||||||||||||||
Net assets at end of period | $773,113,087 | $674,124,099 | $486,519,913 | $153,002,273 | $20,622,982 | ||||||||||||||
Ratio/Supplemental Data (annualized): | |||||||||||||||||||
Ratio of net investment income/(loss) to average net assets(5) | 8.20 | % | 7.57 | % | 6.09 | % | 7.56 | % | 5.64%(6) | ||||||||||
Ratio of net expenses (including incentive fees) to average net assets(5) | 5.44 | % | 6.37 | % | 6.17 | % | 3.77 | % | 8.58%(6) | ||||||||||
Ratio of incentive fees to average net assets (non-annualized) | 1.27 | % | 0.72 | % | (0.06 | )% | 0.26 | % | 0.01%(6) | ||||||||||
Supplemental Data (annualized): | |||||||||||||||||||
Asset coverage ratio per unit(7) | $2,476 | $2,386 | $2,211 | $5,480 | $2,189 | ||||||||||||||
Percentage of non-recurring fee income(8) | 8.64 | % | 12.40 | % | 20.10 | % | 7.72 | % | 0.55%(6) | ||||||||||
Ratio of net expenses (excluding incentive fees) to average net assets | 4.18 | % | 5.65 | % | 6.23 | % | 3.51 | % | 8.57%(6) | ||||||||||
Ratio of interest and financing related expenses to average net assets | 1.85 | % | 1.62 | % | 0.98 | % | 0.26 | % | 0.55%(6) | ||||||||||
________________________________
(1) | The per share data was derived by using the weighted average shares outstanding during the years ended December 31, 2016, 2015, 2014, 2013 and the period ended December 31, 2012 which were 94,666,418, 70,648,292, 35,425,825, 7,426,660 and 1,452,160 respectively. |
(2) | The per share data for distributions is the actual amount of paid distributions per share during the period. |
(3) | Shares issued under the DRIP (see Note 13) as well as the continuous issuance of common shares may cause on incremental increase/decrease in NAV per share due to the effect of issuing shares at amounts that differ from the prevailing NAV at each issuance. |
(4) | Total annual returns are historical and assume reinvestments of all dividends and distributions at prices obtained under the Company’s dividend reinvestment plan, and no sales charge. |
(5) | Total returns, ratios of net investment income/(loss), and ratios of gross expenses to average net assets for the years ended December 31, 2016, 2015, 2014, 2013 and the period ended December 31, 2012, prior to the effect of the Expense Support and Reimbursement Agreement were as follows: total return 7.57%, (1.76)%, 5.00%, 8.88% and (4.00)% and ratio of net investment income/(loss): 8.32%, 6.54%, 4.51%, 2.04% and (12.01)% and ratio of gross expenses to average net assets: 7.76%, 7.39%, 7.87%, 9.61% and 27.22%, respectively. |
(6) | Annualized. The period from June 10, 2011 (inception) to April 16, 2012 is not presented as the Company had not commenced operations. |
(7) | Asset coverage per unit is the ratio of the carrying value of the Company's total consolidated assets for regulatory purposes, which includes the underlying fair value of net TRS, less all liabilities and indebtedness not represented by senior securities to the aggregate amount of Senior Securities representing indebtedness and the implied leverage on the TRS. Asset coverage per unit is expressed in terms of dollars per $1,000 of indebtedness. For the years ended December 31, 2016, 2015, 2014, 2013 and the period ended December 31, 2012 the Company's Asset Coverage Per Unit including unfunded commitments was $2,355, $2,318, $2,141, $5,480 and $2,189, respectively. |
(8) | Represents the impact of non-recurring fees over total investment income. |
F- 63
Note 15. Selected Quarterly Financial Data (unaudited)
Quarter Ended | |||||||||||||
December 31, 2016 | September 30, 2016 | June 30, 2016 | March 31, 2016 | ||||||||||
Total investment income | $ | 26,608,281 | $ | 25,148,661 | 24,797,049 | 23,226,505 | |||||||
Total investment income per common share | 0.28 | 0.27 | 0.27 | 0.27 | |||||||||
Net investment income | 13,673,095 | 15,609,962 | 16,159,711 | 14,521,704 | |||||||||
Net investment income per common share | 0.14 | 0.17 | 0.18 | 0.17 | |||||||||
Net realized and unrealized gain/(loss) | 3,825,620 | 5,224,610 | 8,561,077 | (8,246,984 | ) | ||||||||
Net realized and unrealized gain/(loss) per common share | 0.04 | 0.06 | 0.09 | (0.09 | ) | ||||||||
Net increase/(decrease) in net assets resulting from operations | 17,498,715 | 20,834,572 | 24,720,788 | 6,274,720 | |||||||||
Basic and diluted earnings/(loss) per common share | 0.18 | 0.23 | 0.28 | 0.07 | |||||||||
Net asset value per common share at end of quarter | 8.17 | 8.14 | 8.11 | 8.04 | |||||||||
Quarter Ended | |||||||||||||||
December 31, 2015 | September 30, 2015 | June 30, 2015 | March 31, 2015 | ||||||||||||
Total investment income | $ | 23,853,088 | $ | 23,479,346 | $ | 22,300,447 | $ | 16,006,819 | |||||||
Total investment income per common share | 0.29 | 0.31 | 0.33 | 0.27 | |||||||||||
Net investment income | 13,980,254 | 11,508,990 | 12,111,932 | 8,899,327 | |||||||||||
Net investment income per common share | 0.17 | 0.15 | 0.18 | 0.15 | |||||||||||
Net realized and unrealized gain/(loss) | (31,161,585 | ) | (28,007,718 | ) | (542,566 | ) | 3,098,553 | ||||||||
Net realized and unrealized gain/(loss) per common share | (0.38 | ) | (0.38 | ) | (0.01 | ) | 0.05 | ||||||||
Net increase/(decrease) in net assets resulting from operations | (17,181,331 | ) | (16,498,728 | ) | 11,569,366 | 11,997,880 | |||||||||
Basic and diluted earnings/(loss) per common share | (0.21 | ) | (0.22 | ) | 0.17 | 0.21 | |||||||||
Net asset value per common share at end of quarter | 8.16 | 8.56 | 8.96 | 8.98 | |||||||||||
Quarter Ended | |||||||||||||||
December 31, 2014 | September 30, 2014 | June 30, 2014 | March 31, 2014 | ||||||||||||
Total investment income | $ | 15,926,766 | $ | 12,054,651 | $ | 6,813,824 | $ | 4,596,214 | |||||||
Total investment income per common share | 0.31 | 0.30 | 0.23 | 0.23 | |||||||||||
Net investment income | 9,005,148 | 4,312,499 | 3,756,119 | 2,492,649 | |||||||||||
Net investment income per common share | 0.18 | 0.11 | 0.13 | 0.12 | |||||||||||
Net realized and unrealized gain/(loss) | (12,958,538 | ) | 2,010,264 | 3,479,210 | 1,954,899 | ||||||||||
Net realized and unrealized gain/(loss) per common share | (0.25 | ) | 0.05 | 0.12 | 0.10 | ||||||||||
Net increase/(decrease) in net assets resulting from operations | (3,953,390 | ) | 6,322,763 | 7,235,329 | 4,447,548 | ||||||||||
Basic and diluted earnings/(loss) per common share | (0.08 | ) | 0.16 | 0.25 | 0.22 | ||||||||||
Net asset value per common share at end of quarter | 8.97 | 9.22 | 9.25 | 9.20 | |||||||||||
Note 16. Subsequent Events
Management has evaluated subsequent events through the date of issuance of the consolidated financial statements included herein. There have been no subsequent events that occurred during such period that would require disclosure in this Form 10-K or would be required to be recognized in the consolidated financial statements as of and for the year ended December 31, 2016, except as disclosed below.
The Company issued common shares and received gross proceeds of approximately $5.8 million subsequent to December 31, 2016.
F- 64
Item 9. Changes in and Disagreements with Accountants on Accounting and Financial Disclosure
None.
Item 9A. Controls and Procedures
Evaluation of Disclosure Controls and Procedures
Our Chief Executive Officer and Chief Financial Officer, under the supervision and with the participation of our management, conducted an evaluation of our disclosure controls and procedures, as defined in Rules 13a-15(e) and 15d-15(e) of the Exchange Act. As of the end of the period covered by this annual report on Form 10-K, our Chief Executive Officer and Chief Financial Officer have concluded that our disclosure controls and procedures were effective to ensure that information required to be disclosed by us in reports that we file or submit under the Exchange Act is recorded, processed, summarized, and reported within the time periods specified in the SEC’s rules and forms, and that information required to be disclosed by us in the reports that we file or submit under the Exchange Act is accumulated and communicated to our management, including our Chief Executive Officer and Chief Financial Officer, as appropriate to allow timely decisions regarding required disclosure.
Management’s Report on Internal Control Over Financial Reporting
Our management is responsible for establishing and maintaining adequate internal control over financial reporting as such term is defined in Exchange Act Rule 13a-15(f), and for performing an assessment of the effectiveness of internal control over financial reporting as of December 31, 2016. Internal control over financial reporting is a process designed by, or under the supervision of, our principal executive and principal financial officers, or persons performing similar functions, and effected by our board of directors, management and other personnel, to provide reasonable assurance regarding the reliability of financial reporting and the preparation of financial statements for external purposes in accordance with generally accepted accounting principles. Our internal control over financial reporting includes those policies and procedures that (i) pertain to the maintenance of records that in reasonable detail accurately and fairly reflect the transactions and dispositions of assets of the company; (ii) provide reasonable assurance that transactions are recorded as necessary to permit preparation of financial statements in accordance with generally accepted accounting principles, and that receipts and expenditures are being made only in accordance with authorizations; and (iii) provide reasonable assurance regarding prevention or timely detection of unauthorized acquisition, use, or disposition of our assets that could have a material effect on the financial statements.
Because of its inherent limitations, internal control over financial reporting may not prevent or detect misstatements. Therefore, even those systems determined to be effective can provide only reasonable assurance with respect to financial statement preparation and presentation.
Management performed an assessment of the effectiveness of our internal control over financial reporting as of December 31, 2016 based upon the criteria set forth in Internal Control — Integrated Framework (2013) issued by the Committee of Sponsoring Organizations of the Treadway Commission (“COSO”). Based on our assessment, management determined that our internal control over financial reporting was effective as of December 31, 2016.
Changes in Internal Control Over Financial Reporting
There have been no changes in our internal control over financial reporting, as defined in Rules 13a-15(f) and 15d-15(f) of the Exchange Act that occurred during our most recently completed fiscal quarter that have materially affected, or are reasonably likely to materially affect, our internal control over financial reporting.
Item 9B. Other Information
None.
PART III
Item 10. Directors, Executive Officers and Corporate Governance
The information required by Item 10 is hereby incorporated by reference from our definitive Proxy statement relating to our 2017 Annual Meeting of Stockholders, to be filed with the Securities and Exchange Commission within 120 days following the end of our fiscal year.
83
Item 11. Executive Compensation
The information required by Item 11 is hereby incorporated by reference from our definitive Proxy Statement relating to our 2017 Annual Meeting of Stockholders, to be filed with the Securities and Exchange Commission within 120 days following the end of our fiscal year.
Item 12. Security Ownership of Certain Beneficial Owners and Management and Related Stockholder Matters
The information required by Item 12 is hereby incorporated by reference from our definitive Proxy Statement relating to our 2017 Annual Meeting of Stockholders, to be filed with the Securities and Exchange Commission within 120 days following the end of our fiscal year.
Item 13. Certain Relationships and Related Transactions, and Director Independence
The information required by Item 13 is hereby incorporated by reference from our definitive Proxy Statement relating to our 2017 Annual Meeting of Stockholders, to be filed with the Securities and Exchange Commission within 120 days following the end of our fiscal year.
Item 14. Principal Accountant Fees and Services
The information required by Item 14 is hereby incorporated by reference from our definitive Proxy Statement relating to our 2017 Annual Meeting of Stockholders, to be filed with the Securities and Exchange Commission within 120 days following the end of our fiscal year.
PART IV
Item 15. Exhibits and Financial Statement Schedules
(a) | The following documents are filed as part of this Annual Report: |
1. The following consolidated financial statements are set forth in Item 8:
Page | |
Report of Independent Registered Public Accounting Firm | F-1 |
Consolidated Statements of Assets and Liabilities as of December 31, 2016 and 2015 | F-2 |
Consolidated Statements of Operations for the years ended December 31, 2016, 2015 and 2014 | F-3 |
Consolidated Statements of Changes in Net Assets for the years ended December 31, 2016, 2015 and 2014 | F-4 |
Consolidated Statements of Cash Flows for the years ended December 31, 2016, 2015 and 2014 | F-5 |
Consolidated Schedule of Investments as of December 31, 2016 and 2015 | F-7 |
Notes to Consolidated Financial Statements | F-24 |
3. Exhibits required to be filed by Item 601 of Regulation S-K
Please note that the agreements included as exhibits to this Form 10-K are included to provide information regarding their terms and are not intended to provide any other factual or disclosure information about us or the other parties to the agreements. The agreements contain representations and warranties by each of the parties to the applicable agreement that have been made solely for the benefit of the other parties to the applicable agreement and may not describe the actual state of affairs as of the date they were made or at any other time.
The following exhibits are filed as part of this report or hereby incorporated by reference to exhibits previously filed with the SEC:
3.1 | Articles of Incorporation of the Registrant(1) | |
3.2 | Articles of Amendment of the Registrant(1) | |
3.3 | Articles of Amendment and Restatement of the Registrant(3) | |
3.4 | Second Articles of Amendment and Restatement of the Registrant(6) | |
3.5 | Form of Articles Supplementary Electing to be Subject to Subtitle 8 of the Maryland General Corporation Law(15) | |
3.6 | Form of Bylaws of the Registrant(1) | |
84
10.1 | Form of Subscription Agreement(12) | |
10.2 | Amended and Restated Distribution Reinvestment Plan(8) | |
10.3 | Investment Advisory Agreement(5) | |
10.4 | Form of Second Amended and Restated Dealer Manager Agreement(16) | |
10.5 | Form of Participating Broker-Dealer Agreement (Included as Exhibit A to the Form of Amended and Restated Dealer Manager Agreement)(16) | |
10.6 | Custody Agreement(2) | |
10.7 | Form of Administration Agreement(2) | |
10.8 | Form of License Agreement(5) | |
10.9 | Form of Escrow Agreement(4) | |
10.10 | Expense Support and Reimbursement Agreement(7) | |
10.11 | ISDA 2002 Master Agreement, together with the Schedule thereto and Credit Support Annex to such Schedule, each dated as of August 27, 2013, by and between Arbor Funding LLC and Citibank, N.A.(9) | |
10.12 | Fourth Amended and Restated Confirmation Letter Agreement, dated as of March 21, 2016, by and between Arbor Funding LLC and Citibank, N.A.(17) | |
10.13 | Amended and Restated Senior Secured Revolving Credit Agreement among the Company as borrower, the Lenders party thereto, and ING Capital LLC, as Administrative Agent, dated as of August 12, 2016(18) | |
10.14 | Guarantee, Pledge and Security Agreement among the Company, the Subsidiary Guarantors party thereto, ING Capital LLC, as Administrative Agent, each Financial Agent and Designated Indebtedness Holder party thereto and ING Capital LLC, as Collateral Agent, dated December 4, 2013(10) | |
10.15 | Control Agreement among the Company, ING Capital LLC, as collateral agent, and State Street Bank and Trust Company, as the Company’s Custodian, dated December 4, 2013(10) | |
10.16 | Loan Agreement, dated as of July 23, 2014, by and among Alpine Funding LLC, as company, JPMorgan Chase Bank, National Association, as administrative agent, the Financing Providers from time to time party thereto, SIC Advisors LLC, as the portfolio manager, and the Collateral Administrator, Collateral Agent and Securities Intermediary party thereto(11) | |
10.17 | Sale and Contribution Agreement, dated as of July 23, 2014, by and between Sierra Income Corporation, as seller, and Alpine Funding LLC, as purchaser(11) | |
10.18 | Portfolio Management Agreement, dated as of July 23, 2014, by and between Alpine Funding LLC, as borrower and SIC Advisors LLC, as portfolio manager(11) | |
10.19 | Amendment No. 1 to the Loan Agreement, dated as of July 23, 2014, by and among Alpine Funding LLC, as borrower, JPMorgan Chase Bank, National Association, as administrative agent, the Financing Providers from time to time party thereto, SIC Advisors LLC, as the portfolio manager, and the Collateral Administrator, Collateral Agent and Securities Intermediary party thereto(13) | |
10.20 | Limited Liability Company Operating Agreement of Sierra Senior Loan Strategy JV I LLC, dated March 27, 2015(14) | |
11 | Computation of Per Share Earnings (included in the notes to the financial statements contained in this report) | |
85
12 | Computation of Ratio of Earnings to Fixed Charges (included in the notes to the financial statements contained in this report) | |
21 | List of Subsidiaries* | |
31.1 | Certification by Chief Executive Officer pursuant to Exchange Act Rule 13a-14(a), as adopted pursuant to Section 302 of the Sarbanes-Oxley Act of 2002* | |
31.2 | Certification by Chief Financial Officer pursuant to Exchange Act Rule 13a-14(a), as adopted pursuant to Section 302 of the Sarbanes-Oxley Act of 2002* | |
32 | Certification pursuant to 18 U.S.C. Section 1350, as adopted pursuant to Section 906 of the Sarbanes-Oxley Act of 2002* | |
____________________________
* | Filed herewith. |
(1) | Previously filed in connection with Pre-Effective Amendment No. 2 to the Registrant’s Registration Statement on Form N-2 (File No. 333-175624), filed on November 3, 2011, and incorporated by reference herein. |
(2) | Previously filed in connection with Pre-Effective Amendment No. 3 to the Registrant’s Registration Statement on Form N-2 (File No. 333-175624), filed on February 21, 2012, and incorporated by reference herein. |
(3) | Previously filed in connection with Pre-Effective Amendment No. 4 to the Registrant’s Registration Statement on Form N-2 (File No. 333-175624), filed on March 12, 2012, and incorporated by reference herein. |
(4) | Previously filed in connection with Pre-Effective Amendment No. 5 to the Registrant’s Registration Statement on Form N-2 (File No. 333-175624), filed on March 21, 2012, and incorporated by reference herein. |
(5) | Previously filed in connection with Pre-Effective Amendment No. 6 to the Registrant’s Registration Statement on Form N-2 (File No. 333-175624), filed on April 10, 2012, and incorporated by reference herein. |
(6) | Previously filed as Exhibit 3.1 to the Registrant’s Current Report on Form 8-K filed on June 14, 2012, and incorporated by reference herein. |
(7) | Previously filed as an exhibit to the Registrant’s Current Report on Form 8-K filed on July 20, 2012, and incorporated by reference herein. |
(8) | Previously filed as an exhibit to the Registrant’s Current Report on Form 8-K filed on September 26, 2012, and incorporated by reference herein. |
(9) | Previously filed as an exhibit to the Registrant’s Current Report on Form 8-K filed on September 3, 2013, and incorporated by reference herein. |
(10) | Previously filed as an exhibit to the Registrant’s Current Report on Form 8-K filed on December 9, 2013, and incorporated by reference herein. |
(11) | Previously filed as an exhibit to the Registrant’s Current Report on Form 8-K filed on July 23, 2014, and incorporated by reference herein. |
(12) | Previously filed in connection with Registrant’s Post-Effective Amendment No. 3 to its Registration Statement on Form N-2 (File No. 333-200595), filed on December 16, 2016, and incorporated by reference herein. |
(13) | Previously filed as an exhibit to Registrant’s Current Report on Form 8-K filed on February 10, 2015, and incorporated by reference herein. |
(14) | Previously filed as an exhibit to Registrant’s Current Report on Form 8-K filed on March 30, 2015, and incorporated by reference herein. |
(15) | Previously filed in connection with Registrant’s Pre-Effective Amendment No. 4 to its Registration Statement on Form N-2 (File No. 333-200595), filed on October 6, 2015, and incorporated by reference herein. |
(16) | Previously filed in connection with Post-Effective Amendment No. 1 to the Registrant’s Registration Statement on Form N-2 (File No. 333-200595), filed on May 9, 2016, and incorporated by reference herein. |
(17) | Previously filed as an exhibit to the Registrant’s Current Report on Form 8-K, filed on March 24, 2016, and incorporated by reference herein. |
(18) | Previously filed as an exhibit to the Registrant’s Current Report on Form 8-K filed on August 17, 2016, and incorporated by reference herein. |
86
SIGNATURES
Pursuant to the requirements Section 13 or 15(d) of the Securities Exchange Act of 1934, the registrant has duly caused this Annual Report on Form 10-K to be signed on its behalf by the undersigned thereunto duly authorized.
Dated: March 6, 2017 | Sierra Income Corporation. | ||
By | /s/ Seth Taube | ||
Seth Taube Chief Executive Officer (Principal Executive Officer) | |||
By | /s/ Christopher M. Mathieu | ||
Christopher M. Mathieu Chief Financial Officer (Principal Accounting and Financial Officer) | |||
Pursuant to the requirements of the Securities Exchange Act of 1934, this Annual Report on Form 10-K has been signed below by the following persons on behalf of the registrant and in the capacities and on the dates indicated.
Signature | Title | Date | ||
/s/ Seth Taube | Chief Executive Officer and Chairman of the Board of Directors (Principal Executive Officer) | March 6, 2017 | ||
Seth Taube | ||||
/s/ Christopher M. Mathieu | Chief Financial Officer (Principal Financial and Accounting Officer) | March 6, 2017 | ||
Christopher M. Mathieu | ||||
/s/ Brook Taube | Director | March 6, 2017 | ||
Brook Taube | ||||
/s/ Oliver T. Kane | Director | March 6, 2017 | ||
Oliver T. Kane | ||||
/s/ Valerie Lancaster-Beal | Director | March 6, 2017 | ||
Valerie Lancaster-Beal | ||||
/s/ Stephen R. Byers | Director | March 6, 2017 | ||
Stephen R. Byers | ||||
87