Attached files
| file | filename |
|---|---|
| EX-32.1 - EXHIBIT 32.1 - Sierra Income Corp | ex_221763.htm |
| EX-31.2 - EXHIBIT 31.2 - Sierra Income Corp | ex_221762.htm |
| EX-31.1 - EXHIBIT 31.1 - Sierra Income Corp | ex_221761.htm |
| EX-21.1 - EXHIBIT 21.1 - Sierra Income Corp | ex_221760.htm |
UNITED STATES
SECURITIES AND EXCHANGE COMMISSION
WASHINGTON, DC 20549
Form 10-K
(Mark One)
|
☒ |
ANNUAL REPORT PURSUANT TO SECTION 13 OR 15(d) OF THE SECURITIES EXCHANGE ACT OF 1934 |
For the fiscal year ended December 31, 2020
or
|
☐ |
TRANSITION REPORT PURSUANT TO SECTION 13 OR 15(d) OF THE SECURITIES EXCHANGE ACT OF 1934 |
For the transition period from to
Commission file number: 814-00924
Sierra Income Corporation
(Exact Name of Registrant as Specified in its Charter)
|
Maryland |
|
45-2544432 |
|
(State or Other Jurisdiction of Incorporation or Organization) |
|
(I.R.S. Employer Identification No.) |
|
280 Park Avenue, 6th Floor East, New York, NY 10017 |
|
10017 |
|
(Address of Principal Executive Offices) |
|
(Zip Code) |
(212) 759-0777
(Registrant’s Telephone Number, Including Area Code)
Securities registered pursuant to Section 12(b) of the Act: None
Securities registered pursuant to Section 12(g) of the Act: Common Stock, par value $0.001 per share
Indicate by check mark if the registrant is a well-known seasoned issuer, as defined in Rule 405 of the Securities Act. Yes ☐ No ☒
Indicate by check mark if the registrant is not required to file reports pursuant to Section 13 or 15(d) of the Act. Yes ☐ No ☒
Indicate by check mark whether the registrant: (1) has filed all reports required to be filed by Section 13 or 15(d) of the Securities Exchange Act of 1934 during the preceding 12 months (or for such shorter period that the registrant was required to file such reports), and (2) has been subject to such filing requirements for the past 90 days. Yes ☒ No ☐
Indicate by check mark whether the registrant has submitted electronically, every Interactive Data File required to be submitted and posted pursuant to Rule 405 of Regulation S-T (§232.405 of this chapter) during the preceding 12 months (or for such shorter period that the registrant was required to submit and post such files). Yes ☐ No ☐
Indicate by check mark whether the registrant is a large accelerated filer, an accelerated filer, a non-accelerated filer, a smaller reporting company or an emerging growth company. See definitions of “large accelerated filer”, “accelerated filer”, “smaller reporting company” and "emerging growth company" in Rule 12b-2 of the Exchange Act. (Check one):
|
Large accelerated filer |
|
☐ |
|
Accelerated filer |
|
☐ |
|
Non-accelerated filer |
|
☒ |
|
Smaller reporting company |
|
☐ |
|
Emerging growth company |
|
☐ |
|
|
|
|
If an emerging growth company, indicate by check mark if the registrant has elected not to use the extended transition period for complying with any new or revised financial accounting standards provided pursuant to Section 13(a) of the Exchange Act. ☐
Indicate by check mark whether the registrant has filed a report on and attestation to its management’s assessment of the effectiveness of its internal control over financial reporting under Section 404(b) of the Sarbanes-Oxley Act (15 U.S.C. 7262(b)) by the registered public accounting firm that prepared or issued its audit report. ☐
Indicate by check mark whether the registrant is a shell company (as defined in Rule 12b-2 of the Securities Exchange Act of 1934). Yes ☐ No ☒
As of March 19, 2021, the Registrant had 102,771,530 shares of common stock, $0.001 par value, outstanding.
DOCUMENTS INCORPORATED BY REFERENCE
Portions of the registrant’s proxy statement to be filed with the Securities and Exchange Commission pursuant to Regulation 14A in connection with the registrant’s 2021 Annual Meeting of Stockholders, which will be filed subsequent to the date hereof, are incorporated by reference into Part III of this Form 10-K. Such proxy statement will be filed with the Securities and Exchange Commission not later than 120 days following the end of the Registrant’s fiscal year ended December 31, 2020.
TABLE OF CONTENTS
In this annual report on Form 10-K, except as otherwise indicated, the terms:
|
• |
“we”, “us”, “our”, “Sierra” and the “Company” refer to Sierra Income Corporation, a Maryland corporation. |
|
• |
“SIC Advisors” and the “Adviser” refer to SIC Advisors LLC, our investment adviser. SIC Advisors is a wholly owned subsidiary of Medley LLC, which is controlled by Medley Management Inc., a publicly traded asset management firm, which in turn is controlled by Medley Group LLC, an entity wholly-owned by the senior professionals of Medley LLC. |
|
• |
“Medley” refers, collectively, to the activities and operations of Medley Capital LLC, Medley LLC, Medley Management Inc., Medley Group LLC, associated investment funds and their respective affiliates. |
GENERAL
Sierra Income Corporation is a non-diversified closed-end management investment company incorporated in Maryland that has elected to be treated and is regulated as a business development company (“BDC”) under the Investment Company Act of 1940, as amended (the “1940 Act”). The Company has elected, and intends to qualify annually, to be treated for U.S. federal income tax purposes as a regulated investment company (“RIC”) under Subchapter M of the Internal Revenue Code of 1986, as amended (the “Code”). We are externally managed and advised by our investment adviser, SIC Advisors LLC (“SIC Advisors”) pursuant to an investment advisory agreement (the "Investment Advisory Agreement").
Our investment objective is to generate current income, and to a lesser extent, long-term capital appreciation. We intend to meet our investment objective by primarily lending to, and investing in, the debt of privately owned U.S. middle market companies, which we define as companies with annual revenue between $50 million and $1 billion. We intend to focus primarily on making investments in first lien senior secured debt, second lien secured debt, and to a lesser extent, subordinated debt, of middle market companies in a broad range of industries. We expect that the majority of our debt investments will bear interest at floating interest rates, but our portfolio may also include fixed-rate investments. We will originate transactions sourced through SIC Advisors’ existing network, and, to a lesser extent, expect to acquire debt securities through the secondary market. We may make equity investments in companies that we believe will generate appropriate risk adjusted returns, although we do not expect such investments to be a substantial portion of our portfolio.
Our Adviser
Our investment activities are managed by our investment adviser, SIC Advisors, which is an investment adviser registered with the Securities and Exchange Commission (the "SEC") under the Investment Advisers Act of 1940, as amended (the “Advisers Act”), and a wholly owned subsidiary of Medley LLC. SIC Advisors is responsible for sourcing potential investments, conducting due diligence on prospective investments, analyzing investment opportunities, structuring investments and monitoring our portfolio on an ongoing basis.
Our Investment Team has extensive experience in the credit business, including originating, underwriting, principal investing and loan structuring. Our Adviser, through Medley, has access to approximately 40 employees, including approximately 20 investment, origination and credit management professionals, and approximately 20 operations, marketing and distribution professionals, each with extensive experience in their respective disciplines. Medley Capital LLC serves as our administrator, provides office space to us, and provides us with equipment and other office services. The responsibilities of our administrator include overseeing our financial records, preparing reports to our stockholders and reports filed with the SEC and generally monitoring the payment of our expenses and the performance of administrative and professional services rendered to us by others. See “Administration Agreement and Fees” below.
Formation
Sierra Income Corporation was incorporated under the general corporation laws of the State of Maryland on June 13, 2011. On April 17, 2012, we successfully reached our minimum escrow requirement and officially commenced our operations by issuing 1,108,033 shares of common stock to SIC Advisors for gross proceeds of $10,000,000. On July 2, 2018, the Company’s board of directors determined to terminate the Company’s offering effective as of July 31, 2018. We sold a total of 102,630,605 shares of common stock, which includes the shares issued as part of the distribution reinvestment plan (see Note 13), for total gross proceeds of $1.0 billion, which includes the shares sold to SIC Advisors. The proceeds from the issuance of common stock are presented in our consolidated statements of changes in net assets and Consolidated Statements of Cash Flows and are presented net of selling commissions and dealer manager fees.
Investment Process
We believe our Adviser has cultivated a disciplined and repeatable process for executing, monitoring, structuring and exiting investments.
Identification and Sourcing. Our Adviser’s experience and reputation have allowed it to generate what we believe to be a substantial and continuous flow of attractive investment opportunities. Our Adviser maintains a strong and diverse network which results in sustained and high quality deal flow. We believe that the breadth and depth of experience of SIC Advisors’ Investment Team across strategies and asset classes, coupled with significant relationships built over the last 20 years, make them particularly qualified to uncover, evaluate and aggressively pursue what we believe to be attractive investment opportunities. We believe that SIC Advisors’ Investment Team, by leveraging the broader Medley platform deal flow network has compiled a robust pipeline of transactions ready for possible inclusion in our portfolio.
Disciplined Underwriting. SIC Advisors’ Investment Team performs thorough due diligence and focuses on several key criteria in its underwriting process, including strong underlying business fundamentals, a meaningful equity cushion, experienced management, conservative valuation and the ability to deleverage through cash flows. Our Adviser’s underwriting process also involves engagement of industry experts and third-party consultants.
Prior to making an investment, the Investment Team subjects each potential borrower to an extensive credit review process, which typically begins with an analysis of the market opportunity, business fundamentals, company operating metrics and historical and projected financial analysis. The Investment Team also compares liquidity, operating margin trends, leverage, free cash flow and fixed charge coverage ratios for each potential investment to industry metrics. Areas of additional underwriting focus include management or sponsor (typically a private equity firm) experience, management compensation, competitive landscape, regulatory environment, pricing power, defensibility of market share and tangible asset values. Background checks and tax compliance information may also be requested on management teams and key employees. In addition, the Investment Team may contact customers, suppliers and competitors and performs on-site visits as part of a routine business due diligence process.
The Investment Team routinely uses third-party consultants and market studies to corroborate valuation and industry specific due diligence, as well as provide quality of earnings analysis. Experienced legal counsel is engaged to evaluate and mitigate regulatory, insurance, tax or other company-specific risks.
After the Investment Team completes its final due diligence, each proposed investment is presented to our Adviser’s investment committee (the “Investment Committee”) and subjected to extensive discussion and follow-up analysis, if necessary. A formal memorandum for each investment opportunity typically includes the results of business due diligence, multi-scenario financial analysis, risk-management assessment, results of third-party consulting work, background checks (where applicable) and structuring proposals. The Investment Committee requires a majority vote to approve any investment, although unanimous agreement is sought.
Active Credit Management. Our Adviser employs active credit management. Our Adviser’s process includes frequent interaction with management, monthly or quarterly review of financial information and may include attendance at board of directors’ meetings as observers. The Investment Team also evaluates financial reporting packages provided by portfolio companies that detail operational and financial performance. Data is entered in our Adviser’s Asset Management System (“AMS”), a centralized electronic credit management database. AMS creates a centralized, dynamic electronic repository for all of our portfolio company data. Our Adviser’s AMS system generates comprehensive, standardized reports which aggregate operational updates, portfolio company financial performance, asset valuations, macro trends, management call notes and account history. AMS enables the Investment Team to have real-time access to the most recent information on our portfolio investments.
In addition to the data provided by our borrowers, our Adviser may also utilize various third parties to provide checks and balances throughout the credit management process. Independent valuation firms may be engaged to provide appraisals of asset and collateral values or external forensic accounting groups may be engaged to verify portfolio company financial reporting or perform cash reconciliation. Our Adviser believes this hands-on approach to credit management is a key contributor to our investment performance.
Investment Structure
For newly originated investments, SIC Advisors strives to negotiate an optimal combination of current and deferred interest payments, equity participation and prepayment penalties, along with suitable covenants and creditor rights which may generally be greater than the rights normally obtained by institutional investors in comparable transactions and may include such provisions as: specific rights to consult with and advise management, the right to inspect company books, records or facilities, as well as the right to review balance sheets and/or statements of income and cash flows of the company. SIC Advisors determines whether the investment structure, particularly the amount of debt, is appropriate for the portfolio company’s business, sometimes reassessing the investment’s risk/return profile and adjusting pricing and other terms as necessary. The Investment Team has in-depth restructuring, liquidation and bankruptcy experience which is vital to success as a lender over market cycles.
Investment Committee
The purpose of the Investment Committee is to evaluate and approve investments proposed by SIC Advisors’ Investment Team. The Investment Committee is comprised of members selected from senior members of SIC Advisors’ Investment Team. Approval of an investment requires a majority vote of the Investment Committee, although unanimous agreement is sought. The committee process is intended to bring the diverse experience and perspectives of the committee members to the analysis and consideration of every investment. The Investment Committee also serves to provide consistency and adherence to SIC Advisors’ investment philosophies and policies. The Investment Committee also determines appropriate investment sizing and suggests ongoing monitoring requirements.
In addition to reviewing investments, the Investment Committee meetings serve as a forum to discuss credit views and outlooks. Potential transactions and deal flow are also reviewed on a regular basis. Members of the Investment Team are encouraged to share information and views on credits with the Investment Committee early in their analysis and throughout the evaluation process. This process improves the quality of the analysis and assists the deal team members to work more efficiently.
Managerial Assistance
As a BDC, we offer, and must provide upon request, managerial assistance to certain of our portfolio companies. This assistance could involve, among other things, monitoring the operations of our portfolio companies, participating in board and management meetings, consulting with and advising officers of portfolio companies and providing other organizational and financial guidance. We may receive fees for these services and will reimburse Medley, as our administrator, for its allocated costs in providing such assistance, subject to review and approval by our board of directors. Medley will provide such managerial assistance on our behalf to portfolio companies that request this assistance.
Competition
Our primary competitors to provide financing to private and middle-market companies are public and private funds, commercial banks, commercial finance companies, other BDCs, small business investment companies and private equity and hedge funds. Some competitors may have access to funding sources that are not available to us. In addition, some of our competitors may have higher risk tolerances or different risk assessments, which could allow them to consider a wider variety of investments and establish more relationships than us. Some of our competitors may also choose lower risk and return profiles and strategies that may outperform higher risk profiles and strategies when credit markets or individual companies encounter stressed environments. Furthermore, many of our competitors are not subject to the regulatory restrictions that the 1940 Act imposes on us as a BDC or to the distribution and other requirements we must satisfy to maintain our favorable RIC tax treatment.
Staffing
We do not currently have any employees and do not expect to have any employees. Services necessary for our business are provided by individuals who are employees of SIC Advisors and Medley Capital LLC, pursuant to the terms of the Investment Advisory Agreement and the Administration Agreement (as defined below). Our day-to-day investment operations are managed by our Adviser. In addition, we reimburse Medley Capital LLC for our allocable portion of expenses incurred by it in performing its obligations under the administration agreement, including our allocable portion of the cost of our officers and their respective staffs.
Administration
We have entered into an administration agreement with Medley Capital LLC (the “Administration Agreement”) pursuant to which Medley Capital LLC furnishes us with administrative services necessary to conduct our day-to-day operations. Medley Capital LLC is reimbursed for administrative expenses it incurs on our behalf in performing its obligations. Such costs are reasonably allocated to us on the basis of assets, revenues, time records or other reasonable methods. We do not reimburse Medley Capital LLC for any services for which it receives a separate fee or for rent, depreciation, utilities, capital equipment or other administrative items allocated to a controlling person of Medley Capital LLC. Medley Capital LLC is an affiliate of SIC Advisors. See “Administration Agreement and Fees.”
Termination of the Agreements and Plan of Mergers
On July 29, 2019, the Company entered into the Amended and Restated Agreement and Plan of Merger, dated as of July 29, 2019 (the “Amended MCC Merger Agreement”), by and between Medley Capital Corporation (“MCC”) and the Company, pursuant to which MCC would, on the terms and subject to the conditions set forth in the Amended MCC Merger Agreement, merge with and into the Company, with the Company as the surviving company in the merger (the “MCC Merger”). In addition, on July 29, 2019, the Company entered into the Amended and Restated Agreement and Plan of Merger, dated as of July 29, 2019 (the “Amended MDLY Merger Agreement”), by and among MDLY, the Company, and Sierra Management, Inc., a wholly owned subsidiary of the Company (“Merger Sub”), MDLY would, on the terms and subject to the conditions set forth in the Amended MDLY Merger Agreement, merge with and into Merger Sub, with Merger Sub as the surviving company in the merger (the “MDLY Merger” together with the MCC Merger, the “Proposed Mergers”).
Section 9.1(c) of the Amended MCC Merger Agreement and Section 9.1(c) of the Amended MDLY Merger Agreement each permits the Company and either MCC or MDLY, as applicable, to terminate the Amended MCC Merger Agreement and the Amended MDLY Merger Agreement, respectively, if the MCC Merger or the MDLY Merger, as applicable, has not been consummated on or before March 31, 2020 (the “Outside Date”). On May 1, 2020, the Company terminated both the Amended MCC Merger Agreement and the Amended MDLY Merger Agreement effective as of May 1, 2020 as the Outside Date had passed and neither the MCC Merger or the MDLY Merger had been consummated. In determining to terminate the Amended MCC Merger Agreement and the Amended MDLY Merger Agreement, the Company considered a number of factors, including, among other factors, changes in the relative valuations of the Company, MCC, and MDLY, the changed circumstances and the unpredictable economic conditions resulting from the global health crisis caused by the coronavirus (COVID-19) pandemic, and the uncertainty regarding the parties’ ability to satisfy the conditions to closing in a timely manner.
Available Information
We maintain a website at http://www.sierraincomecorp.com. We make available, free of charge, on our website, our annual report on Form 10-K, quarterly reports on Form 10-Q, current reports on Form 8-K and amendments to those reports as soon as reasonably practicable after we electronically file such material with, or furnish it to, the SEC. Information contained on our website is not incorporated by reference into this annual report on Form 10-K and you should not consider information contained on our website to be part of this annual report on Form 10-K or any other report we file with the SEC.
INVESTMENTS
We have built an investment portfolio that includes senior secured first lien term loans, senior secured second lien term loans, senior secured first lien notes, subordinated notes and equity/warrants.
The following table shows the investment portfolio composition by industry classification at amortized cost and fair value as of December 31, 2020.
|
Amortized Cost |
Percentage |
Fair Value |
Percentage |
|||||||||||||
|
Multi-Sector Holdings |
$ | 174,660,001 | 24.9 | % | $ | 131,792,864 | 21.8 | % | ||||||||
|
Services: Business |
79,260,551 | 11.3 | % | 73,716,395 | 12.2 | % | ||||||||||
|
High Tech Industries |
75,519,344 | 10.8 | % | 71,792,022 | 11.9 | % | ||||||||||
|
Healthcare & Pharmaceuticals |
68,599,968 | 9.8 | % | 58,275,198 | 9.6 | % | ||||||||||
|
Consumer Goods: Durable |
32,045,028 | 4.6 | % | 41,016,292 | 6.8 | % | ||||||||||
|
Construction & Building |
42,928,750 | 6.1 | % | 38,356,358 | 6.4 | % | ||||||||||
|
Banking, Finance, Insurance & Real Estate |
27,848,664 | 4.0 | % | 37,620,161 | 6.2 | % | ||||||||||
|
Aerospace & Defense |
33,558,896 | 4.8 | % | 29,723,725 | 4.9 | % | ||||||||||
|
Hotel, Gaming & Leisure |
36,326,705 | 5.2 | % | 24,013,769 | 4.0 | % | ||||||||||
|
Automotive |
18,886,756 | 2.7 | % | 17,404,476 | 2.9 | % | ||||||||||
|
Containers, Packaging & Glass |
15,206,840 | 2.2 | % | 15,120,424 | 2.5 | % | ||||||||||
|
Environmental Industries |
5,041,430 | 0.7 | % | 10,052,691 | 1.7 | % | ||||||||||
|
Services: Consumer |
9,700,000 | 1.4 | % | 9,725,000 | 1.6 | % | ||||||||||
|
Chemicals, Plastics & Rubber |
10,060,861 | 1.4 | % | 9,063,498 | 1.5 | % | ||||||||||
|
Forest Products & Paper |
6,477,887 | 0.9 | % | 7,770,704 | 1.3 | % | ||||||||||
|
Media: Diversified & Production |
15,474,145 | 2.2 | % | 6,780,000 | 1.1 | % | ||||||||||
|
Transportation: Cargo |
6,877,294 | 1.0 | % | 6,770,781 | 1.1 | % | ||||||||||
|
Transportation: Consumer |
7,975,416 | 1.1 | % | 6,068,082 | 1.0 | % | ||||||||||
|
Metals & Mining |
3,492,436 | 0.5 | % | 3,492,479 | 0.6 | % | ||||||||||
|
Energy: Oil & Gas |
20,868,832 | 3.0 | % | 2,625,018 | 0.4 | % | ||||||||||
|
Wholesale |
2,212,919 | 0.3 | % | 1,746,044 | 0.3 | % | ||||||||||
|
Retail |
7,934,347 | 1.1 | % | 1,012,358 | 0.2 | % | ||||||||||
|
Beverage & Food |
46,869 | 0.0 | % | 48,141 | 0.0 | % | ||||||||||
|
Total |
$ | 701,003,939 | 100.0 | % | $ | 603,986,480 | 100.0 | % | ||||||||
The following table sets forth certain information for each portfolio company in which we had an investment as of December 31, 2020. Other than these portfolio investments, our only formal relationships with our portfolio companies are the managerial assistance that we may provide upon their request and the board observer or participation rights we may receive in connection with our investment portfolio.
|
Company(1)(2) |
Industry |
Type of Investment |
Maturity |
Par Amount |
Cost |
Fair Value |
% of Net Assets(3) |
|||||||||||||||
|
Non-controlled/non-affiliated investments – |
89.9% | |||||||||||||||||||||
|
AAAHI Acquisition Corporation |
Transportation: Consumer |
Senior Secured First Lien Term Loan LIBOR + 8.250%, 1.000% Floor(4) (5) (13) |
12/10/2023 |
$ | 7,110,546 | $ | 6,975,416 | $ | 4,977,382 | 0.9 | % | |||||||||||
| 7,110,546 | 6,975,416 | 4,977,382 | ||||||||||||||||||||
|
Alpine SG, LLC |
High Tech Industries |
Senior Secured First Lien Term Loan LIBOR + 8.500%, 1.000% Floor(5) (6) |
11/16/2022 |
1,262,051 | 1,230,864 | 1,298,524 | 0.2 | % | ||||||||||||||
|
Senior Secured First Lien Delayed Draw Term Loan LIBOR + 5.750%, 1.000% Floor(5) (6) |
11/16/2022 |
6,165,725 | 6,165,633 | 6,102,218 | 1.2 | % | ||||||||||||||||
|
Senior Secured First Lien Term Loan LIBOR + 5.750%, 1.000% Floor(5) (6) |
11/16/2022 |
12,529,258 | 12,517,772 | 12,400,207 | 2.4 | % | ||||||||||||||||
|
Senior Secured First Lien Revolving Credit Facility LIBOR + 5.750%, 1.000% Floor(5) (6) |
11/16/2022 |
1,000,000 | 1,000,000 | 989,700 | 0.2 | % | ||||||||||||||||
| 20,957,034 | 20,914,269 | 20,790,649 | ||||||||||||||||||||
|
American Dental Partners, Inc. |
Healthcare & Pharmaceuticals |
Senior Secured Second Lien Term Loan LIBOR + 8.500%, 1.000% Floor(4) (5) |
9/25/2023 |
4,893,750 | 4,893,750 | 4,704,362 | 0.9 | % | ||||||||||||||
| 4,893,750 | 4,893,750 | 4,704,362 | ||||||||||||||||||||
|
Amerijet Holdings, Inc. |
Transportation: Cargo |
Senior Secured First Lien Term Loan LIBOR + 8.000%, 1.000% Floor(5) (6) |
7/15/2021 |
2,952,518 | 2,952,518 | 2,952,518 | 0.6 | % | ||||||||||||||
| 2,952,518 | 2,952,518 | 2,952,518 | ||||||||||||||||||||
|
AMMC CLO 22, Limited Series 2018-22A |
Multi-Sector Holdings |
Subordinated Notes 13.429% effective yield(7) (8) (9) |
4/25/2031 |
7,222,000 | 5,402,828 | 4,786,019 | 0.9 | % | ||||||||||||||
| 7,222,000 | 5,402,828 | 4,786,019 | ||||||||||||||||||||
|
AMMC CLO 23, Ltd. Series 2020-23A |
Multi-Sector Holdings |
Subordinated Notes 19.100% effective yield(7) (8) (9) |
10/17/2031 |
2,000,000 | 1,688,071 | 1,688,000 | 0.3 | % | ||||||||||||||
| 2,000,000 | 1,688,071 | 1,688,000 | ||||||||||||||||||||
|
Answers Finance, LLC |
High Tech Industries |
Common Stock - 388,533 shares (10) |
— | 5,076,376 | 493,437 | 0.1 | % | |||||||||||||||
| — | 5,076,376 | 493,437 | ||||||||||||||||||||
|
Apidos CLO XXIV, Series 2016-24A |
Multi-Sector Holdings |
Subordinated Notes 8.894% effective yield(5) (7) (8) (9) |
7/20/2027 |
18,357,647 | 10,342,024 | 8,402,295 | 1.6 | % | ||||||||||||||
| 18,357,647 | 10,342,024 | 8,402,295 | ||||||||||||||||||||
|
Arrow International Inc. |
Hotel, Gaming & Leisure |
Senior Secured First Lien Term Loan LIBOR + 7.250%, 1.250% Floor(6) |
12/21/2025 |
10,000,000 | 10,000,000 | 10,000,000 | 1.9 | % | ||||||||||||||
| 10,000,000 | 10,000,000 | 10,000,000 | ||||||||||||||||||||
|
Avantor, Inc. |
Wholesale |
Common Stock - 27,252 shares (5) (8) (10) (11) |
— | 467,171 | 767,144 | 0.1 | % | |||||||||||||||
| — | 467,171 | 767,144 | ||||||||||||||||||||
|
Aviation Technical Services, Inc. |
Aerospace & Defense |
Senior Secured Second Lien Term Loan LIBOR + 8.500%, 1.000% Floor(4) (5) |
3/31/2022 |
25,000,000 | 25,000,000 | 21,795,000 | 4.1 | % | ||||||||||||||
| 25,000,000 | 25,000,000 | 21,795,000 | ||||||||||||||||||||
|
Company(1)(2) |
Industry |
Type of Investment |
Maturity |
Par Amount |
Cost |
Fair Value |
% of Net Assets(3) |
|||||||||||||||
|
BRG Sports, Inc. |
Consumer Goods: Durable |
Senior Secured First Lien Term Loan LIBOR + 6.250%, 1.000% Floor(5) (6) |
6/15/2023 |
3,480,384 | 3,474,606 | 3,445,232 | 0.7 | % | ||||||||||||||
| 3,480,384 | 3,474,606 | 3,445,232 | ||||||||||||||||||||
|
Brook & Whittle Holding Corp. |
Containers, Packaging & Glass |
Senior Secured First Lien Delayed Draw Term Loan LIBOR + 5.250%, 1.000% Floor(4) (5) |
10/17/2024 |
699,967 | 697,464 | 682,888 | 0.1 | % | ||||||||||||||
|
Senior Secured First Lien Term Loan LIBOR + 5.250%, 1.000% Floor(4) (5) |
10/17/2024 |
2,976,219 | 2,965,575 | 2,903,599 | 0.6 | % | ||||||||||||||||
| 3,676,186 | 3,663,039 | 3,586,487 | ||||||||||||||||||||
|
Callaway Golf Co. |
Consumer Goods: Durable |
Senior Secured First Lien Term Loan LIBOR + 4.500%, 1.000% Floor(5) (6) |
1/4/2026 |
46,000 | 45,422 | 46,060 | — | % | ||||||||||||||
| 46,000 | 45,422 | 46,060 | ||||||||||||||||||||
|
CM Finance SPV LLC |
Banking, Finance, Insurance & Real Estate |
Subordinated Notes 3.000%(5) |
6/24/2021 |
35,600 | 35,600 | 35,600 | — | % | ||||||||||||||
| 35,600 | 35,600 | 35,600 | ||||||||||||||||||||
|
CPI International, Inc. |
Aerospace & Defense |
Senior Secured Second Lien Term Loan LIBOR + 7.250%, 1.000% Floor(5) (6) |
7/28/2025 |
8,575,302 | 8,558,896 | 7,928,725 | 1.5 | % | ||||||||||||||
| 8,575,302 | 8,558,896 | 7,928,725 | ||||||||||||||||||||
|
CT Technologies Intermediate Holdings, Inc. |
Healthcare & Pharmaceuticals |
Senior Secured First Lien Term Loan LIBOR + 5.000%, 1.000% Floor(5) (6) |
12/16/2025 |
7,000,000 | 6,965,245 | 6,965,000 | 1.3 | % | ||||||||||||||
| 7,000,000 | 6,965,245 | 6,965,000 | ||||||||||||||||||||
|
DataOnline Corp. |
High Tech Industries |
Revolving Credit Facility LIBOR + 6.250%, 1.000% Floor(4) (5) (12) |
11/13/2025 |
1,821,429 | 1,821,429 | 1,765,929 | 0.3 | % | ||||||||||||||
|
Senior Secured First Lien Term Loan LIBOR + 6.250%, 1.000% Floor(4) (5) |
11/13/2025 |
14,850,000 | 14,850,000 | 14,465,385 | 2.8 | % | ||||||||||||||||
| 16,671,429 | 16,671,429 | 16,231,314 | ||||||||||||||||||||
|
Delta Air Lines, Inc. |
Transportation: Consumer |
Senior Secured First Lien Notes 4.750%(5) (7) (8) |
10/20/2028 |
1,000,000 | 1,000,000 | 1,090,700 | 0.2 | % | ||||||||||||||
| 1,000,000 | 1,000,000 | 1,090,700 | ||||||||||||||||||||
|
Dryden 38 Senior Loan Fund, Series 2015-38A |
Multi-Sector Holdings |
Subordinated Notes 11.373% effective yield(7) (8) (9) |
7/15/2027 |
7,000,000 | 4,308,139 | 3,598,000 | 0.7 | % | ||||||||||||||
| 7,000,000 | 4,308,139 | 3,598,000 | ||||||||||||||||||||
|
Dryden 43 Senior Loan Fund, Series 2016-43A |
Multi-Sector Holdings |
Subordinated Notes 8.262% effective yield(5) (7) (8) (9) |
7/20/2029 |
3,620,000 | 2,513,635 | 1,901,586 | 0.4 | % | ||||||||||||||
| 3,620,000 | 2,513,635 | 1,901,586 | ||||||||||||||||||||
|
Dryden 49 Senior Loan Fund, Series 2017-49A |
Multi-Sector Holdings |
Subordinated Notes 9.989% effective yield(5) (7) (8) (9) |
7/18/2030 |
17,233,288 | 12,375,842 | 9,498,988 | 1.8 | % | ||||||||||||||
| 17,233,288 | 12,375,842 | 9,498,988 | ||||||||||||||||||||
|
Envision Healthcare Corporation |
Healthcare & Pharmaceuticals |
Senior Secured First Lien Term Loan LIBOR + 3.750%(5) (6) |
10/10/2025 |
49,000 | 33,226 | 40,734 | — | % | ||||||||||||||
| 49,000 | 33,226 | 40,734 | ||||||||||||||||||||
|
First Boston Construction Holdings, LLC |
Banking, Finance, Insurance & Real Estate |
Senior Secured First Lien Notes 12.000%(5) |
2/23/2023 |
7,473,750 | 7,473,750 | 7,458,055 | 1.4 | % | ||||||||||||||
|
Preferred Equity - 2,304,406 units (5) (10) |
— | 1,868,437 | 1,307,906 | 0.2 | % | |||||||||||||||||
| 7,473,750 | 9,342,187 | 8,765,961 | ||||||||||||||||||||
|
Friedrich Holdings, Inc. |
Construction & Building |
Senior Secured First Lien Term Loan LIBOR + 6.000%, 1.000% Floor(5) (6) |
2/7/2023 |
10,421,300 | 10,421,300 | 10,263,938 | 2.0 | % | ||||||||||||||
| 10,421,300 | 10,421,300 | 10,263,938 | ||||||||||||||||||||
|
GK Holdings, Inc. |
Services: Business |
Senior Secured Second Lien Term Loan LIBOR + 10.250%, 1.000% Floor(4) (13) |
1/20/2022 |
10,000,000 | 10,000,000 | 5,500,000 | 1.0 | % | ||||||||||||||
| 10,000,000 | 10,000,000 | 5,500,000 | ||||||||||||||||||||
|
Company(1)(2) |
Industry |
Type of Investment |
Maturity |
Par Amount |
Cost |
Fair Value |
% of Net Assets(3) |
|||||||||||||||
|
Glass Mountain Pipeline Holdings, LLC |
Energy: Oil & Gas |
Senior Secured First Lien Term Loan LIBOR + 4.500%, 1.000% Floor(5) (6) (13) |
12/23/2024 |
48,625 | 23,389 | 24,434 | — | % | ||||||||||||||
| 48,625 | 23,389 | 24,434 | ||||||||||||||||||||
|
Golden West Packaging Group LLC |
Forest Products & Paper |
Senior Secured First Lien Term Loan LIBOR + 5.250%, 1.000% Floor(5) (6) |
6/20/2023 |
1,405,738 | 1,405,738 | 1,404,332 | 0.3 | % | ||||||||||||||
| 1,405,738 | 1,405,738 | 1,404,332 | ||||||||||||||||||||
|
Holland Acquisition Corp. |
Energy: Oil & Gas |
Senior Secured First Lien Term Loan LIBOR + 9.000%, 1.000% Floor(4) (13) (14) |
5/29/2020 |
3,857,305 | 3,733,979 | 108,310 | — | % | ||||||||||||||
| 3,857,305 | 3,733,979 | 108,310 | ||||||||||||||||||||
|
Hylan Datacom & Electrical LLC |
Construction & Building |
Senior Secured First Lien Term Loan LIBOR + 10.000%, 1.000% Floor(4) (5) |
7/25/2022 |
15,255,390 | 15,255,390 | 10,983,881 | 2.1 | % | ||||||||||||||
| 15,255,390 | 15,255,390 | 10,983,881 | ||||||||||||||||||||
|
Impact Group, LLC |
Services: Business |
Senior Secured First Lien Term Loan LIBOR + 7.370%, 1.000% Floor(4) (5) |
6/27/2023 |
5,734,462 | 5,734,462 | 5,548,092 | 1.1 | % | ||||||||||||||
| 5,734,462 | 5,734,462 | 5,548,092 | ||||||||||||||||||||
|
Innovative XCessories & Services, LLC |
Automotive |
Senior Secured First Lien Term Loan LIBOR + 5.200%, 1.000% Floor(4) (5) |
3/5/2027 |
2,976,933 | 2,950,524 | 2,979,016 | 0.6 | % | ||||||||||||||
| 2,976,933 | 2,950,524 | 2,979,016 | ||||||||||||||||||||
|
Interflex Acquisition Company, LLC |
Containers, Packaging & Glass |
Senior Secured First Lien Term Loan LIBOR + 8.000%, 1.000% Floor(5) (6) |
8/18/2022 |
11,553,578 | 11,543,801 | 11,533,937 | 2.2 | % | ||||||||||||||
| 11,553,578 | 11,543,801 | 11,533,937 | ||||||||||||||||||||
|
Iqor US Inc. |
Services: Business |
Senior Secured First Lien Term Loan LIBOR + 7.500%, 1.000% Floor(5) (6) |
11/19/2024 |
3,471,136 | 3,388,625 | 3,401,713 | 0.6 | % | ||||||||||||||
|
Senior Secured First Lien Term Loan LIBOR + 7.500%, 1.000% Floor(5) (6) |
11/19/2025 |
7,734,435 | 7,734,435 | 7,734,435 | 1.5 | % | ||||||||||||||||
|
Equity - 246,857 Shares |
— | 2,962,285 | 3,085,713 | 0.6 | % | |||||||||||||||||
| 11,205,571 | 14,085,345 | 14,221,861 | ||||||||||||||||||||
|
Isagenix International, LLC |
Wholesale |
Senior Secured First Lien Term Loan LIBOR + 5.750%, 1.000% Floor(4) (5) |
6/16/2025 |
1,776,911 | 1,745,748 | 978,900 | 0.2 | % | ||||||||||||||
| 1,776,911 | 1,745,748 | 978,900 | ||||||||||||||||||||
|
Isola USA Corp. |
High Tech Industries |
Senior Secured Second Lien Term Loan LIBOR + 9.500%, 1.000% Floor, PIK(4) (12) (13) |
1/2/2023 |
11,331,641 | 7,016,631 | 8,498,730 | 1.6 | % | ||||||||||||||
|
Common Units - 10,283,782 units (10) |
— | — | — | — | % | |||||||||||||||||
| 11,331,641 | 7,016,631 | 8,498,730 | ||||||||||||||||||||
|
Ivanti Software, Inc. |
High Tech Industries |
Senior Secured Second Lien Term Loan LIBOR + 8.500%, 1.000% Floor(5) (6) |
12/1/2028 |
6,000,000 | 6,000,000 | 5,947,800 | 1.1 | % | ||||||||||||||
| 6,000,000 | 6,000,000 | 5,947,800 | ||||||||||||||||||||
|
JFL-WCS Partners, LLC |
Environmental Industries |
Preferred units - 618,876 6.000%, PIK(5) |
— | 659,447 | 709,806 | 0.1 | % | |||||||||||||||
|
Common Units - 70,412 units (5) (10) |
— | 98,052 | 5,069,664 | 1.0 | % | |||||||||||||||||
| — | 757,499 | 5,779,470 | ||||||||||||||||||||
|
Company(1)(2) |
Industry |
Type of Investment |
Maturity |
Par Amount |
Cost |
Fair Value |
% of Net Assets(3) |
|||||||||||||||
|
Keystone Acquisition Corp. |
Healthcare & Pharmaceuticals |
Senior Secured First Lien Term Loan LIBOR + 5.250%, 1.000% Floor(4) (5) |
5/1/2024 |
1,784,130 | 1,736,823 | 1,614,638 | 0.3 | % | ||||||||||||||
|
Senior Secured Second Lien Term Loan LIBOR + 9.250%, 1.000% Floor(4) (5) |
5/1/2025 |
7,000,000 | 6,921,915 | 6,127,800 | 1.2 | % | ||||||||||||||||
| 8,784,130 | 8,658,738 | 7,742,438 | ||||||||||||||||||||
|
LogMeIn, Inc. |
High Tech Industries |
Senior Secured First Lien Term Loan LIBOR + 7.750%, 1.000% Floor(5) (6) (8) |
8/31/2027 |
1,000,000 | 980,865 | 995,300 | 0.2 | % | ||||||||||||||
| 1,000,000 | 980,865 | 995,300 | ||||||||||||||||||||
|
Magnetite XIX, Limited |
Multi-Sector Holdings |
Subordinated Notes LIBOR + 7.610%(4) (7) (8) (9) |
7/17/2030 |
2,000,000 | 1,893,387 | 1,745,800 | 0.3 | % | ||||||||||||||
|
Subordinated Notes 9.779% effective yield(5) (7) (8) (9) |
7/17/2030 |
13,730,209 | 9,451,985 | 7,493,948 | 1.4 | % | ||||||||||||||||
| 15,730,209 | 11,345,372 | 9,239,748 | ||||||||||||||||||||
|
Midwest Physician Administrative Services, LLC |
Healthcare & Pharmaceuticals |
Senior Secured Second Lien Term Loan LIBOR + 7.000%, 0.750% Floor(6) |
8/15/2025 |
2,000,000 | 1,935,192 | 1,945,000 | 0.4 | % | ||||||||||||||
| 2,000,000 | 1,935,192 | 1,945,000 | ||||||||||||||||||||
|
Novetta Solutions, LLC |
High Tech Industries |
Senior Secured First Lien Term Loan LIBOR + 5.000%, 1.000% Floor(5) (6) |
10/17/2022 |
1,560,779 | 1,522,514 | 1,521,291 | 0.3 | % | ||||||||||||||
|
Senior Secured Second Lien Term Loan LIBOR + 8.500%, 1.000% Floor(5) (6) |
10/16/2023 |
11,000,000 | 10,951,758 | 10,574,300 | 2.0 | % | ||||||||||||||||
| 12,560,779 | 12,474,272 | 12,095,591 | ||||||||||||||||||||
|
Offen Inc. |
Transportation: Cargo |
Senior Secured First Lien Term Loan LIBOR + 5.000%(5) (6) |
6/21/2026 |
2,893,982 | 2,871,192 | 2,793,272 | 0.5 | % | ||||||||||||||
|
Senior Secured First Lien Term Loan LIBOR + 5.000%(5) (6) |
6/21/2026 |
1,061,947 | 1,053,584 | 1,024,991 | 0.2 | % | ||||||||||||||||
| 3,955,929 | 3,924,776 | 3,818,263 | ||||||||||||||||||||
|
Path Medical, LLC |
Healthcare & Pharmaceuticals |
Senior Secured First Lien Term Loan LIBOR + 13.000%, 1.000% Floor, PIK(4) (5) (6) (13) |
10/11/2021 |
10,752,249 | 8,860,931 | 1,075,225 | 0.2 | % | ||||||||||||||
|
Senior Secured First Lien Term Loan LIBOR + 9.500%, 1.000% Floor, PIK(4) (5) (6) |
10/11/2021 |
7,943,176 | 7,943,176 | 7,943,176 | 1.5 | % | ||||||||||||||||
|
Warrants - 36,716 warrants (5) (10) |
1/9/2027 |
— | 669,709 | — | — | % | ||||||||||||||||
| 18,695,425 | 17,473,816 | 9,018,401 | ||||||||||||||||||||
|
PetroChoice Holdings, Inc. |
Chemicals, Plastics & Rubber |
Senior Secured Second Lien Term Loan LIBOR + 8.750%, 1.000% Floor(4) (5) |
8/21/2023 |
9,000,000 | 9,000,000 | 8,010,000 | 1.5 | % | ||||||||||||||
| 9,000,000 | 9,000,000 | 8,010,000 | ||||||||||||||||||||
|
Polymer Solutions Group Holdings, LLC |
Chemicals, Plastics & Rubber |
Senior Secured First Lien Term Loan LIBOR + 7.000%, 1.000% Floor(5) (6) |
6/30/2021 |
1,064,355 | 1,060,861 | 1,053,498 | 0.2 | % | ||||||||||||||
| 1,064,355 | 1,060,861 | 1,053,498 | ||||||||||||||||||||
|
Project Silverback Holdings Corp. |
High Tech Industries |
Senior Secured First Lien Term Loan LIBOR + 3.500%, 1.000% Floor(4) |
8/21/2024 |
4,837,500 | 4,403,234 | 4,819,601 | 0.9 | % | ||||||||||||||
| 4,837,500 | 4,403,234 | 4,819,601 | ||||||||||||||||||||
|
Proppants Holdings, LLC |
Energy: Oil & Gas |
Common Units - 161,852 units (10) |
— | 874,363 | 323,704 | 0.1 | % | |||||||||||||||
| Common Units - 161,852 units (10) | — | 8,832 | — | — | % | |||||||||||||||||
| — | 883,195 | 323,704 | ||||||||||||||||||||
|
PT Network, LLC |
Healthcare & Pharmaceuticals |
Senior Secured First Lien Term Loan LIBOR + 5.500%, 1.000% Floor, 2.00% PIK(5) (17) |
11/30/2023 |
8,072,834 | 7,729,742 | 7,427,007 | 1.4 | % | ||||||||||||||
|
Membership Units - 1.441 units (5) (10) |
— | — | — | — | % | |||||||||||||||||
| 8,072,834 | 7,729,742 | 7,427,007 | ||||||||||||||||||||
|
Company(1)(2) |
Industry |
Type of Investment |
Maturity |
Par Amount |
Cost |
Fair Value |
% of Net Assets(3) |
|||||||||||||||
|
RateGain Technologies, Inc. |
Hotel, Gaming & Leisure |
Subordinated Notes (5) (10) (14) |
7/31/2020 |
440,050 | 440,049 | — | — | % | ||||||||||||||
|
Subordinated Notes (5) (10) |
7/31/2021 |
476,190 | 476,190 | — | — | % | ||||||||||||||||
| 916,240 | 916,239 | — | ||||||||||||||||||||
|
Redwood Services Group, LLC |
Services: Business |
Senior Secured First Lien Term Loan LIBOR + 8.500%, 1.000% Floor(5) (6) |
6/6/2023 |
4,000,000 | 4,000,000 | 4,000,000 | 0.8 | % | ||||||||||||||
|
Senior Secured First Lien Term Loan LIBOR + 6.000%, 1.000% Floor(5) (6) |
6/6/2023 |
12,611,712 | 12,611,712 | 12,267,412 | 2.3 | % | ||||||||||||||||
|
Senior Secured First Lien Term Loan LIBOR + 8.500%, 1.000% Floor(5) (6) |
6/6/2023 |
10,730,528 | 10,713,091 | 10,472,305 | 2.0 | % | ||||||||||||||||
|
Revolving Credit Facility LIBOR + 6.000%, 1.000% Floor(5) (6) (12) |
6/6/2023 |
287,500 | 287,500 | 208,725 | — | % | ||||||||||||||||
| 27,629,740 | 27,612,303 | 26,948,442 | ||||||||||||||||||||
|
Resolute Investment Managers, Inc. |
Banking, Finance, Insurance & Real Estate |
Senior Secured Second Lien Term Loan LIBOR + 8.000%, 1.000% Floor(5) (6) |
4/30/2025 |
6,000,000 | 5,970,877 | 5,943,600 | 1.1 | % | ||||||||||||||
| 6,000,000 | 5,970,877 | 5,943,600 | ||||||||||||||||||||
|
Rhombus Cinema Holdings, LP |
Media: Diversified & Production |
Preferred Equity - 7,449 shares 10.000% PIK(5) (10) (13) |
— | 4,584,207 | — | — | % | |||||||||||||||
|
Common Units - 3,163 units (5) (7) (10) |
— | 2,864,831 | — | — | % | |||||||||||||||||
|
Common Units - 3,163 units (5) (7) (10) |
— | 297,962 | — | — | % | |||||||||||||||||
| — | 7,747,000 | — | ||||||||||||||||||||
|
RTIC Subsidiary Holdings, LLC |
Consumer Goods: Durable |
Senior Secured First Lien Term Loan LIBOR + 7.750%, 1.250% Floor(4) (5) (12) |
9/1/2025 |
10,000,000 | 10,000,000 | 10,000,000 | 1.9 | % | ||||||||||||||
|
Preferred Class A units - 142.50 units (10) |
— | 142,500 | 142,500 | — | % | |||||||||||||||||
|
Preferred Class B units - 142.50 units (10) |
— | 142,500 | 142,500 | — | % | |||||||||||||||||
|
Common units - 150 units (10) |
— | 15,000 | 15,000 | — | % | |||||||||||||||||
| 10,000,000 | 10,300,000 | 10,300,000 | ||||||||||||||||||||
|
SavATree, LLC |
Environmental Industries |
Senior Secured First Lien Term Loan LIBOR + 5.000%, 1.000% Floor(4) (5) |
6/2/2022 |
4,283,931 | 4,283,931 | 4,273,221 | 0.8 | % | ||||||||||||||
| 4,283,931 | 4,283,931 | 4,273,221 | ||||||||||||||||||||
|
SFP Holding, Inc. |
Construction & Building |
Senior Secured First Lien Term Loan LIBOR + 6.250%, 1.000% Floor(4) (5) (12) |
9/1/2022 |
16,560,532 | 16,540,362 | 16,560,532 | 3.1 | % | ||||||||||||||
|
Equity - 0.803% of outstanding equity (5) (10) |
— | 711,698 | 548,007 | 0.1 | % | |||||||||||||||||
| 16,560,532 | 17,252,060 | 17,108,539 | ||||||||||||||||||||
|
Simplified Logistics, LLC |
Services: Business |
Senior Secured First Lien Term Loan LIBOR + 6.500%, 1.000% Floor(4) (5) |
2/28/2022 |
17,323,831 | 17,323,831 | 17,058,776 | 3.2 | % | ||||||||||||||
|
Senior Secured First Lien Term Loan LIBOR + 6.500%, 1.000% Floor(4) (5) |
2/28/2022 |
971,277 | 971,277 | 956,417 | 0.2 | % | ||||||||||||||||
|
Revolving Credit Facility LIBOR + 6.500%, 1.000% Floor(4) (5) |
2/28/2022 |
3,533,333 | 3,533,333 | 3,482,807 | 0.7 | % | ||||||||||||||||
| 21,828,441 | 21,828,441 | 21,498,000 | ||||||||||||||||||||
|
SMART Financial Operations, LLC |
Retail |
Preferred Equity - 1,000,000 units (5) (10) |
— | 1,000,000 | 490,000 | 0.1 | % | |||||||||||||||
| — | 1,000,000 | 490,000 | ||||||||||||||||||||
|
Company(1)(2) |
Industry |
Type of Investment |
Maturity |
Par Amount |
Cost |
Fair Value |
% of Net Assets(3) |
|||||||||||||||
|
Smile Doctors, LLC |
Healthcare & Pharmaceuticals |
Senior Secured First Lien Term Loan LIBOR + 6.000%, 1.000% Floor(4) (5) |
10/6/2022 |
13,805,148 | 13,786,625 | 13,587,027 | 2.6 | % | ||||||||||||||
| 13,805,148 | 13,786,625 | 13,587,027 | ||||||||||||||||||||
|
Sound Point CLO XX, Ltd. |
Multi-Sector Holdings |
Subordinated Notes 8.553% effective yield(5) (7) (8) (9) |
7/26/2031 |
4,489,000 | 3,508,513 | 2,824,030 | 0.5 | % | ||||||||||||||
| 4,489,000 | 3,508,513 | 2,824,030 | ||||||||||||||||||||
|
Starfish Holdco, LLC |
High Tech Industries |
Senior Secured Second Lien Term Loan LIBOR + 9.000%, 1.000% Floor(4) (5) |
8/18/2025 |
2,000,000 | 1,982,268 | 1,919,600 | 0.4 | % | ||||||||||||||
| 2,000,000 | 1,982,268 | 1,919,600 | ||||||||||||||||||||
|
Team Car Care, LLC |
Automotive |
Senior Secured First Lien Term Loan LIBOR + 8.000%, 1.000% Floor(4) (5) |
2/23/2023 |
13,624,819 | 13,624,819 | 13,529,446 | 2.6 | % | ||||||||||||||
| 13,624,819 | 13,624,819 | 13,529,446 | ||||||||||||||||||||
|
Team Services Group |
Services: Consumer |
Senior Secured First Lien Term Loan LIBOR + 5.000%, 1.000% Floor(5) (6) |
12/20/2027 |
5,000,000 | 4,850,000 | 4,825,000 | 0.9 | % | ||||||||||||||
|
Senior Secured Second Lien Term Loan LIBOR + 9.000%, 1.000% Floor(5) (6) |
12/18/2028 |
5,000,000 | 4,850,000 | 4,900,000 | 0.9 | % | ||||||||||||||||
| 10,000,000 | 9,700,000 | 9,725,000 | ||||||||||||||||||||
|
The Octave Music Group, Inc. |
Media: Diversified & Production |
Senior Secured First Lien Term Loan LIBOR + 5.250%, 1.000% Floor, 0.75% PIK(5) (6) |
5/29/2025 |
7,793,103 | 7,727,145 | 6,780,000 | 1.3 | % | ||||||||||||||
| 7,793,103 | 7,727,145 | 6,780,000 | ||||||||||||||||||||
|
True Religion Apparel, Inc. |
Retail |
Senior Secured First Lien Term Loan 10.000%(13) |
10/27/2022 |
179,437 | 133,654 | 12,094 | — | % | ||||||||||||||
|
Common Stock - 2,448 shares (10) |
— | — | — | — | % | |||||||||||||||||
|
Warrants - 1,122 warrants (10) |
— | — | — | — | % | |||||||||||||||||
| 179,437 | 133,654 | 12,094 | ||||||||||||||||||||
|
Velocity Pooling Vehicle, LLC |
Automotive |
Senior Secured First Lien Term Loan LIBOR + 11.000%, 1.000% Floor(4) (5) |
4/28/2023 |
871,784 | 838,397 | 871,784 | 0.2 | % | ||||||||||||||
|
Common Units - 4,676 units (5) (10) |
— | 259,937 | 11,035 | — | % | |||||||||||||||||
|
Warrants - 5,591 warrants (5) (10) |
3/30/2028 |
— | 310,802 | 13,195 | — | % | ||||||||||||||||
| 871,784 | 1,409,136 | 896,014 | ||||||||||||||||||||
|
VOYA CLO 2015-2, LTD. |
Multi-Sector Holdings |
Subordinated Notes 0.516% effective yield(5) (7) (8) (9) |
7/19/2028 |
10,735,659 | 5,792,260 | 3,657,639 | 0.7 | % | ||||||||||||||
| 10,735,659 | 5,792,260 | 3,657,639 | ||||||||||||||||||||
|
VOYA CLO 2016-2, LTD. |
Multi-Sector Holdings |
Subordinated Notes 2.808% effective yield(5) (7) (8) (9) |
7/19/2028 |
11,088,290 | 7,333,317 | 4,407,595 | 0.8 | % | ||||||||||||||
| 11,088,290 | 7,333,317 | 4,407,595 | ||||||||||||||||||||
|
Walker Edison Furniture Company LLC |
Consumer Goods: Durable |
Senior Secured First Lien Term Loan LIBOR + 8.750%, 1.000% Floor(4) (5) |
9/26/2024 |
1,975,000 | 1,975,000 | 1,975,000 | 0.4 | % | ||||||||||||||
|
Senior Secured First Lien Term Loan LIBOR + 6.250%, 1.000% Floor(4) (5) |
9/26/2024 |
14,250,000 | 14,250,000 | 14,250,000 | 2.7 | % | ||||||||||||||||
|
Common Units - 2,000 units (5) (10) |
— | 2,000,000 | 11,000,000 | 2.1 | % | |||||||||||||||||
| 16,225,000 | 18,225,000 | 27,225,000 | ||||||||||||||||||||
|
Watermill-QMC Midco, Inc. |
Automotive |
Equity - 1.62% partnership interest (5) (10) |
— | 902,277 | — | — | % | |||||||||||||||
| — | 902,277 | — | ||||||||||||||||||||
|
Wawona Delaware Holdings, LLC |
Beverage & Food |
Senior Secured First Lien Term Loan LIBOR + 4.750%(4) (5) |
9/11/2026 |
49,375 | 46,869 | 48,141 | — | % | ||||||||||||||
| 49,375 | 46,869 | 48,141 | ||||||||||||||||||||
|
West Dermatology, LLC |
Healthcare & Pharmaceuticals |
Senior Secured First Lien Term Loan LIBOR + 7.500%, 1.000% Floor(5) (6) (12) |
2/11/2025 |
726,672 | 726,672 | 613,498 | 0.1 | % | ||||||||||||||
|
Revolving Credit Facility LIBOR + 6.000%, 1.000% Floor, 0.75% PIK(5) (6) |
2/11/2025 |
1,657,459 | 1,657,459 | 1,614,033 | 0.3 | % | ||||||||||||||||
|
Senior Secured First Lien Term Loan LIBOR + 6.000%, 1.000% Floor, 0.750% PIK(5) (6) |
2/11/2025 |
4,739,503 | 4,739,503 | 4,617,698 | 0.9 | % | ||||||||||||||||
| 7,123,634 | 7,123,634 | 6,845,229 | ||||||||||||||||||||
|
Wok Holdings Inc. |
Retail |
Senior Secured First Lien Term Loan LIBOR + 6.250%, (5) (6) |
3/1/2026 |
49,125 | 33,080 | 42,758 | — | % | ||||||||||||||
| 49,125 | 33,080 | 42,758 | ||||||||||||||||||||
|
Total non-controlled/non-affiliated investments |
$ | 521,483,006 | $ | 472,813,820 | 89.9 | % | ||||||||||||||||
|
Company(1)(2) |
Industry |
Type of Investment |
Maturity |
Par Amount |
Cost |
Fair Value |
% of Net Assets(3) |
|||||||||||||||
|
1888 Industrial Services, LLC |
Energy: Oil & Gas |
Revolving Credit Facility LIBOR + 5.000%, 1.000% Floor(4) (5) (12) |
9/30/2021 |
1,243,924 | 1,243,924 | 1,243,924 | 0.2 | % | ||||||||||||||
|
Senior Secured First Lien Term Loan LIBOR + 5.000%, 1.000% Floor(4) (5) (13) |
9/30/2021 |
431,176 | 403,717 | 431,176 | 0.1 | % | ||||||||||||||||
|
Senior Secured First Lien Term Loan LIBOR + 5.000%, 1.000% Floor, PIK(4) (5) (13) |
9/30/2021 |
3,534,740 | 3,315,574 | — | — | % | ||||||||||||||||
|
Senior Secured First Lien Term Loan LIBOR + 8.000%, 1.000% Floor, PIK(4) (5) (13) |
9/30/2021 |
9,286,929 | 6,816,029 | — | — | % | ||||||||||||||||
|
Units - 6,122.765 units (5) (10) |
— | — | — | — | % | |||||||||||||||||
| 14,496,769 | 11,779,244 | 1,675,100 | ||||||||||||||||||||
|
Black Angus Steakhouses, LLC |
Hotel, Gaming & Leisure |
Senior Secured First Lien Term Loan LIBOR + 9.000%, 1.000% Floor, PIK(5) (6) (13) |
6/30/2022 |
21,573,552 | 20,457,589 | 9,060,892 | 1.7 | % | ||||||||||||||
|
Senior Secured First Lien Term Loan LIBOR + 9.000%, 1.000% Floor(5) (6) |
6/30/2022 |
1,897,321 | 1,897,321 | 1,897,321 | 0.4 | % | ||||||||||||||||
|
Senior Secured First Lien Term Loan LIBOR + 9.000%, 1.000% Floor(6) (12) |
6/30/2022 |
3,055,556 | 3,055,556 | 3,055,556 | 0.6 | % | ||||||||||||||||
|
Equity - 44.60% of outstanding equity (5) (10) |
— | — | — | — | % | |||||||||||||||||
| 26,526,429 | 25,410,466 | 14,013,769 | ||||||||||||||||||||
|
Caddo Investors Holdings 1 LLC |
Forest Products & Paper |
Equity - 12.250% LLC Interest (5) (16) |
— | 5,072,149 | 6,366,372 | 1.2 | % | |||||||||||||||
| — | 5,072,149 | 6,366,372 | ||||||||||||||||||||
|
Charming Charlie LLC |
Retail |
Senior Secured First Lien Delayed Draw Term Loan 20.000%(13) (14) |
5/15/2020 |
769,967 | 769,968 | 396,225 | 0.1 | % | ||||||||||||||
|
Senior Secured First Lien Term Loan LIBOR + 10.000%, 1.000% Floor(4) (13) |
4/24/2023 |
7,590,773 | 5,859,128 | — | — | % | ||||||||||||||||
|
Senior Secured First Lien Term Loan 20.000%(13) (14) |
5/15/2020 |
138,517 | 138,517 | 71,281 | — | % | ||||||||||||||||
|
Common Stock - 34,923,249 shares (10) |
— | — | — | — | % | |||||||||||||||||
| 8,499,257 | 6,767,613 | 467,506 | ||||||||||||||||||||
|
Dynamic Energy Services International LLC |
Energy: Oil & Gas |
Senior Secured First Lien Term Loan 13.500% PIK(4) (5) (13) |
12/31/2021 |
7,049,577 | 4,449,025 | 493,470 | 0.1 | % | ||||||||||||||
|
Common Units - 6,500,000 shares (5) (10) |
— | — | — | — | % | |||||||||||||||||
| 7,049,577 | 4,449,025 | 493,470 | ||||||||||||||||||||
|
Kemmerer Operations, LLC |
Metals & Mining |
Senior Secured First Lien Term Loan 15.000% PIK(5) |
6/21/2023 |
2,130,353 | 2,130,353 | 2,130,353 | 0.4 | % | ||||||||||||||
|
Senior Secured First Lien Delayed Draw Term Loan 15.000% PIK(5) (12) |
6/21/2023 |
399,366 | 399,366 | 399,366 | 0.1 | % | ||||||||||||||||
|
Common Units - 6.7797 units (5) (10) |
— | 962,717 | 962,760 | 0.2 | % | |||||||||||||||||
| 2,529,719 | 3,492,436 | 3,492,479 | ||||||||||||||||||||
|
MCM 500 East Pratt Holdings, LLC |
Banking, Finance, Insurance & Real Estate |
Equity - 5,000,000 units (8) (10) |
— | 5,000,000 | 7,350,000 | 1.4 | % | |||||||||||||||
| — | 5,000,000 | 7,350,000 | ||||||||||||||||||||
|
MCM Capital Office Park Holdings LLC |
Banking, Finance, Insurance & Real Estate |
Equity - 7,500,000 units (8) (10) |
— | 7,500,000 | 15,525,000 | 3.0 | % | |||||||||||||||
| — | 7,500,000 | 15,525,000 | ||||||||||||||||||||
|
Sierra Senior Loan Strategy JV I LLC |
Multi-Sector Holdings |
Equity - 89.01% ownership of SIC Senior Loan Strategy JV I LLC (8) (16) |
— | 110,050,000 | 81,788,964 | 15.6 | % | |||||||||||||||
| — | 110,050,000 | 81,788,964 | ||||||||||||||||||||
|
Total controlled/affiliated investments(15) |
$ | 179,520,933 | $ | 131,172,660 | 25.0 | % | ||||||||||||||||
|
Total investments |
$ | 701,003,939 | $ | 603,986,480 | 114.9 | % | ||||||||||||||||
|
Money Market Fund - 32.5% |
||||||||||||||||||||||
|
Federated Institutional Prime Obligations Fund |
Money Market 0.150%(11) |
25,401,625 | 25,401,625 | 25,401,625 | 4.8 | % | ||||||||||||||||
|
State Street Institutional Liquid Reserves Fund |
Money Market 0.010% (11) |
12,683,935 | 12,686,471 | 12,685,203 | 2.4 | % | ||||||||||||||||
|
Total money market fund |
$ | 38,085,560 | $ | 38,088,096 | $ | 38,086,828 | 7.2 | % | ||||||||||||||
|
(1) |
All of the Company's investments are domiciled in the United States except for AMMC CLO 22, Limited Series 2018-22A, AMMC CLO 23, Limited Series 2020-23A, Apidos CLO XXIV, Series 2016-24A, Dryden 38 Senior Loan Fund, Series 2015-38A, Dryden 43 Senior Loan Fund, Series 2016-43A, Dryden 49 Senior Loan Fund, 2017-49A, Magnetite XIX, Limited, Sound Point CLO XX, Ltd., VOYA CLO 2016-2, LTD., and VOYA CLO 2015-2, LTD., which are all domiciled in the Cayman Islands. All foreign investments were denominated in US Dollars. |
|
(2) |
Unless otherwise indicated, all securities are valued using significant unobservable inputs, which are categorized as Level 3 assets under the definition of ASC 820 fair value hierarchy. |
|
(3) |
Percentage is based on net assets of $525,740,939 as of December 31, 2020. |
|
(4) |
The interest rate on these loans is subject to a base rate plus 3 Month "3M" LIBOR, which at December 31, 2020 was 0.24%. The interest rate is subject to a minimum LIBOR floor. |
|
(5) |
An affiliated fund that is managed by an affiliate of SIC Advisors LLC also holds an investment in this security. |
|
(6) |
The interest rate on these loans is subject to a base rate plus 1 Month "1M" LIBOR, which at December 31, 2020 was 0.14%. The interest rate is subject to a minimum LIBOR floor. |
|
(7) |
Securities are exempt from registration under Rule 144A of the Securities Act of 1933, as amended (the "Securities Act"). These securities represent a fair value of $51,094,601 or 9.7% of net assets as of December 31, 2020 and are considered restricted securities. |
|
(8) |
The investment is not a qualifying asset under Section 55 of the Investment Company Act of 1940, as amended (the "1940 Act"). Non-qualifying assets represent 30.0% of the Company's portfolio at fair value. |
|
(9) |
This investment is in the equity class of a collateralized loan obligation ("CLO"). The CLO equity investments are entitled to recurring distributions that are generally equal to the excess cash flow generated from the underlying investments after payment of the contractual payments to debt holders and fund expenses. The current estimated yield is based on the current projections of this excess cash flow taking into account assumptions that have been made regarding expected prepayments, losses and future reinvestment rates. These assumptions are periodically reviewed and adjusted. Ultimately, the actual yield may be higher or lower than the estimated yield if actual results differ from those used for the assumptions. |
|
(10) |
Security is non-income producing. |
|
(11) |
Represents securities in Level 1 in the ASC 820 table (see Note 4). |
| (12) | The investment has an unfunded commitment as of December 31, 2020. For further details see Note 11. Fair value includes an analysis of the unfunded commitment. |
|
(13) |
The investment was on non-accrual status as of December 31, 2020. |
| (14) | The investment is past due as of December 31, 2020. |
|
(15) |
Affiliate Investments are defined by the 1940 Act as investments in companies in which the Company owns at least 5% but no more than 25% of the voting securities or we are under common control with such portfolio company. Control Investments are defined by the 1940 Act as investments in companies in which the Company owns more than 25% of the voting securities or maintains greater than 50% of the board representation. |
|
(16) |
As a practical expedient, the Company uses NAV to determine the fair value of this investment. |
| (17) | The interest rate on these loans is subject to a base rate plus 6 Month "6M" LIBOR, which at December 31, 2020 was 0.34%. The interest rate is subject to a minimum LIBOR floor. |
As of December 31, 2020, the weighted average yield based upon original cost on our portfolio investments was approximately 8.0%, and approximately 69.2% of our portfolio investments were senior secured. As of December 31, 2020, of our income-bearing investment portfolio bore interest based on floating rates, such as LIBOR or the Alternate Base Rate ("ABR"), and bore interest at fixed rates. The weighted average yield on income-producing investments is computed based upon the contractual interest payments and principal amortizations due at maturity for each individual investment, which amount is divided by the total cost borne by us on such income-producing investments as of the end of the applicable reporting period. The yield on our portfolio investments is higher than what our investors will realize because it does not reflect our expenses and the sales load paid by investors.
Overview of Portfolio Companies
Set forth below is a brief description of the business of our portfolio companies as of December 31, 2020.
|
Portfolio Company |
|
Brief Description of Portfolio Company |
|
1888 Industrial Services, LLC |
|
1888 Industrial Services, LLC provides field support services to oil and gas independent producers, drilling companies and midstream companies in the Denver-Julesburg Basin, with headquarters in the heart of the Wattenberg region in Greeley, CO. AAR builds, repairs, modifies and maintains oil and gas production equipment, sites, wells and pipelines. |
|
AAAHI Acquisition Corporation |
|
AAAHI Acquisition Corporation (“All Aboard”) is a leading provider of passenger transport services to customers throughout the U.S. Sun Belt Region. All Aboard is comprised of six local operating units, the largest of which include: Hotard, All Aboard America!, and Sun Diego. |
|
Alpine SG, LLC |
|
Alpine SG, LLC ("Alpine SG") is an aggregator of niche, vertically oriented software businesses. Each acquired business operates independently with oversight from the Alpine SG management team. The platform includes the following companies:.Aerialink, Minute Menu, Bill4Time, and Exym. |
|
American Dental Partners, Inc. |
|
American Dental Partners, Inc., founded in 1995 and headquartered in Wakefield, MA, provides dental groups with critical administrative functions, enabling dentists to focus on clinical care. |
|
Amerijet Holdings, Inc. |
|
Amerijet Holdings, Inc., headquartered in Fort Lauderdale, FL, is a leading provider of air cargo and logistics to and from the Caribbean, Mexico and Latin America. |
|
AMMC CLO 22, Limited Series 2018-22A |
|
AMMC CLO 22, Limited Series 2018-22A is a collateralized loan obligation vehicle invested in a diversified portfolio of primarily senior secured first lien bank loans and, to a limited extent, senior unsecured loans, second lien loans and first lien last, out loans. |
| AMMC CLO 23, Ltd. Series 2020-23A | AMMC CLO 23, Ltd. Series 2020-23A is a collateralized loan obligation vehicle invested in a diversified portfolio of primarily senior secured first lien bank loans and, to a limited extent, senior unsecured loans, second lien loans and first lien last-out loans. | |
|
Answers Finance, LLC |
|
Answers Finance, LLC (“Answers”) is headquartered in St. Louis, MO operates three primary businesses, supported by shared services functions, focused on empowering consumers and brands by connecting them with the information to optimize their decision making. |
|
Apidos CLO XXIV, Series 2016-24A |
|
Apidos CLO XXIV, Series 2016-24A is a collateralized loan obligation vehicle invested in a diversified portfolio of primarily senior secured first lien bank loans and, to a limited extent, senior unsecured loans, second lien loans and first lien last-out loans. |
| Arrow International, Inc. | The Company provides charitable gaming products (pull tabs and charitable bingo supplies) to various social & charitable organizations that rely on Arrow’s products to generate income for various philanthropic causes. | |
|
Avantor, Inc. |
|
Avantor, Inc. is a global provider of products and services to the biopharma, healthcare, education & government, and advanced technologies & applied materials industries. |
|
Aviation Technical Services, Inc. |
|
Aviation Technical Services, Inc., founded in 1970 and headquartered in Everett, WA, is a provider of commercial aerospace aftermarket services to the North American maintenance, repair and overhaul market. |
|
Black Angus Steakhouses, LLC |
|
Black Angus Steakhouses, LLC, founded in 1964 and headquartered in Los Altos, CA, operates restaurants across six states including California, Arizona, Alaska, New Mexico, Washington, and Hawaii. |
|
BRG Sports, Inc. |
|
BRG Sports, Inc., founded in 1929 and headquartered in Des Plaines, Illinois, is a leading designer and developer of football helmets, protective sports equipment, head impact monitoring technologies, apparel and related accessories. |
|
Brook & Whittle Holding Corp. |
|
Brook & Whittle Holding Corp., founded in 1996 and based in North Branford, CT, provides printing and packaging solutions in North America. The company produces and supplies pressure sensitive labels and shrink film packaging products for personal care, beverage, food, and household industry sectors. |
|
Caddo Investors Holdings 1 LLC |
|
Caddo Investors Holdings 1 LLC (d/b/a TexMark Timber Treasury, L.P.), consists of ~1.1 million acres of high quality and relatively young timber lands located in East Texas. |
|
Callaway Golf Co. |
|
Callaway Golf Company is a premium golf equipment and active lifestyle company with a portfolio of global brands, including Callaway Golf, Odyssey, OGIO, TravisMathew and Jack Wolfskin. |
|
Charming Charlie LLC |
|
Charming Charlie LLC is a destination retailer of fashion jewelry and accessories. Charming Charlie is known for its fun, friendly, and fabulous brand which permeates its in-store and online experience. |
| CM Finance SPV LLC | CM Finance SPV LLC is a wholly-owned subsidiary of Investcorp Credit Management BDC, Inc., a specialty finance company that invests primarily in the debt of U.S. middle-market companies. | |
|
CPI International, Inc. |
|
CPI Holdings, Inc. develops and manufactures microwave, radio frequency, power, and control products for critical communications, defense and medical applications. |
|
CT Technologies Intermediate Holdings, Inc. |
|
CT Technologies Intermediate Holdings, Inc., founded in 1976 and located in Alpharetta, GA, is a provider of outsourced release-of-information services, which involves the interaction between healthcare providers, who possess protected medical information, and authorized requestors, who are entitled to receive that information for various commercial, legal, or personal purposes. |
|
DataOnline Corp. |
|
DataOnline Corp ("DataOnline") is a global provider of M2M solutions specifically for the monitoring of both fixed and mobile remote industrial assets. DataOnline specializes in robust and reliable devices & sensors, remote data collection, global wireless communications & web-based applications. |
|
Delta Air Lines, Inc. |
|
Delta Air Lines, Inc. is a leading global airline based in the U.S. serving approximately 200 million customers in 2019. |
|
Dryden 38 Senior Loan Fund, Series 2015-38A |
|
Dryden 38 Senior Loan Fund, Series 2015-38A is a collateralized loan obligation vehicle invested in a diversified portfolio of primarily senior secured first lien bank loans and, to a limited extent, senior unsecured loans, second lien loans and first lien last out loans. |
|
Dryden 43 Senior Loan Fund, Series 2016-43A |
|
Dryden 43 Senior Loan Fund, Series 2016-43A is a collateralized loan obligation vehicle invested in a diversified portfolio of primarily senior secured first lien bank loans and, to a limited extent, senior unsecured loans, second lien loans and first lien last out loans. |
|
Portfolio Company |
|
Brief Description of Portfolio Company |
|
Dryden 49 Senior Loan Fund, Series 2017-49A |
|
Dryden 49 Senior Loan Fund is a collateralized loan obligation vehicle invested in a diversified portfolio of primarily senior secured first lien bank loans and, to a limited extent, senior unsecured loans, second lien loans and first lien last out loans. |
|
Dynamic Energy Services International LLC |
|
Dynamic Energy Services International LLC, headquartered in New Orleans, LA, is a provider of full-service fabrication, construction and maintenance services to a broad range of worldwide markets including oil and gas, industrial and petrochemical markets. |
| Envision Healthcare Corporation | Envision Healthcare Corporation is a national provider of healthcare services with two main operating segments – Physician Services and Ambulatory Services. | |
|
First Boston Construction Holdings, LLC |
|
First Boston Construction Holdings, LLC, an affiliate of The Grossman Companies with offices in Quincy, MA and Southport, CT, extends private loans to builders, developers and real estate investors in the Northeast region of the United States. |
|
Friedrich Holdings, Inc. |
|
Friedrich Holdings, Inc., founded in 1883 and headquartered in San Antonio, TX, engineers and manufactures high-performance in-room air conditioning products. |
|
GK Holdings, Inc. |
|
GK Holdings, Inc., headquartered in Cary, NC, is a worldwide provider of IT and business skills learning solutions participating in the global corporate training market. |
| Glass Mountain Pipeline Holdings II, LLC | Glass Mountain Pipeline Holdings II, LLC is a ~280 mile pipeline providing crude oil transportation and storage to the STACK / SCOOP / MERGE, Mississippi Lime, and Granite Wash areas. | |
|
Golden West Packaging Group LLC |
|
Golden West Packaging Group LLC is a vertically integrated provider of highly customized, corrugated cardboard packaging. |
|
Holland Acquisition Corp. |
|
Holland Acquisition Corp. (“Holland”), founded in 1985 and headquartered in Fort Worth, TX, is a provider of land services to blue-chip clients throughout the United States. Holland offers a full-suite of land services in all three stages of the energy production cycle: upstream, midstream and downstream. |
|
Hylan Datacom & Electrical LLC |
|
Hylan Datacom & Electrical LLC, headquartered in Holmdel, NJ, is a specialty design, engineering and construction company providing telecommunications, electrical and utility services to customers in New York City and the greater Tri-State area. |
|
Impact Group, LLC |
|
Impact Group, LLC is a Boise, Idaho based sales and marketing agency providing outsourced sales, marketing and merchandising services to consumer packaged goods manufacturers. |
| Innovative Xcessories & Services, LLC | Innovative XCessories & Services, LLC is a U.S. based Original Equipment and Aftermarket upfitter to the automotive industry, primarily providing spray-on coating to truck beds and exterior accessories such as Side Steps and roof racks. | |
|
Interflex Acquisition Company, LLC |
|
InterFlex Acquisition Company, LLC, headquartered in Wilkesboro, NC, is a comprehensive provider of specialized printed and converted flexible packaging solutions for food and consumer packaged goods producers throughout the USA and UK. |
| Iqor US Inc. | iQor is a managed services provider of customer engagement and technology-enabled business process outsourcing solutions. | |
|
Isagenix International, LLC |
|
Isagenix International, LLC (“Isagenix”) develops and distributes nutritional products through a direct marketing strategy. Isagenix offers products across a range of categories including weight wellness, energy, performance and healthy aging. |
|
Isola USA Corp. |
|
Isola USA Corp., founded in Germany in 1912, is a global material science company that designs, develops, and manufactures copper-clad laminate and prepreg used to fabricate advanced multilayer printed circuit boards. |
| Ivanti Software, Inc. | Ivanti is a leading IT management software provider to mid-market enterprises. Per Gartner (2020) the Company is one of three leaders in the segment (BMC, ServiceNow comps). The Company has +24K clients including Autotrader, Oxford Univ, UnderArmour, UMC Health Systems, Service Corp, Adventis, covering +48M endpoints globally. | |
|
JFL-WCS Partners, LLC |
|
JFL-WCS Partners, LLC (d/b/a Waste Control Specialists LLC), headquartered in Dallas, Texas, operates a state-of-the-art facility for the processing, treatment, storage and disposal of LLRW, hazardous waste, and mixed hazardous and radioactive wastes. |
|
Kemmerer Operations, LLC |
|
Kemmerer Operations, LLC, location in Wyoming, is a producer of high-value thermal coal and surface-mined coal. |
|
Keystone Acquisition Corp. |
|
Keystone Acquisition Corp. provides care and quality management to public and commercial clients in the healthcare industry. |
|
LogMeIn, Inc. |
|
LogMeIn is a SaaS software provider of cloud communication, remote access, remote customer engagement & IT support to SMB customers |
|
Magnetite XIX, Limited |
|
Magnetite XIX, Limited is a collateralized loan obligation vehicle invested in a diversified portfolio of primarily senior secured first lien bank loans and, to a limited extent, second lien loans. |
|
MCM 500 East Pratt Holdings, LLC |
|
MCM 500 East Pratt Holdings, LLC is a 13-story, 279,712 square foot, class A office building located along Baltimore’s Pratt Street corridor developed in 2004 by the Trammell Crow Company |
|
MCM Capital Office Park Holdings LLC |
|
MCM Capital Office Park Holdings LLC is a commercial real estate portfolio in the Washington, DC metro area. The portfolio consists of six office buildings, a bank pad site and a residential development opportunity. |
|
Midwest Physician Administrative Services, LLC |
|
Midwest Physician Administrative Services, LLC, headquartered in Downers Grove, Illinois is the largest independent, for-profit, multi-specialty physician group in the United States. |
|
Novetta Solutions, LLC |
|
Novetta Solutions, LLC, headquartered in McLean, VA, is an advanced analytics company focused on technology-intensive national security solutions, providing services to government and commercial organizations. |
|
Offen Inc. |
|
Offen, Inc., headquartered in Commerce City, Colorado, is a wholesaler and distributor of motor fuel and related products, delivering over 1B gallons of fuel per year. |
|
Path Medical, LLC |
|
Path Medical, LLC, founded in 1993, is a provider of fully-integrated acute trauma treatment and diagnostic imaging solutions to patients injured in automobile and non-work related accidents throughout Florida. |
|
PetroChoice Holdings, Inc. |
|
PetroChoice Holdings, Inc. is a distributor of US lubricants and services primarily serving the Northeastern and Midwestern United States. |
|
Polymer Solutions Group Holdings, LLC |
|
Polymer Solutions Group Holdings, LLC, formed in 2015, is a portfolio of companies that deliver customer-centric solutions that improve the customers’ products, processes and performance. |
|
Portfolio Company |
|
Brief Description of Portfolio Company |
| Project Investor Holdings | Project Investor Holdings is an innovative sand producer and technology company operating in high-quality silica sand and gravel, and proppant technology. | |
| Project Silverback Holdings Corp. | Project Silverback Holdings Corp. is a quality management software provider via on-premise and cloud based solutions, established in 1994. | |
|
Proppants Holdings, LLC |
|
Proppants Holdings, LLC is a manufacturer and provider of high-quality and innovative raw and resin coated frac sand for use in the oil and gas industry. |
|
PT Network, LLC |
|
PT Network, LLC (d/b/a Pivot Physical Therapy), is a regional outpatient physical therapy and sports medicine operator with clinics in most of the Mid-Atlantic region. |
|
RateGain Technologies, Inc. |
|
RateGain Technologies, Inc. provides hospitality and travel technology solutions for revenue management decision support, rate intelligence, electronic distribution and brand engagement helping customers across the world in streamlining their operations and sales. |
|
Redwood Services Group, LLC |
|
Redwood Services Group, LLC is a group of regional IT managed service providers that provide fully outsourced IT services to small and medium sized businesses. |
|
Resolute Investment Managers, Inc. |
|
Resolute Investment Managers, Inc. headquartered in Irving, TX, is an asset management firm that provides institutional-quality equity, fixed income, alternative and cash solutions to retail and institutional clients. |
|
Rhombus Cinema Holdings, LP |
|
Rhombus Cinema Holdings, LP, headquartered in Beverly Hills, CA, is an innovator and licensor of stereoscopic (3D) and other visual technologies for use in the cinema and on consumer electronic devices. |
| RTIC Subsidiary Holdings, LLC | RTIC, headquartered in Houston, TX, and founded in 2015, is a designer, manufacturer and marketer of a variety of stock and customized outdoor and recreational products including drinkware, coolers, and other related products and accessories. The majority of sales are direct-to-consumer sales through RTIC’s own website. RTIC also sells products through its branded retail store located in Houston as well as Amazon. | |
|
SavATree, LLC |
|
SavATree, LLC, headquartered in Bedford Hills, NY, is a leading provider of residential tree and shrub maintenance, professional lawn care, and outdoor residential services with over twenty branches throughout the Eastern and Midwestern regions of the United States. |
|
SFP Holding, Inc. |
|
SFP Holdings, Inc., founded in 1999 and headquartered in St. Paul, MN, is a provider of fire and life safety security systems. |
|
Sierra Senior Loan Strategy JV I LLC |
|
Sierra Senior Loan Strategy JV I LLC generates current income and capital appreciation by investing primarily in the debt of privately-held middle market companies in the United States with a focus on senior secured first lien term loans. See "Note 3 - Investments" in "Item 8 - Consolidated Financial Statements and Supplementary Data." |
|
Simplified Logistics, LLC |
|
Simplified Logistics, LLC is a Westlake, OH based provider of asset-light transportation management services focused on primarily managing less-than-truckload freight. |
|
SMART Financial Operations, LLC |
|
SMART Financial Operations, LLC, headquartered in Orlando, FL, is a specialty retail platform initially comprised of three distinct retail pawn store chains and a pawn industry consulting firm. |
|
Smile Doctors LLC |
|
Smile Doctors LLC is a Specialty Dental Services Organization focused on acquiring pre-existing orthodontist practices and improving profitability through the implementation of upgraded marketing strategies and pricing plans, streamlining scheduling and back-office functions, and supporting new start growth with capital investments. |
|
Sound Point CLO XX, Ltd. |
|
Sound Point CLO XX, Ltd is a collateralized loan obligation vehicle invested in a diversified portfolio of primarily senior secured first lien bank loans and, to a limited extent, senior unsecured loans, second lien loans and first lien last, out loans. |
|
Starfish Holdco, LLC |
|
Starfish Holdco, LLC (d/b/a Syncsort or Precisely) through its subsidiaries is a global software company specializing in Big Data, high speed sorting products, data protection, data quality and integration software and services, for mainframe, power systems and open system environments to enterprise customers. |
|
Team Car Care, LLC |
|
Team Car Care, LLC (dba Heartland Automotive Services), founded in 1995, is a provider of quick lube and other ancillary maintenance services and is the largest Jiffy Lube franchisee in the United States. |
|
Team Services Group |
|
TEAM Services Group is a provider of employment administration and risk management solutions that facilitate self-directed home care (unskilled) for seniors and people w/ long-term disabilities |
|
The Octave Music Group, Inc. |
|
The Octave Music Group, Inc., headquartered in New York, NY, is an in-venue interactive music and entertainment platform, featured in bars and restaurants across North America and Europe. |
|
True Religion Apparel, Inc. |
|
True Religion Apparel, Inc. (“True Religion”), headquartered in Vernon, CA, designs, manufactures, and markets the True Religion brand. True Religion’s product line is sold in branded retail and outlet stores, as well as department stores and boutiques in the U.S. and abroad. |
|
Velocity Pooling Vehicle, LLC |
|
Velocity Pooling Vehicle, LLC, headquartered in Indianapolis, IN is a manufacturer comprised of a group of highly recognizable brands serving nearly all product categories in the powersports aftermarket industry and a distributor of proprietary and sourced brands to a variety of dealers and retailers. |
|
Portfolio Company |
|
Brief Description of Portfolio Company |
|
VOYA CLO 2015-2, LTD. |
|
VOYA CLO 2015-2, LTD. is a collateralized loan obligation vehicle invested in a diversified portfolio of primarily senior secured first lien bank loans and, to a limited extent, senior unsecured loans, second lien loans and first lien last, out loans. |
|
VOYA CLO 2016-2, LTD. |
|
VOYA CLO 2016-2, LTD. is a collateralized loan obligation vehicle invested in a diversified portfolio of primarily senior secured first lien bank loans and, to a limited extent, senior unsecured loans, second lien loans and first lien last, out loans. |
|
Walker Edison Furniture Company LLC |
|
Walker Edison Furniture Company LLC ("Walker Edison") is an e-commerce furniture platform exclusively selling through the websites of top online retailers. Walker Edison operates a data-driven business model to sell a variety of home furnishings in the discount category including TV stands, bedroom furniture, chairs & tables, desks and other. |
|
Watermill-QMC Midco, Inc. |
|
Watermill-QMC Midco, Inc. (d/b/a Quality Metalcraft, Inc.), founded in 1964 and headquartered in Livonia, MI, is a provider of complex assemblies for specialty automotive production, prototype and factory assist applications. |
|
Wawona Delaware Holdings, LLC |
Wawona Delaware Holdings, LLC a vertically-integrated supplier of high quality conventional and organic stone fruit and citrus. | |
| West Dermatology, LLC | West Dermatology is an operator of dermatology clinics in Nevada, Arizona and California. The Company's board-certified dermatologists specialize in a range of clinical diagnostic and treatment options including general dermatology services, Mohs surgery, cosmetic services, and medical grade dermatology products. | |
| Wok Holdings, Inc. | Wok Holdings (dba P.F. Chang's) is a U.S. full-service Asian cuisine restaurant brand that operates 216 company-operated restaurants in 39 states; 94 franchisees in 23 countries. |
INVESTMENT ADVISORY AGREEMENT AND FEES
Investment Advisory Fees
We pay SIC Advisors a fee for its services under the Investment Advisory Agreement consisting of two components: a management fee and an incentive fee. We believe that this fee structure benefits stockholders by aligning the compensation of our Adviser with our overall investment performance. The cost of both the base management fee and the incentive fee are ultimately borne by our stockholders.
Base Management Fee
The base management fee is calculated at an annual rate of 1.75% of our gross assets payable quarterly in arrears. For purposes of calculating the base management fee, the term “gross assets” includes any assets acquired with the proceeds of leverage. The Adviser benefits when we incur debt or use leverage. The base management fee is calculated based on our gross assets at the end of each completed calendar quarter. Base management fees for any partial quarter are appropriately pro-rated.
Incentive Fee
The incentive fee is divided into two parts: (i) a subordinated incentive fee on income and (ii) an incentive fee on capital gains. Each part of the incentive fee is outlined below.
The subordinated incentive fee on income is earned on pre-incentive fee net investment income and is determined and payable in arrears as of the end of each calendar quarter during which the Investment Advisory Agreement is in effect. If the Investment Advisory Agreement is terminated, the fee will also become payable as of the effective date of the termination.
The subordinated incentive fee on income for each quarter will be calculated as follows:
|
• |
No subordinated incentive fee on income is payable in any calendar quarter in which the pre-incentive fee net investment income does not exceed a quarterly return to investors of 1.75% per quarter on our net assets at the end of the immediately preceding fiscal quarter. We refer to this as the preferred quarterly return. |
|
|
||
|
• |
All of our pre-incentive fee net investment income, if any, that exceeds the preferred quarterly return, but is less than or equal to 2.1875% on our net assets at the end of the immediately preceding fiscal quarter in any quarter, is payable to the Adviser. We refer to this portion of our subordinated incentive fee on income as the catch up. It is intended to provide an incentive fee of 20% on all of our pre-incentive fee net investment income when our pre-incentive fee net investment income exceeds 2.1875% on our net assets at the end of the immediately preceding fiscal quarter in any quarter. |
|
|
||
|
• |
For any quarter in which our pre-incentive fee net investment income exceeds 2.1875% on our net assets at the end of the immediately preceding fiscal quarter, the subordinated incentive fee on income shall equal 20% of the amount of our pre-incentive fee net investment income, because the preferred return and catch up will have been achieved. |
|
|
||
|
• |
Pre-incentive fee net investment income is defined as interest income, dividend income and any other income accrued during the calendar quarter, minus our operating expenses for the quarter, including the base management fee, expenses payable under the Administration Agreement, any interest expense and dividends paid on any issued and outstanding preferred stock, but excluding the incentive fee. Pre-incentive fee net investment income does not include any realized capital gains, realized capital losses or unrealized capital appreciation or depreciation. |
The following is a graphical representation of the calculation of the quarterly subordinated incentive fee on income:
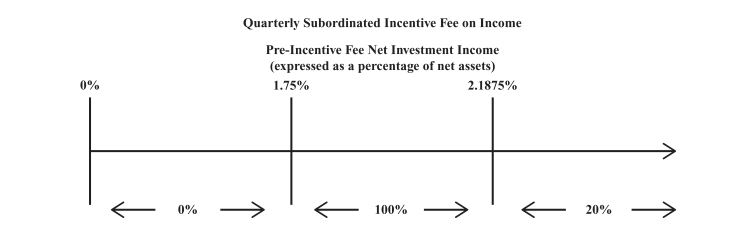
Percentage of Pre-Incentive Fee Net Investment Income Allocated to Quarterly Incentive Fee
The incentive fee on capital gains is earned on investments sold and shall be determined and payable in arrears as of the end of each calendar year during which the Investment Advisory Agreement is in effect. In the case the Investment Advisory Agreement is terminated, the fee will also become payable as of the effective date of such termination. The fee equals 20% of our realized capital gains, less the aggregate amount of any previously paid incentive fee on capital gains. The incentive fee on capital gains is equal to our realized capital gains on a cumulative basis from inception, computed net of all realized capital losses and unrealized capital depreciation on a cumulative basis.
Because of the structure of the subordinated incentive fee on income and the incentive fee on capital gains, it is possible that we may pay such fees in a quarter where we incur a net loss. For example, if we receive pre-incentive fee net investment income in excess of the 1.75% on our net assets at the end of the immediately preceding fiscal quarter for a quarter, we will pay the applicable incentive fee even if we have incurred a net loss in the quarter due to a realized or unrealized capital loss. Our Adviser will not be under any obligation to reimburse us for any part of the incentive fee it receives that is based on prior period accrued income that we never receive as a result of a subsequent decline in the value of our portfolio.
The fees that are payable under the Investment Advisory Agreement for any partial period will be appropriately pro-rated. The fees will also be calculated using a detailed policy and procedure approved by our Adviser and our board of directors, including a majority of the independent directors, and such policy and procedure will be consistent with the description of the calculation of the fees set forth above.
Our Adviser may elect to defer or waive all or a portion of the fees that would otherwise be paid to it in its sole discretion. Any portion of a fee not taken as to any month, quarter or year will be deferred without interest and may be taken in any such other month prior to the occurrence of a liquidity event as our Adviser may determine in its sole discretion.
Reimbursements of Organizational and Offering Expense
Under the terms of the Investment Advisory Agreement, SIC Advisors bears all organizational and offering expenses on our behalf. Since June 2, 2014, the date that we raised $300 million in gross proceeds in connection with the sale of shares of our common stock, SIC Advisors was no longer obligated to bear, pay or otherwise be responsible for any ongoing organizational and offering expenses on our behalf, and we have been responsible for paying or otherwise incurring all such organizational and offering expenses.
Advisory Services
Under the terms of the Investment Advisory Agreement, our Adviser is responsible for the following:
|
• |
determining the composition and allocation of our portfolio, the nature and timing of the changes to our portfolio and the manner of implementing such changes; |
|
• |
identifying, evaluating, negotiating and structuring the investments we make; |
|
• |
performing due diligence on prospective portfolio companies; |
|
• |
executing, closing, servicing and monitoring the investments we make; |
|
• |
determining the securities and other assets that we will purchase, retain or sell; and |
|
• |
providing us with such other investment advisory, research and related services as we may, from time to time, reasonably require for the investment of our capital. |
Under the Investment Advisory Agreement, SIC Advisors has a fiduciary responsibility for the safeguarding and use of all of our funds and assets. SIC Advisors is also subject to liability under both the 1940 Act and the Advisers Act for a breach of these fiduciary duties.
Currently, SIC Advisors is primarily responsible for initially identifying, evaluating, negotiating and structuring our investments. These activities will be carried out by its Investment Team and subject to the oversight of SIC Advisors’ senior investment personnel. Each investment that we make will require the approval of our Adviser before the investment may be made. Certain affiliated co-investment transactions may require the additional approval of our independent directors.
SIC Advisors’ services under the Investment Advisory Agreement are not exclusive, and it is free to furnish similar services to other entities so long as its services to us are not impaired.
Indemnification of Our Adviser
The Investment Advisory Agreement provides that the Adviser and its officers, directors, persons associated with SIC Advisors, stockholders (and owners of the stockholders), controlling persons and agents are entitled to indemnification from us for any damages, liabilities, costs and expenses (including reasonable attorneys’ fees and amounts reasonably paid in settlement) incurred by them in or by reason of any pending, threatened or completed action, suit, investigation or other proceedings arising out of or otherwise based on the performance of any of SIC Advisors’ duties or obligations under the Investment Advisory Agreement, as applicable, or otherwise as our investment adviser, (i) to the extent such damages, liabilities, cost and expenses (A) are not fully reimbursed by insurance and (B) do not arise by reason of willful misfeasance, bad faith, or gross negligence in SIC Advisors’ performance of such duties or obligations, or SIC Advisors’ reckless disregard of such duties or obligations, and (ii) otherwise to the fullest extent such indemnification is consistent with the provisions of our articles of incorporation, the 1940 Act, the laws of the State of Maryland and other applicable law.
The Investment Advisory Agreement further provides that SIC Advisors and its officers, directors, persons associated with SIC Advisors, stockholders (and owners of the stockholders), controlling persons and agents are not entitled to indemnification for any liability or loss suffered by them, nor will they be held harmless for any loss or liability suffered by us, unless (i) the indemnified party has determined, in good faith, that the course of conduct which caused the loss or liability was in our best interests; (ii) SIC Advisors was acting on behalf of or performing services for us; (iii) such liability or loss was not the result of misconduct or negligence by SIC Advisors; and (iv) such indemnification or agreement to hold harmless is recoverable only out of our net assets and not from stockholders.
Term; Effective Date
The Investment Advisory Agreement was initially approved by our board of directors on April 5, 2012 and, pursuant to the 1940 Act, remained in effect for an initial period of two years from its effective date. The Investment Advisory Agreement became effective on April 17, 2012, the date that we met our minimum offering requirement. Most recently, on April 3, 2020, the Company’s board of directors approved the renewal of the Investment Advisory Agreement for an additional one-year term, which will expire on April 17, 2021. Unless earlier terminated pursuant to its terms, the Investment Advisory Agreement will remain in effect from year-to-year thereafter if approved annually at an in-person meeting of our board of directors by a majority of our directors who are not "interested persons" (as defined in Section 2(a)(19) of the 1940 Act) of the Company or the Adviser, and either our board of directors or the holders of a majority of our outstanding voting securities.
At its meeting held on April 3, 2020, the Company’s board of directors, including all of the independent directors, considered the re-approval of the Investment Advisory Agreement. In advance of that meeting, the independent directors met separately on multiple occasions with their independent counsel. At those meetings, the independent directors reviewed a significant amount of information, which had been furnished by SIC Advisors at the request of independent counsel on behalf of the independent directors. The independent directors met on March 19, 2020 with members of SIC Advisors' senior management to review, among other things, the financial condition of SIC Advisors and its parent company, and, on March 31, 2020 with SIC Advisors' senior management and investment team to discuss, among other things, the Company's investment portfolio and its financing arrangements.
In its considerations, the Company’s board of directors focused on information it had received relating to, among other things: (a) the nature, quality and extent of the advisory and other services to be provided to the Company by SIC Advisors; (b) the Company’s investment performance and the investment performance of the Adviser; (c) comparative data with respect to advisory fees or similar expenses paid by other BDCs with similar investment objectives and strategies; (d) the Company’s operating expenses and expense ratio compared to BDCs with similar investment objectives and strategies; (e) any existing and potential sources of indirect income to SIC Advisors and its affiliates from its relationships with the Company and the profitability of those relationships; (f) information about the services to be performed and the personnel performing such services under the Investment Advisory Agreement; (g) the organizational capability and financial condition of SIC Advisors and its affiliates; (h) possible economies of scale arising from the Company's size and/or anticipated growth; and (i) possible alternative fee structures or bases for determining fees.
As part of its review, the Company’s board of directors evaluated charts that compared the advisory fees, administrative fees and performance of many BDCs, including some BDCs that might be considered to be somewhat comparable to the Company with respect to their investment objective or strategy. The Company’s board of directors took into account that it was difficult to identify BDCs that are comparable to the Company for this purpose due to several anomalies that exist in the BDC comparison group regarding apparent loss leader pricing, post-acquisition temporary fee reductions, lower risk profiles and therefore generally lower fee structures, and the general difficulty in determining reasonable comparable peer strategies due to many variables at work in the private loan market and with private loan credits in general. Based upon this analysis, the Company’s board of directors observed that, in light of the unique circumstances applicable to the Company, it was difficult to determine which BDCs were most comparable to the Company in terms of investment objective and investment strategy. Notwithstanding that difficulty, the Company’s board of directors noted that the Company’s investment performance generally appeared to be below that of the BDCs with somewhat similar investment profiles.
The Company’s board of directors also determined that the advisory fees paid by the Company were within the range of fees paid by such BDCs but generally were higher than the median of such BDCs. The board of directors considered management’s discussion of the Company’s relative investment performance and expenses. In particular, the Company’s board of directors considered the Company’s extensive efforts with respect to the proposed mergers with Medley Management Inc. and Medley Capital Corporation, which significantly impacted the Company’s operations, both from an investment standpoint and an operational standpoint. The Company’s board of directors weighed all of these factors in its analysis and decision making.
Based on the information reviewed and discussions with management, the board of directors, including all of the independent directors, concluded that the investment management fee rates and terms were reasonable in relation to the services to be provided and unanimously approved the Investment Advisory Agreement for a period of one additional year, which will expire on April 17, 2021. No single factor was determinative of the decision of our board of directors to approve the Investment Advisory Agreement, and individual directors may have weighed certain factors differently. Throughout the process, the independent directors were advised by independent counsel. In accordance with the 1940 Act, we may terminate the Investment Advisory Agreement with SIC Advisors upon 60 days’ written notice. The decision to terminate the agreement may be made by a majority of our independent directors or the holders of a majority of the outstanding shares of our common stock. In addition, SIC Advisors may terminate the Investment Advisory Agreement with us upon 120 days’ written notice.
Annual Board Approval of the Investment Advisory Agreement
Our board of directors, including a majority of independent directors, annually reviews the compensation the Company pays to Medley to determine that the provisions of the Investment Advisory Agreement are carried out satisfactorily and to determine, among other things, whether the fees payable under such agreement are reasonable in light of the services provided. Our board of directors reviews the methodology employed in determining how the expenses are allocated to the Company and the proposed allocation of administrative expenses among the Company and certain affiliates of Medley. Our board of directors then assesses the reasonableness of such reimbursements for expenses allocated to the Company based on the breadth, depth and quality of such services as compared to the estimated cost to the Company of obtaining similar services from third-party service providers known to be available. In addition, our board of directors considers whether any single third-party service provider would be capable of providing all such services at comparable cost and quality. Finally, our board of directors compares the total amount paid to Medley for such services to amounts paid by other comparable BDCs to their investment advisers for similar services.
ADMINISTRATION AGREEMENT AND FEES
Administrative Services
Under the terms of the Administration Agreement, and on our behalf, Medley Capital LLC performs or oversees the performance of various administrative services that we require. These include investor services, general ledger accounting, fund accounting, maintaining required financial records, calculating our net asset value, filing tax returns, preparing and filing SEC reports, preparing, printing and disseminating stockholder reports and generally overseeing the payment of our expenses and the performance of administrative and professional services rendered to us by others. Medley provides us with facilities and access to personnel necessary for our business and these services. For providing these services, facilities and personnel, we reimburse Medley Capital LLC for administrative expenses it incurs in performing its obligations.
Additionally, as a BDC, we must offer, and provide upon request, managerial assistance to our portfolio companies. This managerial assistance may include monitoring the operations of our portfolio companies, participating in board and management meetings, consulting with and advising officers of our portfolio companies and providing other organizational and financial guidance. Medley Capital LLC will make available such managerial assistance, on our behalf, to our portfolio companies whether or not they request this assistance. We may receive fees for these services and will reimburse Medley Capital LLC for its allocated costs in providing such assistance, subject to review and approval by our board of directors.
Term; Effective Date
On April 5, 2012, the Company entered into an administration agreement (the “Administration Agreement”) with Medley Capital LLC, pursuant to which Medley Capital LLC furnishes the Company with administrative services necessary to conduct its day-to-day operations. Pursuant to the 1940 Act, the Administration Agreement remained in effect for an initial period of two years from its effective date. The Administration Agreement became effective on April 17, 2012, the date that we met our minimum offering requirement. Pursuant to its terms, and unless earlier terminated as described below, the Administration Agreement will remain in effect from year-to-year if approved annually by a majority of our directors who are not "interested persons" (as defined in Section 2(a)(19) of the 1940 Act) of the Company or Medley Capital LLC, and either the holders of a majority of our outstanding voting securities or our board of directors. Most recently, on April 3, 2020, the Company’s board of directors approved the renewal of the Administration Agreement for an additional one-year term, which will expire on April 17, 2021. Medley Capital LLC is reimbursed for administrative expenses it incurs on the Company’s behalf in performing its obligations. Such costs are reasonably allocated to the Company on the basis of assets, revenues, time records or other reasonable methods. The Company does not reimburse Medley Capital LLC for any services for which it receives a separate fee or for rent, depreciation, utilities, capital equipment or other administrative items allocated to a controlling person of Medley Capital LLC. On February 28, 2013, Medley Capital LLC entered into a Sub-Administration Agreement with State Street Bank Global Fund Accounting and Custody to perform certain financial, accounting, administrative and other services on behalf of the Company.
REGULATION
General
We have elected to be regulated as a BDC under the 1940 Act and have also elected, and intend to qualify annually, to be treated for U.S. federal income tax purposes as a RIC under Subchapter M of the Code. BDCs are closed-end funds that elect to be regulated as BDCs under the 1940 Act. As such, BDCs are subject to only certain provisions of the 1940 Act. BDCs are provided greater flexibility under the 1940 Act than are other investment companies in dealing with their portfolio companies, issuing securities, and compensating their managers. BDCs can be internally or externally managed and may elect to be treated as RICs for U.S. federal income tax purposes. The 1940 Act contains prohibitions and restrictions relating to transactions between BDCs and their affiliates (including any investment advisers or sub-advisers), principal underwriters, and affiliates of those affiliates or underwriters. The 1940 Act requires that a majority of a BDC’s directors be persons other than “interested persons,” as that term is defined in the 1940 Act. In addition, the 1940 Act provides that we may not change the nature of our business so as to cease to be, or withdraw our election as a BDC unless approved by a majority of our outstanding voting securities. The 1940 Act defines “a majority of the outstanding voting securities” as the lesser of: (1) 67% or more of the voting securities present at a meeting if the holders of more than 50% of our outstanding voting securities are present or represented by proxy or (2) more than 50% of our voting securities.
As a BDC, we are required to meet an asset coverage ratio, reflecting the value of our total assets to our total senior securities, which include all of our borrowings and any preferred stock we may issue in the future, of at least 200%. However, in March 2018, the Small Business Credit Availability Act (the “SBCA”) modified the 1940 Act by allowing a BDC to increase the maximum amount of leverage it may incur from 200% to 150%, if certain requirements are met. Under the 1940 Act, we are allowed to increase our leverage capacity if stockholders representing at least a majority of the votes cast, when a quorum is present, approve a proposal to do so. If we receive stockholder approval, we would be allowed to increase our leverage capacity on the first day after such approval. Alternatively, the 1940 Act allows the majority of our independent directors to approve an increase in our leverage capacity, and such approval would become effective on the one-year anniversary of such approval. In addition, the legislation requires non-listed BDCs to offer to repurchase 25% of its securities each quarter following the calendar quarter in which the BDC obtains such approval. In either case, we would be required to make certain disclosures on our website and in SEC filings regarding, among other things, the receipt of approval to increase our leverage, our leverage capacity and usage, and risks related to leverage. However, the Company has not sought stockholder or board approval to reduce its asset coverage ratio to 150%.
The SBCA also instructs the SEC to issue rules or amendments to rules allowing BDCs to use the same registration, offering and communication processes that are available to operating companies. The rules and amendments specified by the SBCA became self-implementing on March 24, 2019. On April 8, 2020, the SEC adopted rules and amendments to implement certain provisions of the SBCA (the “Final Rules”) that, among other things, modify the registration, offering, and communication processes available to BDCs relating to: (i) the shelf offering process to permit the use of short-form registration statements on Form N-2 and incorporation by reference; (ii) the ability to qualify for well-known seasoned issuer status; (iii) the immediate or automatic effectiveness of certain filings made in connection with continuous public offerings; and (iv) communication processes and prospectus delivery. In addition, the SEC adopted rules that will require BDCs to comply with certain structured data and inline XBRL requirements. The Final Rules generally became effective on August 1, 2020, except that a BDC, like the Company, must comply with the Inline XBRL structure data requirements for its financial statements by February 1, 2023.
We are generally not able to issue and sell our common stock at a price below net asset value per share. We may, however, sell our common stock, or warrants, options, or rights to acquire our common stock, at a price below the then-current net asset value of our common stock if our board of directors determines that such sale is in our best interests and the best interests of our stockholders, and our stockholders approve such sale. In addition, we may generally issue new shares of our common stock at a price below net asset value in rights offerings to existing stockholders, in payment of dividends, and in certain other limited circumstances.
We may invest up to 100% of our assets in securities acquired directly from issuers in privately negotiated transactions. With respect to such securities, we may, for the purpose of public resale, be deemed an “underwriter” as that term is defined in the Securities Act. We do not intend to acquire securities issued by any investment company that exceed the limits imposed by the 1940 Act.
As a BDC, we will not generally be permitted to invest in any portfolio company in which our Adviser or any of their affiliates currently have a controlling interest or to make any co-investments with our Adviser or any of its affiliates without an exemptive order from the SEC. We may, however, invest alongside our Adviser and its affiliates’ other clients in certain circumstances where doing so is consistent with applicable law and SEC staff interpretations. For example, we may invest alongside such other clients’ accounts consistent with guidance promulgated by the SEC Staff permitting us and such other clients’ accounts to purchase interests in a single class of privately placed securities so long as certain conditions are met, including that no investment advisor, acting on our behalf or on behalf of other clients, negotiates any term other than price. We may also invest alongside such other clients as otherwise permissible under regulatory guidance, applicable regulations and our Adviser’s allocation policies. In addition, on November 25, 2013, we received an exemptive order from the SEC that permits us to participate in negotiated co-investment transactions with certain affiliates, each of whose investment adviser is Medley LLC or an investment adviser controlled by Medley LLC in a manner consistent with our investment objective, strategies and restrictions, as well as regulatory requirements and other pertinent factors (the “Prior Exemptive Order”).
On March 29, 2017, the Company, SIC Advisors and certain other affiliated funds and investment advisers received an exemptive order (the "Exemptive Order") that supersedes the Prior Exemptive Order and allows affiliated registered investment companies to participate in co-investment transactions with us that would otherwise have been prohibited under Section 17(d) and 57(a)(4) and Rule 17d-1. On October 4, 2017, the Company, SIC Advisors and certain of our affiliates received an exemptive order that supersedes the Exemptive Order (the “Current Exemptive Order”) and allows, in addition to the entities already covered by the Exemptive Order, Medley LLC and its subsidiary, Medley Capital LLC, to the extent they hold financial assets in a principal capacity, and any direct or indirect, wholly- or majority-owned subsidiary of Medley LLC that is formed in the future, to participate in co-investment transactions with us that would otherwise be prohibited by either or both of Sections 17(d) and 57(a)(4) of the 1940 Act.
Opportunities for co-investments may arise when SIC Advisors or an affiliated adviser becomes aware of investment opportunities that may be appropriate for the Company and other clients or affiliated funds. Without the Current Exemptive Order, we would be substantially limited in our ability to co-invest in privately negotiated transactions with affiliated funds as a BDC.
In situations where co-investments with other clients of Medley or its affiliates is not permitted or appropriate, such as when there is an opportunity to invest in different securities of the same issuer or where the different investments could be expected to result in a conflict between our interests and those of other Medley clients, SIC Advisors and the Medley affiliate will need to decide which client will proceed with the investment. SIC Advisors and the Medley affiliate will make these determinations based on its policies and procedures, which generally require that such opportunities be offered to eligible accounts on an alternating basis that will be fair and equitable over time. Moreover, except in certain circumstances, we will be unable to invest in any issuer in which a fund managed by Medley or its affiliates has previously invested. Similar restrictions limit our ability to transact business with our officers or directors or their affiliates.
Business Development Company Regulation: Qualifying Assets
Under the 1940 Act, a BDC may not acquire any asset other than assets of the type listed in Section 55(a) of the 1940 Act, which are referred to as qualifying assets, unless, at the time the acquisition is made, qualifying assets represent at least 70% of the BDC's total assets. As discussed in greater detail below, the 1940 Act defines qualifying assets as principally including certain investments by a BDC in eligible portfolio companies. An eligible portfolio company is defined under the 1940 Act as any issuer which:
|
|
1. |
is organized under the laws of, and has its principal place of business in, the United States; |
|
|
|
2. |
is not an investment company (other than a small business investment company wholly owned by the BDC) or a company that would be an investment company but for certain exclusions under the 1940 Act; and |
|
|
|
3. |
satisfies any of the following: |
|
|
|
|
a. |
does not have any class of securities that is traded on a national securities exchange; |
|
|
|
b. |
has a class of securities listed on a national securities exchange, but has an aggregate market value of outstanding voting and non-voting common equity of less than $250 million; |
|
|
|
c. |
is controlled by a BDC, either alone or as part of a group acting together, and the BDC has an affiliated person who is a director of the eligible portfolio company; or |
|
|
|
d. |
is a small and solvent company having total assets of not more than $4 million and capital and surplus of not less than $2 million. |
As relevant to our proposed business, the principal categories of qualifying assets under the 1940 Act are the following:
|
|
1. |
Securities purchased in transactions not involving any public offering from the issuer of such securities, which issuer (subject to certain limited exceptions) is an eligible portfolio company, or from any person who is, or has been during the preceding 13 months, an affiliated person of an eligible portfolio company, or from any other person, subject to such rules as may be prescribed by the SEC. |
|
|
2. |
Securities of any eligible portfolio company that we control. |
|
|
3. |
Securities purchased in a private transaction from a U.S. issuer that is not an investment company or from an affiliated person of the issuer, or in transactions incident thereto, if the issuer is in bankruptcy and subject to reorganization or if the issuer, immediately prior to the purchase of its securities was unable to meet its obligations as they came due without material assistance other than conventional lending or financing arrangements. |
|
|
4. |
Securities of an eligible portfolio company purchased from any person in a private transaction if there is no ready market for such securities and we already own 60% of the outstanding equity of the eligible portfolio company. |
|
|
5. |
Securities received in exchange for or distributed on or with respect to securities described in (1) through (4) above, or pursuant to the exercise of warrants or rights relating to such securities. |
|
|
6. |
Cash, cash equivalents, U.S. government securities, or high-quality debt securities maturing in one year or less from the time of investment. |
In addition, a BDC must have been organized and have its principal place of business in the United States and be operated for the purpose of making investments in the types of securities described in (1), (2) or (3) above.
Business Development Company Regulation: Control and Managerial Assistance to Portfolio Companies
BDCs generally must offer to make available to the issuer of the securities significant managerial assistance, except in circumstances where either (i) the BDC controls such issuer of securities or (ii) the BDC purchases such securities in conjunction with one or more other persons acting together and one of the other persons in the group makes available such managerial assistance. Making available managerial assistance includes any arrangement whereby the BDC, through its directors, officers, or employees, offers to provide, and, if accepted, does so provide, significant guidance and counsel concerning the management, operations or business objectives and policies of a portfolio company.
Temporary Investments
Pending investment in other types of “qualifying assets,” as described above, our investments may consist of cash, cash equivalents, U.S. government securities, or high-quality debt securities maturing in one year or less from the time of investment so that 70% of our total assets are qualifying assets. Typically, we intend to invest in U.S. Treasury bills or in repurchase agreements, provided that such agreements are fully collateralized by cash or securities issued by the U.S. government or its agencies. A repurchase agreement involves the purchase by an investor, such as us, of a specified security and the simultaneous agreement by the seller to repurchase it at an agreed-upon future date and at a price that is greater than the purchase price by an amount that reflects an agreed-upon interest rate. There is no percentage restriction on the proportion of our assets that may be invested in such repurchase agreements. However, if more than 25% of our total assets constitute repurchase agreements from a single counterparty, we may not meet the diversification requirements in order to qualify to be taxed as a RIC for U.S. federal income tax purposes. Thus, we do not intend to enter into repurchase agreements with a single counterparty in excess of this limit. We expect that our Adviser will monitor the creditworthiness of the counterparties with which we enter into repurchase agreement transactions.
Warrants and Options
Under the 1940 Act, a BDC is subject to restrictions on the amount of warrants, options, restricted stock or rights to purchase shares of capital stock that it may have outstanding at any time. Under the 1940 Act, we may generally only offer warrants provided that (i) the warrants expire by their terms within ten years, (ii) the exercise or conversion price is not less than the current market value at the date of issuance, (iii) our stockholders authorize the proposal to issue such warrants, and our board of directors approves such issuance on the basis that the issuance is in the best interests of us and our stockholders and (iv) if the warrants are accompanied by other securities, the warrants are not separately transferable unless no class of such warrants and the securities accompanying them has been publicly distributed. The 1940 Act also provides that the amount of our voting securities that would result from the exercise of all outstanding warrants, as well as options and rights, at the time of issuance may not exceed 25% of our outstanding voting securities. In particular, the amount of capital stock that would result from the conversion or exercise of all outstanding warrants, options or rights to purchase capital stock cannot exceed 25% of the BDC’s total outstanding shares of capital stock.
Senior Securities
We are permitted, under specified conditions, to issue multiple classes of debt and one class of stock senior to our common stock if our asset coverage, as defined in the 1940 Act, is at least equal to 200% (or 150% if certain requirements under the 1940 Act are met) immediately after each such issuance. In addition, while any senior securities remain outstanding, we must prohibit any distribution to our stockholders or the repurchase of such securities or shares unless we meet the applicable asset coverage ratios at the time of the distribution or repurchase. We may also borrow amounts up to 5% of the value of our total assets for temporary or emergency purposes without regard to asset coverage.
Code of Ethics
We have adopted a code of ethics, which we call our “Code of Business Conduct and Ethics,” which covers ethics and business conduct. This document applies to our directors, officers and employees. Our Code of Business Conduct and Ethics is publicly available on the Corporate Governance section of our website under "Corporate Governance" at http://www.sierraincomecorp.com/CorporateGovernance.html. We will report any amendments to or waivers of a required provision of our Code of Business Conduct and Ethics on our website or in a Current Report on Form 8-K. You may read and copy any materials we file with the SEC at the SEC’s website at http://www.sec.gov. Information contained on our website is not incorporated by reference into this Annual Report on Form 10-K, and you should not consider that information to be part of this Annual Report on Form 10-K.
Compliance Policies and Procedures
We and our Adviser have each adopted and implemented written compliance policies and procedures reasonably designed to prevent violation of the federal securities laws and are required to review these compliance policies and procedures annually for their adequacy and the effectiveness of their implementation. Our chief compliance officer is responsible for administering our compliance policies and procedures and our Adviser’s chief compliance officer is responsible for administering the compliance policies and procedures for the Adviser.
Proxy Voting Policies and Procedures
We have delegated our proxy voting responsibility to SIC Advisors. SIC Advisors will vote proxies according to our proxy voting policies and procedures which are set forth below. These policies and procedures are reviewed periodically by the Adviser as well as our board of directors, and, accordingly, are subject to change.
As an investment adviser registered under the 1940 Act, SIC Advisors has a fiduciary duty to act solely in the best interests of its clients. As part of this duty, it recognizes that it must vote client securities in a timely manner free of conflicts of interest and in the best interests of its clients. These policies and procedures for voting proxies for the investment advisory clients of SIC Advisors are intended to comply with Section 206 of the Advisers Act and Rule 206(4)-6 thereunder.
Proxy Policies
SIC Advisors will vote proxies relating to our securities in a manner that it believes, in its discretion, to be in the best interest of our stockholders. It will review on a case-by-case basis each proposal submitted for a stockholder vote taking into account relevant factors, including: (1) the impact on the value of the securities; (2) the anticipated costs and benefits associated with the proposal; (3) the effect on liquidity; and (4) customary industry and business practices. Although SIC Advisors will generally vote against proposals that may have a negative impact on its clients’ portfolio securities, it may vote for such a proposal if there exists compelling long-term reasons to do so.
The proxy voting decisions of SIC Advisors are made by its portfolio managers and investment professionals under the supervision of SIC Advisors legal/compliance department. To ensure that its vote is not the product of a conflict of interest, it will require that: (a) the recommended vote be approved by a member of SIC Advisors legal/compliance department prior to being submitted to the custodian; (b) associates involved in the decision making process or vote administration are prohibited from revealing how SIC Advisors intends to vote on a proposal in order to reduce any attempted influence from interested parties; and (c) where a material conflict of interest exists, the chief compliance officer designate an individual or group who can impartially help decide how to resolve such conflict.
Proxy Voting Records
You may obtain information, without charge, regarding how SIC Advisors voted proxies with respect to our portfolio securities by making a written request for proxy voting information to: Chief Compliance Officer, c/o Sierra Income Corporation at 280 Park Ave, 6th Floor East, New York, NY 10017.
Securities Exchange Act and Sarbanes-Oxley Act
We are subject to the reporting and disclosure requirements of the Exchange Act, including the filing of quarterly, annual and current reports, proxy statements and other required items. In addition, we are subject to the Sarbanes-Oxley Act of 2002, which imposes a wide variety of regulatory requirements on publicly-held companies and their insiders. Many of these requirements will affect us. For example:
|
• |
pursuant to Rule 13a-14 of the Exchange Act, our chief executive officer and chief financial officer are required to certify the accuracy of the financial statements contained in our periodic reports; |
|
• |
pursuant to Item 307 of Regulation S-K, our periodic reports are required to disclose our conclusions about the effectiveness of our disclosure controls and procedures; |
|
• |
pursuant to Rule 13a-15 of the Exchange Act, our management is required to prepare a report regarding its assessment of our internal control over financial reporting; and |
|
• |
pursuant to Item 308 of Regulation S-K and Rule 13a-15 of the Exchange Act, our periodic reports must disclose whether there were significant changes in our internal control over financial reporting or in other factors that could significantly affect these controls subsequent to the date of their evaluation, including any corrective actions with regard to significant deficiencies and material weaknesses. |
The Sarbanes-Oxley Act requires us to review our policies and procedures to determine whether we comply with the Sarbanes-Oxley Act and its regulations. We intend to monitor our compliance with all regulations that are adopted under the Sarbanes-Oxley Act and will take actions necessary to ensure that we are in compliance.
Other
We are required to provide and maintain a bond issued by a reputable fidelity insurance company to protect us against larceny and embezzlement.
Election to Be Taxed as a RIC
We have elected, and intend to qualify annually, to be treated as a RIC under Subchapter M of the Code. As a RIC, we generally do not have to pay corporate-level U.S. federal income taxes on any income that we timely distribute to our stockholders from our tax earnings and profits. To maintain our qualification as a RIC, we must, among other things, meet certain source-of-income and asset diversification requirements (as described below). In addition, in order to obtain and maintain RIC tax treatment, we must timely distribute to our stockholders, for each taxable year, at least 90% of our “investment company taxable income,” which is generally our net ordinary income plus the excess, if any, of realized net short-term capital gains over realized net long-term capital losses, or the Annual Distribution Requirement.
Taxation as a RIC
If we:
|
• |
maintain our qualification as a RIC; and |
|
• |
satisfy the Annual Distribution Requirement, |
then we will not be subject to U.S. federal income tax on the portion of our income we distribute (or are deemed to distribute) to stockholders. We will be subject to U.S. federal income tax at the regular corporate rates on any income or capital gains not distributed (or deemed distributed) to our stockholders.
We will be subject to a 4% nondeductible U.S. federal excise tax on certain undistributed income unless we distribute in a timely manner an amount at least equal to the sum of (1) 98% of our net ordinary income for each calendar year, (2) 98.2% of our capital gain net income for the one-year period ending October 31 in that calendar year and (3) any income and net capital gain we recognized, but were not distributed, in preceding years and on which we paid no U.S. federal income tax, or the Excise Tax Avoidance Requirement. We generally will endeavor in each taxable year to avoid any U.S. federal excise tax on our earnings.
In order to maintain our qualification as a RIC for U.S. federal income tax purposes, we must, among other things:
|
• |
continue to qualify as a BDC under the 1940 Act at all times during each taxable year; |
|
• |
derive in each taxable year at least 90% of our gross income from dividends, interest, payments with respect to certain securities, loans, gains from the sale of stock or other securities, net income from certain “qualified publicly traded partnerships,” or other income derived with respect to our business of investing in such stock or securities, or the 90% Income Test; and |
|
• |
diversify our holdings so that at the end of each quarter of the taxable year: |
|
• |
at least 50% of the value of our assets consists of cash, cash equivalents, U.S. Government securities, securities of other RICs, and other securities if such other securities of any one issuer do not represent more than 5% of the value of our assets or more than 10% of the outstanding voting securities of the issuer; and |
|
• |
no more than 25% of the value of our assets is invested in the securities, other than U.S. government securities or securities of other RICs, of one issuer, of two or more issuers that are controlled, as determined under applicable Code rules, by us and that are engaged in the same or similar or related trades or businesses or of certain “qualified publicly traded partnerships,” or the Diversification Tests. |
For U.S. federal income tax purposes, we may be required to recognize taxable income in circumstances in which we do not receive a corresponding payment in cash. For example, if we hold debt obligations that are treated under applicable tax rules as having original issue discount ("OID") (such as debt instruments with PIK interest or, in certain cases, increasing interest rates or debt instruments that were issued with warrants), we must include in income each year a portion of the OID that accrues over the life of the obligation, regardless of whether cash representing such income is received by us in the same taxable year. We may also have to include in income other amounts that we have not yet received in cash, such as deferred loan origination fees that are paid after origination of the loan or are paid in non-cash compensation such as warrants or stock. We anticipate that a portion of our income may constitute OID or other income required to be included in taxable income prior to receipt of cash.
Because any OID or other amounts accrued will be included in our investment company taxable income for the year of the accrual, we may be required to make a distribution to our stockholders in order to satisfy the Annual Distribution Requirement, even though we will not have received any corresponding cash amount. As a result, we may have difficulty meeting the annual distribution requirement necessary to obtain and maintain RIC tax treatment under the Code. We may have to sell some of our investments at times and/or at prices we would not consider advantageous, raise additional debt or equity capital or forgo new investment opportunities for this purpose. If we are not able to obtain cash from other sources, we may fail to qualify for RIC tax treatment and thus become subject to corporate-level U.S. federal income tax. Our ability to dispose of assets to meet our distribution requirements may be limited by (1) the illiquid nature of our portfolio and/or (2) other requirements relating to our status as a RIC, including the Diversification Tests. If we dispose of assets in order to meet the Annual Distribution Requirement or the Excise Tax Avoidance Requirement, we may make such dispositions at times that, from an investment standpoint, are not advantageous.
Under the 1940 Act, we are not permitted to make distributions to our stockholders while our debt obligations and other senior securities are outstanding unless certain “asset coverage” tests are met. See “Regulation — Senior Securities.” As a result, we may be prohibited from making distributions necessary to satisfy the Annual Distribution Requirement. Even if we are not prohibited from making distributions, our ability to raise additional capital to satisfy the Annual Distribution Requirement may be limited. If we are not able to make sufficient distributions to satisfy the Annual Distribution Requirement, we may fail to qualify for RIC tax treatment and thus become subject to corporate-level U.S. federal income tax.
Certain of our investment practices may be subject to special and complex U.S. federal income tax provisions that may, among other things, (1) treat dividends that would otherwise constitute qualified dividend income as non-qualified dividend income, (2) disallow, suspend or otherwise limit the allowance of certain losses or deductions, (3) convert lower-taxed long-term capital gain into higher-taxed short-term capital gain or ordinary income, (4) convert an ordinary loss or a deduction into a capital loss (the deductibility of which is more limited), (5) cause us to recognize income or gain without receipt of a corresponding distribution of cash, (6) adversely affect the time as to when a purchase or sale of stock or securities is deemed to occur, (7) adversely alter the characterization of certain complex financial transactions and (8) produce income that will not be qualifying income for purposes of the 90% Income Test. We intend to monitor its transactions and may make certain tax elections to mitigate the potential adverse effect of these provisions, but there can be no assurance that any adverse effects of these provisions will be mitigated.
If we purchase shares in a “passive foreign investment company” (a “PFIC”), we may be subject to U.S. federal income tax on its allocable share of a portion of any “excess distribution” received on, or any gain from the disposition of, such shares even if our allocable share of such income is distributed as a taxable dividend to its stockholders. Additional charges in the nature of interest generally will be imposed on us in respect of deferred taxes arising from any such excess distribution or gain. If we invest in a PFIC and elect to treat the PFIC as a “qualified electing fund” under the Code (a “QEF”), in lieu of the foregoing requirements, we will be required to include in income each year, our proportionate share of the ordinary earnings and net capital gain of the QEF, even if such income is not distributed by the QEF. Alternatively, we may be able to elect to mark-to-market at the end of each taxable year its shares in a PFIC; in this case, we will recognize as ordinary income our allocable share of any increase in the value of such shares, and as ordinary loss our allocable share of any decrease in such value to the extent that any such decrease does not exceed prior increases included in its income. Under either election, we may be required to recognize in a year income in excess of distributions from PFICs and proceeds from dispositions of PFIC stock during that year, and such income will nevertheless be subject to the Annual Distribution Requirement and will be taken into account for purposes of the 4% U.S. federal excise tax. Income inclusions from a QEF will be "good income" for purposes of the 90% Income Test provided that they are derived in connection with our business of investing in stocks and securities or the QEF distributes such income to us in the same taxable year to which the income is included in our income.
Failure to Maintain Our Qualification as a RIC
If we fail to satisfy the 90% Income Test or the Diversification Tests for any taxable year, we may nevertheless continue to qualify as a RIC for such year if certain relief provisions are applicable (which may, among other things, require us to pay certain corporate-level U.S. federal income taxes or to dispose of certain assets).
If we were unable to qualify for treatment as a RIC and the foregoing relief provisions are not applicable, we would be subject to tax on all of our taxable income at regular corporate rates, regardless of whether we make any distributions to our stockholders. Distributions would not be required, and any distributions made would be taxable to our stockholders as ordinary dividend income. Subject to certain limitations, non-corporate stockholders may be eligible for a 20% maximum U.S. federal income tax rate to the extent of our current and accumulated earnings and profits provided certain holding period and other requirements were met. Subject to certain limitations under the Code, corporate distributees would be eligible for the dividends-received deduction. Distributions in excess of our current and accumulated earnings and profits would be treated first as a return of capital to the extent of the stockholder’s tax basis, and any remaining distributions would be treated as a capital gain. To requalify as a RIC in a subsequent taxable year, we would be required to satisfy the RIC qualification requirements for that year and dispose of any earnings and profits from any year in which we failed to qualify as a RIC. Subject to a limited exception applicable to RICs that qualified as such under Subchapter M of the Code for at least one year prior to disqualification and that requalify as a RIC no later than the second year following the nonqualifying year, we could be subject to tax on any unrealized net built-in gains in the assets held by us during the period in which we failed to qualify as a RIC that are recognized within the subsequent 5 years, unless we made a special election to pay corporate-level U.S. federal income tax on such built-in gain at the time of our requalification as a RIC.
Investing in our common stock involves a number of significant risks. In addition to the other information contained in this Annual Report on Form 10-K, you should consider carefully the following information before making an investment in our common stock. The risks below are not the only risks we face. Additional risks and uncertainties not presently known to us or not presently deemed material by us may also impair our operations and performance. If any of the following events occur, our business, financial condition and results of operations could be materially and adversely affected. In such case, the net asset value of our common stock could decline, and you may lose all or part of your investment.
The following is a summary of the principal risk factors associated with an investment in the Company. Further details regarding each risk included in the below summary list can be found further below.
|
|
● |
We are currently operating in a period of capital markets disruptions and economic uncertainty. Such market conditions may materially and adversely affect debt and equity capital markets, which may have a negative impact on our business, financial condition and operations. |
|
|
● |
Events outside of our control, such as the COVID-19 pandemic, could negatively affect our portfolio companies and our results of our operations. |
.
|
|
● |
A failure of cybersecurity systems, as well as the occurrence of events unanticipated in our disaster recovery systems and management continuity planning could impair our ability to conduct business effectively. |
|
|
● |
A failure on our part to maintain our status as a BDC would significantly reduce our operating flexibility. |
|
|
● |
We depend upon senior management personnel of SIC Advisors for our future success, and if SIC Advisors is unable to retain qualified personnel or if SIC Advisors loses any member of its senior management team, our ability to achieve our investment objective could be significantly harmed. |
|
|
● |
Because we expect to distribute substantially all of our net investment income and net realized capital gains to our stockholders, we will need additional capital to finance our growth and such capital may not be available on favorable terms or at all. |
|
|
● |
The amount of any distributions we pay is uncertain. We may not be able to pay you distributions or be able to sustain them and our distributions may not grow over time. |
|
|
● |
Our distribution proceeds may exceed our earnings. We have not established any limit on the extent to which we may use borrowings, if any, or proceeds from our offering to fund distributions, which may reduce the amount of capital we ultimately invest in assets. |
|
|
● |
A significant portion of our investment portfolio is recorded at fair value as determined in good faith by our board of directors and, as a result, there will be uncertainty as to the value of our portfolio investments. |
|
|
● |
Any unrealized losses we experience on our portfolio may be an indication of future realized losses, which could reduce our income available for distribution. |
|
|
● |
We are uncertain of our sources for funding our future capital needs. If we cannot obtain debt or equity financing on acceptable terms, our ability to acquire investments and to expand our operations will be adversely affected. |
|
|
● |
SIC Advisors and its affiliates, including our officers and some of our directors, face conflicts of interest caused by compensation arrangements with us, which could result in actions that are not in the best interests of our stockholders. |
|
|
● |
We may be obligated to pay our Adviser incentive compensation even if we incur a net loss due to a decline in the value of our portfolio. |
|
|
● |
Our ability to enter into transactions with our affiliates will be restricted, which may limit the scope of investments available to us. |
|
|
● |
We may face increasing competition for investment opportunities, which could delay deployment of our capital, reduce returns and result in losses. |
|
|
● |
Regulations governing our operation as a BDC and RIC will affect our ability to raise capital and the way in which we raise additional capital or borrow for investment purposes, which may have a negative effect on our growth. As a BDC, the necessity of raising additional capital may expose us to risks, including the typical risks associated with leverage. |
|
|
● |
An investment strategy focused primarily on privately held companies presents certain challenges, including the lack of available information about these companies. |
|
|
● |
Because we use borrowed funds to make investments or fund our business operations, we are exposed to risks typically associated with leverage which increase the risk of investing in us. |
|
|
● |
Our stockholders will have limited liquidity and may not receive a full return of invested capital upon selling their shares. |
|
|
● |
We are not obligated to complete a liquidity event; therefore, it will be difficult for an investor to sell his or her shares. |
|
|
● |
We will be subject to corporate-level U.S. federal income tax if we are unable to qualify for the tax treatment applicable to RICs under Subchapter M of the Code or to satisfy RIC distribution requirements. |
Risks Relating to Our Business and Structure
We are currently operating in a period of capital markets disruptions and economic uncertainty. Such market conditions may materially and adversely affect debt and equity capital markets, which may have a negative impact on our business, financial condition and operations.
From time to time, capital markets may experience periods of disruption and instability. The U.S. capital markets have experienced extreme volatility and disruption following the global outbreak of coronavirus (“COVID-19”) that began in December 2019. Some economists and major investment banks have expressed concern that the continued spread of the COVID-19 globally could lead to a world-wide economic downturn. Even after the COVID-19 pandemic subsides, the U.S. economy, as well as most other major economies, may continue to experience a recession, and we anticipate our businesses would be materially and adversely affected by a prolonged recession in the United States and other major markets. Disruptions in the capital markets have increased the spread between the yields realized on risk-free and higher risk securities, resulting in illiquidity in parts of the capital markets. The COVID-19 outbreak continues to have, and any future outbreaks could have, an adverse impact on the ability of lenders to originate loans, the volume and type of loans originated, the ability of borrowers to make payments and the volume and type of amendments and waivers granted to borrowers and remedial actions taken in the event of a borrower default, each of which could negatively impact the amount and quality of loans available for investment by the Company and returns to the Company, among other things. With respect to the U.S. credit markets (in particular for middle market loans), the COVID-19 outbreak has resulted in, and until fully resolved is likely to continue to result in, the following among other things: (i) increased draws by borrowers on revolving lines of credit and other financing instruments; (ii) increased requests by borrowers for amendments and waivers of their credit agreements to avoid default, increased defaults by such borrowers and/or increased difficulty in obtaining refinancing at the maturity dates of their loans; (iii) greater volatility in pricing and spreads and difficulty in valuing loans during periods of increased volatility; and (iv) rapidly evolving proposals and/or actions by state and federal governments to address problems being experienced by the markets and by businesses and the economy in general which will not necessarily adequately address the problems facing the loan market and middle-market businesses. These and future market disruptions and/or illiquidity could have an adverse effect on our business, financial condition, results of operations and cash flows. Unfavorable economic conditions also could increase our funding costs, limit our access to the capital markets or result in a decision by lenders not to extend credit to us. These events could limit our investment originations, limit our ability to grow and have a material negative impact on our operating results and the fair values of our debt and equity investments. We may have to access, if available, alternative markets for debt and equity capital, and a severe disruption in the global financial markets, deterioration in credit and financing conditions or uncertainty regarding U.S. government spending and deficit levels or other global economic conditions could have a material adverse effect on our business, financial condition and results of operations.
For example, between 2008 and 2009, the U.S. and global capital markets were unstable as evidenced by periodic disruptions in liquidity in the debt capital markets, significant write-offs in the financial services sector, the re-pricing of credit risk in the broadly syndicated credit market, and the failure of major financial institutions. Despite actions of the U.S. federal government and foreign governments, these events contributed to worsening general economic conditions that materially and adversely impacted the broader financial and credit markets and reduced the availability of debt and equity capital for the market as a whole and financial services firms in particular.
Equity capital may be difficult to raise during periods of adverse or volatile market conditions because, subject to some limited exceptions, as a BDC, we are generally not able to issue additional shares of our common stock at a price less than NAV without first obtaining approval for such issuance from our stockholders and our independent directors. Volatility and dislocation in the capital markets can also create a challenging environment in which to raise or access debt capital. The current market and future market conditions similar to those experienced from 2008 through 2009 for any substantial length of time could make it difficult to extend the maturity of or refinance our existing indebtedness or obtain new indebtedness with similar terms and any failure to do so could have a material adverse effect on our business. The debt capital that will be available to us in the future, if at all, may be at a higher cost and on less favorable terms and conditions than what we currently experience, including being at a higher cost in a rising interest rate environment. If any of these conditions appear, they may have an adverse effect on our business, financial condition, and results of operations. These events could limit our investment originations, limit our ability to increase returns to equity holders through the effective use of leverage, and negatively impact our operating results.
In addition, significant changes in the capital markets may also affect the pace of our investment activity and the potential for liquidity events involving our investments. Thus, the illiquidity of our investments may make it difficult for us to sell our investments to access capital if required, and as a result, we could realize significantly less than the value at which we have recorded our investments if we were required to sell them for liquidity purposes. An inability to raise or access capital could have a material adverse effect on our business, financial condition or results of operations.
Governmental authorities worldwide have taken increased measures to stabilize the markets and support economic growth. The success of these measures is unknown and they may not be sufficient to address the market dislocations or avert severe and prolonged reductions in economic activity.
We also face an increased risk of investor, creditor or portfolio company disputes, litigation and governmental and regulatory scrutiny as a result of the effects of COVID-19 on economic and market conditions.
Events outside of our control, such as the COVID-19 pandemic, could negatively affect our portfolio companies and our results of our operations.
Periods of market volatility have occurred and could continue to occur in response to pandemics or other events outside of our control. These types of events have adversely affected and could continue to adversely affect operating results for us and for our portfolio companies. For example, the COVID-19 pandemic has led to, and for an unknown period of time will continue to lead to, disruptions in local, regional, national and global markets and economies affected thereby, including the United States. The COVID-19 pandemic and restrictive measures taken to contain or mitigate its spread have caused, and are continuing to cause, business shutdowns, or the re-introduction of business shutdowns, cancellations of events and restrictions on travel, significant reductions in demand for certain goods and services, reductions in business activity and financial transactions, supply chain interruptions and overall economic and financial market instability both globally and in the United States. Such effects will likely continue for the duration of the COVID-19 pandemic, which is uncertain, and for some period thereafter. While several countries, as well as certain states, counties and cities in the United States, began to relax the early public health restrictions with a view to partially or fully reopening their economies, many cities, both globally and in the United States, have since experienced a surge in the reported number of cases, hospitalizations and deaths related to the COVID-19 pandemic. This recent increase in cases has led to the re-introduction of restrictions and business shutdowns in certain states, counties and cities in the United States and globally and could continue to lead to the re-introduction of such restrictions elsewhere as of the date of this Annual Report on Form 10-K. Additionally, in December 2020, the U.S. Food and Drug Administration authorized vaccines produced by Pfizer-BioNTech and Moderna for emergency use. However, it remains unclear how quickly the vaccines will be distributed nationwide and globally or when “herd immunity” will be achieved and the restrictions that were imposed to slow the spread of the virus will be lifted entirely. The delay in distributing the vaccines could lead people to continue to self-isolate and not participate in the economy at pre-pandemic levels for a prolonged period of time.
COVID-19 and the resulting economic dislocations have had and continue to have adverse consequences for the business operations and financial performance of some of our portfolio companies, which may, in turn impact the valuation of our investments and have adversely affected, and threaten to continue to adversely affect, our operations. We cannot predict the full impact of COVID-19, including the duration of the restrictions described above. As a result, we are unable to predict the duration of these business and supply-chain disruptions, the extent to which COVID-19 will negatively affect our portfolio companies’ operating results or the impact that such disruptions may have on our results of operations and financial condition. With respect to loans to portfolio companies, the Company will be impacted if, among other things, (i) amendments and waivers are granted (or are required to be granted) to borrowers permitting deferral of loan payments or allowing for PIK interest payments, (ii) borrowers default on their loans, are unable to refinance their loans at maturity, or go out of business, or (iii) the value of loans held by the Company decreases as a result of such events and the uncertainty they cause. Portfolio companies may also be more likely to seek to draw on unfunded commitments we have made, and the risk of being unable to fund such commitments is heightened during such periods. Depending on the duration and extent of the disruption to the business operations of our portfolio companies, we expect some portfolio companies, particularly those in vulnerable industries to experience financial distress and possibly to default on their financial obligations to us and/or their other capital providers. In addition, if such portfolio companies are subjected to prolonged and severe financial distress, we expect some of them to substantially curtail their operations, defer capital expenditures and lay off workers. These developments would be likely to permanently impair their businesses and result in a reduction in the value of our investments in them. Any potential impact to our results of operations will depend to a large extent on future developments and new information that could emerge regarding the duration and severity of the COVID-19 pandemic and the actions taken by authorities and other entities to contain the spread or treat its impact, all of which are beyond our control. These potential impacts, while uncertain, could adversely affect our and our portfolio companies’ operating results and financial condition.
The Company will also be negatively affected if the operations and effectiveness of SIC Advisors or our portfolio companies (or any of the key personnel or service providers of the foregoing) are compromised or if necessary or beneficial systems and processes are disrupted as a result of stay-at-home orders or other related interruptions to business operations.
Political, social and economic uncertainty, including uncertainty related to the COVID-19 pandemic, creates and exacerbates risks.
Social, political, economic and other conditions and events (such as natural disasters, epidemics and pandemics, terrorism, conflicts and social unrest) will occur that create uncertainty and have significant impacts on issuers, industries, governments and other systems, including the financial markets, to which companies and their investments are exposed. As global systems, economies and financial markets are increasingly interconnected, events that once had only local impact are now more likely to have regional or even global effects. Events that occur in one country, region or financial market will, more frequently, adversely impact issuers in other countries, regions or markets, including in established markets such as the United States. These impacts can be exacerbated by failures of governments and societies to adequately respond to an emerging event or threat.
Uncertainty can result in or coincide with, among other things: increased volatility in the financial markets for securities, derivatives, loans, credit and currency; a decrease in the reliability of market prices and difficulty in valuing assets (including portfolio company assets); greater fluctuations in spreads on debt investments and currency exchange rates; increased risk of default (by both government and private obligors and issuers); further social, economic, and political instability; nationalization of private enterprise; greater governmental involvement in the economy or in social factors that impact the economy; changes to governmental regulation and supervision of the loan, securities, derivatives and currency markets and market participants and decreased or revised monitoring of such markets by governments or self-regulatory organizations and reduced enforcement of regulations; limitations on the activities of investors in such markets; controls or restrictions on foreign investment, capital controls and limitations on repatriation of invested capital; the significant loss of liquidity and the inability to purchase, sell and otherwise fund investments or settle transactions (including, but not limited to, a market freeze); unavailability of currency hedging techniques; substantial, and in some periods extremely high, rates of inflation, which can last many years and have substantial negative effects on credit and securities markets as well as the economy as a whole; recessions; and difficulties in obtaining and/or enforcing legal judgments.
As a result of the U.S. presidential election and the subsequent senate runoff elections, there has been a change in control of the executive and legislative branches of the U.S. government. Changes in federal policy, including tax policies, and at regulatory agencies occur over time through policy and personnel changes following elections, which lead to changes involving the level of oversight and regulation of the financial services industry, as well as changes in tax rates. The nature, timing and economic and political effects of potential changes to the current legal and regulatory framework affecting financial institutions remain highly uncertain.
For example, the COVID-19 pandemic outbreak has led and for an unknown period of time will continue to lead to disruptions in local, regional, national and global markets and economies affected thereby. The COVID-19 pandemic has impacted the U.S. credit markets (in particular for middle market loans). See “We are currently operating in a period of capital markets disruptions and economic uncertainty. Such market conditions may materially and adversely affect debt and equity capital markets, which may have a negative impact on our business, financial condition and operations” and “Events outside of our control, including public health crises, could negatively affect our portfolio companies and our results of our operations.”
Although it is impossible to predict the precise nature and consequences of these events, or of any political or policy decisions and regulatory changes occasioned by emerging events or uncertainty on applicable laws or regulations that impact us, our portfolio companies and our investments, it is clear that these types of events are impacting and will, for at least some time, continue to impact us and our portfolio companies and, in many instances, the impact will be adverse and profound. The effects of the COVID-19 pandemic may materially and adversely impact (i) the value and performance of us and our portfolio companies, (ii) the ability of our borrowers to continue to meet loan covenants or repay loans provided by us on a timely basis or at all, which may require us to restructure our investments or write down the value of our investments, (iii) our ability to repay debt obligations, on a timely basis or at all, or (iv) our ability to source, manage and divest investments and achieve our investment objectives, all of which could result in significant losses to us.
The United Kingdom referendum decision to leave the European Union may create significant risks and uncertainty for global markets and our investments.
The decision made in the United Kingdom referendum to leave the European Union has led to volatility in global financial markets, and in particular in the markets of the United Kingdom and across Europe, and may also lead to weakening in consumer, corporate and financial confidence in the United Kingdom and Europe. Under the terms of the withdrawal agreement negotiated and agreed to between the United Kingdom and the European Union, the United Kingdom’s departure from the European Union was followed by a transition period which ran until December 31, 2020 and during which the United Kingdom continued to apply European Union law and was treated for all material purposes as if it were still a member of the European Union. On December 24, 2020, the European Union and United Kingdom governments signed a trade deal that became provisionally effective on January 1, 2021 and that now governs the relationship between the United Kingdom and the European Union (the “Trade Agreement”). The Trade Agreement implements significant regulation around trade, transport of goods and travel restrictions between the United Kingdom and the European Union.
Notwithstanding the foregoing, the longer term economic, legal, political and social framework to be put in place between the United Kingdom and the European Union is unclear at this stage and is likely to lead to ongoing political and economic uncertainty and periods of exacerbated volatility in both the United Kingdom and in wider European markets for some time. In particular, the decision made in the United Kingdom referendum may lead to a call for similar referenda in other European jurisdictions which may cause increased economic volatility and uncertainty in the European and global markets. This volatility and uncertainty may have an adverse effect on the economy generally and on our ability, and the ability of our portfolio companies, to execute our respective strategies and to receive attractive returns.
In particular, currency volatility may mean that our returns and the returns of our portfolio companies will be adversely affected by market movements and may make it more difficult, or more expensive, for us to implement appropriate currency hedging. Potential declines in the value of the British Pound and/or the euro against other currencies, along with the potential downgrading of the United Kingdom’s sovereign credit rating, may also have an impact on the performance of any of our portfolio companies located in the United Kingdom or Europe.
Rising interest rates may adversely affect the value of our portfolio investments which could have an adverse effect on our business, financial condition and results of operations.
Our debt investments may be based on floating rates, such as LIBOR, EURIBOR, the Federal Funds Rate or the Prime Rate. General interest rate fluctuations may have a substantial negative impact on our investments, the value of our shares and our rate of return on invested capital. A reduction in the interest rates on new investments relative to interest rates on current investments could also have an adverse impact on our net interest income. An increase in interest rates could decrease the value of any investments we hold which earn fixed interest rates, including subordinated loans, senior and junior secured and unsecured debt securities and loans and high yield bonds, and also could increase our interest expense, thereby decreasing our net income. Also, an increase in interest rates available to investors could make investment in our shares less attractive if we are not able to increase our distribution rate, which could reduce the value of our shares.
Because we may borrow funds and may issue preferred shares to finance investments, our net investment income may depend, in part, upon the difference between the rate at which we borrow funds or pay distributions on preferred shares and the rate that our investments yield. As a result, we can offer no assurance that a significant change in market interest rates will not have a material adverse effect on our net investment income. In periods of rising interest rates, our cost of funds would increase except to the extent we have issued fixed rate debt or preferred shares, which could reduce our net investment income.
You should also be aware that a change in the general level of interest rates can be expected to lead to a change in the interest rate we receive on many of our debt investments. Accordingly, a change in the interest rate could make it easier for us to meet or exceed the performance threshold and may result in a substantial increase in the amount of incentive fees payable to our Adviser with respect to the portion of the incentive fee based on income.
Changes relating to the LIBOR calculation process may adversely affect the value of our portfolio of LIBOR-indexed, floating-rate debt securities.
In the recent past, concerns have been publicized that some of the member banks surveyed by the British Bankers’ Association (“BBA”) in connection with the calculation of LIBOR across a range of maturities and currencies may have been under-reporting or otherwise manipulating the inter-bank lending rate applicable to them in order to profit on their derivative positions or to avoid an appearance of capital insufficiency or adverse reputational or other consequences that may have resulted from reporting inter-bank lending rates higher than those they actually submitted. A number of BBA member banks entered into settlements with their regulators and law enforcement agencies with respect to alleged manipulation of LIBOR, and investigations by regulators and governmental authorities in various jurisdictions are ongoing.
Actions by the ICE Benchmark Administration, regulators or law enforcement agencies as a result of these or future events, may result in changes to the manner in which LIBOR is determined. Potential changes, or uncertainty related to such potential changes may adversely affect the market for LIBOR-based securities, including our portfolio of LIBOR-indexed, floating-rate debt securities. In addition, any further changes or reforms to the determination or supervision of LIBOR may result in a sudden or prolonged increase or decrease in reported LIBOR, which could have an adverse impact on the market for LIBOR-based securities or the value of our portfolio of LIBOR-indexed, floating-rate debt securities, loans, and other financial obligations or extensions of credit held by or due to us.
On July 27, 2017, the U.K. Financial Conduct Authority, which regulates LIBOR, announced that it intends to stop persuading or compelling banks to submit LIBOR rates after 2021. We have exposure to LIBOR, including in financial instruments that mature after 2021. Our exposure arises from the value of our portfolio of LIBOR-indexed, floating-rate debt securities. The Company intends to monitor the developments with respect to the scheduled phasing out of LIBOR after 2021 and work with its portfolio companies and lenders to ensure such transition away from LIBOR will have minimal impact on its financial condition, but can provide no assurances regarding the impact of the discontinuation of LIBOR.
In the United States, the U.S. Federal Reserve Board and the Federal Reserve Bank of New York, in conjunction with the Alternative Reference Rates Committee, a steering committee comprised of large U.S. financial institutions, is considering replacing U.S. dollar LIBOR with a new index calculated by short-term repurchase agreements, backed by Treasury securities, called the Secured Overnight Financing Rate (“SOFR”). The Federal Reserve Bank of New York began publishing SOFR in April 2018. In addition, on March 25, 2020, the U.K. Financial Conduct Authority stated that, although the central assumption that firms cannot rely on LIBOR being published after the end of 2021 has not changed, the outbreak of COVID-19 has impacted the timing of many firms’ transition planning, and the U.K. Financial Conduct Authority will continue to assess the impact of the COVID-19 outbreak on transition timelines and update the marketplace as soon as possible. Furthermore, on November 30, 2020, the Intercontinental Exchange, Inc. (“ICE”) announced that the ICE Benchmark Administration Limited, a wholly owned subsidiary of ICE and the administrator of LIBOR, announced its plan to extend the date that most U.S. LIBOR values would cease being computed from December 31, 2021 to June 30, 2023. Despite this extension of the U.S. LIBOR transition deadline for certain LIBOR values, U.S. regulators continue to urge financial institutions to stop entering into new LIBOR transactions by the end of 2021.
Although SOFR appears to be the preferred replacement rate for U.S. dollar LIBOR, at this time, it is not possible to predict the effect of any such changes, any establishment of alternative reference rates or other reforms to LIBOR that may be enacted in the United States, United Kingdom or elsewhere or, whether the COVID-19 outbreak will have further effect on LIBOR transition plans. The elimination of LIBOR or any other changes or reforms to the determination or supervision of LIBOR could have an adverse impact on the market for or value of any LIBOR-indexed, floating-rate debt securities, loans, and other financial obligations or extensions of credit held by or due to us or on our overall financial condition or results of operations.
Our business and operations could be negatively affected if we become subject to any securities class actions and derivative lawsuits, which could cause us to incur significant expense, hinder execution of investment strategy and impact our stock price.
In the past, following periods of volatility in the market price of a company’s securities, securities class-action litigation has often been brought against that company. Stockholder activism, which could take many forms or arise in a variety of situations, has been increasing in the BDC space recently. Securities litigation and stockholder activism, including potential proxy contests, could result in substantial costs and divert management’s and our board of directors’ attention and resources from our business. Additionally, such securities litigation and stockholder activism could give rise to perceived uncertainties as to our future, adversely affect our relationships with service providers and make it more difficult to attract and retain qualified personnel. Also, we may be required to incur significant legal fees and other expenses related to any securities litigation and activist stockholder matters.
We are highly dependent on information systems and systems failures could significantly disrupt our business, which may, in turn, negatively affect the NAV of our common stock and our ability to pay dividends.
Our business is highly dependent on our and third parties’ communications and information systems. Any failure or interruption of those systems, including as a result of the termination of an agreement with any third-party service providers, could cause delays or other problems in our activities. Our financial, accounting, data processing, backup or other operating systems and facilities may fail to operate properly or become disabled or damaged as a result of a number of factors including events that are wholly or partially beyond our control and adversely affect our business. There could be:
|
● |
sudden electrical or telecommunications outages; |
|
● |
natural disasters such as earthquakes, tornadoes and hurricanes; |
|
● |
disease pandemics (including the COVID-19 outbreak); |
|
● |
events arising from local or larger scale political or social matters, including terrorist acts; and |
|
● |
cyber-attacks. |
These events, in turn, could have a material adverse effect on our operating results and negatively affect the NAV of our common stock and our ability to pay dividends to our stockholders.
A failure of cybersecurity systems, as well as the occurrence of events unanticipated in our disaster recovery systems and management continuity planning could impair our ability to conduct business effectively.
The occurrence of a disaster, such as a cyber-attack against us or against a third-party that has access to our data or networks, a natural catastrophe, an industrial accident, failure of our disaster recovery systems, or consequential employee error, could have an adverse effect on our ability to communicate or conduct business, negatively impacting our operations and financial condition. This adverse effect can become particularly acute if those events affect our electronic data processing, transmission, storage, and retrieval systems, or impact the availability, integrity, or confidentiality of our data.
We depend heavily upon computer systems to perform necessary business functions. Despite our implementation of a variety of security measures, our computer systems, networks, and data, like those of other companies, could be subject to cyber-attacks and unauthorized access, use, alteration, or destruction, such as from physical and electronic break-ins or unauthorized tampering, malware and computer virus attacks, or system failures and disruptions. If one or more of these events occurs, it could potentially jeopardize the confidential, proprietary, and other information processed, stored in, and transmitted through our computer systems and networks. Such an attack could cause interruptions or malfunctions in our operations, which could result in financial losses, litigation, regulatory penalties, client dissatisfaction or loss, reputational damage, and increased costs associated with mitigation of damages and remediation.
Third parties with which we do business may also be sources of cybersecurity or other technological risks. We outsource certain functions and these relationships allow for the storage and processing of our information, as well as client, counterparty, employee and borrower information. Cybersecurity failures or breaches by the Adviser and other service providers (including, but not limited to, accountants, custodians, and administrators), and the issuers of securities in which we invest, also have the ability to cause disruptions and impact business operations, potentially resulting in financial losses, interference with our ability to calculate its net asset value, impediments to trading, the inability of our stockholders to transact business, violations of applicable privacy and other laws, regulatory fines, penalties, reputation damages, reimbursement of other compensation costs, or additional compliance costs. While we engage in actions to reduce our exposure resulting from outsourcing, ongoing threats may result in unauthorized access, loss, exposure or destruction of data, or other cybersecurity incidents with increased costs and other consequences, including those described above. In addition, substantial costs may be incurred in order to prevent any cyber incidents in the future.
Privacy and information security laws and regulation changes, and compliance with those changes, may result in cost increases due to system changes and the development of new administrative processes. In addition, we may be required to expend significant additional resources to modify our protective measures and to investigate and remediate vulnerabilities or other exposures arising from operational and security risks.
We and our service providers are currently impacted by quarantines and similar measures being enacted by governments in response to COVID-19, which are obstructing the regular functioning of business work forces (including requiring employees to work from external locations and their homes). Accordingly, the risks described above are heightened under current conditions.
A failure on our part to maintain our status as a BDC would significantly reduce our operating flexibility.
If we fail to maintain our status as a BDC, we might be regulated as a closed-end investment company that is required to register under the 1940 Act, which would subject us to additional regulatory restrictions and significantly decrease our operating flexibility. In addition, any such failure could cause an event of default under our outstanding indebtedness, which could have a material adverse effect on our business, financial condition or results of operations.
We may suffer credit losses.
Private debt in the form of secured loans to corporate and asset-based borrowers is highly speculative and involves a high degree of risk of credit loss, and therefore an investment in our securities may not be suitable for someone with a low tolerance for risk. These risks are likely to increase during an economic recession, such as the economic recession or downturn that the United States and many other countries have recently experienced or are experiencing.
Price declines in the corporate leveraged loan market may adversely affect the fair value of our portfolio, reducing our NAV through increased net unrealized depreciation.
Prior to the onset of the financial crisis that began in 2007, securitized investment vehicles, hedge funds and other highly leveraged non-bank financial institutions comprised the majority of the market for purchasing and holding senior and subordinated debt. As the trading price of the loans underlying these portfolios began to deteriorate beginning in the first quarter of 2007, we believe that many institutions were forced to raise cash by selling their interests in performing assets in order to satisfy margin requirements or the equivalent of margin requirements imposed by their lenders. This resulted in a forced deleveraging cycle of price declines, compulsory sales, and further price declines, with falling underlying credit values, widespread redemption requests, and other constraints resulting from the credit crisis generating further selling pressure.
Conditions in the medium- and large-sized U.S. corporate debt market may experience similar or worse disruption or deterioration in the future, which may cause pricing levels to similarly decline or be volatile. As a result, our NAV could decline through an increase in unrealized depreciation and incurrence of realized losses in connection with the sale of our investments, which could have a material adverse impact on our business, financial condition and results of operations.
Our ability to achieve our investment objective depends on our Adviser’s ability to manage and support our investment process. If the Adviser was to lose a significant number of its key professionals, our ability to achieve our investment objective could be significantly harmed.
We have no internal management capacity or employees other than our appointed executive officers and are dependent upon the investment expertise, skill and network of business contacts of our Adviser to achieve our investment objective. Our Adviser will evaluate, negotiate, structure, execute, monitor, and service our investments. Our future success depends to a significant extent on the continued service and coordination of our Adviser, including its key professionals. The departure of a significant number of our Adviser’s key professionals could have a material adverse effect on our ability to achieve our investment objective. Our ability to achieve our investment objective also depends on the ability of our Adviser to identify, analyze, invest in, finance, and monitor companies that meet our investment criteria. Our Adviser’s capabilities in structuring the investment process, providing competent, attentive and efficient services to us, and facilitating access to financing on acceptable terms depend on the involvement of investment professionals in an adequate number and of adequate sophistication to match the corresponding flow of transactions. To achieve our investment objective, our Adviser may need to retain, hire, train, supervise, and manage new investment professionals to participate in our investment selection and monitoring process. Our Adviser may not be able to find qualified investment professionals in a timely manner or at all. Any failure to do so could have a material adverse effect on our business, financial condition and results of operations.
In addition, the Investment Advisory Agreement has termination provisions that allow the agreement to be terminated by us on 60 days’ notice or by SIC Advisors on 120 days’ notice without penalty.
We depend upon senior management personnel of SIC Advisors for our future success, and if SIC Advisors is unable to retain qualified personnel or if SIC Advisors loses any member of its senior management team, our ability to achieve our investment objective could be significantly harmed.
We depend on our investment management team, or the Investment Team, which is provided by SIC Advisors, for the identification, final selection, structuring, closing and monitoring of our investments. Our Investment Team is integral to our asset management activities and has critical industry experience and relationships that we will rely on to implement our business plan. Our future success depends on our Investment Team’s continued service to SIC Advisors. The departure of any of the members of SIC Advisors’ Investment Team could have a material adverse effect on our ability to achieve our investment objective. As a result, we may not be able to operate our business as we expect, and our ability to compete could be harmed, which could cause our operating results to suffer. In addition, we can offer no assurance that SIC Advisors will remain our investment adviser or our administrator.
SIC Advisors may not be able to achieve the same or similar returns as those achieved in the past by our senior management and Investment Team.
The track record and achievements of the senior management and Investment Team of SIC Advisors are not necessarily indicative of future results that will be achieved by our investment adviser. As a result, our investment adviser may not be able to achieve the same or similar returns as those achieved by our senior management and Investment Team during their tenure with SIC Advisors or while they were employed at prior positions.
Because we expect to distribute substantially all of our net investment income and net realized capital gains to our stockholders, we will need additional capital to finance our growth and such capital may not be available on favorable terms or at all.
We have elected, and intend to qualify annually, to be taxed for U.S. federal income tax purposes as a RIC under Subchapter M of the Code. As a RIC, we must meet certain requirements, including source-of-income, asset diversification and distribution requirements in order to not have to pay corporate-level U.S. federal income taxes on income we timely distribute to our stockholders as dividends, which allows us to substantially reduce or eliminate our corporate-level U.S. federal income tax liability. As a BDC, we are generally required to meet a coverage ratio of total assets to total senior securities, which includes all of our borrowings and any preferred stock we may issue in the future, of at least 200% (or 150% if, pursuant to the 1940 Act, certain requirements are met) at the time we issue any debt or preferred stock. This requirement limits the amount of our leverage. Because we will continue to need capital to grow our investment portfolio, this limitation may prevent us from incurring debt or issuing preferred stock and require us to raise additional equity at a time when it may be disadvantageous to do so. We cannot assure you that debt and equity financing will be available to us on favorable terms, or at all, and debt financings may be restricted by the terms of any of our outstanding borrowings. In addition, as a BDC, we are generally not permitted to issue common stock priced below NAV without stockholder approval. If additional funds are not available to us, we could be forced to curtail or cease new lending and investment activities, and our NAV could decline.
The amount of any distributions we pay is uncertain. We may not be able to pay you distributions or be able to sustain them and our distributions may not grow over time.
We began declaring semi-monthly distributions, which are paid on a monthly basis, to our stockholders beginning in July 2012 and intend to continue declaring semi-monthly distributions to stockholders, to the extent that we have assets legally available for distribution. We cannot assure you that we will achieve investment results that will allow us to make a targeted level of cash distributions or year-to-year increases in cash distributions. All distributions that we make will be at the discretion of our board of directors and will depend on our earnings, our financial condition, maintenance of our RIC tax treatment and other factors as our board of directors may deem to be relevant. Our ability to pay distributions might be adversely affected by the impact of the risks described in this Annual Report on Form 10-K. In addition, the inability to satisfy the asset coverage test applicable to us as a BDC may limit our ability to pay distributions. As a result, we cannot assure you that we will pay distributions to our stockholders in the future.
Our distribution proceeds may exceed our earnings. We have not established any limit on the extent to which we may use borrowings, if any, or proceeds from our offering to fund distributions, which may reduce the amount of capital we ultimately invest in assets.
The distributions we pay to our stockholders may exceed earnings. In the event that we encounter delays in locating suitable investment opportunities, we may pay our distributions from the proceeds of our offering or from borrowings in anticipation of future cash flow, which may constitute a return of your capital and will lower a stockholder’s tax basis in its shares, but not below zero. Distributions in excess of a stockholder’s basis will be treated as proceeds from the sale or exchange of property. Distributions from the proceeds of our offering or from borrowings also could reduce the amount of capital we ultimately invest in portfolio companies. Accordingly, stockholders who receive the payment of a dividend or other distribution from us should not assume that such dividend or other distribution is the result of a net profit earned by us.
Because our business model depends to a significant extent upon relationships with corporations, financial institutions and investment firms, the inability of our Adviser to maintain or develop these relationships, or the failure of these relationships to generate investment opportunities, could adversely affect our business.
SIC Advisors depends on its relationships with corporations, financial institutions and investment firms, and we rely indirectly to a significant extent upon these relationships to provide us with potential investment opportunities. If SIC Advisors fails to maintain its existing relationships or develop new relationships or sources of investment opportunities, we may not be able to grow our investment portfolio. In addition, individuals with whom SIC Advisors have relationships are not obligated to provide us with investment opportunities, and, therefore, there is no assurance that such relationships will generate investment opportunities for us.
A significant portion of our investment portfolio is recorded at fair value as determined in good faith by our board of directors and, as a result, there will be uncertainty as to the value of our portfolio investments.
The debt and equity securities in which we invest for which market quotations are not readily available will be valued at fair value as determined in good faith by or under the direction of our board of directors. Most, if not all, of our investments (other than cash and cash equivalents) will be classified as Level 3 under Accounting Standards Codification (“ASC”) Topic 820 - Fair Value Measurements and Disclosures. This means that our portfolio valuations will be based on unobservable inputs and our own assumptions about how market participants would price the asset or liability in question. We expect that inputs into the determination of fair value of our portfolio investments will require significant management judgment or estimation. Even if observable market data are available, such information may be the result of consensus pricing information or broker quotes, which include a disclaimer that the broker would not be held to such a price in an actual transaction. The non-binding nature of consensus pricing and/or quotes accompanied by disclaimers materially reduces the reliability of such information. We have retained the services of an independent service provider to review the valuation of these loans and securities. The types of factors that the board of directors may take into account in determining the fair value of our investments generally include, as appropriate, comparison to publicly traded securities including such factors as yield, maturity and measures of credit quality, the enterprise value of a portfolio company, the nature and realizable value of any collateral, the portfolio company’s ability to make payments and its earnings and discounted cash flow, the markets in which the portfolio company does business and other relevant factors. Because such valuations, and particularly valuations of private securities and private companies, are inherently uncertain, may fluctuate over short periods of time and may be based on estimates, our determinations of fair value may differ materially from the values that would have been used if a ready market for these loans and securities existed. Our NAV could be adversely affected if our determinations regarding the fair value of our investments were materially higher than the values that we ultimately realize upon the disposal of such loans and securities.
Our board of directors may change our operating policies and strategies without prior notice or stockholder approval, the effects of which may be adverse to our stockholders.
Our board of directors has the authority to modify or waive our current operating policies, investment criteria and strategies without prior notice and without stockholder approval. We cannot predict the effect any changes to our current operating policies, investment criteria and strategies would have on our business, NAV, operating results and the value of our common stock. However, the effects might be adverse, which could negatively impact our ability to pay you distributions and cause you to lose all or part of your investment. Moreover, we have significant flexibility in investing the net proceeds of any offering and may use the net proceeds from any offering in ways with which investors may not agree.
If SIC Advisors is unable to manage our investments effectively, we may be unable to achieve our investment objective.
Our ability to achieve our investment objective will depend on our ability to manage our business, which will depend, in turn, on the ability of SIC Advisors to identify, invest in and monitor companies that meet our investment criteria. Accomplishing this result largely will be a function of SIC Advisors’ investment process and, in conjunction with its role as our administrator, its ability to provide competent, attentive and efficient services to us.
SIC Advisors’ senior management team is comprised of members of the senior management team for Medley LLC, and they manage other investment funds. They may also be required to provide managerial assistance to our portfolio companies. These demands on their time may distract them or slow our rate of investment. Any failure to manage our business effectively could have a material adverse effect on our business, financial condition and results of operations.
We may experience fluctuations in our quarterly results.
We could experience fluctuations in our quarterly operating results due to a number of factors, including our ability or inability to make investments in companies that meet our investment criteria, the interest rate payable and default rates on the debt securities we acquire, the level of our expenses, variations in and the timing of the recognition of realized and unrealized gains or losses, the degree to which we encounter competition in our markets, and general economic conditions. As a result of these factors, results for any previous period should not be relied upon as indicative of performance in future periods. These occurrences could have a material adverse effect on our results of operations, the value of your investment in us and our ability to pay distributions to you and our other stockholders.
Any unrealized losses we experience on our portfolio may be an indication of future realized losses, which could reduce our income available for distribution.
As a BDC, we are required to record on our financial statements our investments at market value or, if no market value is ascertainable, at the fair value as determined in good faith by our board of directors. Decreases in the market values or fair values of our investments are recorded as unrealized depreciation. Any unrealized losses in our portfolio could be an indication of a portfolio company’s inability to meet its repayment obligations to us with respect to the affected investments. This could result in realized losses in the future and ultimately in reductions of our income available for distribution in future periods. In addition, decreases in the market value or fair value of our investments will reduce our NAV. See “Management's Discussion and Analysis of Financial Condition and Results of Operations - Valuation of Investments.”
We are uncertain of our sources for funding our future capital needs. If we cannot obtain debt or equity financing on acceptable terms, our ability to acquire investments and to expand our operations will be adversely affected.
The net proceeds from the sale of shares of our common stock will be used for our investment opportunities, operating expenses and for payment of various fees and expenses such as management fees, incentive fees and other fees. Any working capital reserves we maintain may not be sufficient for investment purposes, and we may require debt or equity financing to operate. In addition, we are required to distribute at least 90% of our net ordinary income and net short-term capital gains in excess of net long-term capital losses, if any, to our stockholders to maintain our RIC tax treatment. Accordingly, in the event that we need additional capital in the future for investments or for any other reason we may need to borrow from financial institutions in order to obtain such additional capital. These sources of funding may not be available to us due to unfavorable economic conditions, which could increase our funding costs, limit our access to the capital markets or result in a decision by lenders not to extend credit to us. Consequently, if we cannot obtain debt or equity financing on acceptable terms, our ability to acquire investments and to expand our operations will be adversely affected. As a result, we would be less able to achieve portfolio diversification and our investment objective, which may negatively impact our results of operations and reduce our ability to make distributions to our stockholders.
We are a non-diversified investment company within the meaning of the 1940 Act, and therefore we are not limited with respect to the proportion of our assets that may be invested in securities of a single issuer.
We are classified as a non-diversified investment company within the meaning of the 1940 Act, which means that we are not limited by the 1940 Act with respect to the proportion of our assets that we may invest in securities of a single issuer. We are also not adopting any policy restricting the percentage of our assets that may be invested in a single portfolio company. To the extent that we assume large positions in the securities of a small number of issuers, or within a particular industry, our NAV may fluctuate to a greater extent than that of a diversified investment company as a result of changes in the financial condition or the market’s assessment of the issuer. We may also be more susceptible to any single economic or regulatory occurrence than a diversified investment company. Beyond our asset diversification requirements applicable to RICs under Subchapter M of the Code, we do not have fixed guidelines for diversification, and our investments could be concentrated in relatively few portfolio companies. See “Business - Taxation as a Regulated Investment Company.”
Risks Relating to SIC Advisors and its Respective Affiliates
Our incentive fee structure may create incentives for SIC Advisors that are not fully aligned with the interests of our stockholders.
In the course of our investing activities, we pay management and incentive fees to SIC Advisors. These fees are based on our gross assets. As a result, investors in our common stock will invest on a “gross” basis and receive distributions on a ‘‘net’’ basis after expenses, resulting in a lower rate of return than one might achieve through direct investments. Because these fees are based on our gross assets, SIC Advisors will benefit when we incur debt or use leverage. Additionally, under the incentive fee structure, SIC Advisors may benefit when capital gains are recognized and, because SIC Advisors determines when a holding is sold, SIC Advisors controls the timing of the recognition of such capital gains. Our board of directors is charged with protecting our interests by monitoring how SIC Advisors addresses these and other conflicts of interests associated with its management services and compensation. While they are not expected to review or approve borrowings or incurrence of leverage in the ordinary course, our independent directors approve any credit facility, including the maximum amount of leverage we may employ, and will periodically review SIC Advisors’ services and fees as well as its portfolio management decisions and portfolio performance through their quarterly review of our portfolio and annual review of our Investment Advisory Agreement and our Administration Agreement. In connection with these reviews, our independent directors will consider whether our fees and expenses (including those related to leverage) remain appropriate. As a result of this arrangement, SIC Advisors or its affiliates may from time to time have interests that differ from those of our stockholders, giving rise to a conflict.
The part of the incentive fee payable to SIC Advisors that relates to our net investment income is computed and paid on income that may include interest income that has been accrued but not yet received in cash. This fee structure may be considered to involve a conflict of interest for SIC Advisors to the extent that it may encourage SIC Advisors to favor debt financings that provide for deferred interest, rather than current cash payments of interest. SIC Advisors may have an incentive to invest in deferred interest securities in circumstances where it would not have done so but for the opportunity to continue to earn the incentive fee even when the issuers of the deferred interest securities would not be able to make actual cash payments to us on such securities. This risk could be increased because SIC Advisors is not obligated to reimburse us for any incentive fees received even if we subsequently incur losses or never receive in cash the deferred income that was previously accrued.
SIC Advisors and its affiliates, including our officers and some of our directors, face conflicts of interest caused by compensation arrangements with us, which could result in actions that are not in the best interests of our stockholders.
SIC Advisors and its affiliates receive substantial fees from us in return for their services, and these fees could influence the advice provided to us. Among other matters, because the base management fee that we pay to SIC Advisors is based on our gross assets, SIC Advisors may benefit if we incur indebtedness.
There are significant potential conflicts of interest that could affect our investment returns.
There may be times when SIC Advisors, its senior management and the Investment Team, and members of its Investment Committee have interests that differ from those of our stockholders, giving rise to a conflict of interest. In particular, certain private investment funds managed by the senior members of SIC Advisors hold controlling or minority equity interests, or have the right to acquire such equity interests, in some of our portfolio companies. As a result, the senior members of SIC Advisors may face conflicts of interests in connection with making business decisions for these portfolio companies to the extent that such decisions affect the debt and equity holders in these portfolio companies differently. In addition, the senior members of SIC Advisors may face conflicts of interests in connection with making investment or other decisions, including granting loan waivers or concessions on our behalf with respect to these portfolio companies given that they also manage private investment funds that hold the equity interests in these portfolio companies.
The time and resources that individuals associated with SIC Advisors devote to us may be diverted, and we may face additional competition due to the fact that SIC Advisors is not prohibited from raising money for or managing another entity that makes the same types of investments that we target.
SIC Advisors is not prohibited from raising money for and managing future investment entities that make the same types of investments as those we target. The time and resources that SIC Advisors devotes to us may be diverted, and during times of intense activity in other programs it may devote less time and resources to our business than is necessary or appropriate. As a result of these competing demands on their time and the fact that they may engage in other business activities on behalf of themselves and others, these individuals face conflicts of interest in allocating their time. These conflicts of interest could result in declines in the returns on our investments and the value of your investment. In addition, we may compete with any such investment entity for the same investors and investment opportunities. While we may co-invest with such investment entities to the extent permitted by the 1940 Act and the rules and regulations thereunder, the 1940 Act imposes significant limits on co-investment. In this regard, the Current Exemptive Order allows us additional latitude to co-invest with certain affiliates. Nevertheless, the Current Exemptive Order requires us to meet certain conditions in order to invest in certain portfolio companies in which our affiliates are investing or are invested. Affiliates of SIC Advisors, whose primary business includes the origination of investments, engage in investment advisory businesses with accounts that compete with us.
SIC Advisors may, from time to time, possess material non-public information, limiting our investment discretion.
SIC Advisors and members of its senior management and Investment Team and the Investment Committee may serve as directors of, or in a similar capacity with, companies in which we invest, the securities of which are purchased or sold on our behalf. In the event that material nonpublic information is obtained with respect to such companies, we could be prohibited for a period of time from purchasing or selling the securities of such companies by law or otherwise, and this prohibition may have an adverse effect on us.
We may be obligated to pay our Adviser incentive compensation even if we incur a net loss due to a decline in the value of our portfolio.
Our Investment Advisory Agreement entitles SIC Advisors to receive an incentive fee based on our net investment income regardless of any capital losses. In such case, we may be required to pay SIC Advisors an incentive fee for a fiscal quarter even if there is a decline in the value of our portfolio or if we incur a net loss for that quarter.
Any incentive fee payable by us that relates to our net investment income may be computed and paid on income that may include interest that has been accrued but not yet received. If a portfolio company defaults on a loan that is structured to provide accrued interest, it is possible that accrued interest previously included in the calculation of the incentive fee will become uncollectible. SIC Advisors is not obligated to reimburse us for any part of the incentive fee it received that was based on accrued income that we never received as a result of a subsequent default, and such circumstances would result in our paying an incentive fee on income we never receive.
For U.S. federal income tax purposes, we are required to recognize taxable income in some circumstances in which we do not receive a corresponding payment in cash (such as deferred interest that is accrued as OID) and to make distributions with respect to such income to maintain our status as a RIC. Under such circumstances, we may have difficulty meeting the annual Distribution Requirement necessary to obtain and maintain RIC tax treatment under the Code. This difficulty in making the required distribution may be amplified to the extent that we are required to pay an incentive fee with respect to such accrued income. As a result, we may have to sell some of our investments at times and/or at prices we would not consider advantageous, raise additional debt or equity capital, or forgo new investment opportunities for this purpose. If we are not able to obtain cash from other sources, we may fail to qualify for RIC tax treatment and thus become subject to corporate-level U.S. federal income tax. For additional discussion regarding the tax implications of being a RIC, see ‘‘Business - Taxation as a Regulated Investment Company.’’
The management and incentive fees we pay to our Adviser may induce our Adviser to make speculative investments.
The incentive fee payable by us to SIC Advisors may create an incentive for SIC Advisors to make investments on our behalf that are risky or more speculative than would be the case in the absence of such compensation arrangements. The way in which the incentive fee is determined may encourage SIC Advisors to use leverage to increase the return on our investments. In addition, the fact that our management fee is payable based upon our gross assets, which would include any borrowings for investment purposes, may encourage SIC Advisors to use leverage to make additional investments. Under certain circumstances, the use of leverage may increase the likelihood of default, which would disfavor holders of our common stock. Such a practice could result in our investing in more speculative securities than would otherwise be the case, which could result in higher investment losses, particularly during cyclical economic downturns.
There are certain risks relating to the investment that SIC Advisors made in us.
SIC Advisors purchased 1,108,033 shares of our common stock for aggregate gross proceeds to us of $10,000,000, which issuance was made immediately after our prior registration statement was declared effective by the SEC. Thus, SIC Advisors is a significant stockholder. As a result and given the fact that SIC Advisors is our investment adviser and certain of its principals serve as our executive officers and members of our board of directors, SIC Advisors will be able to exert significant influence over our management and policies. As a result, SIC Advisors, or any person or entity to which such shares may be transferred, may ultimately have the ability to take actions with respect to their voting of such shares that may not be in our or our stockholders’ best interest.
Our ability to enter into transactions with our affiliates will be restricted, which may limit the scope of investments available to us.
We are prohibited under the 1940 Act from participating in certain transactions with certain of our affiliates without the prior approval of a majority of the independent directors and, in some cases, the SEC. Any person that owns, directly or indirectly, 5% or more of our outstanding voting securities will be our affiliate for purposes of the 1940 Act, and we will generally be prohibited from buying or selling any securities from or to such affiliate, absent the prior approval of our board of directors. The 1940 Act also prohibits certain “joint” transactions with certain of our affiliates, which in certain circumstances could include investments in the same portfolio company (whether at the same or different times to the extent the transaction is deemed to be “joint”), without prior approval of our board of directors and, in some cases, the SEC. If a person acquires more than 25% of our voting securities, we will be prohibited from buying or selling any security from or to such person or certain of that person’s affiliates, or entering into prohibited joint transactions with such persons, absent the prior approval of the SEC. Similar restrictions limit our ability to transact business with our Adviser as well as our officers or directors or their affiliates. The SEC has interpreted the BDC regulations governing transactions with affiliates to prohibit certain “joint transactions” involving entities that share a common investment adviser. As a result of these restrictions, we may be prohibited from buying or selling any security (other than any security of which we are the issuer) from or to, as well as co-investing with, any fund managed by our Affiliates without the prior approval of the SEC. The foregoing may limit the scope of investment opportunities that would otherwise be available to us.
We may, however, invest alongside other clients of our Adviser and its affiliates, including other entities they manage in certain circumstances where doing so is consistent with applicable law, the Current Exemptive Order and SEC staff interpretations and guidance. For example, we may co-invest with such accounts consistent with guidance promulgated by the SEC staff permitting us and such other accounts to purchase interests in a single class of privately placed securities so long as certain conditions are met, including that our investment adviser, acting on our behalf and on behalf of other clients, negotiates no term other than price. We may also co-invest with our investment adviser’s other clients as otherwise permissible under regulatory guidance, applicable regulations and our Adviser’s allocation policy. Under this allocation policy, a fixed percentage of each opportunity, which may vary based on asset class and investment objectives, among other things, will be offered to us and similar eligible accounts, as periodically determined by our Adviser and approved by our board of directors, including our independent directors. The allocation policy further provides that allocations among us and these other accounts will generally be made pro rata based on each account’s capital available for investment, as determined, in our case, by our Adviser. It is our policy to base our determinations as to the amount of capital available for investment based on such factors as the amount of cash on-hand, existing commitments and reserves, if any, the targeted leverage level, the targeted asset mix and diversification requirements and other investment policies and restrictions set by our board of directors or imposed by applicable laws, rules, regulations or interpretations. We expect that these determinations will be made similarly for other accounts. However, we can offer no assurance that investment opportunities will be allocated to us fairly or equitably in the short-term or over time.
In situations where co-investment with other clients of our Adviser or its affiliates is not permitted under the 1940 Act and related rules, existing or future staff guidance, or the terms and conditions of the Current Exemptive Order, our Adviser will need to decide which client or clients will proceed with the investment. Under our Adviser’s allocation policy, such determinations will be made based on the principle that investment opportunities shall be offered to eligible clients on an alternating basis that will be fair and equitable over time. As a result, we will not have an entitlement to make a co-investment in these circumstances and, to the extent that another client elects to proceed with the investment, we will not be permitted to participate. Moreover, except in certain circumstances, we will be unable to invest in any issuer in which a client of our Adviser or its affiliate holds a controlling interest. These restrictions may limit the scope of investment opportunities that would otherwise be available to us.
We may make investments that could give rise to a conflict of interest.
We do not expect to invest in, or hold securities of, companies that are controlled by our Adviser’s affiliates’ clients. However, our Adviser’s affiliates’ clients may invest in, and gain control over, one of our portfolio companies. If our Adviser’s affiliates’ client, or clients, gains control over one of our portfolio companies, it may create conflicts of interest and may subject us to certain restrictions under the 1940 Act. As a result of these conflicts and restrictions, our Adviser may be unable to implement our investment strategy as effectively as they could have in the absence of such conflicts or restrictions. For example, as a result of a conflict or restriction, our Adviser may be unable to engage in certain transactions that they would otherwise pursue. In order to avoid these conflicts and restrictions, our Adviser may choose to exit these investments prematurely and, as a result, we would forego any positive returns associated with such investments. In addition, to the extent that another client holds a different class of securities than us as a result of such transactions, our interests may not be aligned.
There may be conflicts related to obligations SIC Advisors’ senior management and Investment Team and members of its Investment Committee have to other clients.
The members of the senior management and Investment Teams and the Investment Committee of SIC Advisors serve or may serve as officers, directors or principals of entities that operate in the same or a related line of business as we do, or of investment funds managed by SIC Advisors or its affiliates. In serving in these multiple capacities, they may have obligations to other clients or investors in those entities, the fulfillment of which may not be in our best interests or in the best interest of our stockholders. For example, the personnel that comprise SIC Advisors’ Investment Team have management responsibilities for other investment funds, accounts or other investment vehicles managed by affiliates of SIC Advisors.
Our investment objective may overlap with the investment objectives of such investment funds, accounts or other investment vehicles. For example, affiliates of SIC Advisors currently manage private funds and managed accounts that are seeking new capital commitments and will pursue an investment strategy similar to our strategy, and we may compete with these and other entities managed by affiliates of SIC Advisors for capital and investment opportunities. As a result, those individuals may face conflicts in the allocation of investment opportunities among us and other investment funds or accounts advised by principals of, or affiliated with, SIC Advisors.
We have received the Current Exemptive Order from the SEC that permits us to co-invest with certain other investment funds managed by SIC Advisors or its affiliates, subject to the conditions included therein. In situations where we cannot co-invest with other investment funds managed by SIC Advisors or its affiliates, the investment policies and procedures of SIC Advisors generally require that such opportunities be offered to us and such other investment funds on an alternating basis. However, there can be no assurance that we will be able to participate in all investment opportunities that are suitable to us.
Our ability to sell or otherwise exit investments in which affiliates of SIC Advisors also have an investment may be restricted.
We may be considered an affiliate with respect to certain of our portfolio companies. Certain private funds advised by the senior members of SIC Advisors also hold interests in these portfolio companies and as such these interests may be considered a joint enterprise under applicable regulations. To the extent that our interests in these portfolio companies may need to be restructured in the future or to the extent that we choose to exit certain of these transactions, our ability to do so will be limited.
Our Adviser’s asset management platform has had a reduction of its assets under management, which could have a material adverse effect on our business, financial condition, or results of operations.
Effective December 31, 2020, a publicly traded BDC that was managed by an affiliate of our Adviser internalized its management function. For the year ended December 31, 2020, the investment advisory relationship with this publicly traded BDC represented approximately 17% of the assets under management of Medley’s asset management platform. As a result, we will no longer have the benefit of our Adviser’s ability to leverage its affiliation with another BDC, which could impact the availability of investment opportunities to the Company, the ability of our Adviser to generate deal flow for the Company, and the opportunities to enter into co-investment transactions with such publicly traded BDC. The foregoing could have a material adverse effect on our business, financial condition, or results of operations.
The Adviser is a wholly owned subsidiary of Medley LLC. Medley LLC has filed a voluntary petition for relief under Chapter 11 of the Bankruptcy Code in the Bankruptcy Court for the District of Delaware, which could negatively impact the Company’s business, financial condition, or results of operations.
On March 7, 2021, Medley LLC commenced a voluntary case (the “Chapter 11 Case”) under chapter 11 of title 11 of the United States Code in the United States Bankruptcy Court for the District of Delaware (the “Bankruptcy Court”). During the pendency of the Chapter 11 Case, Medley LLC’s management may be required to spend a significant amount of time and effort dealing with restructuring matters rather than focusing on our business operations. The Medley LLC Chapter 11 Case may also make it more difficult to retain management and the key personnel necessary to the success of our business and, in turn, the ability of the Adviser to manage and support the Company’s investment process. As a result of the foregoing, if the Adviser is unable to manage our investments effectively, we may be unable to achieve our investment objective. The uncertainties associated with the Medley LLC Chapter 11 Case and the related risks to the Company’s business could negatively impact the Company’s business, financial condition, or results of operations.
The Adviser is an indirect wholly owned subsidiary of MDLY. MDLY is subject to a formal order of private investigation by the SEC’s Division of Enforcement, an adverse outcome of which could have a material adverse effect on our business, financial condition, or results of operations.
On September 17, 2019 the staff of the SEC’s Division of Enforcement (the “Staff”) informed MDLY and the Company that it was conducting an informal inquiry and requested the production and preservation of certain documents and records. MDLY and the Company fully cooperated with the Staff’s informal inquiry and began voluntarily providing the Staff with documents in response to their informal inquiry.
By letter dated December 18, 2019, the Staff advised MDLY that a formal order of private investigation (the “Order”) had been issued and that the informal inquiry was now a formal investigation. The Order indicated that the investigation relates to Section 17(a) of the Securities Act, Section 10(b) of the Exchange Act and Rule 10b-5 thereunder, and Sections 206(1), 206(2), and 206(4) of the Advisers Act, Rule 206(4)-8, Sections 13(a) and 14(a) of the Exchange Act and Rules 12b-20, 13a-1, 13a-11, 13a-13, and 14a-9 thereunder. MDLY and the Company continues to cooperate fully with the investigation.
MDLY and the Company cannot predict the outcome of, or the timeframe for, the conclusion of this investigation. An adverse outcome could have a material adverse effect on the Company’s business, financial condition, or results of operations.
Risks Relating to BDCs
We may face increasing competition for investment opportunities, which could delay deployment of our capital, reduce returns and result in losses.
We compete for investments with other BDCs and investment funds (including registered investment companies, private equity funds and mezzanine funds), as well as traditional financial services companies such as commercial banks and other sources of funding. Moreover, alternative investment vehicles, such as hedge funds, have begun to invest in areas in which they have not traditionally invested, including making investments in our target market of privately owned U.S. companies. As a result of these new entrants, competition for investment opportunities in privately owned U.S. companies may intensify. Many of our competitors are substantially larger and have considerably greater financial, technical, and marketing resources than we do. For example, some competitors may have a lower cost of capital and access to funding sources that are not available to us. In addition, some of our competitors may have higher risk tolerances or different risk assessments than we have. These characteristics could allow our competitors to consider a wider variety of investments, establish more relationships and offer better pricing and more flexible structuring than we are able to do.
We do not seek to compete primarily based on the interest rates we offer, and we believe that some of our competitors make loans with interest rates that are comparable to or lower than the rates we offer. We may lose investment opportunities if we do not match our competitors’ pricing, terms, and structure criteria. If we are forced to match these criteria to make investments, we may not be able to achieve acceptable returns on our investments or may bear substantial risk of capital loss. A significant increase in the number and/or the size of our competitors in this target market could force us to accept less attractive investment terms. Furthermore, many of our competitors are not subject to the regulatory restrictions that the 1940 Act imposes on us as a BDC or the source of income, asset diversification and distribution requirements we must satisfy to maintain our RIC tax treatment. The competitive pressures we face may have a material adverse effect on our business, financial condition, results of operations, and cash flows. As a result of this competition, we may not be able to take advantage of attractive investment opportunities from time to time. Also, we may not be able to identify and make investments that are consistent with our investment objective.
The requirement that we invest a sufficient portion of our assets in qualifying assets could preclude us from investing in accordance with our current business strategy.
As a BDC, the 1940 Act prohibits us from acquiring any assets other than certain qualifying assets unless, at the time of and after giving effect to such acquisition, at least 70% of our total assets are qualifying assets. Therefore, we may be precluded from investing in what we believe are attractive investments if such investments are not qualifying assets, which would have a material adverse effect on our business, financial condition, and result of operations. Similarly, these rules could prevent us from making additional investments in existing portfolio companies, which could result in the dilution of our position.
Changes in laws or regulations governing our operations may adversely affect our business or cause us to alter our business strategy.
We and our portfolio companies will be subject to regulation at the local, state, and federal level. Changes to the laws and regulations governing our permitted investments may require a change to our investment strategy. Such changes could differ materially from our strategies and plans as set forth in this Annual Report on Form 10-K and may shift our investment focus from the areas of expertise of our Adviser. Thus, any such changes, if they occur, could have a material adverse effect on our results of operations and the value of your investment.
Regulations governing our operation as a BDC and RIC will affect our ability to raise capital and the way in which we raise additional capital or borrow for investment purposes, which may have a negative effect on our growth. As a BDC, the necessity of raising additional capital may expose us to risks, including the typical risks associated with leverage.
As a result of the annual distribution requirement to qualify for RIC tax treatment, we may need to access the capital markets periodically to raise cash to fund new investments. We may issue “senior securities”, including borrowing money from banks or other financial institutions only in amounts such that our asset coverage, as defined in the 1940 Act, equals at least 200% after such incurrence or issuance. If we issue senior securities, we will be exposed to typical risks associated with leverage, including an increased risk of loss. Our ability to issue different types of securities is also limited. Compliance with these requirements may unfavorably limit our investment opportunities and reduce our ability in comparison to other companies to profit from favorable spreads between the rates at which we can borrow and the rates at which we can lend.
We may borrow for investment purposes. If the value of our assets declines, we may be unable to satisfy the asset coverage requirement applicable to us as a BDC, which would prohibit us from paying distributions and could prevent us from qualifying for RIC tax treatment, which would generally result in a corporate-level U.S. federal income tax on any income and net gains. If we cannot satisfy the asset coverage requirement applicable to us as a BDC, we may be required to sell a portion of our investments and, depending on the nature of our debt financing, repay a portion of our indebtedness at a time when such sales may be disadvantageous. Also, any amounts that we use to service our indebtedness would not be available for distributions to our common stockholders.
In addition, we anticipate that as market conditions permit, we may securitize our loans to generate cash for funding new investments. To securitize loans, we may create a wholly owned subsidiary, contribute a pool of loans to the subsidiary and have the subsidiary issue primarily investment grade debt securities to purchasers who we would expect to be willing to accept a substantially lower interest rate than the loans earn. We would retain all or a portion of the equity in the securitized pool of loans. Our retained equity would be exposed to any losses on the portfolio of loans before any of the debt securities would be exposed to such losses. Accordingly, if the pool of loans experienced a low level of losses due to defaults, we would earn an incremental amount of income on our retained equity but we would be exposed, up to the amount of equity we retained, to that proportion of any losses we would have experienced if we had continued to hold the loans in our portfolio. We would not treat the debt issued by such a subsidiary as senior securities.
Legislation that became effective in 2018 may allow us to incur additional leverage.
The 1940 Act generally prohibits us from incurring indebtedness unless immediately after such borrowing we have an asset coverage for total borrowings of at least 200% (i.e., the amount of debt may not exceed 50% of the value of our assets). However, in March 2018, the SBCA modified the 1940 Act by allowing a BDC to increase the maximum amount of leverage it may incur from an asset coverage ratio of 200% to an asset coverage ratio of 150%, if certain requirements are met. Under the 1940 Act, we are allowed to increase our leverage capacity if our stockholders representing at least a majority of the votes cast, when a quorum is present, approve a proposal to do so. If we receive stockholder approval, we would be allowed to increase our leverage capacity on the first day after such approval. Alternatively, the 1940 Act allows the majority of our independent directors to approve an increase in our leverage capacity, and such approval would become effective after one year. In addition, the 1940 Act requires non-listed BDCs to offer to repurchase 25% of its securities each quarter following the calendar quarter in which the BDC obtains such approval. In either case, we would be required to make certain disclosures on our website and in SEC filings regarding, among other things, the receipt of approval to increase our leverage, our leverage capacity and usage, and risks related to leverage. We have not sought or obtained stockholder or board approval to reduce our coverage ratio to 150%.
As a result of the SBCA, we may, in the future, be able to increase our leverage up to an amount that reduces our asset coverage ratio from 200% to 150%. Leverage magnifies the potential for loss on investments in our indebtedness and on invested equity capital. As we use leverage to partially finance our investments, our stockholders will experience increased risks of investing in our securities. If the value of our assets increases, then leveraging would cause the NAV attributable to our common stock to increase more sharply than it would have had we not leveraged. Conversely, if the value of our assets decreases, leveraging would cause NAV to decline more sharply than it otherwise would have had we not leveraged our business. Similarly, any increase in our income in excess of interest payable on the borrowed funds would cause our net investment income to increase more than it would without the leverage, while any decrease in our income would cause net investment income to decline more sharply than it would have had we not borrowed. Such a decline could negatively affect our ability to pay common stock dividends, scheduled debt payments or other payments related to our securities. Leverage is generally considered a speculative investment technique.
Legislative or other actions relating to taxes could have a negative effect on us.
Legislative or other actions relating to taxes could have a negative effect on us. The rules dealing with U.S. federal income taxation are constantly under review by persons involved in the legislative process and by the Internal Revenue Service and the U.S. Department of the Treasury. We cannot predict with certainty how any changes in the tax laws might affect us, our stockholders, or our portfolio investments. New legislation and any U.S. Treasury regulations, administrative interpretations or court decisions interpreting such legislation could significantly and negatively affect our ability to qualify for tax treatment as a RIC or the U.S. federal income tax consequences to us and our stockholders of such qualification, or could have other adverse consequences. Stockholders are urged to consult with their tax advisor regarding tax legislative, regulatory, or administrative developments and proposals and their potential effect on an investment in our securities.
Changes to U.S. tariff and import/export regulations may have a negative effect on our portfolio companies and, in turn, harm us.
There has been on-going discussion and commentary regarding potential significant changes that have been and could be made to U.S. trade policies, treaties and tariffs. The new U.S. presidential administration, and U.S. Congress is in the process of reversing changes made by the prior U.S. presidential administration and there is uncertainty about the future relationship between the United States and other countries with respect to the trade policies, treaties and tariffs. These developments, or the perception that any of them could occur, may have a material adverse effect on global economic conditions and the stability of global financial markets, and may significantly reduce global trade and, in particular, trade between the impacted nations and the United States. Any of these factors could depress economic activity and restrict our portfolio companies’ access to suppliers or customers and have a material adverse effect on their business, financial condition and results of operations, which in turn would negatively impact us.
Risks Relating to our Investments
Our investments in prospective portfolio companies may be risky, and we could lose all or part of our investment.
We pursue a strategy focused on investing primarily in the debt of privately owned U.S. companies with a focus on transactions sourced through the network of SIC Advisors.
|
● |
Senior Secured First Lien Term Debt and Senior Secured Second Lien Term Debt. When we invest in first lien and second lien term debt, we will generally take a security interest in the available assets of these portfolio companies, including the equity interests of their subsidiaries. There is a risk that the collateral securing our investments may decrease in value over time or lose its entire value, may be difficult to sell in a timely manner, may be difficult to appraise and may fluctuate in value based upon the success of the business and market conditions, including as a result of the inability of the portfolio company to raise additional capital. Also, in some circumstances, our security interest could be subordinated to claims of other creditors. In addition, deterioration in a portfolio company’s financial condition and prospects, including its inability to raise additional capital, may be accompanied by deterioration in the value of the collateral for the debt security. Consequently, the fact that debt is secured does not guarantee that we will receive principal and interest payments according to the investment terms, or at all, or that we will be able to collect on the investment should we be forced to enforce our remedies. |
|
● |
Subordinated Debt. Our subordinated debt investments will generally be subordinated to senior debt and will generally be unsecured. This may result in a heightened level of risk and volatility or a loss of principal, which could lead to the loss of the entire investment. These investments may involve additional risks that could adversely affect our investment returns. To the extent interest payments associated with such debt are deferred, such debt may be subject to greater fluctuations in valuations, and such debt could subject us and our stockholders to non-cash income. Since we will not receive any principal repayments prior to the maturity of some of our subordinated debt investments, such investments will be of greater risk than amortizing loans. |
|
● |
Equity Investments. We expect to make selected equity investments. In addition, when we invest in senior and subordinated debt, we may acquire warrants or options to purchase equity securities or benefit from other types of equity participation. Our goal is ultimately to dispose of these equity interests and realize gains upon our disposition of such interests. However, the equity interests we receive may not appreciate in value and, in fact, may decline in value. Accordingly, we may not be able to realize gains from our equity interests, and any gains that we do realize on the disposition of any equity interests may not be sufficient to offset any other losses we experience. Most loans in which we invest will not be rated by any rating agency and, if they were rated, they would be rated as below investment grade quality. Loans rated below investment grade quality are generally regarded as having predominantly speculative characteristics and may carry a greater risk with respect to a borrower’s capacity to pay interest and repay principal. |
To the extent OID constitutes a portion of our income, we will be exposed to risks associated with the deferred receipt of cash representing such income.
Our investments may include OID instruments. To the extent OID constitutes a portion of our income, we will be exposed to typical risks associated with such income being required to be included in taxable and accounting income prior to receipt of cash, including the following:
|
● |
OID instruments may create heightened credit risks because the inducement to trade higher rates for the deferral of cash payments typically represents, to some extent, speculation on the part of the borrower. |
|
● |
For accounting purposes, cash distributions to stockholders representing OID income do not come from paid-in capital. Thus, although a distribution of OID income comes from the cash invested by the stockholders, the 1940 Act does not require that stockholders be given notice of this fact. |
|
● |
OID creates risk of non-refundable cash incentive fee payments to the Adviser based on non-cash accruals that may never be realized. |
|
● |
Interest rates payable on OID instruments, including payment-in-kind loans, or PIK loans, are higher because the deferred interest payments are discounted to reflect the time-value of money and because PIK instruments generally represent a significantly higher credit risk than coupon loans. |
|
● |
OID and PIK instruments may have unreliable valuations because the accruals require judgments about collectability of the deferred payments and the value of the associated collateral. |
|
● |
An election to defer PIK interest payments by adding them to the principal of such instruments increases the Company’s gross assets, which increases future base management fees, and, because interest payments will then be payable on a larger principal amount, the election also increases the Adviser’s future incentive fees at a compounding rate. |
|
● |
Market prices of PIK instruments and other zero coupon instruments are affected to a greater extent by interest rate changes, and may be more volatile than instruments that pay interest periodically in cash. While PIK instruments are usually less volatile than zero coupon debt instruments, PIK instruments are generally more volatile than cash-pay securities. |
|
● |
The deferral of PIK interest on a loan increases its loan-to-value ratio, which is a measure of the riskiness of a loan. |
|
● |
Even if the conditions for income accrual under GAAP are satisfied, a borrower could still default when actual payment is due upon the maturity of such loan. |
|
● |
The required recognition of OID, including PIK, interest for U.S. federal income tax purposes may have a negative impact on liquidity, because it represents a non-cash component of the Company’s investment company taxable income that must, nevertheless, be distributed in cash to investors to avoid it being subject to corporate-level U.S. federal income taxation. |
Our portfolio companies may incur debt that ranks equally with, or senior to, our investments in such companies.
We intend to pursue a strategy focused on investing primarily in the debt of privately owned U.S. companies with a focus on transactions sourced through the network of SIC Advisors. Our portfolio companies may have, or may be permitted to incur, other debt that ranks equally with, or senior to, the debt in which we invest. By their terms, such debt instruments may entitle the holders to receive payment of interest or principal on or before the dates on which we are entitled to receive payments with respect to the debt instruments in which we invest. Also, in the event of insolvency, liquidation, dissolution, reorganization or bankruptcy of a portfolio company, holders of debt instruments ranking senior to our investment in that portfolio company would typically be entitled to receive payment in full before we receive any distribution. After repaying such senior creditors, such portfolio company may not have any remaining assets to use for repaying its obligation to us. In the case of debt ranking equally with debt instruments in which we invest, we would have to share on an equal basis any distributions with other creditors holding such debt in the event of an insolvency, liquidation, dissolution, reorganization or bankruptcy of the relevant portfolio company.
Subordinated liens on collateral securing debt that we will make to our portfolio companies may be subject to control by senior creditors with first priority liens. If there is a default, the value of the collateral may not be sufficient to repay in full both the first priority creditors and us.
Certain debt investments that we make in portfolio companies are secured on a second priority basis by the same collateral securing senior secured debt of such companies. The first priority liens on the collateral secure the portfolio company’s obligations under any outstanding senior debt and may secure certain other future debt that may be permitted to be incurred by the company under the agreements governing the debt. The holders of obligations secured by the first priority liens on the collateral generally control the liquidation of and be entitled to receive proceeds from any realization of the collateral to repay their obligations in full before us. In addition, the value of the collateral in the event of liquidation will depend on market and economic conditions, the availability of buyers and other factors. There can be no assurance that the proceeds, if any, from the sale or sales of all of the collateral would be sufficient to satisfy the debt obligations secured by the second priority liens after payment in full of all obligations secured by the first priority liens on the collateral. If such proceeds are not sufficient to repay amounts outstanding under the debt obligations secured by the second priority liens, then we, to the extent not repaid from the proceeds of the sale of the collateral, will only have an unsecured claim against the portfolio company’s remaining assets, if any.
We may also make unsecured debt investments in portfolio companies, meaning that such investments will not benefit from any interest in collateral of such companies. Liens on such portfolio companies’ collateral, if any, will secure the portfolio company’s obligations under its outstanding secured debt and may secure certain future debt that is permitted to be incurred by the portfolio company under its secured debt agreements. The holders of obligations secured by such liens will generally control the liquidation of, and be entitled to receive proceeds from, any realization of such collateral to repay their obligations in full before us. In addition, the value of such collateral in the event of liquidation will depend on market and economic conditions, the availability of buyers and other factors. There can be no assurance that the proceeds, if any, from sales of such collateral would be sufficient to satisfy our unsecured debt obligations after payment in full of all secured debt obligations. If such proceeds were not sufficient to repay the outstanding secured debt obligations, then our unsecured claims would rank equally with the unpaid portion of such secured creditors’ claims against the portfolio company’s remaining assets, if any.
The rights we may have with respect to the collateral securing the debt investments we make in our portfolio companies with senior debt outstanding may also be limited pursuant to the terms of one or more inter-creditor agreements that we enter into with the holders of senior debt. Under such an inter-creditor agreement, at any time that obligations that have the benefit of the first priority liens are outstanding, any of the following actions that may be taken in respect of the collateral will be at the direction of the holders of the obligations secured by the first priority liens: the ability to cause the commencement of enforcement proceedings against the collateral; the ability to control the conduct of such proceedings; the approval of amendments to collateral documents; releases of liens on the collateral; and waivers of past defaults under collateral documents. We may not have the ability to control or direct such actions, even if our rights are adversely affected.
There may be circumstances where our debt investments could be subordinated to claims of other creditors or we could be subject to lender liability claims.
If one of our portfolio companies were to go bankrupt, depending on the facts and circumstances, including the extent to which we actually provided managerial assistance to that portfolio company or a representative of us or SIC Advisors sat on the board of directors of such portfolio company, a bankruptcy court might re-characterize our debt investment and subordinate all or a portion of our claim to that of other creditors. In situations where a bankruptcy carries a high degree of significance, our legal rights may be subordinated to other creditors.
In addition, lenders in certain cases can be subject to lender liability claims for actions taken by them when they become too involved in the borrower’s business or exercise control over a borrower. It is possible that we could become subject to a lender’s liability claim, including as a result of actions taken if we render significant managerial assistance to, or exercise control or influence over the board of directors of, the borrower.
We generally will not control the business operations of our portfolio companies and, due to the illiquid nature of our holdings in our portfolio companies, may not be able to dispose of our interest in our portfolio companies.
We do not expect to control most of our portfolio companies, even though we may have board representation or board observation rights, and our debt agreements may impose certain restrictive covenants on our borrowers. As a result, we are subject to the risk that a portfolio company in which we invest may make business decisions with which we disagree and the management of such company, as representatives of the holders of their common equity, may take risks or otherwise act in ways that do not serve our interests as a debtholder. Due to the lack of liquidity for our investments in private companies, we may not be able to dispose of our interests in our portfolio companies as readily as we would like or at an appropriate valuation. As a result, a portfolio company may make decisions that could decrease the value of our portfolio holdings.
The lack of liquidity in our investments may adversely affect our business.
We anticipate that our investments generally will be made in private companies. Substantially all of these securities will be subject to legal and other restrictions on resale or will be otherwise less liquid than publicly traded securities. The illiquidity of our investments may make it difficult for us to sell such investments if the need arises. In addition, if we are required to liquidate all or a portion of our portfolio quickly, we may realize significantly less than the value at which we had previously recorded our investments. In addition, we may face other restrictions on our ability to liquidate an investment in a portfolio company to the extent that we or SIC Advisors has material non-public information regarding such portfolio company.
Economic recessions or downturns could impair our portfolio companies and harm our operating results.
Many of our portfolio companies may be susceptible to economic slowdowns or recessions and may be unable to repay our debt investments during these periods. The recent global outbreak of COVID-19 has disrupted economic markets, and the prolonged economic impact is uncertain. Many manufacturers of goods in China and other countries in Asia have seen a downturn in production due to the suspension of business and temporary closure of factories in an attempt to curb the spread of the illness. As the impact of COVID-19 spreads to other parts of the world, similar impacts may occur with respect to affected countries. In the past, instability in the global capital markets resulted in disruptions in liquidity in the debt capital markets, significant write-offs in the financial services sector, the re-pricing of credit risk in the broadly syndicated credit market and the failure of major domestic and international financial institutions. In particular, in past periods of instability, the financial services sector was negatively impacted by significant write-offs as the value of the assets held by financial firms declined, impairing their capital positions and abilities to lend and invest. In addition, continued uncertainty surrounding the negotiation of trade deals between Britain and the European Union following the United Kingdom’s exit from the European Union and uncertainty between the United States and other countries, including China, with respect to trade policies, treaties, and tariffs, among other factors, have caused disruption in the global markets. There can be no assurance that market conditions will not worsen in the future.
In an economic downturn, we may have non-performing assets or non-performing assets may increase, and the value of our portfolio is likely to decrease during these periods. Adverse economic conditions may also decrease the value of any collateral securing our senior secured or second lien secured debt. A severe recession may further decrease the value of such collateral and result in losses of value in our portfolio and a decrease in our revenues, net income, assets and net worth. Unfavorable economic conditions also could increase our funding costs, limit our access to the capital markets or result in a decision by lenders not to extend credit to us on terms we deem acceptable. These events could prevent us from increasing investments and harm our operating results.
The occurrence of recessionary conditions and/or negative developments in the domestic and international credit markets may significantly affect the markets in which we do business, the value of our investments, and our ongoing operations, costs and profitability. Any such unfavorable economic conditions, including rising interest rates, may also increase our funding costs, limit our access to capital markets or negatively impact our ability to obtain financing, particularly from the debt markets. In addition, any future financial market uncertainty could lead to financial market disruptions and could further impact our ability to obtain financing. These events could limit our investment originations, limit our ability to grow and negatively impact our operating results and financial condition.
A covenant breach by our portfolio companies may harm our operating results.
A portfolio company’s failure to satisfy financial or operating covenants imposed by us or other lenders could lead to defaults and, potentially, termination of its debt and foreclosure on its secured assets, which could trigger cross-defaults under other agreements and jeopardize a portfolio company’s ability to meet its obligations under the debt or equity securities that we hold. We may incur expenses to the extent necessary to seek recovery upon default or to negotiate new terms, which may include the waiver of certain financial covenants, with a defaulting portfolio company.
An investment strategy focused primarily on privately held companies presents certain challenges, including the lack of available information about these companies.
We intend to invest primarily in privately held companies. Investments in private companies pose certain incremental risks as compared to investments in public companies including that they:
|
● |
have reduced access to the capital markets, resulting in diminished capital resources and ability to withstand financial distress; |
|
● |
may have limited financial resources and may be unable to meet their obligations under their debt securities that we hold, which may be accompanied by a deterioration in the value of any collateral and a reduction in the likelihood of us realizing any guarantees we may have obtained in connection with our investment; |
|
● |
may have shorter operating histories, narrower product lines and smaller market shares than larger businesses, which tend to render them more vulnerable to competitors’ actions and changing market conditions, as well as general economic downturns; |
|
● |
are more likely to depend on the management talents and efforts of a small group of persons; therefore, the death, disability, resignation or termination of one or more of these persons could have a material adverse impact on our portfolio company and, in turn, on us; and |
|
● |
generally have less predictable operating results, may from time to time be parties to litigation, may be engaged in rapidly changing businesses with products subject to a substantial risk of obsolescence, and may require substantial additional capital to support their operations, finance expansion or maintain their competitive position. In addition, our executive officers, directors and members of the Adviser’s management may, in the ordinary course of business, be named as defendants in litigation arising from our investments in the portfolio companies. |
In addition, investments in private companies tend to be less liquid. The securities of private companies are not publicly traded or actively traded on the secondary market and are, instead, traded on a privately negotiated over-the-counter secondary market for institutional investors. These privately negotiated over-the-counter secondary markets may be inactive during an economic downturn or a credit crisis. In addition, the securities in these companies will be subject to legal and other restrictions on resale or will otherwise be less liquid than publicly traded securities. Also, under the 1940 Act, if there is no readily available market for these investments, we are required to carry these investments at fair value as determined by our board of directors. As a result, if we are required to liquidate all or a portion of our portfolio quickly, we may realize significantly less than the value at which we had previously recorded these investments. We may also face other restrictions on our ability to liquidate an investment in a portfolio company to the extent that we, SIC Advisors or any of their respective affiliates have material nonpublic information regarding such portfolio company or where the sale would be an impermissible joint transaction. The reduced liquidity of our investments may make it difficult for us to dispose of them at a favorable price, and, as a result, we may suffer losses.
Finally, little public information generally exists about private companies and these companies may not have third-party debt ratings or audited financial statements. We must therefore rely on the ability of SIC Advisors to obtain adequate information through due diligence to evaluate the creditworthiness and potential returns from investing in these companies. Additionally, these companies and their financial information will not generally be subject to the Sarbanes-Oxley Act and other rules that govern public companies. If we are unable to uncover all material information about these companies, we may not make a fully informed investment decision, and we may lose money on our investments.
Our failure to make follow-on investments in our portfolio companies could impair the value of our portfolio; our ability to make follow-on investments in certain portfolio companies may be restricted.
Following an initial investment in a portfolio company, provided that there are no restrictions imposed by the 1940 Act, we may make additional investments in that portfolio company as “follow-on” investments in order to: (1) increase or maintain in whole or in part our equity ownership percentage; (2) exercise warrants, options or convertible securities that were acquired in the original or subsequent financing; or (3) attempt to preserve or enhance the value of our initial investment.
We have the discretion to make any follow-on investments, subject to the availability of capital resources. We may elect not to make follow-on investments or may lack sufficient funds to make those investments. Our failure to make follow-on investments may, in some circumstances, jeopardize the continued viability of a portfolio company and our initial investment, or may result in a missed opportunity for us to increase our participation in a successful operation. Even if we have sufficient capital to make a desired follow-on investment, we may elect not to make such follow-on investment because we may not want to increase our concentration of risk, because we prefer other opportunities, because we are inhibited by compliance with BDC requirements or because we desire to maintain our RIC tax treatment. We also may be restricted from making follow-on investments in certain portfolio companies to the extent that affiliates hold interests in such companies.
Our ability to invest in public companies may be limited in certain circumstances.
As a BDC, we are not permitted to acquire any assets other than “qualifying assets” specified in the 1940 Act unless, at the time the acquisition is made, at least 70% of our total assets are qualifying assets (with certain limited exceptions). Subject to certain exceptions for follow-on investments and distressed companies, an investment in an issuer that has outstanding securities listed on a national securities exchange may be treated as qualifying assets only if such issuer has a market capitalization that is less than $250 million at the time of such investment. In addition, we may invest up to 30% of our portfolio in opportunistic investments which will be intended to diversify or complement the remainder of our portfolio and to enhance our returns to stockholders. These investments may include private equity investments, securities of public companies that are broadly traded and securities of non-U.S. companies. We expect that these public companies generally will have debt securities that are non-investment grade.
Our investments in foreign securities may involve significant risks in addition to the risks inherent in U.S. investments.
Our investment strategy contemplates that a portion of our investments may be in securities of foreign companies. Investing in foreign companies may expose us to additional risks not typically associated with investing in U.S. companies. These risks include changes in exchange control regulations, political, economic and social instability, expropriation, imposition of foreign taxes, less liquid markets and less available information than is generally available in the United States, higher transaction costs, less government supervision of exchanges, brokers and issuers, less developed bankruptcy laws, difficulty in enforcing contractual obligations, lack of uniform accounting and auditing standards and greater price volatility. Although it is anticipated that most of our investments will be denominated in U.S. dollars, our investments that are denominated in a foreign currency will be subject to the risk that the value of a particular currency may change in relation to the U.S. dollar. Among the factors that may affect currency values are trade balances, the level of short-term interest rates, differences in relative values of similar assets in different currencies, long-term opportunities for investment and capital appreciation and political developments. We may employ hedging techniques to minimize these risks, but we can offer no assurance that we will, in fact, hedge currency risk or, that if we do, such strategies will be effective. As a result, a change in currency exchange rates may adversely affect our profitability.
Prepayments of our debt investments by our portfolio companies could adversely impact our results of operations and reduce our return on equity.
We are subject to the risk that the investments we make in our portfolio companies may be repaid prior to maturity. When this occurs, we will generally reinvest these proceeds in temporary investments, pending their future investment in new portfolio companies. These temporary investments will typically have substantially lower yields than the debt being prepaid and we could experience significant delays in reinvesting these amounts. Any future investment in a new portfolio company may also be at lower yields than the debt that was repaid. As a result, our results of operations could be materially adversely affected if one or more of our portfolio companies elect to prepay amounts owed to us. Additionally, prepayments, net of prepayment fees, could negatively impact our return on equity.
We may acquire indirect interests in loans rather than direct interests, which would subject us to additional risk.
We may make or acquire loans or investments through participation agreements. A participation agreement typically results in a contractual relationship only with the counterparty to the participation agreement and not with the borrower. SIC Advisors has adopted best execution procedures and guidelines to mitigate credit and counterparty risk when we acquire a loan through a participation agreement. In investing through participations, we will generally not have a right to enforce compliance by the borrower with the terms of the loan agreement against the borrower, and we may not directly benefit from the collateral supporting the debt obligation in which it has purchased the participation. As a result, we will be exposed to the credit risk of both the borrower and the counterparty selling the participation. In the event of insolvency of the counterparty, we, by virtue of holding participation interests in the loan, may be treated as its general unsecured creditor. In addition, although we may have certain contractual rights under the loan participation that require the counterparty to obtain our consent prior to taking various actions relating to the loan, we cannot guarantee that the counterparty will seek such consent prior to taking various actions. Further, in investing through participation agreements, we may not be able to conduct the due diligence on the borrower or the quality of the loan with respect to which it is buying a participation that we would otherwise conduct if we were investing directly in the loan, which may result in us being exposed to greater credit or fraud risk with respect to the borrower or the loan than we expected when initially purchasing the participation. See ‘‘Risks Relating to SIC Advisors and its Respective Affiliates - There are significant potential conflicts of interest that could affect our investment returns’’ above.
Hedging transactions may expose us to additional risks.
We may engage in currency or interest rate hedging transactions. If we engage in hedging transactions, we may expose ourselves to risks associated with such transactions. We may utilize instruments such as forward contracts, currency options and interest rate swaps, caps, collars and floors to seek to hedge against fluctuations in the relative values of our portfolio investments from changes in currency exchange rates and market interest rates. Hedging against a decline in the values of our portfolio investments does not eliminate the possibility of fluctuations in the values of such investments or prevent losses if the values of such investments decline. However, such hedging can establish other investments designed to gain from those same developments, thereby offsetting the decline in the value of such portfolio investments. Such hedging transaction may also limit the opportunity for gain if the values of the underlying portfolio investments should increase. Moreover, it may not be possible to hedge against an exchange rate or interest rate fluctuation that is so generally anticipated that we are not able to enter into a hedging transaction at an acceptable price.
While we may enter into transactions to seek to reduce currency exchange rate and interest rate risks, unanticipated changes in currency exchange rates or interest rates may result in poorer overall investment performance than if we had not engaged in any such hedging transactions. In addition, the degree of correlation between price movements of the instruments used in a hedging strategy and price movements in the portfolio investments being hedged may vary. Moreover, for a variety of reasons, we may not seek or be able to establish a perfect correlation between such hedging instruments and the portfolio holdings being hedged. Any such imperfect correlation may prevent us from achieving the intended hedge and expose us to risk of loss. In addition, it may not be possible to hedge fully or perfectly against currency fluctuations affecting the value of securities denominated in non-U.S. currencies because the value of those securities is likely to fluctuate as a result of factors not related to currency fluctuations.
The disposition of our investments may result in contingent liabilities.
We currently expect that a significant portion of our investments will involve lending directly to private companies. In connection with the disposition of an investment in private securities, we may be required to make representations about the business and financial affairs of the portfolio company typical of those made in connection with the sale of a business. We may also be required to indemnify the purchasers of such investment to the extent that any such representations turn out to be inaccurate or with respect to certain potential liabilities. These arrangements may result in contingent liabilities that ultimately must be satisfied through our return of certain distributions previously made to us.
If we invest in the securities and obligations of distressed and bankrupt issuers, we might not receive interest or other payments.
We may invest in the securities and obligations of distressed and bankrupt issuers, including debt obligations that are in covenant or payment default. Such investments generally are considered speculative. The repayment of defaulted obligations is subject to significant uncertainties. Defaulted obligations might be repaid only after lengthy workout or bankruptcy proceedings, during which the issuer of those obligations might not make any interest or other payments. We may not realize gains from our equity investments.
Risks Relating to Debt Financing
At December 31, 2020, we had $145.0 million of outstanding indebtedness under the Alpine Credit Facility.
Illustration. The following table illustrates the effect of leverage on returns from an investment in our common stock assuming various annual returns, net of expenses. The calculations in the table below are hypothetical and actual returns may be higher or lower than those appearing below. The calculation assumes (i) $677.7 million in total assets, (ii) a weighted average cost of funds of 4.4%, (iii) $145.0 million in debt outstanding and (iv) $525.7 million in stockholders’ equity. In order to compute the “Corresponding return to stockholders,” the “Assumed Return on Our Portfolio (net of expenses)” is multiplied by the assumed total assets to obtain an assumed return to us. From this amount, the interest expense is calculated by multiplying the assumed weighted average cost of funds times the assumed debt outstanding, and the product is subtracted from the assumed return to us in order to determine the return available to stockholders. The return available to stockholders is then divided by our stockholders’ equity to determine the “Corresponding return to stockholders.” Actual interest payments may be different.
|
Assumed Return on Our Portfolio (net of expenses) |
(10)% | (5)% | 0% | 5% | 10% | |||||||||||||||
|
Corresponding return to stockholders (1) |
-14.1 | % | -7.7 | % | -1.2 | % | 5.2 | % | 11.7% | |||||||||||
|
(1) |
In order for us to cover our annual interest payments on indebtedness, we must achieve annual returns on our December 31, 2020 total assets of at least 1.2%. |
Because we use borrowed funds to make investments or fund our business operations, we are exposed to risks typically associated with leverage which increase the risk of investing in us.
We intend to borrow funds through draws from our existing revolving credit facility with Alpine Funding LLC (the “Alpine Credit Facility”), our wholly owned, special purpose financing subsidiary (“Alpine”), to leverage our capital structure, which is generally considered a speculative investment technique. As a result:
|
● |
our common stock may be exposed to an increased risk of loss because a decrease in the value of our investments may have a greater negative impact on the value of our common stock than if we did not use leverage; |
|
● |
if we do not appropriately match the assets and liabilities of our business, adverse changes in interest rates could reduce or eliminate the incremental income we make with the proceeds of any leverage; |
|
● |
our ability to pay dividends on our common stock may be restricted if our asset coverage ratio, as provided in the 1940 Act, is not at least 200% (or 150% if, pursuant to the 1940 Act, certain requirements are met) and any amounts used to service indebtedness or preferred stock would not be available for such dividends; |
|
● |
the Alpine Credit Facility is subject to periodic renewal by our lenders, whose continued participation cannot be guaranteed; |
|
● |
the Alpine Credit Facility contains covenants restricting our operating flexibility; and |
|
● |
we, and indirectly our stockholders, bear the cost of issuing and paying interest or dividends on such securities. |
Covenants in the Alpine Credit Facility may restrict our financial and operating flexibility.
We maintain the Alpine Credit Facility. The Alpine Credit Facility are secured by substantially all of our assets, subject to certain exclusions. Availability of loans under the Alpine Credit Facility are linked to the valuation of the collateral pursuant to a borrowing base mechanism. Borrowings under the Alpine Credit Facility are subject to, among other things, a minimum borrowing/collateral base. Substantially all of our assets are pledged as collateral under the Alpine Credit Facility. The Alpine Credit Facility require us to, among other things (i) make representations and warranties regarding the collateral as well as our business and operations, (ii) agree to certain indemnification obligations, and (iii) agree to comply with various affirmative and negative covenants. The documents for each of the Alpine Credit Facility also include default provisions such as the failure to make timely payments under the Alpine Credit Facility, as the case may be, the occurrence of a change in control, and our failure to materially perform under the operative agreements governing the Alpine Credit Facility, which, if not complied with, could accelerate repayment under the Alpine Credit Facility, thereby materially and adversely affecting our liquidity, financial condition and results of operations.
As a result of such covenants and restrictions in the Alpine Credit Facility, we will be limited in how we conduct our business and we may be unable to raise additional debt or equity financing to take advantage of new business opportunities. In addition, our ability to satisfy the financial requirements required by the Alpine Credit Facility can be affected by events beyond our control and we cannot assure you that we will meet these requirements. We cannot assure you that we will be able to maintain compliance with these covenants in the future and, if we fail to do so, we may be in default under the Alpine Credit Facility, and we may be prohibited from undertaking actions that are necessary or desirable to maintain and expand our business.
Default under the Alpine Credit Facility could allow the lender(s) to declare all amounts outstanding to be immediately due and payable. If the lender(s) declare amounts outstanding under the Alpine Credit Facility to be due, the lender(s) could proceed against the assets pledged to secure the debt under the Alpine Credit Facility. Any event of default, therefore, could have a material adverse effect on our business if the lender(s) determine to exercise their rights.
If we are unable to extend the reinvestment period or refinance the Alpine Credit Facility and/or the JV Facility, Alpine and/or Sierra JV may be required to repay or refinance their respective indebtedness at a time or in a manner that could have a material adverse effect on our business, financial condition, or results of operations.
The reinvestment period of the Alpine Credit Facility and the senior secured revolving credit facility agreement, as amended, between Sierra JV and Deutsche Bank, AG, New York Branch (the “JV Facility”) ends on May 18, 2021 and April 30, 2021, respectively. If Alpine, the Company’s wholly owned financing subsidiary, is not able to extend the reinvestment period or refinance its existing indebtedness under the Alpine Credit Facility with another lender, the Alpine Credit Facility would enter its amortization period and be payable at maturity on May 29, 2022, and the reinvestment period of the JV Facility would change from April 30, 2021 to April 18, 2021, 30 days before the end of the reinvestment period under the Alpine Credit Facility under the terms of the JV Facility, and the maturity date of the JV Facility would change from April 30, 2024 to April 18, 2024. If Sierra JV is not able to extend the reinvestment period or refinance its existing indebtedness under the JV Facility, then the JV Facility will enter its amortization period and be payable at maturity on April 30, 2024. In such event, we may be forced to sell a portion of our investments or the investments of Sierra JV, as applicable, to meet such obligations, which may be sold at a time we would not consider advantageous. The uncertainties associated with the Medley LLC Chapter 11 Case and the related risks, including the risk that Medley LLC operates under the Bankruptcy Court’s protection for a longer period of time or for a longer period of time than expected, may impact the ability of Alpine and Sierra JV to extend the reinvestment period or refinance its existing indebtedness. See “The Adviser is a wholly owned subsidiary of Medley LLC. Medley LLC has filed a voluntary petition for relief under Chapter 11 of the Bankruptcy Code in the Bankruptcy Court for the District of Delaware, which could negatively impact the Company’s business, financial condition, or results of operations.” As a result of the foregoing, our ability to finance investments could be impacted, which could have a material adverse effect on our business, financial condition, or results of operations.
Because we use debt to finance our investments, changes in interest rates will affect our cost of capital and net investment income.
Because we borrow money to make investments, our net investment income will depend, in part, upon the difference between the rate at which we borrow funds and the rate at which we invest those funds. As a result, we can offer no assurance that a significant change in market interest rates will not have a material adverse effect on our net investment income in the event we use our existing debt to finance our investments. In periods of rising interest rates, our cost of funds will increase to the extent we access the Alpine Credit Facility, since the interest rate on the Alpine Credit Facility is floating, which could reduce our net investment income to the extent any debt investments have fixed interest rates. We expect that our long-term fixed-rate investments will be financed primarily with issuances of equity and long-term debt securities. We may use interest rate risk management techniques in an effort to limit our exposure to interest rate fluctuations. Such techniques may include various interest rate hedging activities to the extent permitted by the 1940 Act.
You should also be aware that a rise in the general level of interest rates typically leads to higher interest rates applicable to our debt investments. Accordingly, an increase in interest rates may result in an increase of the amount of incentive fees payable to SIC Advisors.
If we borrow money, the potential for gain or loss on amounts invested in us will be magnified and may increase the risk of investing in us. Borrowed money may also adversely affect the return on our assets, reduce cash available for distribution to our stockholders, and result in losses.
The use of borrowings, also known as leverage, increases the volatility of investments by magnifying the potential for gain or loss on invested equity capital. Our use of leverage to partially finance our investments, through borrowing from banks and other lenders, increases the risks of investing in our common stock. If the value of our assets decreases, leveraging would cause NAV to decline more sharply than it otherwise would have had we not leveraged. Similarly, any decrease in our income would cause net income to decline more sharply than it would have had we not borrowed. Such a decline could negatively affect our ability to make distributions to our stockholders. In addition, our stockholders will bear the burden of any increase in our expenses as a result of our use of leverage, including interest expenses and any increase in the management or incentive fees payable to the Adviser.
We use leverage to finance our investments. The amount of leverage that we employ depends on our Adviser and our board of directors’ assessment of market and other factors at the time of the relevant borrowing. There can be no assurance that leveraged financing will in the future be available to us on favorable terms or at all. However, to the extent of our use of leverage to finance our assets, our financing costs will reduce cash available for distributions to stockholders. Moreover, we may not be able to meet our financing obligations and, to the extent that we cannot, we risk the loss of some or all of our assets to liquidation or sale to satisfy the obligations. In such an event, we may be forced to sell assets at significantly depressed prices due to market conditions or otherwise, which may result in losses.
As a BDC, we generally are required to meet a coverage ratio of total assets to total borrowings and other senior securities, which include all of our borrowings and any preferred stock that we may issue in the future, of at least 200% (or 150% if, pursuant to the 1940 Act, certain requirements are met). If this ratio declines below 200%, we cannot incur additional debt and could be required to sell a portion of our investments to repay some debt when it is disadvantageous to do so. This could have a material adverse effect on our operations, and we may not be able to make distributions. The amount of leverage that we will employ will be subject to oversight by our board of directors, a majority of whom will be independent directors with no material interests in such transactions.
We will be exposed to risks associated with changes in interest rates.
We are subject to financial market risks, including changes in interest rates. Because we use debt to finance investments, our net investment income depends, in part, upon the difference between the rate at which we borrow funds and the rate at which we invest those funds. As a result, we can offer no assurance that a significant change in market interest rates will not have a material adverse effect on our net investment income. In periods of rising interest rates when we have debt outstanding, our cost of funds will increase, which could reduce our net investment income.
In addition, due in part to the effects of the prolonged economic crisis and recession that began in 2007, interest rates have recently been at or near historic lows. In the event of a significant rising interest rate environment, our portfolio companies with adjustable-rate debt could see their payments increase and there may be a significant increase in the number of our portfolio companies who are unable or unwilling to repay their debt. Investments in companies with adjustable-rate debt may also decline in value in response to rising interest rates if the rates at which they pay interest do not rise as much, or as quickly, as market interest rates in general. Similarly, during periods of rising interest rates, our investments with fixed rates may decline in value because they are locked in at below market yield.
We may use interest rate risk management techniques in an effort to limit our exposure to interest rate fluctuations. These techniques may include various interest rate hedging activities to the extent such activities are not prohibited by the 1940 Act. These activities may limit our ability to participate in the benefits of lower interest rates with respect to the hedged portfolio. Adverse developments resulting from changes in interest rates or hedging transactions could have a material adverse effect on our business, financial condition and results of operations.
Risks Relating to an Investment in our Common Stock
Our stockholders will have limited liquidity and may not receive a full return of invested capital upon selling their shares.
Shares of our common stock are illiquid investments for which there is currently no secondary market. A future liquidity event could include: (i) a listing of our common stock on a national securities exchange; (ii) a merger or another transaction approved by our board of directors in which our stockholders will receive cash or shares of a listed company; or (iii) a sale of all or substantially all of our assets either on a complete portfolio basis or individually followed by a liquidation. Certain types of liquidity events, such as a listing, would allow us to retain our investment portfolio intact while providing our stockholders with access to a trading market for their securities.
We are not obligated to complete a liquidity event; therefore, it will be difficult for an investor to sell his or her shares.
There can be no assurance that we will complete a liquidity event. If we do not successfully complete a liquidity event, liquidity for our stockholder’s investment in our common stock will be limited.
We may be unable to invest a significant portion of the net proceeds of our offering on acceptable terms in an acceptable timeframe.
Delays in investing the net proceeds of our offering, which was terminated by our board of directors effective as of July 31, 2018, may impair our performance. We cannot assure you we will be able to identify any investments that meet our investment objective or that any investment that we make will produce a positive return. We may be unable to invest the net proceeds of our offering on acceptable terms within the time period that we anticipate or at all, which could harm our financial condition and operating results.
Before making investments, we will invest the net proceeds of our public offering primarily in cash, cash equivalents, U.S. government securities, repurchase agreements, and other high-quality debt instruments maturing in one year or less from the time of investment. This will produce returns that are significantly lower than the returns, which we expect to achieve when our portfolio is fully invested in securities meeting our investment objective. As a result, any distributions that we pay while our portfolio is not fully invested in securities meeting our investment objective may be lower than the distributions that we may be able to pay when our portfolio is fully invested in securities meeting our investment objective.
A stockholder’s interest in us will be diluted if we issue additional shares, which could reduce the overall value of an investment in us.
Our stockholders do not have preemptive rights to any shares of our capital stock we issue in the future. Our articles of incorporation authorizes us to issue up to 250,000,000 shares of common stock. Pursuant to our articles of incorporation, a majority of our board of directors may amend our articles of incorporation to increase the number of authorized shares of stock without stockholder approval. After an investor purchases shares, our board of directors may elect to sell additional shares in the future, issue equity interests in private offerings or issue share-based awards to our independent directors or persons associated with the Adviser. To the extent we issue additional equity interests at or below NAV, after an investor purchases shares of our common stock, a stockholder’s percentage ownership interest in us will be diluted. In addition, depending upon the terms and pricing of any additional offerings and the value of our investments, a stockholder may also experience dilution in the net asset and fair value of his or her shares of our common stock.
Under the 1940 Act, we generally are prohibited from issuing or selling our common stock at a price below NAV per share, which may be a disadvantage as compared with certain public companies. We may, however, sell our common stock, or warrants, options, or rights to acquire our common stock, at a price below the current NAV of our common stock if our board of directors and independent directors determine that such sale is in our best interests and the best interests of our stockholders, and our stockholders, including a majority of those stockholders that are not affiliated with us, approve such sale. In any such case, the price at which our securities are to be issued and sold may not be less than a price that, in the determination of our board of directors, closely approximates the fair value of such securities (less any distributing commission or discount). If we raise additional funds by issuing common stock or senior securities convertible into, or exchangeable for, our common stock, then the percentage ownership of our stockholders at that time will decrease and you will experience dilution.
Preferred stock could be issued with rights and preferences that would adversely affect holders of our common stock.
Under the terms of our articles of incorporation, our board of directors is authorized to issue shares of preferred stock in one or more series without stockholder approval, which could potentially adversely affect the interests of existing stockholders.
If we issue preferred stock, the NAV and market value of our common stock may become more volatile.
If we issue preferred stock, we cannot assure you that such issuance would result in a higher yield or return to the holders of our common stock. The issuance of preferred stock would likely cause the NAV and market value of our common stock to become more volatile. If the dividend rate on the preferred stock were to approach the net rate of return on our investment portfolio, the benefit of leverage to the holders of our common stock would be reduced. If the dividend rate on the preferred stock were to exceed the net rate of return on our portfolio, the leverage would result in a lower rate of return to the holders of our common stock than if we had not issued preferred stock. Any decline in the NAV of our investments would be borne entirely by the holders of our common stock. Therefore, if the market value of our portfolio were to decline, the leverage would result in a greater decrease in NAV to the holders of our common stock than if we were not leveraged through the issuance of preferred stock. We might be in danger of failing to maintain the required asset coverage of the preferred stock or of losing our ratings on the preferred stock or, in an extreme case, our current investment income might not be sufficient to meet the dividend requirements on the preferred stock. In order to counteract such an event, we might need to liquidate investments in order to fund a redemption of some or all of the preferred stock. In addition, we would pay (and the holders of our common stock would bear) all costs and expenses relating to the issuance and ongoing maintenance of the preferred stock, including higher advisory fees if our total return exceeds the dividend rate on the preferred stock. Holders of preferred stock may have different interests than holders of our common stock and may at times have disproportionate influence over our affairs.
Holders of any preferred stock we might issue might have the right to elect members of the board of directors and class voting rights on certain matters.
Holders of any preferred stock we might issue, voting separately as a single class, might have the right to elect two members of the board of directors at all times and in the event dividends become two full years in arrears, would have the right to elect a majority of our directors until such arrearage is completely eliminated. In addition, preferred stockholders would have class voting rights on certain matters, including changes in fundamental investment restrictions and conversion to open-end status, and accordingly would be able to veto any such changes. Restrictions imposed on the declarations and payment of dividends or other distributions to the holders of our common stock and preferred stock, both by the 1940 Act and by requirements imposed by rating agencies or the terms of the Alpine Credit Facility, might impair our ability to maintain our qualification for RIC tax treatment for U.S. federal income tax purposes. While we would intend to redeem our preferred stock to the extent necessary to enable us to distribute our income as required to maintain our qualification as a RIC, there can be no assurance that such actions could be effected in time to meet the tax requirements.
Certain provisions of the Maryland General Corporation Law could deter takeover attempts.
The Maryland General Corporate Law (the “MGCL”) and our articles of incorporation and bylaws contain certain provisions that may have the effect of discouraging, delaying or making difficult a change in control or removal of the Adviser or the removal of its incumbent directors.
Our board of directors is divided into three classes of directors serving staggered three-year terms. At each annual meeting of our stockholders, the successors to the class of directors whose term expires at such meeting will be elected to hold office for a term expiring at the annual meeting of our stockholders held in the third year following the year of their election. Each director holds office for the term to which he or she is elected and until his or her successor is duly elected and qualifies. As members of a classified board, directors may only be removed for cause by the affirmative vote of the holders of a majority of shares outstanding. Moreover, by virtue of an election into Section 3-804(c) of the MGCL in our articles of incorporation, any vacancy on our board of directors may only be filled by the remaining directors even where those directors constitute less than a quorum of our board of directors.
Our bylaws exempt us from the Maryland Control Share Acquisition Act, which significantly restricts the voting rights of control shares of a Maryland corporation acquired in a control share acquisition. If our board of directors were to amend our bylaws to repeal this exemption from the Maryland Control Share Acquisition Act, that statute may make it more difficult for a third party to obtain control of us and increase the difficulty of consummating such a transaction. Although we do not presently intend to adopt such an amendment to our bylaws, there can be no assurance that we will not so amend our bylaws at some time in the future. We will not, however, amend our bylaws to make us subject to the Maryland Control Share Acquisition Act without our board of directors determining that doing so would not conflict with the 1940 Act and obtaining confirmation from the SEC that it does not object to that determination.
Additionally, our board of directors may, without stockholder action, authorize the issuance of shares of stock in one or more classes or series, including preferred stock. Our board of directors may also, without stockholder action, amend our articles of incorporation to increase the number of shares of stock of any class or series that we have authority to issue. These anti-takeover provisions may inhibit a change of control in circumstances that could give the holders of our common stock the opportunity to realize a premium over the value of our common stock.
Investing in our common stock involves a high degree of risk.
The investments we make in accordance with our investment objective may result in a higher amount of risk and volatility or loss of principal than alternative investment options. Our investments in portfolio companies may be highly speculative and aggressive and, therefore, an investment in our common stock may not be suitable for someone with lower risk tolerance.
The NAV of our common stock may fluctuate significantly.
The NAV and liquidity, if any, of the market for shares of our common stock may be significantly affected by numerous factors, some of which are beyond our control and may not be directly related to our operating performance. These factors include:
|
● |
significant volatility in the market price and trading volume of securities of BDCs or other companies in our sector, which are not necessarily related to the operating performance of the companies; |
|
● |
changes in regulatory policies or tax guidelines, particularly with respect to RICs or BDCs; |
|
● |
loss of RIC tax treatment or BDC status; |
|
● |
changes in earnings or variations in operating results; |
|
● |
changes in the value of our portfolio of investments; |
|
● |
changes in accounting guidelines governing valuation of our investments; |
|
● |
any shortfall in revenue or net income or any increase in losses from levels expected by investors; |
|
● |
departure of SIC Advisors or certain of its respective key personnel; |
|
● |
operating performance of companies comparable to us; |
|
● |
general economic trends and other external factors; |
|
● |
loss of a major funding source; and |
|
● |
the length and duration of the COVID-19 outbreak in the U.S. as well as worldwide and the magnitude of the economic impact of that outbreak. |
U.S. Federal Income Tax Risks
We will be subject to corporate-level U.S. federal income tax if we are unable to qualify for the tax treatment applicable to RICs under Subchapter M of the Code or to satisfy RIC distribution requirements.
To maintain RIC tax treatment under the Code, we must meet the following minimum annual distribution, income source and asset diversification requirements. See "Business - Taxation as a Regulated Investment Company."
The minimum annual distribution requirement for a RIC will be satisfied if we distribute to our stockholders on an annual basis at least 90% of our “investment company taxable income,” which generally is its net ordinary income plus the excess of realized net short-term capital gains over realized net long-term capital losses, if any. We would be taxed on any retained income and/or gains, including any short-term capital gains or long-term capital gains. Because we may use debt financing, we are subject to an asset coverage ratio requirement under the 1940 Act and may in the future become subject to certain financial covenants under loan and credit agreements that could, under certain circumstances, restrict us from making distributions necessary to satisfy the distribution requirements. If we are unable to obtain cash from other sources, we could fail to qualify for RIC tax treatment, or could be required to retain a portion of our income or gains, and thus become subject to corporate-level U.S. federal income tax.
The income source requirement will be satisfied if we obtain at least 90% of our income for each year from dividends, interest, gains from the sale of stock or securities, or similar sources. The asset diversification requirement will be satisfied if we meet certain asset diversification requirements at the end of each quarter of our taxable year. To satisfy this requirement, at least 50% of the value of our assets must consist of cash, cash equivalents, U.S. Government securities, securities of other RICs, and other securities, with those other securities limited, in respect of any one issuer, to an amount that does not exceed 5% of the value of its total assets and that does not represent more than 10% of the outstanding voting securities of such issuer; and no more than 25% of the value of our assets can be invested in the securities, other than U.S. government securities or securities of other RICs, of one issuer, of two or more issuers that are controlled, as determined under applicable Code rules, by us and that are engaged in the same or similar or related trades or businesses or of certain ‘‘qualified publicly traded partnerships.’’ Failure to meet these requirements may result in our having to dispose of certain investments quickly in order to prevent the loss of RIC tax treatment. Because most of our investments will be in private companies, and therefore will be relatively illiquid, any such dispositions could be made at disadvantageous prices and could result in substantial losses.
If we fail to qualify for or maintain RIC tax treatment for any reason and are subject to corporate-level U.S. federal income tax, the resulting corporate taxes could substantially reduce our net assets, the amount of income available for distribution, and the amount of our distributions. Such a failure would have a material adverse effect on our results of operations and financial conditions, and thus, our stockholders.
We may have difficulty paying our required distributions if we recognize income before or without receiving cash representing such income.
For U.S. federal income tax purposes, we may be required to recognize taxable income in circumstances in which we do not receive a corresponding payment in cash. For example, if we hold debt obligations that are treated under applicable tax rules as having OID (such as debt instruments with PIK, interest or, in certain cases, increasing interest rates or debt instruments that were issued with warrants), we must include in income each year a portion of the OID that accrues over the life of the obligation, regardless of whether cash representing such income is received by us in the same taxable year. We may also have to include in income other amounts that we have not yet received in cash, such as deferred loan origination fees that are paid after origination of the loan or are paid in non-cash compensation such as warrants or stock. Furthermore, we may invest in non-U.S. corporations (or other non-U.S. entities treated as corporations for U.S. federal income tax purposes) that could be treated under the Code and U.S. Treasury regulations as ‘‘passive foreign investment companies’’ and/or ‘‘controlled foreign corporations.’’ The rules relating to investment in these types of non-U.S. entities are designed to ensure that U.S. taxpayers are either, in effect, taxed currently (or on an accelerated basis with respect to corporate level events) or taxed at increased tax rates on the receipt of distributions or upon disposition. In certain circumstances, this could require us to recognize income where we do not receive a corresponding payment in cash. We anticipate that a portion of our income may constitute OID or other income required to be included in taxable income prior to receipt of cash. Further, we may elect to amortize market discounts and include such amounts in our taxable income in the current year, instead of upon disposition, as an election not to do so would limit our ability to deduct interest expenses for tax purposes.
Because any OID or other amounts accrued will be included in our investment company taxable income for the year of the accrual, we may be required to make a distribution to our stockholders in order to satisfy the annual distribution requirement, even if we will not have received any corresponding cash amount. As a result, we may have difficulty meeting the tax requirement to distribute at least 90% of our net ordinary income and net short-term capital gains in excess of net long-term capital losses, if any, to maintain RIC tax treatment under the Code. We may have to sell some of our investments at times and/or at prices we would not consider advantageous, raise additional debt or equity capital, make a partial share distribution, or forgo new investment opportunities for this purpose. If we are not able to obtain cash from other sources, and choose not to make a qualifying share distribution, we may fail to qualify for RIC tax treatment and thus become subject to corporate-level U.S. federal income tax. See ‘‘Tax Matters.’’
Item 1B. Unresolved Staff Comments
None.
We do not own any real estate or other physical properties materially important to our operation. Our administrator furnishes us office space. Our headquarters are currently located at 280 Park Avenue, 6th Floor East, New York, NY 10017.
On August 4, 2020, the court approved a stipulation of dismissal of a purported class action (the “Anderson Action”) pending in the Supreme Court of the State of New York, County of New York, captioned Roger Anderson et al. v. Stephen R. Byers et al., Index No. 652006/2019. Named as defendants were Stephen R. Byers, Oliver T. Kane, Valerie Lancaster-Beal, Brook Taube, Seth Taube, the Company, and Sierra Management, Inc. (collectively, the “Defendants”). The complaint alleged that the Defendants breached their fiduciary duties to stockholders of the Company in connection with the proposed mergers of MCC with and into the Company and of MDLY with and into Sierra Management, Inc., a wholly owned subsidiary of the Company. Compensatory damages in unspecified amounts were sought. The defendants vigorously denied any wrongdoing or liability with respect to the facts and claims which were asserted, or which could have been asserted, in the Anderson Action. Pursuant to the terms of the stipulation of dismissal, on August 14, 2020, the plaintiffs’ attorneys filed a motion seeking an award of attorneys’ fees and expenses in the amount of $1 million (the “Fee Motion”). Defendants opposed the Fee Motion in a brief filed on September 11, 2020, and the plaintiffs filed a reply brief in further support of the Fee Motion on October 1, 2020. The Court heard oral argument on the Fee Motion on January 27, 2021, and stated at the conclusion of the hearing that the motion would be denied. The Court filed a written order denying the Fee Motion on February 8, 2021.
Item 4. Mine Safety Disclosures
Not Applicable
Item 5. Market for Registrant’s Common Equity, Related Stockholder Matters and Issuer Purchases of Equity Securities.
Market Information
Shares of our common stock are illiquid investments for which there is currently no secondary market. No shares of our common stock have been authorized for issuance under any equity compensation plans. Under Maryland General Corporation Law, our stockholders generally will not be personally liable for our debts or obligations.
On July 2, 2018, the Company’s board of directors determined to terminate the Company’s offering effective as of July 31, 2018. Prior to such date, the Company conducted a continuous public offering of its shares of common stock beginning on April 16, 2012. The Company sold a total of 102,630,605 shares of common stock, which includes shares issued as part of the distribution reinvestment plan (see Note 13), for total proceeds of $1.0 billion, which includes the shares sold to SIC Advisors.
As of March 19, 2021, we had 20,042 record holders of our common stock.
Set forth below is a chart describing the classes of our securities outstanding as of March 19, 2021:
|
Title of Class |
Amount Authorized |
Amount Held by Us or for Our Account |
Amount Outstanding | |||||||||
|
Common Stock |
250,000,000 | — | 102,771,530 | |||||||||
Distributions
Our dividends, if any, are determined by the board of directors. We have elected to be treated as a RIC under Subchapter M of the Code. To maintain RIC tax treatment, we must, among others things, distribute at least 90% of our net ordinary income and net short-term capital gains in excess of net long-term capital losses, if any, to our stockholders. In order to avoid certain excise taxes imposed on RICs, we currently intend to distribute during each calendar year an amount at least equal to the sum of: (i) 98% of our ordinary income for the calendar year, (ii) 98.2% of our capital gains in excess of capital losses for the one-year period generally ending on October 31 of the calendar year (unless an election is made by us to use our taxable year) and (iii) any ordinary income and net capital gains that we recognized for preceding years, but were not distributed during such years, and on which we paid no U.S. federal income tax.
From time to time, but not less than quarterly, we will review our accounts to determine whether distributions to our stockholders are appropriate. We may in the future fund our cash distributions to stockholders from any sources of funds available to us, including borrowings. We have not established limits on the amount of funds we may use from available sources to make distributions.
The following table reflects, for U.S. federal income tax purposes, the sources of the cash distributions that we have paid on our common stock during the years ended December 31, 2020, 2019 and 2018:
|
2020 |
2019 |
2018 |
||||||||||||||||||||||
|
Source of Distribution |
Distribution Amount |
Percentage |
Distribution Amount |
Percentage |
Distribution Amount |
Percentage |
||||||||||||||||||
|
Ordinary income |
$ | — | — | % | $ | 38,237,797 | 59.6 | % | $ | 62,256,547 | 100.0 | % | ||||||||||||
|
Tax Return of Capital |
$ | 13,838,034 | 100.0 | % | $ | 25,924,607 | 40.4 | % | $ | — | — | % | ||||||||||||
|
Distributions on a tax basis: |
$ | 13,838,034 | 100.0 | % | $ | 64,162,404 | 100.0 | % | $ | 62,256,547 | 100.0 | % | ||||||||||||
We have adopted an “opt in” distribution reinvestment plan pursuant to which our stockholders may elect to have the full amount of any cash distributions reinvested in additional shares of our common stock. As a result, if we declare a cash dividend or other distribution, each stockholder that has “opted in” to our distribution reinvestment plan will have their distributions automatically reinvested in additional shares of our common stock rather than receiving cash distributions. Stockholders who receive distributions in the form of shares of common stock will be subject to the same federal, state and local tax consequences as if they received cash distributions.
Sales of Unregistered Securities
None.
Unregistered Sales of Equity Securities and Use of Proceeds
In June 2013, we commenced a share repurchase program pursuant to which we conducted quarterly share repurchases, of up to 2.5% of the weighted average number of outstanding shares in any 3-month period or 10% of the weighted average number of outstanding shares in any 12-month period. The purpose of the share repurchase program was to allow stockholders to sell their shares back to us at a price equal to the most recently disclosed NAV per share of our common stock immediately prior to the date of repurchase. Shares were purchased from stockholders participating in the program on a pro rata basis. Unless our board of directors determined otherwise, the number of shares to be repurchased during any calendar year were limited to the proceeds received in association with the sale of shares of common stock under the distribution reinvestment plan.
Notwithstanding the suspension of the share repurchase program, our board of directors approved the repurchase of shares of our common stock from our stockholders who have requested repurchases in connection with such stockholder’s death or disability. See Note 13 to our consolidated financial statements for more information.
During the year ended December 31, 2020, the Company repurchased 647,252 shares, respectively, of certain shareholders due to death or disability. The following table provides information concerning our repurchases of shares of our common stock from our stockholders who have requested repurchases in connection with such stockholder’s death or disability during the fiscal year ended December 31, 2020:
|
Period |
Total Number of Shares Purchased | Average Price Per Share Paid |
Total Number of Shares Purchased as Part of Publicly Announced Plans or Programs |
Maximum Number of Shares that May Yet be Purchased Under the Plans or Programs |
||||||||||||
|
March 1, 2020 - March 31, 2020 |
124,861 | $ | 5.78 | — | — | |||||||||||
|
June 1, 2020 - June 30, 2020 |
34,086 | 4.51 | — | — | ||||||||||||
| September 1, 2020 - September 30, 2020 | 324,136 | 4.60 | — | — | ||||||||||||
| December 1, 2020 - December 31, 2020 | 164,169 | 4.91 | — | — | ||||||||||||
|
Total |
647,252 | $ | 4.90 | — | — | |||||||||||
Item 6. Selected Financial Data
The following consolidated selected financial data should be read in conjunction with Part II, Item 7, Management’s Discussion and Analysis of Financial Condition and Results of Operations, and Part II, Item 8, Consolidated Financial Statements and Supplementary Data, of this Annual Report on Form 10-K. The following consolidated selected financial and other data for the years ended December 31, 2020, 2019, 2018, 2017, and 2016 is derived from the audited consolidated financial statements for such years, included in Part II, Item 8, Consolidated Financial Statements and Supplementary Data, of this Annual Report on Form 10-K.
|
As of and for the years ended December 31, |
||||||||||||||||||||
|
2020 |
2019 |
2018 |
2017 |
2016 |
||||||||||||||||
|
Statement of Operations data: |
||||||||||||||||||||
|
Total investment income |
$ | 47,893,107 | $ | 80,097,606 | $ | 97,172,641 | $ | 107,175,537 | $ | 99,780,496 | ||||||||||
|
Base management fees |
12,185,544 | 17,018,479 | 19,011,460 | 21,233,065 | 19,928,802 | |||||||||||||||
|
Incentive fee |
— | 176,061 | — | 4,700,177 | 9,281,479 | |||||||||||||||
|
All other expenses - Net of expense reimbursement |
38,180,644 | 30,821,164 | 31,432,395 | 28,738,825 | 10,605,743 | |||||||||||||||
|
Net investment income |
(2,473,081 | ) | 32,081,902 | 46,728,786 | 52,503,470 | 59,964,472 | ||||||||||||||
|
Unrealized appreciation/(depreciation) on total investments |
23,240,858 | (33,939,196 | ) | (17,544,964 | ) | (13,935,972 | ) | 22,484,721 | ||||||||||||
|
Net realized gain/(loss) on total investments |
(73,884,623 | ) | (27,723,609 | ) | (57,661,458 | ) | (26,062,342 | ) | (13,120,398 | ) | ||||||||||
|
Net increase/(decrease) in net assets resulting from operations |
(53,116,846 | ) | (29,580,903 | ) | (28,477,636 | ) | 12,505,156 | 69,328,795 | ||||||||||||
|
Per share data:(1) |
||||||||||||||||||||
|
Net asset value per common share at year end |
$ | 5.12 | $ | 5.78 | $ | 6.72 | $ | 7.66 | $ | 8.17 | ||||||||||
|
Net investment income/(loss) |
(0.02 | ) | 0.32 | 0.48 | 0.55 | 0.66 | ||||||||||||||
|
Net realized gains/(losses) on total investments |
(0.72 | ) | (0.28 | ) | (0.59 | ) | (0.27 | ) | (0.15 | ) | ||||||||||
|
Net unrealized appreciation/(depreciation) on total investments |
0.23 | (0.34 | ) | (0.18 | ) | (0.14 | ) | 0.25 | ||||||||||||
|
Net increase/decrease in net assets resulting from operations |
(0.52 | ) | (0.30 | ) | (0.29 | ) | 0.14 | 0.76 | ||||||||||||
|
Distributions declared (2) |
0.14 | 0.64 | 0.64 | 0.64 | 0.76 | |||||||||||||||
|
Issuance of common stock (3) |
— | — | (0.01 | ) | (0.01 | ) | 0.01 | |||||||||||||
|
Balance Sheet data at year end: |
||||||||||||||||||||
|
Total investment portfolio at fair value |
$ | 603,986,480 | $ | 675,623,930 | $ | 923,480,762 | $ | 1,064,109,090 | $ | 983,144,322 | ||||||||||
| Cash collateral on total return swap | — | — | 27,000,000 | 48,000,000 | 79,620,942 | |||||||||||||||
|
Total investments |
603,986,480 | 675,623,930 | 950,480,762 | 1,112,109,090 | 1,062,765,264 | |||||||||||||||
|
Cash and cash equivalents |
65,301,216 | 225,316,656 | 59,481,495 | 64,909,759 | 99,400,794 | |||||||||||||||
|
Other assets |
8,420,346 | 24,942,469 | 19,669,393 | (147,387,199 | ) | 21,565,190 | ||||||||||||||
|
Total assets |
677,708,042 | 925,883,055 | 1,029,631,650 | 1,029,631,650 | 1,183,731,248 | |||||||||||||||
|
Total liabilities |
151,967,103 | 334,820,334 | 367,551,451 | 447,966,265 | 410,618,161 | |||||||||||||||
|
Total net assets |
525,740,939 | 591,062,721 | 662,080,199 | 581,665,385 | 773,113,087 | |||||||||||||||
|
Other data (unaudited): |
||||||||||||||||||||
|
Weighted average yield on total investments (4) |
9.5 | % | 10.9 | % | 10.8 | % | 9.9 | % | 10.4 | % | ||||||||||
|
Number of companies in investment portfolio at year end |
83 | 84 | 95 | 115 | 99 | |||||||||||||||
| (1) |
The per share data was derived by using the weighted average shares outstanding during the years ended December 31, 2020, 2019, 2018, 2017, and 2016, which were 102,744,642 100,582,788, 97,404,685, 96,248,024 and 90,424,090, respectively. |
|
(2) |
The per share data for distributions reflects the actual amount of distributions paid per share during the applicable period. |
|
(3) |
Shares issued under the distribution reinvestment plan as well as the continuance issuance of shares of common stock may cause an incremental increase/decrease in net asset value per share due to the effect of issuing shares at amounts that differ from the prevailing net asset value at each issuance. |
|
(4) |
The weighted average yield represents amortized total investments yield to maturity including the yield of cash collateral on the total return swap. |
Item 7. Management’s Discussion and Analysis of Financial Condition and Results of Operations.
The following discussion and analysis should be read in conjunction with our financial statements and related notes and other financial information appearing elsewhere in this annual report on Form 10-K. Except as otherwise specified, references to “we,” “us,” “our,” or the “Company,” refers to Sierra Income Corporation. “SIC Advisors” or “Adviser” refers to SIC Advisors LLC, our investment adviser. SIC Advisors is a wholly owned subsidiary of Medley LLC, which is controlled by Medley Management Inc., a publicly traded asset management firm ("MDLY"), which in turn is controlled by Medley Group LLC, an entity wholly-owned by the senior professionals of Medley LLC. “Medley” refers, collectively, to the activities and operations of Medley Capital LLC, Medley LLC, MDLY, Medley Group LLC, SIC Advisors, associated investment funds and their respective affiliates.
Some of the statements in this annual report on Form 10-K constitute forward-looking statements, which relate to future events or our performance or financial condition. The forward-looking statements contained in this annual report on Form 10-K involve risks and uncertainties, including, but not limited to, statements as to:
|
● |
our future operating results; |
|
● |
our business prospects and the prospects of our portfolio companies; |
|
● |
changes in laws and regulations, changes in political, economic or industry conditions, and changes in the interest rate environment or other conditions affecting the financial and capital markets, including with respect to changes resulting from or in response to, or potentially even the absence of changes as a result of, the impact of the COVID-19 pandemic; |
|
● |
risks associated with possible disruptions in our operations or the economy generally including the current economic downturn as a result of the impact of the COVID-19 pandemic; |
|
● |
the risk that, if the current period of capital markets disruption and instability continues for an extended period of time, that our stockholders may not receive distributions, if any, or at historical levels and that a portion of our distribution in the future may be a return of capital; |
|
● |
the effect of investments that we expect to make; |
|
● |
our contractual arrangements and relationships with third parties; |
|
● |
actual and potential conflicts of interest with SIC Advisors and its affiliates; |
|
● |
the dependence of our future success on the general economy and its effect on the industries in which we invest; |
|
● |
the ability of our portfolio companies to achieve their objectives; |
|
● |
the use of borrowed money to finance a portion of our investments; |
|
● |
the adequacy of our financing sources and working capital; |
|
● |
the timing of cash flows, if any, from the operations of our portfolio companies; |
|
● |
the ability of SIC Advisors to locate suitable investments for us and to monitor and administer our investments; |
|
● |
the ability of SIC Advisors and its affiliates to attract and retain highly talented professionals; |
|
● |
our ability to maintain our qualification as a RIC and as a BDC; |
|
● |
uncertainties associated with the impact from the COVID-19 pandemic, including: its impact on the global and U.S. capital markets, and the global and U.S. economy; the length and duration of the COVID-19 outbreak in the United States as well as worldwide and the magnitude of the economic impact of that outbreak; the effect of the COVID-19 pandemic on our business prospects and the operational and financial performance of our portfolio companies, including our and their ability to achieve their respective objectives; the effect of the disruptions caused by the COVID-19 pandemic on our ability to continue to effectively manage our business and our use of borrowed money to finance a portion of our investments; and |
|
● |
the impact of the termination of the Amended MCC Merger Agreement (as defined below) and the Amended MDLY Merger Agreement (as defined below) on our business, financial results, and ability to pay dividends and distributions, if any, to our stockholders. |
Such forward-looking statements may include statements preceded by, followed by or that otherwise include the words “trend,” “opportunity,” “pipeline,” “believe,” “comfortable,” “expect,” “anticipate,” “current,” “intention,” “estimate,” “position,” “assume,” “potential,” “outlook,” “continue,” “remain,” “maintain,” “sustain,” “seek,” “achieve,” and similar expressions, or future or conditional verbs such as “will,” “would,” “should,” “could,” “may,” or similar expressions. The forward-looking statements contained in this annual report involve risks and uncertainties. Our actual results could differ materially from those implied or expressed in the forward-looking statements for any reason, including due to the factors set forth in “Risk Factors” and elsewhere in this annual report on Form 10-K.
We have based the forward-looking statements included in this report on information available to us on the date of this report, and we assume no obligation to update any such forward-looking statements. Actual results could differ materially from those anticipated in our forward-looking statements, and future results could differ materially from historical performance. Although we undertake no obligation to revise or update any forward-looking statements, whether as a result of new information, future events or otherwise, you are advised to consult any additional disclosures that we may make directly to you or through reports that we have filed or in the future may file with the SEC, including quarterly reports on Form 10-Q, annual reports on Form 10-K, and current reports on Form 8-K.
COVID-19 Developments
On March 11, 2020, the World Health Organization declared the novel coronavirus (“COVID-19”) as a pandemic, and, on March 13, 2020, the United States declared a national emergency with respect to COVID-19. The outbreak of COVID-19 has severely impacted global economic activity and caused significant volatility and negative pressure in financial markets. The global impact of the COVID-19 outbreak has been rapidly evolving and has led to, and for an unknown period of time will continue to lead to, disruptions in local, regional, national and global markets and economies affected thereby, including the United States. The COVID-19 pandemic and restrictive measures taken to contain or mitigate its spread have caused, and are continuing to cause, business shutdowns, or the re-introduction of business shutdowns, cancellations of events and restrictions on travel, significant reductions in demand for certain goods and services, reductions in business activity and financial transactions, supply chain interruptions and overall economic and financial market instability both globally and in the United States. In addition, although the U.S. Food and Drug Administration authorized vaccines for emergency use starting in December 2020, it remains unclear how quickly the vaccines will be distributed nationwide and globally or when “herd immunity” will be achieved and the restrictions that were imposed to slow the spread of the virus will be lifted entirely. The delay in distributing the vaccines could lead people to continue to self-isolate and not participate in the economy at pre-pandemic levels for a prolonged period of time. Even after the COVID-19 pandemic subsides, the U.S. economy and most other major global economies may continue to experience a recession, and we anticipate our business and operations could be materially adversely affected by a prolonged recession in the United States and other major markets.
We have been closely monitoring, and will continue to monitor, the COVID-19 pandemic and its impact on all aspects of our business, including how it has, an impact our portfolio companies, employees, due diligence and underwriting processes, and financial markets. In addition, as a result of the adverse effects of the COVID-19 pandemic and the related disruption and financial distress, certain portfolio companies may seek to modify their loans from us, which could reduce the amount or extend the time for payment of principal, reduce the rate or extend the time of payment of interest, and/or increase the amount of PIK interest we receive with respect to such investment, among other things. The effects of the COVID-19 pandemic have also impeded, and may continue to impede, the ability of certain of our portfolio companies to raise additional capital and/or pursue asset sales or otherwise execute strategic transactions, which could have a material adverse effect on the valuation of our investments in such companies. Portfolio companies operating in certain industries may be more susceptible to these risks than other portfolio companies in other industries in light of the effects of the COVID-19 pandemic. Given the rapid development and fluidity of this situation, we cannot estimate the long-term impact of COVID-19 on our business, future results of operations, financial position or cash flows at this time. Further, the operational and financial performance of the portfolio companies in which we make investments may be significantly impacted by COVID-19, which may in turn impact the valuation of our investments. We believe our portfolio companies have taken, and continue to take, immediate actions to effectively and efficiently respond to the challenges posed by COVID-19 and related orders imposed by state and local governments, including developing liquidity plans supported by internal cash reserves, shareholder support, and, as appropriate, accessing their ability to participate in the government Paycheck Protection Program, including the second draw Paycheck Protection Program loans. The extent to which our operations may be impacted by the COVID-19 pandemic will depend largely on future developments, which are highly uncertain and cannot be accurately predicted, including guidance from U.S. and international authorities, including federal, state and local public health authorities. Furthermore, the impacts of a potential worsening of global economic conditions and the continued disruptions to and volatility in the financial markets remain unknown. COVID-19 presents material uncertainty and risks with respect to the underlying value of the Company’s portfolio companies, the Company’s business, financial condition, results of operations and cash flows, such as the potential negative impact to financing arrangements, increased costs of operations, changes in law and/or regulation, and uncertainty regarding government and regulatory policy.
We have evaluated subsequent events from December 31, 2020 through the filing date of this annual report on Form 10-K. However, as the discussion in this Item 7. Management’s Discussion and Analysis of Financial Condition and Results of Operations relates to the Company’s financial statements for the year end December 31, 2020, the analysis contained herein may not fully account for impacts relating to the COVID-19 pandemic. In that regard, for example, as of December 31, 2020, the Company valued its portfolio investments in conformity with U.S. GAAP based on the facts and circumstances known by the Company at that time, or reasonably expected to be known at that time. Due to the overall volatility that the COVID-19 pandemic has caused during the months that followed our December 31, 2020 valuation, any valuations conducted now or in the future in conformity with U.S. GAAP could result in a lower fair value of our portfolio. The impact to our results going forward will depend to a large extent on future developments and new information that may emerge regarding the duration of COVID-19 and the actions taken by authorities and other entities to contain the coronavirus or treat its impact, all of which are beyond our control. Accordingly, the Company cannot predict the extent to which its financial condition and results of operations will be affected at this time.
Overview
We are an externally managed non-diversified closed-end management investment company that has elected to be treated as a BDC under the 1940 Act. We are externally managed by SIC Advisors, which is an investment adviser registered with the SEC under the Advisers Act. SIC Advisors is responsible for sourcing potential investments, conducting due diligence on prospective investments, analyzing investment opportunities, structuring investments and monitoring our portfolio on an ongoing basis. In addition, we have elected, and intend to qualify annually to be treated, for U.S. federal income tax purposes, as a RIC under Subchapter M of the Code.
Under our Investment Advisory Agreement, we pay SIC Advisors a base management fee as well as an incentive fee based on our investment performance. Also, under the Administration Agreement, we reimburse Medley for the allocable portion of overhead and other expenses incurred by Medley Capital LLC in performing its obligations under the Administration Agreement, including our allocable portion of the costs of compensation and related expenses of our Chief Compliance Officer, Chief Financial Officer and their respective staffs.
We intend to meet our investment objective by primarily lending to, and investing in, the debt of privately owned U.S. middle market companies, which we define as companies with annual revenue between $50 million and $1 billion. We intend to focus primarily on making investments in first lien senior secured debt, second lien secured debt, and to a lesser extent, subordinated debt, of middle market companies in a broad range of industries. We expect that the majority of our debt investments will bear interest at floating interest rates, but our portfolio may also include fixed-rate investments. We will originate transactions sourced through SIC Advisors’ existing network, and, to a lesser extent, expect to acquire debt securities through the secondary market. We may make equity investments in companies that we believe will generate appropriate risk adjusted returns, although we do not expect such investments to be a substantial portion of our portfolio.
The level of our investment activity depends on many factors, including the amount of debt and equity capital available to prospective portfolio companies, the level of merger, acquisition and refinancing activity for such portfolio companies, the availability of credit to finance transactions, the general economic environment and the competitive environment for the types of investments we make. Based on prevailing market conditions, we anticipate that we will invest the proceeds from each subscription closing generally within 30-90 days. The precise timing will depend on the availability of investment opportunities that are consistent with our investment objectives and strategies.
As a BDC, we are required to comply with certain regulatory requirements. For instance, we generally have to invest at least 70% of our total assets in “qualifying assets,” including securities of private or thinly traded public U.S. companies, cash, cash equivalents, U.S. government securities and high-quality debt investments that mature in one year or less. In addition, we are only allowed to borrow money such that our asset coverage, as defined in the 1940 Act, equals at least 200% (or 150% if certain requirements under the 1940 Act are met) after such borrowing, with certain limited exceptions. To maintain our RIC tax treatment, we must meet specified source-of-income and asset diversification requirements. To be eligible for RIC tax treatment under Subchapter M for U.S. federal income tax purposes, we must distribute at least 90% of our net ordinary income and realized net short-term capital gains in excess of realized net long-term capital losses, if any, for the taxable year.
Termination of the Agreements and Plan of Mergers
On July 29, 2019, the Company entered into the Amended and Restated Agreement and Plan of Merger, dated as of July 29, 2019 (the “Amended MCC Merger Agreement”), by and between Medley Capital Corporation (“MCC”) and the Company, pursuant to which MCC would, on the terms and subject to the conditions set forth in the Amended MCC Merger Agreement, merge with and into the Company, with the Company as the surviving company in the merger (the “MCC Merger”). In addition, on July 29, 2019, the Company entered into the Amended and Restated Agreement and Plan of Merger, dated as of July 29, 2019 (the “Amended MDLY Merger Agreement”), by and among MDLY, the Company, and Sierra Management, Inc., a wholly owned subsidiary of the Company (“Merger Sub”), MDLY would, on the terms and subject to the conditions set forth in the Amended MDLY Merger Agreement, merge with and into Merger Sub, with Merger Sub as the surviving company in the merger (the “MDLY Merger” together with the MCC Merger, the “Proposed Mergers”).
Section 9.1(c) of the Amended MCC Merger Agreement and Section 9.1(c) of the Amended MDLY Merger Agreement each permits the Company and either MCC or MDLY, as applicable, to terminate the Amended MCC Merger Agreement and the Amended MDLY Merger Agreement, respectively, if the MCC Merger or the MDLY Merger, as applicable, has not been consummated on or before March 31, 2020 (the “Outside Date”). On May 1, 2020, the Company terminated both the Amended MCC Merger Agreement and the Amended MDLY Merger Agreement effective as of May 1, 2020 as the Outside Date had passed and neither the MCC Merger or the MDLY Merger had been consummated. In determining to terminate the Amended MCC Merger Agreement and the Amended MDLY Merger Agreement, the Company considered a number of factors, including, among other factors, changes in the relative valuations of the Company, MCC, and MDLY, the changed circumstances and the unpredictable economic conditions resulting from the global health crisis caused by the coronavirus (COVID-19) pandemic, and the uncertainty regarding the parties’ ability to satisfy the conditions to closing in a timely manner.
Revenues
We generate revenue in the form of interest on the debt securities that we hold and distributions and capital gains on other interests that we acquire in our portfolio companies. We expect that the senior debt we invest in will generally have stated terms of three to ten years and that the subordinated debt we invest in will generally have stated terms of five to ten years. Our senior and subordinated debt investments bear interest at a fixed or floating rate. Interest on debt securities is generally payable monthly, quarterly or semiannually. In addition, some of our investments provide for deferred interest payments or PIK interest. The principal amount of the debt securities and any accrued but unpaid interest generally will become due at the maturity date. In addition, we may generate revenue in the form of commitment and other fees in connection with transactions. OIDs and market discounts or premiums will be capitalized, and we will accrete or amortize such amounts as interest income. We will record prepayment premiums on loans and debt securities as fee income. Dividend income, if any, will be recognized on an accrual basis to the extent that we expect to collect such amounts.
Expenses
Our primary annual operating expenses consist of the payment of advisory fees and the reimbursement of expenses under our Investment Advisory Agreement with SIC Advisors and our Administration Agreement with Medley Capital LLC. We bear other expenses, which include, among other things:
|
• |
corporate, organizational and offering expenses relating to offerings of our common stock, subject to limitations included in our Investment Advisory Agreement; |
|
• |
the cost of calculating our NAV, including the related fees and cost of any third-party valuation services; |
|
• |
the cost of effecting sales and repurchases of shares of our common stock and other securities; |
|
• |
fees payable to third parties relating to, or associated with, monitoring our financial and legal affairs, making investments, and valuing investments, including fees and expenses associated with performing due diligence reviews of prospective investments; |
|
• |
interest payable on debt, if any, incurred to finance our investments; |
|
• |
transfer agent and custodial fees; |
|
• |
fees and expenses associated with marketing efforts subject to limitations included in the Investment Advisory Agreement; |
|
• |
federal and state registration fees and any stock exchange listing fees; |
|
• |
federal, state and local taxes; |
|
• |
independent directors’ fees and expenses, including travel expenses; |
|
• |
costs of director and stockholder meetings, proxy statements, stockholders’ reports and notices; |
|
• |
costs of fidelity bonds, directors and officers/errors and omissions liability insurance and other types of insurance; |
|
• |
direct costs, including those relating to printing of stockholder reports and advertising or sales materials, mailing, long distance telephone and staff subject to limitations included in the Investment Advisory Agreement; |
|
• |
fees and expenses associated with independent audits and outside legal costs, including compliance with the Sarbanes-Oxley Act of 2002, the 1940 Act and applicable federal and state securities laws; |
|
• |
brokerage commissions for our investments; |
|
• |
all other expenses incurred by us or SIC Advisors in connection with administering our investment portfolio, including expenses incurred by SIC Advisors in performing certain of its obligations under the Investment Advisory Agreement; and |
|
• |
the reimbursement of the compensation of our Chief Financial Officer and Chief Compliance Officer and their respective staffs, whose compensation is paid by Medley Capital LLC, to the extent that each such reimbursement amount is annually approved by our independent director committee and subject to the limitations included in our Administration Agreement. |
Administrative Services
We reimburse Medley Capital LLC for the administrative expenses necessary for its performance of services to us. However, such reimbursement is made at an amount equal to the lower of Medley Capital LLC’s actual costs or the amount that we would be required to pay for comparable administrative services in the same geographic location. Also, such costs will be reasonably allocated to us on the basis of assets, revenues, time records or other reasonable methods. We will not reimburse Medley Capital LLC for any services for which it receives a separate fee or for rent, depreciation, utilities, capital equipment or other administrative items allocated to a controlling person of Medley Capital LLC.
Portfolio and Investment Activity
The following table shows the amortized cost and the fair value of our investment portfolio as of December 31, 2020:
|
Amortized Cost |
Percentage |
Fair Value |
Percentage |
|||||||||||||
|
Senior secured first lien term loans |
$ | 369,385,810 | 52.7 | % | $ | 315,490,601 | 52.3 | % | ||||||||
|
Senior secured second lien term loans |
103,081,287 | 14.7 | % | 93,794,917 | 15.5 | % | ||||||||||
|
Senior secured first lien notes |
8,473,750 | 1.2 | % | 8,548,755 | 1.4 | % | ||||||||||
|
Subordinated notes |
65,561,840 | 9.4 | % | 50,039,500 | 8.3 | % | ||||||||||
|
Sierra Senior Loan Strategy JV I LLC |
110,050,000 | 15.7 | % | 81,788,964 | 13.5 | % | ||||||||||
|
Equity/warrants |
44,451,252 | 6.3 | % | 54,323,743 | 9.0 | % | ||||||||||
|
Total |
$ | 701,003,939 | 100.0 | % | $ | 603,986,480 | 100.0 | % | ||||||||
As of December 31, 2020, our investment portfolio consisted of investments in 83 portfolio companies with a fair value of $604.0 million.
As of December 31, 2020, our income-bearing investment portfolio, which represented 87.2% of our total portfolio, had a weighted average yield based upon the cost of our portfolio investments of approximately 8.0%, and 3.50% of our income-bearing portfolio bore interest based on fixed rates, and 96.50% of our income-bearing portfolio bore interest at floating rates, such as LIBOR.
For the year ended December 31, 2020, we invested $79.0 million of principal in directly originated transactions across 15 portfolio companies and $54.2 million of principal in syndicated transactions across 15 portfolio companies. As of December 31, 2020, the investment portfolio was comprised of $541.1 million of principal in directly originated transactions across 67 portfolio companies and $62.9 million of principal in syndicated transactions across 16 portfolio companies.
The following table shows the amortized cost and the fair value of our investment portfolio as of December 31, 2019:
|
Amortized Cost |
Percentage |
Fair Value |
Percentage |
|||||||||||||
|
Senior secured first lien term loans |
$ | 382,580,269 | 48.0 | % | $ | 328,816,197 | 48.7 | % | ||||||||
|
Senior secured second lien term loans |
157,794,323 | 19.8 | 122,817,885 | 18.2 | ||||||||||||
|
Senior secured first lien notes |
15,217,625 | 1.9 | 14,354,825 | 2.1 | ||||||||||||
|
Subordinated notes |
70,422,851 | 8.8 | 63,021,420 | 9.3 | ||||||||||||
|
Sierra Senior Loan Strategy JV I LLC |
92,050,000 | 11.5 | 68,434,389 | 10.1 | ||||||||||||
|
Equity/warrants |
79,968,093 | 10.0 | 78,179,214 | 11.6 | ||||||||||||
|
Total |
$ | 798,033,161 | 100.0 | % | $ | 675,623,930 | 100.0 | % | ||||||||
As of December 31, 2019, our investment portfolio consisted of investments in 84 portfolio companies with a fair value of $675.6 million.
As of December 31, 2019, our income-bearing investment portfolio, which represented 87.2% of our total portfolio, had a weighted average yield based upon the cost of our investment portfolio of approximately 9.6%, and 4.5% of our income-bearing portfolio bore interest based on fixed rates, while 95.5% of our income-bearing portfolio bore interest at floating rates, such as LIBOR.
For the year ended December 31, 2019, we invested $107.5 million of principal in directly originated transactions across 24 portfolio companies and $60.3 million of principal in syndicated transactions across 14 portfolio companies. As of December 31, 2019, the investment portfolio was comprised of $634.5 million of principal in directly originated transactions across 62 portfolio companies and $131.1 million of principal in syndicated transactions across 22 portfolio companies.
The following table shows weighted average current yield to maturity based on fair value as of December 31, 2020 and 2019:
|
December 31, 2020 |
December 31, 2019 |
|||||||||||||||
|
Percentage of Total Investments |
Weighted Average Current Yield for Total Investments |
Percentage of Total Investments |
Weighted Average Current Yield for Total Investments |
|||||||||||||
|
Senior secured first lien term loans |
52.7 | % | 9.3 | % | 48.7 | % | 10.4 | % | ||||||||
|
Senior secured first lien notes |
1.2 | % | 11.0 | % | 2.1 | 11.0 | ||||||||||
|
Senior secured second lien term loans |
14.7 | % | 10.9 | % | 18.2 | 29.6 | ||||||||||
|
Subordinated notes |
9.4 | % | 8.8 | % | 9.3 | 10.8 | ||||||||||
|
Sierra Senior Loan Strategy JV I LLC |
15.7 | % | 9.0 | % | 10.1 | 9.6 | ||||||||||
|
Equity/warrants |
6.3 | % | 6.0 | % | 11.6 | 9.7 | ||||||||||
|
Total |
100.0 | % | 9.5 | % | 100.0 | % | 10.9 | % | ||||||||
|
(1) |
The weighted average current yield for total investments does not represent the total return to our stockholders. |
The following table shows the portfolio composition by industry classification, based on fair value at December 31, 2020:
|
Amortized Cost |
Percentage |
Fair Value |
Percentage |
|||||||||||||
|
Multi-Sector Holdings |
$ | 174,660,001 | 24.9 | % | $ | 131,792,864 | 21.8 | % | ||||||||
|
Services: Business |
79,260,551 | 11.3 | % | 73,716,395 | 12.2 | % | ||||||||||
|
High Tech Industries |
75,519,344 | 10.8 | % | 71,792,022 | 11.9 | % | ||||||||||
|
Healthcare & Pharmaceuticals |
68,599,968 | 9.8 | % | 58,275,198 | 9.6 | % | ||||||||||
|
Consumer Goods: Durable |
32,045,028 | 4.6 | % | 41,016,292 | 6.8 | % | ||||||||||
|
Construction & Building |
42,928,750 | 6.1 | % | 38,356,358 | 6.4 | % | ||||||||||
|
Banking, Finance, Insurance & Real Estate |
27,848,664 | 4.0 | % | 37,620,161 | 6.2 | % | ||||||||||
|
Aerospace & Defense |
33,558,896 | 4.8 | % | 29,723,725 | 4.9 | % | ||||||||||
|
Hotel, Gaming & Leisure |
36,326,705 | 5.2 | % | 24,013,769 | 4.0 | % | ||||||||||
|
Automotive |
18,886,756 | 2.7 | % | 17,404,476 | 2.9 | % | ||||||||||
|
Containers, Packaging & Glass |
15,206,840 | 2.2 | % | 15,120,424 | 2.5 | % | ||||||||||
|
Environmental Industries |
5,041,430 | 0.7 | % | 10,052,691 | 1.7 | % | ||||||||||
|
Services: Consumer |
9,700,000 | 1.4 | % | 9,725,000 | 1.6 | % | ||||||||||
|
Chemicals, Plastics & Rubber |
10,060,861 | 1.4 | % | 9,063,498 | 1.5 | % | ||||||||||
|
Forest Products & Paper |
6,477,887 | 0.9 | % | 7,770,704 | 1.3 | % | ||||||||||
|
Media: Diversified & Production |
15,474,145 | 2.2 | % | 6,780,000 | 1.1 | % | ||||||||||
|
Transportation: Cargo |
6,877,294 | 1.0 | % | 6,770,781 | 1.1 | % | ||||||||||
|
Transportation: Consumer |
7,975,416 | 1.1 | % | 6,068,082 | 1.0 | % | ||||||||||
|
Metals & Mining |
3,492,436 | 0.5 | % | 3,492,479 | 0.6 | % | ||||||||||
|
Energy: Oil & Gas |
20,868,832 | 3.0 | % | 2,625,018 | 0.4 | % | ||||||||||
|
Wholesale |
2,212,919 | 0.3 | % | 1,746,044 | 0.3 | % | ||||||||||
|
Retail |
7,934,347 | 1.1 | % | 1,012,358 | 0.2 | % | ||||||||||
|
Beverage & Food |
46,869 | 0.0 | % | 48,141 | 0.0 | % | ||||||||||
|
Total |
$ | 701,003,939 | 100.0 | % | $ | 603,986,480 | 100.0 | % | ||||||||
The following table shows the portfolio composition by industry classification, including the total return swap ("TRS") underlying loans, based on fair value as of December 31, 2019:
|
Amortized Cost |
Percentage |
Fair Value |
Percentage |
|||||||||||||
|
Multi-Sector Holdings |
$ | 161,308,341 | 20.2 | % | $ | 130,278,650 | 19.2 | % | ||||||||
|
High Tech Industries |
86,735,849 | 10.8 | 81,531,661 | 12.1 | ||||||||||||
|
Services: Business |
131,560,449 | 16.5 | 81,285,736 | 12.0 | ||||||||||||
|
Healthcare & Pharmaceuticals |
59,511,718 | 7.5 | 57,374,851 | 8.5 | ||||||||||||
|
Banking, Finance, Insurance & Real Estate |
45,286,982 | 5.7 | 52,049,297 | 7.7 | ||||||||||||
|
Construction & Building |
42,797,402 | 5.4 | 39,865,739 | 5.9 | ||||||||||||
|
Wholesale |
34,519,910 | 4.3 | 35,186,289 | 5.2 | ||||||||||||
|
Aerospace & Defense |
34,876,226 | 4.4 | 34,475,020 | 5.1 | ||||||||||||
|
Consumer Goods: Durable |
21,962,500 | 2.8 | 24,214,089 | 3.6 | ||||||||||||
|
Hotel, Gaming & Leisure |
21,373,829 | 2.7 | 21,365,163 | 3.2 | ||||||||||||
|
Automotive |
22,312,149 | 2.8 | 19,861,655 | 2.9 | ||||||||||||
|
Containers, Packaging & Glass |
16,263,768 | 2.0 | 15,655,179 | 2.3 | ||||||||||||
|
Transportation: Cargo |
12,734,167 | 1.6 | 12,771,231 | 1.9 | ||||||||||||
|
Energy: Oil & Gas |
21,692,260 | 2.7 | 10,007,469 | 1.5 | ||||||||||||
|
Chemicals, Plastics & Rubber |
10,090,722 | 1.3 | 9,505,614 | 1.4 | ||||||||||||
|
Media: Diversified & Production |
14,279,258 | 1.8 | 9,493,583 | 1.4 | ||||||||||||
|
Forest Products & Paper |
6,455,137 | 0.8 | 7,182,914 | 1.1 | ||||||||||||
|
Transportation: Consumer |
6,966,133 | 0.9 | 6,877,180 | 1.0 | ||||||||||||
|
Capital Equipment |
6,778,258 | 0.8 | 6,537,927 | 1.0 | ||||||||||||
|
Environmental Industries |
5,021,241 | 0.6 | 6,414,400 | 0.9 | ||||||||||||
|
Consumer Goods: Non-durable |
4,912,500 | 0.6 | 4,721,895 | 0.7 | ||||||||||||
|
Metals & Mining |
3,257,979 | 0.4 | 3,258,022 | 0.5 | ||||||||||||
|
Media: Broadcasting & Subscription |
10,408,142 | 1.3 | 2,163,218 | 0.3 | ||||||||||||
|
Retail |
8,304,830 | 1.0 | 1,846,648 | 0.3 | ||||||||||||
|
Media: Advertising, Printing & Publishing |
8,623,411 | 1.1 | 1,700,500 | 0.3 | ||||||||||||
|
Total |
$ | 798,033,161 | 100.0 | % | $ | 675,623,930 | 100.0 | % | ||||||||
|
(1) |
Does not include TRS underlying loans |
SIC Advisors regularly assesses the risk profile of our portfolio investments and rates each of them based on the categories set forth below, which we refer to as SIC Advisors’ investment credit rating. Investment credit ratings are assigned to each of the investments in our portfolio that are directly held by the Company, but exclude any off-balance sheet interests of the Company.
|
Investment Credit Rating |
Definition |
|
1 |
Investments that are performing above expectations. |
|
|
|
|
2 |
Investments that are performing within expectations, with risks that are neutral or favorable compared to risks at the time of origination or purchase. All new loans are rated ‘2’. |
|
|
|
|
3 |
Investments that are performing below expectations and that require closer monitoring, but where no loss of interest, dividend or principal is expected. Companies rated ‘3’ may be out of compliance with financial covenants, however, loan payments are generally not past due. |
|
|
|
|
4 |
Investments that are performing below expectations and for which risk has increased materially since origination or purchase. Some loss of interest or dividend is expected, but no loss of principal. In addition to the borrower being generally out of compliance with debt covenants, loan payments may be past due (but generally not more than 180 days past due). |
|
|
|
|
5 |
Investments that are performing substantially below expectations and whose risks have increased substantially since origination or purchase. Most or all of the debt covenants are out of compliance and payments are substantially delinquent. Some loss of principal is expected. |
The following table shows the distribution of our investment portfolio, not including cash and cash equivalents, on the 1 to 5 investment credit rating scale at fair value as of December 31, 2020 and 2019:
|
December 31, 2020 |
December 31, 2019 |
|||||||||||||||
| Investment Credit Rating | Investments at Fair Value |
Percentage |
Investments at Fair Value |
Percentage |
||||||||||||
| 1 | $ | 51,481,987 | 8.5 | % | $ | 58,241,430 | 8.6 | % | ||||||||
| 2 | 410,310,087 | 67.9 | % | 455,613,817 | 67.5 | |||||||||||
| 3 | 110,668,216 | 18.3 | % | 144,141,977 | 21.3 | |||||||||||
| 4 | 13,500,546 | 2.3 | % | 7,187,740 | 1.1 | |||||||||||
| 5 | 18,025,644 | 3.0 | % | 10,438,966 | 1.5 | |||||||||||
|
Total |
$ | 603,986,480 | 100.0 | % | $ | 675,623,930 | 100.0 | % | ||||||||
Results of Operations
The following table shows operating results for the years ended December 31, 2020, 2019 and 2018:
|
2020 |
2019 |
2018 |
||||||||||
|
Total investment income |
$ | 47,893,107 | $ | 80,097,606 | $ | 97,172,641 | ||||||
|
Total expenses |
50,366,188 | 48,015,704 | 50,443,855 | |||||||||
|
Net investment income/(loss) |
(2,473,081 | ) | 32,081,902 | 46,728,786 | ||||||||
|
Net realized gain/(loss) from investments and total return swap |
(73,666,673 | ) | (27,723,609 | ) | (57,661,458 | ) | ||||||
|
Net change in unrealized appreciation/(depreciation) on investments and total return swap |
25,390,519 | (33,698,261 | ) | (17,836,419 | ) | |||||||
|
Change in provision for deferred taxes on unrealized (appreciation)/depreciation on investments |
(2,149,661 | ) | (240,935 | ) | 291,455 | |||||||
|
Loss on extinguishment of debt |
(217,950 | ) | — | — | ||||||||
|
Net increase/(decrease) in net assets resulting from operations |
$ | (53,116,846 | ) | $ | (29,580,903 | ) | $ | (28,477,636 | ) | |||
Investment Income
Total investment income decreased $32,204,499, or 40.2%, to $47,893,107 for the year ended December 31, 2020, compared to $80,097,606 for the year ended December 31, 2019. Total investment income consisted primarily of portfolio interest, which decreased $29,332,140, or 39.3%, to $45,251,944 for the year ended December 31, 2020, compared to $74,584,084 for the year ended December 31, 2019. This decrease was primarily due to a $189 million, or 24.4%, decrease in our average investment portfolio. Fee income decreased $2,802,932 or 69.4%, to $1,236,934 for the year ended December 31, 2020, compared to $4,039,866 for the year ended December 31, 2019, primarily due to a decrease in fees associated with loan originations and loan prepayments.
Total investment income decreased $17,075,035, or 17.6%, to $80,097,606 for the year ended December 31, 2019, compared to $97,172,641 for the year ended December 31, 2018. Total investment income consisted primarily of portfolio interest, which decreased $18,710,179, or 20.1%, to $74,584,084 for the year ended December 31, 2019, compared to $93,294,263 for the year ended December 31, 2018. This decrease was primarily due to a $191 million, or 19.2%, decrease in our average investment portfolio. Fee income increased $491,486, or 13.9%, to $4,039,866 for the year ended December 31, 2019, compared to $3,548,380 for the year ended December 31, 2018, primarily due to an increase in fees associated with loan originations and loan prepayments.
Operating Expenses
The following table shows operating expenses for the years ended December 31, 2020, 2019 and 2018:
|
2020 |
2019 |
2018 |
||||||||||
|
Base management fees |
$ | 12,185,544 | $ | 17,018,479 | $ | 19,011,460 | ||||||
|
Interest and financing expenses |
11,835,466 | 20,489,217 | 21,356,282 | |||||||||
|
Incentive fees |
— | 176,061 | — | |||||||||
|
General and administrative expenses |
12,363,215 | 5,885,448 | 5,034,100 | |||||||||
|
Administrator expenses |
2,231,015 | 2,538,480 | 2,699,176 | |||||||||
|
Offering costs |
38,846 | 43,987 | 633,317 | |||||||||
|
Professional fees |
11,712,102 | 1,864,032 | 1,709,520 | |||||||||
|
Total expenses |
$ | 50,366,188 | $ | 48,015,704 | $ | 50,443,855 | ||||||
Total expenses increased $2,350,484, or 4.9%, to $50,366,188 for the year ended December 31, 2020, as compared to $48,015,704 for the year ended December 31, 2019, primarily due to an increase in professional fees and general and administrative expenses related to deferred transaction costs (see Note 2), partially offset by a decrease in base management fees and a decrease in interest and financing expenses. Total expenses decreased $2,428,151, or 4.8%, to $48,015,704 for the year ended December 31, 2019, as compared to $50,443,855 for the year ended December 31, 2018, primarily due to a decrease in management fees.
Base management fees decreased $4,832,935, or 28.4%, to $12,185,544 for the year ended December 31, 2020, as compared to $17,018,479 for the year ended December 31, 2019, primarily due to a decrease in our average gross assets of $274 million, or 28.3%. Base management fees decreased $1,992,981, or 10.5%, to $17,018,479 for the year ended December 31, 2019, as compared to $19,011,460 for the year ended December 31, 2018, primarily due to a decrease in our average gross assets of $123 million, or 11.1%.
Interest and financing expenses decreased $8,653,751, or 42.2%, to $11,835,466 for the year ended December 31, 2020, as compared to $20,489,217 for the year ended December 31, 2019, primarily due to the wind-down and termination of the Company's senior secured syndicated revolving credit facility (the “ING Credit Facility” as amended from time to time as described below) from May 2020 through July 2020. Interest and financing expenses decreased $867,065, or 4.1%, to $20,489,217 for the year ended December 31, 2019, as compared to $21,356,282 for the year ended December 31, 2018, primarily due to a decrease in the weighted average interest on our credit facilities of 0.5%.
Net Realized Gains/Losses on Investments
We measure realized gains or losses by the difference between the net proceeds from the disposition and the amortized cost basis of an investment, without regard to unrealized gains or losses previously recognized.
During the years ended December 31, 2020, 2019 and 2018, we recognized net realized losses of $73,666,673, $27,723,609 and $57,661,458, on total investments, respectively, primarily due to the sale of investments, certain non-cash restructuring transactions and the wind-down of our TRS facility.
Net Unrealized Appreciation/Depreciation on Investments
Net change in unrealized appreciation/depreciation on investments reflects the net change in the fair value of our total investments including the TRS and provision for deferred taxes. For the year ended December 31, 2020 we recorded a net change in unrealized appreciation of $23,240,858. The unrealized appreciation resulted from the reversal of previously recorded unrealized depreciation on investments that were realized, partially sold, or written-off during the year, partially offset by net unrealized depreciation on the current portfolio. For the years ended December 31, 2019 and 2018, we recorded a net change in unrealized depreciation of $33,939,196 and $17,544,964 on total investments, respectively. The unrealized depreciation resulted from negative credit-related adjustments that caused a reduction in fair value of certain portfolio investments.
Changes in Net Assets from Operations
For the year ended December 31, 2020, we recorded a net decrease in net assets resulting from operations of $53,116,846 compared to a net decrease in net assets resulting from operations of $29,580,903 for the year ended December 31, 2019. Based on 102,744,642 and 100,582,788 weighted average common shares outstanding for the years ended December 31, 2020 and 2019, respectively, our per share net decrease in net assets resulting from operations was $0.52 for the year ended December 31, 2020 compared to a per share net decrease in net assets from operations of $0.29 for the year ended December 31, 2019.
For the year ended December 31, 2019, we recorded a net decrease in net assets resulting from operations of $29,580,903 compared to a net decrease in net assets resulting from operations of $28,477,636 for the year ended December 31, 2018. Based on 100,582,788 and 97,404,685 weighted average common shares outstanding for the years ended December 31, 2019 and 2018, respectively, our per share net decrease in net assets resulting from operations was $0.29 for the year ended December 31, 2019 compared to a per share net decrease in net assets from operations of $0.29, for the year ended December 31, 2018.
Financial Condition, Liquidity and Capital Resources
This “Liquidity and Capital Resources” section should be read in conjunction with “COVID-19 Developments” above and “Risk Factors” in Part I, Item 1A of this Annual Report on Form 10-K. As a BDC, we distribute substantially all of our net income to our stockholders and have an ongoing need to raise additional capital for investment purposes. To fund growth, we have a number of alternatives available to increase capital, including increasing debt and funding from operational cash flow.
Our liquidity and capital resources historically have been generated primarily from the net proceeds of our public offering of common stock, use of our credit facilities and our TRS. Currently, our primary source of liquidity derived from the use of our credit facility.
As of December 31, 2020 and 2019, we had $65.3 million and $225.3 million, respectively, in cash and cash equivalents. In the future, we may generate cash from future offerings of securities, future borrowings and cash flows from operations, including interest earned from the temporary investment of cash in U.S. government securities and other high-quality debt investments that mature in one year or less. Our primary use of funds is to make investments in our targeted asset classes, cash distributions to our stockholders, and other general corporate purposes.
In order to satisfy the Code requirements applicable to us as a RIC, we intend to distribute to our stockholders substantially all of our taxable income, but we may also elect to periodically spillover certain excess undistributed taxable income from one tax year into the next tax year. In addition, as a BDC, we generally are required to meet a coverage ratio of total assets to total senior securities, which include borrowings and any preferred stock we may issue in the future, of at least 200% (or 150% if certain requirements under the 1940 Act are met) at the time of the borrowing or issuance of preferred stock. This requirement limits the amount that we may borrow.
The following table shows our net borrowings as of December 31, 2020 and 2019:
|
December 31, 2020 |
December 31, 2019 |
|||||||||||||||||||||||
|
Total Commitment |
Balance Outstanding |
Unused Commitment |
Total Commitment |
Balance Outstanding |
Unused Commitment |
|||||||||||||||||||
|
ING Credit Facility |
$ | — | $ | — | $ | — | $ | 215,000,000 | $ | 88,100,000 | $ | 126,900,000 | ||||||||||||
|
Alpine Credit Facility |
180,000,000 | 145,000,000 | 35,000,000 | 300,000,000 | 240,000,000 | 60,000,000 | ||||||||||||||||||
|
Total before deferred financing costs |
180,000,000 | 145,000,000 | 35,000,000 | 515,000,000 | 328,100,000 | 186,900,000 | ||||||||||||||||||
|
Unamortized deferred financing costs |
— | (659,266 | ) | — | — | (2,235,279 | ) | — | ||||||||||||||||
|
Total borrowings outstanding, net deferred financing costs |
$ | 180,000,000 | $ | 144,340,734 | $ | 35,000,000 | $ | 515,000,000 | $ | 325,864,721 | $ | 186,900,000 | ||||||||||||
ING Credit Facility
On August 12, 2016, the Company amended its ING Credit Facility pursuant to a Senior Secured Revolving Credit Agreement (the “Revolving Credit Agreement” as amended from time to time as described below) with certain lenders party thereto from time to time and ING Capital LLC, as administrative agent. The ING Credit Facility was secured by substantially all of the Company’s assets, subject to certain exclusions as further set forth in an Amended and Restated Guarantee, Pledge and Security Agreement (the “Security Agreement”) entered into in connection with the Revolving Credit Agreement, among the Company, the subsidiary guarantors party thereto, ING Capital LLC, as Administrative Agent, each Financial Agent and Designated Indebtedness Holder party thereto and ING Capital LLC, as Collateral Agent. The ING Credit Facility also included usual and customary representations, covenants and events of default for senior secured revolving credit facilities of this nature.
On July 25, 2019, the Company entered into Amendment No. 2 to the Revolving Credit Agreement that among other things, (i) reduced the size of the commitments thereunder from $220.0 million to $215.0 million, (ii) extended the Revolver Termination Date (as defined in the Revolving Credit Agreement) from August 12, 2019 to March 31, 2020 and (iii) extended the Maturity Date (as defined in the Revolving Credit Agreement) from August 12, 2020 to March 31, 2021. On March 30, 2020, the Company entered into Amendment No. 3 to the Revolving Credit Agreement that among other things, extended the Revolver Termination Date from March 31, 2020 to April 30, 2020 after which the Revolving Credit Facility would enter amortization.
On May 15, 2020, the Company entered into Amendment No. 4 to the Revolving Credit Agreement to among other things, (i) shorten the maturity date from March 31, 2021 to September 30, 2020, (ii) accelerate the amortization of the Revolving Credit Agreement, and (iii) provide for the prepayment of the outstanding loans under the Revolving Credit Agreement in an aggregate principal amount of not less than $20 million. On July 22, 2020, the Company paid all remaining outstanding obligations under the Revolving Credit Agreement. On July 31, 2020 (the “Termination Date”), the Company terminated the commitments on the Credit Agreement. The repayment of the outstanding obligations under the Revolving Credit Agreement was accounted for as a debt extinguishment in accordance with ASC 470-50, Modifications and Extinguishments, which attributed to a realized loss of $217,950 and was recorded on the Consolidated Statements of Operations as a loss on extinguishment of debt.
The ING Credit Facility allowed for the Company, at its option, to borrow money at a rate of either (i) an alternate base rate plus 1.50% per annum or (ii) LIBOR plus 2.50% per annum. The interest rate margins were subject to certain step-downs upon the satisfaction of certain conditions described in the Revolving Credit Agreement. The alternate base rate was the greatest of (i) the U.S. Prime Rate set forth in the Wall Street Journal, (ii) the federal funds effective rate plus 1/2 of 1%, and (iii) three month LIBOR plus 1.00%. As of December 31, 2020, there were no commitments under the ING Credit Facility. As of December 31, 2019, the commitment under the ING Credit Facility was $215,000,000. Availability of loans under the ING Credit Facility was linked to the valuation of the collateral pursuant to a borrowing base mechanism.
The Company was also required to pay a commitment fee to the lenders based on the daily unused portion of the aggregate commitments under the ING Credit Facility. The commitment fee was (i) 1.50% if the used portion of the aggregate commitments is less than or equal to 40%, (ii) 0.75% if the used portion of the aggregate commitments is greater than 40% and less than or equal to 65% or (iii) 0.50% if the used portion of the aggregate commitments is greater than 65%. The ING Credit Facility provided that the Company may use the proceeds of the ING Credit Facility for general corporate purposes, including making investments in accordance with the Company’s investment objective and strategy.
Borrowings under the Revolving Credit Agreement were subject to, among other things, a minimum borrowing base. Substantially all of the Company’s assets were pledged as collateral under the Revolving Credit Agreement. The ING Credit Facility required the Company to, among other things (i) make representations and warranties regarding the collateral as well the Company’s business and operations, (ii) agree to certain indemnification obligations, and (iii) agree to comply with various affirmative and negative covenants. The documents for the Revolving Credit Agreement also included default provisions, such as the failure to make timely payments under the Revolving Credit Agreement, the occurrence of a change in control, and the failure by the Company to materially perform under the operative agreements governing the Revolving Credit Agreement, which, if not complied with, could have accelerated repayment under the Revolving Credit Agreement, thereby materially and adversely affecting the Company’s liquidity, financial condition and results of operations.
In connection with the security interest established under the Security Agreement, the Company, ING Capital LLC, in its capacity as collateral agent, and State Street Bank and Trust Company, in its capacity as the Company’s custodian, entered into a control agreement dated as of December 4, 2013, in order to, among other things, perfect the security interest granted pursuant to the Security Agreement in, and provide for control over, the related collateral. As a result of the termination of the Revolving Credit Agreement, the Security Agreement was terminated effective as of the Termination Date.
As of December 31, 2019, the carrying amount of the Company’s borrowings under the ING Credit Facility approximated their fair value. The fair value of the Company’s debt obligation was determined in accordance with ASC 820, which defines fair value in terms of the price that would be paid to transfer a liability in an orderly transaction between market participants at the measurement date under current market conditions. The fair value of the Company’s borrowings under the ING Credit Facility was estimated based upon market interest rates of the Company’s borrowings or entities with similar credit risk, adjusted for nonperformance risk, if any. As of December 31, 2019, certain unobservable inputs used to value the ING Credit Facility were deemed to be Level 3, as defined in Note 4.
Alpine Credit Facility
On September 29, 2017, the Company’s wholly-owned, special purpose financing subsidiary, Alpine, amended its existing revolving credit facility (the “Alpine Credit Facility”) pursuant to an Amended and Restated Loan Agreement (the “Loan Agreement”) with JPMorgan Chase Bank, National Association (“JPMorgan”), as administrative agent and lender, the Financing Providers from time to time party thereto, SIC Advisors, as the portfolio manager, and the Collateral Administrator, Collateral Agent and Securities Intermediary party thereto. The Loan Agreement was amended to, among other things, (i) extend the reinvestment period until December 29, 2020, (ii) extend the scheduled termination date until March 29, 2022, (iii) decrease the applicable margin for advances to 2.85% per annum and (iv) increase the compliance condition for net advances to 55% of net asset value. Alpine’s obligations to JPMorgan under the Alpine Credit Facility are secured by a first priority security interest in a significant portions of the assets of Alpine, including its portfolio of loans. The obligations of Alpine under the Alpine Credit Facility are non-recourse to the Company.
On November 18, 2020, Alpine entered into Amendment No.1 to the Loan Agreement to, among other things, (i) extend the reinvestment period from December 29, 2020 to May 18, 2021, (ii) increase the applicable margin for advances from 2.85% to 3.10% per annum, (iii) reduce the amount of maximum borrowings in an aggregate principal amount from $300,000,000 to $180,000,000 on a committed basis, (iv) require the Company to maintain a minimum a cash balance of $20,000,000 in Alpine, and (v) decrease the compliance condition for net advances from 55% to 52.5% of net asset value. The maturity date under the Loan Agreement did not change and therefore any amounts borrowed, as well as all accrued and unpaid interest thereunder, will be due and payable on March 29, 2022. In connection with the Amendment, the Company repaid $35,000,000 of the outstanding balance under the Loan Agreement on November 18, 2020, reducing the outstanding balance from $180,000,000 to $145,000,000.
The Alpine Credit Facility provides for borrowings in an aggregate principal amount up to $180,000,000 on a committed basis. Borrowings under the Alpine Credit Facility are subject to compliance with a NAV coverage ratio with respect to the current value of Alpine’s portfolio and various eligibility criteria must be satisfied with respect to the initial acquisition of each loan in Alpine’s portfolio.Pricing under the Alpine Credit Facility for each one month calculation period is based on LIBOR for an interest period of one month, plus a spread of 3.10% per annum. If LIBOR is unavailable, pricing will be determined at the prime rate offered by JPMorgan or the federal funds effective rate, plus a spread of 3.10% per annum. Interest is payable monthly in arrears. Alpine is also required to pay a commitment fee of 1.00% on the average daily unused amount of the financing commitments to the extent that $180,000,000 has not been borrowed. Borrowings of Alpine are considered borrowings of the Company for purposes of complying with the asset coverage requirements under the 1940 Act, applicable to BDCs.
Pursuant to a Sale and Contribution Agreement entered into between the Company and Alpine (the “Sale Agreement”) in connection with the Alpine Credit Facility, the Company may sell loans or contribute cash or loans to Alpine from time to time and will retain a residual interest in any assets contributed through its ownership of Alpine or will receive fair market value for any assets sold to Alpine. In certain circumstances the Company may be required to repurchase certain loans sold to Alpine. In addition to the acquisition of loans pursuant to the Sale Agreement, Alpine may purchase additional assets from various sources. Alpine has appointed SIC Advisors to manage its portfolio of assets pursuant to the terms of a Portfolio Management Agreement between SIC Advisors and Alpine.
As of December 31, 2020 and 2019, the carrying amount of the Company’s borrowings under the Alpine Credit Facility approximated the fair value of the Company’s debt obligation. The fair value of the Company’s debt obligation is determined in accordance with ASC 820, which defines fair value in terms of the price that would be paid to transfer a liability in an orderly transaction between market participants at the measurement date under current market conditions. The fair value of the Company’s borrowings under the Alpine Credit Facility is estimated based upon market interest rates of the Company’s borrowings or entities with similar credit risk, adjusted for nonperformance risk, if any. As of December 31, 2020 and 2019, the Alpine Credit Facility would be deemed to be Level 3, as defined in Note 4.
Contractual Obligations
The following table shows our payment obligations for repayment of debt, which total our contractual obligations at December 31, 2020:
|
Payment Due By Period |
||||||||||||||||||||
|
Total |
Less than 1 Year |
1 - 3 Years |
3 - 5 Years |
More than 5 Years |
||||||||||||||||
|
Alpine Credit Facility |
145,000,000 | — | 145,000,000 | — | — | |||||||||||||||
|
Total Contractual Obligations |
$ | 145,000,000 | $ | — | $ | 145,000,000 | $ | — | $ | — | ||||||||||
We have entered into certain contracts under which we have material future commitments. On April 5, 2012, we entered into the Investment Advisory Agreement with SIC Advisors in accordance with the 1940 Act. The Investment Advisory Agreement became effective as of April 17, 2012, the date that we met the minimum offering requirement. Pursuant to the 1940 Act, the initial term of the Investment Advisory Agreement was for two years from its effective date, with one-year renewals subject to approval by our board of directors, a majority of whom must be independent directors. Most recently, on April 3, 2020, the board of directors approved the renewal of the Investment Advisory Agreement for an additional one-year term at a board meeting. SIC Advisors serves as our investment adviser in accordance with the terms of the Investment Advisory Agreement. Payments under our Investment Advisory Agreement in each reporting period consist of (i) a management fee equal to a percentage of the value of our gross assets and (ii) an incentive fee based on our performance.
On April 5, 2012, we entered into the Administration Agreement with Medley Capital LLC with an initial term of two years, pursuant to which Medley Capital LLC furnishes us with administrative services necessary to conduct our day-to-day operations. The Administration Agreement became effective as of April 17, 2012, the date that we met the minimum offering requirement. Pursuant to its terms, and unless earlier terminated as described below, the Administration Agreement will remain in effect from year-to-year if approved annually by a majority of our directors who are not “interested persons” (as defined in Section 2(a)(19) of the 1940 Act) of the Company or Medley Capital LLC, and either the holders of a majority of our outstanding voting securities or our board of directors. Most recently, on April 3, 2020, the board of directors approved the renewal of the Administration Agreement for an additional one-year term at a board meeting. Medley Capital LLC is reimbursed for administrative expenses it incurs on our behalf in performing its obligations. Such costs are reasonably allocated to us on the basis of assets, revenues, time records or other reasonable methods. We do not reimburse Medley Capital LLC for any services for which it receives a separate fee or for rent, depreciation, utilities, capital equipment or other administrative items allocated to a controlling person of Medley Capital LLC.
If any of our contractual obligations discussed above are terminated, our costs may increase under any new agreements that we enter into as replacements. We would also likely incur expenses in locating alternative parties to provide the services we expect to receive under the Investment Advisory Agreement and the Administration Agreement. Any new investment advisory agreement would also be subject to approval by our stockholders.
Off-Balance Sheet Arrangements
On August 27, 2013, Arbor, a wholly-owned financing subsidiary of the Company, entered into a TRS with Citibank.
On September 29, 2017, Arbor entered into the Fifth Amended Confirmation Letter Agreement with Citibank. The Fifth Amended Confirmation Agreement reduced the maximum portfolio notional (determined at the time each such loan becomes subject to the TRS) from $300,000,000 to $180,000,000, through incremental reductions of $60,000,000 on October 3, 2017 and $20,000,000 on each of November 3, 2017, December 3, 2017 and January 3, 2018. The Fifth Amended Confirmation Agreement also decreased the interest rate payable to Citibank from LIBOR plus 1.65% per annum to LIBOR plus 1.60% per annum. Other than the foregoing, the Fifth Amended Confirmation Agreement did not change any of the other material terms of the TRS. On July 22, 2019, the TRS with Citibank was terminated.
The TRS with Citibank enabled Arbor to obtain the economic benefit of the loans underlying the TRS, despite the fact that such loans were not directly held or otherwise owned by Arbor, in return for an interest-type payment to Citibank. Accordingly, the TRS is analogous to Arbor utilizing leverage to acquire loans and incurring an interest expense to a lender.
SIC Advisors acted as the investment manager of Arbor and had discretion over the composition of the basket of loans underlying the TRS. The terms of the TRS were governed by an ISDA 2002 Master Agreement, the Schedule thereto and Credit Support Annex to such Schedule, and the Confirmation exchanged thereunder, between Arbor and Citibank, which collectively established the TRS, and are collectively referred to herein as the “TRS Agreement”.
Transactions in TRS contracts during the years ended December 31, 2020, 2019 and 2018 were as follows:
|
2020 |
2019 |
2018 |
||||||||||
|
Interest income and settlement from TRS |
$ | — | $ | 309,388 | $ | 5,185,757 | ||||||
|
Traded gains/(loss) on TRS loan sales |
— | (9,632,900 | ) | (2,943,401 | ) | |||||||
|
Net realized gains/(loss) on TRS |
$ | — | $ | (9,323,512 | ) | $ | 2,242,356 | |||||
|
Net change in unrealized appreciation/(depreciation) on TRS |
$ | — | $ | 6,524,904 | $ | (1,170,036 | ) | |||||
The Company held no derivative positions as of the year ended December 31, 2020 and 2019, subject to a Master Agreement (“MA”).
The following table shows the volume of the Company’s derivative transactions for the years ended December 31, 2020, 2019 and 2018:
|
2020 |
2019 |
2018 |
||||||||||
|
Average notional par amount of contracts (1) |
$ | — | $ | 18,016,329 | $ | 153,644,607 | ||||||
|
(1) |
Average notional amount is based on the average month end balances for the years ended December 31, 2020 and 2019, which is representative of the volume of notional contract amounts held during each year. |
On March 27, 2015, the Company and Great American Life Insurance Company (“GALIC”) entered into a limited liability company operating agreement to co-manage Sierra Senior Loan Strategy JV I LLC (“Sierra JV”). All portfolio and other material decisions regarding Sierra JV must be submitted to Sierra JV's board of managers, which is comprised of four members, two of whom are selected by the Company and the other two are selected by GALIC. The Company has concluded that it does not operationally control Sierra JV. As the Company does not operationally control Sierra JV, it does not consolidate the operations of Sierra JV within the consolidated financial statements. As a practical expedient, the Company uses NAV to determine the fair value of its investment in Sierra JV; therefore, this investment has been presented as a reconciling item within the fair value hierarchy (see Note 4).
As of December 31, 2020, Sierra JV had total capital commitments of $124.6 million, with the Company providing $110.1 million and GALIC providing $14.5 million. As of December 31, 2019, Sierra JV had total capital commitments of $116.0 million, with the Company providing $101.5 million and GALIC providing $14.5 million. As of December 31, 2020, approximately $124.5 million was funded relating to these commitments of which $110.1 million was from the Company. As of December 31, 2019, approximately $105.2 million was funded relating to these commitments of which $92.1 million was from the Company. The Company does not have the right to withdraw any of their respective capital commitment, unless in connection with a transfer of its membership interests. The Company may transfer full membership interests as long as it is approved by all members and transferred in a transaction exempt from the registration requirements of the Securities Act or applicable state securities laws.
Sierra JV entered into a Senior Secured Revolving Credit Facility Agreement, as amended (the "JV Facility") with Deutsche Bank, AG, New York Branch ("DB").
On March 29, 2019, the JV Facility reinvestment period was extended from March 30, 2019 to June 28, 2019.
On June 28, 2019, the JV Facility reinvestment period was further extended from June 28, 2019 to October 28, 2019.
On October 28, 2019, the JV Facility reinvestment period was further extended from October 28, 2019 to March 31, 2020 and the interest rate was modified from bearing an interest rate of LIBOR (with a 0.00% floor) + 2.50% per annum to LIBOR (with a 0.00% floor) + 2.75% per annum.
On March 31, 2020, the total commitment under the JV Facility was reduced to $240.0 million from $250.0 million and the reinvestment period was extended from March 31, 2020 to April 30, 2020.
On April 30, 2020, the total commitment under the JV Facility was reduced to $200.0 million from $240.0 million, the reinvestment period was extended from April 30, 2020 to July 31, 2020, the maturity date was extended to July 31, 2023 and the interest rate was modified from bearing an interest rate of LIBOR (with a 0.00% floor) + 2.75% per annum to LIBOR (with a 0.50% floor) + 3.15% per annum.
On July 29, 2020, the total commitment under the JV Facility was reduced to $175.0 million from $200.0 million, the reinvestment period was extended from July 31, 2020 to April 30, 2021 and the maturity date was extended to April 30, 2024. Additionally, the interest rate was modified from bearing an interest rate of LIBOR (with a 0.50% floor) + 3.15% per annum to LIBOR (with a 0.50% floor) + 3.25% per annum.
The JV Facility is secured substantially by all of Sierra JV's assets, subject to certain exclusions set forth in the JV Facility. As of December 31, 2020 and December 31, 2019, there was $124.7 million and $204.9 million outstanding under the JV Facility, respectively.
We have determined that the Sierra JV is an investment company under ASC 946; however, in accordance with such guidance, we generally will not consolidate its investment in a company other than a wholly owned investment company subsidiary or a controlled operating company whose business consists of providing services to us. As we do not operationally control Sierra JV, we do not consolidate our interest in the Sierra JV.
Distributions
We have elected, and intend to qualify annually, to be treated for U.S. federal income tax purposes, as a RIC under Subchapter M of the Code. To maintain RIC tax treatment, we must, among others things, distribute at least 90% of our net ordinary income and net short-term capital gains in excess of net long-term capital losses, if any, to our stockholders. In order to avoid certain U.S. federal excise taxes imposed on RICs, we must distribute during each calendar year an amount at least equal to the sum of: (i) 98.0% of our ordinary income for the calendar year, (ii) 98.2% of our capital gains in excess of capital losses for the one-year period generally ending on October 31 of the calendar year (unless an election is made by us to use our taxable year) and (iii) any ordinary income and net capital gains that we recognized for preceding years, but were not distributed during such years, and on which we paid no U.S. federal income tax.
While we intend to distribute any income and capital gains in the manner necessary to minimize imposition of the 4% U.S. federal excise tax, sufficient amounts of our taxable income and capital gains may not be distributed to avoid entirely the imposition of the tax. In that event, we will be liable for the tax only on the amount by which we do not meet the foregoing distribution requirement.
We currently intend to distribute net capital gains (i.e., net long-term capital gains in excess of net short-term capital losses), if any, at least annually out of the assets legally available for such distributions. However, we may decide in the future to retain such capital gains for investment and elect to treat such gains as deemed distributions to you. If this happens, you will be treated for U.S. federal income tax purposes as if you had received an actual distribution of the capital gains that we retain and reinvested the net after tax proceeds in us. In this situation, you would be eligible to claim a tax credit (or, in certain circumstances, a tax refund) equal to your allocable share of the tax we paid on the capital gains deemed distributed to you. We can offer no assurance that we will continue to achieve results that will permit the payment of any cash distributions and, if we issue senior securities, we may be prohibited from making distributions if doing so causes us to fail to maintain the asset coverage ratios stipulated by the 1940 Act or if distributions are limited by the terms of any of our borrowings.
On July 31, 2020, our board of directors temporarily suspended the monthly distributions on the shares of the Company’s common stock. On October 22, 2020, our board of directors determined to reinstate the monthly distributions on the shares of the Company’s common stock. Any distributions to our stockholders paid by the Company is subject to our board of directors’ discretion and applicable legal restrictions and take into account our results of operations, our general financial condition, general economic conditions, or other factors prohibit us from declaring a distribution. Any distributions to our stockholders will be declared out of assets legally available for distribution. From time to time, but not less than quarterly, we will review our accounts to determine whether distributions to our stockholders are appropriate. We have not established limits on the amount of funds we may use from available sources to make distributions. From the commencement of our offering through September 30, 2016, a portion of our distributions were comprised in part of expense support payments made by SIC Advisors that were subject to repayment by us within three years of the date of such support payment. The Expense Support Agreement expired on December 31, 2016 and the Company's contingent obligation to repay eligible reimbursements to SIC Advisors expired on September 30, 2019. The purpose of this arrangement was to cover distributions to stockholders so as to ensure that the distributions did not constitute a return of capital for GAAP purposes. In the future, we may have distributions which could be characterized as a return of capital. Such distributions are not based on our investment performance and can only be sustained if we achieve positive investment performance in future periods. There can be no assurance that we will achieve the performance necessary to make distributions and at historical levels in the future. SIC Advisors has no obligation to enter into a renewed expense support agreement.
Our distributions may exceed our earnings, which we refer to as a return of capital. As a result, a portion of the distributions we make may represent a return of capital. Our use of the term “return of capital” merely means distributions in excess of our earnings and as such may constitute a return on your individual investments and does not mean a return on capital. Therefore stockholders are advised that they should be aware of the differences with our use of the term “return of capital” and “return on capital.”
The following table reflects the cash distributions per share that the Company has declared or paid to its stockholders during 2020, 2019 and 2018. Stockholders of record as of each respective record date were entitled to receive the distribution.
|
Record Date |
Payment Date |
Amount per share |
||||
| January 15 and 31, 2018 | January 31, 2018 | 0.2667 | ||||
| February 15 and 28, 2018 | February 28, 2018 | 0.2667 | ||||
| March 15 and 30, 2018 | March 30, 2018 | 0.2667 | ||||
| April 13 and 30, 2018 | April 30, 2018 | 0.2667 | ||||
| May 15 and 31, 2018 | May 31, 2018 | 0.2667 | ||||
| June 15 and 29, 2018 | June 29, 2018 | 0.2667 | ||||
| July 13 and 13, 2018 | July 31, 2018 | 0.2667 | ||||
| August 15 and 31, 2018 | August 31, 2018 | 0.2667 | ||||
| September 14 and 28, 2018 | September 28, 2018 | 0.2667 | ||||
| October 15 and 31, 2018 | October 31, 2018 | 0.2667 | ||||
| November 15 and 30, 2018 | November 30, 2018 | 0.2667 | ||||
| December 14 and 31, 2018 | December 31, 2018 | 0.2667 | ||||
|
January 25, 2019 |
January 31, 2019 |
0.05334 | ||||
|
February 11, 2019 |
February 28, 2019 |
0.05334 | ||||
|
March 11, 2019 |
March 29, 2019 |
0.05334 | ||||
|
April 29, 2019 |
April 30, 2019 |
0.05334 | ||||
|
May 30, 2019 |
May 31, 2019 |
0.05334 | ||||
|
June 27, 2019 |
June 28, 2019 |
0.05334 | ||||
|
July 30, 2019 |
July 31, 2019 |
0.05334 | ||||
|
August 29, 2019 |
August 30, 2019 |
0.05334 | ||||
|
September 27, 2019 |
September 30, 2019 |
0.05334 | ||||
|
October 30, 2019 |
October 31, 2019 |
0.05334 | ||||
|
November 28, 2019 |
November 29, 2019 |
0.05334 | ||||
|
December 30, 2019 |
December 31, 2019 |
0.05334 | ||||
|
January 30, 2020 |
January 31, 2020 |
0.03500 | ||||
|
February 27, 2020 |
February 28, 2020 |
0.03500 | ||||
|
March 30, 2020 |
March 31, 2020 |
0.03500 | ||||
|
October 29, 2020 |
October 30, 2020 |
0.01000 | ||||
|
November 27, 2020 |
November 30, 2020 |
0.01000 | ||||
|
December 30, 2020 |
December 31, 2020 |
0.01000 | ||||
We have adopted an “opt in” distribution reinvestment plan pursuant to which common stockholders may elect to have the full amount of any cash distributions reinvested in additional shares of our common stock. As a result, if we declare a cash distribution, stockholders that have “opted in” to our distribution reinvestment plan will have their distribution automatically reinvested in additional shares of our common stock rather than receiving cash dividends. Stockholders who receive distributions in the form of shares of common stock will be subject to the same federal, state and local tax consequences as if they received cash distributions.
Each year a statement on Internal Revenue Service Form 1099-DIV (or such successor form) identifying the source of the distribution (i.e., paid from ordinary income, paid from net capital gain on the sale of securities, or a return of capital) will be mailed to our stockholders. The tax basis of shares must be reduced by the amount of any return of capital distributions, which will result in an increase in the amount of any taxable gain (or a reduction in any deductible loss) on the sale of shares.
Related Party Transactions
We have entered into an Investment Advisory Agreement with SIC Advisors in which our senior management holds an equity interest and were party to the Expense Support Agreement through December 31, 2016, the date on which such agreement expired. Members of our senior management also serve as principals of other investment managers affiliated with SIC Advisors that do, and may in the future, manage investment funds, accounts or other investment vehicles with investment objectives similar to ours.
We have entered into an Administration Agreement with Medley Capital LLC, pursuant to which Medley Capital LLC furnishes us with administrative services necessary to conduct our day-to-day operations. Medley Capital LLC is reimbursed for administrative expenses it incurs on our behalf. We do not reimburse Medley Capital LLC for any services for which it receives a separate fee or for rent, depreciation, utilities, capital equipment or other administrative items allocated to a controlling person of Medley Capital LLC. Medley Capital LLC is an affiliate of SIC Advisors.
We have entered into a license agreement with SIC Advisors under which SIC Advisors has agreed to grant us a non-exclusive, royalty-free license to use the name “Sierra” for specified purposes in our business. Under the license agreement, we will have a right to use the “Sierra” name, subject to certain conditions, for so long as SIC Advisors or one of its affiliates remains our investment adviser. Other than with respect to this limited license, we will have no legal right to the “Sierra” name.
Opportunities for co-investments may arise when SIC Advisors or an affiliated adviser becomes aware of investment opportunities that may be appropriate for the Company and other clients or affiliated funds. The Company obtained an exemptive order from the SEC on November 25, 2013 (the “Prior Exemptive Order”). On March 29, 2017, the Company, SIC Advisors and certain other affiliated funds and investment advisers received an exemptive order (the "Exemptive Order") that supersedes the Prior Exemptive Order and allows affiliated registered investment companies to participate in co-investment transactions with us that would otherwise have been prohibited under Section 17(d) and 57(a)(4) and Rule 17d-1. On October 4, 2017, the Company, SIC Advisors and certain of our affiliates received an exemptive order that supersedes the Exemptive Order (the “Current Exemptive Order”) and allows, in addition to the entities already covered by the Exemptive Order, Medley LLC and its subsidiary, Medley Capital LLC, to the extent they hold financial assets in a principal capacity, and any direct or indirect, wholly- or majority-owned subsidiary of Medley LLC that is formed in the future, to participate in co-investment transactions with us that would otherwise be prohibited by either or both of Sections 17(d) and 57(a)(4) of the 1940 Act.
Management Fee
We pay SIC Advisors a fee for its services under the Investment Advisory Agreement. The fee consists of two components: a base management fee and an incentive fee.
The base management fee is calculated at an annual rate of 1.75% of our gross assets and is payable quarterly in arrears. The incentive fee consists of:
|
● |
An incentive fee on net investment income (“subordinated incentive fee on income”) is calculated and payable quarterly in arrears and is based upon pre-incentive fee net investment income for the immediately preceding quarter. No subordinated incentive fee on income is payable in any calendar quarter in which pre-incentive fee net investment income does not exceed a quarterly return to stockholders of 1.75% per quarter on our net assets at the end of the immediately preceding fiscal quarter, or the preferred quarterly return. All pre-incentive fee net investment income, if any, that exceeds the preferred quarterly return, but is less than or equal to 2.1875% of net assets at the end of the immediately preceding fiscal quarter in any quarter, will be payable to SIC Advisors. We refer to this portion of our subordinated incentive fee on income as the catch up. It is intended to provide an incentive fee of 20% on pre-incentive fee net investment income when pre-incentive fee net investment income exceeds 2.1875% of net assets at the end of the immediately preceding quarter in any quarter. For any quarter in which our pre-incentive fee net investment income exceeds 2.1875% of net assets at the end of the immediately preceding quarter, the subordinated incentive fee on income shall equal 20% of the amount of pre-incentive fee net investment income, because the preferred return and catch up will have been achieved. |
|
● |
A capital gains incentive fee will be earned on realized investments and shall be payable in arrears as of the end of each calendar year during which the Investment Advisory Agreement is in effect. If the Investment Advisory Agreement is terminated, the fee will become payable as of the effective date of such termination. The capital gains incentive fee is based on our realized capital gains on a cumulative basis from inception, computed net of all realized capital losses and unrealized capital depreciation on a cumulative basis, which we refer to as “net realized capital gains.” The capital gains incentive fee equals 20% of net realized capital gains, less the aggregate amount of any previously paid capital gains incentive fee. |
Under the terms of the Investment Advisory Agreement, SIC Advisors bears all organizational and offering expenses on our behalf. Since June 2, 2014, the date that we raised $300 million in gross proceeds in connection with the sale of shares of our common stock, SIC Advisors was no longer obligated to bear, pay or otherwise be responsible for any ongoing organizational and offering expenses on our behalf, and we were responsible for paying or otherwise incurring all such organizational and offering expenses. Pursuant to the terms of the Investment Advisory Agreement, we had agreed to reimburse SIC Advisors for any such organizational and offering expenses incurred by SIC Advisors not to exceed 1.25% of the gross subscriptions raised by us over the course of the offering period, which was initially scheduled to terminate two years from the initial offering date, unless extended. On July 2, 2018, the Company’s board of directors determined to terminate the Company’s offering effective as of July 31, 2018.
Critical Accounting Policies
This discussion of our expected operating plans is based upon our expected consolidated financial statements, which will be prepared in accordance with U.S. generally accepted accounting principles ("GAAP"). The preparation of these consolidated financial statements will require our management to make estimates and assumptions that affect the reported amounts of assets, liabilities, revenues and expenses. Changes in the economic environment, financial markets and any other parameters used in determining such estimates could cause actual results to differ. In addition to the discussion below, we will describe our critical accounting policies in the notes to our future consolidated financial statements.
Valuation of Investments
We apply fair value accounting to all of its financial instruments in accordance with the 1940 Act and ASC Topic 820 — Fair Value Measurements and Disclosures (“ASC 820”). ASC 820 defines fair value, establishes a framework used to measure fair value and requires disclosures for fair value measurements. In accordance with ASC 820, we have categorized its financial instruments carried at fair value, based on the priority of the valuation technique, into a three-level fair value hierarchy as identified below and discussed in Note 4.
|
• |
Level 1 — Quoted prices are available in active markets for identical investments as of the reporting date. Publicly listed equities and publicly listed derivatives will be included in Level 1. In addition, securities sold, but not yet purchased and call options will be included in Level 1. We will not adjust the quoted price for these investments, even in situations where we hold a large position and a sale could reasonably affect the quoted price. |
|
|
||
|
• |
Level 2 — Pricing inputs are other than quoted prices in active markets, which are either directly or indirectly observable as of the reporting date, and fair value is determined through the use of models or other valuation methodologies. In certain cases, debt and equity securities are valued on the basis of prices from an orderly transaction between market participants provided by reputable dealers or pricing services. In determining the value of a particular investment, pricing services may use certain information with respect to transactions in such investments, quotations from dealers, pricing matrices, market transactions in comparable investments, and various relationships between investments. Investments which are generally expected to be included in this category include corporate bonds and loans, convertible debt indexed to publicly listed securities, and certain over-the-counter derivatives. |
|
|
||
|
• |
Level 3 — Pricing inputs are unobservable for the investment and include situations where there is little, if any, market activity for the investment. The inputs into the determination of fair value require significant judgment or estimation. Investments that are expected to be included in this category are our private portfolio companies. |
Fair value is a market-based measure considered from the perspective of the market participant who holds the financial instrument rather than an entity specific measure. Therefore, when market assumptions are not readily available, our own assumptions are set to reflect those that management believes market participants would use in pricing the financial instrument at the measurement date.
Investments for which market quotations are readily available are valued at such market quotations, which are generally obtained from an independent pricing service or multiple broker-dealers or market makers. We weight the use of third-party broker quotes, if any, in determining fair value based on our understanding of the level of actual transactions used by the broker to develop the quote and whether the quote was an indicative price or binding offer. However, debt investments with remaining maturities within 60 days that are not credit impaired are valued at cost plus accreted discount, or minus amortized premium, which approximates fair value. Investments for which market quotations are not readily available are valued at fair value as determined by our board of directors based upon input from management and third party valuation firms. Because these investments are illiquid and because there may not be any directly comparable companies whose financial instruments have observable market values, these loans are valued using a fundamental valuation methodology, consistent with traditional asset pricing standards, that is objective and consistently applied across all loans and through time.
We use third-party valuation firms to assist the board of directors in the valuation of its portfolio investments. The valuation reports generated by the third-party valuation firms consider the evaluation of financing and sale transactions with third parties, expected cash flows and market based information, including comparable transactions, performance multiples, and movement in yields of debt instruments, among other factors. Based on market data obtained from the third-party valuation firms, we use a combined market yield analysis and an enterprise model of valuation. In applying the market yield analysis, the value of our loans are determined based upon inputs such as the coupon rate, current market yield, interest rate spreads of similar securities, the stated value of the loan, and the length to maturity. In applying the enterprise model, we use a waterfall analysis which takes into account the specific capital structure of the borrower and the related seniority of the instruments within the borrower’s capital structure into consideration. To estimate the enterprise value of the portfolio company, we weigh some or all of the traditional market valuation methods and factors based on the individual circumstances of the portfolio company in order to estimate the enterprise value. The methodologies for performing investments may be based on, among other things: valuations of comparable public companies, recent sales of private and public comparable companies, discounting the forecasted cash flows of the portfolio company, third party valuations of the portfolio company, considering offers from third parties to buy the company, estimating the value to potential strategic buyers and considering the value of recent investments in the equity securities of the portfolio company. For non-performing investments, we may estimate the liquidation or collateral value of the portfolio company’s assets and liabilities using an expected recovery model. We may estimate the fair value of warrants based on a model such as the Black-Scholes model or simulation models or a combination thereof.
We undertake a multi-step valuation process each quarter when valuing investments for which market quotations are not readily available, as described below:
|
• |
our quarterly valuation process begins with each portfolio investment being initially valued by the valuation professionals; |
|
• |
conclusions are then documented and discussed with senior management; and |
|
• |
an independent valuation firm engaged by our board of directors prepares an independent valuation report for approximately one third of the portfolio investments each quarter on a rotating quarterly basis on non fiscal year-end quarters, such that each of these investments will be valued by an independent valuation firm at least twice per annum when combined with the fiscal year-end review of all the investments by independent valuation firms. |
In addition, all of our investments are subject to the following valuation process:
|
• |
management reviews preliminary valuations and their own independent assessment; |
|
• |
the audit committee of our board of directors reviews the preliminary valuations of senior management and independent valuation firms; and |
|
• |
our board of directors discusses valuations and determines the fair value of each investment in our portfolio in good faith based on the input of SIC Advisors, the respective independent valuation firms and the audit committee. |
Due to the inherent uncertainty of determining the fair value of investments that do not have a readily available market value, the fair value of our investments may differ significantly from the values that would have been used had a readily available market value existed for such investments, and the differences could be material.
Our investments in subordinated notes are carried at fair value, which is based on a discounted cash flow model. The discounted cash flow model models both the underlying collateral (“assets”) and the liabilities of the CLO capital structure. The discounted cash flow model uses a set of assumptions including projected default rates, recovery rates, reinvestment rates and prepayment rates in order to arrive at estimated cash flows of the assets. The discounted cash flow model distributes the asset cash flows to the liability structure based on the payment priorities and discounts them back using appropriate market discount rates based on discount rates for comparable CLOs. The assumptions are based on available market data as well as management estimates. Additional data is used to validate the results from the discounted cash flow method, such as analysis of relevant data observed in the CLO market, review of quotes, where available, recent acquisitions and observable transactions in the subordinated notes, among other factors.
The SEC recently adopted new Rule 2a-5 under the 1940 Act, which establishes requirements for determining fair value in good faith for purposes of the 1940 Act. We will comply with the new rule’s valuation requirements on or before the SEC’s compliance date in 2022.
Revenue Recognition
We record interest income on an accrual basis to the extent that we expect to collect such amounts. For loans and debt securities with contractual PIK interest, which represents contractual interest accrued and added to the principal balance, we generally will not accrue PIK interest for accounting purposes if the portfolio company valuation indicates that such PIK interest is not collectible. We do not accrue as a receivable interest on loans and debt securities or accounting purposes if we have reason to doubt our ability to collect such interest. Original issue discounts, market discounts, or premiums are accreted or amortized using the effective interest method as interest income. We record prepayment premiums on loans and debt securities as fee income. Dividend income, if any, is recognized on an accrual basis to the extent that we expect to collect such amount.
Net Realized Gains or Losses and Net Change in Unrealized Appreciation or Depreciation
We measure net realized gains or losses by the difference between the net proceeds from the repayment or sale and the amortized cost basis of the investment, without regard to unrealized appreciation or depreciation previously recognized. Net change in unrealized appreciation or depreciation reflects the change in portfolio investment values during the reporting period, including any reversal of previously recorded unrealized appreciation or depreciation, when gains or losses are realized.
Payment-in-Kind Interest
We have investments in our portfolio that contain a PIK interest provision. Any PIK interest is added to the principal balance of such investments and is recorded as income, if the portfolio company valuation indicates that such PIK interest is collectible. In order to maintain our RIC tax treatment, substantially all of this income must be paid out to stockholders in the form of dividends, even if we have not collected any cash.
U.S. Federal Income Taxes
We have elected, and intend to qualify annually, to be treated for U.S. federal income tax purposes as a RIC under Subchapter M of the Code. As a RIC, we generally will not have to pay corporate-level U.S. federal income taxes on any ordinary income or capital gains that we timely distribute to our stockholders from our tax earnings and profits. To obtain and maintain our RIC tax treatment, we must, among other things, meet specified source-of-income and asset diversification requirements and distribute annually at least 90% of our ordinary income and realized net short-term capital gains in excess of realized net long-term capital losses, if any.
Recent Developments
On January 21, 2021, the Board of Directors declared a series of monthly distributions for January, February and March 2021 in the amount of $0.010 per share. Stockholders of record as of each respective monthly record date will be entitled to receive the distribution. Below are the details for each respective distribution:
|
Record Date |
Payment Date |
Amount per share |
||||
|
January 28, 2021 |
January 29, 2021 |
$ | 0.010 | |||
|
February 25, 2021 |
February 26, 2021 |
0.010 | ||||
|
March 30, 2021 |
March 31, 2021 |
0.010 |
|
|||
On January 27, 2021, Massachusetts Mutual Life Insurance Company (“MassMutual”) announced it has entered into a definitive agreement with American Financial Group, Inc. to purchase its wholly owned subsidiary, GALIC. The transaction is expected to close in the second quarter of 2021, subject to regulatory and other necessary approvals. Upon the close of the transaction, GALIC will operate as an independent subsidiary of MassMutual. The Company is in the process of assessing the impact, if any, that the foregoing will have on Sierra JV’s investment activity and operations.
Item 7A: Quantitative and Qualitative Disclosures About Market Risk
We are subject to financial market risks, including changes in interest rates. See “Risk Factors - Risks Relating to Debt Financing - We will be exposed to risks associated with changes in interest rates.” Uncertainty with respect to the economic effects of the COVID-19 pandemic has introduced significant volatility in the financial markets, and the effects of this volatility could materially impact our market risks, including those listed below. For additional information concerning the COVID-19 pandemic and its potential impact on our business and our operating results, see “Risk Factors - We are currently operating in a period of capital markets disruptions and economic uncertainty. Such market conditions may materially and adversely affect debt and equity capital markets, which may have a negative impact on our business, financial condition and operations.”
As of December 31, 2020, 96.50% of our portfolio investments (based on fair value) paid variable interest rates while 3.50% paid fixed interest rates, and 12.8% were non-income producing investments while 87.2% were income producing investments. In connection with the COVID-19 pandemic, the U.S. Federal Reserve and other central banks have reduced certain interest rates and LIBOR has decreased. A prolonged reduction in interest rates will reduce our gross investment income and could result in a decrease in our net investment income if such decreases in LIBOR are not offset by a corresponding increase in the spread over LIBOR that we earn on any portfolio investments, a decrease in our operating expenses, including with respect to our income incentive fee, or a decrease in the interest rate of our floating interest rate liabilities tied to LIBOR. In contrast, a rise in the general level of interest rates can be expected to lead to higher interest rates applicable to any variable rate investments we hold and to declines in the value of any fixed rate investments we hold. In addition, a rise in interest rates may increase the likelihood that a portfolio company defaults on a loan. However, many of our variable rate investments provide for an interest rate floor, which may prevent our interest income from increasing until benchmark interest rates increase beyond a threshold amount. To the extent that a substantial portion of our investments may be in variable rate investments, an increase in interest rates beyond this threshold would make it easier for us to meet or exceed the hurdle rate applicable to the subordinated incentive fee on income under the Investment Advisory Agreement we have entered into with SIC Advisors, and may result in a substantial increase in our net investment income and to the amount of incentive fees payable to SIC Advisors with respect to our increased pre-incentive fee net investment income.
Our interest expense will also be affected by changes in the published LIBOR rate in connection with our Alpine Credit Facility. See “Risk Factors - Risks Relating to Debt Financing - Changes relating to the LIBOR calculation process may adversely affect the value of our portfolio of LIBOR-indexed, floating-rate debt securities.” We expect any future credit facilities, total return swap agreements or other financing arrangements that we or any of our subsidiaries may enter into will also be based on a floating interest rate. As a result, we are subject to risks relating to changes in market interest rates. In periods of rising interest rates, when we or our subsidiaries have debt outstanding or financing arrangements in effect, our cost of funds would increase, which could reduce our net investment income, especially to the extent we hold fixed rate investments.
In addition, any investments we make that are denominated in a foreign currency will be subject to risks associated with changes in currency exchange rates. These risks include the possibility of significant fluctuations in the foreign currency markets, the imposition or modification of foreign exchange controls and potential illiquidity in the secondary market. These risks will vary depending upon the currency or currencies involved.
Based on our Consolidated Statement of Assets and Liabilities as of December 31, 2020, the following table shows the approximate annual impact on the change in net assets resulting from operations of hypothetical base rate changes in interest rates, assuming no changes in our investment portfolio and capital structure:
|
Change in |
||||||||||||
|
Basis point increase/(decrease) |
Interest Income (1) |
Interest Expense |
Net Interest Income |
|||||||||
|
300 |
$ | 10,890,519 | $ | 4,350,000 | $ | 6,540,519 | ||||||
|
200 |
5,986,842 | 2,900,000 | 3,086,842 | |||||||||
|
100 |
1,083,164 | 1,450,000 | (366,836 | ) | ||||||||
|
(100) |
(12,287 | ) | (212,788 | ) | 200,501 | |||||||
|
(200) |
(12,287 | ) | (212,788 | ) | 200,501 | |||||||
|
(300) |
(12,287 | ) | (212,788 | ) | 200,501 | |||||||
|
(1) |
Assumes no defaults or prepayments by portfolio companies over the next twelve months. |
We expect that our long-term investments will be financed primarily with equity and debt. If deemed prudent, we may use interest rate risk management techniques in an effort to minimize our exposure to interest rate fluctuations. These techniques may include various interest rate hedging activities to the extent permitted by the 1940 Act. Adverse developments resulting from changes in interest rates or hedging transactions could have a material adverse effect on our business, financial condition and results of operations. During the years ended December 31, 2020, 2019 and 2018, we did not engage in interest rate hedging activities.
In addition, we may have risk regarding portfolio valuation. See “Item 7. Management’s Discussion and Analysis of Financial Condition and Results of Operations-Critical Accounting Policies-Valuation of Investments” and “Item 1A. Risk Factors.”
Item 8. Consolidated Financial Statements and Supplementary Data
INDEX TO CONSOLIDATED FINANCIAL STATEMENTS
Report of Independent Registered Public Accounting Firm
To the Shareholders and Board of Directors of Sierra Income Corporation
Opinion on the Financial Statements
We have audited the accompanying consolidated statements of assets and liabilities of Sierra Income Corporation (the Company), including the consolidated schedules of investments, as of December 31, 2020 and 2019, the related consolidated statements of operations, changes in net assets and cash flows for each of the three years in the period ended December 31, 2020, and the related notes (collectively referred to as the “consolidated financial statements”). In our opinion, the consolidated financial statements present fairly, in all material respects, the financial position of the Company at December 31, 2020 and 2019, and the results of its operations, changes in its net assets, and its cash flows for each of the three years in the period ended December 31, 2020, in conformity with U.S. generally accepted accounting principles.
Basis for Opinion
These financial statements are the responsibility of the Company's management. Our responsibility is to express an opinion on the Company’s financial statements based on our audits. We are a public accounting firm registered with the Public Company Accounting Oversight Board (United States) (PCAOB) and are required to be independent with respect to the Company in accordance with the U.S. federal securities laws and the applicable rules and regulations of the Securities and Exchange Commission and the PCAOB.
We conducted our audits in accordance with the standards of the PCAOB. Those standards require that we plan and perform the audit to obtain reasonable assurance about whether the financial statements are free of material misstatement, whether due to error or fraud. The Company is not required to have, nor were we engaged to perform, an audit of its internal control over financial reporting. As part of our audits we are required to obtain an understanding of internal control over financial reporting but not for the purpose of expressing an opinion on the effectiveness of the Company's internal control over financial reporting. Accordingly, we express no such opinion.
Our audits included performing procedures to assess the risks of material misstatement of the financial statements, whether due to error or fraud, and performing procedures that respond to those risks. Such procedures included examining, on a test basis, evidence regarding the amounts and disclosures in the financial statements. Our procedures included confirmation of investments owned as of December 31, 2020 and 2019, by correspondence with the custodian, directly with counterparties and management of the portfolio companies, debt agents and brokers or by other appropriate auditing procedures where replies were not received, as applicable. Our audits also included evaluating the accounting principles used and significant estimates made by management, as well as evaluating the overall presentation of the financial statements. We believe that our audits provide a reasonable basis for our opinion.
Critical Audit Matter
The critical audit matter communicated below is a matter arising from the current period audit of the financial statements that was communicated or required to be communicated to the audit committee and that: (1) relates to accounts or disclosures that are material to the financial statements and (2) involved our especially challenging, subjective or complex judgments. The communication of the critical audit matter does not alter in any way our opinion on the consolidated financial statements, taken as a whole, and we are not, by communicating the critical audit matter below, providing a separate opinion on the critical audit matter or on the account or disclosures to which it relates.
| Valuation of investments using significant unobservable inputs and assumptions | |
| Description of the Matter |
At December 31, 2020, the fair value of the Company’s investments categorized as Level 3 within the fair value hierarchy (Level 3 investments) totaled $515.1 million.
As further described in Notes 2 and 4 of the Company’s consolidated financial statements, management determines the fair value of Level 3 investments by using valuation methodologies (e.g., market or income approach) and associated techniques such as guideline comparables, discounted cash flows, and/or enterprise value analysis. These techniques require management to make judgments about the significant unobservable inputs and assumptions including, among others, market yields, EBITDA multiples, revenue multiples, discount rates, book value multiples, capitalization rates, and for subordinated notes of collateralized loan obligations, projected default rates, recovery rates, reinvestment rates and prepayment rates.
Auditing the fair value of the Company’s Level 3 investments is complex, as the unobservable inputs and assumptions used by the Company require significant management judgment or estimation and could have a significant effect on the fair value measurements of such investments. Also, applying audit procedures to address the estimation uncertainty involves a high degree of auditor subjectivity.
|
| How We Addressed the Matter in Our Audit |
Our audit procedures performed to test the fair value of the Company’s Level 3 investments included, among others, evaluating the Company’s valuation methodologies and significant unobservable inputs used in the valuations, as well as testing the mathematical accuracy of the Company’s valuation models utilized to calculate the fair value.
For all Level 3 investments, we reviewed the information considered by the Company’s Board of Directors relating to the determination of fair value.
For a sample of Level 3 investments, we obtained and reviewed management’s valuation models and compared the underlying data used in the models to agreements, underlying source documents, or portfolio company financial information provided to the Company by the investees, as applicable. We assessed whether the significant unobservable inputs used by the Company were developed in a manner consistent with its valuation policies. We also evaluated the appropriateness of the inputs and assumptions used in the fair value estimates by comparing them to portfolio company financial information and/or available market information and evaluated the appropriateness of any significant adjustments.
Additionally, for a sample of Level 3 investments and with the assistance of our valuation specialists, we developed independent fair value estimates to compare to the Company’s fair value measurements, by using market information from third-party sources, such as market multiples and market yields, or portfolio company financial information, as applicable.
We searched for and evaluated information that corroborated or contradicted the Company's significant unobservable inputs and assumptions. We also evaluated subsequent events and transactions and considered whether they corroborated or contradicted the Company's year-end valuations.
|
/s/ Ernst and Young LLP
We have served as the Company’s auditor since 2011.
New York, New York
Consolidated Statements of Assets and Liabilities
|
As of |
||||||||
|
December 31, 2020 |
December 31, 2019 |
|||||||
|
ASSETS |
||||||||
|
Investments at fair value |
||||||||
|
Non-controlled/non-affiliated investments (amortized cost of $521,483,006 and $651,393,473, respectively) |
$ | 472,813,820 | $ | 567,402,503 | ||||
|
Controlled/affiliated investments (amortized cost of $179,520,933 and $146,639,688, respectively) |
131,172,660 | 108,221,427 | ||||||
|
Investments at fair value |
603,986,480 | 675,623,930 | ||||||
|
Cash and cash equivalents |
65,301,216 | 225,316,656 | ||||||
|
Interest receivable from investments |
3,943,980 | 8,137,227 | ||||||
|
Unsettled trades receivable |
2,541,500 | 20,481 | ||||||
|
Prepaid expenses and other assets |
1,934,866 | 1,790,983 | ||||||
|
Deferred transaction costs (Note 2) |
— | 14,993,778 | ||||||
|
Total assets |
$ | 677,708,042 | $ | 925,883,055 | ||||
|
LIABILITIES |
||||||||
|
Revolving credit facilities payable (net of deferred financing costs of $659,266 and $2,235,279 respectively) (Note 6) |
$ | 144,340,734 | $ | 325,864,721 | ||||
|
Base management fees payable (Note 7) |
2,967,857 | 4,060,518 | ||||||
|
Deferred tax liability |
2,390,596 | 240,935 | ||||||
|
Accounts payable and accrued expenses |
1,406,175 | 2,131,765 | ||||||
|
Administrator fees payable |
401,260 | 381,923 | ||||||
|
Interest payable |
449,420 | 1,612,981 | ||||||
| Unsettled trades payable | 11,061 | — | ||||||
|
Transaction costs payable (Note 2) |
— | 527,491 | ||||||
|
Total liabilities |
151,967,103 | 334,820,334 | ||||||
|
Commitments (Note 11) |
||||||||
|
NET ASSETS |
||||||||
|
Common shares, par value $0.001 per share, 250,000,000 common shares authorized, 102,630,605 and 102,282,366 common shares outstanding, respectively |
$ | 102,631 | $ | 102,282 | ||||
|
Capital in excess of par value |
850,737,609 | 869,567,685 | ||||||
|
Total distributable earnings/(loss) |
(325,099,301 | ) | (278,607,246 | ) | ||||
|
Total net assets |
525,740,939 | 591,062,721 | ||||||
|
Total liabilities and net assets |
$ | 677,708,042 | $ | 925,883,055 | ||||
|
NET ASSET VALUE PER COMMON SHARE |
$ | 5.12 | $ | 5.78 | ||||
See accompanying notes to the consolidated financial statements.
Consolidated Statements of Operations
|
For the years ended December 31, |
||||||||||||
|
2020 |
2019 |
2018 |
||||||||||
|
INVESTMENT INCOME |
||||||||||||
|
Interest and dividends from investments |
||||||||||||
|
Non-controlled/non-affiliated investments |
||||||||||||
|
Cash |
$ | 36,500,331 | $ | 56,950,129 | $ | 78,408,358 | ||||||
|
Payment-in-kind |
1,953,472 | 2,384,461 | 2,173,330 | |||||||||
|
Controlled/affiliated investments: |
||||||||||||
|
Cash |
6,727,395 | 13,478,339 | 10,610,174 | |||||||||
|
Payment-in-kind |
70,746 | 1,771,155 | 2,102,401 | |||||||||
|
Total interest and dividend income |
45,251,944 | 74,584,084 | 93,294,263 | |||||||||
|
Fee income (Note 12) |
1,236,934 | 4,039,866 | 3,548,380 | |||||||||
|
Interest from cash and cash equivalents |
1,404,229 | 1,473,656 | 329,998 | |||||||||
|
Total investment income |
47,893,107 | 80,097,606 | 97,172,641 | |||||||||
|
EXPENSES |
||||||||||||
|
Base management fees (Note 7) |
12,185,544 | 17,018,479 | 19,011,460 | |||||||||
|
Interest and financing expenses |
11,835,466 | 20,489,217 | 21,356,282 | |||||||||
|
Incentive fees (Note 7) |
— | 176,061 | — | |||||||||
|
General and administrative expenses |
12,363,215 | 5,885,448 | 5,034,100 | |||||||||
|
Administrator expenses (Note 7) |
2,231,015 | 2,538,480 | 2,699,176 | |||||||||
|
Offering costs |
38,846 | 43,987 | 633,317 | |||||||||
|
Professional fees |
11,712,102 | 1,864,032 | 1,709,520 | |||||||||
|
Total expenses |
50,366,188 | 48,015,704 | 50,443,855 | |||||||||
|
NET INVESTMENT INCOME/(LOSS) |
(2,473,081 | ) | 32,081,902 | 46,728,786 | ||||||||
|
REALIZED AND UNREALIZED GAIN/(LOSS) ON INVESTMENTS |
||||||||||||
|
Net realized gain/(loss) from non-controlled/non-affiliated investments |
(64,961,724 | ) | (9,305,439 | ) | (59,912,008 | ) | ||||||
|
Net realized gain/(loss) from controlled/affiliated investments |
(8,704,949 | ) | (9,094,658 | ) | 8,194 | |||||||
|
Net realized gain/(loss) on total return swap (Note 5) |
— | (9,323,512 | ) | 2,242,356 | ||||||||
|
Net change in unrealized appreciation/(depreciation) on non-controlled/non-affiliated investments |
35,320,531 | (23,432,733 | ) | (2,410,359 | ) | |||||||
|
Net change in unrealized appreciation/(depreciation) on controlled/affiliated investments |
(9,930,012 | ) | (16,790,432 | ) | (14,256,024 | ) | ||||||
|
Net change in unrealized appreciation/(depreciation) on total return swap (Note 5) |
— | 6,524,904 | (1,170,036 | ) | ||||||||
|
Change in provision for deferred taxes on unrealized (appreciation)/depreciation on investments |
(2,149,661 | ) | (240,935 | ) | 291,455 | |||||||
|
Loss on extinguishment of debt |
(217,950 | ) | — | — | ||||||||
|
Net realized and unrealized gain/(loss) on investments |
(50,643,765 | ) | (61,662,805 | ) | (75,206,422 | ) | ||||||
|
NET INCREASE/(DECREASE) IN NET ASSETS RESULTING FROM OPERATIONS |
$ | (53,116,846 | ) | $ | (29,580,903 | ) | $ | (28,477,636 | ) | |||
|
WEIGHTED AVERAGE - BASIC AND DILUTED EARNINGS PER COMMON SHARE |
$ | (0.52 | ) | $ | (0.29 | ) | $ | (0.29 | ) | |||
|
WEIGHTED AVERAGE - BASIC AND DILUTED NET INVESTMENT INCOME/(LOSS) PER COMMON SHARE |
$ | (0.02 | ) | $ | 0.32 | $ | 0.48 | |||||
|
WEIGHTED AVERAGE COMMON STOCK OUTSTANDING - BASIC AND DILUTED (Note 10) |
102,744,642 | 100,582,788 | 97,404,685 | |||||||||
See accompanying notes to the consolidated financial statements.
Consolidated Statements of Changes in Net Assets
|
Common Stock |
Paid in Capital |
Distributable |
Total |
|||||||||||||||||
|
Shares |
Par Amount |
in Excess of Par |
Earnings/(Loss) |
Net Assets |
||||||||||||||||
|
Balance at December 31, 2017 |
96,620,231 | $ | 96,620 | $ | 843,592,066 | $ | (103,702,117 | ) | $ | 739,986,569 | ||||||||||
|
Net increase/(decrease) in net assets resulting from operations: |
||||||||||||||||||||
|
Net investment income |
— | — | — | 46,728,786 | 46,728,786 | |||||||||||||||
|
Net realized gain/(loss) on investments |
— | — | — | (59,903,814 | ) | (59,903,814 | ) | |||||||||||||
|
Net realized gain/(loss) on total return swap (Note 5) |
— | — | — | 2,242,356 | 2,242,356 | |||||||||||||||
|
Net change in unrealized appreciation/(depreciation) on investments |
— | — | — | (16,666,383 | ) | (16,666,383 | ) | |||||||||||||
|
Net change in unrealized appreciation/(depreciation) on total return swap (Note 5) |
— | — | — | (1,170,036 | ) | (1,170,036 | ) | |||||||||||||
|
Change in provision for deferred taxes on unrealized appreciation/(depreciation) on investments |
— | — | — | 291,455 | 291,455 | |||||||||||||||
|
Shareholder distributions: |
||||||||||||||||||||
|
Issuance of common shares, net of underwriting costs |
324,169 | 324 | 2,482,124 | — | 2,482,448 | |||||||||||||||
|
Issuance of common shares pursuant to distribution reinvestment plan |
3,607,329 | 3,607 | 25,855,702 | — | 25,859,309 | |||||||||||||||
|
Repurchase of common shares |
(2,048,822 | ) | (2,048 | ) | (15,511,896 | ) | — | (15,513,944 | ) | |||||||||||
|
Distributions from earnings |
— | — | (62,256,547 | ) | (62,256,547 | ) | ||||||||||||||
|
Total increase/(decrease) for the year ended December 31, 2018 |
1,882,676 | 1,883 | 12,825,930 | (90,734,183 | ) | (77,906,370 | ) | |||||||||||||
|
Tax reclassification of stockholders’ equity in accordance with GAAP |
— | — | 2,281,761 | (2,281,761 | ) | - | ||||||||||||||
|
Balance at December 31, 2018 |
98,502,907 | 98,503 | $ | 858,699,757 | $ | (196,718,061 | ) | $ | 662,080,199 | |||||||||||
|
Net increase/(decrease) in net assets resulting from operations: |
||||||||||||||||||||
|
Net investment income |
— | — | — | 32,081,902 | 32,081,902 | |||||||||||||||
|
Net realized gain/(loss) on investments |
— | — | — | (18,400,097 | ) | (18,400,097 | ) | |||||||||||||
|
Net realized gain/(loss) on total return swap (Note 5) |
— | — | — | (9,323,512 | ) | (9,323,512 | ) | |||||||||||||
|
Net change in unrealized appreciation/(depreciation) on investments |
— | — | — | (40,223,165 | ) | (40,223,165 | ) | |||||||||||||
|
Net change in unrealized appreciation/(depreciation) on total return swap (Note 5) |
— | — | — | 6,524,904 | 6,524,904 | |||||||||||||||
|
Change in provision for deferred taxes on unrealized appreciation/(depreciation) on investments |
— | — | — | (240,935 | ) | (240,935 | ) | |||||||||||||
|
Shareholder distributions: |
||||||||||||||||||||
|
Issuance of common shares pursuant to distribution reinvestment plan |
4,028,163 | 4,028 | 24,270,566 | — | 24,274,594 | |||||||||||||||
|
Repurchase of common shares |
(248,704 | ) | (249 | ) | (1,548,516 | ) | — | (1,548,765 | ) | |||||||||||
|
Distribution from tax return of capital |
— | — | (25,924,607 | ) | — | (25,924,607 | ) | |||||||||||||
|
Distributions from earnings |
— | — | — | (38,237,797 | ) | (38,237,797 | ) | |||||||||||||
|
Total increase/(decrease) for the year ended December 31, 2019 |
3,779,459 | 3,779 | (3,202,557 | ) | (67,818,700 | ) | (71,017,478 | ) | ||||||||||||
|
Tax reclassification of stockholders’ equity in accordance with GAAP |
— | — | 14,070,485 | (14,070,485 | ) | - | ||||||||||||||
|
Balance at December 31, 2019 |
102,282,366 | 102,282 | $ | 869,567,685 | $ | (278,607,246 | ) | $ | 591,062,721 | |||||||||||
|
Net increase/(decrease) in net assets resulting from operations: |
||||||||||||||||||||
|
Net investment income/(loss) |
— | — | — | (2,473,081 | ) | (2,473,081 | ) | |||||||||||||
|
Net realized gain/(loss) on investments |
— | — | — | (73,666,673 | ) | (73,666,673 | ) | |||||||||||||
|
Net realized gain/(loss) on extinguishment of debt |
— | — | — | (217,950 | ) | (217,950 | ) | |||||||||||||
|
Net change in unrealized appreciation/(depreciation) on investments |
— | — | — | 25,390,519 | 25,390,519 | |||||||||||||||
|
Change in provision for deferred taxes on unrealized (appreciation)/depreciation on investments |
— | — | — | (2,149,661 | ) | (2,149,661 | ) | |||||||||||||
|
Shareholder distributions: |
||||||||||||||||||||
|
Issuance of common shares pursuant to distribution reinvestment plan |
995,491 | 995 | 4,884,939 | — | 4,885,934 | |||||||||||||||
|
Repurchase of common shares |
(647,252 | ) | (646 | ) | (3,252,190 | ) | — | (3,252,836 | ) | |||||||||||
|
Distribution from tax return of capital |
— | — | (13,838,034 | ) | — | (13,838,034 | ) | |||||||||||||
|
Total increase/(decrease) for the year ended December 31, 2020 |
348,239 | 349 | (12,205,285 | ) | (53,116,846 | ) | (65,321,782 | ) | ||||||||||||
|
Tax reclassification of stockholders’ equity in accordance with GAAP |
— | — | (6,624,791 | ) | 6,624,791 | - | ||||||||||||||
|
Balance at December 31, 2020 |
102,630,605 | $ | 102,631 | $ | 850,737,609 | $ | (325,099,301 | ) | $ | 525,740,939 | ||||||||||
See accompanying notes to the consolidated financial statements.
Consolidated Statements of Cash Flows
|
For the years ended December 31, |
||||||||||||
|
2020 |
2019 |
2018 |
||||||||||
|
Cash flows from operating activities |
||||||||||||
|
NET INCREASE/(DECREASE) IN NET ASSETS RESULTING FROM OPERATIONS: |
$ | (53,116,846 | ) | $ | (29,580,903 | ) | $ | (28,477,636 | ) | |||
|
ADJUSTMENT TO RECONCILE NET INCREASE/(DECREASE) IN NET ASSETS FROM OPERATIONS TO NET CASH PROVIDED BY/(USED IN) OPERATING ACTIVITIES: |
||||||||||||
|
Payment-in-kind interest income |
(2,024,218 | ) | (4,155,616 | ) | (4,275,731 | ) | ||||||
|
Net amortization of premium on investments |
(757,180 | ) | (1,644,734 | ) | (1,755,437 | ) | ||||||
|
Amortization of deferred financing costs |
2,245,823 | 1,931,634 | 1,900,940 | |||||||||
|
Net realized (gain)/loss on investments |
73,666,673 | 18,400,097 | 59,903,814 | |||||||||
|
Net change in unrealized (appreciation)/depreciation on investments |
(25,390,519 | ) | 40,223,131 | 16,666,383 | ||||||||
|
Net change in unrealized (appreciation)/depreciation on total return swap (Note 5) |
— | (6,524,904 | ) | 1,170,036 | ||||||||
|
Purchases and originations |
(143,185,043 | ) | (281,525,752 | ) | (232,654,876 | ) | ||||||
|
Proceeds from sale of investments and principal repayments |
169,327,737 | 476,559,706 | 302,744,176 | |||||||||
| Loss on extinguishment of debt | 217,950 | — | — | |||||||||
|
(Increase)/decrease in operating assets: |
||||||||||||
|
Unsettled trades receivable |
(2,521,019 | ) | 2,319,066 | (1,999,974 | ) | |||||||
|
Interest receivable from investments |
4,193,247 | 1,399,258 | 141,216 | |||||||||
|
Receivable for Company shares sold |
— | — | 235,060 | |||||||||
|
Receivable due on total return swap (Note 5) |
— | 113,252 | 349,303 | |||||||||
|
Deferred transaction costs |
14,993,778 | (7,941,087 | ) | (7,052,691 | ) | |||||||
|
Prepaid expenses and other assets |
(143,883 | ) | (1,163,565 | ) | (408,322 | ) | ||||||
|
Increase/(decrease) in operating liabilities: |
||||||||||||
|
Unsettled trades payable |
11,061 | — | (308,233 | ) | ||||||||
|
Management fee payable (Note 7) |
(1,092,661 | ) | (430,716 | ) | (705,763 | ) | ||||||
|
Transaction costs payable |
(527,491 | ) | 128,811 | 398,680 | ||||||||
|
Accounts payable and accrued expenses |
(725,590 | ) | 58,596 | 317,201 | ||||||||
|
Incentive fees payable (Note 7) |
— | — | (2,827,372 | ) | ||||||||
|
Administrator fees payable |
19,337 | (307,788 | ) | (6,066 | ) | |||||||
|
Interest payable |
(1,163,561 | ) | (221,758 | ) | 12,216 | |||||||
|
Deferred tax liability |
2,149,661 | 240,935 | (291,455 | ) | ||||||||
|
NET CASH PROVIDED BY/(USED IN) OPERATING ACTIVITIES |
36,177,256 | 207,877,663 | 103,075,469 | |||||||||
|
Cash flows from financing activities: |
||||||||||||
|
Borrowings under revolving credit facility |
— | — | 48,000,000 | |||||||||
|
Repayments of revolving credit facility |
(183,100,000 | ) | (26,900,000 | ) | (128,000,000 | ) | ||||||
|
Proceeds from issuance of common shares, net of underwriting costs |
— | — | 2,482,448 | |||||||||
|
Payment of cash distributions |
(8,952,100 | ) | (39,887,810 | ) | (36,397,238 | ) | ||||||
|
Financing costs paid |
(887,760 | ) | (705,927 | ) | (74,999 | ) | ||||||
|
Repurchase of common shares |
(3,252,836 | ) | (1,548,765 | ) | (15,513,944 | ) | ||||||
|
NET CASH PROVIDED BY/(USED IN) FINANCING ACTIVITIES |
(196,192,696 | ) | (69,042,502 | ) | (129,503,733 | ) | ||||||
|
TOTAL INCREASE/(DECREASE) IN CASH |
(160,015,440 | ) | 138,835,161 | (26,428,264 | ) | |||||||
|
CASH, CASH EQUIVALENTS AND ANY CASH COLLATERAL ON TOTAL RETURN SWAP AT BEGINNING OF YEAR |
225,316,656 | 86,481,495 | 112,909,759 | |||||||||
|
CASH, CASH EQUIVALENTS AND ANY CASH COLLATERAL ON TOTAL RETURN SWAP AT END OF YEAR(1) |
$ | 65,301,216 | $ | 225,316,656 | $ | 86,481,495 | ||||||
|
Supplemental Information: |
||||||||||||
|
Cash paid during the year for interest |
$ | 10,535,252 | $ | 18,779,341 | $ | 19,443,126 | ||||||
|
Supplemental non-cash information: |
||||||||||||
|
Non-cash purchase of investments |
$ | 54,915,833 | $ | 15,700,771 | $ | 29,221,172 | ||||||
|
Non-cash sale of investments |
54,915,833 | 15,700,771 | 29,221,172 | |||||||||
|
Issuance of common shares in connection with distribution reinvestment plan |
$ | 4,885,934 | $ | 24,274,594 | $ | 25,859,309 | ||||||
|
(1) |
Includes cash and cash equivalents of $65,301,216, $225,316,656 and $59,481,495 as of December 31, 2020, 2019 and 2018, respectively, and cash collateral on total return swap of $27,000,000 solely as of December 31, 2018. |
See accompanying notes to the consolidated financial statements.
Consolidated Schedule of Investments
As of December 31, 2020
|
Company(1)(2) |
Industry |
Type of Investment |
Maturity |
Par Amount |
Cost |
Fair Value |
% of Net Assets(3) |
|||||||||||||||
|
Non-controlled/non-affiliated investments – |
89.9% | |||||||||||||||||||||
|
AAAHI Acquisition Corporation |
Transportation: Consumer |
Senior Secured First Lien Term Loan LIBOR + 8.250%, 1.000% Floor(4) (5) (13) |
12/10/2023 |
$ | 7,110,546 | $ | 6,975,416 | $ | 4,977,382 | 0.9 | % | |||||||||||
| 7,110,546 | 6,975,416 | 4,977,382 | ||||||||||||||||||||
|
Alpine SG, LLC |
High Tech Industries |
Senior Secured First Lien Term Loan LIBOR + 8.500%, 1.000% Floor(5) (6) |
11/16/2022 |
1,262,051 | 1,230,864 | 1,298,524 | 0.2 | % | ||||||||||||||
|
Senior Secured First Lien Delayed Draw Term Loan LIBOR + 5.750%, 1.000% Floor(5) (6) |
11/16/2022 |
6,165,725 | 6,165,633 | 6,102,218 | 1.2 | % | ||||||||||||||||
|
Senior Secured First Lien Term Loan LIBOR + 5.750%, 1.000% Floor(5) (6) |
11/16/2022 |
12,529,258 | 12,517,772 | 12,400,207 | 2.4 | % | ||||||||||||||||
|
Senior Secured First Lien Revolving Credit Facility LIBOR + 5.750%, 1.000% Floor(5) (6) |
11/16/2022 |
1,000,000 | 1,000,000 | 989,700 | 0.2 | % | ||||||||||||||||
| 20,957,034 | 20,914,269 | 20,790,649 | ||||||||||||||||||||
|
American Dental Partners, Inc. |
Healthcare & Pharmaceuticals |
Senior Secured Second Lien Term Loan LIBOR + 8.500%, 1.000% Floor(4) (5) |
9/25/2023 |
4,893,750 | 4,893,750 | 4,704,362 | 0.9 | % | ||||||||||||||
| 4,893,750 | 4,893,750 | 4,704,362 | ||||||||||||||||||||
|
Amerijet Holdings, Inc. |
Transportation: Cargo |
Senior Secured First Lien Term Loan LIBOR + 8.000%, 1.000% Floor(5) (6) |
7/15/2021 |
2,952,518 | 2,952,518 | 2,952,518 | 0.6 | % | ||||||||||||||
| 2,952,518 | 2,952,518 | 2,952,518 | ||||||||||||||||||||
|
AMMC CLO 22, Limited Series 2018-22A |
Multi-Sector Holdings |
Subordinated Notes 13.429% effective yield(7) (8) (9) |
4/25/2031 |
7,222,000 | 5,402,828 | 4,786,019 | 0.9 | % | ||||||||||||||
| 7,222,000 | 5,402,828 | 4,786,019 | ||||||||||||||||||||
|
AMMC CLO 23, Ltd. Series 2020-23A |
Multi-Sector Holdings |
Subordinated Notes 19.100% effective yield(7) (8) (9) |
10/17/2031 |
2,000,000 | 1,688,071 | 1,688,000 | 0.3 | % | ||||||||||||||
| 2,000,000 | 1,688,071 | 1,688,000 | ||||||||||||||||||||
|
Answers Finance, LLC |
High Tech Industries |
Common Stock - 388,533 shares (10) |
— | 5,076,376 | 493,437 | 0.1 | % | |||||||||||||||
| — | 5,076,376 | 493,437 | ||||||||||||||||||||
|
Apidos CLO XXIV, Series 2016-24A |
Multi-Sector Holdings |
Subordinated Notes 8.894% effective yield(5) (7) (8) (9) |
7/20/2027 |
18,357,647 | 10,342,024 | 8,402,295 | 1.6 | % | ||||||||||||||
| 18,357,647 | 10,342,024 | 8,402,295 | ||||||||||||||||||||
|
Arrow International Inc. |
Hotel, Gaming & Leisure |
Senior Secured First Lien Term Loan LIBOR + 7.250%, 1.250% Floor(6) |
12/21/2025 |
10,000,000 | 10,000,000 | 10,000,000 | 1.9 | % | ||||||||||||||
| 10,000,000 | 10,000,000 | 10,000,000 | ||||||||||||||||||||
|
Avantor, Inc. |
Wholesale |
Common Stock - 27,252 shares (5) (8) (10) (11) |
— | 467,171 | 767,144 | 0.1 | % | |||||||||||||||
| — | 467,171 | 767,144 | ||||||||||||||||||||
|
Aviation Technical Services, Inc. |
Aerospace & Defense |
Senior Secured Second Lien Term Loan LIBOR + 8.500%, 1.000% Floor(4) (5) |
3/31/2022 |
25,000,000 | 25,000,000 | 21,795,000 | 4.1 | % | ||||||||||||||
| 25,000,000 | 25,000,000 | 21,795,000 | ||||||||||||||||||||
|
Company(1)(2) |
Industry |
Type of Investment |
Maturity |
Par Amount |
Cost |
Fair Value |
% of Net Assets(3) |
|||||||||||||||
|
BRG Sports, Inc. |
Consumer Goods: Durable |
Senior Secured First Lien Term Loan LIBOR + 6.250%, 1.000% Floor(5) (6) |
6/15/2023 |
3,480,384 | 3,474,606 | 3,445,232 | 0.7 | % | ||||||||||||||
| 3,480,384 | 3,474,606 | 3,445,232 | ||||||||||||||||||||
|
Brook & Whittle Holding Corp. |
Containers, Packaging & Glass |
Senior Secured First Lien Delayed Draw Term Loan LIBOR + 5.250%, 1.000% Floor(4) (5) |
10/17/2024 |
699,967 | 697,464 | 682,888 | 0.1 | % | ||||||||||||||
|
Senior Secured First Lien Term Loan LIBOR + 5.250%, 1.000% Floor(4) (5) |
10/17/2024 |
2,976,219 | 2,965,575 | 2,903,599 | 0.6 | % | ||||||||||||||||
| 3,676,186 | 3,663,039 | 3,586,487 | ||||||||||||||||||||
|
Callaway Golf Co. |
Consumer Goods: Durable |
Senior Secured First Lien Term Loan LIBOR + 4.500%, 1.000% Floor(5) (6) |
1/4/2026 |
46,000 | 45,422 | 46,060 | — | % | ||||||||||||||
| 46,000 | 45,422 | 46,060 | ||||||||||||||||||||
|
CM Finance SPV LLC |
Banking, Finance, Insurance & Real Estate |
Subordinated Notes 3.000%(5) |
6/24/2021 |
35,600 | 35,600 | 35,600 | — | % | ||||||||||||||
| 35,600 | 35,600 | 35,600 | ||||||||||||||||||||
|
CPI International, Inc. |
Aerospace & Defense |
Senior Secured Second Lien Term Loan LIBOR + 7.250%, 1.000% Floor(5) (6) |
7/28/2025 |
8,575,302 | 8,558,896 | 7,928,725 | 1.5 | % | ||||||||||||||
| 8,575,302 | 8,558,896 | 7,928,725 | ||||||||||||||||||||
|
CT Technologies Intermediate Holdings, Inc. |
Healthcare & Pharmaceuticals |
Senior Secured First Lien Term Loan LIBOR + 5.000%, 1.000% Floor(5) (6) |
12/16/2025 |
7,000,000 | 6,965,245 | 6,965,000 | 1.3 | % | ||||||||||||||
| 7,000,000 | 6,965,245 | 6,965,000 | ||||||||||||||||||||
|
DataOnline Corp. |
High Tech Industries |
Revolving Credit Facility LIBOR + 6.250%, 1.000% Floor(4) (5) (12) |
11/13/2025 |
1,821,429 | 1,821,429 | 1,765,929 | 0.3 | % | ||||||||||||||
|
Senior Secured First Lien Term Loan LIBOR + 6.250%, 1.000% Floor(4) (5) |
11/13/2025 |
14,850,000 | 14,850,000 | 14,465,385 | 2.8 | % | ||||||||||||||||
| 16,671,429 | 16,671,429 | 16,231,314 | ||||||||||||||||||||
|
Delta Air Lines, Inc. |
Transportation: Consumer |
Senior Secured First Lien Notes 4.750%(5) (7) (8) |
10/20/2028 |
1,000,000 | 1,000,000 | 1,090,700 | 0.2 | % | ||||||||||||||
| 1,000,000 | 1,000,000 | 1,090,700 | ||||||||||||||||||||
|
Dryden 38 Senior Loan Fund, Series 2015-38A |
Multi-Sector Holdings |
Subordinated Notes 11.373% effective yield(7) (8) (9) |
7/15/2027 |
7,000,000 | 4,308,139 | 3,598,000 | 0.7 | % | ||||||||||||||
| 7,000,000 | 4,308,139 | 3,598,000 | ||||||||||||||||||||
|
Dryden 43 Senior Loan Fund, Series 2016-43A |
Multi-Sector Holdings |
Subordinated Notes 8.262% effective yield(5) (7) (8) (9) |
7/20/2029 |
3,620,000 | 2,513,635 | 1,901,586 | 0.4 | % | ||||||||||||||
| 3,620,000 | 2,513,635 | 1,901,586 | ||||||||||||||||||||
|
Dryden 49 Senior Loan Fund, Series 2017-49A |
Multi-Sector Holdings |
Subordinated Notes 9.989% effective yield(5) (7) (8) (9) |
7/18/2030 |
17,233,288 | 12,375,842 | 9,498,988 | 1.8 | % | ||||||||||||||
| 17,233,288 | 12,375,842 | 9,498,988 | ||||||||||||||||||||
|
Envision Healthcare Corporation |
Healthcare & Pharmaceuticals |
Senior Secured First Lien Term Loan LIBOR + 3.750%(5) (6) |
10/10/2025 |
49,000 | 33,226 | 40,734 | — | % | ||||||||||||||
| 49,000 | 33,226 | 40,734 | ||||||||||||||||||||
|
First Boston Construction Holdings, LLC |
Banking, Finance, Insurance & Real Estate |
Senior Secured First Lien Notes 12.000%(5) |
2/23/2023 |
7,473,750 | 7,473,750 | 7,458,055 | 1.4 | % | ||||||||||||||
|
Preferred Equity - 2,304,406 units (5) (10) |
— | 1,868,437 | 1,307,906 | 0.2 | % | |||||||||||||||||
| 7,473,750 | 9,342,187 | 8,765,961 | ||||||||||||||||||||
|
Friedrich Holdings, Inc. |
Construction & Building |
Senior Secured First Lien Term Loan LIBOR + 6.000%, 1.000% Floor(5) (6) |
2/7/2023 |
10,421,300 | 10,421,300 | 10,263,938 | 2.0 | % | ||||||||||||||
| 10,421,300 | 10,421,300 | 10,263,938 | ||||||||||||||||||||
|
GK Holdings, Inc. |
Services: Business |
Senior Secured Second Lien Term Loan LIBOR + 10.250%, 1.000% Floor(4) (13) |
1/20/2022 |
10,000,000 | 10,000,000 | 5,500,000 | 1.0 | % | ||||||||||||||
| 10,000,000 | 10,000,000 | 5,500,000 | ||||||||||||||||||||
|
Company(1)(2) |
Industry |
Type of Investment |
Maturity |
Par Amount |
Cost |
Fair Value |
% of Net Assets(3) |
|||||||||||||||
|
Glass Mountain Pipeline Holdings, LLC |
Energy: Oil & Gas |
Senior Secured First Lien Term Loan LIBOR + 4.500%, 1.000% Floor(5) (6) (13) |
12/23/2024 |
48,625 | 23,389 | 24,434 | — | % | ||||||||||||||
| 48,625 | 23,389 | 24,434 | ||||||||||||||||||||
|
Golden West Packaging Group LLC |
Forest Products & Paper |
Senior Secured First Lien Term Loan LIBOR + 5.250%, 1.000% Floor(5) (6) |
6/20/2023 |
1,405,738 | 1,405,738 | 1,404,332 | 0.3 | % | ||||||||||||||
| 1,405,738 | 1,405,738 | 1,404,332 | ||||||||||||||||||||
|
Holland Acquisition Corp. |
Energy: Oil & Gas |
Senior Secured First Lien Term Loan LIBOR + 9.000%, 1.000% Floor(4) (13) (14) |
5/29/2020 |
3,857,305 | 3,733,979 | 108,310 | — | % | ||||||||||||||
| 3,857,305 | 3,733,979 | 108,310 | ||||||||||||||||||||
|
Hylan Datacom & Electrical LLC |
Construction & Building |
Senior Secured First Lien Term Loan LIBOR + 10.000%, 1.000% Floor(4) (5) |
7/25/2022 |
15,255,390 | 15,255,390 | 10,983,881 | 2.1 | % | ||||||||||||||
| 15,255,390 | 15,255,390 | 10,983,881 | ||||||||||||||||||||
|
Impact Group, LLC |
Services: Business |
Senior Secured First Lien Term Loan LIBOR + 7.370%, 1.000% Floor(4) (5) |
6/27/2023 |
5,734,462 | 5,734,462 | 5,548,092 | 1.1 | % | ||||||||||||||
| 5,734,462 | 5,734,462 | 5,548,092 | ||||||||||||||||||||
|
Innovative XCessories & Services, LLC |
Automotive |
Senior Secured First Lien Term Loan LIBOR + 5.200%, 1.000% Floor(4) (5) |
3/5/2027 |
2,976,933 | 2,950,524 | 2,979,016 | 0.6 | % | ||||||||||||||
| 2,976,933 | 2,950,524 | 2,979,016 | ||||||||||||||||||||
|
Interflex Acquisition Company, LLC |
Containers, Packaging & Glass |
Senior Secured First Lien Term Loan LIBOR + 8.000%, 1.000% Floor(5) (6) |
8/18/2022 |
11,553,578 | 11,543,801 | 11,533,937 | 2.2 | % | ||||||||||||||
| 11,553,578 | 11,543,801 | 11,533,937 | ||||||||||||||||||||
|
Iqor US Inc. |
Services: Business |
Senior Secured First Lien Term Loan LIBOR + 7.500%, 1.000% Floor(5) (6) |
11/19/2024 |
3,471,136 | 3,388,625 | 3,401,713 | 0.6 | % | ||||||||||||||
|
Senior Secured First Lien Term Loan LIBOR + 7.500%, 1.000% Floor(5) (6) |
11/19/2025 |
7,734,435 | 7,734,435 | 7,734,435 | 1.5 | % | ||||||||||||||||
|
Equity - 246,857 Shares |
— | 2,962,285 | 3,085,713 | 0.6 | % | |||||||||||||||||
| 11,205,571 | 14,085,345 | 14,221,861 | ||||||||||||||||||||
|
Isagenix International, LLC |
Wholesale |
Senior Secured First Lien Term Loan LIBOR + 5.750%, 1.000% Floor(4) (5) |
6/16/2025 |
1,776,911 | 1,745,748 | 978,900 | 0.2 | % | ||||||||||||||
| 1,776,911 | 1,745,748 | 978,900 | ||||||||||||||||||||
|
Isola USA Corp. |
High Tech Industries |
Senior Secured Second Lien Term Loan LIBOR + 9.500%, 1.000% Floor, PIK(4) (12) (13) |
1/2/2023 |
11,331,641 | 7,016,631 | 8,498,730 | 1.6 | % | ||||||||||||||
|
Common Units - 10,283,782 units (10) |
— | — | — | — | % | |||||||||||||||||
| 11,331,641 | 7,016,631 | 8,498,730 | ||||||||||||||||||||
|
Ivanti Software, Inc. |
High Tech Industries |
Senior Secured Second Lien Term Loan LIBOR + 8.500%, 1.000% Floor(5) (6) |
12/1/2028 |
6,000,000 | 6,000,000 | 5,947,800 | 1.1 | % | ||||||||||||||
| 6,000,000 | 6,000,000 | 5,947,800 | ||||||||||||||||||||
|
JFL-WCS Partners, LLC |
Environmental Industries |
Preferred units - 618,876 6.000%, PIK(5) |
— | 659,447 | 709,806 | 0.1 | % | |||||||||||||||
|
Common Units - 70,412 units (5) (10) |
— | 98,052 | 5,069,664 | 1.0 | % | |||||||||||||||||
| — | 757,499 | 5,779,470 | ||||||||||||||||||||
|
Company(1)(2) |
Industry |
Type of Investment |
Maturity |
Par Amount |
Cost |
Fair Value |
% of Net Assets(3) |
|||||||||||||||
|
Keystone Acquisition Corp. |
Healthcare & Pharmaceuticals |
Senior Secured First Lien Term Loan LIBOR + 5.250%, 1.000% Floor(4) (5) |
5/1/2024 |
1,784,130 | 1,736,823 | 1,614,638 | 0.3 | % | ||||||||||||||
|
Senior Secured Second Lien Term Loan LIBOR + 9.250%, 1.000% Floor(4) (5) |
5/1/2025 |
7,000,000 | 6,921,915 | 6,127,800 | 1.2 | % | ||||||||||||||||
| 8,784,130 | 8,658,738 | 7,742,438 | ||||||||||||||||||||
|
LogMeIn, Inc. |
High Tech Industries |
Senior Secured First Lien Term Loan LIBOR + 7.750%, 1.000% Floor(5) (6) (8) |
8/31/2027 |
1,000,000 | 980,865 | 995,300 | 0.2 | % | ||||||||||||||
| 1,000,000 | 980,865 | 995,300 | ||||||||||||||||||||
|
Magnetite XIX, Limited |
Multi-Sector Holdings |
Subordinated Notes LIBOR + 7.610%(4) (7) (8) (9) |
7/17/2030 |
2,000,000 | 1,893,387 | 1,745,800 | 0.3 | % | ||||||||||||||
|
Subordinated Notes 9.779% effective yield(5) (7) (8) (9) |
7/17/2030 |
13,730,209 | 9,451,985 | 7,493,948 | 1.4 | % | ||||||||||||||||
| 15,730,209 | 11,345,372 | 9,239,748 | ||||||||||||||||||||
|
Midwest Physician Administrative Services, LLC |
Healthcare & Pharmaceuticals |
Senior Secured Second Lien Term Loan LIBOR + 7.000%, 0.750% Floor(6) |
8/15/2025 |
2,000,000 | 1,935,192 | 1,945,000 | 0.4 | % | ||||||||||||||
| 2,000,000 | 1,935,192 | 1,945,000 | ||||||||||||||||||||
|
Novetta Solutions, LLC |
High Tech Industries |
Senior Secured First Lien Term Loan LIBOR + 5.000%, 1.000% Floor(5) (6) |
10/17/2022 |
1,560,779 | 1,522,514 | 1,521,291 | 0.3 | % | ||||||||||||||
|
Senior Secured Second Lien Term Loan LIBOR + 8.500%, 1.000% Floor(5) (6) |
10/16/2023 |
11,000,000 | 10,951,758 | 10,574,300 | 2.0 | % | ||||||||||||||||
| 12,560,779 | 12,474,272 | 12,095,591 | ||||||||||||||||||||
|
Offen Inc. |
Transportation: Cargo |
Senior Secured First Lien Term Loan LIBOR + 5.000%(5) (6) |
6/21/2026 |
2,893,982 | 2,871,192 | 2,793,272 | 0.5 | % | ||||||||||||||
|
Senior Secured First Lien Term Loan LIBOR + 5.000%(5) (6) |
6/21/2026 |
1,061,947 | 1,053,584 | 1,024,991 | 0.2 | % | ||||||||||||||||
| 3,955,929 | 3,924,776 | 3,818,263 | ||||||||||||||||||||
|
Path Medical, LLC |
Healthcare & Pharmaceuticals |
Senior Secured First Lien Term Loan LIBOR + 13.000%, 1.000% Floor, PIK(4) (5) (6) (13) |
10/11/2021 |
10,752,249 | 8,860,931 | 1,075,225 | 0.2 | % | ||||||||||||||
|
Senior Secured First Lien Term Loan LIBOR + 9.500%, 1.000% Floor, PIK(4) (5) (6) |
10/11/2021 |
7,943,176 | 7,943,176 | 7,943,176 | 1.5 | % | ||||||||||||||||
|
Warrants - 36,716 warrants (5) (10) |
1/9/2027 |
— | 669,709 | — | — | % | ||||||||||||||||
| 18,695,425 | 17,473,816 | 9,018,401 | ||||||||||||||||||||
|
PetroChoice Holdings, Inc. |
Chemicals, Plastics & Rubber |
Senior Secured Second Lien Term Loan LIBOR + 8.750%, 1.000% Floor(4) (5) |
8/21/2023 |
9,000,000 | 9,000,000 | 8,010,000 | 1.5 | % | ||||||||||||||
| 9,000,000 | 9,000,000 | 8,010,000 | ||||||||||||||||||||
|
Polymer Solutions Group Holdings, LLC |
Chemicals, Plastics & Rubber |
Senior Secured First Lien Term Loan LIBOR + 7.000%, 1.000% Floor(5) (6) |
6/30/2021 |
1,064,355 | 1,060,861 | 1,053,498 | 0.2 | % | ||||||||||||||
| 1,064,355 | 1,060,861 | 1,053,498 | ||||||||||||||||||||
|
Project Silverback Holdings Corp. |
High Tech Industries |
Senior Secured First Lien Term Loan LIBOR + 3.500%, 1.000% Floor(4) |
8/21/2024 |
4,837,500 | 4,403,234 | 4,819,601 | 0.9 | % | ||||||||||||||
| 4,837,500 | 4,403,234 | 4,819,601 | ||||||||||||||||||||
|
Proppants Holdings, LLC |
Energy: Oil & Gas |
Common Units - 161,852 units (10) |
— | 874,363 | 323,704 | 0.1 | % | |||||||||||||||
| Common Units - 161,852 units (10) | — | 8,832 | — | — | % | |||||||||||||||||
| — | 883,195 | 323,704 | ||||||||||||||||||||
|
PT Network, LLC |
Healthcare & Pharmaceuticals |
Senior Secured First Lien Term Loan LIBOR + 5.500%, 1.000% Floor, 2.00% PIK(5) (17) |
11/30/2023 |
8,072,834 | 7,729,742 | 7,427,007 | 1.4 | % | ||||||||||||||
|
Membership Units - 1.441 units (5) (10) |
— | — | — | — | % | |||||||||||||||||
| 8,072,834 | 7,729,742 | 7,427,007 | ||||||||||||||||||||
|
Company(1)(2) |
Industry |
Type of Investment |
Maturity |
Par Amount |
Cost |
Fair Value |
% of Net Assets(3) |
|||||||||||||||
|
RateGain Technologies, Inc. |
Hotel, Gaming & Leisure |
Subordinated Notes (5) (10) (14) |
7/31/2020 |
440,050 | 440,049 | — | — | % | ||||||||||||||
|
Subordinated Notes (5) (10) |
7/31/2021 |
476,190 | 476,190 | — | — | % | ||||||||||||||||
| 916,240 | 916,239 | — | ||||||||||||||||||||
|
Redwood Services Group, LLC |
Services: Business |
Senior Secured First Lien Term Loan LIBOR + 8.500%, 1.000% Floor(5) (6) |
6/6/2023 |
4,000,000 | 4,000,000 | 4,000,000 | 0.8 | % | ||||||||||||||
|
Senior Secured First Lien Term Loan LIBOR + 6.000%, 1.000% Floor(5) (6) |
6/6/2023 |
12,611,712 | 12,611,712 | 12,267,412 | 2.3 | % | ||||||||||||||||
|
Senior Secured First Lien Term Loan LIBOR + 8.500%, 1.000% Floor(5) (6) |
6/6/2023 |
10,730,528 | 10,713,091 | 10,472,305 | 2.0 | % | ||||||||||||||||
|
Revolving Credit Facility LIBOR + 6.000%, 1.000% Floor(5) (6) (12) |
6/6/2023 |
287,500 | 287,500 | 208,725 | — | % | ||||||||||||||||
| 27,629,740 | 27,612,303 | 26,948,442 | ||||||||||||||||||||
|
Resolute Investment Managers, Inc. |
Banking, Finance, Insurance & Real Estate |
Senior Secured Second Lien Term Loan LIBOR + 8.000%, 1.000% Floor(5) (6) |
4/30/2025 |
6,000,000 | 5,970,877 | 5,943,600 | 1.1 | % | ||||||||||||||
| 6,000,000 | 5,970,877 | 5,943,600 | ||||||||||||||||||||
|
Rhombus Cinema Holdings, LP |
Media: Diversified & Production |
Preferred Equity - 7,449 shares 10.000% PIK(5) (10) (13) |
— | 4,584,207 | — | — | % | |||||||||||||||
|
Common Units - 3,163 units (5) (7) (10) |
— | 2,864,831 | — | — | % | |||||||||||||||||
|
Common Units - 3,163 units (5) (7) (10) |
— | 297,962 | — | — | % | |||||||||||||||||
| — | 7,747,000 | — | ||||||||||||||||||||
|
RTIC Subsidiary Holdings, LLC |
Consumer Goods: Durable |
Senior Secured First Lien Term Loan LIBOR + 7.750%, 1.250% Floor(4) (5) (12) |
9/1/2025 |
10,000,000 | 10,000,000 | 10,000,000 | 1.9 | % | ||||||||||||||
|
Preferred Class A units - 142.50 units (10) |
— | 142,500 | 142,500 | — | % | |||||||||||||||||
|
Preferred Class B units - 142.50 units (10) |
— | 142,500 | 142,500 | — | % | |||||||||||||||||
|
Common units - 150 units (10) |
— | 15,000 | 15,000 | — | % | |||||||||||||||||
| 10,000,000 | 10,300,000 | 10,300,000 | ||||||||||||||||||||
|
SavATree, LLC |
Environmental Industries |
Senior Secured First Lien Term Loan LIBOR + 5.000%, 1.000% Floor(4) (5) |
6/2/2022 |
4,283,931 | 4,283,931 | 4,273,221 | 0.8 | % | ||||||||||||||
| 4,283,931 | 4,283,931 | 4,273,221 | ||||||||||||||||||||
|
SFP Holding, Inc. |
Construction & Building |
Senior Secured First Lien Term Loan LIBOR + 6.250%, 1.000% Floor(4) (5) (12) |
9/1/2022 |
16,560,532 | 16,540,362 | 16,560,532 | 3.1 | % | ||||||||||||||
|
Equity - 0.803% of outstanding equity (5) (10) |
— | 711,698 | 548,007 | 0.1 | % | |||||||||||||||||
| 16,560,532 | 17,252,060 | 17,108,539 | ||||||||||||||||||||
|
Simplified Logistics, LLC |
Services: Business |
Senior Secured First Lien Term Loan LIBOR + 6.500%, 1.000% Floor(4) (5) |
2/28/2022 |
17,323,831 | 17,323,831 | 17,058,776 | 3.2 | % | ||||||||||||||
|
Senior Secured First Lien Term Loan LIBOR + 6.500%, 1.000% Floor(4) (5) |
2/28/2022 |
971,277 | 971,277 | 956,417 | 0.2 | % | ||||||||||||||||
|
Revolving Credit Facility LIBOR + 6.500%, 1.000% Floor(4) (5) |
2/28/2022 |
3,533,333 | 3,533,333 | 3,482,807 | 0.7 | % | ||||||||||||||||
| 21,828,441 | 21,828,441 | 21,498,000 | ||||||||||||||||||||
|
SMART Financial Operations, LLC |
Retail |
Preferred Equity - 1,000,000 units (5) (10) |
— | 1,000,000 | 490,000 | 0.1 | % | |||||||||||||||
| — | 1,000,000 | 490,000 | ||||||||||||||||||||
|
Company(1)(2) |
Industry |
Type of Investment |
Maturity |
Par Amount |
Cost |
Fair Value |
% of Net Assets(3) |
|||||||||||||||
|
Smile Doctors, LLC |
Healthcare & Pharmaceuticals |
Senior Secured First Lien Term Loan LIBOR + 6.000%, 1.000% Floor(4) (5) |
10/6/2022 |
13,805,148 | 13,786,625 | 13,587,027 | 2.6 | % | ||||||||||||||
| 13,805,148 | 13,786,625 | 13,587,027 | ||||||||||||||||||||
|
Sound Point CLO XX, Ltd. |
Multi-Sector Holdings |
Subordinated Notes 8.553% effective yield(5) (7) (8) (9) |
7/26/2031 |
4,489,000 | 3,508,513 | 2,824,030 | 0.5 | % | ||||||||||||||
| 4,489,000 | 3,508,513 | 2,824,030 | ||||||||||||||||||||
|
Starfish Holdco, LLC |
High Tech Industries |
Senior Secured Second Lien Term Loan LIBOR + 9.000%, 1.000% Floor(4) (5) |
8/18/2025 |
2,000,000 | 1,982,268 | 1,919,600 | 0.4 | % | ||||||||||||||
| 2,000,000 | 1,982,268 | 1,919,600 | ||||||||||||||||||||
|
Team Car Care, LLC |
Automotive |
Senior Secured First Lien Term Loan LIBOR + 8.000%, 1.000% Floor(4) (5) |
2/23/2023 |
13,624,819 | 13,624,819 | 13,529,446 | 2.6 | % | ||||||||||||||
| 13,624,819 | 13,624,819 | 13,529,446 | ||||||||||||||||||||
|
Team Services Group |
Services: Consumer |
Senior Secured First Lien Term Loan LIBOR + 5.000%, 1.000% Floor(5) (6) |
12/20/2027 |
5,000,000 | 4,850,000 | 4,825,000 | 0.9 | % | ||||||||||||||
|
Senior Secured Second Lien Term Loan LIBOR + 9.000%, 1.000% Floor(5) (6) |
12/18/2028 |
5,000,000 | 4,850,000 | 4,900,000 | 0.9 | % | ||||||||||||||||
| 10,000,000 | 9,700,000 | 9,725,000 | ||||||||||||||||||||
|
The Octave Music Group, Inc. |
Media: Diversified & Production |
Senior Secured First Lien Term Loan LIBOR + 5.250%, 1.000% Floor, 0.75% PIK(5) (6) |
5/29/2025 |
7,793,103 | 7,727,145 | 6,780,000 | 1.3 | % | ||||||||||||||
| 7,793,103 | 7,727,145 | 6,780,000 | ||||||||||||||||||||
|
True Religion Apparel, Inc. |
Retail |
Senior Secured First Lien Term Loan 10.000%(13) |
10/27/2022 |
179,437 | 133,654 | 12,094 | — | % | ||||||||||||||
|
Common Stock - 2,448 shares (10) |
— | — | — | — | % | |||||||||||||||||
|
Warrants - 1,122 warrants (10) |
— | — | — | — | % | |||||||||||||||||
| 179,437 | 133,654 | 12,094 | ||||||||||||||||||||
|
Velocity Pooling Vehicle, LLC |
Automotive |
Senior Secured First Lien Term Loan LIBOR + 11.000%, 1.000% Floor(4) (5) |
4/28/2023 |
871,784 | 838,397 | 871,784 | 0.2 | % | ||||||||||||||
|
Common Units - 4,676 units (5) (10) |
— | 259,937 | 11,035 | — | % | |||||||||||||||||
|
Warrants - 5,591 warrants (5) (10) |
3/30/2028 |
— | 310,802 | 13,195 | — | % | ||||||||||||||||
| 871,784 | 1,409,136 | 896,014 | ||||||||||||||||||||
|
VOYA CLO 2015-2, LTD. |
Multi-Sector Holdings |
Subordinated Notes 0.516% effective yield(5) (7) (8) (9) |
7/19/2028 |
10,735,659 | 5,792,260 | 3,657,639 | 0.7 | % | ||||||||||||||
| 10,735,659 | 5,792,260 | 3,657,639 | ||||||||||||||||||||
|
VOYA CLO 2016-2, LTD. |
Multi-Sector Holdings |
Subordinated Notes 2.808% effective yield(5) (7) (8) (9) |
7/19/2028 |
11,088,290 | 7,333,317 | 4,407,595 | 0.8 | % | ||||||||||||||
| 11,088,290 | 7,333,317 | 4,407,595 | ||||||||||||||||||||
|
Walker Edison Furniture Company LLC |
Consumer Goods: Durable |
Senior Secured First Lien Term Loan LIBOR + 8.750%, 1.000% Floor(4) (5) |
9/26/2024 |
1,975,000 | 1,975,000 | 1,975,000 | 0.4 | % | ||||||||||||||
|
Senior Secured First Lien Term Loan LIBOR + 6.250%, 1.000% Floor(4) (5) |
9/26/2024 |
14,250,000 | 14,250,000 | 14,250,000 | 2.7 | % | ||||||||||||||||
|
Common Units - 2,000 units (5) (10) |
— | 2,000,000 | 11,000,000 | 2.1 | % | |||||||||||||||||
| 16,225,000 | 18,225,000 | 27,225,000 | ||||||||||||||||||||
|
Watermill-QMC Midco, Inc. |
Automotive |
Equity - 1.62% partnership interest (5) (10) |
— | 902,277 | — | — | % | |||||||||||||||
| — | 902,277 | — | ||||||||||||||||||||
|
Wawona Delaware Holdings, LLC |
Beverage & Food |
Senior Secured First Lien Term Loan LIBOR + 4.750%(4) (5) |
9/11/2026 |
49,375 | 46,869 | 48,141 | — | % | ||||||||||||||
| 49,375 | 46,869 | 48,141 | ||||||||||||||||||||
|
West Dermatology, LLC |
Healthcare & Pharmaceuticals |
Senior Secured First Lien Term Loan LIBOR + 7.500%, 1.000% Floor(5) (6) (12) |
2/11/2025 |
726,672 | 726,672 | 613,498 | 0.1 | % | ||||||||||||||
|
Revolving Credit Facility LIBOR + 6.000%, 1.000% Floor, 0.75% PIK(5) (6) |
2/11/2025 |
1,657,459 | 1,657,459 | 1,614,033 | 0.3 | % | ||||||||||||||||
|
Senior Secured First Lien Term Loan LIBOR + 6.000%, 1.000% Floor, 0.750% PIK(5) (6) |
2/11/2025 |
4,739,503 | 4,739,503 | 4,617,698 | 0.9 | % | ||||||||||||||||
| 7,123,634 | 7,123,634 | 6,845,229 | ||||||||||||||||||||
|
Wok Holdings Inc. |
Retail |
Senior Secured First Lien Term Loan LIBOR + 6.250%, (5) (6) |
3/1/2026 |
49,125 | 33,080 | 42,758 | — | % | ||||||||||||||
| 49,125 | 33,080 | 42,758 | ||||||||||||||||||||
|
Total non-controlled/non-affiliated investments |
$ | 521,483,006 | $ | 472,813,820 | 89.9 | % | ||||||||||||||||
|
Company(1)(2) |
Industry |
Type of Investment |
Maturity |
Par Amount |
Cost |
Fair Value |
% of Net Assets(3) |
|||||||||||||||
|
1888 Industrial Services, LLC |
Energy: Oil & Gas |
Revolving Credit Facility LIBOR + 5.000%, 1.000% Floor(4) (5) (12) |
9/30/2021 |
1,243,924 | 1,243,924 | 1,243,924 | 0.2 | % | ||||||||||||||
|
Senior Secured First Lien Term Loan LIBOR + 5.000%, 1.000% Floor(4) (5) (13) |
9/30/2021 |
431,176 | 403,717 | 431,176 | 0.1 | % | ||||||||||||||||
|
Senior Secured First Lien Term Loan LIBOR + 5.000%, 1.000% Floor, PIK(4) (5) (13) |
9/30/2021 |
3,534,740 | 3,315,574 | — | — | % | ||||||||||||||||
|
Senior Secured First Lien Term Loan LIBOR + 8.000%, 1.000% Floor, PIK(4) (5) (13) |
9/30/2021 |
9,286,929 | 6,816,029 | — | — | % | ||||||||||||||||
|
Units - 6,122.765 units (5) (10) |
— | — | — | — | % | |||||||||||||||||
| 14,496,769 | 11,779,244 | 1,675,100 | ||||||||||||||||||||
|
Black Angus Steakhouses, LLC |
Hotel, Gaming & Leisure |
Senior Secured First Lien Term Loan LIBOR + 9.000%, 1.000% Floor, PIK(5) (6) (13) |
6/30/2022 |
21,573,552 | 20,457,589 | 9,060,892 | 1.7 | % | ||||||||||||||
|
Senior Secured First Lien Term Loan LIBOR + 9.000%, 1.000% Floor(5) (6) |
6/30/2022 |
1,897,321 | 1,897,321 | 1,897,321 | 0.4 | % | ||||||||||||||||
|
Senior Secured First Lien Term Loan LIBOR + 9.000%, 1.000% Floor(6) (12) |
6/30/2022 |
3,055,556 | 3,055,556 | 3,055,556 | 0.6 | % | ||||||||||||||||
|
Equity - 44.60% of outstanding equity (5) (10) |
— | — | — | — | % | |||||||||||||||||
| 26,526,429 | 25,410,466 | 14,013,769 | ||||||||||||||||||||
|
Caddo Investors Holdings 1 LLC |
Forest Products & Paper |
Equity - 12.250% LLC Interest (5) (16) |
— | 5,072,149 | 6,366,372 | 1.2 | % | |||||||||||||||
| — | 5,072,149 | 6,366,372 | ||||||||||||||||||||
|
Charming Charlie LLC |
Retail |
Senior Secured First Lien Delayed Draw Term Loan 20.000%(13) (14) |
5/15/2020 |
769,967 | 769,968 | 396,225 | 0.1 | % | ||||||||||||||
|
Senior Secured First Lien Term Loan LIBOR + 10.000%, 1.000% Floor(4) (13) |
4/24/2023 |
7,590,773 | 5,859,128 | — | — | % | ||||||||||||||||
|
Senior Secured First Lien Term Loan 20.000%(13) (14) |
5/15/2020 |
138,517 | 138,517 | 71,281 | — | % | ||||||||||||||||
|
Common Stock - 34,923,249 shares (10) |
— | — | — | — | % | |||||||||||||||||
| 8,499,257 | 6,767,613 | 467,506 | ||||||||||||||||||||
|
Dynamic Energy Services International LLC |
Energy: Oil & Gas |
Senior Secured First Lien Term Loan 13.500% PIK(4) (5) (13) |
12/31/2021 |
7,049,577 | 4,449,025 | 493,470 | 0.1 | % | ||||||||||||||
|
Common Units - 6,500,000 shares (5) (10) |
— | — | — | — | % | |||||||||||||||||
| 7,049,577 | 4,449,025 | 493,470 | ||||||||||||||||||||
|
Kemmerer Operations, LLC |
Metals & Mining |
Senior Secured First Lien Term Loan 15.000% PIK(5) |
6/21/2023 |
2,130,353 | 2,130,353 | 2,130,353 | 0.4 | % | ||||||||||||||
|
Senior Secured First Lien Delayed Draw Term Loan 15.000% PIK(5) (12) |
6/21/2023 |
399,366 | 399,366 | 399,366 | 0.1 | % | ||||||||||||||||
|
Common Units - 6.7797 units (5) (10) |
— | 962,717 | 962,760 | 0.2 | % | |||||||||||||||||
| 2,529,719 | 3,492,436 | 3,492,479 | ||||||||||||||||||||
|
MCM 500 East Pratt Holdings, LLC |
Banking, Finance, Insurance & Real Estate |
Equity - 5,000,000 units (8) (10) |
— | 5,000,000 | 7,350,000 | 1.4 | % | |||||||||||||||
| — | 5,000,000 | 7,350,000 | ||||||||||||||||||||
|
MCM Capital Office Park Holdings LLC |
Banking, Finance, Insurance & Real Estate |
Equity - 7,500,000 units (8) (10) |
— | 7,500,000 | 15,525,000 | 3.0 | % | |||||||||||||||
| — | 7,500,000 | 15,525,000 | ||||||||||||||||||||
|
Sierra Senior Loan Strategy JV I LLC |
Multi-Sector Holdings |
Equity - 89.01% ownership of SIC Senior Loan Strategy JV I LLC (8) (16) |
— | 110,050,000 | 81,788,964 | 15.6 | % | |||||||||||||||
| — | 110,050,000 | 81,788,964 | ||||||||||||||||||||
|
Total controlled/affiliated investments(15) |
$ | 179,520,933 | $ | 131,172,660 | 25.0 | % | ||||||||||||||||
|
Total investments |
$ | 701,003,939 | $ | 603,986,480 | 114.9 | % | ||||||||||||||||
|
Money Market Fund - 32.5% |
||||||||||||||||||||||
|
Federated Institutional Prime Obligations Fund |
Money Market 0.150%(11) |
25,401,625 | 25,401,625 | 25,401,625 | 4.8 | % | ||||||||||||||||
|
State Street Institutional Liquid Reserves Fund |
Money Market 0.010% (11) |
12,683,935 | 12,686,471 | 12,685,203 | 2.4 | % | ||||||||||||||||
|
Total money market fund |
$ | 38,085,560 | $ | 38,088,096 | $ | 38,086,828 | 7.2 | % | ||||||||||||||
|
(1) |
All of the Company's investments are domiciled in the United States except for AMMC CLO 22, Limited Series 2018-22A, AMMC CLO 23, Limited Series 2020-23A, Apidos CLO XXIV, Series 2016-24A, Dryden 38 Senior Loan Fund, Series 2015-38A, Dryden 43 Senior Loan Fund, Series 2016-43A, Dryden 49 Senior Loan Fund, 2017-49A, Magnetite XIX, Limited, Sound Point CLO XX, Ltd., VOYA CLO 2016-2, LTD., and VOYA CLO 2015-2, LTD., which are all domiciled in the Cayman Islands. All foreign investments were denominated in US Dollars. |
|
(2) |
Unless otherwise indicated, all securities are valued using significant unobservable inputs, which are categorized as Level 3 assets under the definition of ASC 820 fair value hierarchy. |
|
(3) |
Percentage is based on net assets of $525,740,939 as of December 31, 2020. |
|
(4) |
The interest rate on these loans is subject to a base rate plus 3 Month "3M" LIBOR, which at December 31, 2020 was 0.24%. The interest rate is subject to a minimum LIBOR floor. |
|
(5) |
An affiliated fund that is managed by an affiliate of SIC Advisors LLC also holds an investment in this security. |
|
(6) |
The interest rate on these loans is subject to a base rate plus 1 Month "1M" LIBOR, which at December 31, 2020 was 0.14%. The interest rate is subject to a minimum LIBOR floor. |
|
(7) |
Securities are exempt from registration under Rule 144A of the Securities Act of 1933, as amended. These securities represent a fair value of $51,094,601 or 9.7% of net assets as of December 31, 2020 and are considered restricted securities. |
|
(8) |
The investment is not a qualifying asset under Section 55 of the Investment Company Act of 1940, as amended (the "1940 Act"). Non-qualifying assets represent 30.0% of the Company's portfolio at fair value. |
|
(9) |
This investment is in the equity class of a collateralized loan obligation ("CLO"). The CLO equity investments are entitled to recurring distributions which are generally equal to the excess cash flow generated from the underlying investments after payment of the contractual payments to debt holders and fund expenses. The current estimated yield is based on the current projections of this excess cash flow taking into account assumptions that have been made regarding expected prepayments, losses and future reinvestment rates. These assumptions are periodically reviewed and adjusted. Ultimately, the actual yield may be higher or lower than the estimated yield if actual results differ from those used for the assumptions. |
|
(10) |
Security is non-income producing. |
|
(11) |
Represents securities in Level 1 in the ASC 820 table (see Note 4). |
| (12) | The investment has an unfunded commitment as of December 31, 2020. For further details see Note 11. Fair value includes an analysis of the unfunded commitment. |
|
(13) |
The investment was on non-accrual status as of December 31, 2020. |
| (14) | The investment is past due as of December 31, 2020. |
|
(15) |
Affiliate Investments are defined by the 1940 Act as investments in companies in which the Company owns at least 5% but no more than 25% of the voting securities or we are under common control with such portfolio company. Control Investments are defined by the 1940 Act as investments in companies in which the Company owns more than 25% of the voting securities or maintains greater than 50% of the board representation. |
|
(16) |
As a practical expedient, the Company uses NAV to determine the fair value of this investment. |
| (17) | The interest rate on these loans is subject to a base rate plus 6 Month "6M" LIBOR, which at December 31, 2020 was 0.34%. The interest rate is subject to a minimum LIBOR floor. |
See accompanying notes to consolidated financial statements.
Sierra Income Corporation
Consolidated Schedule of Investments
As of December 31, 2019
|
Company(1)(2) |
Industry |
Type of Investment |
Maturity |
Par Amount |
Cost |
Fair Value |
% of Net Assets(3) |
|||||||||||||||
|
Non-controlled/non-affiliated investments – 96.0% |
||||||||||||||||||||||
|
AAAHI Acquisition Corporation |
Transportation: Consumer |
Senior Secured First Lien Term Loan LIBOR + 6.250%, 1.000% Floor (4)(5)(6) |
12/10/2023 |
$ | 6,966,133 | $ | 6,966,133 | $ | 6,877,180 | 1.2 | % | |||||||||||
| 6,966,133 | 6,966,133 | 6,877,180 | ||||||||||||||||||||
|
Alpine SG, LLC |
High Tech Industries |
Senior Secured First Lien Delayed Draw Term Loan LIBOR + 6.500%, 1.000% Floor (5)(7) |
11/16/2022 |
6,617,630 | 6,617,630 | 6,613,660 | 1.1 | % | ||||||||||||||
|
Senior Secured First Lien Term Loan LIBOR + 6.500%, 1.000% Floor (5)(6)(7) |
11/16/2022 |
13,398,750 | 13,398,750 | 13,390,711 | 2.3 | % | ||||||||||||||||
| 20,016,380 | 20,016,380 | 20,004,371 | ||||||||||||||||||||
|
American Dental Partners, Inc. |
Healthcare & Pharmaceuticals |
Senior Secured Second Lien Term Loan LIBOR + 8.500%, 1.000% Floor (4)(5) |
9/25/2023 |
4,893,750 | 4,893,750 | 4,813,492 | 0.8 | % | ||||||||||||||
| 4,893,750 | 4,893,750 | 4,813,492 | ||||||||||||||||||||
|
Amerijet Holdings, Inc. |
Transportation: Cargo |
Senior Secured First Lien Term Loan LIBOR + 8.000%, 1.000% Floor (5)(7) |
7/15/2021 |
9,847,868 | 9,847,868 | 9,847,868 | 1.7 | % | ||||||||||||||
| 9,847,868 | 9,847,868 | 9,847,868 | ||||||||||||||||||||
|
AMMC CLO 22, Limited Series 2018-22A |
Multi-Sector Holdings |
Subordinated Notes 12.573% effective yield (8)(9)(10) |
4/25/2031 |
7,222,000 | 5,719,206 | 5,693,103 | 1.0 | % | ||||||||||||||
| 7,222,000 | 5,719,206 | 5,693,103 | ||||||||||||||||||||
|
Answers Finance, LLC |
High Tech Industries |
Common Stock - 389,533 shares (11) |
— | 5,076,376 | 802,438 | 0.1 | % | |||||||||||||||
| — | 5,076,376 | 802,438 | ||||||||||||||||||||
|
Apidos CLO XXIV, Series 2016-24A |
Multi-Sector Holdings |
Subordinated Notes 12.285% effective yield (5)(8)(9)(10) |
7/20/2027 |
18,357,647 | 11,350,063 | 11,142,247 | 1.9 | % | ||||||||||||||
| 18,357,647 | 11,350,063 | 11,142,247 | ||||||||||||||||||||
| Avantor, Inc. | Wholesale | Common Stock - 1,867,356 shares (11)(12) | — | 32,678,730 | 33,892,511 | 5.7 | % | |||||||||||||||
| — | 32,678,730 | 33,892,511 | ||||||||||||||||||||
|
Aviation Technical Services, Inc. |
Aerospace & Defense |
Senior Secured Second Lien Term Loan LIBOR + 8.500%, 1.000% Floor (4)(5) |
3/31/2022 |
25,000,000 | 25,000,000 | 25,000,000 | 4.2 | % | ||||||||||||||
| 25,000,000 | 25,000,000 | 25,000,000 | ||||||||||||||||||||
|
Black Angus Steakhouses, LLC |
Hotel, Gaming & Leisure |
Senior Secured First Lien Term Loan LIBOR + 9.000%, 1.000% Floor (4)(5) |
4/24/2020 |
18,225,446 | 18,225,446 | 18,215,218 | 3.1 | % | ||||||||||||||
| Revolving Credit Facility LIBOR + 9.000%, 1.000% Floor (5)(6)(7) | 4/24/2020 | 2,232,143 | 2,232,143 | 2,233,705 | 0.4 | % | ||||||||||||||||
| 20,457,589 | 20,457,589 | 20,448,923 | ||||||||||||||||||||
|
BRG Sports, Inc. |
Consumer Goods: Durable |
Senior Secured First Lien Term Loan LIBOR + 6.250%, 1.000% Floor (5)(7) |
6/15/2023 |
5,337,500 | 5,337,500 | 5,331,629 | 0.9 | % | ||||||||||||||
| 5,337,500 | 5,337,500 | 5,331,629 | ||||||||||||||||||||
|
Brook & Whittle Holding Corp. |
Containers, Packaging & Glass |
Senior Secured First Lien Term Loan LIBOR + 5.250%, 1.000% Floor (4)(5) |
10/17/2024 |
2,937,058 | 2,937,058 | 2,924,135 | 0.5 | % | ||||||||||||||
|
Senior Secured First Lien Delayed Draw Term Loan LIBOR + 5.250%, 1.000% Floor (4)(5) |
10/17/2024 |
690,757 | 690,757 | 687,718 | 0.1 | % | ||||||||||||||||
| 3,627,815 | 3,627,815 | 3,611,853 | ||||||||||||||||||||
| Capstone Nutrition Development, LLC | Healthcare & Pharmaceuticals | Units - 11,124.90 units (11) | — | 1,112,490 | 1,112,490 | 0.2 | % | |||||||||||||||
| — | 1,112,490 | 1,112,490 | ||||||||||||||||||||
|
Company(1)(2) |
Industry |
Type of Investment |
Maturity |
Par Amount |
Cost |
Fair Value |
% of Net Assets(3) |
|||||||||||||||
|
Centauri Group Holdings, LLC |
High Tech Industries |
Senior Secured First Lien Term Loan LIBOR + 5.250%, 1.000% Floor(4)(5) |
2/12/2024 |
10,029,280 | 10,012,265 | 10,004,207 | 1.7 | % | ||||||||||||||
| 10,029,280 | 10,012,265 | 10,004,207 | ||||||||||||||||||||
|
CPI International, Inc. |
Aerospace & Defense |
Senior Secured Second Lien Term Loan LIBOR + 7.250%, 1.000% Floor (5)(7) |
7/28/2025 |
9,900,752 | 9,876,226 | 9,475,020 | 1.6 | % | ||||||||||||||
| 9,900,752 | 9,876,226 | 9,475,020 | ||||||||||||||||||||
|
CT Technologies Intermediate Holdings, Inc. |
Healthcare & Pharmaceuticals |
Senior Secured First Lien Term Loan LIBOR + 4.250%, 1.000% Floor (5)(7) |
12/1/2021 |
972,010 | 863,963 | 914,856 | 0.2 | % | ||||||||||||||
| 972,010 | 863,963 | 914,856 | ||||||||||||||||||||
|
DataOnline Corp. |
High Tech Industries |
Senior Secured First Lien Term Loan LIBOR + 5.500%, 1.000% Floor (4)(5)(6) |
11/13/2025 |
15,000,000 | 15,000,000 | 15,000,000 | 2.5 | % | ||||||||||||||
| 15,000,000 | 15,000,000 | 15,000,000 | ||||||||||||||||||||
|
Dermatologists of Southwestern Ohio, LLC |
Healthcare & Pharmaceuticals |
Senior Secured First Lien Term Loan LIBOR + 6.500%, 1.000% Floor (5)(7) |
4/20/2022 |
2,444,307 | 2,444,307 | 2,416,686 | 0.4 | % | ||||||||||||||
|
Senior Secured First Lien Delayed Draw Term Loan LIBOR + 6.500%, 1.000% Floor (5)(7) |
4/20/2022 |
927,413 | 927,413 | 916,934 | 0.2 | % | ||||||||||||||||
| 3,371,720 | 3,371,720 | 3,333,620 | ||||||||||||||||||||
|
DirectBuy Home Improvement, Inc. |
Retail |
Subordinated notes LIBOR + 6.500%, 1.000% Floor (4) |
6/20/2022 |
260,919 | 248,270 | 260,919 | 0.0 | % | ||||||||||||||
| Common Stock - 191,678 shares (11) | — | 75,340 | 61,337 | 0.0% | ||||||||||||||||||
| 260,919 | 323,610 | 322,256 | ||||||||||||||||||||
|
Dryden 38 Senior Loan Fund, Series 2015-38A |
Multi-Sector Holdings |
Subordinated Notes 12.678% effective yield (8)(9)(10) |
7/15/2027 |
7,000,000 | 4,715,290 | 4,664,800 | 0.8 | % | ||||||||||||||
| 7,000,000 | 4,715,290 | 4,664,800 | ||||||||||||||||||||
|
Dryden 43 Senior Loan Fund, Series 2016-43A |
Multi-Sector Holdings |
Subordinated Notes 10.956% effective yield (5)(8)(9)(10) |
7/20/2029 |
3,620,000 | 2,747,203 | 2,268,286 | 0.4 | % | ||||||||||||||
| 3,620,000 | 2,747,203 | 2,268,286 | ||||||||||||||||||||
|
Dryden 49 Senior Loan Fund, Series 2017-49A |
Multi-Sector Holdings |
Subordinated Notes 9.486% effective yield (5)(8)(9)(10) |
7/18/2030 |
17,233,288 | 13,515,790 | 11,498,222 | 1.9 | % | ||||||||||||||
| 17,233,288 | 13,515,790 | 11,498,222 | ||||||||||||||||||||
|
First Boston Construction Holdings, LLC |
Banking, Finance, Insurance & Real Estate |
Senior secured first lien notes 12.000% (5) |
2/23/2023 |
9,217,625 | 9,217,625 | 9,217,625 | 1.6 | % | ||||||||||||||
| Preferred Equity - 2,304,406 units (5)(11) | — | 2,304,406 | 2,304,406 | 0.4% | ||||||||||||||||||
| 9,217,625 | 11,522,031 | 11,522,031 | ||||||||||||||||||||
|
Friedrich Holdings, Inc. |
Construction & Building |
Senior Secured First Lien Term Loan LIBOR + 6.000%, 1.000% Floor (5)(7) |
2/7/2023 |
10,527,100 | 10,527,100 | 10,527,100 | 1.8 | % | ||||||||||||||
| 10,527,100 | 10,527,100 | 10,527,100 | ||||||||||||||||||||
|
GK Holdings, Inc. |
Services: Business |
Senior Secured Second Lien Term Loan LIBOR + 10.250%, 1.000% Floor (4) |
1/20/2022 |
10,000,000 | 10,000,000 | 7,048,000 | 1.2 | % | ||||||||||||||
| 10,000,000 | 10,000,000 | 7,048,000 | ||||||||||||||||||||
|
Golden West Packaging Group LLC |
Forest Products & Paper |
Senior Secured First Lien Term Loan LIBOR + 5.750%, 1.000% Floor (5)(7) |
6/20/2023 |
1,427,655 | 1,427,655 | 1,417,661 | 0.2 | % | ||||||||||||||
| 1,427,655 | 1,427,655 | 1,417,661 | ||||||||||||||||||||
|
Holland Acquisition Corp. |
Energy: Oil & Gas |
Senior Secured First Lien Term Loan LIBOR + 9.000%, 1.000% Floor (4)(13) |
5/29/2020 |
4,400,696 | 4,260,117 | 1,100,174 | 0.2 | % | ||||||||||||||
| 4,400,696 | 4,260,117 | 1,100,174 | ||||||||||||||||||||
|
Hylan Datacom & Electrical LLC |
Construction & Building |
Senior Secured First Lien Term Loan LIBOR + 9.500%, 1.000% Floor (4)(5) |
7/25/2021 |
14,548,297 | 14,548,297 | 11,638,638 | 2.0 | % | ||||||||||||||
| 14,548,297 | 14,548,297 | 11,638,638 | ||||||||||||||||||||
|
Company(1)(2) |
Industry |
Type of Investment |
Maturity |
Par Amount |
Cost |
Fair Value |
% of Net Assets(3) |
|||||||||||||||
|
IHS Intermediate, Inc. |
Services: Business |
Senior Secured Second Lien Term Loan LIBOR + 8.250%, 1.000% Floor (4)(13) |
7/20/2022 |
25,000,000 | 25,000,000 | 1,750,000 | 0.3 | % | ||||||||||||||
| 25,000,000 | 25,000,000 | 1,750,000 | ||||||||||||||||||||
|
Impact Group, LLC |
Services: Business |
Senior Secured First Lien Term Loan LIBOR + 6.500%, 1.000% Floor (4)(5) |
6/27/2023 |
5,796,354 | 5,796,354 | 5,458,427 | 0.9 | % | ||||||||||||||
| 5,796,354 | 5,796,354 | 5,458,427 | ||||||||||||||||||||
|
Interflex Acquisition Company, LLC |
Containers, Packaging & Glass |
Senior Secured First Lien Term Loan LIBOR + 9.000%, 1.000% Floor (5)(7) |
8/18/2022 |
12,635,953 | 12,635,953 | 12,043,326 | 2.0 | % | ||||||||||||||
| 12,635,953 | 12,635,953 | 12,043,326 | ||||||||||||||||||||
|
Iqor US Inc. |
Services: Business |
Senior Secured First Lien Term Loan LIBOR + 5.000%, 1.000% Floor (4)(7) |
4/1/2021 |
19,815,331 | 19,012,372 | 17,027,313 | 2.9 | % | ||||||||||||||
| 19,815,331 | 19,012,372 | 17,027,313 | ||||||||||||||||||||
|
Isagenix International, LLC |
Wholesale |
Senior Secured First Lien Term Loan LIBOR + 5.750%, 1.000% Floor (4)(5) |
6/16/2025 |
1,848,782 | 1,841,180 | 1,293,778 | 0.2 | % | ||||||||||||||
| 1,848,782 | 1,841,180 | 1,293,778 | ||||||||||||||||||||
|
Isola USA Corp. |
High Tech Industries |
Senior Secured Second Lien Term Loan LIBOR + 9.500%, 1.000% Floor, PIK (4)(6)(13) |
1/2/2023 |
10,237,487 | 7,578,468 | 7,187,740 | 1.2 | % | ||||||||||||||
|
Common Units - 10,283,782 units (9)(11) |
— | — | — | 0.0 | % | |||||||||||||||||
| 10,237,487 | 7,578,468 | 7,187,740 | ||||||||||||||||||||
|
JFL-WCS Partners, LLC |
Environmental Industries |
Preferred Units - 618,876 6.000%, PIK (5)(9) |
— | 618,876 | 618,876 | 0.1 | % | |||||||||||||||
|
Common Units - 68,764 units (5)(9)(11) |
— | 68,764 | 1,461,923 | 0.2 | % | |||||||||||||||||
| — | 687,640 | 2,080,799 | ||||||||||||||||||||
|
Keystone Acquisition Corp. |
Healthcare & Pharmaceuticals |
Senior Secured First Lien Term Loan LIBOR + 5.250%, 1.000% Floor (4)(5) |
5/1/2024 |
1,802,571 | 1,741,353 | 1,757,507 | 0.3 | % | ||||||||||||||
| Senior Secured Second Lien Term Loan LIBOR + 9.250%, 1.000% Floor (4)(5) | 5/1/2025 | 7,000,000 | 6,904,682 | 6,869,800 | 1.2 | % | ||||||||||||||||
| 8,802,571 | 8,646,035 | 8,627,307 | ||||||||||||||||||||
|
L&S Plumbing Partnership, Ltd. |
Construction & Building |
Senior Secured First Lien Term Loan LIBOR + 7.500%, 1.000% Floor (4)(5) |
2/15/2022 |
7,535,892 | 7,535,892 | 7,579,600 | 1.3 | % | ||||||||||||||
| 7,535,892 | 7,535,892 | 7,579,600 | ||||||||||||||||||||
|
Magnetite XIX, Limited |
Multi-Sector Holdings |
Subordinated Notes LIBOR + 7.610% (4)(8)(9)(10) |
7/17/2030 |
2,000,000 | 1,874,937 | 1,757,368 | 0.3 | % | ||||||||||||||
|
Subordinated Notes 8.407% effective yield (5)(8)(9)(10) |
7/17/2030 |
13,730,209 | 10,427,732 | 8,857,783 | 1.5 | % | ||||||||||||||||
| 15,730,209 | 12,302,669 | 10,615,151 | ||||||||||||||||||||
|
Manna Pro Products, LLC |
Consumer Goods: Non-durable |
Senior Secured First Lien Term Loan LIBOR + 6.000%, 1.000% Floor (5)(7) |
12/8/2023 |
4,083,333 | 4,083,333 | 3,924,900 | 0.7 | % | ||||||||||||||
| Senior Secured First Lien Delayed Draw Term Loan LIBOR + 6.000%, 1.000% Floor (5)(7) | 12/8/2023 | 829,167 | 829,167 | 796,995 | 0.1 | % | ||||||||||||||||
| 4,912,500 | 4,912,500 | 4,721,895 | ||||||||||||||||||||
|
Midwest Physician Administrative Services, LLC |
Healthcare & Pharmaceuticals |
Senior Secured Second Lien Term Loan LIBOR + 7.000%, 1.000% Floor (7) |
8/15/2025 |
1,950,000 | 1,881,156 | 1,862,250 | 0.3 | % | ||||||||||||||
| 1,950,000 | 1,881,156 | 1,862,250 | ||||||||||||||||||||
|
Novetta Solutions, LLC |
High Tech Industries |
Senior Secured Second Lien Term Loan LIBOR + 8.500%, 1.000% Floor (7) |
10/16/2023 |
11,000,000 | 10,938,515 | 10,585,300 | 1.8 | % | ||||||||||||||
| 11,000,000 | 10,938,515 | 10,585,300 | ||||||||||||||||||||
|
Offen Inc. |
Transportation: Cargo |
Senior Secured First Lien Term Loan LIBOR + 5.000% (4)(6) |
6/21/2026 |
2,923,363 | 2,886,299 | 2,923,363 | 0.5 | % | ||||||||||||||
| 2,923,363 | 2,886,299 | 2,923,363 | ||||||||||||||||||||
|
Company(1)(2) |
Industry |
Type of Investment |
Maturity |
Par Amount |
Cost |
Fair Value |
% of Net Assets(3) |
|||||||||||||||
|
Path Medical, LLC |
Healthcare & Pharmaceuticals |
Senior Secured First Lien Term Loan LIBOR + 9.500%, 1.000% Floor, PIK (5)(7) |
10/11/2021 |
17,601,348 | 17,340,449 | 16,328,771 | 2.8 | % | ||||||||||||||
|
Senior Secured First Lien Term Loan LIBOR + 10.000%, 1.000% Floor (5)(6)(7) |
10/11/2021 |
328,000 | 328,000 | 327,836 | 0.1 | % | ||||||||||||||||
|
Warrants - 36,716 warrants(5)(11) |
1/9/2027 |
— | 669,709 | — | 0.0 | % | ||||||||||||||||
| 17,929,348 | 18,338,158 | 16,656,607 | ||||||||||||||||||||
|
PetroChoice Holdings, Inc. |
Chemicals, Plastics & Rubber |
Senior Secured Second Lien Term Loan LIBOR + 8.750%, 1.000% Floor (4)(5) |
8/21/2023 |
9,000,000 | 9,000,000 | 8,422,200 | 1.5 | % | ||||||||||||||
| 9,000,000 | 9,000,000 | 8,422,200 | ||||||||||||||||||||
|
Polymer Solutions Group Holdings, LLC |
Chemicals, Plastics & Rubber |
Senior Secured First Lien Term Loan LIBOR + 6.750%, 1.000% Floor (5)(7) |
6/30/2021 |
1,090,722 | 1,090,722 | 1,083,414 | 0.2 | % | ||||||||||||||
| 1,090,722 | 1,090,722 | 1,083,414 | ||||||||||||||||||||
|
Project Silverback Holdings Corp. |
High Tech Industries |
Senior Secured First Lien Term Loan LIBOR + 3.500%, 1.000% Floor (4) |
8/21/2024 |
4,887,500 | 4,338,566 | 4,257,990 | 0.7 | % | ||||||||||||||
| 4,887,500 | 4,338,566 | 4,257,990 | ||||||||||||||||||||
| Proppants Holdings, LLC | Energy: Oil & Gas | Common Units - 161,852 units (11) | — | 874,363 | 809,260 | 0.1 | % | |||||||||||||||
| Common Units - 161,852 units (11) | — | 8,832 | 8,093 | 0.0 | % | |||||||||||||||||
| — | 883,195 | 817,353 | ||||||||||||||||||||
|
PT Network, LLC |
Healthcare & Pharmaceuticals |
Senior Secured First Lien Term Loan LIBOR + 5.500%, 1.000% Floor (4)(5) |
11/30/2023 |
7,969,098 | 7,511,671 | 7,450,310 | 1.4 | % | ||||||||||||||
| Membership Units - 1.441 units (5)(11) | — | — | — | 0.1 | % | |||||||||||||||||
| 7,969,098 | 7,511,671 | 7,450,310 | ||||||||||||||||||||
|
RateGain Technologies, Inc. |
Hotel, Gaming & Leisure |
Subordinated Notes (5)(11) |
7/31/2020 |
440,050 | 440,050 | 440,050 | 0.1 | % | ||||||||||||||
|
Subordinated Notes (5)(11) |
7/31/2021 |
476,190 | 476,190 | 476,190 | 0.1 | % | ||||||||||||||||
| 916,240 | 916,240 | 916,240 | ||||||||||||||||||||
|
Redwood Services Group, LLC |
Services: Business |
Senior Secured First Lien Term Loan LIBOR + 6.000%, 1.000% Floor (4)(5) |
6/6/2023 |
22,837,649 | 22,837,649 | 22,791,974 | 3.9 | % | ||||||||||||||
|
Revolving Credit Facility LIBOR + 6.000%, 1.000% Floor (4)(5)(6) |
6/6/2023 |
1,150,000 | 1,150,000 | 1,148,562 | 0.2 | % | ||||||||||||||||
| 23,987,649 | 23,987,649 | 23,940,536 | ||||||||||||||||||||
|
Resolute Investment Managers, Inc. |
Banking, Finance, Insurance & Real Estate |
Senior Secured Second Lien Term Loan LIBOR + 7.500%, 1.000% Floor (4)(5) |
4/30/2023 |
7,950,000 | 7,914,608 | 7,950,000 | 1.3 | % | ||||||||||||||
| 7,950,000 | 7,914,608 | 7,950,000 | ||||||||||||||||||||
|
Rhombus Cinema Holdings, LP |
Media: Diversified & Production |
Preferred Equity 10.000% - 7,449 shares (5)(9) |
— | 4,584,207 | 2,979,615 | 0.5 | % | |||||||||||||||
|
Common Units - 3,163 units (5)(8)(11) |
— | 3,162,793 | — | 0.0 | % | |||||||||||||||||
| — | 7,747,000 | 2,979,615 | ||||||||||||||||||||
|
SavATree, LLC |
Environmental Industries |
Senior Secured First Lien Term Loan LIBOR + 5.000%, 1.000% Floor (4)(5) |
6/2/2022 |
4,333,601 | 4,333,601 | 4,333,601 | 0.7 | % | ||||||||||||||
| 4,333,601 | 4,333,601 | 4,333,601 | ||||||||||||||||||||
|
SFP Holding, Inc. |
Construction & Building |
Senior Secured First Lien Term Loan LIBOR + 6.250%, 1.000% Floor (5)(6)(11) |
9/1/2022 |
9,367,373 | 9,367,373 | 9,367,373 | 1.6 | % | ||||||||||||||
|
Senior Secured First Lien Delayed Draw Term Loan LIBOR + 6.250%, 1.000% Floor (5)(6)(11) |
9/1/2022 |
161,625 | 161,625 | 161,625 | 0.0 | % | ||||||||||||||||
| Equity - 0.803% of outstanding equity (5)(11) | — | 657,115 | 591,403 | 0.1 | % | |||||||||||||||||
| 9,528,998 | 10,186,113 | 10,120,401 | ||||||||||||||||||||
|
Company(1)(2) |
Industry |
Type of Investment |
Maturity |
Par Amount |
Cost |
Fair Value |
% of Net Assets(3) |
|||||||||||||||
|
Shift4 Payments, LLC |
Banking, Finance, Insurance & Real Estate |
Senior Secured Second Lien Term Loan LIBOR + 4.500%, 1.000% Floor (4)(5) |
11/29/2024 |
3,491,094 | 3,474,373 | 3,502,266 | 0.6 | % | ||||||||||||||
|
Senior Secured Second Lien Term Loan LIBOR + 8.500%, 1.000% Floor (4)(5) |
11/28/2025 |
9,950,000 | 9,875,970 | 9,950,000 | 1.7 | % | ||||||||||||||||
| 13,441,094 | 13,350,343 | 13,452,266 | ||||||||||||||||||||
|
Ship Supply Acquisition Corporation |
Services: Business |
Senior Secured First Lien Term Loan LIBOR + 8.000%, 1.000% Floor (4)(5)(13) |
7/31/2020 |
21,799,085 | 21,427,121 | — | 0.0 | % | ||||||||||||||
| 21,799,085 | 21,427,121 | — | ||||||||||||||||||||
|
Simplified Logistics, LLC |
Services: Business |
Senior Secured First Lien Term Loan LIBOR + 6.500%, 1.000% Floor (4)(5)(6) |
2/28/2022 |
18,481,420 | 18,481,420 | 18,481,420 | 3.1 | % | ||||||||||||||
| 18,481,420 | 18,481,420 | 18,481,420 | ||||||||||||||||||||
|
SMART Financial Operations, LLC |
Retail |
Preferred Equity - 1,000,000 units (5)(9)(11) |
— | 1,000,000 | 760,000 | 0.1 | % | |||||||||||||||
| — | 1,000,000 | 760,000 | ||||||||||||||||||||
|
Smile Doctors, LLC |
Healthcare & Pharmaceuticals |
Senior Secured First Lien Term Loan LIBOR + 6.000%, 1.000% Floor (4)(5) |
10/6/2022 |
8,250,167 | 8,250,167 | 8,078,563 | 1.4 | % | ||||||||||||||
| Senior Secured First Lien Delayed Draw Term Loan LIBOR + 6.000%, 1.000% Floor (4)(5)(6) | 10/6/2022 | 4,642,608 | 4,642,608 | 4,525,356 | 0.8 | % | ||||||||||||||||
| 12,892,775 | 12,892,775 | 12,603,919 | ||||||||||||||||||||
|
Sound Point CLO XX, Ltd. |
Multi-Sector Holdings |
Subordinated Notes 12.370% effective yield (5)(8)(9)(10) |
7/26/2031 |
4,489,000 | 3,895,539 | 3,736,644 | 0.6 | % | ||||||||||||||
| 4,489,000 | 3,895,539 | 3,736,644 | ||||||||||||||||||||
|
Starfish Holdco, LLC |
High Tech Industries |
Senior Secured Second Lien Term Loan LIBOR + 9.000%, 1.000% Floor (5)(7) |
8/18/2025 |
4,000,000 | 3,957,111 | 3,862,000 | 0.7 | % | ||||||||||||||
| 4,000,000 | 3,957,111 | 3,862,000 | ||||||||||||||||||||
|
Sungard AS New Holdings, LLC |
Services: Business |
Senior Secured First Lien Term Loan LIBOR + 4.000%, 1.000% Floor, 2.500% PIK (4) |
11/3/2022 |
4,994,410 | 4,994,410 | 4,078,935 | 0.7 | % | ||||||||||||||
|
Senior Secured First Lien Term Loan LIBOR + 7.500%, 1.000% Floor (4) |
2/3/2022 |
714,915 | 698,047 | 693,467 | 0.1 | % | ||||||||||||||||
|
Membership units - 73,135 units (11) |
— | 2,163,076 | 2,163,041 | 0.4 | % | |||||||||||||||||
| 5,709,325 | 7,855,533 | 6,935,443 | ||||||||||||||||||||
|
Team Car Care, LLC |
Automotive |
Senior Secured First Lien Term Loan LIBOR + 8.000%, 1.000% Floor (4) |
2/23/2023 |
14,091,320 | 14,091,319 | 13,926,451 | 2.4 | % | ||||||||||||||
| 14,091,320 | 14,091,319 | 13,926,451 | ||||||||||||||||||||
|
Techniplas, LLC |
Automotive |
Senior Secured First Lien Notes 10.000% (8) |
5/1/2020 |
6,000,000 | 6,000,000 | 5,137,200 | 0.9 | % | ||||||||||||||
| 6,000,000 | 6,000,000 | 5,137,200 | ||||||||||||||||||||
|
Tensar Corporation |
Capital Equipment |
Senior Secured First Lien Term Loan LIBOR + 4.750%, 1.000% Floor, 3.000% PIK (4) |
7/9/2021 |
6,900,187 | 6,778,258 | 6,537,927 | 1.1 | % | ||||||||||||||
| 6,900,187 | 6,778,258 | 6,537,927 | ||||||||||||||||||||
|
The Imagine Group LLC |
Media: Advertising, Printing & Publishing |
Senior Secured Second Lien Term Loan LIBOR + 8.750%, 1.000% Floor (5)(7)(13) |
6/21/2023 |
8,950,000 | 8,623,411 | 1,700,500 | 0.3 | % | ||||||||||||||
| 8,950,000 | 8,623,411 | 1,700,500 | ||||||||||||||||||||
|
The Octave Music Group, Inc. |
Media: Diversified & Production |
Senior Secured Second Lien Term Loan LIBOR + 8.250%, 1.000% Floor (5)(7) |
5/27/2022 |
6,532,258 | 6,532,258 | 6,513,968 | 1.1 | % | ||||||||||||||
| 6,532,258 | 6,532,258 | 6,513,968 | ||||||||||||||||||||
|
True Religion Apparel, Inc. |
Retail |
Senior Secured First Lien Term Loan 10.000% (13) |
10/27/2022 |
179,896 | 134,083 | 23,386 | 0.0 | % | ||||||||||||||
| Common Stock - 2,448 shares(11) | — | — | — | 0.0 | % | |||||||||||||||||
| Warrants - 1,122 warrants (11) | — | — | — | 0.0 | % | |||||||||||||||||
| 179,896 | 134,083 | 23,386 | ||||||||||||||||||||
|
Company(1)(2) |
Industry |
Type of Investment |
Maturity |
Par Amount |
Cost |
Fair Value |
% of Net Assets(3) |
|||||||||||||||
|
Velocity Pooling Vehicle, LLC |
Automotive |
Senior Secured First Lien Term Loan LIBOR + 11.000%, 1.000% Floor (4)(5) |
4/28/2023 |
794,055 | 747,813 | 704,803 | 0.1 | % | ||||||||||||||
|
Common units - 4,676 units (5)(11) |
— | 259,938 | 17,956 | 0.0 | % | |||||||||||||||||
|
Warrants - 5,591 warrants(5)(11) |
3/30/2028 |
— | 310,802 | 21,469 | 0.0 | % | ||||||||||||||||
| 794,055 | 1,318,553 | 744,228 | ||||||||||||||||||||
|
Vertafore, Inc. |
High Tech Industries |
Senior Secured Second Lien Term Loan LIBOR + 7.250%, 1.000% Floor (5)(7) |
7/2/2026 |
9,950,000 | 9,818,168 | 9,827,615 | 1.7 | % | ||||||||||||||
| 9,950,000 | 9,818,168 | 9,827,615 | ||||||||||||||||||||
|
VOYA CLO 2016-2, LTD. |
Multi-Sector Holdings |
Subordinated Notes 6.704% effective yield (5)(8)(9)(10) |
7/19/2028 |
11,088,290 | 8,296,086 | 6,199,335 | 1.0 | % | ||||||||||||||
| 11,088,290 | 8,296,086 | 6,199,335 | ||||||||||||||||||||
|
VOYA CLO 2015-2, LTD. |
Multi-Sector Holdings |
Subordinated Notes 16.348% effective yield (5)(8)(9)(10) |
7/19/2028 |
10,735,659 | 6,716,495 | 6,026,473 | 1.0 | % | ||||||||||||||
| 10,735,659 | 6,716,495 | 6,026,473 | ||||||||||||||||||||
|
Walker Edison Furniture Company LLC |
Consumer Goods: Durable |
Senior Secured First Lien Term Loan LIBOR + 6.500%, 1.000% Floor (4)(5) |
9/26/2024 |
14,625,000 | 14,625,000 | 14,771,250 | 2.5 | % | ||||||||||||||
|
Common units - 2,000 units (5)(9)(11) |
— | 2,000,000 | 4,111,210 | 0.7 | % | |||||||||||||||||
| 14,625,000 | 16,625,000 | 18,882,460 | ||||||||||||||||||||
|
Watermill-QMC Midco, Inc. |
Automotive |
Equity - 1.62% partnership interest (5)(9)(11) |
— | 902,277 | 53,776 | 0.0 | % | |||||||||||||||
| — | 902,277 | 53,776 | ||||||||||||||||||||
| Total non-controlled/non-affiliated investments | 651,393,473 | 567,402,503 | 96.0% | |||||||||||||||||||
|
Controlled/affiliated investments - 18.3% (14) |
||||||||||||||||||||||
|
1888 Industrial Services, LLC |
Energy: Oil & Gas |
Revolving Credit Facility LIBOR + 5.000%, 1.000% Floor (4)(5)(6) |
9/30/2021 |
1,183,094 | 1,183,094 | 1,183,094 | 0.2 | % | ||||||||||||||
| Senior Secured First Lien Term Loan LIBOR + 5.000%, 1.000% Floor (4)(5) | 9/30/2021 | 3,315,574 | 3,315,574 | 3,315,574 | 0.6 | % | ||||||||||||||||
|
Senior Secured First Lien Term Loan LIBOR + 8.000%, 1.000% Floor, PIK (4)(5)(13) |
9/30/2021 |
8,454,467 | 6,816,029 | 2,113,617 | 0.4 | % | ||||||||||||||||
| Senior Secured First Lien Term Loan LIBOR + 5.000%, 1.000% Floor (4)(5) | 6/30/2021 | 416,940 | 416,940 | 416,940 | 0.1 | % | ||||||||||||||||
| Senior Secured First Lien Term Loan LIBOR + 5.000%, 1.000% Floor (4)(5) | 9/19/2020 | 79,986 | 79,986 | 79,986 | 0.0 | % | ||||||||||||||||
|
Senior Secured First Lien Term Loan LIBOR + 5.000%, 1.000% Floor (4)(5) |
9/19/2020 |
288,300 | 288,300 | 288,300 | 0.0 | % | ||||||||||||||||
|
Units - 7,546.76 units (5)(11) |
— | — | — | 0.0 | % | |||||||||||||||||
| 13,738,361 | 12,099,923 | 7,397,511 | ||||||||||||||||||||
|
Access Media Holdings, LLC |
Media: Broadcasting & Subscription |
Senior Secured First Lien Term Loan 10.000% PIK (5)(7)(13) |
7/22/2020 |
9,005,670 | 7,458,342 | 2,251,418 | 0.4 | % | ||||||||||||||
|
Common Stock - 140 units (5)(9)(11) |
— | — | — | 0.0 | % | |||||||||||||||||
|
Preferred Equity - 1,400,000 units (5)(9)(11) |
— | 1,400,000 | — | 0.0 | % | |||||||||||||||||
|
Preferred Equity - 700,000 units (5)(9)(11) |
— | 700,000 | — | 0.0 | % | |||||||||||||||||
|
Preferred Equity - 849,800 units (5)(6)(9)(11) |
— | 849,800 | (88,200 | ) | 0.0 | % | ||||||||||||||||
| 9,005,670 | 10,408,142 | 2,163,218 | ||||||||||||||||||||
|
Caddo Investors Holdings 1 LLC |
Forest Products & Paper |
Equity - 12.250% LLC Interest (5)(9)(15) |
— | 5,027,482 | 5,765,253 | 1.0 | % | |||||||||||||||
| — | 5,027,482 | 5,765,253 | ||||||||||||||||||||
|
Charming Charlie LLC |
Retail |
Senior Secured First Lien Term Loan LIBOR + 10.000%, 1.000% Floor (4)(13) |
4/24/2023 |
3,412,549 | 3,121,470 | — | 0.0 | % | ||||||||||||||
|
Company(1)(2) |
Industry |
Type of Investment |
Maturity |
Par Amount |
Cost |
Fair Value |
% of Net Assets(3) |
|||||||||||||||
|
Senior Secured First Lien Term Loan LIBOR + 10.000%, 1.000% Floor (4)(13) |
4/24/2023 |
4,178,224 | 2,737,658 | — | 0.0 | % | ||||||||||||||||
|
Senior Secured First Lien Term Loan 20.000% |
5/15/2020 |
150,642 | 150,642 | 112,981 | 0.0 | % | ||||||||||||||||
|
Senior Secured First Lien Delayed Draw Term Loan 20.000% (7)(13) |
5/15/2020 |
837,367 | 837,367 | 628,025 | 0.1 | % | ||||||||||||||||
|
Common Stock - 34,923,249 shares (11) |
— | — | — | 0.0 | % | |||||||||||||||||
| 8,578,782 | 6,847,137 | 741,006 | ||||||||||||||||||||
|
Dynamic Energy Services International LLC |
Energy: Oil & Gas |
Senior Secured First Lien Term Loan 13.500% PIK(5)(7)(13) |
12/31/2021 |
6,089,982 | 4,449,025 | 692,431 | 0.1 | % | ||||||||||||||
|
Common Units - 6,500,000 units (5)(11) |
— | — | — | 0.0 | % | |||||||||||||||||
| 6,089,982 | 4,449,025 | 692,431 | ||||||||||||||||||||
|
Kemmerer Operations, LLC |
Metals & Mining |
Senior Secured First Lien Term Loan 15.000% PIK |
6/21/2023 |
1,834,227 | 1,834,227 | 1,834,227 | 0.3 | % | ||||||||||||||
|
Senior Secured First Lien Delayed Draw Term Loan 15.000% PIK (6) |
6/21/2023 |
461,035 | 461,035 | 461,035 | 0.1 | % | ||||||||||||||||
|
Common Units - 6.7797 units (11) |
— | 962,717 | 962,760 | 0.2 | % | |||||||||||||||||
| 2,295,262 | 3,257,979 | 3,258,022 | ||||||||||||||||||||
|
MCM 500 East Pratt Holdings, LLC |
Banking, Finance, Insurance & Real Estate |
Equity - 5,000,000 units (9)(11) |
— | 5,000,000 | 7,350,000 | 1.2 | % | |||||||||||||||
| — | 5,000,000 | 7,350,000 | ||||||||||||||||||||
|
MCM Capital Office Park Holdings LLC |
Banking, Finance, Insurance & Real Estate |
Equity - 7,500,000 units (9)(11) |
— | 7,500,000 | 11,775,000 | 2.0 | % | |||||||||||||||
| — | 7,500,000 | 11,775,000 | ||||||||||||||||||||
|
Sierra Senior Loan Strategy JV I LLC |
Multi-Sector Holdings |
Equity - 87.5% ownership of SIC Senior Loan Strategy JV I LLC (6)(9)(15) |
92,050,000 | 92,050,000 | 68,434,389 | 11.6 | % | |||||||||||||||
| 92,050,000 | 92,050,000 | 68,434,389 | ||||||||||||||||||||
|
TwentyEighty, Inc. |
Services: Business |
Common Units - 58,098 units(11) |
— | — | 644,597 | 0.1 | % | |||||||||||||||
| — | — | 644,597 | ||||||||||||||||||||
|
Total controlled/affiliated investments |
146,639,688 | 108,221,427 | 18.3 | % | ||||||||||||||||||
|
Money Market Fund - 32.5% |
||||||||||||||||||||||
|
State Street Institutional Liquid Reserves Fund |
Money Market 1.730%(12) |
82,288,653 | 82,296,916 | 82,296,882 | 13.9 | % | ||||||||||||||||
|
Federated Institutional Prime Obligations Fund |
Money Market 1.740% (12) |
109,958,375 | 109,958,375 | 109,958,375 | 18.6 | % | ||||||||||||||||
|
Total money market fund |
$ | 192,247,028 | $ | 192,255,291 | $ | 192,255,257 | 32.5 | % | ||||||||||||||
|
(1) |
All of the Company's investments are domiciled in the United States except for AMMC CLO 22, Limited Series 2018-22A, Apidos CLO XXIV, Series 2016-24A, Dryden 38 Senior Loan Fund, Series 2015-38A, Dryden 43 Senior Loan Fund, Series 2016-43A, Dryden 49 Senior Loan Fund, 2017-49A, Magnetite XIX, Limited, Sound Point CLO XX, Ltd., VOYA CLO 2016-2, LTD., and VOYA CLO 2015-2, LTD., which are all domiciled in the Cayman Islands. All foreign investments were denominated in US Dollars. |
|
(2) |
Unless otherwise indicated, all securities are valued using significant unobservable inputs, which are categorized as Level 3 assets under the definition of ASC 820 fair value hierarchy. |
|
(3) |
Percentage is based on net assets of $591,062,721 as of December 31, 2019. |
|
(4) |
The interest rate on these loans is subject to a base rate plus 3 Month “3M” LIBOR, which at December 31, 2019 was 1.91%. As the interest rate is subject to a minimum LIBOR floor, the prevailing rate in effect at December 31, 2019 was the base rate plus the LIBOR floor or 3M LIBOR. |
|
(5) |
An affiliated fund that is managed by an affiliate of SIC Advisors also holds an investment in this security. |
| (6) | The investment has an unfunded commitment as of December 31, 2019. For further details, see Note 11. Fair value includes an analysis of the unfunded commitment. |
|
(7) |
The interest rate on these loans is subject to a base rate plus 1 Month "1M" LIBOR, which at December 31, 2019 was 1.76%. As the interest rate is subject to a minimum LIBOR floor, the prevailing rate in effect at December 31, 2019 was the base rate plus the LIBOR floor or 1M LIBOR. |
|
(8) |
Securities are exempt from registration under Rule 144A of the Securities Act of 1933. These securities represent a fair value of $66,981,461 or 11.3% of net assets as of December 31, 2019 and are considered restricted. |
|
(9) |
The investment is not a qualifying asset as defined under Section 55(a) of the Investment Company Act of 1940 (the "1940 Act"). Non-qualifying assets represent 27.9% of the Company's portfolio at fair value. |
|
(10) |
This investment is in the equity class of a collateralized loan obligation ("CLO"). The CLO equity investments are entitled to recurring distributions which are generally equal to the excess cash flow generated from the underlying investments after payment of the contractual payments to debt holders and fund expenses. The current estimated yield is based on the current projections of this excess cash flow taking into account assumptions that have been made regarding expected prepayments, losses and future reinvestment rates. These assumptions are periodically reviewed and adjusted. Ultimately, the actual yield may be higher or lower than the estimated yield if actual results differ from those used for the assumptions. |
|
(11) |
Security is non-income producing. |
| (12) | Represents securities in Level 1 in the ASC 820 table (see Note 4). |
|
(13) |
The investment was on non-accrual status as of December 31, 2019. |
|
(14) |
Affiliate Investments are defined by the 1940 Act as investments in companies in which the Company owns at least 5% but no more than 25% of the voting securities or we are under common control with such portfolio company. Control Investments are defined by the 1940 Act as investments in companies in which the Company owns more than 25% of the voting securities or maintains greater than 50% of the board representation. |
|
(15) |
As a practical expedient, the Company uses NAV to determine the fair value of this investment. |
See accompanying notes to consolidate financial statements
Notes to Consolidated Financial Statements
Note 1. Organization
Sierra Income Corporation (the “Company”) was incorporated under the general corporation laws of the State of Maryland on June 13, 2011 and formally commenced operations on April 17, 2012. The Company is an externally managed, non-diversified closed-end management investment company that has elected to be treated as a business development company (“BDC”) under the Investment Company Act of 1940, as amended (the "1940 Act"). The Company is externally managed by SIC Advisors LLC (“SIC Advisors”), an investment adviser with the Securities and Exchange Commission (the “SEC”) under the Investment Advisers Act of 1940, as amended (the “Advisers Act”). SIC Advisors is a wholly owned subsidiary of Medley LLC, which is controlled by Medley Management Inc., a publicly traded asset management firm (NYSE: MDLY), which in turn is controlled by Medley Group LLC, an entity wholly-owned by the senior professionals of Medley LLC. The term “Medley” refers to the collective activities of Medley Capital LLC, Medley LLC, Medley Management Inc., Medley Group LLC, SIC Advisors, associated investment funds and their respective affiliates. The Company has elected, and intends to qualify annually, to be treated for U.S. federal income tax purposes as a regulated investment company (“RIC”) under Subchapter M of the Internal Revenue Code of 1986, as amended (the “Code”). The Company’s fiscal year-end is December 31.
On April 17, 2012, the Company successfully reached its minimum escrow requirement and officially commenced operations by issuing 1,108,033 shares of common stock to SIC Advisors for gross proceeds of $10,000,000. On July 2, 2018, the Company’s board of directors determined to terminate the Company’s offering effective as of July 31, 2018. The Company has sold a total of 102,630,605 shares of common stock, which includes shares issued as part of the distribution reinvestment plan (see Note 13), for total proceeds of $1.0 billion, which includes the shares sold to SIC Advisors. The proceeds from the issuance of common stock are presented in the Company’s Consolidated Statements of Changes in Net Assets and Consolidated Statements of Cash Flows and are presented net of selling commissions and dealer manager fees.
On August 15, 2013, the Company formed Arbor Funding LLC ("Arbor"), a wholly-owned financing subsidiary.
On June 18, 2014, the Company formed Alpine Funding LLC ("Alpine"), a wholly-owned financing subsidiary.
On July 2, 2020, the Company purchased STRF Holdings LLC ("STRF"), a wholly-owned subsidiary.
The Company has formed and expects to continue to form certain taxable subsidiaries (the “Taxable Subsidiaries”), which are taxed as corporations for U.S. federal income tax purposes. Taxable Subsidiaries allow the Company to hold equity securities of portfolio companies organized as pass-through entities while continuing to satisfy the requirements applicable to a RIC under the Code.
The Company’s investment objective is to generate current income, and to a lesser extent, long-term capital appreciation. The Company intends to meet its investment objective by investing primarily in the debt of privately owned U.S. companies with a focus on senior secured debt, second lien debt and, to a lesser extent, subordinated debt. The Company will originate transactions sourced through SIC Advisors’ direct origination network, and also expects to acquire debt securities through the secondary market. The Company may make equity investments in companies that it believes will generate appropriate risk adjusted returns, although it does not expect such investments to be a substantial portion of the portfolio.
Termination of the Agreements and Plan of Mergers
Section 9.1(c) of the Amended MCC Merger Agreement and Section 9.1(c) of the Amended MDLY Merger Agreement each permits the Company and either MCC or MDLY, as applicable, to terminate the Amended MCC Merger Agreement and the Amended MDLY Merger Agreement, respectively, if the MCC Merger or the MDLY Merger, as applicable, has not been consummated on or before March 31, 2020 (the “Outside Date”). On May 1, 2020, the Company terminated both the Amended MCC Merger Agreement and the Amended MDLY Merger Agreement effective as of May 1, 2020 as the Outside Date had passed and neither the MCC Merger or the MDLY Merger had been consummated. In determining to terminate the Amended MCC Merger Agreement and the Amended MDLY Merger Agreement, the Company considered a number of factors, including, among other factors, changes in the relative valuations of the Company, MCC, and MDLY, the changed circumstances and the unpredictable economic conditions resulting from the global health crisis caused by the coronavirus (COVID-19) pandemic, and the uncertainty regarding the parties’ ability to satisfy the conditions to closing in a timely manner.
Basis of Presentation
The Company follows the accounting and reporting guidance in the Financial Accounting Standards Board Accounting Standards Codification ("ASC") Topic 946 - Financial Services, Investment Companies ("ASC 946"). The accompanying consolidated financial statements have been prepared on the accrual basis of accounting in conformity with U.S. generally accepted accounting principles (“GAAP”) and includes the accounts of the Company and its wholly-owned subsidiaries, Alpine, Arbor, and the Taxable Subsidiaries. All intercompany balances and transactions have been eliminated in consolidation. All references made to the “Company,” “we,” and “us” herein include Sierra Income Corporation and its consolidated subsidiaries, except as stated otherwise. Additionally, the accompanying consolidated financial statements of the Company and related financial information have been prepared pursuant to the requirements for reporting on Form 10-K and Article 10 of Regulation S-X of the Securities Act of 1933. All intercompany balances and transactions have been eliminated.
Cash and Cash Equivalents
The Company considers cash equivalents to be highly liquid investments or investments with original maturities of three months or less. Cash and cash equivalents include deposits in money market mutual funds. The Company deposits its cash in major United States financial institutions which, at times, may be in excess of the Federal Deposit Insurance Corporation insurance limits.
Use of Estimates in the Preparation of Financial Statements
The preparation of financial statements in conformity with GAAP requires management to make estimates and assumptions that affect the reported amounts of assets and liabilities, and disclosure of contingent assets and liabilities at the date of the financial statements and the reported amounts of revenues and expenses during the reporting period. Actual results could differ from those estimates.
Deferred Financing Costs
Financing costs, incurred in connection with the Company’s credit facilities (see Note 6), are deferred and amortized over the life of each corresponding facility.
Deferred Transaction Costs
Transaction costs incurred in connection with the Proposed Mergers (see Note 1), were deferred until the closing or termination of the Proposed Mergers. On May 1, 2020, the Company terminated the Amended MCC Merger Agreement and the Amended MDLY Merger Agreement. As a result of the foregoing, the deferred transaction costs were recorded as a component of professional fees and general and administrative expenses on our Consolidated Statements of Operations.
Indemnification
In the normal course of business, the Company enters into contractual agreements that provide general indemnifications against losses, costs, claims and liabilities arising from the performance of individual obligations under such agreements. The Company has had no claims or payments pursuant to such agreements. The Company’s individual maximum exposure under these arrangements is unknown, as this would involve future claims that may be made against the Company that have not yet occurred. However, based on management’s experience, the Company expects the risk of loss to be remote.
Revenue Recognition
Interest income, adjusted for amortization of premiums and accretion of discounts, is recorded on an accrual basis. The Company records amortized or accreted discounts or premiums as interest income using the effective interest method. Dividend income, which represents dividends from equity investments and distributions from subsidiaries, if any, is recognized on an accrual basis to the extent that the Company expects to collect such amount.
Fee income associated with investments in portfolio companies is recognized as income in the period that the Company becomes entitled to such fees. Other fees related to loan administration requirements are capitalized as deferred revenue and recorded into income over the respective period.
Prepayment penalties received by the Company for debt instruments paid back to the Company prior to the maturity date are recorded as income upon receipt.
The Company holds debt investments that contain a payment-in-kind ("PIK") interest provision. PIK interest, which represents contractually deferred interest added to the investment balance that is generally due at maturity, is recorded on an accrual basis to the extent such amounts are expected to be collected. PIK interest is not accrued if the Company does not expect the issuer to be able to pay all principal and interest when due. For the years ended December 31, 2020, 2019 and 2018, the Company earned $2,024,218, $4,155,616 and $4,275,731 in PIK interest, respectively.
Investment transactions are accounted for on a trade-date basis. Realized gains or losses on investments are measured by the difference between the net proceeds from the disposition and the amortized cost basis of investment, without regard to unrealized gains or losses previously recognized. During the year ended December 31, 2019, the Company recognized $16,060,644, in realized losses related to certain non-cash restructuring transactions, which are recorded on the Consolidated Statements of Operations as a component of net realized gain/(loss) from controlled/affiliated investments. During the years ended December 31, 2020 and December 31, 2018, the Company did not recognize any realized gains or losses related to non-cash restructuring transactions from controlled/affiliated investments. During the years ended December 31, 2020, 2019 and 2018, the Company recognized $7,627,874, $6,990,377 and $47,049,926, respectively, in realized losses related to certain non-cash restructuring transactions, which are recorded on the Consolidated Statements of Operations as a component of net realized gain/(loss) from non-controlled/non-affiliated investments. The Company reports changes in fair value of investments that are measured at fair value as a component of the net change in unrealized appreciation/(depreciation) on investments in the Consolidated Statements of Operations. For total return swap transactions (see Note 5), periodic payments are received or made at the end of each settlement period, but prior to settlement are recorded as realized gains or losses on total return swap in the Consolidated Statements of Operations.
Management reviews all loans that become 90 days or more past due on principal and interest or when there is reasonable doubt that principal or interest will be collected for possible placement on management's designation of non-accrual status. Accrued interest is generally reserved when a loan is placed on non-accrual status. Interest payments received on non-accrual loans may be recognized as income or applied to principal depending upon management’s judgment regarding collectability. Loans on non-accrual status are restored to accrual status when past due principal and interest is paid and, in management’s judgment, are likely to remain current, although the Company may make exceptions to this general rule if the loan has sufficient collateral value and is in the process of collection. As of December 31, 2020, certain investments in twelve portfolio companies were on non-accrual status with a combined cost of $83,537,754, or 11.9% of the cost of the Company's portfolio, and a combined fair value of $30,649,219, or 5.1% of the fair value of the Company's portfolio. As of December 31, 2019, certain investments in ten portfolio companies were on non-accrual status with a combined cost of $92,443,091, or 11.6% of the cost of the Company's portfolio, and a combined fair value of $17,447,291 or 2.6% of the fair value of the Company's portfolio.
Interest income from investments in the “equity” class of a collateralized loan obligation ("CLO") security (typically subordinated notes) is recorded based upon an estimation of an effective yield to expected maturity utilizing assumed cash flows in accordance with ASC 325-40, Beneficial Interests in Securitized Financial Assets. The Company monitors the expected cash flows from these investments, including the expected residual payments, and the effective yield is determined and updated periodically. Any difference between the cash distribution received and the amount calculated pursuant to the effective interest method is recorded as an adjustment to the cost basis of such investments.
Investment Classification
The Company classifies its investments in accordance with the requirements of the 1940 Act. Under the 1940 Act, the Company would be deemed to “control” a portfolio company if it owns more than 25% of its outstanding voting securities and/or had the power to exercise control over the management or policies of such portfolio company. The Company refers to such investments in portfolio companies that it “controls” as “Controlled Investments.” Under the 1940 Act, the Company would be deemed to be an “Affiliated Person” of a portfolio company if it owns at least 5%, but no more than 25%, of the portfolio company’s outstanding voting securities or if it is under common control with such portfolio company. The Company refers to such investments in Affiliated Persons as “Affiliated Investments.”
Valuation of Investments
The Company applies fair value accounting to all of its financial instruments in accordance with the 1940 Act and ASC Topic 820 - Fair Value Measurements and Disclosures (“ASC 820”). ASC 820 defines fair value, establishes a framework used to measure fair value and requires disclosures for fair value measurements. In accordance with ASC 820, the Company has categorized its financial instruments carried at fair value, based on the priority of the valuation technique, into a three-level fair value hierarchy as discussed in Note 4. Fair value is a market-based measure considered from the perspective of the market participant who holds the financial instrument rather than an entity specific measure. Therefore, when market assumptions are not readily available, the Company’s own assumptions are set to reflect those that management believes market participants would use in pricing the financial instrument at the measurement date.
Investments for which market quotations are readily available are valued at such market quotations, which are generally obtained from an independent pricing service or multiple broker-dealers or market makers. The Company weighs the use of third-party broker quotations, if any, in determining fair value based on management's understanding of the level of actual transactions used by the broker to develop the quote and whether the quote was an indicative price or binding offer. However, debt investments with remaining maturities within 60 days that are not credit impaired are valued at cost plus accreted discount, or minus amortized premium, which approximates fair value. Investments for which market quotations are not readily available are valued at fair value as determined by the Company’s board of directors based upon input from management and third-party valuation firms. Because these investments are illiquid and there may not be any directly comparable companies whose financial instruments have observable market values, these loans are valued using a fundamental valuation methodology, consistent with traditional asset pricing standards, that is objective and consistently applied across all loans and through time.
Investments in investment companies are valued at fair value. Fair values are generally determined utilizing the net asset value ("NAV") supplied by, or on behalf of, management of each investment company, which is net of management and incentive fees or allocations charged by the investment company and is in accordance with the "practical expedient", as defined by ASC 820. NAVs received by, or on behalf of, management of each investment company are based on the fair value of the investment company's underlying investments in accordance with policies established by management of each investment company, as described in each of their financial statements and offering memorandum.
The methodologies utilized by the Company in estimating the fair value of its investments categorized as Level 3 generally fall into the following two categories:
|
• |
The “Market Approach” uses prices and other relevant information generated by market transactions involving identical or comparable assets, liabilities, or a group of assets and liabilities, such as a business. |
|
• |
The “Income Approach” converts future amounts (for example, cash flows or income and expenses) to a single current (that is, discounted) amount. When the Income Approach is used, the fair value measurement reflects current market expectations about those future amounts. |
The Company uses third-party valuation firms to assist the board of directors in the valuation of its portfolio investments. The valuation reports generated by the third-party valuation firms consider the evaluation of financing and sale transactions with third parties, expected cash flows and market based information, including comparable transactions, performance multiples, and movement in yields of debt instruments, among other factors. Based on market data obtained from the third-party valuation firms, the Company uses a combined market yield analysis and an enterprise model of valuation. In applying the market yield analysis, the value of the Company’s loans is determined based upon inputs such as the coupon rate, current market yield, interest rate spreads of similar securities, the stated value of the loan, and the length to maturity. In applying the enterprise model, the Company uses a waterfall analysis which takes into account the specific capital structure of the borrower and the related seniority of the instruments within the borrower’s capital structure into consideration. To estimate the enterprise value of the portfolio company, the Company weighs some or all of the traditional market valuation methods and factors based on the individual circumstances of the portfolio company in order to estimate the enterprise value. The methodologies for performing investments may be based on, among other things: valuations of comparable public companies, recent sales of private and public comparable companies, discounting the forecasted cash flows of the portfolio company, third party valuations of the portfolio company, considering offers from third parties to buy the company, estimating the value to potential strategic buyers and considering the value of recent investments in the equity securities of the portfolio company. For non-performing investments, the Company may estimate the liquidation or collateral value of the portfolio company’s assets and liabilities using an expected recovery model. The Company may estimate the fair value of warrants based on a model such as the Black-Scholes model or simulation models or a combination thereof.
The methodologies and information that the Company utilizes when applying the Market Approach for performing investments includes, among other things:
|
• |
valuations of comparable public companies (“Guideline Comparable Approach”); |
|
• |
recent sales of private and public comparable companies (“Guideline Comparable Approach”); |
|
• |
recent acquisition prices of the company, debt securities or equity securities (“Recent Arms-length Transaction”); |
|
• |
external valuations of the portfolio company, offers from third parties to buy the company (“Estimated Sales Proceeds Approach”); |
|
• |
subsequent sales made by the company of its investments (“Expected Sales Proceeds Approach”); and |
|
• |
estimating the value to potential buyers. |
The methodologies and information that the Company utilizes when applying the Income Approach for performing investments includes:
|
• |
discounting the forecasted cash flows of the portfolio company or securities (“Discounted Cash Flow” or “DCF” Approach); and |
|
• |
Black-Scholes model or simulation models or a combination thereof (Income Approach – Option Model) with respect to the valuation of warrants. |
For non-performing investments, the Company may estimate the liquidation or collateral value of the portfolio company’s assets and liabilities using an expected recovery model. The Company may estimate the fair value of warrants based on a model such as the Black-Scholes model or simulation models or a combination thereof.
Over-the-counter derivative contracts, such as total return swaps (see Note 5) are fair valued using models that measure the change in fair value of reference assets underlying the swaps offset against any fees payable to the swap counterparty. The fair values of the reference assets underlying the swaps are determined using similar methods as described above for debt and equity investments where the Company also invests directly in such assets.
The Company undertakes a multi-step valuation process each quarter when valuing investments for which market quotations are not readily available, as described below:
|
• |
the quarterly valuation process begins with each portfolio investment being initially valued by the Company's valuation professionals; |
|
• |
preliminary valuation conclusions are then documented and discussed with senior management; and |
|
• |
an independent valuation firm engaged by the Company’s board of directors prepares an independent valuation report for approximately one-third of the portfolio investments each quarter on a rotating quarterly basis on non-fiscal year-end quarters, such that each of these investments will be valued by an independent valuation firm at least twice per annum when combined with the fiscal year-end review of all the investments by independent valuation firms. |
In addition, all of the Company’s investments are subject to the following valuation process:
|
• |
management reviews preliminary valuations and its own independent assessment; |
|
• |
the independent audit committee of the Company’s board of directors reviews the preliminary valuations of senior management and independent valuation firms; and |
|
• |
the Company’s board of directors discusses valuations and determines the fair value of each investment in the Company’s portfolio in good faith based on the input of SIC Advisors, the respective independent valuation firms and the audit committee. |
The Company’s investments in subordinated notes are carried at fair value, which is based on a discounted cash flow model. The discounted cash flow model models both the underlying collateral (assets) and the liabilities of the CLO capital structure. The discounted cash flow model uses a set of assumptions including projected default rates, recovery rates, reinvestment rates and prepayment rates in order to arrive at estimated cash flows of the assets. The discounted cash flow model distributes the asset cash flows to the liability structure based on the payment priorities and discounts them back using appropriate market discount rates based on discount rates for comparable CLOs. The assumptions are based on available market data as well as management estimates. Additional data is used to validate the results from the discounted cash flow method, such as analysis of relevant data observed in the CLO market, review of quotes, where available, recent acquisitions and observable transactions in the subordinated notes, among other factors.
Due to the inherent uncertainty of determining the fair value of investments that do not have a readily available market value, the fair value of the Company’s investments may differ significantly from the values that would have been used had a readily available market value existed for such investments, and the differences could be material.
Fair Value of Financial Instruments
The carrying amounts of certain of the Company’s financial instruments, including cash and accounts payable and accrued expenses, approximate fair value due to their short-term nature. The carrying amounts and fair values of the Company’s long-term obligations are discussed in Note 4.
U.S. Federal Income Taxes
The Company has elected, and intends to qualify annually, to be treated as a RIC under Subchapter M of the Code. In order to continue to qualify as a RIC, among other things, the Company is required to meet certain source of income and asset diversification requirements and timely distribute to its stockholders at least 90% of the sum of its investment company taxable income ( "ICTI") including PIK, as defined by the Code, and net tax-exempt interest income (which is the excess of the Company’s gross tax-exempt interest income over certain disallowed deductions) for each taxable year in order to be eligible for tax treatment under Subchapter M of the Code. Depending on the level of ICTI earned in a tax year, the Company may choose to carry forward ICTI in excess of current year dividend distributions into the next tax year. Any such carryover ICTI must be distributed before the end of that next tax year through a dividend declared prior to filing the final tax return related to the year which generated such ICTI.
The Company will be subject to a nondeductible U.S. federal excise tax of 4% on undistributed income if it does not distribute at least 98% of its ordinary income in any calendar year and 98.2% of its capital gain net income for each one-year period ending on October 31 of such calendar year. To the extent the Company determines that its estimated current year annual taxable income will be in excess of estimated current year dividend distributions for U.S. federal excise tax purposes, the Company accrues U.S. federal excise tax, if any, on estimated excess taxable income as taxable income is earned.
The Taxable Subsidiaries accrue income taxes payable based on the applicable corporate rates on the unrealized gains generated by the investments held by the Taxable Subsidiaries. As of December 31, 2020 and 2019, the Company recorded a deferred tax liability of $2,390,596 and $240,935, respectively, on the Consolidated Statements of Assets and Liabilities. The change in deferred tax liabilities is included as a component of net realized and unrealized gain/(loss) on investments on the Consolidated Statements of Operations.
ICTI generally differs from net investment income for financial reporting purposes due to temporary and permanent differences in the recognition of income and expenses. The Company may be required to recognize ICTI in certain circumstances in which it does not receive cash. For example, if the Company holds debt obligations that are treated under applicable tax rules as having original issue discount ("OID"), the Company must include in ICTI each year a portion of the OID that accrues over the life of the obligation, regardless of whether cash representing such income is received by the Company in the same taxable year. The Company may also have to include in ICTI other amounts that it has not yet received in cash, such as PIK interest income. Because any OID or other amounts accrued will be included in the Company’s ICTI for the year of accrual, the Company may be required to make a distribution to its stockholders in order to satisfy the minimum distribution requirements, even though the Company will not have received and may not ever receive any corresponding cash amount. ICTI also excludes net unrealized appreciation or depreciation, as investment gains or losses are not included in taxable income until they are realized.
Although the Company files federal and state tax returns, the Company's major tax jurisdiction is the United States federal jurisdiction. The Company’s federal and state tax returns for the prior three fiscal years remain open, subject to examination by the Internal Revenue Service.
The Company accounts for income taxes in conformity with ASC Topic 740 - Income Taxes (“ASC 740”). ASC 740 provides guidelines for how uncertain tax positions should be recognized, measured, presented and disclosed in financial statements. ASC 740 requires the evaluation of tax positions taken or expected to be taken in the course of preparing the Company’s tax returns to determine whether the tax positions are “more-likely-than-not” to be sustained by the applicable tax authority. Tax positions deemed to meet the “more-likely-than-not” threshold would be recorded as a tax benefit or expense in the current period. The Company recognizes interest and penalties, if any, related to unrecognized tax benefits as income tax expense in the Consolidated Statements of Operations. There were no interest or penalties due to material uncertain income tax positions at December 31, 2020, 2019 and 2018.
Permanent differences between ICTI and net investment income for financial reporting purposes are reclassified among capital accounts in the financial statements to reflect their tax character. During the years ended December 31, 2020, 2019 and 2018, the Company reclassified for book purposes amounts arising from permanent book/tax differences related to reversal of subsidiary blocker level income, and net operation losses.
|
As of December 31, |
||||||||||||
|
2020 |
2019 |
2018 |
||||||||||
|
Capital in excess of par value |
$ | (6,624,791 | ) | $ | 14,070,485 | $ | 2,281,761 | |||||
|
Total distributable earnings/(loss) |
6,624,791 | (14,070,485 | ) | (2,281,761 | ) | |||||||
The following table reflects, for U.S. federal income tax purposes, the sources of the cash distributions that the Company has paid on its common stock during the years ended December 31, 2020, 2019 and 2018:
|
2020 |
2019 |
2018 |
||||||||||||||||||||||
|
Source of Distribution |
Distribution Amount |
Percentage |
Distribution Amount |
Percentage |
Distribution Amount |
Percentage |
||||||||||||||||||
|
Ordinary income |
$ | — | — | % | $ | 38,237,797 | 59.6 | % | $ | 62,256,547 | 100.0 | % | ||||||||||||
|
Tax Return of Capital |
$ | 13,838,034 | 100.0 | % | $ | 25,924,607 | 40.4 | % | $ | — | — | % | ||||||||||||
|
Distributions on a tax basis: |
$ | 13,838,034 | 100.0 | % | $ | 64,162,404 | 100.0 | % | $ | 62,256,547 | 100.0 | % | ||||||||||||
For U.S. federal income tax purposes, the aggregate cost of investments owned as of December 31, 2020, 2019 and 2018 was $694,702,931, $795,136,133 and $1,010,325,183, respectively. For the year ended December 31, 2020, gross unrealized appreciation and depreciation for U.S. federal income tax purposes were $28,388,444 and $119,104,895, respectively, resulting in net unrealized depreciation of $90,716,451. For the year ended December 31, 2019, gross unrealized appreciation and depreciation for U.S. federal income tax purposes were $13,220,556 and $132,732,759, respectively, resulting in net unrealized depreciation of $119,512,203. For the year ended December 31, 2018, gross unrealized appreciation and depreciation for U.S. federal income tax purposes were $11,096,251 and $97,940,672, respectively, resulting in net unrealized depreciation of $86,844,421.
The following table shows the components of distributable earnings/(accumulated deficits) on a tax basis which includes temporary and other book/tax differences, primarily relating to wash sales, passive foreign investment company un-reversed inclusions, partnership basis adjustments, defaulted bond income accruals, upfront fees remaining to be amortized, outstanding loan fees, basis adjustments outstanding on controlled foreign corporations and open TRS swap marked to market as of December 31, 2020, 2019 and 2018:
|
2020 |
2019 |
2018 |
||||||||||
|
Ordinary income |
$ | — | $ | — | $ | 377,319 | ||||||
|
Other temporary differences |
— | — | — | |||||||||
|
Short term capital loss carryover |
(21,494,988 | ) | (21,992,433 | ) | (11,404,648 | ) | ||||||
|
Long term capital loss carryover |
(210,582,597 | ) | (136,948,241 | ) | (98,932,911 | ) | ||||||
|
Unrealized appreciation (depreciation) |
(93,021,716 | ) | (119,666,572 | ) | (86,757,821 | ) | ||||||
|
Components of tax distributable earnings/(accumulated deficits) at year end |
$ | (325,099,301 | ) | $ | (278,607,246 | ) | $ | (196,718,061 | ) | |||
Segments
The Company invests in various industries. The Company separately evaluates the performance of each of its investment relationships. However, because each of these investment relationships has similar business and economic characteristics, they have been aggregated into a single investment segment. All applicable segment disclosures are included in or can be derived from the Company’s consolidated financial statements (See Note 3).
Company Investment Risk, Concentration of Credit Risk, and Liquidity Risk
SIC Advisors has broad discretion in making investments for the Company. Investments generally consist of debt instruments that may be affected by business, financial market or legal uncertainties. Prices of investments may be volatile, and a variety of factors that are inherently difficult to predict, such as domestic or international economic and political developments, may significantly affect the results of the Company’s activities and the value of its investments. In addition, the value of the Company’s portfolio may fluctuate as the general level of interest rates fluctuates.
The value of the Company’s investments in loans and bonds may be detrimentally affected to the extent, among other things, that a borrower defaults on its obligations, there is insufficient collateral and/or there are extensive legal and other costs incurred in collecting on a defaulted loan, observable secondary or primary market yields for similar instruments issued by comparable companies increase materially or risk premiums required in the market between smaller companies, such as the Company’s borrowers, and those for which market yields are observable, increase materially.
The Company’s assets may, at any time, include securities and other financial instruments or obligations that are illiquid or thinly traded, making purchase or sale of such securities and financial instruments at desired prices or in desired quantities difficult. Furthermore, the sale of any such investments may be possible only at substantial discounts, and it may be extremely difficult to value any such investments accurately.
Recent Accounting Pronouncements
In March 2020, the FASB issued ASU 2020-04, "Reference rate reform (Topic 848)—Facilitation of the effects of reference rate reform on financial reporting." The amendments in this update provide optional expedients and exceptions for applying U.S. GAAP to certain contracts and hedging relationships that reference LIBOR or another reference rate expected to be discontinued due to reference rate reform and became effective upon issuance for all entities. The Company has agreements that have LIBOR as a reference rate with certain portfolio companies and also with certain lenders. Many of these agreements include language for choosing an alternative successor rate if LIBOR reference is no longer considered to be appropriate. Contract modifications are required to be evaluated in determining whether the modifications result in the establishment of new contracts or the continuation of existing contracts. The standard is effective as of March 12, 2020 through December 31, 2022 and the Company plans to apply the amendments in this update to account for contract modifications due to changes in reference rates. The Company does not believe that it will have a material impact on its consolidated financial statements and disclosures.
The following table shows the amortized cost and the fair value of the Company’s portfolio investments as of December 31, 2020:
|
Amortized Cost |
Percentage |
Fair Value |
Percentage |
|||||||||||||
|
Senior secured first lien term loans |
$ | 369,385,810 | 52.7 | % | $ | 315,490,601 | 52.3 | % | ||||||||
|
Senior secured second lien term loans |
103,081,287 | 14.7 | % | 93,794,917 | 15.5 | % | ||||||||||
|
Senior secured first lien notes |
8,473,750 | 1.2 | % | 8,548,755 | 1.4 | % | ||||||||||
|
Subordinated notes |
65,561,840 | 9.4 | % | 50,039,500 | 8.3 | % | ||||||||||
|
Sierra Senior Loan Strategy JV I LLC |
110,050,000 | 15.7 | % | 81,788,964 | 13.5 | % | ||||||||||
|
Equity/warrants |
44,451,252 | 6.3 | % | 54,323,743 | 9.0 | % | ||||||||||
|
Total |
$ | 701,003,939 | 100.0 | % | $ | 603,986,480 | 100.0 | % | ||||||||
The following table shows the amortized cost and the fair value of the Company’s portfolio investments as of December 31, 2019:
|
Amortized Cost |
Percentage |
Fair Value |
Percentage |
|||||||||||||
|
Senior secured first lien term loans |
$ | 382,580,269 | 48.0 | % | $ | 328,816,197 | 48.7 | % | ||||||||
|
Senior secured second lien term loans |
157,794,323 | 19.8 | 122,817,885 | 18.2 | ||||||||||||
|
Senior secured first lien notes |
15,217,625 | 1.9 | 14,354,825 | 2.1 | ||||||||||||
|
Subordinated notes |
70,422,851 | 8.8 | 63,021,420 | 9.3 | ||||||||||||
|
Sierra Senior Loan Strategy JV I LLC |
92,050,000 | 11.5 | 68,434,389 | 10.1 | ||||||||||||
|
Equity/warrants |
79,968,093 | 10.0 | 78,179,214 | 11.6 | ||||||||||||
|
Total |
$ | 798,033,161 | 100.0 | % | $ | 675,623,930 | 100.0 | % | ||||||||
The following table shows the composition of the Company’s portfolio investments by industry classification at amortized cost and fair value as of December 31, 2020:
|
Amortized Cost |
Percentage |
Fair Value |
Percentage |
|||||||||||||
|
Multi-Sector Holdings |
$ | 174,660,001 | 24.9 | % | $ | 131,792,864 | 21.8 | % | ||||||||
|
Services: Business |
79,260,551 | 11.3 | % | 73,716,395 | 12.2 | % | ||||||||||
|
High Tech Industries |
75,519,344 | 10.8 | % | 71,792,022 | 11.9 | % | ||||||||||
|
Healthcare & Pharmaceuticals |
68,599,968 | 9.8 | % | 58,275,198 | 9.6 | % | ||||||||||
|
Consumer Goods: Durable |
32,045,028 | 4.6 | % | 41,016,292 | 6.8 | % | ||||||||||
|
Construction & Building |
42,928,750 | 6.1 | % | 38,356,358 | 6.4 | % | ||||||||||
|
Banking, Finance, Insurance & Real Estate |
27,848,664 | 4.0 | % | 37,620,161 | 6.2 | % | ||||||||||
|
Aerospace & Defense |
33,558,896 | 4.8 | % | 29,723,725 | 4.9 | % | ||||||||||
|
Hotel, Gaming & Leisure |
36,326,705 | 5.2 | % | 24,013,769 | 4.0 | % | ||||||||||
|
Automotive |
18,886,756 | 2.7 | % | 17,404,476 | 2.9 | % | ||||||||||
|
Containers, Packaging & Glass |
15,206,840 | 2.2 | % | 15,120,424 | 2.5 | % | ||||||||||
|
Environmental Industries |
5,041,430 | 0.7 | % | 10,052,691 | 1.7 | % | ||||||||||
| Services: Consumer | 9,700,000 | 1.4 | % | 9,725,000 | 1.6 | % | ||||||||||
|
Chemicals, Plastics & Rubber |
10,060,861 | 1.4 | % | 9,063,498 | 1.5 | % | ||||||||||
|
Forest Products & Paper |
6,477,887 | 0.9 | % | 7,770,704 | 1.3 | % | ||||||||||
|
Media: Diversified & Production |
15,474,145 | 2.2 | % | 6,780,000 | 1.1 | % | ||||||||||
|
Transportation: Cargo |
6,877,294 | 1.0 | % | 6,770,781 | 1.1 | % | ||||||||||
|
Transportation: Consumer |
7,975,416 | 1.1 | % | 6,068,082 | 1.0 | % | ||||||||||
|
Metals & Mining |
3,492,436 | 0.5 | % | 3,492,479 | 0.6 | % | ||||||||||
|
Energy: Oil & Gas |
20,868,832 | 3.0 | % | 2,625,018 | 0.4 | % | ||||||||||
|
Wholesale |
2,212,919 | 0.3 | % | 1,746,044 | 0.3 | % | ||||||||||
|
Retail |
7,934,347 | 1.1 | % | 1,012,358 | 0.2 | % | ||||||||||
|
Beverage & Food |
46,869 | 0.0 | % | 48,141 | 0.0 | % | ||||||||||
|
Total |
$ | 701,003,939 | 100.0 | % | $ | 603,986,480 | 100.0 | % | ||||||||
The following table shows the composition of the Company’s portfolio investments by industry classification at amortized cost and fair value as of December 31, 2019:
|
Amortized Cost |
Percentage |
Fair Value |
Percentage |
|||||||||||||
|
Multi-Sector Holdings |
$ | 161,308,341 | 20.2 | % | $ | 130,278,650 | 19.2 | % | ||||||||
|
High Tech Industries |
86,735,849 | 10.8 | 81,531,661 | 12.1 | ||||||||||||
|
Services: Business |
131,560,449 | 16.5 | 81,285,736 | 12.0 | ||||||||||||
|
Healthcare & Pharmaceuticals |
59,511,718 | 7.5 | 57,374,851 | 8.5 | ||||||||||||
|
Banking, Finance, Insurance & Real Estate |
45,286,982 | 5.7 | 52,049,297 | 7.7 | ||||||||||||
|
Construction & Building |
42,797,402 | 5.4 | 39,865,739 | 5.9 | ||||||||||||
|
Wholesale |
34,519,910 | 4.3 | 35,186,289 | 5.2 | ||||||||||||
|
Aerospace & Defense |
34,876,226 | 4.4 | 34,475,020 | 5.1 | ||||||||||||
|
Consumer Goods: Durable |
21,962,500 | 2.8 | 24,214,089 | 3.6 | ||||||||||||
|
Hotel, Gaming & Leisure |
21,373,829 | 2.7 | 21,365,163 | 3.2 | ||||||||||||
|
Automotive |
22,312,149 | 2.8 | 19,861,655 | 2.9 | ||||||||||||
|
Containers, Packaging & Glass |
16,263,768 | 2.0 | 15,655,179 | 2.3 | ||||||||||||
|
Transportation: Cargo |
12,734,167 | 1.6 | 12,771,231 | 1.9 | ||||||||||||
|
Energy: Oil & Gas |
21,692,260 | 2.7 | 10,007,469 | 1.5 | ||||||||||||
|
Chemicals, Plastics & Rubber |
10,090,722 | 1.3 | 9,505,614 | 1.4 | ||||||||||||
|
Media: Diversified & Production |
14,279,258 | 1.8 | 9,493,583 | 1.4 | ||||||||||||
|
Forest Products & Paper |
6,455,137 | 0.8 | 7,182,914 | 1.1 | ||||||||||||
|
Transportation: Consumer |
6,966,133 | 0.9 | 6,877,180 | 1.0 | ||||||||||||
|
Capital Equipment |
6,778,258 | 0.8 | 6,537,927 | 1.0 | ||||||||||||
|
Environmental Industries |
5,021,241 | 0.6 | 6,414,400 | 0.9 | ||||||||||||
|
Consumer Goods: Non-durable |
4,912,500 | 0.6 | 4,721,895 | 0.7 | ||||||||||||
|
Metals & Mining |
3,257,979 | 0.4 | 3,258,022 | 0.5 | ||||||||||||
|
Media: Broadcasting & Subscription |
10,408,142 | 1.3 | 2,163,218 | 0.3 | ||||||||||||
|
Retail |
8,304,830 | 1.0 | 1,846,648 | 0.3 | ||||||||||||
|
Media: Advertising, Printing & Publishing |
8,623,411 | 1.1 | 1,700,500 | 0.3 | ||||||||||||
|
Total |
$ | 798,033,161 | 100.0 | % | $ | 675,623,930 | 100.0 | % | ||||||||
The following table shows the composition of the Company’s portfolio investments by geography classification at fair value as of December 31, 2020 and 2019:
|
December 31, 2020 |
December 31, 2019 |
|||||||||||||||
|
Geography |
Fair Value |
Percentage |
Fair Value |
Percentage |
||||||||||||
|
United States |
$ | 553,982,580 | 91.7 | % | $ | 613,779,669 | 90.8 | % | ||||||||
|
Cayman Islands |
50,003,900 | 8.3 | % | 61,844,261 | 9.2 | % | ||||||||||
|
Total |
$ | 603,986,480 | 100.0 | % | $ | 675,623,930 | 100.0 | % | ||||||||
Transactions with Controlled/Affiliated Companies
During the years ended December 31, 2020 and 2019, the Company had investments in portfolio companies designated as controlled/affiliated investments under the 1940 Act. Transactions with controlled/affiliated investments were as follows:
|
Name of Investment(3) |
Type of Investment |
Fair Value at December 31, 2019 |
Purchases/ (Sales) of Investments | Transfers In/(Out) of Investments |
Net change in unrealized appreciation/ (depreciation) |
Realized Gain/(Loss) |
Fair Value at December 31, 2020 |
Income Earned | |||||||||||||||||||||
|
1888 Industrial Services, LLC |
Revolving Credit Facility |
$ | 1,183,094 | $ | 60,830 | $ | — | $ | — | $ | — | $ | 1,243,924 | $ | 80,161 | ||||||||||||||
|
Senior Secured First Lien Term Loan |
3,315,574 | — | — | (3,315,574 | ) | — | — | — | |||||||||||||||||||||
|
Senior Secured First Lien Term Loan |
2,113,617 | — | — | (2,113,617 | ) | — | — | — | |||||||||||||||||||||
|
Senior Secured First Lien Term Loan |
416,940 | (13,223 | ) | — | 27,459 | — | 431,176 | — | |||||||||||||||||||||
|
Senior Secured First Lien Term Loan |
79,986 | (79,986 | ) | — | — | — | — | 3,860 | |||||||||||||||||||||
|
Senior Secured First Lien Term Loan |
288,300 | (288,300 | ) | — | — | — | — | 13,913 | |||||||||||||||||||||
|
Membership Units |
— | (35,600 | ) | — | — | 35,600 | — | — | |||||||||||||||||||||
|
Access Media Holdings, LLC |
Senior Secured First Lien Term Loan |
2,251,418 | (1,045,943 | ) | — | 5,206,924 | (6,412,399 | ) | — | 524,710 | |||||||||||||||||||
| Common Stock | — | — | — | — | — | — | — | ||||||||||||||||||||||
|
Preferred Equity |
— | — | — | 1,400,000 | (1,400,000 | ) | — | — | |||||||||||||||||||||
|
Preferred Equity |
— | — | — | 700,000 | (700,000 | ) | — | — | |||||||||||||||||||||
|
Preferred Equity |
(88,200 | ) | — | — | 938,000 | (849,800 | ) | — | — | ||||||||||||||||||||
| Black Angus Steakhouses, LLC | Senior Secured First Lien Term Loan | — | 334,821 | 1,562,500 | — | — | 1,897,321 | 93,471 | |||||||||||||||||||||
|
Senior Secured First Lien Term Loan |
— | — | 20,457,589 | (11,396,697 | ) | — | 9,060,892 | — | |||||||||||||||||||||
|
Senior Secured First Lien Term Loan |
— | 3,055,556 | — | — | — | 3,055,556 | 36,510 | ||||||||||||||||||||||
|
Equity |
— | — | — | — | — | — | — | ||||||||||||||||||||||
|
Caddo Investors Holdings 1 LLC |
Equity |
5,765,253 | 44,667 | — | 556,452 | — | 6,366,372 | — | |||||||||||||||||||||
|
Charming Charlie LLC |
Senior Secured First Lien Term Loan |
— | — | — | — | — | — | — | |||||||||||||||||||||
|
Senior Secured First Lien Term Loan |
— | — | — | — | — | — | — | ||||||||||||||||||||||
|
Senior Secured First Lien Term Loan |
112,981 | (12,125 | ) | — | (29,575 | ) | — | 71,281 | — | ||||||||||||||||||||
| Senior Secured First Lien Term Loan | 628,025 | (67,399 | ) | — | (164,401 | ) | — | 396,225 | — | ||||||||||||||||||||
|
Common Stock |
— | — | — | — | — | — | — | ||||||||||||||||||||||
|
Dynamic Energy Services International LLC |
Revolving Credit Facility |
— | — | — | — | — | — | — | |||||||||||||||||||||
|
Senior Secured First Lien Term Loan |
692,431 | — | — | (198,961 | ) | — | 493,470 | (8,948 | ) | ||||||||||||||||||||
|
Equity |
— | — | — | — | — | — | — | ||||||||||||||||||||||
|
Name of Investment(3) |
Type of Investment |
Fair Value at December 31, 2019 |
Purchases/ (Sales) of Investments | Transfers In/(Out) of Investments |
Net change in unrealized appreciation/ (depreciation) |
Realized Gain/(Loss) |
Fair Value at December 31, 2020 |
Income Earned | |||||||||||||||||||||
|
Kemmerer Operations, LLC |
Senior Secured First Lien Term Loan |
1,834,227 | 296,126 | — | — | — | 2,130,353 | 296,250 | |||||||||||||||||||||
|
Senior Secured First Lien Delayed Draw Term Loan |
461,035 | (61,669 | ) | — | — | — | 399,366 | 73,898 | |||||||||||||||||||||
|
Equity |
962,760 | — | — | — | — | 962,760 | — | ||||||||||||||||||||||
|
MCM 500 East Pratt Holdings, LLC |
Equity |
7,350,000 | — | — | — | — | 7,350,000 | 423,119 | |||||||||||||||||||||
|
MCM Capital Office Park Holdings LLC |
Equity |
11,775,000 | — | — | 3,750,000 | — | 15,525,000 | 879,369 | |||||||||||||||||||||
|
Sierra Senior Loan Strategy JV I LLC(2) |
Equity |
68,434,389 | 18,000,000 | — | (4,645,425 | ) | — | 81,788,964 | 4,381,828 | ||||||||||||||||||||
|
TwentyEighty, Inc. |
Common Units |
644,597 | (621,650 | ) | — | (644,597 | ) | 621,650 | — | — | |||||||||||||||||||
|
Total |
$ | 108,221,427 | $ | 19,566,105 | $ | 22,020,089 | $ | (9,930,012 | ) | $ | (8,704,949 | ) | $ | 131,172,660 | $ | 6,798,141 | |||||||||||||
|
Name of Investment(3) |
Type of Investment |
Fair Value at December 31, 2018 |
Purchases/ (Sales) of Investments | Transfers In/(Out) of Investments |
Net change in unrealized appreciation/ (depreciation) |
Realized Gain/(Loss) |
Fair Value at December 31, 2019 |
Income Earned | |||||||||||||||||||||
|
1888 Industrial Services, LLC |
Revolving Credit Facility |
$ | 943,344 | $ | 239,750 | $ | — | $ | — | $ | — | $ | 1,183,094 | $ | 92,014 | ||||||||||||||
|
Senior Secured First Lien Term Loan |
3,144,481 | 171,093 | — | — | — | 3,315,574 | 240,273 | ||||||||||||||||||||||
|
Senior Secured First Lien Term Loan |
6,005,623 | (206,393 | ) | — | (3,685,613 | ) | — | 2,113,617 | — | ||||||||||||||||||||
| Senior Secured First Lien Term Loan | — | 416,940 | — | — | — | 416,940 | 15,206 | ||||||||||||||||||||||
| Senior Secured First Lien Term Loan | — | 79,986 | — | — | — | 79,986 | 1,617 | ||||||||||||||||||||||
|
Senior Secured First Lien Term Loan |
— | 288,300 | — | — | — | 288,300 | 4,757 | ||||||||||||||||||||||
|
Membership Units |
— | — | — | — | — | — | — | ||||||||||||||||||||||
|
Access Media Holdings, LLC |
Senior Secured First Lien Term Loan |
5,141,747 | 35,935 | — | (2,926,264 | ) | — | 2,251,418 | — | ||||||||||||||||||||
|
Common Stock |
— | — | — | — | — | — | — | ||||||||||||||||||||||
|
Preferred Equity |
— | — | — | — | — | — | — | ||||||||||||||||||||||
|
Preferred Equity |
— | — | — | — | — | — | — | ||||||||||||||||||||||
|
Preferred Equity |
(88,200 | ) | — | — | — | — | (88,200 | ) | — | ||||||||||||||||||||
|
Caddo Investors Holdings 1 LLC |
Equity |
5,186,935 | 54,619 | — | 523,699 | — | 5,765,253 | — | |||||||||||||||||||||
| Capstone Nutrition, Inc. | Senior Secured First Lien Term Loan | 9,524,176 | (1,413,538 | ) | 6,128,103 | (14,238,741 | ) | — | 2,776,469 | ||||||||||||||||||||
| Senior Secured First Lien Delayed Draw Term Loan | 4,282,981 | (635,662 | ) | — | 2,985,858 | (6,633,177 | ) | — | 1,248,566 | ||||||||||||||||||||
| Senior Secured First Lien Incremental Delayed Draw Term Loan | 1,745,510 | (1,745,510 | ) | — | — | — | — | 319,581 | |||||||||||||||||||||
|
Common Stock |
— | — | — | 9 | (9 | ) | — | — | |||||||||||||||||||||
|
Common Stock |
— | — | — | — | — | — | — | ||||||||||||||||||||||
|
Common Stock |
— | — | — | 300,002 | (300,002 | ) | — | — | |||||||||||||||||||||
|
Charming Charlie LLC |
Senior Secured First Lien Term Loan |
3,121,470 | — | — | (3,121,470 | ) | — | — | — | ||||||||||||||||||||
|
Senior Secured First Lien Term Loan |
1,515,547 | — | — | (1,515,547 | ) | — | — | — | |||||||||||||||||||||
|
Senior Secured First Lien Term Loan |
182,617 | (31,975 | ) | — | (37,661 | ) | — | 112,981 | 41,702 | ||||||||||||||||||||
|
Senior Secured First Lien Term Loan |
— | 837,367 | — | (209,342 | ) | — | 628,025 | — | |||||||||||||||||||||
| Common Stock | — | — | — | — | — | — | — | ||||||||||||||||||||||
| Dynamic Energy Services International LLC | Revolving Credit Facility | — | (246,677 | ) | 246,677 | — | — | — | 60,352 | ||||||||||||||||||||
|
Senior Secured First Lien Term Loan |
— | — | 9,828,831 | (3,756,594 | ) | (5,379,806 | ) | 692,431 | — | ||||||||||||||||||||
|
Equity |
— | — | — | — | — | — | — | ||||||||||||||||||||||
|
Kemmerer Operations, LLC |
Senior Secured First Lien Term Loan |
— | 461,035 | — | — | — | 461,035 | 54,448 | |||||||||||||||||||||
| Senior Secured First Lien Delayed Draw Term Loan | — | 1,834,227 | — | — | — | 1,834,227 | 140,076 | ||||||||||||||||||||||
|
Equity |
— | 962,717 | — | 43 | — | 962,760 | — | ||||||||||||||||||||||
|
MCM 500 East Pratt Holdings, LLC |
Equity |
5,000,000 | — | — | 2,350,000 | — | 7,350,000 | 550,881 | |||||||||||||||||||||
|
MCM Capital Office Park Holdings LLC |
Equity |
12,499,125 | — | — | (724,125 | ) | — | 11,775,000 | 455,649 | ||||||||||||||||||||
|
Medley Chiller Holdings LLC |
Equity |
9,098,157 | (20,835,203 | ) | — | (470,658 | ) | 12,207,704 | — | 557,697 | |||||||||||||||||||
|
Nomida LLC(1) |
Equity |
989,820 | (771,420 | ) | — | 1,299,940 | (1,518,340 | ) | — | — | |||||||||||||||||||
|
Sierra Senior Loan Strategy JV I LLC(2) |
Equity |
82,515,860 | — | — | (14,081,471 | ) | — | 68,434,389 | 7,612,500 | ||||||||||||||||||||
|
TwentyEighty, Inc. |
Senior Secured First Lien Term Loan |
6,975,035 | (6,975,035 | ) | — | — | — | — | 425,894 | ||||||||||||||||||||
|
Senior Secured First Lien Term Loan |
6,497,461 | (6,521,105 | ) | — | (91,097 | ) | 114,741 | — | 631,186 | ||||||||||||||||||||
| Senior Secured First Lien Term Loan | 319,870 | (322,723 | ) | — | 2,102 | 751 | — | 18,846 | |||||||||||||||||||||
| Senior Secured First Lien Term Loan | — | — | — | — | — | — | 1,780 | ||||||||||||||||||||||
| Equity | 404,943 | (6,652,221 | ) | — | 239,654 | 6,652,221 | 644,597 | — | |||||||||||||||||||||
|
Total |
$ | 165,006,502 | $ | (40,975,493 | ) | $ | 10,075,508 | $ | (16,790,432 | ) | $ | (9,094,658 | ) | $ | 108,221,427 | $ | 15,249,494 | ||||||||||||
|
(1) |
Nomida LLC ("Nomida") is a non-public real estate investment formed by the Company to purchase and develop a residential property. The Company is the sole equity shareholder of Nomida and has provided 100% of the debt financing to the entity. The Company is Nomida’s sole member responsible for Nomida’s daily operations. In addition, the Chief Financial Officer and Secretary of the Company also serves as President of Nomida. The assets of Nomida are comprised of a residential development property in the city of Chicago, IL and the proceeds of the loan from the Company; the liabilities of Nomida consist of the loan payable to the Company. As of December 31, 2020, the investment has been realized. |
|
(2) |
The Company and Great American Life Insurance Company ("GALIC") are the members of Sierra Senior Loan Strategy JV I LLC ("Sierra JV"), a joint venture formed as a Delaware limited liability company that is not consolidated by either member for financial reporting purposes. The members of Sierra JV make capital contributions as investments by Sierra JV are completed, and all portfolio and other material decisions regarding Sierra JV must be submitted to Sierra JV’s board of managers, which is comprised of an equal number of members appointed by each of the Company and GALIC. Approval of Sierra JV’s board of managers requires the unanimous approval of a quorum of the board of managers, with a quorum consisting of equal representation of members appointed by each of the Company and GALIC. Because management of Sierra JV is shared equally between the Company and GALIC, the Company does not have operational control over the Sierra JV for purposes of the 1940 Act or otherwise. |
|
(3) |
The par amount and additional detail are shown in the consolidated schedules of investments |
Purchases/(sales) of investments in controlled affiliates are included in the purchases and sales presented on the Consolidated Statements of Cash Flows for the year ended December 31, 2020. Transfers in/(out) of control/affiliates represents the fair value for the month an investment became or was removed as a controlled/affiliated investment. Income received from controlled/affiliates is included in total investment income on the Consolidated Statements of Operations for the years ended December 31, 2020 and 2019.
In connection with certain of the Company’s investments, the Company receives warrants which are obtained for the objective of increasing the total investment returns and are not held for hedging purposes. For the years ended December 31, 2020 and 2019, the total fair value of warrants were $13,195 and $21,469, respectively, and were included in investments at fair value on the Consolidated Statements of Assets and Liabilities. Total realized and change in unrealized gains/(losses) related to warrants for the years ended December 31, 2020, 2019 and 2018 were $8,274, $75,922 and $283,449, respectively and were recorded on the Consolidated Statements of Operations in those accounts. The warrants are received in connection with individual investments and are not subject to master netting arrangements.
As of December 31, 2020, the Company held investments it has made directly to 67 investee companies with aggregate principal amounts of $541.1 million. As of December 31, 2019, the Company held investments it has made directly to 62 investee companies with aggregate principal amounts of $643.5 million. During the years ended December 31, 2020, 2019 and 2018, the Company made 30, 65 and 94 investments to investee companies, respectively, with aggregate principal amounts of $133.3 million, $167.8 million and $232.7 million, respectively. The details of the Company’s investments have been disclosed on the consolidated schedule of investments as well as in Note 4.
In addition to the loans that the Company has provided, the Company has unfunded commitments to provide additional financings through undrawn term loans or revolving lines of credit. The details of such arrangements are disclosed in Note 11.
Sierra Senior Loan Strategy JV I LLC
On March 27, 2015, the Company and GALIC entered into a limited liability company operating agreement to co-manage Sierra JV. All portfolio and other material decisions regarding Sierra JV must be submitted to Sierra JV's board of managers, which is comprised of four members, two of whom are selected by the Company and the other two are selected by GALIC. The Company has concluded that it does not operationally control Sierra JV. As the Company does not operationally control Sierra JV, it does not consolidate the operations of Sierra JV within the consolidated financial statements. As a practical expedient, the Company uses NAV to determine the fair value of its investment in Sierra JV; therefore, this investment has been presented as a reconciling item within the fair value hierarchy (see Note 4).
As of December 31, 2020 Sierra JV had total capital commitments of $124.6 million, with the Company providing $110.1 million and GALIC providing $14.5 million. As of December 31, 2019 Sierra JV had total capital commitments of $116.0 million, with the Company providing $101.5 million and GALIC providing $14.5 million. As of December 31, 2020 approximately $124.5 million was funded relating to these commitments of which $110.1 million was from the Company. As of December 31, 2019 approximately $105.2 million was funded relating to these commitments of which $92.1 million was from the Company. The Company does not have the right to withdraw any of their respective capital commitment, unless in connection with a transfer of its membership interests. The Company may transfer full membership interests as long as it is approved by all members and transferred in a transaction exempt from the registration requirements of the Securities Act or applicable state securities laws.
Sierra JV entered into a Senior Secured Revolving Credit Facility Agreement, as amended (the "JV Facility") with Deutsche Bank, AG, New York Branch ("DB").
On March 29, 2019, the JV Facility reinvestment period was extended from March 30, 2019 to June 28, 2019.
On June 28, 2019, the JV Facility reinvestment period was further extended from June 28, 2019 to October 28, 2019.
On October 28, 2019, the JV Facility reinvestment period was further extended from October 28, 2019 to March 31, 2020 and the interest rate was modified from bearing an interest rate of LIBOR (with a 0.00% floor) + 2.50% per annum to LIBOR (with a 0.00% floor) + 2.75% per annum.
On March 31, 2020, the total commitment under the JV Facility was reduced to $240.0 million from $250.0 million and the reinvestment period was extended from March 31, 2020 to April 30, 2020.
On April 30, 2020, the total commitment under the JV Facility was reduced to $200.0 million from $240.0 million, the reinvestment period was extended from April 30, 2020 to July 31, 2020, the maturity date was extended to July 31, 2023 and the interest rate was modified from bearing an interest rate of LIBOR (with a 0.00% floor) + 2.75% per annum to LIBOR (with a 0.50% floor) + 3.15% per annum.
On July 29, 2020, the total commitment under the JV Facility was reduced to $175.0 million from $200.0 million, the reinvestment period was extended from July 31, 2020 to April 30, 2021 and the maturity date was extended to April 30, 2024. Additionally, the interest rate was modified from bearing an interest rate of LIBOR (with a 0.50% floor) + 3.15% per annum to LIBOR (with a 0.50% floor) + 3.25% per annum.
The JV Facility is secured substantially by all of Sierra JV's assets, subject to certain exclusions set forth in the JV Facility. As of December 31, 2020 and December 31, 2019, there was $124.7 million and $204.9 million outstanding under the JV Facility, respectively.
The following table shows a summary of Sierra JV's portfolio as of December 31, 2020 and December 31, 2019:
|
December 31, 2020 |
December 31, 2019 |
|||||||
|
Senior secured loans(1) |
$ | 210,175,007 | $ | 255,853,296 | ||||
|
Weighted average current interest rate on senior secured loans(2) |
6.05 | % | 6.86 | % | ||||
|
Number of borrowers in the Sierra JV |
52 | 60 | ||||||
|
Investments at fair value |
$ | 196,605,878 | $ | 238,316,936 | ||||
|
Largest loan to a single borrower(1) |
$ | 10,595,716 | $ | 10,826,856 | ||||
|
Total of five largest loans to borrowers(1) |
$ | 38,163,663 | $ | 43,344,178 | ||||
|
(1) |
At par value. |
|
(2) |
Computed as the (a) annual stated interest rate on accruing senior secured loans, divided by (b) total senior secured loans at principal amount. |
The following is a list of the individual investments in Sierra JV's portfolio as of December 31, 2020:
|
Company |
Industry |
Type of Investment |
Maturity |
Par Amount |
Cost |
Fair Value(1) |
|||||||||
|
4Over International, LLC |
Media: Advertising, Printing & Publishing |
Senior Secured First Lien Term Loan (LIBOR + 6.00%)(2) |
6/7/2022 |
$ | 10,595,716 | $ | 10,595,716 | $ | 10,595,716 | ||||||
| ADB Companies | Services: Business | Senior Secured First Lien Term Loan (LIBOR + 6.25%, 1.00% LIBOR Floor)(4)(6) | 12/18/2025 | 2,500,000 | 2,425,370 | 2,425,000 | |||||||||
| Brook & Whittle Holding | Containers, Packaging & Glass | Senior Secured First Lien Term Loan (LIBOR + 7.00%, 1.00% LIBOR Floor)(4) | 10/17/2024 | 5,000,000 | 5,000,000 | 5,000,000 | |||||||||
|
Callaway Golf Company |
Consumer Goods: Durable |
Senior Secured First Lien Term Loan (LIBOR + 4.35%)(2) |
1/2/2026 |
1,506,345 | 1,485,640 | 1,508,303 | |||||||||
|
Cambrex Corporation |
Healthcare & Pharmaceuticals |
Senior Secured First Lien Term Loan (LIBOR + 5.00%, 1.00% LIBOR Floor)(2) |
12/4/2026 |
4,000,000 | 3,980,210 | 3,980,000 | |||||||||
|
Cardenas Markets LLC |
Retail |
Senior Secured First Lien Term Loan (LIBOR + 5.75%, 1.00% LIBOR Floor)(2) |
11/29/2023 |
7,847,596 | 7,723,410 | 7,847,596 | |||||||||
|
CHA Consulting, Inc. |
Construction & Building |
Senior Secured First Lien Term Loan (LIBOR + 4.50%, 1.00% LIBOR Floor)(4) |
4/10/2025 |
1,336,961 | 1,332,898 | 1,297,788 | |||||||||
|
CHA Consulting, Inc. |
Construction & Building |
Senior Secured First Lien Term Loan (LIBOR + 4.50%, 1.00% LIBOR Floor)(4) |
4/10/2025 |
591,000 | 591,000 | 573,684 | |||||||||
|
Covenant Surgical Partners, Inc. |
Healthcare & Pharmaceuticals |
Senior Secured First Lien Term Loan (LIBOR + 4.00%)(2)(6) |
7/1/2026 |
4,937,812 | 4,898,946 | 4,741,270 | |||||||||
|
CT Technologies Intermediate Holdings, Inc. |
Healthcare & Pharmaceuticals |
Senior Secured First Lien Term Loan (LIBOR + 5.00%, 1.00% LIBOR Floor)(2) |
12/16/2025 |
5,000,000 | 4,975,931 | 4,975,000 | |||||||||
|
Envision Healthcare Corporation |
Healthcare & Pharmaceuticals |
Senior Secured First Lien Term Loan (LIBOR + 3.75%)(2) |
10/10/2025 |
1,935,500 | 1,889,054 | 1,608,981 | |||||||||
|
GC EOS Buyer, Inc. |
Automotive |
Senior Secured First Lien Term Loan (LIBOR + 4.50%, 1.00% LIBOR Floor)(3) |
8/1/2025 |
3,401,588 | 3,366,203 | 3,282,532 | |||||||||
|
GK Holdings, Inc. |
Services: Business |
Senior Secured First Lien Term Loan (LIBOR + 6.00%, 1.00% LIBOR Floor)(4)(8) |
1/20/2021 |
3,864,837 | 3,864,580 | 3,401,056 | |||||||||
|
Glass Mountain Pipeline Holdings, LLC |
Energy: Oil & Gas |
Senior Secured First Lien Term Loan (LIBOR + 4.50%, 1.00% LIBOR Floor)(5)(8) |
12/23/2024 |
4,838,188 | 4,827,833 | 2,431,189 | |||||||||
|
Golden West Packaging Group LLC |
Forest Products & Paper |
Senior Secured First Lien Term Loan (LIBOR + 5.25%, 1.00% LIBOR Floor)(2) |
6/20/2023 |
4,058,560 | 4,058,560 | 4,054,502 | |||||||||
|
Company |
Industry |
Type of Investment |
Maturity |
Par Amount |
Cost |
Fair Value(1) |
|||||||||
|
High Ridge Brands Co. |
Consumer Goods: Non-Durable |
Senior Secured First Lien Term Loan (9.25% Base Rate)(8) |
6/30/2022 |
2,266,515 | 1,893,812 | 367,669 | |||||||||
|
Infogroup, Inc. |
Services: Business |
Senior Secured First Lien Term Loan (LIBOR + 5.00%, 1.00% LIBOR Floor)(4) |
4/3/2023 |
4,812,500 | 4,794,282 | 4,484,769 | |||||||||
|
Intermediate LLC |
High Tech Industries |
Senior Secured First Lien Term Loan (LIBOR + 3.75%)(4) |
7/1/2026 |
2,715,625 | 2,701,881 | 2,557,304 | |||||||||
|
Isagenix International, LLC |
Wholesale |
Senior Secured First Lien Term Loan (LIBOR + 5.75%, 1.00% LIBOR Floor)(4) |
6/16/2025 |
2,578,687 | 2,569,382 | 1,420,599 | |||||||||
| Ivanti Software, Inc. | High Tech Industries | Senior Secured First Lien Term Loan (LIBOR + 4.75%, 1.00% LIBOR Floor)(4) | 12/1/2027 | 5,000,000 | 4,925,706 | 4,982,500 | |||||||||
| IXS Holdings, Inc. | Automotive | Senior Secured First Lien Term Loan (LIBOR + 5.00%, 1.00% LIBOR Floor)(4) | 3/5/2027 | 2,976,933 | 2,950,597 | 2,979,016 | |||||||||
|
Keystone Acquisition Corp. |
Healthcare & Pharmaceuticals |
Senior Secured First Lien Term Loan (LIBOR + 5.25%, 1.00% LIBOR Floor)(4) |
5/1/2024 |
6,084,094 | 6,029,328 | 5,506,105 | |||||||||
|
KNB Holdings Corporation |
Consumer Goods: Durable |
Senior Secured First Lien Term Loan (LIBOR + 5.50%, 1.00% LIBOR Floor)(4) |
4/26/2024 |
4,711,121 | 4,666,373 | 3,574,799 | |||||||||
|
Liasion Acquisition, LLC |
High Tech Industries |
Senior Secured First Lien Term Loan (LIBOR + 4.25%, 1.00% LIBOR Floor)(4) |
12/20/2026 |
6,435,000 | 6,421,268 | 6,435,000 | |||||||||
|
LifeMiles Ltd. |
Services: Consumer |
Senior Secured First Lien Term Loan (LIBOR + 5.50%, 1.00% LIBOR Floor)(2) |
8/18/2022 |
4,078,218 | 4,070,961 | 3,843,721 | |||||||||
| Logmein | High Tech Industries | Senior Secured First Lien Term Loan (LIBOR + 3.75%)(2) | 5/4/2026 | 3,000,000 | 2,941,452 | 2,985,900 | |||||||||
| Mileage Plus | Transportation: Consumer | Senior Secured First Lien Term Loan (LIBOR + 5.25%, 1.00% LIBOR Floor)(2) | 6/21/2027 | 5,098,181 | 5,093,806 | 5,307,207 | |||||||||
| NGS US Finco, LLC | Capital Equipment | Senior Secured First Lien Term Loan (LIBOR + 4.25%, 1.00% LIBOR Floor)(2) | 10/1/2025 | 2,935,723 | 2,926,468 | 2,847,651 | |||||||||
| NGS US Finco, LLC | Capital Equipment | Senior Secured First Lien Term Loan (LIBOR + 5.25%, 1.00% LIBOR Floor)(2) | 10/1/2025 | 2,500,000 | 2,451,295 | 2,450,000 | |||||||||
|
Northern Star Industries, Inc. |
Capital Equipment |
Senior Secured First Lien Term Loan (LIBOR + 4.75%, 1.00% LIBOR Floor)(5) |
3/28/2025 |
4,133,125 | 4,120,550 | 3,797,102 | |||||||||
| NorthStar Group Services, Inc. | Environmental Industries | Senior Secured First Lien Term Loan (LIBOR + 5.50%, 1.00% LIBOR Floor)(4) | 11/12/2026 | 5,000,000 | 4,925,521 | 4,925,500 | |||||||||
|
Nuvei Technologies Corp. |
Banking, Finance, Insurance & Real Estate |
Senior Secured First Lien Term Loan (LIBOR + 4.00%, 0.75% LIBOR Floor)(2) |
9/29/2025 |
3,000,000 | 3,000,000 | 3,003,900 | |||||||||
|
Offen, Inc. |
Transportation: Cargo |
Senior Secured First Lien Term Loan (LIBOR + 5.00%, 1.00% LIBOR Floor)(4) |
6/22/2026 |
4,944,911 | 4,916,534 | 4,772,829 | |||||||||
|
Patriot Rail Company LLC |
Transportation: Cargo |
Senior Secured First Lien Term Loan (LIBOR + 5.25%)(4) |
10/19/2026 |
1,736,875 | 1,708,056 | 1,739,133 | |||||||||
|
Peraton Corp. |
Aerospace and Defense |
Senior Secured First Lien Term Loan (LIBOR + 5.25%, 1.00% LIBOR Floor)(2) |
4/29/2024 |
3,362,879 | 3,354,861 | 3,358,843 | |||||||||
|
PetroChoice Holdings, Inc. |
Chemicals, Plastics and Rubber |
Senior Secured First Lien Term Loan (LIBOR + 5.00%, 1.00% LIBOR Floor)(2) |
8/19/2022 |
6,751,727 | 6,739,538 | 6,426,969 | |||||||||
|
Company |
Industry |
Type of Investment |
Maturity |
Par Amount |
Cost |
Fair Value(1) |
|||||||||
|
Plaskolite PPC Intermediate II LLC |
Chemicals, Plastics and Rubber |
Senior Secured First Lien Term Loan (LIBOR + 4.25%, 1.00% LIBOR Floor)(4) |
12/15/2025 |
3,185,000 | 3,143,257 | 3,171,305 | |||||||||
|
Port Townsend Holdings Company, Inc. |
Forest Products & Paper |
Senior Secured First Lien Term Loan (LIBOR + 4.75%, 1.00% LIBOR Floor)(2)(6) |
4/3/2024 |
2,937,918 | 2,921,835 | 2,630,140 | |||||||||
|
PT Network, LLC |
Healthcare & Pharmaceuticals |
Senior Secured First Lien Term Loan (LIBOR + 5.50%, 1.00% LIBOR Floor, 2% PIK)(5)(9) |
11/30/2023 |
4,497,071 | 4,322,519 | 4,137,305 | |||||||||
|
PT Network, LLC |
Healthcare & Pharmaceuticals |
Class C Common Stock(7) |
1 | - | - | ||||||||||
|
PVHC Holding Corp |
Containers, Packaging and Glass |
Senior Secured First Lien Term Loan (LIBOR + 4.75%, 1.00% LIBOR Floor)(4) |
8/2/2024 |
1,947,447 | 1,941,553 | 1,858,254 | |||||||||
|
Quartz Holding Company |
High Tech Industries |
Senior Secured First Lien Term Loan (LIBOR + 4.00%)(2) |
4/2/2026 |
949,061 | 948,258 | 926,569 | |||||||||
|
RB Media, Inc. |
Media: Diversified & Production |
Senior Secured First Lien Term Loan (LIBOR + 4.25%, 1.00% LIBOR Floor)(2) |
8/29/2025 |
5,632,559 | 5,597,474 | 5,592,568 | |||||||||
| Resolute | Banking, Finance, Insurance & Real Estate | Senior Secured First Lien Term Loan (LIBOR + 8.00%, 1.00% LIBOR Floor)(4) | 4/30/2025 | 2,000,000 | 1,990,307 | 1,981,200 | |||||||||
|
Salient CRGT Inc. |
High Tech Industries |
Senior Secured First Lien Term Loan (LIBOR + 6.50%, 1.00% LIBOR Floor)(2) |
2/28/2022 |
4,159,226 | 4,139,751 | 3,987,866 | |||||||||
|
Sierra Enterprises, LLC |
Beverage & Food |
Senior Secured First Lien Term Loan (LIBOR + 4.00%, 1.00% LIBOR Floor)(2) |
11/11/2024 |
3,869,259 | 3,862,349 | 3,637,104 | |||||||||
|
Simplified Logistics, LLC |
Services: Business |
Senior Secured First Lien Term Loan (LIBOR + 6.50%, 1.00% LIBOR Floor)(4) |
2/27/2022 |
3,438,750 | 3,381,255 | 3,386,137 | |||||||||
|
Syniverse Holdings, Inc. |
High Tech Industries |
Senior Secured First Lien Term Loan (LIBOR + 5.00%, 1.00% LIBOR Floor)(2) |
3/9/2023 |
2,897,803 | 2,885,063 | 2,621,933 | |||||||||
| TEAM Services | Services: Consumer | Senior Secured First Lien Term Loan (LIBOR + 5.00%, 1.00% LIBOR Floor)(5) | 12/20/2027 | 5,000,000 | 4,850,587 | 4,825,000 | |||||||||
|
The Octave Music Group, Inc. |
Media: Diversified & Production |
Senior Secured First Lien Term Loan (LIBOR + 5.25%, 1.00% LIBOR Floor, 0.75% PIK)(4)(9) |
5/29/2025 |
5,844,828 | 5,795,611 | 5,085,000 | |||||||||
|
Veregy |
Transportation: Cargo |
Senior Secured First Lien Term Loan (LIBOR + 6.00%, 1.00% LIBOR Floor)(4) |
11/3/2027 |
4,000,000 | 3,882,494 | 3,952,400 | |||||||||
|
Vero Parent, Inc. |
High Tech Industries |
Senior Secured First Lien Term Loan (LIBOR + 4.50, 1.00% LIBOR Floor)(2) |
8/16/2024 |
3,866,037 | 3,848,371 | 3,850,960 | |||||||||
|
Company |
Industry |
Type of Investment |
Maturity |
Par Amount |
Cost |
Fair Value(1) |
|||||||||
|
Wawona Delaware Holdings, LLC |
Beverage & Food |
Senior Secured First Lien Term Loan (LIBOR + 4.75%)(4) |
9/11/2026 |
942,963 | 935,269 | 919,389 | |||||||||
|
Wok Holdings Inc. |
Retail |
Senior Secured First Lien Term Loan (LIBOR + 6.25%)(2) |
3/1/2026 |
6,533,625 | 6,492,517 | 5,686,867 | |||||||||
|
Wrench Group LLC |
Services: Consumer |
Senior Secured First Lien Term Loan (LIBOR + 4.00%, 1.00% LIBOR Floor)(4) |
4/30/2026 |
2,937,242 | 2,915,853 | 2,866,748 | |||||||||
|
Total |
$ | 210,175,007 | $ | 208,071,345 | $ | 196,605,878 | |||||||||
|
(1) |
All securities are valued using significant unobservable inputs, which are categorized as Level 3 assets under the definition of ASC 820 fair value hierarchy. |
|
(2) |
The interest rate on these loans is subject to a base rate plus 1 Month (“1M”) LIBOR, which at December 31, 2020 was 0.14%. As the interest rate is subject to a minimum LIBOR floor, the prevailing rate in effect at December 31, 2020 was the base rate plus the LIBOR floor or 1M LIBOR. |
|
(3) |
The interest rate on these loans is subject to a base rate plus 2 Month (“2M”) LIBOR, which at December 31, 2020 was 0.19%. As the interest rate is subject to a minimum LIBOR floor, the prevailing rate in effect at December 31, 2020 was the base rate plus the LIBOR floor or 2M LIBOR. |
|
(4) |
The interest rate on these loans is subject to a base rate plus 3 Month (“3M”) LIBOR, which at December 31, 2020 was 0.24%. As the interest rate is subject to a minimum LIBOR floor, the prevailing rate in effect at December 31, 2020 was the base rate plus the LIBOR floor or 3M LIBOR. |
|
(5) |
The interest rate on these loans is subject to a base rate plus 6 Month (“6M”) LIBOR, which at December 31, 2020 was 0.34%. As the interest rate is subject to a minimum LIBOR floor, the prevailing rate in effect at December 31, 2020 was the base rate plus the LIBOR floor or 6M LIBOR. |
|
(6) |
Includes an analysis of the value of any unfunded loan commitments. |
|
(7) |
Security is non-income producing. |
|
(8) |
The investment was on non-accrual status as of December 31, 2020. |
|
(9) |
Par amount includes accumulated paid-in-kind ("PIK") interest and is net of repayments. |
The following is a list of the individual investments in Sierra JV's portfolio as of December 31, 2019:
|
Company |
Industry |
Type of Investment |
Maturity |
Par Amount |
Cost |
Fair Value(1) |
|||||||||
|
4Over International, LLC |
Media: Advertising, Printing & Publishing |
Senior Secured First Lien Term Loan (LIBOR + 6.00%, 1.00% LIBOR Floor) |
6/7/2022 |
$ | 10,826,856 | $ | 10,826,856 | $ | 10,648,215 | ||||||
|
Acrisure, LLC |
Banking, Finance, Insurance & Real Estate |
Senior Secured First Lien Term Loan (LIBOR + 4.25%, 1.00% LIBOR Floor) |
11/22/2023 |
3,182,966 | 3,183,838 | 3,187,103 | |||||||||
|
Brightspring Health Services |
Healthcare & Pharmaceuticals |
Senior Secured First Lien Term Loan (LIBOR + 4.50%) |
3/5/2026 |
3,980,000 | 3,933,275 | 3,998,905 | |||||||||
|
Callaway Golf Company |
Consumer Goods: Durable |
Senior Secured First Lien Term Loan (LIBOR + 4.50%, 1.00% LIBOR Floor) |
1/4/2026 |
2,766,749 | 2,720,217 | 2,794,418 | |||||||||
|
Cambrex Corporation |
Healthcare & Pharmaceuticals |
Senior Secured First Lien Term Loan (LIBOR + 5.00%, 1.00% LIBOR Floor) |
12/4/2026 |
4,000,000 | 3,920,721 | 3,920,000 | |||||||||
|
Cardenas Markets LLC |
Retail |
Senior Secured First Lien Term Loan (LIBOR + 5.75%, 1.00% LIBOR Floor) |
11/29/2023 |
6,305,000 | 6,269,750 | 6,195,293 | |||||||||
|
CHA Consulting, Inc. |
Construction & Building |
Senior Secured First Lien Term Loan (LIBOR + 4.50%, 1.00% LIBOR Floor) |
4/10/2025 |
1,350,672 | 1,345,582 | 1,347,565 | |||||||||
|
CHA Consulting, Inc. |
Construction & Building |
Senior Secured First Lien Term Loan (LIBOR + 4.50%, 1.00% LIBOR Floor)(2) |
4/10/2025 |
597,000 | 597,000 | 595,627 | |||||||||
|
Covenant Surgical Partners, Inc. |
Healthcare & Pharmaceuticals |
Senior Secured First Lien Term Loan (LIBOR + 4.00%)(2) |
7/1/2026 |
4,987,500 | 4,941,073 | 4,942,594 | |||||||||
|
CT Technologies Intermediate Holdings, Inc. |
Healthcare & Pharmaceuticals |
Senior Secured First Lien Term Loan (LIBOR + 4.25%, 1.00% LIBOR Floor) |
12/1/2021 |
4,121,112 | 4,064,756 | 3,878,791 | |||||||||
|
Directbuy Home Improvement, Inc. |
Retail |
Senior Secured First Lien Term Loan (LIBOR + 6.50%, 1.00% LIBOR Floor)(2) |
6/20/2022 |
274,413 | 274,413 | 274,413 | |||||||||
| Directbuy Home Improvement, Inc. | Retail | Common Stock - 201,591 shares(3) | — | 79,237 | 64,509 | ||||||||||
|
Company |
Industry |
Type of Investment |
Maturity |
Par Amount |
Cost |
Fair Value(1) |
|||||||||
|
Envision Healthcare Corporation |
Healthcare & Pharmaceuticals |
Senior Secured First Lien Term Loan (LIBOR + 3.75%, 1.00% LIBOR Floor) |
10/10/2025 |
1,955,250 | 1,896,560 | 1,666,264 | |||||||||
|
GC EOS Buyer, Inc. |
Automotive |
Senior Secured First Lien Term Loan (LIBOR + 4.50%, 1.00% LIBOR Floor) |
8/1/2025 |
3,436,387 | 3,392,804 | 3,340,511 | |||||||||
|
GK Holdings, Inc. |
Services: Business |
Senior Secured First Lien Term Loan (LIBOR + 6.00%, 1.00% LIBOR Floor) |
1/20/2021 |
3,905,952 | 3,900,993 | 3,241,940 | |||||||||
|
Glass Mountain Pipeline Holdings, LLC |
Energy: Oil & Gas |
Senior Secured First Lien Term Loan (LIBOR + 4.50%, 1.00% LIBOR Floor) |
12/23/2024 |
4,887,938 | 4,874,842 | 4,286,232 | |||||||||
|
Golden West Packaging Group LLC |
Forest Products & Paper |
Senior Secured First Lien Term Loan (LIBOR + 5.75%, 1.00% LIBOR Floor) |
6/20/2023 |
4,121,837 | 4,121,837 | 4,092,984 | |||||||||
|
High Ridge (DIP Term Loan) |
Consumer Goods: Non-Durable |
Senior Secured First Lien Term Loan (LIBOR + 7.00%, 1.00% LIBOR Floor)(3)(4) |
4/18/2020 |
143,852 | 139,187 | 143,852 | |||||||||
|
High Ridge Brands Co. |
Consumer Goods: Non-Durable |
Senior Secured First Lien Term Loan (LIBOR + 7.00%, 1.00% LIBOR Floor) |
6/30/2022 |
3,031,250 | 3,011,569 | 1,312,531 | |||||||||
|
Highline Aftermarket Acquisitions, LLC |
Automotive |
Senior Secured First Lien Term Loan (LIBOR + 3.50%, 1.00% LIBOR Floor) |
4/26/2025 |
4,055,882 | 4,045,615 | 3,660,434 | |||||||||
|
Infogroup, Inc. |
Services: Business |
Senior Secured First Lien Term Loan (LIBOR + 5.00%, 1.00% LIBOR Floor) |
4/3/2023 |
4,862,500 | 4,835,906 | 4,704,955 | |||||||||
|
Intermediate LLC |
High Tech Industries |
Senior Secured First Lien Term Loan (LIBOR + 4.00%, 1.00% LIBOR Floor) |
7/1/2026 |
2,743,125 | 2,726,710 | 2,729,409 | |||||||||
|
Isagenix International, LLC |
Wholesale |
Senior Secured First Lien Term Loan (LIBOR + 5.75%, 1.00% LIBOR Floor) |
6/16/2025 |
2,750,063 | 2,737,896 | 1,924,494 | |||||||||
|
Jordan Health Products I, Inc. |
Healthcare & Pharmaceuticals |
Senior Secured First Lien Term Loan (LIBOR + 5.00%, 1.00% LIBOR Floor) |
5/15/2025 |
5,168,658 | 5,107,272 | 3,721,434 | |||||||||
|
Keystone Acquisition Corp. |
Healthcare & Pharmaceuticals |
Senior Secured First Lien Term Loan (LIBOR + 5.25%, 1.00% LIBOR Floor) |
5/1/2024 |
6,146,978 | 6,075,006 | 5,993,304 | |||||||||
|
KNB Holdings Corporation |
Consumer Goods: Durable |
Senior Secured First Lien Term Loan (LIBOR + 5.50%, 1.00% LIBOR Floor) |
4/26/2024 |
4,839,315 | 4,779,469 | 3,629,970 | |||||||||
|
Liaison Acquisition, LLC |
High Tech Industries |
Senior Secured First Lien Term Loan (LIBOR + 4.50%, 1.00% LIBOR Floor) |
12/20/2026 |
6,500,000 | 6,483,801 | 6,483,750 | |||||||||
|
LifeMiles Ltd. |
Services: Consumer |
Senior Secured First Lien Term Loan (LIBOR + 5.50%, 1.00% LIBOR Floor) |
8/18/2022 |
4,684,602 | 4,671,137 | 4,614,801 | |||||||||
|
Manna Pro Products, LLC |
Consumer Goods: Non-Durable |
Senior Secured First Lien Term Loan (LIBOR + 6.00%, 1.00% LIBOR Floor)(2) |
12/8/2023 |
3,021,667 | 3,021,667 | 2,904,426 | |||||||||
|
Manna Pro Products, LLC |
Consumer Goods: Non-Durable |
Senior Secured First Lien Term Loan (LIBOR + 6.00%, 1.00% LIBOR Floor) |
12/8/2023 |
613,583 | 613,583 | 589,776 | |||||||||
|
MediaOcean |
Media: Advertising, Printing & Publishing |
Senior Secured First Lien Term Loan (LIBOR + 4.00%, 1.00% LIBOR Floor)(2) |
8/18/2025 |
1,750,000 | 1,745,688 | 1,745,625 | |||||||||
|
NGS US Finco, LLC |
Capital Equipment |
Senior Secured First Lien Term Loan (LIBOR + 4.25%, 1.00% LIBOR Floor) |
10/1/2025 |
2,970,000 | 2,958,188 | 2,968,218 | |||||||||
|
Northern Star Industries, Inc. |
Capital Equipment |
Senior Secured First Lien Term Loan (LIBOR + 4.50%, 1.00% LIBOR Floor)(4) |
3/28/2025 |
4,175,625 | 4,159,917 | 4,049,521 | |||||||||
|
Nuvei Technologies Corp. |
Banking, Finance, Insurance & Real Estate |
Senior Secured First Lien Term Loan (LIBOR + 5.00%, 1.00% LIBOR Floor) |
9/29/2025 |
975,269 | 975,269 | 980,145 | |||||||||
|
Nuvei Technologies Corp. |
Banking, Finance, Insurance & Real Estate |
Senior Secured First Lien Term Loan (LIBOR + 5.00%, 1.00% LIBOR Floor) |
9/29/2025 |
4,826,747 | 4,785,934 | 4,850,881 | |||||||||
|
Company |
Industry |
Type of Investment |
Maturity |
Par Amount |
Cost |
Fair Value(1) |
|||||||||
|
Nuvei Technologies Corp. |
Banking, Finance, Insurance & Real Estate |
Senior Secured First Lien Term Loan (LIBOR + 5.00%, 1.00% LIBOR Floor) |
9/29/2025 |
707,074 | 707,074 | 710,609 | |||||||||
|
Offen, Inc. |
Transportation: Cargo |
Senior Secured First Lien Term Loan (LIBOR + 5.00%)(2) |
6/22/2026 |
3,654,204 | 3,620,287 | 3,654,204 | |||||||||
|
Patriot Rail Company LLC |
Transportation: Cargo |
Senior Secured First Lien Term Loan (LIBOR + 5.25%, 1.00% LIBOR Floor) |
10/19/2026 |
1,750,000 | 1,715,946 | 1,715,000 | |||||||||
|
Peraton Corp. |
Aerospace and Defense |
Senior Secured First Lien Term Loan (LIBOR + 5.25%, 1.00% LIBOR Floor) |
4/29/2024 |
3,397,727 | 3,387,186 | 3,380,739 | |||||||||
|
PetroChoice Holdings, Inc. |
Chemicals, Plastics and Rubber |
Senior Secured First Lien Term Loan (LIBOR + 5.00%, 1.00% LIBOR Floor) |
8/19/2022 |
6,822,978 | 6,807,103 | 6,473,642 | |||||||||
|
Plaskolite PPC Intermediate II LLC |
Chemicals, Plastics and Rubber |
Senior Secured First Lien Term Loan (LIBOR + 4.25%, 1.00% LIBOR Floor) |
12/15/2025 |
3,217,500 | 3,164,435 | 2,984,231 | |||||||||
|
Port Townsend Holdings Company, Inc. |
Forest Products & Paper |
Senior Secured First Lien Term Loan (LIBOR + 4.75%, 1.00% LIBOR Floor) |
4/3/2024 |
3,034,160 | 3,012,438 | 2,883,970 | |||||||||
|
PT Network, LLC |
Healthcare & Pharmaceuticals |
Senior Secured First Lien Term Loan (LIBOR + 5.50%, 1.00% LIBOR Floor, 2% PIK)(4) |
11/30/2023 |
4,439,284 | 4,198,393 | 4,150,286 | |||||||||
|
PT Network, LLC |
Healthcare & Pharmaceuticals |
Class C Common Stock(3) |
— | — | — | ||||||||||
|
PVHC Holding Corp |
Containers, Packaging and Glass |
Senior Secured First Lien Term Loan (LIBOR + 4.75%, 1.00% LIBOR Floor)(2) |
8/5/2024 |
1,967,369 | 1,959,755 | 1,816,508 | |||||||||
|
Quartz Holding Company |
High Tech Industries |
Senior Secured First Lien Term Loan (LIBOR + 4.00%, 1.00% LIBOR Floor) |
4/2/2026 |
6,466,253 | 6,444,757 | 6,433,922 | |||||||||
|
RB Media, Inc. |
Media: Diversified & Production |
Senior Secured First Lien Term Loan (LIBOR + 4.50%, 1.00% LIBOR Floor) |
8/29/2025 |
5,431,250 | 5,387,100 | 5,431,250 | |||||||||
|
Rough Country, LLC |
Automotive |
Senior Secured First Lien Term Loan (LIBOR + 3.50%, 1.00% LIBOR Floor) |
5/25/2023 |
4,698,652 | 4,684,364 | 4,651,666 | |||||||||
|
Safe Fleet Holdings LLC |
Automotive |
Senior Secured First Lien Term Loan (LIBOR + 3.00%, 1.00% LIBOR Floor) |
2/3/2025 |
3,414,188 | 3,407,774 | 3,254,233 | |||||||||
|
Safe Fleet Holdings LLC |
Automotive |
Senior Secured First Lien Term Loan (LIBOR + 3.75%, 1.00% LIBOR Floor) |
2/3/2025 |
1,332,506 | 1,291,776 | 1,271,344 | |||||||||
|
Salient CRGT Inc. |
High Tech Industries |
Senior Secured First Lien Term Loan (LIBOR + 6.50%, 1.00% LIBOR Floor) |
2/28/2022 |
4,377,976 | 4,339,781 | 3,983,958 | |||||||||
|
SCS Holdings I Inc. |
Wholesale |
Senior Secured First Lien Term Loan (LIBOR + 4.25%, 1.00% LIBOR Floor) |
7/1/2026 |
2,238,750 | 2,233,552 | 2,247,257 | |||||||||
|
Shift4 Payments, LLC |
Banking, Finance, Insurance & Real Estate |
Senior Secured First Lien Term Loan (LIBOR + 4.50%, 1.00% LIBOR Floor) |
11/29/2024 |
9,800,000 | 9,765,521 | 9,831,360 | |||||||||
|
Sierra Enterprises, LLC |
Beverage & Food |
Senior Secured First Lien Term Loan (LIBOR + 4.00%, 1.00% LIBOR Floor) |
11/11/2024 |
3,909,046 | 3,900,184 | 3,889,501 | |||||||||
|
Simplified Logistics, LLC |
Services: Business |
Senior Secured First Lien Term Loan (LIBOR + 6.50%, 1.00% LIBOR Floor) |
2/27/2022 |
3,473,750 | 3,401,169 | 3,473,750 | |||||||||
|
SMB Shipping Logistics, LLC |
Transportation: Cargo |
Senior Secured First Lien Term Loan (LIBOR + 4.00%, 1.00% LIBOR Floor) |
2/5/2024 |
1,462,048 | 1,451,196 | 1,451,521 | |||||||||
|
Syniverse Holdings, Inc. |
High Tech Industries |
Senior Secured First Lien Term Loan (LIBOR + 5.00%, 1.00% LIBOR Floor) |
3/9/2023 |
2,927,601 | 2,908,826 | 2,762,191 | |||||||||
|
The Imagine Group, LLC |
Media: Advertising, Printing & Publishing |
Senior Secured First Lien Term Loan (LIBOR + 4.75%, 1.00% LIBOR Floor) |
6/21/2022 |
7,780,000 | 7,740,720 | 2,650,646 | |||||||||
|
Company |
Industry |
Type of Investment |
Maturity |
Par Amount |
Cost |
Fair Value(1) |
|||||||||
| The Octave Music Group, Inc. | Media: Diversified & Production | Senior Secured First Lien Term Loan (LIBOR + 4.75%, 1.00% LIBOR Floor) | 5/28/2021 | 4,337,289 | 4,337,289 | 4,332,085 | |||||||||
| ThoughtWorks, Inc. | High Tech Industries | Senior Secured First Lien Term Loan (LIBOR + 4.00%, 1.00% LIBOR Floor) | 10/11/2024 | 6,658,045 | 6,643,269 | 6,674,690 | |||||||||
| Tortoise Borrower LLC | Banking, Finance, Insurance & Real Estate | Senior Secured First Lien Term Loan (LIBOR + 3.50%, 1.00% LIBOR Floor) | 1/31/2025 | 2,431,688 | 2,422,832 | 2,416,611 | |||||||||
| United Road Services, Inc. | Transportation: Cargo | Senior Secured First Lien Term Loan (LIBOR + 5.75%, 1.00% LIBOR Floor) | 9/2/2024 | 3,729,999 | 3,717,259 | 3,468,899 | |||||||||
| Vero Parent, Inc. | High Tech Industries | Senior Secured First Lien Term Loan (LIBOR + 6.25%, 1.00% LIBOR Floor) | 8/16/2024 | 3,905,587 | 3,882,806 | 3,739,600 | |||||||||
| Wawona Delaware Holdings, LLC | Beverage & Food | Senior Secured First Lien Term Loan (LIBOR + 4.75%, 1.00% LIBOR Floor) | 9/11/2026 | 4,962,563 | 4,914,942 | 4,912,937 | |||||||||
| Wok Holdings Inc. | Retail | Senior Secured First Lien Term Loan (LIBOR + 6.50%, 1.00% LIBOR Floor) | 3/1/2026 | 6,600,125 | 6,549,669 | 5,321,681 | |||||||||
| Wrench Group LLC | Services: Consumer | Senior Secured First Lien Term Loan (LIBOR + 4.25%, 1.00% LIBOR Floor) | 4/30/2026 | 2,220,094 | 2,203,372 | 2,205,275 | |||||||||
| Xebec Global Holdings, LLC | High Tech Industries | Senior Secured First Lien Term Loan (LIBOR + 5.25%, 1.00% LIBOR Floor) | 2/12/2024 | 8,114,342 | 8,114,342 | 8,094,056 | |||||||||
|
Z Medica, LLC |
Healthcare & Pharmaceuticals |
Senior Secured First Lien Term Loan (LIBOR + 5.50%, 1.00% LIBOR Floor) |
9/29/2022 |
2,632,500 | 2,632,500 | 2,566,424 | |||||||||
|
Total |
$ | 255,853,296 | $ | 254,165,185 | $ | 238,316,936 | |||||||||
|
(1) |
All securities are valued using significant unobservable inputs, which are categorized as Level 3 assets under the definition of ASC 820 fair value hierarchy. |
|
(2) |
The interest rate on these loans is subject to a base rate plus 1 Month (“1M”) LIBOR, which at December 31, 2019 was 1.76%. As the interest rate is subject to a minimum LIBOR floor, the prevailing rate in effect at December 31, 2019 was the base rate plus the LIBOR floor or 1M LIBOR. |
|
(3) |
The interest rate on these loans is subject to a base rate plus 2 Month (“2M”) LIBOR, which at December 31, 2019 was 1.83%. As the interest rate is subject to a minimum LIBOR floor, the prevailing rate in effect at December 31, 2019 was the base rate plus the LIBOR floor or 2M LIBOR. |
|
(4) |
The interest rate on these loans is subject to a base rate plus 3 Month (“3M”) LIBOR, which at December 31, 2019 was 1.91%. As the interest rate is subject to a minimum LIBOR floor, the prevailing rate in effect at December 31, 2019 was the base rate plus the LIBOR floor or 3M LIBOR. |
|
(5) |
The interest rate on these loans is subject to a base rate plus 6 Month (“6M”) LIBOR, which at December 31, 2019 was 1.91%. As the interest rate is subject to a minimum LIBOR floor, the prevailing rate in effect at December 31, 2019 was the base rate plus the LIBOR floor or 6M LIBOR. |
|
(6) |
Includes an analysis of the value of any unfunded loan commitments. |
| (7) | Security is non-income producing. |
|
(8) |
The investment was on non-accrual status as of December 31, 2019. |
| (9) | Par amount includes accumulated paid-in-kind ("PIK") interest and is net of repayments. |
Below is certain summarized financial information for the Sierra JV as of December 31, 2020 and 2019, and for the years ended December 31, 2020 and 2019:
|
December 31, 2020 |
December 31, 2019 |
|||||||
|
Selected Consolidated Statement of Assets and Liabilities Information: |
||||||||
|
Investments in loans at fair value (Amortized cost of $208,071,345 and $254,165,185, respectively) |
$ | 196,605,878 | $ | 238,316,936 | ||||
|
Cash and cash equivalents |
17,130,001 | 44,019,523 | ||||||
|
Other assets |
1,173,707 | 943,994 | ||||||
|
Total assets |
$ | 214,909,586 | $ | 283,280,453 | ||||
|
Senior credit facility payable (net of deferred financing costs of $2,639,540 and $2,355,405, respectively) |
$ | 122,063,405 | $ | 202,544,595 | ||||
|
Other liabilities |
526,233 | 501,316 | ||||||
|
Interest payable |
432,351 | 852,009 | ||||||
|
Total liabilities |
123,021,989 | 203,897,920 | ||||||
|
Members’ capital |
91,887,597 | 79,382,533 | ||||||
|
Total liabilities and members' capital |
$ | 214,909,586 | $ | 283,280,453 | ||||
|
Year ended December 31, 2020 |
Year ended December 31, 2019 |
|||||||
|
Selected Consolidated Statement of Operations Information: |
||||||||
|
Total investment income |
$ | 14,629,790 | $ | 21,204,043 | ||||
|
Total expenses |
9,097,602 | 12,750,993 | ||||||
|
Net change in unrealized appreciation/(depreciation) of investments |
4,382,782 | (10,501,720 | ) | |||||
|
Net realized gain/(loss) on investments |
(11,709,906 | ) | (4,648,094 | ) | ||||
|
Net income/(loss) |
$ | (1,794,936 | ) | $ | (6,696,764 | ) | ||
Rule 4-08(g) of Regulation S-X requires the Company to include summarized financial statements of any unconsolidated controlled subsidiary (portfolio company in which the Company owns greater than 25% of the voting securities of the unconsolidated subsidiary or otherwise controls the subsidiary) in the Company's annual report on Form 10-K if one of the following conditions are met: (i) if the portfolio investment’s fair value exceeds 10% of the Company’s total investments fair value (the investment test); or (ii) either (A) if the income from the portfolio investment exceeds 80% of the Company’s absolute value of the change in net assets from operations of the Company and its subsidiaries (the income test) or (B) if the income from the portfolio investment income exceeds 10% of the Company’s absolute value of the change in net assets from operations of the Company and its subsidiaries and have a fair value exceeding 5% of the Company’s total investment fair value (the alternate income test).
After performing the investment analysis and income analysis for the year ended December 31, 2020, the Company determined that no portfolio company would be deemed to be a significant subsidiary pursuant to Rules 3-09 and 4-08(g) of Regulation S- X.
Note 4. Fair Value Measurements
The Company follows ASC 820 for measuring the fair value of portfolio investments. Fair value is the price that would be received in the sale of an asset or paid to transfer a liability in an orderly transaction between market participants at the measurement date. Where available, fair value is based on observable market prices or parameters, or derived from such prices or parameters. Where observable prices or inputs are not available, valuation models are applied. These valuation models involve some level of management estimation and judgment, the degree of which is dependent on the price transparency for the instruments or market and the instruments’ complexity. The Company’s fair value analysis includes an analysis of the value of any unfunded loan commitments. Financial investments recorded at fair value in the consolidated financial statements are categorized for disclosure purposes based upon the level of judgment associated with the inputs used to measure their value. The valuation hierarchical levels are based upon the transparency of the inputs to the valuation of the investment as of the measurement date. The three levels are defined as follows. Investments which are valued using NAV as a practical expedient are excluded from this hierarchy:
|
• |
Level 1 — Valuations based on quoted prices in active markets for identical assets or liabilities at the measurement date. |
|
• |
Level 2 — Valuations based on inputs other than quoted prices in active markets included in Level 1, which are either directly or indirectly observable at the measurement date. This category includes quoted prices for similar assets or liabilities in active markets, quoted prices for identical or similar assets or liabilities in non-active markets including actionable bids from third parties for privately held assets or liabilities, and observable inputs other than quoted prices such as yield curves and forward currency rates that are entered directly into valuation models to determine the value of derivatives or other assets or liabilities. |
|
• |
Level 3 — Valuations based on inputs that are unobservable and where there is little, if any, market activity at the measurement date. The inputs for the determination of fair value may require significant management judgment or estimation and is based upon management’s assessment of the assumptions that market participants would use in pricing the assets or liabilities. These investments include debt and equity investments in private companies or assets valued using the Market or Income Approach and may involve pricing models whose inputs require significant judgment or estimation because of the absence of any meaningful current market data for identical or similar investments. The inputs in these valuations may include, but are not limited to, capitalization and discount rates, beta and Earnings Before Interest, Taxes, Depreciation and Amortization ("EBITDA") multiples. The information may also include pricing information or broker quotes which include a disclaimer that the broker would not be held to such a price in an actual transaction. The non-binding nature of consensus pricing and/or quotes accompanied by disclaimer would result in classification as Level 3 information, assuming no additional corroborating evidence. |
In addition to using the above inputs in investment valuations, the Company employs the valuation policy approved by the board of directors that is consistent with ASC 820 (see Note 2). Consistent with the Company’s valuation policy, the Company evaluates the source of inputs, including any markets in which the Company’s investments are trading, in determining fair value.
The following table presents the fair value measurements of the Company’s total investments, by major class according to the fair value hierarchy, as of December 31, 2020:
|
Type of Investment (1) |
Level 1 |
Level 2 |
Level 3 |
Total |
||||||||||||
|
Asset |
||||||||||||||||
|
Senior secured first lien term loans |
$ | — | $ | — | $ | 315,490,601 | $ | 315,490,601 | ||||||||
|
Senior secured first lien notes |
— | — | 8,548,755 | 8,548,755 | ||||||||||||
|
Senior secured second lien term loans |
— | — | 93,794,917 | 93,794,917 | ||||||||||||
|
Subordinated notes |
— | — | 50,039,500 | 50,039,500 | ||||||||||||
|
Equity/warrants |
767,144 | — | 47,190,227 | 47,957,371 | ||||||||||||
|
Total |
$ | 767,144 | $ | — | $ | 515,064,000 | $ | 515,831,144 | ||||||||
|
Investments measured at net asset value |
$ | 88,155,336 | ||||||||||||||
|
Total Investments, at fair value |
$ | 603,986,480 | ||||||||||||||
|
(1) |
Certain investments that are measured at fair value using NAV have not been categorized in the fair value hierarchy. The fair value amounts presented in the table are intended to permit reconciliation of the fair value hierarchy to the amount presented in the Consolidated Statements of Assets and Liabilities. |
The following table presents the fair value measurements of the Company’s total investments, by major class according to the fair value hierarchy, as of December 31, 2019:
|
Type of Investment (1) |
Level 1 |
Level 2 |
Level 3 |
Total |
||||||||||||
|
Asset |
||||||||||||||||
|
Senior secured first lien term loans |
$ | — | $ | — | $ | 328,816,197 | $ | 328,816,197 | ||||||||
|
Senior secured first lien notes |
— | — | 14,354,825 | 14,354,825 | ||||||||||||
|
Senior secured second lien term loans |
— | — | 122,817,885 | 122,817,885 | ||||||||||||
|
Subordinated Notes |
— | — | 63,021,420 | 63,021,420 | ||||||||||||
|
Equity/warrants |
33,892,511 | — | 38,521,450 | 72,413,961 | ||||||||||||
|
Total |
$ | 33,892,511 | $ | — | $ | 567,531,777 | $ | 601,424,288 | ||||||||
|
Investments measured at net asset value |
$ | 74,199,642 | ||||||||||||||
|
Total Investments, at fair value |
$ | 675,623,930 | ||||||||||||||
|
(1) |
Certain investments that are measured at fair value using NAV have not been categorized in the fair value hierarchy. The fair value amounts presented in the table are intended to permit reconciliation of the fair value hierarchy to the amount presented in the Consolidated Statements of Assets and Liabilities. |
The following table provides a reconciliation of the beginning and ending balances for total investments that use Level 3 inputs for the year ended December 31, 2020:
| Senior Secured First Lien Term Loans |
Senior Secured First Lien Notes |
Senior Secured Second Lien Term Loans |
Subordinated Notes |
Equity/warrants |
Total |
|||||||||||||||||||
|
Balance, December 31, 2019 |
$ | 328,816,197 | $ | 14,354,825 | $ | 122,817,885 | $ | 63,021,420 | $ | 38,521,450 | $ | 567,531,777 | ||||||||||||
|
Purchases |
85,861,584 | 1,000,000 | 18,050,833 | 1,723,670 | 474,802 | 107,541,763 | ||||||||||||||||||
|
Sales |
(59,531,538 | ) | (2,613,875 | ) | (38,963,177 | ) | (6,418,204 | ) | (2,308,101 | ) | (109,834,895 | ) | ||||||||||||
|
Transfers in |
— | — | — | — | — | — | ||||||||||||||||||
|
Transfers out |
— | — | — | — | — | — | ||||||||||||||||||
|
Amortization of discount/(premium) |
1,098,221 | — | (378,606 | ) | — | — | 719,615 | |||||||||||||||||
|
Paid-in-kind interest income |
2,024,218 | — | — | — | — | 1,593,344 | ||||||||||||||||||
|
Net realized gains (losses) |
(39,684,646 | ) | (5,130,000 | ) | (33,422,085 | ) | (166,476 | ) | (4,567,133 | ) | (82,970,340 | ) | ||||||||||||
|
Net change in unrealized appreciation/ (depreciation) |
(3,093,435 | ) | 937,805 | 25,690,067 | (8,120,910 | ) | 15,069,209 | 30,482,736 | ||||||||||||||||
|
Balance, December 31, 2020 |
$ | 315,490,601 | $ | 8,548,755 | $ | 93,794,917 | $ | 50,039,500 | $ | 47,190,227 | $ | 515,064,000 | ||||||||||||
|
Change in net unrealized appreciation/ (depreciation) in investments held as of December 31, 2020 (1) |
$ | (11,350,094 | ) | $ | (15,695 | ) | $ | (2,890,942 | ) | $ | (7,191,950 | ) | $ | 9,386,338 | $ | (12,062,343 | ) | |||||||
|
(1) |
Amount is included in the change in unrealized appreciation/(depreciation) account in Consolidated Statements of Operations. |
Transfers between levels of the fair value hierarchy are reported at the beginning of the reporting period in which they occur. During the year ended December 31, 2020, the Company recorded no transfers from Level 3 to Level 2. During the year ended December 31, 2020, the Company recorded no transfers from Level 2 to Level 3.
The following table provides a reconciliation of the beginning and ending balances for total investments that use Level 3 inputs for the year ended December 31, 2019:
|
Senior Secured First Lien Term Loans |
Senior Secured First Lien Notes |
Senior Secured Second Lien Term Loans |
Subordinated Notes |
Equity/warrants |
Total Return Swap |
Total |
||||||||||||||||||||||
|
Balance, December 31, 2018 |
$ | 479,593,279 | $ | 30,752,993 | $ | 169,923,547 | $ | 66,187,857 | $ | 75,480,034 | $ | (6,524,904 | ) | 815,412,806 | ||||||||||||||
|
Purchases |
112,049,559 | — | 10,788,902 | 7,404,438 | 1,029,185 | — | 131,272,084 | |||||||||||||||||||||
|
Sales |
(219,091,494 | ) | (16,018,625 | ) | (27,871,092 | ) | (12,893,865 | ) | (58,624,316 | ) | — | (334,499,392 | ) | |||||||||||||||
| Transfers in | — | — | — | — | — | — | — | |||||||||||||||||||||
|
Transfers out |
— | — | — | — | — | — | — | |||||||||||||||||||||
|
Amortization of discount/(premium) |
1,014,411 | — | 533,214 | — | — | — | 1,547,625 | |||||||||||||||||||||
|
Paid-in-kind interest income |
4,155,616 | — | — | — | — | — | 4,155,616 | |||||||||||||||||||||
|
Net realized gains (losses) |
(47,850,396 | ) | (1,728,750 | ) | 84,328 | (2,017,784 | ) | 22,262,427 | — | (29,250,175 | ) | |||||||||||||||||
|
Net change in unrealized appreciation/ (depreciation) |
(1,054,778 | ) | 1,349,207 | (30,641,014 | ) | 4,340,774 | (1,625,880 | ) | 6,524,904 | (21,106,787 | ) | |||||||||||||||||
|
Balance, December 31, 2019 |
$ | 328,816,197 | $ | 14,354,825 | $ | 122,817,885 | $ | 63,021,420 | $ | 38,521,450 | $ | — | $ | 567,531,777 | ||||||||||||||
|
Change in net unrealized appreciation/(depreciation) in investments held as of December 31, 2019 (1) |
$ | (30,821,525 | ) | $ | 50,697 | $ | (31,255,286 | ) | $ | 1,462,084 | $ | 741,470 | $ | — | $ | (59,822,560 | ) | |||||||||||
|
(1) |
Amount is included in the change in unrealized appreciation/(depreciation) account in Consolidated Statements of Operations. |
Transfers between levels of the fair value hierarchy are reported at the beginning of the reporting period in which they occur. During the year ended December 31, 2019, the Company recorded no transfers from Level 3 to Level 2 and no transfers from Level 2 to Level 3 due to due to a decrease in observable inputs in market data and no other transfers between levels.
The following table presents the quantitative information about Level 3 fair value measurements of the Company’s total investments, as of December 31, 2020:
|
Type of Investment |
Fair Value |
Valuation techniques |
Unobservable input(1) |
Range (weighted average) |
||||
| Senior Secured First Lien Term Loans | $209,276,266 | Income Approach (DCF) | Market Yield | 4.61% - 26.41% (7.93%) | ||||
| Senior Secured First Lien Term Loans | 84,351,515 | Market Approach (Guideline Comparable)/Income Approach (DCF)/ Enterprise Value Analysis | EBITDA Multiple, Expected Proceeds, Revenue Multiple, Discount Rate | 2.00x - 9.50x (6.21x) / $48.00 - $115.00 ($69.29) / 0.80x - 1.00x (0.90x) / 16.9% - 18.9% (17.9%) | ||||
| Senior Secured First Lien Term Loans | 21,862,820 | Recent Arms-Length Transaction | Recent Arms-Length Transaction | N/A | ||||
| Senior Secured First Lien Notes | 8,548,755 | Income Approach (DCF) | Market Yield | 3.42% - 11.86% (10.78%) | ||||
| Senior Secured Second Lien Term Loans | 74,896,187 | Income Approach (DCF) | Market Yield | 7.53% - 21.50% (13.85%) | ||||
| Senior Secured Second Lien Term Loans | 13,998,730 | Market Approach (Guideline Comparable) | EBITDA Multiple, Expected Proceeds | 6.50x - 7.50x (7.00x) / $209.70 - $233.00 ($221.35) | ||||
| Senior Secured Second Lien Term Loans | 4,900,000 | Recent Arms-Length Transaction | Recent Arms-Length Transaction | N/A | ||||
| Subordinated Notes | 48,315,900 | Income Approach (DCF) | Discount Rate, Projected Default rates, Recovery Rates, Reinvestment Rates, Prepayment Rates | 11.02% - 21.00% (18.72%) / 2.00% - 2.00% (2.00%) / 65.00% - 65.00% (65.00%) / 98.00% - 98.00% (98.00%) / 20.00% - 25.00% (22.50%) | ||||
| Subordinated Notes | 1,723,600 | Recent Arms-Length Transaction | Recent Arms-Length Transaction | N/A | ||||
| Equity | 38,001,340 | Market Approach (Guideline Comparable)/Income Approach (DCF)/Enterprise Value Analysis | Book Value Multiple, EBITDA Multiple, Capitalization Rate, Revenue Multiple, Expected Proceeds | 0.75x - 1.00x (0.88x) / 2.00x - 9.50 (8.39x) / 7.50x - 9.30x (8.54%) / 0.50x - 1.00x (0.83x) / $0.10 - $66.20 ($2.60) | ||||
| Equity | 9,188,887 | Recent Arms-Length Transaction | Recent Arms-Length Transaction | N/A | ||||
|
Total |
$ | 515,064,000 | ||||||
|
(1) |
Represents the method used when the Company has determined that market participants would use such inputs when measuring the fair value of these investments. |
The following table presents the quantitative information about Level 3 fair value measurements of the Company’s total investments, as of December 31, 2019:
|
Type of Investment |
Fair Value |
Valuation techniques |
Unobservable input(1) |
Range (weighted average) |
||||
|
Senior Secured First Lien Term Loans |
$ | 265,263,318 |
Income Approach (DCF) |
Market Yield |
6.11% - 19.47 (24.25%) | |||
|
Senior Secured First Lien Term Loans |
36,067,276 |
Market Approach (Guideline Comparable)/Income Approach (DCF)/ Enterprise Value Analysis |
EBITDA Multiple, Discount Rate, Expected Proceeds | 3.50x - 8.50x (6.28x) / 17.75% - 19.50 (18.63%) / $9.0M - $65.0M ($9.0M) | ||||
|
Senior Secured First Lien Term Loans |
27,485,603 |
Recent Arms-Length Transaction |
Recent Arms-Length Transaction |
N/A | ||||
|
Senior Secured First Lien Notes |
14,354,825 |
Income Approach (DCF) |
Market Yield |
10.94% - 65.06 (30.31%) | ||||
|
Senior Secured Second Lien Term Loan |
112,179,645 |
Income Approach (DCF) |
Market Yield |
8.98% - 31.18 (11.67%) | ||||
|
Senior Secured Second Lien Term Loans |
10,638,240 |
Market Approach (Guideline Comparable)/Income Approach (DCF) |
EBITDA Multiple, Expected Proceeds | 4.50x - 123.75x (25.47x) / $123.75 - $123.75 ($123.75) | ||||
|
Subordinated Notes |
1,177,159 |
Market Approach (Guideline Comparable)/Income Approach (DCF) / Recent Arms-length transaction |
EBITDA Multiple, Discount Rate, Recent Arms-length transaction | 7.50x - 7.50x (7.50x) / 13.00% - 13.00% (13.00%) | ||||
|
Subordinated Notes |
61,844,261 |
Income Approach (DCF) |
Discount Rate |
9.40% - 23.00% (17.32%) | ||||
|
Equity |
35,575,070 |
Market Approach (Guideline Comparable)/Income Approach (DCF)/Enterprise Value Analysis |
Book Value Multiple, EBITDA Multiple, Capitalization Rate, Discount Rate, Expected Proceeds | $1.25x - $1.25 ($1.25) / 3.50x - 10.00x (7.92x) / 7.63% - 8.50% (8.16%) / 9.90% - 21.25% (18.30%) / $2.60M - $65.00M ($11.45M) | ||||
|
Equity |
2,946,380 |
Recent Arms-Length Transaction |
Recent Arms-Length Transaction |
N/A |
||||
|
Total |
$ | 567,531,777 | ||||||
|
(1) |
Represents the method used when the Company has determined that market participants would use such inputs when measuring the fair value of these investments. |
The significant unobservable inputs used in the fair value measurement of the Company’s debt and derivative investments are market yields. Increases in market yields would result in lower fair value measurements.
The significant unobservable inputs used in the fair value measurement of the Company’s equity/warrants investments are comparable company multiples of revenue or EBITDA for the latest twelve months (“LTM”), next twelve months (“NTM”) or a reasonable period a market participant would consider. Increases in Revenue or EBITDA multiples in isolation would result in higher fair value measurement.
On August 27, 2013, the Company, through its wholly-owned financing subsidiary, Arbor, entered into a Total Return Swap ("TRS") with Citibank, N.A. (“Citibank”) that is indexed to a basket of loans.
The TRS with Citibank enabled Arbor to obtain the economic benefit of the loans underlying the TRS, despite the fact that such loans were not directly held or otherwise owned by Arbor, in return for an interest-type payment to Citibank.
SIC Advisors acted as the investment manager of Arbor and had discretion over the composition of the basket of loans underlying the TRS. The terms of the TRS were governed by an ISDA 2002 Master Agreement, the Schedule thereto and Credit Support Annex to such Schedule, and the Confirmation exchanged thereunder, between Arbor and Citibank, which collectively established the TRS, and are collectively referred to herein as the “TRS Agreement”.
On July 22, 2019, the TRS with Citibank was terminated, and the TRS was fully wound down during the year ended December 31, 2019.
Arbor was required to pay a minimum usage fee in connection with the TRS of 1.60% on the amount equal to 85% of the average daily unused portion of the maximum amount permitted under the TRS. Such minimum usage fee did not apply during the first 365 days and last 60 days of the term of the TRS. Arbor also paid Citibank customary fees in connection with the establishment and maintenance of the TRS. During the years ended December 31, 2020 and December 31, 2019, Arbor paid no minimum usage fees.
Arbor was required to initially cash collateralize a specified percentage of each loan (generally 20% to 30% of the market value of such loan) included under the TRS in accordance with margin requirements described in the TRS Agreement. Arbor was restricted from removing the cash collateral posted to Citibank and was required to post additional collateral from time to time as a result of a decline in the mark-to-market value of the portfolio of loans subject to the TRS. The obligations of Arbor under the TRS Agreement were non-recourse to the Company and the Company’s exposure under the TRS Agreement was limited to the value of the Company’s investment in Arbor, which generally equaled the value of cash collateral provided by Arbor under the TRS Agreement.
Transactions in TRS contracts during the years ended December 31, 2020, 2019 and 2018 were as follows:
|
2020 |
2019 |
2018 |
||||||||||
|
Interest income and settlement from TRS |
$ | — | $ | 309,388 | $ | 5,185,757 | ||||||
|
Traded gains/(loss) on TRS loan sales |
— | (9,632,900 | ) | (2,943,401 | ) | |||||||
|
Net realized gains/(loss) on TRS |
$ | — | $ | (9,323,512 | ) | $ | 2,242,356 | |||||
|
Net change in unrealized appreciation/(depreciation) on TRS |
$ | — | $ | 6,524,904 | $ | (1,170,036 | ) | |||||
The following table shows the volume of the Company’s derivative transactions for the years ended December 31, 2020, 2019 and 2018:
|
2020 |
2019 |
2018 |
||||||||||
|
Average notional par amount of contracts (1) |
$ | — | $ | 18,016,329 | $ | 153,644,607 | ||||||
|
(1) |
Average notional amount is based on the average month end balances for the years ended December 31, 2020 and 2019, which is representative of the volume of notional contract amounts held during each year. |
The following table shows the Company's outstanding debt as of December 31, 2020 and 2019:
|
December 31, 2020 |
December 31, 2019 |
|||||||||||||||||||||||
| Total Commitment | Balance Outstanding | Unused Commitment | Total Commitment | Balance Outstanding | Unused Commitment | |||||||||||||||||||
|
ING Credit Facility |
$ | — | $ | — | $ | — | $ | 215,000,000 | $ | 88,100,000 | $ | 126,900,000 | ||||||||||||
|
Alpine Credit Facility |
180,000,000 | 145,000,000 | 35,000,000 | 300,000,000 | 240,000,000 | 60,000,000 | ||||||||||||||||||
|
Total before deferred financing costs |
180,000,000 | 145,000,000 | 35,000,000 | 515,000,000 | 328,100,000 | 186,900,000 | ||||||||||||||||||
|
Unamortized deferred financing costs |
— | (659,266 | ) | — | — | (2,235,279 | ) | — | ||||||||||||||||
|
Total borrowings outstanding, net deferred financing costs |
$ | 180,000,000 | $ | 144,340,734 | $ | 35,000,000 | $ | 515,000,000 | $ | 325,864,721 | $ | 186,900,000 | ||||||||||||
As a BDC, the Company is generally allowed to employ leverage to the extent that its asset coverage, as defined in the 1940 Act, equals at least 200% (or 150% if certain requirements under the 1940 Act are met) after giving effect to such leverage. The amount of leverage that the Company employs at any time depends on its assessment of the market and other factors at the time of any proposed borrowing.
The fair value of the Company’s debt obligation is determined in accordance with ASC 820, which defines fair value in terms of the price that would be paid to transfer a liability in an orderly transaction between market participants at the measurement date under current market conditions. The fair value of the Company’s margin borrowings are estimated based upon market interest rates for its own borrowings or entities with similar credit risk, adjusted for nonperformance risk, if any. The Company’s debt obligation is recorded at its carrying value, which approximates fair value.
ING Credit Facility
On August 12, 2016, the Company amended its existing senior secured syndicated revolving credit facility (the “ING Credit Facility” as amended from time to time as described below) pursuant to a Senior Secured Revolving Credit Agreement (the “Revolving Credit Agreement” as amended from time to time as described below) with certain lenders party thereto from time to time and ING Capital LLC, as administrative agent. The ING Credit Facility was secured by substantially all of the Company’s assets, subject to certain exclusions as further set forth in an Amended and Restated Guarantee, Pledge and Security Agreement (the “Security Agreement”) entered into in connection with the Revolving Credit Agreement, among the Company, the subsidiary guarantors party thereto, ING Capital LLC, as Administrative Agent, each Financial Agent and Designated Indebtedness Holder party thereto and ING Capital LLC, as Collateral Agent. The ING Credit Facility also included usual and customary representations, covenants and events of default for senior secured revolving credit facilities of this nature.
On July 25, 2019, the Company entered into Amendment No. 2 to the Revolving Credit Agreement that among other things, (i) reduced the size of the commitments thereunder from $220.0 million to $215.0 million, (ii) extended the Revolver Termination Date (as defined in the Revolving Credit Agreement) from August 12, 2019 to March 31, 2020 and (iii) extended the Maturity Date (as defined in the Revolving Credit Agreement) from August 12, 2020 to March 31, 2021. On March 30, 2020, the Company entered into Amendment No. 3 to the Revolving Credit Agreement that among other things, extended the Revolver Termination Date from March 31, 2020 to April 30, 2020 after which the Revolving Credit Facility would enter amortization.
On May 15, 2020, the Company entered into Amendment No. 4 to the Revolving Credit Agreement to among other things, (i) shorten the maturity date from March 31, 2021 to September 30, 2020, (ii) accelerate the amortization of the Revolving Credit Agreement, and (iii) provide for the prepayment of the outstanding loans under the Revolving Credit Agreement in an aggregate principal amount of not less than $20 million. On July 22, 2020, the Company paid all remaining outstanding obligations under the Revolving Credit Agreement. On July 31, 2020 (the “Termination Date”), the Company terminated the commitments on the Credit Agreement. The repayment of the outstanding obligations under the Revolving Credit Agreement was accounted for as a debt extinguishment in accordance with ASC 470-50, Modifications and Extinguishments, which attributed to a realized loss of $217,950 and was recorded on the Consolidated Statements of Operations as a loss on extinguishment of debt.
The ING Credit Facility allowed for the Company, at its option, to borrow money at a rate of either (i) an alternate base rate plus 1.50% per annum or (ii) LIBOR plus 2.50% per annum. The interest rate margins were subject to certain step-downs upon the satisfaction of certain conditions described in the Revolving Credit Agreement. The alternate base rate was the greatest of (i) the U.S. Prime Rate set forth in the Wall Street Journal, (ii) the federal funds effective rate plus 1/2 of 1%, and (iii) three month LIBOR plus 1.00%. As of December 31, 2020, there were no commitments under the ING Credit Facility. As of December 31, 2019, the commitment under the ING Credit Facility was $215,000,000. Availability of loans under the ING Credit Facility was linked to the valuation of the collateral pursuant to a borrowing base mechanism.
The Company was also required to pay a commitment fee to the lenders based on the daily unused portion of the aggregate commitments under the ING Credit Facility. The commitment fee was (i) 1.50% if the used portion of the aggregate commitments is less than or equal to 40%, (ii) 0.75% if the used portion of the aggregate commitments is greater than 40% and less than or equal to 65% or (iii) 0.50% if the used portion of the aggregate commitments is greater than 65%. The ING Credit Facility provided that the Company may use the proceeds of the ING Credit Facility for general corporate purposes, including making investments in accordance with the Company’s investment objective and strategy.
Borrowings under the Revolving Credit Agreement were subject to, among other things, a minimum borrowing base. Substantially all of the Company’s assets were pledged as collateral under the Revolving Credit Agreement. The ING Credit Facility required the Company to, among other things (i) make representations and warranties regarding the collateral as well the Company’s business and operations, (ii) agree to certain indemnification obligations, and (iii) agree to comply with various affirmative and negative covenants. The documents for the Revolving Credit Agreement also included default provisions, such as the failure to make timely payments under the Revolving Credit Agreement, the occurrence of a change in control, and the failure by the Company to materially perform under the operative agreements governing the Revolving Credit Agreement, which, if not complied with, could have accelerated repayment under the Revolving Credit Agreement, thereby materially and adversely affecting the Company’s liquidity, financial condition and results of operations.
In connection with the security interest established under the Security Agreement, the Company, ING Capital LLC, in its capacity as collateral agent, and State Street Bank and Trust Company, in its capacity as the Company’s custodian, entered into a control agreement dated as of December 4, 2013, in order to, among other things, perfect the security interest granted pursuant to the Security Agreement in, and provide for control over, the related collateral. As a result of the termination of the Revolving Credit Agreement, the Security Agreement was terminated effective as of the Termination Date.
As of December 31, 2019, the carrying amount of the Company’s borrowings under the ING Credit Facility approximated their fair value. The fair value of the Company’s debt obligation was determined in accordance with ASC 820, which defines fair value in terms of the price that would be paid to transfer a liability in an orderly transaction between market participants at the measurement date under current market conditions. The fair value of the Company’s borrowings under the ING Credit Facility was estimated based upon market interest rates of the Company’s borrowings or entities with similar credit risk, adjusted for nonperformance risk, if any. As of December 31, 2019, certain unobservable inputs used to value the ING Credit Facility were deemed to be Level 3, as defined in Note 4.
As of December 31, 2019, $1,164,341 of financing costs related to the ING Credit Facility were capitalized and were being amortized over the term. The following table shows additional information about the interest and financing costs related to the ING Credit Facility for the years ended December 31, 2020, 2019 and 2018:
|
For the Year Ended December 31, |
||||||||||||
|
2020 |
2019 |
2018 |
||||||||||
|
Interest expense related to the ING Credit Facility |
$ | 1,729,271 | $ | 5,508,219 | $ | 7,071,689 | ||||||
|
Financing expenses related to the ING Credit Facility |
1,238,677 | 961,380 | 930,686 | |||||||||
|
Total interest and financing expenses related to the ING Credit Facility |
$ | 2,967,948 | $ | 6,469,599 | $ | 8,002,375 | ||||||
|
Weighted average outstanding debt balance of the ING Credit Facility |
$ | 36,873,586 | $ | 93,406,301 | $ | 143,142,466 | ||||||
|
Weighted average interest rate of the ING Credit Facility |
4.6 | % | 5.8 | % | 4.9 | % | ||||||
Alpine Credit Facility
On September 29, 2017, the Company’s wholly-owned, special purpose financing subsidiary, Alpine, amended its existing revolving credit facility (the “Alpine Credit Facility”) pursuant to an Amended and Restated Loan Agreement (the “Loan Agreement”) with JPMorgan Chase Bank, National Association (“JPMorgan”), as administrative agent and lender, the Financing Providers from time to time party thereto, SIC Advisors, as the portfolio manager, and the Collateral Administrator, Collateral Agent and Securities Intermediary party thereto. The Loan Agreement was amended to, among other things, (i) extend the reinvestment period until December 29, 2020, (ii) extend the scheduled termination date until March 29, 2022, (iii) decrease the applicable margin for advances to 2.85% per annum and (iv) increase the compliance condition for net advances to 55% of net asset value. Alpine’s obligations to JPMorgan under the Alpine Credit Facility are secured by a first priority security interest in significant portion of the assets of Alpine, including its portfolio of loans. The obligations of Alpine under the Alpine Credit Facility are non-recourse to the Company.
On November 18, 2020, Alpine entered into Amendment No.1 to the Loan Agreement to, among other things, (i) extend the reinvestment period from December 29, 2020 to May 18, 2021, (ii) increase the applicable margin for advances from 2.85% to 3.10% per annum, (iii) reduce the amount of maximum borrowings in an aggregate principal amount from $300,000,000 to $180,000,000 on a committed basis, (iv) require the Company to maintain a minimum a cash balance of $20,000,000 in Alpine, and (v) decrease the compliance condition for net advances from 55% to 52.5% of net asset value. The maturity date under the Loan Agreement did not change and therefore any amounts borrowed, as well as all accrued and unpaid interest thereunder, will be due and payable on March 29, 2022. In connection with the Amendment, the Company repaid $35,000,000 of the outstanding balance under the Loan Agreement on November 18, 2020, reducing the outstanding balance from $180,000,000 to $145,000,000.
The Alpine Credit Facility provides for borrowings in an aggregate principal amount up to $180,000,000 on a committed basis. Borrowings under the Alpine Credit Facility are subject to compliance with a NAV coverage ratio with respect to the current value of Alpine’s portfolio and various eligibility criteria must be satisfied with respect to the initial acquisition of each loan in Alpine’s portfolio. Pricing under the Alpine Credit Facility for each one month calculation period is based on LIBOR for an interest period of one month, plus a spread of 3.10% per annum. If LIBOR is unavailable, pricing will be determined at the prime rate offered by JPMorgan or the federal funds effective rate, plus a spread of 3.10% per annum. Interest is payable monthly in arrears. Alpine is also required to pay a commitment fee of 1.00% on the average daily unused amount of the financing commitments to the extent that $180,000,000 has not been borrowed. Borrowings of Alpine are considered borrowings of the Company for purposes of complying with the asset coverage requirements under the 1940 Act, applicable to BDCs.
Pursuant to a Sale and Contribution Agreement entered into between the Company and Alpine (the “Sale Agreement”) in connection with the Alpine Credit Facility, the Company may sell loans or contribute cash or loans to Alpine from time to time and will retain a residual interest in any assets contributed through its ownership of Alpine or will receive fair market value for any assets sold to Alpine. In certain circumstances the Company may be required to repurchase certain loans sold to Alpine. In addition to the acquisition of loans pursuant to the Sale Agreement, Alpine may purchase additional assets from various sources. Alpine has appointed SIC Advisors to manage its portfolio of assets pursuant to the terms of a Portfolio Management Agreement between SIC Advisors and Alpine.
As of December 31, 2020 and 2019, the carrying amount of the Company’s borrowings under the Alpine Credit Facility approximated the fair value of the Company’s debt obligation. The fair value of the Company’s debt obligation is determined in accordance with ASC 820, which defines fair value in terms of the price that would be paid to transfer a liability in an orderly transaction between market participants at the measurement date under current market conditions. The fair value of the Company’s borrowings under the Alpine Credit Facility is estimated based upon market interest rates of the Company’s borrowings or entities with similar credit risk, adjusted for nonperformance risk, if any. As of December 31, 2020 and 2019, the Alpine Credit Facility would be deemed to be Level 3, as defined in Note 4.
As of December 31, 2020 and 2019, $659,266 and $1,070,938, respectively, of financing costs related to the Alpine Credit Facility have been capitalized and were being amortized over the respective terms. The following table shows additional information about the interest and financing costs related to the Alpine Credit Facility for the years ended December 31, 2020, 2019 and 2018:
|
For the Year Ended December 31, |
||||||||||||
|
2020 |
2019 |
2018 |
||||||||||
|
Interest expense related to the Alpine Credit Facility |
$ | 7,642,421 | $ | 13,049,364 | $ | 12,383,653 | ||||||
|
Financing expenses related to the Alpine Credit Facility |
1,225,097 | 970,254 | 970,254 | |||||||||
|
Total interest and financing expenses related to the Alpine Credit Facility |
$ | 8,867,518 | $ | 14,019,618 | $ | 13,353,907 | ||||||
|
Weighted average outstanding debt balance of the Alpine Credit Facility |
$ | 182,841,530 | $ | 240,000,000 | $ | 240,676,712 | ||||||
|
Weighted average interest rate of the Alpine Credit Facility |
4.1 | % | 5.4 | % | 5.1 | % | ||||||
Investment Advisory Agreement
On April 5, 2012, the Company entered into an investment advisory agreement (the “Investment Advisory Agreement”) with SIC Advisors to manage the Company’s investment activities. The Investment Advisory Agreement became effective as of April 17, 2012, the date that the Company met its minimum offering requirement. Pursuant to the 1940 Act, the initial term of the Investment Advisory Agreement was for two years from its effective date. Unless earlier terminated pursuant to its terms, the Investment Advisory Agreement will remain in effect from year-to-year thereafter if approved annually at an in-person meeting of our board of directors by a majority of our directors who are not "interested persons" (as defined in Section 2(a)(19) of the 1940 Act) of the Company or the Adviser, and either our board of directors or the holders of a majority of our outstanding voting securities. Most recently, on April 3, 2020, the Company’s board of directors approved the renewal of the Investment Advisory Agreement for an additional one-year term, which will expire on April 17, 2021.
Pursuant to the Investment Advisory Agreement, SIC Advisors implements the Company’s business strategy on a day-to-day basis and performs certain services for the Company, subject to oversight by the Company’s board of directors. SIC Advisors is responsible for, among other duties, determining investment criteria, sourcing, analyzing and executing investment transactions, asset sales, financings and performing asset management duties. Under the Investment Advisory Agreement, the Company has agreed to pay SIC Advisors a management fee for investment advisory and management services consisting of a base management fee and an incentive fee.
The base management fee is calculated at an annual rate of 1.75% of the Company’s gross assets payable quarterly in arrears. For purposes of calculating the base management fee, the term “gross assets” includes any assets acquired with the proceeds of leverage. “Gross assets” also includes any cash collateral posted with respect to the TRS, adjusted for realized and unrealized appreciation. For the first quarter of the Company’s operations, the base management fee was calculated based on the initial value of the Company’s gross assets. Subsequently, the base management fee is calculated based on the gross assets at the end of each completed calendar quarter. Base management fees for any partial quarter are appropriately pro-rated. For the years ended December 31, 2020, 2019 and 2018, the Company recorded an expense for base management fees of $12,185,544, $17,018,479 and $19,011,460, respectively, of which $2,967,857 and $4,060,518 were payable at December 31, 2020 and 2019, respectively.
The incentive fee consists of the following two parts:
An incentive fee on net investment income (“Subordinated Incentive Fee on Income”) is calculated and payable quarterly in arrears and is based upon pre-incentive fee net investment income for the immediately preceding quarter. No Subordinated Incentive Fee on Income is payable in any calendar quarter in which pre-incentive fee net investment income does not exceed a quarterly return to stockholders of 1.75% per quarter on the Company’s net assets at the end of the immediately preceding fiscal quarter (the “Preferred Quarterly Return”). All pre-incentive fee net investment income, if any, that exceeds the Preferred Quarterly Return, but is less than or equal to 2.1875% of net assets at the end of the immediately preceding fiscal quarter in any quarter, will be payable to SIC Advisors. The Company refers to this portion of its Subordinated Incentive Fee on Income as the “Catch Up”. It is intended to provide an incentive fee of 20% on pre-incentive fee net investment income when pre-incentive fee net investment income exceeds 2.1875% of net assets at the end of the immediately preceding quarter in any quarter. For any quarter in which the Company’s pre-incentive fee net investment income exceeds 2.1875% of net assets at the end of the immediately preceding quarter, the Subordinated Incentive Fee on Income shall equal 20% of the amount of pre-incentive fee net investment income, because the Preferred Quarterly Return and Catch Up will have been achieved. There is no incentive fee on net investment income earned on the TRS.
For the years ended December 31, 2020, 2019 and 2018, the Company recorded incentive fees of $0, $176,061 and $0, respectively. As of December 31, 2020 and 2019, the Company recorded no incentive fees payable.
A capital gains incentive fee will be earned on realized investments and shall be payable in arrears as of the end of each calendar year during which the Investment Advisory Agreement is in effect. If the Investment Advisory Agreement is terminated, the fee will also become payable as of the effective date of such termination. The fee equals 20% of the realized capital gains, less the aggregate amount of any previously paid capital gains incentive fees. The incentive fee on capital gains is equal to realized capital gains on a cumulative basis from inception, computed net of all realized capital losses and unrealized capital depreciation on a cumulative basis.
Under GAAP, the Company calculates capital gains incentive fees as if the Company had realized all assets at their fair values and liabilities at their settlement amounts as of the reporting date. GAAP requires that the capital gains incentive fee accrual assume the cumulative aggregate unrealized capital appreciation is realized, even though such unrealized capital appreciation is not payable under the Investment Advisory Agreement. Accordingly, the Company accrues a provisional capital gains incentive fee taking into account any unrealized gains or losses. There can be no assurance that such unrealized capital appreciation will be realized in the future and that the provisional capital gains incentive fee will become payable.
For the years ended December 31, 2020, 2019 and 2018, the Company recorded no capital gains incentive fee and no capital gains incentive fee were payable.
Administration Agreement
On April 5, 2012, the Company entered into an administration agreement (the “Administration Agreement”) with Medley Capital LLC, pursuant to which Medley Capital LLC furnishes the Company with administrative services necessary to conduct its day-to-day operations. Pursuant to the 1940 Act, the Administration Agreement remained in effect for an initial period of two years from its effective date. The Administration Agreement became effective on April 17, 2012, the date that we met our minimum offering requirement. Pursuant to its terms, and unless earlier terminated as described below, the Administration Agreement will remain in effect from year-to-year if approved annually by a majority of our directors who are not "interested persons" (as defined in Section 2(a)(19) of the 1940 Act) of the Company or Medley Capital LLC, and either the holders of a majority of our outstanding voting securities or our board of directors. Most recently, on April 3, 2020, the Company’s board of directors approved the renewal of the Administration Agreement for an additional one-year term, which will expire on April 17, 2021. Medley Capital LLC is reimbursed for administrative expenses it incurs on the Company’s behalf in performing its obligations. Such costs are reasonably allocated to the Company on the basis of assets, revenues, time records or other reasonable methods. The Company does not reimburse Medley Capital LLC for any services for which it receives a separate fee or for rent, depreciation, utilities, capital equipment or other administrative items allocated to a controlling person of Medley Capital LLC.
On February 28, 2013, Medley Capital LLC entered into a Sub-Administration Agreement with State Street Bank Global Fund Accounting and Custody to perform certain financial, accounting, administrative and other services on behalf of the Company.
For the years ended December 31, 2020, 2019 and 2018, the Company recorded an expenses of $2,231,015, $2,538,480 and $2,699,176, respectively, relating to administrator expenses. As of December 31, 2020 and 2019, the Company had $401,260 and $381,923, respectively, in administrator fees payable.
We have entered into an Investment Advisory Agreement with SIC Advisors in which our senior management holds an equity interest and were party to the Expense Support Agreement through December 31, 2016 the date on which such agreement expired. Members of our senior management also serve as principals of other investment managers affiliated with SIC Advisors that do, and may in the future, manage investment funds, accounts or other investment vehicles with investment objectives similar to ours.
We have entered into an Administration Agreement with Medley Capital LLC, pursuant to which Medley Capital LLC furnishes us with administrative services necessary to conduct our day-to-day operations. Medley Capital LLC is reimbursed for administrative expenses it incurs on our behalf. We do not reimburse Medley Capital LLC for any services for which it receives a separate fee or for rent, depreciation, utilities, capital equipment or other administrative items allocated to a controlling person of Medley Capital LLC. Medley Capital LLC is an affiliate of SIC Advisors.
We have entered into a license agreement with SIC Advisors under which SIC Advisors has agreed to grant us a non-exclusive, royalty-free license to use the name “Sierra” for specified purposes in our business. Under this license agreement, we will have a right to use the “Sierra” name, subject to certain conditions, for so long as SIC Advisors or one of its affiliates remains our investment adviser. Other than with respect to this limited license, we will have no legal right to the “Sierra” name.
Opportunities for co-investments may arise when SIC Advisors or an affiliated adviser becomes aware of investment opportunities that may be appropriate for the Company and other clients or affiliated funds. The Company obtained an exemptive order from the SEC on November 25, 2013 (the “Prior Exemptive Order”). On March 29, 2017, the Company, SIC Advisors and certain other affiliated funds and investment advisers received an exemptive order (the "Exemptive Order") that supersedes the Prior Exemptive Order and allows affiliated registered investment companies to participate in co-investment transactions with us that would otherwise have been prohibited under Section 17(d) and 57(a)(4) and Rule 17d-1. On October 4, 2017, the Company, SIC Advisors and certain of our affiliates received an exemptive order that supersedes the Exemptive Order (the “Current Exemptive Order”) and allows, in addition to the entities already covered by the Exemptive Order, Medley LLC and its subsidiary, Medley Capital LLC, to the extent they hold financial assets in a principal capacity, and any direct or indirect, wholly- or majority-owned subsidiary of Medley LLC that is formed in the future, to participate in co-investment transactions with us that would otherwise be prohibited by either or both of Sections 17(d) and 57(a)(4) of the 1940 Act.
Each independent director will be compensated as follows: (i) an annual retainer of $85,000; (ii) a fee of $3,000 for each in-person board meeting in which they participate; (iii) a fee of $1,000 for each telephonic board meeting in which they participate; (iv) a fee of $2,500 for each in-person audit committee meeting in which they participate; (v) a fee $1,000 for each telephonic audit committee meeting in which they participate; (vi) a fee of $2,000 for each in-person nominating and corporate governance committee meeting in which they participate; and (vii) a fee of $1,000 for each telephonic nominating and corporate governance committee meeting in which they participate. In addition, each independent director will be reimbursed for reasonable and documented out-of-pocket expenses incurred in connection with attending each board or committee meeting. In addition, the Chair of the audit committee receives an annual retainer of $15,000, while the Chair of any other committee receives an annual retainer of $5,000. The Lead Independent Director receives an annual retainer of $10,000.
In addition, the Board established a special committee comprised solely of its independent directors (the “Sierra Special Committee”), for the purpose of assessing the merits of various business proposals. On January 26, 2018, the Board approved (i) a monthly fee of $15,000 payable to the Chairman of the Sierra Special Committee, (ii) a monthly fee of $10,000 payable to each of the other members of the Sierra Special Committee, and (iii) reimbursement for all out-of-pocket expenses incurred by the members of the Sierra Special Committee in connection with his services as a member of the Special Committee consistent with the Company’s policies for reimbursement of members of the Board. On July 2, 2018, the Board approved an increase in the monthly fee payable to the members of the Sierra Special Committee. Effective July 1, 2018, the monthly fee payable to the Chairman of the Sierra Special Committee was increased to $20,000 and a monthly fee payable to each of the other members of the Sierra Special Committee was increased to $15,000.
For the years ended December 31, 2020, 2019 and 2018, the Company recorded directors' fees expenses in General and Administrative expenses on the Consolidated Statements of Operations of $1,068,875, $1,030,500 and $968,500, respectively, of which no amount was payable at December 31, 2020, 2019 and 2018, respectively.
Note 10. Earnings Per Share
In accordance with the provisions of ASC Topic 260 - Earnings per Share, basic earnings per share is computed by dividing earnings available to common shareholders by the weighted average number of shares outstanding during the period. Other potentially dilutive common shares, and the related impact to earnings, are considered when calculating earnings per share on a diluted basis.
The following table sets forth the computation of the weighted average basic and diluted net increase in net assets per share from operations for the years ended December 31, 2020, 2019 and 2018:
|
2020 |
2019 |
2018 |
||||||||||
|
Net increase/(decrease) in net assets from operations |
$ | (53,116,846 | ) | $ | (29,580,903 | ) | $ | (28,477,636 | ) | |||
|
Weighted average common stock outstanding |
102,744,642 | 100,582,788 | 97,404,685 | |||||||||
|
Weighted average basic and diluted earnings/(loss) per common share |
$ | (0.52 | ) | $ | (0.29 | ) | $ | (0.29 | ) | |||
Note 11. Commitments
As of December 31, 2020 and 2019, the Company had $17,393,369 and $32,654,545, respectively, of unfunded commitments under loan and financing agreements. These amounts are primarily composed of commitments for senior secured term loans, revolvers, and additional capital contributions for the Sierra JV. The unrealized gain or loss associated with unfunded commitments is recorded in the financial statements and reflected as an adjustment to the valuation of the related security in the Consolidated Schedule of Investments. The par amount of the unfunded commitments are not recognized by the Company until the commitment is funded.
|
As of December 31, |
||||||||
|
2020 |
2019 |
|||||||
|
1888 Industrial Services, LLC |
$ | 376,856 | $ | 424,422 | ||||
|
AAAHI Acquisition Corporation |
— | 1,586,982 | ||||||
|
Access Media Holdings, LLC |
— | 88,200 | ||||||
|
Alpine SG, LLC |
— | 1,000,000 | ||||||
|
Black Angus Steakhouses, LLC |
1,111,111 | 2,232,143 | ||||||
|
DataOnline Corp. |
321,429 | 2,142,857 | ||||||
|
Isola USA Corp. |
1,138,277 | 1,138,277 | ||||||
|
Kemmerer Operations LLC |
908,475 | 908,475 | ||||||
|
Offen, Inc. |
— | 1,061,947 | ||||||
|
Redwood Services Group, LLC |
2,587,500 | 1,725,000 | ||||||
|
RTIC Subsidiary Holdings, LLC |
3,174,603 | — | ||||||
|
SFP Holdings, Inc. |
3,081,900 | 10,151,775 | ||||||
|
Sierra Senior Loan Strategy JV I LLC |
— | 4,200,000 | ||||||
|
Simplified Logistics, LLC |
— | 5,000,000 | ||||||
|
Smile Doctors LLC |
— | 994,467 | ||||||
|
West Dermatology, LLC |
4,693,218 | — | ||||||
|
Total Commitments |
$ | 17,393,369 | $ | 32,654,545 | ||||
Insurance Reimbursements
During the year ended December 31, 2020, the Company has received insurance proceeds under its insurance policy relating to the legal expenses associated with the dismissed stockholder class action, captioned as FrontFour Capital Group LLC, et al. v Brook Taube et al. During the year ended December 31, 2020, the Company received $2.7 million of insurance proceeds. The reimbursement has been recorded as an offset or reduction in professional fees and expenses on the Consolidated Statements of Operations.
Note 12. Fee Income
Fee income consists of origination fees, amendment fees, prepayment fees, administrative agent fees and other miscellaneous fees. Origination fees, prepayment fees, amendment fees, and other similar fees are non-recurring fee sources. Such fees are received on a transaction by transaction basis and do not constitute a regular stream of income. The following table shows the Company’s fee income for the years ended December 31, 2020, 2019 and 2018:
|
2020 |
2019 |
2018 |
||||||||||
|
Origination fee |
$ | 799,838 | $ | 467,783 | $ | 2,583,089 | ||||||
|
Prepayment fee |
— | 2,870,918 | 420,667 | |||||||||
|
Amendment fee |
328,716 | 589,236 | 376,292 | |||||||||
|
Administrative agent fee |
31,342 | 106,162 | 146,961 | |||||||||
|
Other fees |
77,038 | 5,767 | 21,371 | |||||||||
|
Total fee income |
$ | 1,236,934 | $ | 4,039,866 | $ | 3,548,380 | ||||||
Distributions to common stockholders are recorded on the ex-dividend date. The amount to be paid out as a distribution is determined by the Company’s board of directors.
The Company has adopted an “opt in” distribution reinvestment plan (“DRIP”) pursuant to which the Company’s stockholders may elect to have the full amount of any cash distributions reinvested in additional shares of the Company’s common stock. On June 30, 2017, the Board approved an amendment to the DRIP, pursuant to which the number of newly-issued shares of the Company’s common stock to be issued to a participating stockholder shall be determined by dividing the total dollar amount of the distribution payable to such stockholder by a price equal to 94.5%, rather than 90%, of the Company’s then current offering price. The Company amended the DRIP as a result of the Company’s revised fee structure, which went into effect on June 16, 2017. Under the Company’s revised fee structure the upfront selling commission was reduced from 7.00% of gross proceeds to up to 3.00% of gross proceeds and the dealer manager fee was reduced from 2.75% of gross proceeds to up to 2.50% of gross proceeds. If the Company declares a cash dividend or other distribution, each stockholder that has “opted in” to the DRIP will have their distributions automatically reinvested in additional shares of the Company’s common stock rather than receiving cash distributions. Stockholders who receive distributions in the form of shares of common stock will be subject to the same federal, state and local tax consequences as if they received cash distributions.
For the year ended December 31, 2020, the Company distributed a total of $13,838,034 of which $8,952,100 was in cash and $4,885,934 was in the form of common stock associated with the DRIP. For the year ended December 31, 2019, the Company distributed a total of $64,162,404 of which $39,887,810 was in cash and $24,274,594 was in the form of common stock associated with the DRIP. For the year ended December 31, 2018, the Company distributed a total of $62,256,547, of which $36,397,238 was in cash and $25,859,309 was in the form of common stock associated with the DRIP
The following table reflects the cash distributions per share that the Company has declared or paid to its stockholders during 2020, 2019 and 2018. Stockholders of record as of each respective record date were entitled to receive the distribution.
|
Record Date |
Payment Date |
Amount per share |
|||
| January 15 and 31, 2018 | January 31, 2018 | 0.2667 | |||
| February 15 and 28, 2018 | February 28, 2018 | 0.2667 | |||
| March 15 and 30, 2018 | March 30, 2018 | 0.2667 | |||
| April 13 and 30, 2018 | April 30, 2018 | 0.2667 | |||
| May 15 and 31, 2018 | May 31, 2018 | 0.2667 | |||
| June 15 and 29, 2018 | June 29, 2018 | 0.2667 | |||
| July 13 and 13, 2018 | July 31, 2018 | 0.2667 | |||
| August 15 and 31, 2018 | August 31, 2018 | 0.2667 | |||
| September 14 and 28, 2018 | September 28, 2018 | 0.2667 | |||
| October 15 and 31, 2018 | October 31, 2018 | 0.2667 | |||
| November 15 and 30, 2018 | November 30, 2018 | 0.2667 | |||
| December 14 and 31, 2018 | December 31, 2018 | 0.2667 | |||
|
January 25, 2019 |
January 31, 2019 |
0.05334 | |||
|
February 11, 2019 |
February 28, 2019 |
0.05334 | |||
|
March 11, 2019 |
March 29, 2019 |
0.05334 | |||
|
April 29, 2019 |
April 30, 2019 |
0.05334 | |||
|
May 30, 2019 |
May 31, 2019 |
0.05334 | |||
|
June 27, 2019 |
June 28, 2019 |
0.05334 | |||
|
July 30, 2019 |
July 31, 2019 |
0.05334 | |||
|
August 29, 2019 |
August 30, 2019 |
0.05334 | |||
|
September 27, 2019 |
September 30, 2019 |
0.05334 | |||
|
October 30, 2019 |
October 31, 2019 |
0.05334 | |||
|
November 28, 2019 |
November 29, 2019 |
0.05334 | |||
|
December 30, 2019 |
December 31, 2019 |
0.05334 | |||
| January 30, 2020 | January 31, 2020 | 0.03500 | |||
| February 27, 2020 | February 28, 2020 | 0.03500 | |||
| March 30, 2020 | March 31, 2020 | 0.03500 | |||
| October 29, 2020 | October 30, 2020 | 0.01000 | |||
| November 27, 2020 | November 30, 2020 | 0.01000 | |||
| December 30, 2020 | December 31, 2020 | 0.01000 | |||
The Company’s distributions may be funded from offering proceeds or borrowings, which may constitute a return of capital and reduce the amount of capital available to the Company for investment. Any capital returned to stockholders through distributions will be distributed after payment of fees and expenses. On July 31, 2020, our board of directors temporarily suspended the monthly distributions on the shares of the Company’s common stock. On October 22, 2020, our board of directors determined to reinstate the monthly distributions on the shares of the Company’s common stock.
During the term of the Expense Support and Reimbursement Agreement with SIC Advisors (which expired on December 31, 2016), SIC Advisors reimbursed the Company for operating expenses in an amount equal to the difference between the Company’s distributions paid to its stockholders in each month, less the sum of the Company’s net investment income, net realized capital gains and dividends paid to the Company from its portfolio companies, not included in net income and net realized capital gains, during such period (“Expense Support Reimbursement”). The Company’s previous distributions to stockholders may have been funded from temporary Expense Support Reimbursements that may have been subject to repayment to SIC Advisors. The portion of these distributions derived from temporary Expense Support Reimbursements were not based on the Company's investment performance and may not continue in the future. If SIC Advisors had not agreed to make Expense Support Reimbursements, these distributions would have come from paid-in-capital. The Company's contingent obligation to repay eligible reimbursements to SIC Advisors expired on September 30, 2019.
The determination of the tax attributes (i.e., paid from ordinary income, paid from net capital gains on the sale of securities, and/or a return of paid-in-capital surplus which is a nontaxable distribution) of distributions is made annually as of the end of the Company’s fiscal year based upon its taxable income earned and distributions paid during the fiscal year.
Share Repurchase Program
In June 2013, the Company commenced a share repurchase program pursuant to which it conducted quarterly share repurchases of up to 2.5% of the weighted average number of outstanding shares of its common stock in the prior four calendar quarters or 10% of the weighted average number of outstanding shares in the prior 12-month period. In connection with the Proposed Mergers, the Company suspended the Share Repurchase Program. The purpose of the share repurchase program was to allow stockholders to sell their shares back to the Company at a price equal to the most recently disclosed NAV per share of the Company's common stock immediately prior to the date of repurchase. Shares were purchased from stockholders participating in the program on a pro-rata basis. Unless the Company's board of directors determined otherwise, the number of shares repurchased during any calendar year were limited to the proceeds received in association with the sale of shares of common stock under the distribution reinvestment plan.
The following table reflects activity under the Company's Share Repurchase Program for the year ended December 30, 2018:
|
Offer Date |
Quantity Offered |
Price per Share |
Repurchase Date |
Repurchase Quantity |
|||||||||
|
3/27/2018 |
895,070 | $ | 7.66 |
5/8/2018 |
895,036 | ||||||||
|
5/21/2018 |
890,089 | 7.49 |
6/29/2018 |
890,048 | |||||||||
Notwithstanding the suspension of the share repurchase program, our board of directors approved the repurchase of shares of our common stock from our stockholders who have requested repurchases in connection with such stockholder’s death or disability. In the event of the death or disability of a stockholder, the Company will repurchase the shares held by such stockholder at a price equal to the NAV per share of our shares as disclosed in the periodic report the Company files with the SEC immediately following the date of the death or disability of such stockholder. The Company's board of directors has the right to suspend or terminate repurchases due to death or disability to the extent that it determines that it is in the Company's best interest to do so. During the years ended December 31, 2020, 2019 and 2018, the Company repurchased 647,252, 248,704 and 263,737, respectively, of certain shareholders due to death or disability.
Note 14. Financial Highlights
The following is a schedule of financial highlights of the Company for the years ended December 31, 2020, 2019, 2018, 2017 and 2016:
|
For the years ended December 31, |
||||||||||||||||||||
|
2020 |
2019 |
2018 |
2017 |
2016 |
||||||||||||||||
|
Per Share Data:(1) |
||||||||||||||||||||
|
Net asset value at beginning of period |
$ | 5.78 | $ | 6.72 | $ | 7.66 | $ | 8.17 | $ | 8.16 | ||||||||||
|
Net investment income/(loss) |
(0.02 | ) | 0.32 | 0.48 | 0.55 | 0.66 | ||||||||||||||
|
Net realized gains/(losses) on investments and total return swap |
(0.72 | ) | (0.28 | ) | (0.59 | ) | (0.27 | ) | (0.15 | ) | ||||||||||
|
Net unrealized appreciation/(depreciation) on investments and total return swap |
0.22 | (0.34 | ) | (0.18 | ) | (0.14 | ) | 0.25 | ||||||||||||
|
Net increase/(decrease) in net assets |
(0.52 | ) | (0.30 | ) | (0.29 | ) | 0.14 | 0.76 | ||||||||||||
|
Distribution from tax return of capital(2) |
(0.14 | ) | (0.26 | ) | — | — | — | |||||||||||||
|
Distributions from earnings(2) |
— | (0.38 | ) | (0.64 | ) | (0.64 | ) | (0.76 | ) | |||||||||||
|
Total distributions to shareholders |
(0.14 | ) | (0.64 | ) | (0.64 | ) | (0.64 | ) | (0.76 | ) | ||||||||||
|
Issuance of common shares above net asset value(3) |
— | — | (0.01 | ) | (0.01 | ) | 0.01 | |||||||||||||
|
Net asset value at end of period |
$ | 5.12 | $ | 5.78 | $ | 6.72 | $ | 7.66 | $ | 8.17 | ||||||||||
|
Total return based on net asset value(4)(5) |
(9.04 | )% | (4.43 | )% | (4.04 | )% | 1.53 | % | 9.87 | % | ||||||||||
|
Portfolio turnover rate |
23.73 | % | 34.92 | % | 23.42 | % | 36.31 | % | 26.33 | % | ||||||||||
|
Shares outstanding at end of period |
102,630,605 | 102,282,366 | 98,502,907 | 96,620,231 | 94,666,418 | |||||||||||||||
|
Net assets at end of period |
$ | 525,740,939 | $ | 591,062,721 | $ | 662,080,199 | $ | 739,986,569 | $ | 773,113,087 | ||||||||||
|
Ratio/Supplemental Data: |
||||||||||||||||||||
|
Ratio of net investment income to average net assets(5) |
(0.49 | )% | 5.05 | % | 6.62 | % | 6.84 | % | 8.20 | % | ||||||||||
|
Ratio of net expenses (including incentive fees) to average net assets(5) |
10.07 | % | 7.54 | % | 7.15 | % | 7.13 | % | 5.44 | % | ||||||||||
|
Ratio of incentive fees to average net assets |
0.00 | % | 0.03 | % | 0.00 | % | 0.61 | % | 1.27 | % | ||||||||||
|
Supplemental Data: |
||||||||||||||||||||
|
Asset coverage ratio per unit(6) |
$ | 4,626 | $ | 2,801 | $ | 2,656 | $ | 2,330 | $ | 2,476 | ||||||||||
|
Percentage of non-recurring fee income |
2.52 | % | 4.91 | % | 3.63 | % | 6.79 | % | 8.64 | % | ||||||||||
|
Ratio of net expenses (excluding incentive fees) to average net assets |
10.07 | % | 7.52 | % | 7.15 | % | 6.52 | % | 4.18 | % | ||||||||||
|
Ratio of interest and financing related expenses to average net assets (7) |
2.37 | % | 3.22 | % | 3.03 | % | 2.38 | % | 2.03 | % | ||||||||||
|
Total Debt Outstanding:(8)(9) |
||||||||||||||||||||
|
Revolving Credit Facility |
$ | 145,000,000 | $ | 328,100,000 | $ | 355,000,000 | $ | 435,000,000 | $ | 390,000,000 | ||||||||||
|
Total Return Swap(10) |
— | — | 51,776,760 | 127,519,693 | 147,892,739 | |||||||||||||||
|
(1) |
The per share data was derived by using the weighted average shares outstanding during the years ended December 31, 2020, 2019, 2018, 2017 and 2016 which were 102,744,642, 100,582,788, 97,404,685, 96,248,024 and 90,424,090, respectively. Table may not foot due to rounding. |
|
(2) |
The per share data for distributions is the actual amount of paid distributions per share during the period. |
|
(3) |
Shares issued under the DRIP (see Note 13) as well as the continuous issuance of common shares may cause on incremental increase/decrease in NAV per share due to the effect of issuing shares at amounts that differ from the prevailing NAV at each issuance. |
|
(4) |
Total annual returns are historical and assume reinvestments of all dividends and distributions at prices obtained under the DRIP, and no sales charge. |
|
(5) |
Total returns, ratios of net investment income and ratios of gross expenses to average net assets for the year ended December 31, 2016, prior to the effect of the Expense Support Agreement were as follows: total return 7.57%, ratio of net investment income: 8.32% and ratio of net expenses to average net assets: 7.76%. |
|
(6) |
Asset coverage per unit is the ratio of the carrying value of the Company's total consolidated assets for regulatory purposes, which includes the underlying fair value of net TRS, less all liabilities and indebtedness not represented by senior securities to the aggregate amount of senior securities representing indebtedness and the implied leverage on the TRS. Asset coverage per unit is expressed in terms of dollars per $1,000 of indebtedness. For the years ended December 31, 2020, 2019, 2018, 2017 and 2016, the Company's Asset Coverage Per Unit including unfunded commitments was $4,130, $2,547, $2,363, $2,054 and $2,355, respectively. |
|
(7) |
Represents the impact of non-recurring fees over total investment income. |
|
(8) |
Total amount of each class of senior securities outstanding at the end of the period excluding debt issuance costs. |
|
(9) |
Average market value per unit is not applicable as these classes of securities are not registered for public trading. |
|
(10) |
The TRS amount is comprised of the outstanding notional amount of the TRS, less the initial amount of any cash collateral required to be posted by Arbor under the TRS. |
Note 15. Selected Quarterly Financial Data (unaudited)
|
Quarter Ended |
||||||||||||||||
|
December 31, 2020 |
September 30, 2020 |
June 30, 2020 |
March 31, 2020 |
|||||||||||||
|
Total investment income |
$ | 12,081,523 | $ | 12,935,319 | $ | 11,699,454 | $ | 11,176,811 | ||||||||
|
Total investment income per common share |
0.12 | 0.13 | 0.11 | 0.11 | ||||||||||||
|
Net investment income/(loss) |
5,389,550 | 6,081,232 | (14,767,663 | ) | 823,800 | |||||||||||
|
Net investment income/(loss) per common share |
0.05 | 0.06 | (0.14 | ) | 0.01 | |||||||||||
|
Net realized and unrealized gain/(loss) |
19,937,287 | 26,039,189 | 23,444,565 | (120,064,806 | ) | |||||||||||
|
Net realized and unrealized gain/(loss) per common share |
0.19 | 0.25 | 0.23 | (1.17 | ) | |||||||||||
|
Net increase/(decrease) in net assets resulting from operations |
25,326,837 | 32,120,421 | 8,676,902 | (119,241,006 | ) | |||||||||||
|
Basic and diluted earnings/(loss) per common share |
0.25 | 0.31 | 0.08 | (1.16 | ) | |||||||||||
|
Net asset value per common share at end of quarter |
5.11 | 4.91 | 4.60 | 4.51 | ||||||||||||
|
Quarter Ended |
||||||||||||||||
|
December 31, 2019 |
September 30, 2019 |
June 30, 2019 |
March 31, 2019 |
|||||||||||||
|
Total investment income |
$ | 17,119,758 | $ | 18,160,825 | $ | 23,906,563 | $ | 20,910,460 | ||||||||
|
Total investment income per common share |
0.17 | 0.18 | 0.24 | 0.21 | ||||||||||||
|
Net investment income |
5,670,095 | 5,757,586 | 11,859,528 | 8,794,693 | ||||||||||||
|
Net investment income per common share |
0.06 | 0.06 | 0.12 | 0.09 | ||||||||||||
|
Net realized and unrealized gain/(loss) |
(14,297,904 | ) | (24,569,974 | ) | (28,913,606 | ) | 6,118,679 | |||||||||
|
Net realized and unrealized gain/(loss) per common share |
(0.15 | ) | (0.24 | ) | (0.29 | ) | 0.06 | |||||||||
|
Net increase/(decrease) in net assets resulting from operations |
(8,627,809 | ) | (18,812,388 | ) | (17,054,078 | ) | 14,913,372 | |||||||||
|
Basic and diluted earnings/(loss) per common share |
(0.09 | ) | (0.19 | ) | (0.17 | ) | 0.15 | |||||||||
|
Net asset value per common share at end of quarter |
5.78 | 6.03 | 6.37 | 6.71 | ||||||||||||
|
Quarter Ended |
||||||||||||||||
|
December 31, 2018 |
September 30, 2018 |
June 30, 2018 |
March 31, 2018 |
|||||||||||||
|
Total investment income |
$ | 23,444,596 | $ | 24,477,122 | $ | 24,890,883 | $ | 24,360,040 | ||||||||
|
Total investment income per common share |
0.24 | 0.25 | 0.26 | 0.25 | ||||||||||||
|
Net investment income |
10,696,360 | 12,357,369 | 12,260,712 | 11,414,345 | ||||||||||||
|
Net investment income per common share |
0.11 | 0.13 | 0.13 | 0.12 | ||||||||||||
|
Net realized and unrealized gain/(loss) |
(27,127,542 | ) | (18,063,473 | ) | (17,587,989 | ) | (12,427,418 | ) | ||||||||
|
Net realized and unrealized gain/(loss) per common share |
(0.28 | ) | (0.19 | ) | (0.18 | ) | (0.13 | ) | ||||||||
|
Net increase/(decrease) in net assets resulting from operations |
(16,431,182 | ) | (5,706,104 | ) | (5,327,277 | ) | (1,013,073 | ) | ||||||||
|
Basic and diluted earnings/(loss) per common share |
(0.17 | ) | (0.06 | ) | (0.05 | ) | (0.01 | ) | ||||||||
|
Net asset value per common share at end of quarter |
6.72 | 7.05 | 7.27 | 7.49 | ||||||||||||
Note 16. Subsequent Events
Management has evaluated subsequent events through the date of issuance of the consolidated financial statements included herein. There have been no subsequent events that occurred during such period that would require disclosure in this Form 10-K or would be required to be recognized in the consolidated financial statements as of and for the year ended December 31, 2020, except as disclosed below.
On January 21, 2021, the Company's board of directors declared a series of monthly distributions for January, February and March 2021 in the amount of $0.010 per share. Stockholders of record as of each respective monthly record date will be entitled to receive the distribution. Below are the details for each respective distribution:
|
Record Date |
Payment Date |
Amount per share |
|||
|
January 28, 2021 |
January 29, 2021 |
$ | 0.010 | ||
|
February 25, 2021 |
February 26, 2021 |
0.010 | |||
|
March 30, 2021 |
March 31, 2021 |
0.010 | |||
Item 9. Changes in and Disagreements with Accountants on Accounting and Financial Disclosure
None.
Item 9A. Controls and Procedures
Evaluation of Disclosure Controls and Procedures
Our Chief Executive Officer and Chief Financial Officer, under the supervision and with the participation of our management, conducted an evaluation of our disclosure controls and procedures, as defined in Rules 13a-15(e) and 15d-15(e) of the Exchange Act. As of the end of the period covered by this annual report on Form 10-K, our Chief Executive Officer and Chief Financial Officer have concluded that our disclosure controls and procedures were effective to ensure that information required to be disclosed by us in reports that we file or submit under the Exchange Act is recorded, processed, summarized, and reported within the time periods specified in the SEC’s rules and forms, and that information required to be disclosed by us in the reports that we file or submit under the Exchange Act is accumulated and communicated to our management, including our Chief Executive Officer and Chief Financial Officer, as appropriate to allow timely decisions regarding required disclosure.
Management’s Report on Internal Control Over Financial Reporting
Our management is responsible for establishing and maintaining adequate internal control over financial reporting as such term is defined in Rule 13a-15(f) of the Exchange Act, and for performing an assessment of the effectiveness of internal control over financial reporting as of December 31, 2020. Internal control over financial reporting is a process designed by, or under the supervision of, our principal executive and principal financial officers, or persons performing similar functions, and effected by our board of directors, management and other personnel, to provide reasonable assurance regarding the reliability of financial reporting and the preparation of financial statements for external purposes in accordance with generally accepted accounting principles. Our internal control over financial reporting includes those policies and procedures that (i) pertain to the maintenance of records that in reasonable detail accurately and fairly reflect the transactions and dispositions of assets of the company; (ii) provide reasonable assurance that transactions are recorded as necessary to permit preparation of financial statements in accordance with generally accepted accounting principles, and that receipts and expenditures are being made only in accordance with authorizations; and (iii) provide reasonable assurance regarding prevention or timely detection of unauthorized acquisition, use, or disposition of our assets that could have a material effect on the financial statements.
Because of its inherent limitations, internal control over financial reporting may not prevent or detect misstatements. Therefore, even those systems determined to be effective can provide only reasonable assurance with respect to financial statement preparation and presentation.
Management performed an assessment of the effectiveness of our internal control over financial reporting as of December 31, 2020 based upon the criteria set forth in Internal Control — Integrated Framework (2013) issued by the Committee of Sponsoring Organizations of the Treadway Commission (“COSO”). Based on our assessment, management determined that our internal control over financial reporting was effective as of December 31, 2020.
Changes in Internal Control Over Financial Reporting
There have been no changes in our internal control over financial reporting, as defined in Rules 13a-15(f) and 15d-15(f) of the Exchange Act that occurred during our most recently completed fiscal quarter that have materially affected, or are reasonably likely to materially affect, our internal control over financial reporting.
None.
Item 10. Directors, Executive Officers and Corporate Governance
The information required by Item 10 is hereby incorporated by reference from our definitive proxy statement relating to our 2021 Annual Meeting of Stockholders, to be filed with the Securities and Exchange Commission within 120 days following the end of our fiscal year.
Item 11. Executive Compensation
The information required by Item 11 is hereby incorporated by reference from our definitive proxy Statement relating to our 2021 Annual Meeting of Stockholders, to be filed with the Securities and Exchange Commission within 120 days following the end of our fiscal year.
Item 12. Security Ownership of Certain Beneficial Owners and Management and Related Stockholder Matters
The information required by Item 12 is hereby incorporated by reference from our definitive proxy Statement relating to our 2021 Annual Meeting of Stockholders, to be filed with the Securities and Exchange Commission within 120 days following the end of our fiscal year.
Item 13. Certain Relationships and Related Transactions, and Director Independence
The information required by Item 13 is hereby incorporated by reference from our definitive proxy Statement relating to our 2021 Annual Meeting of Stockholders, to be filed with the Securities and Exchange Commission within 120 days following the end of our fiscal year.
Item 14. Principal Accountant Fees and Services
The information required by Item 14 is hereby incorporated by reference from our definitive proxy Statement relating to our 2021 Annual Meeting of Stockholders, to be filed with the Securities and Exchange Commission within 120 days following the end of our fiscal year.
Item 15. Exhibits and Financial Statement Schedules
|
(a) |
The following documents are filed as part of this Annual Report: |
The following consolidated financial statements are set forth in Item 8:
|
(b) |
Exhibits |
The following exhibits are filed as part of this report or hereby incorporated by reference to exhibits previously filed with the SEC:
|
3.1 |
|
|
|
3.2 |
|
|
|
3.3 |
|
|
|
3.4 |
|
Second Articles of Amendment and Restatement of the Registrant |
|
3.5 |
|
|
|
3.6 |
|
|
|
4.1 |
|
|
|
10.2 |
|
|
31.1 |
|
|
|
31.2 |
|
|
|
32.1 |
|
|
* |
Filed herewith. |
None.
Pursuant to the requirements Section 13 or 15(d) of the Securities Exchange Act of 1934, the registrant has duly caused this Annual Report on Form 10-K to be signed on its behalf by the undersigned thereunto duly authorized.
|
Dated: March 19, 2021 |
Sierra Income Corporation. |
||
|
|
|
|
|
|
|
By |
|
/s/ Seth Taube |
|
|
|
|
Seth Taube Chief Executive Officer (Principal Executive Officer) |
|
|
|
|
|
|
|
By |
|
/s/ Richard T. Allorto Jr. |
|
|
|
|
Richard T. Allorto Jr. Chief Financial Officer |
Pursuant to the requirements of the Securities Exchange Act of 1934, this Annual Report on Form 10-K has been signed below by the following persons on behalf of the registrant and in the following capacities on March 19, 2021.
|
/s/ Seth Taube |
|
Chief Executive Officer |
|
Seth Taube |
|
(Principal Executive Officer) |
|
|
|
|
|
/s/ Richard T. Allorto Jr. |
|
Chief Financial Officer |
|
Richard T. Allorto Jr. |
|
(Principal Accounting and Financial Officer) |
|
|
|
|
|
/s/ Brook Taube |
|
Director |
|
Brook Taube |
|
|
|
|
|
|
|
/s/ Oliver T. Kane |
|
Director |
|
Oliver T. Kane |
|
|
|
|
|
|
|
/s/ Valerie Lancaster-Beal |
|
Director |
|
Valerie Lancaster-Beal |
|
|
|
|
|
|
|
/s/ Stephen R. Byers |
|
Director and Chairman of the Board of Directors |
|
Stephen R. Byers |
|
|
|
/s/ Matthew E. Forstenhausler |
|
Director |
|
Matthew E. Forstenhausler |
|
|