Attached files
| file | filename |
|---|---|
| EX-99.3 - PRESS RELEASE - AVADEL PHARMACEUTICALS PLC | sharerepurchaseannouncemen.htm |
| EX-99.1 - EARNINGS RELEASE - AVADEL PHARMACEUTICALS PLC | ex991earningsreleaseq4_2016.htm |
| 8-K - PRESS RELEASE - AVADEL PHARMACEUTICALS PLC | form8-kq4_2016.htm |

Year-End 2016
Earnings Conference Call
March 7, 2017

2
Safe Harbor
This presentation may include "forward-looking statements" within the meaning of the Private Securities Litigation
Reform Act of 1995. All statements herein that are not clearly historical in nature are forward-looking, and the words
"anticipate," "assume," "believe," "expect," "estimate," "plan," "will," "may," and the negative of these and similar
expressions generally identify forward-looking statements. All forward-looking statements involve risks, uncertainties
and contingencies, many of which are beyond Avadel’s control and could cause actual results to differ materially from
the results contemplated in such forward-looking statements. These risks, uncertainties and contingencies include the
risks relating to: our dependence on a small number of products and customers for the majority of our revenues; the
possibility that our Bloxiverz®, Vazculep® and Akovaz® products, which are not patent protected, could face substantial
competition resulting in a loss of market share or forcing us to reduce the prices we charge for those products; the
possibility that we could fail to successfully complete the research and development for the pipeline product we are
evaluating for potential application to the FDA pursuant to our "unapproved-to-approved" strategy, or that competitors
could complete the development of such product and apply for FDA approval of such product before us; our
dependence on the performance of third parties in partnerships or strategic alliances for the commercialization of some
of our products; the possibility that our products may not reach the commercial market or gain market acceptance; our
need to invest substantial sums in research and development in order to remain competitive; our dependence on
certain single providers for development of several of our drug delivery platforms and products; our dependence on a
limited number of suppliers to manufacture our products and to deliver certain raw materials used in our products; the
possibility that our competitors may develop and market technologies or products that are more effective or safer than
ours, or obtain regulatory approval and market such technologies or products before we do; the challenges in
protecting the intellectual property underlying our drug delivery platforms and other products; our dependence on key
personnel to execute our business plan; the amount of additional costs we will incur to comply with U.S. securities laws
as a result of our ceasing to qualify as a foreign private issuer; and the other risks, uncertainties and contingencies
described in the Company's filings with the U.S. Securities and Exchange Commission, including our annual report on
Form 10-K for the year ended December 31, 2015, all of which filings are also available on the Company's website.
Avadel undertakes no obligation to update its forward-looking statements as a result of new information, future events
or otherwise, except as required by law.

3
Call Outline
• Share Repurchase Program
• REST-ON Trial
• Special Protocol Assessment
• Timeline
• Patent Landscape
• Base Business Overview
• Akovaz®
• Vazculep®
• Bloxiverz®
• R&D Pipeline
• Non-GAAP Financial Results
• GAAP Financial Results
• Product Sales
• Cash Flow
• 2017 Guidance

4
Share Repurchase Program
Board of Directors authorized share repurchase program of up
to $25 million
Strong cash position allows flexibility to allocate money for share repurchase
Provides opportunity to purchase shares and return cash to shareholders
Repurchases may be made in open-market transactions, block transactions on or off
the exchange, in privately negotiated transactions, or through other means as
determined by management

5
REST-ON Phase III Trial
• Reached protocol agreement with FDA via Special Protocol
Assessment in Q4
• Upfront agreement from FDA on powering and trial design
• Endpoints: Excessive Daytime Sleepiness (EDS) and Cataplexy
• Initiated patient enrollment and dosing in Q4
• Active enrollment in Europe and Canada
• US site initiations ongoing
• Enrollment completion goal of year end 2017
Progress to Date

6
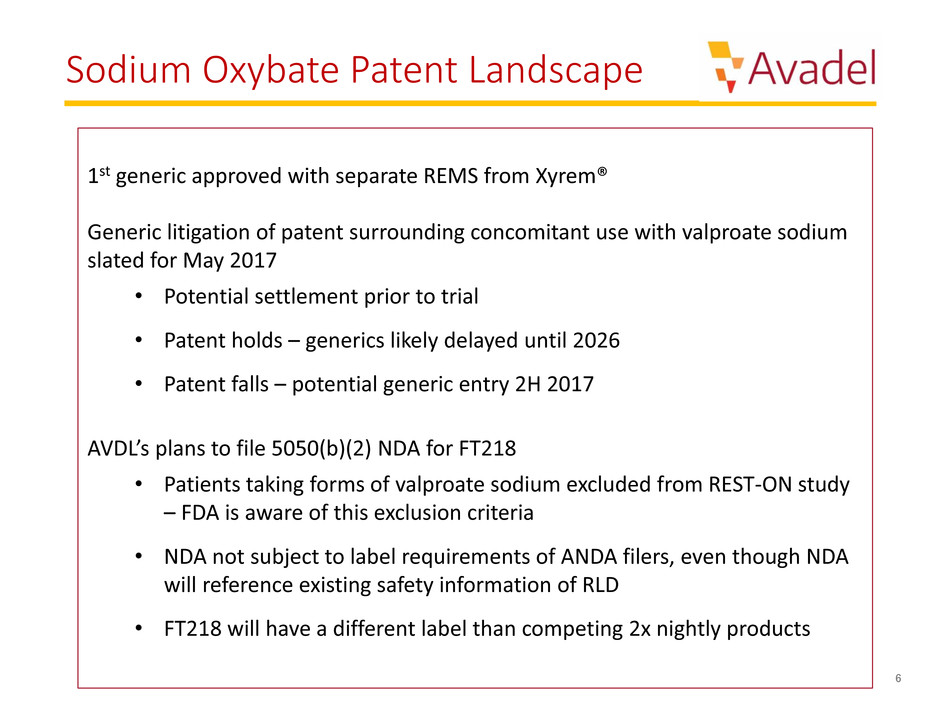
Sodium Oxybate Patent Landscape
1st generic approved with separate REMS from Xyrem®
Generic litigation of patent surrounding concomitant use with valproate sodium
slated for May 2017
• Potential settlement prior to trial
• Patent holds – generics likely delayed until 2026
• Patent falls – potential generic entry 2H 2017
AVDL’s plans to file 5050(b)(2) NDA for FT218
• Patients taking forms of valproate sodium excluded from REST-ON study
– FDA is aware of this exclusion criteria
• NDA not subject to label requirements of ANDA filers, even though NDA
will reference existing safety information of RLD
• FT218 will have a different label than competing 2x nightly products

7
Hospital Products
• Akovaz® successfully launched in August Q3
• Exited 2016 with approximately 27% market share
( ~7.5 million vials / year)
• 1 competitor in 2016
• 2 competitors in 2017
• Expect to garner and retain ~ 30% of overall market
• Vazculep® had 100% share of 5mL & 10mL markets
• 40% market share across 3 vial sizes
• Expect another competitor mid-year 2017
• Bloxiverz® retained ~ 40% share during 2016 in 3
player market
• Sugammadex, neostigmine alternative, reduced the
overall neostigmine market by ~20% during 2016
• Expect another competitor mid-year 2017

8
Internal Development Pipeline
Indication: CNS
Indication: Psychiatric
Indication: Pediatric
Indication: Pediatric
• Numerous internal development opportunities under evaluation
• Expect to file 4th NDA for AV001 by year end 2017
• Evaluating more unapproved marketed drugs (UMD) for potential development
beginning in 2017

9
Non-GAAP Financial Results
*Reconciliations from GAAP to Non-GAAP can be found in the appendix
(in 000s)
12/31/16 09/30/16 12/31/15 12/31/16 12/31/15
Sales 43,085$ 32,087$ 44,568$ 150,246$ 173,009$
Cost of products and services sold 3,610 2,844 2,937 12,742 11,410
Research and development expenses 13,476 8,143 5,161 34,611 25,608
Selling, general and admin expenses 10,688 12,740 6,808 44,179 21,712
Intangible asset amortization - - - - -
Operating expenses 27,774 23,727 14,906 91,532 58,730
Contingent consideration payments and accruals 7,645 5,884 8,158 26,966 32,081
Operating income (loss) 7,666 2,476 21,504 31,748 82,198
Interest and other expense (net) 294 226 65 672 1,236
Other Expense - changes in fair value of related party payable (1,018) (785) (1,123) (3,636) (4,414)
Income (loss) before income taxes 6,942 1,917 20,446 28,784 79,020
Income tax provision 6,875 5,416 9,687 31,373 37,290
Net income (loss) 67$ (3,499)$ 10,759$ (2,589)$ 41,730$
Diluted earnings (loss) per share -$ (0.08)$ 0.25$ (0.06)$ 0.96$
Three Months Ended Twelve Months Ended

10
GAAP Financial Results
(in 000s)
12/31/16 09/30/16 12/31/15 12/31/16 12/31/15
Sales 43,085$ 32,087$ 44,568$ 150,246$ 173,009$
Cost of products and services sold 2,591 2,844 2,937 13,248 11,410
Research and development expenses 13,476 8,143 5,161 34,611 25,608
Selling, general and admin expenses 10,688 12,740 6,808 44,179 21,712
Intangible asset amortization 2,970 3,702 3,141 13,888 12,564
Operating expenses 29,725 27,429 18,047 105,926 71,294
Fair value adjustments of contingent consideration (3,704) 20,848 (51,079) 49,285 30,957
Operating income (loss) 17,064 (16,190) 77,600 (4,965) 70,758
Interest and other expense (net) 1,429 1,475 2,563 1,795 11,830
Other Expense - changes in fair value of related party payable (413) (1,828) 4,746 (6,548) (4,883)
Income (loss) before income taxes 18,080 (16,543) 84,909 (9,718) 77,705
Income tax provision 13,346 3,451 11,391 31,558 35,907
Net income (loss) 4,734$ (19,994)$ 73,518$ (41,276)$ 41,798$
Diluted earnings (loss) per share 0.11$ (0.48)$ 1.69$ (1.00)$ 0.96$
Three Months Ended Twelve Months Ended

11
Product Sales
in $000's
Q1 2016 Q2 2016 Q3 2016 Q4 2016
Full Year
2016
Full Year
2015
Bloxiverz 24,747$ 25,620$ 15,591$ 16,938$ 82,896$ 150,083$
Vazculep 9,406 10,421 9,340 10,629 39,796 20,151
Akovaz - - 5,568 11,263 16,831 -
Other 1,200 2,124 841 3,534 7,699 2,054
Total product sales and services 35,353$ 38,165$ 31,340$ 42,364$ 147,222$ 172,288$
License and research revenue 863$ 693$ 747$ 721$ 3,024$ 721$
Total revenues 36,216$ 38,858$ 32,087$ 43,085$ 150,246$ 173,009$

12
Cash Flow Summary
in $000's
2016 2015
TOTAL Cash and Marketable Securities
Beginning Balance 144,802$ 92,834$
Operating Cash Flows (excl tax and earnout payments) 68,801$ 126,414
Tax Payments (27,180)$ (42,121)
Earnout/Royalty Payments (30,837)$ (27,897)
Capital Spending (1,201)$ (1,629)
Repayment of Debt (277)$ (5,658)
Issuance of Ordinary Shares and Warrants 440$ 6,990
FX (166)$ (3,508)
Other (187)$ (623)
Change in Total 9,393$ 51,968
Ending Balance 154,195$ 144,802$
Twelve Months Ended December 31,

13
Full Year 2017 Guidance - Reaffirmed
2017 Guidance
Sales $170M - $200M
Diluted EPS (Adjusted) $0.20 - $0.35

14
APPENDIX

15
GAAP to NON-GAAP Reconciliations
Three Months Ended December 31, 2016:
(in thousands - USD$) Include
GAAP
Intangible asset
amortization
Foreign
exchange
(gain)/loss
Cross-border
merger impacts
Purchase
accounting
adjustments -
FSC
Contingent
related party
payable
fair value
remeasurements
Contingent
related party
payable
paid/accrued
Total
Adjustments NON-GAAP
Product sales and services 42,364$ -$ -$ -$ -$ -$ -$ -$ 42,364$
License and research revenue 721 - - - - - - - 721
Total revenue 43,085 - - - - - - - 43,085
Cost of products and services sold 2,591 - - - 1,019 - - 1,019 3,610
Research and development expenses 13,476 - - - - - - - 13,476
Selling, general and administrative expenses 10,688 - - - - - - - 10,688
Intangible asset amortization 2,970 (2,970) - - - - - (2,970) -
Changes in fair value of related party contingent
consideration (3,704) - - - - 3,704 7,645 11,349 7,645
Total operating expenses 26,021 (2,970) - - 1,019 3,704 7,645 9,398 35,419
Operating income (loss) 17,064 2,970 - - (1,019) (3,704) (7,645) (9,398) 7,666
Investment Income 555 - - - - - - - 555
Interest Expense (261) - - - - - - - (261)
Other Expense - changes in fair value of related party
payable (413) - - - - 413 (1,018) (605) (1,018)
Foreign exchange gain (loss) 1,135 - (1,135) - - - - (1,135) -
Income (loss) before income taxes 18,080 2,970 (1,135) - (1,019) (3,291) (8,663) (11,138) 6,942
Income tax provision 13,346 1,066 - (6,754) (366) 82 (499) (6,471) 6,875
Income Tax Rate 74% 36% - - 36% (2%) 6% 58% 99%
Net Loss 4,734$ 1,904$ (1,135)$ 6,754$ (653)$ (3,373)$ (8,164)$ (4,667)$ 67$
Net loss per share - Diluted 0.11$ 0.04$ (0.03)$ 0.16$ (0.02)$ (0.08)$ (0.19)$ (0.11)$ -$
Weighted average number of shares outstanding - Diluted 42,808 42,808 42,808 42,808 42,808 42,808 42,808 42,808 42,808
Adjustments
Exclude

16
GAAP to NON-GAAP Reconciliations
Three Months Ended September 30, 2016:
(in thousands - USD$) Include
GAAP
Intangible asset
amortization
Foreign
exchange
(gain)/loss
Contingent
related party
payable
fair value
remeasurements
Contingent
related party
payable
paid/accrued
Total
Adjustments NON-GAAP
Product sales and services 31,340$ -$ -$ -$ -$ -$ 31,340$
License and research revenue 747 - - - - - 747
Total revenue 32,087 - - - - - 32,087
Cost of products and services sold 2,844 - - - - - 2,844
Research and development expenses 8,143 - - - - - 8,143
Selling, general and administrative expenses 12,740 - - - - - 12,740
Intangible asset amortization 3,702 (3,702) - - - (3,702) -
Changes in fair value of related party contingent
consideration 20,848 - - (20,848) 5,884 (14,964) 5,884
Total operating expenses 48,277 (3,702) - (20,848) 5,884 (18,666) 29,611
Operating income (loss) (16,190) 3,702 - 20,848 (5,884) 18,666 2,476
Investment Income 490 - - - - - 490
Interest Expense (264) - - - - - (264)
Other Expense - changes in fair value of related party
payable (1,828) - - 1,828 (785) 1,043 (785)
Foreign exchange gain (loss) 1,249 - (1,249) - - (1,249) -
Income (loss) before income taxes (16,543) 3,702 (1,249) 22,676 (6,669) 18,460 1,917
Income tax provision 3,451 1,329 - 1,022 (386) 1,965 5,416
Income Tax Rate (21%) 36% - 5% 6% 11% 283%
Net Loss (19,994)$ 2,373$ (1,249)$ 21,654$ (6,283)$ 16,495$ (3,499)$
Net loss per share - Diluted (0.48)$ 0.06$ (0.03)$ 0.53$ (0.15)$ 0.40$ (0.08)$
Weighted average number of shares outstanding - Diluted 41,241 41,241 41,241 41,241 41,241 41,241 41,241
Adjustments
Exclude

17
GAAP to NON-GAAP Reconciliations
Three Months Ended December 31, 2015:
(in thousands - USD$) Include
GAAP
Intangible asset
amortization
Foreign
exchange
(gain)/loss
Contingent
related party
payable
fair value
remeasurements
Contingent
related party
payable
paid/accrued
Total
Adjustments NON-GAAP
Product sales and services 43,847$ -$ -$ -$ -$ -$ 43,847$
License and research revenue 721 - - - - - 721
Total revenue 44,568 - - - - - 44,568
Cost of products and services sold 2,937 - - - - - 2,937
Research and development expenses 5,161 - - - - - 5,161
Selling, general and administrative expenses 6,808 - - - - - 6,808
Intangible asset amortization 3,141 (3,141) - - - (3,141) -
Changes in fair value of related party contingent
consideration (51,079) - - 51,079 8,158 59,237 8,158
Total operating expenses (33,032) (3,141) - 51,079 8,158 56,096 23,064
Operating income (loss) 77,600 3,141 - (51,079) (8,158) (56,096) 21,504
Investment Income 65 - - - - - 65
Interest Expense - - - - - - -
Other Expense - changes in fair value of related party
payable 4,746 - - (4,746) (1,123) (5,869) (1,123)
Foreign exchange gain (loss) 2,498 - (2,498) - - (2,498) -
Income (loss) before income taxes 84,909 3,141 (2,498) (55,825) (9,281) (64,463) 20,446
Income tax provision 11,391 1,099 (749) (1,661) (393) (1,704) 9,687
Income Tax Rate 13% 35% 30% 3% 4% 3% 47%
Net Loss 73,518$ 2,042$ (1,749)$ (54,164)$ (8,888)$ (62,759)$ 10,759$
Net loss per share - Diluted 1.69$ 0.05$ (0.04)$ (1.25)$ (0.20)$ (1.45)$ 0.25$
Weighted average number of shares outstanding - Diluted 43,430 43,430 43,430 43,430 43,430 43,430 43,430
Adjustments
Exclude

18
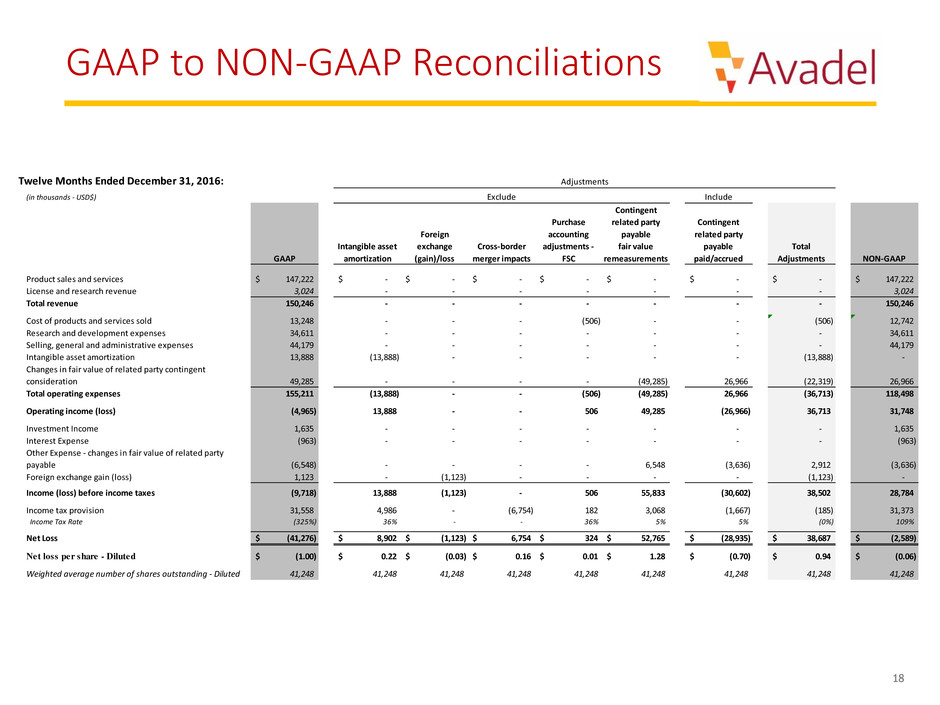
GAAP to NON-GAAP Reconciliations
Twelve Months Ended December 31, 2016:
(in thousands - USD$) Include
GAAP
Intangible asset
amortization
Foreign
exchange
(gain)/loss
Cross-border
merger impacts
Purchase
accounting
adjustments -
FSC
Contingent
related party
payable
fair value
remeasurements
Contingent
related party
payable
paid/accrued
Total
Adjustments NON-GAAP
Product sales and services 147,222$ -$ -$ -$ -$ -$ -$ -$ 147,222$
License and research revenue 3,024 - - - - - - - 3,024
Total revenue 150,246 - - - - - - - 150,246
Cost of products and services sold 13,248 - - - (506) - - (506) 12,742
Research and development expenses 34,611 - - - - - - - 34,611
Selling, general and administrative expenses 44,179 - - - - - - - 44,179
Intangible asset amortization 13,888 (13,888) - - - - - (13,888) -
Changes in fair value of related party contingent
consideration 49,285 - - - - (49,285) 26,966 (22,319) 26,966
Total operating expenses 155,211 (13,888) - - (506) (49,285) 26,966 (36,713) 118,498
Operating income (loss) (4,965) 13,888 - - 506 49,285 (26,966) 36,713 31,748
Investment Income 1,635 - - - - - - - 1,635
Interest Expense (963) - - - - - - - (963)
Other Expense - changes in fair value of related party
payable (6,548) - - - - 6,548 (3,636) 2,912 (3,636)
Foreign exchange gain (loss) 1,123 - (1,123) - - - - (1,123) -
Income (loss) before income taxes (9,718) 13,888 (1,123) - 506 55,833 (30,602) 38,502 28,784
Income tax provision 31,558 4,986 - (6,754) 182 3,068 (1,667) (185) 31,373
Income Tax Rate (325%) 36% - - 36% 5% 5% (0%) 109%
Net Loss (41,276)$ 8,902$ (1,123)$ 6,754$ 324$ 52,765$ (28,935)$ 38,687$ (2,589)$
Net loss per share - Diluted (1.00)$ 0.22$ (0.03)$ 0.16$ 0.01$ 1.28$ (0.70)$ 0.94$ (0.06)$
Weighted average number of shares outstanding - Diluted 41,248 41,248 41,248 41,248 41,248 41,248 41,248 41,248 41,248
Adjustments
Exclude

19
GAAP to NON-GAAP Reconciliations
Twelve Months Ended December 31, 2015:
(in thousands - USD$) Include
GAAP
Intangible asset
amortization
Foreign
exchange
(gain)/loss
Contingent
related party
payable
fair value
remeasurements
Contingent
related party
payable
paid/accrued
Total
Adjustments NON-GAAP
Product sales and services 172,288$ -$ -$ -$ -$ -$ 172,288$
License and research revenue 721 - - - - - 721
Total revenue 173,009 - - - - - 173,009
Cost of products and services sold 11,410 - - - - - 11,410
Research and development expenses 25,608 - - - - - 25,608
Selling, general and administrative expenses 21,712 - - - - - 21,712
Intangible asset amortization 12,564 (12,564) - - - (12,564) -
Changes in fair value of related party contingent
consideration 30,957 - - (30,957) 32,081 1,124 32,081
Total operating expenses 102,251 (12,564) - (30,957) 32,081 (11,440) 90,811
Operating income (loss) 70,758 12,564 - 30,957 (32,081) 11,440 82,198
Investment Income 1,236 - - - - - 1,236
Interest Expense - - - - - - -
Other Expense - changes in fair value of related party
payable (4,883) - - 4,883 (4,414) 469 (4,414)
Foreign exchange gain (loss) 10,594 - (10,594) - - (10,594) -
Income (loss) before income taxes 77,705 12,564 (10,594) 35,840 (36,495) 1,315 79,020
Income tax provision 35,907 4,397 (3,178) 1,709 (1,545) 1,383 37,290
Income Tax Rate 46% 35% 30% 5% 4% 105% 47%
Net Loss 41,798$ 8,167$ (7,416)$ 34,131$ (34,950)$ (68)$ 41,730$
Net loss per share - Diluted 0.96$ 0.19$ (0.17)$ 0.78$ (0.80)$ -$ 0.96$
Weighted average number of shares outstanding - Diluted 43,619 43,619 43,619 43,619 43,619 43,619 43,619
Adjustments
Exclude
