Attached files
| file | filename |
|---|---|
| EX-32.2 - EXHIBIT 32.2 - Spok Holdings, Inc | cfosoxcertification-ex322.htm |
| EX-32.1 - EXHIBIT 32.1 - Spok Holdings, Inc | ceosoxcertification-ex321.htm |
| EX-31.2 - EXHIBIT 31.2 - Spok Holdings, Inc | cfocertification-ex312.htm |
| EX-31.1 - EXHIBIT 31.1 - Spok Holdings, Inc | ceocertification-ex311.htm |
| EX-23 - EXHIBIT 23 - Spok Holdings, Inc | auditorconsent-ex23.htm |
| EX-21 - EXHIBIT 21 - Spok Holdings, Inc | subsidiarieschart-ex21.htm |
| EX-10.18 - EXHIBIT 10.18 - Spok Holdings, Inc | amendedseveranceplanandsum.htm |
| EX-10.17 - EXHIBIT 10.17 - Spok Holdings, Inc | rsunotice2015ltipex1017.htm |
| EX-10.16 - EXHIBIT 10.16 - Spok Holdings, Inc | rsunoticetimebasedltipex10.htm |
| EX-10.15 - EXHIBIT 10.15 - Spok Holdings, Inc | ltip2017redacted-ex1015.htm |
| EX-10.14 - EXHIBIT 10.14 - Spok Holdings, Inc | stip2017redacted-ex1014.htm |
| EX-10.11 - EXHIBIT 10.11 - Spok Holdings, Inc | stip2016unredacted-ex1011.htm |
UNITED STATES
SECURITIES AND EXCHANGE COMMISSION
WASHINGTON, D.C. 20549
FORM 10-K
(Mark One)
x | ANNUAL REPORT PURSUANT TO SECTION 13 OR 15(d) OF THE SECURITIES EXCHANGE ACT OF 1934 |
For the Fiscal Year Ended December 31, 2016
or
¨ | TRANSITION REPORT PURSUANT TO SECTION 13 OR 15(d) OF THE SECURITIES EXCHANGE ACT OF 1934 |
For the transition period from to
Commission file number 001-32358
SPOK HOLDINGS, INC.
(Exact name of registrant as specified in its charter)
DELAWARE | 16-1694797 | |
(State or other jurisdiction of incorporation or organization) | (I.R.S. Employer Identification No.) | |
6850 Versar Center, Suite 420 Springfield, Virginia | 22151-4148 | |
(Address of principal executive offices) | (Zip Code) | |
(800) 611-8488
(Registrant’s telephone number, including area code)
Securities registered pursuant to Section 12(b) of the Act:
Title of each class | Name of each exchange on which registered | |
Common Stock, par value $0.0001 per share | NASDAQ National Market® | |
Securities registered pursuant to Section 12(g) of the Act:
None
Indicate by check mark if the registrant is a well-known seasoned issuer, as defined in Rule 405 of the Securities Act. YES ¨ NO x
Indicate by check mark if the registrant is not required to file reports pursuant to Section 13 or Section 15(d) of the Act. YES ¨ NO x
Indicate by check mark whether the registrant (1) has filed all reports required to be filed by Section 13 or 15(d) of the Securities Exchange Act of 1934 during the preceding 12 months (or for such shorter period that the registrant was required to file such reports), and (2) has been subject to such filing requirements for the past 90 days. YES x NO ¨
Indicate by check mark whether the registrant has submitted electronically and posted on its corporate Web site, if any, every Interactive Data File required to be submitted and posted pursuant to Rule 405 of Regulation S-T (§ 232.405 of this chapter) during the preceding 12 months (or for such shorter period that the registrant was required to submit and post such files). YES x NO ¨
Indicate by check mark if disclosure of delinquent filers pursuant to Item 405 of Regulation S-K (§ 229.405 of this chapter) is not contained herein, and will not be contained, to the best of registrant’s knowledge, in definitive proxy or information statements incorporated by reference in Part III of this Form 10-K or any amendment to this Form 10-K. x
Indicate by check mark whether the registrant is a large accelerated filer, an accelerated filer, a non-accelerated filer, or a smaller reporting company. See the definitions of “large accelerated filer,” “accelerated filer” and “smaller reporting company” in Rule 12b-2 of the Exchange Act.
Large accelerated filer | ¨ | Accelerated filer | x | ||
Non-accelerated filer | ¨ (Do not check if a smaller reporting company) | Smaller reporting company | ¨ | ||
Indicate by check mark whether the registrant is a shell company (as defined in Rule 12b-2 of the Act). YES ¨ NO x
The aggregate market value of the common stock held by non-affiliates of the registrant was $393.8 million based on the closing price of $19.17 per share on the NASDAQ National Market® on June 30, 2016.
The number of shares of registrant’s common stock outstanding on February 24, 2017 was 20,530,795.
DOCUMENTS INCORPORATED BY REFERENCE
Portions of the registrant’s Definitive Proxy Statement for the 2017 Annual Meeting of Stockholders of the registrant, which will be filed with the Securities and Exchange Commission pursuant to Regulation 14A no later than May 1, 2017, are incorporated by reference into Part III of this Report.
TABLE OF CONTENTS
Part I | ||
Item 1. | ||
Item 1A. | ||
Item 1B. | ||
Item 2. | ||
Item 3. | ||
Item 4. | ||
Part II | ||
Item 5. | ||
Item 6. | ||
Item 7. | ||
Item 7A. | ||
Item 8 | ||
Item 9. | ||
Item 9A. | ||
Item 9B. | ||
Part III | ||
Item 10. | ||
Item 11. | ||
Item 12. | ||
Item 13. | ||
Item 14. | ||
Part IV | ||
Item 15. | ||
2
Forward-Looking Statements
This Annual Report on Form 10-K contains forward-looking statements and information relating to Spok Holdings, Inc. and its subsidiaries (“Spok” or the “Company”) that set forth anticipated results based on management’s current plans, known trends and assumptions. These statements are made pursuant to the safe harbor provisions of the Private Securities Litigation Reform Act of 1995. Statements that are predictive in nature, that depend upon or refer to future events or conditions, or that include words such as “anticipate,” “believe,” “estimate,” “expect,” “intend,” “will,” “target,” “forecast” and similar expressions, as they relate to Spok are forward-looking statements.
Although these statements are based upon current plans, known trends and assumptions that management considers reasonable, they are subject to certain risks, uncertainties and assumptions, including but not limited to the following:
• | Continuing decline in the number of paging units we have in service with customers, commensurate with a continuing decline in our wireless revenue |
• | The sales cycle of our software solutions and services can run from six to eighteen months, making it difficult to plan for and meet our sales objectives and bookings on a steady basis quarter-to-quarter and year-to-year |
• | Our ability to manage network rationalization to lower our costs without causing disruption of service to our customers |
• | Our ability to design and develop an integrated critical communications platform to address mobile communications, clinical alerting, nursing and workflow functions at state of the art hospitals that gains market acceptance and wide-spread use by customers |
• | Our ability to address changing market conditions with new or revised software solutions |
• | Our ability to retain key management personnel and to attract and retain talent within the organization |
• | Our ability to manage change related to regulation, including laws and regulations affecting hospitals and the healthcare industry generally |
• | Competition for our services and products from new technologies or those offered and/or developed from firms that are substantially larger and have much greater financial and human capital resources |
• | The reliability of our networks and servers and our ability to prevent cyber-attacks and other security issues and disruptions |
• | Those matters discussed in this Annual Report under Item 1A “Risk Factors.” |
Should known or unknown risks or uncertainties materialize, known trends change, or underlying assumptions prove inaccurate, actual results or outcomes may differ materially from past results and those described herein as anticipated, believed, estimated, expected, intended, targeted or forecasted. Investors are cautioned not to place undue reliance on these forward-looking statements.
The Company undertakes no obligation to update forward-looking statements. Investors are advised to consult all further disclosures the Company makes in its subsequent reports on Form 10-Q and Form 8-K that it will file with the United States Securities and Exchange Commission (“SEC”). Also note that, in the risk factors section, the Company provides a cautionary discussion of risks, uncertainties and possibly inaccurate assumptions relevant to its business. These are factors that, individually or in the aggregate, could cause the Company’s actual results to differ materially from past results as well as those results that may be anticipated, believed, estimated, expected, intended, targeted or forecasted. It is not possible to predict or identify all such risk factors. Consequently, investors should not consider the risk factor discussion to be a complete discussion of all of the potential risks or uncertainties that could affect Spok’s business, statement of income or financial condition, subsequent to the filing of this Annual Report.
3
PART I
The terms "we," "us," "our," "Company" and "Spok" refer to Spok Holdings, Inc. and its direct and indirect wholly-owned subsidiaries.
ITEM 1. BUSINESS
Overview
Spok, Inc., a wholly owned subsidiary of Spok Holdings, Inc. (NASDAQ: SPOK), is proud to be the global leader in healthcare communications. We deliver clinical information to care teams when and where it matters most to improve patient outcomes. Top hospitals rely on the Spok Care Connect suite to enhance workflows for clinicians, support administrative compliance, and provide a better experience for patients. Our customers send over 100 million messages each month through their Spok solutions.
Our headquarters is located at 6850 Versar Center, Suite 420, Springfield, Virginia 22151, and our telephone number is 800-611-8488. We maintain an Internet website at http://www.spok.com. (This website address is for information only and is not intended to be an active link or to incorporate any website information into this 2016 Annual Report on Form 10-K ("2016 Form 10-K").)
We are a provider of paging services and selected software solutions in the United States and abroad, on a limited basis, in Europe, Canada, Australia, Asia and the Middle East. We offer our services and products to three major market segments: healthcare, government, and large enterprise, with a greater emphasis on the healthcare market segment.
Industry Overview
We deliver smart, reliable critical communication solutions to help protect the health, well-being, and safety of people around the globe, primarily in the United States. Our customers rely on Spok for workflow improvement, secure texting, paging services, contact center optimization, and public safety response.
We develop, sell, and support enterprise-wide systems primarily for healthcare and other organizations needing to automate, centralize, and standardize their approach to critical communications. Our solutions can be found in prominent hospitals; large government agencies; leading public safety institutions, colleges and universities; large hotels, resorts and casinos; and well-known manufacturers.
Due to the focused nature of our software solutions there is no single competitor that matches our portfolio (additional details can be found under “Competition”). Our primary market is healthcare providers, particularly hospitals. We have identified hospitals with 200 or more beds as the primary targets for our software solutions as well as our paging services. Within this market we have identified the following dynamics and have focused our efforts to address these dynamics:
• | a heightened awareness of the ubiquitous, critical role of communications in healthcare; |
• | an increased focus within hospitals on quality of care and patient safety initiatives; |
• | the importance of confidentiality when sharing information; |
• | increased regulations that may result in process changes, increased documentation and reporting and increased costs; |
• | a continuing focus within hospitals to reduce labor and administrative costs while increasing productivity; and |
• | a broader proliferation of information technology in healthcare as hospitals strive to apply technology to solve their business problems. |
Sales and Marketing
Sales. We market and distribute our critical communication solutions through a direct sales force and an indirect sales channel.
The direct sales force contracts or sells products, solutions, messaging services and other services directly to customers ranging from small and medium-sized businesses to companies in the Fortune 1000; healthcare and related businesses; and federal, state, and local government agencies. We will continue to market primarily to commercial enterprises, with a focus on healthcare organizations, interested in our communication solutions. We maintain a sales presence in key markets throughout the United States in an effort to gain new customers and to retain and increase sales to existing customers. We also maintain several corporate sales groups, such as our Key Account Management team, focused on retaining and selling additional products and services to our key healthcare accounts as well as a team selling primarily to national accounts. The direct sales force targets leadership responsible for the procurement of critical communications solutions such as chief information officers, chief technology officers, chief medical officers, chief nursing officers, information technology directors, telecommunications directors, and contact center managers. The timing for a direct sale varies, but may take from six to 18 months depending on the type of software solution.
The indirect sales force complements our direct sales force. Through relationships with alliance partners we are able to sell our solutions to a wider customer base. For paging services that we do not provide directly, we contract with and invoice an intermediary for airtime
4
services. For our software sales, our relationships with alliance partners assist us in broadening the distribution of our products and further diversifying into markets outside healthcare.
Marketing. We have a centralized marketing function, which is focused on supporting our solutions and sales efforts by strengthening our corporate brand, generating sales leads, and facilitating the sales process. Our principal marketing programs include:
• | Content marketing (eBriefs, case studies, brochures, videos, infographics, and more) as an underlying foundation of all marketing campaigns or initiatives; |
• | Website development and maintenance, which provides product and Company information, customer support options, paging capabilities, as well as thought leadership and engagement; |
• | Participation at trade shows and industry events, such as Healthcare Information and Management Systems Society, College of Healthcare Information Management Executives and Radiological Society of North America; |
• | Webinars about current industry trends and our solutions; |
• | Social media involvement to provide information regarding upcoming educational events or new product offerings; |
• | Industry analyst relationships; |
• | Newsletters and blog posts to provide information about industry trends and our solutions to customers, prospects, and alliances; and |
• | Annual customer conferences that solicit feedback on our solutions and services. |
Licenses and Messaging Networks
In order to provide our wireless services, we hold licenses to operate on various frequencies in the 900 MHz narrowband. We are licensed by the United States Federal Communications Commission (the “FCC”) to operate Commercial Mobile Radio Services (“CMRS”). These licenses are required to provide one-way and two-way messaging services over our networks.
We operate local, regional and nationwide one-way networks, which enable subscribers to receive messages over a desired geographic area. One-way networks operating in 900 MHz frequency bands utilize the FLEX™ protocol developed by Motorola Mobility, Inc. (“Motorola”). The FLEX™ protocol has advantages of functioning at higher network speeds (which increases the volume of messages that can be transmitted over the network) and of having more robust error correction (which facilitates message delivery to a device with fewer transmission errors).
Our two-way networks utilize the ReFLEX 25™ protocol, also developed by Motorola. ReFLEX 25™ promotes spectrum efficiency and high network capacity by dividing coverage areas into zones and sub-zones. Messages are directed to the zone or sub-zone where the subscriber is located, allowing the same frequency to be reused to carry different traffic in other zones or sub-zones. As a result, the ReFLEX 25™ protocol allows the two-way network to transmit substantially more messages than a one-way network using the FLEX™ protocols. The two-way network also provides for assured message delivery. The network stores, for a limited amount of time, messages that could not be delivered to a device that is out of coverage for any reason, and when the unit returns to service, those messages are delivered. The two-way paging network operates under a set of licenses called narrowband Personal Communications Service, which uses 900 MHz frequencies. These licenses require certain minimum five and ten-year build-out commitments established by the FCC, which have been satisfied.
Although the capacities of our networks vary by geographic area, we have a significant amount of excess capacity. We have implemented a plan to manage network capacity and to improve overall network efficiency by consolidating subscribers onto fewer, higher capacity networks with increased transmission speeds. This plan is referred to as network rationalization. Network rationalization will result in fewer networks and therefore fewer transmitter locations, which we believe will result in lower operating expenses due primarily to lower site rent expenses. As we continue to implement our network rationalization plan, we expect to have fewer transmitters that can be removed efficiently from our networks and still maintain the level of service required for our customers, and thus the benefits of network rationalization will decline.
Generally, our software solutions do not require licenses or permits from Federal, state and/or local government agencies in order to be sold to customers. However, certain of our software products are subject to regulation by the United States Food and Drug Administration ("FDA") and are subject to certification by the Joint Interoperability Test Command to be sold to the branches of the armed services of the Unite States and the United States government. (See “Regulation” below).
Our messaging networks and related infrastructure are located exclusively in the United States.
5
Our Strategy
Our goal is to continue to execute on our vision of becoming a leading provider of integrated communications and collaboration enterprise solutions. In doing so, we will strengthen our core product offerings and offer new solutions as we continue to focus on serving the mission critical needs of our customers, while operating an efficient and profitable business strategy.
Critical aspects of our strategy include:
Growth of our software revenue and bookings — We expect to substantially increase our investment in sales and marketing, product implementation, product development and customer support to drive software, services and maintenance bookings and revenue growth. We will continue to focus our sales and marketing efforts in the healthcare market in order to identify opportunities for sales and close those opportunities in the form of purchase orders or bookings. We have established software operations bookings as a key performance objective for our consolidated operations in 2017.
We have an ongoing initiative to further penetrate the hospital segment in the United States and while we believe there is a significant opportunity to sell critical communication solutions to hospitals located outside the United States our focus is on the domestic market. We intend to leverage the strength of our market presence and the breadth of our product offerings to further expand our customer base in healthcare.
Retention of our wireless subscribers and revenue stream — Wireless subscribers and the resulting revenue represented about 61%, 63% and 66% of our total consolidated revenue for each of the years ended December 31, 2016, 2015 and 2014, respectively. We will continue to focus on reducing the rate of subscriber disconnects and minimize the rate of wireless revenue erosion. We continue to have a valuable wireless presence in the healthcare market, particularly in larger hospitals. We offer a comprehensive suite of wireless messaging products and services focused on healthcare and “campus” type environments and critical mission notification. We will continue to focus on network reliability and customer service to help minimize the rate of subscriber disconnects. Retention of our wireless revenue has been included as a key performance objective for our consolidated operations in 2017.
We recognize that the number of our wireless subscribers, our units in service and the related revenue will continue to decline. We intend to continue reducing our underlying cost structure impacting this wireless revenue stream. We will reduce payroll and related expenses as well as network related expenses as necessary in light of the declining wireless revenue. We will integrate and consolidate operations as necessary to ensure the lowest cost operational platform for our consolidated business. We have established management of our operating and capital expenses as a key performance objective for our consolidated operations in 2017.
Invest in our future solutions — The market for communication and collaboration solutions is expected to grow as healthcare continues to change. Trends including the establishment of accountable care organizations, reimbursement changes and emphasis on quality improvement and care coordination are all driving an evolution in communication and collaboration between previously disparate departments and systems within and outside hospitals. Becoming the leader in healthcare communication and collaboration requires us to continue development of our integrated platform and invest in the key areas of customer need including: 1) mobility, 2) integrated platform, 3) nursing solutions and 4) alerting. We will increase our spending on product development and strategy in 2017 and beyond to develop these solutions and compete in the changing marketplace. This is a key performance objective for our consolidated operations in 2017. Investment in our future solutions is discussed in further detail under "Research and Development".
Return capital to our stockholders — The development of our integrated critical communications solutions is a key performance objective for our consolidated operations in 2017. We understand that our primary objective is to create long-term stockholder value. Executing our 2017 objectives is important, and we will continue to evaluate how best to deploy our capital resources to support sustainable business growth and maximize stockholder value. We expect to continue to pay a quarterly dividend of $0.125 per share of common stock or $0.50 annually in 2017. We will continue to evaluate both market and Company factors to determine whether a common stock repurchase program is an appropriate method to return capital to our stockholders.
Long-term revenue growth through business diversification — We believe that add-on acquisitions of companies or technologies could be an important part of our future growth. We believe add-on acquisitions of complementary companies or technologies in the healthcare market could enhance our position with current customers and expand our overall addressable markets. Rapidly and successfully integrating strategic acquisitions and improving operational efficiencies would be a focus of our management team. Given the nature of our solutions, new technologies can be integrated to accelerate cross-selling opportunities. We evaluate these potential businesses or technologies to determine if they can be acquired at a reasonable valuation and will be profitably accretive and accelerate our revenue goals.
To ensure focus on our business strategy we establish specific performance objectives and develop short-term and long-term incentive plans (“STIP” and "LTIP," respectively) for our management that include a combination of these operating objectives and priorities.
6
Our Products and Services
Wireless Products and Services. We offer subscriptions to one-way or two-way messaging services for a periodic (monthly, quarterly, semi-annual, or annual) service fee. The level of service fees is generally based upon the type of service provided, the geographic area covered, the number of devices provided to the customer and the period of commitment. A subscriber to one-way messaging services may select coverage on a local, regional, or nationwide basis to best meet their messaging needs. Two-way messaging is generally offered on a nationwide basis. In addition, subscribers either contract for a messaging device from us for an additional fixed monthly fee or they own a device, having purchased it either from us or from another vendor. We also sell devices to resellers who lease or resell them to their subscribers and then sell messaging services utilizing our networks. We offer ancillary services, such as voicemail and equipment loss or maintenance protection, which help increase the monthly recurring revenue we receive along with these traditional messaging services. In 2015 and 2016 we launched new and exclusive one-way (T5) and two-way (T52) alphanumeric pagers, respectively. Both pagers are configurable to support un-encrypted or encrypted operation. When configured for encryption, they utilize AES-128 bit encryption, screen locking and remote wipe capabilities. With encryption enabled these new secure paging devices enhance our service offerings to the healthcare community by adding Health Insurance Portability and Accountability Act ("HIPAA") security capabilities to the low cost, highly reliable and availability benefits of paging.
The demand for one-way and two-way messaging services declined during the years ended December 31, 2016, 2015 and 2014 and we believe demand will continue to decline for the foreseeable future. Wireless products and services revenue represented 61%, 63% and 66% of total consolidated revenue for the years ended December 31, 2016, 2015 and 2014, respectively. As demand for one-way and two-way messaging has declined, we have developed or added service offerings in order to increase our revenue potential and mitigate the decline in our wireless revenues. We will continue to evaluate opportunities to provide customers the highest value possible.
Software. Dependable critical communications are paramount for individuals in healthcare and a host of other industries. We offer a number of solutions, providing our customers with the ability to communicate anywhere, anytime across a number of situations. Our solutions are used for contact centers, clinical alerting and notification, mobile communications and messaging, and for public safety notifications. We offer critical communication solutions in four major product categories:
Contact Center
• | Spok® Healthcare Console: Provides operators with the information needed to process calls using their computers, with just a few keystrokes. This solution integrates with the customers’ existing phone systems and is used by the operator group to answer incoming calls to the contact center. Operators can quickly and accurately perform directory searches and code calls, as well as messaging and paging by individual, groups, and roles using the Spok Healthcare Console’s computer telephony integration ("CTI") and directory capabilities. |
• | Spok® Web-Based Directory: Makes employee contact information more accessible and enables staff to send messages quickly right from the directory. Authenticated users can log on anywhere, anytime to perform a variety of important updates to contact information and on-call schedules, search the directory, and send important messages. |
• | Spok® Web-Based On-Call Scheduling: Keeps personnel, calendars and on-call scheduling information updated, even with thousands of staff, using a secure web portal to maintain and allow password-protected access to the latest on-call schedules and personnel information. |
• | Spok® Speech: Enables the organization to process routine phone requests, including transfers, directory assistance, messaging and paging without live operators and with more ease-of-use than touchtone menus. |
• | HigherGround® Call Recording and Quality Management: Records, monitors, and scores operators’ conversations to allow for better management of calls, helping improve customer service. |
• | Spok® Eclipse Call Accounting: Provides a wealth of information about every call being made and received. The information can be formatted and used to analyze voice network resources, employee telephone usage and bill-back information. |
7
Clinical Alerting
• | Spok® Messenger: Provides an intelligent, FDA, 510(k)-cleared solution that connects virtually all crucial alert systems, including nurse call, fire, security, patient monitoring, and building management to mobile staff via their wireless communication devices. This solution provides the ability to reach mobile team members within seconds of an alert, improving overall workflow, staff productivity, and the comfort and safety of everyone in the facility. |
• | Spok® e.Notify: Enables organizations to quickly and reliably notify and confirm team member availability during emergency situations without relying on calling trees, thereby reducing confusion that may arise in an emergency situation. This solution automatically delivers messages, collects responses, escalates issues to others, and logs all activities for reporting and analysis purposes. |
• | Spok® Critical Test Results Management: Automates and streamlines the process of delivering critical test results to the right clinicians to help ensure patient safety. This solution can send messages from the cardiology, laboratory and radiology departments by means of encrypted smartphone communications, two-way paging, secure email, secure text, images, annotations, and voice to a variety of endpoints such as workstations, laptops, tablets, smartphones, pagers, and other wireless devices. |
Mobile Communications
• | Spok Mobile®: Simplifies communications and strengthens care by using smartphones and tablets for secure code alerts, patient updates, results, consult requests, and much more. Allows users to access the full directory of accurate contact information to send messages/photos/videos to smartphones and other devices, and to ensure critical communications are logged, all with security, traceability, and reliability. |
• | Spok® Device Preference Engine: Facilitates voice conversations among doctors and caregivers by enabling users to choose the desired communication method based on factors such as message priority. |
Public Safety
• | Spok® pc/psap: Speeds emergency dispatch by giving Public Safety Answering Point ("PSAP") call-takers an easy-to-use, standards-based, graphical interface that integrates the underlying phone system, mapping systems, and other resources for critical information availability. 9-1-1 call-takers are able to instantly involve police, fire, EMT, and hazardous material personnel with a single click of the mouse or touch of the screen. |
• | Spok® Enterprise Alert: Directs emergency personnel to a 9-1-1 caller’s exact location (building, floor, room), helping to ensure speed, accuracy, and reliability of response. The E9-1-1 software provides real-time, onsite notification when 9-1-1 is dialed, and works to decrease emergency response time. |
Services. We offer a variety of professional services to assist our customers in the successful implementation of, and to maximize the benefits obtained from the use of, our software solutions. We also offer support services to enhance and refine the customers experience throughout their relationship with Spok.
• | Professional Services: We offer a full suite of professional services which are provided by a dedicated group of professional service employees. Our professional services include consultation, implementation and training services. For software solution implementations, our professional services staff uses a branded, consistent methodology that provides a comprehensive phased work plan for both new software installations and/or upgrades. In support of our implementation methodology, we manage the various aspects of the process through a professional services automation tool. A typical implementation process ranges from 30 to 180 days depending on the type of implementation. We may also use third-party professional services firms to implement our solutions for customers depending on the circumstances. Professional services revenue represented 10%, 10% and 9% of total consolidated revenue for the years ended December 31, 2016, 2015 and 2014 respectively. |
• | Software License Updates and Product Support (Maintenance): Software license updates and product support, which is generally referred to as maintenance when sold to customers, is an important offering to customers who utilize our software solutions. In order to support our products that provide mission critical solutions to our customer’s organizations, we have a dedicated customer support organization. The customer support organization provides support 24 hours a day, 7 days a week, 365 days a year and the service can be accessed via telephone, email or the Internet via the Spok webpage. The Spok support service is augmented by third party services where needed. Software license updates and product support are generally priced together as a percentage of the software licenses for which these services will be provided. Largely all of our customers purchase maintenance when they purchase new software licenses after which renewals generally occur on an annual basis and are paid in advance. Software license updates provide customers with rights to unspecified product upgrades as well as maintenance and patch releases that are released during the term of the support period. Software license updates and product support revenue (i.e. maintenance revenue) represented 21%, 18% and 15% of total consolidated revenue for the years ended December 31, 2016, 2015 and 2014 respectively. |
8
Sources of Equipment
We do not manufacture the messaging devices our customers need to take advantage of our services or the network equipment we use to provide messaging services. We have relationships with several vendors to purchase new messaging devices. Used messaging devices are available in the secondary market from various sources. We believe existing inventory, returns of devices from customers that canceled services, and purchases from other available sources of new and reconditioned devices will be sufficient to meet expected messaging device requirements for the foreseeable future. We negotiate contractual terms with our vendors that do not directly relate to the manufacturing of the network equipment or messaging devices. The network equipment and messaging devices are generic on which we may place our logo or label.
We sell third party equipment for use with our software solutions. The third party equipment that we sell is generally available and does not require any specialty manufacturing to accommodate our software solutions.
We currently have inventory and network equipment on hand that we believe will be sufficient to meet our wireless and software equipment requirements for the foreseeable future.
Intellectual Property
As of December 31, 2016 we held 64 trademarks and 19 patents which we believe are important to protect our intellectual property. We believe our intellectual property distinguishes our business from our competition and are integral to our continued success in the area of critical communication solutions. The expiration dates of these trademarks range from 2017 to 2032 and can be extended for 10 year periods upon renewals.
Customers
Our customers include businesses and employees who need to be accessible to their offices or customers, first responders who need to be accessible in emergencies, and third parties, such as other telecommunication carriers and resellers that pay our Company to use our networks. Customers include businesses, professionals, management personnel, medical personnel, field sales personnel and service forces, members of the construction industry and construction trades, real estate brokers and developers, sales and services organizations, specialty trade organizations, manufacturing organizations and government agencies.
We offer our communication services and products primarily in the United States and to three major market segments: healthcare, government and large enterprise, but with a greater emphasis on the healthcare market segment. For the years ended December 31, 2016, 2015 and 2014, revenues from healthcare customers accounted for approximately 70.3%, 68.2% and 66.0% of our total revenues, respectively. We expect the trend of an increasing percentage of our total revenue to come from the health care segment, even as our total revenue declines due to our subscriber erosion from our wireless services. No single customer accounted for more than 10% of our total revenues in 2016, 2015 and 2014. For the years ended December 31, 2016, 2015 and 2014, foreign sales represented approximately 3.2%, 2.0% and 2.7% of our consolidated revenue, respectively.
We pursue close, long-term relationships with our customers because we believe strong customer relationships enable us to retain our current customer base and expand our services and revenue to that customer base.
Backlog
Our backlog of undelivered or in-progress orders was $38.3 million and $38.7 million at December 31, 2016 and 2015, respectively. Of the current backlog we expect to deliver and complete all but $5.8 million in 2017.
Competition
The competitors and degree of competition vary among our various product categories. Competition is particularly strong for our wireless messaging services. Within the wireless industry, companies compete on the basis of price, coverage area, services offered, transmission quality, network reliability, and customer service. We compete by maintaining competitive pricing for our products and services, by providing broad coverage options through high-quality, reliable messaging networks and by providing quality customer service. Direct competitors for wireless messaging services include American Messaging Service, LLC and a variety of other regional and local providers. We also compete with a broad array of wireless messaging services provided by mobile telephone companies, including AT&T Mobility LLC, Sprint Nextel Corporation, T-Mobile USA, Inc., and Verizon Wireless, Inc. This competition has intensified as prices for the services of mobile telephone companies have declined and as those companies have incorporated messaging capabilities into their mobile phone devices. Many of these companies possess far greater financial, technical and other resources than we do.
9
Most Personal Communications Service and other mobile phone devices currently sold in the United States are capable of sending and receiving one-way and two-way messages. Most subscribers that purchase these services no longer need to subscribe to a separate messaging service. As a result, many one-way and two-way messaging subscribers can readily switch to cellular, Personal Communications Service and other mobile telephone services. The decrease in prices and increase in capacity and functionality for cellular, Personal Communications Service, WiFi, and other mobile telephone services have led many subscribers to select combined voice and messaging services from mobile telephone companies as an alternative to our stand-alone messaging services.
We also have a number of competitors whose software products compete with one or more modules of our critical communications solutions. These competitors are a mix of privately held and public companies that offer a number of call center, alerting and mobile communication products. Our primary competitive advantages include having:
• | An integrated product suite; |
• | A communication-driven workflow; |
• | Certifications, such as those through the Joint Interoperability Test Command (See "Joint Interoperability Test Command" below) and the FDA; and |
• | A complete directory of contacts throughout the customer enterprise. |
Although there are no competitors that offer a similar comprehensive set of software modules that match our product offerings, there are several competitors who offer software similar to many of our solutions. Selected competitors for portions of our product portfolio include:
• | Amtel Communications, Inc. (AMTELCO) - Contact center solutions; |
• | Nuance Communications, Inc. - Clinical alerting solutions; |
• | peerVue, Inc. - Clinical alerting solutions; |
• | TigerText, Inc. - Mobile communication solutions; |
• | Vocera Communications, Inc. (including Extension Healthcare)- Mobile communications solutions; |
• | Imprivata, Inc. - Mobile communications solutions; |
• | Voalte, Inc. - Mobile communications solutions; |
• | Ascom Holding AG - Mobile Communications solutions; |
• | Emergin, a Phillips Healthcare company - Alerting and notification; |
• | DBA HipLink Software, Inc. - Mobile communications solutions; and |
• | Veriphy Ltd - Critical test results management. |
In addition, substantially larger companies in the electronic medical records ("EMR") space such as Epic Systems Corporation, Cerner Corporation, Athenahealth, Inc. and Allscripts Healthcare, LLC may choose to offer software related solutions similar to our critical communications and work flow solutions, or may acquire one of our competitors.
Research and Development ("R&D")
We maintain a product development group, a substantial portion of which is focused on developing new software products , especially with respect to developing an integrated platform for communications solutions. Within our Research and Development group is a separate task force focused on ongoing maintenance and enhancement of existing point-solution products. Our product development group uses a methodology that balances enhancement requests from a number of sources including customers, regulatory requirements, the professional services staff, customer support incidents, known defects, market and technology trends, and competitive requirements. These requests are reviewed and prioritized based on criteria that include the potential for increased revenue, customer/employee satisfaction, possible cost savings and development time and expense.
We have increasingly focused our product development activities on developing our unified communications solution, Spok Care Connect®. This unified communication solution focuses on four key areas of customer need: mobility offerings, an integrated platform, alerting and nursing solutions. The development of Spok Care Connect requires a multi-year effort by a dedicated product development staff and will be deployed in multiple phases which include planned development and enhancements. We believe that development of the Spok Care Connect platform will drive long-term stockholder value and play an important role in determining the future success of our strategy.
Our expenses for research and development for the years ended December 31, 2016, 2015 and 2014 were $13.5 million, $10.3 million, and $9.5 million, respectively, and we expect our research and development expenses to grow substantially over the next two to three years. We plan to invest significantly in our research and development efforts to build a fully integrated communications and workflow platform for hospitals focused on mobility, critical alerting, and nursing care with full enterprise accessibility.
10
Employees
At December 31, 2016 and 2015 we had 587 and 600 full time equivalent (“FTE”) employees, respectively. We recently announced plans to hire up to 60 new employees focused on our research and development efforts for our Spok Care Connect platform. Our employees are not represented by labor unions or covered by a collective bargaining agreement. We believe that our employee relations are good.
Regulation
Federal Regulation
The FCC issues licenses to use radio frequencies necessary to conduct our business and regulate many aspects of the operations that support our wireless revenue. Licenses granted to us by the FCC have varying terms, generally of up to ten years, at which time the FCC must approve renewal applications. In the past, FCC renewal applications generally have been granted upon showing compliance with FCC regulations and adequate service to the public. Other than those still pending, the FCC has thus far granted each license renewal that we have requested.
The Communications Act of 1934, as amended (the “Communications Act”), requires radio licensees, including us, to obtain prior approval from the FCC for the assignment or transfer of control of any construction permit or station license or authorization of any rights thereunder. The FCC has thus far granted each assignment or transfer request we have made in connection with a change of control.
The Communications Act also places limitations on foreign ownership of CMRS licenses, which constitute the majority of our licenses. These foreign ownership restrictions limit the percentage of stockholders’ equity that may be owned or voted, directly or indirectly, by non-United States citizens or their representatives, foreign governments or their representatives, or foreign corporations. Our Amended and Restated Certificate of Incorporation permits the redemption of our equity from stockholders where necessary to ensure compliance with these requirements.
The FCC’s rules and regulations require us to pay a variety of fees that otherwise increase our costs of doing business. For example, the FCC requires licensees, including Spok, to pay levies and fees, such as universal service fees, to cover the costs of certain regulatory programs and to promote various other societal goals. These requirements increase the cost of the services provided. By law, we are permitted to bill our customers for these regulatory costs and we typically do so.
Additionally, the Communications Assistance to Law Enforcement Act of 1994, (“CALEA”) and certain rules implementing CALEA require some telecommunication companies, including Spok, to design and/or modify their equipment in order to allow law enforcement personnel to “wiretap” or otherwise intercept messages. Other regulatory requirements restrict how we may use customer information and prohibit certain commercial electronic messages, even to our own customers.
In addition, the FCC’s rules require us to pay other carriers for the transport and termination of some telecommunication traffic. As a result of various FCC decisions over the last few years, we no longer pay fees for the termination of traffic originating on the networks of local exchange carriers providing wireline services interconnected with our services. In some instances, we received refunds for prior payments to certain local exchange carriers. We have entered into a number of interconnection agreements with local exchange carriers in order to resolve various issues regarding charges imposed by local exchange carriers for interconnection.
Failure to follow the FCC’s rules and regulations can result in a variety of penalties, ranging from monetary fines to the loss of licenses. Additionally, the FCC has the authority to modify licenses, or impose additional requirements through changes to its rules.
The FDA has determined software systems that connect to medical devices are subject to regulation as medical devices as defined by the federal Food, Drug and Cosmetic Act (“the FDC Act”). Since our middleware software products connect to medical devices, we are required to comply with the FDC Act’s requirements, including but not limited to: registration and listing, labeling, medical device reporting (reporting of medical device-related adverse events), removal and correction, and good manufacturing practice requirements. We have complied with the regulatory requirements of the FDC Act, and registered and received the necessary clearances for our products. As we modify and/or enhance our software products (including our middleware product), we may be required to request FDA clearance before we are permitted to market these products.
In addition, our software solutions may handle or have access to personal health information subject in the United States to the HIPAA, the Health Information Technology for Economic and Clinical Health Act (“HITECH”), and related regulations. These statutes and related regulations impose numerous requirements regarding the use and disclosure of personal health information with which we help our customers comply. Our failure to accurately anticipate or interpret these complex and technical laws could subject us to civil and/or criminal liability. We believe that we are in compliance with these laws and their related regulations.
11
Although these and other regulatory requirements have not, to date, had a material adverse effect on our operating results, such requirements could have a material impact on our operating results in the future. We monitor discussions at the FCC and FDA on pending changes in regulatory policy or regulations; however, we are unable to predict what changes, if any, may occur in 2017 to regulatory policy or regulations.
State Regulation
As a result of the enactment by the United States Congress of the Omnibus Budget Reconciliation Act of 1993 (“OBRA”) in August 1993, states are now generally preempted from exercising rate or entry regulation over any of our operations. States are not preempted, however, from regulating “other terms and conditions” of our operations, including consumer protection and similar rules of general applicability. Zoning requirements are also generally permissible, however, provisions of the OBRA prohibit local zoning authorities from unreasonably restricting wireless services. States that regulate our services also may require us to obtain prior approval of (1) the acquisition of controlling interests in other paging companies and (2) a change of control.
At this time, we are not aware of any proposed state legislation or regulations that would have a material adverse impact on our business.
Joint Interoperability Test Command ("JITC") Certification
JITC is a military organization that tests technology for use by the branches of the armed services of the United States and the United States federal government. JITC certification is required of all systems with joint interfaces or joint information exchanges with other systems used by these organizations and is done to ensure all systems operate effectively together. All information technology and national security systems that exchange and use information to enable units or forces to operate effectively in joint, combined, coalition and interagency operations and simulations must be certified. Once a system has been certified under this program, the certification must be renewed every four years or after any changes that may affect interoperability. The interoperability certification process consists of four basic steps, which are:
• | Identify (interoperability) requirements; |
• | Develop certification approach (planning); |
• | Perform interoperability test and evaluation; and |
• | Report certifications and statuses. |
We submit and receive JITC certification for certain of our products through the Defense Information Systems Agency ("DISC"), which allows us to sell and implement our solutions at Federal government agencies. We currently certify a console, web, speech, mass notification, public safety answering point, call recording and campus 911 product with JITC. We have a roadmap to renew the existing certifications with new releases of existing products and to bring additional products to JITC to increase the products that can be sold into Federal agencies.
Information about Segment and Geographic Revenue
Information regarding segment and geographic revenue can be found in Note 13, "Segments and Geographic Information". No country other than the United States accounted for more than 10% of our total revenue, and we intend to focus our marketing and sales efforts on customers in the United States due to lower margins on sales abroad and low volume relative to the cost of maintaining an international sales team. Financial information regarding revenues from external customers and measure of profit and/or loss for the years ended December 31, 2016, 2015 and 2014, and our total assets as of December 31, 2016 and 2015, is included in our Consolidated Financial Statements.
Available Information
We make available on our website at http://www.spok.com, free of charge, our annual reports on Form 10-K, quarterly reports on Form 10-Q, current reports on Form 8-K and all amendments to those reports as soon as reasonably practicable after such reports are electronically filed with, or furnished to, the United States Securities and Exchange Commission ("SEC"). The public may read and copy any materials we file with the SEC at the SEC’s Public Reference Room at 100 F Street, NE, Washington, DC 20549. The public may obtain information on the operation of the Public Reference Room by calling the SEC at 1-800-SEC-0330. The SEC also maintains an Internet site that contains reports, proxy and information statements, and other information regarding issuers that file electronically with the SEC at http://www.sec.gov. We also make available on our website, and in print, if any stockholder or other person so requests, our code of business conduct and ethics entitled “Code of Ethics” which is applicable to all employees and directors, our “Corporate Governance Guidelines” and the charters for all committees of our Board of Directors, including Audit, Compensation and Corporate Governance and Nominating. Any changes to our Code of Ethics or waiver, if any, of our Code of Ethics for executive officers or directors will be posted on that website.
12
ITEM 1A. RISK FACTORS
The following important factors, among others, could cause our actual operating results to differ materially from those indicated or suggested by forward-looking statements made in this 2016 Form 10-K or presented elsewhere by management from time to time.
The rate of wireless subscriber and revenue erosion could exceed our ability to reduce operating expenses in order to maintain overall positive operating cash flow.
Our wireless revenue is dependent on the number of subscribers that use our paging devices. There is intense competition for these subscribers from other paging service providers and alternate wireless communications providers such as mobile phone and mobile data service providers. In addition to competition, our customer base may be impacted by the introduction of new technologies. As mobile communications technology evolves, competitors that provide wireless broadband data services may lower their prices to customers that approach, meet or undercut our prices for paging services. We are unable to predict how customer perceptions of the value of our wireless services will be impacted by the development of new wireless technologies.
We expect our subscriber numbers, units in service and revenue will continue to decline into the foreseeable future. As this revenue erosion continues, maintaining positive cash flow is dependent on substantial and timely reductions in selected operating expenses. Reductions in operating expenses require both the reduction of internal costs and negotiation of lower costs from outside vendors. As we require fewer services and products from our vendors, our negotiating leverage to lower our costs is diminished. There can be no assurance that we will be able to reduce our operating expenses commensurate with the level of revenue erosion. The inability to reduce operating expenses would have a material adverse impact on our business, financial condition and statement of income including our continued ability to remain profitable, produce positive operating cash flow, continue our research and development investment in our Spok Care Connect platform, pay cash dividends to stockholders, and repurchase shares of our common stock.
We may be unable to effectively develop, introduce and deploy our integrated communications platform, Spok Care Connect, which is the basis for our future growth.
Our future revenue growth depends on our ability to develop, introduce and effectively deploy our integrated communications suite. This multi-year effort will require the coordination of multiple development teams dedicated to this task. Simultaneously with this new development effort, we must continue to improve and support our existing suite of products to transition to the integrated critical communications suite. We foresee the following risks inherent in our research and product development efforts:
• | Requirements Definition - Our plans for an integrated communications suite may not meet the market's needs or customer expectations and could result in low market demand and/or acceptance. |
• | Product Scope and Schedule - We may fail to manage the scope of our software development activities effectively, resulting in delays to meet key milestones, achieve network solutions on a fully integrated basis, or solve coding problems in a timely and efficient manner. In addition, the continuing software development efforts on our existing products could distract management time and focus on developing our integrated communications platform. |
• | Staffing and Organization - The development of the integrated communications suite requires the hiring of new staff. We may be unable to attract, in a timely manner, the qualified staff to meet our requirements. The organizational changes and new hires necessary to address our development requirements could create attrition risk for our current staff. |
• | Operational Readiness - While the development of the integrated communications suite could occur as we have planned, we may not be prepared or ready to sell, deliver and support the new platform technology. |
Technical problems and higher costs may affect our product development initiatives.
Our future software revenue growth depends on our ability to develop, introduce and effectively deploy new solutions and features to our existing software solutions. These new features and functionalities are designed to address both existing and new customer requirements. We may experience technical problems and additional costs as these new features are tested and deployed. Failure to effectively develop new or improved software solutions could adversely impact software revenue growth and could have a material adverse effect on our operations, financial condition and statement of income including our continued ability to remain profitable, produce positive operating cash flow, pay cash dividends to stockholders, and repurchase shares of our common stock.
13
If we are unable to retain key management personnel, we might not be able to find suitable replacements in a timely basis, or at all, and our business could be disrupted.
Our success is largely dependent upon the continued service of key personnel, including our Chief Executive Officer, senior management team and other highly skilled personnel, particularly in product development, product strategy and sales. We believe that there is, and will continue to be, intense competition for qualified personnel in the telecommunication and software industries, and there is no assurance that we will be able to attract and retain the personnel necessary for the management and development of our business. Turnover, particularly among senior management, can also create distractions as we search for replacement personnel, which could result in significant recruiting, relocation, training and other costs, and can cause operational inefficiencies as replacement personnel become familiar with our business and operations. In addition, manpower in certain areas may be constrained, which could lead to disruptions over time. The elimination or reconfiguration of employee responsibilities could impact retention decisions by key executives and personnel.
In order to grow our software revenue and bookings and maintain our wireless revenue and subscribers we are dependent on our ability to effectively manage our employee base in sales and marketing to achieve our sales productivity goals.
Growth in our software revenue and bookings and maintenance of our wireless revenue and subscriber base is dependent on the productivity of our sales organization. From time to time it may be necessary to reorient our sales representatives to focus on specific market segments, product lines or new software solutions or to remove underperforming individuals which may require additional resources to maintain productivity. The impact of these changes could adversely impact our ability to achieve our sales productivity goals. We have also identified the following risks that could impact our sales productivity:
• | Customer Dissatisfaction and Spok's Reputation - We may experience customer dissatisfaction with our solutions that could result in lost opportunities for sales. Potential low ratings of our solutions may negatively impact our perception by future prospects. In addition, fewer references for our solutions could impact our ability to prospect new sales. |
• | Training - Training of our marketing and sales personnel as to the clinical requirements of our healthcare customers and the complexity of our service offerings, takes time and requires a substantial, continuing investment in new hires as well as long term employees. |
• | Competitive Speed - Sales productivity can be impacted by the capabilities of our competitors. There is a risk that competitors can innovate or partner faster than we do to deliver a unified communications platform. |
• | Employee Retention - The impact of the elements noted above can challenge the ability of employees to make sales. This is tough on morale and can affect employee retention. |
We may experience a long sales cycle for our software products.
Our software revenue growth results from a long sales cycle that from initial contact to final sales order may take six to 18 months depending on the type of software solution. Our software sales and marketing efforts involve educating our customers on the technical capabilities of our software solutions and the potential benefits from the deployment of our software, as well as educating ourselves as to the clinical needs of our customers. The inherent unpredictability of decision making resulting from customer budget constraints, multiple approvals and administrative issues may result in fluctuating bookings and revenue from month to month, quarter to quarter and year to year. Our bookings and corresponding revenue are dependent on actions that have occurred in the past. Each month we need to spend substantial time, effort, and expense on our marketing and sales efforts that may not result in future revenue.
Service to our customers could be adversely impacted by network rationalization.
We have an active program to consolidate the number of networks and related transmitter locations, which is referred to as network rationalization. Network rationalization is necessary to match our technical infrastructure to our smaller subscriber base and to reduce both site rent and telecommunication costs. The implementation of the network rationalization program could adversely impact service to our existing subscribers despite our efforts to minimize the impact on subscribers. This adverse impact could increase the rate of gross subscriber cancellations and/or the level of wireless revenue erosion. Adverse changes in gross subscriber cancellations and/or revenue erosion could have a material adverse effect on our business, financial condition and results of operations.
We may be unable to find vendors able to supply us with paging equipment based on future demands.
We purchase paging equipment from third party vendors. This equipment is sold or leased to customers in order to provide wireless messaging services. The reduction in industry demand for paging equipment has caused various suppliers to cease manufacturing this equipment. There can be no assurance that we can continue to find vendors to supply paging equipment, or that the vendors will supply equipment at costs that allow us to remain a competitive alternative in the wireless messaging industry. A lack of paging equipment could impact our ability to provide certain wireless messaging services and could have a material adverse effect on our business, leading to further wireless revenue erosion.
14
We may be unable to maintain successful relationship with our channel partners.
We use channel partners such as resellers, consulting firms, original equipment manufacturers, and technology partners to license and support our products. Contract defaults by any of these channel partners or the loss of our relationships with them may materially adversely affect our ability to develop, market, sell, or support our communication solution offerings.
We may be unable to realize the benefits associated with our deferred income tax assets.
We have significant deferred income tax assets that are available to offset future taxable income and increase cash flows from operations. The use of these deferred income tax assets is dependent on the availability of taxable income in future periods. The availability of future taxable income is dependent on our ability to profitably manage our operations to support a growing base of software revenue offset by declining wireless subscribers and revenue. To the extent that anticipated reductions in operating expenses do not occur or sufficient revenue is not generated, we may not achieve sufficient taxable income to allow for use of our deferred income tax assets. The accounting for deferred income tax assets is based upon an estimate of future results, and the valuation allowance may be increased or decreased as conditions change or if we are unable to implement certain tax planning strategies. If we are unable to use these deferred income tax assets, our financial condition and statement of income may be materially affected. In addition, a significant portion of our deferred income tax assets relate to net operating losses. If our ability to utilize these losses is limited, due to Internal Revenue Code (“IRC”) Section 382, our financial condition and statement of income may be materially affected.
Our wireless products are regulated by the FCC and, to a lesser extent, state and local regulatory authorities. Changes in regulation could result in increased costs to us and our customers.
We are subject to regulation by the FCC and, to a lesser extent, by state and local authorities. Changes in regulatory policy could increase the fees we must pay to the government or to third parties, and could subject us to more stringent requirements that could cause us to incur additional capital and/or operating costs. To the extent additional regulatory costs are passed along to customers, those increased costs could adversely impact subscriber cancellations.
For example, the FCC issued an order in October 2007 that mandated paging carriers (including the Company) along with all other CMRS providers serving a defined minimum number of subscribers to maintain an emergency back-up power supply at all cell sites to enable operation for a minimum of eight hours in the event of a loss of commercial power (the “Back-up Power Order”). Ultimately, after a hearing by the DC Circuit Court and disapproval by the Office of Management and Budget (the “OMB”) of the information collection requirements of the Back-Up Power Order, the FCC indicated that it would not seek to override the OMB’s disapproval. Rather the FCC indicated that it would issue a Notice of Proposed Rulemaking with the goal of adopting revised back-up power rules. To date, there has been no Notice of Proposed Rulemaking by the FCC and we are unable to predict what impact, if any, a revised back-up power rule could have on our operations, cash flows, ability to continue payment of cash dividends to stockholders, and ability to repurchase shares of our common stock.
As a further example, the FCC continues to consider changes to the rules governing the collection of universal service fees. The FCC is evaluating a flat monthly charge per assigned telephone number as opposed to assessing universal service contributions based on telecommunication carriers’ interstate revenue. There is no timetable for any rulemaking to implement this numbers-based methodology. If the FCC adopts a numbers-based methodology, our attempt to recover the increased contribution costs from our customers could significantly diminish demand for our services, and our failure to recover such increased contribution costs could have a material adverse impact on our business, financial condition and results of operations.
Certain of our software products are regulated by the FDA. The application of or changes in regulations could impact our ability to market new or revised software products to our customers.
Certain of our software products are regulated by the FDA as medical devices. The classification of our software products as medical devices means that we are required to comply with certain registration and listing, labeling, medical device reporting, removal and correction, and good manufacturing practice requirements. Updates to these products or the development of new products could require us to seek clearance from the FDA before we are permitted to market or sell these software products. In addition, changes to FDA regulations could impact existing software products or updates to existing products. The impact of delays in FDA clearance or changes to FDA regulations could impact our ability to market or sell our software products and could have a material adverse effect on our software sales, financial condition and results of operations, including our continued ability to remain profitable, produce positive operating cash flow, pay cash dividends to stockholders and repurchase shares of our common stock.
15
We have investigated potential acquisitions and may not be able to identify an opportunity at favorable terms or have the ability to close on financing necessary to consummate the transaction.
We cannot provide any assurances that we will be successful in finding such acquisitions or consummating future acquisitions on favorable terms. We anticipate that our acquisitions will be financed through a combination of methods, including but not limited to the use of available cash on hand, and, if necessary, borrowings from third party financial institutions. Disruptions in credit markets and an unwillingness to lend may limit our ability to finance acquisitions.
We have investigated potential acquisitions and may be unable to successfully integrate such acquisitions into our business and may not achieve all or any of the operating synergies or anticipated benefits of those acquisitions.
We continue to evaluate acquisitions of other businesses where we believe such acquisitions will yield increased cash flows, improved market penetration and/or identified operating efficiencies and synergies. We may face various challenges with our integration efforts, including the combination and simplification of product and service offerings, sales and marketing approaches and establishment of combined operations. Although acquired businesses may have significant operating histories, we may have limited or no history of owning and operating these businesses. If we were to acquire these businesses, there can be no assurance that:
• | such businesses will perform as expected; |
• | such businesses will not incur unforeseen obligations or liabilities; |
• | such businesses will generate sufficient cash flow to support the indebtedness, if incurred, to acquire them or the expenditures needed to develop them; and/or |
• | the rate of return from such businesses will justify the decision to invest the capital to acquire them. |
We may experience litigation claiming intellectual property infringement by us, and we may not be able to protect our rights in intellectual property that we own and develop.
Intellectual property infringement litigation has become commonplace, particularly in the wireless and software industries in which we operate. This litigation can be protracted, expensive, and time consuming. There is no assurance that we will remain immune to this type of predatory litigation. Any such claims, whether meritorious or not, could be time consuming and costly in terms of both resources and management time.
Third parties may claim we infringe their intellectual property rights. We may receive claims that we have infringed the intellectual property rights of others, including claims regarding patents, copyrights, and trademarks. The number of these claims may grow as a result of constant technological change in the segments in which our software products compete, the extensive patent coverage of existing technologies, and the rapid rate of issuance of new patents.
Our patents, trademarks, copyrights and trade secrets relating to our wireless services and networks, and our software solutions, are important assets. The efforts we undertake to protect our proprietary rights may not be sufficient or effective. Any significant impairment to our intellectual property rights could harm our business and our ability to compete effectively. Protecting our intellectual property rights can be costly and time consuming.
We seek to maintain certain of our intellectual property rights as trade secrets, including the source code for many of our software solutions and innovations. Our source code and system architecture may be reverse engineered by our competitors, or the secrecy of our solutions and designs could be compromised through a security breach or otherwise, or by our employees or former employees, intentionally or accidentally. Any compromise of our trade secrets could cause us to lose any competitive advantage our software solutions have and the investment we have made in developing our products and services.
Our portfolio of issued patents and copyrights may be insufficient to defend ourselves against intellectual property infringement claims, and the validity and scope of our patents could be challenged by third parties were we to seek to enforce them.
16
We may encounter issues with privacy and security of personal information.
A substantial portion of our revenue comes from healthcare customers. Our software solutions may handle or have access to personal health information subject in the United States to HIPAA, HITECH and related regulations as well as legislation and regulations in foreign countries. These statutes and related regulations impose numerous requirements regarding the use and disclosure of personal health information with which we and our software solutions must comply. Our failure to accurately anticipate or interpret these complex and technical laws and regulations could subject us to civil and/or criminal liability. Such failure could adversely impact our ability to market and sell our software solutions to healthcare customers, and have a material adverse impact on our software sales.
In addition, customers may use our wireless services to transmit patient health information subject to HIPAA and other regulatory requirements. While we offer encrypted pagers to our customers, many customers use pager devices provided by us that do not encrypt text messages. While we disclaim liability for customer non-compliance with HIPAA and other privacy requirements, there remains some risk we could be held responsible for privacy violations by our customers.
System disruptions and security threats to our computer networks, satellite control or telecommunications systems could have a material adverse effect on our business.
The performance and reliability of our computer network and telecommunications systems infrastructure is critical to our operations. Any computer system or satellite network error or failure, regardless of cause, could result in a substantial outage that materially disrupts our operations. In addition, we face the threat to our computer systems of unauthorized access, computer hackers, computer viruses, malicious code, organized cyber-attacks and other security problems and system disruptions.
Our satellite network connections for our wireless services depend upon VSAT terminals, many of which are based on decades-old technology or equipment that could fail resulting in a loss of service to our customers. With respect to our Enterprise Reporting and Management systems and data storage we rely on third party data centers and services with whom we are dependent for maintaining accessibility, reliability and uninterrupted connectivity.
Our computer systems may be vulnerable to these threats. A user who circumvents security measures could misappropriate proprietary information or cause interruptions or malfunctions in our operations. We utilize a costly, multilayered security framework including detailed security policies and procedures, security appliances and software, third party vulnerability testing and detailed Business Continuity Plans that could be disrupted at any time.
However, we may be required to expend significant resources to protect against the threat of these system disruptions and security breaches or to alleviate problems caused by these disruptions and breaches.
General economic conditions that are largely out of our control may adversely affect our financial condition and statement of income.
Our business is sensitive to changes in general economic conditions, both in the United States and foreign markets. Recessionary economic cycles, higher interest rates, inflation, higher levels of unemployment, higher tax rates and other changes in tax laws, or other economic factors that may affect business spending or buying habits could adversely affect the demand for our services. This adverse impact could increase the rate of gross subscriber cancellations and/or the level of revenue erosion.
A significant portion of our revenue is derived from healthcare customers and we are impacted by changes in the healthcare economic environment. The healthcare industry is highly regulated and is subject to changing political, legislative, regulatory, and other economic developments. These developments can have a dramatic effect on the decision-making and the spending by our customers for information technology and software. This economic uncertainty can add to the unpredictability of decision-making and lengthen our sales cycle.
Further, the consequences of the implementation of changes to healthcare reform legislation continue to impact both the economy in general and the healthcare market in particular. The uncertainty created by possibility of changes to the legislation is impacting customer decision making and information technology plans in our key healthcare market. We are unable to predict the full consequences of this uncertainty on our operations. Adverse changes in the economic environment could adversely impact our ability to market and sell our wireless and software solutions to healthcare customers.
ITEM 1B. UNRESOLVED STAFF COMMENTS
We had no unresolved SEC staff comments as of March 2, 2017.
17
ITEM 2. PROPERTIES
Our corporate headquarters is located in Springfield, Virginia, and consists of approximately 18,000 square feet of space under a lease that expires on March 31, 2018. At December 31, 2016, we leased facility space, including our executive headquarters, sales offices, technical facilities, warehouse and storage facilities in 72 locations in 30 states in the United States, one facility in Australia and one facility in the Middle East. The total leased space is approximately 160,000 square feet. At December 31, 2016, we owned three small parcels of land in three states in the United States.
At December 31, 2016, we leased transmitter sites on commercial broadcast towers, buildings and other fixed structures in approximately 3,380 locations throughout the United States. These leases are for our active transmitters and are for various terms and provide for periodic lease payments at various rates.
At December 31, 2016, we had 4,159 active transmitters on leased sites which provide service to our customers (of which 2,234 are located at customer sites).
ITEM 3. LEGAL PROCEEDINGS
We are involved, from time to time, in lawsuits arising in the normal course of business. We believe these pending lawsuits will not have a material adverse impact on our financial condition or statement of income.
On January 23, 2017, 911 Notify, Inc. filed a lawsuit against us in the United States District Court for the Eastern District of Texas alleging infringement of U.S. Patent Nos. 6,151,385; 6,775,356; and 8,965,447 pertaining to our software solution for notification of 911 emergency calls. We have settled this lawsuit for an immaterial amount.
ITEM 4. MINE SAFETY DISCLOSURES
Not applicable.
18
PART II
ITEM 5. MARKET FOR REGISTRANT’S COMMON EQUITY, RELATED STOCKHOLDER MATTERS AND ISSUER PURCHASES OF EQUITY SECURITIES
Market Information
Our sole class of common equity is our $0.0001 par value common stock, which is listed on the NASDAQ National Market® and is traded under the symbol “SPOK.”
The following table sets forth the high and low sales prices per share of our common stock, based on the last daily sale, for the periods indicated, which correspond to our quarterly fiscal periods for financial reporting purposes. Prices for our common stock are as reported on the NASDAQ National Market® from January 1, 2015 through December 31, 2016.
2016 | 2015 | ||||||||||||||
For the Three Months Ended | High | Low | High | Low | |||||||||||
March 31, | $ | 18.01 | $ | 15.85 | $ | 20.20 | $ | 16.85 | |||||||
June 30, | 19.29 | 16.17 | 21.04 | 16.18 | |||||||||||
September 30, | 20.56 | 16.34 | 17.63 | 15.46 | |||||||||||
December 31, | 21.30 | 16.40 | 18.95 | 15.92 | |||||||||||
Holders of Common Stock
As of February 24, 2017, there were 3,314 holders of record of our common stock.
Dividends
The Company declared dividends totaling $15.8 million and $13.5 million during 2016 and 2015, respectively, and expects to pay dividends of $0.125 per common share each quarter, subject to declaration by the Board of Directors, in 2017. Cash dividends declared for the years ended December 31, 2016 and 2015, respectively, include dividends related to unvested restricted stock units (“RSUs”) and shares of unvested restricted common stock (“restricted stock”) granted under the Spok Holdings, Inc. Equity Incentive Plan (“Equity Plan”) to executives and non-executive members of our Board of Directors. Cash distributions on RSUs and restricted stock are accrued and paid when the applicable vesting conditions are met. Accrued cash distributions on forfeited RSUs and restricted stock are also forfeited.
19
The following table details information on our dividends declared and cash distributions since the formation of the Company through the year ended December 31, 2016:
Year | Dividends Declared Per Share Amount | Total Payment(1) | |||||
(Dollars in thousands) | |||||||
2005 | $ | 1.500 | $ | 40,691 | |||
2006(2) | 3.650 | 98,904 | |||||
2007(3) | 3.600 | 98,250 | |||||
2008(4) | 1.400 | 39,061 | |||||
2009(3) | 2.000 | 45,502 | |||||
2010(3) | 2.000 | 44,234 | |||||
2011 | 1.000 | 22,121 | |||||
2012(5) | 0.750 | 16,512 | |||||
2013 | 0.500 | 12,312 | |||||
2014 | 0.500 | 10,826 | |||||
2015(6) | 0.625 | 13,333 | |||||
2016(7) | 0.750 | 10,287 | |||||
Total | $ | 18.275 | $ | 452,033 | |||
(1) | The total payment reflects the cash distributions paid in relation to common stock, vested RSUs and vested shares of restricted stock. |
(2) | On August 8, 2006, we announced the adoption of a regular quarterly cash distribution of $0.65 per share of common stock. |
(3) | The cash distribution includes an additional special one-time cash distribution to stockholders of $1.00 per share of common stock. |
(4) | On May 2, 2008, our Board of Directors reset the quarterly cash distribution rate to $0.25 per share of common stock from $0.65 per share of common stock. |
(5) | On July 30, 2012, our Board of Directors reset the quarterly cash distribution rate to $0.125 per share of common stock from $0.25 per share of common stock. |
(6) | The cash distribution includes an additional special one-time cash distribution to stockholders of $0.125 per share of common stock. |
(7) | The per share amount includes a special one-time dividend of $0.25 per share of common stock declared in 2016 but payable to stockholders in 2017. |
On March 1, 2017, our Board of Directors declared a regular quarterly cash dividend of $0.125 per share of common stock, with a record date of March 17, 2017, and a payment date of March 30, 2017. This cash dividend of approximately $2.6 million is expected to be paid from available cash on hand.
20
Performance Graph
We began trading on the NASDAQ National Market® on November 17, 2004. The chart below compares the relative changes in the cumulative total return of our common stock for the period December 31, 2011 to December 31, 2016, against the cumulative total return of the NASDAQ Composite Index®, the NASDAQ Telecommunications Index® and the S&P Health Care Technology Index for the same period.
The chart below assumes that on December 31, 2011, $100 was invested in our common stock and in each of the indices. The comparisons assume that all cash distributions were reinvested. The chart indicates the dollar value of each hypothetical $100 investment based on the closing price as of the last trading day of each fiscal year from December 31, 2011 to December 31, 2016.
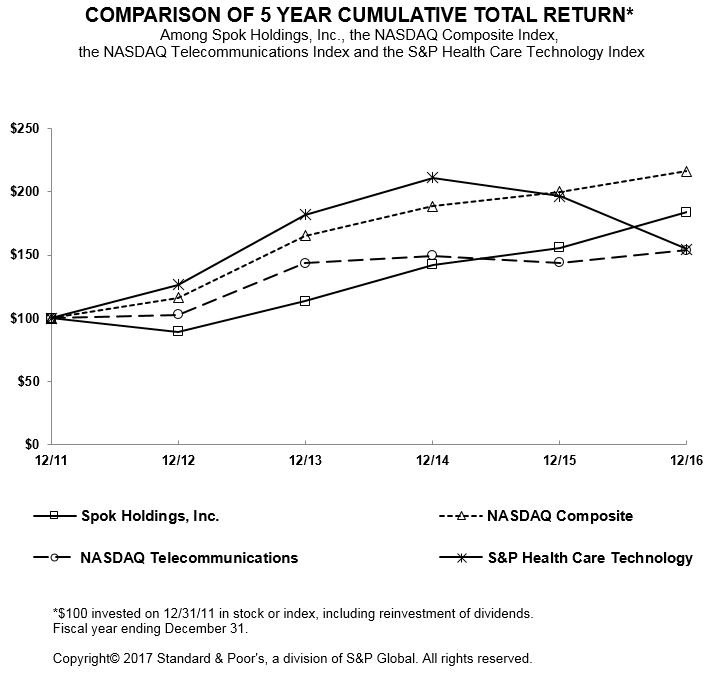
December 31, | |||||||||||||||||||||||
2011 | 2012 | 2013 | 2014 | 2015 | 2016 | ||||||||||||||||||
Spok Holdings, Inc. | $ | 100.00 | $ | 89.46 | $ | 113.44 | $ | 142.50 | $ | 155.87 | $ | 184.09 | |||||||||||
NASDAQ Composite Index | 100.00 | 116.41 | 165.47 | 188.69 | 200.32 | 216.54 | |||||||||||||||||
NASDAQ Telecommunications Index | 100.00 | 102.78 | 143.40 | 149.42 | 144.02 | 153.88 | |||||||||||||||||
S&P Health Care Technology Index | 100.00 | 126.76 | 182.01 | 211.13 | 196.47 | 154.68 | |||||||||||||||||
21
Purchases of Equity Securities by the Issuer and Affiliated Purchasers
The following table presents information with respect to common stock repurchased by us during the year ended December 31, 2016.
Period | Total Number of Shares Purchased | Average Price Paid Per Share(1) | Total Number of Shares Purchased as Part of Publicly Announced Plans or Programs | Approximate Dollar Value of Shares That May Yet Be Purchased Under the Publicly Announced Plans or Programs | |||||||||
(Dollars in thousands) | |||||||||||||
Beginning Balance as of January 1, 2016 | $ | 10,000 | |||||||||||
January 1 through January 31, 2016 | 152,198 | $ | 16.53 | 152,198 | 7,484 | ||||||||
February 1 through February 29, 2016 | 101,736 | $ | 17.24 | 101,736 | 5,730 | ||||||||
March 1 through March 31, 2016 | 37,927 | $ | 16.44 | 37,927 | 5,106 | ||||||||
April 1 through April 30, 2016 | 31,468 | $ | 16.40 | 31,468 | 4,590 | ||||||||
May 1 through May 30, 2016 | 34,323 | $ | 16.37 | 34,323 | 4,028 | ||||||||
June 1, through June 30, 2016 | — | $ | — | — | 4,028 | ||||||||
July 1, through July 31, 2016 | — | $ | — | — | 4,028 | ||||||||
August 1, through August 31, 2016 | 3,800 | $ | 16.44 | 3,800 | 3,966 | ||||||||
September 1, through September 30, 2016 | 10,084 | $ | 16.46 | 10,084 | 3,800 | ||||||||
October 1 through October 31, 2016 | — | $ | — | — | 3,800 | ||||||||
November 1 through November 30, 2016 | 16,719 | $ | 16.43 | 16,719 | 3,525 | ||||||||
December 1 through December 31, 2016 | — | $ | — | — | 3,525 | ||||||||
Total | 388,255 | $ | 16.67 | 388,255 | |||||||||
(1) Average price paid per share excludes commissions of approximately $15,410.
Repurchased shares of our common stock were accounted for as a reduction to common stock and additional paid-in-capital in the period in which the repurchase occurred. From the inception of the share repurchase program in August 2008 through December 31, 2016, we have repurchased a total of 7,817,708 shares of our common stock for approximately $85.5 million (excluding commissions). The Company's Board of Directors did not reset the repurchase authority under the share repurchase program for 2017 and the previous authority expired on December 31, 2016.
Transfer Restrictions on Common Stock
In order to reduce the possibility that certain changes in ownership could impose limitations on the use of our deferred income tax assets, our Amended and Restated Certificate of Incorporation contains provisions that generally restrict transfers by or to any 5% stockholder of our common stock or any transfer that would cause a person or group of persons to become a 5% stockholder of our common stock. After a cumulative indirect shift in ownership of more than 45% since our emergence from bankruptcy proceedings in May 2002 through a transfer of our common stock, any transfer of our common stock by or to a 5% stockholder of our common stock or any transfer that would cause a person or group of persons to become a 5% stockholder of such common stock, will be prohibited unless the transferee or transferor provides notice of the transfer to us and our Board of Directors determines in good faith that the transfer would not result in a cumulative indirect shift in ownership of more than 47%.
Prior to a cumulative indirect ownership change of more than 45%, transfers of our common stock will not be prohibited, except to the extent that they result in a cumulative indirect shift in ownership of more than 47%, but any transfer by or to a 5% stockholder of our common stock or any transfer that would cause a person or group of persons to become a 5% stockholder of our common stock requires notice to us. Similar restrictions apply to the issuance or transfer of an option to purchase our common stock, if the exercise of the option would result in a transfer that would be prohibited pursuant to the restrictions described above. These restrictions will remain in effect until the earliest of (1) the repeal of IRC Section 382 (or any comparable successor provision) and (2) the date on which the limitation amount imposed by IRC Section 382 in the event of an ownership change would not be less than the tax attributes subject to these limitations. Transfers by or to us and any transfer pursuant to a merger approved by our Board of Directors or any tender offer to acquire all of our outstanding stock where a majority of the shares have been tendered will be exempt from these restrictions.
Based on publicly available information and after considering any direct knowledge we may have, our combined cumulative change in ownership was an insignificant amount as of December 31, 2016 and 2015.
22
ITEM 6. SELECTED FINANCIAL DATA
The following selected consolidated financial data should be read in conjunction with “Item 7. Management’s Discussion and Analysis of Financial Condition and Statement of Income” (“MD&A”), the consolidated financial statements and notes thereto, and other financial information appearing elsewhere in this 2016 Form 10-K. The amounts below related to basic and diluted net income per common share have been revised for all periods presented. Additionally, data presented for the year ended December 31, 2015 reflects an increase of $4.0 million to income tax expense and a corresponding adjustment to net income as well as a $4.0 million reduction to deferred income tax assets and a corresponding adjustment to retained earnings related to the correction of an immaterial misstatement. For more information on these changes, refer to Note 1 "Organization and Significant Accounting Policies" of the Consolidated Financial Statements for additional information.
For the Year Ended December 31, | |||||||||||||||||||
2016 | 2015 | 2014 | 2013 | 2012 | |||||||||||||||
(Dollars in thousands except per share amounts) | |||||||||||||||||||
Statements of Income Data: | |||||||||||||||||||
Revenues | $ | 179,561 | $ | 189,628 | $ | 200,273 | $ | 209,752 | $ | 219,696 | |||||||||
Operating expenses | 157,408 | 164,528 | 172,122 | 164,258 | 173,968 | ||||||||||||||
Operating income | 22,153 | 25,100 | 28,151 | 45,494 | 45,728 | ||||||||||||||
Net income | 13,979 | 80,246 | 20,745 | 27,530 | 26,984 | ||||||||||||||
Basic and diluted net income per common share | 0.68 | 3.74 | 0.96 | 1.27 | 1.23 | ||||||||||||||
Cash dividends declared per common share | 0.75 | 0.625 | 0.50 | 0.50 | 0.75 | ||||||||||||||
December 31, | |||||||||||||||||||
2016 | 2015 | 2014 | 2013 | 2012 | |||||||||||||||
(Dollars in thousands) | |||||||||||||||||||
Balance Sheets Data: | |||||||||||||||||||
Current assets | $ | 155,862 | $ | 141,613 | $ | 142,761 | $ | 116,779 | $ | 95,909 | |||||||||
Total assets | 388,087 | 386,433 | 337,890 | 326,898 | 322,627 | ||||||||||||||
Long-term debt | — | — | — | — | — | ||||||||||||||
Long-term liabilities, excluding deferred revenue | 8,921 | 8,972 | 8,131 | 9,259 | 9,789 | ||||||||||||||
Stockholders’ equity | 322,087 | 329,564 | 279,059 | 269,950 | 251,419 | ||||||||||||||
ITEM 7. MANAGEMENT’S DISCUSSION AND ANALYSIS OF FINANCIAL CONDITION AND STATEMENT OF INCOME
The following discussion and analysis should be read in conjunction with our consolidated financial statements and related notes and the discussion under “Application of Critical Accounting Policies” (also under Item 7), which describes key estimates and assumptions we make in the preparation of our consolidated financial statements; the cautionary language that appears under the title "Forward Looking Statements" immediately following the Table of Contents;“Item 1. Business,” which describes our operations; and “Item 1A. Risk Factors,” which describes key risks associated with our operations and markets in which we operate. A reference to a “Note” in this section refers to the accompanying Notes to Consolidated Financial Statements.
Overview and Highlights
We are a comprehensive provider of critical communication solutions for enterprises. We offer a suite of unified critical communication solutions that include call center operations, clinical alerting and notifications, one-way and advanced two-way wireless messaging services, mobile communications and public safety response. Our customers rely on Spok for workflow improvement, secure texting, paging services, contact center optimization and public safety response. Our product offerings are capable of addressing a customer’s mission critical communications needs. We develop, sell and support enterprise-wide systems for healthcare and other organizations needing to automate, centralize and standardize their approach to critical communications. Our solutions can be found in prominent hospitals; large government agencies; leading public safety institutions, colleges and universities; large hotels, resorts and casinos; and well-known manufacturers. Our primary market has been the healthcare industry, particularly hospitals. We have identified hospitals with 200 or more beds as the primary targets for our software and wireless solutions.
23
Revenue generated by wireless messaging services (including voice mail, personalized greeting, message storage and retrieval) and equipment loss and/or maintenance protection to both one-way and two-way messaging subscribers is presented as wireless revenue in our statements of income. Revenue generated by the sale of our software solutions, which includes software license, professional services (installation, consulting and training), equipment procured by us from third parties (to be used in conjunction with our software) and post-contract support (on-going maintenance), is presented as software revenue in our statements of income. Our software is licensed to end users under an industry standard software license agreement.
The following tables present wireless and software revenue by key market segments for the periods stated and illustrate the relative significance of these market segments to our operations.
For the Year Ended December 31, 2016 | For the Year Ended December 31, 2015 | For the Year Ended December 31, 2014 | |||||||||||||||||||||||||||||||||||||||||||
Market Segment | Wireless | Software | Total | % of Total | Wireless | Software | Total | % of Total | Wireless | Software | Total | % of Total | |||||||||||||||||||||||||||||||||
(Dollars in thousands) | |||||||||||||||||||||||||||||||||||||||||||||
Healthcare | $ | 81,788 | $ | 44,406 | $ | 126,194 | 70.3 | % | $ | 85,148 | $ | 44,113 | $ | 129,261 | 68.2 | % | $ | 90,092 | $ | 42,117 | $ | 132,209 | 66.0 | % | |||||||||||||||||||||
Government | 6,867 | 7,286 | 14,153 | 7.9 | % | 7,993 | 9,348 | 17,341 | 9.1 | % | 9,426 | 11,217 | 20,643 | 10.3 | % | ||||||||||||||||||||||||||||||
Large Enterprise | 9,532 | 3,563 | 13,095 | 7.3 | % | 11,539 | 3,009 | 14,548 | 7.7 | % | 13,867 | 2,257 | 16,124 | 8.1 | % | ||||||||||||||||||||||||||||||
Other(1) | 11,403 | 14,716 | 26,119 | 14.5 | % | 14,334 | 14,144 | 28,478 | 15.0 | % | 19,017 | 12,280 | 31,297 | 15.6 | % | ||||||||||||||||||||||||||||||
Total | $ | 109,590 | $ | 69,971 | $ | 179,561 | 100.0 | % | $ | 119,014 | $ | 70,614 | $ | 189,628 | 100.0 | % | $ | 132,402 | $ | 67,871 | $ | 200,273 | 100.0 | % | |||||||||||||||||||||
(1) | Other includes hospitality, resort, indirect and billable travel revenue. |
2016 Highlights
Net sales declined by 5.3% or $10.1 million during 2016 compared to 2015, driven primarily by a continued and expected decline in wireless revenue while software revenue decreased slightly for the same period. Our operating expenses declined by 4.3% or $7.1 million during 2016 compared to 2015, driven primarily by reduction in all functional categories partially offset by an increase in research and development expenses attributable to our continued investment in the development of Spok Care Connect. We are committed to increasing our research and development spend throughout 2017 as we look to continue developing new products and services as well as enhancements for our current suite of solutions. We returned approximately $22.0 million of capital to our stockholders in the form of cash dividends and share repurchases which includes the special dividend declared in December 2016 but was paid in January 2017.
2015 Highlights
Net sales declined by 5.3% or $10.6 million during 2015 compared to 2014, driven primarily by a continued and expected decline in wireless revenue partially offset by solid growth in software maintenance revenue. Year-over-year paging unit erosion improved to a low of 6.6% during 2015 which was a decrease of 2.1% compared to 2014. Operating expenses declined by 4.4% or $7.6 million during 2015 compared to 2014, driven primarily by a reduction in general and administrative as well as lower depreciation, amortization and accretion costs. We reduced our deferred income tax asset valuation allowance by $64.2 million based on our analysis and expectation that these assets would now be realized in the future prior to expiration. We returned approximately $29.0 million of capital to our stockholders in the form of cash dividends and share repurchases.
Wireless Revenue
Our core offering includes subscriptions to one-way or two-way messaging services for a periodic (monthly, quarterly, semiannual, or annual) service fee. This is generally based upon the type of service provided, the geographic area covered, the number of devices provided to the customer and the period of commitment. A subscriber to one-way messaging services may select coverage on a local, regional or nationwide basis to best meet their messaging needs. Two-way messaging is generally offered on a nationwide basis. In addition, subscribers either contract for a messaging device from us for an additional fixed monthly fee or they own a device, having purchased it either from us or from another vendor. We also sell devices to resellers who lease or resell devices to their subscribers and then sell messaging services utilizing our networks. We offer ancillary services, such as voicemail and equipment loss or maintenance protection, which help increase the monthly recurring revenue we receive along with these traditional messaging services. In 2015 and 2016 we launched new and exclusive one-way (T5) and two-way (T52) alphanumeric pagers, respectively. Both pagers are configurable to support un-encrypted or encrypted operation. When configured for encryption, they utilize AES-128 bit encryption, screen locking and remote wipe capabilities. With encryption enabled these new secure paging devices enhance our service offerings to the healthcare community by adding Health Insurance Portability and Accountability Act ("HIPAA") security capabilities to the low cost, highly reliable and availability benefits of paging. (See Item 1. “Business” for more details.)
24
Software Revenue
Software revenue consists of two primary components: operations revenue and maintenance revenue. Operations revenue consists of license revenue, professional services revenue, and equipment revenue. Maintenance revenue is for ongoing support of a software application or equipment (typically for one year). We recognize equipment revenue when it is shipped or delivered to the customer depending on the delivery method of Free on Board ("FOB") shipping or FOB destination, respectively. License, professional services and maintenance revenue is recognized ratably over the longer of the period of professional services delivery to the customer or the contractual term of the maintenance agreement. If the period of delivery to the customer is not known, license and professional services revenue will be recognized when software and professional services are fully delivered to the customer and the maintenance revenue will be recognized ratably over the remaining contractual term of the agreement.
Operations - Consolidated
Our operating expenses are presented in functional categories. Certain of our functional categories are especially important to overall expense control and management. These operating expenses are categorized as follows:
• | Cost of revenue. These are expenses primarily for hardware, third-party software, outside service expenses and payroll and related expenses for our professional services, logistics, customer support and maintenance staff. |
• | Research and Development. These expenses relate primarily to the development of new software products and the ongoing maintenance and enhancement of existing products. This classification consists primarily of employee payroll and related expenses, outside services related to the design, development, testing and enhancement of our solutions and to a lesser extent hardware equipment. |
• | Service, rental and maintenance. These are expenses associated with the operation of our paging networks. Expenses consist largely of site rent expenses for transmitter locations, telecommunication expenses to deliver messages over our paging networks, and payroll and related expenses for our engineering and pager repair functions. |
• | Selling and marketing. The sales and marketing staff are involved in selling our communication solutions primarily in the United States. These expenses support our efforts to maintain gross placements of units in service, which mitigated the impact of disconnects on our wireless revenue base, and to identify business opportunities for additional or future software sales. We have a centralized marketing function, which is focused on supporting our products and vertical sales efforts by strengthening our brand, generating sales leads and facilitating the sales process. These marketing functions are accomplished through targeted email campaigns, webinars, regional and national user conferences, monthly newsletters and participation at industry trade shows. Expenses consist largely of payroll and related expenses, commissions and other costs such as travel and advertising costs. |
• | General and administrative. These are expenses associated with information technology and administrative functions. This classification consists primarily of payroll and related expenses, outside service expenses, taxes, licenses and permit expenses, and facility rent expenses. |
We review the percentages of these operating expenses to revenue on a regular basis. Even though the operating expenses are classified as described above, expense control and management are also performed by expense category. Approximately 65.6%, 62.5% and 60.6% of the operating expenses referred to above were incurred in payroll and related expenses, site and facility rent expenses and telecommunication expenses for each the years ended December 31, 2016, 2015 and 2014.
Our largest expense, payroll and related expenses, includes wages, commissions, incentives, employee benefits and related taxes. On a monthly basis, we review the number of employees in major functional categories and the design and physical locations of functional groups to continuously improve efficiency, to simplify organizational structures, and to minimize the number of physical locations for the Company. We had 587 full-time equivalent employees (“FTEs”) at December 31, 2016, a decrease of 2.2% from 600 FTEs at December 31, 2015. We very recently announced plans to hire up to 60 new employees over the next 18 to 24 months, with the majority of new hires to occur during 2017. Nearly all of the new hires will be working in software development and supporting areas for our planned integrated communications platform, Spok Care Connect.
We operate local, regional, and nationwide one-way and two-way paging networks. These networks each require locations on which to place transmitters, receivers, and antennae. Site rent expenses for transmitter locations are highly dependent on the number of transmitters, which in turn is dependent on the number of networks. In addition, these expenses generally do not vary directly with the number of subscribers or units in service, which is detrimental to our operating margins as revenue declines. In order to reduce these expenses, we have an active program to consolidate the number of paging networks, and thus transmitter locations, which we refer to as network rationalization. We have reduced the number of active transmitters by 2.0% to 4,159 active transmitters at December 31, 2016 from 4,243 active transmitters at December 31, 2015.
25
Telecommunication expenses are incurred to interconnect our paging networks and to provide telephone numbers for customer use, points of contact for customer service, and connectivity among our offices. These expenses are dependent on the number of units in service, the number of customers we support and the number of office and network locations that we maintain. However, the number or duration of telephone calls to call centers may vary from period to period based on factors other than the number of units in service or customers, which could cause telecommunication expenses to vary.
Statements of Income
Comparison of Statement of Income Elements for the Years Ended December 31, 2016, 2015 and 2014
(Dollars in thousands) | 2016 | Change | 2015 | Change | 2014 | ||||||||||||||||||||
Revenues: | |||||||||||||||||||||||||
Wireless | $ | 109,590 | (9,424 | ) | (7.9 | )% | $ | 119,014 | $ | (13,388 | ) | (10.1 | )% | $ | 132,402 | ||||||||||
Software | 69,971 | (643 | ) | (0.9 | )% | 70,614 | 2,743 | 4.0 | % | 67,871 | |||||||||||||||
Total | $ | 179,561 | $ | (10,067 | ) | (5.3 | )% | $ | 189,628 | $ | (10,645 | ) | (5.3 | )% | $ | 200,273 | |||||||||
Selected operating expenses: | |||||||||||||||||||||||||
Cost of revenue | $ | 30,649 | $ | (3,202 | ) | (9.5 | )% | $ | 33,851 | $ | 1,295 | 4.0 | % | $ | 32,556 | ||||||||||
Research and development | 13,467 | 3,187 | 31.0 | % | 10,280 | 779 | 8.2 | % | 9,501 | ||||||||||||||||
Service, rental and maintenance | 32,734 | (1,387 | ) | (4.1 | )% | 34,121 | (1,863 | ) | (5.2 | )% | 35,984 | ||||||||||||||
Selling and marketing | 24,768 | (2,678 | ) | (9.8 | )% | 27,446 | (2,567 | ) | (8.6 | )% | 30,013 | ||||||||||||||
General and administrative | 41,381 | (778 | ) | (1.8 | )% | 42,159 | (3,737 | ) | (8.1 | )% | 45,896 | ||||||||||||||
Severance | 1,446 | (1,255 | ) | (46.5 | )% | 2,701 | 1,206 | 80.7 | % | 1,495 | |||||||||||||||
Total | $ | 144,445 | $ | (6,113 | ) | (4.1 | )% | $ | 150,558 | $ | (4,887 | ) | (3.1 | )% | $ | 155,445 | |||||||||
FTEs | 587 | (13 | ) | (2.2 | )% | 600 | 13 | 2.2 | % | 587 | |||||||||||||||
Active transmitters | 4,159 | (84 | ) | (2.0 | )% | 4,243 | (96 | ) | (2.2 | )% | 4,339 | ||||||||||||||
Revenue — Wireless
The table below details total wireless revenue for the periods stated:
Revenue - wireless | 2016 | Change | 2015 | Change | 2014 | ||||||||||||||||||||
(Dollars in thousands) | |||||||||||||||||||||||||
Paging revenue | $ | 105,048 | $ | (9,059 | ) | (7.9 | )% | $ | 114,107 | $ | (11,094 | ) | (8.9 | )% | $ | 125,201 | |||||||||
Product and other revenue | 4,542 | (365 | ) | (7.4 | )% | 4,907 | (2,294 | ) | (31.9 | )% | 7,201 | ||||||||||||||
Total wireless revenue | $ | 109,590 | $ | (9,424 | ) | (7.9 | )% | $ | 119,014 | $ | (13,388 | ) | (10.1 | )% | $ | 132,402 | |||||||||
The decrease in wireless revenue during 2016 compared to both 2015 and 2014, respectively, reflects the decrease in demand for our wireless services. Paging revenue consists primarily of recurring fees associated with the provision of messaging services and fees for paging devices and is net of a provision for service credits. Product and other revenue reflects system sales, the sale of devices and charges for paging devices that are not returned and are net of anticipated credits.
The demand for one-way and two-way messaging declined at each specified date and we believe demand will continue to decline for the foreseeable future. Demand for our services has also been impacted by the shift from narrow band wireless service offerings to broad band technology services by our competition.
As demand for one-way and two-way messaging has declined, we have developed or added service offerings such as encrypted paging and Spok Mobile with a pager number in order to increase our revenue potential and mitigate the decline in our wireless revenue. We will continue to explore ways to innovate and provide customers the highest value possible. Software revenue is anticipated to increase, while the wireless revenue is expected to continue to decrease reflecting the changing technology expectations of our customer base.
26
Wireless revenue is generally based upon the number of units in service and the monthly charge per unit. The number of units in service changes based on subscribers added, referred to as gross placements, less subscriber cancellations, or disconnects. The net of gross placements and disconnects is commonly referred to as net gains or losses of units in service or the net disconnect rate. The absolute number of gross placements as well as the number of gross placements relative to average units in service in a period, referred to as the gross placement rate, is monitored on a monthly basis. Disconnects are also monitored on a monthly basis. The ratio of units disconnected in a period to average units in service for the same period, called the disconnect rate, is an indicator of our success at retaining subscribers, which is important in order to maintain recurring revenue and to control operating expenses.
The following table sets forth information on our units in service by account size at specified dates:
Account Size | As of December 31, | ||||||||||||||||
(Units in thousands) | 2016 | % of Total | 2015 | % of Total | 2014 | % of Total | |||||||||||
1 to 100 Units(1) | 105 | 9.5 | % | 123 | 10.5 | % | 145 | 11.5 | % | ||||||||
101 to 1000 Units(1) | 217 | 19.5 | % | 243 | 20.7 | % | 277 | 22.1 | % | ||||||||
> 1000 Units(1) | 789 | 71.0 | % | 807 | 68.8 | % | 834 | 66.4 | % | ||||||||
Total units in service(1) | 1,111 | 100.0 | % | 1,173 | 100.0 | % | 1,256 | 100.0 | % | ||||||||
(1) | All figures presented include both direct and indirect units in service. |
The following table sets forth information on the net disconnect rate by account size for our customers for the periods stated:
For the Year Ended | ||||||||
Account Size | 2016 | 2015 | 2014 | |||||
1 to 100 Units | (14.7 | )% | (15.0 | )% | (17.7 | )% | ||
101 to 1000 Units | (10.5 | )% | (12.4 | )% | (8.2 | )% | ||
> 1000 Units | (2.3 | )% | (3.3 | )% | (7.1 | )% | ||
Total net unit loss % | (5.3 | )% | (6.6 | )% | (8.7 | )% | ||
(1) | All figures presented include both direct and indirect units in service. |
The following table sets forth information on Average Revenue Per Unit ("ARPU") by account size for the periods stated:
For the Year Ended | |||||||||||
Account Size | 2016 | 2015 | 2014 | ||||||||
1 to 100 Units | $ | 12.36 | $ | 12.51 | $ | 12.57 | |||||
101 to 1000 Units | 8.64 | 8.65 | 8.79 | ||||||||
> 1000 Units | 6.71 | 6.81 | 6.78 | ||||||||
Total ARPU | $ | 7.67 | $ | 7.83 | $ | 7.93 | |||||
(1) | All figures presented include both direct and indirect units in service. |
While ARPU for similar services and distribution channels is indicative of changes in monthly charges and the revenue rate applicable to new subscribers, this measurement on a consolidated basis is affected by several factors, including the mix of units in service and the pricing of the various components of our services. We expect future annual revenue to decline in line with recent trends. The decrease in consolidated ARPU for the year ended December 31, 2016 compared to the year ended December 31, 2015 and for the year ended December 31, 2015 compared to the year ended December 31, 2014 was due to the change in composition of our customer base as the percentage of units in service attributable to larger customers continues to increase. These larger customers benefit from lower pricing associated with their larger number of units-in-service. We believe that without further price adjustments, ARPU will trend lower in 2017. ARPU may further be affected by lower prices for broad band wireless services offered by our competitors. Any price increases could mitigate, but not completely offset, the expected declines in both ARPU and revenue.
27
The following reflects the impact of subscribers and ARPU on the change in wireless revenue:
Units in Service As of December 31, | Revenue For the Year Ended December 31, | Change Due To: | ||||||||||||||||||||||||||
2016 | 2015 | Change | 2016 | 2015 | Change | ARPU | Units | |||||||||||||||||||||
(Units in thousands) | (Dollars in thousands) | |||||||||||||||||||||||||||
Total | 1,111 | 1,173 | (62 | ) | $ | 105,048 | $ | 114,107 | $ | (9,059 | ) | $ | (1,886 | ) | $ | (7,173 | ) | |||||||||||
Units in Service as of December 31, | Revenue For the Year Ended December 31, | Change Due To: | ||||||||||||||||||||||||||
2015 | 2014 | Change | 2015 | 2014 | Change | ARPU | Units | |||||||||||||||||||||
(Units in thousands) | (Dollars in thousands) | |||||||||||||||||||||||||||
Total | 1,173 | 1,256 | (83 | ) | $ | 114,107 | $ | 125,201 | $ | (11,094 | ) | $ | (1,236 | ) | $ | (9,858 | ) | |||||||||||
As previously discussed, demand for messaging services has declined over the past several years and we anticipate that it will continue to decline for the foreseeable future, which would result in reductions in wireless revenue due to the decreased number of subscribers and related units in service.
Revenue — Software
The table below details total revenue for software operations for the periods stated:
Revenue - software | 2016 | Change | 2015 | Change | 2014 | ||||||||||||||||||||
(Dollars in thousands) | |||||||||||||||||||||||||
Subscription | $ | 2,112 | $ | 431 | 25.6 | % | $ | 1,681 | $ | 198 | 13.4 | % | $ | 1,483 | |||||||||||
License | 6,720 | (3,076 | ) | (31.4 | )% | 9,796 | (1,478 | ) | (13.1 | )% | 11,274 | ||||||||||||||
Services | 18,594 | (243 | ) | (1.3 | )% | 18,837 | 1,465 | 8.4 | % | 17,372 | |||||||||||||||
Equipment | 5,472 | (401 | ) | (6.8 | )% | 5,873 | (1,066 | ) | (15.4 | )% | 6,939 | ||||||||||||||
Operations revenue | 32,898 | (3,289 | ) | (9.1 | )% | 36,187 | (881 | ) | (2.4 | )% | 37,068 | ||||||||||||||
Maintenance revenue | 37,073 | 2,646 | 7.7 | % | 34,427 | 3,624 | 11.8 | % | 30,803 | ||||||||||||||||
Total revenue | $ | 69,971 | $ | (643 | ) | (0.9 | )% | $ | 70,614 | $ | 2,743 | 4.0 | % | $ | 67,871 | ||||||||||
The decrease in software operations revenue during 2016 when compared to 2015 primarily reflects a decrease in the number and size of projects completed during 2016 as compared to the same period in 2015. Starting in late 2015, we began a reorganization of the sales staff and related sales territories, which realigned territories and replaced lower performing sales employees with new staff. The decrease in operational bookings during 2015 and 2016 also factored into the decrease in operational revenue for the same period. The decrease in operations revenue during 2015 when compared to 2014 primarily reflects lower sales of software to new customers which was reflected in the decrease in license revenue.
The continued increase in maintenance revenue for each of the periods stated reflects our continuing success in renewals of our maintenance support for existing software solutions and in maintenance support for sales of new solutions. The maintenance renewal rates for the year ended December 31, 2016, 2015 and 2014 were in excess of 99%. We achieve very high maintenance renewal rates compared to many companies that have software offerings, and we may experience a downward trend in maintenance renewal as communications technology and services continue to advance, and customers have more choices and opportunities to shift to newer solutions for their communication and work flow needs.
Our software revenue is dependent on the conversion of our software bookings into revenues. On a regular basis, we enter into contractual arrangements with our customers to provide software licenses, professional services, and equipment sales. In addition, we enter into contractual arrangements for maintenance with our customers on new solutions or renewals of existing solutions. These contractual arrangements are reported as bookings and represent future revenue.
28
The following table summarizes total bookings for the periods stated:
Bookings | 2016 | Change | 2015 | Change | 2014 | ||||||||||||||||||||
(Dollars in thousands) | |||||||||||||||||||||||||
Operations and new maintenance orders | $ | 33,598 | $ | (4,979 | ) | (12.9 | )% | $ | 38,577 | $ | (6,548 | ) | (14.5 | )% | $ | 45,125 | |||||||||
Maintenance and subscription renewals | 40,256 | 4,810 | 13.6 | % | 35,446 | 2,057 | 6.2 | % | 33,389 | ||||||||||||||||
Total bookings | $ | 73,854 | $ | (169 | ) | (0.2 | )% | $ | 74,023 | $ | (4,491 | ) | (5.7 | )% | $ | 78,514 | |||||||||
The decrease in bookings during 2016 when compared to 2015 primarily reflects a decrease in the number of new operations orders and new maintenance orders from fewer new installations, partially offset by the continued success of maintenance and subscription renewals. Starting in late 2015, the Company undertook a reorganization of the sales staff and related sales territories. As part of that reorganization, the Company has replaced lower performing sales employees with new staff. The Company is unable to predict the impact of this reorganization on the level and timing of future software operations bookings. The Company is also migrating its sales focus from individual software solutions to its integrated solution portfolio. The change in sales focus has impacted bookings as the focus on the integrated solution portfolio requires a longer sales cycle to achieve completion. The maintenance bookings continue to reflect a strong renewal rate in excess of 99%.
Operations and new orders in 2014 reflect $6.7 million of one-time bookings for a U.S. government entity which is the primary reason for the decrease in bookings during 2015 when compared to 2014. Excluding the one-time booking, operations and new maintenance orders remained relatively flat while maintenance and subscription renewals continued to reflect a strong renewal rate in excess of 99%.
The following table summarizes backlog for the periods stated:
For the Year Ended December 31, | |||||||||||
Backlog | 2016 | 2015 | 2014 | ||||||||
(Dollars in thousands) | |||||||||||
Beginning balance | $ | 38,650 | $ | 42,391 | $ | 40,211 | |||||
Operations bookings | 33,598 | 38,577 | 45,125 | ||||||||
Maintenance and subscription renewals | 40,256 | 35,446 | 33,389 | ||||||||
Available backlog | $ | 112,504 | $ | 116,414 | $ | 118,725 | |||||
Operations revenue | (32,898 | ) | (36,187 | ) | (37,068 | ) | |||||
Maintenance revenue | (37,073 | ) | (34,427 | ) | (30,803 | ) | |||||
Other(1) | (4,238 | ) | (7,150 | ) | (8,463 | ) | |||||
Ending balance | $ | 38,295 | $ | 38,650 | $ | 42,391 | |||||
Change in backlog | (0.9 | )% | (8.8 | )% | 5.4 | % | |||||
(1) | Other reflects cancellations and adjustments to backlog. |
We reported a software backlog of $38.3 million at December 31, 2016 which represented all orders received from customers not yet recognized as revenue. We continually review our backlog and adjust the balance to reflect the expected amount and timing of customer implementations. Refer to the discussion on revenue and bookings for explanations of the changes in backlog for the periods ending December 31, 2016, 2015 and 2014.
29
Operating Expenses
Operating expenses | 2016 | Change | 2015 | Change | 2014 | ||||||||||||||||||||
(Dollars in thousands) | |||||||||||||||||||||||||
Cost of revenue | $ | 30,649 | $ | (3,202 | ) | (9.5 | )% | $ | 33,851 | $ | 1,295 | 4.0 | % | $ | 32,556 | ||||||||||
Research and development | 13,467 | 3,187 | 31.0 | % | 10,280 | 779 | 8.2 | % | 9,501 | ||||||||||||||||
Service, rental and maintenance | 32,734 | (1,387 | ) | (4.1 | )% | 34,121 | (1,863 | ) | (5.2 | )% | 35,984 | ||||||||||||||
Selling and marketing | 24,768 | (2,678 | ) | (9.8 | )% | 27,446 | (2,567 | ) | (8.6 | )% | 30,013 | ||||||||||||||
General and administrative | 41,381 | (778 | ) | (1.8 | )% | 42,159 | (3,737 | ) | (8.1 | )% | 45,896 | ||||||||||||||
Severance | 1,446 | (1,255 | ) | (46.5 | )% | 2,701 | 1,206 | 80.7 | % | 1,495 | |||||||||||||||
Total | $ | 144,445 | $ | (6,113 | ) | (4.1 | )% | $ | 150,558 | $ | (4,887 | ) | (3.1 | )% | $ | 155,445 | |||||||||
FTEs | 587 | (13 | ) | (2.2 | )% | 600 | 13 | 2.2 | % | 587 | |||||||||||||||
Cost of revenue. Cost of revenue consisted primarily of the following items:
Cost of revenue | 2016 | Change | 2015 | Change | 2014 | ||||||||||||||||||||
(Dollars in thousands) | |||||||||||||||||||||||||
Payroll and related | $ | 18,119 | $ | 998 | 5.8 | % | $ | 17,121 | $ | 1,370 | 8.7 | % | $ | 15,751 | |||||||||||
Cost of sales | 9,689 | (3,184 | ) | (24.7 | )% | 12,873 | 401 | 3.2 | % | 12,472 | |||||||||||||||
Stock based compensation | 56 | (78 | ) | (58.2 | )% | 134 | (217 | ) | (61.8 | )% | 351 | ||||||||||||||
Other | 2,785 | (938 | ) | (25.2 | )% | 3,723 | (259 | ) | (6.5 | )% | 3,982 | ||||||||||||||
Total cost of revenue | $ | 30,649 | $ | (3,202 | ) | (9.5 | )% | $ | 33,851 | $ | 1,295 | 4.0 | % | $ | 32,556 | ||||||||||
FTEs | 181 | (10 | ) | (5.2 | )% | 191 | 12 | 6.7 | % | 179 | |||||||||||||||
As illustrated in the table above, cost of revenue expense decreased $3.2 million for the year ended December 31, 2016 compared to the year ended December 31, 2015 and increased $1.3 million for the year ended December 31, 2015 compared to the year ended December 31, 2014 primarily due to the following significant components and variances:
• | Payroll and related — Payroll and related expenses were incurred largely for maintenance, support and service personnel. While there was a decrease of 10 FTEs for the year ended December 31, 2016 compared to the same period in 2015, payroll and related expenses increased by $1.0 million due primarily to the timing of hiring and departures and an increase in the average cost per employee. The increase of $1.4 million in payroll and related expenses for the year ended December 31, 2015 compare to the same period in 2014 was due primarily to an increase of 12 FTEs and by an increase in the average cost per employee. |
• | Cost of sales — Cost of sales consisted primarily of third party software, use of third party resources for software implementation related work, inventory and maintenance of third party products. For the year ended December 31, 2016 compared to the same period in 2015 cost of sales decreased by $3.2 million due primarily to a decrease in the sale of third party software, less use of third party resources for software implementation related work, a reduction in billable travel costs and a one-time charge of $0.8 million related to adjustments made to our inventory balances in 2015. The increase of $0.4 million in cost of sales for the year ended December 31, 2015 compared to the same period in 2014 was due primarily to charges related to missing or obsolete inventory in the second quarter of 2015, which was partially off-set by lower third-party professional services related to the implementation of software sales orders. |
• | Stock based compensation — Stock based compensation expenses consisted primarily of amortization of compensation expense associated with restricted stock units (“RSUs”) granted to certain eligible employees. For the year ended December 31, 2016 compared to the same period in 2015 stock based compensation expense decreased by $0.1 million due primarily to the reversal of stock compensation expense partially offset by the issuance and amortization of the 2016 grants under the 2015 LTIP. The decrease of $0.2 million in stock based compensation expense for the year ended December 31, 2015 compare to the same period in 2014 was due primarily to lower amortization of compensation expense for awards under the 2015 Long-Term Incentive Plan ("LTIP"). (See Note 7, "Stockholders' Equity"). |
• | Other — Other expenses consisted primarily of repairs and maintenance, shipping, outside services and travel costs. For the year ended December 31, 2016 compared to the same period in 2015 other expenses decreased by $0.9 million due primarily to a reduction in outside services, shipping expenses, repairs and maintenance and travel costs. The decrease of $0.3 million in other expenses for the year ended December 31, 2015 compared to the same period in 2014 was due primarily to a decrease in outside services, repairs and maintenance and travel costs. |
30
Research and development. We intend to substantially increase our research and development efforts associated with our software solutions due to its importance to our continued success. The Company is investing in the development of products in the areas of: 1) mobility, 2) a unified software platform, 3) nursing solutions, and 4) alerting. The Company plans to continue to increase its staffing to develop its integrated communications solution portfolio. This increase in staffing will substantially impact margins and our cash flow from operations as the benefits from this development effort will not immediately be realized for at least three years. Based on this emphasis we expect the number of FTEs to increase in this area, substantially impacting future payroll and related expenses. Research and development consisted primarily of the following items:
Research and development | 2016 | Change | 2015 | Change | 2014 | ||||||||||||||||||||
(Dollars in thousands) | |||||||||||||||||||||||||
Payroll and related | $ | 10,941 | $ | 3,195 | 41.2 | % | $ | 7,746 | $ | 718 | 10.2 | % | $ | 7,028 | |||||||||||
Outside services | 2,088 | 55 | 2.7 | % | 2,033 | 17 | 0.8 | % | 2,016 | ||||||||||||||||
Stock based compensation | 52 | (34 | ) | (39.5 | )% | 86 | (4 | ) | (4.4 | )% | 90 | ||||||||||||||
Other | 386 | (29 | ) | (7.0 | )% | 415 | 48 | 13.1 | % | 367 | |||||||||||||||
Total research and development | $ | 13,467 | $ | 3,187 | 31.0 | % | $ | 10,280 | $ | 779 | 8.2 | % | $ | 9,501 | |||||||||||
FTEs | 88 | 28 | 46.7 | % | 60 | 7 | 13.2 | % | 53 | ||||||||||||||||
As illustrated in the table above, research and development expense increased $3.2 million for the year ended December 31, 2016 compared to the year ended December 31, 2015 and increased $0.8 million for the year ended December 31, 2015 compared to the year ended December 31, 2014 primarily due to the following significant components and variances:
• | Payroll and related — Payroll and related expenses were incurred largely for product development personnel. For the year ended December 31, 2016 compared to the same period in 2015 payroll and related expenses increased by $3.2 million due primarily to an increase of 28 FTEs and an increase in the average cost per employee. The increase of $0.7 million in payroll and related expenses for the year ended December 31, 2015 compare to the same period in 2014 was due primarily to an increase of 7 FTEs and an increase in the average cost per employee. |
• | Outside services — Outside services consisted primarily of third party developers. For the years ended December 31, 2016 and 2015 compared to the same period in 2015 and 2014 outside services remained relatively flat. |
• | Stock based compensation — Stock based compensation expenses consisted primarily of amortization of compensation expense associated with RSUs granted to certain eligible employees. For the years ended December 31, 2016 and 2015 compared to the same period in 2015 and 2014 stock based compensation expense remained relatively flat. (See Note 7, "Stockholders' Equity"). |
• | Other — Other expenses consisted primarily of travel and office expenses. For the years ended December 31, 2016 and 2015 compared to the same period in 2015 and 2014 other expenses remained relatively flat. |
31
Service, rental and maintenance. Service, rental and maintenance consisted primarily of the following items:
Service, rental and maintenance | 2016 | Change | 2015 | Change | 2014 | ||||||||||||||||||||
(Dollars in thousands) | |||||||||||||||||||||||||
Payroll and related | $ | 10,724 | $ | (164 | ) | (1.5 | )% | $ | 10,888 | $ | 249 | 2.3 | % | $ | 10,639 | ||||||||||
Site rent | 14,572 | (404 | ) | (2.7 | )% | 14,976 | (769 | ) | (4.9 | )% | 15,745 | ||||||||||||||
Telecommunications | 4,569 | (674 | ) | (12.9 | )% | 5,243 | (1,120 | ) | (17.6 | )% | 6,363 | ||||||||||||||
Stock based compensation | 13 | (16 | ) | (55.2 | )% | 29 | 11 | 61.1 | % | 18 | |||||||||||||||
Other | 2,856 | (129 | ) | (4.3 | )% | 2,985 | (234 | ) | (7.3 | )% | 3,219 | ||||||||||||||
Total service, rental and maintenance | $ | 32,734 | $ | (1,387 | ) | (4.1 | )% | $ | 34,121 | $ | (1,863 | ) | (5.2 | )% | $ | 35,984 | |||||||||
FTEs | 97 | (1 | ) | (1.0 | )% | 98 | (1 | ) | (1.0 | )% | 99 | ||||||||||||||
As illustrated in the table above, service, rental and maintenance expense decreased $1.4 million for the year ended December 31, 2016 compared to the year ended December 31, 2015 and decreased $1.9 million for the year ended December 31, 2015 compared to the year ended December 31, 2014 primarily due to the following significant components and variances:
• | Payroll and related — Payroll and related expenses were incurred largely for field technicians, their managers, in-house repair personnel and quality assurance personnel. For the year ended December 31, 2016 compared to the same period in 2015 payroll and related expenses decreased by $0.2 million due primarily to a decrease of 1 FTE partially offset by an increase in the average cost per employee. The increase of $0.2 million in payroll and related expenses for the year ended December 31, 2015 compared to the same period in 2014 was due primarily to a decrease of 1 FTE offset by an increase in the average cost per employee. |
• | Site rent — Site rent expenses consisted primarily of rent for transmitter locations used in our paging network. For the year ended December 31, 2016 compared to the same period in 2015 and for the year ended December 31, 2015 compared to the same period in 2014, site rent expenses decreased by $0.4 million and $0.8 million, respectively, due primarily to the rationalization of our networks, which has decreased the number of transmitters required to provide service to our customers. The reduction in transmitters has, in turn, reduced the number of lease locations. The number of active transmitters declined 2.0% from December 31, 2015 to December 31, 2016 and 2.2% from December 31, 2014 to December 31, 2015. |
• | Telecommunications — Telecommunications expenses consisted primarily of expenses incurred to interconnect our paging networks and to provide telephone numbers for customer use, points of contact for customer service, and connectivity among our offices. For the year ended December 31, 2016 compared to the same period in 2015 and for the year ended December 31, 2015 compared to the same period in 2014, telecommunications expenses decreased by $0.7 million and $1.1 million, respectively, due to the consolidation of our networks. We believe continued reductions in these expenses will occur as our networks continue to be consolidated for the foreseeable future. |
• | Stock based compensation — Stock based compensation expenses consisted primarily of amortization of compensation expense associated with RSUs granted to certain eligible employees. For the year ended December 31, 2016 and 2015 compared to the same period in 2015 and 2014 stock based compensation expense remained relatively flat. (See Note 7, "Stockholders' Equity"). |
• | Other — Other expenses consisted primarily of repairs and maintenance and outside services and includes management of these expenses to reflect the continued transition to support the growth in software revenue. For the year ended December 31, 2016 compared to the same period in 2015 other expenses decreased by $0.1 million due primarily to repairs and maintenance. The decrease of $0.2 million in other expenses for the year ended December 31, 2015 compared to the same period in 2014 was due primarily to a reclassification of expenses to other functional categories. |
32
Selling and marketing. Selling and marketing consisted primarily of the following items:
Selling and marketing | 2016 | Change | 2015 | Change | 2014 | ||||||||||||||||||||
(Dollars in thousands) | |||||||||||||||||||||||||
Payroll and related | $ | 14,252 | $ | (841 | ) | (5.6 | )% | $ | 15,093 | $ | (908 | ) | (5.7 | )% | $ | 16,001 | |||||||||
Commissions | 5,649 | (1,590 | ) | (22.0 | )% | 7,239 | (1,230 | ) | (14.5 | )% | 8,469 | ||||||||||||||
Stock based compensation | 67 | (44 | ) | (39.6 | )% | 111 | (433 | ) | (79.6 | )% | 544 | ||||||||||||||
Other | 4,800 | (203 | ) | (4.1 | )% | 5,003 | 4 | 0.1 | % | 4,999 | |||||||||||||||
Total selling and marketing | $ | 24,768 | $ | (2,678 | ) | (9.8 | )% | $ | 27,446 | $ | (2,567 | ) | (8.6 | )% | $ | 30,013 | |||||||||
FTEs | 107 | (23 | ) | (17.7 | )% | 130 | 6 | 4.8 | % | 124 | |||||||||||||||
As illustrated in the table above, selling and marketing expense decreased $2.7 million for the year ended December 31, 2016 compared to the year ended December 31, 2015 and decreased $2.6 million for the year ended December 31, 2015 compared to the year ended December 31, 2014 primarily due to the following significant components and variances:
• | Payroll and related — Payroll and related expenses were incurred largely for sales and marketing personnel. For the year ended December 31, 2016 compared to the same period in 2015 payroll and related expenses decreased by $0.8 million due primarily to a decrease of 23 FTEs, predominately related to the reorganization of our sales staff and related sales territories, partially offset by an increase in the average cost per employee. This decrease in FTEs reflects the reorganization of the sales staff, which includes the replacement of underperforming sales employees. While there was an increase of 6 FTEs for the year ended December 31, 2015 compared to the same period in 2014, the average headcount outstanding for 2015 was lower by approximately 16 FTEs compared to the same period in 2014. The decrease of $0.9 million in payroll and related expenses in 2015 was due primarily to the lower average headcount, partially offset by an increase in the average cost per employee. |
• | Commissions — Commissions expense relates to the payments made to the sales representatives responsible for executing contracts. Commissions are expensed as projects are implemented and are impacted by the level of software operations revenue. For the year ended December 31, 2016 compared to the same period in 2015 commissions expense decreased by $1.6 million due primarily to lower software operations revenue compared to the same period in the prior year and to a lesser extent due to the continued impact from the change in the commission plan incentives made in 2015. The decrease of $1.2 million in commissions expense for the year ended December 31, 2015 compared to the same period in 2014 was due primarily to the impact of a change in the commission plan incentives, which lowered the commission paid on the sale of certain products and to a lesser extent on lower software operations revenue in 2015. |
• | Stock based compensation — Stock based compensation expenses consisted primarily of amortization of compensation expense associated with RSUs granted to certain eligible employees. For the year ended December 31, 2016 compared to the same period in 2015 stock based compensation expense remained relatively flat due primarily to the reversal of stock compensation expense partially offset by the issuance and amortization of the 2016 grants under the 2015 LTIP. The decrease of $0.4 million in stock based compensation expense for the year ended December 31, 2015 compare to the same period in 2014 was due primarily to lower amortization of compensation expense for awards under the 2015 LTIP. (See Note 7, "Stockholders' Equity"). |
• | Other — Other expenses consisted primarily of advertising, trade show, convention and related travel expenses and reflect our focus on identifying sales opportunities. For the year ended December 31, 2016 compared to the same period in 2015 other expenses decreased by $0.2 million due primarily to customer referral fees and an aggregate of smaller insignificant costs partially offset by higher advertising expenses in 2015. Other expenses remained relatively consistent for the year ended December 31, 2015 compared to the same period in 2014. |
33
General and administrative. General and administrative consisted primarily of the following items:
General and administrative | 2016 | Change | 2015 | Change | 2014 | ||||||||||||||||||||
(Dollars in thousands) | |||||||||||||||||||||||||
Payroll and related | $ | 17,382 | $ | (458 | ) | (2.6 | )% | $ | 17,840 | $ | (350 | ) | (1.9 | )% | $ | 18,190 | |||||||||
Stock based compensation | 666 | (842 | ) | (55.8 | )% | 1,508 | (1,327 | ) | (46.8 | )% | 2,835 | ||||||||||||||
Facility rent | 3,315 | (190 | ) | (5.4 | )% | 3,505 | (9 | ) | (0.3 | )% | 3,514 | ||||||||||||||
Outside services | 8,005 | 844 | 11.8 | % | 7,161 | 196 | 2.8 | % | 6,965 | ||||||||||||||||
Taxes, licenses and permits | 4,254 | (222 | ) | (5.0 | )% | 4,476 | (479 | ) | (9.7 | )% | 4,955 | ||||||||||||||
Other | 7,759 | 90 | 1.2 | % | 7,669 | (1,768 | ) | (18.7 | )% | 9,437 | |||||||||||||||
Total general and administrative | $ | 41,381 | $ | (778 | ) | (1.8 | )% | $ | 42,159 | $ | (3,737 | ) | (8.1 | )% | $ | 45,896 | |||||||||
FTEs | 114 | (7 | ) | (5.8 | )% | 121 | (11 | ) | (8.3 | )% | 132 | ||||||||||||||
As illustrated in the table above, general and administrative expense decreased $0.8 million for the year ended December 31, 2016 compared to the year ended December 31, 2015 and decreased $3.7 million for the year ended December 31, 2015 compared to the year ended December 31, 2014 primarily due to the following significant components and variances:
• | Payroll and related — Payroll and related expenses were incurred for employees in information technology, administrative operations, finance, human resources and executive management. For the year ended December 31, 2016 compared to the same period in 2015 payroll and related expenses decreased by $0.5 million due primarily to a decrease of 7 FTEs partially offset by an increase in the average cost per employee. The decrease of $0.4 million in payroll and related expenses for the year ended December 31, 2015 compare to the same period in 2014 was due primarily to a decrease of 11 FTEs partially offset by an increase in the average cost per employee. |
• | Stock based compensation — Stock based compensation expenses consisted primarily of amortization of compensation expense associated with RSUs granted to certain eligible employees. For the year ended December 31, 2016 compared to the same period in 2015 stock based compensation expense decreased by $0.8 million due primarily to the reversal of stock compensation expense partially offset by the issuance and amortization of the 2016 grants under the 2015 LTIP. The decrease of $1.3 million in stock based compensation expense for the year ended December 31, 2015 compare to the same period in 2014 was due primarily to lower amortization of compensation expense for awards under the 2015 LTIP. (See Note 7, "Stockholders' Equity"). |
• | Facility Rent— Facility rent expenses consisted primarily of rent, utilities and other fees related to the lease of office space for administrative purposes. For the year ended December 31, 2016 compared to the same period in 2015 facility rent expenses decreased by $0.2 million due primarily to reductions in rent and utilities. Facility rent expenses stayed relatively consistent for the year ended December 31, 2015 compared to the same period in 2014. |
• | Outside services — Outside service expenses consisted primarily of costs associated with professional services related to financial reporting, taxes and internal control compliance. For the year ended December 31, 2016 compared to the same period in 2015 outside service expenses increased by $0.8 million due primarily to costs related to the enhancement and replacement of certain internal processes and systems. These costs include enhancement of our current customer relationship management solution, implementation of an enterprise resource planning platform, replacement of our sales quoting tool and the addition of commission software. The increase of $0.2 million in outside service expenses for the year ended December 31, 2015 compared to the same period in 2014 was due primarily to higher professional service fees for external accounting and tax support services. |
• | Taxes, licenses and permits — Taxes, license and permit expenses consisted primarily of property, franchise, gross receipts and transactional taxes and are primarily impacted by our level of revenue and property and equipment base. For the year ended December 31, 2016 compared to the same period in 2015, taxes, license and permit expenses decreased by $0.2 million due primarily to a decrease in gross receipts, license and permits and personal property tax partially offset by an increase in sales and use tax. The decrease of $0.5 million in taxes, license and permit expenses for the year ended December 31, 2015 compared to the same period in 2014 was due primarily to a decrease in gross receipts and sales and use tax partially offset by increases in license and permits expense. |
• | Other — Other expenses consisted primarily of bad debt, insurance, shipping costs, financial services and office rent and utilities. For the year ended December 31, 2016 compared to the same period in 2015 other expenses increased by $0.1 million due primarily to an aggregate of smaller insignificant costs. The decrease of $1.8 million in other expenses for the year ended December 31, 2015 compared to the same period in 2014 was due primarily to a non-recurring charge of $0.8 million related to future billing credits, relocation expenses and refunds and repairs and maintenance for the year ended December 31, 2014, which were not incurred in 2015. |
34
Severance. For the year ended December 31, 2016 compared to the same period in 2015 and for the year ended December 31, 2015 compared to the same period in 2014 severance expenses decreased by $1.3 million and increased by $1.2 million, respectively, due primarily to the departure of two executives during the year ended December 31, 2015 which were not incurred in 2016 or 2014 (See Note 1, "Organization and Significant Accounting Policies", for further discussion on our severance policies).
Depreciation, amortization and accretion. For the year ended December 31, 2016 compared to the same period in 2015 depreciation, amortization and accretion expenses decreased by $1.0 million due primarily to $0.6 million related to the amortization of our acquired technology and non-compete arrangements which were included for the year ended December 31, 2015 but were completely amortized during the year ended December 31, 2016 and $0.5 million related to lower depreciation expense because of a lower balance of pagers for the year ended December 31, 2016 partially offset by $0.1 million in other changes. The decrease of $2.7 million in depreciation, amortization and accretion expenses for the year ended December 31, 2015 compared to the same period in 2014 was due primarily to $1.6 million in lower depreciation expense for the period for non-paging device assets and $1.0 million in lower amortization expense for intangible assets associated with the change in the useful life of software related intangibles due to our rebranding in 2014 and $0.1 million in other changes.
Interest expense, net, Other income, net and Income tax expense
Interest income (expense), net. For the year ended December 31, 2016, compared to the same period in 2015, interest income increased by $0.3 million primarily due to an increase in funds held in interest bearing accounts. The increase of $0.5 million in interest expense, net for the year ended December 31, 2015 compared to the same period in 2014 was due primarily to recognition of the remaining deferred financing costs associated with the revolving credit facility, which was terminated on December 15, 2014 and was not subsequently recognized in 2015.
Other income, net. For the year ended December 31, 2016 compared to the same period in 2015 other income, net decreased by $0.6 million due primarily to $0.8 million related to the sale of two land parcels in 2015 that did not occur in 2016 partially offset by $0.2 million related to a reduction in the total estimated royalty liability for the purchase of IMCO in 2012. The increase of $1.6 million in other income, net for the year ended December 31, 2015 compared to the same period in 2014, was due primarily to $0.8 million related to the sale of two land parcels and $0.3 million related to dividend income.
Income tax expense (benefit). Spok's income tax expense (benefit) has fluctuated for the periods presented below, largely due to non-cash adjustments related to our deferred income tax assets and related valuation allowance. The effects of foreign taxes are immaterial for all periods presented. The following is the effective tax rate reconciliation for the years ended December 31, 2016, 2015 and 2014, respectively (See Note 8, "Income Taxes", for further discussion on our income taxes):
Effective tax rate reconciliation | 2016 | 2015 | 2014 | |||||||||||||||||
(Dollars in thousands) | ||||||||||||||||||||
Income before income tax expense | $ | 22,971 | $ | 26,298 | $ | 27,327 | ||||||||||||||
Federal income tax expense at the Federal statutory rate | $ | 8,040 | 35.0 | % | $ | 9,204 | 35.0 | % | $ | 9,564 | 35.0 | % | ||||||||
State income taxes, net of Federal benefit | 867 | 3.8 | % | 1,021 | 3.9 | % | 1,188 | 4.3 | % | |||||||||||
Change in valuation allowance | — | — | % | (64,159 | ) | (244.0 | )% | (5,087 | ) | (18.6 | )% | |||||||||
Other, including permanent differences | 85 | 0.4 | % | (14 | ) | (0.1 | )% | 917 | 3.4 | % | ||||||||||
Income tax expense (benefit) | $ | 8,992 | 39.1 | % | $ | (53,948 | ) | (205.1 | )% | $ | 6,582 | 24.1 | % | |||||||
Income tax expense increased by $62.9 million for the year ended December 31, 2016 compared to the same period in 2015 due primarily to a $64.2 million one-time favorable adjustment to the deferred income tax asset ("DTA") valuation allowance in 2015. This was partially offset by $1.2 million in lower income tax expense related to a decrease of $3.3 million in income before income tax expense and $0.1 million in other changes. The decrease of $60.5 million in income tax expenses for the year ended December 31, 2015 compared to the same period in 2014 was due primarily to a $59.1 million greater reduction in the deferred income tax asset valuation allowance in 2015 than in 2014 and $1.4 million in other changes. The favorable adjustments to the DTA valuation allowance in both 2015 and 2014 relate to our assessment on the probability of future recoverability of our DTAs.
35
The pro-forma effective tax rate excludes the effects of the change in the valuation allowance and the change in the deferred income tax assets to provide a more comparable effective tax rate. The following are the pro-forma effective tax rates for the years ended December 31, 2016, 2015 and 2014, respectively:
Pro forma effective tax rate | 2016 | 2015 | 2014 | |||||
(Dollars in thousands) | ||||||||
Effective tax rate | 39.1 | % | (205.1 | %) | 24.1 | % | ||
Change in valuation allowance | — | % | 244.0 | % | 18.6 | % | ||
Pro-forma effective tax rate | 39.1 | % | 38.9 | % | 42.7 | % | ||
Liquidity and Capital Resources
Cash and Cash Equivalents
At December 31, 2016, we had cash and cash equivalents of $125.8 million. The available cash and cash equivalents are held in accounts managed by third-party financial institutions and consist of invested cash and cash in our operating accounts. The invested cash is invested in interest bearing funds managed by third-party financial institutions. These funds invest in direct obligations of the government of the United States. To date, we have experienced no loss or lack of access to our invested cash or cash equivalents; however, we can provide no assurance that access to our invested cash and cash equivalents will not be impacted by adverse market conditions.
At any point in time, we have approximately $7.0 to $12.0 million in our operating accounts that are with third-party financial institutions. While we monitor daily the cash balances in our operating accounts and adjust the cash balances as appropriate, these cash balances could be impacted if the underlying financial institutions fail or are subject to other adverse conditions in the financial markets. To date, we have experienced no loss or lack of access to cash in our operating accounts.
We intend to use our cash on hand to provide working capital, to support operations, to invest in our business and to return value to stockholders through cash dividends and possible repurchases of our common stock. We may also consider using cash to fund or complete opportunistic investments and acquisitions that we believe will provide a measure of growth or revenue stability while supporting our existing operations. Because we intend to increase substantially our investment in developing our integrated communications platform over the next two or three years commensurate with declining revenues from our wireless business, we anticipate that our cash on hand will decrease significantly during that period and possibly longer until revenues from our Spok Care Connect platform begin to be realized.
Overview
In the event that net cash provided by operating activities and cash on hand are not sufficient to meet future cash requirements, we may be required to reduce planned capital expenses, reduce or eliminate our cash dividends to stockholders, not resume our common stock repurchase program, and/or sell assets or seek additional financing. We can provide no assurance that reductions in planned capital expenses or proceeds from asset sales would be sufficient to cover shortfalls in available cash or that additional financing would be available on acceptable terms. As of December 31, 2016, our available cash on hand was $125.8 million.
Based on current and anticipated levels of operations, we anticipate net cash provided by operating activities, together with the available cash on hand at December 31, 2016, should be adequate to meet anticipated cash requirements for the foreseeable future.
36
The following table sets forth information on our net cash flows from operating, investing, and financing activities for the periods stated:
For the Year Ended December 31, | Change Between 2016 and 2015 | ||||||||||||||
2016 | 2015 | 2014 | |||||||||||||
(Dollars in thousands) | |||||||||||||||
Net cash provided by operating activities | $ | 37,461 | $ | 41,837 | $ | 41,559 | $ | (4,376 | ) | ||||||
Net cash used in investing activities | (6,254 | ) | (5,565 | ) | (7,614 | ) | (689 | ) | |||||||
Net cash used in financing activities | (16,723 | ) | (32,809 | ) | (15,151 | ) | 16,086 | ||||||||
Net Cash Provided by Operating Activities. As discussed above, we are dependent on cash flows from operating activities to meet our cash requirements. Cash from operations varies depending on changes in various working capital items, including deferred revenues, accounts payable, accounts receivable, prepaid expenses and various accrued expenses. Net cash provided by operating activities reflects the reclassification of $3.8 million to net cash used in financing activities associated with employee stock based compensation tax withholding. Excluding this reclassification, net cash provided by operating activities decreased $0.6 million for the year ended December 31, 2016 compared to the same period in 2015 due primarily to a decrease in net income, net of adjustments related to deferred income tax benefit (expense) of $4.3 million (decrease in cash flow), a decrease of $1.0 million in depreciation, amortization and accretion expenses (decrease in cash flow), a decrease of $1.0 million in stock based compensation expenses (decrease in cash flow) partially offset by $0.7 million in other non-cash items (increase in cash flow). With respect to changes in assets and liabilities the net cash provided by operating activities reflects an $8.4 million greater increase in accounts payable, accrued liabilities and other (increase in cash flow), $0.7 million lower increase in deferred revenue (decrease in cash flow) and a net $2.7 million greater increase to assets (decrease in cash flow).
Net Cash Used in Investing Activities. Net cash used in investing activities increased $0.7 million for the year ended December 31, 2016 compared to the same period in 2015 due primarily to lower proceeds from the disposal of property and equipment.
Net Cash Used in Financing Activities. Net cash used in financing activities decreased $16.1 million for the year ended December 31, 2016 from the same period in 2015 due primarily to $2.6 million less in special dividends paid, an $8.6 million decrease in common stock repurchases, net of proceeds from the issuance of common stock, $0.6 million related to the payment of accumulated cash dividends earned on vested RSUs from the 2011 LTIP in 2015 and $0.5 million related to a reduction in the quarterly dividend payment as a result of less common stock outstanding in 2016 as compared to 2015 . The remaining offset was related to the early adoption of ASU No. 2016-09 and the reclassification of $3.8 million in employee stock based compensation for tax withholding purposes for the year ended December 31, 2015 (See Note 2 to our Consolidated Financial Statements for further details regarding ASU No. 2016-09).
Cash Dividends to Stockholders. For the year ended December 31, 2016, we paid a total of $10.3 million in cash dividends compared to $14.0 million in cash dividends for the same period in 2015. Cash dividends paid to stockholders in 2016 decreased by $3.7 million primarily due to $0.6 million related to the payment of accumulated cash dividends earned on vested RSU from the 2011 LTIP in 2015 and $0.5 million related to a reduction in the quarterly dividend payment as a result of less common stock outstanding in 2016 as compared to 2015 and $2.6 million related to a special dividend of $0.125 which was declared and paid in 2015.
Future Cash Dividends to Stockholders. On December 20, 2016 our Board of Directors declared a special dividend of $0.25 per share of common stock, with a record date of January 4, 2017, and a payment date of January 17, 2017. This cash dividend of approximately $5.2 million will be paid from available cash on hand. On March 1, 2017, our Board of Directors declared a regular quarterly dividend of $0.125 per share of common stock, with a record date of March 17, 2017, and a payment date of March 30, 2017. This cash dividend of approximately $2.6 million will be paid from available cash on hand.
Common Stock Repurchase Program. For the year ended December 31, 2016, we purchased 388,255 shares of our common stock under the repurchase program for $6.4 million, net of proceeds from the issuance of common stock. The repurchase authority allows us, at management’s discretion, to selectively repurchase shares of our common stock from time to time in the open market depending upon market price and other factors. The Company's Board of Directors did not reset the repurchase authority under the share repurchase program for 2017 and the previous authority expired on December 31, 2016. (See Note 7, "Stockholders' Equity", for further discussion on our common stock repurchase program.)
Borrowings. On November 8, 2011 we executed the First Amendment to our Amended and Restated Credit Agreement (“Amended Credit Agreement”) with Wells Fargo Capital Finance, LLC (“Wells Fargo”). The Amended Credit Agreement increased the amount of the revolving credit facility to $40.0 million. The maturity date for the revolving credit facility was September 3, 2015. The Amended Credit Agreement also revised the London Interbank Offered Rate (“LIBOR”) definition to eliminate the LIBOR floor and reduced the interest rate margin to 3.25%. Borrowings under this facility were secured by a lien on substantially all of the existing assets, interests in assets
37
and proceeds owned or acquired by us. We were subject to certain financial covenants on a quarterly basis under the terms of the Amended Credit Agreement. These financial covenants consisted of a leverage ratio and a fixed charge coverage ratio.
On December 15, 2014, we terminated the Amended Credit Agreement and underlying revolving credit facility. At the time the revolving credit facility was terminated, we were in compliance with all the required financial covenants and did not incur any early termination penalties. As of December 31, 2016, we had no outstanding debt.
Other. For 2017, the Board of Directors currently expects to pay dividends of $0.125 per common share each quarter, subject to declaration by the Board of Directors, in 2017.
Commitments and Contingencies
Contractual Obligations. The following table provides the Company's significant commitments and contractual obligations as of December 31, 2016.
Payments Due By Period | |||||||||||||||||||
(Dollars in thousands) | Total | Less than 1 Year | 1 to 3 years | 3 to 5 years | More than 5 years | ||||||||||||||
Operating lease obligations | $ | 17,150 | $ | 6,672 | $ | 6,703 | $ | 2,678 | $ | 1,097 | |||||||||
Purchase obligations | 3,992 | — | 3,992 | — | — | ||||||||||||||
Total contractual obligations | $ | 21,142 | $ | 6,672 | $ | 10,695 | $ | 2,678 | $ | 1,097 | |||||||||
As of December 31, 2016, our contractual payment obligations under our operating leases for office and transmitter locations are indicated in the table above. For purposes of the table above, purchase obligations are defined as agreements to purchase goods or services that are enforceable, legally binding, noncancelable, has a remaining term in excess of one year and that specify all significant terms, including: fixed or minimum quantities to be purchased; fixed, minimum or variable pricing provisions; and the approximate timing of transactions. These purchase obligations primarily relate to commitments to purchase a minimum number of pagers. The amounts are based on our contractual commitments; however, it is possible that we may be able to negotiate lower payments if we choose to exit these contracts before their expiration date. See Note 10, "Commitments and Contingencies", for further discussion on commitments and contingencies.
Off-Balance Sheet Arrangements. We do not have any relationships with unconsolidated entities or financial partnerships, such as entities often referred to as structured finance or special purpose entities, which would have been established for the purpose of facilitating off-balance sheet arrangements or other contractually narrow or limited purposes. As such, we are not exposed to any financing, liquidity, market or credit risk that could arise if we had engaged in such relationships.
Related Parties
See Note 12, "Related Parties", for further discussion on our related party transactions.
Inflation
Inflation has not had a material effect on our operations to date. System equipment and operating costs have not significantly increased in price, and the price of wireless messaging devices has tended to decline in recent years. This reduction in costs has generally been reflected in lower prices charged to subscribers who purchase their wireless messaging devices. Our general operating expenses, such as salaries, site rent for transmitter locations, employee benefits and occupancy costs, are subject to normal inflationary pressures.
Critical Accounting Policies and Estimates
The preceding discussion and analysis of financial condition and statement of income is based on our consolidated financial statements, which have been prepared in conformity with accounting principles generally accepted in the United States of America (“GAAP”). The preparation of these consolidated financial statements requires management to make estimates, judgments and assumptions that affect the amounts reported in its consolidated financial statements and accompanying notes. Note 1, "Organization and Significant Accounting Policies", of the Notes to Consolidated Financial Statements in Part II, Item 8 of this Form 10-K describes the significant accounting policies and methods used in the preparation of the Company's consolidated financial statements. We base our estimates on historical experience and various other assumptions that are believed to be reasonable under the circumstances, the results of which form the basis for making judgments about the carrying values of assets and liabilities that are not readily apparent from other sources. Actual results may differ from these estimates under different assumptions or condition.
38
Management believes the Company's critical accounting policies and estimates are those related to revenue recognition, asset retirement obligations, income taxes and the impairment of long-lived assets and intangible assets subject to amortization and goodwill. Management considers these policies critical because of the significant judgment and estimates inherent within each process and their importance to the overall presentation of the Company's financial statements and operating results. We believe the following critical accounting policies affect our more significant judgments and estimates used in the preparation of our consolidated financial statements.
Revenue Recognition
We recognize revenue when four basic criteria have been met:
• | there is persuasive evidence that an arrangement exists; |
• | delivery has occurred or services rendered; |
• | the fee is fixed or determinable; and |
• | collectability is reasonably assured. |
Amounts billed to customers, but not meeting the above revenue recognition criteria are deferred until all four criteria have been met.
Signed agreements are used as evidence of an arrangement. If a contract signed by the customer does not exist, we use a purchase order as evidence of an arrangement. If both a signed contract and a purchase order exist, we consider the signed contract to be the final persuasive evidence of an arrangement. At the time a contract is executed, we evaluate the contract to assess whether the fee is fixed or determinable. If the fee is assessed as not being fixed or determinable, revenue recognition is delayed until this assessment can be made. Additionally, we review customer creditworthiness and our historical ability to collect payments when due.
Our wireless revenue consists primarily of service, rental and maintenance fees charged to customers on a monthly, quarterly or annual basis. Revenue also includes the sale of messaging devices directly to customers and other companies that resell our services. With respect to revenue recognition for multiple deliverables, we evaluated these revenue arrangements and determined that two separate units of accounting exist, paging service revenue and product sales. We recognize paging service revenue over the period the service is performed; revenue from product sales is recognized at the time of shipment or installation. We have a variety of billing arrangements with our customers resulting in deferred revenue from advance billings and accounts receivables for billing in-arrears arrangements.
Our software revenue consists primarily of the sale of software (license fees), professional services (primarily installation and training), equipment (to be used in conjunction with the software) and maintenance support (post-contract support). The software is licensed to end users under an industry standard software license agreement. Our software products are considered to be “off-the-shelf software” as the software is marketed as a stock item that customers can use without customization.
Software revenue consists of two primary components: (1) operations revenue consisting of software license revenue, professional services revenue and equipment revenue, and (2) maintenance revenue.
We generally sell software licenses, professional services, equipment and maintenance in multiple-element arrangements. At inception of the arrangement, we allocate the arrangement consideration to the software deliverables (software licenses, professional services and maintenance) as a group and to the non-software deliverables (equipment and maintenance on equipment, when applicable) using the relative selling price method. When performing this allocation, the estimated selling price for each deliverable is based on vendor specific objective evidence of fair value (“VSOE”), third party evidence of fair value (“TPE”), or if VSOE and TPE are not available, the best estimated selling price (“BESP”) for selling the element on a stand-alone basis. We have determined that TPE is not a practical alternative due to differences in our service offerings compared to other parties and the availability of relevant third-party pricing information. The amount of revenue allocated to delivered items is limited by contingent revenue, if any.
Our standard post contract support (maintenance) is allocated using VSOE as an input in the relative selling price allocation. For software licenses, professional services, equipment and premium maintenance we have determined that neither VSOE nor TPE is available and as such, we have used BESP as an input in order to allocate our arrangement fees. We determine BESP by considering our overall pricing objectives and market conditions. Significant pricing practices take into consideration our discounting practices, the size and volume of our transactions, the customer demographic, the geographic area where our services are sold, our price lists, our go-to-market strategy, historical standalone sales and contract prices. The determination of BESP is made through consultation with and approval by management, taking into consideration the go-to-market strategy. As our go-to-market strategies evolve, we may modify our pricing practices in the future, which could result in changes in relative selling prices, including both VSOE and BESP.
In multiple-element arrangements, the arrangement consideration allocated to our non-software deliverables (equipment) is generally recognized upon shipment or delivery to the customer depending on delivery method of Free on Board ("FOB") shipping or FOB destination, respectively.
39
For our software deliverables, which include software licenses, professional services, and post contract support (maintenance), we further allocate arrangement consideration using the residual method. As noted above, we have not established VSOE for our software licenses, professional services and premium maintenance. However, we have established, and continue to maintain, VSOE for our standard post contract support (maintenance). We recognize contract revenue ratably over the longer of the estimated services delivery period or the maintenance term. If delivery of the software and services is completed before the end of the maintenance period, then the remaining deferred revenue associated with these elements is recognized in full at this time. Any unrecognized revenue related to maintenance continues to be recognized ratably over the remaining term of the maintenance period. If the period of delivery to the customer is not known, license and professional services revenue will be recognized when software and professional services are fully delivered to the customer and the maintenance revenue will be recognized ratably over the remaining contractual term of the agreement. Prior to January 1, 2014, we did not have a method for reasonably estimating the services period and therefore, license and professional services revenue was primarily recognized at the time of full delivery. In 2014, we developed a methodology for reasonably estimating the services period and have been able to recognize license and professional services revenue ratably on most contracts. Generally, the defined services period for most of our projects is shorter than the maintenance term.
Asset Retirement Obligations
We recognize liabilities and corresponding assets for future obligations associated with the retirement of assets. We have paging equipment assets, principally transmitters, which are located on leased locations. The underlying leases generally require the removal of equipment at the end of the lease term; therefore, a future obligation exists. Asset retirement costs are reflected in paging equipment assets with depreciation expense recognized over the estimated lives, which range between one and five years. The asset retirement costs and the corresponding liabilities that have been recorded to date generally relate to either current plans to consolidate networks or to the removal of assets at a future terminal date.
The primary variables associated with these estimates are the number of transmitters and related equipment to be removed, the timing of removal, and a fair value estimate of the outside contractor fees to remove each asset. The fair value estimate of contractor fees to remove each asset is assumed to escalate by 4% each year through the terminal date. The total estimated liability is based on transmitter locations remaining after we have consolidated the number of networks we operate and assume the underlying leases continue to be renewed to that future date.
We believe these estimates are reasonable at the present time, but we can give no assurance that changes in technology, our financial condition, the economy or other factors would not result in higher or lower asset retirement obligations. Any variations from our estimates would generally result in a change in the assets and liabilities in equal amounts, and operating results would differ in the future by any difference in depreciation expense and accretion expense.
Income Taxes - Uncertainties and Deferred Income Tax Assets ("DTAs")
We file our income tax returns as prescribed by the tax laws of the jurisdictions in which we operate. We are required to evaluate the recoverability of our DTAs. The assessment is to determine whether based on all available evidence, it is more likely than not (i.e., greater than a 50% probability) that all or some portion of the DTAs will be realized in the future.
The DTA valuation allowance reflects management’s judgment concerning the ultimate recoverability of the DTAs. At December 31, 2016, Spok did not have a valuation allowance.
We consider both positive and negative evidence when evaluating the recoverability of our DTAs. During the fourth quarter of each year, we prepare a multi-year forecast of taxable income for our operations. In preparing our analysis of the recoverability of our DTAs, we consider the following possible sources of taxable income:
1. | Future reversals of existing taxable temporary differences. |
We consider 100% of our existing taxable temporary differences when estimating the amount of recoverable DTAs.
2. | Future taxable income exclusive of reversing temporary differences and carryforwards. |
As described above, we use a multi-year forecast of taxable income for the Company. DTAs are realizable if future deductible amounts would reduce taxes that would be paid on future taxable income excluding the reversal of existing temporary differences.
3. | Taxable income in carryback years to the extent permitted by tax law. |
We have exhausted our carryback potential and now only have carryforwards available.
4. | Tax planning strategies. |
40
Since 2012, we have elected to capitalize and amortize over 10 years, software research and development costs. In the near term, this has the effect of increasing taxable income and the amount of net operating losses utilized.
Impairment of Long-Lived Assets, Intangible Assets Subject to Amortization and Goodwill
We are required to evaluate the carrying value of our long-lived assets, amortizable intangible assets and goodwill. Amortizable intangible assets include customer related intangibles, technology based intangibles, contract based intangibles and marketing intangibles that primarily resulted from our previous acquisitions. Such intangibles are being amortized over periods up to ten years. Quarterly, we assess whether circumstances exist which suggest that the carrying value of long-lived assets may not be recoverable. When applicable, we assess the recoverability of the carrying value of our long-lived assets and certain amortizable intangible assets based on estimated undiscounted cash flows to be generated from such assets. In assessing the recoverability of these assets, we forecasted estimated enterprise-level cash flows based on operating assumptions such as revenue forecasted by product line. If the forecast of undiscounted cash flows did not exceed the carrying value of the long-lived assets, we would record an impairment charge to the extent the carrying value exceeded the fair value of such assets.
Goodwill resulting from our acquisitions is not amortized but is evaluated for impairment at least annually, or when events or circumstances suggest a potential impairment has occurred. We evaluate goodwill for impairment between annual tests if indicators of impairment exist. The first step of the impairment test involves comparing the fair value of the reporting unit with its carrying value. If the reporting unit’s fair value is less than the carrying amount of the reporting unit, we compare the implied fair value of the affected reporting unit’s goodwill with the carrying value of that goodwill. The amount by which the implied fair value is less than the carrying value of the goodwill, if any, is recognized as an impairment loss. For purposes of the goodwill impairment evaluation, the Company as a whole is considered the reporting unit. The fair value of the reporting unit is estimated under a market based approach using the fair value of the Company's common stock. A confirmatory discounted cash flow analysis is also used to assess whether impairment exists. This calculation requires significant judgments, including estimation of future cash flows, which is dependent on internal forecasts, estimation of the long-term rate of growth for our business, estimation of the useful life over which cash flows will occur and determination of our weighted average cost of capital.
Recent and Pending Accounting Standards
Revenue
In May 2014, the Financial Accounting Standards Board (“FASB”) issued Accounting Standards Update (“ASU”) No. 2014-09, Revenue from Contracts with Customers. Since this ASU was issued, the FASB has issued several updates including ASU No. 2015-14 in July 2015 which delayed the effective date, ASU No. 2016-08 in March 2016 which updated guidance related to principal versus agent considerations, ASU No. 2016-10 in April 2016 which updated guidance related to the identification of performance obligations, ASU No. 2016-12 in May 2016 which updated guidance related to scope improvements and practical expedients and ASU No. 2016-20 which provided technical corrections and improvements but did not update guidance issued in prior updates. The effective date is January 1, 2018, and while early adoption to the original effective date of January 1, 2017 is permitted, we have elected not to early adopt.
ASU No. 2014-09 creates a five-step model that requires companies to exercise judgment when considering all relevant facts and circumstances in the determination of when and how revenue is recognized. The two permitted transition methods under the new standard are the full retrospective method, in which case the standard would be applied to each prior reporting period presented, or the modified retrospective method, in which case the cumulative effect of applying the standard would be recognized at the date of initial application. We have completed our review of the acceptable transition methods and have selected the modified retrospective approach. We currently believe the modified retrospective approach will have a material impact on both deferred revenue and retained earnings in our 2018 consolidated financial statements.
We currently believe the standard will materially impact our revenue recognition on a going-forward basis once adopted. While we continue to assess the potential impacts of this standard, we currently believe that the most significant impact relates to our accounting for software license revenue. We expect software license revenue to be recognized at the time of shipment rather than over a combined service period or subscription period. Due to the nuances of certain contracts the actual revenue recognition treatment required under the standard will be dependent on contract-specific terms and may vary in some instances from recognition at the time of shipment.
41
Leases
In February 2016, the FASB issued ASU No. 2016-02, Leases. The new standard establishes a right of use (“ROU”) model that requires a lessee to record a ROU asset and a lease liability on the balance sheet for all leases with terms longer than twelve months. Leases will be classified as either financing or operating with the classification affecting the pattern of expense recognition in the income statement.
ASU No. 2016-02 will be effective for fiscal years beginning on January 1, 2019, including the related interim periods and early adoption of the standard is permitted. A modified retrospective transition approach is required for capital and operating leases existing at, or entered into after, the beginning of the earliest comparative period presented in the financial statements, with certain practical expedients available. While we are still evaluating the impact of the potential new standard on our consolidated financial statements, we expect that upon adoption we will recognize ROU assets and lease liabilities and that the amounts could be material.
Stock Compensation
In March 2016, the FASB issued ASU No. 2016-09, Stock Compensation Expense. The new standard is primarily focused on income taxes and the presentation of taxes related to stock compensation, but also provides a simpler method of accounting for forfeitures. An entity will now be able to make an entity-wide accounting policy election to either estimate the number of awards that are expected to be forfeited, as permissible under existing GAAP, or account for forfeitures as incurred. The purpose of this ASU was to reduce cost and complexity of the accounting related to share-based payment awards issued to employees for public and private companies.
ASU No. 2016-09 will be effective for fiscal years beginning after December 15, 2016, including interim periods within those fiscal years, and early adoption upon issuance of the ASU is permitted. We have adopted this new ASU effective January 1, 2016. As part of the adoption, we have made an accounting policy election to account for forfeitures as incurred rather than estimate the number of awards that are expected to be forfeited. The following summary provides further clarification of the transition approaches and the impact on the Company for each issue in ASU No. 2016-09 that requires a retrospective or modified retrospective approach:
• | For entities electing to account for forfeitures as they are incurred, a modified retrospective transition approach, with a cumulative-effect adjustment recognized in equity, is required for stock based compensation accounted for prior to the date on which the standard is adopted. We made the policy election to account for forfeitures as incurred and therefore, recorded a cumulative-effect adjustment in equity to account for this change in the first quarter of 2016. The overall impact to our consolidated financial statements is immaterial. Future forfeitures will be accounted for as they are incurred rather than estimating the number of awards that are expected to be forfeited at the time of grant. |
• | A retrospective transition approach is required for classification of employee taxes paid in the Statement of Cash Flows when an employer withholds shares for tax-withholding purposes. In the three months ended March 31, 2015, shares were withheld for tax-withholding purposes related to the payment of vested 2011 LTIP awards. Previously, the withholdings were classified as an operating activity within our Statement of Cash Flows. We have retrospectively reclassified those withholdings as a financing activity and the total reclassification was $3.8 million. |
• | There was no additional impact on our financial statements, resulting from the adoption of ASU No. 2016-09, that required a retrospective or modified retrospective approach. Any additional requirements under this ASU will be accounted for on a prospective basis. |
Goodwill
In January 2017, the FASB issued ASU No. 2017-04, Intangibles - Goodwill and Other: Simplifying the Test for Goodwill Impairment. The new standard simplifies how an entity tests for goodwill by eliminating Step 2 from the goodwill impairment test. Step 2 measured a goodwill impairment loss by comparing the implied fair value of a reporting unit's goodwill with the carrying amount of that goodwill. By eliminating Step 2 an entity must now record an impairment to goodwill based on an analysis of the fair value of a reporting unit as compared to its carrying amount. An impairment charge is recognized for the amount that the carrying value exceeds the reporting unit's fair value.
ASU No. 2017-04 will be effective for fiscal years beginning on January 1, 2020. including interim periods within those fiscal years, and early adoption as of January 1, 2017 is permitted. All changes are to be accounted for on a prospective basis upon adoption. We continue to evaluate the impact ASU No. 2017-04 will have on our consolidated financial statements. We have not yet determined whether we will early adopt ASU No. 2017-04.
42
Non-GAAP Financial Measures
We use a non-GAAP financial measure as a key element in determining performance for purposes of incentive compensation under our annual Short-Term Incentive Plan ("STIP") and LTIP. That non-GAAP financial measure is operating cash flow (“OCF”), defined as EBITDA less purchases of property and equipment. (The Company defines EBITDA as operating income plus depreciation, amortization and accretion, each determined in accordance with GAAP). Purchases of property and equipment are also determined in accordance with GAAP. For purposes of STIP and LTIP performance, OCF was as follows for the periods stated:
Non-GAAP Financial Measures | 2016 | 2015 | 2014 | ||||||||
(Dollars in thousands) | |||||||||||
Net income | $ | 13,979 | $ | 80,246 | $ | 20,745 | |||||
Plus (Less): Income tax expense (benefit) | 8,992 | (53,948 | ) | 6,582 | |||||||
Plus (Less): Other expense (income) | (543 | ) | (1,182 | ) | 368 | ||||||
Plus (Less): Interest expense (income) | (275 | ) | (16 | ) | 456 | ||||||
Operating income | 22,153 | 25,100 | 28,151 | ||||||||
Plus: Depreciation, amortization and accretion | 12,963 | 13,970 | 16,677 | ||||||||
EBITDA (as defined by the Company) | 35,116 | 39,070 | 44,828 | ||||||||
Less: Purchases of property and equipment | (6,256 | ) | (6,374 | ) | (7,679 | ) | |||||
OCF (as defined by the Company) | $ | 28,860 | $ | 32,696 | $ | 37,149 | |||||
ITEM 7A. QUANTITATIVE AND QUALITATIVE DISCLOSURES ABOUT MARKET RISK
Interest Rate Risk
At December 31, 2016, we had no outstanding borrowings or associated debt service requirements.
Foreign Currency Exchange Rate Risk
We conduct a limited amount of business outside the United States. The financial impact of transactions billed in foreign currencies is immaterial to our financial results and, consequently, we do not have any material exposure to the risk of foreign currency exchange rate fluctuations.
ITEM 8. FINANCIAL STATEMENTS AND SUPPLEMENTARY DATA
The consolidated financial statements are included in this Report beginning on Page F-1.
Index to Consolidated Financial Statements | Page |
43
ITEM 9. CHANGES IN AND DISAGREEMENTS WITH ACCOUNTANTS ON ACCOUNTING AND FINANCIAL DISCLOSURE
There are no reportable events.
ITEM 9A. CONTROLS AND PROCEDURES
Evaluation of Disclosure Controls and Procedures
Our management carried out an evaluation, as required by Rule 13a-15(b) of the Securities Exchange Act of 1934, as amended (the “Exchange Act”), with the participation of our principal executive officer and our principal financial officer, of the effectiveness of our disclosure controls and procedures, as of the end of our last fiscal year. Disclosure controls and procedures are defined under Rule 13a-15(e) under the Exchange Act as controls and other procedures of an issuer that are designed to ensure that the information required to be disclosed by the issuer in the reports that it files or submits under the Exchange Act (i) is recorded, processed, summarized and reported within the time periods specified in SEC rules and forms, and (ii) is accumulated and communicated to the issuer’s management, including its principal executive officer and principal financial officer, or persons performing similar functions, as appropriate to allow timely decisions regarding required disclosure. Based upon this evaluation, our principal executive officer and our principal financial officer have concluded that our disclosure controls and procedures were effective as of December 31, 2016.
Management’s Report on Internal Control Over Financial Reporting
Our management is responsible for establishing and maintaining adequate internal control over financial reporting, as defined in the Exchange Act Rule 13a-15(f) and 15d-15(f). Management conducted an evaluation of the effectiveness of our internal control over financial reporting based on the 2013 Internal Control — Integrated Framework issued by the Committee of Sponsoring Organizations of the Treadway Commission (“COSO”).
Such internal controls include those policies and procedures that:
• | pertain to the maintenance of records that in reasonable detail accurately and fairly reflect the transactions and dispositions of the assets of the Company; |
• | provide reasonable assurance that transactions are recorded as necessary to permit preparation of financial statements in accordance with GAAP, and that receipts and expenditures are being made only in accordance with authorizations of management and members of the Board of Directors of the Company; and |
• | provide reasonable assurance regarding prevention or timely detection of unauthorized acquisition, use or disposition of our assets that could have a material effect on the financial statements. |
Because of its inherent limitations, internal control over financial reporting may not prevent or detect misstatements. Projections of any evaluation of effectiveness to future periods are subject to the risk that controls may become inadequate because of changes in conditions, or that the degree of compliance with the policies or procedures may deteriorate.
Based on our evaluation under the 2013 Internal Control — Integrated Framework, our management concluded that our internal control over financial reporting was effective as of December 31, 2016.
The effectiveness of our internal control over financial reporting as of December 31, 2016 has been audited by Grant Thornton LLP, an independent registered public accounting firm, as stated in their report which appears in this 2016 Annual Report on Form 10-K.
Changes in Internal Control Over Financial Reporting
There were no changes made in the Company’s internal control over financial reporting during the year ended December 31, 2016 that have materially affected, or are reasonably likely to materially affect, the Company’s internal controls over financial reporting.
ITEM 9B. OTHER INFORMATION
None.
44
PART III
Certain information called for by Items 10 through 14 is incorporated by reference from Spok’s definitive Proxy Statement for our 2017 Annual Meeting of Stockholders, which will be filed with the SEC no later than May 1, 2016.
ITEM 10. DIRECTORS, EXECUTIVE OFFICERS AND CORPORATE GOVERNANCE
The following information required by this item is incorporated by reference from Spok’s definitive Proxy Statement for our 2017 Annual Meeting of Stockholders:
• | information regarding directors is set forth under the caption “Election of Directors”; |
• | information regarding executive officers is set forth under the caption “Executive Officers”; |
• | information regarding our audit committee and designated “audit committee financial expert” is set forth under the caption “Committees of the Board of Directors”; and |
• | information regarding compliance with Section 16(a) of the Exchange Act is set forth under the caption “Section 16(a) Beneficial Ownership Reporting Compliance”. |
We also make available on our website, and in print, if any stockholder or other person so requests, our code of business conduct and ethics entitled “Code of Ethics” which is applicable to all employees and directors, our “Corporate Governance Guidelines,” and the charters for all committees of our Board of Directors, including Audit, Compensation and Corporate Governance and Nominating. Any changes to our Code of Ethics or waiver, if any, of our Code of Ethics for executive officers or directors will be posted on that website.
ITEM 11. EXECUTIVE COMPENSATION
The information required by this item is incorporated by reference from the section of Spok’s definitive Proxy Statement for our 2017 Annual Meeting of Stockholders entitled “Compensation Discussion and Analysis.”
ITEM 12. SECURITY OWNERSHIP OF CERTAIN BENEFICIAL OWNERS AND MANAGEMENT AND RELATED STOCKHOLDER MATTERS
The information required by this item is incorporated by reference from the section of Spok’s definitive Proxy Statement for our 2017 Annual Meeting of Stockholders entitled “Security Ownership of Certain Beneficial Owners and Management and Related Stockholder Matters.”
ITEM 13. CERTAIN RELATIONSHIPS AND RELATED TRANSACTIONS, AND DIRECTOR INDEPENDENCE
The information required by this item with respect to certain relationships and related transactions is incorporated by reference from the section of Spok’s definitive Proxy Statement for our 2017 Annual Meeting of Stockholders entitled “Related Person Transactions and Code of Conduct.” The information required by this item with respect to director independence is incorporated by reference from the section of Spok’s definitive Proxy Statement for our 2017 Annual Meeting of Stockholders entitled “Board and Governance Matters.”
ITEM 14. PRINCIPAL ACCOUNTING FEES AND SERVICES
The information required by this item is incorporated by reference from the section of Spok’s definitive Proxy Statement for our 2017 Annual Meeting of Stockholders entitled “Independent Registered Public Accounting Firm Fees.”
45
PART IV
ITEM 15. EXHIBITS AND FINANCIAL STATEMENT SCHEDULES
The following documents are filed as part of this Annual Report on Form 10-K:
(a) | 1. Financial Statements |
Index to Consolidated Financial Statements | Page |
2. Financial Statement Schedules
Index to Consolidated Financial Statements | Page |
(a) | Exhibits |
The exhibits listed in the accompanying index to exhibits, that follows the Signatures page, are filed as part of this Annual Report on Form 10-K.
46
SIGNATURES
Pursuant to the requirements of Section 13 or 15(d) of the Securities Exchange Act of 1934, the registrant has duly caused this report to be signed on our behalf by the undersigned, thereunto duly authorized.
Spok Holdings, Inc. | |
By: | /s/ Vincent D. Kelly |
Vincent D. Kelly | |
President and Chief Executive Officer | |
March 2, 2017 | |
Pursuant to the requirements of the Securities Exchange Act of 1934, this report has been signed below by the following persons on behalf of the registrant and in the capacities and on the dates indicated.
Signature | Title | Date | ||
/s/ Vincent D. Kelly | Director, President and Chief Executive Officer (principal executive officer) | March 2, 2017 | ||
Vincent D. Kelly | ||||
/s/ Shawn E. Endsley | Chief Financial Officer (principal financial officer) | March 2, 2017 | ||
Shawn E. Endsley | ||||
/s/ Royce Yudkoff | Chairman of the Board | March 2, 2017 | ||
Royce Yudkoff | ||||
/s/ N. Blair Butterfield | Director | March 2, 2017 | ||
N. Blair Butterfield | ||||
/s/ Stacia A. Hylton | Director | March 2, 2017 | ||
Stacia A. Hylton | ||||
/s/ Brian O’Reilly | Director | March 2, 2017 | ||
Brian O’Reilly | ||||
/s/ Matthew Oristano | Director | March 2, 2017 | ||
Matthew Oristano | ||||
/s/ Samme L. Thompson | Director | March 2, 2017 | ||
Samme L. Thompson | ||||
47
Index to Consolidated Financial Statements | Page |
F- 1
REPORT OF INDEPENDENT REGISTERED PUBLIC ACCOUNTING FIRM
Board of Directors and Stockholders
Spok Holdings, Inc.
We have audited the accompanying consolidated balance sheets of Spok Holdings, Inc. (a Delaware corporation) and subsidiaries (the “Company”) as of December 31, 2016 and 2015, and the related consolidated statements of income, changes in shareholders’ equity, and cash flows for each of the three years in the period ended December 31, 2016. Our audits of the basic consolidated financial statements included the financial statement schedule listed in the index appearing under Item 15(a)(2). These financial statements are the responsibility of the Company’s management. Our responsibility is to express an opinion on these financial statements based on our audits.
We conducted our audits in accordance with the standards of the Public Company Accounting Oversight Board (United States). Those standards require that we plan and perform the audit to obtain reasonable assurance about whether the financial statements are free of material misstatement. An audit includes examining, on a test basis, evidence supporting the amounts and disclosures in the financial statements. An audit also includes assessing the accounting principles used and significant estimates made by management, as well as evaluating the overall financial statement presentation. We believe that our audits provide a reasonable basis for our opinion.
In our opinion, the consolidated financial statements referred to above present fairly, in all material respects, the financial position of Spok Holdings, Inc. and subsidiaries as of December 31, 2016 and 2015, and the results of their operations and cash flows for each of the three years in the period ended December 31, 2016 in conformity with accounting principles generally accepted in the United States of America. Also in our opinion, the related financial statement schedule, when considered in relation to the basic consolidated financial statements taken as a whole, presents fairly, in all material respects, the information set forth therein.
We also have audited, in accordance with the standards of the Public Company Accounting Oversight Board (United States), the Company’s internal control over financial reporting as of December 31, 2016, based on criteria established in the 2013 Internal Control-Integrated Framework issued by the Committee of Sponsoring Organizations of the Treadway Commission (COSO), and our report dated March 2, 2017 expressed an unqualified opinion.
/s/ GRANT THORNTON LLP |
Arlington, Virginia |
March 2, 2017 |
F- 2
REPORT OF INDEPENDENT REGISTERED PUBLIC ACCOUNTING FIRM
Board of Directors and Stockholders
Spok Holdings, Inc.
We have audited the internal control over financial reporting of Spok Holdings, Inc. (a Delaware corporation) and subsidiaries (the “Company”) as of December 31, 2016, based on criteria established in the 2013 Internal Control-Integrated Framework issued by the Committee of Sponsoring Organizations of the Treadway Commission (COSO). The Company’s management is responsible for maintaining effective internal control over financial reporting and for its assessment of the effectiveness of internal control over financial reporting, included in the accompanying Management’s Report on Internal Control over Financial Reporting. Our responsibility is to express an opinion on the Company’s internal control over financial reporting based on our audit.
We conducted our audit in accordance with the standards of the Public Company Accounting Oversight Board (United States). Those standards require that we plan and perform the audit to obtain reasonable assurance about whether effective internal control over financial reporting was maintained in all material respects. Our audit included obtaining an understanding of internal control over financial reporting, assessing the risk that a material weakness exists, testing and evaluating the design and operating effectiveness of internal control based on the assessed risk, and performing such other procedures as we considered necessary in the circumstances. We believe that our audit provides a reasonable basis for our opinion.
A company’s internal control over financial reporting is a process designed to provide reasonable assurance regarding the reliability of financial reporting and the preparation of financial statements for external purposes in accordance with generally accepted accounting principles. A company’s internal control over financial reporting includes those policies and procedures that (1) pertain to the maintenance of records that, in reasonable detail, accurately and fairly reflect the transactions and dispositions of the assets of the company; (2) provide reasonable assurance that transactions are recorded as necessary to permit preparation of financial statements in accordance with generally accepted accounting principles, and that receipts and expenditures of the company are being made only in accordance with authorizations of management and directors of the company; and (3) provide reasonable assurance regarding prevention or timely detection of unauthorized acquisition, use, or disposition of the company’s assets that could have a material effect on the financial statements.
Because of its inherent limitations, internal control over financial reporting may not prevent or detect misstatements. Also, projections of any evaluation of effectiveness to future periods are subject to the risk that controls may become inadequate because of changes in conditions, or that the degree of compliance with the policies or procedures may deteriorate.
In our opinion, the Company maintained, in all material respects, effective internal control over financial reporting as of December 31, 2016, based on criteria established in the 2013 Internal Control-Integrated Framework issued by COSO.
We also have audited, in accordance with the standards of the Public Company Accounting Oversight Board (United States), the consolidated financial statements of the Company as of and for the year ended December 31, 2016, and our report dated March 2, 2017 expressed an unqualified opinion on those financial statements.
/s/ GRANT THORNTON LLP |
Arlington, Virginia |
March 2, 2017 |
F- 3
SPOK HOLDINGS, INC.
CONSOLIDATED BALANCE SHEETS
December 31, | |||||||
(Dollars in thousands except share and per share amounts) | 2016 | 2015 | |||||
ASSETS | |||||||
Current assets: | |||||||
Cash and cash equivalents | $ | 125,816 | $ | 111,332 | |||
Accounts receivable, net | 23,666 | 22,638 | |||||
Prepaid expenses and other | 4,384 | 5,352 | |||||
Inventory, net | 1,996 | 2,291 | |||||
Total current assets | 155,862 | 141,613 | |||||
Non-current assets: | |||||||
Property and equipment, net | 12,818 | 15,386 | |||||
Goodwill | 133,031 | 133,031 | |||||
Intangible assets, net | 10,803 | 14,964 | |||||
Deferred income tax assets, net | 73,068 | 79,994 | |||||
Other non-current assets | 2,505 | 1,445 | |||||
Total non-current assets | 232,225 | 244,820 | |||||
TOTAL ASSETS | $ | 388,087 | $ | 386,433 | |||
LIABILITIES AND STOCKHOLDERS’ EQUITY | |||||||
Current liabilities: | |||||||
Accounts payable | $ | 1,909 | $ | 2,121 | |||
Accrued compensation and benefits | 13,268 | 10,864 | |||||
Accrued dividends payable | 5,140 | — | |||||
Accrued taxes | 4,132 | 3,465 | |||||
Deferred revenue | 29,145 | 27,045 | |||||
Other current liabilities | 2,733 | 3,661 | |||||
Total current liabilities | 56,327 | 47,156 | |||||
Non-current liabilities: | |||||||
Deferred revenue | 752 | 741 | |||||
Other non-current liabilities | 8,921 | 8,972 | |||||
Total non-current liabilities | 9,673 | 9,713 | |||||
TOTAL LIABILITIES | 66,000 | 56,869 | |||||
COMMITMENTS AND CONTINGENCIES | |||||||
STOCKHOLDERS’ EQUITY: | |||||||
Preferred stock—$0.0001 par value; 25,000,000 shares authorized; no shares issued or outstanding | — | — | |||||
Common stock—$0.0001 par value; 75,000,000 shares authorized; 20,525,614 and 20,886,261 shares issued and outstanding as of December 31, 2016 and December 31, 2015, respectively | 2 | 2 | |||||
Additional paid-in capital | 104,810 | 110,435 | |||||
Retained earnings | 217,275 | 219,127 | |||||
TOTAL STOCKHOLDERS’ EQUITY | 322,087 | 329,564 | |||||
TOTAL LIABILITIES AND STOCKHOLDERS’ EQUITY | $ | 388,087 | $ | 386,433 | |||
The accompanying notes are an integral part of these consolidated financial statements.
F- 4
SPOK HOLDINGS, INC.
CONSOLIDATED STATEMENTS OF INCOME
For the Year Ended December 31, | |||||||||||
(Dollars in thousands, except share and per share amounts) | 2016 | 2015 | 2014 | ||||||||
Revenue: | |||||||||||
Wireless | $ | 109,590 | $ | 119,014 | $ | 132,402 | |||||
Software | 69,971 | 70,614 | 67,871 | ||||||||
Total revenue | 179,561 | 189,628 | 200,273 | ||||||||
Operating expenses: | |||||||||||
Cost of revenue | 30,649 | 33,851 | 32,556 | ||||||||
Research and development | 13,467 | 10,280 | 9,501 | ||||||||
Service, rental and maintenance | 32,734 | 34,121 | 35,984 | ||||||||
Selling and marketing | 24,768 | 27,446 | 30,013 | ||||||||
General and administrative | 41,381 | 42,159 | 45,896 | ||||||||
Severance | 1,446 | 2,701 | 1,495 | ||||||||
Depreciation, amortization and accretion | 12,963 | 13,970 | 16,677 | ||||||||
Total operating expenses | 157,408 | 164,528 | 172,122 | ||||||||
Operating income | 22,153 | 25,100 | 28,151 | ||||||||
Interest income (expense) | 275 | 16 | (456 | ) | |||||||
Other income (expense) | 543 | 1,182 | (368 | ) | |||||||
Income before income tax expense | 22,971 | 26,298 | 27,327 | ||||||||
Income tax benefit (expense) | (8,992 | ) | 53,948 | (6,582 | ) | ||||||
Net income | $ | 13,979 | $ | 80,246 | $ | 20,745 | |||||
Basic and diluted net income per common share | $ | 0.68 | $ | 3.74 | $ | 0.96 | |||||
Basic and diluted weighted average common shares outstanding | 20,586,066 | 21,471,041 | 21,644,163 | ||||||||
Cash dividends declared per common share | $ | 0.750 | $ | 0.625 | $ | 0.500 | |||||
The accompanying notes are an integral part of these consolidated financial statements.
F- 5
SPOK HOLDINGS, INC.
CONSOLIDATED STATEMENTS OF STOCKHOLDERS’ EQUITY
(Dollars in thousands except share amounts) | Outstanding Common Shares | Common Stock | Additional Paid-In Capital | Retained Earnings | Total Stockholders’ Equity | |||||||||||||
Balance, January 1, 2014 | 21,652,341 | $ | 2 | $ | 127,264 | $ | 142,684 | $ | 269,950 | |||||||||
Net income | — | — | — | 20,745 | 20,745 | |||||||||||||
Issuance of common stock under the Equity Plan | 5,820 | — | 85 | — | 85 | |||||||||||||
Issuance of common stock for vested restricted stock units under the Equity Plan | 559,689 | — | — | — | — | |||||||||||||
Amortization of stock based compensation | — | — | 3,753 | — | 3,753 | |||||||||||||
Cash dividends declared | — | — | — | (11,050 | ) | (11,050 | ) | |||||||||||
Common stock repurchase program | (263,772 | ) | — | (4,325 | ) | — | (4,325 | ) | ||||||||||
Issuance of restricted common stock under the Equity Plan | 24,684 | — | — | — | — | |||||||||||||
Other | — | — | (99 | ) | — | (99 | ) | |||||||||||
Balance, December 31, 2014 | 21,978,762 | $ | 2 | $ | 126,678 | $ | 152,379 | $ | 279,059 | |||||||||
Net income | — | — | — | 80,246 | 80,246 | |||||||||||||
Purchase of common stock for tax withholding, net | (217,211 | ) | — | (3,824 | ) | — | (3,824 | ) | ||||||||||
Amortization of stock based compensation | — | — | 1,868 | — | 1,868 | |||||||||||||
Cash dividends declared | — | — | — | (13,498 | ) | (13,498 | ) | |||||||||||
Common stock repurchase program | (897,177 | ) | — | (15,008 | ) | — | (15,008 | ) | ||||||||||
Issuance of restricted common stock under the Equity Plan | 21,887 | — | — | — | — | |||||||||||||
Other | — | — | 721 | — | 721 | |||||||||||||
Balance, December 31, 2015 | 20,886,261 | $ | 2 | $ | 110,435 | $ | 219,127 | $ | 329,564 | |||||||||
Net income | — | — | — | 13,979 | 13,979 | |||||||||||||
Issuance of common stock under the Employee Stock Purchase Plan | 3,961 | — | 53 | — | 53 | |||||||||||||
Purchased and retired common stock | (2 | ) | — | — | — | — | ||||||||||||
Amortization of stock based compensation | — | — | 854 | — | 854 | |||||||||||||
Cash dividends declared | — | — | — | (15,766 | ) | (15,766 | ) | |||||||||||
Common stock repurchase program | (388,255 | ) | — | (6,489 | ) | — | (6,489 | ) | ||||||||||
Issuance of restricted common stock under the Equity Plan | 23,649 | — | — | — | — | |||||||||||||
Other | — | — | (43 | ) | (65 | ) | (108 | ) | ||||||||||
Balance, December 31, 2016 | 20,525,614 | $ | 2 | $ | 104,810 | $ | 217,275 | $ | 322,087 | |||||||||
The accompanying notes are an integral part of these consolidated financial statements.
F- 6
SPOK HOLDINGS, INC.
CONSOLIDATED STATEMENTS OF CASH FLOWS
For the Year Ended December 31, | |||||||||||
(Dollars in thousands) | 2016 | 2015 | 2014 | ||||||||
Cash flows from operating activities: | |||||||||||
Net income | $ | 13,979 | $ | 80,246 | $ | 20,745 | |||||
Adjustments to reconcile net income to net cash provided by operating activities: | |||||||||||
Depreciation, amortization and accretion | 12,963 | 13,970 | 16,677 | ||||||||
Amortization of deferred financing costs | — | — | 456 | ||||||||
Deferred income tax (benefit) expense | 6,926 | (55,018 | ) | 4,740 | |||||||
Stock based compensation | 854 | 1,868 | 3,838 | ||||||||
Provisions for doubtful accounts, service credits and other | 761 | 1,290 | 1,128 | ||||||||
Adjustments of non-cash transaction taxes | (270 | ) | (686 | ) | (310 | ) | |||||
(Gain)/Loss on disposals of property and equipment | 2 | (793 | ) | 3 | |||||||
Changes in assets and liabilities: | |||||||||||
Accounts receivable | (1,790 | ) | 1,041 | (8,013 | ) | ||||||
Prepaid expenses, intangible assets and other assets | 843 | 658 | 17 | ||||||||
Accounts payable, accrued liabilities and other | 1,083 | (3,556 | ) | 1,192 | |||||||
Deferred revenue | 2,110 | 2,817 | 1,086 | ||||||||
Net cash provided by operating activities | 37,461 | 41,837 | 41,559 | ||||||||
Cash flows from investing activities: | |||||||||||
Purchases of property and equipment, net of proceeds from disposals of property and equipment | (6,254 | ) | (5,565 | ) | (7,614 | ) | |||||
Net cash used in investing activities | (6,254 | ) | (5,565 | ) | (7,614 | ) | |||||
Cash flows from financing activities: | |||||||||||
Cash distributions to stockholders | (10,287 | ) | (13,976 | ) | (10,826 | ) | |||||
Purchase of common stock (including commissions), net of proceeds from issuance of common stock | (6,436 | ) | (15,008 | ) | (4,325 | ) | |||||
Employee stock based compensation tax withholding | — | (3,825 | ) | — | |||||||
Net cash used in financing activities | (16,723 | ) | (32,809 | ) | (15,151 | ) | |||||
Net increase in cash and cash equivalents | 14,484 | 3,463 | 18,794 | ||||||||
Cash and cash equivalents, beginning of period | 111,332 | 107,869 | 89,075 | ||||||||
Cash and cash equivalents, end of period | $ | 125,816 | $ | 111,332 | $ | 107,869 | |||||
Supplemental disclosure: | |||||||||||
Income taxes paid | $ | 695 | $ | 1,521 | $ | 1,448 | |||||
The accompanying notes are an integral part of these consolidated financial statements.
F- 7
SPOK HOLDINGS, INC.
NOTES TO CONSOLIDATED FINANCIAL STATEMENTS
NOTE 1 - ORGANIZATION AND SIGNIFICANT ACCOUNTING POLICIES
Spok, Inc., a wholly owned subsidiary of Spok Holdings, Inc. (NASDAQ: SPOK)("Spok" or the "Company"), is proud to be the global leader in healthcare communications. We deliver clinical information to care teams when and where it matters most to improve patient outcomes. Top hospitals rely on the Spok Care Connect platform to enhance workflows for clinicians, support administrative compliance, and provide a better experience for patients. Our customers send over 100 million messages each month through their Spok solutions.
We offer a focused suite of unified critical communication solutions that include call center operations, clinical alerting and notifications, one-way and advanced two-way wireless messaging services, mobile communications and public safety solutions.
We provide one-way and advanced two-way wireless messaging services including information services throughout the United States. These services are offered on a local, regional and nationwide basis employing digital networks. One-way messaging consists of numeric and alphanumeric messaging services. Numeric messaging services enable subscribers to receive messages that are composed entirely of numbers, such as a phone number, while alphanumeric messages may include numbers and letters, which enable subscribers to receive text messages. Two-way messaging services enable subscribers to send and receive messages to and from other wireless messaging devices, including pagers, personal digital assistants and personal computers. We also offer voice mail, personalized greeting, message storage and retrieval, and equipment loss and/or maintenance protection to both one-way and two-way messaging subscribers. These services are commonly referred to as wireless messaging and information services.
We also develop, sell and support enterprise-wide systems for hospitals and other organizations needing to automate, centralize and standardize mission critical communications. These solutions are used for contact centers, clinical alerting and notification, mobile communications and messaging and for public safety notifications. These areas of market focus compliment the market focus of our wireless services outlined above.
Basis of Presentation
The accompanying consolidated financial statements include our accounts and the accounts of our wholly-owned direct and indirect subsidiaries. All significant intercompany accounts and transactions have been eliminated in consolidation. Our consolidated financial statements have been prepared in accordance with accounting principles generally accepted in the United States (“GAAP”) and the rules and regulations of the United States Securities and Exchange Commission (the “SEC”). In management's opinion, the consolidated financial statements include all adjustments and accruals that are necessary for a fair presentation of the results of all periods reported herein and all such adjustments are of a normal, recurring nature (except for the reduction of deferred income tax assets and related valuation allowance described in further detail below under the heading "Prior Period Financial Statement Correction of an Immaterial Misstatement").
Amounts shown on the consolidated statements of income within the operating expense categories of cost of revenue; research and development; service, rental and maintenance; selling and marketing; and general and administrative are recorded exclusive of severance, depreciation, amortization and accretion. These items are shown separately on the consolidated statements of income within operating expenses. Foreign currency translation adjustments were immaterial and are not presented separately in our consolidated statements of stockholders’ equity and balance sheets, and consequently no statements of comprehensive income are presented.
Certain prior period amounts in the consolidated financial statements have been reclassified to conform to the current period's presentation. These reclassifications had no effect on the reported results of operations. In the fourth quarter 2016, the Company concluded that it was appropriate to separately state those operating costs related to research and development. Previously those costs had been classified under the Service, Rental and Maintenance operating category. Corresponding reclassifications were made to the Consolidated Statements of Income for the years ended December 31, 2015 and 2014. This change in classification has no effect on the previously reported Consolidated Statements of Income for any period.
F- 8
Prior Period Financial Statement Correction of an Immaterial Misstatement
In 2016, we identified certain adjustments in preparing our provision for income taxes, the most significant of which relating to our determination that certain net operating loss carryforwards (“NOLs”) available for state income tax purposes on which we based our calculation of the deferred income tax asset and deferred income tax benefit in our financial statements for the year ended December 31, 2015 were overstated, resulting in the recorded deferred income tax asset and benefit reported in our 2015 financial statements being overstated by approximately $4.3 million. The aggregate amount and effect of all such adjustments was $4.0 million. The Company files income tax returns in substantially every state in the United States. After undertaking an extensive reconciliation of its cumulative net operating loss carryforwards in 2016 as a result of a recent 3rd party Tax Court decision upheld upon appeal impacting another taxpayer, the Company found that a portion of the NOLs used in prior periods were subject to this Tax Court decision, requiring the absorption and use of other NOLs not subject to this decision, lowering the amount of related deferred income tax assets reported by the Company at December 31, 2015. Further details related to this decision can be found in Note 8 "Income Taxes". This adjustment did not impact the Company’s cash flows from operations or cash position. Financial statements relating to any other prior period were also not affected by this matter.
The Company also determined, based on the performance criteria of the 2011 Long-Term Incentive Plan ("LTIP") and 2015 LTIP for the 2015 and 2016 grants, that unvested restricted stock units ("RSUs") have not met since issuance, the criteria to be considered dilutive. Our 2016 Consolidated Financial Statements reflect this determination, along with additional corrections, within the calculation of basic and diluted weighted average shares outstanding and earnings per share for the years ended December 31, 2016, 2015 and 2014.
We assessed the materiality of these misstatements on our 2014 and 2015 financial statements in accordance with SEC Staff Accounting Bulletin ("SAB") No. 99, Materiality, codified in Accounting Standards Codification ("ASC") 250, Presentation of Financial Statements, and concluded that they were not material to any prior annual or interim periods. However, the amount of the prior period correction, if recorded in 2016, would have been material to the quarterly amounts within our current 2016 Consolidated Statements of Operations. Consequently, in accordance with ASC 250 (specifically SAB No. 108, Considering the Effects of Prior Year Misstatements when Quantifying Misstatements in Current Year Financial Statements), we have corrected these misstatements in 2014 and 2015 by revising the consolidated 2014 and 2015 financial statements and other financial information included herein. Periods not presented herein will be revised, as applicable, in future filings.
The effect of these revisions on the Company's Consolidated Balance Sheet is as follows:
(Dollars in thousands) | As Previously Reported At December 31, 2015 | Adjustment | As Revised At December 31, 2015 | |||||||
Gross deferred income tax asset | $ | 129,760 | 265 | $ | 130,025 | |||||
Valuation allowance | (45,777 | ) | (4,254 | ) | (50,031 | ) | ||||
Net deferred income tax asset | 83,983 | (3,989 | ) | 79,994 | ||||||
Retained earnings | 223,116 | (3,989 | ) | 219,127 | ||||||
The effect of these revisions on the Company's Consolidated Statement of Income is as follows:
(Dollars in thousands, except for share and per share amounts) | As Previously Reported for the Twelve Months Ended December 31, 2015 | Adjustment | As Revised for the Twelve Months Ended December 31, 2015 | ||||||||
Income tax benefit | $ | 57,937 | $ | (3,989 | ) | $ | 53,948 | ||||
Net income | 84,235 | (3,989 | ) | 80,246 | |||||||
Basic net income per common share | 3.99 | (0.25 | ) | 3.74 | |||||||
Basic weighted average common shares outstanding | 21,120,268 | 350,773 | 21,471,041 | ||||||||
Diluted net income per common share | 3.98 | (0.24 | ) | 3.74 | |||||||
Diluted weighted average common shares outstanding | 21,186,750 | 284,291 | 21,471,041 | ||||||||
F- 9
(Dollars in thousands, except for share and per share amounts) | As Previously Reported for the Twelve Months Ended December 31, 2014 | Adjustment | As Revised for the Twelve Months Ended December 31, 2014 | ||||||||
Basic weighted average common shares outstanding | 21,621,466 | 22,697 | 21,644,163 | ||||||||
Diluted net income per common share | $ | 0.94 | $ | 0.02 | $ | 0.96 | |||||
Diluted weighted average common shares outstanding | 22,090,770 | (446,607 | ) | 21,644,163 | |||||||
(Dollars in thousands, except for per share amounts) | As Previously Reported for the Three Months Ended December 31, 2015 | Adjustment | As Revised for the Three Months Ended December 31, 2015 | ||||||||
Income tax benefit | $ | 57,937 | $ | (3,989 | ) | $ | 53,948 | ||||
Net income | 72,721 | (3,989 | ) | 68,732 | |||||||
Basic net income per common share | 3.54 | (0.26 | ) | 3.28 | |||||||
Diluted net income per common share | 3.53 | (0.25 | ) | 3.28 | |||||||
The effect of these revisions on the Company's Consolidated Statement of Cash Flows is as follows:
(Dollars in thousands) | As Previously Reported At December 31, 2015 | Adjustment | As Revised At December 31, 2015 | ||||||||
Net income | $ | 84,235 | $ | (3,989 | ) | $ | 80,246 | ||||
Deferred income tax (benefit) expense | (59,007 | ) | 3,989 | (55,018 | ) | ||||||
Use of Estimates
The preparation of these consolidated financial statements requires management to make estimates and judgments that affect the reported amounts of assets, liabilities, revenues, expenses and related disclosures. On an on-going basis, we evaluate estimates and assumptions, including but not limited to those related to the impairment of long-lived assets, intangible assets subject to amortization and goodwill, accounts receivable allowances, revenue recognition, depreciation expense, asset retirement obligations, severance and income taxes. We base our estimates on historical experience and various other assumptions that are believed to be reasonable under the circumstances, the results of which form the basis for making judgments about the carrying values of assets and liabilities that are not readily apparent from other sources. Actual results may differ from these estimates under different assumptions or conditions.
Revenue Recognition
We recognize revenue when four basic criteria have been met:
• | there is persuasive evidence that an arrangement exists; |
• | delivery has occurred or services rendered; |
• | the fee is fixed or determinable; and |
• | collectability is reasonably assured. |
Amounts billed to customers, but not meeting the above revenue recognition criteria are deferred until all four criteria have been met.
Signed agreements are used as evidence of an arrangement. If a contract signed by the customer does not exist, we use a purchase order as evidence of an arrangement. If both a signed contract and a purchase order exist, we consider the signed contract to be the final persuasive evidence of an arrangement. At the time a contract is executed, we evaluate the contract to assess whether the fee is fixed or determinable. If the fee is assessed as not being fixed or determinable, revenue recognition is delayed until this assessment can be made. Additionally, we review customer creditworthiness and our historical ability to collect payments when due.
Our wireless revenue consists primarily of service, rental and maintenance fees charged to customers on a monthly, quarterly or annual basis. Revenue also includes the sale of messaging devices directly to customers and other companies that resell our services. With respect to revenue recognition for multiple deliverables, we evaluated these revenue arrangements and determined that two separate units of accounting exist, paging service revenue and product sales. We recognize paging service revenue over the period the service is performed; revenue from product sales is recognized at the time of shipment or installation. We have a variety of billing arrangements with our customers resulting in deferred revenue from advance billings and accounts receivables for billing in-arrears arrangements.
F- 10
Our software revenue consists primarily of the sale of software (license fees), professional services (primarily installation and training), equipment (to be used in conjunction with the software) and maintenance support (post-contract support). The software is licensed to end users under an industry standard software license agreement. Our software products are considered to be “off-the-shelf software” as the software is marketed as a stock item that customers can use without customization.
Software revenue consists of two primary components: (1) operations revenue consisting of software license revenue, professional services revenue and equipment revenue, and (2) maintenance revenue.
We generally sell software licenses, professional services, equipment and maintenance in multiple-element arrangements. At inception of the arrangement, we allocate the arrangement consideration to the software deliverables (software licenses, professional services and maintenance) as a group and to the non-software deliverables (equipment and maintenance on equipment, when applicable) using the relative selling price method. When performing this allocation, the estimated selling price for each deliverable is based on vendor specific objective evidence of fair value (“VSOE”), third party evidence of fair value (“TPE”), or if VSOE and TPE are not available, the best estimated selling price (“BESP”) for selling the element on a stand-alone basis. We have determined that TPE is not a practical alternative due to differences in our service offerings compared to other parties and the availability of relevant third-party pricing information. The amount of revenue allocated to delivered items is limited by contingent revenue, if any.
Our standard post contract support (maintenance) is allocated using VSOE as an input in the relative selling price allocation. For software licenses, professional services, equipment and premium maintenance we have determined that neither VSOE nor TPE is available and as such, we have used BESP as an input in order to allocate our arrangement fees. We determine BESP by considering our overall pricing objectives and market conditions. Significant pricing practices take into consideration our discounting practices, the size and volume of our transactions, the customer demographic, the geographic area where our services are sold, our price lists, our go-to-market strategy, historical standalone sales and contract prices. The determination of BESP is made through consultation with and approval by management, taking into consideration the go-to-market strategy. As our go-to-market strategies evolve, we may modify our pricing practices in the future, which could result in changes in relative selling prices, including both VSOE and BESP.
In multiple-element arrangements, the arrangement consideration allocated to our non-software deliverables (equipment) is generally recognized upon shipment or delivery to the customer depending on delivery method of Free on Board ("FOB") shipping or FOB destination, respectively.
For our software deliverables, which include software licenses, professional services, and post-contract support (maintenance), we further allocate arrangement consideration using the residual method. As noted above, we have not established VSOE for our software licenses, professional services and premium maintenance. However, we have established, and continue to maintain, VSOE for our standard post-contract support (maintenance). We recognize contract revenue ratably over the longer of the estimated services delivery period or the maintenance term. If delivery of the software and services is completed before the end of the maintenance period, then the remaining revenue associated with these elements is recognized in full at this time. Any unrecognized revenue related to maintenance continues to be recognized ratably over the remaining term of the maintenance period. If the period of delivery to the customer is not known, license and professional services revenue will be recognized when software and professional services are fully delivered to the customer and the maintenance revenue will be recognized ratably over the remaining contractual term of the agreement. The defined services period for most of our projects is shorter than the maintenance term.
The Company recognizes deferred revenue when it receives payments in advance of the delivery of products or the performance of services. Our deferred balance represents the contractual obligation for maintenance, software license, professional services and wireless services for which we have received payment in advance of meeting the revenue recognition criteria. We will recognize revenue when the goods or services meet our revenue recognition criteria.
Impairment of Long-Lived Assets, Intangible Assets Subject to Amortization and Goodwill
We are required to evaluate the carrying value of our long-lived assets, amortizable intangible assets and goodwill. Amortizable intangible assets include customer related intangibles, technology based intangibles, contract based intangibles and marketing intangibles that primarily resulted from our previous acquisitions. Such intangibles are amortized over periods up to ten years. Quarterly, we assess whether circumstances exist which suggest that the carrying value of long-lived and amortizable intangible assets may not be recoverable. When applicable, we assess the recoverability of the carrying value of our long-lived assets and certain amortizable intangible assets based on estimated undiscounted cash flows to be generated from such assets. In assessing the recoverability of these assets, we forecast estimated enterprise-level cash flows based on various operating assumptions such as revenue forecasted by product line and in-process research and development cost. If the forecast of undiscounted cash flows does not exceed the carrying value of the long-lived and amortizable intangible assets, we would record an impairment charge to the extent the carrying value exceeded the fair value of such assets.
F- 11
Goodwill resulting from our acquisitions is not amortized but is evaluated for impairment at least annually, or when events or circumstances suggest a potential impairment has occurred. We generally perform this annual impairment test in the fourth quarter of the reporting period. We evaluate goodwill for impairment between annual tests if indicators of impairment exist. The first step of the impairment test involves comparing the fair value of the reporting unit with its carrying value. If the reporting unit’s fair value is less than the carrying amount of the reporting unit, we compare the implied fair value of the affected reporting unit’s goodwill with the carrying value of that goodwill. The amount by which the implied fair value is less than the carrying value of the goodwill, if any, is recognized as an impairment loss. For purposes of the goodwill impairment evaluation, the Company as a whole is considered the reporting unit. The fair value of the reporting unit is estimated under a market based approach using the fair value of the Company's common stock. A confirmatory discounted cash flow analysis is also used to assess whether impairment exists. This calculation requires significant judgments, including estimation of future cash flows, which is dependent on internal forecasts, estimation of the long-term rate of growth for our business, estimation of the useful life over which cash flows will occur and determination of our weighted average cost of capital.
We did not record any impairment of long-lived assets, definite lived intangible assets or goodwill for the years ended December 31, 2016, 2015 and 2014.
Accounts Receivable Allowances
Our two most significant allowance accounts are: an allowance for doubtful accounts and an allowance for service credits. Provisions for these allowances are recorded on a monthly basis and are included as a component of general and administrative expenses and a reduction of revenue, respectively. Accounts receivable was recorded net of $1.1 million and $1.3 million allowance for the periods ended December 31, 2016 and 2015, respectively.
Estimates are used in determining the allowance for doubtful accounts and are based on historical collection experience and current and forecasted trends. In determining these percentages, we review historical write-offs, including comparisons of write-offs to provisions for doubtful accounts and as a percentage of revenues. We compare the ratio of the allowance to gross receivables to historical levels, and monitor amounts collected and related statistics. We write off receivables when they are deemed uncollectible. While write-offs of customer accounts have historically been within our expectations and the provisions established, we cannot guarantee that the future write-off experience will be consistent with historical experience, which could result in material differences in the allowance for doubtful accounts and related provisions.
The allowance for service credits and maintenance related provisions is based on historical credit percentages, current credit and aging trends, historical actual payment trends and actual credit experience. We analyze our past credit experience over several time frames. Using this analysis along with current operational data including existing experience of credits issued and the time frames in which credits are issued, we establish an appropriate allowance for service credits. This allowance also reduces accounts receivable for lost and non-returned pagers to the expected realizable amounts and for free wireless services. In addition, this allowance reduces software maintenance revenue. While credits issued have been within our expectations and the provisions established, we cannot guarantee that future credit experience will be consistent with historical experience, which could result in material differences in the allowance for service credits and maintenance related provisions.
Inventory
Inventories are stated at the lower of cost or net realizable value. Cost is computed using a weighted average cost approach which blends the prices at which goods are purchased from vendors. We evaluate our ending inventories for shrinkage and estimated obsolescence. Any shrinkage identified is written off to cost of goods sold in the period in which the shrinkage is identified. Further, we assess the impact of changing technology on our inventories and we write off inventories that are considered obsolete in the period in which the analysis takes place. Inventory consists primarily of finished goods. We do not account for inventory as work-in-process or raw materials as any such inventory would be immaterial to the consolidated financial statements.
Property and Equipment
Property and equipment are reported at cost and are depreciated using the straight-line method based on estimated useful lives which range from one to five years.
Transmitter assets are grouped into tranches based on our transmitter decommissioning forecast and are depreciated using the group life method on a straight-line basis. Depreciation expense is determined by the expected useful life of each tranche of the underlying transmitter assets. The expected useful life is based on our forecasted usage of those assets and their retirement over time and aligns the useful lives of these transmitter assets with their planned removal from service. Disposals are charged against accumulated depreciation with no gain or loss recognized. This rational and systematic method matches the underlying usage of these assets to the underlying revenue that is generated from these assets. Depreciation expense for these assets is subject to change based upon revisions in the timing of transmitter deconstruction resulting from our long-range planning and network rationalization process.
F- 12
Asset Retirement Obligations
We recognize liabilities and corresponding assets for future obligations associated with the retirement of assets. We have paging equipment assets, principally transmitters, which are located on leased locations. The underlying leases generally require the removal of equipment at the end of the lease term; therefore, a future obligation exists. Asset retirement costs are reflected in paging equipment assets with depreciation expense recognized over the estimated lives, which range between one and five years. The asset retirement costs and the corresponding liabilities that have been recorded to date generally relate to either current plans to consolidate networks or to the removal of assets at a future terminal date. When an asset retirement obligation arises, the liabilities and corresponding assets are recorded at their present value using a discounted cash flow approach and the liabilities are accreted using the interest method.
The recognition of an asset retirement obligation requires that management make numerous assumptions regarding such factors as the cost and timing of deconstruction; the credit-adjusted risk-free rate to be used; inflation rates; and future advances in technology. The fair value estimate of contractor fees to remove each asset is assumed to escalate by 4% each year through the terminal date. The total estimated liability is based on the estimated future value of those costs and the timing of deconstruction.
We believe these estimates are reasonable at the present time, but we can give no assurance that changes in technology, our financial condition, the economy or other factors would not result in higher or lower asset retirement obligations. Any variations from our estimates would generally result in a change in the assets and liabilities in equal amounts, and operating results would differ in the future by any difference in depreciation expense and accretion expense (see Note 3, "Consolidated Financial Statement Components", and Note 6, "Asset Retirement Obligations", for additional details).
Severance
We continually evaluate our staffing levels to meet our business objectives for our operations and our strategy to reduce cost associated with the declining wireless revenue and subscriber base. Severance costs are reviewed periodically to determine whether a severance charge is required due to the Company's accounting for post-employment benefits. We are required to accrue post-employment benefits if certain specified criteria are met. Post-employment benefits include salary continuation, severance benefits and continuation of health insurance benefits.
From time to time, we will announce reorganization plans that may include eliminating positions. Each plan is reviewed to determine whether a restructuring charge is required to be recorded related to costs associated with exit or disposal activities. We are required to record an estimate of the fair value of any termination costs based on certain facts, circumstances and assumptions, including specific provisions included in the underlying reorganization plan.
Subsequent to recording such accrued severance and restructuring liabilities, changes in market or other conditions may result in changes to assumptions upon which the original liabilities were recorded that could result in an adjustment to the liabilities and, depending on the circumstances, such adjustment could be material (see Note 5, "Severance", and Note 11, "Employee Benefits Plan", for additional details).
Income Taxes
We file a consolidated U.S. Federal income tax return and income tax returns in state, local and foreign jurisdictions as required. The provision for current income taxes is calculated and accrued on income and expenses expected to be included in current year U.S. and foreign income tax returns. The provision for current income taxes may also include interest, penalties and an estimated amount reflecting uncertain tax positions.
Deferred income tax assets and liabilities are computed based on temporary differences between the financial statement values and the tax bases of assets and liabilities including net operating loss and tax credit carryforwards at the enacted tax rates expected to apply to taxable income when taxes are actually paid or recovered. Changes in deferred income tax assets and liabilities are included as a component of deferred income tax expense. Deferred income tax assets represent amounts available to reduce future income taxes payable. We provide a valuation allowance when we consider it “more likely than not” (greater than a 50% probability) that a deferred income tax asset will not be fully recovered. Adjustments to the valuation allowance are a component of the deferred income tax expense or benefit in the statements of income.
Assets and liabilities are established for uncertain tax positions taken or positions expected to be taken in income tax returns when such positions fail to meet the “more likely than not” threshold based on the technical merits of the positions. We assess whether previously unrecognized tax benefits may be recognized when the tax position is (1) more likely than not of being sustained based on its technical merits, (2) effectively settled through examination, negotiation or litigation, or (3) settled through actual expiration of the relevant tax statutes (see Note 8, "Income Taxes", for additional details).
F- 13
Research and Development
Development costs incurred in the research and development of new software products and enhancements to existing software products for external use are charged to operations and expensed as incurred. Until technological feasibility has been established, research and development costs are expensed as incurred. Material costs incurred after technological feasibility is established and before the product is ready for general release are capitalized and amortized on a straight-line basis over the estimated remaining economic life of the product or the ratio of current revenues to total projected product revenues, whichever is greater. To date, the time between technological feasibility and general release to the public has been extremely short and consequently expenses available for capitalization have been immaterial. Accordingly, all research and developments costs incurred to date have been expensed as incurred.
In previous filings, research and development costs were included within the service, rental and maintenance operating category. Beginning with our 2016 Form 10-K we have disclosed research and development costs separately within our Consolidated Financial Statements and have adjusted comparative periods accordingly.
Commissions Expenses
We pay a sales commission for each contract executed with a customer. We capitalize the commissions paid at contract execution and recognize the related expense as the revenue from the underlying contract is recognized. Commission expense was $5.6 million, $7.2 million and $8.5 million for the years ended December 31, 2016, 2015 and 2014, respectively. Commission expense is classified as selling and marketing expenses.
Shipping and Handling Costs
We incur shipping and handling costs to send and receive messaging devices and other equipment to/from our customers. Amounts billed to customers related to shipping and handling are classified as revenue and the Company's shipping and handling costs are classified as cost of sales. These costs are expensed as incurred.
Advertising Expenses
Advertising costs are charged to operations when incurred because they occur in the same period as the benefit is derived. Advertising costs are classified as selling and marketing expenses. We do not incur any direct response advertising costs. Advertising expenses were $1.8 million, $1.7 million and $2.3 million for the years ended December 31, 2016, 2015 and 2014, respectively. Advertising expenses incurred in 2014 included one-time advertising and related expenses of $0.7 million associated with the re-branding to the name Spok in July 2014.
Stock Based Compensation
We account for share-based payments to employees, including restricted stock units ("RSUs"), restricted common stock ("restricted stock") and the option to purchase common stock under the Employee Stock Purchase Plan ("ESPP") based on their fair value and the estimated number of shares we expect will vest based on the performance metrics associated with the award, if applicable. Fair value is measured based on the closing fair market value of the Company's common stock on the date of grant. Compensation expense is recognized on a straight line basis over the requisite service period. Forfeitures and withdrawals are accounted for on an as incurred basis.
Changes in our estimates of the expected attainment of performance targets are reflected in the amount of compensation expense that we recognize for the related instruments' during the interim reporting period when the change in estimate is determined and may cause the amount of compensation expense that we record for each period to vary. Further information regarding stock based compensation can be found in Note 9, "Stock Based Compensation".
Cash Equivalents
Cash equivalents include short-term, interest-bearing instruments purchased with initial or remaining maturities of three months or less when purchased.
Sales and Use Taxes
Sales and use taxes imposed on the ultimate consumer are excluded from revenue where we are required by law or regulation to act as collection agent for the taxing jurisdiction.
Fair Value of Financial Instruments
Our financial instruments include our cash, letters of credit (“LOCs”), accounts receivable and accounts payable. The fair value of cash, accounts receivable and accounts payable approximate their carrying values at December 31, 2016 and 2015 due to their short maturities.
F- 14
Earnings Per Common Share
The calculation of earnings per common share is based on the weighted-average number of common shares outstanding during the applicable period. The calculation for diluted earnings per common share recognizes the effect of all potential dilutive common shares that were outstanding during the respective periods, unless the impact would be anti-dilutive. Further information regarding earnings per common share can be found in Note 7, "Stockholders' Equity".
NOTE 2 - RECENT AND PENDING ACCOUNTING STANDARDS
Revenue
In May 2014, the Financial Accounting Standards Board (“FASB”) issued Accounting Standards Update (“ASU”) No. 2014-09, Revenue from Contracts with Customers. Since this ASU was issued, the FASB has issued several updates including ASU No. 2015-14 in July 2015 which delayed the effective date, ASU No. 2016-08 in March 2016 which updated guidance related to principal versus agent considerations, ASU No. 2016-10 in April 2016 which updated guidance related to the identification of performance obligations, ASU No. 2016-12 in May 2016 which updated guidance related to scope improvements and practical expedients and ASU No. 2016-20 which provided technical corrections and improvements but did not update guidance issued in prior updates. The effective date is January 1, 2018, and while early adoption to the original effective date of January 1, 2017 is permitted, we have elected not to early adopt.
ASU No. 2014-09 creates a five-step model that requires companies to exercise judgment when considering all relevant facts and circumstances in the determination of when and how revenue is recognized. The two permitted transition methods under the new standard are the full retrospective method, in which case the standard would be applied to each prior reporting period presented, or the modified retrospective method, in which case the cumulative effect of applying the standard would be recognized at the date of initial application. We have completed our review of the acceptable transition methods and have selected the modified retrospective approach. We currently believe the modified retrospective approach will have a material impact on both deferred revenue and retained earnings in our 2018 consolidated financial statements.
We currently believe the standard will materially impact our revenue recognition on a going-forward basis once adopted. While we continue to assess the potential impacts of this standard, we currently believe that the most significant impact relates to our accounting for software license revenue. We expect software license revenue to be recognized at the time of shipment rather than over a combined service period or subscription period. Due to the nuances of certain contracts the actual revenue recognition treatment required under the standard will be dependent on contract-specific terms and may vary in some instances from recognition at the time of shipment.
Leases
In February 2016, the FASB issued ASU No. 2016-02, Leases. The new standard establishes a right of use (“ROU”) model that requires a lessee to record a ROU asset and a lease liability on the balance sheet for all leases with terms longer than twelve months. Leases will be classified as either financing or operating with the classification affecting the pattern of expense recognition in the income statement.
ASU No. 2016-02 will be effective for fiscal years beginning on January 1, 2019, including the related interim periods and early adoption of the standard is permitted. A modified retrospective transition approach is required for capital and operating leases existing at, or entered into after, the beginning of the earliest comparative period presented in the financial statements, with certain practical expedients available. While we are still evaluating the impact of the potential new standard on our consolidated financial statements, we expect that upon adoption we will recognize ROU assets and lease liabilities and that the amounts could be material.
Stock Compensation
In March 2016, the FASB issued ASU No. 2016-09, Stock Compensation Expense. The new standard is primarily focused on income taxes and the presentation of taxes related to stock compensation, but also provides a simpler method of accounting for forfeitures. An entity will now be able to make an entity-wide accounting policy election to either estimate the number of awards that are expected to be forfeited, as permissible under existing GAAP, or account for forfeitures as incurred. The purpose of this ASU was to reduce cost and complexity of the accounting related to share-based payment awards issued to employees for public and private companies.
F- 15
ASU No. 2016-09 will be effective for fiscal years beginning after December 15, 2016, including interim periods within those fiscal years, and early adoption upon issuance of the ASU is permitted. We have adopted this new ASU effective January 1, 2016. As part of the adoption, we have made an accounting policy election to account for forfeitures as incurred rather than estimate the number of awards that are expected to be forfeited. The following summary provides further clarification of the transition approaches and the impact on the Company for each issue in ASU No. 2016-09 that requires a retrospective or modified retrospective approach:
• | For entities electing to account for forfeitures as they are incurred, a modified retrospective transition approach, with a cumulative-effect adjustment recognized in equity, is required for stock based compensation accounted for prior to the date on which the standard is adopted. We made the policy election to account for forfeitures as incurred and therefore, recorded a cumulative-effect adjustment in equity to account for this change in the first quarter of 2016. The overall impact to our consolidated financial statements is immaterial. Future forfeitures will be accounted for as they are incurred rather than estimating the number of awards that are expected to be forfeited at the time of grant. |
• | A retrospective transition approach is required for classification of employee taxes paid in the Statement of Cash Flows when an employer withholds shares for tax-withholding purposes. In the three months ended March 31, 2015, shares were withheld for tax-withholding purposes related to the payment of vested 2011 LTIP awards. Previously, the withholdings were classified as an operating activity within our Statement of Cash Flows. We have retrospectively reclassified those withholdings as a financing activity and the total reclassification was $3.8 million. |
• | There was no additional impact on our financial statements resulting from the adoption of ASU No. 2016-09 that required a retrospective or modified retrospective approach. Any additional requirements under this ASU will be accounted for on a prospective basis. |
Goodwill
In January 2017, the FASB issued ASU No. 2017-04, Intangibles - Goodwill and Other: Simplifying the Test for Goodwill Impairment. The new standard simplifies how an entity tests for goodwill by eliminating Step 2 from the goodwill impairment test. Step 2 measured a goodwill impairment loss by comparing the implied fair value of a reporting unit's goodwill with the carrying amount of that goodwill. By eliminating Step 2 an entity must now record an impairment to goodwill based on an analysis of the fair value of a reporting unit as compared to its carrying amount. An impairment charge is recognized for the amount that the carrying value exceeds the reporting unit's fair value.
ASU No. 2017-04 will be effective for fiscal years beginning on January 1, 2020. including interim periods within those fiscal years, and early adoption as of January 1, 2017 is permitted. All changes are to be accounted for on a prospective basis upon adoption. We continue to evaluate the impact ASU No. 2017-04 will have on our consolidated financial statements. We have not yet determined whether we will early adopt ASU No. 2017-04.
NOTE 3 - CONSOLIDATED FINANCIAL STATEMENT COMPONENTS
Depreciation, Amortization and Accretion
Depreciation, amortization and accretion consisted of the following for the periods stated:
For the Year Ended December 31, | |||||||||||
(Dollars in thousands) | 2016 | 2015 | 2014 | ||||||||
Depreciation | |||||||||||
Leasehold improvements | $ | 189 | $ | 233 | $ | 194 | |||||
Asset retirement costs | (277 | ) | (505 | ) | (289 | ) | |||||
Paging and computer equipment | 7,974 | 8,489 | 9,370 | ||||||||
Furniture, fixtures and vehicles | 294 | 353 | 925 | ||||||||
Total depreciation | 8,180 | 8,570 | 10,200 | ||||||||
Amortization | 4,160 | 4,735 | 5,722 | ||||||||
Accretion | 623 | 665 | 755 | ||||||||
Total depreciation, amortization and accretion expense | $ | 12,963 | $ | 13,970 | $ | 16,677 | |||||
F- 16
Property and Equipment, net
Property and equipment, net consisted of the following for the periods stated:
Useful Life (In Years) | For the Year Ended December 31, | ||||||||
(Dollars in thousands) | 2016 | 2015 | |||||||
Leasehold improvements | lease term | $ | 3,843 | $ | 3,699 | ||||
Asset retirement costs | 1-5 | 3,263 | 3,566 | ||||||
Paging and computer equipment | 1-5 | 113,175 | 114,390 | ||||||
Furniture, fixtures and vehicles | 3-5 | 2,852 | 2,648 | ||||||
Total property and equipment | 123,133 | 124,303 | |||||||
Accumulated depreciation | (110,315 | ) | (108,917 | ) | |||||
Total property and equipment, net | $ | 12,818 | $ | 15,386 | |||||
For purposes of assessing our asset retirement costs, we completed a review of the estimated useful life of our transmitter assets during the fourth quarter of 2016 (that are part of paging and computer equipment). This review was based on the results of our long-range planning and network rationalization process and indicated that the expected useful life of the last tranche of the transmitter assets was no longer appropriate. As a result of that review, the expected useful life of the final tranche of transmitter assets was extended from 2020 to 2021. This change resulted in a revision of the expected future depreciation expense for the transmitter assets and an immaterial impact to the consolidated financial statements beginning in the fourth quarter of 2016. We believe these estimates remain reasonable at the present time, but we can give no assurance that changes in technology, customer usage patterns, our financial condition, the economy or other factors would not result in changes to our transmitter decommissioning plans. Any further variations from our estimates could result in a change in the expected useful lives of the underlying transmitter assets and operating results could differ in the future by any difference in depreciation expense. The extension of the depreciable life was accounted for as a change in accounting estimate.
Other Current Liabilities
Other current liabilities consisted of the following for the periods stated:
December 31, | |||||||
(Dollars in thousands) | 2016 | 2015 | |||||
Accrued outside services | $ | 975 | $ | 1,455 | |||
Accrued network costs | 773 | 917 | |||||
Accrued accounting and legal | 467 | 458 | |||||
Accrued recognition awards | 299 | 370 | |||||
Deferred rent and other | 134 | 165 | |||||
Asset retirement obligations | 85 | 296 | |||||
Total other current liabilities | $ | 2,733 | $ | 3,661 | |||
Other Non-Current Liabilities
Other non-current liabilities consisted of the following for the periods stated:
December 31, | |||||||
(Dollars in thousands) | 2016 | 2015 | |||||
Asset retirement obligations | $ | 7,472 | $ | 7,543 | |||
Deferred rent and other | 942 | 1,269 | |||||
Dividends payable | 507 | 160 | |||||
Total other non-current liabilities | $ | 8,921 | $ | 8,972 | |||
F- 17
NOTE 4 - INTANGIBLE ASSETS, NET
Intangible Assets
Intangible assets consists of a covenant not to compete with a former executive which was amortized over a three year period and intangible assets related to the acquisition of Amcom Software, Inc. and subsidiaries ("Amcom") on March 3, 2011 that are being amortized over two to ten years. In 2015, we reviewed the remaining useful life of customer relationships that had initially been set to amortize over fifteen years. At the time the intangible assets were reassessed, they had been amortized for approximately three years. Upon reassessment, we determined the remaining useful life to be three years and are amortizing the remaining balance over this period. We have not recorded an impairment of our intangible assets during the years ended December 31, 2016, 2015 and 2014.
The net consolidated balance of intangible assets consisted of the following at December 31, 2016 and 2015:
As of December 31, | |||||||||||||||||||||||||
2016 | 2015 | ||||||||||||||||||||||||
(Dollars in thousands) | Useful Life (In Years) | Gross Carrying Amount | Accumulated Amortization | Net Carrying Amount | Gross Carrying Amount | Accumulated Amortization | Net Carrying Amount | ||||||||||||||||||
Customer relationships | 10 | $ | 25,002 | $ | (14,585 | ) | $ | 10,417 | $ | 25,002 | $ | (12,084 | ) | $ | 12,918 | ||||||||||
Acquired technology | 2 - 4 | 8,452 | (8,452 | ) | — | 8,452 | (8,339 | ) | 113 | ||||||||||||||||
Non-compete agreements | 3 | — | — | — | 2,370 | (2,352 | ) | 18 | |||||||||||||||||
Trademarks | 6 | 5,754 | (5,368 | ) | 386 | 5,754 | (3,839 | ) | 1,915 | ||||||||||||||||
Total amortizable intangible assets | 2-10 | $ | 39,208 | $ | (28,405 | ) | $ | 10,803 | $ | 41,578 | $ | (26,614 | ) | $ | 14,964 | ||||||||||
Estimated amortization of intangible assets for future periods was as follows:
For the year ending December 31, | (Dollars in thousands) | ||
2017 | $ | 2,886 | |
2018 | 2,500 | ||
2019 | 2,500 | ||
2020 | 2,500 | ||
2021 | 417 | ||
Total | $ | 10,803 | |
NOTE 5 - SEVERANCE
The components of the changes in severance liabilities, which are included under accrued compensation and benefits on the Consolidated Balance Sheets, for the periods stated were as follows:
(Dollars in thousands) | Severance | ||
Balance at January 1, 2015 | $ | 1,581 | |
Charges | 2,701 | ||
Cash paid | (2,926 | ) | |
Balance at December 31, 2015 | 1,356 | ||
Charges | 1,446 | ||
Cash paid | (1,347 | ) | |
Balance at December 31, 2016 | $ | 1,455 | |
Severance charges incurred in 2016 and 2015 related to staff reductions as we continue to match our employee levels with operational requirements and to a sales management realignment. Approximately $1.8 million of severance charges incurred in 2015 related to the departure of a former executive. The balance of accrued severance liabilities as of December 31, 2016 is expected to be paid during 2017.
F- 18
NOTE 6 - ASSET RETIREMENT OBLIGATIONS
The components of the changes in the asset retirement obligation liabilities for the periods stated were as follows:
(Dollars in thousands) | Short-Term Portion | Long-Term Portion | Total | ||||||||
Balance at January 1, 2015 | $ | 342 | $ | 6,805 | $ | 7,147 | |||||
Accretion | 125 | 540 | 665 | ||||||||
Amounts paid | (176 | ) | — | (176 | ) | ||||||
Increases and (reductions) recorded | (55 | ) | 258 | 203 | |||||||
Reclassifications | 60 | (60 | ) | — | |||||||
Balance at December 31, 2015 | 296 | 7,543 | 7,839 | ||||||||
Accretion | 36 | 587 | 623 | ||||||||
Amounts paid | (213 | ) | — | (213 | ) | ||||||
Reductions recorded | (134 | ) | (558 | ) | (692 | ) | |||||
Reclassifications | 100 | (100 | ) | — | |||||||
Balance at December 31, 2016 | $ | 85 | $ | 7,472 | $ | 7,557 | |||||
Increases and reductions other than accretion, reclassification and amounts paid primarily relate to changes in estimate of the underlying liability, specifically as it relates to updates in estimated costs to remove a transmitter and the estimated timing of removal. The cost associated with the estimated removal costs and timing refinements due to ongoing network rationalization activities is expected to accrete to a total liability of $9.0 million. The total estimated liability is based on the transmitter locations remaining after we have consolidated the number of networks we operate and assume the underlying leases continue to be renewed to that future date.
Accretion expense was $0.6 million, $0.7 million and $0.8 million for the periods ended December 31, 2016, 2015 and 2014, respectively. Accretion expense related solely to asset retirement obligations and was recorded based on the interest method utilizing the following discount rates for the specified periods:
Period | Discount Rate | |
2016 – January 1 through December 31 – Additions(1) | 11.50 | % |
2016 – December 31 - Incremental Estimates(2) | 12.09 | % |
2015 – January 1 through December 31 – Additions(1) | 10.48 | % |
2015 – December 31 - Incremental Estimates(2) | 11.50 | % |
2014 – January 1 through December 31 – Additions(1) | 10.48 | % |
2014 – December 31 - Incremental Estimates(2) | 12.10 | % |
(1) | Transmitters moved to new sites resulting in additional liability. Weighted average credit adjusted risk-free rate used to discount additions. |
(2) | Weighted average credit adjusted risk-free rate used to discount downward revision to estimated future cash flows. |
Additional information regarding related asset retirement costs, depreciation expense, accretion and liabilities can be found in Note 3, "Consolidated Financial Statement Components."
NOTE 7 - STOCKHOLDERS' EQUITY
General
Our authorized capital stock consists of 75 million shares of common stock, par value $0.0001 per share, and 25 million shares of preferred stock, par value $0.0001 per share.
At December 31, 2016 and 2015, we had no stock options outstanding.
At December 31, 2016 and 2015, there were 20,525,614 and 20,886,261 shares of common stock outstanding, respectively, and no shares of preferred stock outstanding.
F- 19
Dividends
For the three years ending December 31, 2016, 2015 and 2014 our Board of Directors declared cash dividends of $0.75, $0.625 and $0.50 per share of our outstanding common stock, respectively. An immaterial amount of dividends declared were related to unvested RSUs and unvested shares of restricted stock which are accrued for and paid when the applicable vesting conditions are met. Accrued cash dividends on forfeited RSUs and restricted stock are also forfeited. Cash dividends paid as disclosed in the statements of cash flows for the years ended December 31, 2016, 2015 and 2014 included previously declared cash dividends on vested RSUs and on shares of vested restricted stock issued to non-executive members of our Board of Directors.
On March 1, 2017, our Board of Directors declared a regular quarterly cash dividend of $0.125 per share of common stock, with a record date of March 17, 2017, and a payment date of March 30, 2017. This cash dividend of approximately $2.6 million will be paid from available cash on hand.
Common Stock Repurchase Program
On July 31, 2008, our Board of Directors approved a program to repurchase up to $50.0 million of our common stock in the open market during the twelve-month period commencing on or about August 5, 2008. As discussed below, this program has been extended at various times, most recently through December 31, 2016, with a repurchase authority of $10.0 million as of January 4, 2016.
We use available cash on hand and net cash provided by operating activities to fund the common stock repurchase program. This repurchase authority allows us, at management’s discretion, to selectively repurchase shares of our common stock from time to time in the open market depending upon market price and other factors.
For the year ended December 31, 2016, we purchased 388,255 shares of our common stock under the repurchase program for approximately $6.5 million (excluding commissions). From the inception of the program in August 2008 through December 31, 2016, we have repurchased a total of 7,817,708 shares of our common stock for approximately $85.5 million (excluding commissions).
Repurchased shares of our common stock were accounted for as a reduction to common stock and additional paid-in-capital in the period in which the repurchase occurred. All repurchased shares of common stock are returned to the status of authorized, but unissued, shares of the Company.
F- 20
Common stock purchased in 2016, 2015 and 2014 (including the purchase of common stock for tax withholdings) was as follows:
For the Three Months Ended | Total Number of Shares Purchased | Average Price Paid Per Share(1) | Total Number of Shares Purchased as Part of Publicly Announced Plans or Programs | Approximate Dollar Value of Shares That May Yet Be Purchased Under the Publicly Announced Plans or Programs (Dollars in thousands) | |||||||||
2014 | |||||||||||||
March 31, | — | $ | — | — | $ | 15,000 | |||||||
June 30, | — | — | — | 15,000 | |||||||||
September 30, | — | — | — | 15,000 | |||||||||
December 31, | 263,772 | 16.36 | 263,772 | 10,685 | |||||||||
Total for 2014 | 263,772 | $ | 16.36 | 263,772 | |||||||||
2015 | |||||||||||||
March 31, | 247,797 | (2) | $ | 17.31 | 27,467 | $ | 14,536 | ||||||
June 30, | 177,330 | 16.93 | 177,330 | 11,531 | |||||||||
September 30, | 502,942 | 16.52 | 502,942 | 3,224 | |||||||||
December 31, | 189,438 | 16.87 | 189,438 | — | |||||||||
Total for 2015 | 1,117,507 | $ | 16.82 | 897,177 | |||||||||
2016 | |||||||||||||
March 31, | 291,861 | $ | 16.76 | 291,861 | $ | 5,106 | |||||||
June 30, | 65,791 | 16.38 | 65,791 | 4,028 | |||||||||
September 30, | 13,884 | 16.46 | 13,884 | 3,800 | |||||||||
December 31, | 16,719 | 16.43 | 16,719 | 3,525 | |||||||||
Total for 2016 | 388,255 | $ | 16.67 | 388,255 | |||||||||
Total | 1,769,534 | $ | 16.72 | 1,549,204 | |||||||||
(1) | Average price paid per share excludes commissions of approximately $15,410. |
(2) | On March 6, 2015, we purchased a total of 220,330 shares of common stock from our CEO and other eligible employees at a price of $17.36 per share in payment of required tax withholdings for the common stock awarded under the 2011 LTIP. |
Net Income per Common Share
Basic net income per common share is computed on the basis of the weighted average common shares outstanding. Diluted net income per common share is computed on the basis of the weighted average common shares outstanding plus the effect of all potentially dilutive common shares including unvested and outstanding equity awards. Diluted net income per share was equal to basic net income per share for the year ended December 31, 2016, 2015 and 2014 respectively.
For the Year Ended December 31, | |||||||||||
(in thousands, except for share and per share amounts) | 2016 | 2015 | 2014 | ||||||||
Numerator: | |||||||||||
Net income | $ | 13,979 | $ | 80,246 | $ | 20,745 | |||||
Denominator: | |||||||||||
Weighted average shares used to compute net income per common share - basic and diluted | 20,586,066 | 21,471,041 | 21,644,163 | ||||||||
Basic and diluted net income per common share | $ | 0.68 | $ | 3.74 | $ | 0.96 | |||||
Spok Holdings, Inc. Equity Incentive Award Plan
We established the Spok Holdings, Inc. Equity Incentive Award Plan (the “2004 Equity Plan”) in connection with and prior to the November 2004 establishment of the Company. Under the 2004 Equity Plan, we had the ability to issue up to 1,878,976 shares of our common stock
F- 21
to eligible employees and non-executive members of the Board of Directors in the form of shares of common stock, stock options, restricted stock, RSUs or stock grants. Restricted stock granted under the 2004 Equity Plan entitled the stockholder to all rights of common stock ownership except that the restricted stock could not be sold, transferred, exchanged, or otherwise disposed of during the restriction period, which was to be determined by the Compensation Committee of the Board of Directors. RSUs are generally convertible into shares of common stock pursuant to a Restricted Stock Unit Agreement when the appropriate vesting conditions have been satisfied. The fair value of each RSU is the market price of our common stock on the date of grant.
On March 23, 2012, our Board of Directors adopted the Spok Holdings, Inc. 2012 Equity Incentive Award Plan (the “2012 Equity Plan”) that was subsequently approved by our stockholders on May 16, 2012. A total of 1,300,000 shares of common stock have been reserved for issuance under this plan. The 2012 Equity Plan replaced the 2004 Equity Plan. As of May 16, 2012, 894,986 shares available under the 2004 Equity Plan were available for grant under the 2012 Equity Plan. At inception, the total shares of common stock available for issuance under the 2012 Equity Plan was 2,194,986. No further grants will be made under the 2004 Equity Plan. However, the 2004 Equity Plan continued to govern all outstanding awards thereunder. As of December 31, 2016, there were no RSUs outstanding subject to the provisions of the 2004 Equity Plan. Any shares which were available for grant under the 2004 Equity Plan including awards that were forfeited or lapsed unexercised as of the date of stockholders’ approval will be available for grant under the 2012 Equity Plan.
Awards under the 2012 Equity Plan may be in the form of stock options, restricted stock, RSUs, performance awards (a cash bonus award, a stock bonus award, a performance award or an incentive award that is paid in cash), dividend equivalents, stock payment awards, deferred stock, deferred stock units, or stock appreciation rights.
The following table summarizes the activities under the 2012 Equity Plan from January 1, 2014 through December 31, 2016:
Activity | ||
Total equity securities available at January 1, 2014 | 1,720,752 | |
Add: LTIP RSUs forfeited by eligible employees | 57,338 | |
Less: Common stock awarded to eligible employees | (5,820 | ) |
Less: Restricted stock awarded to non-executive members of the Board of Directors | (24,684 | ) |
Total equity securities available at December 31, 2014 | 1,747,586 | |
Less: LTIP RSUs awarded to eligible employees, net of forfeitures | (242,468 | ) |
Less: Restricted stock awarded to non-executive members of the Board of Directors | (21,887 | ) |
Total equity securities available at December 31, 2015 | 1,483,231 | |
Less: LTIP RSUs awarded to eligible employees, net of forfeitures and other | (212,643 | ) |
Less: Restricted stock awarded to non-executive members of the Board of Directors | (23,649 | ) |
Total equity securities available at December 31, 2016 | 1,246,939 | |
Common Stock
On July 8, 2014, our Board of Directors granted 5,820 shares of common stock to certain eligible employees under the 2012 Equity Plan. The grant date fair value was $0.1 million based upon the closing price per share of our common stock of $15.74.
2011 Long Term Incentive Plan
On March 15, 2011, our Board of Directors adopted a long-term incentive program (over a 45 month vesting period) that included a stock component in the form of RSUs. The 2011 LTIP provided eligible employees the opportunity to earn RSUs based upon achievement of performance goals established by our Board of Directors for our revenue and operating cash flows during the period from January 1, 2011 through December 31, 2014 (the “performance period”), and continued employment with the Company. As it relates to eligible employees from Amcom, the performance period was considered as April 1, 2011, through December 31, 2014. Our Board of Directors approved that future cash dividends related to the existing RSUs will be set aside and paid in cash to each eligible employee when the RSUs are converted into shares of common stock. Existing RSUs would be converted into shares of common stock on the earlier of a change in control of the Company (as defined in the 2004 Equity Plan for RSUs granted before May 16, 2012, or the 2012 Equity Plan for grants on or after May 16, 2012) or on or after the third business day following the day that we file our 2014 Annual Report on Form 10-K (“2014 Annual Report”) with the SEC but in no event later than December 31, 2015. Any unvested RSUs awarded under the 2011 LTIP and the related cash dividends were forfeited if the participant terminates employment with Spok.
On April 7, 2011, our Board of Directors granted 211,587 RSUs to eligible employees under the 2004 Equity Plan pursuant to a Restricted Stock Unit Agreement. The grant date fair value was $3.0 million (net of estimated forfeitures) based upon the closing price per share of our common stock of $15.68. In 2012, our Board of Directors awarded 122,673 RSUs to eligible employees with a grant date fair value
F- 22
of $1.3 million (net of estimated forfeitures). During 2012, 101,294 RSUs and the related cash dividends were forfeited with a related fair value of $1.4 million. There were 232,966 outstanding RSUs under the 2011 LTIP as of December 31, 2012.
On December 27, 2012, our Board of Directors approved a modification to the 2011 LTIP performance goals for revenue and operating cash flows during the performance period as the original award was not expected to vest. This modification affected 18 eligible employees. As a result of reversing previously recognized compensation expense and recording compensation for the modified award, the Company recognized a benefit to stock based compensation expense of $0.2 million. We used the fair-value based method of accounting for the 2011 LTIP and amortized the remaining $1.6 million of the grant date fair value (net of estimated forfeitures) over the remaining vesting period.
In 2013, our Board of Directors awarded 434,811 RSUs to eligible employees under the 2012 Equity Plan for the 2011 LTIP pursuant to a Restricted Stock Unit Agreement with a grant date fair value of $5.2 million (net of estimated forfeitures). During 2013, 50,750 RSUs and the related cash dividends were forfeited with a related fair value of $0.5 million. As of December 31, 2013 there were 617,027 RSUs outstanding relating to the 2011 LTIP.
A total of $3.4 million, $2.8 million and $0.1 million was included in stock based compensation expense for the years ended December 31, 2014, 2013 and 2012, respectively, in relation to the 2011 LTIP. In addition to the benefit for the modification of $0.2 million, stock based compensation expense for the year ended December 31, 2012, included a net benefit of $0.4 million for forfeitures under the 2011 LTIP associated with the departure of two former executives.
On December 13, 2013, our Board of Directors approved a modification to the 2011 LTIP performance goals for operating cash flows during the performance period. The original award was expected to vest, therefore, the modification had no impact on the grant date fair value. This modification affected 51 eligible employees.
During 2014, 57,338 RSUs and the related cash dividends were forfeited with a related fair value of $0.6 million. As of December 31, 2014 there were 559,689 RSUs outstanding relating to the 2011 LTIP.
On December 31, 2014, the RSUs under the 2011 LTIP satisfied the vesting requirements. The Company converted 559,689 RSUs into shares of common stock and issued the common stock and paid the cumulative cash dividends earned on the RSUs to the participants in March 2015 after filing the 2014 Annual Report with the SEC. In March 2015, 217,211 shares of common stock, net of other activity, were sold to the Company for required income tax withholding on the vested RSUs under the 2011 LTIP.
2015 Long Term Incentive Plan
On December 9, 2014, our Board of Directors adopted the 2015 LTIP (which provides for a 36 month vesting period) that included a stock component in the form of RSUs. Under this incentive program, RSUs will be granted to eligible employees annually and each annual grant will generally vest over a three year service period. Each annual grant includes performance metrics required to be met for vesting purposes, as established by the Board of Directors. Our Board of Directors also approved that future cash dividends related to the RSUs will be set aside and paid in cash to each eligible employee when the RSUs are converted into shares of common stock. RSUs would be converted into shares of common stock on the earlier of a change in control of the Company (as defined in the 2015 LTIP) or on or after the third business day following the day that we file the Annual Report on Form 10-K with the SEC for the grant's final vesting year, but in no event later than December 31 of the year following the vesting date if the pre-established performance conditions are achieved. Any unvested RSUs awarded under the 2015 LTIP and the related cash dividends are forfeited if the participant terminates employment with the Company.
On January 2, 2015, our Board of Directors granted 254,777 RSUs with a grant date fair value of $4.4 million. An additional 6,123 RSUs were granted to eligible employees who were promoted or joined the Company during the twelve months ended December 31, 2015. On January 28, 2016 our Board of Directors issued a second grant of 227,082 RSUs with a grant date fair value of $3.8 million. An additional 7,629 RSUs were granted to eligible employees who were promoted or joined the Company during the twelve months ended December 31, 2016. All issuances were made to eligible employees under the 2012 Equity Plan for the 2015 LTIP pursuant to a Restricted Stock Unit Agreement. Eligible employees have the opportunity to earn RSUs based upon continued employment with the Company and the achievement of performance goals established by our Board of Directors for our consolidated revenue and operating cash flows (as defined by the Company) during the period of January 1, 2015 through December 31, 2017 (“the 2015-2017 performance period”) for the 2015 grant and the period of January 1, 2016 through December 31, 2018 ("the 2016-2018 performance period") for the 2016 grant, respectively. (For additional details regarding stock compensation refer to Note 9, "Stock Based Compensation")
F- 23
The following table details activities with respect to outstanding RSUs under the 2015 LTIP for the year ended December 31, 2016:
Shares | Weighted- Average Grant Date Fair Value | Total Unrecognized Compensation Cost (net of estimated forfeitures) (In thousands) | Weighted-Average Period Over Which Cost is Expected to be Recognized (In months) | ||||||||||
Non-vested RSUs at January 1, 2015 | — | $ | — | ||||||||||
Granted | 260,900 | $ | 17.35 | ||||||||||
Vested | — | — | |||||||||||
Forfeited | (18,432 | ) | 17.36 | ||||||||||
Non-vested RSUs at December 31, 2015 | 242,468 | $ | 17.35 | $ | 2,708 | 24 | |||||||
Granted | 234,711 | $ | 16.83 | ||||||||||
Vested | — | — | |||||||||||
Forfeited | (25,686 | ) | 17.05 | ||||||||||
Non-vested RSUs at December 31, 2016 | 451,493 | $ | 17.10 | $ | 1,882 | 18 | |||||||
Employee Stock Purchase Plan
On July 25, 2016, our stockholders approved the registration with the SEC of 250,000 shares of common stock, to be issued from time to time in connection with purchases under the Spok Holdings, Inc. 2016 Employee Stock Purchase Plan ("2016 ESPP"). Shares were first offered for purchase under the 2016 ESPP during the third quarter of 2016. Under the 2016 ESPP, eligible participants can voluntarily elect to have contributions withheld from their pay for the duration of an offering period, subject to the 2016 ESPP limits. At the end of an offering period, contributions will be used to purchase the Company's common stock at a discount to the market price based on the first or last day of the offering period, whichever is lower. Participants are required to hold common stock for a minimum period of two years from the grant date. Participants will begin earning dividends on shares after the purchase date. Each offering period will generally last for no longer than six months. Once an offering period begins, participants cannot adjust their withholding amount. If a participant chooses to withdraw, any previously withheld funds will be returned to the participant, with no stock purchased, and that participant will be eligible to participate in the 2016 ESPP at the next offering period. If the participant terminates employment with the Company during the offering period, all contributions will be returned to the employee and no stock will be purchased at a discounted rate.
We use the Black-Scholes model to calculate the fair value of the options to purchase common stock, under the 2016 ESPP, at the grant date due to the look back feature included in the 2016 ESPP. The look back feature allows for the purchase of common stock at a discount based on the price at the time of grant or purchase date, whichever is lower. The Black-Scholes model requires the use of estimates for the expected term, the expected volatility of the underlying common stock over the expected term, the risk-free interest rate and the expected dividend payment. The fair value of the discount is the difference between the fair value of the underlying stock price at grant date and the discounted purchase price at grant date. The fair value of the look back feature is estimated to be a call option at the discounted rate combined with a put option on one minus the discounted rate where the discounted rate is equal to the discount being offered to participants under the 2016 ESPP. The fair value of the options to purchase common stock under the 2016 ESPP is the combination of the fair value of the discount and the fair value of the look back feature.
F- 24
We base the risk-free rate for the expected term on the U.S. Treasury Rate as of the grant date. The expected term is equal to the required holding period of two years. The volatility for our common stock was estimated based on the standard deviation of monthly variances in stock price using a rolling three year history of the Company's stock price. Because the expected term includes a period for which a participant earns (the two year holding period less the offering period) and does not earn dividends (the offering period) our fair value is equal to the sum of the Black-Scholes model amount, run for the non-dividend yielding period, plus the Black Scholes model amount, run for the dividend yielding period (for which the total period is equal to the expected term). We use the discrete dividend yield method due to our consistent and routine history of paying dividends. The following assumptions were used for each respective period for employee stock-based compensation related to the 2016 ESPP:
For the Year Ended December 31, | ||||||
2016 | 2015 | |||||
Expected term (in years) | 2.00 | — | ||||
Volatility | 7.89% - 8.03% | — | ||||
Risk-free interest rate | 0.34% - 0.80% | — | ||||
Dividend payment | $0.125 - 0.250 | $ | — | |||
For the year ended December 31, 2016, 3,961 shares of common stock were purchased by employees under the plan. The following table summarizes the activities under the ESPP from January 1, 2016 through December 31, 2016:
Activity | ||
Total ESPP equity securities available at January 1, 2016 | — | |
Plus: Registration of 2016 ESPP | 250,000 | |
Less: 2016 ESPP common stock purchased by eligible employees, net | (3,961 | ) |
Total 2016 ESPP securities available at December 31, 2016 | 246,039 | |
Amounts withheld from participants will be classified as a liability on the balance sheet until funds are used to purchase shares. This liability amount is immaterial to the overall financial statements.
Board of Directors Compensation
On August 1, 2007, for periods of service beginning on July 1, 2007, and subsequently updated on July 23, 2013, our Board of Directors approved that, in lieu of RSUs, each non-executive director will be granted in arrears on the first business day following the quarter of service, restricted stock under the 2012 Equity Plan for their service on the Board of Directors and committees thereof. The restricted stock will be granted quarterly based upon the closing price per share of our common stock at the end of each quarter, such that each non-executive director will receive $60,000 per year of restricted stock ($70,000 for the Chair of the Audit Committee). The restricted stock will vest on the earlier of a change in control of the Company (as defined in the 2012 Equity Plan for grants on or after May 16, 2012) or one year from the date of grant, provided, in each case, that the non-executive director maintains continuous service on the Board of Directors. Future cash dividends related to the restricted stock will be set aside and paid in cash to each non-executive director on the date the restricted stock vests. In addition to the quarterly restricted stock grants, the non-executive directors will be entitled to cash compensation of $45,000 per year ($55,000 for the Chair of the Audit Committee), also payable quarterly. These sums are payable, at the election of the non-executive director, in the form of cash, shares of common stock or any combination thereof. No directors have elected common stock in lieu of cash payments for their services during the years ended December 31, 2016, 2015 and 2014. The non-executive directors are required to hold shares of common stock and/or restricted stock equal to three times their annual cash compensation ($135,000 for each non-executive director and $165,000 for the Chair of the Audit Committee) as measured on June 30th of each year. Should the value of the non-executive director’s holdings fall below the established minimum, the non-executive director will be deemed in compliance with the requirement provided that the non-executive director retained shares equal to the total number of restricted stock granted during the preceding three years. All non-executive directors will have a three year grace period to reach this ownership threshold.
F- 25
The following table details information on the restricted stock awarded to our non-executive directors during the three years ended December 31, 2016:
Service for The Three Months Ended | Grant Date | Price Per Share(1) | Restricted Stock Awarded | |||||
December 31, 2013 | January 1, 2014 | $ | 14.28 | 6,475 | ||||
March 31, 2014 | April 1, 2014 | 18.17 | 5,093 | |||||
June 30, 2014 | July 1, 2014 | 15.40 | 6,006 | |||||
September 30, 2014 | October 1, 2014 | 13.01 | 7,110 | |||||
December 31, 2014 | January 1, 2015 | 17.36 | 5,328 | |||||
March 31, 2015 | April 1, 2015 | 19.17 | 4,823 | |||||
June 30, 2015 | July 1, 2015 | 16.84 | 5,494 | |||||
September 30, 2015 | October 1, 2015 | 16.46 | 6,242 | |||||
December 31, 2015(2) | January 1, 2016 | 18.32 | 5,869 | |||||
March 31, 2016(2) | April 1, 2016 | 17.51 | 6,141 | |||||
June 30, 2016(2) | July 1, 2016 | 19.17 | 5,605 | |||||
September 30, 2016(2) | October 1, 2016 | 17.82 | 6,034 | |||||
Total | 70,220 | |||||||
(1) | The quarterly restricted stock awarded is based on the price per share of our common stock on the last trading day prior to the quarterly award date. |
(2) | The Board of Directors voted to grant a full award for services provided during the fourth quarter of 2016 and fully vest all unvested restricted stock for the Company's former Chairman of the Audit Committee who died on November 14, 2016. |
The shares of restricted stock will vest one year from the date of grant and the related cash dividends on the vested restricted stock will be paid to our non-executive directors at vesting.
NOTE 8 - INCOME TAXES
The significant components of our income tax (benefit) expense attributable to current operations for the periods stated were as follows:
For the Year Ended December 31, | |||||||||||
(Dollars in thousands) | 2016 | 2015 | 2014 | ||||||||
Income before income tax expense (benefit) | $ | 22,971 | $ | 26,298 | $ | 27,327 | |||||
Current: | |||||||||||
Federal tax | $ | 669 | $ | 432 | $ | 753 | |||||
State tax | 1,294 | 622 | 1,087 | ||||||||
Foreign tax | 103 | 16 | 2 | ||||||||
Total current | 2,066 | 1,070 | 1,842 | ||||||||
Deferred: | |||||||||||
Federal tax | 6,811 | (55,716 | ) | 6,046 | |||||||
State tax | 41 | 1,020 | (1,249 | ) | |||||||
Foreign tax | 74 | (322 | ) | (57 | ) | ||||||
Total deferred | 6,926 | (55,018 | ) | 4,740 | |||||||
Total income tax expense (benefit) | $ | 8,992 | $ | (53,948 | ) | $ | 6,582 | ||||
Foreign income before income tax expense is immaterial to consolidated income before income tax expense.
F- 26
The following table summarizes the principal elements of the difference between the United States Federal statutory rate of 35% and our effective tax rate:
Effective tax rate reconciliation | 2016 | 2015 | 2014 | |||||||||||||||||
(Dollars in thousands) | ||||||||||||||||||||
Income before income tax expense | $ | 22,971 | $ | 26,298 | $ | 27,327 | ||||||||||||||
Federal income tax expense at the Federal statutory rate | $ | 8,040 | 35.0 | % | $ | 9,204 | 35.0 | % | $ | 9,564 | 35.0 | % | ||||||||
State income taxes, net of Federal benefit | 867 | 3.8 | % | 1,021 | 3.9 | % | 1,188 | 4.3 | % | |||||||||||
Change in valuation allowance | — | — | % | (64,159 | ) | (244.0 | )% | (5,087 | ) | (18.6 | )% | |||||||||
Other, including permanent differences | 85 | 0.4 | % | (14 | ) | (0.1 | )% | 917 | 3.4 | % | ||||||||||
Income tax expense (benefit) | $ | 8,992 | 39.1 | % | $ | (53,948 | ) | (205.1 | )% | $ | 6,582 | 24.1 | % | |||||||
Income tax expense increased by $62.9 million for the year ended December 31, 2016 compared to the same period in 2015 due primarily to a $64.2 million one-time favorable adjustment to the deferred income tax asset ("DTA") valuation allowance in 2015. This was partially offset by $1.2 million in lower income tax expense related to a decrease of $3.3 million in income before income tax expense and $0.1 million in other changes. The decrease of $60.5 million in income tax expenses for the year ended December 31, 2015 compared to the same period in 2014 was due primarily to a $59.1 million greater reduction in the deferred income tax asset valuation allowance in 2015 than in 2014 and $1.4 million in other changes.
During the year ended December 31, 2016, the US Court of Appeals for the Second Circuit affirmed a Tax Court Decision, unrelated to Spok, regarding the allocation of cancellation of debt income to tax attributes for a company that filed a Federal consolidated income tax return. This impacted the ultimate realization of certain of our net operating loss ("NOL") carryovers. Therefore, during the year ended December 31, 2016, we wrote off our valuation allowance of $50.0 million against the related Federal and State NOL DTAs. This had no impact on the 2016 income tax provision or net income.
The net deferred income tax assets at December 31, 2016 and 2015 were as follows:
December 31, | |||||||
(Dollars in thousands) | 2016 | 2015 | |||||
Long-term: | |||||||
Net deferred income tax asset | $ | 73,068 | $ | 130,025 | |||
Valuation allowance | — | (50,031 | ) | ||||
Total deferred income tax assets | $ | 73,068 | $ | 79,994 | |||
F- 27
The components of deferred income tax assets at December 31, 2016 and 2015 were as follows:
December 31, | |||||||
(Dollars in thousands) | 2016 | 2015 | |||||
Net operating losses and tax credits | $ | 48,146 | $ | 111,538 | |||
Property and equipment | 12,995 | 12,628 | |||||
Accruals and accrued loss contingencies | 6,723 | 5,410 | |||||
Intangible Assets | 5,886 | 760 | |||||
Gross deferred income tax assets | 73,750 | 130,336 | |||||
Deferred income tax liabilities: | |||||||
Prepaid expenses | (360 | ) | (311 | ) | |||
Other | (322 | ) | — | ||||
Gross deferred income tax liabilities | (682 | ) | (311 | ) | |||
Net deferred income tax assets | $ | 73,068 | $ | 130,025 | |||
Valuation allowance | — | (50,031 | ) | ||||
Total deferred income tax assets | $ | 73,068 | $ | 79,994 | |||
Net Operating Losses
As of December 31, 2016, we had approximately $125.7 million of NOLs available to offset future taxable income. The Federal NOLs begin expiring in 2025 and will fully expire in 2029. We have foreign NOLs available for future years of approximately $1.7 million which do not expire, foreign tax credits of $0.4 million and AMT minimum tax credit carryforwards of $2.2 million.
Valuation Allowance
We assess the recoverability of our deferred income tax assets, which represent the tax benefits of future tax deductions, NOLs and tax credits, by considering the adequacy of future taxable income from all sources. This assessment is required to determine whether based on all available evidence, it is “more likely than not” (which means a probability of greater than 50%) that all or some portion of the DTAs will be realized in future periods. The DTA valuation allowance balances at December 31, 2016 and 2015 were $0.0 and $50.0 million, respectively. The valuation allowance reduces the DTAs to their estimated recoverable amounts.
As previously mentioned, as of December 31, 2016, our DTAs consist primarily of NOLs that can be used to offset future taxable income. The assessment of recoverability is required to determine whether based on all available evidence, it is more likely than not that all or some portion of the deferred income tax assets will be realized in future periods. The US Court of Appeals for the Second Circuit affirmed a Tax Court Decision, unrelated to Spok, regarding the allocation of cancellation of debt income to tax attributes for a company that file a Federal consolidated income tax return. This impacted the ultimate realization of certain of our NOL carryovers. As such, during the year ended December 31, 2016, we reduced both our DTAs and the valuation allowance by $50.0 million, which left no remaining valuation allowance as of December 31, 2016, reflecting our assessment that this portion of DTAs would not be realized. This had no impact on our income tax provision or net income for the year ending December 31, 2016.
Consistent with prior years we completed a multi-year forecast of our operations that included taxable income for the period 2017-2021 (long range plan or “LRP”). This LRP of our operations was reviewed and approved by the Board of Directors on December 20, 2016. Based on the following factors determined in the fourth quarter 2016, we concluded that the Company would utilize all of our remaining DTAs.
1. | Through 2016, the Company has generated seven consecutive years (2010-2016) of taxable income. This period includes the acquisition of the software related operations in March 2011. In addition the Company has forecasted future taxable income (including the use of tax planning strategies such as the capitalization of research and development costs and amortization over a ten year period). |
2. | With the acquisition of the software related operations in March 2011, we have successfully merged the wireless and software operations, hired new software skilled management and rebranded the combined entity under the Spok name starting in July 2014. This rebranding effort has been successful throughout 2016. |
3. | In 2016, management clearly evaluated the risks and benefits associated with the strategy to redesign and enhance our software solution suite into an integrated critical communication platform. These benefits and risks were included in the LRP reviewed and approved by the Board of Directors on December 20, 2016. |
4. | Significant management changes were made during 2015 and 2016 to accomplish our goals and LRP. These included hiring a new president, an executive vice president of sales and new product development staff. |
F- 28
The long-term history of profitability, the demonstrated commitment to the growth of software revenue through investment in management and product development activities indicated that an analysis of both positive and negative evidence as required by ASC 740 was evaluated in the fourth quarter 2016. Based on the strength of the positive evidence the Company concluded no valuation allowance was required at December 31, 2016.
The anticipated effective income tax rate is expected to continue to differ from the Federal statutory rate of 35% primarily due to the effect of state income taxes, the effect of changes to the deferred income tax asset valuation allowance, permanent differences between book and taxable income and certain discrete items. The earnings of non-US subsidiaries are deemed to be indefinitely reinvested in non-US operations.
Income Tax Audits
Our Federal income tax returns have been examined by the Internal Revenue Service ("IRS") through December 31, 2008. The audits of the Federal returns for the years ended 2005 through 2008 resulted in no changes. The IRS also audited Amcom’s 2009 Federal tax return (pre-acquisition) with no changes. The 2013, 2014 and 2015 income tax returns of the Company have not been audited by the IRS and are within the statute of limitations (“SOL”).
We operate in all states and the District of Columbia and are subject to various state income and franchise tax audits. The states’ SOL varies from three to four years from the later of the due date of the return or the date filed. We usually file our Federal and all state and local income tax returns on or before September 15 of the following year; therefore, the SOL for those states with a three year SOL is open for calendar years ending 2013 through 2016, and for the four year SOL states, the SOL is open for years ending from 2012 through 2016.
NOTE 9 - STOCK BASED COMPENSATION
Compensation expense associated with common stock, RSUs and restricted stock was recognized based on the fair value of the instruments, over the instruments’ vesting period. Stock based compensation expense decreased by $1.0 million for the year ended December 31, 2016 from the same period in 2015 primarily due to a one-time reversal of $2.0 million in stock compensation expense related to the 2015 and 2016 awards issued under the 2015 LTIP partially offset by the issuance and amortization of the 2016 grants under the 2015 LTIP. As of December 31, 2016 we do not currently believe it is probable that 50% of the awards issued in 2015 and 2016 will vest based on the related performance criteria and our assessment of the anticipated future performance applied to the performance criteria. The remaining 50% of awards expected to vest will continue to be expensed accordingly over the remaining applicable service periods. Stock based compensation expense decreased by $2.0 million for the year ended December 31, 2015 from the same period in 2014 primarily due to a lower number of shares issued for the 2015 grant under the 2015 LTIP plan as compared to the 2011 LTIP plan, which resulted in lower stock based compensation expense. Stock based compensation expense for the year ended December 31, 2015 also included a one-time charge of $0.3 million related to the departure of an executive.
The following table reflects the statement of income line items for stock based compensation expense for the periods stated:
Operating Expense Category | For the Year Ended December 31, | ||||||||||
(Dollars in thousands) | 2016 | 2015 | 2014 | ||||||||
Cost of revenue (LTIP) | $ | 56 | $ | 134 | $ | 351 | |||||
Research and development (LTIP) | 52 | 86 | 90 | ||||||||
Service, rental and maintenance (LTIP) | 13 | 29 | 18 | ||||||||
Selling and marketing (LTIP) | 67 | 111 | 544 | ||||||||
General and administrative (LTIP) | 225 | 1,138 | 2,498 | ||||||||
General and administrative (ESPP) | 23 | — | — | ||||||||
General and administrative (Board of Directors Restricted Stock) | 418 | 370 | 337 | ||||||||
Total stock based compensation | $ | 854 | $ | 1,868 | $ | 3,838 | |||||
F- 29
NOTE 10 - COMMITMENTS AND CONTINGENCIES
Contractual Obligations
We incurred significant commitments and contractual obligations as of December 31, 2016 as outlined below.
We have entered into two exclusive agreements with vendors to purchase a minimum number of paging devices with one commitment beginning in 2015, one commitment beginning in 2016 and both commitments ending in 2018. The total purchase commitment of these agreements is $10.2 million of which $4.0 million remained as of December 31, 2016. The minimum purchase requirement must be met prior to the end of each agreement, however there is no requirement that we purchase a minimum amount during interim periods.
Other Commitments
We have various LOCs outstanding with multiple state agencies which are considered to be immaterial to the consolidated financial statements. The LOCs typically have one to three-year contract requirements and contain automatic renewal terms.
Legal Contingencies
We are involved, from time to time, in lawsuits arising in the normal course of business. We believe these pending lawsuits will not have a material adverse impact on our financial position or statement of income.
On January 23, 2017, 911 Notify, Inc. filed a lawsuit against us in the United States District Court for the Eastern District of Texas alleging infringement of U.S. Patent Nos. 6,151,385; 6,775,356; and 8,965,447 pertaining to our software solution for notification of 911 emergency calls. We have settled this lawsuit for an immaterial amount.
Operating Leases
We have operating leases for office and transmitter locations. Substantially all of these leases have lease terms ranging from one month to five years. We continue to review our office and transmitter locations, and intend to replace, reduce or consolidate leases, where possible.
Future minimum lease payments under non-cancelable operating leases at December 31, 2016 were as follows:
For the Year Ended December 31, | (Dollars in thousands) | ||
2017 | $ | 6,672 | |
2018 | 4,421 | ||
2019 | 2,282 | ||
2020 | 1,421 | ||
2021 | 1,257 | ||
Thereafter | 1,097 | ||
Total | $ | 17,150 | |
These leases typically include renewal options and escalation clauses. Where material, we recognize rent expense on a straight-line basis over the lease period. The difference between rent paid and rent expense is recorded as accrued other and other long-term liabilities on the consolidated balance sheets.
Total rent expense under operating leases for the years ended December 31, 2016, 2015 and 2014, was approximately $17.9 million, $18.5 million and $19.3 million, respectively.
Indemnification
We and certain of our subsidiaries, as permitted under Delaware law, have entered into indemnification agreements with several persons, including each of our present directors and certain members of management, for defined events or occurrences while the director or member of management is, or was serving, at our request in such capacity. The maximum potential amount of future payments we could be required to make under these indemnification agreements is unlimited; however, we have a director and officer insurance policy that limits our exposure and enables us to recover a portion of any future amounts paid under the terms of the policy. As a result of our insurance policy coverage, we believe the estimated fair value of these indemnification agreements is immaterial. Therefore, we have not recorded a liability for these agreements as of December 31, 2016 and 2015, respectively.
Our services and product sales agreements typically include certain provisions that indemnify customers from claims of intellectual property infringement made by third parties arising from the use of our products. The maximum potential amount of future payments we could be required to make under these indemnification agreements is unlimited; however, we have an insurance policy that limits our
F- 30
exposure and enables us to recover a portion of any future amounts paid under the terms of the policy. As a result of our insurance policy coverage, we believe the estimated fair value of these indemnification agreements is immaterial. To date, we have not incurred and have not accrued for any costs related to such indemnification provisions.
NOTE 11 - EMPLOYEE BENEFIT PLANS
Spok Holdings, Inc. Savings and Retirement Plan
The Spok Holdings, Inc. Savings and Retirement Plan (the “Retirement Plan”), is open to all Company employees working a minimum of twenty hours per week with at least 30 days of service. The Retirement Plan qualifies under Section 401(k) of the IRC. Under the Retirement Plan, participating employees may elect to voluntarily contribute a percentage of their qualifying compensation on a pretax or after-tax basis up to the annual maximum amounts established by the Internal Revenue Code. The Company matches 50% of the employee’s contribution, up to 5% of each participant’s gross salary per pay period, or 50% of the employee’s annualized contribution up to $2,500, whichever is greater. There is a per-pay-period match on the 5% component and an end-of-year true up on the $2,500 component. Contributions made by the Company become fully vested three years from the date of the participant’s employment (33% in year one, 66% in year two and 100% in year three). For purposes of vesting, a year consists of 1,000 hours or more. Other than the Company match as discussed above, profit sharing contributions are discretionary. Matching contributions under the Retirement Plan were approximately $1.1 million for each of the years ended December 31, 2016, 2015 and 2014.
Spok Holdings, Inc. Severance Pay Plan
The Spok Holdings, Inc. Severance Pay Plan for salaried employees, hourly employees and commissioned direct-sales employees (the “Severance Plan”) provides severance payments on a discretionary basis to certain employees who are terminated involuntarily under certain specified circumstances as defined in the Severance Plan. The amount of the benefit to be provided is based on the employee’s compensation and years of service with the Company as defined. Eligible terminated employees will receive two weeks of compensation for each completed year of service, up to a maximum of twenty-six weeks of compensation with a minimum compensation of two weeks. We maintain a substantially similar type of severance pay plan for executive employees at and above the level of vice-president. At December 31, 2016 and 2015, the accrued severance liability included $1.5 million and $1.4 million, respectively, associated with these plans, reflecting our expected headcount reductions. For additional information refer to Note 5, "Severance".
NOTE 12 - RELATED PARTIES
A member of our Board of Directors also serves as a director for an entity that leases transmission tower sites to the Company. For the years ended December 31, 2016, 2015 and 2014, we incurred $3.9 million, $4.1 million and $4.2 million, respectively, in site rent expenses from the entity on which the individual serves as a director. These amounts are included in service, rental and maintenance expenses.
F- 31
NOTE 13 - SEGMENTS AND GEOGRAPHIC INFORMATION
Effective January 1, 2014, the Company was structured as a single operating (and reportable) segment, a critical communication business. The Chief Executive Officer (who is also the chief operating decision maker as defined by ASC 280) views the business as one operation and assesses performance and allocates resources on the basis of consolidated operations.
The U.S. was the only country that accounted for more than 10% of the Company's total revenue for the years ended December 31, 2016, 2015 and 2014. Revenue by geographic region consisted of the following for the periods stated:
December 31, | |||||||||||
(Dollars in thousands) | 2016 | 2015 | 2014 | ||||||||
Revenue | |||||||||||
United States | $ | 173,852 | $ | 185,741 | $ | 194,886 | |||||
International | 5,709 | 3,887 | 5,387 | ||||||||
Total revenue | $ | 179,561 | $ | 189,628 | $ | 200,273 | |||||
An immaterial amount of long-lived assets were held outside of the United States for the years ended December 31, 2016, 2015 and 2014.
NOTE 14 - SELECTED QUARTERLY FINANCIAL INFORMATION (UNAUDITED)
Quarterly financial information for the years ended December 31, 2016 and 2015 is summarized below:
For the Year Ended December 31, 2016 | First Quarter | Second Quarter | Third Quarter | Fourth Quarter | |||||||||||
(Dollars in thousands except per share amounts) | |||||||||||||||
Revenues(2) | $ | 45,388 | $ | 44,635 | $ | 45,355 | $ | 44,184 | |||||||
Operating income(2) | 5,800 | 5,620 | 6,029 | 4,703 | |||||||||||
Net income(2)(4) | 3,444 | 3,451 | 4,058 | 3,026 | |||||||||||
Basic and diluted net income per common share(1) | 0.17 | 0.17 | 0.20 | 0.15 | |||||||||||
For the Year Ended December 31, 2015 | First Quarter | Second Quarter | Third Quarter | Fourth Quarter(4) | |||||||||||
(Dollars in thousands except per share amounts) | |||||||||||||||
Revenues(2) | $ | 48,138 | $ | 47,969 | $ | 46,181 | $ | 47,339 | |||||||
Operating income(2) | 6,273 | 5,621 | 6,657 | 6,550 | |||||||||||
Net income(2)(3) | 3,917 | 3,376 | 4,220 | 68,732 | |||||||||||
Basic and diluted net income per common share(1) | 0.18 | 0.16 | 0.20 | 3.28 | |||||||||||
(1) | Basic and diluted net income per common share is computed independently for each period presented. As a result, the sum of the quarterly basic and diluted net income per common share for the years ended December 31, 2016 and 2015 may not equal the total computed for the year. |
(2) | Slight variations in totals are due to rounding. |
(3) | Fourth quarter 2015 net income includes $64.2 million from the release of the deferred income tax asset valuation allowance (refer to Note 8, "Income Taxes"). |
(4) | Fourth quarter 2015 net income reflects a revision to net income by $4.0 million to adjust deferred income taxes as further described in Note 1, "Organization and Significant Accounting Policies". |
F- 32
SCHEDULE II
SPOK HOLDINGS, INC.
VALUATION AND QUALIFYING ACCOUNTS
Allowance for Doubtful Accounts, Service Credits and Other | Balance at the Beginning of the Period | Charged to Operations | Write-offs | Balance at the End of the Period | ||||||||||||
(Dollars in thousands) | ||||||||||||||||
Year ended December 31, 2016 | $ | 1,286 | $ | 761 | $ | (991 | ) | $ | 1,056 | |||||||
Year ended December 31, 2015 | $ | 1,300 | $ | 1,290 | $ | (1,304 | ) | $ | 1,286 | |||||||
Year ended December 31, 2014 | $ | 2,221 | $ | 1,128 | $ | (2,049 | ) | $ | 1,300 | |||||||
Inventory Excess and Obsolete Reserves | Balance at the Beginning of the Period | Charged to Operations | Write-offs | Balance at the End of the Period | ||||||||||||
(Dollars in thousands) | ||||||||||||||||
Year ended December 31, 2016 | $ | 214 | $ | — | $ | (214 | ) | $ | — | |||||||
Year ended December 31, 2015 | $ | 175 | $ | 1,066 | $ | (1,027 | ) | $ | 214 | |||||||
Year ended December 31, 2014 | $ | 75 | $ | 100 | $ | — | $ | 175 | ||||||||
Deferred Income Tax Asset Valuation Allowance | Balance at the Beginning of the Period | Additions | Deductions | Balance at the End of the Period | ||||||||||||
(Dollars in thousands) | ||||||||||||||||
Year ended December 31, 2016 | $ | 50,031 | $ | — | $ | (50,031 | ) | $ | — | |||||||
Year ended December 31, 2015 | $ | 114,190 | $ | — | $ | (64,159 | ) | $ | 50,031 | |||||||
Year ended December 31, 2014 | $ | 119,277 | $ | — | $ | (5,087 | ) | $ | 114,190 | |||||||
F- 33
EXHIBIT INDEX
Incorporated by Reference | ||||||||||||
Exhibit Number | Exhibit Description | Form | File No. | Exhibit | Filing Date | Filed/Furnished Herewith | ||||||
3.1 | Amended and Restated Certificate of Incorporation | 8-K | 001-32358 | 3.1 | 7/8/2014 | |||||||
3.2 | Second Amended and Restated Bylaws | 8-K | 001-32358 | 3.1 | 12/20/2016 | |||||||
4.1* | Specimen of common stock certificate, par value $0.0001 per share | S-4/A | 333-115769 | 4.1 | 10/6/2004 | |||||||
10.1* | Form of Indemnification Agreement for directors and executive officers of USA Mobility, Inc. | 8-K | 001-32358 | 10.4 | 11/17/2004 | |||||||
10.2* | USA Mobility, Inc. Equity Incentive Plan | 10-K | 001-32358 | 10.9 | 3/17/2005 | |||||||
10.3* | USA Mobility, Inc. Equity Incentive Plan Restricted Stock Agreement (For Board of Directors) (amended) | 10-Q | 001-32358 | 10.18 | 11/1/2007 | |||||||
10.4* | Form of Director’s Indemnification Agreement | 10-Q | 001-32358 | 10.24 | 10/30/2008 | |||||||
10.5* | USA Mobility, Inc. 2011 Long-Term Incentive Plan | 10-K | 001-32358 | 10.21 | 3/5/2015 | |||||||
10.6* | Form of Amended Executive Severance and Change In Control Agreement | 8-K | 001-32358 | 99.1 | 5/5/2011 | |||||||
10.7* | USA Mobility, Inc. 2012 Equity Incentive Award Plan | DEF 14A | 001-32358 | A | 3/28/2012 | |||||||
10.8* | USA Mobility, Inc. 2014 Short-Term Incentive Plan | 10-K | 001-32358 | 10.33 | 3/5/2015 | |||||||
10.9 | Spok Holdings, Inc. 2015 Short-Term Incentive Plan | 10-K | 001-32358 | 10.35 | 2/25/2016 | |||||||
10.10 | Spok Holdings, Inc. 2015 Long-Term Incentive Plan(1) | 10-K | 001-32358 | 10.36 | 3/5/2015 | |||||||
10.11 | Spok Holdings, Inc. 2016 Short-Term Incentive Plan | Filed | ||||||||||
10.12 | Exhibits to Spok Holdings, Inc., 2015 Long-Term Incentive Plan for the 2016 - 2018 performance period(1) | 10-K | 001-32358 | 10.38 | 2/25/2016 | |||||||
10.13 | Third Amended and Restated Employment Agreement, between Spok Holdings, Inc. and Vince D. Kelly, dated as of December 28, 2016 | 8-K | 001-32358 | 10.1 | 12/28/2016 | |||||||
10.14 | Spok Holdings, Inc. 2017 Short-Term Incentive Plan(1) | Filed | ||||||||||
10.15 | Exhibits to Spok Holdings, Inc., 2015 Long-Term Incentive Plan for the 2017 - 2019 performance period(1) | Filed | ||||||||||
10.16* | Restricted Stock Unit Grant Notice for the USA Mobility, Inc. 2012 Equity Incentive Award Plan | Filed | ||||||||||
10.17 | Restricted Stock Unit Grant Notice for the Spok Holdings, Inc. 2015 Long-Term Incentive Plan | Filed | ||||||||||
10.18* | Spok Holdings, Inc. Severance Pay Plan and Summary Plan Description (For certain C-Level, not including CEO) (amended and restated) | Filed | ||||||||||
21 | Subsidiaries of the Company | Filed | ||||||||||
23 | Consent of Grant Thornton LLP | Filed | ||||||||||
31.1 | Certification of President and Chief Executive Officer pursuant to Rule 13a-14(a)/Rule 15d-14(a) of the Securities Exchange Act of 1934, as amended | Filed | ||||||||||
31.2 | Certification of Chief Financial Officer pursuant to Rule 13a-14(a)/Rule 15d-14(a) of the Securities Exchange Act of 1934, as amended | Filed | ||||||||||
32.1 | Certification of President and Chief Executive Officer pursuant to 18 U.S.C. Section 1350 | Furnished | ||||||||||
32.2 | Certification of Chief Financial Officer pursuant to 18 U.S.C. Section 1350 | Furnished | ||||||||||
101.INS | XBRL Instance Document** | Furnished | ||||||||||
101.SCH | XBRL Taxonomy Extension Schema** | Furnished | ||||||||||
101.CAL | XBRL Taxonomy Extension Calculation** | Furnished | ||||||||||
101.DEF | XBRL Taxonomy Extension Definition** | Furnished | ||||||||||
101.LAB | XBRL Taxonomy Extension Labels** | Furnished | ||||||||||
101.PRE | XBRL Taxonomy Extension Presentation** | Furnished | ||||||||||
* On July 8, 2014, the Company changed its name from USA Mobility, Inc. to Spok Holdings, Inc.
** | The financial information contained in these XBRL documents is unaudited. |
(1) | Portions of this document have been omitted and filed separately with the Securities and Exchange Commission |
pursuant to requests for confidential treatment pursuant to Rule 24b-2.