Attached files
| file | filename |
|---|---|
| EX-32.2 - CERTIFICATION OF CFO PURSUANT TO SECTION 906 - TENNANT CO | exhibit_32-2.htm |
| EX-32.1 - CERTIFICATION OF CEO PURSUANT TO SECTION 906 - TENNANT CO | exhibit_32-1.htm |
| EX-31.2 - CERTIFICATION OF CFO PURSUANT TO SECTION 302 - TENNANT CO | exhibit_31-2.htm |
| EX-31.1 - CERTIFICATION OF CEO PURSUANT TO SECTION 302 - TENNANT CO | exhibit_31-1.htm |
| EX-23.1 - INDEPENDENT AUDITOR'S CONSENT - TENNANT CO | exhibit_23-1.htm |
| EX-21 - SUBSIDIARIES OF THE REGISTRANT - TENNANT CO | exhibit_21.htm |
UNITED STATES
SECURITIES AND EXCHANGE COMMISSION
Washington, D.C. 20549
FORM 10-K
(Mark One)
[ü] | ANNUAL REPORT PURSUANT TO SECTION 13 OR 15(d) OF THE SECURITIES EXCHANGE ACT OF 1934 For the fiscal year ended December 31, 2016 |
OR | |
[ ] | TRANSITION REPORT PURSUANT TO SECTION 13 OR 15(d) OF THE SECURITIES EXCHANGE ACT OF 1934 For the transition period from __________ to __________. |
Commission File Number 001-16191
TENNANT COMPANY
(Exact name of registrant as specified in its charter)
Minnesota | 41-0572550 | |
State or other jurisdiction of | (I.R.S. Employer | |
incorporation or organization | Identification No.) | |
701 North Lilac Drive, P.O. Box 1452 Minneapolis, Minnesota 55440 |
(Address of principal executive offices) (Zip Code) |
Registrant’s telephone number, including area code 763-540-1200
Securities registered pursuant to Section 12(b) of the Act:
Title of each class | Name of exchange on which registered | |
Common Stock, par value $0.375 per share | New York Stock Exchange | |
Securities registered pursuant to Section 12(g) of the Act: None | ||||
Indicate by check mark if the registrant is a well-known seasoned issuer, as defined by Rule 405 of the Securities Act. | ü | Yes | No | |
Indicate by check mark if the registrant is not required to file reports pursuant to Section 13 or Section 15(d) of the Act. | Yes | ü | No | |
Indicate by check mark whether the registrant (1) has filed all reports required to be filed by Section 13 or 15(d) of the Securities Exchange Act of 1934 during the preceding 12 months (or for such shorter period that the registrant was required to file such reports), and (2) has been subject to such filing requirements for the past 90 days. | ü | Yes | No | |
Indicate by check mark whether the registrant has submitted electronically and posted on its corporate Web site, if any, every Interactive Data File required to be submitted and posted pursuant to Rule 405 of Regulation S-T (§232.405 of this chapter) during the preceding 12 months (or for such shorter period that the registrant was required to submit and post such files). | ü | Yes | No | |
Indicate by check mark if disclosure of delinquent filers pursuant to Item 405 of Regulation S-K (§229.405 of this chapter) is not contained herein, and will not be contained, to the best of registrant’s knowledge, in definitive proxy or information statements incorporated by reference in Part III of this Form 10-K or any amendment to this Form 10-K. | [ü] | |||
Indicate by check mark whether the registrant is a large accelerated filer, an accelerated filer, a non-accelerated filer, or a smaller reporting company. See definitions of “large accelerated filer,” "accelerated filer" and "smaller reporting company" in Rule 12b-2 of the Exchange Act. | |||||
Large accelerated filer | ü | Accelerated filer | |||
Non-accelerated filer | (Do not check if a smaller reporting company) | Smaller reporting company | |||
Indicate by check mark whether the registrant is a shell company (as defined in Rule 12b-2 of the Act). | Yes | ü | No | |
The aggregate market value of the voting and non-voting common equity held by non-affiliates as of June 30, 2016, was $929,372,459. | ||||
As of February 10, 2017, there were 17,695,327 shares of Common Stock outstanding. | ||||
DOCUMENTS INCORPORATED BY REFERENCE
Portions of the registrant’s Proxy Statement for its 2017 annual meeting of shareholders (the “2017 Proxy Statement”) are incorporated by reference in Part III.
Tennant Company
Form 10–K
Table of Contents
PART I | Page | ||||
PART II | |||||
PART III | |||||
PART IV | |||||
2
TENNANT COMPANY
2016
ANNUAL REPORT
Form 10–K
(Pursuant to Securities Exchange Act of 1934)
PART I
ITEM 1 – Business
General Development of Business
Tennant Company, a Minnesota corporation founded in 1870 and incorporated in 1909, is a world leader in designing, manufacturing and marketing solutions that empower customers to achieve quality cleaning performance, significantly reduce environmental impact and help create a cleaner, safer, healthier world. Tennant is committed to creating and commercializing breakthrough, sustainable cleaning innovations to enhance its broad suite of products, including: floor maintenance and outdoor cleaning equipment, detergent-free and other sustainable cleaning technologies, aftermarket parts and consumables, equipment maintenance and repair service, specialty surface coatings and asset management solutions. Tennant products are used in many types of environments including: Retail establishments, distribution centers, factories and warehouses, public venues such as arenas and stadiums, office buildings, schools and universities, hospitals and clinics, parking lots and streets, and more. Customers include contract cleaners to whom organizations outsource facilities maintenance, as well as businesses that perform facilities maintenance themselves. The Company reaches these customers through the industry's largest direct sales and service organization and through a strong and well-supported network of authorized distributors worldwide.
Segment and Geographic Area Financial Information
The Company has one reportable business segment. Sales to customers geographically located in the United States were $525.3 million, $517.9 million and $479.5 million for the years ended December 31, 2016, 2015 and 2014, respectively. Long-lived assets located in the United States were $109.2 million and $92.2 million as of the years ended December 31, 2016 and 2015, respectively. Additional financial information on the Company’s segment and geographic areas is provided throughout Item 8 and Note 19 to the Consolidated Financial Statements.
Principal Products, Markets and Distribution
The Company offers products and solutions consisting of mechanized cleaning equipment, detergent-free and other sustainable cleaning technologies, aftermarket parts and consumables, equipment maintenance and repair service, specialty surface coatings, and business solutions such as financing, rental and leasing programs, and machine-to-machine asset management solutions. The Company markets and sells the following brands: Tennant®, Nobles®, Green Machines™, Alfa Uma Empresa Tennant™, IRIS® and Orbio®. Orbio Technologies, which markets and sells Orbio-branded products and solutions, is a group created by the Company to focus on expanding the opportunities for the emerging category of On-Site Generation (OSG). OSG technologies create and dispense effective cleaning and antimicrobial solutions on site within a facility.
As of January 31, 2016, we closed on the sale of our Green Machines outdoor city cleaning line to Green Machines International GmbH and affiliates, subsidiaries of M&F Management and Financing GmbH, which is also parent company of the master distributor of our products in Central Eastern Europe, Middle East and Africa, TCS EMEA GmbH. Therefore, as of February 2016, Green Machines is no longer a Company-owned brand. Further details regarding the sale of our Green Machines outdoor city cleaning line are discussed in Note 4 and Note 6 to the Consolidated Financial Statements.
The Company's principal markets include targeted vertical industries such as retail, manufacturing/warehousing, education, healthcare and hospitality, among others. The Company sells products directly in 15 countries and through distributors in more than 80 countries. The Company serves customers in these geographies via three geographically aligned business units: The Americas, which consists of North America and Latin America, EMEA, which consists of Europe, the Middle East and Africa, and APAC, which consists of the Asia Pacific region.
Raw Materials
The Company has not experienced any significant or unusual problems in the availability of raw materials or other product components. The Company has sole-source vendors for certain components. A disruption in supply from such vendors may disrupt the Company’s operations. However, the Company believes that it can find alternate sources in the event there is a disruption in supply from such vendors.
Intellectual Property
Although the Company considers that its patents, proprietary technologies and trade secrets, customer relationships, licenses, trademarks, trade names and brand names in the aggregate constitute a valuable asset, it does not regard its business as being materially dependent upon any single item or category of intellectual property. We take appropriate measures to protect our intellectual property to the extent such intellectual property can be protected.
Seasonality
Although the Company’s business is not seasonal in the traditional sense, the percentage of revenues in each quarter typically ranges from 22% to 28% of the total year. The first quarter tends to be at the low end of the range reflecting customers’ initial slow ramp up of capital purchases and the Company’s efforts to close out orders at the end of each year. The second and fourth quarters tend to be towards the high end of the range and the third quarter is typically in the middle of the range.
Working Capital
The Company funds operations through a combination of cash and cash equivalents and cash flows from operations. Wherever possible, cash management is centralized and intercompany financing is used to provide working capital to subsidiaries as needed. In addition, credit facilities are available for additional working capital needs or investment opportunities.
Major Customers
The Company sells its products to a wide variety of customers, none of which are of material importance in relation to the business as a whole. The customer base includes several governmental entities which generally have terms similar to other customers.
Backlog
The Company processes orders within two weeks, on average. Therefore, no significant backlogs existed at December 31, 2016 and 2015.
3
Competition
While there is no publicly available industry data concerning market share, the Company believes, through its own market research, that it is a world-leading manufacturer of floor maintenance and cleaning equipment. Several global competitors compete with Tennant in virtually every geography in the world. However, small regional competitors also exist who vary by country, vertical market, product category or channel. The Company competes primarily on the basis of offering a broad line of high-quality, innovative products supported by an extensive sales and service network in major markets.
Research and Development
The Company strives to be an industry leader in innovation and is committed to investing in research and development. The Company’s Global Innovation Center in Minnesota and engineers throughout its global locations are dedicated to various activities, including researching new technologies to create meaningful product differentiation, development of new products and technologies, improvements of existing product design or manufacturing processes and exploring new product applications with customers. In 2016, 2015 and 2014, the Company spent $34.7 million, $32.4 million and $29.4 million on research and development, respectively.
Environmental Compliance
Compliance with Federal, State and local provisions which have been enacted or adopted regulating the discharge of materials into the environment, or otherwise relating to the protection of the environment, has not had, and the Company does not expect it to have, a material effect upon the Company’s capital expenditures, earnings or competitive position.
Employees
The Company employed 3,236 people in worldwide operations as of December 31, 2016.
Available Information
The Company makes available free of charge, through the Investor Relations website at investors.tennantco.com, its annual report on Form 10-K, quarterly reports on Form 10-Q, current reports on Form 8-K and amendments to those reports filed or furnished pursuant to Section 13(a) or 15(d) of the Exchange Act as soon as reasonably practicable when such material is filed electronically with, or furnished to, the Securities and Exchange Commission (“SEC”).
ITEM 1A – Risk Factors
The following are significant factors known to us that could materially adversely affect our business, financial condition or operating results.
We may encounter financial difficulties if the United States or other global economies experience an additional or continued long-term economic downturn, decreasing the demand for our products and negatively affecting our sales growth.
Our product sales are sensitive to declines in capital spending by our customers. Decreased demand for our products could result in decreased revenues, profitability and cash flows and may impair our ability to maintain our operations and fund our obligations to others. In the event of a continued long-term economic downturn in the U.S. or other global economies, our revenues could decline to the point that we may have to take cost-saving measures, such as restructuring actions. In addition, other fixed costs would have to be reduced to a level that is in line with a lower level of sales. A long-term economic downturn that puts downward pressure on sales could also negatively affect investor perception relative to our publicly stated growth targets.
We are subject to competitive risks associated with developing innovative products and technologies, including but not limited to, not expanding as rapidly or aggressively in the global market as our competitors, our customers not continuing to pay for innovation and competitive challenges to our products, technology and the underlying intellectual property.
Our products are sold in competitive markets throughout the world. Competition is based on product features and design, brand recognition, reliability, durability, technology, breadth of product offerings, price, customer relationships and after-sale service. Although we believe that the performance and price characteristics of our products will produce competitive solutions for our customers’ needs, our products are generally priced higher than our competitors’ products. This is due to our dedication to innovation and continued investments in research and development. We believe that customers will pay for the innovations and quality in our products. However, in the current economic environment, it may be difficult for us to compete with lower priced products offered by our competitors and there can be no assurance that our customers will continue to choose our products over products offered by our competitors. If our products, markets and services are not competitive, we may experience a decline in sales volume, an increase in price discounting and a loss of market share, which adversely impacts revenues, margin and the success of our operations.
Competitors may also initiate litigation to challenge the validity of our patents or claims, allege that we infringe upon their patents, violate our patents or they may use their resources to design comparable products that avoid infringing our patents. Regardless of whether such litigation is successful, such litigation could significantly increase our costs and divert management’s attention from the operation of our business, which could adversely affect our results of operations and financial condition.
Our ability to effectively operate our Company could be adversely affected if we are unable to attract and retain key personnel and other highly skilled employees, provide employee development opportunities and create effective succession planning strategies.
Our continued success will depend on, among other things, the skills and services of our executive officers and other key personnel. Our ability to attract and retain highly qualified managerial, technical, manufacturing, research, sales and marketing personnel also impacts our ability to effectively operate our business. As the economy recovers and companies grow and increase their hiring activities, there is an inherent risk of increased employee turnover and the loss of valuable employees in key positions, especially in emerging markets. We believe the increased loss of key personnel within a concentrated region could adversely affect our sales growth.
In addition, there is a risk that we may not have adequate talent acquisition resources and employee development resources to support our future hiring needs and provide training and development opportunities to all employees. This, in turn, could impede our workforce from embracing change and leveraging the improvements we have made in technology and other business process enhancements.
We may consider acquisition of suitable candidates to accomplish our growth objectives. We may not be able to successfully integrate the businesses we acquire to achieve operational efficiencies, including synergistic and other benefits of acquisition.
We may consider, as part of our growth strategy, supplementing our organic growth through acquisitions of complementary businesses or products. We have engaged in acquisitions in the past and believe future acquisitions may provide meaningful opportunities to grow our business and improve profitability. Acquisitions allow us to enhance the breadth of our product offerings and expand the market and geographic participation of our products and services.
4
However, our success in growing by acquisition is dependent upon identifying businesses to acquire, integrating the newly acquired businesses with our existing businesses and complying with the terms of our credit facilities. We may incur difficulties in the realignment and integration of business activities when assimilating the operations and products of an acquired business or in realizing projected efficiencies, cost savings, revenue synergies and profit margins. Acquired businesses may not achieve the levels of revenue, profit, productivity or otherwise perform as expected. We are also subject to incurring unanticipated liabilities and contingencies associated with an acquired entity that are not identified or fully understood in the due diligence process. Current or future acquisitions may not be successful or accretive to earnings if the acquired businesses do not achieve expected financial results.
In addition, we may record significant goodwill or other intangible assets in connection with an acquisition. We are required to perform impairment tests at least annually and whenever events indicate that the carrying value may not be recoverable from future cash flows. If we determine that any intangible asset values need to be written down to their fair values, this could result in a charge that may be material to our operating results and financial condition.
We may not be able to effectively manage organizational changes which could negatively impact our operating results or financial condition.
We are continuing to implement global standardized processes in our business despite lean staffing levels. We continue to consolidate and reallocate resources as part of our ongoing efforts to optimize our cost structure in the current economy. Our operating results may be negatively impacted if we are unable to implement new processes and manage organizational changes. In addition, if we do not effectively realize and sustain the benefits that these transformations are designed to produce, we may not fully realize the anticipated savings of these actions or they may negatively impact our ability to serve our customers or meet our strategic objectives.
We may not be able to upgrade and evolve our information technology systems as quickly as we wish and we may encounter difficulties as we upgrade and evolve these systems, which could adversely impact our abilities to accomplish anticipated future cost savings, better serve our customers and protect against information system disruption, corruption or intrusions.
We have many information technology systems that are important to the operation of our business and are in need of upgrading in order to effectively implement our growth strategy. Given our greater emphasis on customer-facing technologies, we may not have adequate resources to upgrade our systems at the pace which the current business environment demands. This could increase the risk that the Information Technology infrastructure, such as access and cybersecurity, is not adequately designed to protect critical data and systems from theft, corruption, unauthorized usage, viruses, sabotage or unintentional misuse. Additionally, significantly upgrading and evolving the capabilities of our existing systems could lead to inefficient or ineffective use of our technology due to lack of training or expertise in these evolving technology systems. These factors could lead to significant expenses, adversely impacting our results of operations and hinder our ability to offer better technology solutions to our customers.
Inadequate funding or insufficient innovation of new technologies may result in an inability to develop and commercialize new innovative products and services.
We strive to develop new and innovative products and services to differentiate ourselves in the marketplace. New product development relies heavily on our financial and resource investments in both the short term and long term. If we fail to adequately fund product development projects or fund a project which ultimately does not gain the market acceptance we anticipated, we risk not meeting our customers' expectations, which could result in decreased revenues, declines in margin and loss of market share.
We are subject to product liability claims and product quality issues that could adversely affect our operating results or financial condition.
Our business exposes us to potential product liability risks that are inherent in the design, manufacturing and distribution of our products. If products are used incorrectly by our customers, injury may result leading to product liability claims against us. Some of our products or product improvements may have defects or risks that we have not yet identified that may give rise to product quality issues, liability and warranty claims. Quality issues may also arise due to changes in parts or specifications with suppliers and/or changes in suppliers. If product liability claims are brought against us for damages that are in excess of our insurance coverage or for uninsured liabilities and it is determined we are liable, our business could be adversely impacted. Any losses we suffer from any liability claims, and the effect that any product liability litigation may have upon the reputation and marketability of our products, may have a negative impact on our business and operating results. We could experience a material design or manufacturing failure in our products, a quality system failure, other safety issues, or heightened regulatory scrutiny that could warrant a recall of some of our products. Any unforeseen product quality problems could result in loss of market share, reduced sales and higher warranty expense.
Increases in the cost of, quality, or disruption in the availability of, raw materials and components that we purchase to manufacture our products could negatively impact our operating results or financial condition.
Our sales growth, expanding geographical footprint and continued use of sole source vendors (concentration risk), coupled with suppliers’ potential credit issues, could lead to an increased risk of a breakdown in our supply chain. There is an increased risk of defects due to the highly configured nature of our purchased component parts that could result in quality issues, returns or production slow-downs. In addition, modularization may lead to more sole sourced products and as we seek to outsource the design of certain key components, we risk loss of proprietary control and becoming more reliant on a sole source. There is also a risk that the vendors we choose to supply our parts and equipment fail to comply with our quality expectations, thus damaging our reputation for quality and negatively impacting sales.
The SEC has adopted rules regarding disclosure of the use of “conflict minerals” (commonly referred to as tin, tantalum, tungsten and gold) which are mined from the Democratic Republic of the Congo in products we manufacture or contract to manufacture. These rules have required and will continue to require due diligence and disclosure efforts. There are and will continue to be costs associated with complying with this disclosure requirement, including costs to determine which of our products are subject to the rules and the source of any "conflict minerals" used in these products. Since our supply chain is complex, ultimately we may not be able to sufficiently discover the origin of the conflict minerals used in our products through the due diligence procedures that we implement. If we are unable to, or choose not to certify that our products are conflict mineral free, customers may choose not to purchase our products. Alternatively, if we choose to use only suppliers offering conflict free minerals, we cannot be sure that we will be able to obtain metals, if necessary, from such suppliers in sufficient quantities or at competitive prices. Any one or a combination of these various factors could harm our business, reduce market demand for our products, and adversely affect our profit margins, net sales, and overall financial results.
5
Foreign currency exchange rate fluctuations, particularly the strengthening of the U.S. dollar against other major currencies, could result in declines in our reported net sales and net earnings.
We earn revenues, pay expenses, own assets and incur liabilities in countries using functional currencies other than the U.S. dollar. Because our consolidated financial statements are presented in U.S. dollars, we translate revenues and expenses into U.S. dollars at the average exchange rate during each reporting period, as well as assets and liabilities into U.S. dollars at exchange rates in effect at the end of each reporting period. Therefore, increases or decreases in the value of the U.S. dollar against other major currencies will affect our net revenues, net earnings, earnings per share and the value of balance sheet items denominated in foreign currencies as we translate them into the U.S. dollar reporting currency. We use derivative financial instruments to hedge our estimated transactional or translational exposure to certain foreign currency-denominated assets and liabilities as well as our foreign currency denominated revenue. While we actively manage the exposure of our foreign currency market risk in the normal course of business by utilizing various foreign exchange financial instruments, these instruments involve risk and may not effectively limit our underlying exposure from foreign currency exchange rate fluctuations or minimize the effects on our net earnings and the cash volatility associated with foreign currency exchange rate changes. Fluctuations in foreign currency exchange rates, particularly the strengthening of the U.S. dollar against major currencies, could materially affect our financial results, such as it did in 2015 and to a lesser extent in 2016.
We may be unable to conduct business if we experience a significant business interruption in our computer systems, manufacturing plants or distribution facilities for a significant period of time.
We rely on our computer systems, manufacturing plants and distribution facilities to efficiently operate our business. If we experience an interruption in the functionality in any of these items for a significant period of time for any reason, including unauthorized access to our systems, we may not have adequate business continuity planning contingencies in place to allow us to continue our normal business operations on a long-term basis. In addition, the increase in customer facing technology raises the risk of a lapse in business operations. Therefore, significant long-term interruption in our business could cause a decline in sales, an increase in expenses and could adversely impact our financial results.
Our global operations are subject to laws and regulations that impose significant compliance costs and create reputational and legal risk.
Due to the international scope of our operations, we are subject to a complex system of commercial, tax and trade regulations around the world. Recent years have seen an increase in the development and enforcement of laws regarding trade, tax compliance, labor and safety and anti-corruption, such as the U.S. Foreign Corrupt Practices Act, and similar laws from other countries. Our numerous foreign subsidiaries and affiliates are governed by laws, rules and business practices that differ from those of the U.S., but because we are a U.S. based company, oftentimes they are also subject to U.S. laws which can create a conflict. Despite our due diligence, there is a risk that we do not have adequate resources or comprehensive processes to stay current on changes in laws or regulations applicable to us worldwide and maintain compliance with those changes. Increased compliance requirements may lead to increased costs and erosion of desired profit margin. As a result, it is possible that the activities of these entities may not comply with U.S. laws or business practices or our Business Ethics Guide. Violations of the U.S. or local laws may result in severe criminal or civil sanctions, could disrupt our business, and result in an adverse effect on our reputation, business and results of operations or financial condition. We cannot predict the nature, scope or effect of future regulatory requirements to which our operations might be subject or the manner in which existing laws might be administered or interpreted.
We have identified material weaknesses in our internal control over financial reporting. If our remedial measures are insufficient to address the material weaknesses, or if additional material weaknesses or significant deficiencies in our internal control over financial reporting are discovered or occur in the future, our consolidated financial statements may contain material misstatements, which could adversely affect our stock price and could negatively impact our results of operations.
As of December 31, 2016, we concluded that there were material weaknesses in our internal control over financial reporting. A material weakness is a deficiency, or combination of deficiencies, in internal control over financial reporting such that there is a reasonable possibility that a material misstatement of our annual or interim financial statements will not be prevented or detected on a timely basis. See Item 9A in Part II of this Annual Report on Form 10-K for details.
While we are committed to remediating the control deficiencies that gave rise to the material weaknesses, there can be no assurances that our remediation efforts will be successful or that we will be able to prevent future control deficiencies (including material weaknesses) from happening that could cause us to incur unforeseen costs, negatively impact our results of operations, cause our consolidated financial results to contain material misstatements, cause the market price of our common stock to decline, damage our reputation or have other potential material adverse consequences.
ITEM 1B – Unresolved Staff Comments
None.
ITEM 2 – Properties
The Company’s corporate offices are owned by the Company and are located in the Minneapolis, Minnesota, metropolitan area. Manufacturing facilities located in Minneapolis, Minnesota; Holland, Michigan; Chicago, Illinois; and Uden, the Netherlands are owned by the Company. Manufacturing facilities located in Louisville, Kentucky; São Paulo, Brazil; and Shanghai, China are leased to the Company. Sales offices, warehouse and storage facilities are leased in various locations in North America, Europe, Japan, China, Australia, New Zealand and Latin America. The Company’s facilities are in good operating condition, suitable for their respective uses and adequate for current needs. Further information regarding the Company’s property and lease commitments is included in the Contractual Obligations section of Item 7 and in Note 15 to the Consolidated Financial Statements.
Effective with the sale of our Green Machines outdoor city cleaning line in January 2016, we sub-leased our former manufacturing facility in Falkirk, United Kingdom to the buyer of the Green Machines business. Further details regarding the sale of our Green Machines outdoor city cleaning line are discussed in Note 6 to the Consolidated Financial Statements.
ITEM 3 – Legal Proceedings
There are no material pending legal proceedings other than ordinary routine litigation incidental to the Company’s business.
ITEM 4 – Mine Safety Disclosures
Not applicable.
6
PART II
ITEM 5 – Market for Registrant’s Common Equity, Related Stockholder Matters and Issuer Purchases of Equity Securities
MARKET INFORMATION – Tennant's common stock is traded on the New York Stock Exchange, under the ticker symbol TNC. As of February 10, 2017, there were 348 shareholders of record. The common stock price was $71.10 per share on February 10, 2017. The accompanying chart shows the high and low sales prices for the Company’s shares for each full quarterly period over the past two years as reported by the New York Stock Exchange:
2016 | 2015 | ||||||||||||||
High | Low | High | Low | ||||||||||||
First Quarter | $ | 55.71 | $ | 45.92 | $ | 72.52 | $ | 63.14 | |||||||
Second Quarter | 56.33 | 49.97 | 70.12 | 62.59 | |||||||||||
Third Quarter | 66.54 | 52.51 | 66.38 | 54.00 | |||||||||||
Fourth Quarter | 76.80 | 60.21 | 62.92 | 54.39 | |||||||||||
DIVIDEND INFORMATION – Cash dividends on Tennant’s common stock have been paid for 72 consecutive years. Tennant’s annual cash dividend payout increased for the 45th consecutive year to $0.81 per share in 2016, an increase of $0.01 per share over 2015. Dividends are generally declared each quarter. On February 15, 2017, the Company announced a quarterly cash dividend of $0.21 per share payable March 15, 2017, to shareholders of record on March 2, 2017.
DIVIDEND REINVESTMENT OR DIRECT DEPOSIT OPTIONS – Shareholders have the option of reinvesting quarterly dividends in additional shares of Company stock or having dividends deposited directly to a bank account. The Transfer Agent should be contacted for additional information.
TRANSFER AGENT AND REGISTRAR – Shareholders with a change of address or questions about their account may contact:
Wells Fargo Bank, N.A.
Shareowner Services
P.O. Box 64874
St. Paul, MN 55164-0854
(800) 468-9716
EQUITY COMPENSATION PLAN INFORMATION – Information regarding equity compensation plans required by Regulation S-K Item 201(d) is incorporated by reference in Item 12 of this annual report on Form 10-K from the 2017 Proxy Statement.
SHARE REPURCHASES – On October 31, 2016, the Board of Directors authorized the repurchase of an additional 1,000,000 shares of our common stock. This was in addition to the 395,049 shares remaining under our prior repurchase program as of December 31, 2016. Share repurchases are made from time to time in the open market or through privately negotiated transactions, primarily to offset the dilutive effect of shares issued through our share-based compensation programs. Our Amended and Restated Credit Agreement and Shelf Agreement restrict the payment of dividends or repurchasing of stock if, after giving effect to such payments, our leverage ratio is greater than 2.00 to 1, in such case limiting such payments to an amount ranging from $50.0 million to $75.0 million during any fiscal year. If our leverage ratio is greater than 3.25 to 1, our Amended and Restated Credit Agreement and Shelf Agreement restrict us from paying any dividends or repurchasing stock, after giving effect to such payments.
For the Quarter Ended December 31, 2016 | Total Number of Shares Purchased (1) | Average Price Paid Per Share | Total Number of Shares Purchased as Part of Publicly Announced Plans or Programs | Maximum Number of Shares that May Yet Be Purchased Under the Plans or Programs | |||||||
October 1–31, 2016 | 106 | 63.88 | — | 1,395,049 | |||||||
November 1–30, 2016 | 1,228 | 64.25 | — | 1,395,049 | |||||||
December 1–31, 2016 | 157 | 52.42 | — | 1,395,049 | |||||||
Total | 1,491 | $62.98 | — | 1,395,049 | |||||||
(1) | Includes 1,491 shares delivered or attested to in satisfaction of the exercise price and/or tax withholding obligations by employees who exercised stock options or restricted stock under employee share-based compensation plans. |
7
STOCK PERFORMANCE GRAPH – The following graph compares the cumulative total shareholder return on Tennant’s common stock to two indices: S&P SmallCap 600 and Morningstar Industrials Sector. The graph below compares the performance for the last five fiscal years, assuming an investment of $100 on December 31, 2011, including the reinvestment of all dividends.
5-YEAR CUMULATIVE TOTAL RETURN COMPARISON
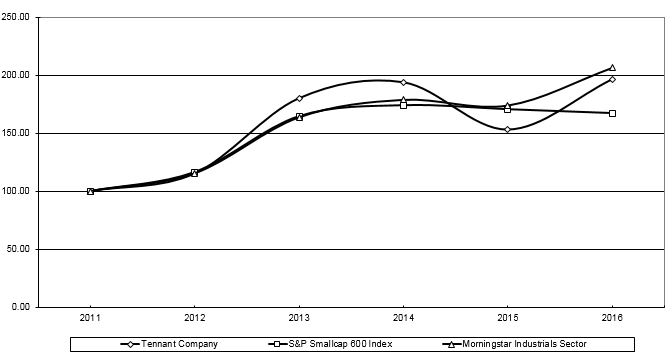
2011 | 2012 | 2013 | 2014 | 2015 | 2016 | ||||||
Tennant Company | $100 | $115 | $180 | $194 | $153 | $196 | |||||
S&P SmallCap 600 | $100 | $116 | $164 | $174 | $170 | $167 | |||||
Morningstar Industrials Sector | $100 | $115 | $164 | $179 | $174 | $206 | |||||
8
ITEM 6 – Selected Financial Data
(In thousands, except shares and per share data)
Years Ended December 31 | 2016 | 2015 | 2014 | 2013 | 2012 | |||||||||||||||||||
Financial Results: | ||||||||||||||||||||||||
Net Sales | $ | 808,572 | $ | 811,799 | $ | 821,983 | $ | 752,011 | $ | 738,980 | ||||||||||||||
Cost of Sales | 456,977 | 462,739 | 469,556 | 426,103 | 413,684 | (3) | ||||||||||||||||||
Gross Margin - % | 43.5 | 43.0 | 42.9 | 43.3 | 44.0 | |||||||||||||||||||
Research and Development Expense | 34,738 | 32,415 | 29,432 | 30,529 | 29,263 | |||||||||||||||||||
% of Net Sales | 4.3 | 4.0 | 3.6 | 4.1 | 4.0 | |||||||||||||||||||
Selling and Administrative Expense | 248,210 | 252,270 | (1) | 250,898 | 232,976 | (2) | 234,114 | (3) | ||||||||||||||||
% of Net Sales | 30.7 | 31.1 | 30.5 | 31.0 | 31.7 | |||||||||||||||||||
Loss (Gain) on Sale of Business | 149 | — | — | — | (784 | ) | (3) | |||||||||||||||||
% of Net Sales | — | — | — | — | (0.1 | ) | ||||||||||||||||||
Impairment of Long-Lived Assets | — | 11,199 | — | — | — | |||||||||||||||||||
% of Net Sales | — | 1.4 | — | — | — | |||||||||||||||||||
Profit from Operations | 68,498 | 53,176 | (1) | 72,097 | 62,403 | (2) | 62,703 | (3) | ||||||||||||||||
% of Net Sales | 8.5 | 6.6 | 8.8 | 8.3 | 8.5 | |||||||||||||||||||
Total Other Expense, Net | (2,007 | ) | (2,752 | ) | (2,559 | ) | (2,525 | ) | (2,813 | ) | ||||||||||||||
Profit Before Income Taxes | 66,491 | 50,424 | (1) | 69,538 | 59,878 | (2) | 59,890 | (3) | ||||||||||||||||
% of Net Sales | 8.2 | 6.2 | 8.5 | 8.0 | 8.1 | |||||||||||||||||||
Income Tax Expense | 19,877 | 18,336 | (1) | 18,887 | 19,647 | (2) | 18,306 | (3) | ||||||||||||||||
Effective Tax Rate - % | 29.9 | 36.4 | 27.2 | 32.8 | 30.6 | |||||||||||||||||||
Net Earnings | 46,614 | 32,088 | (1) | 50,651 | 40,231 | (2) | 41,584 | (3) | ||||||||||||||||
% of Net Sales | 5.8 | 4.0 | 6.2 | 5.3 | 5.6 | |||||||||||||||||||
Per Share Data: | ||||||||||||||||||||||||
Basic Net Earnings | $ | 2.66 | $ | 1.78 | (1) | $ | 2.78 | $ | 2.20 | (2) | $ | 2.24 | (3) | |||||||||||
Diluted Net Earnings | $ | 2.59 | $ | 1.74 | (1) | $ | 2.70 | $ | 2.14 | (2) | $ | 2.18 | (3) | |||||||||||
Diluted Weighted Average Shares | 17,976,183 | 18,493,447 | 18,740,858 | 18,833,453 | 19,102,016 | |||||||||||||||||||
Cash Dividends | $ | 0.81 | $ | 0.80 | $ | 0.78 | $ | 0.72 | $ | 0.69 | ||||||||||||||
Financial Position: | ||||||||||||||||||||||||
Total Assets | $ | 470,037 | $ | 432,295 | $ | 486,932 | $ | 456,306 | $ | 420,760 | ||||||||||||||
Total Debt | 36,194 | 24,653 | 28,137 | 31,803 | 32,323 | |||||||||||||||||||
Total Shareholders’ Equity | 278,543 | 252,207 | 280,651 | 263,846 | 235,054 | |||||||||||||||||||
Current Ratio | 2.2 | 2.2 | 2.4 | 2.4 | 2.2 | |||||||||||||||||||
Debt-to-Capital Ratio | 11.5 | % | 8.9 | % | 9.1 | % | 10.8 | % | 12.1 | % | ||||||||||||||
Cash Flows: | ||||||||||||||||||||||||
Net Cash Provided by Operations | $ | 57,878 | $ | 45,232 | $ | 59,362 | $ | 59,814 | $ | 47,566 | ||||||||||||||
Capital Expenditures, Net of Disposals | (25,911 | ) | (24,444 | ) | (19,292 | ) | (14,655 | ) | (14,595 | ) | ||||||||||||||
Free Cash Flow | 31,967 | 20,788 | 40,070 | 45,159 | 32,971 | |||||||||||||||||||
Other Data: | ||||||||||||||||||||||||
Depreciation and Amortization | $ | 18,300 | $ | 18,031 | $ | 20,063 | $ | 20,246 | $ | 20,872 | ||||||||||||||
Number of employees at year-end | 3,236 | 3,164 | 3,087 | 2,931 | 2,816 | |||||||||||||||||||
The results of operations from our 2011 acquisition have been included in the Selected Financial Data presented above since its acquisition date.
(1) | 2015 includes restructuring charges of $3,744 pre-tax ($3,095 after-tax or $0.17 per diluted share) and a non-cash Impairment of Long-Lived Assets of $11,199 pre-tax ($10,822 after-tax or $0.58 per diluted share). |
(2) | 2013 includes restructuring charges of $3,017 pre-tax ($2,938 after-tax or $0.15 per diluted share) and a tax benefit of $582 (or $0.03 per diluted share) related to the retroactive reinstatement of the 2012 U.S. Federal Research and Development ("R&D") Tax Credit. |
(3) | 2012 includes a gain on sale of business of $784 pre-tax ($508 after-tax or $0.03 per diluted share), a restructuring charge of $760 pre-tax ($670 after-tax or $0.04 per diluted share) and tax benefits from an international entity restructuring of $2,043 (or $0.11 per diluted share). |
9
ITEM 7 – Management’s Discussion and Analysis of Financial Condition and Results of Operations
Overview
Tennant Company is a world leader in designing, manufacturing and marketing solutions that empower customers to achieve quality cleaning performance, significantly reduce environmental impact and help create a cleaner, safer, healthier world. Tennant is committed to creating and commercializing breakthrough, sustainable cleaning innovations to enhance its broad suite of products, including: floor maintenance and outdoor cleaning equipment, detergent-free and other sustainable cleaning technologies, aftermarket parts and consumables, equipment maintenance and repair service, specialty surface coatings and asset management solutions. Tennant products are used in many types of environments including: Retail establishments, distribution centers, factories and warehouses, public venues such as arenas and stadiums, office buildings, schools and universities, hospitals and clinics, parking lots and streets, and more. Customers include contract cleaners to whom organizations outsource facilities maintenance, as well as businesses that perform facilities maintenance themselves. The Company reaches these customers through the industry's largest direct sales and service organization and through a strong and well-supported network of authorized distributors worldwide.
Net Sales in 2016 totaled $808.6 million, down 0.4% from $811.8 million in the prior year primarily due to an unfavorable impact from foreign currency exchange of approximately 1.0%, an unfavorable net impact of 0.5% resulting from the sale of our Green MachinesTM outdoor city cleaning line, partially offset by the acquisition of the Florock® Polymer Flooring brand ("Florock"), and lower sales of commercial equipment, particularly within the Asia Pacific ("APAC") region. These impacts were more than offset by strong sales of industrial equipment and sales of new products, particularly in the Americas region. 2016 organic sales growth, which excludes the impact of foreign currency exchange and acquisitions and divestitures, was up approximately 1.1% from 2015 with growth in the Americas and Europe, Middle East and Africa ("EMEA") geographical regions. 2016 Gross Profit margin increased 50 basis points to 43.5% from 43.0% in 2015 primarily due to a more favorable product mix (with relatively higher sales of industrial equipment and lower sales of commercial equipment). This was somewhat offset by manufacturing productivity challenges in North America. Selling and Administrative Expense (“S&A Expense”) decreased 1.6% to $248.2 million in 2016 from $252.3 million in 2015, which included the third and fourth quarter restructuring charges we recorded in 2015 of $3.7 million that did not repeat in 2016. Further details regarding the 2015 restructuring actions are discussed in Note 2 to the Consolidated Financial Statements. Operating Profit was $68.5 million in 2016, as compared to Operating Profit of $53.2 million in the prior year which included $11.2 million for the pre-tax non-cash Impairment of Long-Lived Assets as a result of the classification of our Green Machines assets as held for sale and also the $3.7 million pre-tax restructuring charges recorded in 2015. Operating Profit margin increased 190 basis points to 8.5% in 2016 from 6.6% in 2015. 2016 Operating Profit was also favorably impacted by higher Gross Profit despite the lower Net Sales in 2016 as compared to 2015. Due to the overall strengthening of the U.S. dollar relative to other currencies in 2016, foreign currency exchange reduced Operating Profit by approximately $1.2 million.
Net Earnings of $46.6 million for 2016 were $14.5 million greater than 2015. 2015 Net Earnings were impacted by the $11.2 million pre-tax non-cash Impairment of Long-Lived Assets as a result of the classification of our Green Machines assets as held for sale as well as the $3.7 million pre-tax restructuring charges that did not repeat in 2016.
Net Sales in 2015 totaled $811.8 million, down from $822.0 million in the prior year primarily due to an unfavorable impact from foreign currency exchange of approximately 5.5%, lower sales of outdoor equipment and sales declines to our Master Distributor for Russia. These impacts were partially offset by robust sales to strategic accounts in North America and global sales of new products and also selling list price increases. 2015 organic sales growth, which excludes the impact of foreign currency exchange (and acquisitions and divestitures when applicable), was up approximately 4.3% from 2014 with growth in the Americas and APAC geographical regions. 2015 Gross Profit margin increased 10 basis points to 43.0% from 42.9% in 2014 primarily due to improved operating efficiencies in both the direct service organization and manufacturing operations. This was somewhat offset by foreign currency headwinds that unfavorably impacted gross margin by approximately 80 basis points. S&A Expense increased 0.5% from $250.9 million in 2014 to $252.3 million in 2015 primarily due to our 2015 third and fourth quarter restructuring charges, described in Note 3 to the Consolidated Financial Statements, of $3.7 million, or 50 basis points as a percentage of Net Sales. This was somewhat offset by continued cost controls and improved operating efficiencies that favorably impacted S&A Expense in 2015. Operating Profit of $53.2 million in 2015 was down from $72.1 million in the prior year and Operating Profit margin decreased 220 basis points to 6.6% in 2015 from 8.8% in 2014. Operating Profit during 2015 was unfavorably impacted by $14.9 million, or 180 basis points as a percentage of Net Sales, for the non-cash Impairment of Long-Lived Assets and the third and fourth quarter restructuring charges. Operating Profit was also unfavorably impacted by higher R&D Expense of $3.0 million as compared to 2014. Due to the strength of the U.S. dollar in 2015, foreign currency exchange reduced Operating Profit by approximately $13.0 million. Net Earnings for 2015 were unfavorably impacted by the $11.2 million pre-tax, or $0.58 per diluted share after-tax, non-cash Impairment of Long-Lived Assets as a result of the classification of our Green Machines assets as held for sale in the third quarter of 2015. There were also two restructuring charges included in the 2015 S&A Expense of $3.7 million pre-tax, or $0.17 per diluted share after-tax, to reduce our infrastructure costs.
Tennant continues to invest in innovative product development with 4.3% of 2016 Net Sales spent on R&D. During 2016, we continued to invest in developing innovative new products for our traditional core business, as well as advancing a suite of sustainable cleaning technologies. New products are a key driver of sales growth. There were 10 new products and product variants launched in 2016 including three models of emerging market floor machines, two models of the M17 battery-powered sweeper-scrubber, three large next-generation cleaning machines: the M20 and M30 integrated sweeper-scrubbers, and the T20 heavy-duty industrial rider scrubber, and two models of the commercial dryer/air mover.
We ended 2016 with a Debt-to-Capital ratio of 11.5%, $58.0 million in Cash and Cash Equivalents compared to $51.3 million at the end of 2015, and Shareholders’ Equity of $278.5 million. During 2016, we generated operating cash flows of $57.9 million, paid a total of $14.3 million in cash dividends and repurchased $12.8 million of common stock. Total debt increased to $36.2 million as of December 31, 2016, compared to $24.7 million at the end of 2015, due primarily to the 2016 acquisitions.
10
Historical Results
The following table compares the historical results of operations for the years ended December 31, 2016, 2015 and 2014 in dollars and as a percentage of Net Sales (in thousands, except per share amounts and percentages):
2016 | % | 2015 | % | 2014 | % | |||||||||||||||
Net Sales | $ | 808,572 | 100.0 | $ | 811,799 | 100.0 | $ | 821,983 | 100.0 | |||||||||||
Cost of Sales | 456,977 | 56.5 | 462,739 | 57.0 | 469,556 | 57.1 | ||||||||||||||
Gross Profit | 351,595 | 43.5 | 349,060 | 43.0 | 352,427 | 42.9 | ||||||||||||||
Operating Expense: | ||||||||||||||||||||
Research and Development Expense | 34,738 | 4.3 | 32,415 | 4.0 | 29,432 | 3.6 | ||||||||||||||
Selling and Administrative Expense | 248,210 | 30.7 | 252,270 | 31.1 | 250,898 | 30.5 | ||||||||||||||
Impairment of Long-Lived Assets | — | — | 11,199 | 1.4 | — | — | ||||||||||||||
Loss on Sale of Business | 149 | — | — | — | — | — | ||||||||||||||
Total Operating Expense | 283,097 | 35.0 | 295,884 | 36.4 | 280,330 | 34.1 | ||||||||||||||
Profit from Operations | 68,498 | 8.5 | 53,176 | 6.6 | 72,097 | 8.8 | ||||||||||||||
Other Income (Expense): | ||||||||||||||||||||
Interest Income | 330 | — | 172 | — | 302 | — | ||||||||||||||
Interest Expense | (1,279 | ) | (0.2 | ) | (1,313 | ) | (0.2 | ) | (1,722 | ) | (0.2 | ) | ||||||||
Net Foreign Currency Transaction Losses | (392 | ) | — | (954 | ) | (0.1 | ) | (690 | ) | (0.1 | ) | |||||||||
Other Expense, Net | (666 | ) | (0.1 | ) | (657 | ) | (0.1 | ) | (449 | ) | (0.1 | ) | ||||||||
Total Other Expense, Net | (2,007 | ) | (0.2 | ) | (2,752 | ) | (0.3 | ) | (2,559 | ) | (0.3 | ) | ||||||||
Profit Before Income Taxes | 66,491 | 8.2 | 50,424 | 6.2 | 69,538 | 8.5 | ||||||||||||||
Income Tax Expense | 19,877 | 2.5 | 18,336 | 2.3 | 18,887 | 2.3 | ||||||||||||||
Net Earnings | $ | 46,614 | 5.8 | $ | 32,088 | 4.0 | $ | 50,651 | 6.2 | |||||||||||
Net Earnings per Diluted Share | $ | 2.59 | $ | 1.74 | $ | 2.70 | ||||||||||||||
Consolidated Financial Results
Net Earnings for 2016 were $46.6 million, or $2.59 per diluted share, compared to $32.1 million, or $1.74 per diluted share, for 2015. Net Earnings were impacted by:
• | A decrease in Net Sales of 0.4% primarily due to an unfavorable impact from foreign currency exchange of approximately 1.0%, an unfavorable net impact of 0.5% resulting from the sale of our Green Machines outdoor city cleaning line, partially offset by the acquisition of Florock, and lower sales of commercial equipment, particularly within the APAC region. These impacts were more than offset by strong sales of industrial equipment and sales of new products, particularly in the Americas region. 2016 organic sales growth, which excludes the impact of foreign currency exchange and acquisitions and divestitures, was up approximately 1.1% from 2015 with growth in the Americas and Europe, Middle East and Africa ("EMEA") geographical regions. |
• | A 50 basis point increase in Gross Profit margin due to a more favorable product mix (with relatively higher sales of industrial equipment and lower sales of commercial equipment). This was somewhat offset by manufacturing productivity challenges in North America. |
• | A decrease in S&A Expense as a percentage of Net Sales of 40 basis points compared to 2015 which included the third and fourth quarter restructuring charges we recorded in 2015 of $3.7 million and there were no restructuring charges recorded in 2016. Further details regarding the 2015 restructuring actions are discussed in Note 2 to the Consolidated Financial Statements. In addition, there was a net favorable impact to S&A Expense in 2016 as a result of disciplined spending control more than offsetting investments in key growth initiatives. |
• | A pre-tax non-cash impact of $11.2 million in 2015 due to the Impairment of Long-Lived Assets as a result of the classification of our Green Machines assets as held for sale that did not repeat in 2016. |
• | A favorable impact of $0.6 million with Net Foreign Currency Transaction Losses of $0.4 million in 2016 as compared to $1.0 million in 2015. |
Net Earnings for 2015 were $32.1 million, or $1.74 per diluted share, compared to $50.7 million, or $2.70 per diluted share, for 2014. Net Earnings were impacted by:
• | A decrease in Net Sales of 1.2% primarily due to an unfavorable impact from foreign currency exchange of approximately 5.5%, lower sales of outdoor equipment and sales declines to our Master Distributor for Russia. These impacts were partially offset by robust sales to strategic accounts in North America and global sales of new products, such as the T12 and T17 rider scrubbers and the T300 walk behind scrubber, and also selling list price increases. |
• | A 10 basis point increase in Gross Profit margin due to improved operating efficiencies in both the direct service organization and manufacturing operations, somewhat offset by foreign currency headwinds that unfavorably impacted gross margin by approximately 80 basis points. |
• | An increase in S&A Expense as a percentage of Net Sales of 60 basis points primarily due to our 2015 third and fourth quarter restructuring charges of $3.7 million, described in Note 2 to the Consolidated Financial Statements. This was somewhat offset by continued cost controls and improved operating efficiencies that favorably impacted S&A Expense. |
• | An unfavorable impact of 130 basis points, as a percentage of Net Sales, net of tax, for the non-cash Impairment of Long-Lived Assets. |
• | An unfavorable direct foreign currency exchange impact to Net Earnings of 110 basis points, as a percentage of Net Sales. |
Profit Before Income Taxes for 2016 was $66.5 million compared to $50.4 million for 2015 and $69.5 million in 2014.
The breakdown of Profit Before Income Taxes between U.S. and foreign operations for each year ended December 31 were as follows:
2016 | % | 2015 | % | 2014 | % | ||||||||
U.S. operations | $ | 54,018 | 81.2 | $ | 51,189 | 101.5 | $ | 52,315 | 75.2 | ||||
Foreign operations | 12,473 | 18.8 | (765 | ) | (1.5 | ) | 17,223 | 24.8 | |||||
Total | $ | 66,491 | 100.0 | $ | 50,424 | 100.0 | $ | 69,538 | 100.0 | ||||
11
Profit Before Income Taxes from foreign operations increased by $13.2 million in 2016 compared to 2015. The increase resulted primarily from the $11.2 million non-cash Impairment of Long-Lived Assets included in 2015 as a result of our decision to hold the assets and liabilities of our Green Machines outdoor city cleaning line for sale that did not repeat in 2016. We further describe this decision in Note 6 to the Consolidated Financial Statements. This impairment affected the results of operations in our EMEA region. In addition, 2015 Profit Before Income Taxes in our EMEA and APAC subsidiaries included an additional expense of $1.9 million and $0.7 million, respectively, as a result of two worldwide restructuring actions, which are more fully described in Note 2 to the Consolidated Financial Statements. Profit Before Income Taxes in our Latin America subsidiaries increased approximately $0.6 million in 2016 primarily due to sales increases. Profit Before Income Taxes in our APAC subsidiaries decreased by $1.3 million primarily due to lower sales resulting from economic slowdowns in the region and fewer large deals.
Profit Before Income Taxes from foreign operations decreased by $18.0 million in 2015 compared to 2014. The decrease was partially due to the $11.2 million non-cash Impairment of Long-Lived Assets recorded in 2015 as a result of our decision to hold the assets and liabilities of our Green Machines outdoor city cleaning line for sale. We further describe this decision in Note 6 to the Consolidated Financial Statements. This impairment affects the results of operations in our EMEA region. In addition, Profit Before Income Taxes in our EMEA subsidiaries decreased by an additional $1.9 million as a result of two worldwide restructuring actions, which are more fully described in Note 3 to the Consolidated Financial Statements. These restructuring actions also unfavorably impacted Profit Before Income Taxes in our APAC subsidiaries by an additional $0.7 million. Furthermore, Profit Before Income Taxes in our EMEA subsidiaries decreased by an additional $2.9 million in 2015 compared to 2014 primarily due to a 15.6% decrease in Net Sales as a result of foreign exchange devaluations and the difficult economic conditions in the European region. Profit Before Income Taxes in our Latin America subsidiaries decreased by approximately $2.8 million in 2015 primarily due to a 26% decrease in net sales due to the devaluation of the Brazilian real and difficult economic conditions in the Latin American countries. Profit Before Income Taxes in our APAC subsidiaries increased by $1.3 million primarily due to lower intercompany interest expense as a result of new intercompany financing agreements and lower intercompany allocations as a result of a legal entity reorganization in 2014.
Other Comprehensive Loss Changes
Foreign Currency Translation Adjustments – For the year ended December 31, 2016, we recorded a pre-tax foreign currency translation gain of $0.1 million. For the years ended December 31, 2015 and 2014, we recorded pre-tax foreign currency translation losses of $12.5 million and $10.1 million, respectively, in Other Comprehensive Loss. These adjustments resulted from translating the financial statements of our non-U.S. dollar functional currency subsidiaries into our reporting currency, which is the U.S. dollar, as well as other adjustments permitted by ASC 830 – Foreign Currency Matters.
During 2016, we recorded translation gains of $3.4 million relating to the Brazilian real, and translation losses of $1.3 million for the Euro, $1.0 million for the Chines renminbi, $0.9 million for the British pound and $0.1 million for various other currencies. These adjustments were caused by the appreciation of the U.S. dollar against these currencies of between 3% and 17%, and the strengthening of the Brazilian real of 22% in 2016.
During 2015, we recorded translation losses of $6.5 million relating to the Brazilian real, $5.3 million for the Euro, $0.6 million for the Chinese renminbi and $0.1 million for various other currencies. These adjustments were caused by the appreciation of the U.S. dollar against these currencies of between 5% and 32% in 2015.
During 2014, we recorded translation losses of $7.0 million relating to the Euro, $1.7 million for the Brazilian real, $1.1 million for the British pound and $0.3 million for various other currencies. These adjustments were caused by the appreciation of the U.S. dollar against these currencies of between 5% and 15% in 2014.
Pension and Retiree Medical Benefits – For the years ended December 31, 2016 and 2015, we recorded pre-tax pension and postretirement liability adjustments consisting of losses of $2.2 million and gains of $4.1 million, respectively, in other comprehensive loss as further disclosed in Note 13 to the Company's Consolidated Financial Statements. For the year ended December 31, 2014, we recorded a loss of $5.4 million in other comprehensive loss for these items.
The summarized changes in Accumulated Other Comprehensive Loss for the three years ended December 31 were as follows:
Pension and Postretirement Medical Benefits | |||||||||
2016 | 2015 | 2014 | |||||||
Net actuarial loss (gain) | $ | 2,357 | $ | (2,940 | ) | $ | 5,931 | ||
Amortization of prior service cost | (41 | ) | (67 | ) | (37 | ) | |||
Amortization of net actuarial loss | (68 | ) | (1,114 | ) | (512 | ) | |||
Total recognized in other comprehensive loss (income) | $ | 2,248 | $ | (4,121 | ) | $ | 5,382 | ||
The $2.2 million loss in 2016 was primarily due to a $2.4 million net actuarial loss relating to an increase of $3.2 million in the projected benefit obligation resulting from a 16 basis point decrease in the U.S. pension discount rate, a 95 basis point decrease in the non-U.S. discount rate and a 12 basis point decrease in the postretirement discount rate. There was an approximate $0.6 million decrease in the pension benefit obligation in 2016 relating to demographic experience and other changes, as well as a $0.2 million decrease due to a higher than expected actual return on assets. The net actuarial loss was partially offset by a $0.1 million credit relating to amortization of accumulated actuarial losses and prior service costs.
The $4.1 million gain in 2015 was primarily due to a $2.9 million net actuarial gain relating to a decrease of $2.4 million in the projected benefit obligation resulting from a 32 basis point increase in the U.S. Pension discount rate, a 21 basis point increase in the non-U.S. discount rate and a 31 basis point increase in the postretirement discount rate. There was an approximate $3.3 million decrease in the pension benefit obligation in 2015 relating to demographic experience and other changes, as well as a $3.0 million increase due to a lower than expected actual return of assets. The net actuarial gain was supplemented by a $1.2 million credit relating to amortization of accumulated losses and prior service costs.
The $5.4 million loss in 2014 was primarily due to a $5.9 million net actuarial loss relating to an increase of $2.1 million in the projected benefit obligation from adopting a new mortality table in 2014, as well as an increase of $6.6 million in the projected benefit obligation resulting from an 87 basis point decease in the U.S. pension discount rate, a 95 basis point decrease in the non-U.S. discount rate and a 71 basis point decrease in the postretirement discount rate. There was an approximate $0.8 million decrease in the pension benefit obligation in 2014 relating to demographic experience and other changes, as well as a $2.0 million decrease due to higher than expected actual return on assets. The net actuarial loss was partially offset by a $0.5 million credit relating to amortization of accumulated actuarial losses and prior service costs.
Net Sales
In 2016, consolidated Net Sales were $808.6 million, a decrease of 0.4% as compared to 2015. Consolidated Net Sales were $811.8 million in 2015, a decrease of 1.2% as compared to 2014.
12
The components of the consolidated Net Sales change for 2016 as compared to 2015, and 2015 as compared to 2014, were as follows:
Growth Elements | 2016 v. 2015 | 2015 v. 2014 | |
Organic Growth: | |||
Volume | 1.1% | 3.3% | |
Price | —% | 1.0% | |
Organic Growth | 1.1% | 4.3% | |
Foreign Currency | (1.0%) | (5.5%) | |
Acquisitions & Divestiture | (0.5%) | —% | |
Total | (0.4%) | (1.2%) | |
The 0.4% decrease in consolidated Net Sales for 2016 as compared to 2015 was primarily due to the following:
• | An unfavorable impact from foreign currency exchange of approximately 1.0%. |
• | An unfavorable net impact of 0.5% resulting from the sale of our Green Machines outdoor city cleaning line, partially offset by the acquisition of the Florock brand. |
• | An organic sales increase of approximately 1.1% which excludes the effects of foreign currency exchange and acquisitions and divestitures, due to an approximate 1.1% volume increase. The volume increase was primarily due to strong sales of industrial equipment and sales of new products, particularly in the Americas region, being somewhat offset by lower sales of commercial equipment, particularly within the APAC region. Sales of new products introduced within the past three years totaled 37% of equipment revenue in 2016. This compares to 26% of equipment revenue in 2015 from sales of new products introduced within the past three years. There was essentially no price increase in 2016 due to no significant new selling list price increases since prior year selling list price increases with an effective date of February 1, 2015. |
The 1.2% decrease in consolidated Net Sales for 2015 as compared to 2014 was primarily due to an unfavorable impact from foreign currency exchange of approximately 5.5%, lower sales of outdoor equipment and sales declines to our Master Distributor in Russia. These impacts were partially offset by robust sales to strategic accounts in North America and global sales of new products, such as the T12 and T17 rider scrubbers and the T300 walk behind scrubber. Sales of new products introduced within the past three years totaled 26% of equipment revenue in 2015. The 1 percent price increase was the result of selling list price increases, typically in the range of 2 percent to 4 percent in most geographies, with an effective date of February 1, 2015.
The following table sets forth annual Net Sales by geographic area and the related percentage change from the prior year (in thousands, except percentages):
2016 | % | 2015 | % | 2014 | |||||||||||||
Americas | $ | 607,026 | 2.6 | $ | 591,405 | 3.9 | $ | 569,004 | |||||||||
Europe, Middle East and Africa | 129,046 | (7.7 | ) | 139,834 | (15.6 | ) | 165,686 | ||||||||||
Asia Pacific | 72,500 | (10.0 | ) | 80,560 | (7.7 | ) | 87,293 | ||||||||||
Total | $ | 808,572 | (0.4 | ) | $ | 811,799 | (1.2 | ) | $ | 821,983 | |||||||
Americas – In 2016, Americas Net Sales increased 2.6% to $607.0 million as compared with $591.4 million in 2015. The primary drivers of the increase in Net Sales were strong sales of industrial equipment, sales of new products and robust sales in Latin America. The direct impact of the Florock acquisition favorably impacted Net Sales by approximately 0.7%. An unfavorable direct impact of foreign currency translation exchange effects within the Americas impacted Net Sales by approximately 0.5% in 2016. As a result, organic sales increased approximately 2.4% in 2016 within the Americas.
In 2015, Americas Net Sales increased 3.9% to $591.4 million as compared with $569.0 million in 2014. The primary driver of the increase in Net Sales was attributable to robust sales to strategic accounts in North America and sales of newly introduced products, including the T12 and T17 rider scrubbers and the T300 walk behind scrubber. The direct impact of foreign currency translation exchange effects within the Americas unfavorably impacted Net Sales by approximately 2.5%. As a result, organic sales increased approximately 6.4% in 2015.
Europe, Middle East and Africa – EMEA Net Sales in 2016 decreased 7.7% to $129.0 million as compared to 2015 Net Sales of $139.8 million. In 2016, organic sales growth was achieved in all regions except the UK and the Central Eastern Europe, Middle East and Africa markets primarily due to Brexit and challenging economic conditions, respectively. In 2016, there was an unfavorable impact on Net Sales of approximately 5.9% as a result of the sale of our Green Machines outdoor city cleaning line in January 2016. In addition, the direct impact of foreign currency exchange effects within EMEA unfavorably impacted Net Sales by approximately 2.0% in 2016. As a result, organic sales increased approximately 0.2% in 2016 within EMEA.
EMEA Net Sales in 2015 decreased 15.6% to $139.8 million as compared to 2014 Net Sales of $165.7 million. Organic sales decreased approximately 2.1% in 2015, which reflected a fragile European economy resulting in lower sales of outdoor equipment and sales declines to our Master Distributor for Russia, somewhat offset by higher sales to strategic accounts and through distribution in Western Europe. Unfavorable direct foreign currency exchange effects decreased EMEA Net Sales by approximately 13.5% in 2015.
Asia Pacific – APAC Net Sales in 2016 decreased 10.0% to $72.5 million as compared to 2015 Net Sales of $80.6 million. Organic sales decreased approximately 10.0% in 2016 with lower sales of commercial and industrial equipment. Organic sales declines in all of our Asian markets were primarily due to economic slowdowns in the region and fewer large deals. Direct foreign currency translation exchange effects had essentially no impact on Net Sales in 2016 within APAC.
APAC Net Sales in 2015 decreased 7.7% to $80.6 million as compared to 2014 Net Sales of $87.3 million. Organic sales increased approximately 1.3% in 2015 due primarily to organic sales growth in China and Australia, more than offsetting the slower economy in other Asian countries. Unfavorable direct foreign currency exchange effects decreased Net Sales by approximately 9.0% in 2015.
Gross Profit
Gross Profit margin was 43.5% in 2016, an increase of 50 basis points as compared to 2015. Gross Profit margin in 2016 was favorably impacted by product mix (with relatively higher sales of industrial equipment and lower sales of commercial equipment), partially offset by manufacturing productivity challenges in North America.
Gross Profit margin was 43.0% in 2015, an increase of 10 basis points as compared to 2014. Gross Profit margin in 2015 was favorably impacted by operating efficiencies in both the direct service organization and manufacturing operations. This was somewhat offset by foreign currency headwinds that unfavorably impacted gross margin by approximately 80 basis points.
13
Operating Expenses
Research and Development Expense – Research and Development ("R&D") Expense increased $2.3 million, or 7.2%, in 2016 as compared to 2015. As a percentage of Net Sales, 2016 R&D Expense increased 30 basis points compared to the prior year. We continue to invest in developing innovative new products for our traditional core business, as well as advancing a suite of sustainable cleaning technologies. New products are a key driver of sales growth. There were 10 new products and product variants launched in 2016 including three models of emerging market floor machines, two models of the M17 battery-powered sweeper-scrubber, three large next-generation cleaning machines: the M20 and M30 integrated sweeper-scrubbers, and the T20 heavy-duty industrial rider scrubber, and two models of the commercial dryer/air mover.
R&D Expense increased $3.0 million, or 10.1%, in 2015 as compared to 2014. As a percentage of Net Sales, 2015 R&D Expense increased 40 basis points to 4.0% in 2015 from 3.6% in the prior year primarily due to an increase in the number of R&D employees and the timing of new product development projects. We continued to invest in developing innovative new products and technologies.
Selling and Administrative Expense – S&A Expense decreased by $4.1 million, or 1.6%, in 2016 compared to 2015. As a percentage of Net Sales, 2016 S&A Expense decreased 40 basis points to 30.7% from 31.1% in 2015 due to two restructuring charges totaling $3.7 million we recorded in 2015 to reduce our infrastructure costs that did not repeat in 2016. In addition, there was a net favorable impact to S&A Expense in 2016 as a result of disciplined spending control more than offsetting investments in key growth initiatives.
S&A Expense increased by $1.4 million, or 0.5%, in 2015 compared to 2014. As a percentage of Net Sales, 2015 S&A Expense increased 60 basis points to 31.1% from 30.5% in 2014 due to continued investments in direct sales and marketing to build organic sales. There were also two restructuring charges totaling $3.7 million, or 50 basis points as a percentage of Net Sales, to reduce our infrastructure costs. These were somewhat offset by strong cost controls and improved operating efficiencies that favorably impacted S&A Expense.
Other Income (Expense)
Interest Income – Interest Income was $0.3 million in 2016, an increase of $0.1 million from 2015. The increase between 2016 and 2015 was due to higher levels of cash deposits.
Interest Income was $0.2 million in 2015, a decrease of $0.1 million from 2014. The decrease between 2015 and 2014 was due to lower levels of cash deposits.
Interest Expense – Interest Expense was $1.3 million in 2016 and 2015.
Interest Expense was $1.3 million in 2015 as compared to $1.7 million in 2014. This decrease was primarily due to a lower level of debt.
Net Foreign Currency Transaction Losses – Net Foreign Currency Transaction Losses were $0.4 million in 2016 as compared to $1.0 million in 2015. The favorable change in the impact from foreign currency transactions in 2016 was due to fluctuations in foreign currency rates and settlements of transactional hedging activity in the normal course of business.
Net Foreign Currency Transaction Losses were $1.0 million in 2015 as compared to $0.7 million in 2014. The unfavorable change in the impact from foreign currency transactions in 2015 was due to fluctuations in foreign currency rates and settlements of transactional hedging activity in the normal course of business.
Income Taxes
The overall effective income tax rate was 29.9%, 36.4% and 27.2% in 2016, 2015 and 2014, respectively.
The tax expense for 2015 included a $0.4 million tax benefit associated with an $11.2 million Impairment of Long-Lived Assets and a $0.6 million tax benefit associated with restructuring charges of $3.7 million. We are not able to recognize a tax benefit on the impairment charge until the assets are sold due to a tax valuation allowance. Excluding these items, the 2015 overall effective tax rate would have been 29.6%.
The increase in the overall effective tax rate to 29.9% in 2016 as compared to 29.6% in the prior year, excluding the effect of the 2015 one-time charges, was primarily related to the mix in expected full year taxable earnings by country.
There were no special items that affected the tax rate in 2014.
We do not have any plans to repatriate the undistributed earnings of non-U.S. subsidiaries. Any repatriation from foreign subsidiaries that would result in incremental U.S. taxation is not being considered. It is management's belief that reinvesting these earnings outside the U.S. is the most efficient use of capital.
Liquidity and Capital Resources
Liquidity – Cash and Cash Equivalents totaled $58.0 million at December 31, 2016, as compared to $51.3 million as of December 31, 2015. Cash and Cash Equivalents held by our foreign subsidiaries totaled $19.0 million as of December 31, 2016, as compared to $14.9 million as of December 31, 2015. Wherever possible, cash management is centralized and intercompany financing is used to provide working capital to subsidiaries as needed. Our current ratio was 2.2 as of December 31, 2016 and 2015, and our working capital was $165.1 million and $160.4 million, respectively.
Our Debt-to-Capital ratio was 11.5% as of December 31, 2016, compared with 8.9% as of December 31, 2015. Our capital structure was comprised of $36.2 million of Debt and $278.5 million of Shareholders’ Equity as of December 31, 2016.
Cash Flow Summary – Cash provided by (used in) our operating, investing and financing activities is summarized as follows (in thousands):
2016 | 2015 | 2014 | |||||||||
Operating Activities | $ | 57,878 | $ | 45,232 | $ | 59,362 | |||||
Investing Activities: | |||||||||||
Purchases of Property, Plant and Equipment, Net of Disposals | (25,911 | ) | (24,444 | ) | (19,292 | ) | |||||
Acquisitions of Businesses, Net of Cash Acquired | (12,933 | ) | — | — | |||||||
Issuance of Long-Term Note Receivable | (2,000 | ) | — | — | |||||||
Proceeds from Sale of Business | 285 | 1,185 | 1,416 | ||||||||
Decrease (Increase) in Restricted Cash | 116 | (322 | ) | 6 | |||||||
Financing Activities | (9,558 | ) | (61,405 | ) | (28,038 | ) | |||||
Effect of Exchange Rate Changes on Cash and Cash Equivalents | (1,144 | ) | (1,908 | ) | (1,476 | ) | |||||
Net Increase (Decrease) in Cash and Cash Equivalents | $ | 6,733 | $ | (41,662 | ) | $ | 11,978 | ||||
14
Operating Activities – Cash provided by operating activities was $57.9 million in 2016, $45.2 million in 2015 and $59.4 million in 2014. In 2016, cash provided by operating activities was driven primarily by cash inflows resulting from $46.6 million of Net Earnings and an increase in Income Taxes Payable of $5.4 million. These cash inflows were partially offset by cash outflows resulting from an increase in Accounts Receivable of $9.3 million, a decrease in Accounts Payable of $3.9 million and a net cash outflow from Other Assets and Liabilities of $2.2 million. The increase in Accounts Receivable was due to the higher sales levels, particularly in December 2016, the variety of terms offered and mix of business. The decrease in Accounts Payable was due to making earlier payments to utilize cash discounts. The net cash outflow from Other Assets and Liabilities was due primarily to changes in Accumulated Other Comprehensive Loss. Cash provided by operating activities was $12.6 million higher in 2016 as compared to 2015 primarily due to more favorable timing of income tax payments and accruals and a lower level of cash used for working capital.
In 2015, cash provided by operating activities was driven primarily by cash inflows resulting from $32.1 million of Net Earnings, which includes a non-cash pre-tax impairment charge of $11.2 million, and a decrease in Receivables, somewhat offset by a decrease in Accounts Payable and an increase in Inventories. The decrease in Receivables was due to the continued proactive management of our receivables by enforcing tighter credit limits and continuing to successfully collect past due balances. The increase in Inventories was in support of the launches of many new products. Cash provided by operating activities was $14.1 million lower in 2015 as compared to 2014 primarily due to lower Net Earnings and a year over year increase in Inventories to support the launches of many new products.
For 2016, we used operating profit and operating profit margin as key indicators of financial performance and the primary metrics for performance-based incentives.
Two metrics used by management to evaluate how effectively we utilize our net assets are “Accounts Receivable Days Sales Outstanding” (“DSO”) and “Days Inventory on Hand” (“DIOH”), on a first-in, first-out (“FIFO”) basis. The metrics are calculated on a rolling three month basis in order to more readily reflect changing trends in the business. These metrics for the quarters ended December 31 were as follows (in days):
2016 | 2015 | 2014 | |||
DSO | 59 | 61 | 62 | ||
DIOH | 89 | 89 | 84 | ||
DSO decreased 2 days in 2016 as compared to 2015 primarily due to the continued proactive management of our receivables by enforcing tighter credit limits and continuing to successfully collect past due balances having a larger favorable impact than the unfavorable trend in the variety of terms offered and mix of business.
DIOH in 2016 was the same as DIOH in 2015 primarily due to progress from inventory reduction initiatives, offset by increased levels of inventory in support of higher sales levels and the launches of new products.
Investing Activities – Net cash used for investing activities was $40.4 million in 2016, $23.6 million in 2015 and $17.9 million in 2014. Net capital expenditures used $25.9 million during 2016 as compared to $24.4 million in 2015 and $19.3 million in 2014. Our 2016 and 2015 capital expenditures included investments in information technology process improvement projects, tooling related to new product development, and manufacturing equipment. Capital expenditures in 2014 included investments in tooling related to new product development, and manufacturing and information technology process improvement projects. In addition, our acquisition of the Florock brand and the assets of Dofesa Barrido Mecanizado, a long-time distributor based in Central Mexico, used $12.9 million, net of cash acquired, in 2016. Further details regarding these 2016 acquisitions are discussed in Note 3 to the Consolidated Financial Statements. We also used $2.0 million as a result of a non-interest bearing cash advance to TCS EMEA GmbH. Further details regarding the cash advance are discussed in Note 4 to the Consolidated Financial Statements. These cash outflows were partially offset by cash inflows resulting from Proceeds from Sale of Business, which provided $0.3 million in 2016, $1.2 million in 2015 and $1.4 million in 2014.
Financing Activities – Net cash used for financing activities was $9.6 million in 2016, $61.4 million in 2015 and $28.0 million in 2014. In 2016, dividend payments used $14.3 million, the purchases of our common stock per our authorized repurchase program used $12.8 million and the payment of Long-Term Debt used $3.5 million. These cash outflows were partially offset by proceeds resulting from the incurrence of Long-Term Debt of $15.0 million, the issuance of Common Stock of $5.3 million and the excess tax benefit on stock plans of $0.7 million. In 2015, the purchases of our common stock per our authorized repurchase program used $46.0 million, dividend payments used $14.5 million and the payment of Long-Term Debt used $3.4 million, partially offset by proceeds from the issuance of Common Stock of $1.7 million and the excess tax benefit on stock plans of $0.9 million. In 2014, payments of dividends used $14.5 million, payments of Long-Term Debt used $2.0 million and payments of Short-Term Debt used $1.5 million, partially offset by proceeds from the issuance of Common Stock of $2.3 million. Our annual cash dividend payout increased for the 45th consecutive year to $0.81 per share in 2016, an increase of $0.01 per share over 2015.
On October 31, 2016, the Board of Directors authorized the repurchase of an additional 1,000,000 shares of our common stock. At December 31, 2016, there were 1,395,049 remaining shares authorized for repurchase.
There were 246,474 shares repurchased in 2016 in the open market, 764,046 shares repurchased in 2015 and 225,034 shares repurchased during 2014, at average repurchase prices of $51.78 during 2016, $60.20 during 2015 and $62.64 during 2014. Our Amended and Restated Credit Agreement with JPMorgan Chase Bank limits the payment of dividends and repurchases of stock to amounts ranging from $50.0 million to $75.0 million per fiscal year based on our leverage ratio after giving effect to such payments for the life of the agreement.
Indebtedness – As of December 31, 2016, we had committed lines of credit totaling approximately $125.0 million and uncommitted lines of credit totaling approximately $85.0 million. There were $25.0 million in outstanding borrowings under our JPMorgan facility (described below) and $11.1 million in outstanding borrowings under our Prudential facility (described below) as of December 31, 2016. In addition, we had stand alone letters of credit and bank guarantees outstanding in the amount of $3.8 million. Commitment fees on unused lines of credit for the year ended December 31, 2016 were $0.2 million.
15
Our most restrictive covenants are part of our 2015 Amended and Restated Credit Agreement (as defined below), which are the same covenants in our Shelf Agreement (as defined below) with Prudential (as defined below), and require us to maintain an indebtedness to EBITDA ratio of not greater than 3.25 to 1 and to maintain an EBITDA to interest expense ratio of no less than 3.50 to 1 as of the end of each quarter. As of December 31, 2016, our indebtedness to EBITDA ratio was 0.49 to 1 and our EBITDA to interest expense ratio was 70.20 to 1.
Credit Facilities
JPMorgan Chase Bank, National Association
On June 30, 2015, we entered into an Amended and Restated Credit Agreement (the "Amended and Restated Credit Agreement") that amended and restated the Credit Agreement dated May 5, 2011 between us and JP Morgan Chase Bank, N.A. ("JPMorgan"), as administrative agent and collateral agent, U.S. Bank National Association, as syndication agent, Wells Fargo Bank, National Association, and RBS Citizens, N.A., as co-documentation agents, and the Lenders (including JPMorgan) from time to time party thereto, as amended by Amendment No. 1 dated April 25, 2013 (the “Credit Agreement”). The Amended and Restated Credit Agreement provides us and certain of our foreign subsidiaries access to a senior unsecured credit facility until June 30, 2020, in the amount of $125.0 million, with an option to expand by up to $62.5 million to a total of $187.5 million. Borrowings may be denominated in U.S. dollars or certain other currencies. The Amended and Restated Credit Agreement contains a $100.0 million sublimit on borrowings by foreign subsidiaries.
The Amended and Restated Credit Agreement principally provides the following changes to the Credit Agreement:
• | changed the fees for committed funds from an annual rate ranging from 0.20% to 0.35%, depending on our leverage ratio, under the Credit Agreement to an annual rate ranging from 0.175% to 0.300%, depending on our leverage ratio, under the Amended and Restated Credit Agreement; |
• | removed RBS Citizens, N.A. as a co-documentation agent; |
• | changed the rate at which Eurocurrency borrowings bear interest from a rate per annum equal to adjusted LIBOR plus an additional spread of 1.30% to 1.90%, depending on our leverage ratio, under the Credit Agreement to a rate per annum equal to adjusted LIBOR plus an additional spread of 1.075% to 1.700%, depending on our leverage ratio, under the Amended and Restated Credit Agreement; |
• | under the Credit Agreement, Alternate Base Rate (“ABR”) borrowings bore interest at a rate per annum equal to the greatest of (a) the prime rate, (b) the federal funds rate plus 0.50% and (c) the adjusted LIBOR rate for a one month period plus 1.00%, plus, in any such case, an additional spread of 0.30% to 0.90%, depending on our leverage ratio. The ABR borrowings bear interest under the Amended and Restated Credit Agreement at a rate per annum equal to the greatest of (a) the prime rate, (b) the federal funds rate plus 0.50% and (c) the adjusted LIBOR rate for a one month period plus 1.00%, plus, in any such case, an additional spread of 0.075% to 0.700%, depending on our leverage ratio. |
The Amended and Restated Credit Agreement gives the Lenders a pledge of 65% of the stock of certain first tier foreign subsidiaries. The obligations under the Amended and Restated Credit Agreement are also guaranteed by certain of our first tier domestic subsidiaries.
The Amended and Restated Credit Agreement contains customary representations, warranties and covenants, including but not limited to covenants restricting our ability to incur indebtedness and liens and merge or consolidate with another entity. It also incorporates new or recently revised financial regulations and other compliance matters. Further, the Amended and Restated Credit Agreement contains the following covenants:
• | a covenant requiring us to maintain an indebtedness to EBITDA ratio as of the end of each quarter of not greater than 3.25 to 1. Under the Credit Agreement, the required indebtedness to EBITDA ratio as of the end of each quarter was not greater than 3.00 to 1; |
• | a covenant requiring us to maintain an EBITDA to interest expense ratio as of the end of each quarter of no less than 3.50 to 1; |
• | a covenant restricting us from paying dividends or repurchasing stock if, after giving effect to such payments, our leverage ratio is greater than 2.00 to 1, in such case limiting such payments to an amount ranging from $50.0 million to $75.0 million during any fiscal year based on our leverage ratio after giving effect to such payments; |
• | a covenant restricting us from paying any dividends or repurchasing stock, if, after giving effect to such payments, our leverage ratio is greater than 3.25 to 1; and |
• | a covenant restricting our ability to make acquisitions, if, after giving pro-forma effect to such acquisitions, our leverage ratio is greater than 3.00 to 1, in such case limiting acquisitions to $25.0 million. Under the Credit Agreement, our leverage ratio restriction under this covenant was 2.75 to 1. |
A copy of the full terms and conditions of the Amended and Restated Credit Agreement are incorporated by reference in Item 15 to Exhibit 10.1 to the Company's Current Report on Form 8-K filed on July 7, 2015.
As of December 31, 2016, we were in compliance with all covenants under this Amended and Restated Credit Agreement. There were $25.0 million in outstanding borrowings under this facility at December 31, 2016, with a weighted average interest rate of 1.64%.
Prudential Investment Management, Inc.
On July 29, 2009, we entered into a Private Shelf Agreement (the “Shelf Agreement”) with Prudential Investment Management, Inc. (“Prudential”) and Prudential affiliates from time to time party thereto. The Shelf Agreement provides us and our subsidiaries access to an uncommitted, senior secured, maximum aggregate principal amount of $80.0 million of debt capital. The Shelf Agreement contains representations, warranties and covenants, including but not limited to covenants restricting our ability to incur indebtedness and liens and to merge or consolidate with another entity.
A copy of the full terms and conditions of the Shelf Agreement are incorporated by reference in Item 15 to Exhibit 10.1 to the Company's Current Report on Form 8-K filed on July 30, 2009.
On May 5, 2011, we entered into Amendment No. 1 to our Private Shelf Agreement (the “Amendment”).
The Amendment principally provided the following changes to the Shelf Agreement:
• | elimination of the security interest in our personal property and subsidiaries; and |
• | an amendment to our restriction regarding the payment of dividends or repurchase of stock to restrict us from paying dividends or repurchasing stock if, after giving effect to such payments, our leverage ratio is greater than 2.00 to 1, in such case limiting such payments to an amount ranging from $50.0 million to $75.0 million during any fiscal year based on our leverage ratio after giving effect to such payments. |
A copy of the full terms and conditions of the Amendment are incorporated by reference in Item 15 to Exhibit 10.2 to the Company's Form 10-Q for the quarter ended June 30, 2011.
16
On July 24, 2012, we entered into Amendment No. 2 to our Private Shelf Agreement (“Amendment No. 2”), which amended the Shelf Agreement. The principal change effected by Amendment No. 2 was an extension of the Issuance Period for Shelf Notes under the Shelf Agreement.
A copy of the full terms and conditions of Amendment No. 2 are incorporated by reference in Item 15 to Exhibit 10.1 to the Company's Current Report on Form 8-K filed on July 26, 2012.
On June 30, 2015, we entered into Amendment No. 3 to our Private Shelf Agreement ("Amendment No. 3"), which amends the Shelf Agreement by and among the Company, Prudential and Prudential affiliates from time to time party thereto, as amended by Amendment No. 1 and Amendment No. 2.
Amendment No. 3 principally provided the following changes to the Shelf Agreement:
• | extended the Issuance Period to June 30, 2018 from July 24, 2015; |
• | changed the covenant regarding our indebtedness to EBITDA ratio at the end of each quarter to not greater than 3.25 to 1. The previous covenant required a ratio of not greater than 3.00 to 1; |
• | added the covenant restricting us from paying any dividends or repurchasing stock, if, after giving such effect to such payments, our leverage ratio is greater than 3.25 to 1; and |
• | changed the covenant restricting us from making acquisitions, if, after giving pro-forma effect to such acquisitions, our leverage ratio is greater than 3.00 to 1, in such case limiting acquisitions to $25.0 million. The previous covenant limiting our ability to make acquisitions under Amendment No. 1 was 2.75 to 1. |
A copy of the full terms and conditions of Amendment No. 3 are incorporated by reference in Item 15 to Exhibit 10.2 to the Company's Current Report on Form 8-K filed on July 7, 2015.
As of December 31, 2016, there were $11.1 million in outstanding borrowings under this facility, consisting of the $4.0 million Series A notes issued in March 2011 with a fixed interest rate of 4.00% and a term of seven years, with remaining serial maturities from 2017 to 2018, and the $7.1 million Series B notes issued in June 2011 with a fixed interest rate of 4.10% and a term of 10 years, with remaining serial maturities from 2017 to 2021. The second payment of $2.0 million on Series A notes was made during the first quarter of 2015. The third payment of $2.0 million on Series A notes was made during the first quarter of 2016. The first payment of $1.4 million on Series B notes was made during the second quarter of 2015. The second payment of $1.4 million on Series B notes was made during the second quarter of 2016. We were in compliance with all covenants under this Shelf Agreement as of December 31, 2016.
HSBC Bank (China) Company Limited, Shanghai Branch
On June 20, 2012, we entered into a banking facility with the HSBC Bank (China) Company Limited, Shanghai Branch in the amount of $5.0 million. As of December 31, 2016, there were no outstanding borrowings on this facility.
Collateralized Borrowings
Collateralized borrowings represent deferred sales proceeds on certain leasing transactions with third-party leasing companies. These transactions are accounted for as borrowings, with the related assets capitalized as property, plant and equipment and depreciated straight-line over the lease term.
Capital Lease Obligations
Capital lease obligations outstanding are primarily related to sale-leaseback transactions with third-party leasing companies whereby we sell our manufactured equipment to the leasing company and lease it back. The equipment covered by these leases is rented to our customers over the lease term.
Contractual Obligations – Our contractual obligations as of December 31, 2016, are summarized by period due in the following table (in thousands):
Total | Less Than 1 Year | 1 - 3 Years | 3 - 5 Years | More Than 5 Years | |||||||||||||||
Long-term debt(1) | $ | 36,143 | $ | 3,429 | $ | 4,857 | $ | 27,857 | $ | — | |||||||||
Interest payments on long-term debt(1) | 2,291 | 775 | 1,193 | 323 | — | ||||||||||||||
Capital leases | 51 | 31 | 20 | — | — | ||||||||||||||
Interest payments on capital leases | 10 | 6 | 4 | — | — | ||||||||||||||
Retirement benefit plans(2) | 1,281 | 1,281 | — | — | — | ||||||||||||||
Deferred compensation arrangements(3) | 6,754 | 1,072 | 1,877 | 822 | 2,983 | ||||||||||||||
Operating leases(4) | 21,258 | 8,866 | 8,390 | 2,800 | 1,202 | ||||||||||||||
Purchase obligations(5) | 41,200 | 41,200 | — | — | — | ||||||||||||||
Other(6) | 12,549 | 12,549 | — | — | — | ||||||||||||||
Total contractual obligations | $ | 121,537 | $ | 69,209 | $ | 16,341 | $ | 31,802 | $ | 4,185 | |||||||||
(1)Long-term debt represents borrowings through our Amended and Restated Credit Agreement with JPMorgan and our Shelf Agreement with Prudential. Our Amended and Restated Credit Agreement with JPMorgan does not have specified repayment terms; therefore, repayment is due upon expiration of the agreement on June 30, 2020. Interest payments on our Amended and Restated Credit Agreement were calculated using the December 31, 2016 LIBOR rate based on the assumption that the principal would be repaid in full upon the expiration of the agreement. Our borrowings under our Shelf Agreement with Prudential have 7 and 10 year terms, with remaining serial maturities from 2017 to 2021 with fixed interest rates of 4.00% and 4.10%, respectively.
(2)Our retirement benefit plans, as described in Note 13 to the Consolidated Financial Statements, require us to make contributions to the plans from time to time. Our plan obligations totaled $6.7 million as of December 31, 2016. Contributions to the various plans are dependent upon a number of factors including the market performance of plan assets, if any, and future changes in interest rates, which impact the actuarial measurement of plan obligations. As a result, we have only included our 2017 expected contribution in the contractual obligations table.
(3)The unfunded deferred compensation arrangements covering certain current and retired management employees totaled $6.8 million as of December 31, 2016. Our estimated distributions in the contractual obligations table are based upon a number of assumptions including termination dates and participant distribution elections.
(4)Operating lease commitments consist primarily of office and warehouse facilities, vehicles and office equipment as discussed in Note 15 to the Consolidated Financial Statements.
(5)Purchase obligations include all known open purchase orders, contractual purchase commitments and contractual obligations as of December 31, 2016.
17
(6)Other obligations include residual value guarantees as discussed in Note 15 to the Consolidated Financial Statements.
Total contractual obligations exclude our gross unrecognized tax benefits of $2.5 million and accrued interest and penalties of $0.5 million as of December 31, 2016. We expect to make cash outlays in the future related to uncertain tax positions. However, due to the uncertainty of the timing of future cash flows, we are unable to make reasonably reliable estimates of the period of cash settlement, if any, with the respective taxing authorities. For further information related to unrecognized tax benefits, see Note 16 to the Consolidated Financial Statements.
Newly Issued Accounting Guidance
Revenues from Contracts with Customers
In May 2014, the Financial Accounting Standards Board (FASB) issued Accounting Standards Update (ASU) No. 2014-09, Revenue from Contracts with Customers (Topic 606). This ASU will replace all existing revenue recognition standards and significantly expand the disclosure requirements for revenue arrangements. This guidance requires an entity to recognize the amount of revenue to which it expects to be entitled for the transfer of promised goods or services to customers. This guidance provides a five-step analysis of transactions to determine when and how revenue is recognized. This guidance also requires enhanced disclosures regarding the nature, amount, timing and uncertainty of revenue and cash flows arising from an entity's contracts with customers.
In August 2015, the FASB issued ASU No. 2015-14, Revenue from Contracts with Customers (Topic 606): Deferral of the Effective Date, which defers the effective date of the new revenue recognition standard by one year from the original effective date specified in ASU No. 2014-09. The guidance now permits us to apply the new revenue recognition standard to annual reporting periods beginning after December 15, 2017, including interim periods within that reporting period, which is our fiscal 2018.
The new standard may be adopted retrospectively for all periods presented, or adopted using a modified retrospective approach. Under the retrospective approach, the fiscal 2017 and 2016 financial statements would be adjusted to reflect the effects of applying the new standard on those periods. Under the modified retrospective approach, the new standard would only be applied for the period beginning January 1, 2018 to new contracts and those contracts that are not yet complete at January 1, 2018, with a cumulative catch-up adjustment recorded to beginning retained earnings for existing contracts that still require performance. Management expects to adopt this accounting standard update on a modified retrospective basis in the first quarter of fiscal 2018, and we are currently evaluating the impact of this accounting standards update on our Consolidated Financial Statements.
Leases
In February 2016, the FASB issued ASU No. 2016-02, Leases (Topic 842). This ASU changes current U.S. GAAP for lessees to recognize lease assets and lease liabilities on the balance sheet for those leases classified as operating leases under previous U.S. GAAP. Under the new guidance, lessor accounting is largely unchanged. The amendments in this ASU are effective for annual periods beginning after December 15, 2018, including interim periods within that reporting period, which is our fiscal 2019. Early application is permitted. Lessees and lessors must apply a modified retrospective transition approach for leases existing at, or entered into after, the beginning of the earliest comparative period presented in the financial statements. The transition approach would not require any transition accounting for leases that expired before the earliest comparative period presented. A full retrospective transition approach is prohibited for both lessees and lessors. Upon adoption in 2019, we will establish right of use assets and lease liabilities. This amount is still to be determined as we are currently evaluating the impact of this amended guidance on our Consolidated Financial Statements and related disclosures.
Improvements to Employee Share-Based Payment Accounting
In March 2016, the FASB issued ASU No. 2016-09, Compensation - Stock Compensation (Topic 718): Improvements to Employee Share-Based Payment Accounting. This ASU modified U.S. GAAP by requiring the following, among others: (1) all excess tax benefits and tax deficiencies are to be recognized as income tax expense or benefit on the income statement (excess tax benefits are recognized regardless of whether the benefit reduces taxes payable in the current period); (2) excess tax benefits are to be classified along with other income tax cash flows as an operating activity in the statement of cash flows; (3) in the area of forfeitures, an entity can still follow the current U.S. GAAP practice of making an entity-wide accounting policy election to estimate the number of awards that are expected to vest or may instead account for forfeitures when they occur; and (4) classification as a financing activity in the statement of cash flows of cash paid by an employer to the taxing authority when directly withholding shares for tax withholding purposes. The amendments in this ASU are effective for annual periods beginning after December 15, 2016, including interim periods within that reporting period, which is our fiscal 2017. Had we early adopted the standard, we estimate 2016 full year net earnings would have increased by $0.7 million and diluted weighted average shares outstanding would have increased by 82,384 shares which would have resulted in a favorable effect on basic and diluted earnings per share of $0.04 and $0.03, respectively. We will adopt this ASU during the first quarter of 2017.
Measurement of Credit Losses on Financial Instruments
In June 2016, the FASB issued ASU No. 2016-13, Financial Instruments – Credit Losses (Topic 326): Measurement of Credit Losses on Financial Instruments. Among other things, the ASU requires the measurement of all expected credit losses for financial assets held at the reporting date based on historical experience, current conditions and reasonable and supportable forecasts. Companies will now use forward-looking information to better inform their credit loss estimates. The amendments in this ASU are effective for annual periods beginning after December 15, 2019, including interim periods within that reporting period, which is our fiscal 2020. Early application is permitted. We are currently evaluating the impact of this amended guidance on our Consolidated Financial Statements and related disclosures.
Classification of Certain Cash Receipts and Cash Payments
In August 2016, the FASB issued ASU 2016-15, Statement of Cash Flows (Topic 230): Classification of Certain Cash Receipts and Cash Payments. ASU 2016-15 addresses how certain cash receipts and cash payments are presented and classified in the statement of cash flows under Topic 230, Statement of Cash Flow, and other Topics. This ASU is effective for annual reporting periods beginning after December 15, 2017, including interim periods within that reporting period, which is our fiscal 2018. We are currently evaluating the impact of this amended guidance on our Consolidated Financial Statements and related disclosures.
Intra-Entity Transfers of Assets Other Than Inventory
In October 2016, the FASB issued ASU No. 2016-16, Income Taxes (Topic 740): Intra-Entity Transfers of Assets Other Than Inventory. This ASU changes the timing of income tax recognition for an intercompany sale of assets. The ASU requires the seller’s tax effects and the buyer’s deferred taxes to be recognized immediately upon the sale instead of deferring accounting for the income tax implications until the assets are sold to a third party or recovered through use. This ASU is effective for annual reporting periods beginning after December 15, 2017, including interim periods within that reporting period, which is our fiscal 2018. We are currently evaluating the effect that this guidance will have on our Consolidated Financial Statements.
No other new accounting pronouncements issued during 2016 but not yet effective have had, or are expected to have, a material impact on our results of operations or financial position.
18
Critical Accounting Policies and Estimates
Our Consolidated Financial Statements are based on the selection and application of accounting principles generally accepted in the United States of America, which require us to make estimates and assumptions about future events that affect the amounts reported in our Consolidated Financial Statements and the accompanying notes. Our significant accounting policies are described in Note 1 to the Consolidated Financial Statements. Future events and their effects cannot be determined with absolute certainty. Therefore, the determination of estimates requires the exercise of judgment. Actual results could differ from those estimates, and any such differences may be material to the Consolidated Financial Statements. We believe that the following policies may involve a higher degree of judgment and complexity in their application and represent the critical accounting policies used in the preparation of our Consolidated Financial Statements. If different assumptions or conditions were to prevail, the results could be materially different from our reported results.
Allowance for Doubtful Accounts – We record a reserve for accounts receivable that are potentially uncollectible. A considerable amount of judgment is required in assessing the realization of these receivables including the current creditworthiness of each customer and related aging of the past-due balances. In order to assess the collectability of these receivables, we perform ongoing credit evaluations of our customers’ financial condition. Through these evaluations, we may become aware of a situation where a customer may not be able to meet its financial obligations due to deterioration of its financial viability, credit ratings or bankruptcy. The reserve requirements are based on the best facts available to us and are reevaluated and adjusted as additional information becomes available. Our reserves are also based on amounts determined by using percentages applied to trade receivables. These percentages are determined by a variety of factors including, but not limited to, current economic trends, historical payment and bad debt write-off experience. We are not able to predict changes in the financial condition of our customers and if circumstances related to these customers deteriorate, our estimates of the recoverability of accounts receivable could be materially affected and we may be required to record additional allowances. Alternatively, if more allowances are provided than are ultimately required, we may reverse a portion of such provisions in future periods based on the actual collection experience. Bad debt write-offs as a percentage of Net Sales were approximately 0.1% in 2016, 0.2% in 2015 and 0.1% in 2014. As of December 31, 2016, we had $3.1 million reserved against Accounts Receivable for doubtful accounts and sales returns.
Inventory Reserves – We value our inventory at the lower of the cost of inventory or fair market value through the establishment of a reserve for excess, slow moving and obsolete inventory. In assessing the ultimate realization of inventories, we are required to make judgments as to future demand requirements compared with inventory levels. Reserve requirements are developed by comparing our inventory levels to our projected demand requirements based on historical demand, market conditions and technological and product life cycle changes. It is possible that an increase in our reserve may be required in the future if there are significant declines in demand for certain products. This reserve creates a new cost basis for these products and is considered permanent. As of December 31, 2016, we had $3.6 million reserved against Inventories.
Goodwill – Goodwill represents the excess of cost over the fair value of net assets of businesses acquired and is allocated to our reporting units at the time of the acquisition. We analyze Goodwill on an annual basis and when an event occurs or circumstances change that may reduce the fair value of one of our reporting units below its carrying amount. A goodwill impairment loss occurs if the carrying amount of a reporting unit’s Goodwill exceeds its fair value.
We performed an analysis of qualitative factors to determine whether it is more likely than not that the fair value of a reporting unit is less than its carrying amount as a basis for determining whether it is necessary to perform the two-step quantitative goodwill impairment test. The first step of the two-step model is used as an indicator to identify if there is potential goodwill impairment. If the first step indicates there may be an impairment, the second step is performed which measures the amount of the goodwill impairment, if any. We perform our goodwill impairment analysis as of year end and use our judgment to develop assumptions for the discounted cash flow model that we use, if necessary. Management assumptions include forecasting revenues and margins, estimating capital expenditures, depreciation, amortization and discount rates.
If our goodwill impairment testing resulted in one or more of our reporting units’ carrying amount exceeding its fair value, we would write down our reporting units’ carrying amount to its fair value and would record an impairment charge in our results of operations in the period such determination is made. Subsequent reversal of goodwill impairment charges is not permitted. Each of our reporting units were analyzed for impairment as of December 31, 2016 and based upon our analysis, the estimated fair values of our reporting units substantially exceeded their carrying amounts. We had Goodwill of $21.1 million as of December 31, 2016.
Warranty Reserves – We record a liability for warranty claims at the time of sale. The amount of the liability is based on the trend in the historical ratio of claims to net sales, the historical length of time between the sale and resulting warranty claim, new product introductions and other factors. Future claims experience could be materially different from prior results because of the introduction of new, more complex products, a change in our warranty policy in response to industry trends, competition or other external forces, or manufacturing changes that could impact product quality. In the event we determine that our current or future product repair and replacement costs exceed our estimates, an adjustment to these reserves would be charged to earnings in the period such determination is made. Warranty expense as a percentage of Net Sales was 1.5% in 2016, 1.4% in 2015 and 1.3% in 2014. As of December 31, 2016, we had $11.0 million reserved for future estimated warranty costs.
Income Taxes – We are required to estimate our income taxes in each of the jurisdictions in which we operate. This process involves estimating our actual current tax obligations based on expected income, statutory tax rates and tax planning opportunities in the various jurisdictions. We also establish reserves for uncertain tax matters that are complex in nature and uncertain as to the ultimate outcome. Although we believe that our tax return positions are fully supportable, we consider our ability to ultimately prevail in defending these matters when establishing these reserves. We adjust our reserves in light of changing facts and circumstances, such as the closing of a tax audit. We believe that our current reserves are adequate. However, the ultimate outcome may differ from our estimates and assumptions and could impact the income tax expense reflected in our Consolidated Statements of Earnings.
19
Tax law requires certain items to be included in our tax return at different times than the items are reflected in our results of operations. Some of these differences are permanent, such as expenses that are not deductible in our tax returns, and some differences will reverse over time, such as depreciation expense on property, plant and equipment. These temporary differences result in deferred tax assets and liabilities, which are included within our Consolidated Balance Sheets. Deferred tax assets generally represent items that can be used as a tax deduction or credit in our tax returns in future years but have already been recorded as an expense in our Consolidated Statements of Earnings. We assess the likelihood that our deferred tax assets will be recovered from future taxable income, and, based on management’s judgment, to the extent we believe that recovery is not more likely than not, we establish a valuation reserve against those deferred tax assets. The deferred tax asset valuation allowance could be materially different from actual results because of changes in the mix of future taxable income, the relationship between book and taxable income and our tax planning strategies. As of December 31, 2016, a valuation allowance of $6.9 million was recorded against foreign tax loss carryforwards, foreign tax credit carryforwards and state credit carryforwards.
Cautionary Factors Relevant to Forward-Looking Information
This annual report on Form 10-K, including “Management’s Discussion and Analysis of Financial Condition and Results of Operations” in Item 7, contain certain statements that are considered “forward-looking statements” within the meaning of the Private Securities Litigation Reform Act of 1995. Forward-looking statements generally can be identified by the use of forward-looking terminology such as “may,” “will,” “expect,” “intend,” “estimate,” “anticipate,” “believe,” “project,” or “continue” or similar words or the negative thereof. These statements do not relate to strictly historical or current facts and provide current expectations of forecasts of future events. Any such expectations or forecasts of future events are subject to a variety of factors. Particular risks and uncertainties presently facing us include:
• | Geopolitical and economic uncertainty throughout the world. |
• | Competition in our business. |
• | Ability to attract, retain and develop key personnel and create effective succession planning strategies. |
• | Ability to achieve operational efficiencies, including synergistic and other benefits of acquisitions. |
• | Ability to effectively manage organizational changes. |
• | Ability to successfully upgrade, evolve and protect our information technology systems. |
• | Ability to develop and commercialize new innovative products and services. |
• | Unforeseen product liability claims or product quality issues. |
• | Fluctuations in the cost or availability of raw materials and purchased components. |
• | Relative strength of the U.S. dollar, which affects the cost of our materials and products purchased and sold internationally. |
• | Occurrence of a significant business interruption. |
• | Ability to comply with laws and regulations. |
• | Inability to implement remediation measures to address material weaknesses in internal control. |
We caution that forward-looking statements must be considered carefully and that actual results may differ in material ways due to risks and uncertainties both known and unknown. Information about factors that could materially affect our results can be found in Part I, Item 1A - Risk Factors. Shareholders, potential investors and other readers are urged to consider these factors in evaluating forward-looking statements and are cautioned not to place undue reliance on such forward-looking statements.
We undertake no obligation to update or revise any forward-looking statement, whether as a result of new information, future events or otherwise. Investors are advised to consult any further disclosures by us in our filings with the Securities and Exchange Commission and in other written statements on related subjects. It is not possible to anticipate or foresee all risk factors, and investors should not consider any list of such factors to be an exhaustive or complete list of all risks or uncertainties.
ITEM 7A – Quantitative and Qualitative Disclosures About Market Risk
Commodity Risk – We are subject to exposures resulting from potential cost increases related to our purchase of raw materials or other product components. We do not use derivative commodity instruments to manage our exposures to changes in commodity prices such as steel, oil, gas, lead and other commodities.
Various factors beyond our control affect the price of oil and gas, including but not limited to worldwide and domestic supplies of oil and gas, political instability or armed conflict in oil-producing regions, the price and level of foreign imports, the level of consumer demand, the price and availability of alternative fuels, domestic and foreign governmental regulation, weather-related factors and the overall economic environment. We purchase petroleum-related component parts for use in our manufacturing operations. In addition, our freight costs associated with shipping and receiving product and sales and service vehicle fuel costs are impacted by fluctuations in the cost of oil and gas.
Fluctuations in worldwide demand and other factors affect the price for lead, steel and related products. We do not maintain an inventory of raw or fabricated steel or batteries in excess of near-term production requirements. As a result, increases in the price of lead or steel can significantly increase the cost of our lead- and steel-based raw materials and component parts.
During 2016, we experienced minor net deflation on our raw materials and other purchased component costs. We continue to focus on mitigating the risk of future raw material or other product component cost increases through supplier negotiations, ongoing optimization of our supply chain, the continuation of cost reduction actions and product pricing. The success of these efforts will depend upon our ability to leverage our commodity spend in the current global economic environment. If the commodity prices increase significantly and we are not able to offset the increases with higher selling prices, our results may be unfavorably impacted in 2017.
Foreign Currency Exchange Rate Risk – Due to the global nature of our operations, we are subject to exposures resulting from foreign currency exchange fluctuations in the normal course of business. Our primary exchange rate exposures are with the Euro, Australian and Canadian dollars, British pound, Japanese yen, Chinese renminbi, Brazilian real and Mexican peso against the U.S. dollar. The direct financial impact of foreign currency exchange includes the effect of translating profits from local currencies to U.S. dollars, the impact of currency fluctuations on the transfer of goods between our operations in the United States and our international operations and transaction gains and losses. In addition to the direct financial impact, foreign currency exchange has an indirect financial impact on our results, including the effect on sales volume within local economies and the impact of pricing actions taken as a result of foreign exchange rate fluctuations.
20
In the normal course of business, we actively manage the exposure of our foreign currency exchange rate market risk by entering into various hedging instruments with counterparties that are highly rated financial institutions. We may use foreign exchange purchased options or forward contracts to hedge our foreign currency denominated forecasted revenues or forecasted sales to wholly owned foreign subsidiaries. Additionally, we hedge our net recognized foreign currency assets and liabilities with foreign exchange forward contracts. We hedge these exposures to reduce the risk that our net earnings and cash flows will be adversely affected by changes in foreign exchange rates. We do not enter into any of these instruments for speculative or trading purposes to generate revenue.
These contracts are carried at fair value and have maturities between one and 12 months. The gains and losses on these contracts generally approximate changes in the value of the related assets, liabilities or forecasted transactions. Some of the derivative instruments we enter into do not meet the criteria for cash flow hedge accounting treatment; therefore, changes in fair value are recorded in Foreign Currency Transaction Losses on our Consolidated Statements of Earnings. For further information regarding our foreign currency derivatives and hedging programs, see Note 11 to the Consolidated Financial Statements.
The average contracted rate and notional amounts of the foreign currency derivative instruments outstanding at December 31, 2016, presented in U.S. dollar equivalents are as follows (dollars in thousands, except average contracted rate):
Notional Amount | Average Contracted Rate | Maximum Term (Months) | |||
Derivatives designated as hedging instrument: | |||||
Foreign currency option contracts: | |||||
Canadian dollar | $ | 8,522 | 1.358 | 12 | |
Foreign currency forward contracts: | |||||
Canadian dollar | 2,127 | 1.350 | 3 | ||
Derivatives not designated as hedging instruments: | |||||
Foreign currency forward contracts: | |||||
Australian dollar | $ | 4,480 | 1.393 | 6 | |
Brazilian real | 5,402 | 3.287 | 1 | ||
Canadian dollar | 6,790 | 1.347 | 12 | ||
Euro | 21,101 | 0.941 | 12 | ||
Japanese yen | 1,393 | 116.487 | 1 | ||
Mexican peso | 3,700 | 20.758 | 1 | ||
For details of the estimated effects of currency translation on the operations of our operating segments, see Item 7 – Management's Discussion and Analysis of Financial Condition and Results of Operations.
Other Matters – Management regularly reviews our business operations with the objective of improving financial performance and maximizing our return on investment. As a result of this ongoing process to improve financial performance, we may incur additional restructuring charges in the future which, if taken, could be material to our financial results.
21
ITEM 8 – Financial Statements and Supplementary Data
REPORT OF INDEPENDENT REGISTERED PUBLIC ACCOUNTING FIRM
The Board of Directors and Shareholders
Tennant Company:
We have audited the accompanying consolidated balance sheets of Tennant Company and subsidiaries as of December 31, 2016 and 2015, and the related consolidated statements of earnings, comprehensive income, shareholders’ equity, and cash flows for each of the years in the three‑year period ended December 31, 2016. In connection with our audits of the consolidated financial statements, we also have audited the financial statement schedule as included in Item 15.A.2. These consolidated financial statements and financial statement schedule are the responsibility of the Company’s management. Our responsibility is to express an opinion on these consolidated financial statements and financial statement schedules based on our audits.
We conducted our audits in accordance with the standards of the Public Company Accounting Oversight Board (United States). Those standards require that we plan and perform the audit to obtain reasonable assurance about whether the financial statements are free of material misstatement. An audit includes examining, on a test basis, evidence supporting the amounts and disclosures in the financial statements. An audit also includes assessing the accounting principles used and significant estimates made by management, as well as evaluating the overall financial statement presentation. We believe that our audits provide a reasonable basis for our opinion.
In our opinion, the consolidated financial statements referred to above present fairly, in all material respects, the financial position of Tennant Company and subsidiaries as of December 31, 2016 and 2015, and the results of their operations and their cash flows for each of the years in the three‑year period ended December 31, 2016, in conformity with U.S. generally accepted accounting principles. Also in our opinion, the related financial statement schedule, when considered in relation to the basic consolidated financial statements taken as a whole, presents fairly, in all material respects, the information set forth therein.
We also have audited, in accordance with the standards of the Public Company Accounting Oversight Board (United States), Tennant Company’s internal control over financial reporting as of December 31, 2016, based on criteria established in Internal Control - Integrated Framework (2013) issued by the Committee of Sponsoring Organizations of the Treadway Commission (COSO), and our report dated March 1, 2017 expressed an adverse opinion on the effectiveness of the Company’s internal control over financial reporting.
/s/ KPMG LLP
Minneapolis, Minnesota
March 1, 2017
22
REPORT OF INDEPENDENT REGISTERED PUBLIC ACCOUNTING FIRM
The Board of Directors and Shareholders
Tennant Company:
We have audited Tennant Company’s internal control over financial reporting as of December 31, 2016, based on criteria established in Internal Control Integrated Framework (2013) issued by the Committee of Sponsoring Organizations of the Treadway Commission (COSO). Tennant Company's management is responsible for maintaining effective internal control over financial reporting and for its assessment of the effectiveness of internal control over financial reporting, included in the accompanying Management’s Report on Internal Control over Financial Reporting. Our responsibility is to express an opinion on the Company's internal control over financial reporting based on our audit.
We conducted our audit in accordance with the standards of the Public Company Accounting Oversight Board (United States). Those standards require that we plan and perform the audit to obtain reasonable assurance about whether effective internal control over financial reporting was maintained in all material respects. Our audit included obtaining an understanding of internal control over financial reporting, assessing the risk that a material weakness exists, and testing and evaluating the design and operating effectiveness of internal control based on the assessed risk. Our audit also included performing such other procedures as we considered necessary in the circumstances. We believe that our audit provides a reasonable basis for our opinion.
A company's internal control over financial reporting is a process designed to provide reasonable assurance regarding the reliability of financial reporting and the preparation of financial statements for external purposes in accordance with generally accepted accounting principles. A company’s internal control over financial reporting includes those policies and procedures that (1) pertain to the maintenance of records that, in reasonable detail, accurately and fairly reflect the transactions and dispositions of the assets of the company; (2) provide reasonable assurance that transactions are recorded as necessary to permit preparation of financial statements in accordance with generally accepted accounting principles, and that receipts and expenditures of the company are being made only in accordance with authorizations of management and directors of the company; and (3) provide reasonable assurance regarding prevention or timely detection of unauthorized acquisition, use, or disposition of the company’s assets that could have a material effect on the financial statements.
Because of its inherent limitations, internal control over financial reporting may not prevent or detect misstatements. Also, projections of any evaluation of effectiveness to future periods are subject to the risk that controls may become inadequate because of changes in conditions, or that the degree of compliance with the policies or procedures may deteriorate.
A material weakness is a deficiency, or a combination of deficiencies, in internal control over financial reporting, such that there is a reasonable possibility that a material misstatement of the company’s annual or interim financial statements will not be prevented or detected on a timely basis.
Material weaknesses related to an insufficient number of trained resources with assigned responsibility and accountability over the design and operation of internal controls; ineffective risk assessment process that identified and assessed necessary changes in significant accounting policies and practices that were responsive to changes in business operations and new product arrangements; ineffective general information technology controls, specifically program change controls in the service scheduling system; ineffective automated and manual controls over the accounting for revenue related to equipment maintenance and repair service; ineffective design and documentation of management review controls over the accounting for certain inventory adjustments, incentive accruals and performance share awards; and ineffective control over the determination of technological feasibility and the capitalization of software development costs have been identified and included in management’s assessment.
We also have audited, in accordance with the standards of the Public Company Accounting Oversight Board (United States), the consolidated balance sheets of Tennant Company and subsidiaries as of December 31, 2016 and 2015, and the related consolidated statements of earnings, comprehensive income, shareholders’ equity, and cash flows, and the related financial statement schedule, for each of the years in the three-year period ended December 31, 2016. The material weaknesses were considered in determining the nature, timing, and extent of audit tests applied in our audit of the 2016 consolidated financial statements, and this report does not affect our report dated March 1, 2017, which expressed an unqualified opinion on those consolidated financial statements.
In our opinion, because of the effect of the aforementioned material weaknesses on the achievement of the objectives of the control criteria, Tennant Company has not maintained effective internal control over financial reporting as of December 31, 2016, based on criteria established in Internal Control-Integrated Framework 2013 issued by the Committee of Sponsoring Organizations of the Treadway Commission (COSO).
Tennant Company acquired selected assets and liabilities of Crawford Laboratories, Inc. and affiliates thereof (“Florock”) and Dofesa Barrido Mecanizado (“Dofesa”) during 2016 which were accounted for as business combinations, and management excluded from its assessment of the effectiveness of Tennant Company’s internal control over financial reporting as of December 31, 2016 Florock and Dofesa’s internal control over financial reporting associated with total assets of $14 million and total revenues of $9 million included in the consolidated financial statements of Tennant Company and subsidiaries as of and for the year ended December 31, 2016. Our audit of internal control over financial reporting of Tennant Company also excluded an evaluation of the internal control over financial reporting of Florock and Dofesa.
/s/ KPMG LLP
Minneapolis, Minnesota
March 1, 2017
23
Consolidated Statements of Earnings
TENNANT COMPANY AND SUBSIDIARIES
(In thousands, except shares and per share data)
Years ended December 31 | 2016 | 2015 | 2014 | ||||||||
Net Sales | $ | 808,572 | $ | 811,799 | $ | 821,983 | |||||
Cost of Sales | 456,977 | 462,739 | 469,556 | ||||||||
Gross Profit | 351,595 | 349,060 | 352,427 | ||||||||
Operating Expense: | |||||||||||
Research and Development Expense | 34,738 | 32,415 | 29,432 | ||||||||
Selling and Administrative Expense | 248,210 | 252,270 | 250,898 | ||||||||
Impairment of Long-Lived Assets | — | 11,199 | — | ||||||||
Loss on Sale of Business | 149 | — | — | ||||||||
Total Operating Expense | 283,097 | 295,884 | 280,330 | ||||||||
Profit from Operations | 68,498 | 53,176 | 72,097 | ||||||||
Other Income (Expense): | |||||||||||
Interest Income | 330 | 172 | 302 | ||||||||
Interest Expense | (1,279 | ) | (1,313 | ) | (1,722 | ) | |||||
Net Foreign Currency Transaction Losses | (392 | ) | (954 | ) | (690 | ) | |||||
Other Expense, Net | (666 | ) | (657 | ) | (449 | ) | |||||
Total Other Expense, Net | (2,007 | ) | (2,752 | ) | (2,559 | ) | |||||
Profit Before Income Taxes | 66,491 | 50,424 | 69,538 | ||||||||
Income Tax Expense | 19,877 | 18,336 | 18,887 | ||||||||
Net Earnings | $ | 46,614 | $ | 32,088 | $ | 50,651 | |||||
Net Earnings per Share: | |||||||||||
Basic | $ | 2.66 | $ | 1.78 | $ | 2.78 | |||||
Diluted | $ | 2.59 | $ | 1.74 | $ | 2.70 | |||||
Weighted Average Shares Outstanding: | |||||||||||
Basic | 17,523,267 | 18,015,151 | 18,217,384 | ||||||||
Diluted | 17,976,183 | 18,493,447 | 18,740,858 | ||||||||
Cash Dividends Declared per Common Share | $ | 0.81 | $ | 0.80 | $ | 0.78 | |||||
See accompanying Notes to Consolidated Financial Statements.
Consolidated Statements of Comprehensive Income
TENNANT COMPANY AND SUBSIDIARIES
(In thousands)
Years ended December 31 | 2016 | 2015 | 2014 | ||||||||
Net Earnings | $ | 46,614 | $ | 32,088 | $ | 50,651 | |||||
Other Comprehensive Income (Loss): | |||||||||||
Foreign currency translation adjustments | 109 | (12,520 | ) | (10,112 | ) | ||||||
Pension and retiree medical benefits | (2,248 | ) | 4,121 | (5,382 | ) | ||||||
Cash flow hedge | (305 | ) | 164 | — | |||||||
Income Taxes: | |||||||||||
Foreign currency translation adjustments | 32 | 25 | 13 | ||||||||
Pension and retiree medical benefits | 504 | (1,265 | ) | 1,859 | |||||||
Cash flow hedge | 114 | (61 | ) | — | |||||||
Total Other Comprehensive Loss, net of tax | (1,794 | ) | (9,536 | ) | (13,622 | ) | |||||
Comprehensive Income | $ | 44,820 | $ | 22,552 | $ | 37,029 | |||||
See accompanying Notes to Consolidated Financial Statements.
24
Consolidated Balance Sheets
TENNANT COMPANY AND SUBSIDIARIES
(In thousands, except shares and per share data)
December 31 | 2016 | 2015 | |||||
ASSETS | |||||||
Current Assets: | |||||||
Cash and Cash Equivalents | $ | 58,033 | $ | 51,300 | |||
Restricted Cash | 517 | 640 | |||||
Receivables: | |||||||
Trade, less Allowances of $3,108 and $3,615, respectively | 145,299 | 136,344 | |||||
Other | 3,835 | 4,101 | |||||
Net Receivables | 149,134 | 140,445 | |||||
Inventories | 78,622 | 77,292 | |||||
Prepaid Expenses | 9,204 | 14,656 | |||||
Other Current Assets | 2,412 | 2,485 | |||||
Assets Held for Sale | — | 6,826 | |||||
Total Current Assets | 297,922 | 293,644 | |||||
Property, Plant and Equipment | 298,500 | 276,811 | |||||
Accumulated Depreciation | (186,403 | ) | (181,853 | ) | |||
Property, Plant and Equipment, Net | 112,097 | 94,958 | |||||
Deferred Income Taxes | 13,439 | 12,051 | |||||
Goodwill | 21,065 | 16,803 | |||||
Intangible Assets, Net | 6,460 | 3,195 | |||||
Other Assets | 19,054 | 11,644 | |||||
Total Assets | $ | 470,037 | $ | 432,295 | |||
LIABILITIES AND SHAREHOLDERS' EQUITY | |||||||
Current Liabilities: | |||||||
Current Portion of Long-Term Debt | $ | 3,459 | $ | 3,459 | |||
Accounts Payable | 47,408 | 50,350 | |||||
Employee Compensation and Benefits | 35,997 | 34,528 | |||||
Income Taxes Payable | 2,348 | 1,398 | |||||
Other Current Liabilities | 43,617 | 43,027 | |||||
Liabilities Held for Sale | — | 454 | |||||
Total Current Liabilities | 132,829 | 133,216 | |||||
Long-Term Liabilities: | |||||||
Long-Term Debt | 32,735 | 21,194 | |||||
Employee-Related Benefits | 21,134 | 21,508 | |||||
Deferred Income Taxes | 171 | 5 | |||||
Other Liabilities | 4,625 | 4,165 | |||||
Total Long-Term Liabilities | 58,665 | 46,872 | |||||
Total Liabilities | 191,494 | 180,088 | |||||
Commitments and Contingencies (Note 15) | |||||||
Shareholders' Equity: | |||||||
Preferred Stock of $0.02 par value per share, 1,000,000 shares authorized; no shares issued or outstanding | — | — | |||||
Common Stock, $0.375 par value per share, 60,000,000 shares authorized; 17,688,350 and 17,744,381 issued and outstanding, respectively | 6,633 | 6,654 | |||||
Additional Paid-In Capital | 3,653 | — | |||||
Retained Earnings | 318,180 | 293,682 | |||||
Accumulated Other Comprehensive Loss | (49,923 | ) | (48,129 | ) | |||
Total Shareholders’ Equity | 278,543 | 252,207 | |||||
Total Liabilities and Shareholders’ Equity | $ | 470,037 | $ | 432,295 | |||
See accompanying Notes to Consolidated Financial Statements.
25
Consolidated Statements of Cash Flows
TENNANT COMPANY AND SUBSIDIARIES
(In thousands)
Years ended December 31 | 2016 | 2015 | 2014 | ||||||||
OPERATING ACTIVITIES | |||||||||||
Net Earnings | $ | 46,614 | $ | 32,088 | $ | 50,651 | |||||
Adjustments to Reconcile Net Earnings to Net Cash Provided by Operating Activities: | |||||||||||
Depreciation | 17,891 | 16,550 | 17,694 | ||||||||
Amortization | 409 | 1,481 | 2,369 | ||||||||
Impairment of Long-Lived Assets | — | 11,199 | — | ||||||||
Deferred Income Taxes | (1,172 | ) | (1,129 | ) | 129 | ||||||
Share-Based Compensation Expense | 3,875 | 8,222 | 7,314 | ||||||||
Allowance for Doubtful Accounts and Returns | 468 | 1,089 | 1,504 | ||||||||
Loss on Sale of Business | 149 | — | — | ||||||||
Other, Net | (345 | ) | (100 | ) | 24 | ||||||
Changes in Operating Assets and Liabilities: | |||||||||||
Receivables, Net | (9,278 | ) | 4,547 | (18,811 | ) | ||||||
Inventories | 23 | (10,190 | ) | (21,155 | ) | ||||||
Accounts Payable | (3,904 | ) | (10,455 | ) | 10,192 | ||||||
Employee Compensation and Benefits | 124 | 716 | 1,927 | ||||||||
Other Current Liabilities | (185 | ) | (402 | ) | 2,782 | ||||||
Income Taxes | 5,427 | (4,283 | ) | 3,466 | |||||||
Other Assets and Liabilities | (2,218 | ) | (4,101 | ) | 1,276 | ||||||
Net Cash Provided by Operating Activities | 57,878 | 45,232 | 59,362 | ||||||||
INVESTING ACTIVITIES | |||||||||||
Purchases of Property, Plant and Equipment | (26,526 | ) | (24,780 | ) | (19,583 | ) | |||||
Proceeds from Disposals of Property, Plant and Equipment | 615 | 336 | 291 | ||||||||
Acquisition of Businesses, Net of Cash Acquired | (12,933 | ) | — | — | |||||||
Issuance of Long-Term Note Receivable | (2,000 | ) | — | — | |||||||
Proceeds from Sale of Business | 285 | 1,185 | 1,416 | ||||||||
Decrease (Increase) in Restricted Cash | 116 | (322 | ) | 6 | |||||||
Net Cash Used for Investing Activities | (40,443 | ) | (23,581 | ) | (17,870 | ) | |||||
FINANCING ACTIVITIES | |||||||||||
Payments of Short-Term Debt | — | — | (1,500 | ) | |||||||
Payments of Long-Term Debt | (3,460 | ) | (3,445 | ) | (2,016 | ) | |||||
Issuance of Long-Term Debt | 15,000 | — | — | ||||||||
Purchases of Common Stock | (12,762 | ) | (45,998 | ) | (14,097 | ) | |||||
Proceeds from Issuances of Common Stock | 5,271 | 1,677 | 2,269 | ||||||||
Excess Tax Benefit on Stock Plans | 686 | 859 | 1,793 | ||||||||
Dividends Paid | (14,293 | ) | (14,498 | ) | (14,487 | ) | |||||
Net Cash Used for Financing Activities | (9,558 | ) | (61,405 | ) | (28,038 | ) | |||||
Effect of Exchange Rate Changes on Cash and Cash Equivalents | (1,144 | ) | (1,908 | ) | (1,476 | ) | |||||
NET INCREASE (DECREASE) IN CASH AND CASH EQUIVALENTS | 6,733 | (41,662 | ) | 11,978 | |||||||
Cash and Cash Equivalents at Beginning of Year | 51,300 | 92,962 | 80,984 | ||||||||
CASH AND CASH EQUIVALENTS AT END OF YEAR | $ | 58,033 | $ | 51,300 | $ | 92,962 | |||||
SUPPLEMENTAL CASH FLOW INFORMATION | |||||||||||
Cash Paid During the Year for: | |||||||||||
Income Taxes | $ | 14,172 | $ | 23,421 | $ | 11,342 | |||||
Interest | $ | 1,135 | $ | 1,167 | $ | 1,470 | |||||
Supplemental Non-Cash Investing and Financing Activities: | |||||||||||
Long-Term Note Receivable from Sale of Business | $ | 5,489 | $ | — | $ | — | |||||
Capital Expenditures in Accounts Payable | $ | 2,045 | $ | 1,830 | $ | 1,197 | |||||
See accompanying Notes to Consolidated Financial Statements.
26
Consolidated Statements of Shareholders’ Equity
TENNANT COMPANY AND SUBSIDIARIES
(In thousands, except shares and per share data)
Common Shares | Common Stock | Additional Paid-in Capital | Retained Earnings | Accumulated Other Comprehensive Loss | Total Shareholders' Equity | ||||||||||||
Balance, December 31, 2013 | 18,491,524 | $ | 6,934 | $ | 31,956 | $ | 249,927 | $ | (24,971 | ) | $ | 263,846 | |||||
Net Earnings | — | — | — | 50,651 | — | 50,651 | |||||||||||
Other Comprehensive Loss | — | — | — | — | (13,622 | ) | (13,622 | ) | |||||||||
Issue Stock for Directors, Employee Benefit and Stock Plans, net of related tax withholdings of 46,152 shares | 148,557 | 56 | (804 | ) | — | — | (748 | ) | |||||||||
Share-Based Compensation | — | — | 7,314 | — | — | 7,314 | |||||||||||
Dividends paid $0.78 per Common Share | — | — | — | (14,487 | ) | — | (14,487 | ) | |||||||||
Tax Benefit on Stock Plans | — | — | 1,793 | — | — | 1,793 | |||||||||||
Purchases of Common Stock | (225,034 | ) | (84 | ) | (14,012 | ) | — | — | (14,096 | ) | |||||||
Balance, December 31, 2014 | 18,415,047 | $ | 6,906 | $ | 26,247 | $ | 286,091 | $ | (38,593 | ) | $ | 280,651 | |||||
Net Earnings | — | — | — | 32,088 | — | 32,088 | |||||||||||
Other Comprehensive Loss | — | — | — | — | (9,536 | ) | (9,536 | ) | |||||||||
Issue Stock for Directors, Employee Benefit and Stock Plans, net of related tax withholdings of 23,160 shares | 93,380 | 35 | 384 | — | — | 419 | |||||||||||
Share-Based Compensation | — | — | 8,222 | — | — | 8,222 | |||||||||||
Dividends paid $0.80 per Common Share | — | — | — | (14,498 | ) | — | (14,498 | ) | |||||||||
Tax Benefit on Stock Plans | — | — | 859 | — | — | 859 | |||||||||||
Purchases of Common Stock | (764,046 | ) | (287 | ) | (35,712 | ) | (9,999 | ) | — | (45,998 | ) | ||||||
Balance, December 31, 2015 | 17,744,381 | $ | 6,654 | $ | — | $ | 293,682 | $ | (48,129 | ) | $ | 252,207 | |||||
Net Earnings | — | — | — | 46,614 | — | 46,614 | |||||||||||
Other Comprehensive Loss | — | — | — | — | (1,794 | ) | (1,794 | ) | |||||||||
Issue Stock for Directors, Employee Benefit and Stock Plans, net of related tax withholdings of 23,113 shares | 190,443 | 71 | 3,939 | — | — | 4,010 | |||||||||||
Share-Based Compensation | — | — | 3,875 | — | — | 3,875 | |||||||||||
Dividends paid $0.81 per Common Share | — | — | — | (14,293 | ) | — | (14,293 | ) | |||||||||
Tax Benefit on Stock Plans | — | — | 686 | — | — | 686 | |||||||||||
Purchases of Common Stock | (246,474 | ) | (92 | ) | (4,847 | ) | (7,823 | ) | — | (12,762 | ) | ||||||
Balance, December 31, 2016 | 17,688,350 | $ | 6,633 | $ | 3,653 | $ | 318,180 | $ | (49,923 | ) | $ | 278,543 | |||||
See accompanying Notes to Consolidated Financial Statements.
27
NOTES TO THE CONSOLIDATED FINANCIAL STATEMENTS
(In thousands, except shares and per share data)
1. | Summary of Significant Accounting Policies |
Nature of Operations – Our primary business is in designing, manufacturing and marketing solutions that empower customers to achieve quality cleaning performance, significantly reduce environmental impact and help create a cleaner, safer, healthier world. Tennant is committed to creating and commercializing breakthrough, sustainable cleaning innovations to enhance its broad suite of products, including: floor maintenance and outdoor cleaning equipment, detergent-free and other sustainable cleaning technologies, aftermarket parts and consumables, equipment maintenance and repair service, specialty surface coatings and asset management solutions. Tennant products are used in many types of environments including: Retail establishments, distribution centers, factories and warehouses, public venues such as arenas and stadiums, office buildings, schools and universities, hospitals and clinics, parking lots and streets, and more. Customers include contract cleaners to whom organizations outsource facilities maintenance, as well as businesses that perform facilities maintenance themselves. The Company reaches these customers through the industry's largest direct sales and service organization and through a strong and well-supported network of authorized distributors worldwide.
Consolidation – The Consolidated Financial Statements include the accounts of Tennant Company and its subsidiaries. All intercompany transactions and balances have been eliminated. In these Notes to the Consolidated Financial Statements, Tennant Company is referred to as “Tennant,” “we,” “us,” or “our.”
Translation of Non-U.S. Currency – Foreign currency-denominated assets and liabilities have been translated to U.S. dollars at year-end exchange rates, while income and expense items are translated at average exchange rates prevailing during the year. Gains or losses resulting from translation are included as a separate component of Accumulated Other Comprehensive Loss. The balance of cumulative foreign currency translation adjustments recorded within Accumulated Other Comprehensive Loss as of December 31, 2016, 2015 and 2014 was a net loss of $44,444, $44,585 and $32,090, respectively. The majority of translation adjustments are not adjusted for income taxes as substantially all translation adjustments relate to permanent investments in non-U.S. subsidiaries. Net Foreign Currency Transaction Losses are included in Other Income (Expense).
Use of Estimates – In preparing the consolidated financial statements in conformity with U.S. generally accepted accounting principles ("U.S. GAAP"), management must make decisions that impact the reported amounts of assets, liabilities, revenues, expenses and the related disclosures, including disclosures of contingent assets and liabilities. Such decisions include the selection of the appropriate accounting principles to be applied and the assumptions on which to base accounting estimates. Estimates are used in determining, among other items, sales promotions and incentives accruals, inventory valuation, warranty reserves, allowance for doubtful accounts, pension and postretirement accruals, useful lives for intangible assets, and future cash flows associated with impairment testing for Goodwill and other long-lived assets. These estimates and assumptions are based on management’s best estimates and judgments. Management evaluates its estimates and assumptions on an ongoing basis using historical experience and other factors that management believes to be reasonable under the circumstances. We adjust such estimates and assumptions when facts and circumstances dictate. A number of these factors include, among others, economic conditions, credit markets, foreign currency, commodity cost volatility and consumer spending and confidence, all of which have combined to increase the uncertainty inherent in such estimates and assumptions. As future events and their effects cannot be determined with precision, actual amounts could differ significantly from those estimated at the time the consolidated financial statements are prepared. Changes in those estimates resulting from continuing changes in the economic environment will be reflected in the financial statements in future periods.
Cash and Cash Equivalents – We consider all highly liquid investments with maturities of three months or less from the date of purchase to be cash equivalents.
Restricted Cash – We have a total of $517 as of December 31, 2016 that serves as collateral backing certain bank guarantees and is therefore restricted. This money is invested in time deposits.
Receivables – Credit is granted to our customers in the normal course of business. Receivables are recorded at original carrying value less reserves for estimated uncollectible accounts and sales returns. To assess the collectability of these receivables, we perform ongoing credit evaluations of our customers’ financial condition. Through these evaluations, we may become aware of a situation where a customer may not be able to meet its financial obligations due to deterioration of its financial viability, credit ratings or bankruptcy. The reserve requirements are based on the best facts available to us and are reevaluated and adjusted as additional information becomes available. Our reserves are also based on amounts determined by using percentages applied to trade receivables. These percentages are determined by a variety of factors including, but not limited to, current economic trends, historical payment and bad debt write-off experience. An account is considered past-due or delinquent when it has not been paid within the contractual terms. Uncollectible accounts are written off against the reserves when it is deemed that a customer account is uncollectible.
Inventories – Inventories are valued at the lower of cost or market. Cost is determined on a first-in, first-out (“FIFO”) basis except for Inventories in North America, which are determined on a last-in, first-out (“LIFO”) basis.
Property, Plant and Equipment – Property, plant and equipment is carried at cost. Additions and improvements that extend the lives of the assets are capitalized while expenditures for repairs and maintenance are expensed as incurred. We generally depreciate buildings and improvements by the straight-line method over a life of 30 years. Other property, plant and equipment are generally depreciated using the straight-line method based on lives of 3 years to 15 years.
Goodwill – Goodwill represents the excess of cost over the fair value of net assets of businesses acquired. We analyze Goodwill on an annual basis as of year end and when an event occurs or circumstances change that may reduce the fair value of one of our reporting units below its carrying amount. A goodwill impairment occurs if the carrying amount of a reporting unit’s Goodwill exceeds its fair value. In assessing the recoverability of Goodwill, we use an analysis of qualitative factors to determine whether it is more likely than not that the fair value of a reporting unit is less than its carrying amount as a basis for determining whether it is necessary to perform the two-step Goodwill impairment test.
Intangible Assets – Intangible Assets consist of definite lived customer lists, trade name and technology. Intangible Assets with a definite life are amortized on a straight-line basis.
28
NOTES TO THE CONSOLIDATED FINANCIAL STATEMENTS
(In thousands, except shares and per share data)
Impairment of Long-lived Assets and Assets Held for Sale – We periodically review our intangible and long-lived assets for impairment and assess whether events or circumstances indicate that the carrying amount of the assets may not be recoverable. We generally deem an asset group to be impaired if an estimate of undiscounted future operating cash flows is less than its carrying amount. If impaired, an impairment loss is recognized based on the excess of the carrying amount of the individual asset group over its fair value.
Assets held for sale are measured at the lower of their carrying value or fair value less costs to sell. Upon retirement or disposition, the asset cost and related accumulated depreciation or amortization are removed from the accounts and a gain or loss is recognized based on the difference between the fair value of proceeds received and carrying value of the assets held for sale. In fiscal 2015, we adopted a plan to sell assets and liabilities of our Green Machines™ outdoor city cleaning line as a result of determining that the product line does not sufficiently complement our core business. The long-lived assets involved were tested for recoverability in 2015; accordingly, a pre-tax impairment loss of $11,199 was recognized, which represents the amount by which the carrying values of the assets exceeded their fair value less costs to sell. The impairment charge is included in the caption "Impairment of Long-Lived Assets" in the accompanying Consolidated Statements of Earnings. For additional information regarding the impairment of our Green Machines outdoor city cleaning line and the related accounting impact, refer to Note 6.
Purchase of Common Stock – We repurchase our Common Stock under 2016 and 2015 repurchase programs authorized by our Board of Directors. These programs allow us to repurchase up to an aggregate of 1,395,049 shares of our Common Stock. Upon repurchase, the par value is charged to Common Stock and the remaining purchase price is charged to Additional Paid-in Capital. If the amount of the remaining purchase price causes the Additional Paid-in Capital account to be in a debit position, this amount is then reclassified to Retained Earnings. Common Stock repurchased is included in shares authorized but is not included in shares outstanding.
Warranty – We record a liability for estimated warranty claims at the time of sale. The amount of the liability is based on the trend in the historical ratio of claims to sales, the historical length of time between the sale and resulting warranty claim, new product introductions and other factors. In the event we determine that our current or future product repair and replacement costs exceed our estimates, an adjustment to these reserves would be charged to earnings in the period such determination is made. Warranty terms on machines range from one to four years. However, the majority of our claims are paid out within the first six to nine months following a sale. The majority of the liability for estimated warranty claims represents amounts to be paid out in the near term for qualified warranty issues, with immaterial amounts reserved to be paid out for older equipment warranty issues.
Environmental – We record a liability for environmental clean-up on an undiscounted basis when a loss is probable and can be reasonably estimated.
Pension and Profit Sharing Plans – Substantially all U.S. employees are covered by various retirement benefit plans, including defined benefit pension plans, postretirement medical plans and defined contribution savings plans. Pension plan costs are accrued based on actuarial estimates with the required pension cost funded annually, as needed. No new participants have entered the defined benefit pension plan since 2000.
Postretirement Benefits – We accrue and recognize the cost of retiree health benefits over the employees’ period of service based on actuarial estimates. Benefits are only available for U.S. employees hired before January 1, 1999.
Derivative Financial Instruments – In countries outside the U.S., we transact business in U.S. dollars and in various other currencies. We hedge our net recognized foreign currency denominated assets and liabilities with foreign exchange forward contracts to reduce the risk that the value of these assets and liabilities will be adversely affected by changes in exchange rates. We may also use foreign exchange option contracts or forward contracts to hedge certain cash flow exposures resulting from changes in foreign currency exchange rates. We enter into these foreign exchange contracts to hedge a portion of our forecasted currency denominated revenue in the normal course of business, and accordingly, they are not speculative in nature.
We account for our foreign currency hedging instruments as either assets or liabilities on the balance sheet and measure them at fair value. Gains and losses resulting from changes in fair value are accounted for depending on the use of the derivative and whether it is designated and qualifies for hedge accounting. Gains and losses from foreign exchange forward contracts that hedge certain balance sheet positions are recorded each period to Net Foreign Currency Transaction Losses in our Consolidated Statements of Earnings. Foreign exchange option contracts or forward contracts hedging forecasted foreign currency revenue are designated as cash flow hedges under accounting for derivative instruments and hedging activities, with gains and losses recorded each period to Accumulated Other Comprehensive Loss in our Consolidated Balance Sheets, until the forecasted transaction occurs. When the forecasted transaction occurs, we reclassify the related gain or loss on the cash flow hedge to Net Sales. In the event the underlying forecasted transaction does not occur, or it becomes probable that it will not occur, we reclassify the gain or loss on the related cash flow hedge from Accumulated Other Comprehensive Loss to Net Foreign Currency Transaction Losses in our Consolidated Statements of Earnings at that time. If we do not elect hedge accounting, or the contract does not qualify for hedge accounting treatment, the changes in fair value from period to period are recorded in Net Foreign Currency Transaction Losses in our Consolidated Statements of Earnings. See Note 11 for additional information regarding our hedging activities.
Revenue Recognition – We recognize revenue when persuasive evidence of an arrangement exists, title and risk of ownership have passed to the customer, the sales price is fixed or determinable and collectability is reasonably assured. Generally, these criteria are met at the time the product is shipped. Provisions for estimated returns, rebates and discounts are provided for at the time the related revenue is recognized. Freight revenue billed to customers is included in Net Sales and the related shipping expense is included in Cost of Sales. Service revenue is recognized in the period the service is performed or ratably over the period of the related service contract.
Customers may obtain financing through third-party leasing companies to assist in their acquisition of our equipment products. Certain lease transactions classified as operating leases contain retained ownership provisions or guarantees, which results in recognition of revenue over the lease term. As a result, we defer the sale of these transactions and record the sales proceeds as collateralized borrowings or deferred revenue. The underlying equipment relating to operating leases is depreciated on a straight-line basis, not to exceed the equipment’s estimated useful life.
Revenues from contracts with multiple element arrangements are recognized as each element is earned. We offer service contracts in conjunction with equipment sales in addition to selling equipment and service contracts separately. Sales proceeds related to service contracts are deferred if the proceeds are received in advance of the service and recognized ratably over the contract period.
29
NOTES TO THE CONSOLIDATED FINANCIAL STATEMENTS
(In thousands, except shares and per share data)
Share-based Compensation – We account for employee share-based compensation using the fair value based method. Our share-based compensation plans are more fully described in Note 17 of the Consolidated Financial Statements.
Research and Development – Research and development costs are expensed as incurred.
Advertising Costs – We advertise products, technologies and solutions to customers and prospective customers through a variety of marketing campaign and promotional efforts. These efforts include tradeshows, online advertising, e-mail marketing, mailings, sponsorships and telemarketing. Advertising costs are expensed as incurred. In 2016, 2015 and 2014 such activities amounted to $7,269, $7,418 and $8,583, respectively.
Income Taxes – Deferred tax assets and liabilities are recognized for the expected future tax consequences of temporary differences between the book and tax bases of existing assets and liabilities. A valuation allowance is provided when, in management’s judgment, it is more likely than not that some portion or all of the deferred tax asset will not be realized. We have established contingent tax liabilities using management’s best judgment. We follow guidance provided by Accounting Standards Codification ("ASC") 740, Income Taxes, regarding uncertainty in income taxes, to record these contingent tax liabilities (refer to Note 16 of the Consolidated Financial Statements for additional information). We adjust these liabilities as facts and circumstances change. Interest Expense is recognized in the first period the interest would begin accruing. Penalties are recognized in the period we claim or expect to claim the position in our tax return. Interest and penalties expenses are classified as an income tax expense.
Sales Tax – Sales taxes collected from customers and remitted to governmental authorities are presented on a net basis.
Earnings per Share – Basic earnings per share is computed by dividing Net Earnings by the Weighted Average Shares Outstanding during the period. Diluted earnings per share assume conversion of potentially dilutive stock options, performance shares, restricted shares and restricted stock units.
2. | Management Actions |
During the third quarter of 2015, we implemented a restructuring action to reduce our infrastructure costs that we anticipated would improve Selling and Administrative Expense operating leverage in future quarters. The pre-tax charge of $1,779 recognized in the third quarter of 2015 consisted primarily of severance, the majority of which was in Europe, and was included within Selling and Administrative Expense in the Consolidated Statements of Earnings. We estimated the savings would offset the pre-tax charge approximately one year from the date of the action. The charge impacted our Americas, EMEA and APAC operating segments. We do not expect additional costs will be incurred related to this restructuring action.
During the fourth quarter of 2015, we implemented an additional restructuring action to reduce our infrastructure costs that we anticipated would improve Selling and Administrative Expense operating leverage in future quarters. The pre-tax charge of $1,965, including other associated costs of $481, consisted primarily of severance and was recorded in the fourth quarter of 2015. The pre-tax charge was included within Selling and Administrative Expense in the Consolidated Statements of Earnings. We estimated the savings would offset the pre-tax charge approximately 1.5 years from the date of the action. The charge impacted our Americas, EMEA and APAC operating segments. We do not expect additional costs will be incurred related to this restructuring action.
A reconciliation of the beginning and ending liability balances is as follows:
Severance and Related Costs | |||
2015 restructuring actions | $ | 3,263 | |
Cash payments | (1,332 | ) | |
Foreign currency adjustments | (19 | ) | |
December 31, 2015 Balance | $ | 1,912 | |
2016 Utilization: | |||
Cash payments | (1,912 | ) | |
December 31, 2016 balance | $ | — | |
3. | Acquisitions |
On July 28, 2016, pursuant to an asset purchase agreement and real estate purchase agreement with Crawford Laboratories, Inc. and affiliates thereof ("Sellers"), we acquired selected assets and liabilities of the Seller's commercial floor coatings business, including the Florock® Polymer Flooring brand ("Florock"). Florock manufactures commercial floor coatings systems in Chicago, IL. The purchase price was $11,804, including estimated working capital and other adjustments per the purchase agreement, is comprised of $10,965 paid at closing, with the remaining $839 to be paid in two installments within seven months of closing. We paid the first installment of $575 on October 14, 2016.
On September 1, 2016, we acquired selected assets and liabilities of Dofesa Barrido Mecanizado ("Dofesa"), which was our largest distributor in Mexico over many decades. The operations are based in Aguascalientes, Mexico, and their addition allows us to expand our sales and service network in an important market. The purchase price was $5,000 less assumed liabilities of $3,448, subject to customary working capital adjustments. The net purchase price of $1,552 is comprised of $1,202 paid at closing, and a value added tax of $191, with the remaining $350 subject to working capital adjustments. The working capital adjustment has not yet been finalized, but we do not expect to pay additional cash.
30
The acquisitions have been accounted for as business combinations and the results of their operations have been included in the Consolidated Financial Statements since their respective dates of acquisition. The impact of the incremental revenue and earnings recorded as a result of the acquisitions are not material to our Consolidated Financial Statements. The purchase price allocations for the Florock acquisition are complete with the exception of preliminary valuations of Intangible Assets and Property, Plant and Equipment which is expected to be complete by the end of the second quarter of 2017. The purchase price allocations for the Dofesa acquisition are complete except for a preliminary valuation of Intangible Assets and finalization of the working capital adjustment. We expect our valuation will be complete in the second quarter of 2017.
The preliminary components of the purchase price of the business combinations described above have been allocated as follows:
Current Assets | $ | 5,939 | |
Property, Plant and Equipment, net | 4,359 | ||
Identified Intangible Assets | 3,731 | ||
Goodwill | 3,787 | ||
Other Assets | 7 | ||
Total Assets Acquired | 17,823 | ||
Current Liabilities | 4,764 | ||
Other Liabilities | 53 | ||
Total Liabilities Assumed | 4,817 | ||
Net Assets Acquired | $ | 13,006 | |
4. | Divestiture |
On January 19, 2016, we signed a Business Purchase Agreement ("BPA") with Green Machines International GmbH and Green Machines Sweepers UK Limited ("Buyers"), subsidiaries of M&F Management and Financing GmbH, which is also the parent company of the master distributor of our products in Central Eastern Europe, Middle East and Africa, TCS EMEA GmbH, for the sale of our Green Machines outdoor city cleaning line. The sale closed on January 31, 2016. Including working capital adjustments, the aggregate consideration for the Green Machines business was $5,774.
Subsequent to the closing date, we entered into a distributor agreement with Green Machine Sweepers UK Limited, an affiliate of Green Machines International GmbH, for the exclusive right for Tennant to distribute, market, sell, rent and lease Green Machines products, aftermarket parts and consumables in the Americas and APAC. As part of this distributor agreement, we entered into a purchase commitment obligating us to purchase $12,000 of products and aftermarket parts and consumables annually for the next two years, for a total purchase commitment of $24,000.
On October 25, 2016, we signed Amendment No. 1 to the distributor agreement ("amended distributor agreement") with Green Machine Sweepers UK Limited, whereby we waived our exclusive rights to distribute Green Machine products and parts in specified APAC and Latin America countries, and our obligation to purchase $24,000 of Green Machines products, aftermarket parts and consumables over two years was canceled. In connection with the amended distributor agreement, we provided a $2,000 non-interest bearing cash advance to TCS EMEA GmbH, the master distributor of our products in Central Eastern Europe, Middle East and Africa, who is an affiliate of Green Machine Sweepers UK Limited. The cash advance is repayable in 36 equal installments beginning in January 2017.
Also on October 25, 2016, we signed Amendment No. 1 to the BPA ("Amended BPA") with the Buyers. The Amended BPA finalized the working capital adjustment and amended the payment terms for the remaining purchase price. The total aggregate consideration will be paid as follows:
• | Initial cash consideration of $285, which was received during the first quarter of 2016. |
• | The remaining purchase price of $5,489 will be financed and received in 16 equal installments on the last business day of each quarter, commencing with the quarter ended March 31, 2018. |
In 2016, as a result of this divestiture, we recorded a pre-tax loss of $149 in our Profit from Operations in the Consolidated Statements of Earnings. The impact of the recorded loss and the sale of Green Machines is not material to our earnings as Green Machines only accounted for approximately two percent of our total sales.
We have identified Green Machines International GmbH as a variable interest entity ("VIE") and have performed a qualitative assessment to determine if Tennant is the primary beneficiary of the VIE. We have determined that we are not the primary beneficiary of the VIE and consolidation of the VIE is not considered necessary.
31
NOTES TO THE CONSOLIDATED FINANCIAL STATEMENTS
(In thousands, except shares and per share data)
5. | Inventories |
Inventories as of December 31, consisted of the following:
2016 | 2015 | ||||||
Inventories carried at LIFO: | |||||||
Finished goods | $ | 39,142 | $ | 41,225 | |||
Raw materials, production parts and work-in-process | 23,980 | 22,158 | |||||
LIFO reserve | (28,190 | ) | (27,645 | ) | |||
Total LIFO inventories | $ | 34,932 | $ | 35,738 | |||
Inventories carried at FIFO: | |||||||
Finished goods | $ | 31,044 | $ | 32,421 | |||
Raw materials, production parts and work-in-process | 12,646 | 13,812 | |||||
Less: Inventories held for sale | — | (4,679 | ) | ||||
Total FIFO inventories | $ | 43,690 | $ | 41,554 | |||
Total inventories | $ | 78,622 | $ | 77,292 | |||
The LIFO reserve approximates the difference between LIFO carrying cost and FIFO.
6. | Assets and Liabilities Held for Sale |
On August 19, 2015, we adopted a plan to sell assets and liabilities of our Green Machines outdoor city cleaning line as a result of determining that the product line, which constituted approximately two percent of our total sales, did not sufficiently complement our core business. The long-lived assets involved were tested for recoverability as of the 2015 third quarter balance sheet date; accordingly, a pre-tax impairment loss of $11,199 was recognized, which represents the amount by which the carrying values of the assets exceeded their fair value, less costs to sell. The $11,199 consisted of $10,577 of intangible assets and $622 of fixed assets. The impairment loss is recorded as a separate line item ("Impairment of Long-Lived Assets") in the Consolidated Statements of Earnings. The carrying value of the assets and liabilities that are held for sale are separately presented in the Consolidated Balance Sheets in the captions "Assets Held for Sale" and "Liabilities Held for Sale," respectively. The long-lived assets classified as held for sale are no longer being depreciated.
On January 19, 2016, we signed a BPA with Green Machines International GmbH and affiliates, subsidiaries of M&F, which is also parent company of the master distributor of our products in Central Eastern Europe, Middle East and Africa, TCS EMEA GmbH, for the sale of our Green Machines outdoor city cleaning line. Per the BPA, the sale officially closed on January 31, 2016. Further details regarding the sale of our Green Machines outdoor city cleaning line are discussed in Note 4.
The assets and liabilities of Green Machines held for sale as of December 31, 2015 consisted of the following:
Assets: | |||
Accounts Receivable | $ | 1,715 | |
Inventories | 4,679 | ||
Prepaid Expenses | 239 | ||
Property, Plant and Equipment, net | 193 | ||
Total Assets Held for Sale | $ | 6,826 | |
Liabilities: | |||
Employee Compensation and Benefits | $ | 338 | |
Other Current Liabilities | 116 | ||
Total Liabilities Held for Sale | $ | 454 | |
32
NOTES TO THE CONSOLIDATED FINANCIAL STATEMENTS
(In thousands, except shares and per share data)
7. | Property, Plant and Equipment |
Property, Plant and Equipment and related Accumulated Depreciation, including equipment under capital leases, as of December 31, consisted of the following:
2016 | 2015 | ||||||
Property, Plant and Equipment: | |||||||
Land | $ | 6,328 | $ | 4,232 | |||
Buildings and improvements | 58,577 | 52,118 | |||||
Machinery and manufacturing equipment | 116,221 | 117,197 | |||||
Office equipment | 89,838 | 80,972 | |||||
Work in progress | 27,536 | 24,481 | |||||
Less: Gross Property, Plant and Equipment held for sale | — | (2,189 | ) | ||||
Total Property, Plant and Equipment | $ | 298,500 | $ | 276,811 | |||
Accumulated Depreciation: | |||||||
Accumulated Depreciation | $ | (186,403 | ) | $ | (183,849 | ) | |
Add: Accumulated Depreciation on Property, Plant and Equipment held for sale | — | 1,996 | |||||
Total Accumulated Depreciation | $ | (186,403 | ) | $ | (181,853 | ) | |
Property, Plant and Equipment, Net | $ | 112,097 | $ | 94,958 | |||
We recorded an impairment loss on Green Machines' fixed assets during 2015, totaling $622, due to our strategic decision to hold the assets of the Green Machines product line for sale. This amount was recorded in Accumulated Depreciation as a write off against Property, Plant and Equipment. The impairment charge was included within Impairment of Long-Lived Assets in the Consolidated Statements of Earnings. Further details regarding the sale of our Green Machines outdoor city cleaning line are discussed in Note 4 and Note 6.
Depreciation expense was $17,891 in 2016, $16,550 in 2015 and $17,694 in 2014.
8. | Goodwill and Intangible Assets |
For purposes of performing our goodwill impairment analysis, we have identified our reporting units as North America, Latin America, Coatings, EMEA and APAC. As of December 31, 2016, 2015 and 2014, we performed an analysis of qualitative factors to determine whether it is more likely than not that the fair value of a reporting unit is less than its carrying amount as a basis for determining whether it is necessary to perform the two-step goodwill impairment test. Based on our analysis of qualitative factors, we determined that it was not necessary to perform the two-step goodwill impairment test for any of our reporting units.
The changes in the carrying amount of Goodwill are as follows:
Goodwill | Accumulated Impairment Losses | Total | |||||||||
Balance as of December 31, 2014 | $ | 64,858 | $ | (46,503 | ) | $ | 18,355 | ||||
Foreign currency fluctuations | (4,411 | ) | 2,859 | (1,552 | ) | ||||||
Balance as of December 31, 2015 | $ | 60,447 | $ | (43,644 | ) | $ | 16,803 | ||||
Additions | 3,787 | — | 3,787 | ||||||||
Foreign currency fluctuations | (5,837 | ) | 6,312 | 475 | |||||||
Balance as of December 31, 2016 | $ | 58,397 | $ | (37,332 | ) | $ | 21,065 | ||||
33
NOTES TO THE CONSOLIDATED FINANCIAL STATEMENTS
(In thousands, except shares and per share data)
The balances of acquired Intangible Assets, excluding Goodwill, as of December 31, are as follows:
Customer Lists | Trade Name | Technology | Total | ||||||||||||
Balance as of December 31, 2016 | |||||||||||||||
Original cost | $ | 8,016 | $ | 2,000 | $ | 5,136 | $ | 15,152 | |||||||
Accumulated amortization | (5,948 | ) | — | (2,744 | ) | (8,692 | ) | ||||||||
Carrying amount | $ | 2,068 | $ | 2,000 | $ | 2,392 | $ | 6,460 | |||||||
Weighted-average original life (in years) | 15 | 15 | 13 | ||||||||||||
Balance as of December 31, 2015 | |||||||||||||||
Original cost | $ | 19,781 | $ | 3,859 | $ | 6,596 | $ | 30,236 | |||||||
Accumulated amortization | (19,232 | ) | (3,859 | ) | (3,950 | ) | (27,041 | ) | |||||||
Carrying amount | $ | 549 | $ | — | $ | 2,646 | $ | 3,195 | |||||||
Weighted-average original life (in years) | 15 | 14 | 13 | ||||||||||||
The additions to Goodwill during 2016 were based on the preliminary purchase price allocation of our acquisitions of the Florock brand and the assets of Dofesa Barrido Mecanizado, as described further in Note 3.
We recorded an impairment loss on the Green Machines customer lists, trade name and technology intangible assets during the third quarter of 2015, totaling $10,577, due to our strategic decision to hold the assets of the Green Machines product line for sale. The impairment was included within Impairment of Long-Lived Assets in the 2015 Consolidated Statements of Earnings. Therefore, the accumulated amortization balances for the year ended December 31, 2015 included these fully impaired customer lists, trade name and technology intangible assets that were impaired as part this sale. Further details regarding the sale of our Green Machines outdoor city cleaning line are discussed in Note 6.
Amortization expense on Intangible Assets was $409, $1,481 and $2,369 for the years ended December 31, 2016, 2015 and 2014, respectively.
Estimated aggregate amortization expense based on the current carrying amount of amortizable Intangible Assets for each of the five succeeding years is as follows:
2017 | $ | 558 | |
2018 | 553 | ||
2019 | 553 | ||
2020 | 553 | ||
2021 | 553 | ||
Thereafter | 3,690 | ||
Total | $ | 6,460 | |
9. | Debt |
Debt as of December 31, consisted of the following:
2016 | 2015 | ||||||
Long-Term Debt: | |||||||
Credit facility borrowings | $ | 36,143 | $ | 24,571 | |||
Capital lease obligations | 51 | 82 | |||||
Total Debt | 36,194 | 24,653 | |||||
Less: current portion | (3,459 | ) | (3,459 | ) | |||
Long-term portion | $ | 32,735 | $ | 21,194 | |||
As of December 31, 2016, we had committed lines of credit totaling approximately $125,000 and uncommitted credit facilities totaling $85,000. There were $25,000 in outstanding borrowings under our JPMorgan facility (described below) and $11,143 in outstanding borrowings under our Prudential facility (described below) as of December 31, 2016. In addition, we had stand alone letters of credit and bank guarantees outstanding in the amount of $3,774. Commitment fees on unused lines of credit for the year ended December 31, 2016 were $222.
34
NOTES TO THE CONSOLIDATED FINANCIAL STATEMENTS
(In thousands, except shares and per share data)
Our most restrictive covenants are part of our 2015 Amended and Restated Credit Agreement (as defined below), which are the same covenants in our Shelf Agreement (as defined below) with Prudential (as defined below), and require us to maintain an indebtedness to EBITDA ratio of not greater than 3.25 to 1 and to maintain an EBITDA to interest expense ratio of no less than 3.50 to 1 as of the end of each quarter. As of December 31, 2016, our indebtedness to EBITDA ratio was 0.49 to 1 and our EBITDA to interest expense ratio was 70.20 to 1.
Credit Facilities
JPMorgan Chase Bank, National Association
On June 30, 2015, we entered into an Amended and Restated Credit Agreement (the "Amended and Restated Credit Agreement") that amended and restated the Credit Agreement dated May 5, 2011 between us and JP Morgan Chase Bank, N.A. ("JPMorgan"), as administrative agent and collateral agent, U.S. Bank National Association, as syndication agent, Wells Fargo Bank, National Association, and RBS Citizens, N.A., as co-documentation agents, and the Lenders (including JPMorgan) from time to time party thereto, as amended by Amendment No. 1 dated April 25, 2013 (the "Credit Agreement"). The Amended and Restated Credit Agreement provides us and certain of our foreign subsidiaries access to a senior unsecured credit facility until June 30, 2020, in the amount of $125,000, with an option to expand by up to $62,500 to a total of $187,500. Borrowings may be denominated in U.S. dollars or certain other currencies. The Amended and Restated Credit Agreement contains a $100,000 sublimit on borrowings by foreign subsidiaries.
The Amended and Restated Credit Agreement principally provided the following changes to the Credit Agreement:
• | changed the fees for committed funds from an annual rate ranging from 0.20% to 0.35%, depending on our leverage ratio, under the Credit Agreement to an annual rate ranging from 0.175% to 0.300%, depending on our leverage ratio, under the Amended and Restated Credit Agreement; |
• | removed RBS Citizens, N.A. as a co-documentation agent; |
• | changed the rate at which Eurocurrency borrowings bear interest from a rate per annum equal to adjusted LIBOR plus an additional spread of 1.30% to 1.90%, depending on our leverage ratio, under the Credit Agreement to a rate per annum equal to adjusted LIBOR plus an additional spread of 1.075% to 1.700%, depending on our leverage ratio, under the Amended and Restated Credit Agreement; |
• | under the Credit Agreement, Alternate Base Rate (“ABR”) borrowings bore interest at a rate per annum equal to the greatest of (a) the prime rate, (b) the federal funds rate plus 0.50% and (c) the adjusted LIBOR rate for a one month period plus 1.00%, plus, in any such case, an additional spread of 0.30% to 0.90%, depending on our leverage ratio. The ABR borrowings bear interest under the Amended and Restated Credit Agreement at a rate per annum equal to the greatest of (a) the primate rate, (b) the federal funds rate plus 0.50% and (c) the adjusted LIBOR rate for a one month period plus 1.00%, plus, in any such case, an additional spread of 0.075% to 0.700%, depending on our leverage ratio. |
The Amended and Restated Credit Agreement gives the Lenders a pledge of 65% of the stock of certain first tier foreign subsidiaries. The obligations under the Amended and Restated Credit Agreement are also guaranteed by certain of our first tier domestic subsidiaries.
The Amended and Restated Credit Agreement contains customary representations, warranties and covenants, including but not limited to covenants restricting our ability to incur indebtedness and liens and merge or consolidate with another entity. It also incorporates new or recently revised financial regulations and other compliance matters. Further, the Amended and Restated Credit Agreement contains the following covenants:
• | a covenant requiring us to maintain an indebtedness to EBITDA ratio as of the end of each quarter of not greater than 3.25 to 1. Under the Credit Agreement, the required indebtedness to EBITDA ratio as of the end of each quarter was not greater than 3.00 to 1; |
• | a covenant requiring us to maintain an EBITDA to interest expense ratio as of the end of each quarter of no less than 3.50 to 1; |
• | a covenant restricting us from paying dividends or repurchasing stock if, after giving effect to such payments, our leverage ratio is greater than 2.00 to 1, in such case limiting such payments to an amount ranging from $50,000 to $75,000 during any fiscal year based on our leverage ratio after giving effect to such payments; |
• | a covenant restricting us from paying any dividends or repurchasing stock, if, after giving effect to such payments, our leverage ratio is greater than 3.25 to 1; and |
• | a covenant restricting our ability to make acquisitions, if, after giving pro-forma effect to such acquisitions, our leverage ratio is greater than 3.00 to 1, in such case limiting acquisitions to $25,000. Under the Credit Agreement, our leverage ratio restriction under this covenant was 2.75 to 1. |
A copy of the full terms and conditions of the Amended and Restated Credit Agreement are incorporated by reference in Item 15 to Exhibit 10.1 to the Company's Current Report on Form 8-K filed on July 7, 2015.
As of December 31, 2016, we were in compliance with all covenants under this Amended and Restated Credit Agreement. There were $25,000 in outstanding borrowings under this facility at December 31, 2016, with a weighted average interest rate of 1.64%.
Prudential Investment Management, Inc.
On July 29, 2009, we entered into a Private Shelf Agreement (the “Shelf Agreement”) with Prudential Investment Management, Inc. (“Prudential”) and Prudential affiliates from time to time party thereto. The Shelf Agreement provides us and our subsidiaries access to an uncommitted, senior secured, maximum aggregate principal amount of $80,000 of debt capital. The Shelf Agreement contains representations, warranties and covenants, including but not limited to covenants restricting our ability to incur indebtedness and liens and to merge or consolidate with another entity.
A copy of the full terms and conditions of the Shelf Agreement are incorporated by reference in Item 15 to Exhibit 10.1 to the Company's Current Report on Form 8-K filed on July 30, 2009.
35
NOTES TO THE CONSOLIDATED FINANCIAL STATEMENTS
(In thousands, except shares and per share data)
On May 5, 2011, we entered into Amendment No. 1 to our Private Shelf Agreement (the “Amendment”).
The Amendment principally provided the following changes to the Shelf Agreement:
• | elimination of the security interest in our personal property and subsidiaries; and |
• | an amendment to our restriction regarding the payment of dividends or repurchase of stock to restrict us from paying dividends or repurchasing stock if, after giving effect to such payments, our leverage ratio is greater than 2.00 to 1, in such case limiting such payments to an amount ranging from $50,000 to $75,000 during any fiscal year based on our leverage ratio after giving effect to such payments. |
A copy of the full terms and conditions of the Amendment are incorporated by reference in Item 15 to Exhibit 10.2 to the Company's Form 10-Q for the quarter ended June 30, 2011.
On July 24, 2012, we entered into Amendment No. 2 to our Private Shelf Agreement (“Amendment No. 2”), which amended the Shelf Agreement. The principal change effected by Amendment No. 2 was an extension of the Issuance Period for Shelf Notes under the Shelf Agreement.
A copy of the full terms and conditions of Amendment No. 2 are incorporated by reference in Item 15 to Exhibit 10.1 to the Company's Current Report on Form 8-K filed on July 26, 2012.
On June 30, 2015 we entered into Amendment No. 3 to our Private Shelf Agreement ("Amendment No. 3"), which amends the Shelf Agreement by and among the Company, Prudential and Prudential affiliates from time to time party thereto, as amended by Amendment No. 1 and Amendment No. 2.
Amendment No. 3 principally provided the following changes to the Shelf Agreement:
• | extended the the Issuance Period to June 30, 2018 from July 24, 2015; |
• | changed the covenant regarding our indebtedness to EBITDA ratio at the end of each quarter to not greater than 3.25 to 1. The previous covenant required a ratio of not greater than 3.00 to 1; |
• | added the covenant restricting us from paying any dividends or repurchasing stock, if, after giving such effect to such payments, our leverage ratio is greater than 3.25 to 1; and |
• | changed the covenant restricting us from making acquisitions, if, after giving pro-forma effect to such acquisitions, our leverage ratio is greater than 3.00 to 1, in such case limiting acquisitions to $25,000. The previous covenant limiting our ability to make acquisitions under Amendment No. 1 was 2.75 to 1. |
A copy of the full terms and conditions of Amendment No. 3 are incorporated by reference in Item 15 to Exhibit 10.2 to the Company's Current Report on Form 8-K filed on July 7, 2015.
As of December 31, 2016, there were $11,143 in outstanding borrowings under this facility, consisting of the $4,000 Series A notes issued in March 2011 with a fixed interest rate of 4.00% and a term of seven years, with remaining serial maturities from 2017 to 2018, and the $7,143 Series B notes issued in June 2011 with a fixed interest rate of 4.10% and a term of 10 years, with remaining serial maturities from 2017 to 2021. The second payment of $2,000 on Series A notes was made during the first quarter of 2015. The third payment of $2,000 on Series A notes was made during the first quarter of 2016. The first payment of $1,429 on Series B notes was made during the second quarter of 2015. The second payment of $1,429 on Series B notes was made during the second quarter of 2016. We were in compliance with all covenants under this Shelf Agreement as of December 31, 2016.
HSBC Bank (China) Company Limited, Shanghai Branch
On June 20, 2012, we entered into a banking facility with the HSBC Bank (China) Company Limited, Shanghai Branch in the amount of $5,000. As of December 31, 2016, there were no outstanding borrowings on this facility.
Collateralized Borrowings
Collateralized borrowings represent deferred sales proceeds on certain leasing transactions with third-party leasing companies. These transactions are accounted for as borrowings, with the related assets capitalized as property, plant and equipment and depreciated straight-line over the lease term.
Capital Lease Obligations
Capital lease obligations outstanding are primarily related to sale-leaseback transactions with third-party leasing companies whereby we sell our manufactured equipment to the leasing company and lease it back. The equipment covered by these leases is rented to our customers over the lease term.
The aggregate maturities of our outstanding debt, including capital lease obligations as of December 31, 2016, are as follows:
2017 | $ | 3,459 | |
2018 | 3,449 | ||
2019 | 1,429 | ||
2020 | 26,428 | ||
2021 | 1,429 | ||
Thereafter | — | ||
Total aggregate maturities | $ | 36,194 | |
36
10. | Other Current Liabilities |
Other Current Liabilities as of December 31, consisted of the following:
2016 | 2015 | ||||||
Other Current Liabilities: | |||||||
Taxes, other than income taxes | $ | 7,122 | $ | 5,030 | |||
Warranty | 10,960 | 10,093 | |||||
Deferred revenue | 2,366 | 2,512 | |||||
Rebates | 11,102 | 10,399 | |||||
Freight | 4,274 | 6,461 | |||||
Severance and Restructuring | 394 | 1,927 | |||||
Miscellaneous accrued expenses | 4,385 | 4,230 | |||||
Other | 3,014 | 2,491 | |||||
Less: Other Current Liabilities held for sale | — | (116 | ) | ||||
Total Other Current Liabilities | $ | 43,617 | $ | 43,027 | |||
The changes in warranty reserves for the three years ended December 31 were as follows:
2016 | 2015 | 2014 | |||||||||
Beginning balance | $ | 10,093 | $ | 9,686 | $ | 9,663 | |||||
Product warranty provision | 12,413 | 11,719 | 10,605 | ||||||||
Acquired Warranty Obligations | 42 | — | — | ||||||||
Foreign currency | 82 | (207 | ) | (215 | ) | ||||||
Claims paid | (11,670 | ) | (11,105 | ) | (10,367 | ) | |||||
Ending balance | $ | 10,960 | $ | 10,093 | $ | 9,686 | |||||
11. | Derivatives |
Hedge Accounting and Hedging Programs
In 2015, we expanded our foreign currency hedging programs to include foreign exchange purchased options and forward contracts to hedge our foreign currency denominated revenue. We recognize all derivative instruments as either assets or liabilities in our Consolidated Balance Sheets and measure them at fair value. Gains and losses resulting from changes in fair value are accounted for depending on the use of the derivative and whether it is designated and qualifies for hedge accounting.
We evaluate hedge effectiveness on our hedges that are designated and qualify for hedge accounting at the inception of the hedge prospectively, as well as retrospectively, and record any ineffective portion of the hedging instruments in Net Foreign Currency Transaction Losses on our Consolidated Statements of Earnings. The time value of purchased contracts is recorded in Net Foreign Currency Transaction Losses in our Consolidated Statements of Earnings.
Our hedging policy establishes maximum limits for each counterparty to mitigate any concentration of risk.
Balance Sheet Hedging – Hedges of Foreign Currency Assets and Liabilities
We hedge our net recognized foreign currency denominated assets and liabilities with foreign exchange forward contracts to reduce the risk that the value of these assets and liabilities will be adversely affected by changes in exchange rates. These contracts hedge assets and liabilities that are denominated in foreign currencies and are carried at fair value as either assets or liabilities on the Consolidated Balance Sheets with changes in the fair value recorded to Net Foreign Currency Transaction Losses in our Consolidated Statements of Earnings. These contracts do not subject us to material balance sheet risk due to exchange rate movements because gains and losses on these derivatives are intended to offset gains and losses on the assets and liabilities being hedged. At December 31, 2016 and December 31, 2015, the notional amounts of foreign currency forward exchange contracts outstanding not designated as hedging instruments were $42,866 and $45,851, respectively.
Cash Flow Hedging – Hedges of Forecasted Foreign Currency Transactions
In countries outside the U.S., we transact business in U.S. dollars and in various other currencies. We may use foreign exchange option contracts or forward contracts to hedge certain cash flow exposures resulting from changes in these foreign currency exchange rates. These foreign exchange contracts, carried at fair value, have maturities of up to 1 year. We enter into these foreign exchange contracts to hedge a portion of our forecasted foreign currency denominated revenue in the normal course of business, and accordingly, they are not speculative in nature. The notional amount of outstanding foreign currency forward contracts designated as cash flow hedges were $2,127 and $2,486 as of December 31, 2016 and December 31, 2015, respectively. The notional amount of outstanding foreign currency option contracts designated as cash flow hedges were $8,522 and $11,271 as of December 31, 2016 and December 31, 2015, respectively.
37
NOTES TO THE CONSOLIDATED FINANCIAL STATEMENTS
(In thousands, except shares and per share data)
To receive hedge accounting treatment, all hedging relationships are formally documented at the inception of the hedge, and the hedges must be highly effective in offsetting changes to future cash flows on hedged transactions. We record changes in the fair value of these cash flow hedges in Accumulated Other Comprehensive Loss in our Consolidated Balance Sheets, until the forecasted transaction occurs. When the forecasted transaction occurs, we reclassify the related gain or loss on the cash flow hedge to Net Sales. In the event the underlying forecasted transaction does not occur, or it becomes probable that it will not occur, we reclassify the gain or loss on the related cash flow hedge from Accumulated Other Comprehensive Loss to Net Foreign Currency Transaction Losses in our Consolidated Statements of Earnings at that time. If we do not elect hedge accounting, or the contract does not qualify for hedge accounting treatment, the changes in fair value from period to period are recorded in Net Foreign Currency Transaction Losses in our Consolidated Statements of Earnings.
The fair value of derivative instruments on our Consolidated Balance Sheets as of December 31, consisted of the following:
2016 | 2015 | |||||||||||||||
Fair Value Asset Derivatives | Fair Value Liability Derivatives | Fair Value Asset Derivatives | Fair Value Liability Derivatives | |||||||||||||
Derivatives designated as hedging instruments: | ||||||||||||||||
Foreign currency option contracts(1)(2) | $ | 184 | $ | — | $ | 387 | $ | — | ||||||||
Foreign currency forward contracts(1) | — | 13 | 113 | — | ||||||||||||
Derivatives not designated as hedging instruments: | ||||||||||||||||
Foreign currency forward contracts(1) | $ | 12 | $ | 162 | $ | 171 | $ | 7 | ||||||||
(1) | Contracts that mature within the next twelve months are included in Other Current Assets and Other Current Liabilities for asset derivatives and liabilities derivatives, respectively, on our Consolidated Balance Sheets. |
(2) | Contracts with a maturity greater than twelve months are included in Other Assets and Other Liabilities for asset derivatives and liability derivatives, respectively, on our Consolidated Balance Sheets. |
As of December 31, 2016, we anticipate reclassifying approximately $71 of losses from Accumulated Other Comprehensive Loss to net earnings during the next twelve months.
The effect of foreign currency derivative instruments designated as cash flow hedges and foreign currency derivative instruments not designated as hedges in our Consolidated Statements of Earnings for the three years ended December 31 were as follows:
2016 | 2015 | 2014 | |||||||||||||||||||||
Foreign Currency Option Contracts | Foreign Currency Forward Contracts | Foreign Currency Option Contracts | Foreign Currency Forward Contracts | Foreign Currency Option Contracts | Foreign Currency Forward Contracts | ||||||||||||||||||
Derivatives in cash flow hedging relationships: | |||||||||||||||||||||||
Net (loss) gain recognized in Other Comprehensive Loss, net of tax(1) | $ | (259 | ) | $ | (73 | ) | $ | 31 | $ | 77 | $ | — | $ | — | |||||||||
Net (loss) gain reclassified from Accumulated Other Comprehensive Loss into earnings, net of tax(2) | (148 | ) | 7 | — | 5 | — | — | ||||||||||||||||
Net (loss) gain recognized in earnings(3) | (11 | ) | 2 | 6 | (2 | ) | — | — | |||||||||||||||
Derivatives not designated as hedging instruments: | |||||||||||||||||||||||
Net (loss) gain recognized in earnings(4) | $ | — | $ | (890 | ) | $ | — | $ | 4,047 | $ | — | $ | 2,384 | ||||||||||
(1) | Net change in the fair value of the effective portion classified in Other Comprehensive Loss. |
(2) | Effective portion classified as Net Sales. |
(3) | Ineffective portion and amount excluded from effectiveness testing classified in Net Foreign Currency Transaction Losses. |
(4) | Classified in Net Foreign Currency Transaction Losses. |
12. | Fair Value Measurements |
Estimates of fair value for financial assets and financial liabilities are based on the framework established in the accounting guidance for fair value measurements. The framework defines fair value, provides guidance for measuring fair value and requires certain disclosures. The framework discusses valuation techniques, such as the market approach (comparable market prices), the income approach (present value of future income or cash flow) and the cost approach (cost to replace the service capacity of an asset or replacement cost). The framework utilizes a fair value hierarchy that prioritizes the inputs to valuation techniques used to measure fair value into three broad levels. The following is a brief description of those three levels:
• | Level 1: Observable inputs such as quoted prices (unadjusted) in active markets for identical assets or liabilities. |
38
NOTES TO THE CONSOLIDATED FINANCIAL STATEMENTS
(In thousands, except shares and per share data)
• | Level 2: Inputs other than quoted prices that are observable for the asset or liability, either directly or indirectly. These include quoted prices for similar assets or liabilities in active markets and quoted prices for identical or similar assets or liabilities in markets that are not active. |
• | Level 3: Unobservable inputs that reflect the reporting entity’s own assumptions. |
Our population of assets and liabilities subject to fair value measurements at December 31, 2016 is as follows:
Fair Value | Level 1 | Level 2 | Level 3 | ||||||||||||
Assets: | |||||||||||||||
Foreign currency forward exchange contracts | $ | 12 | $ | — | $ | 12 | $ | — | |||||||
Foreign currency option contracts | 184 | — | 184 | — | |||||||||||
Total Assets | $ | 196 | $ | — | $ | 196 | $ | — | |||||||
Liabilities: | |||||||||||||||
Foreign currency forward exchange contracts | $ | 175 | $ | — | $ | 175 | $ | — | |||||||
Total Liabilities | $ | 175 | $ | — | $ | 175 | $ | — | |||||||
Our foreign currency forward exchange and option contracts are valued using observable Level 2 market expectations at the measurement date and standard valuation techniques to convert future amounts to a single present value amount. Further details regarding our foreign currency forward exchange and option contracts are discussed in Note 11.
The carrying amounts reported in the Consolidated Balance Sheets for Cash and Cash Equivalents, Restricted Cash, Receivables, Other Current Assets, Assets Held for Sale, Accounts Payable, Other Current Liabilities and Liabilities Held for Sale approximate fair value due to their short-term nature.
The fair market value of our Long-Term Debt approximates cost based on the borrowing rates currently available to us for bank loans with similar terms and remaining maturities.
From time to time, we measure certain assets at fair value on a non-recurring basis, including evaluation of long-lived assets, goodwill and other intangible assets for impairment using company-specific assumptions which would fall within Level 3 of the fair value hierarchy.
13. | Retirement Benefit Plans |
Substantially all U.S. employees are covered by various retirement benefit plans, including defined benefit pension plans, postretirement medical plans and defined contribution savings plans. Retirement benefits for eligible employees in foreign locations are funded principally through defined benefit plans, annuity or government programs. The total cost of benefits for our plans was $12,108, $12,428 and $11,334 in 2016, 2015 and 2014, respectively.
We have a qualified, funded defined benefit retirement plan (the “U.S. Pension Plan”) covering certain current and retired employees in the U.S. Pension Plan benefits are based on the years of service and compensation during the highest five consecutive years of service in the final ten years of employment. No new participants have entered the plan since 2000. The plan has 351 participants including 61 active employees as of December 31, 2016. During 2015, the plan was amended to freeze benefits for all participants effective January 31, 2017. On February 15, 2017, the Board of Directors approved the termination of the U.S. Pension Plan, effective May 15, 2017.
We have a U.S. postretirement medical benefit plan (the “U.S. Retiree Plan”) to provide certain healthcare benefits for U.S. employees hired before January 1, 1999. Eligibility for those benefits is based upon a combination of years of service with us and age upon retirement.
Our defined contribution savings plan (“401(k)”) covers substantially all U.S. employees. Under this plan, we match up to 3% of the employee’s annual compensation in cash to be invested per their election. We also make a profit sharing contribution to the 401(k) plan for employees with more than one year of service in accordance with our Profit Sharing Plan. This contribution is based upon our financial performance and can be funded in the form of Tennant stock, cash or a combination of both. Expenses for the 401(k) plan were $8,359, $8,098 and $7,475 during 2016, 2015 and 2014, respectively.
We have a U.S. nonqualified supplemental benefit plan (the “U.S. Nonqualified Plan”) to provide additional retirement benefits for certain employees whose benefits under our 401(k) plan or U.S. Pension Plan are limited by either the Employee Retirement Income Security Act or the Internal Revenue Code.
We also have defined pension benefit plans in the United Kingdom and Germany (the “U.K. Pension Plan” and the “German Pension Plan”). The U.K. Pension Plan and German Pension Plan cover certain current and retired employees and both plans are closed to new participants.
We expect to contribute approximately $238 to our U.S. Nonqualified Plan, $828 to our U.S. Retiree Plan, $185 to our U.K. Pension Plan and $30 to our German Pension Plan in 2017. No contributions to the U.S. Pension Plan are expected to be required during 2017. There were no contributions made to the U.S. Pension Plan during 2016.
39
NOTES TO THE CONSOLIDATED FINANCIAL STATEMENTS
(In thousands, except shares and per share data)
Weighted-average asset allocations by asset category of the U.S. and U.K. Pension Plans as of December 31, 2016 are as follows:
Asset Category | Fair Value | Quoted Prices in Active Markets for Identical Assets (Level 1) | Significant Observable Inputs (Level 2) | Significant Unobservable Inputs (Level 3) | |||||||||||
Cash and Cash Equivalents | $ | 663 | $ | 663 | $ | — | $ | — | |||||||
Mutual Funds: | |||||||||||||||
U.S. Large-Cap | 9,803 | 9,803 | — | — | |||||||||||
U.S. Small-Cap | 2,584 | 2,584 | — | — | |||||||||||
International Equities | 2,244 | 2,244 | — | — | |||||||||||
Fixed-Income Domestic | 4,564 | 4,564 | — | — | |||||||||||
Collective Investment Funds | 26,531 | — | 26,531 | — | |||||||||||
Investment Account held by Pension Plan (1) | 9,562 | — | — | 9,562 | |||||||||||
Total | $ | 55,951 | $ | 19,858 | $ | 26,531 | $ | 9,562 | |||||||
(1) | This category is comprised of investments in insurance contracts. |
Weighted-average asset allocations by asset category of the U.S. and U.K. Pension Plans as of December 31, 2015 are as follows:
Asset Category | Fair Value | Quoted Prices in Active Markets for Identical Assets (Level 1) | Significant Observable Inputs (Level 2) | Significant Unobservable Inputs (Level 3) | |||||||||||
Cash and Cash Equivalents | $ | 954 | $ | 954 | $ | — | $ | — | |||||||
Mutual Funds: | |||||||||||||||
U.S. Large-Cap | 9,194 | 9,194 | — | — | |||||||||||
U.S. Small-Cap | 2,258 | 2,258 | — | — | |||||||||||
International Equities | 2,206 | 2,206 | — | — | |||||||||||
Fixed-Income Domestic | 32,589 | 32,589 | — | — | |||||||||||
Investment Account held by Pension Plan (1) | 10,691 | — | — | 10,691 | |||||||||||
Total | $ | 57,892 | $ | 47,201 | $ | — | $ | 10,691 | |||||||
(1) | This category is comprised of investments in insurance contracts. |
Estimates of the fair value of U.S. and U.K Pension Plan assets are based on the framework established in the accounting guidance for fair value measurements. A brief description of the three levels can be found in Note 12. Equity Securities and Mutual Funds traded in active markets are classified as Level 1. Collective Investment Funds are measured at fair value using quoted market prices. They are classified as Level 2 as they trade in a non-active market for which asset prices are readily available. The Investment Account held by the U.K. Pension Plan invests in insurance contracts for purposes of funding the U.K. Pension Plan and is classified as Level 3. The fair value of the Investment Account is the cash surrender values as determined by the provider which are the amounts the plan would receive if the contracts were cashed out at year end. The underlying assets held by these contracts are primarily invested in assets traded in active markets.
A reconciliation of the beginning and ending balances of the Level 3 investments of our U.K. Pension Plan during the years ended are as follows:
2016 | 2015 | ||||||
Fair value at beginning of year | $ | 10,691 | $ | 9,989 | |||
Purchases, sales, issuances and settlements, net | 7 | 52 | |||||
Net gain | 674 | 1,232 | |||||
Foreign currency | (1,810 | ) | (582 | ) | |||
Fair value at end of year | $ | 9,562 | $ | 10,691 | |||
40
NOTES TO THE CONSOLIDATED FINANCIAL STATEMENTS
(In thousands, except shares and per share data)
The primary objective of our U.S. and U.K. Pension Plans is to meet retirement income commitments to plan participants at a reasonable cost to us and to maintain a sound actuarially funded status. This objective is accomplished through growth of capital and safety of funds invested. The pension plans' assets are invested in securities to achieve growth of capital over inflation through appreciation and accumulation and reinvestment of dividend and interest income. Investments are diversified to control risk. The target allocation for the U.S. Pension Plan is 70% debt securities and 30% equity. Equity securities within the U.S. Pension Plan do not include any direct investments in Tennant Company Common Stock. The U.K. Pension Plan is invested in insurance contracts with underlying investments primarily in equity and fixed income securities. Our German Pension Plan is unfunded, which is customary in that country.
Weighted-average assumptions used to determine benefit obligations as of December 31 are as follows:
U.S. Pension Benefits | Non-U.S. Pension Benefits | Postretirement Medical Benefits | |||||||||||||||
2016 | 2015 | 2016 | 2015 | 2016 | 2015 | ||||||||||||
Discount rate | 3.92 | % | 4.08 | % | 2.64 | % | 3.59 | % | 3.58 | % | 3.70 | % | |||||
Rate of compensation increase | 3.00 | % | 3.00 | % | 3.50 | % | 3.50 | % | — | — | |||||||
Weighted-average assumptions used to determine net periodic benefit costs as of December 31 are as follows:
U.S. Pension Benefits | Non-U.S. Pension Benefits | Postretirement Medical Benefits | ||||||||||||||||||||||||
2016 | 2015 | 2014 | 2016 | 2015 | 2014 | 2016 | 2015 | 2014 | ||||||||||||||||||
Discount rate | 4.08 | % | 3.76 | % | 4.63 | % | 3.59 | % | 3.38 | % | 4.33 | % | 3.70 | % | 3.39 | % | 4.10 | % | ||||||||
Expected long-term rate of return on plan assets | 5.20 | % | 5.20 | % | 5.70 | % | 4.60 | % | 4.40 | % | 5.60 | % | — | — | — | |||||||||||
Rate of compensation increase | 3.00 | % | 3.00 | % | 3.00 | % | 3.50 | % | 3.50 | % | 4.50 | % | — | — | — | |||||||||||
The discount rate is used to discount future benefit obligations back to today’s dollars. Our discount rates were determined based on high-quality fixed income investments. The resulting discount rates are consistent with the duration of plan liabilities. The Citigroup Above Median Spot Rate is used in determining the discount rate for the U.S. Plans. The expected return on assets assumption on the investment portfolios for the pension plans is based on the long-term expected returns for the investment mix of assets currently in the portfolio. Management uses historic return trends of the asset portfolio combined with recent market conditions to estimate the future rate of return.
The accumulated benefit obligations as of December 31, for all defined benefit plans are as follows:
2016 | 2015 | ||||||
U.S. Pension Plans | $ | 40,961 | $ | 41,537 | |||
U.K. Pension Plan | 10,067 | 9,720 | |||||
German Pension Plan | 871 | 870 | |||||
Information for our plans with an accumulated benefit obligation in excess of plan assets as of December 31 is as follows:
2016 | 2015 | ||||||
Accumulated benefit obligation | $ | 12,597 | $ | 2,616 | |||
Fair value of plan assets | 9,562 | — | |||||
As of December 31, 2016, the U.S. Nonqualified, the U.K. Pension and the German Pension Plans had an accumulated benefit obligation in excess of plan assets. As of December 31, 2015, the U.S. Nonqualified and the German Pension Plans had an accumulated benefit obligation in excess of plan assets.
Information for our plans with a projected benefit obligation in excess of plan assets as of December 31 is as follows:
2016 | 2015 | ||||||
Projected benefit obligation | $ | 12,794 | $ | 2,616 | |||
Fair value of plan assets | 9,562 | — | |||||
As of December 31, 2016, the U.S. Nonqualified, the UK Pension and the German Pension Plans had a projected benefit obligation in excess of plan assets. As of December 31, 2015, the U.S. Nonqualified and the German Pension Plans had a projected benefit obligation in excess of plan assets.
41
NOTES TO THE CONSOLIDATED FINANCIAL STATEMENTS
(In thousands, except shares and per share data)
Assumed healthcare cost trend rates as of December 31 are as follows:
2016 | 2015 | ||||
Healthcare cost trend rate assumption for the next year | 6.56 | % | 6.76 | % | |
Rate to which the cost trend rate is assumed to decline (the ultimate trend rate) | 5.00 | % | 5.00 | % | |
Year that the rate reaches the ultimate trend rate | 2031 | 2031 | |||
Assumed healthcare cost trend rates have a significant effect on the amounts reported for healthcare plans. To illustrate, a one-percentage-point change in assumed healthcare cost trends would have the following effects:
1-Percentage- Point Decrease | 1-Percentage- Point Increase | ||||||
Effect on total of service and interest cost components | $ | (35 | ) | $ | 39 | ||
Effect on postretirement benefit obligation | $ | (751 | ) | $ | 850 | ||
Summaries related to changes in benefit obligations and plan assets and to the funded status of our defined benefit and postretirement medical benefit plans are as follows:
U.S. Pension Benefits | Non-U.S. Pension Benefits | Postretirement Medical Benefits | |||||||||||||||||||||
2016 | 2015 | 2016 | 2015 | 2016 | 2015 | ||||||||||||||||||
Change in benefit obligation: | |||||||||||||||||||||||
Benefit obligation at beginning of year | $ | 41,774 | $ | 47,027 | $ | 10,883 | $ | 12,014 | $ | 11,144 | $ | 13,292 | |||||||||||
Service cost | 354 | 480 | 103 | 153 | 76 | 96 | |||||||||||||||||
Interest cost | 1,659 | 1,711 | 358 | 396 | 396 | 393 | |||||||||||||||||
Plan participants' contributions | — | — | 14 | 20 | — | — | |||||||||||||||||
Actuarial loss (gain) | 690 | (3,352 | ) | 1,939 | (718 | ) | 6 | (1,618 | ) | ||||||||||||||
Foreign exchange | — | — | (1,852 | ) | (681 | ) | — | — | |||||||||||||||
Benefits paid | (3,516 | ) | (1,944 | ) | (309 | ) | (301 | ) | (1,082 | ) | (1,019 | ) | |||||||||||
Settlement | — | (2,148 | ) | — | — | — | — | ||||||||||||||||
Benefit obligation at end of year | $ | 40,961 | $ | 41,774 | $ | 11,136 | $ | 10,883 | $ | 10,540 | $ | 11,144 | |||||||||||
Change in fair value of plan assets and net accrued liabilities: | |||||||||||||||||||||||
Fair value of plan assets at beginning of year | $ | 47,201 | $ | 51,885 | $ | 10,691 | $ | 9,989 | $ | — | $ | — | |||||||||||
Actual return on plan assets | 2,457 | (933 | ) | 673 | 1,232 | — | — | ||||||||||||||||
Employer contributions | 247 | 341 | 303 | 333 | 1,082 | 1,019 | |||||||||||||||||
Plan participants' contributions | — | — | 14 | 20 | — | — | |||||||||||||||||
Foreign exchange | — | — | (1,810 | ) | (582 | ) | — | — | |||||||||||||||
Benefits paid | (3,516 | ) | (1,944 | ) | (309 | ) | (301 | ) | (1,082 | ) | (1,019 | ) | |||||||||||
Settlement | — | (2,148 | ) | — | — | — | — | ||||||||||||||||
Fair value of plan assets at end of year | 46,389 | 47,201 | 9,562 | 10,691 | — | — | |||||||||||||||||
Funded status at end of year | $ | 5,428 | $ | 5,427 | $ | (1,574 | ) | $ | (192 | ) | $ | (10,540 | ) | $ | (11,144 | ) | |||||||
Amounts recognized in the Consolidated Balance Sheets consist of: | |||||||||||||||||||||||
Noncurrent Other Assets | $ | 7,087 | $ | 7,173 | $ | — | $ | 678 | $ | — | $ | — | |||||||||||
Current Liabilities | (239 | ) | (243 | ) | (30 | ) | (33 | ) | (828 | ) | (835 | ) | |||||||||||
Long-Term Liabilities | (1,420 | ) | (1,503 | ) | (1,544 | ) | (837 | ) | (9,712 | ) | (10,309 | ) | |||||||||||
Net accrued asset (liability) | $ | 5,428 | $ | 5,427 | $ | (1,574 | ) | $ | (192 | ) | $ | (10,540 | ) | $ | (11,144 | ) | |||||||
Amounts recognized in Accumulated Other Comprehensive Loss consist of: | |||||||||||||||||||||||
Prior service cost | $ | — | $ | (42 | ) | $ | — | $ | — | $ | — | $ | — | ||||||||||
Net actuarial loss | (5,720 | ) | (5,127 | ) | (1,802 | ) | (111 | ) | (566 | ) | (560 | ) | |||||||||||
Accumulated Other Comprehensive Loss | $ | (5,720 | ) | $ | (5,169 | ) | $ | (1,802 | ) | $ | (111 | ) | $ | (566 | ) | $ | (560 | ) | |||||
42
NOTES TO THE CONSOLIDATED FINANCIAL STATEMENTS
(In thousands, except shares and per share data)
The components of the net periodic benefit (credit) cost for the three years ended December 31 were as follows:
U.S. Pension Benefits | Non-U.S. Pension Benefits | Postretirement Medical Benefits | |||||||||||||||||||||||||||||||||
2016 | 2015 | 2014 | 2016 | 2015 | 2014 | 2016 | 2015 | 2014 | |||||||||||||||||||||||||||
Service cost | $ | 354 | $ | 480 | $ | 493 | $ | 103 | $ | 153 | $ | 155 | $ | 76 | $ | 96 | $ | 128 | |||||||||||||||||
Interest cost | 1,659 | 1,711 | 1,964 | 358 | 396 | 476 | 396 | 393 | 497 | ||||||||||||||||||||||||||
Expected return on plan assets | (2,400 | ) | (2,613 | ) | (2,683 | ) | (452 | ) | (433 | ) | (539 | ) | — | — | — | ||||||||||||||||||||
Amortization of net actuarial loss | 41 | 835 | 147 | 27 | 54 | 9 | — | — | — | ||||||||||||||||||||||||||
Amortization of prior service cost (credit) | 41 | 42 | 43 | — | — | — | — | — | (6 | ) | |||||||||||||||||||||||||
Foreign currency | — | — | — | 97 | (35 | ) | (61 | ) | — | — | — | ||||||||||||||||||||||||
Curtailment charge | — | 25 | — | — | — | — | — | — | — | ||||||||||||||||||||||||||
Settlement charge | — | 225 | 356 | — | — | — | — | — | — | ||||||||||||||||||||||||||
Net periodic benefit (credit) cost | $ | (305 | ) | $ | 705 | $ | 320 | $ | 133 | $ | 135 | $ | 40 | $ | 472 | $ | 489 | $ | 619 | ||||||||||||||||
The changes in Accumulated Other Comprehensive Loss for the three years ended December 31 were as follows:
U.S. Pension Benefits | Non-U.S. Pension Benefits | Postretirement Medical Benefits | |||||||||||||||||||||||||||||||||
2016 | 2015 | 2014 | 2016 | 2015 | 2014 | 2016 | 2015 | 2014 | |||||||||||||||||||||||||||
Net actuarial loss (gain) | $ | 633 | $ | 195 | $ | 4,353 | $ | 1,718 | $ | (1,517 | ) | $ | 987 | $ | 6 | $ | (1,618 | ) | $ | 591 | |||||||||||||||
Amortization of prior service (cost) credit | (41 | ) | (67 | ) | (43 | ) | — | — | — | — | — | 6 | |||||||||||||||||||||||
Amortization of net actuarial loss | (41 | ) | (1,060 | ) | (503 | ) | (27 | ) | (54 | ) | (9 | ) | — | — | — | ||||||||||||||||||||
Total recognized in other comprehensive loss (income) | $ | 551 | $ | (932 | ) | $ | 3,807 | $ | 1,691 | $ | (1,571 | ) | $ | 978 | $ | 6 | $ | (1,618 | ) | $ | 597 | ||||||||||||||
Total recognized in net periodic benefit cost and other comprehensive loss (income) | $ | 246 | $ | (227 | ) | $ | 4,127 | $ | 1,824 | $ | (1,436 | ) | $ | 1,018 | $ | 478 | $ | (1,129 | ) | $ | 1,216 | ||||||||||||||
The following benefit payments, which reflect expected future service, are expected to be paid for our U.S. and Non-U.S. plans:
U.S. Pension Benefits | Non-U.S. Pension Benefits | Postretirement Medical Benefits | |||||||||
2017 | $ | 2,289 | $ | 215 | $ | 828 | |||||
2018 | 2,436 | 221 | 887 | ||||||||
2019 | 2,422 | 228 | 924 | ||||||||
2020 | 2,499 | 235 | 979 | ||||||||
2021 | 2,567 | 243 | 882 | ||||||||
2022 to 2026 | 13,130 | 1,344 | 4,141 | ||||||||
Total | $ | 25,343 | $ | 2,486 | $ | 8,641 | |||||
The following amounts are included in Accumulated Other Comprehensive Loss as of December 31, 2016 and are expected to be recognized as components of net periodic benefit cost during 2017:
Pension Benefits | Postretirement Medical Benefits | ||||||
Net actuarial loss | $ | 111 | $ | — | |||
Prior service cost | — | — | |||||
43
NOTES TO THE CONSOLIDATED FINANCIAL STATEMENTS
(In thousands, except shares and per share data)
14. | Shareholders' Equity |
Authorized Shares
We are authorized to issue an aggregate of 61,000,000 shares; 60,000,000 are designated as Common Stock, having a par value of $0.375 per share, and 1,000,000 are designated as Preferred Stock, having a par value of $0.02 per share. The Board of Directors is authorized to establish one or more series of preferred stock, setting forth the designation of each such series, and fixing the relative rights and preferences of each such series.
Purchase Rights
On November 10, 2006, the Board of Directors approved a Rights Agreement and declared a dividend of one preferred share purchase right for each outstanding share of Common Stock. Each right entitles the registered holder to purchase from us one one-hundredth of a Series A Junior Participating Preferred Share of the par value of $0.02 per share at a price of $100 per one hundredth of a Preferred Share, subject to adjustment. The rights are not exercisable or transferable apart from the Common Stock until the earlier of: (i) the close of business on the fifteenth day following a public announcement that a person or group of affiliated or associated persons has become an “Acquiring Person” (i.e., has become, subject to certain exceptions, including for stock ownership by employee benefit plans, the beneficial owner of 20% or more of the outstanding Common Stock), or (ii) the close of business on the fifteenth day following the first public announcement of a tender offer or exchange offer the consummation of which would result in a person or group of affiliated or associated persons becoming, subject to certain exceptions, the beneficial owner of 20% or more of the outstanding Common Stock (or such later date as may be determined by our Board of Directors prior to a person or group of affiliated or associated persons becoming an Acquiring Person). After a person or group becomes an Acquiring Person, each holder of a Right (other than an Acquiring Person) will be able to exercise the right at the current exercise price of the Right and receive the number of shares of Common Stock having a market value of two times the exercise price of the right, or, depending upon the circumstances in which the rights became exercisable, the number of common shares of the Acquiring Person having a market value of two times the exercise price of the right. At no time do the rights have any voting power. We may redeem the rights for $0.001 per right at any time prior to a person or group acquiring 20% or more of the Common Stock. Under certain circumstances, the Board of Directors may exchange the rights for our Common Stock or reduce the 20% thresholds to not less than 10%. The rights expired on December 26, 2016.
Accumulated Other Comprehensive Loss
Components of Accumulated Other Comprehensive Loss, net of tax, within the Consolidated Balance Sheets and Statements of Shareholders' Equity as of December 31 are as follows:
2016 | 2015 | 2014 | |||||||||
Foreign currency translation adjustments | $ | (44,444 | ) | $ | (44,585 | ) | $ | (32,090 | ) | ||
Pension and retiree medical benefits | (5,391 | ) | (3,647 | ) | (6,503 | ) | |||||
Cash flow hedge | (88 | ) | 103 | — | |||||||
Total Accumulated Other Comprehensive Loss | $ | (49,923 | ) | $ | (48,129 | ) | $ | (38,593 | ) | ||
The changes in components of Accumulated Other Comprehensive Loss, net of tax, are as follows:
Foreign Currency Translation Adjustments | Pension and Postretirement Benefits | Cash Flow Hedge | Total | ||||||||||||
December 31, 2015 | $ | (44,585 | ) | $ | (3,647 | ) | $ | 103 | $ | (48,129 | ) | ||||
Other comprehensive income (loss) before reclassifications | 141 | (1,815 | ) | (332 | ) | (2,006 | ) | ||||||||
Amounts reclassified from Accumulated Other Comprehensive Loss | — | 71 | 141 | 212 | |||||||||||
Net current period other comprehensive income (loss) | 141 | (1,744 | ) | (191 | ) | (1,794 | ) | ||||||||
December 31, 2016 | $ | (44,444 | ) | $ | (5,391 | ) | $ | (88 | ) | $ | (49,923 | ) | |||
Accumulated Other Comprehensive Loss associated with pension and postretirement benefits and cash flow hedges are included in Notes 13 and 11, respectively.
15. | Commitments and Contingencies |
We lease office and warehouse facilities, vehicles and office equipment under operating lease agreements, which include both monthly and longer-term arrangements. Leases with initial terms of one year or more expire at various dates through 2025 and generally provide for extension options. Rent expense under the leasing agreements (exclusive of real estate taxes, insurance and other expenses payable under the leases) amounted to $18,640, $17,804 and $18,446 in 2016, 2015 and 2014, respectively.
44
NOTES TO THE CONSOLIDATED FINANCIAL STATEMENTS
(In thousands, except shares and per share data)
The minimum rentals for aggregate lease commitments as of December 31, 2016, were as follows:
2017 | $ | 8,866 | |
2018 | 5,056 | ||
2019 | 3,334 | ||
2020 | 1,852 | ||
2021 | 948 | ||
Thereafter | 1,202 | ||
Total | $ | 21,258 | |
Certain operating leases for vehicles contain residual value guarantee provisions, which would become due at the expiration of the operating lease agreement if the fair value of the leased vehicles is less than the guaranteed residual value. The aggregate residual value at lease expiration of those leases is $15,571, of which we have guaranteed $12,549. As of December 31, 2016, we have recorded a liability for the estimated end-of-term loss related to this residual value guarantee of $483 for certain vehicles within our fleet. Our fleet also contains vehicles we estimate will settle at a gain. Gains on these vehicles will be recognized at the end of the lease term.
On March 23, 2016, we entered into a four year Joint Development Agreement with a partner to develop software. As part of that agreement we have committed to spend $3,000 during the first year of the agreement and $8,000 over the life of the agreement, subject to regular time and materials billing and achievement of contract milestones.
In the ordinary course of business, we may become liable with respect to pending and threatened litigation, tax, environmental and other matters. While the ultimate results of current claims, investigations and lawsuits involving us are unknown at this time, we do not expect that these matters will have a material adverse effect on our consolidated financial position or results of operations. Legal costs associated with such matters are expensed as incurred.
16. | Income Taxes |
Income from continuing operations for the three years ended December 31 was as follows:
2016 | 2015 | 2014 | |||||||||
U.S. operations | $ | 54,018 | $ | 51,189 | $ | 52,315 | |||||
Foreign operations | 12,473 | (765 | ) | 17,223 | |||||||
Total | $ | 66,491 | $ | 50,424 | $ | 69,538 | |||||
Income tax expense (benefit) for the three years ended December 31 was as follows:
2016 | 2015 | 2014 | |||||||||
Current: | |||||||||||
Federal | $ | 15,962 | $ | 15,117 | $ | 11,903 | |||||
Foreign | 3,035 | 3,992 | 3,373 | ||||||||
State | 1,859 | 1,685 | 1,543 | ||||||||
$ | 20,856 | $ | 20,794 | $ | 16,819 | ||||||
Deferred: | |||||||||||
Federal | $ | (472 | ) | $ | (481 | ) | $ | 2,650 | |||
Foreign | (434 | ) | (1,888 | ) | (524 | ) | |||||
State | (73 | ) | (89 | ) | (58 | ) | |||||
$ | (979 | ) | $ | (2,458 | ) | $ | 2,068 | ||||
Total: | |||||||||||
Federal | $ | 15,490 | $ | 14,636 | $ | 14,553 | |||||
Foreign | 2,601 | 2,104 | 2,849 | ||||||||
State | 1,786 | 1,596 | 1,485 | ||||||||
Total Income Tax Expense | $ | 19,877 | $ | 18,336 | $ | 18,887 | |||||
U.S. income taxes have not been provided on approximately $14,650 of undistributed earnings of non-U.S. subsidiaries. We do not have any plans to repatriate the undistributed earnings. Any repatriation from foreign subsidiaries that would result in incremental U.S. taxation is not being considered. It is management’s belief that reinvesting these earnings outside the U.S. is the most efficient use of capital.
45
NOTES TO THE CONSOLIDATED FINANCIAL STATEMENTS
(In thousands, except shares and per share data)
We have Dutch and German tax loss carryforwards of approximately $17,276 and $10,764, respectively. If unutilized, the Dutch tax loss carryforward will expire after 9 years. The German tax loss carryforward has no expiration date. Because of the uncertainty regarding realization of the Dutch tax loss carryforward, a valuation allowance was established. This valuation allowance increased in 2016 due to the sale of our Green Machines outdoor city cleaning line.
We have Dutch foreign tax credit carryforwards of $1,228. Because of the uncertainty regarding utilization of the Dutch foreign tax credit carryforward, a valuation allowance was established.
A valuation allowance for the remaining deferred tax assets is not required since it is more likely than not that they will be realized through carryback to taxable income in prior years, future reversals of existing taxable temporary differences and future taxable income.
Our effective income tax rate varied from the U.S. federal statutory tax rate for the three years ended December 31 as follows:
2016 | 2015 | 2014 | ||||||
Tax at statutory rate | 35.0 | % | 35.0 | % | 35.0 | % | ||
Increases (decreases) in the tax rate from: | ||||||||
State and local taxes, net of federal benefit | 1.7 | 2.2 | 1.7 | |||||
Effect of foreign operations | (5.5 | ) | (5.1 | ) | (4.6 | ) | ||
Impairment of Long-Lived Assets | — | 7.0 | — | |||||
Effect of changes in valuation allowances | 1.9 | 1.5 | (0.9 | ) | ||||
Domestic production activities deduction | (2.2 | ) | (2.7 | ) | (1.6 | ) | ||
Other, net | (1.0 | ) | (1.5 | ) | (2.4 | ) | ||
Effective income tax rate | 29.9 | % | 36.4 | % | 27.2 | % | ||
Deferred tax assets and liabilities were comprised of the following as of December 31:
2016 | 2015 | ||||||
Deferred Tax Assets: | |||||||
Inventories, principally due to changes in inventory reserves | $ | 332 | $ | — | |||
Employee wages and benefits, principally due to accruals for financial reporting purposes | 14,723 | 16,395 | |||||
Warranty reserves accrued for financial reporting purposes | 3,617 | 3,101 | |||||
Receivables, principally due to allowance for doubtful accounts and tax accounting method for equipment rentals | 1,413 | 1,446 | |||||
Tax loss carryforwards | 7,821 | 5,834 | |||||
Tax credit carryforwards | 1,228 | 1,102 | |||||
Other | 2,126 | 603 | |||||
Gross Deferred Tax Assets | $ | 31,260 | $ | 28,481 | |||
Less: valuation allowance | (6,865 | ) | (5,884 | ) | |||
Total Net Deferred Tax Assets | $ | 24,395 | $ | 22,597 | |||
Deferred Tax Liabilities: | |||||||
Inventories, principally due to changes in inventory reserves | $ | — | $ | 617 | |||
Property, Plant and Equipment, principally due to differences in depreciation and related gains | 6,947 | 6,619 | |||||
Goodwill and Intangible Assets | 4,180 | 3,315 | |||||
Total Deferred Tax Liabilities | $ | 11,127 | $ | 10,551 | |||
Net Deferred Tax Assets | $ | 13,268 | $ | 12,046 | |||
The valuation allowance at December 31, 2016 principally applies to Dutch tax loss and tax credit carryforwards that, in the opinion of management, are more likely than not to expire unutilized. However, to the extent that tax benefits related to these carryforwards are realized in the future, the reduction in the valuation allowance will reduce income tax expense.
46
NOTES TO THE CONSOLIDATED FINANCIAL STATEMENTS
(In thousands, except shares and per share data)
A reconciliation of the beginning and ending amount of unrecognized tax benefits is as follows:
2016 | 2015 | ||||||
Balance at January 1, | $ | 2,326 | $ | 3,029 | |||
Increases as a result of tax positions taken during the current year | 545 | 532 | |||||
Decreases relating to settlement with tax authorities | (6 | ) | (72 | ) | |||
Reductions as a result of a lapse of the applicable statute of limitations | (523 | ) | (760 | ) | |||
Increases (Decreases) as a result of foreign currency fluctuations | 135 | (403 | ) | ||||
Balance at December 31, | $ | 2,477 | $ | 2,326 | |||
Included in the balance of unrecognized tax benefits at December 31, 2016 and 2015 are potential benefits of $2,114 and $1,992, respectively, that if recognized, would affect the effective tax rate from continuing operations.
We recognize potential accrued interest and penalties related to unrecognized tax benefits as a component of income tax expense. In addition to the liability of $2,477 and $2,326 for unrecognized tax benefits as of December 31, 2016 and 2015, there was approximately $490 and $504, respectively, for accrued interest and penalties. To the extent interest and penalties are not assessed with respect to uncertain tax positions, the amounts accrued will be revised and reflected as an adjustment to income tax expense.
We and our subsidiaries are subject to U.S. federal income tax as well as income tax of numerous state and foreign jurisdictions. We are generally no longer subject to U.S. federal tax examinations for taxable years before 2013 and, with limited exceptions, state and foreign income tax examinations for taxable years before 2007.
We are currently undergoing income tax examinations in various state and foreign jurisdictions covering 2007 to 2014. Although the final outcome of these examinations cannot be currently determined, we believe that we have adequate reserves with respect to these examinations.
We do not anticipate that total unrecognized tax benefits will change significantly within the next 12 months.
17. | Share-Based Compensation |
We have four plans under which we have awarded share-based compensation grants: The 1999 Amended and Restated Stock Incentive Plan (“1999 Plan”), which provided for share-based compensation grants to our executives and key employees, the 1997 Non-Employee Directors Option Plan (“1997 Plan”), which provided for stock option grants to our non-employee Directors, the 2007 Stock Incentive Plan (“2007 Plan”) and the Amended and Restated 2010 Stock Incentive Plan, as Amended (“2010 Plan”), which were adopted as a continuing step toward aggregating our equity compensation programs to reduce the complexity of our equity compensation programs.
The 1997 Plan was terminated in 2006 and all remaining shares were transferred to the 1999 Plan as approved by the shareholders in 2006. Awards granted under the 1997 Plan prior to 2006 that remain outstanding continue to be governed by the respective plan under which the grant was made. Upon approval of the 1999 Plan in 2006, we ceased making grants of future awards under these plans and subsequent grants of future awards were made from the 1999 Plan and governed by its terms.
The 2007 Plan terminated our rights to grant awards under the 1999 Plan. Awards previously granted under the 1999 Plan remain outstanding and continue to be governed by the terms of that plan.
The 2010 Plan, originally approved by our shareholders on April 28, 2010 and amended and restated by our shareholders on April 25, 2012, terminated our rights to grant awards under the 2007 Plan; however, any awards granted under the 2007 or 2010 Plans that do not result in the issuance of shares of Common Stock may again be used for an award under the 2010 Plan. The 2010 Plan was amended and restated by our shareholders on April 24, 2013, increasing the number of shares available under the amended 2010 Plan from 1,500,000 shares to 2,600,000 shares.
As of December 31, 2016, there were 252,598 shares reserved for issuance under the 1997 Plan, the 1999 Plan and the 2007 Plan for outstanding compensation awards and 656,339 shares were available for issuance under the 2010 Plan for current and future equity awards. The Compensation Committee of the Board of Directors determines the number of shares awarded and the grant date, subject to the terms of our equity award policy.
We recognized total Share-Based Compensation Expense of $3,875, $8,222 and $7,314, respectively, during the years ended 2016, 2015 and 2014. The total excess tax benefit recognized for share-based compensation arrangements during the years ended 2016, 2015 and 2014 was $686, $859 and $1,793, respectively.
Stock Option Awards
We determined the fair value of our stock option awards using the Black-Scholes valuation model that uses the assumptions noted in the table below. The expected life selected for stock options granted during the year represents the period of time that the stock options are expected to be outstanding based on historical data of stock option holder exercise and termination behavior of similar grants. The risk-free interest rate for periods within the contractual life of the stock option is based on the U.S. Treasury rate over the expected life at the time of grant. Expected volatilities are based upon historical volatility of our stock over a period equal to the expected life of each stock option grant. Dividend yield is estimated over the expected life based on our dividend policy and historical dividends paid. We use historical data to estimate pre-vesting forfeiture rates and revise those estimates in subsequent periods if actual forfeitures differ from those estimates.
47
NOTES TO THE CONSOLIDATED FINANCIAL STATEMENTS
(In thousands, except shares and per share data)
The following table illustrates the valuation assumptions used for the 2016, 2015 and 2014 grants:
2016 | 2015 | 2014 | |||
Expected volatility | 29 - 32% | 32 - 36% | 47 - 50% | ||
Weighted-average expected volatility | 32% | 36% | 50% | ||
Expected dividend yield | 1.3 - 1.5% | 1.1 - 1.2% | 1.1 - 1.3% | ||
Weighted-average expected dividend yield | 1.3% | 1.2% | 1.3% | ||
Expected term, in years | 5 | 5 | 6 | ||
Risk-free interest rate | 1.1 - 1.4% | 1.4 - 1.6% | 1.8 - 2.0% | ||
Employee stock option awards prior to 2005 included a reload feature for options granted to key employees. This feature allowed employees to exercise options through a stock-for-stock exercise using mature shares, and employees were granted a new stock option (reload option) equal to the number of shares of Common Stock used to satisfy both the exercise price of the option and the minimum tax withholding requirements. The reload options granted had an exercise price equal to the fair market value of the Common Stock on the grant date. Stock options granted in conjunction with reloads vested immediately and had a term equal to the remaining life of the initial grant. Compensation expense was fully recognized for reload stock options as of the reload date. The final reload options outstanding were exercised in January 2014.
Beginning in 2004, new stock option awards granted vest one-third each year over a three year period and have a ten year contractual term. These grants do not contain a reload feature. Compensation expense equal to the grant date fair value is recognized for these awards over the vesting period. Stock options granted to employees are subject to accelerated expensing if the option holder meets the retirements definition set forth in the 2010 Plan.
In addition to stock options, we also occasionally grant cash-settled stock appreciation rights (“SARs”) to employees in certain foreign locations. There were no outstanding SARs as of December 31, 2016 and no SARs were granted during 2016, 2015 or 2014.
The following table summarizes the activity during the year ended December 31, 2016 for stock option awards:
Shares | Weighted-Average Exercise Price | |||||
Outstanding at beginning of year | 1,018,958 | $ | 39.69 | |||
Granted | 258,895 | 52.80 | ||||
Exercised | (135,744 | ) | 38.82 | |||
Forfeited | (23,028 | ) | 59.46 | |||
Expired | (5,699 | ) | 60.26 | |||
Outstanding at end of year | 1,113,382 | $ | 42.34 | |||
Exercisable at end of year | 736,650 | $ | 34.75 | |||
The weighted-average grant date fair value of stock options granted during the years ended December 31, 2016, 2015 and 2014 was $13.61, $20.08 and $26.93, respectively. The total intrinsic value of stock options exercised during the years ended December 31, 2016, 2015 and 2014 was $3,408, $1,702 and $2,972, respectively. The aggregate intrinsic value of options outstanding and exercisable at December 31, 2016 was $32,152 and $26,868, respectively. The weighted-average remaining contractual life for options outstanding and exercisable as of December 31, 2016, was 5.9 years and 4.4 years, respectively. As of December 31, 2016, there was unrecognized compensation cost for nonvested options of $2,103, which is expected to be recognized over a weighted-average period of 1.3 years.
Restricted Share Awards
Restricted share awards for employees generally have a three year vesting period from the effective date of the grant. Restricted share awards to non-employee directors vest upon a change of control or upon termination of service as a director occurring at least six months after grant date of the award so long as termination is for one of the following reasons: death; disability; retirement in accordance with Tennant policy (e.g., age, term limits, etc.); resignation at request of Board (other than for gross misconduct); resignation following at least six months’ advance notice; failure to be renominated (unless due to unwillingness to serve) or reelected by shareholders; or removal by shareholders. We use the closing share price the day before the grant date to determine the fair value of our restricted share awards. Expenses on these awards are recognized over the vesting period.
48
NOTES TO THE CONSOLIDATED FINANCIAL STATEMENTS
(In thousands, except shares and per share data)
The following table summarizes the activity during the year ended December 31, 2016 for nonvested restricted share awards:
Shares | Weighted-Average Grant Date Fair Value | |||||
Nonvested at beginning of year | 138,819 | $ | 43.83 | |||
Granted | 27,921 | 53.02 | ||||
Vested | (49,306 | ) | 39.96 | |||
Forfeited | (200 | ) | 61.26 | |||
Nonvested at end of year | 117,234 | $ | 47.62 | |||
The total fair value of shares vested during the years ended December 31, 2016, 2015 and 2014 was $1,970, $1,054 and $827, respectively. As of December 31, 2016, there was $1,679 of total unrecognized compensation cost related to nonvested shares which is expected to be recognized over a weighted-average period of 1.8 years.
Performance Share Awards
We grant performance share awards to key employees as a part of our long-term management compensation program. These awards are earned based upon achievement of certain financial performance targets over a three year period. The number of shares of common stock a participant receives will be increased (up to 200 percent of target levels) or reduced (down to zero) based on the level of achievement of the financial performance targets. We use the closing share price the day before the grant date to determine the fair value of our performance share awards. Expenses on these awards are recognized over a three year performance period. Performance shares are granted in restricted stock units. They are payable in stock and vest solely upon achievement of certain financial performance targets during this three year period.
The following table summarizes the activity during the year ended December 31, 2016 for nonvested performance share awards:
Shares | Weighted-Average Grant Date Fair Value | |||||
Nonvested at beginning of year | 141,374 | $ | 56.07 | |||
Granted | 58,454 | 52.56 | ||||
Vested | (36,054 | ) | 47.25 | |||
Forfeited | (34,678 | ) | 47.30 | |||
Nonvested at end of year | 129,096 | $ | 59.30 | |||
The total fair value of shares vested during the year ended December 31, 2016, 2015 and 2014 was $1,703, $1,713 and $4,346, respectively. As of December 31, 2016, achievements of performance targets on unvested performance shares were determined to be not probable and we expect to incur no further expense on these awards. If the achievement of such performance targets becomes probable, we would recognize $5,642 of total compensation costs over a weighted-average period of 1.7 years.
Restricted Stock Units
We grant restricted stock units to employees, which generally vest within three years from the date of the grant. Vested restricted stock units are paid out in stock. We use the closing share price the day before the grant date to determine the fair value our restricted stock units. Expenses on these awards are recognized over a three year period.
The following table summarizes the activity during the year ended December 31, 2016 for nonvested restricted stock units:
Shares | Weighted-Average Grant Date Fair Value | |||||
Nonvested at beginning of year | 32,646 | $ | 66.89 | |||
Granted | 15,450 | 54.35 | ||||
Vested | (13,190 | ) | 68.80 | |||
Forfeited | (3,868 | ) | 61.83 | |||
Nonvested at end of year | 31,038 | $ | 60.47 | |||
49
NOTES TO THE CONSOLIDATED FINANCIAL STATEMENTS
(In thousands, except shares and per share data)
The total fair value of shares vested during the years ended December 31, 2016 and 2015 was $907 and $10, respectively. Since 2015 was the first year we paid out on vested restricted stock units, there were no restricted stock units that vested for the year ended December 31, 2014. As of December 31, 2016, there was $723 of total unrecognized compensation cost related to nonvested shares which is expected to be recognized over a weighted-average period of 1.2 years.
Share-Based Liabilities
As of December 31, 2016 and 2015, we had $155 and $149 in total share-based liabilities recorded on our Consolidated Balance Sheets, respectively. During the years ended December 31, 2016, 2015 and 2014, we paid out $62, $53 and $275 related to 2013, 2012 and 2011 share-based liability awards, respectively.
18. | Earnings Per Share |
The computations of Basic and Diluted Earnings per Share for the years ended December 31 were as follows:
2016 | 2015 | 2014 | |||||||||
Numerator: | |||||||||||
Net Earnings | $ | 46,614 | $ | 32,088 | $ | 50,651 | |||||
Denominator: | |||||||||||
Basic - Weighted Average Shares Outstanding | 17,523,267 | 18,015,151 | 18,217,384 | ||||||||
Effect of dilutive securities | 452,916 | 478,296 | 523,474 | ||||||||
Diluted - Weighted Average Shares Outstanding | 17,976,183 | 18,493,447 | 18,740,858 | ||||||||
Basic Earnings per Share | $ | 2.66 | $ | 1.78 | $ | 2.78 | |||||
Diluted Earnings per Share | $ | 2.59 | $ | 1.74 | $ | 2.70 | |||||
Options to purchase 356,598, 222,092 and 91,199 shares of Common Stock were outstanding during 2016, 2015 and 2014, respectively, but were not included in the computation of diluted earnings per share. These exclusions are made if the exercise prices of these options are greater than the average market price of our Common Stock for the period, if the number of shares we can repurchase under the treasury stock method exceeds the weighted shares outstanding in the options, or if we have a net loss, as the effects are anti-dilutive.
19. | Segment Reporting |
We are organized into four operating segments: North America; Latin America; Europe, Middle East, Africa; and Asia Pacific. We combine our North America and Latin America operating segments into the "Americas" for reporting net sales by geographic area. In accordance with the objective and basic principles of the applicable accounting guidance, we aggregate our operating segments into one reportable segment that consists of the design, manufacture and sale of products used primarily in the maintenance of nonresidential surfaces.
The following table presents Net Sales by geographic area for the years ended December 31:
2016 | 2015 | 2014 | |||||||||
Net Sales: | |||||||||||
Americas | $ | 607,026 | $ | 591,405 | $ | 569,004 | |||||
Europe, Middle East, Africa | 129,046 | 139,834 | 165,686 | ||||||||
Asia Pacific | 72,500 | 80,560 | 87,293 | ||||||||
Total | $ | 808,572 | $ | 811,799 | $ | 821,983 | |||||
The following table presents long-lived assets by geographic area as of December 31:
2016 | 2015 | 2014 | |||||||||
Long-lived assets: | |||||||||||
Americas | $ | 134,737 | $ | 110,842 | $ | 103,958 | |||||
Europe, Middle East, Africa | 19,606 | 11,100 | 24,051 | ||||||||
Asia Pacific | 4,334 | 4,658 | 3,669 | ||||||||
Total | $ | 158,677 | $ | 126,600 | $ | 131,678 | |||||
Accounting policies of the operations in the various operating segments are the same as those described in Note 1. Net Sales are attributed to each operating segment based on the end user country and are net of intercompany sales. Information regarding sales to customers geographically located in the United States is provided in Item 1, Business - Segment and Geographic Area Financial Information. No single customer represents more than 10% of our consolidated Net Sales.
50
NOTES TO THE CONSOLIDATED FINANCIAL STATEMENTS
(In thousands, except shares and per share data)
Long-lived assets consist of Property, Plant and Equipment, Goodwill, Intangible Assets and certain other assets. Long-lived assets located in the Netherlands totaled $14,742, $9,724 and $14,066 as of the years ended December 31, 2016, 2015 and 2014, respectively. There are no other individual foreign locations which have long-lived assets which represent more than 10% of our consolidated long-lived assets.
The following table presents revenues for groups of similar products and services for the years ended December 31:
2016 | 2015 | 2014 | |||||||||
Net Sales: | |||||||||||
Equipment | $ | 491,075 | $ | 499,634 | $ | 500,141 | |||||
Parts and consumables | 173,632 | 175,697 | 182,845 | ||||||||
Service and other | 114,719 | 112,622 | 114,027 | ||||||||
Specialty surface coatings | 29,146 | 23,846 | 24,970 | ||||||||
Total | $ | 808,572 | $ | 811,799 | $ | 821,983 | |||||
20. | Consolidated Quarterly Data (Unaudited) |
2016 | |||||||||||||||
Q1 | Q2 | Q3 | Q4 | ||||||||||||
Net Sales | $ | 179,864 | $ | 216,828 | $ | 200,134 | $ | 211,746 | |||||||
Gross Profit | 77,502 | 95,289 | 85,295 | 93,509 | |||||||||||
Net Earnings | 4,439 | 15,328 | 11,477 | 15,370 | |||||||||||
Basic Earnings per Share | $ | 0.25 | $ | 0.88 | $ | 0.66 | $ | 0.88 | |||||||
Diluted Earnings per Share | $ | 0.25 | $ | 0.85 | $ | 0.64 | $ | 0.85 | |||||||
2015 | |||||||||||||||
Q1 | Q2 | Q3 | Q4 | ||||||||||||
Net Sales | $ | 185,740 | $ | 215,404 | $ | 204,802 | $ | 205,853 | |||||||
Gross Profit | 78,081 | 95,033 | 88,657 | 87,289 | |||||||||||
Net Earnings (Loss) | 5,026 | 14,817 | (951 | ) | 13,196 | ||||||||||
Basic Earnings (Loss) per Share | $ | 0.27 | $ | 0.81 | $ | (0.05 | ) | $ | 0.74 | ||||||
Diluted Earnings (Loss) per Share | $ | 0.27 | $ | 0.79 | $ | (0.05 | ) | $ | 0.73 | ||||||
The summation of quarterly data may not equate to the calculation for the full fiscal year as quarterly calculations are performed on a discrete basis.
Regular quarterly dividends aggregated to $0.81 per share in 2016, or $0.20 per share per for the first three quarters of 2016 and $0.21 per share for the last quarter of 2016, and $0.80 per share in 2015, or $0.20 per share per quarter.
21. | Related Party Transactions |
During the first quarter of 2008, we acquired Sociedade Alfa Ltda. and entered into lease agreements for certain properties owned by or partially owned by the former owners of this entity. Some of these individuals are current employees of Tennant. Lease payments made under these lease agreements are not material to our financial position or results of operations.
22. | Subsequent Events |
On February 13, 2017, we announced a joint venture with i-team Global, a Future Cleaning Technologies (FCT) company headquartered in Eindhoven, The Netherlands. The joint venture will operate as the distributor of the i-mop, a heavy-duty scrubber that combines the cleaning performance of an autoscrubber with the agility of a flat mop, in North America. i-team North America will begin selling and servicing the i-mop starting April 3, 2017.
On February 15, 2017, the Board of Directors approved the termination of the U.S. Pension Plan, effective May 15, 2017.
On February 23, 2017, we announced the signing of a definitive agreement with private equity fund Ambienta to acquire the stock of IPC Group in an all-cash transaction valued at approximately $350,000, or €330,000. IPC Group, based in Italy, is a privately held designed and manufacturer of innovative professional cleaning equipment, tools and other solutions sold under the brand names IPC, IPC Forma, IPC Eagles, IPC Gansow, ICA, Vaclensa, Portotecnica, Sirio and Soteco, Readysystem, Euromop and Pulex. In 2016, IPC Group generated annual sales of about $203,000, or €192,000. The transaction is expected to close in the 2017 second quarter, subject to customary closing conditions and regulatory approvals. Tennant anticipates that the acquisition will be accretive to the 2018 full year earnings per share.
On February 23, 2017, in connection with the Company's planned acquisition of IPC Group, the Company entered into a foreign exchange call option for a notional amount of €180,000 that expires on April 3, 2017.
51
On February 23, 2017, we announced a restructuring charge to reduce our global workforce by three percent, with the majority of the actions occurring in March. As a result, we anticipate recording a restructuring charge in the 2017 first quarter in the range of $7,000 to $8,000 pre-tax, or $0.27 to $0.30 per diluted share. The savings from this action are estimated to be $7,000 in 2017 and $10,000 in 2018.
52
ITEM 9 – Changes in and Disagreements with Accountants on Accounting and Financial Disclosure
None.
ITEM 9A – Controls and Procedures
Disclosure Controls and Procedures
Our management, including our Chief Executive Officer and Principal Financial and Accounting Officer, have conducted an evaluation of the effectiveness of the design and operation of our disclosure controls and procedures (as defined in Rule 13a-15(e) under the Securities Exchange Act of 1934, as amended (the Exchange Act)) as of December 31, 2016. Our Chief Executive Officer and Principal Financial and Accounting Officer concluded that, as a result of the material weaknesses in internal control over financial reporting as described below, our disclosure controls and procedures were not effective as of December 31, 2016.
For purposes of Rule 13a-15(e), the term disclosure controls and procedures means controls and other procedures of an issuer that are designed to ensure that information required to be disclosed by the issuer in the reports that it files or submits under the Exchange Act (15 U.S.C. 78a et seq.) is recorded, processed, summarized and reported within the time periods specified in the SEC’s rules and forms. Disclosure controls and procedures include, without limitation, controls and procedures designed to ensure that information required to be disclosed by an issuer in the reports that it files or submits under the Exchange Act is accumulated and communicated to the issuer’s management, including its Chief Executive Officer and Principal Financial and Accounting Officer, or persons performing similar functions, as appropriate to allow timely decisions regarding required disclosure.
Management’s Report on Internal Control over Financial Reporting
Our management is responsible for establishing and maintaining adequate internal control over financial reporting, as such term is defined in Rule 13a-15(f) under the Exchange Act.
The Company’s internal control over financial reporting is a process designed to provide reasonable assurance regarding the reliability of financial reporting and the preparation of financial statements for external purposes in accordance with generally accepted accounting principles. A company’s internal control over financial reporting includes those policies and procedures that:
(i) | Pertain to the maintenance of records that, in reasonable detail, accurately and fairly reflect the transactions and dispositions of the assets of the company; |
(ii) | Provide reasonable assurance that transactions are recorded as necessary to permit preparation of financial statements in accordance with generally accepted accounting principles, and that receipts and expenditures of the company are being made only in accordance with authorizations of management and directors of the company; and |
(iii) | Provide reasonable assurance regarding prevention or timely detection of unauthorized acquisition, use or disposition of the company’s assets that could have a material effect on the financial statements. |
Because of its inherent limitations, internal control over financial reporting may not prevent or detect misstatements. Also, projections of any evaluation of effectiveness to future periods are subject to the risk that controls may become inadequate because of changes in conditions, or that the degree of compliance with the policies or procedures may deteriorate.
A material weakness is a deficiency, or combination of deficiencies, in internal control over financial reporting such that there is a reasonable possibility that a material misstatement of the Company’s annual or interim financial statements will not be prevented or detected on a timely basis.
Under the supervision of the Audit Committee of the Board of Directors and with the participation of our management, including our Chief Executive Officer and Principal Financial and Accounting Officer, we conducted an evaluation of the effectiveness of our internal control over financial reporting using the criteria established in Internal Control - Integrated Framework (2013) issued by the Committee of Sponsoring Organizations of the Treadway Commission (COSO). Based on our assessment and those criteria, management concluded that our internal control over financial reporting as of December 31, 2016 was not effective due to the material weaknesses described as follows:
• | The Company did not have sufficient number of trained resources with assigned responsibility and accountability over the design and operation of internal controls; and |
• | The Company did not have an effective risk assessment process that identified and assessed necessary changes in significant accounting policies and practices that were responsive to changes in business operations and new product arrangements, specifically the Company did not have an adequately designed and documented technical accounting analysis over the application of generally accepted accounting principles to a software development arrangement. |
As a consequence, the Company did not have effective process level control activities over the following:
• | effective general information technology controls, specifically program change controls in our service scheduling system and therefore the Company did not maintain effective automated and manual controls over the accounting for revenue related to equipment maintenance and repair service; |
• | adequately designed and documented management review controls over the accounting for certain inventory adjustments, incentive accruals and performance share awards, specifically, the management review controls did not adequately address management’s expectations, criteria for investigation, follow up on outliers and the level of precision used in the performance of the review controls; |
• | effective control over the determination of technological feasibility and the capitalization of software development costs. |
The control deficiencies described above created a reasonable possibility that a material misstatement to the consolidated financial statements would not be prevented or detected on a timely basis. The control deficiencies described above resulted in immaterial misstatements in the preliminary consolidated financial statements that were corrected prior to the issuance of the consolidated financial statements as of and for the fiscal year ended December 31, 2016.
53
Tennant Company acquired selected assets and liabilities of Crawford Laboratories, Inc. and affiliates thereof (“Florock”) and Dofesa Barrido Mecanizado (“Dofesa”) in August 2016 and September 2016, respectively, which were accounted for as business combinations, and management excluded from its assessment of the effectiveness of Tennant Company’s internal control over financial reporting as of December 31, 2016 Florock and Dofesa’s internal control over financial reporting associated with total assets of $14 million and total revenues of $9 million included in the consolidated financial statements of Tennant Company and subsidiaries as of and for the year ended December 31, 2016. This exclusion is in accordance with the SEC’s guidance, which permits companies to omit an acquired business’s internal control over financial reporting from management’s assessment for up to one year after the date of the acquisition.
KPMG LLP, an independent registered public accounting firm, has audited the effectiveness of the Company’s internal control over financial reporting as of December 31, 2016, and has issued an adverse report which is included in Item 8 of this Annual Report on Form 10-K.
Remediation Plan for Material Weaknesses in Internal Control over Financial Reporting
The Company will execute the following steps in 2017 to remediate the aforementioned material weaknesses in its internal control over financial reporting:
• | The Company will sponsor ongoing training related to the COSO 2013 Framework best practices for personnel that are accountable for internal control over financial reporting; |
• | The Company will perform a complete review of our accounting for revenue related to equipment maintenance and repair service to ensure the adequacy of the design and implementation of automated and manual controls; |
• | The Company will design and implement controls over the determination of technological feasibility and the capitalization of software development costs. |
Changes in Internal Control Over Financial Reporting
Except for the identification of the material weaknesses noted above during the fourth quarter, there were no other changes in internal control over financial reporting during the fourth quarter of 2016 that have materially affected, or are reasonably likely to materially affect, our internal control over financial reporting.
/s/ H. Chris Killingstad | ||
H. Chris Killingstad President and Chief Executive Officer | ||
/s/ Thomas Paulson | ||
Thomas Paulson Senior Vice President and Chief Financial Officer (Principal Financial and Accounting Officer) | ||
ITEM 9B – Other Information
None.
PART III
ITEM 10 – Directors, Executive Officers and Corporate Governance
Information required under this item with respect to directors is contained in the sections entitled “Board of Directors Information” and “Section 16(a) Beneficial Ownership Reporting Compliance” as part of our 2017 Proxy Statement and is incorporated herein by reference.
The list below identifies those persons designated as executive officers of the Company, including their age, positions held with the Company and their business experience during the past five or more years.
David W. Huml, Senior Vice President, Global Marketing
David W. Huml (48) joined the Company in November 2014 as Senior Vice President, Global Marketing. In January 2016, he also assumed oversight for the Company's APAC business unit and in January 2017, he assumed oversight for the Company's EMEA business. From 2006 to October 2014, he held various positions with Pentair plc, a global manufacturer of water and fluid solutions, valves and controls, equipment protection and thermal management products, most recently as Vice President, Applied Water Platform. From 1992 to 2006, he held various positions with Graco Inc., a designer, manufacturer and marketer of systems and equipment to move, measure, control, dispense and spray fluid and coating materials, including Worldwide Director of Marketing, Contractor Equipment Division.
H. Chris Killingstad, President and Chief Executive Officer
H. Chris Killingstad (61) joined the Company in April 2002 as Vice President, North America and was named President and CEO in 2005. From 1990 to 2002, he was employed by The Pillsbury Company, a consumer foods manufacturer. From 1999 to 2002 he served as Senior Vice President and General Manager of Frozen Products for Pillsbury North America; from 1996 to 1999 he served as Regional Vice President and Managing Director of Pillsbury Europe, and from 1990 to 1996 was Regional Vice President of Häagen-Dazs Asia Pacific. He held the position of International Business Development Manager at PepsiCo Inc., from 1982-1990 and Financial Manager for General Electric, from 1978-1980.
Carol E. McKnight, Senior Vice President, Global Human Resources
Carol E. McKnight (49) joined the Company in June 2014 as Senior Vice President, Global Human Resources. From 2002 to May 2014, she held various positions with Alliant Techsystems, Inc. (ATK), an aerospace, defense and sporting goods company, most recently as Vice President, Human Resources. From 2000 to 2002, she was a Compensation Consultant/Manager at NRG Energy, Inc., a wholesale power generation company. From 1994 to 2000, she provided consulting and project management services for SilverStone Group, Inc. (formerly Mathis & Associates, LLC), a compensation and benefits consulting firm.
Jeffrey C. Moorefield, Senior Vice President, Global Operations
Jeffrey C. Moorefield (53) joined the Company in April 2015 as Senior Vice President, Global Operations. From 2001 to 2008 and 2010 to March 2015, he held various positions with Pentair plc, a global manufacturer of water and fluid solutions, valves and controls, equipment protection and thermal management products, most recently as Global Vice President of Operation - Technical Solutions. From 2008 to 2010, he was Head of Operations for Netshape Technology, a technical start-up company. From 1987 to 2001, he held various positions with Emerson Electric Company, a worldwide technology and engineering company, culminating in Vice President, Operations. From 1985 to 1987, he was a Design Engineer at Smith & Proffit Machine & Engineering, a custom equipment engineering company.
54
Thomas Paulson, Senior Vice President and Chief Financial Officer
Thomas Paulson (60) joined the Company in March 2006 as Vice President and Chief Financial Officer and was named Senior Vice President and Chief Financial Officer in October 2013. Prior to joining Tennant, he was Chief Financial Officer and Senior Vice President of Innovex from 2001 to February 2006. Prior to joining Innovex, a manufacturer of electronic interconnect solutions, he worked for The Pillsbury Company for over 19 years. He became a Vice President at Pillsbury in 1995 and was the Vice President of Finance for the $4 billion North American Foods Division for over two years before joining Innovex.
Michael W. Schaefer, Senior Vice President, Chief Technical Officer
Michael W. Schaefer (56) joined the Company in January 2008 as Vice President, Chief Technical Officer and was named Senior Vice President, Chief Technical Officer in October 2013. From 2000 to January 2008, he was Vice President of Dispensing Systems, Lean Six Sigma and Quality at Ecolab, Inc., a provider of cleaning, sanitizing, food safety and infection prevention products and services, where he led R&D efforts for their equipment business, continuous improvement and standardization of R&D processes. Prior to that, he held various management positions at Alticor Corporation and Kraft General Foods.
Heidi M. Wilson, Senior Vice President, General Counsel and Secretary
Heidi M. Wilson (66) joined the Company in 2003 as Assistant General Counsel and Assistant Secretary. She was named Vice President, General Counsel and Secretary in 2005 and Senior Vice President, General Counsel and Secretary in October 2013. She was a partner with General Counsel Ltd. during 2003. From 1995 to 2001, she was Vice President, General Counsel and Secretary at Musicland Group, Inc. From 1993 to 1995, she was Senior Legal Counsel at Medtronic, Inc. Prior to that, she was a partner at Faegre & Benson LLP (predecessor to Faegre Baker Daniels LLP), a Minneapolis law firm, which she joined in 1976.
Richard H. Zay, Senior Vice President, The Americas
Richard H. Zay (46) joined the Company in June 2010 as Vice President, Global Marketing. He was named Senior Vice President, Global Marketing in October 2013 and Senior Vice President, The Americas in July 2014. From 2006 to June 2010, he held various positions with Whirlpool Corporation, a manufacturer of major home appliances, most recently as General Manager, KitchenAid Brand. From 1993 to 2006, he held various positions with Maytag Corporation, including Vice President, Jenn-Air Brand, Director of Marketing, Maytag Brand, and Director of Cooking Category Management.
Business Ethics Guide
We have adopted the Tennant Company Business Ethics Guide, as amended by the Board of Directors in December 2011, which applies to all of our employees, directors, consultants, agents and anyone else acting on our behalf. The Business Ethics Guide includes particular provisions applicable to our senior financial management, which includes our Chief Executive Officer, Chief Financial Officer, Controller and other employees performing similar functions. A copy of our Business Ethics Guide is available on the Investor Relations website at investors.tennantco.com, and a copy will be mailed upon request to Investor Relations, Tennant Company, P.O. Box 1452, Minneapolis, MN 55440-1452. We intend to post on our website any amendment to, or waiver from, a provision of our Business Ethics Guide that applies to our Principal Executive Officer, Principal Financial Officer, Principal Accounting Officer, Controller and other persons performing similar functions promptly following the date of such amendment or waiver. In addition, we have also posted copies of our Corporate Governance Principles and the Charters for our Audit, Compensation, Governance and Executive Committees on our website.
ITEM 11 – Executive Compensation
Information required under this item is contained in the sections entitled “Director Compensation” and “Executive Compensation Information” as part of our 2017 Proxy Statement and is incorporated herein by reference.
ITEM 12 – Security Ownership of Certain Beneficial Owners and Management and Related Shareholder Matters
Information required under this item is contained in the sections entitled “Equity Compensation Plan Information” and “Security Ownership of Certain Beneficial Owners and Management” as part of our 2017 Proxy Statement and is incorporated herein by reference.
ITEM 13 – Certain Relationships and Related Transactions, and Director Independence
Information required under this item is contained in the sections entitled “Director Independence” and “Related Person Transaction Approval Policy” as part of our 2017 Proxy Statement and is incorporated herein by reference.
ITEM 14 – Principal Accountant Fees and Services
Information required under this item is contained in the section entitled “Fees Paid to Independent Registered Public Accounting Firm” as part of our 2017 Proxy Statement and is incorporated herein by reference.
55
PART IV
ITEM 15 – Exhibits and Financial Statement Schedules
A. | The following documents are filed as a part of this report: |
1. | Financial Statements |
Consolidated Financial Statements filed as part of this report are contained in Item 8 of this annual report on Form 10-K.
2. | Financial Statement Schedule |
Schedule II - Valuation and Qualifying Accounts
(In thousands) | 2016 | 2015 | 2014 | ||||||||
Allowance for Doubtful Accounts and Returns: | |||||||||||
Balance at beginning of year | $ | 3,615 | $ | 3,936 | $ | 4,526 | |||||
Charged to costs and expenses | 561 | 1,087 | 999 | ||||||||
Reclassification (1) | — | 172 | — | ||||||||
Charged to other accounts (2) | (19 | ) | (159 | ) | (319 | ) | |||||
Deductions (3) | (1,049 | ) | (1,421 | ) | (1,270 | ) | |||||
Balance at end of year | $ | 3,108 | $ | 3,615 | $ | 3,936 | |||||
Inventory Reserves: | |||||||||||
Balance at beginning of year | $ | 3,540 | $ | 3,272 | $ | 3,250 | |||||
Charged to costs and expenses | 1,455 | 1,728 | 622 | ||||||||
Charged to other accounts (2) | (50 | ) | (160 | ) | (194 | ) | |||||
Deductions (4) | (1,301 | ) | (1,300 | ) | (406 | ) | |||||
Balance at end of year | $ | 3,644 | $ | 3,540 | $ | 3,272 | |||||
Valuation Allowance for Deferred Tax Assets: | |||||||||||
Balance at beginning of year | $ | 5,884 | $ | 5,699 | $ | 7,243 | |||||
Charged to costs and expenses | 1,295 | 734 | (636 | ) | |||||||
Charged to other accounts (2) | (314 | ) | (549 | ) | (908 | ) | |||||
Balance at end of year | $ | 6,865 | $ | 5,884 | $ | 5,699 | |||||
(1) | Includes amount reclassified from Other Current Liabilities to Allowance for Doubtful Accounts to properly classify a customer's open receivables balance. |
(2) | Primarily includes impact from foreign currency fluctuations. |
(3) | Includes accounts determined to be uncollectible and charged against reserves, net of collections on accounts previously charged against reserves. |
(4) | Includes inventory identified as excess, slow moving or obsolete and charged against reserves. |
All other schedules are omitted because they are not applicable or the required information is shown in the Consolidated Financial Statements or notes thereto.
56
3. | Exhibits |
Item # | Description | Method of Filing | ||
3i | Restated Articles of Incorporation | Incorporated by reference to Exhibit 3i to the Company’s Form 10-Q for the quarter ended June 30, 2006. | ||
3ii | Amended and Restated By-Laws | Incorporated by reference to Exhibit 3iii to the Company’s Current Report on Form 8-K dated December 14, 2010. | ||
10.1 | Tennant Company Executive Nonqualified Deferred Compensation Plan, as restated effective January 1, 2009, as amended* | Incorporated by reference to Exhibit 10.1 to the Company’s Form 10-Q for the quarter ended September 30, 2012. | ||
10.2 | Form of Amended and Restated Management Agreement and Executive Employment Agreement* | Incorporated by reference to Exhibit 10.3 to the Company's Form 10-K for the year ended December 31, 2011. | ||
10.3 | Schedule of parties to Management and Executive Employment Agreement | Incorporated by reference to Exhibit 10.3 to the Company's Form 10-K for the year ended December 31, 2015. | ||
10.4 | Tennant Company Non-Employee Director Stock Option Plan (as amended and restated effective May 6, 2004)* | Incorporated by reference to Exhibit 10.6 to the Company’s Form 10-Q for the quarter ended June 30, 2004. | ||
10.5 | Tennant Company Amended and Restated 1999 Stock Incentive Plan* | Incorporated by reference to Appendix A to the Company’s Proxy Statement for the 2006 Annual Meeting of Shareholders filed on March 15, 2006. | ||
10.6 | Tennant Company 2007 Stock Incentive Plan* | Incorporated by reference to Appendix A to the Company’s Proxy Statement for the 2007 Annual Meeting of Shareholders filed on March 15, 2007. | ||
10.7 | Amended and Restated Credit Agreement dated as of June 30, 2015 | Incorporated by reference to Exhibit 10.1 to the Company's Current Report on Form 8-K filed on July 7, 2015. | ||
10.8 | Deferred Stock Unit Agreement (awards in and after 2008)* | Deferred Stock Unit Agreement (awards in and after 2008)* | ||
10.9 | Tennant Company 2014 Short-Term Incentive Plan* | Incorporated by reference to Appendix B to the Company's Proxy Statement for the 2013 Annual Meeting of Shareholders filed on March 11, 2013. | ||
10.10 | Private Shelf Agreement dated as of July 29, 2009 | Incorporated by reference to Exhibit 10.1 to the Company's Current Report on Form 8-K filed on July 30, 2009. | ||
10.11 | Amendment No. 1 to Private Shelf Agreement dated as of May 5, 2011 | Incorporated by reference to Exhibit 10.2 to the Company's Form 10-Q for the quarter ended June 30, 2011. | ||
10.12 | Amendment No. 2 to Private Shelf Agreement dated as of July 24, 2012 | Incorporated by reference to Exhibit 10.1 to the Company's Current Report on Form 8-K filed on July 26, 2012. | ||
10.13 | Amendment No. 3 to Private Shelf Agreement dated as of June 30, 2015 | Incorporated by reference to Exhibit 10.2 to the Company's Current Report on Form 8-K filed on July 7, 2015. | ||
10.14 | Amended and Restated 2010 Stock Incentive Plan, as Amended* | Incorporated by reference to Appendix A to the Company's Proxy Statement for the 2013 Annual Meeting of Shareholders filed on March 11, 2013. | ||
21 | Subsidiaries of the Registrant | Filed herewith electronically. | ||
23.1 | Consent of KPMG, LLP Independent Registered Public Accounting Firm | Filed herewith electronically. | ||
31.1 | Rule 13a-14(a)/15d-14(a) Certification of Chief Executive Officer | Filed herewith electronically. | ||
31.2 | Rule 13a-14(a)/15d-14(a) Certification of Chief Financial Officer | Filed herewith electronically. | ||
32.1 | Section 1350 Certification of Chief Executive Officer | Filed herewith electronically. | ||
32.2 | Section 1350 Certification of Chief Financial Officer | Filed herewith electronically. | ||
101 | The following financial information from Tennant Company’s annual report on Form 10-K for the period ended December 31, 2016, filed with the SEC on March 1, 2017, formatted in Extensible Business Reporting Language (XBRL): (i) the Consolidated Statements of Earnings for the years ended December 31, 2016, 2015 and 2014, (ii) the Consolidated Statements of Comprehensive Income for the years ended December 31, 2016, 2015 and 2014, (iii) the Consolidated Balance Sheets as of December 31, 2016 and 2015, (iv) the Consolidated Statements of Cash Flows for the years ended December 31, 2016, 2015 and 2014, (v) the Consolidated Statements of Shareholders' Equity for the years ended December 31, 2016, 2015 and 2014, and (vi) Notes to the Consolidated Financial Statements. | Filed herewith electronically. | ||
* Management contract or compensatory plan or arrangement required to be filed as an exhibit to this annual report on Form 10-K.
57
ITEM 16 – Form 10-K Summary
None.
58
SIGNATURES
Pursuant to the requirements of Section 13 or 15(d) of the Securities Exchange Act of 1934, the Registrant has duly caused this report to be signed on its behalf by the undersigned, thereunto duly authorized.
TENNANT COMPANY | ||||||
By | /s/ H. Chris Killingstad | |||||
H. Chris Killingstad | ||||||
President, CEO and | ||||||
Board of Directors | ||||||
Date | February 27, 2017 | |||||
Pursuant to the requirements of Section 13 or 15(d) of the Securities Exchange Act of 1934, this report has been signed by the following persons on behalf of the Registrant and in the capacities and on the dates indicated.
By | /s/ H. Chris Killingstad | By | /s/ Stephen G. Shank | |||
H. Chris Killingstad | Stephen G. Shank | |||||
President, CEO and | Board of Directors | |||||
Board of Directors | Date | February 27, 2017 | ||||
Date | February 27, 2017 | |||||
By | /s/ Thomas Paulson | By | /s/ Steven A. Sonnenberg | |||
Thomas Paulson | Steven A. Sonnenberg | |||||
Senior Vice President and Chief Financial Officer | Board of Directors | |||||
(Principal Financial and Accounting Officer) | Date | February 27, 2017 | ||||
Date | February 27, 2017 | |||||
By | /s/ Azita Arvani | By | /s/ David S. Wichmann | |||
Azita Arvani | David S. Wichmann | |||||
Board of Directors | Board of Directors | |||||
Date | February 27, 2017 | Date | February 27, 2017 | |||
By | /s/ William F. Austen | By | /s/ David Windley | |||
William F. Austen | David Windley | |||||
Board of Directors | Board of Directors | |||||
Date | February 27, 2017 | Date | February 27, 2017 | |||
By | /s/ Carol S. Eicher | |||||
Carol S. Eicher | ||||||
Board of Directors | ||||||
Date | February 27, 2017 | |||||
By | /s/ Donal L. Mulligan | |||||
Donal L. Mulligan | ||||||
Board of Directors | ||||||
Date | February 27, 2017 | |||||
59