Attached files
| file | filename |
|---|---|
| EX-32 - EX-32 - BJs RESTAURANTS INC | d280042dex32.htm |
| EX-31 - EX-31 - BJs RESTAURANTS INC | d280042dex31.htm |
| EX-23.1 - EX-23.1 - BJs RESTAURANTS INC | d280042dex231.htm |
| EX-21 - EX-21 - BJs RESTAURANTS INC | d280042dex21.htm |
| EX-10.23 - EX-10.23 - BJs RESTAURANTS INC | d280042dex1023.htm |
Table of Contents
UNITED STATES
SECURITIES AND EXCHANGE COMMISSION
Washington, D.C. 20549
FORM 10-K
(Mark one)
| ☒ | ANNUAL REPORT PURSUANT TO SECTION 13 OR 15(d) OF THE SECURITIES EXCHANGE ACT OF 1934 |
For the fiscal year ended January 3, 2017
OR
| ☐ | TRANSITION REPORT PURSUANT TO SECTION 13 OR 15(d) OF THE SECURITIES EXCHANGE ACT OF 1934 |
For the transition period from to
Commission file number 0-21423
BJ’S RESTAURANTS, INC.
(Exact name of registrant as specified in its charter)
| California | 33-0485615 | |
| (State or other jurisdiction of incorporation or organization) |
(I.R.S. Employer Identification Number) |
7755 Center Avenue, Suite 300
Huntington Beach, California 92647
(714) 500-2400
(Address, including zip code, and telephone number, including
area code, of registrant’s principal executive offices)
Securities registered pursuant to Section 12(b) of the Act:
| Title of Each Class | Name of each Exchange on Which Registered | |
| Common Stock, No Par Value | NASDAQ Global Select Market |
Securities registered pursuant to Section 12(g) of the Act:
None
Indicate by check mark whether the registrant is a well-known seasoned issuer, as defined in Rule 405 of the Securities Act. YES ☒ NO ☐
Indicate by check mark if the registrant is not required to file reports pursuant to Section 13 or Section 15(d) of the Act. YES ☐ NO ☒
Indicate by check mark whether the Registrant (1) has filed all reports required to be filed by Section 13 or 15(d) of the Securities Exchange Act of 1934 during the preceding 12 months (or for such shorter period that the Registrant was required to file such reports), and (2) has been subject to such filing requirements for the past 90 days. YES ☒ NO ☐
Indicate by check mark whether the registrant has submitted electronically and posted on its corporate Website, if any, every Interactive Data File required to be submitted and posted pursuant to Rule 405 of Regulation S-T (Section 232.405 of this chapter) during the preceding 12 months (or for such shorter period that the registrant was required to submit and post such files). YES ☒ NO ☐
Indicate by check mark if disclosure of delinquent filers pursuant to Item 405 of Regulation S-K is not contained herein, and will not be contained, to the best of Registrant’s knowledge, in definitive proxy or information statements incorporated by reference in Part III of this Form 10-K or any amendment to this Form 10-K. ☐
Indicate by check mark whether the registrant is a large accelerated filer, an accelerated filer, a non-accelerated filer or a smaller reporting company. See definition of “accelerated filer,” “large accelerated filer” and “smaller reporting company” in Rule 12b-2 of the Exchange Act. (Check one):
| ☒ Large accelerated filer | ☐ Accelerated filer | |
| ☐ Non-accelerated filer (do not check if smaller reporting company) | ☐ Smaller reporting company | |
Indicate by check mark whether the registrant is a shell company (as defined in Rule 12b-2 of the Act). YES ☐ NO ☒
The aggregate market value of the common stock of the Registrant (“Common Stock”) held by non-affiliates as of the last business day of the second fiscal quarter, June 28, 2016, was $942,922,138, calculated based on the closing price of our common stock as reported by the NASDAQ Global Select Market on such date.
As of February 24, 2017, 21,858,646 shares of the common stock of the Registrant were outstanding.
DOCUMENTS INCORPORATED BY REFERENCE
Certain portions of the following documents are incorporated by reference into Part III of this Form 10-K: The Registrant’s Proxy Statement for the Annual Meeting of Shareholders.
Table of Contents
Table of Contents
BJ’S RESTAURANTS, INC.
PART I
Unless the context otherwise requires, when we use the words “BJ’s,” “the Company,” “we,” “us” or “our” in this Form 10-K, we are referring to BJ’s Restaurants, Inc., a California corporation, and its subsidiaries.
Cautionary Factors That May Affect Future Results
(Cautionary Statements Under the Private Securities Litigation Reform Act of 1995)
This Form 10-K contains “forward-looking” statements and other information based on the current beliefs and assumptions of our management. Words or phrases such as “believe,” “plan,” “will likely result,” “expect,” “intend,” “will continue,” “is anticipated,” “estimate,” “project,” “may,” “could,” “would,” “should,” “target” and similar expressions in this Form 10-K are intended to identify “forward-looking” statements. These statements reflect our current assumptions and outlook with respect to BJ’s future expansion plans, key business initiatives, expected operating conditions and other factors. Moreover, we operate in a very competitive and rapidly changing environment, and new risk factors emerge from time to time. Additional risks and uncertainties that we are currently unaware of, or that we currently deem immaterial, may become important factors that affect us. It is not possible for us to predict the impact of all of these factors on our business, financial condition or results of operations or the extent to which any factor, or combination of factors, may cause actual results to differ materially from those contained in any “forward-looking” statements. Given the volatility of the operating environment and its associated risks and uncertainties, investors should not rely on “forward-looking” statements as any prediction or guarantee of actual results.
“Forward-looking” statements include, among others, statements concerning:
| • | our restaurant concept, its competitive advantages and our strategies for its continued evolution and expansion; |
| • | the rate and scope of our future restaurant development; |
| • | the total domestic capacity for our restaurants; |
| • | dates on which we will commence or complete the development and opening of new restaurants; |
| • | expectations for consumer spending on casual dining restaurant occasions; |
| • | the availability and cost of key commodities used in our restaurants and brewing operations; |
| • | menu price increases and their effect, if any, on revenue and results of operations; |
| • | the effectiveness of our planned operational, menu, marketing and capital expenditure initiatives; |
| • | capital requirement expectations and actual or available borrowings on our line of credit; |
| • | projected revenues, operating costs and expenses; and |
| • | other statements of expectations, beliefs, future plans and strategies, anticipated developments and other matters that are not historical facts. |
Some, but not all, significant factors that could prevent us from achieving our stated goals are set forth in Part I, Item 1A of this Annual Report on Form 10-K and include, but are not limited to:
| • | Failure to maintain a favorable image, credibility and the value of the BJ’s brand and our reputation for offering customers a higher quality more differentiated total dining experience at a good value could adversely affect our business. |
| • | Our inability or failure to recognize, respond to and effectively manage the accelerated impact of social media could adversely impact our business. |
| • | Any deterioration in general economic conditions may affect consumer spending and may adversely affect our revenues, operating results and liquidity. |
| • | Any deterioration in general economic conditions could also have a material adverse impact on our landlords or on businesses neighboring our locations, which could adversely affect our revenues and results of operations. |
| • | If we do not successfully expand our restaurant operations, our growth rate and results of operations will be adversely affected. |
| • | Our ability to open new restaurants on schedule in accordance with our targeted capacity growth rate may be adversely affected by delays or problems associated with securing suitable restaurant locations, leases and |
1
Table of Contents
| licenses, recruiting and training qualified managers and hourly employees and by other factors, some of which are beyond our control and difficult to forecast accurately. |
| • | Access to sources of capital and our ability to raise capital in the future may be limited, which may adversely affect our business and our expansion plans. |
| • | Any failure of our existing or new restaurants to achieve expected results may have a negative impact on our consolidated revenues and financial results, including the potential impairment of long-lived assets. |
| • | Our growth may strain our infrastructure and resources, which could slow our development of new restaurants and adversely affect our ability to manage our existing restaurants. |
| • | Any decision to either reduce or accelerate the pace of openings may positively or adversely affect our comparative financial performance. |
| • | Our future operating results may fluctuate significantly due to the expenditures required to open new restaurants. |
| • | A significant number of our restaurants are concentrated in California, Texas and Florida, which makes us particularly sensitive to economic, regulatory, weather and other risk factors and conditions that are more prevalent in those states. |
| • | Negative publicity about us, our restaurants, other restaurants, or others across the food supply chain, due to food borne illness or other reasons, whether or not accurate, could adversely affect the reputation and popularity of our restaurants and our results of operations. |
| • | Our operations are susceptible to changes in the cost of food, labor and related employee benefits (including, but not limited to, group health insurance coverage for our employees), brewing and energy which may adversely affect our profitability. |
| • | Our dependence on independent third party brewers and manufacturers for some of our beer could have an adverse effect on our operations if they cease to supply us with our proprietary craft beer. |
| • | Our internal brewing, independent third party brewing and beer distribution arrangements are subject to periodic reviews and audits by various federal, state and local governmental and regulatory agencies and could be adversely affected by different interpretations of the laws and regulations that govern such arrangements or by new laws and regulations. |
| • | Government laws and regulations affecting the operation of our restaurants, including but not limited to those that apply to the acquisition and maintenance of our brewing and retail liquor licenses, minimum wages, federal or state exemption rules, consumer health and safety, health insurance coverage, or other employment benefits such as paid time off, nutritional disclosures, and employment eligibility-related documentation requirements could increase our operating costs, cause unexpected disruptions to our operations and restrict our growth. |
| • | Our operations, including our loyalty and employee engagement programs, are heavily dependent on information technology. Any material failure of such technology, including but not limited to cyber-attacks, could adversely affect our revenues and impair our ability to efficiently operate our business. |
| • | Unsolicited takeover proposals, governance change proposals, proxy contests and certain proposals/actions by activist investors may create additional risks and uncertainties with respect to the Company’s financial position, operations, strategies and management, and may adversely affect our ability to attract and retain key employees. Any perceived uncertainties may affect the market price and volatility of our securities. |
| • | Any suspension of, or failure to repurchase the Company’s stock up to the maximum amounts permitted under, our previously announced repurchase program may negatively impact investor perceptions of us and could therefore affect the market price and volatility of our stock. |
These cautionary statements are to be used as a reference in connection with any “forward-looking” statements. The factors, risks and uncertainties identified in these cautionary statements are in addition to those contained in any other cautionary statements, written or oral, which may be made or otherwise addressed in connection with a “forward-looking” statement or contained in any of our filings with the U.S. Securities and Exchange Commission (“SEC”). Because of these factors, risks and uncertainties we caution against placing undue reliance on “forward-looking” statements.
The risks described in this Form 10-K are not the only risks we face. New risks and uncertainties arise from time to time, and we cannot predict those events or how they may affect us. There may be other risks and uncertainties that are not currently known by us or that are currently deemed by us to be immaterial. However, they may ultimately have a material adverse effect on our business, financial condition and/or operating results. Although we believe that the
2
Table of Contents
assumptions underlying “forward-looking” statements are reasonable on the dates they are made, any of the assumptions could be incorrect, and there can be no guarantee or assurance that “forward-looking” statements will ultimately prove to be accurate. We do not have any obligation to modify or revise any “forward-looking” statement to take into account or otherwise reflect subsequent events or circumstances arising after the date that the “forward-looking” statement was made. For further information regarding the risks and uncertainties that may affect our future results, please review the information set forth below under “Item 1A. Risk Factors.”
FISCAL PERIODS USED IN THIS FORM 10-K
Throughout this Form 10-K, our fiscal years ended January 3, 2017, December 29, 2015, December 30, 2014, December 31, 2013, and January 1, 2013, are referred to as fiscal years 2016, 2015, 2014, 2013, and 2012, respectively. Our fiscal years consist of 52 or 53 weeks and end on the Tuesday closest to December 31. All fiscal years presented in this Form 10-K, with the exception of fiscal year 2016, consisted of 52 weeks. Additionally, all quarters, with the exception of the fourth quarter in fiscal year 2016, consisted of 13 weeks. Fiscal year 2016 consisted of 53 weeks, with a 14-week fourth quarter; therefore, all financial references to fiscal year 2016 assume 53 weeks of operations, unless noted otherwise.
| ITEM 1. | BUSINESS |
GENERAL
As of February 27, 2017, we owned and operated 189 restaurants located in the 24 states of Alabama, Arizona, Arkansas, California, Colorado, Florida, Indiana, Kansas, Kentucky, Louisiana, Maryland, Nevada, New Jersey, New Mexico, New York, North Carolina, Ohio, Oklahoma, Oregon, Pennsylvania, Tennessee, Texas, Virginia and Washington. Each of our restaurants is operated either as a BJ’s Restaurant & Brewhouse®, a BJ’s Restaurant & Brewery®, a BJ’s Pizza & Grill®, or a BJ’s Grill® restaurant. Currently, the BJ’s Restaurant & Brewhouse® format represents our primary future expansion vehicle. Our proprietary craft beer is produced at several of our BJ’s Restaurant & Brewery® locations, our Temple, Texas brewpub location and by independent third party brewers using our proprietary recipes. Our BJ’s Pizza & Grill® restaurants are smaller format, full-service restaurants relative to our BJ’s Restaurant & Brewhouse® and BJ’s Restaurant & Brewery® locations and reflect the original format of the BJ’s restaurant concept that was first introduced in 1978. Our BJ’s Grill® restaurant is a slightly smaller footprint restaurant, compared to our BJ’s Restaurant & Brewhouse® format, featuring all the amenities of our Brewhouse locations.
The first BJ’s restaurant opened in 1978 in Orange County, California, featuring Chicago style deep-dish pizza with a unique California twist. Over the years we expanded the BJ’s concept from its beginnings as a small pizzeria to a full-service, high energy casual dining restaurant with a broad menu including our BJ’s award-winning, signature deep-dish pizza, our proprietary craft and other beers, as well as a large selection of appetizers, entrées, pastas, burgers and sandwiches, specialty salads and desserts, including our made to order, warm pizza cookie dessert, the Pizookie®.
In 1996, we introduced our proprietary craft beers when we opened our first BJ’s Restaurant & Brewery® in Brea, California. Today all of our restaurants feature our award-winning, proprietary craft beers, which we believe showcases the quality and care of the ingredients we use at BJ’s. Our high-quality, craft beers further differentiates BJ’s from many other restaurant concepts and complement our signature deep-dish pizza and other menu items. Our beers have earned over 150 medals at different beer festivals and events, including 34 medals at the Great American Beer Festival. We also offer as many as 30 “guest” domestic and imported craft beers on tap, in addition to a selection of bottled beers in our restaurants. Our large and unique beer offering is intended to enhance BJ’s competitive positioning as a leading retailer of beer in the casual dining segment of the restaurant industry.
We compete in the casual dining segment of the restaurant industry, which is a large, highly fragmented segment with estimated annual sales in the $100+ billion range. The casual dining segment has become a fairly mature segment of the restaurant industry. According to some industry analysts and observers, the annual rate of sales growth for the segment has been gradually decreasing as a result of increased competition from innovative quick-service and “fast casual” restaurant concepts and other food-away-from-home retailers, a leveling off of certain favorable demographic trends (the number of two wage-earner households, etc.), and a perceived over-supply of casual dining restaurants compared to demand. We believe that, in addition to these factors, the segment has suffered from low levels of innovation and a general reduction in the overall quality and differentiation of many of the larger, more mature mass market casual dining chains that collectively operate several thousand restaurants.
3
Table of Contents
In contrast to our mass market casual competitors, we believe that the BJ’s restaurant concept offers consumers a higher quality, more contemporary and approachable “casual plus” (or “premium casual” or “polished casual”) dining experience. The term “casual plus” typically refers to a competitive position that provides greater quality and differentiation when compared to the more mature, mass market casual dining concepts with average customer checks of $12.00 to $18.00, but not necessarily as extensive as the “upscale casual” concepts that typically have average customer checks in excess of $18.00. Accordingly, our primary business objective is to continue our national expansion program as a “casual plus” restaurant company and attempt to capture additional market share in the segment over time. Additionally, we continue to evolve our existing restaurant base by introducing a series of initiatives to drive profitable sales and traffic growth while continuously improving the customer dining experience.
Our Internet address is http://www.bjsrestaurants.com. Electronic copies of our Annual Report on Form 10-K, quarterly reports on Form 10-Q and current reports on Form 8-K are available, free of charge, by visiting the “Investor Relations” section of our website at http://www.bjsrestaurants.com. These reports are posted as soon as practical after they are electronically filed with the SEC. We caution that the information on our website is not part of this or any other report we file with, or furnish to, the SEC.
THE BJ’s RESTAURANT CONCEPT AND MENU
Our primary growth objective is to expand the BJ’s “casual plus” restaurant concept nationwide and to consistently deliver the BJ’s dining experience at the “BJ’s Gold Standard of Operational Excellence” level with our genuine commitment to passionately connect with every customer, on every visit, through the flawless and relentless execution of every detail during every shift – to create and keep fanatical fans of BJ’s concept and brand. We believe that by delivering upon this commitment to our customers, we will have the best opportunity to generate significant repeat business and capture additional market share in the casual dining segment of the restaurant industry. To achieve these objectives, we plan to focus on the opening of additional BJ’s Restaurant & Brewhouse® format restaurants in new and existing markets in a carefully controlled manner.
Our signature menu offering is our deep-dish pizza, which was introduced in 1978. Our unique version of deep-dish pizza is unusually light, with a crispy, flavorful, bakery-type crust. Our pizza is topped with high-quality meats, fresh vegetables and a blend of five cheeses. During 2016, total pizza sales represented approximately 13% of our total restaurant sales.
In addition to pizza, we have a broad menu featuring appetizers, specialty salads, soups, pastas, sandwiches, entrées and desserts. All of our menu items are prepared to order using high-quality ingredients. This broad menu, which we continually evolve, is an important factor in our differentiation from other casual dining competitors. Over the last several years we have continued to evolve and differentiate our menu offerings, including a “Snacks and Small Bites” menu category, featuring small plate appetizers and salads and a lower calorie and “better for you” menu category called Enlightened Entrées®. In fiscal 2016, we introduced over 20 new menu items including such customer favorites as our Spicy Peanut Chicken with Soba Noodles, Derby Cobb Salad, Piadina and Grilled Cheese sandwiches and our new Monkey Bread Pizookie. Our menu entrées generally range in price from $6.95 to $23.50. We estimate that our average per-customer check in fiscal 2016, including beverages, was approximately $14.50. Our extensive menu and moderate pricing allow us to appeal to a variety of customers and dining occasions, including everyday lunch and dinner, special occasions, and late night business.
Our large, flexible kitchens and bars allow us to adapt to changing consumer tastes and trends for food and beverages. Generally, we evaluate our menu offerings and prices two to three times a year, and we may add, delete or modify certain menu offerings at those times. Substantially all prospective menu and beverage offerings are initially evaluated by our internal menu development team and then tested in selected restaurants before any company-wide rollout.
In addition to introducing new menu items, we consistently evaluate our existing menu and our current operating procedures to improve the quality of our offerings, menu execution and customer service. We believe that reducing unnecessary complexity will improve the consistency and speed of service in our restaurants, which in return will enhance profitability and customer service and provide additional future menu capacity for innovation in our restaurants.
All of our restaurants feature our award-winning, proprietary freshly brewed (not pasteurized) craft beers, which we believe not only differentiate us from many other restaurant concepts, but also enhance our ability to provide greater
4
Table of Contents
quality and unique experiences to our customers. Approximately 8% of our total restaurant sales in fiscal 2016 consisted of our proprietary craft beers. We also offer as many as 30 “guest” domestic and imported craft beers on tap, in addition to a selection of bottled beers in the majority of our restaurants. Our broad and unique beer offerings are intended to enhance BJ’s competitive positioning as a leading retailer of craft beer in the casual dining segment of the restaurant industry. We source our beers using a combination of our internal brewing operations located at our Restaurant and Brewery locations and our brewpub locations in Texas as well as through qualified independent third party brewers. During fiscal 2016, approximately 40% of our proprietary craft beer was produced at our internal brewing operations and then distributed to our restaurants in a “hub and spoke” fashion. The remaining 60% of our proprietary craft beer was produced by other qualified independent third party brewers using our proprietary recipes. During fiscal 2016, our in-house brewing operations produced approximately 25,000 barrels of beer, and independent third party brewers produced approximately 36,000 barrels of beer. We also offer a selection of popular wines and spirits for sale in our restaurants. Alcoholic beverages, including our craft beers, represented approximately 21% of our total restaurant sales in fiscal 2016.
RESTAURANT OPERATIONS
Based on internal and publicly available data, we believe that our larger format brewhouse restaurants, on average, generate relatively high customer traffic per square foot compared to many other casual dining concepts. Therefore, we have implemented operational systems and procedures to support our desire to run our restaurants “quality fast,” particularly at peak dining periods, in order to effectively and efficiently serve every customer. The typical management team for a BJ’s restaurant consists of a General Manager, an Executive Kitchen Manager and three to five other managers depending on the sales volume of each restaurant. The General Manager is responsible for the day-to-day operations of their restaurant, including hiring, training, and the development of personnel, as well as for sales and operating profit. The Executive Kitchen Manager is responsible for managing food quality and preparation, purchasing, inventories and kitchen labor costs. All of our restaurants prepare detailed monthly operating budgets and compare their actual results to their budgets. We also measure the productivity and efficiency of our restaurant operations using a variety of qualitative and quantitative statistical indicators such as Net Promoter Scores, kitchen ticket times, actual versus theoretical food waste, items produced or sold per labor hour, controllable operating costs per customer served and other activity-based measures.
New restaurant managers are required to successfully complete an 11-week comprehensive advanced management training program dedicated to all aspects of the operation of our restaurants including both restaurateuring and restaurant business-related topics. Our restaurant management training program is directed by our Vice President of Operations Talent Development and is closely monitored by our field supervision team. We continuously review our training curriculum for our new managers and existing hourly employees and restaurant managers.
The General Manager of each restaurant reports to a Director of Operations or an Area Vice President, who reports to a Regional Vice President or a Senior Regional Vice President. Additionally, we have Directors of Kitchen Operations who oversee the food quality and safety, kitchen efficiency and consistency in our restaurants and help educate, coach and develop our kitchen managers. Our Directors of Kitchen Operations report to the Vice President of Culinary and Kitchen Innovation. Our Regional and Senior Regional Vice Presidents report to our Executive Vice President of Operations who oversees all aspects of restaurant operations including kitchen and bar operations, restaurant facility management, new restaurant openings and the roll-out of key operational initiatives.
We carefully select, train and supervise our restaurant-level employees (“employees”). Each restaurant typically employs an average of approximately 120 hourly employees, many of whom are paid at the statutory minimum wage level and work part-time. Our goal is to staff our restaurants with qualified, trained and enthusiastic employees who desire to be an integral part of BJ’s fun, premium casual atmosphere and, at the same time, have the passion, intensity, work ethic and ability to execute our concept correctly and consistently on every shift. Prior experience in the restaurant industry is only one of the qualities management looks for in our restaurant employees. Enthusiasm, motivation, dependability, integrity, and the ability to interact well and connect with our customers and correctly execute our concept are some of the key qualities of BJ’s management and employees.
In order to maintain our high standards, all new restaurant hourly employees undergo formal training from certified Employee Instructors at each restaurant. Our Employee Instructors oversee the training by position for each new hourly
5
Table of Contents
employee and are also utilized to support our new restaurant openings. Our hourly team goes through a series of in-depth interactive and automated training for their respective positions. Our future growth and success are highly dependent upon our ability to attract, develop and retain qualified restaurant management and hourly employees. We attempt to accomplish this by providing our employees with opportunities for increased responsibilities and advancement as well as performance-driven incentives based on both financial and customer satisfaction metrics. We also support our employees by offering what we believe to be competitive wages and, for eligible employees, competitive fringe benefits (including a 401(k) plan with a company match, medical insurance and dining discounts). Additionally, our General Managers, Executive Kitchen Managers, Directors of Operations and Directors of Kitchen Operations are eligible to be selected to participate in our Gold Standard Stock Ownership Program that operates under the authority of our 2005 Equity Incentive Plan (“the Plan”). This program, which is intended to be a long-term incentive program, provides for equity-based awards. Participation in the Plan requires extended service in good standing with us (generally three to five years).
Excluding our BJ’s Pizza & Grill® restaurants, our typical restaurant hours of operations are generally from 11:00 a.m. to 12:00 a.m. Sunday through Thursday and 11:00 a.m. to 1:00 a.m. Friday and Saturday. Our restaurants are typically open every day of the year except for Thanksgiving and Christmas. Most of our restaurants currently offer either in-house and/or third party delivery service. Additionally, all restaurants offer call-ahead seating, on-line ordering for customer pick-up and reservations for large parties.
RESTAURANT SITE SELECTION AND EXPANSION OBJECTIVES
Our BJ’s Restaurant & Brewhouse® format is currently expected to represent the vast majority of our planned new restaurant growth for the foreseeable future. We may also open new BJ’s Restaurant & Brewery® formats or brewpub locations (“brewing restaurants”) to maintain our beer supply throughout our organization as we open more restaurants or if on-site brewing is the only legally permissible way to offer our proprietary craft beer.
We seek to obtain high-quality, high-profile locations for our “casual plus” restaurants, which we believe have the ability to draw customers from a larger area than most “mass market” casual dining chain restaurants. The size of our restaurant trade areas vary from location to location, depending on a number of factors such as population density, retail traffic generators and geography. We believe the locations of our restaurants are critical to our long-term success. Accordingly, we devote significant time and resources to analyzing each prospective site. Since BJ’s has proven that it can be successful in a variety of locations (urban or suburban shopping areas, retail strip centers, lifestyle centers, and entertainment centers – either freestanding or in-line) and in a variety of income demographics, we can be highly selective and flexible in choosing suitable locations. In general, we currently prefer to open our restaurants at high-profile sites in mature trade areas with dense populations. Additionally, we generally target geographic regions that allow us to build multiple restaurants in those areas. This “clustering” approach provides economic benefits including lower supply and distribution costs, improved marketing efficiencies, management supervision leverage and increased brand awareness. As with most growing retail and restaurant chain operations, there can be no assurance that the transfer of sales or “cannibalization” among our locations will not inadvertently occur or become more significant in the future as we gradually increase our presence in existing markets to maximize our competitive position and financial performance in each market.
During fiscal 2016, we opened 17 new restaurants and closed our Century City, California restaurant as a result of our landlord exercising their right to terminate our lease in return for a termination fee due to the mall being remodeled and reconfigured. Overall we increased our total restaurant operating weeks by approximately 11% during the year, including the effect of the 53rd week. During fiscal 2017, we expect to open 10 new restaurants. Based on information currently available, we expect to open seven restaurants during the first half of fiscal 2017 and the remaining restaurants in the second half of the year. However, there are a number of risks associated with opening new restaurants and entering new markets, and it is difficult for us to precisely predict the timing of our new restaurant openings due to many factors that are outside of our control, including those identified under “Risk Factors” in Part I, Item 1A of this Annual Report on Form 10-K.
We have signed leases, land purchase agreements or letters of intent for all of our potential restaurant openings for fiscal 2017. We are currently negotiating additional leases and/or real estate purchases for potential future locations for fiscal 2018 and 2019. We typically enter into operating leases for our locations for periods ranging from 10 to 20 years. We obtain lease extension options in most instances. Our restaurants can either be freestanding or in-line. Our lease payment terms vary from lease to lease, but generally provide for the payment of both minimum base rent and
6
Table of Contents
contingent (percentage) rent based on restaurant sales. We are generally responsible for our proportionate share of common area maintenance (“CAM”), insurance, property tax and other occupancy-related expenses under our leases. We expend cash for leasehold improvements and furnishings, fixtures and equipment to build out our leased premises. We may also expend cash for permanent structural additions that we make to leased premises.
We may have some of the costs to open a restaurant reimbursed to us by our landlords in the form of tenant improvement allowance incentives pursuant to agreed-upon terms in our leases. These allowances usually take the form of up-front cash, full or partial credits against minimum or percentage rents otherwise payable by us, or a combination thereof. Generally, a landlord will charge us additional rent for any allowances provided to us. We typically seek tenant improvement allowances of approximately $100 per square foot; however, not every location we develop into a restaurant will have such allowances available. During fiscal 2016, we opened 17 new restaurants, of which only eight restaurants received tenant improvement allowances. For these restaurants, our average tenant improvement allowance was approximately $90 per square foot. There can be no assurance that such allowances will be available for every potential location that we seek to open a new restaurant. We may also purchase the land underlying certain restaurant locations if it becomes available. However, it is not our current strategy to own a large number of land parcels that underlie our restaurants. In many cases, we subsequently enter into sale-leaseback arrangements for land parcels that we purchase.
TARGETED NEW RESTAURANT ECONOMICS
Our current prototype is approximately 7,400 square feet with seating for as many as 225 customers with a targeted gross construction cost of approximately $4.0 million (before tenant improvement allowances, if any). Our construction costs for new restaurants may vary significantly depending on a number of factors including, but not limited to their sizes, layout (custom or prototype), type of construction labor (union or non-union), local permitting requirements, the scope of any required site work, the cost of liquor and other licenses and hook-up fees, geographical location and facility type (for example, whether the site will have the capacity to brew beer).
In selecting sites for our restaurants, an important objective is to earn a suitable rate of return on our investment. However, this return often cannot be meaningfully measured until our restaurants reach their mature levels of sales and profitability. Maturation periods vary from restaurant to restaurant, but generally range from two to five years. As a result of our new prototype, we currently target a blended 25% to 30% return on our net cash invested to build a new restaurant, and a blended 20% to 25% return on total capital invested, which includes our net cash invested and a factor for the landlord’s invested capital (based on a capitalized value of minimum rents to be paid to the landlord) for each group of new restaurants to be opened each year, measured once the restaurants reach their mature level of operations. Our targeted returns on invested capital in new restaurants may change in the future, depending upon competitive conditions in the casual dining segment, real estate market conditions, construction and operating cost trends and other factors both within and outside of our control.
The aforementioned return-on-investment targets for our restaurant operations do not include any allocation of opening costs, field supervision and corporate support expense, non-cash items such as depreciation, amortization, equity-related compensation expense, and income taxes, and do not represent a targeted return on an investment in our common stock. Additionally, the actual performance of any new restaurant location will usually differ from its originally targeted performance due to a variety of factors, many of which are outside of our control, and such differences may be material. There can be no assurance that any new restaurant opened will have similar operating results to those of established restaurants. See “Risk Factors” in Part I, Item 1A of this Annual Report on Form 10-K for a discussion of certain risks relating to the development and operation of our restaurants.
We generally target our new restaurants to achieve average annual sales at maturity of $4.5 million, and we generally target an average “four wall” estimated operating cash flow margin in the range of 18% to 20% at maturity, after all occupancy expenses. Not all new restaurants are expected to achieve our average return-on-investment targets. Some may be targeted to achieve higher returns and some may be targeted to achieve lower returns, based on factors specific to each restaurant location. These factors include, among other things, the level of overall consumer and market awareness for our brand in the location’s general trade area; the specific occupancy structure and capital expenditure requirement for the location; the availability and amount of tenant improvement allowances; and the expected operating cost structure in the trade area (i.e., minimum hourly wages, local costs for fresh commodities such as produce, etc.).
7
Table of Contents
It is common in the casual dining industry for many new locations to initially open with sales volumes well in excess of their sustainable run-rate levels. This initial “honeymoon” sales period usually results from the energy and excitement generated by restaurant openings in new or remodeled lifestyle centers or retail projects that generate unusually high consumer traffic during grand openings. During the several months following the opening of new restaurants, consumer traffic and sales volumes gradually adjust downward to their expected, more predictable and sustainable levels. In fact, it may take two to five years for a new restaurant’s sales to eventually settle at a more predictable and sustainable level. Every restaurant has its own individual opening sales pattern, and this pattern is difficult to predict.
Additionally, all of our new restaurants usually require several months or longer after opening to reach their targeted restaurant-level operating margin due to cost of sales and labor inefficiencies commonly associated with more complex casual dining restaurants. How quickly new restaurants achieve their targeted operating margin depends on many factors, including the level of consumer familiarity with our brand when we enter new markets, as well as the availability of experienced managers and employees, and the time required to negotiate and obtain favorable costs for certain fresh food items and other supplies from local suppliers. As a result, a significant number of restaurant openings in any single fiscal quarter, along with their associated opening expenses, could have a significant impact on our consolidated results of operations for that period. Therefore, our results of operations for any single fiscal quarter are not necessarily indicative of the results expected for any other fiscal quarter nor for a full fiscal year.
RESTAURANT OPENING EXPENSES
Restaurant opening expenses (also referred to as “preopening” expenses) include incremental out-of-pocket costs that are directly related to the openings of new restaurants that may not be capitalized. As a result of the more complex operational nature of our “casual plus” restaurant concept compared to that of a typical casual dining chain restaurant, the preopening process for our new restaurants is more extensive, time consuming and costly. The preopening expense for one of our restaurants usually includes costs to compensate an average of six to eight restaurant management employees prior to opening; costs to recruit and train an average of 150 hourly restaurant employees; wages, travel and lodging costs for our opening training team and other support employees; costs to practice service activities; and straight-line minimum base rent during the construction and in-restaurant training period. Preopening expenses vary from location to location depending on a number of factors, including the proximity of our existing restaurants; the amount of rent expensed during the construction and in-restaurant training periods; the size and physical layout of each location; the number of management and hourly employees required to operate each restaurant; the relative difficulty of the restaurant staffing process; the cost of travel and lodging for different metropolitan areas; the timing of the restaurant opening; and the extent of unexpected delays, if any, in obtaining necessary licenses and permits to open the restaurant. The acquisition of our necessary operating licenses and permits may also depend on our landlords obtaining their licenses and permits, as well as fully completing their construction activities for the retail projects in which our leased premises are located.
Our preopening expense for a prototypical BJ’s Restaurant & Brewhouse® location averaged approximately $0.4 million in fiscal 2016. Preopening expenses are typically higher for non-prototypical, “custom footprint” restaurants and for a restaurant’s initial entry into a new market. During fiscal 2017, we plan to open our first restaurant in the states of South Carolina and Michigan, where we expect to incur initially higher preopening costs. We usually incur the most significant portion of direct preopening costs within the two-month period immediately preceding and during the month of a restaurant’s opening. Preopening costs can fluctuate significantly from period to period, based on the number and timing of restaurant openings and the specific preopening costs incurred for each restaurant. We expense preopening costs as incurred in accordance with U.S. Generally Accepted Accounting Principles (“U.S. GAAP”).
BREWING OPERATIONS
Sales of our proprietary craft beers represented approximately 8% of our total restaurant sales during fiscal 2016. In substantially all of our restaurants we also offer a wide selection of other popular craft beers on tap. Accordingly, total sales of beer represented approximately 11% of our total restaurant sales during fiscal 2016.
Our internal brewing operations originated in 1996 with the opening of the first large format BJ’s Restaurant & Brewery® location in Brea, California, which included our first on-site brewing operation. The Brea BJ’s Restaurant & Brewery® serviced not only that restaurant, but also several other California restaurants, using a “hub and spoke”
8
Table of Contents
production and distribution model that is legally permitted in California with certain limitations and restrictions. To supplement our internal brewing operations and as a result of the constraints imposed by various state “tied-house” laws, which regulate how alcoholic beverages are manufactured, distributed and marketed, we also utilize qualified independent third party brewers to produce our beer, using our proprietary recipes. In fiscal 2016, our four BJ’s Restaurant & Brewery® locations and two brewpub locations produced approximately 25,000 barrels of BJ’s branded beer, and independent third party brewers produced approximately 36,000 barrels of BJ’s branded beer. Our brewing operations are typically staffed with a head brewer and an assistant brewer, who report to a brewing director. Production planning and quality control are monitored by our corporate brewing operations department which is led by our Senior Vice President of Brewing Operations. Additionally, our on-site and independent third party brewing operations periodically send out samples of each batch of BJ’s branded beer to an independent laboratory for quality control testing purposes.
As we continue to expand the BJ’s restaurant concept, our requirement to produce our proprietary craft beer will continue to grow. As a result of that growth, we will continue to evaluate the benefits and risks associated with brewing our beer internally and using qualified independent third party brewers, including factors such as availability of adequate production capacity, quality control procedures, federal and state laws, consistency of corporate and brand strategy, and the operating and capital costs associated with independent third party brewing versus the costs of brewing operations ownership. We currently believe that a combination of internal brewing and larger-scale independent third party brewing represents the optimal production method for our craft beers as we continue the expansion of our restaurants nationally. This approach allows us to get the benefits provided by brewing beer in larger batches, yet also provides us the flexibility to allow our brewing operations to focus on specialty, seasonal and research and development beers. We estimate our total proprietary craft beer requirement to be approximately 71,000 barrels for fiscal 2017, with approximately 56% of that requirement expected to be produced by independent third party brewers.
We also produce our proprietary non-alcoholic craft sodas that are sold in our restaurants. Our craft sodas include root beer, cream, orange and black cherry soda.
MARKETING AND ADVERTISING
We believe that the most effective method, over the long run, to protect and enhance our customer visit frequency is to spend our marketing dollars on the plate and provide better food quality, service and facilities for our customers. However, due to sluggish retail sales growth coupled with the maturation of the casual dining segment of the restaurant industry, we have been prudently increasing our marketing expenditures to improve our awareness and brand equity in the markets that we operate. Our marketing spend generally takes the form of limited television for those markets in which we have enough restaurant penetration, as well as print, radio, digital and social media programs. We also utilize our loyalty program, BJ’s Premier Rewards®, to engage with our customers and monitor their frequency and purchasing behavior.
Our marketing related expenditures were approximately 1.9%, 2.2%, and 2.3% of revenues for fiscal 2016, 2015, and 2014, respectively. We expect our marketing expenditures in 2017 to continue to be between 2% to 3% of our revenues. However, depending on the current operating conditions for casual dining restaurants, we may decide to increase or decrease our marketing expenditures beyond our current expectations.
CHARITABLE ACTIVITIES
At BJ’s we believe it is important to give back to the communities we serve and to do more good things for more people. In fiscal 2006, we started the BJ’s Restaurants Foundation (the “Foundation”), a 501(c)(3) qualified non-profit charitable organization, principally dedicated to supporting charities that benefit children’s healthcare and education, with a primary focus on the Cystic Fibrosis Foundation (“CFF”). Our Chairman of the Board of Directors and four of our current executive officers currently serve on the Foundation’s seven-person Board of Directors. Our commitment to supporting humanitarian causes is exemplified by our “Cookies for Kids” program, which supports CFF by donating a portion of our Pizookie® sales to CFF. In addition, we arrange for the collection and donation of other funds to CFF through our restaurant preopening training programs. These programs, combined with other programs administered by the Foundation resulted in the donation of $0.4 million to CFF during fiscal each of the last three fiscal years.
We also focus on supporting our local communities by providing food and other resources for many worthwhile charitable causes and events. The Foundation’s Team Action to Support Communities (“TASC Force”) program
9
Table of Contents
recognizes and rewards the volunteer efforts of our restaurant employees across the country as they help to give back to the communities in which our restaurants do business. The TASC Force program received the prestigious Restaurant Neighbor Award in the large business category for 2009 from the National Restaurant Association. The TASC Force teams have helped fulfill the wishes of special needs kids, placed flags in a national cemetery by the graves of fallen soldiers, painted over unsightly graffiti and helped clean up beaches, parks and school grounds. In addition, the TASC Force teams have hosted blood drives, worked with Special Olympics, painted houses for elderly citizens, supported Habitat for Humanity, re-built playgrounds, worked at food banks, participated in fundraising runs and walkathons and delivered food to families in need.
INFORMATION SYSTEMS
We believe it is extremely important to provide our operators with state of the art, secure technology so that they can better serve our customers and our employees in a more productive and efficient manner. These technologies include an automated kitchen display system (“KDS”) and bar display system (“BDS”), a web-based labor scheduling and productivity analyzer system, a theoretical food cost system and an automated front desk table management system. Each of these systems is integrated into our Point of Sale (“POS”) system which is used to record sales transactions, send menu orders to our kitchen, batch and transmit credit card transactions, record employee time clock information and produce a variety of management reports. Our KDS is an automated routing and cooking station balancing system which improves cooking station productivity, synchronizes order completion, provides valuable ticket time and cooking time data, and allows for more efficient levels of labor without sacrificing quality. Our BDS is an automated routing and beverage station balancing system which improves beverage station productivity by further leveraging our automation capability. Additionally, our web-based labor scheduling and productivity analyzer automates the labor scheduling for the managers and employees and produces a number of real-time key performance indicators and productivity reports for our management team, including controls and alerts to assist in complying with federal, state and local labor laws. Our theoretical food cost system and automated food prep system allow us to better measure product yields in our kitchens and help reduce kitchen errors and eliminate excessive waste. Our automated front desk table management system helps us to better optimize the overall seating efficiencies and “table turns” in our restaurants. We also utilize a centralized accounting and human resources system that collects data from our restaurants in order to produce operational and scorecard reporting as well as a data center technology services with cloud based technologies to provide scalability and bursting capabilities which support growth and enable rapid technology deployments. Our electronic human resources workflow solution streamlines and expedites the process of onboarding new team members, while insuring accuracy and facilitating the collection of richer data. Our tablet-based inventory technology streamlines our inventory counting process while insuring accuracy. Our BJ’s mobile application, which allows our customers to use their smartphones to order ahead, add their name to our waitlist, pay at the table and manage their loyalty account, among other things, has been well received by our customers. We will continue to develop restaurant and support technologies that help improve the customer experience, employee effectiveness, financial management and cost control. As part of this continued development we have been testing hand held point of sales systems and pay at the table devices. All new technology is thoroughly tested before any company-wide rollout is implemented.
SUPPLY CHAIN MANAGEMENT
Our supply chain department, working together with our culinary research and development team, is responsible for the selection and procurement of all of the food ingredients, beverages, products and supplies for our restaurants and brewing operations. Additionally, the supply chain department manages procurement agreements in the areas of energy, transportation and general corporate services. We seek to obtain the highest quality menu ingredients, products and supplies from reliable, approved sources at competitive prices. Ingredient specifications are mandated by the supply chain department in order to consistently maintain the highest quality ingredients and operational materials. We continually research and evaluate various food ingredients, products and supplies for consistency and quality and compare them to our detailed specifications. In order to maximize operating efficiencies between purchase and usage, each restaurant’s Executive Kitchen Manager determines daily usage requirements for food ingredients, products and supplies for their restaurant and places all orders with vendors approved by our supply chain department. Our Executive Kitchen Managers also inspect our deliveries to ensure that the items received meet our quality specifications and negotiated prices. For many of our menu ingredients, we have arranged for acceptable alternative manufacturers, vendors, growers and shippers in order to reduce risk in our supply chain.
10
Table of Contents
Where economically feasible and possible, we attempt to negotiate contracts for key commodities used in the preparation of our food and beverage offerings, based on our expected requirements for each fiscal year. If our attempts are successful, most of our contracts typically range in duration from three to twelve months, and are generally set to expire at the end of calendar quarters (if less than a year in duration) or at the end of our fiscal year (if annual in duration). We attempt to contract for the majority of our more significant commodities (chicken, beef and wheat-based products) for various periods of time with the objective of stabilizing our costs and ensuring product availability. However, there is no assurance that we will be able to continue to do so in light of the continuing volatility in the supplies and costs for many food commodities. Although we currently do not directly engage in future contracts or other financial risk management strategies with respect to potential commodity cost fluctuations, from time to time we may opportunistically request that our suppliers consider doing so to help minimize the impact of potential cost fluctuations. Suppliers will typically pass the cost of such strategies along to us, either directly or indirectly.
We use Distribution Market Advantage (“DMA”), a consortium of large, regional food distributors located throughout the United States to deliver the majority of our food products to our restaurants. Our agreement with DMA is for five years expiring June 2017. We are currently in the final stages of renewing our existing agreement with DMA to extend our program an additional five years so as to expire in June 2022. Jacmar Foodservice Distribution is a member of DMA and is the primary distributor of food and operating supplies for our California and Nevada restaurants. See Note 11 of Notes to Consolidated Financial Statements in Part IV, Item 15 of this Annual Report on Form 10-K for related party transactions. We have a non-exclusive contract with DMA on terms and conditions that we believe are consistent with those made available to similarly situated restaurant companies.
Additionally, in 2006 we entered into an agreement with the largest nationwide foodservice distributor of fresh produce in the United States to service most of our restaurants and, where licensed, to distribute our proprietary craft beer to our restaurants. This distributor currently delivers our proprietary craft beer to approximately 50% of our restaurants. If our relationship with this distributor were discontinued, we would pursue alternative distributors. However, it may take some time to enter into replacement distribution arrangements, and our costs for distribution may increase as a result.
The overall cost environment for food commodities can be extremely volatile due to domestic and worldwide agricultural, supply/demand and other macroeconomic factors that are outside of our control. Additionally, the availability and prices of food commodities can also be influenced by increased energy prices, animal-related diseases, natural disasters, increased geo-political tensions, the relationship of the dollar to other currencies, consumer demand both domestically and worldwide, and other factors. Virtually all commodities purchased and used in the restaurant industry, including proteins, grains, oils, dairy products, and energy have varying amounts of inherent price volatility associated with them. Additionally, during periods of rising costs for diesel fuel, our major distributors have the ability under our agreements to pass along fuel surcharges to us that are triggered when their cost per gallon of diesel fuel exceeds a certain level. While we attempt to manage these factors by offering a diversified menu and by attempting to contract for our key commodities for extended periods of time whenever feasible and possible, there can be no assurance that we will be successful in this respect due to the many factors that are outside of our control.
COMPETITION
The domestic restaurant industry is highly competitive and generally considered to be mature. There are a substantial number of casual dining chain restaurants, as well as fast casual and quick service restaurant chains and other food and beverage service operations, that compete both directly and indirectly with us in every respect, including food quality and service, the price-value relationship, beer quality and selection, atmosphere, suitable sites for new restaurants and for qualified personnel to operate our restaurants, among other factors. We also compete within each of our trade areas with national and regional restaurant chains and locally-owned restaurants. We also face growing competition as a result of the trend toward convergence in grocery, deli and restaurant services, particularly in the supermarket industry which offers “convenient meals” in the form of improved entrées and side dishes.
Our restaurant concept is a relatively small “varied menu” casual dining competitor when compared to the mature “mass market” chains, with 63 of our restaurants currently located in one state – California. Our overall brand awareness and competitive presence in states outside of California is not as significant as that of our major casual dining chain competitors. Many competitors with similar concepts to ours have been in business longer than we have, have greater consumer awareness, and often have substantially greater capital, marketing and human resources.
11
Table of Contents
Accordingly, we must be prepared to constantly evolve and refine the critical elements of our restaurant concept over time to protect our longer-term competitiveness. Additionally, due to the continuing difficult operating environment for casual dining restaurants, coupled with continuing pressure on consumer spending for restaurant occasions, we expect that our larger chain restaurant competitors will continue to allocate even more resources to their national media advertising and discounting programs in order to protect their respective market shares, which could have an adverse effect on our sales and results of operations.
The restaurant industry can be significantly affected by changes in consumer tastes and nutritional concerns, national, regional or local economic conditions, demographic trends, traffic patterns, weather, and the type and number of competing restaurants. Changes in these factors could adversely affect us. In addition, other factors such as increased food, beverage, labor, energy and other operating costs could adversely affect us. We believe, however, that our ability to offer higher quality food and beverages at moderate prices with superior service in a distinctive dining environment provides us with the opportunity to capture additional market share in the casual dining segment.
FOOD QUALITY AND SAFETY
Our revenues can be substantially affected by adverse publicity resulting from food quality, illness, or health concerns stemming from incidents occurring at a single restaurant of ours as well as incidents that may occur at our competitors’ restaurants. In addition, our revenues can be affected by illness or health concerns stemming from incidents occurring at our suppliers or competing suppliers. While we believe that our internal policies and procedures for food safety and sanitation are thorough, the risk of food-borne illness cannot be completely eliminated, and incidents at other restaurant chains or in the food supply chain may affect our restaurants even if our restaurants are not implicated in a food safety concern. We attempt to manage risks of this nature through food safety controls throughout our supply chain and internal training programs, but the occurrence of any one of these factors in any one of our restaurants or elsewhere within the foodservice industry could cause our entire Company to be adversely affected.
RELATED PARTY TRANSACTIONS
The Jacmar Companies and their affiliates (collectively referred to herein as “Jacmar”) is one of our shareholders and James Dal Pozzo, the Chief Executive Officer of Jacmar, is a member of our Board of Directors. Jacmar, through its affiliation with DMA, is currently our largest supplier of food, beverage, paper products and supplies. We began using DMA for our national foodservice distribution in July 2006. In July 2012, we finalized a new five-year agreement with DMA, after conducting another extensive competitive bidding process. Jacmar services our restaurants in California and Nevada, while other DMA distributors service our restaurants in all other states. Under the terms of our agreement with DMA, Jacmar is required to sell products to us at the same prices as the other DMA distributors. Jacmar does not provide us with any produce, liquor, wine or beer products, all of which are provided by other third party vendors and are included in “Cost of sales” on the Consolidated Statements of Income. See Note 11 of Notes to Consolidated Financial Statements in Part IV, Item 15 of this Annual Report on Form 10-K for more information on related party transactions.
GOVERNMENT REGULATIONS
We are subject to various federal, state and local laws, rules and regulations that affect our business. Each of our restaurants is subject to licensing and regulation by a number of governmental authorities, which may include alcoholic beverage control, labor/equal employment, building, land use, health, safety and fire agencies, and environmental regulations in the state or municipality in which the restaurant is located. Difficulties obtaining or maintaining the required licenses or approvals could delay or prevent the development of a new restaurant in a particular area or could adversely affect the operation of an existing restaurant. We believe, however, that we are in compliance in all material respects with all relevant laws, rules, and regulations. We have never experienced abnormal difficulties or delays in obtaining the licenses or approvals required to open a new restaurant or in continuing the operation of an existing restaurant.
Alcoholic beverage control regulations require each of our restaurants to apply to a federal and state authority and, in certain locations, municipal authorities for a license and permit to sell alcoholic beverages on and off premises. Typically, licenses must be renewed annually and may be revoked or suspended for cause by such authority at any time. Alcoholic beverage control regulations relate to numerous aspects of the daily operations of our restaurants,
12
Table of Contents
including minimum age of patrons and employees, hours of operation, advertising, wholesale purchasing, inventory control and handling, and storage and dispensing of alcoholic beverages.
Our restaurants and brewing operations are subject to “tied house” laws and the “three tier system” of beverage alcohol distribution, which were introduced after the repeal of Prohibition by various states. These laws generally prohibit brewers from holding an interest in retail licenses and require manufacturers, distributors and retailers to remain separate “tiers”. Over the last 25 years, “brewpubs,” which are both retailers and brew beer onsite, have been authorized by law in most states through specific exceptions to these laws. These exceptions are unique to each state and do not mirror one another. However, brewpubs are generally licensed as retailers and do not have the same privileges as microbreweries, and the privileges of, and restrictions imposed on, brewpubs vary from state to state. These restrictions sometimes prevent us from operating both brewpubs and restaurants in some states. We believe that we are currently in compliance with the brewpub regulations in the states where we hold such licenses. However, there is some risk that a state’s brewpub regulations or the interpretation of these regulations may change in a way that could impact our current model of brewing beer and/or supplying beer to our restaurants in that state. We apply for our alcoholic beverage licenses with the advice of outside legal and licensing counsel and consultants. Even after the issuance of these licenses, our operations could be subject to differing interpretations of the “tied house” laws and the requirements of the “three tier system” of beverage alcohol distribution in any jurisdiction that we conduct business. Additionally, the failure to receive or retain, or a delay in obtaining, a liquor license in a particular location could adversely affect our ability to obtain such a license elsewhere.
We are subject to “dram-shop” statutes in California and other states in which we operate. Those statutes generally provide a person who has been injured by an intoxicated person the right to recover damages from an establishment that has wrongfully served alcoholic beverages to such person. We carry liquor liability coverage as part of our existing comprehensive general liability insurance, which we believe is consistent with coverage carried by other entities in the restaurant industry and would help protect us from exposure created by possible claims. Even though we carry liquor liability insurance, a judgment against us under a dram-shop statute in excess of our liability coverage could have a materially adverse effect on us. Regardless of whether any claims against us are valid or whether we are liable, claims may also be expensive to defend and may divert management’s time and our financial resources away from our operations. We may also be adversely affected by publicity resulting from such claims.
Various federal and state labor laws, along with rules and regulations, govern our relationship with our employees, including such matters as minimum wage, overtime, tip credits, health insurance, working conditions, safety and work eligibility requirements. Significant additional governmental mandates, such as an increased minimum wage, a change in the laws governing exempt employees, an increase in paid time off or leaves of absence, mandates on health benefits and insurance or increased tax reporting and payment requirements for employees who receive gratuities, could negatively impact our restaurants’ profitability. We are also subject to the regulations of the Immigration and Customs Enforcement (“ICE”) branch of the United States Department of Homeland Security. In addition, some states in which we operate have adopted immigration employment protection laws. Even if we operate our restaurants in strict compliance with ICE and state requirements, some of our employees may not meet federal work eligibility or residency requirements, despite our efforts and without our knowledge, which could lead to a disruption in our work force. Additionally, our suppliers may also be affected by various federal and state labor laws which could result in supply disruptions for our various goods and services or higher costs for goods and services supplied to us.
We are also subject to various laws and proposals regarding regulations relating to nutritional content, nutritional labeling, product safety and menu labeling.
We are subject to federal and state environmental regulations. Various laws concerning the handling, storage, and disposal of hazardous materials, such as cleaning solvents, and the operation of restaurants and brewpubs in environmentally sensitive locations may impact aspects of our operations. During fiscal 2016, there were no material capital expenditures for environmental control facilities.
Our facilities must comply with the applicable requirements of the Americans With Disabilities Act of 1990 (“ADA”) and related state statutes. The ADA prohibits discrimination on the basis of disability with respect to public accommodations and employment. Under the ADA and related state laws, when constructing new restaurants or undertaking significant remodeling of existing restaurants, we must make them readily accessible to disabled persons. We must also make reasonable accommodations for the employment of disabled persons.
13
Table of Contents
We have a significant number of hourly restaurant employees who receive income from gratuities. We have elected to voluntarily participate in a Tip Reporting Alternative Commitment (“TRAC”) agreement with the Internal Revenue Service. By complying with the educational and other requirements of the TRAC agreement, we reduce the likelihood of potential employer-only FICA assessments for unreported or under reported tips.
EMPLOYEES
At February 27, 2017, we employed approximately 22,000 employees at our 189 restaurants. Most of our employees in our restaurant operations provide their services on a part-time basis. We also employed approximately 220 employees at our restaurant support center and in our field supervision organization. We believe that we maintain favorable relations with our employees. Currently, no unions or collective bargaining arrangements are in place at our Company.
INSURANCE
We maintain property and casualty insurance with coverage and limits we believe are currently appropriate for our operations. We retain a substantial portion of our workers’ compensation and general liability costs through self-insured retentions and large deductibles. There is no assurance that any insurance coverage maintained by us will be adequate or that we will not experience claims in excess of our coverage limits; that we can continue to obtain and maintain such insurance at all; or that our premium costs will not rise to an extent that they will adversely affect our ability to economically obtain or maintain such insurance. While we also carry employment practices insurance, a settlement or judgment against us in excess of, or outside of, our coverage limitations could have a material adverse effect on our results of operations, liquidity, financial position and business. See “Limitations in our insurance coverage or rising insurance costs could adversely affect our business or financial condition in certain circumstances” in “Risk Factors” contained in Part I, Item 1A of this Annual Report on Form 10-K.
TRADEMARKS AND COPYRIGHTS
We believe that our trademarks, service marks and other proprietary rights have significant value and are important to our brand-building effort and the marketing of our restaurant concept. Our domestically-registered trademarks and service marks include, among others, our stylized logos displaying the name “BJ’s” for restaurant services, restaurant and bar services, on-line ordering and take-out restaurant services and the word mark “BJ’s” for restaurant and bar services, take-out and carry-out restaurant services. We have also registered with the United States Patent and Trademark Office many of our standard and seasonal beer logos and names, as well as many of our signature menu item names including “Great White” and “Sweet Pig” for our proprietary pizzas, “Pizookie” for our proprietary dessert and “Enlightened Entrees,” “Craft Matters” and “Wow, I Love This Place” for our branding. We have registered our BJ’s logo mark in a number of foreign countries. Additional domestic and foreign trademark applications are pending. We have also registered our ownership of the internet domain name “www.bjsrestaurants.com” and other internet domain names. We have in the past protected, and expect to continue to vigorously protect, our proprietary rights. We cannot predict whether steps taken by us to protect our proprietary rights will be adequate to prevent misappropriation of these rights or the use by others of restaurant features based upon, or otherwise similar to, our concept and products. There may be other restaurants, retailers and/or businesses that also use the letters “BJ’s” in some form or fashion throughout the United States and abroad. It may be difficult for us to prevent others from copying elements of our concept. Any litigation undertaken to enforce our rights will likely be costly. In addition, we may face claims of misappropriation or infringement of third parties’ trademarks, patents or other intellectual property rights. Defending these claims may be costly and, if unsuccessful, may prevent us from continuing to use certain intellectual property rights or information in the future and may result in a judgment or monetary damages.
14
Table of Contents
EXECUTIVE OFFICERS
The following table sets forth certain information concerning our executive officers and senior management as of February 27, 2017:
| Name |
Age |
Position | ||
| Gregory A. Trojan |
57 | President, Chief Executive Officer and Director | ||
| Gregory S. Levin |
49 | Executive Vice President, Chief Financial Officer and Secretary | ||
| Gregory S. Lynds |
55 | Executive Vice President and Chief Development Officer | ||
| Lon F. Ledwith |
59 | Executive Vice President of Operations | ||
| Kevin E. Mayer |
47 | Executive Vice President and Chief Marketing Officer | ||
| Jeffrey H. Fowler |
51 | Senior Vice President and Chief Supply Chain Officer | ||
| Brian S. Krakower |
46 | Senior Vice President and Chief Information Officer | ||
| Kendra D. Miller |
42 | Senior Vice President, General Counsel and Assistant Secretary | ||
| Alexander M. Puchner |
55 | Senior Vice President, Brewing Operations |
GREGORY A. TROJAN has served as our President and a member of the Company’s Board of Directors since December 2012 and as our Chief Executive Officer since February 2013. Prior to joining the Company, Mr. Trojan was employed by Guitar Center, Inc., a leading retailer of musical instrument products, where he served as President, Chief Executive Officer and Director from November 2010 to November 2012 and as President, Chief Operating Officer and Director from October 2007 to November 2010. From 1998 to 2006, Mr. Trojan served as Chief Executive Officer of House of Blues Entertainment, Inc., an operator of restaurant and music venues, concerts and media properties, having served as President from 1996 to 1998. Prior to that, he held various positions with PepsiCo from 1990 to 1996, including service as an executive officer and eventually as Chief Executive Officer of California Pizza Kitchen, Inc., when it was owned by PepsiCo. Earlier in his career, Mr. Trojan was a consultant at Bain & Company, the Wharton Small Business Development Center and Arthur Andersen & Company. Mr. Trojan served on the Board of Directors at Oakley Inc. from June 2005 to November 2007. Since March 2010, he has served as a director of Domino’s Pizza, Inc.
GREGORY S. LEVIN has served as our Chief Financial Officer since September 2005. He was promoted to Executive Vice President in October 2007 and added the post of Secretary in June 2008. From February 2004 to August 2005, Mr. Levin served as Chief Financial Officer and Secretary of SB Restaurant Company, a privately held company that operated the Elephant Bar Restaurants. From 1996 to 2004, Mr. Levin was employed by California Pizza Kitchen, Inc., operator and licensor of casual dining restaurants, with his last position as Vice President, Chief Financial Officer and Secretary. Earlier in his career, he served as an audit manager with Ernst & Young LLP.
GREGORY S. LYNDS has served as our Chief Development Officer since July 2003 and was promoted to Executive Vice President in October 2007. Prior to joining the Company, Mr. Lynds served as a Director of Real Estate for Darden Restaurants, Inc., the largest casual dining company in America. Prior to joining Darden, Mr. Lynds served as Vice President of Real Estate and Development for Wilshire Restaurant Group (Marie Callender’s and East Side Mario’s) and was a partner responsible for expanding the Mimi’s Café brand.
LON F. LEDWITH has served as our Executive Vice President of Operations since April 2015. Prior to this responsibility, he served as our Senior Vice President of Operations Talent Development from January 2010 to March 2015, as our Senior Vice President of Restaurant Operations from April 2006 to December 2009, and as Vice President of Operations from February 2004 to March 2006. From July 1981 to November 2003, Mr. Ledwith was employed by Brinker International, Inc., with his last position as a Regional Vice President of the Chili’s Grill & Bar concept.
KEVIN E. MAYER has served as our Executive Vice President and Chief Marketing Officer since July 2014. Prior to joining the Company, Mr. Mayer was employed by Volkswagen of America, the U.S. subsidiary of the second largest global auto brand, Volkswagen AG, where he served as Vice President of Marketing from June 2012 to December 2013. From October 2010 to June 2012, Mr. Mayer was employed by General Motors and served as their Director of Global Advertising and Promotions for Chevrolet. Prior to that, Mr. Mayer served as the Director of Marketing Communications for Subaru of America from March 2007 to October 2010. Early in his career, Mr. Mayer served in a variety of agency and client-side leadership roles such as Grey Advertising.
15
Table of Contents
JEFFREY H. FOWLER has served as our Senior Vice President and Chief Supply Chain Officer since November 2016. Prior to joining the Company, Mr. Fowler served as Vice President of Operations and Supply Chain Management for Lands O’ Lakes from 2011 to 2015. Prior to that, Mr. Fowler was employed by Foster Dairy Farms/Crystal Creamery where he served as Vice President of Operations and Transportation from 2008 to 2011. From 2005 to 2008, Mr. Fowler was employed by Campbell’s Soup and served as their Director of Operations and Director of Supply Chain Strategy. Earlier in his career he served in various management roles for HP Hood LLC and Safeway Stores in their Supply divisions.
BRIAN S. KRAKOWER has served as our Senior Vice President and Chief Information Officer since February 2013. Prior to joining the Company, Mr. Krakower served as Chief Technology Officer for Restaurant Revolution Technologies, a restaurant order management technology solutions company. From 2007 to 2012, Mr. Krakower was employed by California Pizza Kitchen, Inc., operator and licensor of casual dining restaurants, with his last position as Vice President of Information Technology. From 2003 to 2007, Mr. Krakower served as Senior Director of Information Technology – Corporate Systems for The Cheesecake Factory Incorporated, a publicly held operator of upscale casual dining restaurants. Prior to that, Mr. Krakower was employed by House of Blues Entertainment, Inc., an operator of restaurant and music venues, concerts and media properties, where he served as its Senior Director of Information Systems & Technology from 1997 to 2003.
KENDRA D. MILLER has served as our Senior Vice President, General Counsel and Assistant Secretary since March 2011. From August 2008 to February 2011, Ms. Miller practiced law as a partner at the international law firm of Crowell & Moring LLP in Irvine, California. From January 2001 to August 2008, she was employed by Carlton, DiSante & Freudenberger LLP, where she became a partner in January 2008. From September 1999 to December 2000, she practiced law at Paul, Hastings, Janofsky & Walker LLP in Los Angeles, California. In her private practice, she litigated on behalf of and counseled numerous restaurant chains on employment law and business matters.
ALEXANDER M. PUCHNER has served as our Senior Vice President of Brewing Operations since 1996. From 1993 to 1995, Mr. Puchner was a founder and brewmaster for a number of southern California-based breweries, including Laguna Beach Brewing Co., Huntington Beach Beer Co., Newport Beach Brewing Co. and Westwood Brewing Co. From 1988 to 1993, Mr. Puchner served as a product manager for Aviva Sports/Mattel Inc. and as a marketing research manager for Mattel Inc. Mr. Puchner has been a nationally certified beer judge since 1990.
The risk factors presented below may affect our future operating results, financial position and cash flows. The risks described in this Item 1A and other sections of this Annual Report on Form 10-K are not exhaustive and are not the only risks we may ever face in our business. We operate in a very competitive and rapidly changing environment. New risks and uncertainties arise from time to time, and we cannot predict those events or how they may affect us. There may be other risks and uncertainties that are not currently known or that are currently deemed by us to be immaterial. However, they may ultimately adversely affect our business, financial condition and/or operating results. In addition to the risk factors presented below, changes in general economic conditions, credit markets, consumer tastes, discretionary spending patterns, demographic trends, and consumer confidence in the economy, all of which affect consumer behavior and spending for restaurant dining occasions, may have a material impact on us.
Failure to maintain a favorable image, credibility and the value of the BJ’s brand and our reputation for offering customers a higher quality more differentiated total dining experience at a good value could adversely affect our business.
The successful operation of the BJ’s restaurant concept and the execution of our national expansion plan are highly dependent upon BJ’s ability to remain relevant to consumers and a brand they trust. We believe that we have built a strong reputation for quality and our differentiated BJ’s menu and beverage offerings are integral components of the total dining experience that customers enjoy in our restaurants. We believe that we must continue to protect, enhance and evolve the BJ’s brand to continue to be successful in the future. Any incident that erodes consumer trust in or affinity for the BJ’s brand could significantly reduce its value. If consumers perceive or experience any reduction in our food or beverage quality, service or facility ambiance, or in any way believe we failed to deliver a consistently positive dining experience, the value of the BJ’s brand and our entire Company could be impaired. We may also need to evolve
16
Table of Contents
the BJ’s restaurant concept in order to compete with popular new restaurant formats or concepts that emerge from time to time, and we cannot provide any assurance that we will be successful in doing so, or that any changes we make to our concept in response will be successful or not adversely affect our profitability. In addition, with the increasing prevalence of food-away-from-home at fast casual restaurants, single-serve operations, quick-service restaurants and certain grocery operations, combined with the continuing pressure on consumer discretionary spending for restaurant occasions, consumers may choose less expensive alternatives to BJ’s which could also negatively affect customer traffic at our restaurants.
In addition, our ability to successfully develop new restaurants in new markets may be adversely affected by a lack of awareness or acceptance of our brand in these new markets. To the extent that we are unable to foster name recognition and affinity for our brand in new markets, our new restaurants may not perform as expected and our growth may be significantly delayed or impaired.
Our inability or failure to recognize, respond to and effectively manage the accelerated impact of social media may materially adversely impact our business.
There has been a significant increase in the use of social media and similar platforms, including weblogs (blogs), social media websites and other forms of Internet-based communications which allow individuals’ access to a broad audience of consumers and other interested persons. Consumers value readily available information concerning goods and services that they have or plan to purchase, and may act on such information without further investigation or authentication. The availability of information on social media platforms is virtually immediate as is its impact. Many social media platforms immediately publish the content their subscribers and participants post, often without filters or checks on accuracy of the content posted. The opportunity for dissemination of information, including inaccurate information, is seemingly limitless and readily available. Information concerning our Company may be posted on such platforms at any time. Information posted may be adverse to our interests or may be inaccurate, each of which may harm our performance, prospects or business. The harm may be immediate without affording us an opportunity for redress or correction. Such platforms also could be used for dissemination of trade secret information, compromising valuable company assets. In summary, the dissemination of information online could harm our business, prospects, financial condition and results of operations, regardless of the information’s accuracy. The inappropriate use of social media vehicles by our customers or employees could increase our costs, lead to litigation or result in negative publicity that could damage our reputation.
As part of our marketing efforts, we rely on search engine marketing and social media platforms such as Facebook®, Twitter® and Google+™ to attract and retain customers. We also are initiating a multi-year effort to implement new technology platforms that should allow us to improve our level of digital engagement with our customers and employees and thereby help strengthen our marketing and related consumer analytics capabilities. These initiatives may not prove to be successful and may result in expenses incurred without the benefit of higher revenues or increased engagement. Our brand could also be confused with brands that have similar names, including but not limited to brands such as BJ’s Wholesale Club and other unaffiliated restaurants that use “BJ’s” in their names. As a result, our brand value may be adversely affected by any negative publicity related to others that use “BJ’s” in their brand names. We have registered certain trademarks and service marks in the United States and foreign jurisdictions. However, we are aware of names and marks identical or similar to our service marks being used from time to time by other persons. Although our policy is to oppose any such infringement, further or unknown unauthorized uses or other misappropriation of our trademarks or service marks could diminish the value of our brands and adversely affect our business.
Any deterioration in general economic conditions may affect consumer spending and may adversely affect our revenues, operating results and liquidity.
Any decrease in customer traffic or the average expenditure per customer will negatively impact our financial results, since reduced sales result in the deleveraging of the fixed and semi-fixed costs in our operations and thereby cause downward pressure on our operating profits and margins. There is also a risk that if negative economic conditions persist for a long period of time or worsen, consumers may make long-lasting changes to their discretionary purchasing behavior, including less frequent discretionary purchases on a more permanent basis.
17
Table of Contents
The above factors could also impose practical limits on our menu price increases. From time to time, we may announce that we intend to take price increases on selected menu items in order to offset increased operating expenses. However, we cannot provide assurance that menu price increases will not deter customers from visiting our restaurants, reduce the frequency of their visits or affect their purchasing decisions.
Any deterioration in general economic conditions could have a material adverse impact on our landlords or on businesses neighboring our locations, which may adversely affect our revenues and results of operations.
Any deterioration in general economic conditions could result in our landlords being unable to obtain financing or remain in good standing under their existing financing arrangements which could result in their failure to satisfy obligations to us under leases, including failures to fund or reimburse agreed-upon tenant improvement allowances. Any such failure could adversely impact our operations.
In addition, if our landlords are unable to obtain sufficient credit to continue to properly manage their retail centers, we may experience a drop in the level of quality of such centers where we operate restaurants. Our future development of new restaurants may also be adversely affected by the negative financial situation of developers and potential landlords. Landlords may try to delay or cancel recent development projects (as well as renovations of existing projects) which could reduce the number of appropriate locations available that we would consider for our new restaurants. Furthermore, the failure of landlords to obtain licenses or permits for development projects on a timely basis, which is beyond our control, may negatively impact our ability to implement our development plan.
Our restaurants are generally located in retail developments with nationally recognized co-tenants, which help increase overall customer traffic into those retail developments. Some of our co-tenants have ceased or may cease operations in the future or have deferred openings or fail to open in a retail development after committing to do so. These failures may lead to reduced customer traffic and a general deterioration in the surrounding retail centers in which our restaurants are located and may contribute to lower customer traffic at our restaurants. If these retail developments experience high vacancy rates, we could experience decreases in customer traffic. A decrease in customer traffic may adversely affect our results of operations.
Changes in consumer buying patterns, particularly e-commerce sites, may affect our revenues, operating results and liquidity.
Our restaurants are primarily located near high consumer activity areas such as regional malls, lifestyle centers, “big box” shopping centers and entertainment centers. We depend in large part on a high volume of visitors to these centers to attract customers to our restaurants. E-Commerce or online shopping continues to increase and negatively impact consumer traffic at traditional “brick and mortar” retail sites located in regional malls, lifestyle centers, “big box” shopping centers and entertainment centers. A decline in development or in visitors to these centers near our restaurants may negatively affect our sales.
If we do not successfully expand our restaurant operations, our growth rate and results of operations will be adversely affected.
A critical factor in our future success is our ability to expand our restaurant operations successfully, which will depend in large part on our ability to open new restaurants in a profitable manner. We anticipate that our new restaurants will generally take several months or even longer to reach targeted productivity levels due to the inefficiencies typically associated with new restaurants, including lack of initial market and consumer awareness, the need to hire and train sufficient management and restaurant personnel and other factors. The opening of new restaurants can also have either an expected or an unintended effect on the sales levels at existing restaurants. We cannot guarantee that any restaurant we open will obtain operating results similar to those of our existing restaurants. If we are unable to open and operate new restaurants successfully, our growth rate and our results of operations will be adversely affected. Our expansion plans may also be impacted by the delay or cancellation of potential new sites by developers and landlords, which may become more common as a result of economic deterioration or tightening credit markets.
We intend to open new restaurants in both established and new markets. Opening new restaurants in established markets generally provides some advantages in the form of stronger levels of initial consumer awareness, trial and usage, as well as greater leverage of certain supply chain and field supervision resources. On the other hand, there is a
18
Table of Contents
risk that a portion of the sales of existing restaurants in the market may transfer to newly opened restaurants in the same market, resulting in negative pressure on our overall comparable restaurant sales metric. While we do not generally select locations for our new restaurants where we believe that a significant sales transfer will likely occur, some unexpected sales transfer may inadvertently occur.
Some of our new restaurants are planned for new markets where we have little or no operating experience. New markets may have different competitive conditions, consumer tastes and discretionary spending patterns than our existing markets. As a result, new restaurants in those markets may be less successful than restaurants in our existing markets. Consumers in a new market may not be familiar with the BJ’s brand. We also may find it more difficult to hire, motivate and retain qualified employees in new markets. Restaurants opened in new markets may also have lower average restaurant sales than restaurants opened in our existing markets, and may have higher construction, occupancy or operating costs than restaurants in existing markets. Sales at restaurants opened in new markets may take longer to achieve margins typical of mature restaurants in existing markets or may never achieve these targeted margins thereby affecting our overall profitability. As we expand into new markets and geographic territories, our operating cost structures may not resemble our experience in existing markets. Because there will initially be fewer restaurants in a given market, our ability to optimally leverage our field supervision, marketing and supply chain resources will be limited for a period of time. Further, our overall new restaurant development and operating costs may increase due to more lengthy geographic distances between restaurants resulting in higher purchasing, preopening, labor, transportation and supervision costs. The performance of restaurants in new markets will often be less predictable.
As part of our ongoing restaurant expansion and growth strategy, we may consider the internal development or acquisition of additional restaurant concepts in the future. We may not be able to internally develop or acquire additional concepts that are as profitable as our existing restaurants. Additionally, growth through acquisitions will also involve additional financial and operational risks.
Our ability to open new restaurants on schedule in accordance with our targeted capacity growth rate may be adversely affected by delays or problems associated with securing suitable restaurant locations, leases and licenses, recruiting and training qualified managers and hourly employees and by other factors, some of which are beyond our control and difficult to forecast accurately.
In order to achieve our targeted capacity rate of new restaurant growth, we must identify suitable restaurant locations and successfully negotiate and finalize the terms of restaurant leases at a number of these locations. Due in part to the unique nature of each proposed restaurant location, we cannot predict the timing or ultimate success of our site selection process or these lease negotiations. Delays encountered in negotiating, or our inability to finalize to our satisfaction, the terms of a restaurant lease may delay our actual rate of new restaurant growth and cause a significant variance from our targeted capacity growth rate. In addition, our scheduled rate of new restaurant openings may be adversely affected by other factors, some of which are beyond our control, including the following:
| • | the availability and cost of suitable restaurant locations for development; |
| • | our ability to compete successfully for suitable restaurant locations; |
| • | the availability of adequate financing; |
| • | the timing of delivery of leased premises from our landlords so we can commence our build-out construction activities; |
| • | construction and development costs; |
| • | labor shortages or disputes experienced by our landlords or outside contractors, including their ability to manage union activities such as picketing or hand billing which could delay construction and could create adverse publicity for our business and operations; |
| • | any unforeseen engineering or environmental problems with the leased premises; |
| • | our ability to hire, train and retain additional management and restaurant personnel; |
| • | our ability to secure governmental approvals and permits, including liquor licenses; |
| • | our ability to make satisfactory arrangements for the delivery of our proprietary craft beer; |
| • | our ability to successfully promote our new restaurants and compete in the markets in which our new restaurants are located; |
| • | weather conditions or natural disasters; and |
| • | general economic conditions. |
19
Table of Contents
Access to sources of capital and our ability to raise capital in the future may be limited, which could adversely affect our business and our expansion plans.
Our ability to successfully grow our business depends, in part, on the availability of adequate capital to finance the development of additional new restaurants and other growth related expenses. Changes in our operating plans, acceleration of our expansion plans, a decision to acquire another restaurant concept, lower than anticipated revenues, unanticipated and/or uncontrollable events in the capital or credit markets that impact our liquidity, lower than anticipated tenant improvement allowances offered by landlords, increased expenses or other events, including those described in this Annual Report on Form 10-K, may cause us to seek additional debt or equity financing on an accelerated basis in the event our cash flow from operations is insufficient. Financing may not be available on acceptable terms, or at all, and our failure to raise capital when needed could adversely affect our growth and other plans, as well as our financial condition. Additional equity financing, if available, may be dilutive to the holders of our common stock and adversely affect the price of our common stock. Debt financing, if available, may involve significant cash payment obligations, covenants and financial ratios that restrict our ability to operate and grow our business, and would cause us to incur additional interest expense and financing costs. In addition, disruptions in the global credit and equity markets, including unanticipated and/or uncontrollable events, may have an adverse effect on our liquidity and our ability to raise additional capital if and when required.
We may issue additional equity securities without the consent of shareholders and such issuances could adversely affect our stock price and the rights of existing shareholders.
We are not restricted from issuing additional common stock or preferred stock, including any securities that are convertible into or exchangeable for, or that represent the right to receive, common stock or preferred stock or any substantially similar securities. Our Board of Directors is authorized to issue additional shares of common stock and additional classes or series of preferred stock without any action on the part of the shareholders. The Board of Directors also has the discretion, without shareholder approval, to set the terms of any such classes or series of preferred stock that may be issued, including voting rights, dividend rights and preferences over the common stock with respect to dividends or upon the liquidation, or winding up of our business and other terms. If we issue preferred shares in the future that have a preference over our common stock with respect to dividends or upon liquidation, dissolution or winding up, or if we issue preferred shares with voting rights that dilute the voting power of our common stock, the rights of our common shareholders or the market price of our common stock could be adversely affected.
Any failure of our existing or new restaurants to achieve expected results could have a negative impact on our consolidated revenues and financial results, including the potential impairment of long-lived assets.
The results achieved by our recently opened restaurants may not be indicative of longer term performance or the potential market acceptance of restaurants in other locations. There can be no assurance that any new restaurant that we open will have similar operating results to those of prior restaurants. Our new restaurants typically take several months, or even longer, to reach targeted levels of productivity due to inefficiencies typically associated with new restaurants. Accordingly, incremental sales from newly-opened restaurants generally do not make a significant contribution to our total operating profits in their initial months of operation. We make certain estimates and projections with regard to individual restaurant operations, as well as our overall performance in connection with our impairment analyses for long-lived assets in accordance with U.S. GAAP. An impairment charge is required when the carrying value of the restaurant exceeds the estimated undiscounted future cash flows of the restaurant, in which case the restaurant assets are written down to estimated fair value. The projection of restaurant future cash flows used in this analysis requires the use of judgment and a number of estimates. If the restaurant’s actual results differ from our estimates, charges to impair the restaurant’s assets may be required. If impairment charges are significant, our results of operations could be adversely affected.
Our growth may strain our infrastructure and resources, which could slow our development of new restaurants and adversely affect our ability to manage our existing restaurants.
We plan to continue opening new restaurants and may also consider the internal development or acquisition of additional restaurant concepts in the future. Additionally, we may also evaluate potential joint ventures to supplement our pace of expansion. Our continued expansion will increase demands on our management team, restaurant
20
Table of Contents
management systems and resources, financial controls and information systems. These increased demands may adversely affect our ability to open new restaurants and to manage our existing restaurants. If we fail to continue to improve our infrastructure or to manage other factors necessary for us to meet our expansion objectives, our growth rate and operating results could be adversely affected.
Any decision to either reduce or accelerate the pace of openings may positively or adversely affect our comparative financial performance.
Our opening costs continue to be significant and the amount incurred in any single year or quarter is dependent on the number of restaurants expected to be opened during that time period. As such, our decision to either decrease or increase the rate of openings may have a significant impact on our financial performance for the period of time being measured. Therefore, if we decide to reduce our openings, our comparable opening costs will be lower and the short-term effect on our comparative financial performance will be favorable. Conversely, if the rate at which we develop and open new restaurants is increased to higher levels in the future, the resulting increase in opening costs will have an unfavorable short-term impact on our comparative financial performance. At some future point, our pace of openings and annual rate of growth in total restaurant operating weeks will begin to gradually decelerate as we become a more mature company.
Our recent trends in average restaurant sales or our trends in comparable restaurant sales may not be indicative of future trends or future operating results.
Our recent average restaurant sales and comparable restaurant sales trends may not be indicative of future trends or future operating results. Our ability to operate new restaurants profitably and increase average restaurant sales and comparable restaurant sales will depend on many factors, some of which are beyond our control, including:
| • | our ability to execute our business strategy effectively; |
| • | our ability to execute productively and efficiently within the “four walls” of each restaurant; |
| • | our menu development and pricing strategy; |
| • | our ability to continue deploying menu, beverage, capital expenditure and technological innovations that have the opportunity to increase customer visit frequency and spending per visit; |
| • | initial sales performance by new restaurants, some of which may be unusually strong and thus difficult to increase further; |
| • | intrusions into our restaurant trade areas by new restaurants operated by competitors; |
| • | the timing of new restaurant openings and related expenses; |
| • | changing demographics, consumer tastes or discretionary spending; |
| • | our ability to develop restaurants in geographic locations that do not compete with or otherwise adversely affect the sales of our existing restaurants; |
| • | overall brand awareness in new markets or existing markets where we may develop new restaurants; |
| • | maturation of the casual dining segment; |
| • | levels of competition in one or more of our markets; and |
| • | general economic conditions, credit markets and consumer confidence. |
We believe that certain of our restaurants operate at or near their effective productive capacities. As a result, we may be unable to grow or maintain comparable restaurant sales at those restaurants, particularly if additional restaurants are opened near the existing locations either by us or by our competitors.
Any failure to drive both short-term and long-term profitable sales growth through continued enhancements to the BJ’s restaurant concept and brand, coupled with any slippage in restaurant operational execution, could result in poor financial performance. As part of our business strategy, we intend to drive profitable sales growth by increasing sales at existing restaurants and by opening new restaurants. This strategy involves numerous risks, and we may not be able to achieve our growth objectives. If we are unable to maintain BJ’s brand relevance and restaurant operational excellence to achieve sustainable comparable restaurant sales growth, we may have to consider slowing the pace of new restaurant openings. BJ’s short-term sales growth could be impacted if we are unable to drive near-term growth in customer traffic, and long-term sales growth could be impacted if we fail to continue to evolve BJ’s to maintain its relevance, contemporary energy and overall value and appeal to the consumer. The casual dining segment, in general, has not seen
21
Table of Contents
any significant growth in customer traffic in several years. If this trend continues, our ability to grow customer traffic at our restaurants will depend on our ability to increase our market share within the casual dining segment.
Adverse changes in our average restaurant revenues and comparable restaurant sales could have an adverse effect on our common stock or increase the volatility of the price of our common stock.
Our menu development and marketing programs may not be successful.
We expect to continue investing in certain menu, marketing and merchandising initiatives that are intended to attract and retain customers for our restaurants. Not all of such initiatives may prove to be successful and may thereby result in incremental expenses incurred without the benefit of higher revenues, or may result in other unfavorable economic consequences. Additionally, if our competitors were to increase their spending on menu development and marketing initiatives, or if our menu and marketing initiatives were to be less effective than those of our competitors, we could experience a material adverse effect on our results of operations.
We have experienced significant increases in the costs of certain food, labor, energy and supply items in the past, and we may be unable to successfully and sufficiently raise menu prices to offset rising costs and expenses.
In the past, we have experienced dramatic price increases of certain items necessary to operate our restaurants and brewing operations, including increases in the cost of food, commodities, minimum wage, employee benefits, insurance arrangements, construction, energy and other costs. To manage this risk in part, we attempt to enter into fixed price purchase commitments, with terms up to one year, for many of our commodity requirements. However, it may not be possible for us to enter into fixed-price contracts for an entire fiscal year for many of our commodity requirements. Additionally, we utilize menu price increases to help offset the increased cost of commodities, minimum wage and other costs. However, there is no guarantee that our menu price increases will be accepted by our customers. If our costs increase, our operating margins and results of operations will be adversely affected if we are unable to increase our menu prices to offset such increased costs or if our increased menu prices result in less guest traffic.
Our future operating results may fluctuate significantly due to expenditures required to open new restaurants.
The expenditures required to develop new restaurants are significant. Actual costs may vary significantly depending upon a variety of factors, including the site type, the square footage and layout of each restaurant, and conditions in the local real estate market. The combination of our relatively small number of existing restaurants, the significant investment associated with each new restaurant and the average revenues of our new restaurants relative to our total revenue may cause our results of operations to fluctuate significantly. Moreover, due to our relatively small base of existing restaurants, poor operating results at any one restaurant or a delay or cancellation of the planned opening of a restaurant could adversely affect our entire business, making the investment risks related to any one location much greater than those associated with many other larger, well-established restaurant chains.
Our inability to renew existing leases on favorable terms may adversely affect our results of operations.
The majority of our restaurants are located on leased premises and are subject to varying lease-specific arrangements. Some of our leases require base rent that is subject to regional cost-of-living increases and other leases include base rent with specified periodic increases. Other leases are subject to renewal at fair market value, which could involve substantial increases. Additionally, many leases require contingent rent based on a percentage of gross sales. There can be no assurance that we will be able to renew our expiring leases after exercising all remaining renewal options; therefore we may incur additional costs to operate our restaurants, including increased rent and other costs related to our renegotiation of lease terms for an existing leased premise or for a new lease in a desirable location and the relocation and development of a replacement restaurant.
The success of our restaurants depends in large part on leased locations. As demographic and economic patterns change, current locations may or may not continue to be attractive or profitable. Possible declines in trade areas where our restaurants are located or adverse economic conditions in surrounding areas could result in reduced revenues in those locations. In addition, desirable locations for new restaurant openings or for the relocation of existing restaurants may not be available at an acceptable cost.
22
Table of Contents
We are subject to all of the risks associated with leasing space subject to long-term non-cancelable leases.
Generally our leases are “net” leases, which require us to pay all of the cost of insurance, taxes, maintenance and utilities and cannot be canceled. Additional sites that we lease are likely to be subject to similar long-term non-cancelable terms. If an existing or future restaurant is not profitable and we decide to close it, we may be required to continue to perform our obligations under the applicable lease including, among other things, paying the base rent for the balance of the lease term. These potential increased occupancy costs could materially adversely affect our business, financial condition or results of operations.
Our operations could be adversely affected if our suppliers are not able to continue to do business with us or are forced to alter the terms on which they do business with us.
If we are forced to find alternative suppliers for key services, whether due to demands from the vendor or the vendor’s bankruptcy, that could be a distraction to us and adversely impact our business. If any of our major suppliers or a large number of other suppliers suspend or cease operations, we may have difficulty keeping our restaurants fully supplied with the commodities and supplies that we require. In addition, we currently rely on one or a limited number of suppliers for certain key menu ingredients. If we were forced to suspend serving one or more of our menu items, that could have a significant adverse impact on our restaurant customer traffic and the public perceptions of us, which would be harmful to our operations.
A significant number of our restaurants are concentrated in California, Texas and Florida, which make us particularly sensitive to economic, regulatory, weather and other risk factors and conditions that are more prevalent in those states.
A significant number of our restaurants are concentrated in California, Texas and Florida. As a result, we are particularly susceptible to adverse trends and economic conditions in those states. Many states and municipalities in which our restaurants are located may experience severe revenue and budget shortfalls. Additionally, changes in state and municipal-level regulatory requirements, such as increases to the minimum wage rate, income taxes, unemployment insurance, and other taxes as well as mandatory healthcare coverage or paid leave in some cities where we operate or may desire to operate restaurants, may adversely impact our financial results. Additionally, we believe that California is subject to a greater risk for earthquakes, fires, water shortages, energy fluctuations and other natural and man-made disasters than most other states.
We are dependent upon consumer trends and upon high levels of consumer traffic at the sites where our restaurants are located, and any adverse change in such consumer trends or traffic levels could adversely affect our business, revenues and results of operations.
Due to the nature of the restaurant industry, we are dependent upon consumer trends with respect to the public’s tastes, eating habits, public perception toward alcohol consumption and discretionary spending priorities, all of which can shift rapidly. We also are dependent upon high consumer traffic rates at the sites surrounding our restaurants, which are primarily located in high-activity areas such as urban, retail, mixed-use and lifestyle centers, to attract customers to our restaurants. In general, such consumer trends and visit frequencies are significantly affected by many factors, including national, regional or local economic conditions, changes in area demographics, public perception and attitudes, increases in regional competition, food, liquor and labor costs, traffic and shopping patterns, weather, natural disasters, interest rates, co-tenancies in urban, retail and mixed-use and lifestyle centers and the availability and relative cost of gasoline. Our success will depend, in part, on our ability to anticipate and respond to such changing consumer preferences, tastes, eating and purchasing habits, as well as other factors affecting the restaurant industry, including new market entrants and demographic changes. Any adverse change in any of the above factors and our inability to respond to such changes could cause our restaurant volumes to decline and adversely affect our business, revenues and results of operations.
Our success depends on our ability to compete effectively in the restaurant industry.
The restaurant industry is highly competitive. We compete on the basis of the taste, quality and price of food offered, customer service, brand name identification, beer quality and selection, facilities attractiveness, restaurant location, atmosphere and overall dining experience. Our competitors include a large and diverse group of restaurant chains and
23
Table of Contents
individual restaurants that range from independent local operators that have opened restaurants in various markets to well-capitalized national restaurant companies. In addition, we compete with other restaurants and retailers for real estate. We also face growing competition as a result of the trend toward convergence in grocery, deli and restaurant services, particularly in the supermarket industry which offers “convenient meals” in the form of improved entrées and side dishes from the deli section. Many of our competitors have substantially greater financial, marketing and other resources than we do.
Restaurant consumers are highly focused on overall value and price perception. If other restaurants are able to promote and deliver a higher degree of perceived value through heavy discounting or other methods, our customer traffic levels may suffer which would adversely impact our revenues and profitability. In addition, with improving product offerings at “fast-casual” restaurants, quick-service restaurants and grocery stores, consumers may choose to trade down to these alternatives, which could also negatively affect our financial results.
We believe that we have built a favorable reputation for the quality and differentiation of our restaurant concept. We also believe that we must continue to re-invest in our core established restaurant operations to further protect and grow the overall consumer “value” of our concept so that it will continue to be relevant in the future. Any incident that erodes consumer trust in, or their attraction to, our concept could significantly reduce its value. If consumers perceive or experience any material reduction in food quality, service or ambiance, or in any way believe we materially failed to deliver a consistently positive dining experience, the consumer “value’ of our concept could suffer.
Negative publicity about us, our restaurants, other restaurants, or others across the food supply chain, due to food borne illness or about other reasons, whether or not accurate, could adversely affect the reputation and popularity of our restaurants and our results of operations.
The good reputation of our restaurants is a key factor to the success of our business. Incidents that occur at any of our restaurants, or at restaurants operated by other foodservice providers or generally in the food supply chain, could be damaging to the restaurant industry overall, may specifically harm our brand and reputation and may quickly result in negative publicity for us, which could adversely affect our reputation and popularity with our customers. Moreover, negative publicity resulting from poor food quality, illness, injury, food tampering or other health concerns, whether related to one of our restaurants, to the restaurant industry, or to the beef, seafood, poultry or produce industries (such as negative publicity concerning the accumulation of carcinogens in seafood, e-coli, hepatitis A, Avian Flu, listeria, salmonella, and other food-borne illnesses), or operating problems related to one or more of our restaurants, could adversely affect sales for all of our restaurants and make our brand and menu offerings less appealing to consumers.
Although we have followed industry standard food safety protocols in the past and continue to enhance our food safety and quality assurance procedures, no food safety protocols can completely eliminate the risk of food-borne illness in any restaurant. Even if food-borne illnesses arise from conditions outside of our control, the negative publicity from any such illnesses is likely to be significant. If our restaurant customers or employees become ill from food-borne illnesses, we could be forced to temporarily close the affected restaurants.
In addition, our brewing operations are subject to certain hazards and liability risks faced by all brewers, such as potential contamination of ingredients or products by bacteria or other external agents that may be wrongfully or accidentally introduced into products or packaging. While we have not experienced any serious contamination problem in our products, the occurrence of such a problem could result in a costly product recall and serious damage to our reputation for product quality, as well as claims for product liability.
New information or attitudes regarding diet, health and the consumption of alcoholic beverages could result in changes in regulations and consumer consumption habits that could adversely affect our results of operations.
Regulations and consumer eating habits may change as a result of new information or attitudes regarding diet and health. Such changes may include regulations that impact the ingredients and nutritional content of the food and beverages we offer. For example, several municipalities and states have approved restrictions on the use of trans-fats by restaurants. The success of our restaurant operations is dependent, in part, upon our ability to effectively respond to changes in any consumer health regulations and our ability to adapt our menu offerings to trends in food consumption. If consumer health regulations or consumer eating habits change significantly, we may be required to modify or delete certain menu items. To the extent we are unable to respond with appropriate changes to our menu offerings, it could
24
Table of Contents
materially affect customer demand and have an adverse impact on our results of operations. The risks and costs associated with nutritional disclosures on our menus could also impact our operations, particularly given differences among applicable legal requirements and practices within the restaurant industry with respect to testing and disclosure, ordinary variations in food preparation among our own restaurants, and the need to rely on the accuracy and completeness of nutritional information obtained from third party suppliers.
The gross profit margin on our sales of alcoholic beverages is generally higher than our gross profit margin on sales of food items. The alcoholic beverage industry has become the subject of considerable societal and political attention in recent years due to increasing public concern over alcohol-related social problems, including driving under the influence, underage drinking and health consequences from the misuse of alcohol, including alcoholism. As an outgrowth of these concerns, the possibility exists that advertising by beer producers could be restricted, that additional cautionary labeling or packaging requirements might be imposed, that further restrictions on the sale of alcohol might be imposed, or that there may be renewed efforts to impose increased excise or other taxes on beer or alcohol related items sold in the United States. If beer or alcohol consumption were to come into disfavor among domestic drinkers, or if the domestic beer industry were subjected to significant additional governmental regulations, our sales and profits could be adversely affected.
Health concerns arising from outbreaks of flu viruses or other diseases, or regional or global health pandemics, could severely affect our business.
The United States and other countries have experienced, or may experience in the future, outbreaks of viruses, such as norovirus, Avian Flu or “SARS,” and H1N1 or “swine flu,” or other diseases such as bovine spongiform encephalopathy, commonly known as “mad cow disease.” To the extent that a virus or disease is food-borne, or perceived to be food-borne, future outbreaks may adversely affect the price and availability of certain food products and cause our customers to eat less of a product. For example, health concerns relating to the consumption of beef or to specific events such as the outbreak of “mad cow disease” may adversely impact sales of our beef-related menu items. In addition, public concern over “avian flu” may cause fear about the consumption of chicken, eggs and other products derived from poultry. The inability to serve beef or poultry-based products would restrict our ability to provide a variety of menu items to our customers. If we change our menu in response to such concerns, we may lose customers who do not prefer the new menu, and we may not be able to sufficiently attract new customers to produce the revenue needed to restore the profitability of our restaurant operations. We also may generate different or additional competitors for our intended customers as a result of such a menu change and may not be able to successfully compete against such competitors. If a virus is transmitted by human contact, our employees or customers could become infected, or could choose, or be advised, to avoid gathering in public places, any of which could adversely affect our restaurant customer traffic and our ability to adequately staff our restaurants, receive deliveries on a timely basis or perform functions at the corporate level. We also could be adversely affected if jurisdictions in which we have restaurants impose mandatory closures, seek voluntary closures or impose restrictions on operations. Even if such measures are not implemented and a virus or other disease does not spread significantly, the perceived risk of infection or significant health risk may adversely affect our business.
A health pandemic is a disease outbreak that spreads rapidly and widely by infection and affects many individuals in an area or population at the same time. We believe that our restaurants have one of the highest levels of customer traffic per square foot in the casual dining segment of the restaurant industry. Our restaurants are places where people can gather together for human connection. Customers might avoid public gathering places in the event of a health pandemic, and local, regional or national governments might limit or ban public gatherings to halt or delay the spread of disease. The impact of a health pandemic on us might be disproportionately greater than on other casual dining concepts that have lower customer traffic and that depend less on the gathering of people.
Our operations are susceptible to changes in the cost of food, labor and related employee benefits (including, but not limited to, group health insurance coverage for our employees), brewing and energy which may adversely affect our profitability.
Our profitability depends, in part, on our ability to anticipate and effectively react to changes in food, labor, utilities and supply costs. Our supply chain department negotiates prices for all of our ingredients and supplies through contracts (with terms of one month up to one year, or longer in a few cases), spot market purchases or commodity
25
Table of Contents
pricing formulas. Furthermore, various factors beyond our control, including adverse weather conditions and governmental regulations, could also cause our food and supply costs to increase. We cannot predict whether we will be able to anticipate and react to changing food and supply costs by adjusting our purchasing practices. A failure to do so could adversely affect our operating results or cash flows from operations. We also have a single or a limited number of suppliers for certain of our commodity and supply items. Accordingly, supply chain risk could increase our costs and limit the availability of some products that are critical to our restaurant and brewing operations.
The overall cost environment for food commodities can be volatile primarily due to domestic and worldwide agricultural supply/demand and other macroeconomic factors that are outside of our control. The availability and prices of food commodities are also influenced by energy prices, droughts, animal-related diseases, natural disasters, increased geo-political tensions, the relationship of the dollar to other currencies, and other issues. Virtually all commodities purchased and used in the restaurant industry (meats, grains, oils, dairy products, and energy) have varying amounts of inherent price volatility associated with them. Our suppliers also may be affected by higher costs to produce and transport commodities used in our restaurants and brewpubs, higher minimum wage and benefit costs, and other expenses that they pass through to their customers, which could result in higher costs for goods and services supplied to us. Increases in minimum wage, health care costs and other benefit costs may have a material adverse effect on our labor costs. While we attempt to manage these factors by offering a diversified menu and by contracting for our key commodities for extended periods of time whenever feasible and possible, there can be no assurance that we will be successful in this respect due to the many factors that are outside of our control. In addition, raw materials that we may purchase on the international market are subject to fluctuations in both the value of the U.S. dollar and increases in local demand, which may increase our costs and negatively impact our profitability.
We and our major independent third party brewing partners purchase a substantial portion of brewing raw materials and products, primarily malt and hops, from a limited number of domestic and foreign suppliers. We purchase both North American and European malts and hops for our beers. We purchase a majority of our malts from a single supplier with multiple sources of malts. We generally enter into one-year purchase commitments with our malt and hops suppliers, based on the projected future volumes and brewing needs. We are exposed to the quality of the barley crop each year, and significant failure of a crop could adversely affect our beer costs. Changes in currency exchange rates and freight costs can also result in increased prices. There are other malt vendors available that are capable of supplying all of our needs. We use American and German hops for our beers. We enter into purchase commitments with several hops suppliers, based on our projected future volumes and brewing needs. However, the quality and availability of the hops may be materially adversely affected by factors such as adverse weather and changes in currency exchange rates, resulting in increased prices. We attempt to maintain at least six months’ supply of essential hop varieties on hand in order to limit the risk of an unexpected reduction in supply. We store our hops in multiple cold storage warehouses, both at our brewpubs and at our suppliers, to minimize the impact of a catastrophe at a single site. Hops and malt are agricultural products and, therefore, many outside factors, including weather conditions, farmers rotating out of hops or barley to other crops, government regulations and legislation affecting agriculture, could affect both price and supply.
Our restaurant-level operating margins are also affected by fluctuations in the availability and cost of utilities services, such as electricity and natural gas. Interruptions in the availability of gas, electric, water or other utilities, whether due to aging infrastructure, weather conditions, fire, animal damage, trees, digging accidents or other reasons largely out of our control, may adversely affect our operations. In addition, weather patterns in recent years have resulted in lower than normal levels of rainfall in certain areas that could produce droughts in key states such as California, thus impacting the price of water and the corresponding prices of commodities grown in states facing drought conditions. There is no assurance that we will be able to maintain our utility and commodity costs at levels that do not have a material adverse effect on our operations.
If our distributors or suppliers do not provide food and beverages to us in a timely fashion, we may experience short-term supply shortages, increased food and beverage costs and quality control problems.
We currently depend on national and regional food distribution service companies, as well as other food manufacturers and suppliers, to provide food and beverage products to all of our restaurants. We also rely on independent third party brewers and many local beer distributors to provide us with beer for our restaurants. The operations of our distributors, suppliers and independent third party brewers are subject to risks including labor disputes, financial liquidity, inclement weather, natural disasters, supply constraints, and general economic and political conditions that could limit their
26
Table of Contents
ability to timely provide us with acceptable products. Additionally, under the “force majeure” provisions in most of our agreements with suppliers, certain unexpected and disruptive events may excuse a supplier from performing. If our distributors, suppliers and independent third party brewers cease doing business with us, or cannot make a scheduled delivery to us, or are unable to obtain credit in a tightened credit market or experience other issues, we could experience short-term product supply shortages in some or all of our restaurants and could be required to purchase food, beer and beverage products from alternate suppliers at higher prices. We may also be forced to temporarily remove popular items from the menu offering of our restaurants. If alternative suppliers cannot meet our current product specifications, the consistency and quality of our food and beverage offerings, and thus our reputation, customer patronage, revenues and results of operations, could be adversely affected.
With respect to potential liability claims related to our food, beer and beverage products, we believe we have sufficient primary or excess umbrella liability insurance in place. However, this insurance may not continue to be available at a reasonable cost or, if available, may not be adequate to cover all claims. We generally seek contractual indemnification and insurance coverage from our key suppliers of food, beer and beverages, but this indemnification or insurance coverage is limited, as a practical matter, by the creditworthiness of the indemnifying party and the insured limits of any insurance provided by suppliers.
Pursuant to various laws and regulations, the majority of our proprietary craft beer must be distributed to our restaurants through independent wholesale beer distributors, whether we produce the beer or it is produced by independent third party brewers. Although we currently have arrangements with a sufficient number of beer distributors in all markets where we operate restaurants, our continued national expansion will require us to enter into agreements with additional beer distributors. No assurance can be given that we will be able to maintain or secure additional beer distributors on terms favorable to us. Changes in control or ownership of the participants in our current beer distribution network could lead to less willingness on the part of certain distributors to carry our proprietary craft beer. Our beer distribution agreements are generally terminable by the distributor on short notice. While these beer distribution agreements contain provisions regarding our enforcement and termination rights, some state laws prohibit us from readily exercising these contractual rights. Our ability to maintain our existing beer distribution agreements may also be adversely affected by the fact that many of our distributors are reliant on one of the major beer producers for a large percentage of their revenue and, therefore, they may be influenced by such producers. If our existing beer distribution agreements are terminated, we may not be able to enter into new distribution agreements on substantially similar terms or it may take some time to enter into a replacement agreement, which may result in an increase in the delivered cost of beer to our restaurants.
Failure to protect our trademarks, service marks, trade secrets or other intellectual property could adversely affect our business.
Our business prospects depend in part on our ability to develop favorable consumer recognition of our brands, including the BJ’s Restaurants name in particular. Although BJ’s is a federally registered trademark, there are many other retailers, restaurants and other types of businesses using the name “BJ’s” in some form or fashion throughout the United States. While we intend to aggressively protect and defend our trademarks, service marks, trade dress, trade secrets and other intellectual property, particularly with respect to their use in our restaurant and brewing operations, they could be imitated or appropriated in ways that we cannot prevent. Alternatively, third parties may attempt to cause us to change our trademarks, service marks or trade dress or not operate in a certain geographic region or regions if our names are deemed confusingly similar to their prior trademarks, service marks or trade dress. We may also encounter claims from prior users of similar intellectual property in areas where we operate or intend to conduct operations. This could harm our image, brand or competitive position and cause us to incur significant penalties and costs. In addition, we rely on trade secrets, proprietary know-how, concepts and recipes. Our methods of protecting this information may not be adequate. While we believe that we take reasonable protective actions with respect to our intellectual property, these actions may not be sufficient to prevent, and we may not be aware of all incidents of, unauthorized usage or imitation by others. Moreover, we may face claims of misappropriation or infringement of third parties’ rights that could interfere with our use of this information. Defending these claims may be costly and, if unsuccessful, may prevent us from continuing to use this proprietary information in the future and may result in a judgment or monetary damages. We do not maintain confidentiality and non-competition agreements with all of our employees or suppliers. Moreover, even with respect to the confidentiality and non-competition agreements we have, we cannot assure that those agreements will not be breached, that they will provide meaningful protection or that adequate remedies will be
27
Table of Contents
available in the event of an unauthorized use or disclosure of our proprietary information. If competitors independently develop or otherwise obtain access to our trade secrets, proprietary know-how or recipes, the appeal of our restaurants could be reduced and our business could be harmed.
Federal, state and local beer, liquor and food service regulations may have a significant adverse impact on our operations.
We are required to operate in compliance with federal laws and regulations relating to alcoholic beverages administered by the Alcohol and Tobacco Tax and Trade Bureau of the U.S. Department of Treasury, as well as the laws and licensing requirements for alcoholic beverages of states and municipalities where our restaurants are or will be located. In addition, each restaurant must obtain a food service license from local authorities. Failure to comply with federal, state or local regulations could cause our licenses to be revoked and force us to cease the brewing or sale of alcoholic beverages, or both, or the serving of food at our restaurants. Additionally, state liquor laws may prevent or impede the expansion of our restaurants into certain markets. The liquor laws of certain states prevent us from selling the beer brewed at our restaurants. Any difficulties, delays or failures in obtaining such licenses, permits or approvals could delay or prevent the opening of a restaurant in a particular area or increase the costs associated therewith. In addition, in certain states, including states where we have existing restaurants or where we plan to open a restaurant, the number of liquor licenses available is limited, and licenses are traded on the open market. Liquor, beer and wine sales comprise a significant portion of our revenues. If we are unable to maintain our existing licenses, our customer patronage, revenues and results of operations could be adversely affected. Or, if we choose to open a restaurant in those states where the number of available licenses is limited, the cost of a new license could be significant.
Brewing operations require various federal, state, and local licenses, permits and approvals. Our restaurants and on-site brewpubs operate pursuant to exceptions to the “tied house” laws, which created the “three tier system” of liquor distribution. These “tied house” laws were adopted by all of the states after the repeal of Prohibition and, generally, prohibit brewers from holding retail licenses and prohibit vertical integration in ownership and control among the three tiers. Brewing restaurants and brewpubs operate under exceptions to these general prohibitions. Over the last 25 years, nearly all of the states have adopted laws and regulations permitting brewing restaurants and brewpubs; however, the privileges and restrictions for brewpubs and brewing restaurants vary from state to state.
We apply for our liquor and brewing licenses with the advice of outside legal and licensing consultants. Generally, our brewing restaurants are licensed as retailers with limited privileges to brew beer on the restaurant premises, and we do not have the same privileges as a microbrewery. Other restrictions imposed by law may prevent us from operating both brewing restaurants and non-brewing restaurants in some states. We are at risk that a state’s regulations concerning brewing restaurants or the interpretation of these regulations may change. Because of the many and various state and federal licensing and permitting requirements, there is a significant risk that one or more regulatory agencies could determine that we have not complied with applicable licensing or permitting regulations or have not maintained the approvals necessary for us to conduct business within its jurisdiction. Even after the issuance of our licenses, our operations could be subject to differing interpretations of the “tied house” laws and the requirements of the “three tier system” of liquor distribution in any jurisdiction that we conduct business. Any such changes in interpretation may adversely impact our current model of brewing beer or supplying beer, or both, to our restaurants in that state, and could also cause us to lose, either temporarily or permanently, the licenses, permits and registrations necessary to conduct our restaurant operations, and subject us to fines and penalties.
The manufacture and sale of alcoholic beverages is a highly regulated and taxed business. Our operations are subject to more restrictive regulations and increased taxation by federal, state, and local governmental entities than are those of non-alcohol related beverage businesses. Federal, state, and local laws and regulations govern the production and distribution of beer, including permitting, licensing, trade practices, labeling, advertising, marketing, distributor relationships, and related matters. Federal, state, and local governmental entities also levy various taxes, license fees, and other similar charges and may require bonds to ensure compliance with applicable laws and regulations. Failure to comply with applicable federal, state, or local laws and regulations could result in higher taxes, penalties, fees, and suspension or revocation of permits, licenses or approvals.
Increasing the federal and/or state excise tax on alcoholic beverages, or certain types of alcoholic beverages, is frequently proposed in various jurisdictions either to increase revenues or discourage purchase by underage drinkers. If
28
Table of Contents
adopted, these measures could affect some or all of our proprietary craft beer products. If federal or state excise taxes are increased, we may have to raise prices to maintain our current profit margins. Higher taxes may reduce overall demand for beer, thus negatively impacting sales of our beer. Some states have also been reviewing the state tax treatment for flavored malt beverages which could result in increased costs for us, as well as decreased sales. Further federal or state regulation may be forthcoming that could further restrict the distribution and sale of alcohol products.
Our dependence on independent third party brewers and manufacturers for some of our beer could have an adverse effect on our operations if they cease to supply us with our proprietary craft beer.
Our proprietary craft beer is a key factor in the success of our business. Each year, our brewing operations department forecasts our annual beer requirements based on our current restaurant requirements and expansion plans and determines our brewing production. Additionally, in certain states we are either legally required or choose to arrange for independent third party brewers to brew our beer using our proprietary recipes. If the independent third party brewers cease doing business with us, or cannot make a scheduled delivery to us because of a supply chain or production disruption or other issues, or if we cannot otherwise satisfy our internal brewing requirements, we could experience short-term supply shortages in some or all of our restaurants which may result in a loss of revenue. Potential disruptions include labor issues, governmental and regulatory actions, quality issues, contractual disputes, machinery failures or operational shut downs. Additionally, if these independent third party brewers cease doing business with us, we could be required to purchase or brew our own beer at higher costs to us, or we may not be able to sell our proprietary craft beer at all, until we are able to secure an alternative supply source. If the independent third party brewers fail to adhere to our proprietary recipe and brewing specifications, the consistency and quality of beer offerings, and thus our reputation, customer patronage, revenues and results of operations, could be adversely affected. As the brewing industry continues to consolidate, the financial stability of those brewing operations where we currently contract for our proprietary craft beer production, as well as their ability or willingness to continue to meet our beer production requirements, continues to be a significant risk in our business model. Accordingly, there can be no guarantees that our proprietary brewing requirements will continue to be met in the future.
From time to time, we or the independent third party brewers and manufacturers may also experience shortages of kegs necessary to distribute our craft beer. We distribute our craft beer in kegs that are owned by us as well as leased from third party vendors. We are also responsible for providing kegs to the independent third party brewers that produce our proprietary craft beer.
Our internal brewing, independent third party brewing and beer distribution arrangements are subject to periodic reviews and audits by various federal, state and local governmental and regulatory agencies and could be adversely affected by different interpretations of the laws and regulations that govern such arrangements or by new laws and regulations.
Brewing and wholesale operations require various federal, state and local licenses, permits and approvals. The loss or revocation of any existing licenses, permits or approvals, and/or the failure to obtain any required additional or new licenses, permits, or approvals could have a material adverse effect on the ability of the Company to conduct its business.
We are subject to periodic audits and reviews by federal, state and local regulatory agencies related to our internal and independent third party brewing operations. We are particularly subject to extensive regulation at the federal, state and local levels. Permits, licenses and approvals necessary to the U.S. beer business are required from the Alcohol and Tobacco Tax and Trade Bureau of the United States Treasury Department (“TTB”), state alcohol beverage regulatory agencies and local authorities in some jurisdictions. Compliance with these laws and regulations can be costly. TTB permits and registrations can be suspended, revoked or otherwise adversely affected for failure to pay taxes, keep proper accounts, pay fees, bond premises, abide by federal alcoholic beverage production and distribution regulations, or notify the TTB of any material change. Permits, licenses and approvals from state regulatory agencies can be revoked for many of the same reasons. Our operations are subject to audit and inspection by the TTB at any time. At the state and local level, some jurisdictions merely require notice of any material change in the operations, management or ownership of the permit or license holder and others require advance approvals, requiring that new licenses, permits or approvals be applied for and obtained in the event of a change in the management or ownership of the permit or license holder. State and local laws and regulations governing the sale of malt beverages and hard cider within a
29
Table of Contents
particular state by a supplier or wholesaler vary from locale to locale. Our operations are subject to audit and inspection by state regulatory agencies at any time. Because of the many and various state and federal licensing and permitting requirements, there is a risk that one or more regulatory agencies could determine that we have not complied with applicable licensing or permitting regulations or have not maintained the approvals necessary to conduct business within its jurisdiction.
We are routinely subject to new or modified laws and regulations for which we must comply in order to avoid fines and other penalties. From time to time, new laws and regulations are proposed that could affect the overall structure and effectiveness of the proprietary craft beer production and distribution model we currently utilize. Any such changes in interpretation may adversely impact our current model of brewing beer or supplying beer, or both, to our restaurants in that state, and could also cause us to lose, either temporarily or permanently, the licenses, permits and registrations necessary to conduct our restaurant operations, and subject us to fines and penalties.
Government laws and regulations affecting the operation of our restaurants, including (but not limited to) those that apply to the acquisition and maintenance of our brewing and retail liquor licenses, minimum wages, consumer health and safety, health insurance coverage, nutritional disclosures, and employment eligibility-related documentation requirements could increase our operating costs, cause unexpected disruptions to our operations and restrict our growth.
Our development and construction of additional restaurants must comply with applicable zoning, land use and environmental regulations. More stringent and varied requirements of local government bodies with respect to zoning, land use and environmental factors could delay construction of new restaurants and add to their cost in the future. In addition, difficulties or failure in obtaining the required licenses and approvals could delay, or result in our decision to cancel, the opening of new restaurants.
In addition, various federal and state labor laws govern our relationship with our employees and affect our operating costs. These laws include minimum wage requirements, overtime pay, meal and rest breaks, unemployment tax rates, workers’ compensation rates, work eligibility requirements, employee classification as exempt/non-exempt for overtime and other purposes, immigration status and other wage and benefit requirements. In particular, we are subject to the regulations of the ICE branch of the United States Department of Homeland Security. In addition, some states in which we operate have adopted immigration employment protection laws. Changes to these aforementioned laws or other employment laws or regulations, could adversely affect our operating results and thus restrict our growth, including additional government-imposed increases in minimum wages, overtime pay, paid time off or leaves of absence, mandated health benefits, increased tax reporting and tax payment requirements for employees who receive gratuities, a reduction in the number of states that allow tips to be credited toward minimum wage requirements and increased employee litigation, including claims relating to the Fair Labor Standards Act and comparable state laws.
The U.S. Congress and Department of Homeland Security from time to time consider and may implement changes to federal immigration laws, regulations or enforcement programs. Some of these changes may increase our obligations for compliance and oversight, which could subject us to additional costs and make our hiring process more cumbersome, or reduce the availability of potential employees. We currently participate in the “E-Verify” program, an Internet-based, free program run by the U.S. government, to verify employment eligibility for all employees throughout our company. However, use of E-Verify does not guarantee that we will properly identify all employees who are ineligible for employment. Even if we operate our restaurants in strict compliance with ICE and state requirements, some of our employees may not meet federal work eligibility or residency requirements, which could lead to a disruption in our work force. Although we require all of our new employees to provide us with the government-specified documentation evidencing their employment eligibility, some of our employees may, without our knowledge, be unauthorized workers. Unauthorized workers are subject to seizure and deportation and may subject us to fines, penalties or loss of our business license in certain jurisdictions. Additionally, a government audit could result in a disruption to our workforce or adverse publicity that could negatively impact our brand and our use of E-Verify and/or potential for receipt of letters from the Social Security Administration requesting information (commonly referred to as no-match letters) could make it more difficult to recruit and/or retain qualified employees.
Potential changes in labor laws or increased union recruiting activates could result in portions of our workforce being subjected to greater organized labor influence. Because we do not franchise, risks associated with hiring and
30
Table of Contents
maintaining a large workforce, including increases in wage rates or the cost of employee benefits, compliance with laws and regulations related to the hiring, payment and termination of employees, and employee-related litigation, may be more pronounced for us than for restaurant companies at which some or all of these risks are borne by franchisees or other operating contractors. Additionally, while we do not currently have any unionized employees, union organizers have engaged in efforts to organize employees of other restaurant companies. If a significant portion of our employees were to become union organized, our labor costs could increase and our efforts to maintain a culture appealing only to top-performing employees could be impaired. Potential changes in labor laws, including the possible passage of legislation designed to make it easier for employees to unionize, could increase the likelihood of some or all of our employees being subjected to greater organized labor influence, and could have an adverse effect on our business and financial results by imposing requirements that could potentially increase our costs, reduce our flexibility, impact our employee culture and our ability to service our customers. In addition, a labor dispute involving some or all of our employees could harm our reputation, disrupt our operations and reduce our revenues and resolution of disputes may increase our costs.
Additionally, some states, counties and cities have enacted menu labeling laws which are separate of the federally mandated menu labeling law that is part of the Patient Protection and Affordable Care Act. Non-compliance with these laws could result in the imposition of fines and/or the closure of restaurants. We could also be subject to lawsuits that claim our non-compliance. These menu labeling laws could also result in changing consumer preferences which may adversely affect our results of operations and financial position. We may not be able to adequately adapt our menu offerings to keep pace with developments in current consumer preferences related to nutrition, which may adversely impact our sales.
Some jurisdictions in which we operate have recently enacted new requirements that require us to adopt and implement a Hazard Analysis and Critical Control Points (“HACCP”) System for managing food safety and quality. HACCP refers to a management system in which food safety is addressed through the analysis and control of potential hazards from production, procurement and handling, to manufacturing, distribution and consumption of the finished product. We expect to incur certain costs to comply with these regulations, and these costs may be more than we anticipate. If we fail to comply with these laws or regulations, our business could experience a material adverse effect.
The Americans with Disabilities Act of 1990 prohibits discrimination on the basis of disability in public accommodations and employment. Although our restaurants are designed to be accessible to the disabled, we could be required to make modifications to our restaurants to provide service to, or make reasonable accommodations for, disabled persons. Non-compliance with this law and related laws enacted at the state or local level could result in the imposition of fines or an award of damages to private litigants.
The collective impact of current laws and regulations, the effect of future changes in laws or regulations that impose additional requirements and the consequences of litigation relating to current or future laws and regulations, or our inability to respond effectively to significant regulatory or public policy issues, could increase our compliance and other costs of doing business and therefore have an adverse effect on our results of operations. Failure to comply with the laws and regulatory requirements of federal, state and local authorities could result in, among other things, revocation of required licenses, administrative enforcement actions, fines and civil and criminal liability. Compliance with these laws and regulations can be costly and can increase our exposure to litigation or governmental investigations or proceedings.
Limitations in our insurance coverage or rising insurance costs could adversely affect our business or financial condition in certain circumstances.
We purchase comprehensive insurance coverage, including, but not limited to, property, casualty, directors and officers liability and network privacy and security liability with coverage levels that we consider appropriate, based on the advice of our outside insurance and risk management advisors. However, such insurance is subject to limitations, including deductibles, exclusions and maximum liabilities covered. The cost of insurance fluctuates based on market conditions and availability as well as our historical loss trends. Moreover, there are certain types of losses that may be uninsurable or not economically insurable. Such hazards may include earthquake, hurricane and flood losses and certain employment practices. If such a loss should occur, we would, to the extent that we were not covered for such loss by insurance, suffer a loss of the capital invested, as well as anticipated profits and cash flow. Punitive damage
31
Table of Contents
awards are generally not covered by insurance; thus, any awards of punitive damages as to which we may be liable could adversely affect our ability to continue to conduct our business, to expand our operations or to develop additional restaurants. There is no assurance that any insurance coverage we maintain will be adequate, that we can continue to obtain and maintain such insurance at all or that the premium costs will not rise to an extent that they adversely affect us or our ability to economically obtain or maintain such insurance.
We retain a substantial portion of our workers’ compensation and general liability costs through self-insured retentions and large deductibles. We estimate the liability for these programs through the use of third party actuarial analysis. Any unfavorable changes in trends or any increase in the actual dollar amount of claims that we incur could have a negative impact on our profitability. Our self-insured retention and large deductible reserves may not be sufficient causing us to record additional expense. Unanticipated changes may produce materially different financial results than previously reported which could have an adverse impact on operations. Additionally, health insurance costs have risen significantly over the past few years and are expected to continue to increase. These increases may have a negative impact on our profitability if we are not able to offset the effect of such increases with plan modifications and cost control measures, or by continuing to improve our operating efficiencies.
Our business and future development could be harmed if we are unable to retain key personnel or have difficulties in recruiting qualified personnel.
The success of our business continues to depend on the contributions of our senior management team, both individually and as a group. Our senior executives have been instrumental in setting our strategic direction, operating our business, identifying, recruiting and training key personnel, identifying expansion opportunities and arranging necessary financing. Losing the services of any of these individuals could materially adversely affect our business until a suitable replacement is found. We believe that these individuals cannot easily be replaced with executives of equal experience and capabilities. Although we have employment agreements with our Chief Executive Officer and some of our senior executives, we cannot prevent them from terminating their employment with us.
Litigation, including allegations of illegal, unfair or inconsistent employment practices, could have a material adverse effect on our business.
Our business is subject to the risk of litigation by employees, customers, suppliers, shareholders, government agencies or others through private actions, class or collective actions, administrative proceedings, regulatory actions or other litigation. These actions and proceedings may involve allegations of illegal, unfair or inconsistent employment practices, including wage and hour violations and employment discrimination; customer discrimination; food safety issues including poor food quality, food-borne illness, food tampering, food contamination, and adverse health effects from consumption of various food products or high-calorie foods (including obesity); other personal injury; violation of “dram-shop” laws (providing an injured party with recourse against an establishment that serves alcoholic beverages to an intoxicated party who then causes injury to himself or a third party); trademark or patent infringement; violation of the federal securities laws; or other concerns. The outcome of litigation, particularly class action lawsuits and regulatory actions, is difficult to assess or quantify. Plaintiffs in these types of lawsuits may seek recovery of very large or indeterminate amounts, and the magnitude of the potential loss relating to such lawsuits may remain unknown for substantial periods of time. The cost to defend litigation may be significant. There may also be adverse publicity associated with litigation that could decrease customer acceptance of our brands, regardless of whether the allegations are valid or we ultimately are found liable. Litigation could impact our operations in other ways as well. Allegations of illegal, unfair or inconsistent employment practices, for example, could adversely affect employee acquisition and retention. Also, some employment related claims in the area of wage and hour disputes are not insurable risks. We also are subject to claims and disputes from landlords under our leases, which could lead to litigation or a threatened or actual lease termination. Litigation of any nature may be expensive to defend and may divert money and management’s attention from our operations and adversely affect our financial condition and results of operations.
The occurrence or threat of extraordinary events, including terrorist attacks, could cause consumer spending to decline, which would adversely affect our sales and results of operations.
The occurrence or threat of extraordinary events, including future terrorist attacks and military and governmental responses and the prospect of future wars, may result in negative changes to economic conditions likely resulting in
32
Table of Contents
decreased consumer spending. Additionally, decreases in consumer discretionary spending could impact the frequency with which our customers choose to dine out at restaurants or the amount they spend on meals while dining out at restaurants, thereby adversely affecting our sales and results of operations. A decrease in consumer discretionary spending could also adversely affect our ability to achieve the benefit of planned menu price increases to help preserve our operating margins.
Natural disasters could unfavorably affect our operations.
The occurrence of natural disasters, such as fires, hurricanes, freezing weather or earthquakes (particularly in California where our centralized operating systems and restaurant support center administrative personnel are located) could unfavorably affect our operations and financial performance. Such events could result in physical damage to one or more of our restaurants; the temporary or permanent closure of one or more of our restaurants or restaurant support center; the temporary lack of an adequate work force in an affected geographical trade area; the temporary or long-term disruption in the supply of food, beverages, beer and other products to our restaurants; the temporary disruption of electric, water, sewer and waste disposal services necessary for our restaurants to operate; and/or the temporary reduction in the availability of certain products in our restaurants.
We have disaster recovery procedures and business continuity plans in place to address most events of a crisis nature, including hurricanes and other natural disasters, including back up and off-site locations for recovery of electronic and other forms of data and information. However, if we are unable to fully implement our disaster recovery plans, we may experience delays in recovery of data, inability to perform vital corporate functions, tardiness in required reporting and compliance, failures to adequately support field operations and other breakdowns in normal communication and operating procedures that could have a material adverse effect on our financial condition, results of operation and exposure to administrative and other legal claims.
Future changes in financial accounting standards may significantly change our reported results of operations.
Generally accepted accounting principles in the U.S. are subject to interpretation by the Financial Accounting Standards Board (“FASB”), the American Institute of Certified Public Accountants (“AICPA”), the SEC and various bodies formed to promulgate and interpret appropriate accounting principles. A change in these principles or interpretations could have a significant effect on our reported financial results and could affect the reporting of transactions completed before the announcement of a change. In addition, the SEC has announced a multi-year plan that could ultimately lead to the use of International Financial Reporting Standards by U.S. issuers in their SEC filings. Any such change could have a significant effect on our reported financial results.
Additionally, our assumptions, estimates and judgments related to complex accounting matters could significantly affect our financial results. Generally accepted accounting principles and related accounting pronouncements, implementation guidelines and interpretations with regard to a wide range of matters that are relevant to our business, including but not limited to, revenue recognition, fair value of investments, impairment of long-lived assets, leases and related economic transactions, intangibles, self-insurance, income taxes, property and equipment, unclaimed property laws and litigation, and stock-based compensation are highly complex and involve many subjective assumptions, estimates and judgments by us. Changes in these rules or their interpretation or changes in underlying assumptions, estimates or judgments by us could significantly change our reported or expected financial performance.
The market price of our common stock may be volatile and our shareholders may lose all or part of their investment.
The market price of our common stock could fluctuate significantly, and our shareholders may not be able to resell their shares at or above the price they paid for them. Those fluctuations could be based on various factors in addition to those otherwise described in this Form 10-K and the following:
| • | actual or anticipated fluctuations in comparable restaurant sales or operating results, whether in our operations or in those of our competitors; |
| • | changes in financial estimates or opinions by research analysts, either with respect to us or other casual dining companies; |
| • | any failure to meet investor or analyst expectations, particularly with respect to total restaurant operating weeks, number of restaurant openings, comparable restaurant sales, average weekly sales per restaurant, total revenues, operating margins and net income per share; |
33
Table of Contents
| • | the public’s reaction to our press releases, other public announcements and our filings with the SEC; |
| • | actual or anticipated changes in domestic or worldwide economic, political or market conditions, such as recessions or international currency fluctuations; |
| • | changes in the consumer spending environment; |
| • | terrorist acts; |
| • | changes in laws or regulations, or new interpretations or applications of laws and regulations, that are applicable to our business; |
| • | changes in accounting standards, policies, guidance, interpretations or principles; |
| • | short sales, hedging and other derivative transactions in the shares of our common stock; |
| • | future sales or issuances of our common stock, including sales or issuances by us, our directors or executive officers and our significant stockholders; |
| • | our dividend policy; |
| • | changes in the market valuations of other restaurant companies; |
| • | actions by stockholders; |
| • | various market factors or perceived market factors, including rumors, involving us, our suppliers and distributors, whether accurate or not; |
| • | announcements by us or our competitors of new locations, menu items, technological advances, significant acquisitions, strategic partnerships, divestitures, joint ventures or other strategic initiatives; |
| • | the addition or loss of a key member of management; and |
| • | changes in the costs or availability of key inputs to our operations. |
In addition, we cannot assure that an active trading market for our common stock will continue which could affect our stock price and the liquidity of any investment in our common stock.
The trading market for our common stock is influenced by the research and reports that industry or securities analysts publish about us, our business and our industry. If one or more analysts adversely change their recommendation regarding our shares or our competitors’ stock, our share price would likely decline. If one or more analysts cease coverage of us or fail to regularly publish reports on us, we could lose visibility in the financial markets which, in turn, could cause our share price or trading volume to decline.
In addition, our stock price can be influenced by trading activity in our common stock or trading activity in derivative instruments with respect to our common stock as a result of market commentary (including commentary that may be unreliable or incomplete in some cases); changes in expectations about our business, our creditworthiness or investor confidence generally; actions by shareholders and others seeking to influence our business strategies; portfolio transactions in our stock by significant shareholders; or trading activity that results from the ordinary course rebalancing of stock indices in which our stock may be included.
In the past, following periods of volatility in the market price of a company’s securities, shareholders have often instituted securities class action litigation against those companies. Such litigation, if instituted, could result in substantial costs and a diversion of management attention and resources, which would significantly harm our profitability and reputation.
We currently do not pay any dividends to our shareholders and they do not receive any return on their investment unless they sell their common stock for a price greater than that what they paid for it.
The continued operation and expansion of our business will require substantial funding. Accordingly, we currently do not pay any dividends to our shareholders and they do not receive any portion of their current total return on investment from this type of capital allocation. Therefore, our shareholders may have to sell some or all of their common stock in order to generate cash flow from their investment. Our shareholders may not receive a gain on their investment when they sell our common stock and they may lose some or the entire amount of their investment. Any determination to pay dividends in the future will be at the discretion of our Board of Directors and will depend upon our financial condition, operating results, contractual restrictions, restrictions imposed by applicable law and other factors our Board of Directors deems relevant.
34
Table of Contents
Failure to establish, maintain and apply adequate internal control over our financial reporting could affect our reported results of operations.
We are subject to the ongoing internal control provisions of Section 404 of the Sarbanes-Oxley Act of 2002 and the related rules adopted by the SEC and the Public Company Accounting Oversight Board. These provisions provide for the identification of material weaknesses in internal control over financial reporting, which is a process to provide reasonable assurance regarding the reliability of financial reporting for external purposes in accordance with U.S. GAAP. Because of its inherent limitations, internal control over financial reporting is not intended to provide absolute assurance that a misstatement of our financial statements would be prevented or detected. Should we identify a material weakness in internal controls, there can be no assurance that we will be able to remediate the material weaknesses identified in a timely manner or maintain all of the controls necessary to remain in compliance. Any failure to maintain an effective system of internal controls over financial reporting could limit our ability to report our financial results accurately and timely or to detect and prevent fraud. Any such failure could subject us to adverse regulatory consequences, including sanctions by the SEC or violations of applicable stock exchange listing rules, or cause a breach of certain covenants under our financing arrangements. There also could be a negative reaction in the financial markets due to a loss of investor confidence in us and the reliability of our financial statements. Confidence in the reliability of our financial statements also could suffer if we or our independent registered public accounting firm were to report a material weakness in our internal controls over financial reporting. This could materially adversely affect us and lead to a decline in the price of our common stock.
Our operations, including our loyalty and employee engagement programs, are heavily dependent on information technology. Any material failure of such technology, including but not limited to cyber-attacks, could adversely affect our revenues and impair our ability to efficiently operate our business.
We rely heavily on electronic information systems in all aspects of our operations, including (but not limited to) point-of-sale transaction processing in our restaurants; efficient operation of our restaurant kitchens; management of our inventories and overall supply chain; collection of cash; payment of payroll and other obligations; and, various other processes and procedures including our customer loyalty and employee engagement programs. Our ability to efficiently manage our business depends significantly on the reliability and capacity of our in-house information systems and those technology services and systems that we contract for from third parties. Our electronic information systems, including our back-up systems, are subject to damage or interruption from power outages, cyber-attacks, computer and telecommunications failures, computer viruses, internal or external security breaches, catastrophic events such as fires, earthquakes, tornadoes and hurricanes, and/or errors by our employees. The failure of any of these systems to operate effectively, any problems with their maintenance, any issues with upgrades or transitions to replacement systems, or any breaches in data security could cause material interruptions to our operations or harm to individuals in the form of identity theft or improper use of personal information. While we have invested and continue to invest in technology security initiatives and disaster recovery plans, these measures cannot fully insulate us from technology disruption that could result in adverse effects on operations and profits. Although we, with the help of third party service providers and consultants, intend to maintain and upgrade our security technology and establish operational procedures to prevent such damage, breaches, or attacks, there can be no assurance that these security measures will be successful. In addition, advances in computer capabilities, new discoveries in the field of cryptography or other developments could result in a compromise or breach of the algorithms we and our third party service providers use to encrypt and protect customer transaction data. A failure of such security measures could harm our reputation and financial results, as well as subject us to litigation or actions by regulatory authorities. Significant capital investments might be required to remediate any problems, infringements, misappropriations or other third party claims.
We outsource certain essential technology-based business processes to third party vendors that subject us to risks, including disruptions in business, increased costs and risk of data breaches or privacy law compliance issues.
Some of our essential business processes that are dependent on technology are outsourced to third parties. Such processes include, but are not limited to, gift card tracking and authorization, on-line ordering, credit card authorization and processing, certain components of our “BJ’s Premier Rewards” customer loyalty program, certain insurance claims processing, payroll processing, web site hosting and maintenance, data warehousing and business intelligence services, point-of-sale system maintenance, certain tax filings, telecommunications services, web-based labor scheduling and
35
Table of Contents
other key processes. We make a diligent effort to ensure that all providers of outsourced services are observing proper internal control practices, such as redundant processing facilities; however, there are no guarantees that failures will not occur. If the security and information systems that our outsourced third party providers use to store or process such information are compromised or if such third parties otherwise fail to comply with applicable privacy laws and regulations, we could face litigation and the imposition of penalties that could adversely affect our financial performance. Our reputation as a brand or as an employer could also be adversely affected from these types of security breaches or regulatory violations, which could impair our sales or ability to attract and keep qualified employees.
We may incur costs resulting from security risks we face in connection with our electronic processing and transmission of confidential customer information.
We accept electronic payment cards from our customers for payment in our restaurants. A number of restaurant operators and retailers have experienced actual or potential security breaches in which credit and debit card information may have been stolen in addition to other personal information such as our customer’s names, email addresses, home addresses and phone numbers. While we have taken reasonable steps to prevent the occurrence of security breaches in this respect, we may, in the future, become subject to claims for purportedly fraudulent transactions arising out of the actual or alleged theft of credit or debit card information, and we may also be subject to lawsuits or other proceedings in the future relating to these types of incidents. Proceedings related to theft of credit or debit card information may be brought by payment card providers, banks and credit unions that issue cards, cardholders (either individually or as part of a class action lawsuit) and federal and state regulators. Any such proceedings could distract our management from running our business and cause us to incur significant unplanned losses and expenses. Additionally, any publicity related to stolen personal identification from credit and debit card information or other personal information such as our customer’s or employee names, email addresses, home addresses and phone numbers may negatively affect our sales and profitability. We also receive and maintain certain personal information about our customers and employees. The use of this information by us is regulated at the federal and state levels. If our security and information systems are compromised or our employees fail to comply with these laws and regulations and this information is obtained by unauthorized persons or used inappropriately, it could adversely affect our reputation, as well as results of operations, and could result in litigation against us or the imposition of penalties. In addition, our ability to accept credit cards as payment in our restaurants and on-line store depends on us remaining in compliance with standards set by the PCI Security Standards Council. These standards, set by a consortium of the major credit card companies, require certain levels of system security and procedures to protect our customers’ credit card and other personal information. Privacy and information security laws and regulations change over time, and compliance with those changes may result in cost increases due to necessary systems and process changes.
Our federal, state and local tax returns may, from time to time, be selected for audit by the taxing authorities, which may result in tax assessments or penalties that could have a material adverse impact on our results of operations and financial position.
We are subject to federal, state and local taxes. Significant judgment is required in determining the provision for income taxes. Although we believe our tax estimates are reasonable, if the IRS or other taxing authority disagrees with the positions we have taken on our tax returns, we could have additional tax liability, including interest and penalties. If material, payment of such additional amounts, upon final adjudication of any disputes, could have a material impact on our results of operations and financial position. The cost of complying with new tax rules, laws or regulations could be significant. Increases in federal or state statutory tax rates and other changes in tax laws, rules or regulations may increase our effective tax rate. Any increase in our effective tax rate could have a material impact on our financial results.
Unsolicited takeover proposals, governance change proposals, proxy contests and certain proposals/actions by activist investors may create additional risks and uncertainties with respect to the Company’s financial position, operations, strategies and management, and may adversely affect our ability to attract and retain key employees. Any perceived uncertainties may affect the market price and volatility of our securities.
Public companies in the restaurant industry have been the target of unsolicited takeover proposals in the past. In the event that a third party, such as a competitor, private equity firm or activist investor makes an unsolicited takeover proposal, or proposes to change our governance policies or board of directors, or makes other proposals concerning the
36
Table of Contents
Company’s ownership structure or operations, our review and consideration of such proposals may be a significant distraction for our management and employees, and could require us to expend significant time and resources. Such proposals may create uncertainty for our employees’ additional risks and uncertainties with respect to the Company’s financial position, operations, strategies and management, and may adversely affect our ability to attract and retain key employees. Any perceived uncertainties as to our future direction also could affect the market price and volatility of our securities.
Any suspension of, or failure to repurchase the Company’s stock up to the maximum amounts permitted under, our previously announced repurchase program may negatively impact investor perception of us, and could therefore affect the market price and volatility of our stock.
Our stock repurchase program may require us to use a significant portion of our cash flow from operations and/or may require us to incur indebtedness utilizing our existing Credit Facility or some other form of debt financing. Our ability to repurchase stock will depend on our ability to generate sufficient cash flows from operations, as supplemented by proceeds from the exercise of employee stock options and our capacity to borrow funds, which may be subject to economic, financial, competitive and other factors that are beyond our control. The inability to complete stock repurchases under our previously announced repurchase program may negatively impact investor perception of us, and could therefore affect the market price and volatility of our stock.
| ITEM 1B. | UNRESOLVED STAFF COMMENTS |
None.
| ITEM 2. | PROPERTIES |
RESTAURANT LOCATIONS
As of February 27, 2017, we operated a total of 189 restaurants as follows:
| BJ’s Pizza & Grill® |
BJ’s Grill® |
BJ’s Restaurant & Brewhouse® |
BJ’s Restaurant & Brewery® |
Total | ||||||||||
| Alabama |
– | – | 1 | – | 1 | |||||||||
| Arizona |
– | – | 5 | 1 | 6 | |||||||||
| Arkansas |
– | – | 2 | – | 2 | |||||||||
| California |
3 | 1 | 53 | 6 | 63 | |||||||||
| Colorado |
– | – | 5 | – | 5 | |||||||||
| Florida |
– | – | 22 | – | 22 | |||||||||
| Indiana |
– | – | 3 | – | 3 | |||||||||
| Kansas |
– | – | 1 | – | 1 | |||||||||
| Kentucky |
– | – | 3 | – | 3 | |||||||||
| Louisiana |
– | – | 3 | – | 3 | |||||||||
| Maryland |
– | – | 4 | – | 4 | |||||||||
| Nevada |
– | – | 4 | 1 | 5 | |||||||||
| New Jersey |
– | – | 1 | – | 1 | |||||||||
| New Mexico |
– | – | 2 | – | 2 | |||||||||
| New York |
– | – | 2 | – | 2 | |||||||||
| North Carolina |
– | – | 2 | – | 2 | |||||||||
| Ohio |
– | – | 10 | – | 10 | |||||||||
| Oklahoma |
– | – | 3 | – | 3 | |||||||||
| Oregon |
– | – | 2 | 1 | 3 | |||||||||
| Pennsylvania |
– | – | 4 | – | 4 | |||||||||
| Tennessee |
– | – | 1 | – | 1 | |||||||||
| Texas |
– | – | 33 | 1 | 34 | |||||||||
| Virginia |
– | – | 5 | – | 5 | |||||||||
| Washington |
– | – | 4 | – | 4 | |||||||||
|
|
|
|
|
|
|
| ||||||||
| 3 | 1 | 175 | 10 | 189 | ||||||||||
|
|
|
|
|
|
|
| ||||||||
37
Table of Contents
As of February 27, 2017, the average interior square footage of our restaurants was approximately 8,100 square feet. Many of our restaurants also have outdoor patios that are utilized when weather conditions permit.
As of February 27, 2017, 185 of our 189 existing restaurants are located on leased properties. We own the underlying land for four of our operating restaurants and our Texas brewpub locations. We also own two parcels of land adjacent to two of our operating restaurants. There can be no assurance that we will be able to renew expiring leases after the expiration of all remaining renewal options. Most of our restaurant leases provide for contingent rent based on a percentage of restaurant sales (to the extent this amount exceeds a minimum base rent) and payment of certain occupancy-related expenses. We own substantially all of the equipment, furnishings and trade fixtures in our restaurants. Our restaurant support center (“RSC”) is located in an approximate 56,000 square foot leased space in Huntington Beach, California. Our RSC lease expires August 31, 2018.
See Note 5 of Notes to Consolidated Financial Statements in Part IV, Item 15 of this Annual Report on Form 10-K for a summary of legal proceedings.
ITEM 4. MINE SAFETY DISCLOSURES
Not applicable.
PART II
ITEM 5. MARKET FOR REGISTRANT’S COMMON EQUITY, RELATED SHAREHOLDER MATTERS AND ISSUER PURCHASES OF EQUITY SECURITIES
Market Information
Our common stock (symbol BJRI) trades on the NASDAQ Global Select Market. All stock prices are closing prices per the NASDAQ Global Select Market. On February 24, 2017, the closing price of our common stock was $37.25 per share. The table below shows our high and low common stock closing prices as reported by the NASDAQ Global Select Market.
| Common Stock | ||||||||||||
| High | Low | |||||||||||
| Fiscal 2016 |
||||||||||||
| First Quarter |
$46.29 | $39.52 | ||||||||||
| Second Quarter |
$47.36 | $40.80 | ||||||||||
| Third Quarter |
$44.83 | $36.36 | ||||||||||
| Fourth Quarter |
$40.15 | $33.65 | ||||||||||
| Fiscal 2015 |
||||||||||||
| First Quarter |
$53.60 | $43.81 | ||||||||||
| Second Quarter |
$53.44 | $45.56 | ||||||||||
| Third Quarter |
$51.83 | $42.14 | ||||||||||
| Fourth Quarter |
$46.86 | $41.43 | ||||||||||
As of February 27, 2017, we had approximately 80 shareholders of record and we estimate that there were approximately 14,000 beneficial shareholders.
Stock Performance Graph
The following chart compares the five-year cumulative total stock performance of our common stock, the S&P 500 Index and a peer group consisting of: Bloomin’ Brands, Inc., Bravo Brio Restaurant Group, Brinker International, Inc., Buffalo Wild Wings, Inc., The Cheesecake Factory Incorporated, Chuy’s Holdings, Inc., Darden Restaurants, Inc., Famous Dave’s of America, Inc., Ignite Restaurant Group, Kona Grill, Inc., Red Robin Gourmet Burgers, Inc., Ruby
38
Table of Contents
Tuesday, Inc. (GA), and Texas Roadhouse, Inc. (Class A). Bloomin’ Brands, Inc., Chuy’s Holdings, Inc. and Ignite Restaurant Group became publicly traded companies during fiscal 2012; therefore, the peer group data only includes their price information beginning in 2012. The peer group companies all compete in the “casual dining” segment of the restaurant industry. The graph assumes that $100 was invested on December 31, 2011, in our common stock and in each of the indices and that all dividends were reinvested. The measurement points utilized in the graph consist of the last trading day in each calendar year, which closely approximates the last day of our respective fiscal year. The historical stock performance presented below is not intended to and may not be indicative of future stock performance.
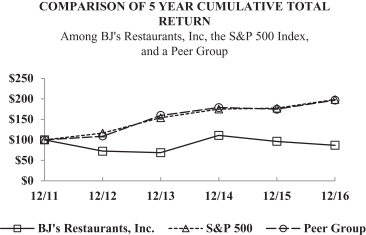
Calculation of Aggregate Market Value of Non-Affiliate Shares
For purposes of calculating the aggregate market value of shares of our common stock held by non-affiliates as set forth on the cover page of this Annual Report on Form 10-K, we have assumed that all outstanding shares are held by non-affiliates, except for shares held by each of our executive officers, directors and 5% or greater stockholders. In the case of 5% or greater stockholders, we have not deemed such stockholders to be affiliates unless there are facts and circumstances which would indicate that such stockholders exercise any control over our company, or unless they hold 10% or more of our outstanding common stock. These assumptions should not be deemed to constitute an admission that all executive officers, directors and 5% or greater stockholders are, in fact, affiliates of our company, or that there are not other persons who may be deemed to be affiliates of our company. Further information concerning shareholdings of our officers, directors and principal stockholders is included or incorporated by reference in Part III, Item 12 of this Annual Report on Form 10-K.
39
Table of Contents
Stock-Based Compensation Plan Information
We have a shareholder approved stock-based compensation plan, the 2005 Equity Incentive Plan (“the Plan”), under which we may issue shares of our common stock to employees, officers, directors and consultants. Under the Plan, we have granted incentive stock options, non-qualified stock options and restricted stock units. The following table provides information about the shares of our common stock that may be issued upon exercise of awards as of January 3, 2017 (share numbers in thousands):
| Number of Securities to be Issued Upon Exercise of Outstanding Stock Options and Vesting of Restricted Stock Units |
Weighted Average Exercise Price of Outstanding Stock Options and Restricted Stock Units |
Number of Securities Remaining Available for Future Issuance Under Stock-Based Compensation Plans |
||||||||||
| Stock-based compensation plans approved by shareholders | 1,741 | $ | 31.95 | 1,146 | ||||||||
| Stock-based compensation plans not approved by shareholders | – | $– | – | |||||||||
Dividend Policy and Stock Repurchases
The continued operation and expansion of our business will require substantial funding. Accordingly, we have not paid any dividends since our inception and have currently not allocated any funds for the payment of dividends. Rather, it is our current policy to retain earnings, if any, for expansion of our operations, remodeling and investing in our existing restaurants, other general corporate purposes and, to the extent that the Board believes appropriate in light of market conditions, the repurchase of shares of our common stock pursuant to Board-approved share repurchase plans. We currently do not pay any dividends to our shareholders. Any determination to pay dividends in the future will be at the discretion of our Board of Directors and will depend upon our financial condition, operating results, contractual restrictions, restrictions imposed by applicable law and other factors our Board of Directors deems relevant. Our Credit Facility contains, and debt instruments that we enter into in the future may contain, covenants that place limitations on the amount of dividends we may pay.
As of January 3, 2017, we have cumulatively repurchased shares valued at approximately $290.5 million in accordance with our approved share repurchase plan. Approximately $95.0 million of these shares were repurchased during fiscal 2016. The share repurchases were executed through open market purchases, and future share repurchases may be completed through the combination of individually-negotiated transactions, accelerated share buyback, and/or open market purchases. As of January 3, 2017, we have approximately $59.5 million available under the current $350 million share repurchase plan approved by our Board of Directors. Our Credit Facility does not contain any restrictions on the amount of borrowings that can be used to make share repurchases as long as we are in compliance with our financial and non-financial covenants.
40
Table of Contents
The following table sets forth information with respect to the repurchase of common shares during fiscal 2016:
| Period (1) | Total of Shares |
Average Price Paid Per Share |
Total Number of Shares Purchased as Part of the Publicly Announced Plans |
Increase in Dollars for Share Repurchase Authorization |
Approximate Dollar Value of Shares that May Yet Be Purchased Under the Plans or Programs |
|||||||||||||||
| 12/30/15 –01/26/16 | 452,584 | $42.02 | 452,584 | $– | $35,577,501 | |||||||||||||||
| 01/27/16 – 02/23/16 | 134,880 | $41.88 | 134,880 | $– | $29,920,906 | |||||||||||||||
| 02/24/16 – 03/29/16 | – | $– | – | $– | $29,920,906 | |||||||||||||||
| 03/30/16 – 04/26/16 | – | $– | – | $– | $29,920,906 | |||||||||||||||
| 04/27/16 – 05/24/16 | – | $– | – | $– | $29,920,906 | |||||||||||||||
| 05/25/16 – 06/28/16 | – | $– | – | $– | $29,920,906 | |||||||||||||||
| 06/29/16 – 07/26/16 | – | $– | – | $– | $29,920,906 | |||||||||||||||
| 07/27/16 – 08/23/16 | 90,715 | $40.25 | 90,715 | $100,000,000 | $126,275,914 | |||||||||||||||
| 08/24/16 – 09/27/16 | 496,655 | $38.98 | 496,655 | $– | $107,074,253 | |||||||||||||||
| 09/28/16 – 10/25/16 | 361,680 | $36.03 | 361,680 | $– | $94,027,653 | |||||||||||||||
| 10/26/16 – 11/22/16 | 774,123 | $36.71 | 774,123 | $– | $66,105,671 | |||||||||||||||
| 11/23/16 – 01/03/17 | 170,991 | $38.94 | 170,991 | $– | $59,464,608 | |||||||||||||||
|
|
|
|||||||||||||||||||
| Total |
2,481,628 | $38.28 | 2,481,628 | |||||||||||||||||
|
|
|
|||||||||||||||||||
| (1) | Period information is presented in accordance with our fiscal months during fiscal 2016. |
41
Table of Contents
ITEM 6. SELECTED CONSOLIDATED FINANCIAL DATA
The following selected consolidated financial and operating data for the five fiscal years ended January 3, 2017, are derived from our audited consolidated financial statements. This selected consolidated financial and operating data should be read in conjunction with the consolidated financial statements and accompanying notes, “Management’s Discussion and Analysis of Financial Condition and Results of Operations” and other financial information included elsewhere in this report.
| Fiscal Year | ||||||||||||||||||||
| 2016 (1) | 2015 | 2014 | 2013 | 2012 | ||||||||||||||||
| (in thousands, except per share data) | ||||||||||||||||||||
| Revenues |
$993,052 | $919,597 | $845,569 | $775,125 | $708,325 | |||||||||||||||
| Restaurant operating costs (excluding depreciation and amortization): |
||||||||||||||||||||
| Cost of sales |
251,460 | 226,942 | 212,979 | 191,891 | 175,636 | |||||||||||||||
| Labor and benefits |
345,370 | 317,050 | 298,703 | 273,458 | 245,078 | |||||||||||||||
| Occupancy and operating |
204,583 | 192,739 | 182,149 | 173,981 | 150,312 | |||||||||||||||
| General and administrative |
55,373 | 53,827 | 51,558 | 49,105 | 45,131 | |||||||||||||||
| Depreciation and amortization |
64,275 | 59,417 | 55,387 | 49,007 | 41,347 | |||||||||||||||
| Restaurant opening |
6,977 | 6,562 | 4,973 | 9,132 | 8,440 | |||||||||||||||
| Loss on disposal of assets and impairments |
2,971 | 2,908 | 1,963 | 3,879 | 557 | |||||||||||||||
| Gain on lease termination, net |
– | (2,910) | – | – | – | |||||||||||||||
| Legal and other settlements |
402 | – | 2,431 | 812 | 959 | |||||||||||||||
|
|
|
|
|
|
|
|
|
|
|
|||||||||||
| Total costs and expenses |
931,411 | 856,535 | 810,143 | 751,265 | 667,460 | |||||||||||||||
| Income from operations |
61,641 | 63,062 | 35,426 | 23,860 | 40,865 | |||||||||||||||
| Other (expense) income: |
||||||||||||||||||||
| Interest (expense) income, net |
(1,730) | (1,015) | (238) | 133 | 222 | |||||||||||||||
| Gain on investment settlement |
– | – | – | – | 797 | |||||||||||||||
| Other income, net |
1,180 | 60 | 1,135 | 1,019 | 772 | |||||||||||||||
|
|
|
|
|
|
|
|
|
|
|
|||||||||||
| Total other (expense) income |
(550) | (955) | 897 | 1,152 | 1,791 | |||||||||||||||
| Income before income taxes |
61,091 | 62,107 | 36,323 | 25,012 | 42,656 | |||||||||||||||
| Income tax expense |
15,534 | 16,782 | 8,926 | 3,990 | 11,247 | |||||||||||||||
|
|
|
|
|
|
|
|
|
|
|
|||||||||||
| Net income |
$45,557 | $45,325 | $27,397 | $21,022 | $31,409 | |||||||||||||||
|
|
|
|
|
|
|
|
|
|
|
|||||||||||
| Net income per share: |
||||||||||||||||||||
| Basic |
$1.91 | $1.76 | $0.99 | $0.75 | $1.12 | |||||||||||||||
|
|
|
|
|
|
|
|
|
|
|
|||||||||||
| Diluted |
$1.88 | $1.73 | $0.97 | $0.73 | $1.09 | |||||||||||||||
|
|
|
|
|
|
|
|
|
|
|
|||||||||||
| Weighted average number of shares outstanding: |
||||||||||||||||||||
| Basic |
23,824 | 25,718 | 27,710 | 28,194 | 27,994 | |||||||||||||||
|
|
|
|
|
|
|
|
|
|
|
|||||||||||
| Diluted |
24,233 | 26,231 | 28,316 | 28,895 | 28,857 | |||||||||||||||
|
|
|
|
|
|
|
|
|
|
|
|||||||||||
| Consolidated Balance Sheets Data (end of period): |
||||||||||||||||||||
| Cash and cash equivalents |
$22,761 | $34,604 | $30,683 | $22,995 | $15,074 | |||||||||||||||
| Marketable securities |
$– | $– | $– | $9,791 | $25,850 | |||||||||||||||
| Total assets |
$708,879 | $681,665 | $647,083 | $610,879 | $559,521 | |||||||||||||||
| Total long-term debt (including current portion) |
$148,000 | $100,500 | $58,000 | $– | $– | |||||||||||||||
| Shareholders’ equity |
$274,897 | $316,483 | $348,689 | $401,436 | $371,834 | |||||||||||||||
| (1) | Fiscal 2016 consists of 53 weeks. All other fiscal years presented consist of 52 weeks. |
42
Table of Contents
ITEM 7. MANAGEMENT’S DISCUSSION AND ANALYSIS OF FINANCIAL CONDITION AND RESULTS OF OPERATIONS
GENERAL
As of February 27, 2017, we owned and operated 189 restaurants located in 24 states as described in Item 2 - Properties - “Restaurant Locations” in this Form 10-K. Each of our restaurants is operated either as a BJ’s Restaurant & Brewhouse®, a BJ’s Restaurant & Brewery®, a BJ’s Pizza & Grill®, or a BJ’s Grill® restaurant. Currently, the BJ’s Restaurant & Brewhouse® format represents our primary future expansion vehicle. Our proprietary craft beer is produced at several of our BJ’s Restaurant & Brewery® locations, our Temple, Texas brewpub locations and by independent third party brewers using our proprietary recipes. Our BJ’s Pizza & Grill® restaurants are smaller format full-service restaurants relative to our BJ’s Restaurant & Brewhouse® and BJ’s Restaurant & Brewery® locations and reflect the original format of the BJ’s restaurant concept that was first introduced in 1978. Our BJ’s Grill® restaurant is a slightly smaller footprint restaurant, compared to our BJ’s Restaurant & Brewhouse® format, featuring all the amenities of our Brewhouse locations. Our menu features BJ’s award-winning, signature deep-dish pizza, our proprietary craft and other beers, as well as a wide selection of appetizers, entrées, pastas, sandwiches, specialty salads and desserts, including our Pizookie® dessert.
We intend to continue developing and opening new BJ’s restaurants in high profile locations within densely populated areas in both existing and new markets. Since most of our established restaurants currently operate close to full capacity during the peak demand periods of lunch and dinner, and given our relatively high average sales per productive square foot, we generally do not expect to achieve sustained increases in comparable restaurant sales in excess of our annual effective menu price increases for our mature restaurants, assuming we are able to retain our customer traffic levels in those restaurants. Therefore, we currently expect that the majority of our year-over-year revenue growth for fiscal 2017 will be derived from new restaurant openings and the carryover impact of partial-year openings during fiscal 2016.
Newly opened restaurants typically experience inefficiencies in the form of higher cost of sales, labor and direct operating and occupancy costs for several months after their opening in both percentage and dollar terms when compared with our more mature, established restaurants. Accordingly, the number and timing of newly opened restaurants has had, and is expected to continue to have, an impact on restaurant opening expenses, cost of sales, labor and occupancy and operating expenses. Additionally, initial restaurant openings in new markets may experience even greater inefficiencies for several months, if not longer, due to lower initial sales volumes, which results from initially low consumer awareness levels, and a lack of supply chain and other operating cost leverage until additional restaurants can be opened in those markets.
Our revenues are comprised of food and beverage sales at our restaurants. Revenues from restaurant sales are recognized when payment is tendered at the point of sale. Amounts paid with a credit card are recorded in accounts and other receivables until payment is collected. Revenues from our gift cards are recognized upon redemption in our restaurants. Gift card breakage is recognized as a component of “Other income, net” on our Consolidated Statements of Income. Gift card breakage is recorded when the likelihood of redemption becomes remote, which is typically after 24 months from the original gift card issuance date.
In calculating comparable company-owned restaurant sales, we include a restaurant in the comparable base once it has been open for 18 months. Customer traffic for our restaurants is estimated based on individual customer checks.
Cost of sales is comprised of food and beverage costs, including the cost to produce and distribute our proprietary craft beer, soda and ciders. The components of cost of sales are variable and typically fluctuate directly with sales volumes, but may be impacted by changes in commodity prices or varying levels of promotional activities.
Labor and benefit costs include direct hourly and management wages, bonuses, payroll taxes, fringe benefits and stock-based compensation and workers’ compensation expense that is directly related to restaurant level employees.
Occupancy and operating expenses include restaurant supplies, credit card fees, marketing costs, fixed rent, percentage rent, common area maintenance charges, utilities, real estate taxes, repairs and maintenance and other related restaurant costs.
43
Table of Contents
General and administrative costs include all corporate, field supervision and administrative functions that support existing operations and provide infrastructure to facilitate our future growth. Components of this category include corporate management, field supervision and corporate hourly staff salaries and related employee benefits (including stock-based compensation expense and cash-based incentive compensation), travel and relocation costs, information systems, the cost to recruit and train new restaurant management employees, corporate rent, certain brand marketing-related expenses and legal, professional and consulting fees.
Depreciation and amortization are composed primarily of depreciation on capital expenditures for restaurant and brewing equipment and leasehold improvements.
Restaurant opening expenses, which are expensed as incurred, consist of the costs of hiring and training the initial hourly work force for each new restaurant, travel, the cost of food and supplies used in training, grand opening promotional costs, the cost of the initial stock of operating supplies and other direct costs related to the opening of a restaurant, including rent during the construction and in-restaurant training period.
In January 2016, we closed our Century City, California restaurant as a result of our landlord exercising their right to terminate our lease in return for a termination fee due to the mall being remodeled and reconfigured. While we currently expect to pursue the renewal of substantially all of our expiring restaurant leases, there is no guarantee that we can mutually agree to a new lease that is satisfactory to our landlord and us or that, if renewed, rents will not increase substantially.
RESULTS OF OPERATIONS
The following table sets forth, for the years indicated, our Consolidated Statements of Income expressed as percentages of total revenues. All fiscal years presented consist of 52 weeks with the exception of fiscal year 2016 which consists of 53 weeks. Percentages below may not reconcile due to rounding.
| Fiscal Year | ||||||||||||||||||||
| 2016 | 2015 | 2014 | 2013 | 2012 | ||||||||||||||||
| Revenues |
100.0% | 100.0% | 100.0% | 100.0% | 100.0% | |||||||||||||||
| Restaurant operating costs (excluding depreciation and amortization): |
||||||||||||||||||||
| Cost of sales |
25.3 | 24.7 | 25.2 | 24.8 | 24.8 | |||||||||||||||
| Labor and benefits |
34.8 | 34.5 | 35.3 | 35.3 | 34.6 | |||||||||||||||
| Occupancy and operating |
20.6 | 21.0 | 21.5 | 22.4 | 21.2 | |||||||||||||||
| General and administrative |
5.6 | 5.9 | 6.1 | 6.3 | 6.4 | |||||||||||||||
| Depreciation and amortization |
6.5 | 6.5 | 6.6 | 6.3 | 5.8 | |||||||||||||||
| Restaurant opening |
0.7 | 0.7 | 0.6 | 1.2 | 1.2 | |||||||||||||||
| Loss on disposal of assets and impairments |
0.3 | 0.3 | 0.2 | 0.5 | 0.1 | |||||||||||||||
| Gain on lease termination, net |
– | (0.3) | – | – | – | |||||||||||||||
| Legal and other settlements |
– | – | 0.3 | 0.1 | 0.1 | |||||||||||||||
|
|
|
|
|
|
|
|
|
|
|
|||||||||||
| Total costs and expenses |
93.8 | 93.1 | 95.8 | 96.9 | 94.2 | |||||||||||||||
| Income from operations |
6.2 | 6.9 | 4.2 | 3.1 | 5.8 | |||||||||||||||
| Other (expense) income: |
||||||||||||||||||||
| Interest expense, net |
(0.2) | (0.1) | – | – | – | |||||||||||||||
| Gain on investment settlement |
– | – | – | – | 0.1 | |||||||||||||||
| Other income, net |
0.1 | – | 0.1 | 0.1 | 0.1 | |||||||||||||||
|
|
|
|
|
|
|
|
|
|
|
|||||||||||
| Total other (expense) income |
(0.1) | (0.1) | 0.1 | 0.1 | 0.3 | |||||||||||||||
| Income before income taxes |
6.2 | 6.8 | 4.3 | 3.2 | 6.0 | |||||||||||||||
| Income tax expense |
1.6 | 1.8 | 1.1 | 0.5 | 1.6 | |||||||||||||||
|
|
|
|
|
|
|
|
|
|
|
|||||||||||
| Net income |
4.6% | 4.9% | 3.2% | 2.7% | 4.4% | |||||||||||||||
|
|
|
|
|
|
|
|
|
|
|
|||||||||||
44
Table of Contents
53 WEEKS ENDED JANUARY 3, 2017 (FISCAL 2016) COMPARED TO THE 52 WEEKS ENDED DECEMBER 29, 2015 (FISCAL 2015)
Revenues. Total revenues increased by $73.5 million, or 8.0%, to $993.1 million during fiscal 2016 from $919.6 million during fiscal 2015. The increase in revenues primarily consisted of an approximate $70.1 million increase in sales from new restaurants not yet in our comparable restaurant sales base, $21.2 million of sales due to the 53rd week, offset by an approximate 1.3%, or $11.3 million decrease in comparable restaurant sales on a 52 week basis, and a $6.5 million decrease in restaurant sales due to the closure of our La Jolla, California restaurant in August 2015 and our Century City, California restaurant in January 2016. On a 52 week basis the decrease in comparable restaurant sales resulted from a reduction in customer traffic of approximately 2.6%, partially offset by an increase in the average check, menu mix and incident rates of approximately 1.3%.
Cost of Sales. Cost of sales increased by $24.5 million, or 10.8%, to $251.5 million during fiscal 2016 compared to $226.9 million during fiscal 2015. This increase was primarily due to the opening of 17 new restaurants during fiscal 2016 coupled with the impact of the 53rd week. As a percentage of revenues, cost of sales increased to 25.3% for fiscal 2016 from 24.7% for the prior fiscal year. Substantially all of the increase in cost of sales, as a percentage of revenues, resulted from our decision at the beginning of fiscal 2016 to no longer allocate the food costs related to certain promotional activities to occupancy and operating expenses. This change presents our cost of sales and promotional activities consistently with casual dining industry practices.
Labor and Benefits. Labor and benefit costs for our restaurants increased by $28.3 million, or 8.9%, to $345.4 million during fiscal 2016 compared to $317.1 million during fiscal 2015. This increase was primarily due to the opening of 17 new restaurants during fiscal 2016 coupled with the impact of the 53rd week. As a percentage of revenues, labor and benefit costs increased to 34.8% for fiscal 2016 from 34.5% for the prior fiscal year. The percentage increase was driven by higher hourly labor primarily related to minimum wage increases coupled with the deleveraging of fixed management labor and benefit costs as a result of negative comparable restaurant sales. Included in labor and benefits for fiscal 2016 and 2015 was approximately $1.8 million and $1.4 million, or 0.2% of revenues, respectively, of stock-based compensation expense related to equity awards granted in accordance with our Gold Standard Stock Ownership Program for certain restaurant management team members.
Occupancy and Operating. Occupancy and operating expenses increased by $11.8 million, or 6.1%, to $204.6 million during fiscal 2016 compared to $192.7 million during fiscal 2015. This increase was primarily due to the opening of 17 new restaurants during fiscal 2016 coupled with the impact of the 53rd week. As a percentage of revenues, occupancy and operating expenses decreased to 20.6% for fiscal 2016 from 21.0% for the prior fiscal year. This percentage decrease was due to the change in the allocation of food costs related to certain promotional activities. Beginning in fiscal 2016, we no longer allocate these food costs to occupancy and operating expenses.
General and Administrative. General and administrative expenses increased by $1.5 million, or 2.9%, to $55.4 million during fiscal 2016 compared to $53.8 million during fiscal 2015. The increase in general and administrative costs was primarily due to higher field supervision and support costs to manage our increasing number of restaurants coupled with the impact of the 53rd week, offset by lower corporate incentive compensation of approximately $1.9 million. As a percentage of revenues, general and administrative expenses decreased to 5.6% for fiscal 2016 from 5.9% for the prior fiscal year. This percentage decrease was primarily due to our ability to leverage the fixed component of these expenses over a higher revenue base from new restaurants and lower incentive compensation. Also included in general and administrative costs for fiscal 2016 and 2015 was approximately $3.7 million and $4.0 million, respectively, or 0.4% of revenues, of stock-based compensation expense.
Depreciation and Amortization. Depreciation and amortization increased by $4.9 million, or 8.2%, to $64.3 million during fiscal 2016 compared to $59.4 million during fiscal 2015. This increase was primarily due to depreciation expense related to the 17 new restaurants opened during fiscal 2016. As a percentage of revenues, depreciation and amortization was 6.5% for both fiscal 2016 and the prior fiscal year. Depreciation and amortization did not change as a percentage of sales primarily due to the impact of the 53rd week.
Restaurant Opening. Restaurant opening expense was $7.0 million during fiscal 2016 compared to $6.6 million during fiscal 2015. This increase is due to the opening of 17 new restaurants during fiscal 2016, compared to 16 new restaurants during the prior fiscal year.
45
Table of Contents
Loss on Disposal and Impairment of Assets. The loss on disposal and impairment of assets was $3.0 million during fiscal 2016 compared to $2.9 million during fiscal 2015. These costs primarily related to the disposal of certain unproductive restaurant assets.
Legal and Other Settlements. Legal and other settlement expense was approximately $0.4 million during fiscal 2016 and related to the settlement of a wage and hour claim.
Gain on Lease Termination, Net. Gain on lease termination, net was $2.9 million during fiscal 2015 and related to the closure of our Century City, California restaurant as a result of our landlord exercising their right to terminate our lease. Our Century City restaurant was located at The Westfield Century City Mall, which was being significantly reconfigured and renovated, requiring the restaurant to be closed by the end of January 2016. As a result of the forced lease termination, we recorded a $6.0 million termination fee receivable in accordance with our lease provision. This fee offset by the remaining net book value of the restaurants fixed assets resulted in this net gain.
Income Tax Expense. Our effective income tax rate for fiscal 2016 was 25.4% compared to 27.0% for fiscal 2015. The effective income tax rate for fiscal 2016 differed from the statutory income tax rate primarily due to tax credits.
52 WEEKS ENDED DECEMBER 29, 2015 (FISCAL 2015) COMPARED TO THE 52 WEEKS ENDED DECEMBER 30, 2014 (FISCAL 2014)
Revenues. Total revenues increased by $74.0 million, or 8.8%, to $919.6 million during fiscal 2015 from $845.6 million during fiscal 2014. The increase in revenues primarily consisted of an increase of approximately $60.7 million in sales from new restaurants not yet in our comparable restaurant sales base coupled with an approximate 1.7%, or $13.3 million increase in comparable restaurant sales. The increase in comparable restaurant sales resulted from an increase in the average check and menu mix of approximately 3.1%, offset by a reduction in customer traffic of approximately 1.4%.
Cost of Sales. Cost of sales increased by $14.0 million, or 6.6%, to $226.9 million during fiscal 2015 compared to $213.0 million during fiscal 2014. This increase was primarily due to the opening of 16 new restaurants during fiscal 2015. As a percentage of revenues, cost of sales decreased to 24.7% for fiscal 2015 from 25.2% for the prior fiscal year. The percentage decrease was primarily related to lower commodity costs, a shift in our menu mix and increased menu pricing.
Labor and Benefits. Labor and benefit costs for our restaurants increased by $18.3 million, or 6.1%, to $317.1 million during fiscal 2015 compared to $298.7 million during fiscal 2014. This increase was primarily due to the opening of 16 new restaurants during fiscal 2015. As a percentage of revenues, labor and benefit costs decreased to 34.5% for fiscal 2015 from 35.3% for the prior fiscal year. The percentage decrease was primarily related to improved hourly labor productivity, coupled with our ability to leverage the fixed component of these expenses as a result of comparable restaurant sales increases. Included in labor and benefits for fiscal 2015 and 2014 was approximately $1.4 million and $1.5 million, respectively, or 0.2% of revenues, of stock-based compensation expense related to equity awards granted in accordance with our Gold Standard Stock Ownership Program for certain restaurant management employees.
Occupancy and Operating. Occupancy and operating expenses increased by $10.6 million, or 5.8%, to $192.7 million during fiscal 2015 compared to $182.1 million during fiscal 2014. This increase was primarily due to the opening of 16 new restaurants during fiscal 2015. As a percentage of revenues, occupancy and operating expenses decreased to 21.0% for fiscal 2015 from 21.5% for the prior fiscal year. This percentage decrease was a result of lower repairs and maintenance, supply costs and marketing spend, coupled with our ability to leverage the fixed component of these expenses as a result of comparable restaurant sales increases.
General and Administrative. General and administrative expenses increased by $2.3 million, or 4.4%, to $53.8 million during fiscal 2015 compared to $51.6 million during fiscal 2014. The increase in general and administrative costs was primarily due to higher field supervision and support costs to manage our increasing number of restaurants. As a percentage of revenues, general and administrative expenses decreased to 5.9% for fiscal 2015 from 6.1% for the prior fiscal year. This percentage decrease was primarily due to our ability to leverage the fixed component of these expenses over a higher revenue base from new restaurants and our comparable restaurant sales increases. Also included in general and administrative costs for fiscal 2015 and 2014 was $4.0 million and $3.2 million, respectively, or 0.4% of revenues, of stock-based compensation expense.
46
Table of Contents
Depreciation and Amortization. Depreciation and amortization increased by $4.0 million, or 7.3%, to $59.4 million during fiscal 2015 compared to $55.4 million during fiscal 2014. As a percentage of revenues, depreciation and amortization decreased to 6.5% for fiscal 2015 from 6.6% for the prior fiscal year. This slight percentage decrease was principally a result of our ability to leverage the fixed component of these expenses as a result of comparable restaurant sales increases.
Restaurant Opening. Restaurant opening expenses increased by $1.6 million, or 32.0%, to $6.6 million during fiscal 2015 compared to $5.0 million during fiscal 2014. This increase was due to the opening of 16 new restaurants during fiscal 2015, compared to 11 new restaurants during the prior fiscal year coupled with the reduction in the average opening cost per restaurant.
Loss on Disposal of Assets and Impairments. Loss on disposal of assets and impairments increased by $0.9 million, or 48.1%, to $2.9 million during fiscal 2015 compared to $2.0 million during fiscal 2014. For fiscal 2015, these costs primarily related to the routine disposal of certain underproductive restaurant assets as a result of restaurant enhancement and other initiatives, coupled with the reduction in the carrying value of two of our legacy BJ’s Pizza & Grill® restaurants upon the expiration of their leases. During fiscal 2014, these costs related to the routine disposal of certain unproductive restaurant assets as a result of restaurant enhancements and other initiatives and the write off of the remaining net book value of assets related to the subsequent closure of our two smaller format legacy BJ’s Pizza & Grill® restaurants in Belmont Shore and La Jolla, California.
Gain on Lease Termination, Net. Gain on lease termination, net was $2.9 million during fiscal 2015 and related to the closure of our Century City, California restaurant as a result of our landlord exercising their right to terminate our lease. Our Century City restaurant was located at The Westfield Century City Mall, which was being significantly reconfigured and renovated, requiring the restaurant to be closed by the end of January 2016. As a result of the forced lease termination, we recorded a $6.0 million termination fee receivable in accordance with our lease provision. This fee offset by the remaining net book value of the restaurants fixed assets resulted in this net gain. In January 2016, we received the $6.0 million termination fee from the landlord.
Income Tax Expense. Our effective income tax rate for fiscal 2015 was 27.0% compared to 24.6% for fiscal 2014. The effective income tax rate for fiscal 2015 differed from the statutory income tax rate primarily due to tax credits.
LIQUIDITY AND CAPITAL RESOURCES
The following tables set forth, for the periods indicated, a summary of our key liquidity measurements (dollar amounts in thousands):
| January 3, 2017 | December 29, 2015 | |||||||
| Cash and cash equivalents |
$22,761 | $34,604 | ||||||
| Net working capital |
$(48,625) | $(23,891) | ||||||
| Current ratio |
0.6:1.0 | 0.8:1.0 | ||||||
| Fiscal Year | ||||||||
| 2016 | 2015 | |||||||
| Cash provided by operating activities |
$138,359 | $127,224 | ||||||
| Capital expenditures |
$109,363 | $86,070 | ||||||
Our capital requirements are driven by our fundamental financial objective to improve total shareholder return through new restaurant expansion plans and restaurant enhancements and initiatives. In addition, we want to maintain a flexible and prudent balance sheet to provide the financial resources necessary to manage the risks and uncertainty of conducting our business operations in a mature segment of the restaurant industry. In order to achieve these objectives we use a combination of operating cash flows, funded debt and landlord allowances. Over the last several years we have been augmenting our strong cash flow from operations by increasing our funded debt and using these proceeds to return capital to shareholders in the form of share repurchases. A dividend might be considered by our Board of Directors in the future as part of our total shareholder return objective.
47
Table of Contents
We currently estimate the total domestic capacity for BJ’s restaurants to be at least 425, given the size of our current restaurant prototype and the current structure of the BJ’s concept and menu. We expect to fund our growth plans from our ongoing operations, our cash balance on hand, proceeds from employee stock option exercises, tenant improvement allowances from our landlords and our $250 million Credit Facility. However, depending on the expected level of new restaurant development, tenant improvement allowances that we receive from our landlords, other planned capital investments including ongoing maintenance capital expenditures, and results from our ongoing operations, we may not generate enough cash flow from operations to completely fund our plans. In addition, any significant increase in our share repurchase activity may impact our capital resources available. Accordingly, we continue to actively monitor overall conditions in the capital and credit markets with respect to the potential sources and the timing of additional financing in order to enhance total shareholder return. However, there can be no assurance that such financing will be available when required or available on terms acceptable to us. If we are unable to secure additional capital resources, we may be required to reduce our planned rate of expansion, share repurchase activity or other shareholder return initiatives.
Similar to many restaurant chains, we typically utilize operating lease arrangements (principally ground leases) for the majority of our restaurant locations. We believe our operating lease arrangements provide appropriate leverage for our capital structure in a financially efficient manner. However, we are not limited to the use of lease arrangements as our only method of opening new restaurants and from time to time have purchased the underlying land for new restaurants. While our operating lease obligations are not required to be reflected as indebtedness on our Consolidated Balance Sheets, the minimum rents and other related lease obligations, such as common area expenses, under our lease agreements must be satisfied by cash flows from our ongoing operations. Accordingly, our lease arrangements reduce, to some extent, our capacity to utilize debt in our capital structure.
We typically lease our restaurant locations for periods of 10 to 20 years under operating lease arrangements. Our rent structures vary from lease to lease, but generally provide for the payment of both minimum and contingent (percentage) rent based on sales, as well as other expenses related to the leases (for example, our pro-rata share of common area maintenance, property tax and insurance expenses). Many of our lease arrangements include the opportunity to secure tenant improvement allowances to partially offset the cost of developing and opening the related restaurants. Generally, landlords recover the cost of such allowances from increased minimum rents. However, there can be no assurance that such allowances will be available to us on each project. From time to time, we may also decide to purchase the underlying land for a new restaurant if that is the only way to secure a highly desirable site. Currently, we own the underlying land for four of our operating restaurants and our Texas brewpub locations. We also own two parcels of land adjacent to two of our operating restaurants. It is not our current strategy to own a large number of land parcels that underlie our restaurants. Therefore, in many cases we subsequently enter into sale-leaseback arrangements for land parcels that we may purchase. We disburse cash for certain site-related work, buildings, leasehold improvements, furnishings, fixtures and equipment to build our leased and owned premises. We own substantially all of the equipment, furniture and trade fixtures in our restaurants and currently plan to do so in the future.
We also require capital resources to evolve, maintain and increase the productive capacity of our existing base of restaurants and brewing operations and to further expand and strengthen the capabilities of our corporate and information technology infrastructures. Our requirement for working capital is not significant since our restaurant customers pay for their food and beverage purchases in cash or credit cards at the time of the sale. Thus, we are able to sell many of our inventory items before we are required to pay our suppliers for such items.
Our cash flows from operating activities, as detailed in the Consolidated Statements of Cash Flows, provided $138.4 million during fiscal 2016, representing an $11.1 million increase from the $127.2 million provided during fiscal 2015. The increase in cash from operating activities for fiscal 2016, in comparison to fiscal 2015, is primarily due to the 53rd operating week, timing of accounts receivable and greater depreciation and amortization, offset by the timing of prepaids and other current assets.
For fiscal 2016, total capital expenditures were approximately $109.4 million, of which expenditures for the purchase of the underlying land for new restaurants as well as the acquisition of restaurant and brewing equipment and leasehold improvements to construct new restaurants were $87.0 million. These expenditures were primarily related to the construction of our 17 new restaurants that opened during fiscal 2016, as well as expenditures related to restaurants expected to open in early 2017. In addition, during fiscal 2016, total capital expenditures related to the maintenance and key productivity initiatives of existing restaurants and expenditures for restaurant and corporate systems were $21.7 million and $0.7 million, respectively.
48
Table of Contents
We have a $250 million unsecured revolving line of credit that expires on November 18, 2021, and may be used for working capital and other general corporate purposes. We utilize the Credit Facility principally for letters of credit that are required to support certain of our self-insurance programs, to fund a portion of the Company’s announced stock repurchase program and for working capital and construction requirements as needed.
We expect to open 10 new restaurants in fiscal 2017, and we have entered into signed leases, land purchase agreements or letters of intent for all of our potential restaurant locations. While we expect our capital expenditures to remain significant, the reduction of restaurant openings in fiscal 2017 will reduce our capital expenditure spend as compared to fiscal 2016. The decision to reduce our pace of expansion will generate increased free cash flow and provide added flexibility to our financial condition. It will also allow us to allocate greater resources to our core base of established restaurants to improve sales and profitability. While our new restaurant unit economics remain solid and warrant continued capital allocation, we will also opportunistically repurchase shares funded by our excess cash flow from operations, combined with a prudent amount of funded debt, to support our commitment to drive total shareholder returns.
We currently anticipate our total capital expenditures for fiscal 2017, including all expenditure categories, to be approximately $80 million to $90 million. We expect to fund our anticipated capital expenditures for fiscal 2017 with our current cash balance on hand, expected cash flows from operations, proceeds from sale-leaseback transactions, expected tenant improvement allowances and our line of credit. Our future cash requirements will depend on many factors, including the pace of our expansion, conditions in the retail property development market, construction costs, the nature of the specific sites selected for new restaurants, and the nature of the specific leases and associated tenant improvement allowances available, if any, as negotiated with landlords.
From time to time, we will evaluate opportunities to acquire and convert other restaurant locations or entire restaurant chains to the BJ’s restaurant concept. In the future we may consider joint venture arrangements to augment BJ’s expansion into new markets or we may evaluate non-controlling investments in other emerging restaurant concepts that offer complementary growth opportunities to our BJ’s restaurant operations. Currently, we have no binding commitments (other than the signed leases or land purchase agreements set forth in Item 1 –Business –“Restaurant Site Selection and Expansion Objectives” of this Annual Report on Form 10-K) or agreements to acquire or convert any other restaurant locations or chains to our concept, or to enter into any joint ventures or non-controlling investments. However, we would likely require additional capital resources to take advantage of any of these growth opportunities should they become feasible.
We depend on our expected cash flows from operations, coupled with agreed-upon landlord tenant improvement allowances and sale-leaseback proceeds, to fund the majority of our planned capital expenditures. If our business does not generate enough cash flows from operations as expected, or if our landlords are unable to honor their agreements with us, or if we are unable to successfully enter in a sale-leaseback transaction and replacement funding sources are not otherwise available to us from borrowings under our Credit Facility or other alternatives, we may not be able to expand our operations at the pace currently planned.
We currently do not pay any dividends to our shareholders. Any determination to pay dividends in the future will be at the discretion of our Board of Directors and will depend upon our financial condition, operating results, contractual restrictions, restrictions imposed by applicable law and other factors our Board of Directors deems relevant. Our Credit Facility contains, and debt instruments that we enter into in the future may contain, covenants that place limitations on the amount of dividends we may pay.
As of fiscal 2016, we have cumulatively repurchased approximately $290.5 million shares in accordance with our approved share repurchase plan. We repurchased approximately $95.0 million of these shares during fiscal 2016. The share repurchases were executed through open market purchases, and future share repurchases may be completed through the combination of individually negotiated transactions, accelerated share buyback, and/or open market purchases. As of fiscal 2016, we have approximately $59.5 million available under our current $350 million share repurchase plan approved by our Board of Directors. Our Credit Facility does not contain any restrictions on the amount of borrowings that can be used to make share repurchases as long as we are in compliance with our financial and non-financial covenants.
49
Table of Contents
OFF-BALANCE SHEET ARRANGEMENTS
We do not participate in transactions that generate relationships with unconsolidated entities or financial partnerships, such as entities often referred to as structured finance or variable interest entities (“VIEs”), which would have been established for the purpose of facilitating off-balance sheet arrangements or other contractually narrow limited purposes. As of January 3, 2017, we are not involved in any off-balance sheet arrangements.
IMPACT OF INFLATION
Inflation on food, labor, energy and occupancy costs can significantly affect the profitability of our restaurant operations. Our profitability is dependent, among other things, on our ability to anticipate and react to changes in the cost of key operating resources, including food and other raw materials, labor, energy and other supplies and services. Substantial increases in costs and expenses could impact our operating results to the extent that such increases cannot be passed along to our restaurant customers. While we have taken steps to enter into agreements for some of the commodities used in our restaurant operations, there can be no assurance that future supplies and costs for such commodities will not fluctuate due to weather or other market conditions outside of our control. We are currently unable to contract for certain commodities, such as fluid dairy, fresh seafood and most fresh produce items, for long periods of time. Consequently, such commodities can be subject to unforeseen supply and cost fluctuations.
Many of our restaurant employees are paid hourly rates subject to the federal, state or local minimum wage requirements. Numerous state and local governments have their own minimum wage requirements that are generally greater than the federal minimum wage and are subject to annual increases based on changes in their local consumer price indices. Additionally, a general shortage in the availability of qualified restaurant management and hourly workers in certain geographic areas in which we operate has caused increases in the costs of recruiting and compensating such employees. Certain operating and other costs including health benefits, in compliance with the Patient Protection and Affordable Care Act, taxes, insurance, federal and state exemption rules, and regulatory requirements relating to employees and other outside services continue to increase with the general level of inflation and may also be subject to other cost and supply fluctuations outside of our control.
While we have been able to partially offset inflation and other changes in the costs of key operating resources by gradually increasing prices of our menu items, coupled with more efficient purchasing practices, productivity improvements and greater economies of scale, there can be no assurance that we will be able to continue to do so in the future. From time to time, competitive conditions will limit our menu pricing flexibility. In addition, macroeconomic conditions that impact consumer discretionary spending for food away from home could make additional menu price increases imprudent. There can be no assurance that all of our future cost increases can be offset by higher menu prices or that higher menu prices will be accepted by our restaurant customers without any resulting changes in their visit frequencies or purchasing patterns. Many of the leases for our restaurants provide for contingent rent obligations based on a percentage of sales. As a result, rent expense will absorb a proportionate share of any menu price increases in our restaurants. There can be no assurance that we will continue to generate increases in comparable restaurant sales in amounts sufficient to offset inflationary or other cost pressures.
SEASONALITY AND ADVERSE WEATHER
Our business is subject to seasonal fluctuations. Additionally, our restaurants are impacted by weather and other seasonal factors that typically impact other restaurant operations. Holidays (and shifts in the holiday calendar) and severe weather including hurricanes, tornados, thunderstorms and similar conditions may impact restaurant sales volumes seasonally in some of the markets where we operate. Many of our restaurants are located in or near shopping centers and malls that typically experience seasonal fluctuations in sales. Quarterly results have been and will continue to be significantly impacted by the timing of new restaurant openings and their associated restaurant opening expenses. As a result of these and other factors, our financial results for any given quarter may not be indicative of the results that may be achieved for a full fiscal year.
CRITICAL ACCOUNTING POLICIES
Critical accounting policies require the greatest amount of subjective or complex judgments by management and are important to portraying our financial condition and results of operations. Judgments or uncertainties regarding the
50
Table of Contents
application of these policies may result in materially different amounts being reported under different conditions or using different assumptions. We consider the following policies to be the most critical in understanding the judgments that are involved in preparing our consolidated financial statements.
Property and Equipment
We record all property and equipment at cost. Property and equipment accounting requires us to estimate the useful lives of the assets for depreciation purposes and to select depreciation methods. We believe the useful lives reflect the actual economic life of the underlying assets. We have elected to use the straight-line method of depreciation over the estimated useful life of an asset or the lease term of the respective lease, whichever is shorter, for leasehold improvements. Renewals and betterments that materially extend the useful life of an asset are capitalized while maintenance and repair costs are charged to operating expense as incurred. Judgment is often required in the decision to distinguish between an asset which qualifies for capitalization versus an expenditure which is for maintenance and repairs. Internal costs associated with the acquisition, development and construction of our restaurants are capitalized and allocated to the projects which they relate. When property and equipment are sold or otherwise disposed of, the asset account and related accumulated depreciation and amortization accounts are relieved, and any gain or loss is included in earnings. Additionally, any interest capitalized for new restaurant construction would be included in “Property and equipment, net” on the Consolidated Balance Sheets.
Impairment of Long-Lived Assets
We assess the potential impairment of our long-lived assets whenever events or changes in circumstances indicate that the carrying value of the assets may not be recoverable. The assets are generally reviewed for impairment in total as well as on a restaurant by restaurant basis. Factors considered include, but are not limited to, significant underperformance by the restaurant relative to expected historical or projected future operating results; significant changes in the manner of use of the acquired assets or the strategy for the overall business; and significant negative industry or economic trends. The recoverability is assessed in most cases by comparing the carrying value of the asset to the undiscounted cash flows expected to be generated by the asset. This assessment process requires the use of estimates and assumptions regarding future restaurant cash flows and estimated useful lives, which are subject to a significant degree of judgment. If these assumptions change in the future, we may be required to record impairment charges for these assets or for the entire restaurant.
Self-Insurance Liability
We retain large deductibles or self-insured retentions for a portion of our general liability insurance and our employee workers’ compensation programs. We maintain coverage with a third party insurer to limit our total exposure for these programs. The accrued liability associated with these programs is based on our estimate of the ultimate costs within our retention amount to settle known claims as well as claims incurred but not yet reported to us (“IBNR claims”) as of the balance sheet date. Our estimated liability is based on information provided by a third party actuary, combined with our judgments regarding a number of assumptions and factors, including the frequency and severity of claims, our claims development history, case jurisdiction, related legislation, and our claims settlement practice. Significant judgment is required to estimate IBNR claims as parties have yet to assert such claims. If actual claims trends, including the severity or frequency of claims, differ from our estimates, our financial results could be significantly impacted.
Income Taxes
We provide for income taxes based on our expected federal and state tax liabilities. Our estimates include, but are not limited to, effective state and local income tax rates, allowable tax credits for items such as FICA taxes paid on reported tip income and estimates related to depreciation expense allowable for tax purposes. We usually file our income tax returns several months after our fiscal year-end. All tax returns are subject to audit by federal and state governments, usually years after the returns are filed, and could be subject to differing interpretation of the tax laws.
We utilize the liability method of accounting for income taxes. Deferred income taxes are recognized based on the tax consequences in future years of differences between the tax basis of assets and liabilities and their financial reporting amounts at each year-end based on enacted tax laws and statutory tax rates applicable to the periods in which differences are expected to affect taxable income. Valuation allowances are established, when necessary, to reduce
51
Table of Contents
deferred tax assets to the amount expected to be realized. The provision for income taxes represents the tax payable for the period and the change during the period in deferred tax assets and liabilities.
We recognize the impact of a tax position in our financial statements if that position is more likely than not of being sustained on audit, based on the technical merits of the position. Interest and penalties related to uncertain tax positions are included in income tax expense.
Leases
We lease the majority of our restaurant locations. We account for our leases in accordance with U.S. GAAP, which require that our leases be evaluated and classified as operating or capital leases for financial reporting purposes. The term used for this evaluation includes renewal option periods only in instances in which the exercise of the renewal option can be reasonably assured and failure to exercise such option would result in an economic penalty. All of our restaurant leases are classified as operating leases. We disburse cash for leasehold improvements, furniture and fixtures and equipment to build out and equip our leased premises. Tenant improvement allowance incentives may be available to partially offset the cost of developing and opening the related restaurants, pursuant to agreed-upon terms in our leases. Tenant improvement allowances can take the form of cash payments upon the opening of the related restaurants, full or partial credits against minimum or percentage rents otherwise payable by us or a combination thereof. All tenant improvement allowances received by us are recorded as a deferred lease incentive and amortized over the term of the lease. The related cash received from the landlord is reflected as “Landlord contribution for tenant improvements” within operating activities of our Consolidated Statements of Cash Flows.
The lease term used for straight-line rent expense is calculated from the date we obtain possession of the leased premises through the lease termination date (including any options that can be reasonably assured where failure to exercise such option would result in an economic penalty). We expense rent from possession date through restaurant open date as preopening expense. Once a restaurant opens for business, we record straight-line rent over the lease term plus contingent rent to the extent it exceeded the minimum rent obligation per the lease agreement.
There is potential for variability in the rent holiday period, which begins on the possession date and ends on the restaurant open date, during which no cash rent payments are typically due under the terms of the lease. Factors that may affect the length of the rent holiday period generally pertain to construction related delays. Extension of the rent holiday period due to delays in restaurant opening will result in greater preopening rent expense recognized during the rent holiday period and lesser occupancy expense during the rest of the lease term (post-opening).
We record total rent payable during the lease term, including rent escalations in which the amount of future rent is certain or can be reasonably calculated on the straight-line basis over the term of the lease (including the rent holiday period beginning upon our possession of the premises), and record the difference between the minimum rents paid and the straight-line rent as deferred rent. Certain leases contain provisions that require additional rent payments based upon restaurant sales volume (“contingent rent”). Contingent rent is accrued each period as the liabilities are incurred, in addition to the straight-line rent expense noted above. This results in some variability in occupancy expense as a percentage of revenues over the term of the lease in restaurants where we pay contingent rent.
Management makes judgments regarding the probable term for each restaurant property lease, which can impact the classification and accounting for a lease as capital or operating, the rent holiday and/or escalations in payments that are taken into consideration when calculating straight-line rent and the term over which leasehold improvements for each restaurant are amortized. These judgments may produce materially different amounts of depreciation, amortization and rent expense than would be reported if different assumed lease terms were used.
Stock-Based Compensation
Under our shareholder approved stock-based compensation plan, we have granted incentive stock options, non-qualified stock options, and restricted stock units that generally vest over three to five years and expire ten years from the date of grant. We have also granted performance-based restricted stock units under our shareholder approved stock-based compensation plan that generally vests after three years based on achievement of certain performance targets. Stock-based compensation is measured in accordance with U.S. GAAP based on the underlying fair value of the awards granted. In valuing stock options, we are required to make certain assumptions and judgments regarding the
52
Table of Contents
grant date fair value, which we value utilizing the Black-Scholes option-pricing model. These judgments include expected volatility, risk free interest rate, expected option life, dividend yield and vesting percentage. These estimations and judgments are determined by us using many different variables that, in many cases, are outside of our control. The changes in these variables or trends, including stock price volatility and risk free interest rate, may significantly impact the grant date fair value resulting in a significant impact to our financial results. The cash flow tax benefits resulting from tax deductions in excess of the compensation cost recognized for those options (excess tax benefits) are required to be classified as financing cash flows.
CONTRACTUAL OBLIGATIONS AND COMMITMENTS
The following table summarizes our future estimated cash payments under existing contractual obligations as of January 3, 2017, including estimated cash payments due by period (in thousands).
| Payments Due by Period | ||||||||||||||||||||
| Total | Less Than 1 Year |
2-3 Years | 4-5 Years | After 5 Years |
||||||||||||||||
| Contractual Obligations: |
||||||||||||||||||||
| Operating leases (1) |
$586,422 | $45,685 | $88,650 | $84,249 | $367,838 | |||||||||||||||
| Purchase obligations (2) |
28,721 | 8,827 | 12,273 | 5,098 | 2,523 | |||||||||||||||
|
|
|
|
|
|
|
|
|
|
|
|||||||||||
| Total |
$615,143 | $54,512 | $100,923 | $89,347 | $370,361 | |||||||||||||||
|
|
|
|
|
|
|
|
|
|
|
|||||||||||
| Other Obligations: |
||||||||||||||||||||
| Long-term debt |
$148,000 | $– | $148,000 | $– | $– | |||||||||||||||
| Standby letters of credit |
$14,503 | $14,503 | $– | $– | $– | |||||||||||||||
|
|
|
|
|
|
|
|
|
|
|
|||||||||||
| Total |
$162,503 | $14,503 | $148,000 | $– | $– | |||||||||||||||
|
|
|
|
|
|
|
|
|
|
|
|||||||||||
| (1) | For more detailed description of our operating leases, refer to Note 5 in the accompanying Consolidated Financial Statements. |
| (2) | Amounts represent non-cancelable commitments for the purchase of goods and other services. |
Additionally, we have entered into lease agreements related to future restaurants with commencement dates subsequent to January 3, 2017. Our aggregate future commitment relating to these leases is $3.5 million and is not included in operating leases above.
ITEM 7A. QUANTITATIVE AND QUALITATIVE DISCLOSURES ABOUT MARKET RISK
The following discussion of market risks contains “forward-looking” statements. Actual results may differ materially from the following discussion based on general conditions in the financial and commodity markets.
Interest Rate Risk
We have a $250 million unsecured Credit Facility that carries interest at a floating rate. We utilize the Credit Facility principally for letters of credit that are required to support our self-insurance programs, to fund a portion of our announced stock repurchase program and for working capital and construction requirements, as needed. We are exposed to interest rate risk through fluctuations in interest rates on our obligations under the Credit Facility. We do not believe that a hypothetical 1% adverse change in the interest rates under our Credit Facility would have a material adverse impact on our results of operation or financial condition.
Food and Commodity Price Risks
We purchase food and other commodities for use in our operations based upon market prices established with our suppliers. Many of the commodities purchased by us can be subject to volatility due to market supply and demand factors outside of our control, whether contracted for or not. Dairy costs can also fluctuate due to government regulation. To manage this risk in part, we attempt to enter into fixed-price purchase commitments, with terms typically up to one year, for some of our commodity requirements. However, it may not be possible for us to enter into fixed-price contracts for certain commodities or we may choose not to enter into fixed-price contracts for certain
53
Table of Contents
commodities. We believe that substantially all of our food and supplies are available from several sources, which helps to diversify our overall commodity cost risk. We also believe that we have some flexibility and ability to increase certain menu prices, or vary certain menu items offered or promoted, in response to food commodity price increases. Some of our commodity purchase arrangements may contain contractual features that limit the price paid by establishing certain price floors or caps. We do not use financial instruments to hedge commodity prices, since our purchase arrangements with suppliers, to the extent that we can enter into such arrangements, help control the ultimate cost that we pay.
ITEM 8. FINANCIAL STATEMENTS AND SUPPLEMENTARY DATA
See the Consolidated Financial Statements and other data attached hereto beginning on page F-1 of this Annual Report on Form 10-K.
ITEM 9. CHANGES IN AND DISAGREEMENTS WITH ACCOUNTANTS ON ACCOUNTING AND FINANCIAL DISCLOSURE
None.
ITEM 9A. CONTROLS AND PROCEDURES
Evaluation of Disclosure Controls and Procedures
Under the supervision and with the participation of our management, including the Chief Executive Officer and Chief Financial Officer, we have evaluated the effectiveness of our disclosure controls and procedures pursuant to Rules 13a-15 and 15d-15 promulgated under the Securities Exchange Act of 1934 as amended, as of the end of the period covered by this report. Based on this evaluation, our Chief Executive Officer and Chief Financial Officer concluded that, as of January 3, 2017, our disclosure controls and procedures are designed and are effective to provide reasonable assurance that information we are required to disclose in reports that we file or submit under the Exchange Act is recorded, processed, summarized, and reported within the time periods specified in the SEC’s rules and forms, and that such information is accumulated and communicated to our management, including our Chief Executive Officer and Chief Financial Officer, as appropriate, to allow timely decisions regarding required disclosure.
Changes in Internal Control Over Financial Reporting
There has not been any change in our internal control over financial reporting (as such term is defined in Rules 13a-15(f) and 15d-15(f) under the Exchange Act) during our fourth fiscal quarter that has materially affected, or is reasonably likely to materially affect, our internal control over financial reporting.
Management’s Report on Internal Control Over Financial Reporting
Our management is responsible for establishing and maintaining adequate internal control over financial reporting, as such term is defined in Exchange Act Rules 13a-15(f) and 15d-15(f). Under the supervision and with the participation of our management, including our Chief Executive Officer and Chief Financial Officer, we conducted an evaluation of the effectiveness of our internal control over financial reporting as of January 3, 2017, based on the framework in Internal Control—Integrated Framework issued by the Committee of Sponsoring Organizations of the Treadway Commission (2013 framework) (“COSO”). Based on that evaluation, our management concluded that our internal control over financial reporting was effective as of January 3, 2017.
Ernst & Young LLP, the independent registered public accounting firm that audited the financial statements included in this Annual Report on Form 10-K, has issued an attestation report on our internal control over financial reporting.
54
Table of Contents
Report of Independent Registered Public Accounting Firm
The Board of Directors and Shareholders of BJ’s Restaurants, Inc.
We have audited BJ’s Restaurants, Inc.’s internal control over financial reporting as of January 3, 2017, based on criteria established in Internal Control—Integrated Framework issued by the Committee of Sponsoring Organizations of the Treadway Commission (2013 framework) (the COSO criteria). BJ’s Restaurants, Inc.’s management is responsible for maintaining effective internal control over financial reporting, and for its assessment of the effectiveness of internal control over financial reporting included in the accompanying Management’s Report on Internal Control over Financial Reporting. Our responsibility is to express an opinion on the Company’s internal control over financial reporting based on our audit.
We conducted our audit in accordance with the standards of the Public Company Accounting Oversight Board (United States). Those standards require that we plan and perform the audit to obtain reasonable assurance about whether effective internal control over financial reporting was maintained in all material respects. Our audit included obtaining an understanding of internal control over financial reporting, assessing the risk that a material weakness exists, testing and evaluating the design and operating effectiveness of internal control based on the assessed risk, and performing such other procedures as we considered necessary in the circumstances. We believe that our audit provides a reasonable basis for our opinion.
A company’s internal control over financial reporting is a process designed to provide reasonable assurance regarding the reliability of financial reporting and the preparation of financial statements for external purposes in accordance with generally accepted accounting principles. A company’s internal control over financial reporting includes those policies and procedures that (1) pertain to the maintenance of records that, in reasonable detail, accurately and fairly reflect the transactions and dispositions of the assets of the company; (2) provide reasonable assurance that transactions are recorded as necessary to permit preparation of financial statements in accordance with generally accepted accounting principles, and that receipts and expenditures of the company are being made only in accordance with authorizations of management and directors of the company; and (3) provide reasonable assurance regarding prevention or timely detection of unauthorized acquisition, use, or disposition of the company’s assets that could have a material effect on the financial statements.
Because of its inherent limitations, internal control over financial reporting may not prevent or detect misstatements. Also, projections of any evaluation of effectiveness to future periods are subject to the risk that controls may become inadequate because of changes in conditions, or that the degree of compliance with the policies or procedures may deteriorate.
In our opinion, BJ’s Restaurants, Inc. maintained, in all material respects, effective internal control over financial reporting as of January 3, 2017, based on the COSO criteria.
We also have audited, in accordance with the standards of the Public Company Accounting Oversight Board (United States), the consolidated balance sheets of BJ’s Restaurants, Inc. as of January 3, 2017 and December 29, 2015, and the related consolidated statements of income, shareholders’ equity and cash flows for each of the three years in the period ended January 3, 2017, and our report dated February 27, 2017 expressed an unqualified opinion thereon.
/s/ Ernst & Young LLP
Irvine, California
February 27, 2017
55
Table of Contents
Inherent Limitations on Effectiveness of Controls
Our management, including the Chief Executive Officer and Chief Financial Officer, does not expect that our disclosure controls or our internal control over financial reporting will prevent or detect all errors and all fraud. A control system, no matter how well designed and operated, can provide only reasonable, not absolute, assurance that the control system’s objectives will be met. The design of a control system must reflect the fact that there are resource constraints, and the benefits of controls must be considered relative to their costs. Further, because of the inherent limitations in all control systems, no evaluation of controls can provide absolute assurance that misstatements due to error or fraud will not occur or that all control issues and instances of fraud, if any, within the Company have been detected. These inherent limitations include the realities that judgments in decision-making can be faulty and that breakdowns can occur because of simple error or mistake. Controls can also be circumvented by the individual acts of some persons, by collusion of two or more people, or by management override of the controls. The design of any system of controls is based in part on certain assumptions about the likelihood of future events, and there can be no assurance that any design will succeed in achieving its stated goals under all potential future conditions. Projections of any evaluation of control effectiveness to future periods are subject to risks. Over time, controls may become inadequate because of changes in conditions or deterioration in the degree of compliance with policies or procedures.
None.
PART III
ITEM 10. DIRECTORS, EXECUTIVE OFFICERS AND CORPORATE GOVERNANCE
We have adopted a Code of Business Ethics and a Code of Business Conduct to promote honest and ethical conduct of our business, professional and personal relationships. The Code of Business Ethics covers all executives, including our principal executive officer and principal financial and accounting officer. The Code of Business Conduct is applicable to all directors, executives and other employees. A copy of our Code of Integrity, Ethics and Conduct is available on our website http://investors.bjsrestaurants.com under Corporate Governance. We intend to post any amendments to or waivers from our Code of Business Ethics and Code of Business Conduct at this website location.
Information with respect to our executive officers is included in Part I, Item 1 of this Annual Report on Form 10-K. Other information required by this Item is hereby incorporated by reference to the information contained in the Proxy Statement relating to the Annual Meeting of Shareholders, which we expect to be filed with the SEC no later than 120 days after the close of the year ended January 3, 2017.
ITEM 11. EXECUTIVE COMPENSATION
The information required by this Item is incorporated herein by reference to the information contained in the Proxy Statement relating to the Annual Meeting of Shareholders, which we expect to file with the SEC no later than 120 days after the close of the year ended January 3, 2017.
ITEM 12. SECURITY OWNERSHIP OF CERTAIN BENEFICIAL OWNERS AND MANAGEMENT AND RELATED SHAREHOLDER MATTERS
The information required by this Item is incorporated herein by reference to the information contained in the Proxy Statement relating to the Annual Meeting of Shareholders, which we expect to file with the SEC no later than 120 days after the close of the year ended January 3, 2017.
ITEM 13. CERTAIN RELATIONSHIPS AND RELATED TRANSACTIONS AND DIRECTOR INDEPENDENCE
The information required by this Item is incorporated herein by reference to the information contained in the Proxy Statement relating to the Annual Meeting of Shareholders, which we expect to file with the SEC no later than 120 days after the close of the year ended January 3, 2017.
56
Table of Contents
See Part II, Item 5 – “Market for Registrant’s Common Equity, Related Shareholder Matters and Issuer Purchases of Equity Securities – Stock-Based Compensation Plan Information” for certain information regarding our equity compensation plans.
ITEM 14. PRINCIPAL ACCOUNTING FEES AND SERVICES
The information required by this Item is incorporated herein by reference to the information contained in the Proxy Statement relating to the Annual Meeting of Shareholders, which we expect to file with the SEC no later than 120 days after the close of the year ended January 3, 2017.
PART IV
ITEM 15. EXHIBITS AND FINANCIAL STATEMENT SCHEDULES
(a) (1) CONSOLIDATED FINANCIAL STATEMENTS
The following documents are contained in Part II, Item 8 of this Annual Report on Form 10-K:
Report of Independent Registered Public Accounting Firm
Consolidated Balance Sheets at January 3, 2017 and December 29, 2015
Consolidated Statements of Income for Each of the Three Fiscal Years in the Period Ended January 3, 2017
Consolidated Statements of Shareholders’ Equity for Each of the Three Fiscal Years in the Period Ended January 3, 2017
Consolidated Statements of Cash Flows for Each of the Three Fiscal Years in the Period Ended January 3, 2017
Notes to the Consolidated Financial Statements
| (2) | FINANCIAL STATEMENT SCHEDULES |
All schedules are omitted because they are not applicable or the required information is shown in the Consolidated Financial Statements or notes thereto.
| (3) | EXHIBITS |
| Exhibit Number |
Description | |
| 3.1 |
Amended and Restated Articles of Incorporation of the Company, as amended, incorporated by reference to Exhibit 3.1 to the Registration Statement on Form SB-2 filed with the Securities and Exchange Commission on June 28, 1996, as amended by the Company’s Registration Statement on Form SB-2/A filed with the Commission on August 1, 1996 and the Company’s Registration Statement on Form SB-2A filed with the Commission on August 22, 1996 (File No. 3335182-LA) (as amended, the “Registration Statement”). | |
| 3.2 |
Amended and Restated Bylaws of the Company, incorporated by reference to Exhibits 3.1 to the Form 8-K filed on June 4, 2007. | |
| 3.3 |
Certificate of Amendment of Articles of Incorporation incorporated by reference to Exhibit 3.3 of the 2004 Annual Report. | |
| 3.4 |
Certificate of Amendment of Articles of Incorporation, dated June 8, 2010, incorporated by reference to Exhibit 3.4 of the Form 10-K for the year ended December 28, 2010. | |
| 4.1 |
Specimen Common Stock Certificate of the Company, incorporated by reference to Exhibit 4.1 of the Registration Statement. | |
| 10.1* |
Form of Indemnification Agreement with Officers and Directors, incorporated by reference to Exhibit 10.6 of the Registration Statement. | |
57
Table of Contents
| 10.2* |
BJ’s Restaurants, Inc. 2005 Equity Incentive Plan, as amended (incorporated by reference to Appendix A to the Company’s definitive proxy statement on Schedule 14A filed with the Securities and Exchange Commission on April 24, 2015). | |
| 10.3* |
Form of Employee Stock Option Agreement for employees under the 2005 Equity Incentive Plan, incorporated by reference to Exhibit 10.1 to the Form 10-Q filed on October 31, 2006. | |
| 10.4* |
Form of Notice of Grant of Stock Option for employees under the 2005 Equity Incentive Plan, incorporated by reference to Exhibit 10.4 of the Form 8-K filed July 1, 2005. | |
| 10.5* |
Form of Non-Employee Director Stock Option Agreement under the 2005 Equity Incentive Plan, incorporated by reference to Exhibit 10.8 of the Form 10-K for the year ended January 3, 2006. | |
| 10.6* |
Form of Non-Employee Director Notice of Grant of Stock Option under the 2005 Equity Incentive Plan, incorporated by reference to Exhibit 10.9 of the Form 10-K for the year ended January 3, 2006. | |
| 10.7* |
Form of Restricted Stock Unit Agreement (non-GSSOP) for employees under the 2005 Equity Incentive Plan, incorporated by reference to Exhibit 10.1 to the Form 10-Q filed on November 6, 2007. | |
| 10.8* |
Form of Restricted Stock Unit Notice (non-GSSOP) for employees under the 2005 Equity Incentive Plan, incorporated by reference to Exhibit 10.2 to the Form 10-Q filed on November 6, 2007. | |
| 10.9* |
Form of Restricted Stock Unit Agreement (2012 BJ’s GSSOP) for employees under the 2005 Equity Incentive Plan, incorporated by reference to Exhibit 10.11 to the Form 10-K for the year ended January 1, 2013. | |
| 10.10* |
Form of Equity Award Certificate (2012 BJ’s GSSOP) for employees under the 2005 Equity Incentive Plan, incorporated by reference to Exhibit 10.12 to the Form 10-K for the year ended January 1, 2013. | |
| 10.11* |
Form of Stock Option Agreement (2012 BJ’s GSSOP) for employees under the 2005 Equity Incentive Plan, incorporated by reference to Exhibit 10.12 to the Form 10-K for the year ended January 1, 2013. | |
| 10.12* |
Form of Option Grant Notice (2012 BJ’s GSSOP) for employees under the 2005 Equity Incentive Plan, incorporated by reference to Exhibit 10.12 to the Form 10-K for the year ended January 1, 2013. | |
| 10.13* |
Form of Restricted Stock Unit Agreement for non-employee directors under the 2005 Equity Incentive Plan, incorporated by reference to Exhibit 10.12 to the Form 10-K for the year ended January 1, 2013. | |
| 10.14* |
Form of Restricted Stock Unit Award Certificate for non-employee directors under the 2005 Equity Incentive Plan, incorporated by reference to Exhibit 10.12 to the Form 10-K for the year ended January 1, 2013. | |
| 10.15* |
Employment Agreement, dated June 12, 2003, between the Company and Gregory S. Lynds, incorporated by reference to Exhibit 10.26 of the Form 10-K filed on or about March 14, 2008. | |
| 10.16* |
Employment Agreement dated April 6, 2010, between the Company and Gerald W. Deitchle, incorporated by reference to Form 8-K filed on April 12, 2010. | |
| 10.17* |
Employment Agreement, dated September 6, 2005, between the Company and Gregory S. Levin, incorporated by reference to Exhibit 10.1 of the Form 10-Q filed on November 3, 2005. | |
| 10.18* |
Employment Agreement, dated March 2, 2011, between the Company and Kendra D. Miller, incorporated by reference to Exhibit 10.17 of the Form 10-K filed on March 4, 2011. | |
| 10.19* |
Employment Agreement dated October 28, 2012, between the Company and Gregory A. Trojan, incorporated by reference to Exhibit 10.1 to Form 8-K filed on October 29, 2012. | |
| 10.20* |
Employment Agreement dated January 28, 2013, between the Company and Brian S. Krakower, incorporated by reference to Exhibit 10.1 to Form 10-Q filed on May 6, 2013. | |
| 10.21* |
Consulting Agreement, dated February 1, 2013, between the Company and Gerald W. Deitchle, incorporated by reference to Exhibit 10.1 to Form 10-Q filed on May 6, 2013. | |
| 10.22* |
Employment Agreement dated July 9, 2014, between the Company and Kevin E. Mayer, incorporated by reference to Exhibit 10.1 to Form 10-Q filed on November 3, 2014. | |
| 10.23* |
Employment Agreement dated November 7, 2016, between the Company and Jeffrey H. Fowler. | |
| 10.24 |
[Reserved] | |
| 10.25 |
[Reserved] | |
| 10.26 |
Second Amended and Restated Credit Agreement, dated November 18, 2016, between the Company and Bank of America, N.A. and JPMorgan Chase Bank, N.A. (incorporated by reference to Exhibit 10.1 of the Company’s Current Report on Form 8-K filed on November 18, 2016). | |
| 10.27* |
BJ’s Restaurants, Inc. 2011 Performance Incentive Plan (incorporated by reference to Appendix A to the Company’s Definitive Proxy Statement on Schedule 14A filed with the Securities and Exchange Commission on April 22, 2016, with respect to the 2016 Annual Meeting of Shareholders). |
58
Table of Contents
| 10.28* |
Form of Performance Stock Unit Agreement under the 2005 Equity Incentive Plan, incorporated by reference to Exhibit 10.1 to Form 10-Q filed on May 5, 2014. | |
| 21 |
List of Significant Subsidiaries. | |
| 23.1 |
Consent of Independent Registered Public Accounting Firm. | |
| 31 |
Section 302 Certifications of Chief Executive Officer and Chief Financial Officer. | |
| 32 |
Section 906 Certification of Chief Executive Officer and Chief Financial Officer. | |
| 101 |
The following materials from BJ’s Restaurants, Inc.’s Quarterly Report on Form 10-K for the year ended January 3, 2017, formatted in XBRL (eXtensible Business Reporting Language): (i) Consolidated Balance Sheets; (ii) Consolidated Statements of Income; (iii) Consolidated Statements of Shareholders’ Equity (iv) Consolidated Statements of Cash Flows; and (v) Notes to Consolidated Financial Statements. |
* Management contracts or compensation plans or arrangements in which directors or executive officers are eligible to participate.
59
Table of Contents
Pursuant to the requirements of Section 13 or 15(d) of the Securities Exchange Act of 1934, the Registrant has duly caused this report to be signed on our behalf by the undersigned, thereunto duly authorized.
| BJ’S RESTAURANTS, INC. | ||||||
| By: | /s/ Gregory A. Trojan | |||||
| Gregory A. Trojan | ||||||
| February 27, 2017 | President, Chief Executive Officer and Director (Principal Executive Officer) | |||||
Pursuant to the requirements of the Securities and Exchange Act of 1934, this Report has been signed below by the following persons on behalf of the Registrant and in the capacities and on the dates indicated.
| Signature | Capacity | Date | ||||||
| By: /s/ GREGORY A. TROJAN |
||||||||
|
Gregory A. Trojan |
President, Chief Executive Officer and Director (Principal Executive Officer) |
February 27, 2017 | ||||||
| By: /s/ GREGORY S. LEVIN |
||||||||
|
Gregory S. Levin |
Executive Vice President, Chief Financial Officer and Secretary (Principal Financial and Accounting Officer) | February 27, 2017 | ||||||
| By: /s/ PETER A. BASSI |
||||||||
|
Peter A. Bassi |
Lead Independent Director | February 27, 2017 | ||||||
| By: /s/ LARRY D. BOUTS |
||||||||
|
Larry D. Bouts |
Director | February 27, 2017 | ||||||
| By: /s/ JAMES A. DAL POZZO |
||||||||
|
James A. Dal Pozzo |
Director | February 27, 2017 | ||||||
| By: /s/ GERALD W. DEITCHLE |
||||||||
|
Gerald W. Deitchle |
Chairman of the Board and Director | February 27, 2017 | ||||||
| By: /s/ NOAH A. ELBOGEN |
||||||||
|
Noah A. Elbogen |
Director | February 27, 2017 | ||||||
| By: /s/ WESLEY A. NICHOLS |
||||||||
|
Wesley A. Nichols |
Director | February 27, 2017 | ||||||
| By: /s/ LEA ANNE S. OTTINGER |
||||||||
|
Lea Anne S. Ottinger |
Director | February 27, 2017 | ||||||
| By: /s/ PATRICK D. WALSH |
||||||||
|
Patrick D. Walsh |
Director | February 27, 2017 | ||||||
60
Table of Contents
INDEX TO CONSOLIDATED FINANCIAL STATEMENTS
| Page | ||||
| F-1 | ||||
| Consolidated Balance Sheets at January 3, 2017 and December 29, 2015 |
F-2 | |||
| F-3 | ||||
| F-4 | ||||
| F-5 | ||||
| F-6 | ||||
61
Table of Contents
REPORT OF INDEPENDENT REGISTERED PUBLIC ACCOUNTING FIRM
The Board of Directors and Shareholders of BJ’s Restaurants, Inc.
We have audited the accompanying consolidated balance sheets of BJ’s Restaurants, Inc. as of January 3, 2017 and December 29, 2015, and the related consolidated statements of income, shareholders’ equity and cash flows for each of the three years in the period ended January 3, 2017. These financial statements are the responsibility of the Company’s management. Our responsibility is to express an opinion on these financial statements based on our audits.
We conducted our audits in accordance with the standards of the Public Company Accounting Oversight Board (United States). Those standards require that we plan and perform the audit to obtain reasonable assurance about whether the financial statements are free of material misstatement. An audit includes examining, on a test basis, evidence supporting the amounts and disclosures in the financial statements. An audit also includes assessing the accounting principles used and significant estimates made by management, as well as evaluating the overall financial statement presentation. We believe that our audits provide a reasonable basis for our opinion.
In our opinion, the financial statements referred to above present fairly, in all material respects, the consolidated financial position of BJ’s Restaurants, Inc. at January 3, 2017 and December 29, 2015, and the consolidated results of its operations and its cash flows for each of the three years in the period ended January 3, 2017, in conformity with U.S. generally accepted accounting principles.
We also have audited, in accordance with the standards of the Public Company Accounting Oversight Board (United States), BJ’s Restaurants, Inc.’s internal control over financial reporting as of January 3, 2017, based on criteria established in Internal Control-Integrated Framework issued by the Committee of Sponsoring Organizations of the Treadway Commission (2013 framework) and our report dated February 27, 2017, expressed an unqualified opinion thereon.
/s/ Ernst & Young LLP
Irvine, California
February 27, 2017
Table of Contents
CONSOLIDATED BALANCE SHEETS
(In thousands)
| January 3, 2017 |
December 29, 2015 |
|||||||
| Assets |
||||||||
| Current assets: |
||||||||
| Cash and cash equivalents |
$22,761 | $34,604 | ||||||
| Accounts and other receivables, net |
14,698 | 25,364 | ||||||
| Inventories, net |
9,907 | 8,893 | ||||||
| Prepaid expenses and other current assets |
11,324 | 7,171 | ||||||
| Deferred income taxes |
18,383 | 16,971 | ||||||
|
|
|
|
|
|||||
| Total current assets |
77,073 | 93,003 | ||||||
| Property and equipment, net |
601,324 | 561,832 | ||||||
| Goodwill |
4,673 | 4,673 | ||||||
| Other assets, net |
25,809 | 22,157 | ||||||
|
|
|
|
|
|||||
| Total assets |
$708,879 | $681,665 | ||||||
|
|
|
|
|
|||||
| Liabilities and Shareholders’ Equity |
||||||||
| Current liabilities: |
||||||||
| Accounts payable (1) |
$31,145 | $33,033 | ||||||
| Accrued expenses |
94,553 | 83,861 | ||||||
|
|
|
|
|
|||||
| Total current liabilities |
125,698 | 116,894 | ||||||
| Deferred income taxes |
55,154 | 46,669 | ||||||
| Deferred rent |
30,424 | 27,627 | ||||||
| Deferred lease incentives |
54,119 | 53,837 | ||||||
| Long-term debt |
148,000 | 100,500 | ||||||
| Other liabilities |
20,587 | 19,655 | ||||||
|
|
|
|
|
|||||
| Total liabilities |
433,982 | 365,182 | ||||||
| Commitments and contingencies (Note 5) |
||||||||
| Shareholders’ equity: |
||||||||
| Preferred stock, 5,000 shares authorized, none issued or outstanding |
– | – | ||||||
| Common stock, no par value, 125,000 shares authorized and 22,332 and 24,672 shares issued and outstanding as of January 3, 2017 and December 29, 2015, respectively |
– | 7,367 | ||||||
| Capital surplus |
66,200 | 63,290 | ||||||
| Retained earnings |
208,697 | 245,826 | ||||||
|
|
|
|
|
|||||
| Total shareholders’ equity |
274,897 | 316,483 | ||||||
|
|
|
|
|
|||||
| Total liabilities and shareholders’ equity |
$708,879 | $681,665 | ||||||
|
|
|
|
|
|||||
The accompanying notes are an integral part of these consolidated financial statements.
| (1) | Included in accounts payable for fiscal years 2016 and 2015 is $5,782 and $4,320, respectively, of related party trade payables. See Note 11 for further information. |
F-2
Table of Contents
CONSOLIDATED STATEMENTS OF INCOME
(In thousands, except per share data)
| Fiscal Year | ||||||||||||
| 2016 | 2015 | 2014 | ||||||||||
| Revenues |
$993,052 | $919,597 | $845,569 | |||||||||
| Restaurant operating costs (excluding depreciation and amortization): | ||||||||||||
| Cost of sales (1) |
251,460 | 226,942 | 212,979 | |||||||||
| Labor and benefits |
345,370 | 317,050 | 298,703 | |||||||||
| Occupancy and operating (1) |
204,583 | 192,739 | 182,149 | |||||||||
| General and administrative |
55,373 | 53,827 | 51,558 | |||||||||
| Depreciation and amortization |
64,275 | 59,417 | 55,387 | |||||||||
| Restaurant opening |
6,977 | 6,562 | 4,973 | |||||||||
| Loss on disposal and impairment of assets |
2,971 | 2,908 | 1,963 | |||||||||
| Gain on lease termination, net |
– | (2,910) | – | |||||||||
| Legal and other settlements |
402 | – | 2,431 | |||||||||
|
|
|
|
|
|
|
|||||||
| Total costs and expenses |
931,411 | 856,535 | 810,143 | |||||||||
|
|
|
|
|
|
|
|||||||
| Income from operations |
61,641 | 63,062 | 35,426 | |||||||||
| Other (expense) income: |
||||||||||||
| Interest (expense), net |
(1,730) | (1,015) | (238) | |||||||||
| Other income, net |
1,180 | 60 | 1,135 | |||||||||
|
|
|
|
|
|
|
|||||||
| Total other (expense) income |
(550) | (955) | 897 | |||||||||
|
|
|
|
|
|
|
|||||||
| Income before income taxes |
61,091 | 62,107 | 36,323 | |||||||||
| Income tax expense |
15,534 | 16,782 | 8,926 | |||||||||
|
|
|
|
|
|
|
|||||||
| Net income |
$45,557 | $45,325 | $27,397 | |||||||||
|
|
|
|
|
|
|
|||||||
| Net income per share: |
||||||||||||
| Basic |
$1.91 | $1.76 | $0.99 | |||||||||
|
|
|
|
|
|
|
|||||||
| Diluted |
$1.88 | $1.73 | $0.97 | |||||||||
|
|
|
|
|
|
|
|||||||
| Weighted average number of shares outstanding: |
||||||||||||
| Basic |
23,824 | 25,718 | 27,710 | |||||||||
|
|
|
|
|
|
|
|||||||
| Diluted |
24,233 | 26,231 | 28,316 | |||||||||
|
|
|
|
|
|
|
|||||||
The accompanying notes are an integral part of these consolidated financial statements.
| (1) | Included in cost of sales for fiscal years 2016, 2015, and 2014 are $81,789, $78,887 and $77,783, respectively, of related party costs. Included in operating and occupancy for fiscal years 2016, 2015, and 2014 are $9,041, $8,507 and $8,899, respectively, of related party costs. See Note 11 for further information. |
F-3
Table of Contents
CONSOLIDATED STATEMENTS OF SHAREHOLDERS’ EQUITY
(In thousands)
| Common Stock | Capital Surplus |
Retained Earnings |
Total |
|||||||||||||||||
| Shares | Amount | |||||||||||||||||||
| Balance, December 31, 2013 |
28,295 | $182,491 | $45,841 | $173,104 | $401,436 | |||||||||||||||
| Exercise of stock options |
667 | 11,480 | – | – | 11,480 | |||||||||||||||
| Issuance of restricted stock units |
103 | – | (445) | – | (445) | |||||||||||||||
| Repurchase of common stock |
(2,836) | (100,000) | – | – | (100,000) | |||||||||||||||
| Stock-based compensation |
– | – | 5,018 | – | 5,018 | |||||||||||||||
| Tax benefit from stock option exercises |
– | – | 3,803 | – | 3,803 | |||||||||||||||
| Net income |
– | – | – | 27,397 | 27,397 | |||||||||||||||
|
|
|
|||||||||||||||||||
| Balance, December 30, 2014 |
26,229 | 93,971 | 54,217 | 200,501 | 348,689 | |||||||||||||||
| Exercise of stock options |
432 | 8,945 | (534) | – | 8,411 | |||||||||||||||
| Issuance of restricted stock units |
80 | – | (293) | – | (293) | |||||||||||||||
| Repurchase of common stock |
(2,069) | (95,549) | – | – | (95,549) | |||||||||||||||
| Stock-based compensation |
– | – | 5,680 | – | 5,680 | |||||||||||||||
| Tax benefit from stock option exercises |
– | – | 4,220 | – | 4,220 | |||||||||||||||
| Net income |
– | – | – | 45,325 | 45,325 | |||||||||||||||
|
|
|
|||||||||||||||||||
| Balance, December 29, 2015 |
24,672 | 7,367 | 63,290 | 245,826 | 316,483 | |||||||||||||||
| Exercise of stock options |
88 | 2,931 | (805) | – | 2,126 | |||||||||||||||
| Issuance of restricted stock units |
53 | 2,002 | (2,325) | – | (323) | |||||||||||||||
| Repurchase and retirement of common stock |
(2,481) | (12,300) | – | (82,686) | (94,986) | |||||||||||||||
| Stock-based compensation |
– | – | 5,707 | – | 5,707 | |||||||||||||||
| Tax benefit from stock option exercises |
– | – | 333 | – | 333 | |||||||||||||||
| Net income |
– | – | – | 45,557 | 45,557 | |||||||||||||||
|
|
|
|||||||||||||||||||
| Balance, January 3, 2017 |
22,332 | $ – | $66,200 | $208,697 | $274,897 | |||||||||||||||
|
|
|
|||||||||||||||||||
The accompanying notes are an integral part of these consolidated financial statements.
F-4
Table of Contents
CONSOLIDATED STATEMENTS OF CASH FLOWS
(In thousands)
| Fiscal Year | ||||||||||||
| 2016 | 2015 | 2014 | ||||||||||
| Cash flows from operating activities: |
||||||||||||
| Net income |
$45,557 | $45,325 | $27,397 | |||||||||
| Adjustments to reconcile net income to net cash provided by operating activities: |
||||||||||||
| Depreciation and amortization |
64,275 | 59,417 | 55,387 | |||||||||
| Deferred income taxes |
7,073 | 5,319 | 4,416 | |||||||||
| Stock-based compensation expense |
5,527 | 5,395 | 4,855 | |||||||||
| Loss on disposal and impairment of assets |
2,971 | 2,908 | 1,963 | |||||||||
| Gain on lease termination, net |
– | (2,910) | – | |||||||||
| Changes in assets and liabilities: |
||||||||||||
| Accounts and other receivables |
9,904 | (994) | (5,393) | |||||||||
| Landlord contribution for tenant improvements |
762 | 426 | (627) | |||||||||
| Inventories, net |
(1,014) | (883) | (577) | |||||||||
| Prepaid expenses and other current assets |
(5,065) | 1,477 | (1,662) | |||||||||
| Other assets, net |
(5,257) | (3,282) | (2,706) | |||||||||
| Accounts payable |
542 | (1,983) | 842 | |||||||||
| Accrued expenses |
10,692 | 11,274 | 12,179 | |||||||||
| Deferred rent |
2,797 | 2,947 | 2,532 | |||||||||
| Deferred lease incentives |
282 | 2,753 | (248) | |||||||||
| Other liabilities |
(687) | 35 | 1,682 | |||||||||
|
|
|
|
|
|
|
|||||||
| Net cash provided by operating activities |
138,359 | 127,224 | 100,040 | |||||||||
| Cash flows from investing activities: |
||||||||||||
| Purchases of property and equipment |
(109,363) | (86,070) | (88,124) | |||||||||
| Proceeds from sale of assets |
4,511 | 3,478 | 13,143 | |||||||||
| Proceeds from marketable securities sold |
– | – | 18,950 | |||||||||
| Purchases of marketable securities |
– | – | (9,159) | |||||||||
|
|
|
|
|
|
|
|||||||
| Net cash used in investing activities |
(104,852) | (82,592) | (65,190) | |||||||||
| Cash flows from financing activities: |
||||||||||||
| Borrowings on line of credit |
1,179,800 | 529,400 | 125,000 | |||||||||
| Payments on line of credit |
(1,132,300) | (486,900) | (67,000) | |||||||||
| Excess tax benefit from stock-based compensation |
333 | 4,220 | 3,803 | |||||||||
| Taxes paid on vested stock units under employee plans |
(323) | (293) | (445) | |||||||||
| Proceeds from exercise of stock options |
2,126 | 8,411 | 11,480 | |||||||||
| Repurchases of common stock |
(94,986) | (95,549) | (100,000) | |||||||||
|
|
|
|
|
|
|
|||||||
| Net cash used in financing activities |
(45,350) | (40,711) | (27,162) | |||||||||
|
|
|
|
|
|
|
|||||||
| Net (decrease) increase in cash and cash equivalents |
(11,843) | 3,921 | 7,688 | |||||||||
| Cash and cash equivalents, beginning of year |
34,604 | 30,683 | 22,995 | |||||||||
|
|
|
|
|
|
|
|||||||
| Cash and cash equivalents, end of year |
$22,761 | $34,604 | $30,683 | |||||||||
|
|
|
|
|
|
|
|||||||
| Supplemental disclosure of cash flow information: |
||||||||||||
| Cash paid for income taxes |
$6,803 | $12,097 | $4,936 | |||||||||
|
|
|
|
|
|
|
|||||||
| Cash paid for interest, net of capitalized interest |
$1,351 | $503 | $175 | |||||||||
|
|
|
|
|
|
|
|||||||
| Supplemental disclosure of non-cash investing and financing activities: |
||||||||||||
| Fixed assets accrued in accounts payable |
$8,485 | $10,915 | $10,294 | |||||||||
|
|
|
|
|
|
|
|||||||
| Stock-based compensation capitalized |
$180 | $285 | $213 | |||||||||
|
|
|
|
|
|
|
|||||||
The accompanying notes are an integral part of these consolidated financial statements.
F-5
Table of Contents
NOTES TO CONSOLIDATED FINANCIAL STATEMENTS
1. The Company and Summary of Significant Accounting Policies
Description of Business
BJ’s Restaurants, Inc. (referred to herein as the “Company,” “BJ’s,” “we,” “us” and “our”) was incorporated in California on October 1, 1991, to assume the management of five “BJ’s Chicago Pizzeria” restaurants and to develop additional BJ’s restaurants. As of January 3, 2017, we owned and operated 187 restaurants located in 24 states. Each of our restaurants is currently operated as a BJ’s Restaurant & Brewhouse®, BJ’s Restaurant & Brewery®, BJ’s Pizza & Grill® or BJ’s Grill®. During fiscal 2016, we opened 17 new restaurants and closed our Century City, California restaurant as a result of our landlord exercising their right to terminate our lease in return for a termination fee due to the mall being remodeled and reconfigured. Several of our BJ’s Restaurant & Brewery® locations, in addition to our two brewpub locations in Texas, brew our signature, proprietary craft BJ’s beer. All of our other restaurants receive their BJ’s beer either from one of our restaurant brewing operations, our Texas brewpubs and/or independent third party brewers using our proprietary recipes.
Basis of Presentation
The accompanying consolidated financial statements include the accounts of BJ’s Restaurants, Inc. and its wholly owned subsidiaries. All intercompany transactions and balances have been eliminated in consolidation. The financial statements presented herein include all material adjustments (consisting of normal recurring adjustments) which are, in the opinion of management, necessary for a fair statement of the financial condition, results of operations and cash flows for the period.
The preparation of financial statements in conformity with U.S. generally accepted accounting principles (“U.S. GAAP”) requires management to make estimates and assumptions for the reporting period and as of the financial statement date. These estimates and assumptions affect the reported amounts of assets and liabilities, the disclosure of contingent assets and liabilities, and the reported amounts of revenues and expenses. Actual results could differ from those estimates.
Our fiscal year consists of 52 or 53 weeks and ends on the Tuesday closest to December 31 for financial reporting purposes. Fiscal year 2016 ended on January 3, 2017 and consisted of 53 weeks of operations. Fiscal years 2015 and 2014 ended on December 29, 2015, and December 30, 2014, respectively, and consisted of 52 weeks of operations.
Segment Disclosure
Financial Accounting Standards Board (“FASB”) Accounting Standards Codification (“ASC”) Topic No. 280, Segment Reporting, establishes standards for disclosures about products and services, geographic areas and major customers. We currently operate in one operating segment: casual dining company-owned restaurants. Additionally, we operate in one geographic area: the United States of America.
Recently Issued Accounting Standards
In February 2016, the FASB issued Accounting Standards Update (“ASU”) 2016-02, Leases (Topic No. 842). This guidance requires the recognition of most leases on the balance sheet to give investors, lenders, and other financial statement users a more comprehensive view of a company’s long-term financial obligations as well as the assets it owns versus leases. ASU 2016-02 will be effective for fiscal years beginning after December 15, 2018, and interim periods within those fiscal years. Currently, all of our restaurant and our restaurant support center leases are accounted for as operating leases and, therefore, are not recorded within our balance sheet. We are currently evaluating the impact that this guidance will have on our consolidated financial statements as well as the expected adoption method.
In March 2016, the FASB issued ASU 2016-09, Improvements to Employee Share-Based Payment Accounting (Topic No. 718). This guidance will change how companies account for certain aspects of share-based payments to employees. Companies will be required to recognize the difference between the estimated and the actual tax impact of awards within the income statement when the awards vest or are settled, and additional paid-in capital (“APIC”) pools will be
F-6
Table of Contents
eliminated. This ASU also impacts the classification of awards as either equity or liabilities and the classification of share-based transactions within the statement of cash flows. ASU 2016-09 is effective for annual and interim reporting periods beginning after December 15, 2016, and early adoption is permitted. We are currently evaluating the impact this guidance will have on our consolidated financial statements.
In April 2016, the FASB issued ASU 2016-10, an amendment to ASU 2014-09, Revenue from Contracts with Customers (Topic No. 606). ASU 2014-09 provides a comprehensive new revenue recognition model that requires a company to recognize revenue to depict the transfer of goods or services to a customer at an amount that reflects the consideration it expects to receive in exchange for those goods or services and expands related disclosure requirements. ASU 2016-10 clarifies ASU 2014-09 to address the potential for diversity in practice at the adoption. ASU 2016-10 is effective for annual and interim reporting periods beginning after December 15, 2017, and early application is permitted. We are currently evaluating the impact this standard will have on our consolidated financial statements as well as the expected adoption method.
Cash and Cash Equivalents
Cash and cash equivalents consist of highly liquid investments and money market funds with an original maturity of three months or less when purchased. Cash and cash equivalents are stated at cost, which approximates fair market value.
Concentration of Credit Risk
Financial instruments which subject us to a concentration of credit risk principally consist of cash and cash equivalents. We currently maintain our day-to-day operating cash balances with a major financial institution. At times, our operating cash balances may be in excess of the FDIC insurance limit.
Inventories
Inventories are comprised primarily of food and beverage products and are stated at the lower of cost (first-in, first-out) or market.
Property and Equipment
Property and equipment are recorded at cost and depreciated over their estimated useful lives. Leasehold improvements are amortized over the estimated useful life of the asset or the lease term, including reasonably assured renewal periods or exercised options, of the respective lease, whichever is shorter. Renewals and betterments that materially extend the life of an asset are capitalized while maintenance and repair costs are expensed as incurred. When property and equipment are sold or otherwise disposed of, the asset accounts and related accumulated depreciation or amortization accounts are relieved, and any gain or loss is included in earnings.
Depreciation and amortization are recorded using the straight-line method over the following estimated useful lives:
| Furniture and fixtures | 10 years | |
| Equipment | 5-10 years | |
| Brewing equipment | 10-20 years | |
| Building improvements | the shorter of 20 years or the remaining lease term | |
| Leasehold improvements | the shorter of the useful life or the lease term, | |
| including reasonably assured renewal periods |
Goodwill
We perform impairment testing annually, during the fourth quarter, and more frequently if factors and circumstances indicate an impairment may have occurred. When evaluating goodwill for impairment, we first perform a qualitative assessment to determine whether it is more likely than not that the fair value of our reporting unit is less than its carrying value. If it is concluded that this is the case, we estimate the fair value of the reporting unit and compare it to the carrying value of the reporting unit, including goodwill. If the carrying value of the reporting unit is greater than the estimated fair value, an impairment charge is recorded for the difference between the implied fair value of goodwill and
F-7
Table of Contents
its carrying amount. To calculate the implied fair value of the reporting unit’s goodwill, the fair value of the reporting unit is first allocated to all of the other assets and liabilities of that unit based on their relative fair values. The excess of the reporting unit’s fair value over the amount assigned to its other assets and liabilities is the implied fair value of goodwill. An impairment loss would be recognized when the carrying amount of goodwill exceeds its implied fair value. This adjusted carrying value becomes the new goodwill accounting basis value. We did not record any impairment to goodwill during fiscal 2016, 2015 or 2014.
Intangible Assets
Definite-lived intangible assets are comprised of trademarks and are amortized over their estimated useful lives of ten years. Definite-lived intangible assets are tested for impairment when facts and circumstances indicate that the carrying values may not be recoverable. Indefinite-lived intangible assets are not subject to amortization and tested for impairment when facts and circumstances indicate that the carrying values may not be recoverable. We did not record any impairment of intangible assets during 2016, 2015 or 2014. Intangible assets are included in “Other assets, net” on the accompanying Consolidated Balance Sheets.
Long-Lived Assets
We assess the potential impairment of our long-lived assets whenever events or changes in circumstances indicate that the carrying value of the assets may not be recoverable. These assets are generally reviewed for impairment in total as well as on a restaurant by restaurant basis. Factors considered include, but are not limited to, significant underperformance by the restaurant relative to expected historical or projected future operating results, significant changes in the manner of use of the acquired assets or the strategy for the overall business, and significant negative industry or economic trends. The recoverability is assessed by comparing the carrying value of the asset to the undiscounted cash flows expected to be generated by the asset. If the carrying amount is greater than the anticipated undiscounted cash flows, an impairment charge is recorded as the difference between the carrying amount and the assets estimated fair value. In fiscal 2015 and 2014, we recorded impairment expense of $0.4 million and $0.3 million, respectively, which is included in “Loss on disposal of assets and impairments” in the Consolidated Statements of Income. We did not incur an impairment expense in fiscal 2016.
Revenue Recognition
Revenues from food and beverage sales at restaurants are recognized when payment is tendered at the point-of-sale. Amounts paid with a credit card are recorded in accounts and other receivables until payment is collected. We sell gift cards which do not have an expiration date and we do not deduct non-usage fees from outstanding gift card balances. Revenues from the sale of gift cards are deferred and recognized upon redemption. Deferred gift card revenue, included in “Accrued expenses” on the accompanying Consolidated Balance Sheets, was $13.0 million and $11.4 million as of January 3, 2017 and December 29, 2015, respectively. We recognize gift card breakage income when the likelihood of the redemption of the cards becomes remote, which is typically 24 months after original issuance. Gift card breakage income is recorded in “Other income, net” on the Consolidated Statements of Income.
Customer Loyalty Program
Our “BJ’s Premier Rewards” customer loyalty program enables participants to earn points for each qualifying purchase. The points can then be redeemed for rewards including food discounts and other items. We measure our total rewards obligation based on the estimated number of customers that will ultimately earn and claim rewards under the program, and record the estimated related expense as reward points accumulate. These expenses are accrued for and recorded as marketing expenses and are included in “Occupancy and operating” expenses on our Consolidated Statements of Income.
Cost of Sales
Cost of sales is comprised of food and beverage costs, including the cost to produce and distribute our proprietary craft beer, soda and ciders. The components of cost of sales are variable and typically fluctuate directly with sales volumes, but may be impacted by changes in commodity prices or promotional activities.
F-8
Table of Contents
Sales Taxes
Revenues are presented net of sales tax collected. The obligations to the appropriate tax authorities are included in other accrued expenses until the taxes are remitted to the appropriate taxing authorities.
Advertising Costs
Advertising costs are expensed as incurred. Advertising expense for fiscal 2016, 2015, and 2014 was approximately $18.9 million, $20.5 million and $19.2 million, respectively. Advertising costs are primarily included in “Occupancy and operating” expenses on our Consolidated Statements of Income.
Income Taxes
We utilize the liability method of accounting for income taxes. Deferred income taxes are recognized based on the tax consequences in future years of differences between the tax basis of assets and liabilities and their financial reporting amounts at each year-end based on enacted tax laws and statutory tax rates applicable to the periods in which differences are expected to affect taxable income. Valuation allowances are established, when necessary, to reduce deferred tax assets to the amount expected to be realized. The provision for income taxes represents the tax payable for the period and the change during the period in deferred tax assets and liabilities.
We provide for income taxes based on our expected federal and state tax liabilities. Our estimates include, but are not limited to, effective state and local income tax rates, allowable tax credits for items such as FICA taxes paid on reported tip income and estimates related to depreciation expense allowable for tax purposes. We usually file our income tax returns several months after our fiscal year-end. All tax returns are subject to audit by federal and state governments for years after the returns are filed, and could be subject to differing interpretations of the tax laws.
We recognize the impact of a tax position in our financial statements if that position is more likely than not of being sustained through an audit, based on the technical merits of the position. Interest and penalties related to uncertain tax positions are included in income tax expense.
Restaurant Opening Expense
Restaurant payroll, supplies, training, other start-up costs and rent expense incurred prior to the opening of a new restaurant are expensed as incurred.
Gain on Lease Termination
On August 3, 2015, the landlord of our Century City, California restaurant notified us that they were exercising their right to terminate our lease in return for a $6.0 million termination fee. Our Century City restaurant was located at The Westfield Century City Mall, which was being significantly reconfigured and renovated, requiring the restaurant to be closed by the end of January 2016. As a result of the forced lease termination, we recorded a $6.0 million termination fee receivable in accordance with our lease provision. This fee offset by the remaining net book value of the restaurants fixed assets resulted in a $2.9 million net gain. In January 2016, we received the $6.0 million termination fee from the landlord.
Leases
We lease the majority of our restaurant locations. We account for our leases in accordance with U.S. GAAP, which require that our leases be evaluated and classified as operating or capital leases for financial reporting purposes. The lease term used for this evaluation includes renewal option periods when the exercise of the renewal option can be reasonably assured and failure to exercise the option would result in an economic penalty. All of our restaurant leases are classified as operating leases.
Tenant improvement allowance incentives may be available to partially offset the cost of developing and opening our restaurants, pursuant to agreed-upon terms in our leases. Tenant improvement allowances can take the form of cash payments upon the opening of the related restaurants, full or partial credits against minimum or percentage rents otherwise payable by us or a combination thereof. All tenant improvement allowances received by us are recorded as a
F-9
Table of Contents
deferred lease incentive and amortized over the term of the lease. The related cash received from the landlord is reflected as “Landlord contribution for tenant improvements” within the cash flow from operating activities section of our Consolidated Statements of Cash Flows.
The lease term used for straight-line rent expense is calculated from the date we obtain possession of the leased premises through the lease termination date. We expense rent from possession date through the restaurant opening date as restaurant opening expense within our statement of operations. Once a restaurant opens for business, we record straight-line rent over the probable lease term plus contingent rent to the extent it exceeds the minimum rent obligation per the lease agreement.
Cash rent payments are not typically due under the terms of our leases during the rent holiday period, which begins on the possession date and ends on the restaurant opening date. Factors that may affect the length of the rent holiday period include construction related delays. Extension of the rent holiday period due to delays in a restaurant opening will result in greater preopening rent expense recognized during the rent holiday period and lesser occupancy expense during the remainder of the lease term (post-opening).
For leases that contain rent escalations in which the amount of future rent can be reasonably calculated, we record the total rent payable under the lease on a straight-line basis over the probable term (including the rent holiday period beginning upon our possession of the premises). Differences between rent payments and the straight-line rent expense are recorded as deferred rent. Certain leases contain provisions that require additional rent payments based upon a restaurant’s sales volume (“contingent rent”). Contingent rent is accrued each period based on the actual sales, in addition to the straight-line rent expense noted above. This results in some variability in occupancy expense over the term of the lease in restaurants where we pay contingent rent.
Management makes judgments regarding the probable term for each restaurant property lease and applies these selected terms consistently to each lease. These judgments can impact the classification and accounting for a lease as capital or operating, the calculation of straight-line rent, and the term over which leasehold improvements are amortized. These judgments produce materially different amounts of depreciation, amortization and rent expense than would be reported if different lease terms were used.
Net Income Per Share
Basic net income per share is computed by dividing the net income attributable to common shareholders by the weighted average number of common shares outstanding during the period. Diluted net income per share reflects the potential dilution that could occur if stock options issued by us to sell common stock at set prices were exercised and if restrictions on restricted stock units issued by us were to lapse (collectively, equity awards) using the treasury stock method. Performance-based restricted stock units have been excluded from the diluted income per share computation because the performance-based criteria have not been met.
The following table presents a reconciliation of basic and diluted net income per share, including the number of dilutive equity awards (stock options and restricted stock units) that were included in the dilutive net income per share computation (in thousands):
| Fiscal Year | ||||||||||||
| 2016 | 2015 | 2014 | ||||||||||
| Numerator: |
||||||||||||
| Net income for basic and diluted net income per share |
$45,557 | $45,325 | $27,397 | |||||||||
|
|
|
|
|
|
|
|||||||
| Denominator: |
||||||||||||
| Weighted-average shares outstanding - basic |
23,824 | 25,718 | 27,710 | |||||||||
| Dilutive effect of equity awards |
409 | 513 | 606 | |||||||||
|
|
|
|
|
|
|
|||||||
| Weighted-average shares outstanding - diluted |
24,233 | 26,231 | 28,316 | |||||||||
|
|
|
|
|
|
|
|||||||
At January 3, 2017, December 29, 2015, and December 30, 2014, there were approximately 0.3 million, 0.2 million, and 0.8 million shares of common stock equivalents, respectively, that have been excluded from the calculation of diluted net income per share because they are anti-dilutive.
F-10
Table of Contents
Stock-Based Compensation
Under our shareholder approved stock-based compensation plans, we have granted incentive stock options, non-qualified stock options, and restricted stock units (“RSUs”), including performance and time-based restricted stock units, that generally vest over three to five years and expire ten years from the date of grant. Stock-based compensation is recorded in accordance with U.S. GAAP based on the underlying estimated fair value of the awards granted. In valuing stock options, we are required to make certain assumptions and judgments regarding the inputs to the Black-Scholes option-pricing model. These inputs include expected volatility, risk free interest rate, expected option life, dividend yield and expected vesting percentage. These estimations and judgments involve many different variables that, in many cases, are outside of our control. Changes in these variables may significantly impact the compensation cost recognized for these grants resulting in a significant impact to our financial results. The tax benefits resulting from tax deductions in excess of the compensation cost recognized for stock options (excess tax benefits) are classified as financing cash flows within the Consolidated Statements of Cash Flows.
2. Accounts and Other Receivables
Accounts and other receivables consisted of the following (in thousands):
| January 3, 2017 |
December 29, 2015 |
|||||||
| Credit cards |
$5,272 | $6,282 | ||||||
| Third party gift cards |
3,016 | 2,933 | ||||||
| Tenant improvement allowances |
4,517 | 5,279 | ||||||
| Income taxes |
1,255 | 4,039 | ||||||
| Lease termination fee |
– | 6,000 | ||||||
| Other |
638 | 831 | ||||||
|
|
|
|
|
|||||
| $14,698 | $25,364 | |||||||
|
|
|
|
|
|||||
3. Property and Equipment
| January 3, 2017 |
December 29, 2015 |
|||||||
| Land |
$10,933 | $8,658 | ||||||
| Building improvements |
344,450 | 308,875 | ||||||
| Leasehold improvements |
240,811 | 222,157 | ||||||
| Furniture and fixtures |
128,582 | 116,308 | ||||||
| Equipment |
258,356 | 230,790 | ||||||
|
|
|
|
|
|||||
| 983,132 | 886,788 | |||||||
| Less accumulated depreciation and amortization |
(404,702) | (345,765) | ||||||
|
|
|
|
|
|||||
| 578,430 | 541,023 | |||||||
| Construction in progress |
22,894 | 20,809 | ||||||
|
|
|
|
|
|||||
| Property and equipment, net |
$601,324 | $561,832 | ||||||
|
|
|
|
|
|||||
F-11
Table of Contents
4. Accrued Expenses
Accrued expenses consisted of the following (in thousands):
| January 3, 2017 |
December 29, 2015 |
|||||||
| Payroll related |
$26,374 | $20,984 | ||||||
| Workers’ compensation |
19,834 | 19,753 | ||||||
| Deferred revenue from gift cards |
12,968 | 11,363 | ||||||
| Sales taxes |
7,044 | 5,332 | ||||||
| Other taxes |
5,089 | 4,992 | ||||||
| Deferred lease incentives - current |
4,568 | 4,268 | ||||||
| Other current rent related |
2,908 | 2,482 | ||||||
| Utilities |
1,981 | 2,026 | ||||||
| Customer loyalty program |
2,780 | 2,424 | ||||||
| Merchant cards |
1,782 | 1,277 | ||||||
| Other |
9,225 | 8,960 | ||||||
|
|
|
|
|
|||||
| $94,553 | $83,861 | |||||||
|
|
|
|
|
|||||
5. Commitments and Contingencies
Leases
We lease our restaurant and office facilities under non-cancelable operating leases with remaining terms ranging from approximately 10 to 20 years and renewal options ranging from 5 to 20 years. Rent expense for fiscal 2016, 2015, and 2014 was $42.8 million, $39.4 million, and $35.9 million, respectively.
We have certain operating leases that contain fixed rent escalation clauses or rent escalation clauses in which the amount of the future rent can be calculated. Total rent due for these leases is expensed on a straight-line basis over each respective lease term, resulting in deferred rent of approximately $30.4 million and $27.6 million at January 3, 2017 and December 29, 2015, respectively. The deferred rent will be amortized to rent expense over each respective lease term.
A number of our leases require us to pay contingent rent based on a percentage of sales above a specified minimum. Total contingent rent included within rent expense for fiscal 2016, 2015, and 2014 was approximately $3.8 million, $3.6 million, and $3.5 million, respectively.
Future minimum annual rent payments under non-cancelable operating leases are as follows (in thousands):
| 2017 |
$45,685 | |||
| 2018 |
45,283 | |||
| 2019 |
43,367 | |||
| 2020 |
42,390 | |||
| 2021 |
41,859 | |||
| Thereafter |
367,838 | |||
|
|
|
|||
| $586,422 | ||||
|
|
|
Additionally, we have entered into lease agreements related to the construction of future restaurants with commencement dates subsequent to January 3, 2017. Our aggregate future commitment relating to these leases is $3.5 million and is not included in the above future minimum annual rent payments.
Legal Proceedings
We are subject to lawsuits, administrative proceedings and demands that arise in the ordinary course of our business and which typically involve claims from customers, employees and others related to operational, employment, real
F-12
Table of Contents
estate and intellectual property issues common to the foodservice industry. A number of these claims may exist at any given time. We are self-insured for a portion of our general liability and our employee workers’ compensation requirements. We maintain coverage with a third party insurer to limit our total exposure. We believe that most of our customer claims will be covered by our general liability insurance, subject to coverage limits and the portion of such claims that are self-insured. Punitive damages awards and employee unfair practice claims, however, are not covered by our general liability insurance. To date, we have not been ordered to pay punitive damages with respect to any claims, but there can be no assurance that punitive damages will not be awarded with respect to any future claims. We could be affected by adverse publicity resulting from allegations in lawsuits, claims and proceedings, regardless of whether these allegations are valid or whether we are ultimately determined to be liable. We currently believe that the final disposition of these types of lawsuits, proceedings and claims will not have a material adverse effect on our financial position, results of operations or liquidity. It is possible, however, that our future results of operations for a particular quarter or fiscal year could be impacted by changes in circumstances relating to lawsuits, proceedings or claims.
Letters of Credit
We have irrevocable standby letters of credit outstanding, as required under our workers’ compensation insurance arrangements, of $14.5 million as of January 3, 2017. Our standby letters of credit automatically renew each October 31 for one year unless 30 days’ notice, prior to such renewal date, is given by the financial institution that provides the letters. The standby letters of credit issued under our Credit Facility reduce the amount available for borrowing.
Other Commitments
We have severance and employment agreements with certain of our executive officers that provide for payments to those officers in the event of a termination of their employment as a result of a change in control of the Company, or without cause, as defined in those agreements. Aggregate payments totaling approximately $2.0 million would have been required by those agreements had all such officers terminated their employment for those reasons as of January 3, 2017. Additionally, our future estimated cash payments under existing contractual purchase obligations for goods and services as of January 3, 2017, are approximately $28.7 million.
6. Long-Term Debt
Line of Credit
On November 18, 2016, we entered into a Second Amended and Restated Credit Agreement amendment to our existing loan agreement (“Credit Facility”) dated September 3, 2014, pursuant to which we increased the amount available under our revolving loan by an additional $50 million. The Credit Facility, which matures on November 18, 2021, now provides us with revolving loan commitments totaling $250 million, of which $50 million may be used for the issuance of letters of credit. Availability under the Credit Facility is reduced by outstanding letters of credit, which are used to support our self-insurance programs. Our obligations under the Credit Facility are unsecured. As of January 3, 2017, there were borrowings of $148.0 million and letters of credit totaling approximately $14.5 million outstanding under the Credit Facility. Available borrowings under the Credit Facility were $87.5 million as of January 3, 2017. The Credit Facility bears interest at our choice of LIBOR plus a percentage not to exceed 1.75%, or at a rate ranging from Bank of America’s prime rate to 0.75% above Bank of America’s prime rate, based on our level of lease and debt obligations as compared to EBITDA plus lease expenses. The weighted average interest rate during fiscal 2016 was approximately 1.53%.
The Credit Facility contains provisions requiring us to maintain compliance with certain covenants, including a Fixed Charge Coverage Ratio and a Lease Adjusted Leverage Ratio. At January 3, 2017, we were in compliance with these covenants.
Interest expense related to the borrowings under the Credit Facility for fiscal 2016, 2015, and 2014 was approximately $1.4 million, $0.5 million and $0.1 million, respectively. We also capitalized approximately $0.2 million of interest expense related to new restaurant construction during fiscal 2016 and fiscal 2015.
F-13
Table of Contents
7. Shareholders’ Equity
Preferred Stock
We are authorized to issue 5.0 million shares of one or more series of preferred stock and we are authorized to determine the rights, preferences, privileges and restrictions to be granted to, or imposed upon, any such series, including the voting rights, redemption provisions (including sinking fund provisions), dividend rights, dividend rates, liquidation rates, liquidation preferences, conversion rights and the description and number of shares constituting any wholly unissued series of preferred stock. No shares of preferred stock were issued or outstanding at January 3, 2017 or December 29, 2015. We currently have no plans to issue shares of preferred stock.
Common Stock
Shareholders are entitled to one vote for each share of common stock held of record. Pursuant to the requirements of California law, shareholders are entitled to accumulate votes in connection with the election of directors. Shareholders of our outstanding common stock are entitled to receive dividends if and when declared by the Board of Directors. We have no plans to pay any cash dividends in the foreseeable future.
Stock Repurchases
During fiscal 2016, we repurchased and retired approximately 2.5 million shares of our common stock at an average price of $38.28 per share for a total of $95.0 million, which is recorded as a reduction in common stock, with any excess charged to retained earnings. As of January 3, 2017, approximately $59.5 million remains available for additional repurchases under our $350 million authorized share repurchase program.
8. Income Taxes
Income tax expense (benefit) for the last three fiscal years consists of the following (in thousands):
| Fiscal Year | ||||||||||||
| 2016 | 2015 | 2014 | ||||||||||
| Current: |
||||||||||||
| Federal |
$6,034 | $8,161 | $3,990 | |||||||||
| State |
2,427 | 3,302 | 520 | |||||||||
|
|
|
|
|
|
|
|||||||
| 8,461 | 11,463 | 4,510 | ||||||||||
| Deferred: |
||||||||||||
| Federal |
6,869 | 5,278 | 3,381 | |||||||||
| State |
204 | 41 | 1,035 | |||||||||
|
|
|
|
|
|
|
|||||||
| 7,073 | 5,319 | 4,416 | ||||||||||
|
|
|
|
|
|
|
|||||||
| Income tax expense |
$15,534 | $16,782 | $8,926 | |||||||||
|
|
|
|
|
|
|
|||||||
Income tax expense for the last three fiscal years differs from the amount that would result from applying the federal statutory rate as follows:
| Fiscal Year | ||||||||||||
| 2016 | 2015 | 2014 | ||||||||||
| Income tax at statutory rates |
35.0% | 35.0% | 35.0% | |||||||||
| State income taxes, net of federal benefit |
3.3 | 3.7 | 1.0 | |||||||||
| Permanent differences |
– | 0.2 | 0.1 | |||||||||
| Income tax credits |
(11.9) | (12.5) | (10.9) | |||||||||
| Other, net |
(1.0) | 0.6 | (0.6) | |||||||||
|
|
|
|
|
|
|
|||||||
| 25.4% | 27.0% | 24.6% | ||||||||||
|
|
|
|
|
|
|
|||||||
F-14
Table of Contents
The components of the deferred income tax asset (liability) consist of the following (in thousands):
| January 3, 2017 |
December 29, 2015 |
|||||||
| Current deferred income tax asset: |
||||||||
| State tax |
$985 | $885 | ||||||
| Gift cards |
1,521 | 988 | ||||||
| Accrued expenses |
13,752 | 13,839 | ||||||
| Other |
2,193 | 1,398 | ||||||
| Valuation allowance |
(68) | (139) | ||||||
|
|
|
|
|
|||||
| Total current deferred income tax asset |
18,383 | 16,971 | ||||||
| Non-current deferred income tax asset (liability): |
||||||||
| Property and equipment |
(80,842) | (77,120) | ||||||
| Intangible assets |
(2,085) | (2,048) | ||||||
| Smallwares |
(5,488) | (5,038) | ||||||
| Accrued expenses |
6,255 | 5,942 | ||||||
| Stock-based compensation |
6,152 | 5,346 | ||||||
| Deferred rent |
11,637 | 10,874 | ||||||
| Income tax credits |
6,559 | 13,188 | ||||||
| Net operating losses |
785 | 562 | ||||||
| Other |
2,071 | 2,079 | ||||||
| Valuation allowance |
(198) | (454) | ||||||
|
|
|
|
|
|||||
| Total non-current deferred income tax liability |
(55,154) | (46,669) | ||||||
|
|
|
|
|
|||||
| Net deferred income tax liability |
$(36,771) | $(29,698) | ||||||
|
|
|
|
|
|||||
At January 3, 2017, we had federal and California income tax credit carryforwards of approximately $6.5 million and $1.4 million, respectively, consisting primarily of the credit for FICA taxes paid on reported employee tip income and California enterprise zone credits. The FICA tax credits will begin to expire in 2034 and the California enterprise zone credits will begin to expire in 2023.
As of January 3, 2017 and December 29, 2015, we have recorded a valuation allowance against certain state net operating loss and tax credit carryforwards of $0.3 million and $0.6 million, respectively, net of federal benefit which are not more likely than not to be realized prior to expiration. We recognize interest and penalties related to uncertain tax positions in income tax expense. As of January 3, 2017, the amount recorded for interest and penalties changed for tax positions taken in the current year.
As of January 3, 2017, unrecognized tax benefits recorded was approximately $1.2 million, of which approximately $0.9 million, if reversed would impact our effective tax rate. We anticipate no change in our liability for unrecognized tax benefits within the next twelve-month period.
F-15
Table of Contents
A reconciliation of the beginning and ending amount of unrecognized tax benefits is as follows (in thousands):
| Balance at December 31, 2013 |
$219 | |||
| Increase for tax positions taken in prior years |
1,798 | |||
| Decrease for tax positions taken in prior years |
(52) | |||
| Increase for tax positions taken in current year |
317 | |||
| Decrease for statute expiration |
(109) | |||
|
|
|
|||
| Balance at December 30, 2014 |
2,173 | |||
| Increase for tax positions taken in prior years |
474 | |||
| Increase for tax positions taken in current year |
386 | |||
| Lapse in statute of limitations |
(35) | |||
|
|
|
|||
| Balance at December 29, 2015 |
2,998 | |||
| Increase for tax positions taken in prior years |
126 | |||
| Decrease for tax positions taken in prior years |
(2,037) | |||
| Increase for tax positions taken in current year |
188 | |||
| Lapse in statute of limitations |
(30) | |||
|
|
|
|||
| Balance at January 3, 2017 |
$1,245 | |||
|
|
|
Our uncertain tax positions are related to tax years that remain subject to examination by tax agencies. As of January 3, 2017, the earliest tax year still subject to examination by the Internal Revenue Service is 2013. The earliest year still subject to examination by a significant state or local taxing jurisdiction is 2012.
9. Stock-Based Compensation Plans
Our current shareholder approved stock-based compensation plan is the 2005 Equity Incentive Plan (“the Plan”), as amended from time to time. Under the Plan, we may issue shares of our common stock to employees, officers, directors and consultants. We have granted incentive stock options, non-qualified stock options, and performance and time-based restricted stock units. Stock options and stock appreciation rights are charged against the Plan share reserve on the basis of one share for each share granted. Other types of grants, including restricted stock units (“RSUs”), are currently charged against the Plan share reserve on the basis of 1.5 shares for each share granted. The Plan also contains other limits on the terms of incentive grants such as limits on the number that can be granted to an employee during any fiscal year. All options granted under the Plan expire within 10 years of their date of grant.
Under the Plan, we issue stock options as well as time-based and performance-based RSUs to officers. We issue time-based RSUs and stock options to other support employees. We also issue RSUs and stock options in connection with the BJ’s Gold Standard Stock Ownership Program (the “GSSOP”). The GSSOP is a long-term equity incentive program for our restaurant general managers, executive kitchen mangers and restaurant field supervision. GSSOP grants are dependent on the length of each participant’s service with us and position. All GSSOP participants must remain in good standing during their service period.
The Plan permits us to set the vesting terms and exercise period for awards at our discretion. Stock options generally vest ratably over three or five years, cliff vest at five years, or cliff vest at 33% on the third anniversary and 67% on the fifth anniversary, and expire ten years from the date of grant. Time-based RSUs generally vest ratably over three or five years for non-GSSOP participants and either cliff vest at five years or cliff vest at 33% on the third anniversary and 67% on the fifth anniversary for GSSOP participants. Performance-based RSUs generally cliff vest on the third anniversary of the grant date in an amount from 0% to 150% of the grant quantity, dependent on the level of target achievement.
F-16
Table of Contents
The following table presents information for the classification of the related to stock-based compensation (in thousands):
| Fiscal Year | ||||||||||||
| 2016 | 2015 | 2014 | ||||||||||
| Labor and benefits |
$1,786 | $1,427 | $1,456 | |||||||||
| General and administrative |
$3,741 | $3,968 | $3,167 | |||||||||
| Legal and other settlements |
$– | $– | $232 | |||||||||
| Capitalized (1) |
$180 | $285 | $213 | |||||||||
| (1) | Capitalized stock-based compensation relates to our restaurant development personnel and is included in “Property and equipment, net” on the Consolidated Balance Sheets. |
Stock Options
The fair value of each stock option grant was estimated on the date of grant using the Black-Scholes option-pricing model with the following weighted average assumptions:
| Fiscal Year | ||||||||||||
| 2016 | 2015 | 2014 | ||||||||||
| Expected volatility |
35.8% | 37.0% | 37.7% | |||||||||
| Risk free interest rate |
1.51% | 1.39% | 1.64% | |||||||||
| Expected option life |
5 years | 5 years | 5 years | |||||||||
| Dividend yield |
0% | 0% | 0% | |||||||||
| Fair value of options granted |
$14.08 | $16.33 | $10.78 | |||||||||
The exercise price of the stock options grants under our stock-based compensation plan is required to equal or exceed the fair market value of the shares on the grant date. The following table presents stock option activity:
| Options Outstanding | Options Exercisable | |||||||||||||||||||||||
| Shares (in thousands) |
Weighted Average Exercise Price |
Shares (in thousands) |
Weighted Average Exercise Price |
Weighted Average Remaining Contractual Life |
||||||||||||||||||||
| Outstanding at December 31, 2013 |
2,049 | $22.82 | 1,514 | $18.74 | 3.9 | |||||||||||||||||||
| Granted |
231 | $30.49 | ||||||||||||||||||||||
| Exercised |
(665) | $17.21 | ||||||||||||||||||||||
| Forfeited |
(93) | $36.33 | ||||||||||||||||||||||
| Outstanding at December 30, 2014 |
1,522 | $25.62 | 1,008 | $21.46 | 4.2 | |||||||||||||||||||
| Granted |
175 | $47.38 | ||||||||||||||||||||||
| Exercised |
(432) | $19.46 | ||||||||||||||||||||||
| Forfeited |
(41) | $35.02 | ||||||||||||||||||||||
| Outstanding at December 29, 2015 |
1,224 | $30.59 | 729 | $25.41 | 4.9 | |||||||||||||||||||
| Granted |
146 | $41.78 | ||||||||||||||||||||||
| Exercised |
(88) | $24.03 | ||||||||||||||||||||||
| Forfeited |
(55) | $40.56 | ||||||||||||||||||||||
| Outstanding at January 3, 2017 |
1,227 | $31.95 | 802 | $27.73 | 4.5 | |||||||||||||||||||
F-17
Table of Contents
Information relating to significant option groups outstanding as of January 3, 2017, is as follows (shares in thousands):
| Options Outstanding | Options Exercisable | |||||||||||||||||||||||
| Range of Exercise Prices |
Outstanding | Weighted Average Remaining Contractual Life |
Weighted Average Exercise Price |
Exercisable | Weighted Average Exercise Price |
|||||||||||||||||||
| $9.37 – $16.63 | 60 | 1.46 | $12.70 | 60 | $12.70 | |||||||||||||||||||
| $18.86 – $18.86 | 276 | 2.99 | $18.86 | 276 | $18.86 | |||||||||||||||||||
| $20.81 – $29.88 | 147 | 6.13 | $28.21 | 80 | $26.91 | |||||||||||||||||||
| $30.39 – $34.24 | 111 | 6.31 | $33.44 | 74 | $33.61 | |||||||||||||||||||
| $34.29 – $34.29 | 245 | 5.92 | $34.29 | 196 | $34.29 | |||||||||||||||||||
| $34.89 – $42.41 | 184 | 7.75 | $40.12 | 49 | $36.44 | |||||||||||||||||||
| $42.94 – $47.04 | 174 | 7.38 | $46.25 | 60 | $45.94 | |||||||||||||||||||
| $48.64 – $51.08 | 13 | 6.00 | $49.71 | 4 | $49.65 | |||||||||||||||||||
| $52.47 – $52.47 | 6 | 8.15 | $52.47 | 1 | $52.47 | |||||||||||||||||||
| $52.98 – $52.98 | 11 | 8.16 | $52.98 | 2 | $52.98 | |||||||||||||||||||
| $9.37 – $52.98 | 1,227 | 5.62 | $31.95 | 802 | $27.73 | |||||||||||||||||||
As of January 3, 2017, total unrecognized stock-based compensation expense related to non-vested stock options was $3.8 million, which is generally expected to be recognized over the next five years.
Time-Based Restricted Stock Units
The following table presents time-based restricted stock unit activity:
| Shares (in thousands) |
Weighted Average Fair Value |
|||||||
| Outstanding at December 31, 2013 |
433 | $33.23 | ||||||
| Granted |
130 | $31.71 | ||||||
| Vested or released |
(80) | $21.36 | ||||||
| Forfeited |
(56) | $35.60 | ||||||
|
|
|
|
|
|||||
| Outstanding at December 30, 2014 |
427 | $34.66 | ||||||
| Granted |
148 | $47.99 | ||||||
| Vested or released |
(89) | $29.75 | ||||||
| Forfeited |
(57) | $39.43 | ||||||
|
|
|
|
|
|||||
| Outstanding at December 29, 2015 |
429 | $39.63 | ||||||
| Granted |
155 | $40.82 | ||||||
| Vested or released |
(63) | $39.47 | ||||||
| Forfeited |
(61) | $42.12 | ||||||
|
|
|
|
|
|||||
| Outstanding at January 3, 2017 |
460 | $39.75 | ||||||
|
|
|
|
|
|||||
The fair value of time-based RSUs is the quoted market value of our common stock on the date of grant. The fair value of each time-based RSU is expensed over the vesting period (e.g., five years). As of January 3, 2017, total unrecognized stock-based compensation expense related to non-vested RSUs was approximately $8.8 million, which is generally expected to be recognized over the next five years.
F-18
Table of Contents
Performance-Based Restricted Stock Units
The following table presents performance-based restricted stock unit activity:
| Shares (in thousands) |
Weighted Average Fair Value |
|||||||
| Outstanding at December 31, 2013 |
– | $– | ||||||
| Granted |
36 | $32.49 | ||||||
| Vested or released |
– | $– | ||||||
| Forfeited |
(6) | $32.49 | ||||||
|
|
|
|
|
|||||
| Outstanding at December 30, 2014 |
30 | $32.49 | ||||||
| Granted |
– | $– | ||||||
| Vested or released |
– | $– | ||||||
| Forfeited |
(1) | $32.49 | ||||||
|
|
|
|
|
|||||
| Outstanding at December 29, 2015 |
29 | $32.49 | ||||||
| Granted |
32 | $42.41 | ||||||
| Vested or released |
– | $– | ||||||
| Forfeited |
(7) | $36.37 | ||||||
|
|
|
|
|
|||||
| Outstanding at January 3, 2017 |
54 | $37.87 | ||||||
|
|
|
|
|
|||||
The fair value of performance-based RSUs is the quoted market value of our common stock on the date of grant. The fair value of each performance-based RSU is recognized when it is probable the performance goal will be achieved. As of January 3, 2017, total unrecognized stock-based compensation expense related to non-vested performance-based RSUs was approximately $0.8 million, which is generally expected to be recognized over the next three years.
10. Employee Benefit Plans
We maintain a voluntary, contributory 401(k) plan for eligible employees. Employees may elect to contribute up to the IRS maximum for the plan year. Additionally, eligible participants may also elect catch-up contributions as provided for by the IRS. Our executive officers and other highly compensated employees are not eligible to participate in the 401(k) plan. Employee contributions are matched by us at a rate of 33% for the first 6% of deferred earnings. We contributed approximately $0.5 million, $0.6 million, and $0.3 million in fiscal 2016, 2015, and 2014, respectively.
We also maintain a non-qualified deferred compensation plan (the “DCP”) for our executive officers and other highly compensated employees, as defined in the DCP, who are otherwise ineligible for participation in our 401(k) plan. The DCP allows participating employees to defer the receipt of a portion of their base compensation and up to 100% of their eligible bonuses. Additionally, the DCP allows for a voluntary company match as determined by the Company’s compensation committee. During fiscal 2016, there were no Company contributions made or accrued. We pay for related administrative costs, which were not significant during fiscal 2016. Employee deferrals are deposited into a rabbi trust and the funds are generally invested in individual variable life insurance contracts owned by us that are specifically designed to informally fund savings plans of this nature. Our investment in variable life insurance contracts, reflected in “Other assets, net” on our Consolidated Balance Sheets, was $6.2 million and $5.5 million as of January 3, 2017 and December 29, 2015, respectively. Our obligation to participating employees, included in “Other liabilities” on the accompanying Consolidated Balance Sheets, was $6.0 million and $4.8 million as of January 3, 2017 and December 29, 2015, respectively. All income and expenses related to the rabbi trust are reflected in our Consolidated Statements of Income.
11. Related Party Transactions
The Jacmar Companies and their affiliates (collectively referred to herein as “Jacmar”) is one of our shareholders and James Dal Pozzo, the Chief Executive Officer of Jacmar, is a member of our Board of Directors. Jacmar, through its affiliation with DMA, is currently our largest supplier of food, beverage, paper products and supplies. We began using DMA for our national foodservice distribution in July 2006. In July 2012, we finalized a new five-year agreement with DMA, after conducting another extensive competitive bidding process. Jacmar services our restaurants in California
F-19
Table of Contents
and Nevada, while other DMA distributors service our restaurants in all other states. Under the terms of our agreement with DMA, Jacmar is required to sell products to us at the same prices as the other DMA distributors. Jacmar does not provide us with any produce, liquor, wine or beer products, all of which are provided by other third party vendors and are included in “Cost of sales” on the Consolidated Statements of Income.
The cost of food, beverage, paper products and supplies provided by Jacmar included within cost of sales and occupancy and operating expenses consisted of the following (in thousands):
| Fiscal Year | ||||||||||||||||||||||||||||||||
| 2016 | 2015 | 2014 | ||||||||||||||||||||||||||||||
| Cost of Sales: |
||||||||||||||||||||||||||||||||
| Third party suppliers |
$169,671 | 67.5% | $148,055 | 65.2% | $135,196 | 63.5% | ||||||||||||||||||||||||||
| Jacmar |
81,789 | 32.5 | 78,887 | 34.8 | 77,783 | 36.5 | ||||||||||||||||||||||||||
| Total Cost of Sales |
$251,460 | 100.0% | $226,942 | 100.0% | $212,979 | 100.0% | ||||||||||||||||||||||||||
| Occupancy and Operating: |
||||||||||||||||||||||||||||||||
| Third party suppliers |
$195,542 | 95.6% | $184,232 | 95.6% | $173,250 | 95.1% | ||||||||||||||||||||||||||
| Jacmar |
9,041 | 4.4 | 8,507 | 4.4 | 8,899 | 4.9 | ||||||||||||||||||||||||||
| Total Occupancy and Operating |
$204,583 | 100.0% | $192,739 | 100.0% | $182,149 | 100.0% | ||||||||||||||||||||||||||
The amounts included in trade payables related to Jacmar consisted of the following (in thousands):
| January 3, 2017 |
December 29, 2015 |
|||||||
| Third party suppliers |
$25,363 | $28,713 | ||||||
| Jacmar |
5,782 | 4,320 | ||||||
|
|
|
|
|
|||||
| Total Accounts Payable |
$31,145 | $33,033 | ||||||
|
|
|
|
|
|||||
12. Selected Consolidated Quarterly Financial Data (Unaudited)
Our summarized unaudited consolidated quarterly financial data is the following (in thousands, except per share data):
| March 29, 2016 |
June 28, 2016 |
September 27, 2016 |
January 3, 2017 |
|||||||||||||
| Total revenues |
$243,401 | $250,328 | $233,702 | $265,621 | ||||||||||||
| Income from operations |
$16,393 | $19,561 | $9,071 | $16,616 | ||||||||||||
| Net income |
$11,644 | $13,789 | $7,237 | $12,887 | ||||||||||||
| Basic net income per share (1) |
$0.48 | $0.57 | $0.30 | $0.56 | ||||||||||||
| Diluted net income per share (1) |
$0.47 | $0.56 | $0.30 | $0.55 | ||||||||||||
| March 31, 2015 |
June 30, 2015 |
September 29, 2015 |
December 29, 2015 |
|||||||||||||
| Total revenues |
$225,069 | $232,013 | $229,412 | $233,103 | ||||||||||||
| Income from operations |
$13,092 | $17,581 | $16,511 | $15,878 | ||||||||||||
| Net income |
$9,615 | $12,438 | $12,364 | $10,908 | ||||||||||||
| Basic net income per share (1) |
$0.37 | $0.48 | $0.48 | $0.43 | ||||||||||||
| Diluted net income per share (1) |
$0.36 | $0.47 | $0.48 | $0.43 | ||||||||||||
| (1) | Basic and diluted net income per share calculations for each quarter is based on the weighted average diluted shares outstanding for that quarter and may not sum to the full year total amount as presented on the Consolidated Statements of Income. |
F-20