Attached files
Table of Contents
UNITED STATES
SECURITIES AND EXCHANGE COMMISSION
Washington, D.C. 20549
FORM 10-K
(Mark one)
| x | ANNUAL REPORT PURSUANT TO SECTION 13 OR 15(d) OF THE SECURITIES EXCHANGE ACT OF 1934 |
For the fiscal year ended December 29, 2009
OR
| ¨ | TRANSITION REPORT PURSUANT TO SECTION 13 OR 15(d) OF THE SECURITIES EXCHANGE ACT OF 1934 |
For the transition period from to
Commission file number 0-21423
BJ’S RESTAURANTS, INC.
(Exact name of registrant as specified in its charter)
| California | 33-0485615 | |
| (State or other jurisdiction of incorporation or organization) |
(I.R.S. Employer Identification Number) |
7755 Center Avenue
Suite 300
Huntington Beach, California 92647
(714) 500-2400
(Address, including zip code, and telephone number, including
area code, of registrant’s principal executive offices)
Securities registered pursuant to Section 12(b) of the Act:
| Title of Each Class |
Name of each Exchange on Which Registered | |
| Common Stock, No Par Value | NASDAQ Global Select Market |
Securities registered pursuant to Section 12(g) of the Act:
None
Indicate by check mark whether the registrant is a well-known seasoned issuer, as defined in Rule 405 of the Securities Act. YES ¨ NO x
Indicate by check mark if the registrant is not required to file reports pursuant to Section 13 or Section 15(d) of the Act. YES ¨ NO x
Indicate by check mark whether the Registrant (1) has filed all reports required to be filed by Section 13 or 15(d) of the Securities Exchange Act of 1934 during the preceding 12 months (or for such shorter period that the Registrant was required to file such reports), and (2) has been subject to such filing requirements for the past 90 days. YES x NO ¨
Indicate by check mark whether the registrant has submitted electronically and posted on its corporate Website, if any, every Interactive Data File required to be submitted and posted pursuant to Rule 405 of Regulation S-T (Section 232.405 of this chapter) during the preceding 12 months (or for such shorter period that the registrant was required to submit and post such files). YES ¨ NO ¨
Indicate by check mark if disclosure of delinquent filers pursuant to Item 405 of Regulation S-K is not contained herein, and will not be contained, to the best of Registrant’s knowledge, in definitive proxy or information statements incorporated by reference in Part III of this Form 10-K or any amendment to this Form 10-K. ¨
Indicate by check mark whether the registrant is a large accelerated filer, an accelerated filer, a non-accelerated filer or a smaller reporting company. See definition of “accelerated filer,” “large accelerated filer” and “smaller reporting company” in Rule 12b-2 of the Exchange Act. (Check one):
| ¨ Large accelerated filer | x Accelerated filer | |
| ¨ Non-accelerated filer (do not check if smaller reporting company) | ¨ Smaller reporting company |
Indicate by check mark whether the registrant is a shell company (as defined in Rule 12b-2 of the Act). YES ¨ NO x
The aggregate market value of the common stock of the Registrant (“Common Stock”) held by non-affiliates as of the last business day of the second fiscal quarter, June 30, 2009, was $379,710,820, calculated based on the closing price of our common stock as reported by the NASDAQ Global Select Market on such date.
As of March 3, 2010, 26,915,917 shares of the common stock of the Registrant were outstanding.
DOCUMENTS INCORPORATED BY REFERENCE
Certain portions of the following documents are incorporated by reference into Part III of this Form 10-K: The Registrant’s Proxy Statement for the Annual Meeting of Shareholders.
Table of Contents
| PART I | ||||
| ITEM 1. |
3 | |||
| ITEM 1A. |
18 | |||
| ITEM 1B. |
36 | |||
| ITEM 2. |
36 | |||
| ITEM 3. |
37 | |||
| ITEM 4. |
39 | |||
| PART II | ||||
| ITEM 5. |
MARKET FOR REGISTRANT’S COMMON EQUITY, RELATED SHAREHOLDER MATTERS AND ISSUER PURCHASES OF EQUITY SECURITIES | 40 | ||
| ITEM 6. |
43 | |||
| ITEM 7. |
MANAGEMENT’S DISCUSSION AND ANALYSIS OF FINANCIAL CONDITION AND RESULTS OF OPERATIONS | 44 | ||
| ITEM 7A. |
QUANTITATIVE AND QUALITATIVE DISCLOSURES ABOUT MARKET RISK | 60 | ||
| ITEM 8. |
FINANCIAL STATEMENTS AND SUPPLEMENTARY DATA | 61 | ||
| ITEM 9. |
CHANGES IN AND DISAGREEMENTS WITH ACCOUNTANTS ON ACCOUNTING AND FINANCIAL DISCLOSURE | 61 | ||
| ITEM 9A. |
CONTROLS AND PROCEDURES | 61 | ||
| ITEM 9B. |
OTHER INFORMATION | 63 | ||
| PART III | ||||
| ITEM 10. |
DIRECTORS, EXECUTIVE OFFICERS AND CORPORATE GOVERNANCE | 63 | ||
| ITEM 11. |
EXECUTIVE COMPENSATION | 63 | ||
| ITEM 12. |
SECURITY OWNERSHIP OF CERTAIN BENEFICIAL OWNERS AND MANAGEMENT AND RELATED SHAREHOLDER MATTERS | 63 | ||
| ITEM 13. |
CERTAIN RELATIONSHIPS AND RELATED TRANSACTIONS AND DIRECTOR INDEPENDENCE | 64 | ||
| ITEM 14. |
PRINCIPAL ACCOUNTING FEES AND SERVICES | 64 | ||
| PART IV | ||||
| ITEM 15. |
64 | |||
| 67 | ||||
| 68 | ||||
Table of Contents
BJ’S RESTAURANTS, INC.
Unless the context otherwise requires, when we use the words “BJ’s,” “the Company,” “we,” “us” or “our” in this Form 10-K, we are referring to BJ’s Restaurants, Inc., a California corporation, and its subsidiaries, unless it is clear from the context or expressly stated that these references are only to BJ’s Restaurants, Inc.
Cautionary Factors That May Affect Future Results
(Cautionary Statements Under the Private Securities Litigation Reform Act of 1995)
This Form 10-K contains forward-looking statements and other information that are based on the current beliefs of our management as well as assumptions made by and information currently available to us. When we use the words “believe,” “plan,” “will likely result,” “expect,” “intend,” “will continue,” “is anticipated,” “estimate,” “project,” “may,” “could,” “would,” “should,” and similar expressions in this Form 10-K, as they relate to us or our management, we are intending to identify forward-looking statements. These statements reflect our current perspectives and outlook with respect to BJ’s future expansion plans, key business initiatives, expected operating conditions and other factors. Moreover, we operate in a very competitive and rapidly changing environment, and new risk factors emerge from time to time. It is not possible for us to predict the impact of all of these factors on our business, financial condition or results of operation or the extent to which any factor, or combination of factors, may cause actual results to differ materially from those contained in any forward-looking statements. Given the volatility of the operating environment and its associated risks and uncertainties, investors should not rely on forward-looking statements as any prediction or guarantee of actual results.
Forward-looking statements include, among others, statements concerning:
| • | our restaurant concept, its competitive advantages and our strategies for its continued evolution and expansion; |
| • | the rate and scope of our planned future restaurant development; |
| • | anticipated dates on which we will commence or complete development of new restaurants; |
| • | expectations as to the timing and success of the planned expansion of our contract brewing strategy; |
| • | expectations for consumer spending on casual dining restaurant occasions in general; |
| • | expectations as to the availability and costs of key commodities used in our restaurants and brewing operations; |
| • | expectations as to our menu price increases and their effect, if any, on our revenues and results of operations; |
| • | expectations as to the effectiveness of our planned operational, menu and marketing initiatives; |
| • | expectations as to our capital requirements and our line of credit availability; |
| • | expectations as to our future revenues, operating costs and expenses, and, |
| • | other statements of expectations, beliefs, future plans and strategies, anticipated developments and other matters that are not historical facts. |
1
Table of Contents
Some, but not all, significant factors that could prevent us from achieving our stated goals include:
| • | Continued deterioration in general economic conditions and consumer spending may adversely affect our revenues, operating results and liquidity. |
| • | If we do not successfully expand our restaurant operations, our growth rate and results of operations would be adversely affected. |
| • | Our ability to open new restaurants on schedule in accordance with our planned capacity growth rate may be adversely affected by delays or problems associated with securing suitable restaurant locations and leases and by other factors, some of which are beyond our control and the timing of which is difficult to forecast accurately. |
| • | Access to sources of capital and our ability to raise capital in the future may be limited, which could adversely affect our business and our expansion plans. |
| • | Continued deterioration in general economic conditions could have a material adverse impact on our landlords or on businesses neighboring our locations, which could adversely affect our revenues and results of operations. |
| • | Any failure of our existing or new restaurants to achieve expected results could have a negative impact on our consolidated sales and financial results, including a potential impairment of the long-lived assets of certain restaurants. |
| • | Our growth may strain our infrastructure and resources, which could slow our development of new restaurants and adversely affect our ability to manage our existing restaurants. |
| • | Our decision to either reduce or accelerate the pace of openings may positively or adversely affect our comparative financial performance. |
| • | Our future operating results may fluctuate significantly due to our relatively small number of existing restaurants and the expenses required to open new restaurants. |
| • | A significant number of our restaurants are concentrated in California and other Western states, which makes us particularly sensitive to economic, regulatory, weather and other risk factors and conditions that are more prevalent in those states. |
| • | Our operations are susceptible to changes in our food and supply costs, which could adversely affect our profitability. |
| • | Our increasing dependence on contract brewers could have an adverse effect on our operations if they cease to supply us with our proprietary beer. |
| • | Other government laws and regulations affecting the operation of our restaurants, particularly those that apply to the acquisition and maintenance of our brewing and retail liquor licenses, could increase our operating costs and restrict our growth. |
These cautionary statements are to be used as a reference in connection with any forward-looking statements. The factors, risks and uncertainties identified in these cautionary statements are in addition to those contained in any other cautionary statements, written or oral, which may be made or otherwise addressed in connection with a forward-looking statement or contained in any of our filings with the Securities and Exchange Commission. Because of these factors, risks and uncertainties, we caution against placing undue reliance on forward-looking statements.
2
Table of Contents
The risks described in this Form 10-K are not the only risks we face. New risks and uncertainties arise from time to time, and we cannot predict those events or how they may affect us. There may be other risks and uncertainties that are not currently known by us or that are currently deemed by us to be immaterial. However, they may ultimately manifest themselves and thereby have a material adverse affect on our business, financial condition and/or operating results. Although we believe that the assumptions underlying forward-looking statements are reasonable on the dates they are made, any of the assumptions could be incorrect, and there can be no guarantee or assurance that forward-looking statements will ultimately prove to be accurate. Forward-looking statements speak only as of the date on which they are made. We do not undertake any obligation to modify or revise any forward-looking statement to take into account or otherwise reflect subsequent events or circumstances arising after the date that the forward-looking statement was made. For further information regarding the risks and uncertainties that may affect our future results, please review the information set forth below under “ITEM 1A. RISK FACTORS.”
ASSUMPTIONS USED IN THIS FORM 10-K
Throughout this Form 10-K, our fiscal years ended December 29, 2009, December 30, 2008, January 1, 2008, January 2, 2007, and January 3, 2006, are referred to as fiscal years 2009, 2008, 2007, 2006, and 2005, respectively. Our fiscal year consists of 52 or 53 weeks. In fiscal 2005, we changed our year end to the Tuesday closest to December 31, from the Sunday closest to December 31. As such, fiscal 2005 included 52 weeks and two days. All other years were 52 weeks. All prior quarters consisted of 13 weeks except for the third quarter of fiscal 2005, which consisted of 13 weeks and two days.
GENERAL
As of March 3, 2010, BJ’s Restaurants, Inc. owned and operated 93 restaurants located in 13 states (California, Texas, Arizona, Colorado, Oregon, Nevada, Florida, Ohio, Oklahoma, Kentucky, Indiana, Louisiana and Washington). Our restaurants operate either as a BJ’s Restaurant & Brewery® which includes a brewery within the restaurant, a BJ’s Restaurant & Brewhouse® which receives the beer it sells from one of our breweries or an approved third-party craft brewer of our proprietary recipe beers (“contract brewer”), or a BJ’s Pizza & Grill® which is a smaller format, full service restaurant with a more limited menu than our other restaurants. Our menu features our BJ’s® award-winning, signature deep-dish pizza, our own handcrafted beers as well as a wide selection of appetizers, entrees, pastas, sandwiches, specialty salads and desserts including our unique Pizookie® dessert. Our BJ’s Restaurant & Brewery restaurants feature in-house brewing facilities where BJ’s proprietary handcrafted beers are produced for many of our restaurants. Currently, five of these restaurants have active brewing operations.
The first BJ’s restaurant was opened in 1978 in Orange County, California and centered on bringing the unique flavor of deep-dish pizza to California. The Company acquired the BJ’s restaurant concept in 1995 from its original founders. Our initial public offering of common stock occurred in 1996. Over the years we expanded the BJ’s concept from its beginnings as a small pizzeria to a full service, high energy casual dining restaurant with over 100 menu items, including appetizers, specialty salads, soups, pastas, sandwiches, entrees and desserts. In 1996, we introduced our own handcrafted beers through our first BJ’s Restaurant & Brewery in Brea, California. Since that time, we have opened additional BJ’s Restaurants & Breweries where our handcrafted beers are manufactured for sale in many of our restaurants. Since 2002, we have also been gradually expanding our use of qualified third-party craft brewers (“contract brewers”) to supply us with our proprietary beer. The differentiated, high-quality, handcrafted beers have added a unique dimension to the BJ’s concept which further distinguishes BJ’s from many other restaurant concepts and complements our signature pizza and many of our other menu items. Over the years, our proprietary beers have earned 26 medals at the Great American Beer Festival. Additionally, over the last few years we have been gradually expanding the number of our “guest “ draft beer taps in many of our restaurants to complement BJ’s high quality, proprietary beers and further facilitate the desired competitive positioning of BJ’s as a leading retailer of craft beer in the casual dining segment of the restaurant industry.
3
Table of Contents
BJ’s competes in the casual dining segment of the restaurant industry, which is a large, highly fragmented segment with estimated annual sales of approximately $80 billion during 2009. Over the last several years the casual dining segment of the restaurant industry has become a mature segment of the restaurant industry. According to some industry analysts and observers, the annual rate of sales growth for the segment has been gradually decreasing since 2004 as a result of increased competition from more innovative quick-service and “fast casual” restaurant concepts and other food-away-from-home retailers, a leveling off of certain favorable demographic trends (the number of two wage-earner households, etc.), and a perceived over-supply of casual dining restaurants compared to demand. We believe that, in addition to these factors, the segment has suffered from low levels of innovation and a general reduction in the overall quality and differentiation of many of the larger, more mature “mass market” casual dining chains that collectively operate several thousand “commoditized” restaurants. We believe that the BJ’s restaurant concept offers consumers a higher quality, more contemporary and approachable “casual-plus” dining experience with higher energy and relevance for about the same amount of money. Accordingly, our primary business objective is to continue our national expansion program and attempt to capture additional market share in the segment over time.
Our Internet address is http://www.bjsrestaurants.com. Electronic copies of our annual report on Form 10-K, quarterly reports on Form 10-Q and current reports on Form 8-K are available, free of charge, by visiting the “Investor Relations” section of http://www.bjsrestaurants.com. These reports are posted as soon as reasonably practicable after they are electronically filed with the Securities and Exchange Commission (“SEC”). We caution that the information on our website is not part of this or any other report we file with, or furnish to, the SEC.
THE BJ’s RESTAURANT CONCEPT AND MENU
Our primary growth objective is to gradually expand the BJ’s “casual-plus” restaurant concept nationwide during the next several years and to consistently deliver the BJ’s dining experience at the “BJ’s Gold Standard of Operational Excellence” (i.e., by providing a genuine commitment to passionately connect with every guest, on every visit, through flawless and relentless execution of every detail during every shift). We believe that by delivering upon this commitment to our guests, we should have the best opportunity to generate significant repeat business and capture additional market share. To achieve these objectives, we plan to focus primarily on the development of additional BJ’s Restaurant & Brewhouse format restaurants in new and existing markets in a carefully controlled manner. The term “casual plus” (or “premium casual” or “polished casual”) typically refers to a competitive positioning that has greater quality and differentiation compared to the more mature, “mass market” casual dining concepts with average guest checks of $12.00 to $16.00, but not necessarily as extensive as the “upscale casual” concepts that usually have average guest checks well in excess of $16.00.
Our signature menu offering is our deep-dish pizza, which has been highly acclaimed since it was originally developed in 1978. Approximately 16% of our total restaurant sales in 2009 consisted of deep-dish pizza. Our unique version of deep-dish pizza is unusually light, with a crispy, flavorful, bakery-type crust, which we believe has a broader appeal than many other versions of deep-dish pizza. Our pizza is topped with high-quality meats, fresh vegetables and a blend of five cheeses. In the past, BJ’s pizza has been awarded “best pizza” honors by restaurant critics and public opinion polls in Orange County, California, where the BJ’s concept originated.
In addition to our deep-dish pizza, we have a broad menu with approximately 100 items featuring appetizers, specialty salads, soups, pastas, sandwiches, entrees and desserts. Examples of our other menu offerings include Santa Fe Spring Rolls, BBQ Chicken Chopped Salad, Blackened New York Steak, Cajun Pasta, Halibut Fish Tacos, Balsamic Glazed Chicken and our famous BJ’s Pizookie ® dessert. All of our menu items are prepared to order using high-quality ingredients. This broad menu is an important factor in our differentiation from the other casual dining competitors. Our entrees generally range in price from $8.50 to $19.95. We also offer a daily lunch menu with lunch specials beginning at $5.95. We estimate that our average guest check in 2009 was approximately $12.20. Our extensive menu and moderate pricing allow BJ’s to appeal to a variety of guests and dining occasions, including everyday lunch and dinner, special occasions, and late night business. We believe these competitive attributes have been a significant factor in achieving a comparable restaurant sales decrease of
4
Table of Contents
only 0.8% for the fiscal year ended 2009 in light of the recessionary environment and the associated weakening in consumer demand for casual dining. Our comparable restaurant sales decreased 0.3% during fiscal 2008 and increased 6.2% during fiscal 2007.
Our large, flexible kitchens allow us to adapt to changing consumer tastes and trends. Generally, we evaluate our menu offerings and prices twice a year, and we may add, delete or modify certain menu offerings. All prospective menu offerings are initially evaluated by our internal menu development team and then tested in selected restaurants before any company-wide roll-out to our restaurant locations.
All of our restaurants feature our award-winning, handcrafted beers, which we believe not only differentiate us from many other restaurant concepts, but enhance our desire to provide quality and uniqueness to our guests in everything we do. Approximately 10% of our total restaurant sales in 2009 consisted of our proprietary handcrafted beers. Generally, we offer seven standard beers along with a rotating selection of seasonal handcrafted specialty beers. In many of our restaurants, we also offer up to thirty “guest” domestic and imported craft beers on our draft beer taps, as well as a wide selection of bottled Belgian beers. During 2009, approximately half of our proprietary beer was produced at our in-house breweries located in our BJ’s Restaurant & Brewery locations, and then distributed to our other locations in a “hub and spoke” fashion. The remainder was produced by other qualified, third-party craft brewers (“contract brewers”) using our proprietary recipes. During 2009, our in-house breweries produced approximately 24,000 barrels of beer, and contract brewers produced approximately 22,000 barrels of beer for distribution to our restaurants. A barrel of beer is approximately equivalent to two retail “kegs” of beer. Going forward, we intend to gradually shift the vast majority of our beer production to contract brewers. We also offer a selection of popular wines and spirits for sale in our restaurants. Alcoholic beverages, including our handcrafted beers, represented approximately 22% of our total restaurant sales in 2009.
RESTAURANT OPERATIONS
Based on internal and publicly available data, we believe that our larger-format brewery and brewhouse restaurants, on average, generate relatively high guest counts per square foot compared to many other casual dining concepts. Therefore, we have implemented operational systems and procedures, aided by certain automated tools, to support our desire to run our restaurants “quality fast,” particularly at peak dining periods, in order to effectively and efficiently process every guest transaction offered to us. In order to serve our relatively large number of guests, we carefully select, train and supervise our restaurant-level employees (“team members”). The typical management team for a BJ’s Restaurant & Brewery and BJ’s Restaurant & Brewhouse consists of a general manager, a kitchen or executive kitchen manager and four to five other managers depending on the sales volume for each restaurant. Additionally, each restaurant typically has an average of approximately 150 hourly team members, many of whom are paid at the statutory minimum wage level and work part-time. The general manager is responsible for the day-to-day operations of their restaurant, including hiring, training, and the development of personnel, as well as for sales and operating profit. The kitchen or executive kitchen manager is responsible for food quality, purchasing, inventories and kitchen labor costs.
The general manager of each restaurant reports to a director of operations or an area vice president, who generally supervises five to seven restaurants and who, in turn, reports to a regional vice president. Our regional vice presidents report to our Chief Restaurant Operations Officer who oversees all aspects of restaurant operations including kitchen operations, restaurant facility management, new restaurant openings and the roll-out of key operational initiatives. We currently have 11 directors of operations, four area vice presidents and two regional vice presidents. In addition, each regional vice president has two regional kitchen operations managers who help educate, coach and develop the kitchen personnel in their respective restaurants. We also have a Vice President of Kitchen Operations who maintains company-wide standards for food quality, food waste and yields, kitchen operations, sanitation, and who also supervises the execution of all menu changes in our restaurants. We prepare detailed weekly and monthly operating budgets or forecasts for each restaurant and compare our actual results to the budgets or forecasts. We also measure the productivity and efficiency of our restaurant operations
5
Table of Contents
using a variety of qualitative and quantitative statistical indicators such as kitchen ticket times, actual versus theoretical food waste, labor hours worked per 100 guests served, controllable operating costs incurred per guest served and other activity measures.
Excluding our BJ’s Pizza and Grill restaurants, our typical restaurant hours of operations are generally from 11:00 am to 12:00 am Sunday through Thursday and 11:00 am to 1:00 am Friday and Saturday. Several of our shopping-mall based restaurants open at 10:00 am Saturdays and Sundays. Our restaurants are typically open every day of the year except for Thanksgiving and Christmas. Most of our restaurants currently offer either in-house or third-party delivery service. Additionally, all restaurants offer on-line ordering for guest pick-up.
Our goal is to staff our restaurants with qualified, trained and enthusiastic team members who desire to be an integral part of BJ’s fun, casual atmosphere and, at the same time, have the passion, intensity, work ethic and ability to execute our concept correctly and consistently on every shift. Prior experience in the restaurant industry is only one of the qualities management looks for in our restaurant team members. Enthusiasm, motivation and the ability to interact well and connect with our guests, and correctly execute our concept, are the most important qualities for BJ’s management and staff.
In order to maintain our high standards, all new restaurant hourly staff members undergo formal training from certified trainers at each restaurant. Our certified trainers oversee the training by position for each new hourly employee and are also utilized to support our new restaurant openings. Our hourly staff goes through a series of in-depth interactive and automated training for their respective positions. New restaurant managers are required to successfully complete a comprehensive training program dedicated to all aspects of the operation of our restaurants including both restauranteuring and restaurant business-related topics. Our restaurant management training program is closely monitored by our regional trainers and our home office talent development professionals. We continuously review our training curriculum for our hourly team members, new managers and our existing restaurant managers. As a result of this review, beginning in 2009, we increased our 10-week management training program by one additional week. We also plan to introduce new continuing professional education programs for both our hourly and management team members. Approximately 175 new restaurant managers joined our Company during fiscal 2009, and we currently anticipate a requirement for approximately 190 additional managers during fiscal 2010.
Our future growth and success is highly dependent upon our ability to attract, develop and retain qualified restaurant management and hourly team members to correctly and consistently operate our restaurants. We attempt to accomplish this by providing our team members with opportunities for increased responsibilities and advancement as well as performance-driven incentives based on both financial and guest satisfaction metrics. We also support our employees by offering what we believe to be competitive wages and, for eligible team members, competitive fringe benefits (including a 401(k) plan with a company match, medical insurance and dining discounts). Additionally, since 2007, all of our general managers, executive kitchen managers, regional kitchen operations managers, directors of operations and certain brewery personnel are eligible to be selected to participate in our Gold Standard Stock Ownership Program under our 2005 Equity Incentive Plan. This program is intended to be a long-term wealth building program based on awards of restricted stock units of the Company and is dependent on the participant’s extended service with us in their respective positions and their achievement of certain agreed upon performance objectives during that service period (generally 5 years).
RESTAURANT SITE SELECTION AND EXPANSION OBJECTIVES
Our BJ’s Restaurant & Brewhouse format (which receives the beer it sells from one of our BJ’s Restaurant & Brewery locations or an approved contract brewer) is currently expected to represent the vast majority of our planned new restaurant growth for the foreseeable future. We may also open new BJ’s Restaurant & Brewery formats if operating an on-site brewery is the only legally permissible way to offer our handcrafted beer in certain highly-desirable locations. We may also consider opening smaller-format BJ’s Pizza and Grill formats as fill-in locations in certain densely-populated, urban trade areas, or in smaller cities, where a larger-format location could not be obtained or is not appropriate.
6
Table of Contents
We desire to obtain high-quality, high-profile locations for our “casual plus” restaurants, which we believe have the ability to draw guests from a much larger area than most “mass market” casual dining chain restaurants. The sizes of our restaurant trade areas vary from location to location, depending on a number of factors such as population density, retail traffic generators and geography. We believe the locations of our restaurants are critical to our long-term success. Accordingly, we devote significant time and resources to analyzing each prospective site. Since BJ’s has proven that it can be successful in a variety of locations (urban or suburban shopping malls, retail strip centers, lifestyle centers, and entertainment centers – either freestanding or in-line) and in a variety of income demographics, we can be highly selective and flexible in choosing suitable locations. In general, we currently prefer to open our restaurants at high-profile sites in mature trade areas with dense populations. It is not our current intention to open new restaurants in locations that compete for significant numbers of customers with our existing restaurants. However, as with most growing retail and restaurant chain operations, there can be no assurance that sales transfers or “cannibalization” among our locations will not inadvertently occur or become more significant in the future as we gradually increase our presence in existing markets to maximize our competitive position and financial performance in each market.
As a result of our successful restaurant openings in numerous markets over the last several years, we believe that the viability of the BJ’s restaurant concept has been successfully demonstrated in a variety of site layouts, trade areas and markets. Accordingly, we intend to continue developing BJ’s restaurants in high-quality, high-profile locations within mature, densely populated trade areas in both existing and new markets. There are a number of risk factors associated with opening new restaurants and entering new markets, including those identified under “Risk Factors” in Part I, Section 1A of this Annual Report on Form 10-K.
During fiscal 2009, we opened 10 new restaurants and thereby successfully achieved our goal to increase our total restaurant operating weeks by approximately 16% during the year. Due to the national economic slowdown and its associated impact on consumer discretionary spending in general, many new retail projects continue to be delayed or cancelled due to the inability of many developers to secure sufficient financing or obtain enough satisfactory retail and restaurant tenants for their projects. As a result, we plan to open as many as 10 to 11 new restaurants during 2010, and we have targeted an approximate 13% increase in total restaurant operating weeks for the year. Based on information currently available, we expect to open as many as two restaurants during the first quarter of 2010; two restaurants during the second quarter; four restaurants during the third quarter; and, as many as two to three restaurants during the fourth quarter. However, it is difficult for us to precisely predict the timing of our new restaurant openings due to many factors that are outside of our control, including those identified under “Risk Factors” in Part I, Section 1A of this Annual Report on Form 10-K.
We have signed leases or letters of intent for all of our 2010 potential restaurant openings. As of March 3, 2010, the following table sets forth information with respect to future restaurant locations that we expect to open in fiscal 2010 and beyond for which leases have been signed:
Future Restaurants with Signed Leases
Escondido, California
San Antonio, Texas
San Antonio, Texas
Tucson, Arizona
We are currently negotiating additional leases for potential future locations that could open during fiscal 2010 and 2011. From time to time, we will evaluate opportunities to acquire and convert other restaurant locations or entire restaurant chains to the BJ’s restaurant concept. However, we currently have no binding commitments (other than the signed leases set forth in the table above) or agreements to acquire or convert any other restaurant locations or chains to our concepts.
7
Table of Contents
We typically lease our locations for primary periods of 15 to 20 years. Our restaurants can either be freestanding or in-line, and we may utilize both ground leases and build-to-suit leases. Our rent structures vary from lease to lease, but generally provide for the payment of both minimum base rent and contingent (percentage) rent based on restaurant sales. We generally are also responsible for our proportionate share of common area maintenance (“CAM”), insurance, property tax and other occupancy-related expenses under our leases. We expend cash for leasehold improvements and furnishings, fixtures and equipment to build out our leased premises. We may also expend cash for permanent structural additions that we make to leased premises. We also expend cash for restaurant preopening costs. At times, we may have some of our costs to open a restaurant effectively reimbursed to us by our landlords in the form of tenant improvement allowance incentives pursuant to agreed-upon terms in our leases. If obtained, these allowances usually take the form of up-front cash, full or partial credits against minimum or percentage rents otherwise payable by us, or a combination thereof. However, there can be no assurance that such allowances will be available for every potential location that we seek to develop into a new restaurant. Generally, a landlord will charge us additional rent for any allowances provided to us in this regard. We may also purchase restaurant properties if they become available, but it is not our current strategy to own a large number of land parcels that underlie our restaurants.
TARGETED NEW RESTAURANT ECONOMICS
In selecting sites for our restaurants, an important objective is to earn a suitable rate of return on our investment. However, this return often cannot be meaningfully measured until our restaurants reach their mature run-rate levels of sales and profitability. Maturation periods vary from restaurant to restaurant, but generally range from two to four years. On average, we currently target a blended 25% to 30% return on our invested capital and a blended 20% to 25% return on total invested capital, which includes our invested capital and the landlord’s invested capital (based on a capitalized value of minimum rents to be paid to the landlord) for each group of new restaurants to be opened each year, measured once the restaurants reach their mature level of operations. Our targeted returns on invested capital in new restaurants may change in the future, depending upon competitive conditions in the casual dining segment, real estate market conditions, construction cost trends and other factors both within and outside of our control.
The aforementioned return-on-investment targets for our restaurant operations do not consider field supervision and corporate support expenses, exclude non-cash items such as depreciation expense, exclude income taxes, and do not represent a targeted return on an investment in our common stock. Additionally, the actual performance of any new restaurant location will usually differ from its originally targeted performance due to a variety of factors, many of which are outside of our control, and such differences may be material. There can be no assurance that any new restaurant opened will have similar operating results to those of established restaurants. See “Risk Factors” in Part I, Item 1A of this Annual Report on Form 10-K for a discussion of certain risks relating to the development and operation of our restaurants.
We generally target our new restaurants to achieve average annual sales at maturity of $4.5 million to $5.5 million, and we generally target an average “four wall” estimated operating cash flow margin in the range of 18% to 20% at maturity, after all occupancy expenses. Not all new restaurants are expected to achieve our average return-on-investment targets. Some may be targeted to achieve higher returns and some may be targeted to achieve lower returns, based on factors specific to each restaurant location. These factors include: the level of overall consumer and market awareness for our brand in the location’s general trade area; the specific occupancy structure and capital expenditure requirement for the location; the availability and amount of tenant improvement allowances; and, the expected operating cost structure in the trade area (minimum hourly wages, local cost of fresh commodities such as produce, etc.).
Our current BJ’s Restaurant and Brewhouse freestanding locations average approximately 8,500 productive square feet, and we generally target average annual sales per productive square foot to be in the range of $500 to $650. During 2009, our restaurants that were open for the entire year achieved sales greater than $600 per productive square foot on average. Our investment costs for new restaurants vary significantly depending on a
8
Table of Contents
number of factors including, but not limited to their absolute sizes, layouts (custom or prototype), type of construction labor (union or non-union), local permitting requirements, the scope of any required site work, the cost of liquor and other licenses and hook-up fees, geographical location and brand type (brewery compared to brewhouse). In general, our gross cash investment for site improvements, buildings, other leasehold improvements and furniture, fixtures and equipment (excluding any tenant improvement allowances we may receive from landlords) currently averages approximately $500 per square foot. We typically seek tenant improvement allowances in the range of $100 to $200 per square foot. However, not every location that we desire to develop into a restaurant will have such allowances available. During 2009, our average tenant improvement allowance was approximately $125 per square foot. However, due to current unfavorable conditions in the general economy and the credit markets that have impacted the financial positions and flexibility of many retail project developers, we currently expect that less tenant improvement allowances will be available for the foreseeable future.
It is common in the casual dining industry for many new locations to initially open with sales volumes well in excess of their sustainable run-rate levels. This initial “honeymoon” sales period usually results from the energy and excitement generated by restaurant openings in new lifestyle centers or retail projects that generate unusually high consumer traffic during grand openings. During the several months following the opening of new restaurants, consumer traffic and sales volumes will gradually adjust downward to their expected, more predictable and sustainable run-rate levels. In fact, it may take 12 to 24 months for a new restaurant’s sales to eventually settle in at a more predictable and sustainable run-rate level. Every restaurant has its own individual opening sales pattern, and this pattern is difficult to predict. For example, many BJ’s restaurant openings in our “home” state of California often experience “honeymoon” sales periods where sales may initially be 20% to 40% higher than their expected run-rate level. On the other hand, many BJ’s restaurant openings in other states, where the BJ’s concept is not that well known, can often experience a “reverse honeymoon” sales period, where initial sales may be 20% to 30% less than where we expect their run-rate level to ultimately settle. Additionally, all of our new restaurants usually require several months after opening, if not longer, to reach their targeted restaurant-level operating margin due to cost of sales and labor inefficiencies commonly associated with more complex casual dining restaurants. As a result, a significant number of restaurant openings in any single fiscal quarter, along with their associated opening expenses, could have a significant impact on our consolidated results of operations for that period. Therefore, our results of operations for any single fiscal quarter are not necessarily indicative of results expected for any other fiscal quarter nor for a full fiscal year.
RESTAURANT OPENING EXPENSES
Restaurant opening expenses (also referred to as “preopening” expenses) include incremental out-of-pocket costs that are directly related to the openings of new restaurants that may not be otherwise capitalized. As a result of the more complex operational nature of our “casual plus” restaurant concept compared to that of a typical casual dining chain restaurant, the preopening process for our new restaurants is more extensive, time consuming and costly. The preopening expense for one of our restaurants usually includes costs to compensate an average of six to seven restaurant management employees prior to opening; costs to recruit and train an average of 150 hourly restaurant employees; wages, travel and lodging costs for our opening training team and other support employees; costs for practice service activities; and, straight-line minimum base rent during the construction and in-restaurant training period in accordance with generally accepted accounting principles. Preopening expenses will vary from location to location depending on a number of factors, including the proximity of our existing restaurants; the amount of rent expensed during the construction and in-restaurant training periods; the size and physical layout of each location; the number of management and hourly employees required to operate each restaurant; the relative difficulty of the restaurant staffing process; the cost of travel and lodging for different metropolitan areas; the timing of the restaurant opening and the extent of unexpected delays, if any, in obtaining final licenses and permits to open the restaurants. The acquisition of our final licenses and permits may also be dependent on our landlords obtaining their licenses and permits, as well as completing their construction activities, for the developments where our leased premises are located.
9
Table of Contents
Our preopening expense for a prototypical BJ’s Restaurant & Brewhouse location averaged approximately $530,000 in 2009. Preopening expenses could be higher for non-prototypical, “custom footprint” restaurants and for those restaurants initial entry into new markets. We usually incur the most significant portion of direct preopening costs within the two-month period immediately preceding and the month of a restaurant’s opening. Preopening costs can fluctuate significantly from period to period, based on the number and timing of restaurant openings and the specific preopening costs incurred for each restaurant. We expense preopening costs as incurred.
BREWERY OPERATIONS
Sales of our proprietary recipe, handcrafted beers represented approximately 10% of our total restaurant sales during fiscal 2009. On average, each of our large-format restaurants utilizes approximately 550 barrels of our proprietary beer per year. Our internal brewery operations originated in 1996 with the opening of the first large-format BJ’s Restaurant & Brewery location in Brea, California, which included our first on-site brewery. The Brea BJ’s Restaurant & Brewery serviced not only that restaurant, but also several other California restaurants, using a “hub and spoke” production and distribution model that is legally permitted in California. Over the years we gradually increased the number of our on-site breweries, and starting in 2002 we also began developing relationships with qualified, third-party craft brewers (“contract brewers”) to produce our beer in Texas and other jurisdictions where the “hub and spoke” production model was not legally permitted. In 2009, our internal breweries produced approximately 24,000 barrels of beer, and contract brewers produced approximately 22,000 barrels of beer. Our on-site breweries are typically staffed with a head brewer and an assistant brewer, which report to a brewing director. Production planning and quality control are monitored by our corporate brewery operations department which is led by a Senior Vice President of Brewing Operations. Additionally, our on-site and contract breweries periodically send out samples of each batch of BJ’s beer to an independent laboratory for quality control testing purposes.
The continued growth of our restaurant locations has resulted in a commensurate increase in our requirement for our proprietary handcrafted beer. As a result of that growing requirement, and also in light of the constraints imposed by various state “tied-house” laws which regulate how alcoholic beverages are manufactured, distributed and marketed, we began to access the services of additional and larger-scale contract brewers with greater economies of scale and quality control capabilities beginning in 2008. We currently believe that larger-scale contract brewing under our indirect supervision represents the optimal production method for our handcrafted beers as we continue the expansion of our restaurants nationally. We also believe that the average production cost per barrel of beer can be gradually reduced over the longer term as a result of large-scale contract brewing. However, freight costs from our current contract brewing locations will likely absorb a large portion of those production cost savings for a period of time until we can further increase the number of restaurants we operate and therefore obtain increased leverage within our beer distribution network. Provided that these larger-scale contract brewing relationships prove to be satisfactory, we intend to continue to gradually expand our contract brewing capabilities during the next few years. As a result, we will concurrently and gradually rebalance our remaining internal beer production activities to focus on our specialty and seasonal beers. As part of this rebalancing effort, we may elect to decommission additional internal breweries, which may result in the disposal of brewery related assets. We will continue to evaluate the benefits of internal brewing versus contract brewing and consider factors such as availability of adequate production capacity, brewery quality control procedures, federal and state laws, consistency of corporate and brand strategy, and the operating and capital costs associated with contract brewing versus the costs of brewery ownership. We estimate our total proprietary beer requirement to be approximately 52,500 barrels for fiscal 2010, with as much as 60% to 65% of that requirement expected to be produced by contract brewers.
MARKETING AND ADVERTISING
We have historically relied on high profile locations, operational excellence, media interest and “word of mouth” to attract and retain restaurant guests instead of extensive use of media advertising or discounting. Accordingly, our marketing activities have historically been focused on community-based promotions and customer referrals.
10
Table of Contents
Our fundamental marketing philosophy has historically been to “spend our marketing dollars on the plate” or use resources that would typically be allocated to external marketing programs to provide better quality food, service and facilities to our guests. We believe this is the most effective method over the long run to protect and enhance our guest visit frequency. While we intend to maintain these historical philosophies to the maximum extent possible, we also recognize that we have to prudently respond from time to time to changes in the operating environment for consumer spending on casual dining occasions. Accordingly, due to the current difficult operating environment for consumer spending and casual dining occasions in general, we increased the amount of external print and internet-based media beginning in 2008 to maintain BJ’s top-of-mind awareness with consumers and to promote BJ’s new menu offerings and guest services. As such, our marketing related expenditures for 2008 and 2009 were approximately 1% of our revenues.
We intend to continue investing approximately 1% of our revenues in marketing related activities in 2010. However, due to the current operating conditions for casual dining restaurants, in general, we may decide to increase our marketing expenditures beyond our current expectations. In addition to our “top-of-mind awareness” advertising that utilizes print and internet-based media, we may also utilize special reduced-price offers for certain restaurants in certain trade areas, from time to time, to stimulate guest trial and frequency. We do not currently anticipate that such offers would be used extensively on a longer-term basis.
CHARITABLE ACTIVITIES
In 2006, the Company sponsored the formation of The BJ’s Restaurants Foundation (the “Foundation”), a 501(c)(3) qualified non-profit charitable organization that is principally dedicated to supporting charities that benefit children’s healthcare and education, with a primary focus on the Cystic Fibrosis Foundation (“CFF”). Three of our executive officers (Gerald Deitchle, Gregory Levin and Matthew Hood) currently serve on the Foundation’s seven-person board of directors. We also focus on the support of other local community and charitable causes, providing food and other resources for many worthwhile charitable events. Our commitment to supporting humanitarian causes is exemplified by our “Cookies for Kids” program, which supports CFF by donating a portion of our Pizookie® sales to CFF. In addition, we arrange for the collection and donation of other funds to CFF through our restaurant preopening training programs. As a collective result of these programs combined with programs administered by the Foundation, we donated $521,000, $567,000 and $620,000 to CFF for during fiscal 2009, 2008 and 2007, respectively.
The Foundation also recognizes and rewards the volunteer efforts of restaurant team members across the country as they help to give back to the communities in which our restaurants do business. In just its second year, the Foundation’s Team Action to Support Communities (“TASC Force”) program received the prestigious Restaurant Neighbor Award in the large business category for 2009 from the National Restaurant Association. The TASC Force teams have helped fulfill the wishes of special needs kids, placed flags in a national cemetery by the graves of fallen soldiers, painted over unsightly graffiti and helped clean up beaches, parks and school grounds. In addition, the TASC Force teams have hosted blood drives, worked with Special Olympics, painted houses for elderly citizens, supported Habitat for Humanity and re-built playgrounds. The TASC Force teams have also worked at food banks, participated in fundraising runs and walkathons and delivered food to families in need on Christmas morning.
INFORMATION SYSTEMS
We utilize an integrated information system to manage the flow of information within each restaurant and between the restaurants and our home office. These systems include a point-of-sale local area network, an automated kitchen display system (“KDS”), a web-based labor scheduling and productivity analyzer system, a theoretical food cost system and an automated front desk table management system. Our point-of-sale system is used to record sales transactions and send the menu orders to our kitchen. Additionally, the point-of-sale system is utilized to authorize, batch and transmit credit card transactions, to record employee time clock information and to produce a variety of management reports. Our KDS is integrated into our point-of-sale system and is an
11
Table of Contents
automated routing and cooking station balancing system installed in all of our restaurants which improves cooking station productivity, synchronizes order completion, provides valuable ticket time and cooking time data, and allows for more efficient levels of labor without sacrificing quality. Additionally, our web-based labor scheduler and productivity analyzer automates the labor scheduling for the managers and employees and produces a number of different productivity reports for our management team. Our theoretical food cost system allows us to better measure our product yields and waste in our kitchens, and our automated front desk table management system helps us to better optimize the overall seating efficiencies and “table turns” in our restaurants. Many of our systems provide information to our home office and our field supervision organization on a daily basis, which enables our senior management to monitor certain metrics of our business on a daily, weekly and monthly basis.
We believe it is extremely important to provide our operators with state of the art technology so that they can better serve our guests. As such, each year we develop a series of technology initiatives to help improve our productivity and better manage our restaurant operations. During 2009, we re-designed our KDS system to further streamline the expediting of orders and the delivery of food to our guests. We also began the development and testing of selected productivity-focused systems which we plan to implement company-wide in 2010. These productivity-focused systems will include an automated shift management “scoreboard” with real-time key performance indicators, an automated food prep system and a computerized recipe viewer to help reduce kitchen errors and waste.
SUPPLY CHAIN MANAGEMENT
Our supply chain department is responsible for the selection and procurement of all of our food ingredients, beverages, products and supplies for our restaurants and brewery operations. This department, in conjunction with our brewery operations department, also manages our contract brewing arrangements. We seek to obtain the highest quality ingredients, products and supplies from reliable, approved sources at competitive prices. We continually research and evaluate various food ingredients, products and supplies for consistency and quality and compare them to our detailed specifications. Ingredient specifications are mandated by the supply chain department in order to consistently maintain the highest quality ingredients and operational materials. In order to maximize operating efficiencies between purchase and usage, each restaurant’s executive kitchen manager determines daily usage requirements for food ingredients, products and supplies for his/her restaurant and places all orders with approved vendors. Our executive kitchen managers also inspect all deliveries daily to ensure that the items received meet our quality specifications and negotiated prices. For the majority of our menu ingredients, we have competitively priced high-quality alternative manufacturers, vendors, growers and distributors available in order to reduce risk in our supply chain.
Where economically feasible and possible, we attempt to negotiate short-term and long-term contracts depending on our expected requirements for the key commodities used in the preparation of our food and beverage offerings. Most of our contracts typically average in duration from three to twelve months. Generally, the majority of our more significant commodities (chicken, beef, and wheat based products) are contracted for various periods of time in order to stabilize our costs and to ensure availability.
Commencing in 2006, we entered into a three-year distribution agreement with a consortium of regional food distributors located throughout the United States. Jacmar Foodservice Distribution, an affiliate of one of our largest shareholders, is a member of our foodservice distributor consortium and is the primary distributor of food and operating supplies for our California and Nevada restaurants. See “Related Party Transactions.” We have a non-exclusive contract with this consortium on terms and conditions that we believe are consistent with those made available to similarly situated restaurant companies. In July 2009, after another extensive competitive bidding process, we re-entered into a new three-year agreement with the same national foodservice distribution system. Additionally, since 2006, we entered into an agreement with the largest nationwide foodservice distributor of fresh produce in the United States to service most of our restaurants and, where licensed, to distribute our proprietary beer to our restaurants.
12
Table of Contents
Over the last several years the overall cost environment for food commodities in general has become extremely volatile primarily due to domestic and worldwide agricultural, supply/demand and other macroeconomic factors that are outside of our control. Additionally, the availabilities and prices of food commodities are also influenced by increased energy prices, animal-related diseases, natural disasters, increased geo-political tensions, the relationship of the dollar to other currencies, consumer demand and other factors. Virtually all commodities purchased and used in the restaurant industry — meats, grains, oils, dairy products, and energy — have varying amounts of inherent price volatility associated with them. While we attempt to manage these factors by offering a diversified menu and by attempting to contract for our key commodities for extended periods of time whenever feasible and possible, there can be no assurance that we will be successful in this respect due to the many factors that are outside of our control.
COMPETITION
The restaurant industry is highly competitive and mature. There are a substantial number of casual dining chain restaurants and other food and beverage service operations that compete both directly and indirectly with us in every respect, including food quality and service, the price-value relationship, beer quality and selection, atmosphere, suitable sites for new restaurants and qualified personnel to operate our restaurants, among other factors. We also compete within each of our trade areas with national and regional restaurant chains and locally-owned restaurants. We also face growing competition as a result of the trend toward convergence in grocery, deli and restaurant services, particularly in the supermarket industry which offers “convenient meals” in the form of improved entrées and side dishes.
Our restaurant concept is a relatively small “grill and bar” or “varied menu” casual dining competitor, with over half of our restaurants currently located in one state — California. Our overall brand awareness and competitive presence in states outside of California is not as significant as that of our major casual dining chain competitors. Many competitors with similar concepts to ours have been in business longer than we have, have greater consumer awareness, and often have substantially greater capital, marketing and human resources. Accordingly, we must be prepared to constantly evolve and refine the critical elements of our restaurant concept over time to protect our longer-term competitiveness. Additionally, due to the continuing difficult operating environment for casual dining restaurants, coupled with increasing pressure on the discretionary spending behavior, we expect that our larger chain restaurant competitors will continue to allocate even more resources to their national media advertising and discounting programs in order to protect their respective market shares, which could have an adverse effect on our sales and results of operations.
Because the restaurant industry can be significantly affected by changes in consumer tastes, national, regional or local economic conditions, demographic trends, traffic patterns, weather, and the type and number of competing restaurants, any changes in these factors could adversely affect us. In addition, factors such as inflation and increased food, liquor, labor and other employee compensation costs could adversely affect us. We believe, however, that our ability to offer high-quality food at moderate prices with superior service in a distinctive dining environment provides us with the opportunity to capture additional market share in the casual dining segment.
FOOD QUALITY AND SAFETY
Our revenues can be substantially affected by adverse publicity resulting from food quality, illness, or health concerns stemming from incidents occurring at a single restaurant of ours as well as incidents that may occur at our competitors’ restaurants. In addition, our revenues can be affected by illness or health concerns stemming from incidents occurring at our suppliers or competing suppliers. While we believe that our internal policies and procedures for food safety and sanitation are thorough, the risk of food-borne illness cannot be completely eliminated, and incidents at other restaurant chains or in the food supply chain may affect our restaurants even if our restaurants are not implicated in a food safety concern. We attempt to manage risks of this nature, but the occurrence of any one of these factors in any one of our restaurants or elsewhere within the foodservice industry could cause our entire Company to be adversely affected.
13
Table of Contents
RELATED PARTY TRANSACTIONS
As of December 29, 2009, we believe that Jacmar Companies and their affiliates (collectively referred to herein as “Jacmar”) owned approximately 15.9% of our outstanding common stock. Jacmar, through its specialty wholesale food distributorship, is currently our largest supplier of food, beverage and paper products servicing our restaurants in California and Nevada, while other system distributors service our restaurants in all other states. Jacmar also owns the Shakey’s pizza parlor chain. We believe that Jacmar sells products to us at prices comparable to those offered by unrelated third parties based on our extensive competitive bidding process in July 2006 and July 2009. Jacmar supplied us with $51.0 million, $46.8 million and $42.9 million of food, beverage and paper products for fiscal 2009, 2008 and 2007, respectively, which represent 47.9%, 49.5% and 53.4% of our total costs for these products, respectively. We had trade payables due to Jacmar related to these products of $3.6 million and $2.5 million at December 29, 2009 and December 30, 2008, respectively.
GOVERNMENT REGULATIONS
We are subject to various federal, state and local laws, along with rules and regulations that affect our business. Each of our restaurants are subject to licensing and regulation by a number of governmental authorities, which may include alcoholic beverage control, building, land use, health, safety and fire agencies in the state or municipality in which the restaurant is located. Difficulties obtaining or maintaining the required licenses or approvals could delay or prevent the development of a new restaurant in a particular area or could adversely affect the operation of an existing restaurant. We believe, however, that we are in compliance in all material respects with all relevant laws, rules, and regulations. Furthermore, we have never experienced abnormal difficulties or delays in obtaining the licenses or approvals required to open a new restaurant or to continue the operation of an existing restaurant. Additionally, we are not aware of any environmental regulations that have had or that we believe will have a materially adverse effect upon our operations.
During fiscal 2009, approximately 22% of our restaurant sales were attributable to alcoholic beverages. Alcoholic beverage control regulations require each of our restaurants to apply to a federal and state authority and, in certain locations, municipal authorities for a license and permit to sell alcoholic beverages on the premises. Typically, licenses must be renewed annually and may be revoked or suspended for cause by such authority at any time. Alcoholic beverage control regulations relate to numerous aspects of the daily operations of our restaurants, including minimum age of patrons and employees, hours of operation, advertising, wholesale purchasing, inventory control and handling, and storage and dispensing of alcoholic beverages. We have not encountered any material problems relating to alcoholic beverage licenses or permits to date. The failure to receive or retain, or a delay in obtaining, a liquor license in a particular location could adversely affect our ability to obtain such a license elsewhere.
We are subject to “dram-shop” statutes in California and other states in which we operate. Those statutes generally provide a person who has been injured by an intoxicated person the right to recover damages from an establishment that has wrongfully served alcoholic beverages to such person. We carry liquor liability coverage as part of our existing comprehensive general liability insurance which we believe is consistent with coverage carried by other entities in the restaurant industry and would help protect us from possible claims. Even though we carry liquor liability insurance, a judgment against us under a dram-shop statute in excess of our liability coverage could have a materially adverse effect on us.
Various federal and state labor laws, along with rules and regulations, govern our relationship with our employees, including such matters as minimum wage, overtime, working conditions, safety and citizenship requirements. Significant additional governmental mandates such as an increased minimum wage, an increase in paid leaves of absence, extensions in health benefits or increased tax reporting and payment requirements for employees who receive gratuities, could negatively impact our restaurants. We are also subject to the regulations of the Bureau of Citizenship and Immigration Services (“BCIS”). In addition, some states in which we operate have adopted immigration employment protection laws. Even if we operate our restaurants in strict compliance
14
Table of Contents
with BCIS and state requirements, some of our employees may not meet federal citizenship or residency requirements, which could lead to a disruption in our work force. Various proposals that would require employers to provide health insurance for all of their employees are considered from time to time in Congress and various states and municipalities. The imposition of any requirement that we provide health insurance benefits to employees that are more extensive than the health insurance benefits we currently provide could have an adverse effect on our results of operations and financial position, as well as the restaurant industry in general. Our suppliers may also be affected by higher minimum wage and benefit standards, which could result in higher costs for goods and services supplied to us.
Our restaurants and breweries are subject to “tied house laws” and the “three tier system” of liquor distribution, both of which were introduced at the federal level after the repeal of Prohibition. These laws prohibit brewers from holding retail licenses and require separate licensing for manufacturers, distributors and retailers. Over the last 25 years, “brewpubs” have been legalized in most states through the loosening of these laws. However, brewpubs are generally licensed as retailers and do not have the same privileges as a microbrewery, and the restrictions imposed on brewpubs vary from state to state. These restrictions prevent us from operating both brewpubs and restaurants in some states. We believe that we are currently in compliance with the brewpub regulations in the states where we hold licenses. However, there is some risk that a state’s brewpub regulations or the interpretation of these regulations may change in a way that could impact our current model of manufacturing beer and/or supplying beer to our restaurants in that state. We apply for our liquor and brewing licenses with the advice of outside legal and licensing consultants. Even after the issuance of these licenses, our operations could be subject to differing interpretations of the “tied house laws” and the requirements of the “three tier system” of liquor distribution in any jurisdiction that we conduct business.
We are subject to federal and state environmental regulations. Various laws concerning the handling, storage, and disposal of hazardous materials, such as cleaning solvents, and the operation of restaurants in environmentally sensitive locations may impact aspects of our operations. During fiscal 2009, there were no material capital expenditures for environmental control facilities and no such expenditures are anticipated.
Our facilities must comply with the applicable requirements of the Americans With Disabilities Act of 1990 (“ADA”) and related state statutes. The ADA prohibits discrimination on the basis of disability with respect to public accommodations and employment. Under the ADA and related state laws, when constructing new restaurants or undertaking significant remodeling of existing restaurants, we must make them readily accessible to disabled persons. We must also make reasonable accommodations for the employment of disabled persons.
We have a significant number of hourly restaurant employees that receive income from gratuities. We have elected to voluntarily participate in a Tip Reporting Alternative Commitment (“TRAC”) agreement with the Internal Revenue Service. By complying with the educational and other requirements of the TRAC agreement, we reduce the likelihood of potential employer-only FICA assessments for unreported or under reported tips.
EMPLOYEES
At March 3, 2010, we employed approximately 11,000 employees at our 93 restaurants, which we refer to as team members. Most of our team members are part-time employees in our restaurant operations. We also employed approximately 130 team members at our home office and in our field supervision organization. We believe that we maintain favorable relations with our team members. Currently, no unions or collective bargaining arrangements are in place at our Company.
INSURANCE
We maintain workers’ compensation, general liability, property insurance and other insurance coverage with deductibles and limits that we believe are currently appropriate for our operations. However, we are self-insured for a portion of our employee workers’ compensation program and our general liability program. We maintain
15
Table of Contents
coverage with a third party insurer to limit our total exposure for these programs. There is no assurance that any insurance coverage maintained by us will be adequate or that we will not experience claims in excess of our coverage limits, or that we can continue to obtain and maintain such insurance at all or that our premium costs will not rise to an extent that they adversely affect our ability to economically obtain or maintain such insurance. While we also carry employment practices insurance, a settlement or judgment against us in excess of our coverage limitations could have a material adverse effect on our results of operations, liquidity, financial position or business. See the “Limitations in our insurance coverage or rising insurance costs could adversely affect our business or financial condition in certain circumstances” in “Risk Factors” contained in Part I, Item 1A of this Annual Report on Form 10-K.
TRADEMARKS AND COPYRIGHTS
Our domestically-registered trademarks and service marks include, among others, the word mark “BJ’s Chicago Pizzeria,” and our stylized logo, displaying the name “BJ’s.” In addition, among others, we have registered the word marks “BJ’s Restaurant & Brewery,” “BJ’s Restaurant & Brewhouse” and “BJ’s Pizza & Grill” for our restaurant services; “Harvest Hefeweizen,” “BJ’s Jeremiah Red,” “BJ’s P.M. Porter,” “Brewhouse Blonde,” “Dim Wit,” “Half Wit,” “Nit Wit,” “Owen’s IPA,” “Pooks,” “Piranha,” “Nutty Brewnette,” “Tatonka” and “Berry Burst Cider” for our proprietary beers; “Great White” for our proprietary pizza; “Together At Last!” for our proprietary appetizer; and, “Pizookie” for our proprietary dessert. We have registered all of these marks with the United States Patent and Trademark Office. Additional trademark applications are pending. We have also registered our ownership of the internet domain name “www.bjsrestaurants.com” and other internet domain names. We have applications to register several of our marks pending in a number of foreign countries. We believe that the trademarks, service marks and other proprietary rights have significant value and are important to our brand-building effort and the marketing of our restaurant concepts. However, there are other restaurants and retailers that use the name “BJ’s” in some form or fashion throughout the United States. We have in the past protected, and expect and intend to continue to vigorously protect, our proprietary rights. We cannot predict whether steps taken by us to protect our proprietary rights will be adequate to prevent misappropriation of these rights or the use by others of restaurant features based upon, or otherwise similar to, our concept. It may be difficult for us to prevent others from copying elements of our concept and any litigation to enforce our rights will likely be costly.
EXECUTIVE OFFICERS
The following table sets forth certain information concerning our executive officers and senior management employees as of March 3, 2010:
| Name |
Age | Position | ||
| Gerald W. Deitchle |
58 | Chairman, President and Chief Executive Officer | ||
| Gregory S. Levin |
42 | Executive Vice President, Chief Financial Officer and Secretary | ||
| Gregory S. Lynds |
48 | Executive Vice President and Chief Development Officer | ||
| Wayne L. Jones |
50 | Executive Vice President and Chief Restaurant Operations Officer | ||
| John D. Allegretto |
46 | Chief Supply Chain Officer | ||
| Matthew W. Hood |
40 | Chief Marketing Officer | ||
| Matthew J. Kimble |
58 | Chief Human Resources Officer | ||
| Alexander M. Puchner |
48 | Senior Vice President, Brewing Operations | ||
| Lon F. Ledwith |
52 | Senior Vice President, Operations Talent Development |
GERALD (“JERRY”) W. DEITCHLE has been President and Chief Executive Officer of the Company since February 2005 and a member of the Company’s Board of Directors since November 2004. In June 2008, Mr. Deitchle was unanimously elected by the Board of Directors to the additional post of Chairman of the Board. From April 2004 to January 2005, Mr. Deitchle served as President, Chief Operating Officer and a director of Fired Up, Inc., a privately held company that owns, operates and franchises the Johnny Carino’s Italian restaurant
16
Table of Contents
concept. From 1995 to 2004, he was a member of the executive management team at The Cheesecake Factory Incorporated, a publicly held operator of upscale casual dining restaurants with his last position as corporate President. From 1984 to 1995, he was employed by the parent company of Long John Silver’s restaurants, with his last position as Executive Vice President.
GREGORY S. LEVIN has been the Company’s Chief Financial Officer since September 2005 and was promoted to Executive Vice President in October 2007 and Secretary in June 2008. From February 2004 to August 2005, Mr. Levin served as Chief Financial Officer and Secretary of SB Restaurant Company, a privately held company that operates the Elephant Bar Restaurants. From 1996 to 2004, Mr. Levin was employed by publicly-held California Pizza Kitchen, Inc., operator and licensor of casual dining restaurants, with his last position as Vice President, Chief Financial Officer and Secretary. Earlier in his career, he served as an audit manager with Ernst & Young LLP.
GREGORY S. LYNDS has been the Company’s Chief Development Officer since July 2003 and was promoted to Executive Vice President in October 2007. Prior to joining the Company, Mr. Lynds served as a director of real estate for Darden Restaurants, Inc., the largest casual dining company in America. Prior to joining Darden, Mr. Lynds served as Vice President of Real Estate and Development for Wilshire Restaurant Group (Marie Callender’s and East Side Mario’s) and was a partner responsible for expanding the Mimi’s Café brand.
WAYNE L. JONES was appointed to the newly created position of Executive Vice President and Chief Restaurant Operations Officer of the Company effective January 19, 2009. Mr. Jones has over 25 years of casual dining restaurant management experience. Immediately prior to joining the Company, Mr. Jones was employed for 19 years at The Cheesecake Factory Incorporated, a publicly held operator of upscale casual dining restaurants. During his long tenure at The Cheesecake Factory, Mr. Jones served in progressively responsible restaurant management and leadership positions including restaurant general manager, area director and regional vice president, with his last position as Vice President, Operations Analysis on the corporate staff.
JOHN D. ALLEGRETTO has been the Chief Supply Chain Officer for the Company since July 2005. Prior to joining the Company, Mr. Allegretto served as Vice President of Supply Chain Management for Pick Up Stix Restaurants and Cal-International Foods, Inc. from March 2003 to June 2005. Prior to that, Mr. Allegretto was employed by The Walt Disney Company as a director in their Strategic Sourcing Group from October 1997 to February 2003.
MATTHEW W. HOOD was appointed to the newly created position of Chief Marketing Officer of the Company effective July 1, 2008, after serving as a part-time consultant to the Company since 2007. Prior to joining the Company, Mr. Hood served as a marketing and strategy consultant to the restaurant industry, and also served as the national restaurant brand consultant for Google, Inc. From 2002 to 2006, Mr. Hood was employed by Fired Up, Inc., owner and operator of the Carino’s Italian Grill casual dining concept, with his last position as Senior Vice President, Marketing and Brand Development. Prior to that, Mr. Hood served as a marketing manager for Brinker International, owner and operator of the Chili’s Grill and Bar and other casual dining concepts.
MATTHEW J. KIMBLE has been the Chief Human Resources Officer for the Company since May 2009. Prior to joining the Company, Mr. Kimble served as the Chief Human Resource Executive for Ready Pac, a market leader in the supply of fresh-cut produce throughout North America. From 1997 to 2008, Mr. Kimble was the Vice President of Human Resources for Mimi’s Café and Diedrich Coffee chains. From 1970 to 1997, Mr. Kimble worked for the Payless Drug Store chain in various operations and human resources assignments.
ALEXANDER M. PUCHNER has been the Senior Vice President of Brewing Operations for the Company since 1996. From 1993 to 1995, Mr. Puchner was a founder and brewmaster for Laguna Beach Brewing Co., Huntington Beach Beer Co., Newport Beach Brewing Co. and Westwood Brewing Co. From 1988 to 1993, Mr. Puchner served as a product manager for Aviva Sports/Mattel Inc. and as a marketing research manager for Mattel Inc. Mr. Puchner has been a nationally certified beer judge since 1990.
17
Table of Contents
LON F. LEDWITH has been the Senior Vice President of Operations Talent Development for the Company since January 2010. Prior to this responsibility within the Company, Mr. Ledwith served as the Company’s Senior Vice President of Restaurant Operations since April 2006 and as Vice President of Operations since February 2004. From July 1981 to November 2003, Mr. Ledwith was employed by Brinker International, Inc., owner, operator and franchisor of various restaurant brands (Chili’s, Macaroni Grill, Maggiano’s and On The Border), with his last position as a Regional Vice President of Chili’s Grill & Bar.
The risk factors presented below may affect our future operating results, financial position and cash flows. The risks described in this Item 1A and other sections of this Annual Report on Form 10-K are not exhaustive and are not the only risks we may ever face in our business. We operate in a very competitive and rapidly changing environment. New risks and uncertainties arise from time to time, and we cannot predict those events or how they may affect us. There may be other risks and uncertainties that are not currently known, or that are currently deemed by us to be immaterial. However, they may ultimately adversely affect our business, financial condition and/or operating results. In addition to the risk factors presented below, changes in general economic conditions and credit markets, consumer tastes and discretionary spending patterns, demographic trends and consumer confidence in the economy, all of which affect consumer behavior and spending for restaurant dining occasions in general, may have a material impact on us.
Continued weakness in general economic conditions may also continue to adversely affect consumer spending for restaurant occasions and, as a result, may adversely affect our revenues, operating results and liquidity.
Our country is currently experiencing weak general economic conditions that we believe will continue at least through 2010. The ongoing impacts of the housing crisis, high unemployment and financial market weakness may further exacerbate current economic conditions. As such, our restaurant guests may remain apprehensive about their job security, their personal asset values and the overall economy and further constrain their level of discretionary spending. A decrease in spending due to lower consumer discretionary income or consumer confidence in the economy could impact the frequency with which our guests choose to dine out or the amount they spend on meals while dining out, thereby decreasing our revenues and negatively affecting our operating results. In addition, if gasoline, natural gas, electricity and other energy costs increase, and credit card, home mortgage and other borrowing costs increase with any future increase in interest rates, additional pressure on consumer disposable income will likely occur. While the government has recently taken unprecedented steps to stimulate the economy and, at the same time, maintain relatively low interest rate levels, there can be no assurance that the government’s actions will be successful in restoring consumer confidence, further stabilizing the financial markets, further increasing liquidity and the availability of credit and result in lower unemployment or keep interest rates low in the future.
Fewer guest visits could result in lower sales for our restaurants and cause a de-leveraging of our operating profit margins. Moreover, our restaurants are primarily located near high activity areas such as regional malls, lifestyle centers, “big box” shopping centers and entertainment centers. We depend in large part on a high volume of visitors to these centers to attract guests to our restaurants. A decline in development or in visitors to these centers near our restaurants could negatively affect our sales. As a result, decreased cash flow generated from our established restaurants may adversely affect our ability to fund our expansion plans and therefore result in a deceleration of the number and timing of restaurant openings. We believe there is also a risk that if the current negative economic conditions persist for a long period of time and become more pervasive, consumers might make long-lasting changes to their discretionary spending behavior, including dining out less frequently on a more permanent basis.
Additionally, the above factors could impose practical limits on our menu price increases. From time to time, we may announce that we intend to take price increases on selected menu items in order to offset increased operating expenses. Although we have not experienced significant consumer resistance to our past price increases, in light of the current economic environment, we cannot provide assurance that any future menu price increases will not deter guests from visiting our restaurants, reduce the frequency of their visits or affect their purchasing decisions.
18
Table of Contents
If we do not successfully expand our restaurant operations, our growth rate and results of operations would be adversely affected.
A critical factor in our future success is our ability to expand our restaurant operations successfully, which will depend in large part on our ability to open new restaurants in a profitable manner. We anticipate that our new restaurants will generally take several months or even longer to reach targeted productivity levels due to the inefficiencies typically associated with new restaurants, including lack of initial market and consumer awareness, the need to hire and train sufficient management and restaurant personnel and other factors. The opening of new restaurants can also have an anticipated or unintended effect on sales levels at existing restaurants. We cannot assure you that any restaurant we open will obtain operating results similar to those of our existing restaurants. If we are unable to open and operate new restaurants successfully, our growth rate and our results of operations would be adversely affected. Our expansion plans could also be impacted by the delay or cancellation of potential new sites by developers and landlords, which may become more common during the next couple of years as a result of the current economic environment and tight credit markets.
We intend to open new restaurants in both established and new markets. Opening new restaurants in established markets generally provides some advantages in the form of stronger levels of initial consumer awareness, trial and usage, as well as greater leverage of certain supply chain and field supervision resources. On the other hand, there is a risk that some portion of the sales of existing restaurants in the market may transfer to newly opened restaurants in the market, resulting in lower comparable restaurant sales. While we do not generally select locations for our new restaurants where we believe that a significant sales transfer will likely occur, some unexpected sales transfer may inadvertently occur.
Some of our new restaurants are planned for new markets where we have little or nor operating experience. New markets may have different competitive conditions, consumer tastes and discretionary spending patterns than our existing markets. As a result, new restaurants in those markets may be less successful than restaurants in our existing markets. Consumers in a new market will typically not be familiar with the BJ’s brand. We also may find it more difficult to hire, motivate and retain qualified employees in new markets. Restaurants opened in new markets may also have lower average restaurant sales than restaurants opened in our existing markets, and may have higher construction, occupancy or operating costs than restaurants in existing markets. Sales at restaurants opened in new markets may take longer to achieve margins more typical of mature restaurants in existing markets or may never achieve these targeted margins thereby affecting our overall profitability. As we expand into new markets and geographic territories, our operating cost structures may not replicate our experience in existing markets. Because there will initially be fewer restaurants in a given market, our ability to optimally leverage our field supervision, marketing and supply chain resources will be limited for a period of time. Further, our overall new restaurant development and operating costs may increase due to more lengthy geographic distances between restaurants resulting in higher purchasing, preopening, labor, transportation and supervision costs. The performance of restaurants in new markets will often be less predictable. New restaurants may not have similar results as our existing restaurants and may not be as profitable.
As part of our ongoing restaurant expansion and growth strategy, we may consider the internal development or acquisition of additional restaurant concepts in the future. We may not be able to internally develop or acquire additional concepts that are as profitable as our existing restaurants. Additionally, growth through acquisitions will also involve additional financial and operational risks.
Our ability to open new restaurants on schedule in accordance with our projected growth rate may be adversely affected by delays or problems associated with securing suitable restaurant locations and leases and by other factors, some of which are beyond our control and the timing of which is difficult to forecast accurately.
In order to achieve our projected rate of new restaurant growth, we must identify suitable restaurant locations and successfully negotiate and finalize the terms of restaurant leases at a number of these locations. Due in part to the
19
Table of Contents
unique nature of each proposed restaurant location, we cannot predict the timing or ultimate success of our site selection process or these lease negotiations. Delays encountered in negotiating, or our inability to finalize to our satisfaction, the terms of a restaurant lease may delay our actual rate of new restaurant growth and cause a significant variance from our projected growth rate. In addition, our scheduled rate of new restaurant openings may be adversely affected by other factors, some of which are beyond our control, including the following:
| • | the availability and cost of suitable restaurant locations for development; |
| • | our ability to compete successfully for suitable restaurant locations; |
| • | the availability of adequate financing; |
| • | the timing of delivery of leased premises from our landlords so we can commence our build-out construction activities; |
| • | construction and development costs; |
| • | labor shortages or disputes experienced by our landlords or outside contractors, including their ability to manage union activities such as picketing or hand billing which could delay construction and which could create adverse publicity for our business and operations; |
| • | any unforeseen engineering or environmental problems with the leased premises; |
| • | our ability to hire, train and retain additional management and restaurant personnel; |
| • | our ability to secure governmental approvals and permits, including liquor licenses; |
| • | our ability to successfully promote our new restaurants and compete in the markets in which our new restaurants are located; |
| • | weather conditions or natural disasters; and, |
| • | general economic conditions. |
Access to sources of capital and our ability to raise capital in the future may be limited, which could adversely affect our business.
Our ability to continue to successfully grow our business depends, in part, on the availability of adequate capital to finance the development of additional new restaurants and other growth-related expenses. Changes in our operating plans, acceleration of our expansion plans, a decision to acquire another restaurant concept, lower than anticipated revenues, unanticipated and/or uncontrollable events in the capital or credit markets that impact our liquidity, lower than anticipated tenant improvement allowances offered by landlords, increased expenses or other events, including those described in this Annual Report on Form 10-K, may cause us to seek additional debt or equity financing on an accelerated basis in the event our cash flow from operations is insufficient. Financing may not be available on acceptable terms, or at all, and our failure to raise capital when needed could adversely affect our growth and other plans, as well as our financial condition. Additional equity financing, if available, may be dilutive to the holders of our common stock and adversely affect the price of our common stock. Debt financing, if available, may involve significant cash payment obligations, covenants and financial ratios that restrict our ability to operate and grow our business, and would cause us to incur additional interest expense and financing costs. In addition, continued disruptions in the global credit and equity markets, including unanticipated and/or uncontrollable events in the capital or credit markets, may have an adverse effect on our liquidity and our ability to raise additional capital if and when required.
20
Table of Contents
We may issue additional equity securities without the consent of shareholders and such issuances could adversely affect our stock price and the rights of existing shareholders.
We are not restricted from issuing additional common stock or preferred stock, including any securities that are convertible into or exchangeable for, or that represent the right to receive, common stock or preferred stock or any substantially similar securities. Our Board of Directors is authorized to issue additional shares of common stock and additional classes or series of preferred stock without any action on the part of the shareholders. The Board of Directors also has the discretion, without shareholder approval, to set the terms of any such classes or series of preferred stock that may be issued, including voting rights, dividend rights and preferences over the common stock with respect to dividends or upon the liquidation, or winding up of our business and other terms. If we issue preferred shares in the future that have a preference over our common stock with respect dividends or upon liquidation, dissolution or winding up, or if we issue preferred shares with voting rights that dilute the voting power of our common stock, the rights of our common shareholders or the market price of our common stock could be adversely affected.
Deterioration in general economic conditions could have a material adverse impact on our landlords or on businesses neighboring our locations, which could adversely affect our business.
Deterioration in general economic conditions could result in our landlords being unable to obtain financing or remain in good standing under their existing financing arrangements which could result in their failure to satisfy obligations to us under leases, including failures to fund or reimburse agreed-upon tenant improvement allowances. Any such failure could adversely impact our operations. In addition, our restaurants are generally located in retail developments with nationally recognized co-tenants, which help increase overall guest traffic into those retail developments. If these developments experience high vacancy rates, we could experience decreases in guest traffic. As a result, our results of operations could be adversely affected.
Any failure of our existing or new restaurants to achieve expected results could have a negative impact on our consolidated sales and financial results, including a potential impairment of the long-lived assets of certain restaurants.
As of March 3, 2010, 39 of our 93 restaurants were opened within the last three fiscal years, including one opened, thus far, in fiscal 2010. The results achieved by these newer restaurants may not be indicative of longer term performance or the potential market acceptance of restaurants in other locations. There can be no assurance that any new restaurant that we open will have similar operating results to those of prior restaurants. Our newer restaurants typically take several months, or even longer, to reach targeted levels of productivity due to inefficiencies typically associated with new restaurants. Accordingly, incremental sales from newly-opened restaurants generally do not make a significant contribution to our total operating profits in their initial months of operation. We make certain estimates and projections with regard to individual restaurant operations, as well as our overall performance in connection with our impairment analyses for long-lived assets in accordance with generally accepted accounting principles. An impairment charge is required when the carrying value of the asset exceeds the estimated fair value or undiscounted future cash flows of the asset. The projection of future cash flows used in this analysis requires the use of judgment and a number of estimates and projections of future operating results. If actual results differ from our estimates, charges for asset impairments may be required in the future. If impairment charges are significant, our results of operations could be adversely affected.
Our growth may strain our infrastructure and resources, which could slow our development of new restaurants and adversely affect our ability to manage our existing restaurants.
We plan to continue opening new restaurants and currently expect to open 10 to 11 new restaurants during 2010. We may also consider the internal development or acquisition of additional restaurant concepts in the future. Our continued expansion will increase demands on our management team, restaurant management systems and resources, financial controls and information systems. These increased demands may adversely affect our ability
21
Table of Contents
to open new restaurants and to manage our existing restaurants. If we fail to continue to improve our infrastructure or to manage other factors necessary for us to meet our expansion objectives, our growth rate and operating results could be adversely affected.
Our decision to reduce openings or accelerate the pace of openings may positively or adversely affect our comparative financial performance.
Our opening costs continue to be significant and the amount incurred in any one year or quarter is dependent on the number of restaurants expected to be opened during that time period. As such, our decision to either decrease or increase the rate of openings may have a significant impact on our financial performance for that period of time being measured. Therefore if we decide to reduce our openings, our comparable opening costs will be lower and the affect on our comparative financial performance will be favorable. Conversely, if the rate at which we develop and open new restaurants is increased to higher levels in the future, the resulting increase in opening costs will have an unfavorable short-term impact on our comparative financial performance.
Our recent trends in average restaurant sales or our trends in comparable restaurant sales may not be indicative of future trends or future operating results.
Our recent average restaurant sales and comparable restaurant sales trends may not be indicative of future trends or future operating results, particularly due to the economic downturn, the maturation of the casual dining segment in general and our expansion into new markets. Our ability to operate new restaurants profitably and increase average restaurant sales and comparable restaurant sales will depend on many factors, some of which are beyond our control, including:
| • | our ability to execute our business strategy effectively; |
| • | our ability to execute productively and efficiently within the “four walls” of each restaurant; |
| • | our menu pricing strategy; |
| • | initial sales performance by new restaurants; |
| • | the timing of new restaurant openings and related expenses; |
| • | changing demographics, consumer tastes or discretionary spending; |
| • | our ability to develop restaurants in geographic locations that do not compete with or otherwise adversely affect the sales of our existing restaurants; |
| • | overall brand awareness in new markets or existing markets where we may develop new restaurants; |
| • | levels of competition in one or more of our markets; and, |
| • | general economic conditions, credit markets and consumer confidence. |
Adverse changes in our average restaurant revenues and comparable restaurant sales could have an adverse affect on our common stock or increase the volatility of the price of our common stock.
Our menu development and marketing programs may not be successful.
We have increased our menu development and marketing expenditures during the past few years and expect to continue investing in certain menu, marketing and merchandising initiatives that are intended to attract and retain guests for our restaurants. Not all of such initiatives may prove to be successful and may thereby result in incremental expenses incurred without the benefit of higher revenues, or may result in other unfavorable economic consequences. Additionally, if our competitors were to increase their spending on menu development and marketing initiatives, or if our menu and marketing initiatives were to be less effective than those of our competitors, we could experience a material adverse effect on our results of operations.
22
Table of Contents
We have experienced significant increases in the costs for certain food, labor, energy and supply items in the past, and we may be unable to successfully and sufficiently raise menu prices to offset rising costs and expenses.
In the past, we have experienced dramatic increases in prices of certain commodities necessary for our restaurant and brewery operations, including increased costs for food, commodities, minimum wage, employee benefits, insurance arrangements, construction, energy and other costs. To manage this risk in part, we attempt to enter into fixed price purchase commitments, with terms typically up to one year, for many of our commodity requirements. However, it may not be possible for us to enter into as many fixed price contracts for the entire year for many of our food commodity requirements due to the recent volatility in the worldwide markets for such commodities. Additionally, we utilize menu price increases to help offset the increased cost of our commodities. However, there is no guarantee that our menu price increases will be accepted by our guests. If our costs do not stabilize, our results of operations will be adversely affected if we are unable to increase our menu prices to offset such increased costs.
Our future operating results may fluctuate significantly due to our relatively small number of existing restaurants and the expenses required to open new restaurants.
As of March 3, 2010, we operated 93 restaurants, 11 of which opened during the last 14 months. The capital resources required to develop each new restaurant are significant. We estimate that the gross cash outlay to open a new BJ’s restaurant on leased ground, excluding any tenant allowance for which we may or may not obtain depending on each new restaurant project, currently ranges from $4.0 million to $5.5 million, inclusive of preopening expenses (which average approximately $500,000 to $550,000, including preopening rent). Actual costs may vary significantly depending upon a variety of factors, including the site type, the square footage and layout of each restaurant, and conditions in the local real estate market. The combination of our relatively small number of existing restaurants, the significant investment associated with each new restaurant and the average restaurant revenues of our new restaurants may cause our results of operations to fluctuate significantly. Moreover, due to our relatively small base of existing restaurants, poor operating results at any one restaurant or a delay or cancellation in the planned opening of a restaurant could adversely affect our entire business, making the investment risks related to any one location much greater than those associated with many other larger, well-established restaurant chains.
Our inability to renew existing leases on favorable terms may adversely affect our results of operations.
As of March 3, 2010, 89 of our 93 restaurants are located on leased premises and are subject to varying lease-specific arrangements. For example, some of the leases require base rent, subject to regional cost-of-living increases, and other leases include base rent with specified periodic increases. Other leases are subject to renewal at fair market value, which could involve substantial increases. Additionally, many leases require contingent rent based on a percentage of gross sales. We currently have one restaurant lease that will expire during the next 12 months, and we are currently evaluating the desirability of renewing that lease. While we currently expect to pursue the renewal of substantially all of our expiring restaurant leases, no guarantee can be given that such leases will be renewed or, if renewed, that rents will not increase substantially.
The success of our restaurants depends in large part on their leased locations. As demographic and economic patterns change, current leased locations may or may not continue to be attractive or profitable. Possible declines in trade areas where our restaurants are located or adverse economic conditions in surrounding areas could result in reduced revenues in those locations. In addition, desirable leased locations for new restaurant openings or for the relocation of existing restaurants may not be available at an acceptable cost when we identify a particular opportunity for a new restaurant or relocation.
23
Table of Contents
Our operations could be adversely affected if our suppliers are not able to continue to do business with us or are forced to alter the terms on which they do business with us.
Some of our suppliers have been adversely impacted by tightening of the credit markets, decreased economic activity, fluctuations in commodity prices and other consequences of the continued economic downturn. Some suppliers have sought to change the terms on which they do business with us in order to lessen the impact of the economic downturn on their business. If we are forced to find alternative suppliers for key services, whether due to demands from the vendor or the vendor’s bankruptcy or ceasing operations, that could be a distraction to us and adversely impact our business. For example, the economic environment has forced some food suppliers to seek additional financing in order to stabilize their businesses, and some suppliers have ceased operations completely. Additional suppliers may encounter difficulties in sustaining their businesses. If any of our major suppliers or a large number of other suppliers suspend or cease operations, we may have difficulty keeping our restaurants fully supplied with the commodities and supplies that we require. If we were forced to suspend serving one or more of our menu items, that could have a significant adverse impact on our restaurant guest traffic and public perceptions of us, which would be harmful to our operations.
A significant number of our restaurants are concentrated in California and other Western states, which make us particularly sensitive to economic, regulatory, weather and other conditions in those states.
As of March 3, 2010, 49 of our 93 restaurants were located in the state of California. Additionally, another 15 of our restaurants were located in other Western states (i.e., Arizona, Nevada, Colorado, Oregon and Washington). In recent years, all of these states have been more negatively impacted by the housing downturn, unemployment levels and the overall economic slowdown than most other geographic areas. As a result, we have recently seen a more substantial decline in our aggregate guest traffic at our restaurants in these states. The State of California and many municipalities within the state are currently experiencing severe revenue shortfalls and ongoing budget crises. The ultimate resolution of these issues cannot be predicted at this time. If our restaurants in California are adversely affected by further changes in California’s economic or regulatory environment, such as changes to California’s minimum wage rates, income and other taxes, mandatory healthcare proposals, unemployment levels or housing environment, our consolidated sales, financial condition and results of operations may be further impacted. Additionally, we believe that California is subject to a greater risk for earthquakes, fires, water shortages, energy fluctuations and other natural and man-made disasters than most other states.
We are dependent upon consumer trends and upon high levels of consumer traffic at the sites where our restaurants are located, and any adverse change in such consumer trends or traffic levels could adversely affect our business, revenues and results of operations.
Due to the nature of the restaurant industry, we are dependent upon consumer trends with respect to the public’s tastes, eating habits, public perception toward alcohol consumption and discretionary spending priorities, all of which can shift rapidly. We also are dependent upon high consumer traffic rates at the sites surrounding our restaurants, which are primarily located in high-activity areas such as urban, retail, mixed-use and lifestyle centers, to attract guests to our restaurants. In general, such consumer trends and visit frequencies are significantly affected by many factors, including: national, regional or local economic conditions, changes in area demographics, public perception and attitudes, increases in regional competition, food, liquor and labor costs, traffic and shopping patterns, weather, natural disasters, interest rates, co-tenancies in these urban, retail and mixed-use and lifestyle centers and the availability and relative cost of gasoline. Our success will depend, in part, on our ability to anticipate and respond to such changing consumer preferences, tastes, eating and purchasing habits, as well as other factors affecting the restaurant industry, including new market entrants and demographic changes. Any adverse change in any of the above factors and our inability to respond to such changes could cause our restaurant volumes to decline and adversely affect our business, revenues and results of operations.
24
Table of Contents
Our success depends on our ability to compete effectively in the restaurant industry.
The restaurant industry is highly competitive. We compete on the basis of the taste, quality and price of food offered, guest service, brand name identification, beer quality and selection, attractiveness of the facilities, restaurant location, atmosphere and overall dining experience. Our competitors include a large and diverse group of restaurant chains and individual restaurants that range from independent local operators that have opened restaurants in various markets to well-capitalized national restaurant companies. In addition, we compete with other restaurants and with retail establishments for real estate. We also compete within each of our trade areas with national and regional restaurant chains and locally-owned restaurants. We also face growing competition as a result of the trend toward convergence in grocery, deli and restaurant services, particularly in the supermarket industry which offers “convenient meals” in the form of improved entrées and side dishes from the deli section. Many of our competitors have substantially greater financial, marketing and other resources than we do.
As a result of the currently weak economy, restaurant consumers are more highly focused on value. If other restaurants are able to promote and deliver a higher degree of perceived value through heavy discounting or other methods, our guest traffic levels may suffer which would adversely impact our revenues and profitability. In addition, with improving product offerings at “fast-casual” restaurants, quick-service restaurants and grocery stores, consumers may choose to trade down to these alternatives, which could also negatively affect our financial results.
We believe that we have built a favorable reputation for the quality and differentiation of our restaurant concept. We also believe that we must continue to re-invest in our core established restaurant operations to further protect and grow the overall consumer “value” of our concept so that it will continue to be relevant in the future. Any incident that erodes consumer trust in, or their attraction to, our concept could significantly reduce its value. If consumers perceive or experience any material reduction in food quality, service or ambiance, or in any way believe we materially failed to deliver a consistently positive dining experience, the consumer “value’ of our concept could suffer.
New information or attitudes regarding diet, health and the consumption of alcoholic beverages could result in changes in regulations and consumer consumption habits that could adversely affect our results of operations.
Regulations and consumer eating habits may change as a result of new information or attitudes regarding diet and health. Such changes may include regulations that impact the ingredients and nutritional content of the food and beverages offered by us. For example, several municipalities and states have approved restrictions on the use of trans-fats by restaurants. The success of our restaurant operations is dependent, in part, upon our ability to effectively respond to changes in any consumer health regulations and our ability to adapt our menu offerings to trends in food consumption. If consumer health regulations or consumer eating habits change significantly, we may be required to modify or delete certain menu items. To the extent we are unable to respond with appropriate changes to our menu offerings, it could materially affect customer demand and have an adverse impact on our results of operations.
Over the past several years alcoholic beverages have comprised approximately 20% or more of our restaurant sales. The gross profit margin on our sales of alcoholic beverages is generally higher than our gross profit margin on sales of food items. Additionally, approximately 10% of our sales over the last several years have consisted of our craft beers. The alcoholic beverage industry has become the subject of considerable societal and political attention in recent years due to increasing public concern over alcohol-related social problems, including drunk driving, underage drinking and health consequences from the misuse of alcohol, including alcoholism. As an outgrowth of these concerns, the possibility exists that advertising by beer producers could be restricted, that additional cautionary labeling or packaging requirements might be imposed, that further restrictions on the sale of alcohol might be imposed, or that there may be renewed efforts to impose increased excise or other taxes on beer sold in the United States. If beer consumption in general were to come into disfavor among domestic drinkers, or if the domestic beer industry were subjected to significant additional governmental regulations, our sales and profits could be adversely affected.
25
Table of Contents
Health concerns arising from outbreaks of flu viruses or other diseases, or regional or global health pandemics, could severely affect our business.
The United States and other countries have experienced, or may experience in the future, outbreaks of viruses, such as norovirus, Avian Flu or “SARS,” and H1N1 or “swine flu,” or other diseases such as bovine spongiform encephalopathy, commonly known as “mad cow disease.” To the extent that a virus or disease is food-borne, or perceived to be food-borne, future outbreaks may adversely affect the price and availability of certain food products and cause our guests to eat less of a product. For example, health concerns relating to the consumption of beef or to specific events such as the outbreak of “mad cow disease” may adversely impact sales of our beef-related menu items. In addition, public concern over “avian flu” may cause fear about the consumption of chicken, eggs and other products derived from poultry. The inability to serve beef or poultry-based products would restrict our ability to provide a variety of menu items to our guests. If we change our menu in response to such concerns, we may lose guests who do not prefer the new menu, and we may not be able to attract sufficiently new guests to produce the revenue needed to restore the profitability of our restaurant operations. We also may generate different or additional competitors for our intended guests as a result of such a menu change and may not be able to successfully compete against such competitors. If a virus is transmitted by human contact, our employees or guests could become infected, or could choose, or be advised, to avoid gathering in public places, any of which could adversely affect our restaurant guest traffic and our ability to adequately staff our restaurants, receive deliveries on a timely basis or perform functions at the corporate level. We also could be adversely affected if jurisdictions in which we have restaurants impose mandatory closures, seek voluntary closures or impose restrictions on operations. Even if such measures are not implemented and a virus or other disease does not spread significantly, the perceived risk of infection or significant health risk may adversely affect our business.
A health pandemic is a disease outbreak that spreads rapidly and widely by infection and affects many individuals in an area or population at the same time. We believe that our restaurants have one of the highest levels of guest traffic per square foot in the casual dining segment of the restaurant industry. Our restaurants are places where people can gather together for human connection. Customers might avoid public gathering places in the event of a health pandemic, and local, regional or national governments might limit or ban public gatherings to halt or delay the spread of disease. The impact of a health pandemic on us might be disproportionately greater than on other casual dining concepts that have lower guest traffic and that depend less on the gathering of people.
Negative publicity about us, our restaurants, other restaurants, others across the food supply chain, or the consumption of beef, seafood, poultry/produce, beer or alcoholic beverages, whether or not accurate, could adversely affect the reputation and popularity of our restaurants and our results of operations.
The good reputation of our restaurants is a key factor to the success of our business. Incidents that occur at any of our restaurants, or at restaurants operated by other foodservice providers or generally in the food supply chain, could be damaging to the restaurant industry overall, may specifically harm our brand and reputation and may quickly result in negative publicity for us, which could adversely affect our reputation and popularity with our guests. In addition, negative publicity resulting from poor food quality, illness, injury, food tampering or other health concerns, whether related to one of our restaurants, to the restaurant industry in general, or to the beef, seafood, poultry or produce industries in general (such as negative publicity concerning the accumulation of carcinogens in seafood, e-coli, hepatitis A, avian flu, salmonella, and other food-borne illnesses), or operating problems related to one or more of our restaurants, could adversely affect sales for all of our restaurants and make our brand and menu offerings less appealing to consumers. If our restaurant guests or employees become ill from food-borne illnesses, we could be forced to temporarily close the affected restaurants.
Our brewing operations are subject to certain hazards and liability risks faced by all brewers, such as potential contamination of ingredients or products by bacteria or other external agents that may be wrongfully or accidentally introduced into products or packaging. While we have not experienced any serious contamination problem in our products, the occurrence of such a problem could result in a costly product recall and serious damage to our reputation for product quality, as well as claims for product liability.
26
Table of Contents
Our operations are susceptible to changes in our food and supply costs, which could adversely affect our margins.
Our profitability depends, in part, on our ability to anticipate and react to changes in food and supply costs. Our supply chain department negotiates prices for all of our ingredients and supplies through either contracts (terms of one month up to one year, or even longer in some cases), spot market purchases or commodity pricing formulas. Furthermore, various factors beyond our control, including adverse weather conditions and governmental regulations, could also cause our food and supply costs to increase. We cannot predict whether we will be able to anticipate and react to changing food and supply costs by adjusting our purchasing practices. A failure to do so could adversely affect our operating results or cash flows from operations. We also have a single or a limited number of suppliers for certain of our commodity and supply items. Accordingly, supply chain risk could increase our costs and limit the availability of some products that are critical to our restaurant and brewing operations.
The overall cost environment for food commodities in general has and may continue to be volatile primarily due to domestic and worldwide agricultural, supply/demand and other macroeconomic factors that are outside of our control. Commodity prices for key agricultural commodities such as corn, wheat, and soybeans have been extremely volatile. The availabilities and prices of food commodities are also influenced by increased energy prices, animal-related diseases, natural disasters, increased geo-political tensions, the relationship of the dollar to other currencies, and other issues. Virtually all commodities purchased and used in the restaurant industry — meats, grains, oils, dairy products, and energy — have varying amounts of inherent price volatility associated with them. Our suppliers also may be affected by higher costs to produce and transport commodities used in our restaurants and breweries, higher minimum wage and benefit costs, and other expenses that they pass through to their customers, which could result in higher costs for goods and services supplied to us. While we attempt to manage these factors by offering a diversified menu and by contracting for our key commodities for extended periods of time whenever feasible and possible, there can be no assurance that we will be successful in this respect due to the many factors that are outside of our control.
Our restaurant-level operating margins are also affected by fluctuations in the availability and cost of utilities services, such as electricity and natural gas. Interruptions in the availability of gas, electric, water or other utilities, whether due to aging infrastructure, weather conditions, fire, animal damage, trees, digging accidents or other reasons largely out of our control, may adversely affect our operations. In addition, weather patterns in recent years have resulted in lower than normal levels of rainfall in certain areas that could produce droughts in key states such as California, thus impacting the price of water and the corresponding prices of commodities grown in states facing drought conditions. There is no assurance that we will be able to maintain our utility and commodity costs at levels that do not have a material adverse effect on our operations.
If our distributors or suppliers do not provide food and beverages to us in a timely fashion, we may experience short-term supply shortages, increased food and beverage costs and quality control problems.
We currently depend on national and regional food distribution service companies, as well as other food manufacturers and suppliers, to provide food and beverage products to all of our restaurants. We also rely on contract brewers to provide us with beer for many of our restaurants. The operations of our distributors, suppliers and contract brewers are subject to risks including labor disputes, financial liquidity, inclement weather, natural disasters, supply constraints, and general economic and political conditions that could limit their ability to timely provide us with acceptable products. If our distributors, suppliers and contract brewers cease doing business with us, or cannot make a scheduled delivery to us, or are unable to obtain credit in a tightened credit market or experience other issues, we could experience short-term product supply shortages in some or all of our restaurants and could be required to purchase food, beer and beverage products from alternate suppliers at higher prices. We may also be forced to temporarily remove popular items from the menu offering of our restaurants. If alternative suppliers cannot meet our current product specifications, the consistency and quality of our food and beverage offerings, and thus our reputation, guest patronage, revenues and results of operations, could be adversely affected.
27
Table of Contents
With respect to potential liability claims related to our food, beer and beverage products, we believe we have sufficient primary or excess umbrella liability insurance in place. However, this insurance may not continue to be available at a reasonable cost or, if available, may not be adequate to cover all claims. We generally seek contractual indemnification and insurance coverage from our key suppliers of food, beer and beverages, but this indemnification or insurance coverage is limited, as a practical matter, by the creditworthiness of the indemnifying party and the insured limits of any insurance provided by suppliers.
Pursuant to various laws and regulations, the majority of our proprietary beer must be distributed to our restaurants through independent wholesale beer distributors, whether we produce the beer or it is produced by contract brewers. Although we currently have arrangements with a sufficient number of beer distributors in all markets where we operate restaurants, our continued national expansion will require us to enter into agreements with additional beer distributors. No assurance can be given that we will be able to maintain or secure additional beer distributors on terms favorable to us. Changes in control or ownership of the participants in our current beer distribution network could lead to less willingness on the part of certain distributors to carry our proprietary beer. Our beer distribution agreements are generally terminable by the distributor on short notice. While these beer distribution agreements contain provisions regarding our enforcement and termination rights, some state laws prohibit us from readily exercising these contractual rights. Our ability to maintain our existing beer distribution agreements may be adversely affected by the fact that many of our distributors are reliant on one of the major beer producers for a large percentage of their revenue and, therefore, they may be influenced by such producers. If our existing beer distribution agreements are terminated, we may not be able to enter into new distribution agreements on substantially similar terms, which may result in an increase in the delivered cost of beer to our restaurants.
Failure to protect our trademarks, service marks, trade secrets or other intellectual property could adversely affect our business.
Our business prospects depend in part on our ability to develop favorable consumer recognition of our brands, including the BJ’s Restaurants name in particular. Although BJ’s is a federally registered trademark, there are other retailers and restaurants using the name “BJ’s” in some form or fashion throughout the United States, and our trademarks, service marks, trade dress, trade secrets or other intellectual property could be imitated or appropriated in ways that we cannot prevent. Alternatively, third parties may attempt to cause us to change our trademarks, service marks or trade dress or not operate in a certain geographic region or regions if our names are deemed confusingly similar to their prior trademarks, service marks or trade dress. We may also encounter claims from prior users of similar intellectual property in areas where we operate or intend to conduct operations. This could harm our image, brand or competitive position and cause us to incur significant penalties and costs. In addition, we rely on trade secrets, proprietary know-how, concepts and recipes. Our methods of protecting this information may not be adequate. Moreover, we may face claims of misappropriation or infringement of third parties’ rights that could interfere with our use of this information. Defending these claims may be costly and, if unsuccessful, may prevent us from continuing to use this proprietary information in the future and may result in a judgment or monetary damages. We do not maintain confidentiality and non-competition agreements with all of our employees or suppliers. Moreover, even with respect to the confidentiality and non-competition agreements we have, we cannot assure you that those agreements will not be breached, that they will provide meaningful protection or that adequate remedies will be available in the event of an unauthorized use or disclosure of our proprietary information. If competitors independently develop or otherwise obtain access to our trade secrets, proprietary know-how or recipes, the appeal of our restaurants could be reduced and our business could be harmed.
Federal, state and local beer, liquor and food service regulations may have a significant adverse impact on our operations.
We are required to operate in compliance with federal laws and regulations relating to alcoholic beverages administered by the Alcohol and Tobacco Tax and Trade Bureau of the U.S. Department of Treasury, as well as the laws and licensing requirements for alcoholic beverages of states and municipalities where our restaurants are
28
Table of Contents
or will be located. In addition, each restaurant must obtain a food service license from local authorities. Failure to comply with federal, state or local regulations could cause our licenses to be revoked and force us to cease the brewing or sale of alcoholic beverages, or both, at our restaurants or the serving of food. Additionally, state liquor laws may prevent or impede the expansion of our restaurants into certain markets. The liquor laws of certain states prevent us from selling at wholesale the beer brewed at our restaurants. Any difficulties, delays or failures in obtaining such licenses, permits or approvals could delay or prevent the opening of a restaurant in a particular area or increase the costs associated therewith. In addition, in certain states, including states where we have existing restaurants or where we plan to open a restaurant, the number of liquor licenses available is limited, and licenses are traded on the open market. Liquor, beer and wine sales comprise a significant portion of our revenues. If we are unable to maintain our existing licenses, our guest patronage, revenues and results of operations could be adversely affected. Or, if we choose to open a restaurant in those states where the number of licenses available is limited, the cost of a new license could be significant.
Brewery operations require various federal, state, and local licenses, permits and approvals. Our restaurants and on-site breweries operate pursuant to exceptions to the “tied house laws,” which created the “three tier system” of liquor distribution. These “tied house laws” were adopted by all of the states after the repeal of prohibition and, generally, prohibit brewers from holding retail licenses and prohibit vertical integration in ownership and control among the three tiers. Brewery restaurants and brewpubs operate under exceptions to these general prohibitions. Over the last 25 years, nearly all of the states have adopted laws and regulations permitting brewery restaurants and brewpubs; however, the privileges and restrictions for brewpubs and brewery restaurants vary from state to state. Generally, our brewery restaurants are licensed as retailers with limited privileges to brew beer on the restaurant premises, and we do not have the same privileges as a microbrewery. Other restrictions imposed by law may prevent us from operating both brewery restaurants and non-brewery restaurants in some states. We are at risk that a state’s regulations concerning brewery restaurants or the interpretation of these regulations may change. Because of the many and various state and federal licensing and permitting requirements, there is a risk that one or more regulatory agencies could determine that we have not complied with applicable licensing or permitting regulations or have not maintained the approvals necessary for us to conduct business within its jurisdiction. Any such change may adversely impact our current model of brewing beer or supplying beer, or both, to our restaurants in that state, and could also cause us to lose the licenses, permits and registrations necessary to conduct our restaurant operations. We apply for our liquor and brewing licenses with the advice of outside legal and licensing consultants. Even after the issuance of these licenses, our operations could be subject to differing interpretations of the “tied house laws” and the requirements of the “three tier system” of liquor distribution in any jurisdiction that we conduct business.
The manufacture and sale of alcoholic beverages is a highly regulated and taxed business. Our operations are subject to more restrictive regulations and increased taxation by federal, state, and local governmental entities than are those of non-alcohol related beverage businesses. Federal, state, and local laws and regulations govern the production and distribution of beer, including permitting, licensing, trade practices, labeling, advertising, marketing, distributor relationships, and related matters. Federal, state, and local governmental entities also levy various taxes, license fees, and other similar charges and may require bonds to ensure compliance with applicable laws and regulations. Failure to comply with applicable federal, state, or local laws and regulations could result in higher taxes, penalties, fees, and suspension or revocation of permits, licenses or approvals. There can be no assurance that other or more restrictive laws, regulations or higher taxes will not be enacted in the future.
Our increasing dependence on contract brewers could have an adverse effect on our operations if they cease to supply us with our proprietary beer.
Our proprietary handcrafted beer is a key factor in the success of our business. Each year, our brewery operations department forecasts our annual beer requirements based on our current restaurant requirements and expansion plans and determines our brewery production. Additionally, in certain states we are either legally required or choose to arrange for third party contractors (i.e., “contract brewers”) to brew our beer using our proprietary recipes. During 2010, we expect to utilize three to four contract brewers to produce as much as 60% to 65% of
29
Table of Contents
the proprietary beer requirements for our restaurants. The remainder will be produced by our in-house brewery operations. We intend to gradually increase the percentage of beer produced by contract brewers over time, based on demonstrated qualitative and economic advantages of doing so. However, there are risks associated with increasing our dependence on contract brewers. If our contract brewers cease doing business with us, or cannot make a scheduled delivery to us because of a supply chain or production disruption or other issues, or if we cannot otherwise satisfy our internal brewing requirements, we could experience short-term supply shortages in some or all of our restaurants which may result in a loss of revenue. Additionally, if these contract brewers cease doing business with us we could be required to purchase or brew our own beer at higher costs to us until we are able to secure an alternative supply source. If our contract brewers fail to adhere to our proprietary recipe and brewing specifications, the consistency and quality of beer offerings, and thus our reputation, guest patronage, revenues and results of operations, could be adversely affected.
From time to time, we or our contract brewers may also experience shortages of kegs necessary to distribute our draft beer. We distribute our draft beer in kegs that are owned by us as well as leased from third-party vendors. We are also responsible for providing kegs to the contract brewers that produce our proprietary beers.
Other government laws and regulations affecting the operation of our restaurants, particularly those that apply to the acquisition and maintenance of our brewing and retail liquor licenses, could increase our operating costs and restrict our growth.
Our development and construction of additional restaurants must comply with applicable zoning, land use and environmental regulations. More stringent and varied requirements of local government bodies with respect to zoning, land use and environmental factors could delay construction of new restaurants and add to their cost in the future. In addition, difficulties or failure in obtaining the required licenses and approvals could delay, or result in our decision to cancel, the opening of new restaurants.
In addition, various federal and state labor laws govern our relationship with our employees (“team members”) and affect our operating costs. These laws include minimum wage requirements, overtime pay, meal and rest breaks, unemployment tax rates, workers’ compensation rates, citizenship requirements and other employment taxes. In particular, we are subject to the regulations of the Bureau of Citizenship and Immigration Services, or BCIS. Changes to these aforementioned laws or other employment laws or regulations, could adversely affect our operating results and thus restrict our growth, including additional government-imposed increases in minimum wages, overtime pay, paid leaves of absence, mandated health benefits, increased tax reporting and tax payment requirements for team members who receive gratuities, a reduction in the number of states that allow tips to be credited toward minimum wage requirements and increased employee litigation, including claims relating to the Fair Labor Standards Act.
In addition, some states in which we operate have adopted immigration employment protection laws. Even if we operate our restaurants in strict compliance with BCIS and state requirements, some of our employees may not meet federal citizenship or residency requirements, which could lead to a disruption in our work force. Although we require all of our team members to provide us with the government-specified documentation evidencing their employment eligibility, some of our employees may, without our knowledge, be unauthorized workers. Unauthorized workers are subject to seizure and deportation and may subject us to fines, penalties or loss of our business license in certain jurisdictions.
Various proposals that would require employers to provide health insurance for all of their employees are considered from time to time in Congress and various states and municipalities. The imposition of any requirement that we provide health insurance benefits to employees that are more extensive than the health insurance benefits we currently provide could have an adverse effect on our results of operations and financial position, as well as the restaurant industry in general. Our suppliers may also be affected by higher minimum wage and benefit standards, which could result in higher costs for goods and services supplied to us.
30
Table of Contents
Potential changes in labor laws, including the possible passage of all or parts of the proposed Employee Free Choice Act (“EFCA”), could result in portions of our workforce being subjected to greater organized labor influence. The EFCA, also referred to as the “card check” bill, could impact the nature of labor relations in the United States, specifically, how union elections and contract negotiations are conducted. The EFCA aims to make it easier for unions to form, and employers of unionized employees may face mandatory, binding arbitration of labor scheduling, costs and standards, which could increase the costs of doing business. Although we do not currently have any union employees, EFCA or similar labor legislation could have an adverse effect on our business and financial results by imposing requirements that could potentially increase our costs, reduce our flexibility and impact our ability to service our guests.
Additionally, some states, counties and cities have enacted menu labeling laws and there is current discussion regarding a national menu labeling law. These laws require us to provide certain nutritional information to our guests. Non-compliance with these laws could result in the imposition of fines or the closure of restaurants. These menu labeling laws could also result in changing consumer preferences which may adversely affect our results of operations and financial position. We may not be able to adequately adapt our menu offerings to keep pace with developments in current consumer preferences related to nutrition, which may adversely impact our sales.
The Americans with Disabilities Act of 1990 prohibits discrimination on the basis of disability in public accommodations and employment. Although our restaurants are designed to be accessible to the disabled, we could be required to make modifications to our restaurants to provide service to, or make reasonable accommodations for, disabled persons. Non-compliance with this law and related laws enacted at the state or local level could result in the imposition of fines or an award of damages to private litigants.
The collective impact of current laws and regulations, the effect of future changes in laws or regulations that impose additional requirements and the consequences of litigation relating to current or future laws and regulations, or our inability to respond effectively to significant regulatory or public policy issues, could increase our compliance and other costs of doing business and therefore have an adverse effect on our results of operations. Failure to comply with the laws and regulatory requirements of federal, state and local authorities could result in, among other things, revocation of required licenses, administrative enforcement actions, fines and civil and criminal liability. Compliance with these laws and regulations can be costly and can increase our exposure to litigation or governmental investigations or proceedings.
Limitations in our insurance coverage or rising insurance costs could adversely affect our business or financial condition in certain circumstances.
We purchase comprehensive insurance coverage, including workers’ compensation, general liability, directors’ and officers’ liability, employment practices, fire and extended coverage and property insurance with coverage levels that we consider appropriate, based on the advice of our outside insurance and risk management advisors. However, such insurance is subject to limitations, including deductibles, exclusions and maximum liabilities covered. The cost of workers’ compensation insurance, general liability insurance and directors and officers’ liability insurance fluctuates based on market conditions and availability as well as our historical trends. Moreover, there are certain types of losses that may be uninsurable or not economically insurable. Such hazards may include earthquake, hurricane and flood losses and certain employee practices. If such a loss should occur, we would, to the extent that we were not covered for such loss by insurance, suffer a loss of the capital invested, as well as anticipated profits and cash flow from such damaged or destroyed properties. Punitive damage awards are generally not covered by insurance; thus, any awards of punitive damages as to which we may be liable could adversely affect our ability to continue to conduct our business, to expand our operations or to develop additional restaurants. There is no assurance that any insurance coverage we maintain will be adequate, that we can continue to obtain and maintain such insurance at all or that the premium costs will not rise to an extent that they adversely affect us or our ability to economically obtain or maintain such insurance.
31
Table of Contents
We self-insure a substantial portion of our workers’ compensation and general liability costs, and unfavorable changes in trends could have a negative impact on our profitability. The dollar amount of claims that we actually experience under our workers’ compensation and general liability insurance, for which we carry high per-claim deductibles, may also increase at any time, thereby further increasing our costs. Additionally, health insurance costs in general have risen significantly over the past few years and are expected to continue to increase. These increases, as well as potential federal and state legislation requirements for employers to provide health insurance to employees, could have a negative impact on our profitability if we are not able to offset the effect of such increases with plan modifications and cost control measures, or by continuing to improve our operating efficiencies.
Labor shortages or increases in labor costs could slow our growth or adversely affect our business.
The future success of our expansion plan, as well as our core established restaurant operations, largely depends in part on our ability to attract, motivate and retain a sufficient number of qualified management and other employees, including qualified and experienced restaurant managers and kitchen managers necessary to correctly and consistently execute in our restaurants. If we are unable to recruit and retain a sufficient number of qualified restaurant managers, our business and our growth could be adversely affected. Competition for qualified restaurant managers and other restaurant employees remain intense and could require us to pay higher wages and benefits, which would result in higher labor costs. Our ability to attract and retain qualified management and restaurant operating personnel may be harmed if we are unable to offer competitive cash and other compensation, including equity awards. If we continue to make equity award grants at similar levels as in the past, our 2005 Equity Incentive Plan only contains authorized shares sufficient to permit granting equity awards through the first quarter of fiscal 2011. Our ability to offer equity awards in the future may be limited or nonexistent if our shareholders do not approve future increases in the number of shares available for grant under our 2005 Equity Incentive Plan.
In addition, we have a substantial number of hourly employees who are paid the federal or state minimum wage and who rely on tips for a significant portion of their income. Government-mandated increases in minimum wages or decreases in tip credits would increase our labor costs. We may be unable to increase our prices in order to pass these increased labor costs on to our guests, in which case our profitability would be adversely affected.
Litigation could have a material adverse effect on our business.
Our business is subject to the risk of litigation by employees, consumers, suppliers, shareholders or others through private actions, class actions, administrative proceedings, regulatory actions or other litigation. The outcome of litigation, particularly class action lawsuits and regulatory actions, is difficult to assess or quantify. Plaintiffs in these types of lawsuits may seek recovery of very large or indeterminate amounts, and the magnitude of the potential loss relating to such lawsuits may remain unknown for substantial periods of time. Employment-related litigation continues to increase at both the state and federal levels, particularly with respect to claims styled as class action lawsuits which are more costly to defend. Also, some employment related claims in the area of wage and hour disputes are not insurable risks.
In addition, we are subject to state “dram shop” laws and regulations, which generally provide that a person injured by an intoxicated person may seek to recover damages from an establishment that wrongfully served alcoholic beverages to the intoxicated person. Recent litigation against restaurant chains has resulted in significant judgments, including punitive damages, under such “dram shop” statutes. While we carry liquor liability coverage as part of our existing comprehensive general liability insurance, we may still be subject to a judgment in excess of our insurance coverage, and we may not be able to obtain or continue to maintain such insurance coverage at reasonable costs, if at all. Regardless of whether any claims against us are valid or whether we are liable, we may be adversely affected by publicity resulting from such claims. We also are subject to claims and disputes from landlords under our leases, which could lead to litigation or a threatened or actual lease termination. Litigation of any nature may be expensive to defend and may divert money and management’s attention from our operations and adversely affect our financial condition and results of operations.
32
Table of Contents
The occurrence or threat of extraordinary events, including terrorist attacks, could cause consumer spending to decline, which would adversely affect our sales and results of operations.
The occurrence or threat of extraordinary events, including future terrorist attacks and military and governmental responses and the prospect of future wars, may result in negative changes to economic conditions likely resulting in decreased consumer spending. Additionally, decreases in consumer discretionary spending could impact the frequency with which our guests choose to dine out at restaurants or the amount they spend on meals while dining out at restaurants, thereby adversely affecting our sales and results of operations. A decrease in consumer discretionary spending could also adversely affect our ability to achieve the benefit of planned menu price increases to help preserve our operating margins.
Natural disasters could unfavorably affect our operations.
The occurrence of natural disasters, such as fires, hurricanes or earthquakes (particularly in California where our centralized operating systems and home office administrative personnel are located) could unfavorably affect our operations and financial performance. Such events could result in physical damage to one or more of our restaurants; the temporary or permanent closure of one or more of our restaurants or home office; the temporary lack of an adequate work force in an affected geographical trade area; the temporary or long-term disruption in the supply of food, beverages, beer and other products to our restaurants; the temporary disruption of electric, water, sewer and waste disposal services necessary for our restaurants to operate; and/or, the temporary reduction in the availability of certain products in our restaurants.
Future changes in financial accounting standards may cause adverse unexpected operating results and affect our reported results of operations.
A change in accounting standards can have a significant effect on our reported results and may affect our reporting of transactions before the change is effective. New pronouncements and varying interpretations of pronouncements have occurred and may occur in the future. Changes to existing accounting rules or the questioning of current accounting practices may adversely affect our reported financial results. Additionally, our assumptions, estimates and judgments related to complex accounting matters could significantly affect our financial results. Generally accepted accounting principles and related accounting pronouncements, implementation guidelines and interpretations with regard to a wide range of matters that are relevant to our business, including but not limited to, revenue recognition, fair value of investments, impairment of long-lived assets, leases and related economic transactions, self-insurance, income taxes, property and equipment, unclaimed property laws and litigation, and stock-based compensation are highly complex and involve many subjective assumptions, estimates and judgments by us. Changes in these rules or their interpretation or changes in underlying assumptions, estimates or judgments by us could significantly change our reported or expected financial performance.
The market price of our common stock could be subject to significant fluctuations.
Among the factors that could affect our stock price are:
| • | actual or anticipated variations in comparable restaurant sales or operating results, whether in our operations or in those of our competitors; |
| • | changes in financial estimates or opinions by research analysts, either with respect to us or other casual dining companies; |
| • | any failure to meet investor or analyst expectations, particularly with respect to total restaurant operating weeks, number of restaurant openings, comparable restaurant sales, average weekly sales per restaurant, total revenues, operating margins and net income per share; |
33
Table of Contents
| • | actual or anticipated changes in economic, political or market conditions, such as recessions or international currency fluctuations; |
| • | changes in the consumer spending environment; |
| • | changes in the market valuations of other restaurant companies; |
| • | announcements by us or our competitors of significant acquisitions, strategic partnerships, divestitures, joint ventures or other strategic initiatives; |
| • | a loss of a key member of management; and, |
| • | changes in the costs or availabilities of key inputs to our operations. |
In addition, we cannot assure you that an active trading market for our common stock will continue which could affect our stock price and the liquidity of any investment in our common stock.
The stock markets in general have experienced substantial volatility that has often been unrelated to the operating performance of individual companies. These broad market fluctuations may adversely affect the trading price of our common stock.
In the past, following periods of volatility in the market price of a company’s securities, shareholders have often instituted class action securities litigation against those companies. Such litigation, if instituted, could result in substantial costs and a diversion of management attention and resources, which would significantly harm our profitability and reputation.
Failure to establish, maintain and apply adequate internal control over our financial reporting could affect our reported results of operations.
We are subject to the ongoing internal control provisions of Section 404 of the Sarbanes-Oxley Act of 2002. These provisions provide for the identification of material weaknesses in internal control over financial reporting, which is a process to provide reasonable assurance regarding the reliability of financial reporting for external purposes in accordance with accounting principles generally accepted in the United States. Because of its inherent limitations, internal control over financial reporting is not intended to provide absolute assurance that a misstatement of our financial statements would be prevented or detected. Should we identify a material weakness in internal controls, there can be no assurance that we will be able to remediate any future material weaknesses that may be identified in a timely manner or maintain all of the controls necessary to remain in compliance. Any failure to maintain an effective system of internal controls over financial reporting could limit our ability to report our financial results accurately and timely or to detect and prevent fraud.
We are heavily dependent on information technology and any material failure of that technology could impair our ability to efficiently operate our business.
We rely heavily on electronic information systems in all aspects of our operations, including (but not limited to) point-of-sale transaction processing in our restaurants; efficient operation of our restaurant kitchens; management of our inventories and overall supply chain; collection of cash; payment of payroll and other obligations; and, various other processes and procedures. Our ability to efficiently manage our business depends significantly on the reliability and capacity of our in-house information systems and those technology services and systems that we contract for from third parties. Our electronic information systems, including our back-up systems, are subject to damage or interruption from power outages, computer and telecommunications failures, computer viruses, internal or external security breaches, catastrophic events such as fires, earthquakes, tornadoes and hurricanes, and/or errors by our employees. The failure of any of these systems to operate effectively, any problems with their maintenance, any issues with upgrades or transitions to replacement systems, or any breaches in data
34
Table of Contents
security could cause material interruptions to our operations. While we have invested and continue to invest in technology security initiatives and disaster recovery plans, these measures cannot fully insulate us from technology disruption that could result in adverse effects on operations and profits. Although we, with the help of third-party service providers and consultants, intend to maintain and upgrade our security technology and establish operational procedures to prevent such damage, breaches, or attacks, there can be no assurance that these security measures will be successful. In addition, advances in computer capabilities, new discoveries in the field of cryptography or other developments could result in a compromise or breach of the algorithms we and our third-party service providers use to encrypt and protect customer transaction data. A failure of such security measures could harm our reputation and financial results, as well as subject us to litigation or actions by regulatory authorities. Significant capital investments might be required to remediate any problems, infringements, misappropriations or other third party claims.
We outsource certain essential business processes to third-party vendors that subject us to risks, including disruptions in business and increased costs.
Some of our essential business processes that are dependent on technology are outsourced to third parties. Such processes include, but are not limited to, gift card tracking and authorization, on-line ordering, credit card authorization and processing, certain insurance claims processing, payroll processing, web site hosting and maintenance, data warehousing and business intelligence services, point-of-sale system maintenance, certain tax filings, telecommunications services, web-based labor scheduling and other key processes. We make a diligent effort to ensure that all providers of outsourced services are observing proper internal control practices, such as redundant processing facilities; however, there are no guarantees that failures will not occur. Failure of third parties to provide adequate services could have an adverse effect on our results of operations, financial condition or ability to accomplish our financial and management reporting.
We may incur costs resulting from security risks we face in connection with our electronic processing and transmission of confidential customer information.
We accept electronic payment cards from our guests for payment in our restaurants. During 2009, approximately 70% of our sales were attributable to credit/debit card transactions, and credit/debit card usage could continue to increase. A number of restaurant operators and retailers have experienced actual or potential security breaches in which credit and debit card information may have been stolen. While we have taken reasonable steps to prevent the occurrence of security breaches in this respect, we may, in the future, become subject to claims for purportedly fraudulent transactions arising out of the actual or alleged theft of credit or debit card information, and we may also be subject to lawsuits or other proceedings in the future relating to these types of incidents. Proceedings related to theft of credit or debit card information may be brought by payment card providers, banks and credit unions that issue cards, cardholders (either individually or as part of a class action lawsuit) and federal and state regulators. Any such proceedings could distract our management from running our business and cause us to incur significant unplanned losses and expenses. We also receive and maintain certain personal information about our guests and team members. The use of this information by us is regulated at the federal and state levels. If our security and information systems are compromised or our team members fail to comply with these laws and regulations and this information is obtained by unauthorized persons or used inappropriately, it could adversely affect our reputation, as well as results of operations, and could result in litigation against us or the imposition of penalties. Additionally, privacy and information security laws and regulations change over time, and compliance with those changes may result in cost increases due to necessary systems changes and the development of new administrative processes.
Our federal, state and local tax returns may, from time to time, be selected for audit by the taxing authorities, which may result in tax assessments or penalties that could have a material adverse impact on our results of operations and financial position.
We are subject to federal, state and local taxes. Significant judgment is required in determining the provision for income taxes. Although we believe our tax estimates are reasonable, if the IRS or other taxing authority disagrees
35
Table of Contents
with the positions we have taken on our tax returns, we could have additional tax liability, including interest and penalties. If material, payment of such additional amounts, upon final adjudication of any disputes, could have a material impact on our results of operations and financial position. The cost of complying with new tax rules, laws or regulations could be significant. Increases in federal or state statutory tax rates and other changes in tax laws, rules or regulations may increase our effective tax rate. Any increase in our effective tax rate could have a material impact on our financial results.
An increase in beer excise taxes could adversely affect our financial results.
The federal government and all of the states levy excise taxes on beer and hard cider. For brewers producing no more than 2.0 million barrels of malt beverages per calendar year, the federal excise tax is $7.00 per barrel on the first 60,000 barrels of malt beverages removed for consumption or sale during a calendar year, and $18.00 per barrel for each barrel in excess of 60,000. For brewers producing more than 2.0 million barrels of malt beverages for domestic consumption in a calendar year, the federal excise tax is $18.00 per barrel for all barrels produced. Our contract brewing arrangements generally call for all such excise taxes to be reimbursed by us. Most of our contract brewers produce more than 60,000 barrels of malt beverages annually. However, we believe the increased excise tax is more than offset by other production economies of scale. Our annual internal beer production volumes have not exceeded the 60,000 barrel threshold and are not expected to do so in the future. Individual states also impose excise taxes on alcoholic beverages in varying amounts, which have also been subject to change. In addition, if federal or state excise taxes are increased, we may need to increase our selling price for beer to maintain our present profit margins, which may or may not be accepted by our restaurants guests.
ITEM 1B. UNRESOLVED STAFF COMMENTS
None.
RESTAURANT LOCATIONS
As of March 3, 2010, we operated a total of 93 restaurants (consisting of seven BJ’s Pizza & Grill restaurants, 75 BJ’s Restaurant & Brewhouses and 11 BJ’s Restaurant & Breweries, of which four are currently actively producing our proprietary beer and one is producing our proprietary root beer) in 13 states, as follows:
| BJ’s Pizza & Grill |
BJ’s Restaurant & Brewhouse |
BJ’s Restaurant & Brewery |
Total | |||||
| Arizona |
– | 4 | 1 | 5 | ||||
| California |
6 | 37 | 6 | 49 | ||||
| Colorado |
– | 2 | 1 | 3 | ||||
| Florida |
– | 5 | – | 5 | ||||
| Indiana |
– | 1 | – | 1 | ||||
| Kentucky |
– | 1 | – | 1 | ||||
| Louisiana |
– | 1 | – | 1 | ||||
| Nevada |
– | 2 | 1 | 3 | ||||
| Ohio |
– | 2 | – | 2 | ||||
| Oklahoma |
– | 2 | – | 2 | ||||
| Oregon |
1 | – | 1 | 2 | ||||
| Texas |
– | 16 | 1 | 17 | ||||
| Washington |
– | 2 | – | 2 | ||||
| 7 | 75 | 11 | 93 | |||||
36
Table of Contents
The average square footage is as follows:
| BJ’s Pizza & Grill |
BJ’s Restaurant & Brewhouse |
BJ’s Restaurant & Brewery | ||||
| Arizona |
– | 8,025 | 8,800 | |||
| California |
2,757 | 8,341 | 10,788 | |||
| Colorado |
– | 8,150 | 5,500 | |||
| Florida |
– | 8,400 | – | |||
| Indiana |
– | 8,500 | – | |||
| Kentucky |
– | 9,000 | – | |||
| Louisiana |
– | 9,000 | – | |||
| Nevada |
– | 8,110 | 13,300 | |||
| Ohio |
– | 8,750 | – | |||
| Oklahoma |
– | 8,500 | – | |||
| Oregon |
4,350 | – | 7,930 | |||
| Texas |
– | 8,257 | 10,710 | |||
| Washington |
– | 9,500 | – | |||
| Total Weighted Average |
2,984 | 8,365 | 10,088 | |||
As of March 3, 2010, 89 of our 93 existing restaurants are located on leased properties. We own the underlying land for four of our existing restaurants. There can be no assurance that we will be able to renew expiring leases after the expiration of all remaining renewal options. Most of our restaurant leases provide for contingent rent based on a percentage of restaurant sales (to the extent this amount exceeds a minimum base rental) and payment of certain occupancy-related expenses. We own substantially all of the equipment, furnishings and trade fixtures in our restaurants. Our home office is located in leased premises in Huntington Beach, California. The office lease expires in 2012.
We are subject to a number of private lawsuits, administrative proceedings and claims that arise in the ordinary course of our business. These claims typically involve claims from guests, employees and others related to operational issues common to the foodservice industry. A number of these claims may exist at any given time. We believe that most of our guest claims will be covered by our general liability insurance, subject to certain deductibles and coverage limits. Punitive damages awards and employee unfair practice claims, however, are not covered by our general liability insurance. To date, we have not paid punitive damages with respect to any claims, but there can be no assurance that punitive damages will not be awarded with respect to any future claims, employee unfair practice claims or any other actions. We could be affected by adverse publicity resulting from allegations in lawsuits, claims and proceedings, regardless of whether these allegations are valid or whether we are ultimately determined to be liable. We currently believe that the final disposition of these types of lawsuits, proceedings and claims will not have a material adverse effect on our financial position, results of operations or liquidity. It is possible, however, that our future results of operations for a particular quarter or fiscal year could be impacted by changes in circumstances relating to lawsuits, proceedings or claims.
The following paragraphs describe certain legal actions recently settled or pending:
Labor Related Matters
On February 5, 2004, a former employee of ours, on behalf of herself, and allegedly other employees, filed a class action complaint in Los Angeles County, California, Superior Court, and on March 16, 2004, filed an amended complaint, alleging causes of action for: (1) failure to pay reporting time minimum pay; (2) failure to allow meal breaks; (3) failure to allow rest breaks; (4) waiting time penalties; (5) civil penalties; (6) reimbursement for fraud and deceit; (7) punitive damages for fraud and deceit; and, (8) disgorgement of illicit
37
Table of Contents
profits. On June 28, 2004, the plaintiff stipulated to dismiss her second, third, fourth and fifth causes of action. During September 2004, the plaintiff stipulated to binding arbitration of the action. On March 2, 2008, and on March 19, 2008, one of Plaintiff’s attorneys filed a notice with the California Labor and Workforce Development Agency, alleging failure to keep adequate pay records and to pay Plaintiff minimum wage. To our knowledge, the Agency has not responded to either of these notices. In November 2008, the parties agreed to settle this matter subject to approval from the arbitrator and/or the court. The terms of this proposed settlement are not considered by us to be material to our consolidated financial position.
On February 16, 2006, a former employee filed a lawsuit in Orange County, California, Superior Court on behalf of herself and allegedly other employees, for alleged failure to provide rest periods and meal periods and violation of California Business and Professions Code. We have answered the complaint, denying the allegations and raising various additional defenses. The parties met for mediation on a non-binding basis. In May 2008, the parties agreed to settle this matter subject to final approval from the court. The court has given final approval of the settlement. The terms of this proposed settlement are not considered by us to be material to our consolidated financial position.
On April 6, 2009, an employee filed a class action complaint in Orange County, California, Superior Court on behalf of himself and allegedly other employees. The complaint alleges causes of action for failure to pay plaintiff and other alleged class members regular wages and overtime pay, failure to maintain the designated wage scale and secret payment of lower wages, the greater of actual damages or penalties for failure to provide accurate wage statements, and restitution of wages and injunction for violation of California Business and Professions Code. The complaint also seeks interest, attorneys’ fees and costs. In February 2010, the parties agreed in principle to settle this case, subject to approval of the court. The terms of this proposed settlement are not considered by us to be material to our consolidated financial position.
On February 4, 2009, an employee, on behalf of himself and allegedly other employees filed a class action complaint in Fresno County, California, Superior Court, which complaint was served on us in the second quarter of 2009. The complaint alleges causes of action for failure to pay wages for on-call time, for violation of California Business and Professional Code and for penalties for unpaid wages. The complaint also seeks a constructive trust on money found unlawfully acquired, an injunction against failure to pay wages, restitution, interest, attorney’s fees and costs. On August 14, 2009, a first amended complaint was filed, in which two other employees joined the action as plaintiffs. The parties have begun discovery, we have filed an answer to the amended complaint, and we intend to vigorously defend our position in this action.
On July 16, 2009, Robert Cho, an individual, on behalf of himself and allegedly other recipients or holders in California of our gift cards, filed a class action complaint in Los Angeles County, California, Superior Court, alleging causes of action for unlawful and deceptive trade practices and violation of the Consumer Legal Remedies Act, for failing to redeem or replace a gift card and deducting a dormancy fee, for violation of California Business and Professions Code and for declaratory relief. The complaint seeks restitution, an injunction against the alleged unfair practices, and attorneys’ fees. Discovery has begun. In November 2009, the plaintiff filed an amended complaint for the causes of action alleged in the original complaint but without the allegation of violation of California Business and Professions Code. We answered the amended complaint, denying the allegations and raising affirmative defenses. We intend to vigorously defend our position in this action.
On August 25, 2009, a former employee of ours filed a lawsuit in Los Angeles County, California, Superior Court, on behalf of himself and allegedly other employees, namely our California restaurant assistant managers, kitchen managers and managers. The complaint alleges our California restaurant assistant managers are not exempt for compensation purposes and alleges causes of action for failure to pay overtime wages, failure to provide meal breaks and rest periods, failure to pay wages timely, penalties for unpaid wages, failure to provide accurate wage statements, failure to keep accurate payroll records and for violation of California Business and Professions Code. The complaint also seeks unspecified damages, restitution, an injunction against unfair
38
Table of Contents
practices, interest, attorneys’ fees and costs. In October 2009, plaintiff filed an amended complaint, alleging the class to be all California assistant kitchen managers, kitchen managers, and managers and adding to plaintiff’s claims for penalties alleged to be due under the California Labor Code Private Attorneys General Act. On October 8, 2009, plaintiff’s attorneys filed a notice with the California Labor and Workforce Development Agency, alleging failure by us to pay overtime wages, failure to provide meal breaks and rest periods, failure to pay wages due on plaintiff’s and other employees’ termination, failure to pay wages timely, failure to provide accurate wage statements and failure to keep accurate payroll records. On December 8, 2009, the Agency responded that it does not intend to investigate the allegations. In January 2010, the plaintiff filed a motion seeking permission to file a second amended complaint; however, as of March 3, 2010, this motion has not been heard. In January 2010, on our motion, the Court ordered the venue of the case moved to Orange County. We have not yet responded to the amended complaint but intend to vigorously defend our position in this action.
Other Matters
On June 12, 2008, we filed an arbitration claim with the Financial Industry Regulatory Authority (FINRA) against Citigroup Global Investments, Inc. (“Citigroup”) asserting claims for breach of contract, breach of the implied covenant of good faith and fair dealing, fraud, breach of fiduciary duty, a failure to act to the highest standards of good faith and commercial honor, violations of Federal and California securities laws, failure to properly train financial advisers, violation of settlement agreements with regulatory authorities, conspiracy, and violation of its duty to us concerning selection of proper securities arising out of our auction rate securities investments. On December 9, 2009, we reached a confidential settlement agreement with Citigroup for the full liquidation of our auction rate securities (ARS) investment portfolio. Under the terms of the settlement, we received approximately $27.4 million in cash (including accrued interest) in exchange for our entire remaining ARS investment portfolio. In addition, the settlement provides us with the potential for additional recoveries, depending upon the performance of the ARS market during the next three years.
39
Table of Contents
ITEM 5. MARKET FOR REGISTRANT’S COMMON EQUITY, RELATED SHAREHOLDER MATTERS AND ISSUER PURCHASES OF EQUITY SECURITIES
Market Information
Our common stock (symbol BJRI) trades on the NASDAQ Global Select Market. All stock prices are closing prices per the NASDAQ Global Select Market. On March 3, 2010, the closing price of our Common Stock was $22.10 per share. The table below shows our high and low common stock closing prices as reported by the NASDAQ Global Select Market.
| Common Stock | ||||||
| High | Low | |||||
| Fiscal year ended December 29, 2009 |
||||||
| First Quarter |
$ | 15.12 | $ | 9.10 | ||
| Second Quarter |
$ | 17.89 | $ | 13.23 | ||
| Third Quarter |
$ | 17.57 | $ | 14.66 | ||
| Fourth Quarter |
$ | 19.03 | $ | 14.30 | ||
| Fiscal year ended December 30, 2008 |
||||||
| First Quarter |
$ | 17.26 | $ | 11.86 | ||
| Second Quarter |
$ | 15.86 | $ | 9.70 | ||
| Third Quarter |
$ | 13.89 | $ | 8.48 | ||
| Fourth Quarter |
$ | 12.52 | $ | 6.79 | ||
As of March 3, 2010, we had approximately 115 shareholders of record and we estimate that there were approximately 6,000 beneficial shareholders.
40
Table of Contents
Stock Performance Graph
The following chart compares the 5-year cumulative total stock performance of our common stock, the S&P 500 Index and a peer group consisting of: Brinker International, Inc., Buffalo Wild Wings, Inc., California Pizza Kitchen, Inc., The Cheesecake Factory Incorporated, Darden Restaurants, Inc., Famous Dave’s of America, Inc., Kona Grill, Inc., O’Charley’s, Inc., PF Chang’s China Bistro, Red Robin Gourmet Burgers, Inc., Ruby Tuesday, Inc. (GA), and Texas Roadhouse, Inc. (Class A). These peer group companies all compete in the “casual dining” segment of the restaurant industry. The graph assumes that $100 was invested at inception in our common stock and in each of the indices that all dividends were reinvested. The measurement points utilized in the graph consist of the last trading day in each calendar year, which closely approximates the last day of our respective fiscal year. The historical stock performance presented below is not intended to and may not be indicative of future stock performance.
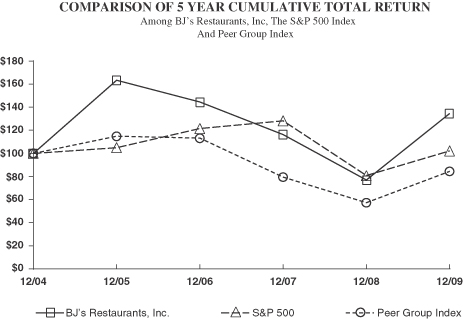
41
Table of Contents
Stock-Based Compensation Plan Information
We have two stock-based compensation plans — the 2005 Equity Incentive Plan and the 1996 Stock Option Plan — under which we may issue shares of our common stock to employees, officers, directors and consultants. Upon effectiveness of the 2005 Equity Incentive Plan, the 1996 Stock Option Plan was closed for purposes of new grants and the remaining available shares for grant, including those shares related to option awards forfeited or terminated without exercise under the 1996 Stock Option Plan accrue to the 2005 Equity Incentive Plan. Both of these plans have been approved by our shareholders. Under the 2005 Equity Incentive Plan, we have granted incentive stock options, non-qualified stock options and restricted stock units. The following table provides information about the shares of our common stock that may be issued upon exercise of awards under these two plans as of December 29, 2009 (share numbers in thousands).
| Number of securities to be issued upon exercise of outstanding stock options and restricted stock units |
Weighted average exercise price of outstanding stock options and restricted stock units |
Number of securities remaining available for future issuance under stock-based compensation plans | |||||
| Stock-based compensation plans approved by shareholders |
2,917 | $ | 15.21 | 1,048 | |||
| Stock-based compensation plans not approved by shareholders |
– | $ | – | – | |||
Dividend Policy and Stock Repurchases
We have not paid any dividends since our inception and have currently not allocated any funds for the payment of dividends. Rather, it is our current policy to retain earnings, if any, for expansion of our operations, remodeling of existing restaurants and other general corporate purposes. We have no plans to pay any cash dividends in the foreseeable future. Should we decide to pay dividends in the future, such payments would be at the discretion of the Board of Directors. We did not have any stock repurchases in fiscal 2009.
42
Table of Contents
ITEM 6. SELECTED CONSOLIDATED FINANCIAL DATA
The following selected consolidated financial and operating data for each of the five fiscal years in the period ended December 29, 2009, are derived from our audited consolidated financial statements. This selected consolidated financial and operating data should be read in conjunction with the consolidated financial statements and accompanying notes, “Management’s Discussion and Analysis of Financial Condition and Results of Operations” and other financial information included elsewhere in this report.
| Fiscal Year (1) | ||||||||||||||||
| 2009 | 2008 | 2007 | 2006 | 2005 | ||||||||||||
| (in thousands, except per share data) | ||||||||||||||||
| Consolidated Statements of Income Data: |
||||||||||||||||
| Revenues |
$ | 426,707 | $ | 374,076 | $ | 316,095 | $ | 238,928 | $ | 178,210 | ||||||
| Costs and expenses: |
||||||||||||||||
| Cost of sales |
106,484 | 94,412 | 80,374 | 61,420 | 45,458 | |||||||||||
| Labor and benefits |
149,075 | 131,328 | 111,031 | 83,292 | 63,867 | |||||||||||
| Occupancy and operating |
92,204 | 80,212 | 61,906 | 46,198 | 33,987 | |||||||||||
| General and administrative |
29,484 | 27,264 | 26,008 | 19,832 | 13,290 | |||||||||||
| Depreciation and amortization |
24,119 | 19,184 | 14,421 | 9,983 | 6,984 | |||||||||||
| Restaurant opening |
5,327 | 7,384 | 6,940 | 5,253 | 3,520 | |||||||||||
| Loss on disposal of assets |
312 | 855 | 2,004 | – | – | |||||||||||
| Natural disaster and related |
– | 446 | – | – | – | |||||||||||
| Legal settlements and terminations |
– | 2,086 | – | – | – | |||||||||||
| Total costs and expenses |
407,005 | 363,171 | 302,684 | 225,978 | 167,106 | |||||||||||
| Income from operations |
19,702 | 10,905 | 13,411 | 12,950 | 11,104 | |||||||||||
| Other income (expense): |
||||||||||||||||
| Interest income (expense), net |
214 | 1,764 | 3,306 | 1,690 | 1,119 | |||||||||||
| Loss on investment settlement |
(1,709 | ) | – | – | – | – | ||||||||||
| Other income (expense), net |
379 | 376 | 482 | 39 | 149 | |||||||||||
| Total other income (expense) |
(1,116 | ) | 2,140 | 3,788 | 1,729 | 1,268 | ||||||||||
| Income before taxes |
18,586 | 13,045 | 17,199 | 14,679 | 12,372 | |||||||||||
| Income tax expense |
5,548 | 2,737 | 5,494 | 4,834 | 4,021 | |||||||||||
| Net income |
$ | 13,038 | $ | 10,308 | $ | 11,705 | $ | 9,845 | $ | 8,351 | ||||||
| Net income per share: |
||||||||||||||||
| Basic |
$ | 0.49 | $ | 0.39 | $ | 0.45 | $ | 0.42 | $ | 0.38 | ||||||
| Diluted |
$ | 0.48 | $ | 0.39 | $ | 0.44 | $ | 0.41 | $ | 0.36 | ||||||
| Weighted average shares outstanding: |
||||||||||||||||
| Basic |
26,750 | 26,484 | 26,187 | 23,287 | 22,134 | |||||||||||
| Diluted |
27,147 | 26,749 | 26,880 | 24,131 | 23,381 | |||||||||||
| Consolidated Balance Sheets Data (end of period): |
||||||||||||||||
| Cash and cash equivalents |
$ | 44,906 | $ | 8,852 | $ | 11,617 | $ | 51,758 | $ | 8,144 | ||||||
| Investments (2) |
$ | – | $ | 30,617 | $ | 41,100 | $ | 32,895 | $ | 41,703 | ||||||
| Total assets |
$ | 381,122 | $ | 335,209 | $ | 285,299 | $ | 249,849 | $ | 163,958 | ||||||
| Total long-term debt (including current portion) |
$ | 5,000 | $ | 9,500 | $ | – | $ | – | $ | – | ||||||
| Shareholders’ equity |
$ | 252,979 | $ | 232,277 | $ | 220,523 | $ | 202,862 | $ | 129,899 | ||||||
| (1) | Fiscal 2005 consists of 52 weeks and two days; all other fiscal years consist of 52 weeks. |
| (2) | Prior to fiscal 2008, auction rate securities investments held by us were classified as held-to-maturity, included in current assets and reported at amortized cost. Due to significant disruptions in the market for auction rate securities during 2008, these investments were reclassified as available-for-sale, included in non-current assets and recorded at their estimated fair value as of the end of fiscal 2008. In December 2009, we reached a settlement for the full liquidation of our auction rate securities investment portfolio. The proceeds from the settlement were invested in investment-grade money market funds which were included with cash and cash equivalents as of the end of fiscal 2009. |
43
Table of Contents
ITEM 7. MANAGEMENT’S DISCUSSION AND ANALYSIS OF FINANCIAL CONDITION AND RESULTS OF OPERATIONS
GENERAL
As of March 3, 2010, we owned and operated 93 restaurants located in California, Texas, Arizona, Colorado, Oregon, Nevada, Florida, Ohio, Oklahoma, Kentucky, Indiana, Louisiana and Washington. Each of our restaurants is operated either as a BJ’s Restaurant & Brewery, a BJ’s Restaurant & Brewhouse, or a BJ’s Pizza & Grill restaurant. Our menu features our award-winning, signature deep-dish pizza, our own handcrafted beers as well as a wide selection of appetizers, entrees, pastas, sandwiches, specialty salads and desserts.
The first BJ’s restaurant was opened in Orange County, California in 1978 as a small full-service restaurant focusing on a lighter, bakery crust style deep-dish pizza. We acquired the original BJ’s restaurants in 1995 from their original owners. Our initial public offering of common stock occurred in 1996. In 1996, we opened our first large-format restaurant and brewery in Brea, California and began to expand the menu to include appetizers, entrees, pastas, sandwiches, specialty salads and desserts.
Of the 93 restaurants we operated as of March 3, 2010, 11 are BJ’s Restaurant & Brewery restaurants (of which four are currently manufacturing our proprietary beer for some of our restaurants and one is manufacturing our proprietary root beer), 75 are BJ’s Restaurant & Brewhouse restaurants (which are similar to our brewery restaurants except that they do not manufacture beer), and seven are BJ’s Pizza & Grill restaurants (which are primarily our original, smaller format “legacy” restaurants). In the near term, our future restaurant growth will focus principally on our BJ’s Restaurant & Brewhouse format. However, we may continue to build additional BJ’s Restaurant & Brewery locations in certain areas where we believe it may be more appropriate to brew our own beer. We also have contract brewing arrangements in which we utilize other qualified craft brewers to produce our handcrafted beers under our proprietary recipes and our indirect supervision. We currently believe that, over the long run, it will become more beneficial to increase our contract brewing due to the economies of scale that can be obtained from brewing beer in large quantities while also avoiding potential liquor licensing complications in some states where we desire to operate restaurants. As such, we expect to gradually increase our contract brewing relationships over the next several years. As a result of this expected increase in contract brewing, we intend to rebalance our internal beer production activities on an ongoing basis. In addition, we may decide to decommission some additional internally-operated breweries, which may result in additional disposals of related assets in the future.
We intend to continue developing and opening new BJ’s restaurants in high profile locations within densely populated areas in both existing and new markets. Since most of our established restaurants currently operate close to full capacity during the peak demand periods of lunch and dinner, and given our relatively high average sales per productive square foot, we generally do not expect to achieve increases in comparable sales other than our effective menu price increases for our mature restaurants. As a result of the current relatively weak condition of the national economy, our comparable restaurant sales decreased slightly during fiscal 2009. We continue to expect an abnormally high national unemployment rate during 2010; and, we expect even higher unemployment rates in certain states where we have a substantial number of restaurants (in particular California and including Nevada, Arizona and Florida). We believe the ultimate recovery of the job market, coupled with a recovery in consumer confidence and spending in general, will be important and necessary catalysts to facilitate improved guest traffic in casual dining restaurants in general and our restaurants in particular. As such, we currently expect guest traffic and sales in our base of comparable restaurants to remain under pressure during 2010. We currently expect the vast majority of our 2010 revenue growth to be derived from new restaurant openings and the carryover impact of partial-year openings during 2009.
Newly opened restaurants typically experience normal inefficiencies in the form of higher cost of sales, labor and direct operating and occupancy costs for several months after their opening in both percentage and dollar terms when compared with our more mature, established restaurants. Accordingly, the number and timing of newly
44
Table of Contents
opened restaurants has had, and is expected to continue to have, an impact on restaurant opening expenses, cost of sales, labor and occupancy and operating expenses. Additionally, initial restaurant openings in new markets may experience even greater inefficiencies for a period of time due to lower initial sales volumes, which results from initially low consumer awareness levels, and a lack of supply chain and other operating cost leverage until additional restaurants can be opened in the markets.
Our revenues are comprised of food and beverage sales at our restaurants. Revenues from restaurant sales are recognized when payment is tendered at the point-of-sale. Revenues from our gift cards are recognized upon redemption in our restaurants. Effective June 2007, we began recognizing gift card breakage as other income on our Consolidated Statements of Income. Gift card breakage is recorded when the likelihood of the redemption of the gift cards becomes remote, which is typically 24 months after original gift card issuance.
Cost of sales is comprised of food and beverage supplies. The components of cost of sales are variable and typically fluctuate with sales volumes. Labor costs include direct hourly and management wages, bonuses and payroll taxes and fringe benefits for restaurant employees.
Occupancy and operating expenses include restaurant supplies, credit card fees, marketing costs, fixed rent, percentage rent, common area maintenance charges, utilities, real estate taxes, repairs and maintenance and other related restaurant costs.
General and administrative costs include all corporate, field supervision and administrative functions that support existing operations and provide infrastructure to facilitate our future growth. Components of this category include corporate management, field supervision and corporate hourly staff salaries and related employee benefits (including stock-based compensation expense), travel and relocation costs, information systems, the cost to recruit and train new restaurant management employees, corporate rent and professional and consulting fees.
Depreciation and amortization principally include depreciation on capital expenditures for restaurants. Restaurant opening expenses, which are expensed as incurred, consist of the costs of hiring and training the initial hourly work force for each new restaurant, travel, the cost of food and supplies used in training, grand opening promotional costs, the cost of the initial stocking of operating supplies and other direct costs related to the opening of a restaurant, including rent during the construction and in-restaurant training period.
We have one lease for a smaller BJ’s Pizza & Grill locations that will expire during the next 12 months, and we are currently evaluating the desirability of renewing that lease.
In calculating comparable company-owned restaurant sales, we include a restaurant in the comparable base once it has been open for 18 months.
45
Table of Contents
RESULTS OF OPERATIONS
The following table sets forth, for the years indicated, our Consolidated Statements of Income expressed as percentages of total revenues.
| Fiscal Year | |||||||||||||||
| 2009 | 2008 | 2007 | 2006 | 2005 | |||||||||||
| Consolidated Statements of Income Data: |
|||||||||||||||
| Revenues |
100.0 | % | 100.0 | % | 100.0 | % | 100.0 | % | 100.0 | % | |||||
| Costs and expenses: |
|||||||||||||||
| Cost of sales |
25.0 | 25.2 | 25.4 | 25.7 | 25.5 | ||||||||||
| Labor and benefits |
34.9 | 35.1 | 35.1 | 34.9 | 35.8 | ||||||||||
| Occupancy and operating |
21.6 | 21.4 | 19.6 | 19.3 | 19.1 | ||||||||||
| General and administrative |
6.9 | 7.3 | 8.2 | 8.3 | 7.5 | ||||||||||
| Depreciation and amortization |
5.7 | 5.1 | 4.6 | 4.2 | 3.9 | ||||||||||
| Restaurant opening |
1.2 | 2.0 | 2.2 | 2.2 | 2.0 | ||||||||||
| Loss on disposal of assets |
0.1 | 0.2 | 0.6 | – | – | ||||||||||
| Natural disaster and related |
– | 0.1 | – | – | – | ||||||||||
| Legal settlements and terminations |
– | 0.6 | – | – | – | ||||||||||
| Total costs and expenses |
95.4 | 97.0 | 95.7 | 94.6 | 93.8 | ||||||||||
| Income from operations |
4.6 | 3.0 | 4.3 | 5.4 | 6.2 | ||||||||||
| Other income (expense): |
|||||||||||||||
| Interest income (expense), net |
0.1 | 0.5 | 1.0 | 0.7 | 0.6 | ||||||||||
| Loss on investment settlement |
(0.4 | ) | – | – | – | – | |||||||||
| Other income (expense), net |
0.1 | 0.1 | 0.2 | – | 0.1 | ||||||||||
| Total other income (expense) |
(0.2 | ) | 0.6 | 1.2 | 0.7 | 0.7 | |||||||||
| Income before taxes |
4.4 | 3.6 | 5.5 | 6.1 | 6.9 | ||||||||||
| Income tax expense |
1.3 | 0.7 | 1.7 | 2.0 | 2.3 | ||||||||||
| Net income |
3.1 | % | 2.9 | % | 3.8 | % | 4.1 | % | 4.6 | % | |||||
FISCAL YEAR 2009 (52 WEEKS) COMPARED TO FISCAL YEAR 2008 (52 WEEKS)
Revenues. Total revenues increased by $52.6 million, or 14.1%, to $426.7 million during the 52 weeks ended December 29, 2009 from $374.1 million during the comparable 52 week period of 2008. The increase in revenues consisted of an increase of approximately $55.3 million in restaurant sales from new restaurants not yet in our comparable sales base, partially offset by an approximate $2.7 million, or 0.8%, decrease in comparable restaurant sales. The decrease in comparable restaurant sales resulted from decreased guest traffic, partially offset by an estimated menu price increase of approximately 2.8%. The difficult economic environment, high unemployment and uncertainty in overall consumer confidence continue to negatively impact consumer spending for casual dining restaurant occasions. Accordingly, we do not anticipate any significant growth in guest traffic during fiscal 2010. In addition, overall guest traffic may continue to decline if the economy further weakens and unemployment rates continue to rise, particularly in California and other Western states where the majority of our restaurants are located.
Our restaurants, like most in casual dining, are impacted by inflationary pressures for the costs of certain commodities, labor and other operating expenses. We attempt to offset the impact of inflation on our cost structure with purchasing economies of scale, productivity and efficiency improvements, and menu price increases. However, if our guests do not accept our price increases, either by reducing their visits to our restaurants or by changing their purchasing patterns at our restaurants, the expected benefit of the menu price increase could be negated and our operating margins could be impacted. We currently expect our effective menu price increase for 2010 to be in the range of 2.0% to 2.5%. Additionally, to help protect guest traffic and to
46
Table of Contents
respond to the actions of our competitors, we may consider selective menu offerings or new menu offerings at reduced or lower price points which could have the effect of further reducing the benefit of any menu price increases. We also believe that some of our larger casual dining chain competitors have increased their media advertising levels to more effectively communicate a stronger “value pricing” or reduced/discounted pricing message to consumers. This competitive development may also impact general levels of guest traffic in our restaurants.
All potential menu price increases must be carefully considered in light of their ultimate acceptability by our restaurant guests. Additionally, other factors outside of our control, such as inclement weather, shifts in the holiday calendar, competitive restaurant intrusions into our trade areas, general economic and competitive conditions and other factors, as described in the “Risk Factors” section in Part I, Item 1A of this Annual Report on Form 10-K, can impact comparable sales. Accordingly, there can be no assurance that increases in comparable sales will be achieved as a result of increased menu prices or other factors.
Cost of Sales. Cost of sales increased by $12.1 million, or 12.8%, to $106.5 million during the 52 weeks ended December 29, 2009, from $94.4 million during the comparable 52 week period of 2008. As a percentage of revenues, cost of sales decreased to 25.0% for the current 52 week period from 25.2% for the prior year comparable 52 week period. This decrease is primarily due to increased revenues from our estimated effective menu price increases, coupled with lower pizza cheese costs.
We do anticipate that cost of sales in our new restaurants will typically be higher during the first several months of operations versus our mature restaurants, as our restaurant management teams become accustomed to optimally predicting, managing and servicing sales volumes at our new restaurants. Accordingly, a comparatively large number of new restaurant openings in any single quarter may significantly impact total cost of sales comparisons for our entire business. Additionally, restaurants opened in new markets may initially experience higher commodity costs than our established restaurants, where we have greater market penetration that generally results in greater purchasing and distribution economies of scale.
We provide our customers a large variety of menu items and therefore we are not overly dependent on a single group of commodities. We believe the overall cost environment for food commodities in general will remain volatile into 2010, primarily due to domestic and worldwide agricultural, supply/demand and other macroeconomic factors that are outside of our control. While we continue to work with our suppliers to control food costs and we have taken steps to enter into agreements for some of the commodities used in our restaurant operations, there can be no assurance that future supplies and costs for such commodities will not fluctuate due to weather and other market conditions outside of our control. Additionally, there are some commodities that we are unable to contract for long periods of time, such as fluid dairy items or certain commodity items where we have currently chosen not to contract for long period of time (such as pizza cheese).
The cost to produce and distribute our proprietary beer is included in our cost of sales. In 2009, we utilized four qualified contract brewers to produce an aggregate of approximately 22,000 barrels of our handcrafted beer, representing about 48% of our total requirement for proprietary beer for the year. We estimate our total proprietary beer requirement to be approximately 52,000 to 53,000 barrels for fiscal 2010, with over 60% of that requirement expected to be produced by contract brewers. Our longer-term objective is to have large contract brewers produce substantially all of our larger-volume beers. We currently expect to continue to create and brew our smaller-volume seasonal and specialty beers; however, we may eventually decide to also move the majority of this production to contract brewers. We believe the larger-scale contract brewers have greater economies of scale, stronger quality control systems and more effective, leverageable supply chain relationships than we have as a relatively small restaurant company. As a result, over the next several years, we expect that the production cost of our larger volume proprietary beers can be gradually reduced, while simultaneously providing an improvement in the overall consistency of our beer. However, freight costs from our contract brewing locations will likely absorb a large portion of those production cost savings for a period of time until we can further increase the number of restaurants we operate and negotiate more favorable terms with our transportation vendors.
47
Table of Contents
Labor and Benefits. Labor and benefit costs for our restaurants increased by $17.8 million, or 13.5%, to $149.1 million during the 52 weeks ended December 29, 2009, from $131.3 million during the comparable 52 week period of 2008. This increase was primarily due to the opening of 10 new restaurants since the 52 weeks ended December 30, 2008. As a percentage of revenues, labor and benefit costs decreased to 34.9% for the current 52 week period from 35.1% as compared to the same 52 week period of 2008. This percentage decrease is primarily due to lower management labor costs as a result of less new restaurant openings coupled with the cumulative favorable forfeiture rate adjustment related to our stock-based compensation grants based on our actual forfeiture experience to date. Included in labor and benefits for the 52 weeks ended December 29, 2009 and December 30, 2008 is approximately $602,000 and $806,000, or 0.1% and 0.2% of revenues, of stock-based compensation expense related to restricted stock units granted in accordance with our Gold Standard Stock Ownership Program, respectively.
Our restaurants can be affected by increases in federal and state minimum wages. Additionally, some states have annual minimum wage increases correlated with either state or federal increases in the consumer price index. In July 2009, the federal minimum wage increased by $0.70 to $7.25 per hour. We do not expect this recent increase to have a material impact on our hourly labor costs, as the majority of our hourly employees are already paid wages in excess of $7.25 per hour. In the past, we have been able to react to changes in our key operating costs, including minimum wage increases by gradually increasing our menu prices and improving our productivity in our restaurants. However, we cannot guarantee that all or any future cost increases can be offset by increased menu prices or that increased menu prices will be accepted by our restaurant guests without any resulting changes in their visit frequencies or purchasing patterns.
For new restaurants, labor expenses will typically be higher than normal during the first several months of operations until our restaurant management team at each new restaurant becomes more accustomed to optimally predicting, managing and servicing the sales volumes expected at our new restaurants. Accordingly, a comparatively large number of new restaurant openings in any single quarter may significantly impact labor cost comparisons for the entire Company.
Occupancy and Operating. Occupancy and operating expenses increased by $12.0 million, or 14.9%, to $92.2 million during the 52 weeks ended December 29, 2009, from $80.2 million during the comparable 52 week period of 2008. The increase reflects additional operating and occupancy expenses related to the 10 new restaurants we opened since the 52 weeks ended December 30, 2008. As a percentage of revenues, occupancy and operating expenses increased to 21.6% for the 52 week period from 21.4% for the prior year comparable 52 week period. This percentage increase is principally a result of increased marketing costs for electronic, print and web-based media in response to the overall competitive environment, coupled with the de-leveraging of the fixed component of rent related expenses as a result of the 0.8% decrease in comparable restaurant sales during fiscal 2009.
General and Administrative. General and administrative expenses increased by $2.2 million, or 8.1%, to $29.5 million during the 52 weeks ended December 29, 2009 from $27.3 million during the comparable 52 week period of 2008. Included in general and administrative costs for the 52 weeks ended December 29, 2009 and December 30, 2008 is $2.3 million and $2.5 million, respectively, of stock-based compensation expense. The increase in general and administrative expenses is primarily due to higher accrued incentive compensation expense compared to the same period last year, planned increases in field supervision and legal fees primarily related to our auction rate securities settlement partially offset by less salary and related expenses from the departure of our two co-founders at the end of last year. As a percentage of revenues, general and administrative expenses decreased to 6.9% for the 52 week period ended December 29, 2009 from 7.3% for the prior year comparable 52 week period. This decrease is primarily due to leverage of the fixed component of these expenses over a higher revenue base.
Depreciation and Amortization. Depreciation and amortization increased by $4.9 million, or 25.7%, to $24.1 million during the 52 weeks ended December 29, 2009, from $19.2 million during the comparable 52 week period of 2008. As a percentage of revenues, depreciation and amortization increased to 5.7% for the 52 week
48
Table of Contents
period from 5.1% for the prior year comparable 52 week period. This increase is primarily a result of the increased construction costs to build new restaurants as compared to our original base of restaurants coupled with the de-leveraging of the fixed component of these expenses as a result of the 0.8% decrease in comparable restaurant sales during fiscal 2009.
Restaurant Opening. Restaurant opening expenses decreased by $2.1 million, or 27.9%, to $5.3 million during the 52 weeks ended December 29, 2009, from $7.4 million during the comparable 52 week period of 2008. This decrease is primarily due to opening costs related to 10 restaurant openings during the 52 weeks ended December 29, 2009, compared to 15 restaurant openings for the 52 weeks ended December 30, 2008. Our opening costs will fluctuate from period to period, depending upon, but not limited to, the number of restaurant openings, the size and concept of the restaurants being opened, the location of the restaurants and the complexity of the staff hiring and training process. See “Business – Restaurant Opening Expenses” in Part I, Item 1 of this Annual Report on Form 10-K.
Loss on Disposal of Assets. Loss on disposal of assets decreased by $543,000 or 63.5%, to $312,000 during the 52 weeks ended December 29, 2009, from $855,000 during the comparable 52 week period of 2008. These costs are related to normal disposals associated with the ordinary course of business, along with asset disposals related to selected restaurant remodeling activities.
Natural Disaster and Related. There were no natural disaster related costs for the 52 weeks ended December 29, 2009. The natural disaster and related costs of $446,000, for the 52 weeks ended December 30, 2008, relates to property and facility damages from hurricanes Gustav and Ike in excess of our related insurance coverage.
Legal Settlements and Terminations. There were no legal settlement and terminations for the 52 weeks ended December 29, 2009. Legal settlements and terminations of $2.1 million, for the 52 weeks ended December 30, 2008, principally relate to accrued compensation and related benefits resulting from the December 2008 departure of our two co-founders and estimated costs to settle two California employment practice lawsuits that have been outstanding since 2004 and 2005.
Interest Income, Net. Net interest income decreased by $1.6 million, or 87.9%, to $0.2 million during the 52 weeks ended December 29, 2009, from $1.8 million during the comparable 52 week period of 2008. This decrease is primarily due to lower investment balances, coupled with lower interest rates, compared to the same period last year.
Other Income, Net. Net other income increased by $3,000, or 0.8% to $379,000 during the 52 weeks ended December 29, 2009, from $376,000 million during the comparable 52 week period of 2008.
Loss on Investment Settlement. Loss on investment settlement relates to the confidential settlement agreement reached in December 2009 for the full liquidation of our auction rate securities (“ARS”) investment portfolio with our former broker-dealer for the portfolio. Under the terms of the settlement, we received approximately $27.4 million in cash (including accrued interest) plus the potential for additional recoveries based on the performance of the auction rate securities market over the next three years in exchange for the entire remaining ARS investment portfolio and recorded a pre-tax loss on investment settlement of approximately $1.7 million.
Income Tax Expense. Our effective income tax rate for the 52 weeks ended December 29, 2009, was 29.9% compared to 21.0% for the comparable 52 week period of 2008. The effective income tax rate for the 52 weeks ended December 29, 2009, differs from the statutory income tax rate primarily due to FICA tip credits, the non-deductibility of incentive stock options and tax free interest on our investments. We currently estimate our effective tax rate to be approximately 30.0% for fiscal 2010. However, the actual effective tax rate for fiscal 2010 may be different than our current estimate due to actual revenues, pre-tax income, tax credits achieved during the year and tax deductibility of our interest on our investments.
49
Table of Contents
FISCAL YEAR 2008 (52 WEEKS) COMPARED TO FISCAL YEAR 2007 (52 WEEKS)
Revenues. Total revenues increased by $58.0 million, or 18.3%, to $374.1 million during the 52 weeks ended December 30, 2008 from $316.1 million during the comparable 52 week period of 2007. The increase in revenues consisted of an increase of approximately $58.7 million in restaurant sales from new restaurants not in our comparable sales base for the prior year, partially offset by an approximate $0.7 million or 0.3%, decrease from comparable restaurant sales. The decrease in comparable restaurant sales resulted from decreased guest traffic offset by an effective menu price increase of approximately 4.9%. In particular, lower levels of guest traffic were experienced by our comparable restaurants located in the Inland Empire and Sacramento areas of California and in the Phoenix, Arizona market, which together contain approximately 20% of our total comparable restaurants for the year. These areas were significantly impacted by the slowing national economy, the “credit crunch” and the resulting pressures in general on consumer spending and confidence. The slowing domestic economy and the accompanying pressures of lower housing, investment and savings account values, reduced credit availability, and higher food and fuel costs on the consumer negatively impacted overall consumer traffic for casual dining during fiscal 2008.
Cost of Sales. Cost of sales increased by $14.0 million, or 17.5%, to $94.4 million during the 52 weeks ended January 1, 2008, from $80.4 million during the comparable 52 week period of 2007. As a percentage of revenues, cost of sales decreased to 25.2% for the current 52 week period from 25.4% for the prior year comparable 52 week period. This decrease was primarily due to increased revenues from our estimated effective menu price increases and reduced food waste (largely resulting from our recently-implemented theoretical food cost system), partially offset by increased commodity costs, including meat, cheese, produce, soups/sauces/dressings and grocery costs.
Labor and Benefits. Labor and benefit costs for our restaurants increased by $20.3 million, or 18.3%, to $131.3 million during the 52 weeks ended December 30, 2008, from $111.0 million during the comparable 52 week period of 2007. This increase was primarily due to the opening of 15 new restaurants since the 52 weeks ended January 1, 2008. As a percentage of revenues, labor and benefit costs remained comparable at 35.1% for the current 52 week period as compared to the same 52 week period of 2007. Included in labor and benefits for the 52 weeks ended December 30, 2008, and January 1, 2008, is approximately $806,000 and $683,000, or 0.2% and 0.2% of revenues, of stock-based compensation expense related to restricted stock units granted in accordance with our Gold Standard Stock Ownership Program, respectively.
The California minimum wage increased $0.50 to $8.00 per hour effective January 1, 2008. Nevada and Kentucky’s minimum wages increased $0.52 and $0.70, respectively, on July, 1, 2008. Oklahoma, Texas, Indiana and Louisiana’s minimum wages increased $0.70 on July 24, 2008 and is scheduled to increase again on July 24, 2009. Additionally, the federal minimum wage increased $0.70 to $6.55 per hour effective July 24, 2008, and is scheduled to increase again in July 2009.
Occupancy and Operating. Occupancy and operating expenses increased by $18.3 million, or 29.6%, to $80.2 million during the 52 weeks ended December 30, 2008, from $61.9 million during the comparable 52 week period of 2007. The increase reflects additional operating and occupancy expenses related to the 15 new restaurants we opened since the 52 weeks ended January 1, 2008. As a percentage of revenues, occupancy and operating expenses increased to 21.4% for the 52 week period from 19.6% for the prior year comparable 52 week period. This percentage increase was principally a result of absolute dollar increases for upgraded china, silverware, glassware and linen napkins in our restaurants; increased marketing costs as we increased the use of electronic and print media to support our new menu items, guest services and lunch specials; and, increased utility costs, coupled with de-leveraging of the fixed component of these expenses as a result of the 0.3% decrease in comparable restaurant sales during fiscal 2008.
General and Administrative. General and administrative expenses increased by $1.3 million, or 4.8%, to $27.3 million during the 52 weeks ended December 30, 2008, from $26.0 million during the comparable 52 week
50
Table of Contents
period of 2007. Included in general and administrative costs for the 52 weeks ended December 30, 2008 and January 1, 2008 is $2.5 million and $2.2 million, respectively, of stock-based compensation expense. This increase was primarily due to planned investments in field supervision and corporate infrastructure to support our growth, higher travel and lodging costs related to our new restaurants in new states and higher restaurant management recruiting and training costs offset by lower incentive compensation based on fiscal 2008 financial results. As a percentage of revenues, general and administrative expenses decreased to 7.3% for the 52 week period ended December 30, 2008, from 8.2% for the prior year comparable 52 week period. This decrease was primarily due to leverage of the fixed component of these expenses over a higher revenue base, coupled with lower performance incentive expenses compared to the prior year.
Depreciation and Amortization. Depreciation and amortization increased by $4.8 million, or 33.0%, to $19.2 million during the 52 weeks ended December 30, 2008, from $14.4 million during the comparable 52 week period of 2007. As a percentage of revenues, depreciation and amortization increased to 5.1% for the 52 week period from 4.6% for the prior year comparable 52 week period. This increase was primarily a result of the increased construction costs to build new restaurants as compared to our original base of restaurants coupled with the de-leveraging of the fixed component of these expenses as a result of the 0.3% decrease in comparable restaurant sales during fiscal 2008.
Restaurant Opening. Restaurant opening expenses increased by approximately $443,000, or 6.4%, to $7.4 million during the 52 weeks ended December 30, 2008, from $6.9 million during the comparable 52 week period of 2007. This increase was primarily due to opening costs related to 15 restaurant openings during the 52 weeks ended December 30, 2008, compared to 13 restaurant openings for the 52 weeks ended January 1, 2008, coupled with higher travel and lodging costs related to openings in our new states.
Loss on Disposal of Assets. Loss on disposal of assets decreased by $1.1 million or 57.4%, to $0.9 million during the 52 weeks ended December 30, 2008, from $2.0 million during the comparable 52 week period of 2007. In 2007, we upgraded all of our china, silverware, and glassware and decommissioned four of our older, smaller and inefficient “legacy” breweries in addition to normal disposal costs associated with our ongoing remodel and upgrade initiatives. In the year ended December 30, 2008, we incurred normal disposal costs associated with the ordinary course of business, along with asset disposals related to selected restaurant remodeling activities.
Natural Disaster and Related. Natural disaster and related costs of $446,000, for the 52 weeks ended December 30, 2008, relates to property and facility damages from hurricanes Gustav and Ike in excess of our related insurance coverage.
Legal Settlements and Terminations. Legal settlements and terminations of $2.1 million, for the 52 weeks ended December 30, 2008, principally relate to accrued compensation and related benefits resulting from the December 2008 departure of our two co-founders and estimated costs to settle two California employment practice lawsuits that have been outstanding since 2004 and 2005.
Interest Income, Net. Net interest income decreased by $1.5 million, or 46.7%, to $1.8 million during the 52 weeks ended December 30, 2008, from $3.3 million during the comparable 52 week period of 2007. This decrease was primarily due to lower investment balances, coupled with lower interest rates, compared to the same period last year.
Other Income, Net. Net other income decreased by $106,000, or 21.9% to $376,000 during the 52 weeks ended December 30, 2008, from $482,000 during the comparable 52 week period of 2007. In the second quarter of 2007, we began recognizing gift card breakage income resulting in a one time cumulative pick up in gift card breakage income at adoption. Our gift card breakage income is based on an analysis of our gift card program since its inception in which we determined that 24 months after issuance date the likelihood of gift card redemption is remote.
51
Table of Contents
Income Tax Expense. Our effective income tax rate for the 52 weeks ended December 30, 2008, was 21.0% compared to 31.9% for the comparable 52 week period of 2007. The effective income tax rate for the 52 weeks ended December 30, 2008, differs from the statutory income tax rate primarily due to FICA tip credits, the non-deductibility of incentive stock options and tax free interest on our investments. We currently estimate our effective tax rate to be approximately 27.0% to 29.0% for fiscal 2009.
LIQUIDITY AND CAPITAL RESOURCES
The following tables set forth, for the periods indicated, a summary of our key liquidity measurements (dollar amounts in thousands):
| December 29, 2009 |
December 30, 2008 |
||||||
| Cash and cash equivalents |
$ | 44,906 | $ | 8,852 | |||
| Net working capital (1) |
$ | 7,557 | ($ | 19,614 | ) | ||
| Current ratio |
1.1:1.0 | 0.7:1.0 | |||||
| (1) | The deficit as of December 30, 2008 is principally due to the classification of our investments in auction rate securities as non-current assets. |
| 52 Weeks Ended | ||||||
| December 29, 2009 |
December 30, 2008 | |||||
| Cash provided by operating activities |
$ | 68,326 | $ | 58,511 | ||
| Capital expenditures |
$ | 60,015 | $ | 79,183 | ||
Our fundamental corporate finance philosophy is to maintain a conservative balance sheet in order to support our long-term restaurant expansion plan with sufficient financial flexibility; to provide the financial resources necessary to protect and enhance the competitiveness of our restaurant and brewing operations; and, to provide a prudent level of financial capacity to manage the risks and uncertainties of conducting our business operations on a larger scale. In the past, we have obtained capital resources from our ongoing operations, public stock and warrant offerings, employee stock option exercises and tenant improvement allowances from our landlords. As an additional source of liquidity, we also have a $45 million credit facility in place, of which $5 million was outstanding as of December 29, 2009.
Our capital requirements are principally related to our restaurant expansion plans. While our ability to achieve our growth plans is dependent on a variety of factors, some of which are outside of our control, our primary growth objective is to achieve an approximate 13% increase in total restaurant operating weeks during fiscal 2010 from the development and opening of new restaurants, coupled with the carryover impact of partial-year 2009 openings. Our base of established restaurant operations is not yet large enough to generate enough cash flow from operations to totally fund our planned restaurant expansion at the rate that it is currently contemplated over the longer run. Accordingly, we will continue to actively monitor overall conditions in the capital markets with respect to the potential sources and timing of additional financing for our planned future expansion. However, there can be no assurance that such financing will be available when required or available on terms acceptable to us. If we are unable to secure additional capital resources, we may be required to reduce our longer-term planned rate of expansion.
Similar to many restaurant chains, we typically utilize operating lease arrangements (principally ground leases) for the majority of our restaurant locations. We believe our operating lease arrangements continue to provide appropriate leverage for our capital structure in a financially efficient manner. However, we are not limited to the use of lease arrangements as our only method of opening new restaurants. While our operating lease obligations are not currently required to be reflected as indebtedness on our Consolidated Balance Sheets, the minimum rents and other related lease obligations, such as common area expenses, under our lease agreements must be satisfied
52
Table of Contents
by cash flows from our ongoing operations. Accordingly, our lease arrangements reduce, to some extent, our capacity to utilize funded indebtedness in our capital structure. We also require capital resources to maintain and improve our existing base of restaurants and brewery operations and to further expand and strengthen the capabilities of our corporate and information technology infrastructures. Our requirement for working capital is not significant since our restaurant guests pay for their food and beverage purchases in cash or credit cards at the time of the sale. Thus, we are able to sell many of our inventory items before we have to pay our suppliers for such items.
We typically seek to lease our restaurant locations for primary periods of 15 to 20 years under operating lease arrangements. Our rent structures vary from lease to lease, but generally provide for the payment of both minimum and contingent (percentage) rent based on sales, as well as other expenses related to the leases (for example, our pro-rata share of common area maintenance, property tax and insurance expenses). In addition, many of our lease arrangements include the opportunity to secure tenant improvement allowances to partially offset the cost of developing and opening the related restaurants. Generally, landlords recover the cost of such allowances from increased minimum rents. During fiscal 2009, we secured approximately $13 million of committed tenant improvement allowances. However, in light of current conditions in the credit and real estate development markets, there can be no assurance that such allowances will continue to be available to us. As of March 3, 2010, we currently expect to secure approximately $6 million of committed tenant improvement allowances for our planned 2010 new restaurant openings. From time to time, we may also decide to purchase the underlying land for a new restaurant if that is the only way to secure a highly desirable site. Currently, we own the land that underlies four of our restaurants, and we may determine at some future point to monetize those assets through a sale-leaseback or other financial transaction, provided that the financial markets for those transactions are functioning normally. We disburse cash for certain site-related work, buildings, leasehold improvements, furnishings, fixtures and equipment to build out our leased and owned premises. We own substantially all of the equipment, furniture and trade fixtures in our restaurants and currently plan to do so in the future.
Our cash flows from operating activities, as detailed in the Consolidated Statements of Cash Flows, provided $68.3 million of net cash during the 52 weeks ended December 29, 2009, a $9.8 million increase from the $58.5 million generated during the 52 week period of 2008. The net increase in cash from operating activities for the 52 weeks ended December 29, 2009, in comparison to the 52 weeks ended December 30, 2008, is primarily due to higher net income, depreciation expense, accrued expenses and other liabilities as a result of our growth and the increase in restaurants open, coupled with the loss on investment settlement and partially offset by the increases in accounts receivables, other receivables, other assets and tenant allowance receivables due principally to timing.
For the 52 weeks ended December 29, 2009, total capital expenditures were $60.0 million, of which expenditures for the acquisition of restaurant and brewery equipment and leasehold improvements to construct new restaurants were $47.3 million. These expenditures were primarily related to the construction of our 10 new restaurants opened by the end of the fiscal year, as well as approximately $5.0 million of construction-in-progress expenditures related to new restaurants expected to open in fiscal 2010. In addition, total capital expenditures related to existing restaurants and expenditures for restaurant and corporate systems were $12.1 million and $0.6 million, respectively.
We filed a shelf registration statement on Form S-3 with the U.S. Securities and Exchange Commission (“SEC”) on January 7, 2010. The statement was declared effective by the SEC on January 28, 2010, and permits us to raise capital from time to time through the offer and sale of various types of securities not to exceed an aggregate value of $75 million. We do not have any immediate intentions or commitments to sell securities. The terms of any future offering of securities would be established at the time of such offering subject to market conditions. Any offering of securities covered by the shelf registration statement will be made only by means of a written prospectus and prospectus supplement. In addition, the Form S-3 also included the registration of 3,801,730 shares of common stock previously acquired by certain shareholders from the Company in various transactions several years ago. We have registered those shares to fulfill our contractual obligations under a registration rights agreement with those shareholders.
53
Table of Contents
On October 17, 2007, we established a $25 million unsecured revolving line of credit with a major financial institution (the “Line of Credit”). The Line of Credit expires on September 30, 2012, and may be used for working capital and other general corporate purposes. The Line of Credit was increased to $45 million during the first quarter of 2008. We expect to utilize the Line of Credit principally for letters of credit that are required to support certain of our self insurance programs and for working capital and construction requirements as may be necessary from time to time. As of December 29, 2009, there were borrowings of $5.0 million outstanding under the Line of Credit and there were outstanding letters of credit totaling approximately $3.6 million. Any borrowings under the Line of Credit will bear interest at the financial institution’s prime rate or at LIBOR plus a percentage not to exceed 1.375% based on a Lease Adjusted Leverage Ratio as defined in the Line of Credit agreement. The Line of Credit agreement also requires compliance with a Fixed Charge Coverage Ratio and the Total Lease Adjusted Leverage Ratio. At December 29, 2009, we were in compliance with these covenants. Any interest on the Line of Credit will be payable quarterly and all related borrowings must be repaid on or before September 30, 2012. While we have the Line of Credit in place and it can be currently drawn upon, in the event that global credit market conditions further deteriorate, it is possible that creditors could place limitations or restrictions on the ability of borrowers in general to draw on existing credit facilities. At this time, however, we have no indication that any such limitations or restrictions are likely to occur.
Our capital expenditure plan for 2010 will continue to be significant as we currently plan to open as many as 10 to 11 new restaurants during fiscal 2010 in addition to our necessary maintenance and key initiative related capital expenditures. As of March 3, 2010, we have entered into six signed leases or purchase agreements for those new restaurants, and we expect to enter into additional leases for new restaurant locations. We currently anticipate our capital expenditures for 2010, gross of any allowances we may receive from landlords, to be approximately $60 million related to the construction of new restaurants, the reinvestment in some of our older restaurants as well as normal maintenance capital expenditures and the investment in toolsets and infrastructure. We expect to fund our expected capital expenditures for 2010 with current cash and investment balances, cash flow from operations and landlord contributions. During fiscal 2010, we are currently expecting to obtain approximately $6 million of landlord construction contributions. Our future cash requirements will depend on many factors, including the pace of expansion, real estate markets, construction costs, the specific sites selected for new restaurants, and the nature of the lease and associated financing arrangements negotiated with landlords.
On April 16, 2009, General Growth Properties, Inc. (“GGP”) announced that it was voluntarily seeking relief to reduce and restructure its debts under Chapter 11 of the United States Bankruptcy Code (“Chapter 11 filing”). Included in its bankruptcy filing are approximately 158 regional shopping centers owned by GGP and certain other GGP subsidiaries. GGP stated that it intends to work with its constituencies to emerge from bankruptcy as quickly as possible and that the day-to-day operations and business of all of our shopping centers and other properties will continue as usual. We currently operate six restaurants in GGP properties that were included in their Chapter 11 filing. We currently do not have any outstanding landlord allowances from GGP. However, as of December 29, 2009, we have one outstanding tenant improvement allowances from a different landlord in the amount of $1.2 million for one of our restaurants. Our restaurant lease allows us to offset or reduce our rent payable in the event that our tenant improvement allowances cannot be collected, as agreed upon in our leases. We do not believe that this matter will have a material impact on our overall liquidity. We may also pursue other legal remedies in this respect.
During December 2009, we reached a confidential settlement agreement for the full liquidation of our auction rate securities (“ARS”) investment portfolio with our former broker-dealer for the portfolio. Under the terms of the settlement, we received approximately $27.4 million in cash (including accrued interest) in exchange for the entire remaining ARS investment portfolio and recorded a pre-tax loss on investment settlement of approximately $1.7 million. In addition, the settlement provides us with additional recoveries, depending upon the performance of the ARS market during the next three years. The cash received in conjunction with the settlement was invested in various financial institutions’ money market funds as of year end. Accordingly, as of December 29, 2009, our investments consisted of money market funds with a cost or fair value of $32.4 million. These investments are considered cash equivalents and included as current assets on the Consolidated Balance Sheets.
54
Table of Contents
We currently believe that our projected cash flow from operations, cash and cash equivalents on hand, agreed-upon tenant improvement allowances and our $45 million credit facility, should be sufficient, in the aggregate, to finance our planned capital expenditures and other operating activities through the next 12 months. Our base of established restaurant operations is not yet large enough to generate enough cash flow from operations to totally fund our planned expansion at the rate that it is currently contemplated over the long run. Accordingly, we will continue to actively monitor overall conditions in the capital markets with respect to the potential sources and timing of additional financing for our planned future expansion. However, there can be no assurance that such financing will be available when required or available on terms acceptable to us. If we are unable to secure additional capital resources, we may be required to reduce our longer-term planned rate of expansion.
OFF-BALANCE SHEET ARRANGEMENTS
We do not participate in transactions that generate relationships with unconsolidated entities or financial partnerships, such as entities often referred to as structured finance or variable interest entities (“VIEs”), which would have been established for the purpose of facilitating off-balance sheet arrangements or other contractually narrow limited purposes. As of December 29, 2009, we are not involved in any off-balance sheet arrangements.
IMPACT OF INFLATION
Our profitability is dependent, among other things, on our ability to anticipate and react to changes in the costs of key operating resources, including food and other raw materials, labor, energy and other supplies and services. Substantial increases in costs and expenses could impact our operating results to the extent that such increases cannot be passed along to our restaurant guests. While we have taken steps to enter into agreements for some of the commodities used in our restaurant operations, there can be no assurance that future supplies and costs for such commodities will not fluctuate due to weather and other market conditions outside of our control. We are currently unable to contract for certain commodities such as fluid dairy items for long periods of time. Consequently, such commodities can be subject to unforeseen supply and cost fluctuations. The impact of inflation on food, labor, energy and occupancy costs can significantly affect the profitability of our restaurant operations.
Many of our restaurant employees are paid hourly rates related to the federal or state minimum wage. In fiscal 2007, Congress enacted an increase in the federal minimum wage implemented in three phases, beginning in fiscal 2007 and concluding in fiscal 2009. In addition, numerous state and local governments increased the minimum wage within their jurisdictions. Additionally, a general shortage in the availability of qualified restaurant management and hourly workers in certain geographical areas in which we operate has caused related increases in the costs of recruiting and compensating such employees. Certain operating costs, such as taxes, insurance and other outside services continue to increase with the general level of inflation and may also be subject to other cost and supply fluctuations outside of our control.
While we have been able to partially offset inflation and other changes in the costs of key operating resources by gradually increasing prices for our menu items, coupled with more efficient purchasing practices, productivity improvements and greater economies of scale, there can be no assurance that we will be able to continue to do so in the future. From time to time, competitive conditions could limit our menu pricing flexibility. In addition, macroeconomic conditions that impact consumer discretionary spending for food away from home could make additional menu price increases imprudent. There can be no assurance that all of our future cost increases can be offset by higher menu prices, or that higher menu prices will be accepted by our restaurant guests without any resulting changes in their visit frequencies or purchasing patterns. Many of the leases for our restaurants provide for contingent rent obligations based on a percentage of sales. As a result, rent expense will absorb a proportionate share of any menu price increases in our restaurants. There can be no assurance that we will continue to generate increases in comparable restaurant sales in amounts sufficient to offset inflationary or other cost pressures.
55
Table of Contents
SEASONALITY AND ADVERSE WEATHER
Our business is subject to seasonal fluctuations. Our results of operations have historically been impacted by seasonality, which directly impacts tourism at our coastal California locations. The summer months (June through August) have traditionally been higher volume periods than other periods of the year. Additionally, in 2007, we began opening new restaurants beyond the West Coast and Texas to other Midwest and Eastern states. Accordingly, these restaurants will be impacted by weather and other seasonal factors that typically impact other restaurant operations in those regions. Holidays (and shifts in the holiday calendar), severe winter weather, hurricanes, thunderstorms and similar conditions may impact restaurant sales volumes seasonally in some of the markets where we operate. Many of our restaurants are located in or near shopping centers and malls that typically experience seasonal fluctuations in sales. Quarterly results have been and will continue to be significantly impacted by the timing of new restaurant openings and their associated restaurant opening expenses. As a result of these and other factors, our financial results for any given quarter may not be indicative of the results that may be achieved for a full fiscal year.
CRITICAL ACCOUNTING POLICIES
Critical accounting policies require the greatest amount of subjective or complex judgments by management and are important to portraying our financial condition and results of operations. Judgments or uncertainties regarding the application of these policies may result in materially different amounts being reported under different conditions or using different assumptions. We consider the following policies to be the most critical in understanding the judgments that are involved in preparing our consolidated financial statements.
Fair Value of Investments
We measure all available-for-sale or non-current investments at fair value in accordance with fair value measurements prescribed by generally accepted accounting principles. We believe that the valuation models and methodologies provided by a third party, who uses “Level 3” inputs (whereby the inputs for the asset or liability are generally less observable from objective sources), provides us with the appropriate basis to estimate fair value for investments that are not currently trading on the open market. In accordance with generally accepted accounting principles, we recognize temporary changes in the fair value of our investments as unrealized holding gains or losses recorded in “other comprehensive income (loss),” which is a component of shareholders’ equity and does not affect net income for the applicable accounting period. For declines in fair value that are below our carrying value and deemed to be other-than-temporary, we would record a charge against net earnings.
Property and Equipment
We record all property and equipment at cost. Property and equipment accounting requires estimates of the useful lives for the assets for depreciation purposes and selection of depreciation methods. We believe the useful lives reflect the actual economic life of the underlying assets. We have elected to use the straight-line method of depreciation over the estimated useful life of an asset or the primary lease term of the respective lease, whichever is shorter. Renewals and betterments that materially extend the useful life of an asset are capitalized while maintenance and repair costs are charged to operations as incurred. Judgment is often required in the decision to distinguish between an asset which qualifies for capitalization versus an expenditure which is for maintenance and repairs. When property and equipment are sold or otherwise disposed of, the asset account and related accumulated depreciation or amortization accounts are relieved, and any gain or loss is included in earnings. Additionally, interest capitalized for new restaurant construction is included in “Property and equipment, net” on the Consolidated Balance Sheets.
Impairment of Long-Lived Assets
We assess potential impairments of our long-lived assets whenever events or changes in circumstances indicate that the carrying value of the assets may not be recoverable. Factors considered include, but are not limited to,
56
Table of Contents
significant underperformance relative to expected historical or projected future operating results; significant changes in the manner of use of the acquired assets or the strategy for the overall business; and, significant negative industry or economic trends. The recoverability is assessed in most cases by comparing the carrying value of the asset to the undiscounted cash flows expected to be generated by the asset. This assessment process requires the use of estimates and assumptions regarding future cash flows and estimated useful lives, which are subject to a significant degree of judgment. If these assumptions change in the future, we may be required to record impairment charges for these assets. As of December 29, 2009, no impairment indicators have been identified.
Self Insurance
We are self-insured for a portion of our employee workers’ compensation program and our general liability program. We maintain coverage with a third party insurer to limit our total exposure for these programs. The accrued liability associated with these programs are based on our estimate of the ultimate costs to settle known claims as well as claims incurred but not yet reported to us (“IBNR claims”) as of the balance sheet date. Our estimated liability is not discounted and is based on information provided by our insurance broker and insurer, combined with our judgments regarding a number of assumptions and factors, including the frequency and severity of claims, our claims development history, case jurisdiction, related legislation, and our claims settlement practice. Significant judgment is required to estimate IBNR claims as parties have yet to assert such claims. If actual claims trends, including the severity or frequency of claims, differ from our estimates, our financial results could be significantly impacted.
Income Taxes
We provide for income taxes based on our estimate of federal and state tax liabilities. Our estimates include, but are not limited to, effective state and local income tax rates, allowable tax credits for items such as FICA taxes paid on reported tip income and estimates related to depreciation expense allowable for tax purposes. We usually file our income tax returns several months after our fiscal year-end. We file our tax returns with the advice and compilation of tax consultants. All tax returns are subject to audit by federal and state governments, usually years after the returns are filed, and could be subject to differing interpretation of the tax laws.
Deferred tax accounting requires that we evaluate net deferred tax assets to determine if these assets will more likely than not be realized in the foreseeable future. This test requires projection of our taxable income into future years to determine if there will be taxable income sufficient to realize the tax assets (future tax deductions and FICA tax credit carryforwards). The preparation of the projections requires considerable judgment and is subject to change to reflect future events and changes in the tax laws.
The accounting for uncertainty in tax positions requires that we recognize the impact of a tax position in our consolidated financial statements if that position is more likely than not of being sustained on audit, based on the technical merits of the position. We recognize interest and penalties related to uncertain tax positions in income tax expense. As of December 29, 2009, unrecognized tax benefits recorded was approximately $145,000.
Leases
We lease the majority of our restaurant locations. We account for our leases in accordance with generally accepted accounting principles, which require that our leases be evaluated and classified as operating or capital leases for financial reporting purposes. The term used for this evaluation includes renewal option periods only in instances in which the exercise of the renewal option can be reasonably assured and failure to exercise such option would result in an economic penalty. All of our restaurant leases are classified as operating leases. We disburse cash for leasehold improvements, furniture and fixtures and equipment to build out and equip our leased premises. Tenant improvement allowance incentives may be available to partially offset the cost of developing and opening the related restaurants, pursuant to agreed-upon terms in our leases. Tenant improvement allowances can take the form of cash payments upon the opening of the related restaurants, full or partial credits against
57
Table of Contents
minimum or percentage rents otherwise payable by us or a combination thereof. All tenant improvement allowances received by us are recorded as a deferred rent obligation and amortized over the term of the lease. The related cash received from the landlord is reflected as “landlord contribution for tenant improvements, net” within operating activities of our Consolidated Statements of Cash Flows.
The lease term used for straight-line rent expense is calculated from the date we obtain possession of the leased premises through the lease termination date. We expense rent from possession date through restaurant open date as preopening expense. Once a restaurant opens for business, we record straight-line rent over the lease term plus contingent rent to the extent it exceeded the minimum rent obligation per the lease agreement.
There is potential for variability in the rent holiday period, which begins on the possession date and ends on the restaurant open date, during which no cash rent payments are typically due under the terms of the lease. Factors that may affect the length of the rent holiday period generally relate to construction related delays. Extension of the rent holiday period due to delays in restaurant opening will result in greater preopening rent expense recognized during the rent holiday period and lesser occupancy expense during the rest of the lease term (post-opening).
For leases that contain rent escalations, we record the total rent payable during the lease term, as determined above, on the straight-line basis over the term of the lease (including the rent holiday period beginning upon our possession of the premises), and record the difference between the minimum rents paid and the straight-line rent as a lease obligation. Certain leases contain provisions that require additional rental payments based upon restaurant sales volume (“contingent rentals”). Contingent rentals are accrued each period as the liabilities are incurred, in addition to the straight-line rent expense noted above. This results in some variability in occupancy expense as a percentage of revenues over the term of the lease in restaurants where we pay contingent rent.
Management makes judgments regarding the probable term for each restaurant property lease, which can impact the classification and accounting for a lease as capital or operating, the rent holiday and/or escalations in payments that are taken into consideration when calculating straight-line rent and the term over which leasehold improvements for each restaurant are amortized. These judgments may produce materially different amounts of depreciation, amortization and rent expense than would be reported if different assumed lease terms were used.
Stock-Based Compensation
We have two stock-based compensation plans — the 2005 Equity Incentive Plan and the 1996 Stock Option Plan — under which we may issue shares of our common stock to employees, officers, directors and consultants. Upon effectiveness of the 2005 Equity Incentive Plan, the 1996 Stock Option Plan was closed for purposes of new grants. Both of these plans have been approved by our shareholders. Under the 2005 Equity Incentive Plan, we have granted incentive stock options, non-qualified stock options, and restricted stock units. Stock options generally vest at 20% per year or cliff vest, either ratably in years three through five or 100% in year five and expire ten years from date of grant.
Beginning in 2007, substantially all of our restaurant general managers, executive kitchen managers, culinary training managers and our area and regional restaurant directors are eligible to participate in an equity-based incentive program called the BJ’s Gold Standard Stock Ownership Program (the “GSSOP”) under our 2005 Equity Incentive Plan. In November 2007, we expanded our GSSOP eligibility to also include certain brewery personnel. The GSSOP is a longer-term equity incentive program that utilizes Company restricted stock units (“RSUs”). The GSSOP is dependent on each participant’s extended service with us in their respective positions (five years) and their achievement of certain agreed-upon performance objectives during that service period.
Beginning in 2008, we also issued RSUs as a component of the annual equity grant award to officers and other employees under our 2005 Equity Incentive Plan. These grants are non-GSSOP grants. Under our 2005 Equity
58
Table of Contents
Incentive Plan we have issued approximately 650,000 RSUs as of December 29, 2009, including both GSSOP and non-GSSOP grants. The fair value of the RSUs is the quoted market value of our common stock on the date of grant. The fair value of each RSU is expensed over the period during which its related restrictions are expected to lapse (i.e., generally five years). RSUs generally vest at 20% per year for non-GSSOP or other RSU grantees and cliff vest at 100% after five years for GSSOP participants.
We account for these plans in accordance with generally accepted accounting principles under the fair value recognition provisions, using the modified-prospective-transition method. Compensation expense recognized in the 52 weeks ended December 29, 2009 and December 30, 2008 include (a) compensation expense for all share-based payments granted prior to, but not yet vested as of January 4, 2006, based on the grant date fair value estimated in accordance with the original provisions and (b) compensation expense for all share-based payments granted subsequent to January 4, 2006, based on the grant date fair value estimated in accordance with the revised provisions under generally accepted accounting principles. We are required to make certain assumptions and judgments regarding the grant date fair value. These judgments include expected volatility, risk free interest rate, expected option life, dividend yield and vesting percentage. These estimations and judgments are determined by us using many different variables that, in many cases, are outside of our control. The changes in these variables or trends, including stock price volatility and risk free interest rate, may significantly impact the grant date fair value resulting in a significant impact to our financial results. The cash flows tax benefits resulting from tax deductions in excess of the compensation cost recognized for those options (excess tax benefits) are required to be classified as financing cash flows.
IMPACT OF RECENT ACCOUNTING PRONOUNCEMENTS
In June 2009, the Financial Accounting Standards Board (“FASB”) approved the FASB Accounting Standards Codification (the “Codification”) as the single source of authoritative nongovernmental generally accepted accounting principles (“GAAP”). All existing accounting standard literature, promulgated by the FASB, American Institute of Certified Public Accountants, Emerging Issues Task Force and other authoritative sources, excluding guidance from the Securities and Exchange Commission (“SEC”), will be superseded by the Codification. All non-grandfathered, non-SEC accounting literature not included in the Codification will become non-authoritative. The Codification does not change GAAP, but instead introduces a new structure that will combine all authoritative standards into a comprehensive, topically organized online database. The Codification became effective for interim and annual periods ending after September 15, 2009. There is no change to the content of our consolidated financial statements or disclosures as a result of implementing the Codification.
In May 2009, the FASB issued a statement on subsequent events (Codification Topic No. 855, Subsequent Events), which establishes general standards of accounting for and disclosure of events that occur after the balance sheet date, but before the financial statements are issued or available to be issued (“subsequent events”). This statement requires disclosure of the date through which the entity has evaluated subsequent events and the basis for that date. For public entities, this is the date the financial statements are issued. This statement does not apply to subsequent events or transactions that are within the scope of other GAAP and will not result in significant changes in the subsequent events reported by us. This statement is effective for interim or annual periods ending after June 15, 2009. We implemented the provisions of this statement during the quarter ended June 30, 2009. We evaluated for subsequent events through the issuance date of our consolidated financial statements. No recognized or non-recognized subsequent events were noted.
In April 2009, the FASB issued guidance on the recognition and presentation of other-than-temporary impairments, which is included in Codification Topic No. 320, Debt and Equity Securities. This guidance amends the other-than-temporary guidance in U.S. GAAP for debt securities, where changes in fair value are not regularly recognized in earnings, to make the guidance more operational and to improve the presentation and disclosure of other-than-temporary impairments on debt securities in the financial statements. This guidance also provides for evaluating whether an impairment of a debt security is other than temporary and for determining the amount of an other-than-temporary impairment recognized in earnings and other comprehensive income. Under this guidance, if management intends to sell an impaired debt security, or it is more likely than not that it will be required to sell the
59
Table of Contents
security before recovery, all other-than-temporary impairments must be separated into two components: (i) the amount related to credit losses (which is recorded in the current period earnings) and (ii) the amount related to all other factors (which is recorded in other comprehensive income). Both components are required to be shown in the statement of income. This guidance is effective for interim and annual reporting periods ending after June 15, 2009. We have applied the guidance and disclosure requirements as it applies to our investments during the first quarter of fiscal 2009 and there was no impact on our consolidated financial statements.
In April 2009, the FASB issued guidance on the interim disclosures about fair value of financial instruments, which is included in Codification Topic No. 825, Financial Instruments. This guidance extends the disclosure requirements regarding the fair value of financial instruments to interim financial statements of publically traded companies. This guidance is effective for interim reporting periods ending after June 15, 2009, and was adopted as of the beginning of our current fiscal year as our interim disclosure about the fair value of our financial instruments incorporates the related requirements.
CONTRACTUAL OBLIGATIONS AND COMMITMENTS
The following table summarizes our future estimated cash payments under existing contractual obligations as of December 29, 2009, including estimated cash payments due by period (in thousands).
| Payments Due by Period | |||||||||||||||
| Total | Less Than 1 Year |
2-3 Years | 4-5 Years | After 5 Years | |||||||||||
| Contractual Obligations | |||||||||||||||
| Operating leases (1) |
$ | 299,138 | $ | 19,787 | $ | 39,441 | $ | 38,500 | $ | 201,410 | |||||
| Purchase obligations (2) |
7,590 | 2,027 | 5,563 | – | – | ||||||||||
| Total |
$ | 306,728 | $ | 21,814 | $ | 45,004 | $ | 38,500 | $ | 201,410 | |||||
| Other Commercial Commitments |
|||||||||||||||
| Standby letters of credit |
$ | 3,610 | $ | 3,610 | $ | – | $ | – | $ | – | |||||
| Long-term debt obligations |
5,000 | – | 5,000 | – | – | ||||||||||
| Total |
$ | 8,610 | $ | 3,610 | $ | 5,000 | $ | – | $ | – | |||||
| (1) | For more detailed description of our operating leases, refer to Note 6 in the accompanying consolidated financial statements. |
| (2) | Amounts represent non-cancelable commitments for the purchase of goods and other services. |
Additionally, we have entered into lease agreements related to future restaurants with commencement dates subsequent to December 29, 2009. Our aggregate future commitment relating to these leases is $7.9 million and is not included in operating leases above.
ITEM 7A. QUANTITATIVE AND QUALITATIVE DISCLOSURES ABOUT MARKET RISK
The following discussion of market risks contains forward-looking statements. Actual results may differ materially from the following discussion based on general conditions in the financial and commodity markets.
Our market risk exposures are related to cash and cash equivalents and investments. We invest our excess cash in highly liquid short-term investments with maturities of two years or less as of the date of purchase. These investments are not held for trading or other speculative purposes. Changes in interest rates affect the investment income we earn on our investments and, therefore, impact our cash flows and results of operations. For the 52 weeks ended December 29, 2009, the average interest rate earned on cash and cash equivalents and investments was approximately 0.7%. As of December 29, 2009, our investment portfolio consisted of money market funds, totaling $32.4 million, held by institutional brokers, all of which are currently considered cash equivalents; cash balances may be in excess of FDIC insurance limits. We have not experienced any losses in these accounts and believe we are not exposed to significant risk on cash and cash equivalents.
60
Table of Contents
We purchase food and other commodities for use in our operations based upon market prices established with our suppliers. Many of the commodities purchased by us can be subject to volatility due to market supply and demand factors outside of our control, whether contracted for or not. To manage this risk in part, we attempt to enter into fixed price purchase commitments, with terms typically up to one year, for many of our commodity requirements. However, it may not be possible for us to enter into fixed-price contracts for certain commodities or we may choose not to enter into fixed price contracts for certain commodities. Dairy costs can also fluctuate due to government regulation. We believe that substantially all of our food and supplies are available from several sources, which helps to diversify our overall commodity cost risk. We also believe that we have some flexibility and ability to increase certain menu prices, or vary certain menu items offered, in response to food commodity price increases. Some of our commodity purchase arrangements may contain contractual features that limit the price paid by establishing certain price floors or caps. We do not use financial instruments to hedge commodity prices, since our purchase arrangements with suppliers, to the extent that we can enter into such arrangements, help control the ultimate cost that we pay.
ITEM 8. FINANCIAL STATEMENTS AND SUPPLEMENTARY DATA
See the Consolidated Financial Statements and other data attached hereto beginning on page F-1 of this report.
ITEM 9. CHANGES IN AND DISAGREEMENTS WITH ACCOUNTANTS ON ACCOUNTING AND FINANCIAL DISCLOSURE
None.
ITEM 9A. CONTROLS AND PROCEDURES
Evaluation of Disclosure Controls and Procedures
Under the supervision and with the participation of our management, including the Chief Executive Officer and Chief Financial Officer, we have evaluated the effectiveness of our disclosure controls and procedures pursuant to Rules 13a-15 and 15d-15 promulgated under the Securities Exchange Act of 1934 as amended, as of the end of the period covered by this report. Based on that evaluation, the Chief Executive Officer and Chief Financial Officer have concluded that these disclosure controls and procedures are effective.
Changes in Internal Control Over Financial Reporting
There has not been any change in our internal control over financial reporting (as such term is defined in Rules 13a-15(f) and 15d-15(f) under the Exchange Act) during our fourth fiscal quarter that has materially affected, or is reasonably likely to materially affect, our internal control over financial reporting.
Management’s Report on Internal Control Over Financial Reporting
Our management is responsible for establishing and maintaining adequate internal control over financial reporting, as such term is defined in Exchange Act Rules 13a-15(f) and 15d-15(f). Under the supervision and with the participation of our management, including our Chief Executive Officer and Chief Financial Officer, we conducted an evaluation of the effectiveness of our internal control over financial reporting as of December 29, 2009, based on the framework in Internal Control — Integrated Framework issued by the Committee of Sponsoring Organizations of the Treadway Commission (“COSO”). Based on that evaluation, our management concluded that our internal control over financial reporting was effective as of December 29, 2009.
Ernst & Young LLP, the independent registered public accounting firm that audited the financial statements included in this Annual Report on Form 10-K, has issued an attestation report on our internal control over financial reporting.
61
Table of Contents
Report of Independent Registered Public Accounting Firm
To the Board of Directors and Shareholders
BJ’s Restaurants, Inc.
We have audited BJ’s Restaurants, Inc.’s internal control over financial reporting as of December 29, 2009, based on criteria established in Internal Control — Integrated Framework issued by the Committee of Sponsoring Organizations of the Treadway Commission (the COSO criteria). BJ’s Restaurants, Inc.’s management is responsible for maintaining effective internal control over financial reporting and for its assessment of the effectiveness of internal control over financial reporting included in the accompanying Management’s Report on Internal Control Over Financial Reporting. Our responsibility is to express an opinion on the Company’s internal control over financial reporting based on our audit.
We conducted our audit in accordance with the standards of the Public Company Accounting Oversight Board (United States). Those standards require that we plan and perform the audit to obtain reasonable assurance about whether effective internal control over financial reporting was maintained in all material respects. Our audit included obtaining an understanding of internal control over financial reporting, assessing the risk that a material weakness exists, testing and evaluating the design and operating effectiveness of internal control based on the assessed risk, and performing such other procedures as we considered necessary in the circumstances. We believe that our audit provides a reasonable basis for our opinion.
A company’s internal control over financial reporting is a process designed to provide reasonable assurance regarding the reliability of financial reporting and the preparation of financial statements for external purposes in accordance with generally accepted accounting principles. A company’s internal control over financial reporting includes those policies and procedures that (1) pertain to the maintenance of records that, in reasonable detail, accurately and fairly reflect the transactions and dispositions of the assets of the company; (2) provide reasonable assurance that transactions are recorded as necessary to permit preparation of financial statements in accordance with generally accepted accounting principles, and that receipts and expenditures of the company are being made only in accordance with authorizations of management and directors of the company; and, (3) provide reasonable assurance regarding prevention or timely detection of unauthorized acquisition, use, or disposition of the company’s assets that could have a material effect on the financial statements.
Because of its inherent limitations, internal control over financial reporting may not prevent or detect misstatements. Also, projections of any evaluation of effectiveness to future periods are subject to the risk that controls may become inadequate because of changes in conditions, or that the degree of compliance with the policies or procedures may deteriorate.
In our opinion, BJ’s Restaurants, Inc. maintained, in all material respects, effective internal control over financial reporting as of December 29, 2009, based on the COSO criteria.
We also have audited, in accordance with the standards of the Public Company Accounting Oversight Board (United States), the consolidated balance sheets of BJ’s Restaurants, Inc. as of December 29, 2009 and December 30, 2008, and the related consolidated statements of income, shareholders’ equity, and cash flows for each of the three years in the period ended December 29, 2009 of BJ’s Restaurants, Inc. and our report dated March 5, 2010 expressed an unqualified opinion thereon.
/s/ Ernst & Young LLP
Irvine, California
March 5, 2010
62
Table of Contents
Inherent Limitations on Effectiveness of Controls
Our management, including the Chief Executive Officer and Chief Financial Officer, does not expect that our disclosure controls or our internal control over financial reporting will prevent or detect all error and all fraud. A control system, no matter how well designed and operated, can provide only reasonable, not absolute, assurance that the control system’s objectives will be met. The design of a control system must reflect the fact that there are resource constraints, and the benefits of controls must be considered relative to their costs. Further, because of the inherent limitations in all control systems, no evaluation of controls can provide absolute assurance that misstatements due to error or fraud will not occur or that all control issues and instances of fraud, if any, within the Company have been detected. These inherent limitations include the realities that judgments in decision-making can be faulty and that breakdowns can occur because of simple error or mistake. Controls can also be circumvented by the individual acts of some persons, by collusion of two or more people, or by management override of the controls. The design of any system of controls is based in part on certain assumptions about the likelihood of future events, and there can be no assurance that any design will succeed in achieving its stated goals under all potential future conditions. Projections of any evaluation of control effectiveness to future periods are subject to risks. Over time, controls may become inadequate because of changes in conditions or deterioration in the degree of compliance with policies or procedures.
None.
ITEM 10. DIRECTORS, EXECUTIVE OFFICERS AND CORPORATE GOVERNANCE
We have adopted a Code of Business Ethics and a Code of Business Conduct to promote honest and ethical conduct of our business, professional and personal relationships. The Code of Business Ethics covers all executives, including our principal executive officer and principal financial and accounting officer. The Code of Business Conduct is applicable to all directors, executives and other employees. A copy of both the Code of Business Ethics and Code of Business Conduct is available on our website (http://www.bjsrestaurants.com). We intend to post any amendments to or waivers from our Code of Business Ethics and Code of Business Conduct at this website location.
Information with respect to our executive officers is included in Part I, Item 1 of this Annual Report on Form 10-K. Other information required by this Item is hereby incorporated by reference to the information contained in the Proxy Statement relating to the Annual Meeting of Shareholders, which we expect to be filed with the Securities and Exchange Commission no later than 120 days after the close of the year ended December 29, 2009.
ITEM 11. EXECUTIVE COMPENSATION
The information required by this Item is incorporated herein by reference to the information contained in the Proxy Statement relating to the Annual Meeting of Shareholders, which we expect to file with the Securities and Exchange Commission no later than 120 days after the close of the year ended December 29, 2009.
ITEM 12. SECURITY OWNERSHIP OF CERTAIN BENEFICIAL OWNERS AND MANAGEMENT AND RELATED SHAREHOLDER MATTERS
The information required by this Item is incorporated herein by reference to the information contained in the Proxy Statement relating to the Annual Meeting of Shareholders, which we expect to file with the Securities and Exchange Commission no later than 120 days after the close of the year ended December 29, 2009.
63
Table of Contents
ITEM 13. CERTAIN RELATIONSHIPS AND RELATED TRANSACTIONS AND DIRECTOR INDEPENDENCE
The information required by this Item is incorporated herein by reference to the information contained in the Proxy Statement relating to the Annual Meeting of Shareholders, which we expect to file with the Securities and Exchange Commission no later than 120 days after the close of the year ended December 29, 2009.
See Part II, Item 5 — “Market for Registrant’s Common Equity, Related Shareholder Matters, and Issuer Purchases of Equity Securities — Equity Compensation Plan Information” for certain information regarding our equity compensation plans.
ITEM 14. PRINCIPAL ACCOUNTING FEES AND SERVICES
The information required by this Item is incorporated herein by reference to the information contained in the Proxy Statement relating to the Annual Meeting of Shareholders, which we expect to file with the Securities and Exchange Commission no later than 120 days after the close of the year ended December 29, 2009.
ITEM 15. EXHIBITS AND FINANCIAL STATEMENT SCHEDULES
(a) (1) CONSOLIDATED FINANCIAL STATEMENTS
The following documents are contained in Part II, Item 8 of this Annual Report on Form 10-K:
Report of Independent Registered Public Accounting Firm
Consolidated Balance Sheets at December 29, 2009 and December 30, 2008
Consolidated Statements of Income for each of the three fiscal years in the period ended December 29, 2009
Consolidated Statements of Shareholders’ Equity for each of the three fiscal years in the period ended December 29, 2009
Consolidated Statements of Cash Flows for each of the three fiscal years in the period ended December 29, 2009
Notes to the Consolidated Financial Statements
(2) FINANCIAL STATEMENT SCHEDULES
All schedules are omitted because they are not applicable or the required information is shown in the Consolidated Financial Statements or notes thereto.
64
Table of Contents
(3) EXHIBITS
| Exhibit Number |
Description | |
| 3.1 | Amended and Restated Articles of Incorporation of the Company, as amended, incorporated by reference to Exhibit 3.1 to the Registration Statement on Form SB-2 filed with the Securities and Exchange Commission on June 28, 1996, as amended by the Company’s Registration Statement on Form SB-2/A filed with the Commission on August 1, 1996 and the Company’s Registration Statement on Form SB-2A filed with the Commission on August 22, 1996 (File No. 3335182-LA) (as amended, the “Registration Statement”). | |
| 3.2 | Amended and Restated Bylaws of the Company, incorporated by reference to Exhibits 3.1 to the Form 8-K filed on June 4, 2007. | |
| 3.3 | Certificate of Amendment of Articles of Incorporation incorporated by reference to Exhibit 3.3 of the 2004 Annual Report. | |
| 4.1 | Specimen Common Stock Certificate of the Company, incorporated by reference to Exhibit 4.1 of the Registration Statement. | |
| 10.1** | Summary of Compensation for Non-Employee Directors incorporated by reference to Exhibit 10.1 of the Form 10-K for the year ended December 30, 2008. | |
| 10.2 | Intentionally omitted. | |
| 10.3** | Form of Indemnification Agreement with Officers and Directors, incorporated by reference to Exhibit 10.6 of the Registration Statement. | |
| 10.4** | BJ’s Restaurants, Inc. Amended and Restated 1996 Stock Option Plan, incorporated by reference to Exhibit 10.4 of the 2004 Annual Report. | |
| 10.5** | BJ’s Restaurants, Inc. Amended 2005 Equity Incentive Plan, incorporated by reference to Exhibit 10.1 of the Form 8-K filed September 9, 2009. | |
| 10.6** | Stock Option Agreement for Executive Officers and Employees under the 2005 Equity Incentive Plan, incorporated by reference to Exhibit 10.3 of the Form 8-K filed July 1, 2005. | |
| 10.7** | Executive Officers and Employee Grant Notice under the 2005 Equity Incentive Plan, incorporated by reference to Exhibit 10.4 of the Form 8-K filed July 1, 2005. | |
| 10.8** | Stock Option Agreement for Non-Employee Directors under the 2005 Equity Incentive Plan, incorporated by reference to Exhibit 10.8 of the Form 10-K for the year ended January 3, 2006. | |
| 10.9** | Non-Employee Director Grant Notice under the 2005 Equity Incentive Plan, incorporated by reference to Exhibit 10.9 of the Form 10-K for the year ended January 3, 2006. | |
| 10.10 | Registration Rights Agreement, incorporated by reference to Exhibit 4.2 of the Form S-3 Registration Statement filed on March 4, 2009. | |
| 10.11 | Intentionally omitted. | |
| 10.12** | Separation Agreement and General Release, dated December 17, 2008, between the Company and Paul A. Motenko, incorporated by reference to Exhibit 10.12 of the Form 10-K for the year ended December 30, 2008. | |
| 10.13** | Separation Agreement and General Release, dated December 17, 2008, between the Company and Jeremiah J. Hennessey, incorporated by reference to Exhibit 10.13 of the Form 10-K for the year ended December 30, 2008. | |
| 10.16** | Employment Agreement, dated September 6, 2005, between the Company and Gregory S. Levin, employed as Chief Financial Officer, incorporated by reference to Exhibit 10.1 of the Form 10-Q filed on November 3, 2005. | |
65
Table of Contents
| Exhibit Number |
Description | |
| 10.17** | Form of Restricted Stock Unit Agreement under the 2005 Equity Incentive Plan, incorporated by reference to Exhibit 10.17 of the Form 10-K filed on March 13, 2007. | |
| 10.18** | Employment Agreement, dated April 12, 2009, between the Company and Matthew J. Kimble, incorporated by reference to Exhibit 10.1 to the Form 10-Q filed on August 4, 2009. | |
| 10.19** | Form of Employee Non-Qualified Stock Option Agreement under the 2005 Equity Incentive Plan, incorporated by reference to Exhibit 10.1 to the Form 10-Q filed on October 31, 2006. | |
| 10.20** | Summary of BJ’s Restaurants, Inc. Performance Incentive Plan, incorporated by reference to Exhibit 10.20 of the Form 10-K filed on March 13, 2007. | |
| 10.21** | Employment Agreement, dated January 19, 2009, between the Company and Wayne L. Jones, employed as Executive Vice President and Chief Restaurant Operations Officer, incorporated by reference to Exhibit 10.1 to Form 10-Q filed on May 1, 2009. | |
| 10.24** | Employment Agreement, dated January 12, 2005, between the Company and Gerald (Jerry) W. Deitchle, employed as Chief Executive Officer, incorporated by reference to Exhibit 10.28 of the Form 10-K filed on March 15, 2005. | |
| 10.25** | Employment Agreement, dated August 10, 2005, between the Company and John D. Allegretto, employed as Chief Supply Chain Officer, incorporated by reference to Exhibit 10.2 of the Form 10-Q filed on November 3, 2005. | |
| 10.26** | Employment Agreement, dated June 12, 2003, between the Company and Gregory S. Lynds, employed as Chief Development Officer, incorporated by reference to Exhibit 10.26 of the Form 10-K filed on or about March 14, 2008. | |
| 10.27** | Form of Restricted Stock Unit Agreement (non-GSSOP) under the 2005 Equity Incentive Plan, incorporated by reference to Exhibit 10.1 to the Form 10-Q filed on November 6, 2007. | |
| 10.28** | Form of Restricted Stock Unit Notice (non-GSSOP) under the 2005 Equity Incentive Plan, incorporated by reference to Exhibit 10.2 to the Form 10-Q filed on November 6, 2007. | |
| 10.29 | Line of Credit Agreement, dated October 17, 2007, between the Company and Bank of America, N.A., incorporated by reference to Exhibit 10.29 of the Form 10-K filed on or about March 14, 2008. | |
| 10.30 | Amendment No. 1 to Loan Agreement, dated March 18, 2008, between Bank of America, N.A. and the Company, incorporated by reference to Exhibit 10.1 to the Form 10-Q filed on May 9, 2008. | |
| 10.31 | Employment Agreement, dated July 1, 2008, between the Company and Matt Hood, incorporated by reference to Exhibit 10.1 to the Form 10-Q filed on August 5, 2008. | |
| 10.32 | Stock Purchase Agreement by and between the Company, The Jacmar Companies and William H. Tilley, dated February 22, 2001, incorporated by reference to Exhibit 10.12 of the Form 10-K filed on April 2, 2001. | |
| 10.33 | Facilitation Agreement between BJ Chicago LLC (“LLC”) and Chicago Pizza & Brewery, Inc., dated December 20, 2000, in furtherance of the Stock Purchase Agreement between LLC and ASSI, Inc, incorporated by reference to Exhibit 10.13 of the Form 10-K filed on April 2, 2001. | |
| 21 | List of Subsidiaries. | |
| 23.1 | Consent of Independent Registered Public Accounting Firm. | |
| 31 | Section 302 Certifications of Co-Chairman of the Board, Chief Executive Officer and Chief Financial Officer. | |
| 32 | Section 906 Certification of Co-Chairman of the Board, Chief Executive Officer and Chief Financial Officer. | |
| ** | Management contracts or compensation plans or arrangements in which directors or executive officers are eligible to participate. |
66
Table of Contents
Pursuant to the requirements of Section 13 or 15(d) of the Securities Exchange Act of 1934, the Registrant has duly caused this report to be signed on our behalf by the undersigned, thereunto duly authorized.
| BJ’S RESTAURANTS, INC. | ||||
| By: | /s/ Gerald W. Deitchle | |||
| March 5, 2010 | Gerald W. Deitchle Chairman, President and Chief Executive Officer (Principal Executive Officer) | |||
Pursuant to the requirements of the Securities and Exchange Act of 1934, this Report has been signed below by the following persons on behalf of the Registrant and in the capacities and on the dates indicated.
| Signature |
Capacity |
Date | ||
| By: /s/ GERALD W. DEITCHLE Gerald W. Deitchle |
Chairman, President and Chief Executive Officer (Principal Executive Officer) | March 5, 2010 | ||
| By: /s/ GREGORY S. LEVIN Gregory S. Levin |
Executive Vice President, Chief Financial Officer and Secretary (Principal Financial and Accounting Officer) | March 5, 2010 | ||
| By: /s/ PETER A. BASSI Peter A. Bassi |
Director | March 5, 2010 | ||
| By: /s/ LARRY D. BOUTS Larry D. Bouts |
Director | March 5, 2010 | ||
| By: /s/ SHANN M. BRASSFIELD Shann M. Brassfield |
Director | March 5, 2010 | ||
| By: /s/ JAMES A. DAL POZZO James A. Dal Pozzo |
Director | March 5, 2010 | ||
| By: /s/ JOHN F. GRUNDHOFER John F. Grundhofer |
Director | March 5, 2010 | ||
| By: /s/ WILLIAM L. HYDE William L. Hyde |
Director | March 5, 2010 | ||
| By: /s/ J. ROGER KING J. Roger King |
Director | March 5, 2010 | ||
67
Table of Contents
INDEX TO CONSOLIDATED FINANCIAL STATEMENTS
| Page | ||
| F-1 | ||
| Consolidated Balance Sheets at December 29, 2009 and December 30, 2008 |
F-2 | |
| F-3 | ||
| F-4 | ||
| F-5 | ||
| F-6 |
68
Table of Contents
REPORT OF INDEPENDENT REGISTERED PUBLIC ACCOUNTING FIRM
The Board of Directors and Shareholders
BJ’s Restaurants, Inc.
We have audited the accompanying consolidated balance sheets of BJ’s Restaurants, Inc. as of December 29, 2009 and December 30, 2008, and the related consolidated statements of income, shareholders’ equity and cash flows for each of the three years in the period ended December 29, 2009. These financial statements are the responsibility of the Company’s management. Our responsibility is to express an opinion on these financial statements based on our audits.
We conducted our audits in accordance with the standards of the Public Company Accounting Oversight Board (United States). Those standards require that we plan and perform the audit to obtain reasonable assurance about whether the financial statements are free of material misstatement. An audit includes examining, on a test basis, evidence supporting the amounts and disclosures in the financial statements. An audit also includes assessing the accounting principles used and significant estimates made by management, as well as evaluating the overall financial statement presentation. We believe that our audits provide a reasonable basis for our opinion.
In our opinion, the financial statements referred to above present fairly, in all material respects, the consolidated financial position of BJ’s Restaurants, Inc. at December 29, 2009 and December 30, 2008, and the consolidated results of its operations and its cash flows for each of the three years in the period ended December 29, 2009, in conformity with U.S. generally accepted accounting principles.
We also have audited, in accordance with the standards of the Public Company Accounting Oversight Board (United States), BJ’s Restaurants, Inc.’s internal control over financial reporting as of December 29, 2009, based on criteria established in Internal Control-Integrated Framework issued by the Committee of Sponsoring Organizations of the Treadway Commission and our report dated March 5, 2010 expressed an unqualified opinion thereon.
/s/ Ernst & Young LLP
Irvine, California
March 5, 2010
F-1
Table of Contents
CONSOLIDATED BALANCE SHEETS
(In thousands)
| December 29, 2009 |
December 30, 2008 |
||||||
| ASSETS |
|||||||
| Current assets: |
|||||||
| Cash and cash equivalents |
$ | 44,906 | $ | 8,852 | |||
| Accounts and other receivables |
13,193 | 10,084 | |||||
| Inventories |
3,994 | 3,606 | |||||
| Prepaids and other current assets |
2,423 | 4,500 | |||||
| Deferred income taxes |
9,782 | 8,680 | |||||
| Total current assets |
74,298 | 35,722 | |||||
| Property and equipment, net |
291,913 | 256,027 | |||||
| Goodwill |
4,673 | 4,673 | |||||
| Non-current investments |
– | 30,617 | |||||
| Notes receivable |
538 | 633 | |||||
| Other assets, net |
9,700 | 7,537 | |||||
| Total assets |
$ | 381,122 | $ | 335,209 | |||
| LIABILITIES AND SHAREHOLDERS’ EQUITY |
|||||||
| Current liabilities: |
|||||||
| Accounts payable |
$ | 11,978 | $ | 12,688 | |||
| Accrued expenses |
54,763 | 42,648 | |||||
| Total current liabilities |
66,741 | 55,336 | |||||
| Deferred income taxes |
17,941 | 11,803 | |||||
| Long-term debt |
5,000 | 9,500 | |||||
| Other liabilities |
38,461 | 26,293 | |||||
| Total liabilities |
128,143 | 102,932 | |||||
| Commitments and contingencies (Note 6) |
|||||||
| Shareholders’ equity: |
|||||||
| Preferred stock, 5,000 shares authorized, none issued or outstanding |
– | – | |||||
| Common stock, no par value, 60,000 shares authorized and 26,774 and 26,718 shares issued and outstanding as of December 29, 2009 and December 30, 2008, respectively |
166,807 | 166,649 | |||||
| Capital surplus |
20,231 | 17,108 | |||||
| Accumulated other comprehensive loss |
– | (4,383 | ) | ||||
| Retained earnings |
65,941 | 52,903 | |||||
| Total shareholders’ equity |
252,979 | 232,277 | |||||
| Total liabilities and shareholders’ equity |
$ | 381,122 | $ | 335,209 | |||
The accompanying notes are an integral part of these consolidated financial statements.
F-2
Table of Contents
CONSOLIDATED STATEMENTS OF INCOME
(In thousands, except per share data)
| Fiscal Year | ||||||||||
| 2009 | 2008 | 2007 | ||||||||
| Revenues |
$ | 426,707 | $ | 374,076 | $ | 316,095 | ||||
| Costs and expenses: |
||||||||||
| Cost of sales |
106,484 | 94,412 | 80,374 | |||||||
| Labor and benefits |
149,075 | 131,328 | 111,031 | |||||||
| Occupancy and operating |
92,204 | 80,212 | 61,906 | |||||||
| General and administrative |
29,484 | 27,264 | 26,008 | |||||||
| Depreciation and amortization |
24,119 | 19,184 | 14,421 | |||||||
| Restaurant opening |
5,327 | 7,384 | 6,940 | |||||||
| Loss on disposal of assets |
312 | 855 | 2,004 | |||||||
| Natural disaster and related |
– | 446 | – | |||||||
| Legal settlements and terminations |
– | 2,086 | – | |||||||
| Total costs and expenses |
407,005 | 363,171 | 302,684 | |||||||
| Income from operations |
19,702 | 10,905 | 13,411 | |||||||
| Other income (expense): |
||||||||||
| Interest income, net |
214 | 1,764 | 3,306 | |||||||
| Loss on investment settlement |
(1,709 | ) | – | – | ||||||
| Other income, net |
379 | 376 | 482 | |||||||
| Total other income (expense) |
(1,116 | ) | 2,140 | 3,788 | ||||||
| Income before income taxes |
18,586 | 13,045 | 17,199 | |||||||
| Income tax expense |
5,548 | 2,737 | 5,494 | |||||||
| Net income |
$ | 13,038 | $ | 10,308 | $ | 11,705 | ||||
| Net income per share: |
||||||||||
| Basic |
$ | 0.49 | $ | 0.39 | $ | 0.45 | ||||
| Diluted |
$ | 0.48 | $ | 0.39 | $ | 0.44 | ||||
| Weighted average number of shares outstanding: |
||||||||||
| Basic |
26,750 | 26,484 | 26,187 | |||||||
| Diluted |
27,147 | 26,749 | 26,880 | |||||||
The accompanying notes are an integral part of these consolidated financial statements.
F-3
Table of Contents
CONSOLIDATED STATEMENTS OF SHAREHOLDERS’ EQUITY
(In thousands)
| Common Stock | Capital Surplus |
Retained Earnings |
Accumulated Other Comprehensive (Loss) Income |
Total | ||||||||||||||||
| Shares | Amount | |||||||||||||||||||
| Balance, January 2, 2007 |
26,061 | $ | 164,592 | $ | 7,380 | $ | 30,890 | – | $ | 202,862 | ||||||||||
| Exercise of stock options, net |
297 | 1,006 | – | – | – | 1,006 | ||||||||||||||
| Stock-based compensation expense |
– | – | 3,190 | – | – | 3,190 | ||||||||||||||
| Tax benefit from stock option exercises |
– | – | 1,780 | – | – | 1,780 | ||||||||||||||
| Proceeds from equity transaction |
– | (20 | ) | – | – | – | (20 | ) | ||||||||||||
| Net income |
– | – | – | 11,705 | – | 11,705 | ||||||||||||||
| Balance, January 1, 2008 |
26,358 | 165,578 | 12,350 | 42,595 | – | 220,523 | ||||||||||||||
| Exercise of stock options, net |
360 | 1,071 | – | – | – | 1,071 | ||||||||||||||
| Stock-based compensation expense |
– | – | 3,605 | – | – | 3,605 | ||||||||||||||
| Tax benefit from stock option exercises |
– | – | 1,153 | – | – | 1,153 | ||||||||||||||
| Other comprehensive income: |
||||||||||||||||||||
| Net income |
– | – | – | 10,308 | – | 10,308 | ||||||||||||||
| Net unrealized loss on investments |
– | – | – | – | (4,383 | ) | (4,383 | ) | ||||||||||||
| Other comprehensive income |
– | – | – | – | – | 5,925 | ||||||||||||||
| Balance, December 30, 2008 |
26,718 | 166,649 | 17,108 | 52,903 | (4,383 | ) | 232,277 | |||||||||||||
| Exercise of stock options, net |
40 | 158 | – | – | – | 158 | ||||||||||||||
| Issuance of restricted stock units |
16 | – | – | – | – | – | ||||||||||||||
| Stock-based compensation expense |
– | – | 3,093 | – | – | 3,093 | ||||||||||||||
| Tax benefit from stock option exercises |
– | – | 30 | – | – | 30 | ||||||||||||||
| Other comprehensive income: |
||||||||||||||||||||
| Net income |
– | – | – | 13,038 | – | 13,038 | ||||||||||||||
| Reversal of net unrealized loss on investments |
– | – | – | – | 4,383 | 4,383 | ||||||||||||||
| Other comprehensive income |
– | – | – | – | – | 17,421 | ||||||||||||||
| Balance, December 29, 2009 |
26,774 | $ | 166,807 | $ | 20,231 | $ | 65,941 | $ | – | $ | 252,979 | |||||||||
The accompanying notes are an integral part of these consolidated financial statements.
F-4
Table of Contents
CONSOLIDATED STATEMENTS OF CASH FLOWS
(In thousands)
| Fiscal Year | ||||||||||||
| 2009 | 2008 | 2007 | ||||||||||
| Cash flows from operating activities: |
||||||||||||
| Net income |
$ | 13,038 | $ | 10,308 | $ | 11,705 | ||||||
| Adjustments to reconcile net income to net cash provided by operating activities: |
||||||||||||
| Depreciation and amortization |
24,119 | 19,184 | 14,421 | |||||||||
| Deferred income taxes |
5,036 | 2,211 | 2,271 | |||||||||
| Stock-based compensation expense |
2,914 | 3,343 | 2,948 | |||||||||
| Loss on disposal of assets |
312 | 855 | 2,004 | |||||||||
| Loss on investment settlement |
1,709 | – | – | |||||||||
| Natural disaster and related |
– | 596 | – | |||||||||
| Changes in assets and liabilities: |
||||||||||||
| Accounts and other receivables |
(1,400 | ) | 1,001 | (8,867 | ) | |||||||
| Inventories |
(388 | ) | (1,062 | ) | (485 | ) | ||||||
| Prepaids and other current assets |
2,077 | (1,056 | ) | (734 | ) | |||||||
| Other assets, net |
(955 | ) | (233 | ) | (704 | ) | ||||||
| Accounts payable |
(710 | ) | 1,910 | (1,168 | ) | |||||||
| Accrued expenses |
12,115 | 10,497 | 6,759 | |||||||||
| Other liabilities |
12,168 | 10,644 | 300 | |||||||||
| Landlord contribution for tenant improvements, net |
(1,709 | ) | 313 | 6,875 | ||||||||
| Net cash provided by operating activities |
68,326 | 58,511 | 35,325 | |||||||||
| Cash flows from investing activities: |
||||||||||||
| Purchases of property and equipment |
(60,015 | ) | (79,183 | ) | (72,733 | ) | ||||||
| Proceeds from investments sold |
31,960 | 12,600 | 93,923 | |||||||||
| Purchases of investments |
– | (6,500 | ) | (102,128 | ) | |||||||
| Collection of notes receivable |
95 | 83 | 70 | |||||||||
| Proceeds from sale of assets |
– | – | 2,636 | |||||||||
| Net cash used in investing activities |
(27,960 | ) | (73,000 | ) | (78,232 | ) | ||||||
| Cash flows from financing activities: |
||||||||||||
| Borrowings on line of credit |
– | 22,500 | – | |||||||||
| Payments on line of credit |
(4,500 | ) | (13,000 | ) | – | |||||||
| Excess tax benefit from stock-based compensation |
30 | 1,153 | 1,780 | |||||||||
| Proceeds from equity transaction |
– | – | (20 | ) | ||||||||
| Proceeds from exercise of stock options |
158 | 1,071 | 1,006 | |||||||||
| Net cash (used in) provided by financing activities |
(4,312 | ) | 11,724 | 2,766 | ||||||||
| Net increase (decrease) in cash and cash equivalents |
36,054 | (2,765 | ) | (40,141 | ) | |||||||
| Cash and cash equivalents, beginning of year |
8,852 | 11,617 | 51,758 | |||||||||
| Cash and cash equivalents, end of year |
$ | 44,906 | $ | 8,852 | $ | 11,617 | ||||||
| Supplemental disclosure of cash flow information: |
||||||||||||
| Cash paid for interest, net of capitalized interest |
$ | – | $ | – | $ | – | ||||||
| Cash paid for income taxes |
$ | 1,412 | $ | 1,454 | $ | 1,171 | ||||||
Supplemental disclosure of non-cash financing activity:
For the 52 weeks ended December 29, 2009 and December 30, 2008, $179 and $262 stock-based compensation, respectively, was capitalized related to the development and construction of our new restaurants.
The accompanying notes are an integral part of these consolidated financial statements.
F-5
Table of Contents
NOTES TO CONSOLIDATED FINANCIAL STATEMENTS
1. The Company and Summary of Significant Accounting Policies
Description of Business
BJ’s Restaurants, Inc. (referred to herein as the “Company” or “BJ’s” or in the first person notations “we,” “us” and “our”) was incorporated in California on October 1, 1991. We owned and operated 92 restaurants at the end of fiscal 2009, located in California, Texas, Arizona, Colorado, Oregon, Nevada, Florida, Ohio, Oklahoma, Kentucky, Indiana, Louisiana and Washington. Each of the restaurants is operated as a BJ’s Restaurant & Brewery, BJ’s Restaurant & Brewhouse, or BJ’s Pizza & Grill. During 2009, we opened 10 new restaurants. Our BJ’s Restaurants & Brewery locations manufacture our signature, proprietary BJ’s beer on the restaurant premises, of which four are currently actively producing our proprietary beer and one is producing our proprietary root beer. Our other restaurants receive their beer from our “brewery” locations and or third-party contract brewers.
Basis of Presentation
The accompanying consolidated financial statements include the accounts of BJ’s Restaurants, Inc. and its wholly owned subsidiaries. All intercompany transactions and balances have been eliminated in consolidation.
The preparation of financial statements in conformity with U.S. generally accepted accounting principles (“GAAP”) requires management to make estimates and assumptions for the reporting period and as of the financial statement date. These estimates and assumptions affect the reported amounts of assets and liabilities, the disclosure of contingent assets and liabilities, and the reported amounts of revenues and expenses. Actual results could differ from those estimates.
Our fiscal year ends on the Tuesday closest to December 31st for financial reporting purposes. Fiscal years 2009, 2008 and 2007 ended on December 29, 2009, December 30, 2008 and January 1, 2008, respectively, and each fiscal year contained 52 weeks.
Segment Disclosure
The Financial Accounting Standards Board (“FASB”) issued Accounting Standards Codification (“Codification”) Topic No. 280, Segment Reporting, which established standards for disclosures about products and services, geographic areas and major customers. We currently operate in one operating segment: casual dining restaurants, some of which have mircrobreweries which produce BJ’s signature, proprietary beers. Additionally, we operate in one geographic area: the United States of America.
Cash and Cash Equivalents
Cash and cash equivalents consist of highly liquid investments, money market funds and certificates of deposit with an original maturity of three months or less when purchased. Cash and cash equivalents are stated at cost, which approximates fair market value.
Investments
Our investment policy restricts the investment of our excess cash balances to instruments with minimal volatility, such as U.S. Treasury and Federal agency obligations, municipal and bank securities, investment-grade corporate debt securities, and money market funds. Investments and marketable securities, which we have the intent and ability to hold until maturity, are classified as held-to-maturity securities and reported at amortized cost with
F-6
Table of Contents
related gains and losses reflected in earnings. Certain of our investments and marketable securities are classified as available-for-sale securities, even though our current liquidity position and requirements provide us with the ability to hold such securities to maturity. Debt securities classified as available-for-sale securities are reported at their fair value, with unrealized gains and losses excluded from net income and reported as a separate component of shareholders’ equity (net of related tax effect) until realized. Any fluctuation in fair value related to investments that are deemed temporary, including any recoveries of previous write-downs, are recorded to accumulated other comprehensive income (loss). Realized gains or losses are determined on the specific identification cost method and recorded as a charge to earnings, when realized.
Concentration of Credit Risk
Financial instruments which potentially subject us to a concentration of credit risk principally consist of cash and cash equivalents, investments and marketable securities. We currently maintain our day to day operating cash balances with a major financial institution. At times, our operating cash balances may be in excess of the FDIC insurance limit. At December 29, 2009, we had approximately $32.4 million of cash invested in investment-grade money market funds. We have not experienced any losses in these accounts and believe we are not exposed to significant risk on cash and cash equivalents. We have placed a majority of our temporary excess cash with a major financial institution that, in turn, invests in instruments with minimal volatility, such as U.S. Treasury and Federal agency obligations, municipal and bank securities, investment-grade corporate debt securities, and money market funds. Our investment policy limits the amount of exposure to any one institution or investment.
Inventories
Inventories are comprised primarily of food and beverage products and are stated at the lower of cost (first-in, first-out) or market.
Property and Equipment
Property and equipment are recorded at cost and depreciated over their estimated useful lives. Leasehold improvements are amortized over the estimated useful life of an asset or the primary lease term of the respective lease including exercised options, whichever is shorter. Renewals and betterments that materially extend the life of an asset are capitalized while maintenance and repair costs are expensed as incurred. When property and equipment are sold or otherwise disposed of, the asset account and related accumulated depreciation or amortization accounts are relieved, and any gain or loss is included in earnings.
Depreciation and amortization are recorded using the straight-line method over the following estimated useful lives:
| Furniture and fixtures |
10 years | |
| Equipment |
5-10 years | |
| Brewery equipment |
20 years | |
| Building improvements |
the shorter of 20 years or the remaining lease term | |
| Leasehold improvements |
the shorter of the useful life or the lease term |
Goodwill and Intangible Assets
Management performs impairment testing annually and more frequently if factors and circumstances indicate an impairment may have occurred. Intangible assets with finite lives are amortized over their estimated useful lives. Management has performed its impairment testing and believes that no impairments existed at December 29, 2009.
F-7
Table of Contents
Included in other assets are trademarks, which are amortized over 10 years.
Long-Lived Assets
We assess potential impairments of our long-lived assets whenever events or changes in circumstances indicate that the carrying value of the assets may not be recoverable. Factors considered include, but are not limited to, significant underperformance relative to expected historical or projected future operating results; significant changes in the manner of use of the acquired assets or the strategy for the overall business; and, significant negative industry or economic trends. The recoverability is assessed in most cases by comparing the carrying value of the asset to the undiscounted cash flows expected to be generated by the asset. This assessment process requires the use of estimates and assumptions regarding future cash flows and estimated useful lives, which are subject to a significant degree of judgment. If these assumptions change in the future, we may be required to record impairment charges for these assets. We believe that no impairment of the carrying value of our long-lived assets existed at December 29, 2009.
Revenue Recognition
Revenues from food and beverage sales at restaurants are recognized when payment is tendered at the point-of-sale. Revenues from the sale of gift cards are deferred and recognized upon redemption. Deferred gift card revenue included in accrued expenses on the accompanying balance sheets was $4.7 million and $3.6 million as of December 29, 2009 and December 30, 2008, respectively. We recognize gift card breakage income when the likelihood of the redemption of the cards becomes remote, which is typically 24 months after original issuance. Gift card breakage income is recorded in “Other income, net” on the Consolidated Statements of Income.
Sales Taxes
Revenues are presented net of sales taxes. The obligation is included in other accrued expenses until the taxes are remitted to the appropriate taxing authorities.
Advertising Costs
Advertising costs are expensed as incurred. Advertising expense for fiscal 2009, 2008, and 2007 was approximately $5.2 million, $3.3 million and $1.7 million, respectively.
Income Taxes
We utilize the liability method of accounting for income taxes. Deferred income taxes are recognized based on the tax consequences in future years of differences between the tax basis of assets and liabilities and their financial reporting amounts at each year-end based on enacted tax laws and statutory tax rates applicable to the periods in which differences are expected to affect taxable income. Valuation allowances are established, when necessary, to reduce deferred tax assets to the amount expected to be realized. The provision for income taxes represents the tax payable for the period and the change during the period in deferred tax assets and liabilities.
We recognize the impact of a tax position in our financial statements if that position is more likely than not of being sustained on audit, based on the technical merits of the position. Interest and penalties related to uncertain tax positions are included in income tax expense.
Restaurant Opening Expense
Restaurant payroll, supplies, other start-up costs and rental expense incurred prior to the opening of a new restaurant are expensed as incurred.
F-8
Table of Contents
Natural Disaster and Related
Natural disaster and related costs relate to property and facility damages incurred from hurricanes Gustav and Ike in excess of related insurance coverage received.
Legal Settlements and Terminations
Legal settlements and terminations principally related to accrued compensation and related benefits resulting from the December 2008 departure of our two co-founders and estimated costs to settle two California employment practice lawsuits that had been outstanding since 2004 and 2005.
Loss on Investment Settlement
Loss on investment settlement relates to the confidential settlement agreement reached in December 2009 for the full liquidation of our auction rate securities (“ARS”) investment portfolio with our former broker-dealer for the portfolio. Under the terms of the settlement, we received approximately $27.4 million in cash (including accrued interest) plus the potential for additional recoveries based on the performance of the auction rate securities market over the next three years in exchange for the entire remaining ARS investment portfolio resulting in a pre-tax loss on investment settlement of approximately $1.7 million. The related guaranteed future payment is recorded as a long term receivable in non-current assets.
Leases
We lease the majority of our restaurant locations. We account for our leases in accordance with generally accepted accounting principles which require that our leases be evaluated and classified as operating or capital leases for financial reporting purposes. The term used for this evaluation includes renewal option periods only in instances in which the exercise of the renewal option can be reasonably assured and failure to exercise such option would result in an economic penalty. All of our restaurant leases are classified as operating leases. We disburse cash for leasehold improvements, furniture and fixtures and equipment to build out and equip our leased premises. Tenant improvement allowance incentives may be available to partially offset the cost of developing and opening the related restaurants, pursuant to agreed-upon terms in our leases. Tenant improvement allowances can take the form of cash payments upon the opening of the related restaurants, full or partial credits against minimum or percentage rents otherwise payable by us or a combination thereof. All tenant improvement allowances received by us are recorded as a deferred rent obligation and amortized over the term of the lease. The related cash received from the landlord is reflected as “landlord contribution for tenant improvements, net” within operating activities of our Consolidated Statements of Cash Flows.
The lease term used for straight-line rent expense is calculated from the date we obtain possession of the leased premises through the lease termination date. We expense rent from possession date through restaurant open date as preopening expense, in accordance with generally accepted accounting principles. Once a restaurant opens for business, we record straight-line rent over the lease term plus contingent rent to the extent it exceeded the minimum rent obligation per the lease agreement.
There is potential for variability in the rent holiday period, which begins on the possession date and ends on the restaurant open date, during which no cash rent payments are typically due under the terms of the lease. Factors that may affect the length of the rent holiday period generally relate to construction related delays. Extension of the rent holiday period due to delays in restaurant opening will result in greater preopening rent expense recognized during the rent holiday period and lesser occupancy expense during the rest of the lease term (post-opening).
For leases that contain rent escalations, we record the total rent payable during the lease term, as determined above, on the straight-line basis over the term of the lease (including the rent holiday period beginning upon our possession of the premises), and record the difference between the minimum rents paid and the straight-line rent
F-9
Table of Contents
as a lease obligation. Certain leases contain provisions that require additional rental payments based upon restaurant sales volume (“contingent rentals”). Contingent rentals are accrued each period as the liabilities are incurred, in addition to the straight-line rent expense noted above. This results in some variability in occupancy expense as a percentage of revenues over the term of the lease in restaurants where we pay contingent rent.
Management makes judgments regarding the probable term for each restaurant property lease, which can impact the classification and accounting for a lease as capital or operating, the rent holiday and/or escalations in payments that are taken into consideration when calculating straight-line rent and the term over which leasehold improvements for each restaurant are amortized. These judgments may produce materially different amounts of depreciation, amortization and rent expense than would be reported if different assumed lease terms were used.
Fair Value of Financial Instruments
The carrying value of cash and cash equivalents, investments classified as held-to-maturity or current assets, accounts receivable, and current liabilities approximate fair values due to the short-term maturity of these instruments. Investments classified as available-for-sale or non-current assets are recorded at fair value based on valuation models and methodologies provided by a third party using “Level 3” inputs. The fair value of long-term debt is determined using current applicable rates for similar instruments as of the balance sheet date and approximates the carrying value of such obligations. Temporary changes in fair value results in unrealized holding gains and losses being recorded in the “other comprehensive income (loss)” component of shareholders’ equity and does not affect net income for the applicable accounting period. Declines in fair value below our carrying value deemed to be other than temporary are charged against net earnings.
Net Income Per Share
Basic net income per share is computed by dividing net income available to common shareholders by the weighted average number of common shares outstanding during the period. At December 29, 2009, 650,000 shares of restricted stock units issued to employees were unvested, and were therefore excluded from the calculation of basic earnings per share for the 52 weeks ended December 29, 2009. Diluted net income per share includes the dilutive effect of both outstanding stock options and restricted stock units, calculated using the treasury stock method. Assumed proceeds from the in-the-money options include the windfall tax benefits, net of shortfalls, calculated under the “as-if” method.
The following table presents a reconciliation of basic and diluted net income per share computations and the number of dilutive securities (stock options and restricted stock units) that were included in the dilutive net income per share computation (in thousands).
| Fiscal Year | |||||||||
| 2009 | 2008 | 2007 | |||||||
| Numerator: |
|||||||||
| Net income for basic and diluted net income per share |
$ | 13,038 | $ | 10,308 | $ | 11,705 | |||
| Denominator: |
|||||||||
| Weighted-average shares outstanding — basic |
26,750 | 26,484 | 26,187 | ||||||
| Effect of dilutive common stock options and restricted stock units |
397 | 265 | 693 | ||||||
| Weighted-average shares outstanding — diluted |
27,147 | 26,749 | 26,880 | ||||||
At December 29, 2009, December 30, 2008 and January 1, 2008, there were approximately 0.6 million, 1.4 million, and 0.4 million stock options outstanding, respectively, whereby the exercise price exceeded the average common stock market value. The effects of the shares which would be issued upon the exercise of these options have been excluded from the calculation of diluted net income per share because they are anti-dilutive.
F-10
Table of Contents
Other Comprehensive Income (Loss)
Other comprehensive income (loss) includes all changes in equity during a period except those resulting from investment by and distribution to shareholders. Other comprehensive income (loss) reported on our Consolidated Statements of Shareholders’ Equity consist of net income and unrealized gains or losses on available-for-sale investments.
Stock-Based Compensation
We have two stock-based compensation plans — the 2005 Equity Incentive Plan and the 1996 Stock Option Plan — under which we may issue shares of our common stock to employees, officers, directors and consultants. Upon effectiveness of the 2005 Equity Incentive Plan, the 1996 Stock Option Plan was closed for purposes of new grants. Both of these plans have been approved by our shareholders. Under the 2005 Equity Incentive Plan, we have granted incentive stock options, non-qualified stock options and restricted stock units.
Beginning in 2007, substantially all of our restaurant general managers, executive kitchen managers, culinary training managers and our area and regional restaurant directors are eligible to participate in a new equity-based incentive program called the BJ’s Gold Standard Stock Ownership Program (the “GSSOP”) under our 2005 Equity Incentive Plan. In November 2007, we expanded our GSSOP eligibility to also include certain brewery personnel. The GSSOP is a longer-term equity incentive program that utilizes Company restricted stock units (“RSUs”). The GSSOP is dependent on each participant’s extended service with us in their respective positions (five years) and their achievement of certain agreed-upon performance objectives during that service period.
Beginning in 2008, we issued RSUs as a component of the annual equity grant award to officers and other employees. Under our 2005 Equity Incentive Plan we have issued approximately 650,000 RSUs as of December 29, 2009. The fair value of the RSUs is the quoted market value of our common stock on the date of grant. The fair value of each RSU is expensed over the period during which its related restrictions are expected to lapse (i.e., generally five years). Stock options generally vest at 20% per year or cliff vest, either ratably in years three through five or 100% in year five and expire ten years from date of grant. RSUs generally vest at 20% per year for other RSU grantees and generally cliff vest at 100% after five years for GSSOP participants.
We account for these plans in accordance with generally accepted accounting principles under the fair value recognition provisions, using the modified-prospective-transition method. Compensation expense recognized in the 52 weeks ended December 29, 2009 and December 30, 2008 include (a) compensation expense for all share-based payments granted prior to, but not yet vested as of January 4, 2006, based on the grant date fair value estimated in accordance with the original provisions and (b) compensation expense for all share-based payments granted subsequent to January 4, 2006, based on the grant date fair value estimated in accordance with the revised provisions under generally accepted accounting principles.
Recent Accounting Pronouncements
In June 2009, the FASB approved the FASB Accounting Standards Codification (the “Codification”) as the single source of authoritative nongovernmental GAAP. All existing accounting standard literature, promulgated by the FASB, American Institute of Certified Public Accountants, Emerging Issues Task Force and other authoritative sources, excluding guidance from the Securities and Exchange Commission (“SEC”), will be superseded by the Codification. All non-grandfathered, non-SEC accounting literature not included in the Codification will become non-authoritative. The Codification does not change GAAP, but instead introduces a new structure that will combine all authoritative standards into a comprehensive, topically organized online database. The Codification was effective for interim or annual periods ending after September 15, 2009, and impacted our consolidated financial statement disclosures beginning with the quarter ending September 29, 2009. There were no changes to the content of our consolidated financial statements or disclosures as a result of implementing the Codification.
F-11
Table of Contents
In May 2009, the FASB issued a statement on subsequent events (Codification Topic No. 855, Subsequent Events), which establishes general standards of accounting for and disclosure of events that occur after the balance sheet date, but before the financial statements are issued or available to be issued (“subsequent events”). This statement requires disclosure of the date through which the entity has evaluated subsequent events and the basis for that date. For public entities, this is the date the financial statements are issued. This statement does not apply to subsequent events or transactions that are within the scope of other GAAP and will not result in significant changes in the subsequent events reported by us. This statement was effective for interim or annual periods ending after June 15, 2009. We implemented the provisions of this statement during the quarter ended June 30, 2009. We evaluated for subsequent events through the issuance date of our consolidated financial statements. No recognized or non-recognized subsequent events were noted.
In April 2009, the FASB issued guidance on the recognition and presentation of other-than-temporary impairments, which is included in Codification Topic No. 320, Debt and Equity Securities. This guidance amends the other-than-temporary impairment guidance in U.S. GAAP for debt securities, where changes in fair value are not regularly recognized in earnings, to make the guidance more operational and to improve the presentation and disclosure of other-than-temporary impairments on debt securities in the financial statements. This guidance also provides for evaluating whether an impairment of a debt security is other than temporary and for determining the amount of an other-than-temporary impairment recognized in earnings and other comprehensive income. Under this guidance, if management intends to sell an impaired debt security, or it is more likely than not that it will be required to sell the security before recovery, all other-than-temporary impairments must be separated into two components: (i) the amount related to credit losses (which is recorded in current period earnings) and (ii) the amount related to all other factors (which is recorded in other comprehensive income). Both components are required to be shown in the statement of income. This guidance was effective for interim and annual reporting periods ending after June 15, 2009. We have applied the guidance and disclosure requirements as it applies to our investments during the fourth quarter of fiscal 2009 and there was no impact on our consolidated financial statements.
In April 2009, the FASB issued guidance on the interim disclosures about fair value of financial instruments, which is included in Codification Topic No. 825, Financial Instruments. This guidance extends the disclosure requirements regarding the fair value of financial instruments to interim financial statements of publically traded companies. This guidance was effective for interim reporting periods ending after June 15, 2009 and was adopted as of the beginning of our current fiscal year as our interim disclosure about the fair value of our financial instruments incorporates the related requirements.
Reclassifications
Certain reclassifications of prior year’s balance sheet amounts have been made to conform to the current year’s format.
2. Investments
In December 2009, we reached a confidential settlement agreement for the full liquidation of our auction rate securities (“ARS”) investment portfolio with our former broker-dealer for the portfolio. These ARS investments were classified as available-for-sale and reported at their fair value with unrealized gains and losses excluded from net income and reported as a separate component of shareholders’ equity (net of related tax effect). During fiscal year 2009 and prior to the settlement, we received partial redemptions on these ARS investments, totaling $4.2 million. Under the terms of the settlement agreement, we received approximately $27.4 million in cash (including accrued interest) plus the potential for additional recoveries based on the performance of the auction rate securities market over the next three years in exchange for the entire remaining ARS investment portfolio and recorded a pre-tax loss on investment settlement of approximately $1.7 million. As a result, the prior net unrealized loss on investments was reversed from other comprehensive income. The majority of the proceeds from the investment settlement were invested with another broker into investment-grade money market funds. These investments are considered cash equivalents and reported at cost, which approximates fair value at December 29, 2009.
F-12
Table of Contents
Non-current investments consist of the following (in thousands):
| Cost or Par Value |
Gross Unrealized Gains |
Gross Unrealized Losses |
Fair Value |
Maturity | |||||||||||
| At December 29, 2009 |
|||||||||||||||
| Available-for-sale — ARS investments |
$ | – | $ | – | $ | – | $ | – | |||||||
| At December 30, 2008 |
|||||||||||||||
| Available-for-sale — ARS investments |
$ | 35,000 | $ | 631 | ($ | 5,014 | ) | $ | 30,617 | 2020 to 2047 | |||||
3. Fair Value Measurement
For assets that are measured using quoted market prices in active markets, fair value is the published market price per unit multiplied by the number of units held without consideration of transaction costs. At December 29, 2009, we had $32.4 million of cash invested in money market funds with various brokers. The fund purchases only first-tier securities, and we have not experienced any losses in these accounts. Therefore, we are not exposed to significant risks on these investments.
4. Property and Equipment
Property and equipment consisted of the following (in thousands):
| December 29, 2009 |
December 30, 2008 |
|||||||
| Land |
$ | 6,453 | $ | 6,453 | ||||
| Building improvements |
126,412 | 106,954 | ||||||
| Leasehold improvements |
109,291 | 91,919 | ||||||
| Furniture and fixtures |
42,813 | 33,448 | ||||||
| Equipment |
83,417 | 70,797 | ||||||
| 368,386 | 309,571 | |||||||
| Less accumulated depreciation and amortization |
(88,916 | ) | (65,218 | ) | ||||
| 279,470 | 244,353 | |||||||
| Construction in progress |
12,443 | 11,674 | ||||||
| $ | 291,913 | $ | 256,027 | |||||
5. Accrued Expenses
Accrued expenses consisted of the following (in thousands):
| December 29, 2009 |
December 30, 2008 | |||||
| Deferred rent and related |
$ | 15,256 | $ | 11,915 | ||
| Payroll related |
12,974 | 9,417 | ||||
| Deferred revenue from gift cards |
4,743 | 3,550 | ||||
| Workers compensation |
4,113 | 4,496 | ||||
| Sales taxes |
3,432 | 2,770 | ||||
| Construction payables |
6,430 | 2,599 | ||||
| Legal settlements and terminations |
841 | 2,086 | ||||
| Other taxes |
2,516 | 1,440 | ||||
| Other |
4,458 | 4,375 | ||||
| $ | 54,763 | $ | 42,648 | |||
F-13
Table of Contents
6. Commitments and Contingencies
Leases
We lease our restaurant and office facilities under noncancelable operating leases with remaining terms ranging from approximately 1 to 20 years with renewal options ranging from 5 to 20 years. Rent expense for fiscal 2009, 2008, and 2007 was $20.6 million, $18.3 million, and $15.2 million, respectively.
We have certain operating leases, which contain fixed rent escalation clauses. Rent expense for these leases has been calculated on the straight-line basis over the term of the leases, resulting in deferred rent of approximately $11.1 million and $8.7 million at December 29, 2009 and December 30, 2008, respectively. The deferred rent is included in accrued expenses on the accompanying balance sheet and will be amortized to rent expense over the life of the leases.
A number of the leases also provide for contingent rentals based on a percentage of sales above a specified minimum. Total contingent rentals, included in rent expense, above the minimum, for fiscal 2009, 2008, and 2007 were approximately $3.1 million for each year, respectively.
Future minimum annual rental payments under noncancelable operating leases are as follows (in thousands):
| 2010 |
$ | 19,787 | |
| 2011 |
19,805 | ||
| 2012 |
19,636 | ||
| 2013 |
19,268 | ||
| 2014 |
19,232 | ||
| Thereafter |
201,410 | ||
| $ | 299,138 | ||
Additionally, we have entered into lease agreements related to the construction of future restaurants with commencement dates subsequent to December 29, 2009. Our aggregate future commitment relating to these leases is $7.9 million.
Legal Proceedings
We are subject to a number of private lawsuits, administrative proceedings and claims that arise in the ordinary course of our business. These claims typically involve claims from guests, employees and others related to operational issues common to the foodservice industry. A number of these claims may exist at any given time. We believe that most of our guest claims will be covered by our general liability insurance, subject to certain deductibles and coverage limits. Punitive damages awards and employee unfair practice claims, however, are not covered by our general liability insurance. To date, we have not paid punitive damages with respect to any claims, but there can be no assurance that punitive damages will not be awarded with respect to any future claims, employee unfair practice claims or any other actions. We could be affected by adverse publicity resulting from allegations in lawsuits, claims and proceedings, regardless of whether these allegations are valid or whether we are determined to be liable. We currently believe that the final disposition of these types of lawsuits, proceedings and claims will not have a material adverse effect on our financial position, results of operations or liquidity. It is possible, however, that our future results of operations for a particular quarter or fiscal year could be impacted by changes in circumstances relating to lawsuits, proceedings or claims.
F-14
Table of Contents
The following paragraphs describe certain legal actions recently settled or pending:
Labor Related Matters
On February 5, 2004, a former employee of ours, on behalf of herself, and allegedly other employees, filed a class action complaint in Los Angeles County, California, Superior Court, and on March 16, 2004, filed an amended complaint, alleging causes of action for: (1) failure to pay reporting time minimum pay; (2) failure to allow meal breaks; (3) failure to allow rest breaks; (4) waiting time penalties; (5) civil penalties; (6) reimbursement for fraud and deceit; (7) punitive damages for fraud and deceit; and, (8) disgorgement of illicit profits. On June 28, 2004, the plaintiff stipulated to dismiss her second, third, fourth and fifth causes of action. During September 2004, the plaintiff stipulated to binding arbitration of the action. On March 2, 2008, and on March 19, 2008, one of Plaintiff’s attorneys filed a notice with the California Labor and Workforce Development Agency, alleging failure to keep adequate pay records and to pay Plaintiff minimum wage. To our knowledge, the Agency has not responded to either of these notices. In November 2008, the parties agreed to settle this matter subject to approval from the arbitrator and/or the court. The terms of this proposed settlement are not considered by us to be material to our consolidated financial position.
On February 16, 2006, a former employee filed a lawsuit in Orange County, California, Superior Court, on behalf of herself and allegedly other employees, for alleged failure to provide rest periods and meal periods and violation of California Business and Professions Code. We have answered the complaint, denying the allegations and raising various additional defenses. The parties met for mediation on a non-binding basis. In May 2008, the parties agreed to settle this matter subject to final approval from the court. The court has given final approval of the settlement. The terms of this proposed settlement are not considered by us to be material to our consolidated financial position.
On April 6, 2009, an employee filed a class action complaint in Orange County, California, Superior Court, on behalf of himself and allegedly other employees. The complaint alleges causes of action for failure to pay plaintiff and other alleged class members regular wages and overtime pay, failure to maintain the designated wage scale and secret payment of lower wages, the greater of actual damages or penalties for failure to provide accurate wage statements, and restitution of wages and injunction for violation of California Business and Professions Code. The complaint also seeks interest, attorneys’ fees and costs. In February 2010, the parties agreed in principle to settle this case, subject to approval of the court. The terms of this proposed settlement are not considered by us to be material to our consolidated financial position.
On February 4, 2009, an employee, on behalf of himself and allegedly other employees filed a class action complaint in Fresno County, California, Superior Court,, which complaint was served on us in the second quarter of 2009. The complaint alleges causes of action for failure to pay wages for on-call time, for violation of California Business and Professional Code and for penalties for unpaid wages. The complaint also seeks a constructive trust on money found unlawfully acquired, an injunction against failure to pay wages, restitution, interest, attorney’s fees and costs. On August 14, 2009, a first amended complaint was filed, in which two other employees joined the action as plaintiffs. The parties have begun discovery, we have filed an answer to the amended complaint, and we intend to vigorously defend our position in this action.
On July 16, 2009, Robert Cho, an individual, on behalf of himself and allegedly other recipients or holders in California of our gift cards, filed a class action complaint in Los Angeles County, California, Superior Court, alleging causes of action for unlawful and deceptive trade practices and violation of the Consumer Legal Remedies Act, for failing to redeem or replace a gift card and deducting a dormancy fee, for violation of California Business and Professions Code and for declaratory relief. The complaint seeks restitution, an injunction against the alleged unfair practices, and attorneys’ fees. Discovery has begun. In November 2009, the plaintiff filed an amended complaint for the causes of action alleged in the original complaint but without the allegation of violation of California Business and Professions Code. We answered the amended complaint, denying the allegations and raising affirmative defenses. We intend to vigorously defend our position in this action.
F-15
Table of Contents
On August 25, 2009, a former employee of ours filed a lawsuit in Los Angeles County, California, Superior Court, on behalf of himself and allegedly other employees, namely our California restaurant assistant managers, kitchen managers and managers. The complaint alleges our California restaurant assistant managers are not exempt for compensation purposes and alleges causes of action for failure to pay overtime wages, failure to provide meal breaks and rest periods, failure to pay wages timely, penalties for unpaid wages, failure to provide accurate wage statements, failure to keep accurate payroll records and for violation of California Business and Professions Code. The complaint also seeks unspecified damages, restitution, an injunction against unfair practices, interest, attorneys’ fees and costs. In October 2009, plaintiff filed an amended complaint, alleging the class to be all California assistant kitchen managers, kitchen managers, and managers and adding to plaintiff’s claims for penalties alleged to be due under the California Labor Code Private Attorneys General Act. On October 8, 2009, plaintiff’s attorneys filed a notice with the California Labor and Workforce Development Agency, alleging failure by us to pay overtime wages, failure to provide meal breaks and rest periods, failure to pay wages due on plaintiff’s and other employees’ termination, failure to pay wages timely, failure to provide accurate wage statements and failure to keep accurate payroll records. On December 8, 2009, the Agency responded that it does not intend to investigate the allegations. In January 2010, the plaintiff filed a motion seeking permission to file a second amended complaint; however, as of March 3, 2010, this motion has not been heard. In January 2010, on our motion, the Court ordered the venue of the case moved to Orange County. We have not yet responded to the amended complaint but intend to vigorously defend our position in this action.
Other Matters
On June 12, 2008, we filed an arbitration claim with the Financial Industry Regulatory Authority (FINRA) against Citigroup Global Investments, Inc. (“Citigroup”) asserting claims for breach of contract, breach of the implied covenant of good faith and fair dealing, fraud, breach of fiduciary duty, a failure to act to the highest standards of good faith and commercial honor, violations of Federal and California securities laws, failure to properly train financial advisers, violation of settlement agreements with regulatory authorities, conspiracy, and violation of its duty to us concerning selection of proper securities arising out of our auction rate securities investments. On December 9, 2009, we reached a confidential settlement agreement with Citigroup for the full liquidation of our auction rate securities (ARS) investment portfolio. Under the terms of the settlement, we received approximately $27.4 million in cash (including accrued interest) in exchange for our entire remaining ARS investment portfolio. In addition, the settlement provides us with the potential for additional recoveries, depending upon the performance of the ARS market during the next three years.
Letters of Credit
We have irrevocable standby letters of credit outstanding as required under the our workers’ compensation policy that total $3.6 million as of December 29, 2009, which automatically renews each October 31 for one year unless 30 day notice, prior to such renewal date, is given by the bank. The standby letters of credit have been issued under our $45 million line of credit and therefore reduce the amount available for borrowing under the credit facility.
Other Commitments
We have severance and employment agreements with certain of our executive officers that provide for payments to those officers in the event of a termination of their employment as a result of a change in control of or without cause, as defined in those agreements. Aggregate payments totaling approximately $1.6 million would have been required by those agreements had all such officers terminated their employment for those reasons as of December 29, 2009.
F-16
Table of Contents
7. Long-Term Debt
Line of Credit
On October 17, 2007, we established a $25 million unsecured revolving line of credit with a major financial institution (the “Line of Credit”). The Line of Credit expires on September 30, 2012 and may be used for working capital and other general corporate purposes. The Line of Credit was increased to $45 million during the first quarter of 2008. We expect to utilize the Line of Credit principally for letters of credit that are required to support certain of our self insurance programs and for working capital and construction requirements. As of December 29, 2009, there were funded borrowings of $5.0 million outstanding under the Line of Credit and there were outstanding letters of credit totaling approximately $3.6 million. Any borrowings under the Line of Credit will bear interest at the financial institution’s prime rate or at LIBOR plus a percentage not to exceed 1.375% based on a Lease Adjusted Leverage Ratio as defined in the Line of Credit agreement. The Line of Credit agreement also requires a Fixed Charge Coverage Ratio. At December 29, 2009, we were in compliance with these covenants. Any interest on the Line of Credit will be payable quarterly and all related borrowings must be repaid on or before September 30, 2012. At December 29, 2009, interest paid on the funded borrowing under the Line of Credit was approximately $137,000 and the weighted average interest rate was approximately 1.4%.
8. Shareholders’ Equity
Preferred Stock
We are authorized to issue five million shares in one or more series of preferred stock and to determine the rights, preferences, privileges and restrictions to be granted to, or imposed upon, any such series, including the voting rights, redemption provisions (including sinking fund provisions), dividend rights, dividend rates, liquidation rates, liquidation preferences, conversion rights and the description and number of shares constituting any wholly unissued series of preferred stock. No shares of preferred stock were issued or outstanding at December 29, 2009 or December 30, 2008. We currently have no plans to issue shares of preferred stock.
Common Stock
Shareholders of our outstanding common stock are entitled to receive dividends if and when declared by the Board of Directors. Shareholders are entitled to one vote for each share of common stock held of record. Pursuant to the requirements of California law, shareholders are entitled to accumulate votes in connection with the election of directors.
9. Income Taxes
The income tax expense (benefit) consists of the following for the last three fiscal years (in thousands):
| Fiscal Year | ||||||||||||
| 2009 | 2008 | 2007 | ||||||||||
| Current: |
||||||||||||
| Federal |
$ | (722 | ) | $ | (227 | ) | $ | 1,327 | ||||
| State |
1,234 | 753 | 1,896 | |||||||||
| 512 | 526 | 3,223 | ||||||||||
| Deferred: |
||||||||||||
| Federal |
4,921 | 2,007 | 2,701 | |||||||||
| State |
115 | 204 | (430 | ) | ||||||||
| 5,036 | 2,211 | 2,271 | ||||||||||
| Provision for income taxes |
$ | 5,548 | $ | 2,737 | $ | 5,494 | ||||||
F-17
Table of Contents
The provision for income taxes differs from the amount that would result from applying the federal statutory rate as follows for the last three fiscal years:
| Fiscal Year | |||||||||
| 2009 | 2008 | 2007 | |||||||
| Income tax at statutory rates |
35.0 | % | 35.0 | % | 35.0 | % | |||
| Permanent differences |
0.2 | (3.6 | ) | (0.5 | ) | ||||
| State income taxes, net of federal benefit |
4.7 | 4.8 | 5.5 | ||||||
| Income tax credits |
(11.3 | ) | (14.1 | ) | (9.1 | ) | |||
| Other, net |
1.3 | (1.1 | ) | 1.0 | |||||
| 29.9 | % | 21.0 | % | 31.9 | % | ||||
The components of the deferred income tax asset (liability) consist of the following (in thousands):
| December 29, 2009 |
December 30, 2008 |
|||||||
| Property and equipment |
$ | (25,220 | ) | $ | (13,983 | ) | ||
| Goodwill |
(1,823 | ) | (1,664 | ) | ||||
| Investments |
701 | 1,831 | ||||||
| Accrued expense and other liabilities |
10,097 | 8,655 | ||||||
| Stock-based compensation |
3,753 | 2,851 | ||||||
| Income tax credits |
7,248 | 3,661 | ||||||
| Other |
(2,703 | ) | (2,642 | ) | ||||
| Subtotal |
(7,947 | ) | (1,291 | ) | ||||
| Valuation allowance |
(212 | ) | (1,832 | ) | ||||
| Net deferred income taxes |
$ | (8,159 | ) | $ | (3,123 | ) | ||
At December 29, 2009, we had federal income tax credit carryforwards of approximately $7.2 million, consisting primarily of the credit for FICA taxes paid on reported employee tip income. The FICA tax credits will begin to expire in 2027.
Our deferred tax assets are subject to periodic recoverability assessments. We believe that it is more likely than not that a portion of the deferred tax asset related to long-term capital losses from the settlement of ARS investments will not be realized. Accordingly, a valuation allowance of $0.2 million was recorded to other comprehensive income at December 29, 2009. In addition, the valuation allowance of $1.8 million related to unrealized losses on investments that was recorded to other comprehensive income at December 30, 2008 was reversed in fiscal 2009 as a result of the settlement of ARS investments.
We recognize interest and penalties related to uncertain tax positions in income tax expense and as of December 29, 2009 the amount recorded for interest and penalties did not change by a material amount. As of December 29, 2009, unrecognized tax benefits recorded was approximately $145,000, which, if reversed, would impact our effective tax rate. A reconciliation of the beginning and ending amount of unrecognized tax benefits is as follows (in thousands):
| Balance at January 3, 2007 |
$ | 89 | ||
| Additions based on tax positions taken during the current period |
79 | |||
| Balance at January 1, 2008 |
168 | |||
| Reductions based on tax positions taken during the current period |
(13 | ) | ||
| Balance at December 30, 2008 |
155 | |||
| Reductions based on tax positions taken during the current period |
(10 | ) | ||
| Balance at December 29, 2009 |
$ | 145 | ||
F-18
Table of Contents
Our uncertain tax positions are related to tax years that remain subject to examination by tax authorities. As of December 29, 2009, the earliest tax year still subject to examination by a significant taxing jurisdiction is 2005.
10. Stock-Based Compensation Plans
We have two stock-based compensation plans — the 1996 Stock Option Plan and the 2005 Equity Incentive Plan — under which we may issue shares of our common stock to our employees, officers, directors and consultants. In August 1996, our shareholders approved the adoption of the 1996 Stock Option Plan which provided for the granting of options to purchase up to 600,000 shares of common stock. The 1996 Stock Option Plan was amended on September 28, 1999 and June 19, 2004, increasing the total number of shares under the plan to 2.2 million. The 1996 Stock Option Plan provided for options to be issued as either incentive stock options or non-statutory stock options as defined under Section 422A of the Internal Revenue Code. The 1996 Stock Option Plan expires on June 19, 2013, unless terminated earlier. Upon effectiveness of the 2005 Equity Incentive Plan, the 1996 Stock Option Plan was closed for purposes of new grants and the remaining available shares for grant, including those shares related to option awards forfeited or terminated without exercise under the 1996 Stock Option Plan accrue to the 2005 Equity Incentive Plan.
In June 2005, our shareholder’s approved the 2005 Equity Incentive Plan (“the Plan”) which provides for the grant of incentive and non statutory stock options as well as stock appreciation rights, restricted stock, restricted stock units, and other stock-based awards. Awards other than incentive stock options generally may be granted only to employees, directors and consultants of the Company, or certain related entities or designated affiliates. The shares of common stock reserved for issuance under this Plan include the aforementioned accrued shares from the 1996 Stock Option Plan plus an additional 3,500,000 shares of the Company’s common stock. As of December 29, 2009, approximately 1.0 million shares were available for future issuance under the Plan. Under the Plan, the Company has granted incentive stock options, non-qualified stock options, and restricted stock units. Shares subject to stock options and stock appreciation rights are charged against the Plan share reserve on the basis of one share for each one share granted while shares subject to other types of awards, including restricted stock units, are charged against the Plan share reserve on the basis of two shares for each one share granted. The Plan also contains other limits with respect to the terms of different types of incentive awards and with respect to the number of shares subject to awards that can be granted to an employee during any fiscal year. All options granted under the Plan expire within 10 years of their date of grant.
Beginning in 2007, substantially all of the our restaurant general managers, executive kitchen managers, culinary training managers, area and regional restaurant directors are eligible to participate in a new equity-based incentive program called the BJ’s Gold Standard Stock Ownership Program (the “GSSOP”) under the Company’s 2005 Equity Incentive Plan. In November 2007, the Company expanded its GSSOP eligibility to also include certain brewery personnel. The GSSOP is a longer-term equity incentive program that utilizes Company restricted stock units (“RSUs”). The GSSOP is dependent on each participant’s extended service with the Company in their respective positions and their achievement of certain agreed-upon performance objectives during that service period (i.e., five years).
Beginning in 2008, we issued RSUs as a component of the annual equity grant award to officers and other employees. Under our 2005 Equity Incentive Plan we have issued approximately 650,000 RSUs as of December 29, 2009. The fair value of the RSUs is the quoted market value of our common stock on the date of grant. The fair value of each RSU is expensed over the period during which its related restrictions are expected to lapse (i.e., generally five years). Stock options generally vest at 20% per year or cliff vest, either ratably in years three through five or 100% in year five and expire ten years from date of grant. RSUs generally vest at 20% per year for other RSU grantees and generally cliff vest at 100% after five years for GSSOP participants.
We account for equity grants under these plans in accordance with generally accepted accounting principles’ fair value recognition provisions, using the modified-prospective-transition method. Compensation expense recognized in the 52 weeks ended December 29, 2009 and December 30, 2008 include (a) compensation expense
F-19
Table of Contents
for all share-based payments granted prior to, but not yet vested as of January 4, 2006, based on the grant date fair value estimated in accordance with the original provisions and (b) compensation expense for all share-based payments granted subsequent to January 4, 2006, based on the grant date fair value estimated in accordance with the revised provisions under generally accepted accounting principles.
The following table presents information related to stock-based compensation (in thousands):
| Fiscal Year | |||||||||
| 2009 | 2008 | 2007 | |||||||
| Labor and benefits stock-based compensation |
$ | 602 | $ | 849 | $ | 719 | |||
| General and administrative stock-based compensation |
$ | 2,312 | $ | 2,494 | $ | 2,228 | |||
| Capitalized stock-based compensation (1) |
$ | 179 | $ | 262 | $ | 242 | |||
| (1) | Capitalized stock-based compensation is included in “Property and equipment, net” on the Consolidated Balance Sheets. |
Stock Options
The fair value of each option grant issued is estimated at the date of grant using the Black-Scholes option-pricing model with the following weighted average assumptions:
| Fiscal Year | ||||||||||||
| 2009 | 2008 | 2007 | ||||||||||
| Expected volatility |
80.20 | % | 45.95 | % | 40.61 | % | ||||||
| Risk free interest rate |
1.64 | % | 3.23 | % | 4.64 | % | ||||||
| Expected option life |
5 years | 5 years | 5 years | |||||||||
| Dividend yield |
0 | % | 0 | % | 0 | % | ||||||
| Fair value of options granted |
$ | 7.15 | $ | 6.15 | $ | 8.27 | ||||||
Generally accepted accounting principles require us to make certain assumptions and judgments regarding the grant date fair value. These judgments include expected volatility, risk free interest rate, expected option life, dividend yield and vesting percentage. These estimations and judgments are determined by us using many different variables that, in many cases, are outside of our control. The changes in these variables or trends, including stock price volatility and risk free interest rate, may significantly impact the grant date fair value resulting in a significant impact to our financial results.
F-20
Table of Contents
The exercise price of the shares under our stock-based compensation plans shall be equal to or exceed 100% of the fair market value of the shares at the date of option grant. The options generally vest over a three to five-year period.
| Options Outstanding | Options Exercisable | ||||||||||
| Shares (in thousands) |
Weighted Average Exercise Price |
Shares (in thousands) |
Weighted Average Exercise Price | ||||||||
| Outstanding options at January 2, 2007 |
2,337 | $ | 12.04 | 1,230 | $ | 7.09 | |||||
| Granted |
211 | $ | 20.14 | ||||||||
| Exercised |
(297 | ) | $ | 3.39 | |||||||
| Forfeited |
(77 | ) | $ | 17.98 | |||||||
| Outstanding options at January 1, 2008 |
2,174 | $ | 13.79 | 1,266 | $ | 10.36 | |||||
| Granted |
237 | $ | 15.28 | ||||||||
| Exercised |
(359 | ) | $ | 2.98 | |||||||
| Forfeited |
(29 | ) | 19.10 | ||||||||
| Outstanding options at December 30, 2008 |
2,023 | $ | 15.82 | 1,321 | $ | 14.50 | |||||
| Granted |
357 | $ | 11.16 | ||||||||
| Exercised |
(41 | ) | $ | 3.92 | |||||||
| Forfeited |
(72 | ) | $ | 18.48 | |||||||
| Outstanding options at December 29, 2009 |
2,267 | $ | 15.21 | 1,497 | $ | 15.32 | |||||
Information relating to significant option groups outstanding at December 29, 2009, is as follows (shares in thousands):
| Options Outstanding | Options Exercisable | |||||||||||||
| Range of Exercise Prices |
Amount Outstanding |
Weighted Average Remaining Contractual Life |
Weighted Average Exercise Price |
Number Exercisable |
Weighted Average Remaining Contractual Life |
Weighted Average Exercise Price | ||||||||
| $ 0.00 – $ 3.00 |
25 | 1.08 | $ | 2.88 | 25 | 1.08 | $ | 2.88 | ||||||
| $ 3.01 – $ 6.00 |
86 | 1.54 | $ | 3.81 | 86 | 1.54 | $ | 3.81 | ||||||
| $ 6.01 – $ 9.00 |
52 | 2.49 | $ | 7.67 | 52 | 2.49 | $ | 7.67 | ||||||
| $ 9.01 – $12.00 |
537 | 6.91 | $ | 10.59 | 212 | 3.69 | $ | 11.02 | ||||||
| $12.01 – $15.00 |
525 | 5.11 | $ | 14.01 | 494 | 4.93 | $ | 14.08 | ||||||
| $15.01 – $18.00 |
293 | 7.41 | $ | 16.25 | 90 | 6.12 | $ | 15.90 | ||||||
| $18.01 – $21.00 |
478 | 4.16 | $ | 19.93 | 337 | 3.08 | $ | 19.86 | ||||||
| $21.01 – $24.00 |
246 | 5.87 | $ | 23.38 | 176 | 5.85 | $ | 23.40 | ||||||
| $24.01 – $27.00 |
25 | 6.19 | $ | 24.42 | 25 | 6.19 | $ | 24.42 | ||||||
| $ 0.00 – $27.00 |
2,267 | 5.49 | $ | 15.21 | 1,497 | 4.19 | $ | 15.32 | ||||||
As of December 29, 2009, total unrecognized stock-based compensation expense related to non-vested stock options was $3.5 million, which is expected to be recognized over the remaining five years.
F-21
Table of Contents
Restricted Stock Units
Restricted stock unit activity was as follows:
| Shares (in thousands) |
Weighted Average Fair Value | |||||
| Outstanding RSUs at January 2, 2007 |
– | $ | – | |||
| Granted |
281 | $ | 20.27 | |||
| Vested |
– | $ | – | |||
| Forfeited |
(28 | ) | $ | 19.96 | ||
| Outstanding RSUs at January 1, 2008 |
253 | $ | 20.30 | |||
| Granted |
249 | $ | 12.82 | |||
| Vested |
– | $ | – | |||
| Forfeited |
(26 | ) | $ | 18.50 | ||
| Outstanding RSUs at December 30, 2008 |
476 | $ | 16.27 | |||
| Granted |
275 | $ | 11.95 | |||
| Vested or released |
(16 | ) | $ | 14.85 | ||
| Forfeited |
(85 | ) | $ | 14.07 | ||
| Outstanding RSUs at December 29, 2009 |
650 | $ | 14.77 | |||
The fair value of the RSUs is the quoted market value of our common stock on the date of grant. The fair value of each RSU is expensed over the period during which the restrictions are expected to lapse (i.e., five years). We recorded stock-based compensation expense related to RSUs of approximately $1.1 million during the 52 weeks ended December 29, 2009. In addition, total unrecognized stock-based compensation expense related to non-vested restricted shares was approximately $5.1 million, which is expected to be generally recognized over the remaining five years.
11. Employee Benefit Plans
We maintain a voluntary, contributory 401(k) plan for all eligible employees. Employees may elect to contribute up to 100% of their earnings, up to the IRS maximum for the plan year of participation. Additionally, eligible participants may also elect allowable catch-up contributions as provided for by the IRS. Our executive officers and other highly compensated employees are not eligible to participate in the 401(k) plan. Employee contributions are matched by the Company at a rate of 33% for the first 6% of deferred earnings. We contributed approximately $159,000, $129,000 and $129,000 in fiscal 2009, 2008 and 2007, respectively.
In April 2009, we also established the BJ’s Restaurants, Inc. Deferred Compensation Plan (“DCP”). The DCP is a non-qualified deferred compensation plan for our executive officers and other highly compensated employees as defined in the DCP who are otherwise ineligible for participation in our 401(k) plan. The DCP allows participating employees to defer the receipt of a portion of their base compensation and up to 100% of their eligible bonuses. Additionally, the DCP allows for a voluntary company match as determined by the Company’s compensation committee. During fiscal 2009, there were no contributions made or accrued by the Company. We pay for related administrative costs, which were not significant during fiscal 2009. Employee deferrals are deposited into a rabbi trust and the funds are generally invested in individual variable life insurance contracts owned by us that are specifically designed to informally fund savings plans of this nature. Our investment in variable life insurance contracts is reflected in “Other assets, net” on our Consolidated Balance Sheets. Our obligation to participating employees is reflected in noncurrent “Other liabilities.” All income and expenses related to the rabbi trust are reflected in our Consolidated Statements of Income.
F-22
Table of Contents
12. Related Party Transactions
As of December 29, 2009, we believe that Jacmar Companies and their affiliates (collectively referred to herein as “Jacmar”) owned approximately 15.9% of our outstanding common stock. Jacmar, through its specialty wholesale food distributorship, is currently our largest supplier of food, beverage and paper products servicing our restaurants in California and Nevada, while other system distributors service our restaurants in all other states. Jacmar also owns the Shakey’s pizza parlor chain. We believe that Jacmar sells products to us at prices comparable to those offered by unrelated third parties based on our extensive competitive bidding process in July 2006 and July 2009. Jacmar supplied us with $51.0 million, $46.8 million and $42.9 million of food, beverage and paper products for fiscal 2009, 2008 and 2007, respectively, which represent 47.9%, 49.5% and 53.4% of our total costs for these products, respectively. We had trade payables due to Jacmar related to these products of $3.6 million and $2.5 million at December 29, 2009 and December 30, 2008, respectively.
13. Selected Consolidated Quarterly Financial Data (Unaudited)
Our summarized unaudited consolidated quarterly financial data is as follows (in thousands, except per share data):
| March 31, 2009 |
June 30, 2009 |
September 29, 2009 |
December 29, 2009 | |||||||||
| Total revenues |
$ | 102,425 | $ | 107,743 | $ | 103,904 | $ | 112,635 | ||||
| Income from operations |
$ | 5,145 | $ | 6,201 | $ | 4,401 | $ | 3,955 | ||||
| Net income |
$ | 3,759 | $ | 4,389 | $ | 3,169 | $ | 1,721 | ||||
| Diluted net income per share |
$ | 0.14 | $ | 0.16 | $ | 0.12 | $ | 0.06 | ||||
| April 1, 2008 |
July 1, 2008 |
September 30, 2008 |
December 30, 2008 | |||||||||
| Total revenues |
$ | 86,822 | $ | 92,227 | $ | 95,751 | $ | 99,276 | ||||
| Income from operations |
$ | 3,665 | $ | 3,638 | $ | 2,283 | $ | 1,319 | ||||
| Net income |
$ | 3,120 | $ | 2,893 | $ | 2,040 | $ | 2,255 | ||||
| Diluted net income per share |
$ | 0.12 | $ | 0.11 | $ | 0.08 | $ | 0.08 | ||||
Diluted net income per share calculations for each quarter are based on the weighted average diluted shares outstanding for that quarter and may not total to the full year amount.
14. Subsequent Events
On January 7, 2010, we filed a shelf registration statement on Form S-3 with the U.S. Securities and Exchange Commission (“SEC”). The statement was declared effective by the SEC on January 28, 2010, and permits us to raise capital from time to time through the offer and sale of various types of securities not to exceed an aggregate value of $75 million. We do not have any immediate intentions or commitments to sell securities. The terms of any future offering of securities would be established at the time of such offering subject to market conditions. Any offering of securities covered by the shelf registration statement will be made only by means of a written prospectus and prospectus supplement. In addition, the Form S-3 also included the registration of 3,801,730 shares of common stock previously acquired by certain shareholders from the Company in various transactions several years ago. We have registered those shares to fulfill our contractual obligations under a registration rights agreement with those shareholders.
F-23