Attached files
UNITED STATES
SECURITIES AND EXCHANGE COMMISSION
Washington, D.C. 20549
FORM 10-K
(Mark One)
þ | ANNUAL REPORT PURSUANT TO SECTION 13 OR 15(d) OF THE SECURITIES EXCHANGE ACT OF 1934 |
For the fiscal year ended December 31, 2016
OR
¨ | TRANSITION REPORT PURSUANT TO SECTION 13 OR 15(d) OF THE SECURITIES EXCHANGE ACT OF 1934 |
For the transition period from ____________ to ____________
Commission file number 001-15827
VISTEON CORPORATION
(Exact name of registrant as specified in its charter)
State of Delaware | 38-3519512 |
(State or other jurisdiction of incorporation or organization) | (I.R.S. Employer Identification No.) |
One Village Center Drive, Van Buren Township, Michigan | 48111 |
(Address of principal executive offices) | (Zip code) |
Registrant’s telephone number, including area code: (800)-VISTEON
Securities registered pursuant to Section 12(b) of the Act:
Title of Each Class | Name of Each Exchange on which Registered |
Common Stock, par value $0.01 per share | New York Stock Exchange |
Securities registered pursuant to Section 12(g) of the Act:
Warrants, each exercisable for 1.4 shares of Common Stock at an exercise price of $0.01 (expiring October 1, 2020) (Title of class) |
Indicate by check mark if the registrant is a well-known seasoned issuer, as defined in Rule 405 of the Securities Act. Yes ü No __
Indicate by check mark if the registrant is not required to file reports pursuant to Section 13 or Section 15(d) of the Exchange Act.
Yes __ No ü
Indicate by check mark whether the registrant (1) has filed all reports required to be filed by Section 13 or 15(d) of the Securities Exchange Act of 1934 during the preceding 12 months (or for such shorter period that the registrant was required to file such reports), and (2) has been subject to such filing requirements for the past 90 days. Yes ü No__
Indicate by check mark whether the registrant has submitted electronically and posted on its corporate Web site, if any, every Interactive Data File required to be submitted and posted pursuant to Rule 405 of Regulation S-T (Section 232.405 of this chapter) during the preceding 12 months (or for such shorter period that the registrant was required to submit and post such files). Yes ü No __
Indicate by check mark if disclosure of delinquent filers pursuant to Item 405 of Regulation S-K is not contained herein, and will not be contained, to the best of registrant’s knowledge, in definitive proxy or information statements incorporated by reference in Part III of this Form 10-K or any amendment to this Form 10-K. ü
Indicate by check mark whether the registrant is a large accelerated filer, an accelerated filer, a non-accelerated filer, or a smaller reporting company. See the definitions of “large accelerated filer," "accelerated filer” and "smaller reporting company" in Rule 12b-2 of the Exchange Act.
Large accelerated filer ü Accelerated filer __ Non-accelerated filer __ Smaller reporting company __
Indicate by check mark whether the registrant is a shell company (as defined in Rule 12b-2 of the Exchange Act). Yes __ No ü
The aggregate market value of the registrant’s voting and non-voting common equity held by non-affiliates of the registrant on June 30, 2016 (the last business day of the most recently completed second fiscal quarter) was approximately $2.2 billion.
Indicate by check mark whether the registrant has filed all documents and reports required to be filed by Sections 12, 13 or 15(d) of the Securities Exchange Act of 1934 subsequent to the distribution of securities under a plan confirmed by a court. Yes ü No__
As of February 16, 2017, the registrant had outstanding 32,811,170 shares of common stock.
Document Incorporated by Reference
Document | Where Incorporated |
2017 Proxy Statement | Part III (Items 10, 11, 12, 13 and 14) |
1
Visteon Corporation and Subsidiaries
Index
Page | ||
2
Part I
Item 1. | Business |
Description of Business
Visteon Corporation (the "Company" or "Visteon") is a global automotive supplier that designs, engineers and manufactures innovative electronics products for nearly every original equipment vehicle manufacturer ("OEM") worldwide including Ford, Mazda, Nissan/Renault, General Motors, Honda BMW and Daimler. Visteon is headquartered in Van Buren Township, Michigan and has an international network of manufacturing operations, technical centers and joint venture operations, supported by approximately 10,000 employees, dedicated to the design, development, manufacture and support of its product offerings and its global customers. The Company's manufacturing and engineering footprint is principally located outside of the U.S., with a heavy concentration in low-cost geographic regions.
Visteon provides value for its customers and stockholders through its technology-focused vehicle cockpit electronics business, by delivering a rich, connected cockpit experience for every car from luxury to entry. The Company's cockpit electronics business is one of the broadest portfolios in the industry and includes instrument clusters, information displays, infotainment systems, audio systems, telematics solutions, and head up displays. The Company's vehicle cockpit electronics business comprises and is reported under the Electronics segment. In addition to the Electronics segment, the Company had residual operations in South America and Europe previously associated with the Interiors and Climate businesses, sold or exited by December 31, 2016, but not subject to discontinued operations classification that comprised Other.
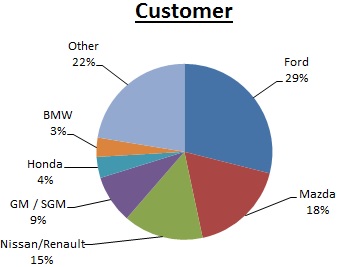
The pie charts below highlight the sales breakdown for Visteon's Electronics segment for the year ended December 31, 2016.


The Company’s History
The Company was incorporated in Delaware in January 2000 as a wholly owned subsidiary of Ford Motor Company (“Ford” or “Ford Motor Company”). Subsequently, Ford transferred the assets and liabilities comprising its automotive components and systems business to Visteon. The Company separated from Ford in June 2000 when all of the Company’s common stock was distributed by Ford to its shareholders. After filing for bankruptcy in 2009 as a result of the recession, the Company emerged from bankruptcy in 2010 and in 2012 implemented a comprehensive shareholder value creation plan which involved the transformation milestones below.
Transformation Milestones
The Company previously operated Climate, Interiors, and Electronics product lines. Over the last three years, the Company has transformed the business operations into a pure-play supplier of automotive cockpit electronics and connected car solutions.
A summary of the most recent milestones completing the transformation are summarized below:
• | Exit of Climate Business - On June 9, 2015, Visteon Corporation and its wholly owned subsidiary, VIHI, LLC (collectively, “Visteon”) completed the sale to Hahn & Co. Auto Holdings Co., Ltd. and Hankook Tire Co., Ltd. (together, the “Purchasers”) of all of its shares of Halla Visteon Climate Control Corporation, a Korean corporation (“HVCC”), for approximately $3.4 billion, or KRW 52,000 per share, after adjusting for the 2014 dividend paid by HVCC to Visteon (the “Climate Transaction”), pursuant to and in accordance with the Share Purchase Agreement, dated as of December 17, 2014, among Visteon and the Purchasers. The Company received net cash proceeds of approximately $2.7 billion and recognized a pretax gain of approximately $2.3 billion in connection with the closing of the Climate Transaction in the second quarter 2015. |
3
During the fourth quarter of 2016, the Company sold its South Africa climate operations with 2015 annual sales of $9 million for proceeds of $2 million, and recorded a loss of $11 million related to foreign currency translation amounts recorded in accumulated other comprehensive loss.
• | Exit of Interiors Business - During 2014, the Company divested the majority of its global Interiors business (the "Interiors Divestiture"). Subsequently, Visteon completed the sale of its Interiors operations in Thailand on February 2, 2015. On December 1, 2016 the Company completed the sale of its Interiors operations in Argentina and Brazil, incurring a loss of $19 million representing the final working capital cash contribution and related contractual obligations, representing the completion of the Interiors Divestiture. |
On December 1, 2015, Visteon completed the sale and transfer of its equity ownership in Visteon Deutschland GmbH, which operated the Berlin, Germany interiors plant ("Germany Interiors Divestiture"). The Company contributed cash, of approximately $141 million, assets of $27 million, and liabilities of $198 million including pension related liabilities. The Company will make a final contribution payment of approximately $31 million during the first half of 2017 upon fulfillment of buyer contractual commitments, included in the Company's consolidated balance sheet as "Other current liabilities" as of December 31, 2016.
• | Enhance Shareholder Returns - In connection with the Climate Transaction, the Company returned approximately $2.75 billion of cash to shareholders through 2016 via a series of actions including share buybacks and special distributions. |
During 2015, the Company entered into two share buyback programs. Under the first program, the Company repurchased 4,771,262 shares of common stock at an average settlement price of $104.79. The first buyback program concluded in 2015. The second program started during the fourth quarter of 2015 and concluded on March 1, 2016. Under the second program, the Company paid approximately $105 million to repurchase 1,607,849 shares at an average price of $65.05.
On December 9, 2015, the Company declared a special distribution of $43.40 per share of its common stock outstanding as of January 15, 2016, or approximately $1.75 billion in the aggregate. On January 22, 2016 approximately $1.74 billion was distributed to shareholders. An additional amount of approximately $15 million will be paid over a two-year period as related to the vesting and settlement of restricted stock units and performance-based share units previously granted to the Company's employees. These amounts were classified as "Distribution payable" on the Consolidated Balance Sheets as of December 31, 2016 and 2015.
On March 1, 2016, the Company entered into an accelerated share buyback ("ASB") program with a third-party financial institution to purchase shares of Visteon common stock for an aggregate purchase price of $395 million. Under the program, the Company paid the financial institution $395 million and received an initial delivery of 4,370,678 shares of common stock using a reference price of $72.30. The program was concluded on October 14, 2016 and the Company received an additional 1,211,979 shares. In total, the Company purchased 5,582,657 shares at an average price of $70.75 under this ASB program.
On January 10, 2017, the Company's Board of Directors authorized a share repurchase program of up to $400 million of common stock to be executed through March 2018.
The Company's strategic initiatives going forward are outlined in Item 7 "Executive Summary" of this Report.
The Company’s Industry
The Company operates in the automotive industry, which is cyclical and highly sensitive to general economic conditions. The Company believes that future success in the automotive industry is, in part, dependent on alignment with customers to support their efforts to effectively meet the challenges associated with the following significant trends and developments in the global automotive industry.
• | Electronic content and connectivity - The electronic content of vehicles continues to increase due to various regulatory requirements and consumer demand for increased vehicle performance and functionality. The use of electronic components can reduce weight, expedite assembly, enhance fuel economy, improve emissions, increase safety and enhance vehicle performance. Additionally, digital and portable technologies have dramatically influenced the lifestyle of today’s consumers, who expect products that enable such a lifestyle. This requires increased electronic and technical content such as in-vehicle communication, navigation and entertainment capabilities. While original equipment manufacturers ("OEMs") are taking different paths to connect their vehicles to high-speed broadband internet connections in the short-term, future vehicles are expected to be built with vehicle-to-vehicle connectivity systems. There is momentum by OEMs to integrate discrete electronic |
4
control units into a multi-core domain controller to increase efficiency and reduce power consumption, cost and weight. The industry continues to advance toward semi-autonomous and autonomous vehicles.
• | Safety - Governments continue to focus regulatory efforts on safer transportation. Accordingly, OEMs are working to improve occupant and pedestrian safety by incorporating more safety-oriented content in their vehicles. Suppliers must enable the safety initiatives of their customers including the development of new technologies. |
• | Vehicle standardization - OEMs continue to standardize vehicle platforms on a global basis, resulting in a lower number of individual vehicle platforms, design cost savings and further scale of economies through the production of a greater number of models from each platform. Having operations in the geographic markets in which OEMs produce global platforms enables suppliers to meet OEMs’ needs more economically and efficiently, thus making global coverage a source of significant competitive advantage for suppliers with a diverse global footprint. Additionally, OEMs are looking to suppliers for increased collaboration to lower costs, reduce risks and decrease overall time to market. Suppliers that can provide fully engineered solutions, systems and pre-assembled combinations of component parts are positioned to leverage the trend toward system sourcing. |
Financial Information about Segments
The Company's operating structure is organized by global product group, including Electronics and Other. These global product groups have financial and operating responsibility over the design, development and manufacture of the Company's product portfolio. The Company's reportable segments are as follows:
• | Electronics - The Company's Electronics segment provides vehicle cockpit electronics products including instrument clusters, information displays, infotainment systems, audio systems, telematics solutions, and head up displays. |
• | Other - Other includes South Africa operations sold on November 1, 2016 and South America operations substantially exited during the fourth quarter of 2016, previously associated with the Climate business but not subject to the Climate Transaction. During 2015 and 2014, Other also included the Berlin, Germany operations previously associated with the Interiors business and sold during the fourth quarter of 2015. |
Refer to Note 22 “Segment Information” in Item 8 of this Report for more information about the Company’s reportable segments.
The Company’s Products
The Company designs and manufacturers vehicle cockpit electronics components, modules and systems further described as follows:
Instrument Clusters
The Company offers a full line of instrument clusters, from standard analog gauge clusters to high-resolution, all-digital, fully reconfigurable, 2-D and 3-D display-based devices. These support all vehicle segments, including motorcycles. These clusters can use a wide range of display technologies, graphic capabilities and decorative elements, including organic light-emitting diode ("OLED"), free-form and curved displays. Premium clusters support complex 3-D graphics and features such as driver awareness and camera inputs.
Information Displays
The Company offers a range of information displays incorporating a sleek profile, craftsmanship and touch sensors, designed to deliver high performance for the automotive market. These displays can integrate a range of user interface technologies and graphics management capabilities, such as 3-D, dual view, cameras, optics and dual (OLED) displays.
Infotainment Systems
The Company offers a range of infotainment platforms from entry to high-end solutions. Visteon’s entry offering is designed to allow vehicle occupants to easily connect their mobile devices to the system and safely access phone functions, listen to music, stream media and enable mobile connectivity applications through Apple CarPlay®, Android Auto and Baidu CarLife. The Company’s Phoenix™ next-generation infotainment platform enables third-party developers to create apps easily while delivering built-in security and over-the-air updates. It facilitates app creation through a software development kit ("SDK") and software simulation of the target hardware system.
5
Audio Systems
The Company offers a range of audio products, including audio head units, amplifiers, and analog and digital radios, which deliver consumer device connectivity.
Telematics Solutions
The Company provides a cost-optimized, high-speed telematics control unit to enable secure connected car services, software updates and data. The Company’s telematics solution uses a single hardware and flexible software architecture to support regional telematics service providers and mobile networks. The Company’s wireless gateway platform is designed to meet future connectivity requirements including 4G, V2X, Wi-Fi® and next-generation mobile standards such as 5G. The Company also offers a hands-free telephone unit that provides Bluetooth® and USB connectivity.
Smartcore™ Cockpit Domain Controller
The Company offers an automotive-grade, integrated domain controller approach, called Smartcore™, which can independently operate the infotainment system, instrument cluster and potentially other features on a single, multi-core chip to improve efficiency and reduce power consumption and cost.
Head-Up Displays
The Company provides a complete line of head-up displays ("HUD") that present critical information to the driver in a convenient location and at a comfortable focal distance. Combiner HUD projects a virtual image in front of the driver using a compact, transparent screen mounted on top of the instrument panel. Windshield HUD projects the image directly on the vehicle windscreen. The Company has demonstrated an augmented reality system that overlays graphics in the driver’s line of sight to represent objects in the vehicle’s path; provides navigation guidance; and displays relevant information, such as a lane departure warning.
The Company’s Customers
The Company sells its products primarily to global vehicle manufacturers including Ford, Mazda, Nissan/Renault, General Motors, Honda, BMW and Daimler. Ford, Mazda and Nissan/Renault are the Company's largest customers and in 2016 accounted for sales of approximately 30%, 17% and 15%, respectively. In 2015 and 2014, Ford accounted for 34% and 41%, respectively. Mazda and Nissan/Renault accounted for 16% and 14% of sales for 2015 and did not individually account for greater than 10% of sales for 2014.
The Company records revenue when persuasive evidence of an arrangement exists, delivery occurs or services are rendered, the sales price or fee is fixed or determinable and collectibility is reasonably assured. Price reductions are typically negotiated on an annual basis between suppliers and OEMs. Such reductions are intended to take into account expected annual reductions in the overall cost to the supplier of providing products and services to the customer, through such factors as manufacturing productivity enhancements, material cost reductions and design-related cost improvements. The Company has an aggressive cost reduction program that focuses on reducing its total costs, which are intended to offset customer price reductions. However, there can be no assurance that the Company’s cost reduction efforts will be sufficient to fully offset such price reductions. The Company records price reductions when probable and reasonably estimable.
The Company’s Competition
The automotive sector is concentrated, but operates under highly competitive conditions resulting from the globalized nature of the industry, high fixed costs and the resulting need for scale economies, market dynamics including share in mature economies and positioning in emerging economies, and the low cost of switching for the end consumer. Accordingly, OEMs rigorously evaluate suppliers on the basis of financial viability, product quality, price competitiveness, technical expertise and development capability, new product innovation, reliability and timeliness of delivery, product design and manufacturing capability and flexibility, customer service and overall management. The Company's primary independent competitors include Alpine Electronics, Continental AG, Delphi Automotive PLC, Denso Corporation, Harman International, Nippon Seiki, Panasonic Corporation, Pioneer Corporation, and Robert Bosch GmbH.
6
The Company’s Product Sales Backlog
The Company defines backlog as cumulative remaining life-of-program expected net sales, launching in future periods. The Company’s Electronics segment backlog was $16.5 billion as of December 31, 2016, compared to $14.9 billion as of December 31, 2015, reflecting an increase of 10.7%. The Company’s estimated net sales may be impacted by various assumptions, including new program vehicle production levels, customer price reductions, currency exchange rates and program launch timing. In addition, the Company typically enters into customer agreements at the beginning of a vehicle life cycle with the intent to fulfill purchasing requirements for the entire vehicle production life cycle. These agreements may be terminated by customers at any time and, accordingly, expected net sales information does not represent firm orders or firm commitments.
The Company’s Business is Seasonal and Cyclical
Historically, the Company’s business has been moderately seasonal because its largest North American customers typically cease production for approximately two weeks in July for model year changeovers and approximately one week in December during the winter holidays. Customers in Europe historically shut down vehicle production during a portion of August and one week in December. In China, customers typically shut down approximately one week in early October and one week in January or February. Additionally, third quarter automotive production traditionally is lower as new vehicle models enter production.
The Company’s Workforce and Employee Relations
The Company’s workforce as of December 31, 2016 included approximately 10,000 persons, of which approximately 5,000 were salaried employees and 5,000 were hourly workers. Many of the Company’s employees are members of industrial trade unions and confederations within their respective countries, including Europe, Asia and South America. Many of these organizations operate under collectively bargained contracts that are not specific to any one employer. The Company constantly works to establish and maintain positive, cooperative relations with its unions and work representatives around the world and believes that its relationships with unionized employees are satisfactory.
The Company’s Product Research and Development
The Company’s research and development efforts are intended to maintain leadership positions in core products and provide the Company with a competitive edge as it seeks additional business with new and existing customers. The Company also works with technology development partners, including customers, to develop technological capabilities and new products and applications. Total research and development expenditures, net of recoveries were approximately $295 million, $294 million and $257 million in 2016, 2015 and 2014, respectively.
The Company’s Intellectual Property
The Company owns significant intellectual property, including a number of patents, copyrights, proprietary tools and technologies and trade secrets and is involved in numerous licensing arrangements. Although the Company’s intellectual property plays an important role in maintaining its competitive position, no single patent, copyright, proprietary tool or technology, trade secret or license, or group of related patents, copyrights, proprietary tools or technologies, trade secrets or licenses is, in the opinion of management, of such value to the Company that its business would be materially affected by the expiration or termination thereof. The Company’s general policy is to apply for patents on an ongoing basis, in appropriate countries, on its patentable developments which are considered to have commercial significance.
The Company also views its name and mark as significant to its business as a whole. In addition, the Company holds rights in a number of other trade names and marks applicable to certain of its businesses and products that it views as important to such businesses and products.
The Company’s Raw Materials and Suppliers
Raw materials used by the Company in the manufacture of its products include resins, copper, precious metals, steel and electronics components. All of the materials used are generally available from numerous sources. In general, the Company does not carry inventories of raw materials in excess of those reasonably required to meet production and shipping schedules. As of December 31, 2016 the Company had not experienced any other significant shortages of raw materials. The Company monitors its supply base and endeavors to work with suppliers and customers to attempt to mitigate the impact of potential material shortages and supply disruptions. While the Company does not anticipate any significant interruption in the supply of raw materials, there can be no assurance that sufficient sources or amounts of all necessary raw materials will be available in the future.
7
The automotive supply industry is subject to inflationary pressures with respect to raw materials which have historically placed operational and financial burdens on the entire supply chain. Accordingly, the Company continues to take actions with its customers and suppliers to mitigate the impact of these inflationary pressures in the future. Actions to mitigate inflationary pressures with customers include collaboration on alternative product designs and material specifications, contractual price escalation clauses and negotiated customer recoveries. Actions to mitigate inflationary pressures with suppliers include aggregation of purchase requirements to achieve optimal volume benefits, negotiation of cost reductions and identification of more cost competitive suppliers. While these actions are designed to offset the impact of inflationary pressures, the Company cannot provide assurance that it will be successful in fully offsetting increased costs resulting from inflationary pressures.
The Company’s International Operations
Financial information about sales and net property by major geographic region can be found in Note 22, Segment Information, included in Item 8 “Financial Statements and Supplementary Data” of this Report. The attendant risks of the Company’s international operations are primarily related to currency fluctuations, changes in local economic and political conditions, and changes in laws and regulations. The following table presents the Company’s sales and net property and equipment by geographic region as a percentage of such consolidated total amounts.
Sales | Property and Equipment, Net | |||||||||||||
Year Ended December 31 | December 31 | |||||||||||||
2016 | 2015 | 2014 | 2016 | 2015 | ||||||||||
United States | 26 | % | 26 | % | 29 | % | 4 | % | 4 | % | ||||
Mexico | 2 | % | 2 | % | 2 | % | 14 | % | 17 | % | ||||
Total North America | 28 | % | 28 | % | 31 | % | 18 | % | 21 | % | ||||
Portugal | 14 | % | 13 | % | 18 | % | 18 | % | 16 | % | ||||
Slovakia | 9 | % | 8 | % | 5 | % | 8 | % | 8 | % | ||||
Germany | — | % | 3 | % | 4 | % | 1 | % | 1 | % | ||||
Tunisia | 5 | % | 6 | % | 4 | % | 3 | % | 4 | % | ||||
France | 4 | % | 4 | % | 3 | % | 6 | % | 7 | % | ||||
Other Europe | 2 | % | 3 | % | 3 | % | 2 | % | 4 | % | ||||
Intra-region eliminations | (1 | )% | (2 | )% | (2 | )% | — | % | — | % | ||||
Total Europe | 32 | % | 35 | % | 35 | % | 38 | % | 40 | % | ||||
China | 22 | % | 21 | % | 22 | % | 22 | % | 20 | % | ||||
Japan | 16 | % | 15 | % | 9 | % | 5 | % | 3 | % | ||||
Thailand | 3 | % | 3 | % | 2 | % | 3 | % | 3 | % | ||||
India | 2 | % | 2 | % | 3 | % | 7 | % | 7 | % | ||||
Korea | 1 | % | 1 | % | 1 | % | — | % | — | % | ||||
Intra-region eliminations | (5 | )% | (5 | )% | (3 | )% | — | % | — | % | ||||
Total Asia | 39 | % | 37 | % | 34 | % | 37 | % | 33 | % | ||||
South America | 3 | % | 4 | % | 7 | % | 7 | % | 6 | % | ||||
Inter-region eliminations | (2 | )% | (4 | )% | (7 | )% | — | % | — | % | ||||
100 | % | 100 | % | 100 | % | 100 | % | 100 | % | |||||
Impact of Environmental Regulations on the Company
The Company is subject to the requirements of federal, state, local and foreign environmental and occupational safety and health laws and regulations. These include laws regulating air emissions, water discharge and waste management. The Company is also subject to environmental laws requiring the investigation and cleanup of environmental contamination at properties it presently owns or operates and at third-party disposal or treatment facilities to which these sites send or arranged to send hazardous waste. The Company makes capital expenditures in the normal course of business as necessary to ensure that its facilities are in compliance with applicable environmental laws and regulations. During 2016, capital expenditures associated with environmental compliance were not material nor did such expenditures have a materially adverse effect on the Company’s earnings or competitive position.
The Company is aware of contamination at some of its properties. The Company is in various stages of investigation and cleanup at these sites and at December 31, 2016, has recorded a reserve of less than $1 million. However, estimating liabilities for environmental investigation and cleanup is complex and dependent upon a number of factors beyond the Company’s control and which may change dramatically. Accordingly, although the Company believes its reserve is adequate based on current information,
8
the Company cannot provide any assurance that its ultimate environmental investigation and cleanup costs and liabilities will not exceed the amount of its current reserve.
The Company’s Website and Access to Available Information
The Company’s current and periodic reports filed with the United States Securities and Exchange Commission (“SEC”), including amendments to those reports, may be obtained through its internet website at www.visteon.com free of charge as soon as reasonably practicable after the Company files these reports with the SEC. A copy of the Company’s code of business conduct and ethics for directors, officers and employees of Visteon and its subsidiaries, entitled “Ethics and Integrity Policy,” the Corporate Governance Guidelines adopted by the Company’s Board of Directors and the charters of each committee of the Board of Directors are also available on the Company’s website. A printed copy of the foregoing documents may be requested by contacting the Company’s Investor Relations department in writing at One Village Center Drive, Van Buren Township, MI 48111; by phone (734) 710-5800; or via email at investor@visteon.com.
Item 1A. | Risk Factors |
The risks and uncertainties described below are not the only ones facing the Company. Risks attributable to all registrants are not included below. Additional risks and uncertainties, including those not presently known or that the Company believes to be immaterial, also may adversely affect the Company’s results of operations and financial condition. Should any such risks and uncertainties develop into actual events, these developments could have material adverse effects on the Company’s business and financial results.
The Company’s substantial international operations make it vulnerable to risks associated with doing business in foreign countries.
The Company has manufacturing and distribution facilities in many foreign countries, including Mexico and countries in Europe, South America and Asia. International operations are subject to certain risks inherent in doing business abroad, including:
• | changes to international trade agreements; |
• | local economic conditions, expropriation and nationalization, foreign exchange rate fluctuations and currency controls; |
• | withholding, border, and other taxes on remittances and other payments by subsidiaries; |
• | investment restrictions or requirements; |
• | export and import restrictions, including increases in border taxes; and |
• | increases in working capital requirements related to long supply chains. |
In particular, if the United States withdraws from or materially modifies the North American Free Trade Agreement, or any other international trade agreement with one of the countries in which the Company operates, or implements increases in border taxes, there could be a significantly adverse effect on the Company's financial condition, operating results and cash flows.
In addition, the Company has invested significantly in joint ventures with other parties to conduct business in China and elsewhere in Asia. The Company’s ability to repatriate funds from these joint ventures depends not only upon their uncertain cash flows and profits, but also upon the terms of particular agreements with the Company’s joint venture partners and maintenance of the legal and political status quo. As a result, the Company’s exposure to the risks described above is substantial. The likelihood of such occurrences and its potential effect on the Company vary from country to country and are unpredictable. However, any such occurrences could be harmful to the Company’s business and the Company’s profitability and financial condition.
The Company must continue to develop, introduce and achieve market acceptance of new and enhanced products in order to grow its sales in the future.
The growth of the Company's business will be dependent on the demand for innovative automotive electronics products. In order to increase sales in current markets and gain entry into new markets, the Company must innovate to maintain and improve existing products, including software, while successfully developing and introducing distinctive new and enhanced products that anticipate changing customer and consumer preferences and capitalize upon emerging software technologies. However, the Company may experience difficulties that delay or prevent the development, introduction or market acceptance of its new or enhanced products, or undiscovered software errors, bugs and defects in its products may injure the Company's reputation. Furthermore, competitors may develop and introduce technologies that gain greater customer or consumer acceptance, which could adversely affect the future growth of the Company.
9
The Company’s ability to effectively operate could be hindered if it fails to attract and retain key personnel.
The Company’s ability to operate its business and implement its strategies effectively depends, in part, on the efforts of its executive officers and other key employees. In addition, the Company’s future success will depend on, among other factors, the ability to attract and retain qualified personnel, particularly engineers and other employees with critical expertise and skills that support key customers and products or in emerging regions. The loss of the services of any key employees or the failure to attract or retain other qualified personnel could have a material adverse effect on the Company’s business.
Warranty claims, product liability claims and product recalls could harm the Company’s business, results of operations and financial condition.
The Company faces the inherent business risk of exposure to warranty and product liability claims in the event that its products fail to perform as expected or such failure results, or is alleged to result, in bodily injury or property damage (or both). In addition, if any of the Company’s designed products are defective or are alleged to be defective, the Company may be required to participate in a recall campaign. As suppliers become more integrally involved in the vehicle design process and assume more of the vehicle assembly functions, automakers are increasingly expecting them to warrant their products and are increasingly looking to suppliers for contributions when faced with product liability claims or recalls. A successful warranty or product liability claim against the Company in excess of its available insurance coverage and established reserves, or a requirement that the Company participate in a product recall campaign, could have materially adverse effects on the Company’s business, results of operations and financial condition.
Developments or assertions by or against the Company relating to intellectual property rights could materially impact its business.
The Company owns significant intellectual property, including a number of patents, trademarks, copyrights and trade secrets, and is involved in numerous licensing arrangements. The Company’s intellectual property plays an important role in maintaining its competitive position in a number of the markets served. Developments or assertions by or against the Company relating to intellectual property rights could materially impact the Company’s business. Significant technological developments by others also could materially and adversely affect the Company’s business and results of operations and financial condition.
The discontinuation of, loss of business or lack of commercial success, with respect to a particular vehicle model for which the Company is a significant supplier could reduce the Company’s sales and harm its profitability.
Although the Company has purchase orders from many of its customers, these purchase orders generally provide for the supply of a customer’s annual requirements for a particular vehicle model and assembly plant, or in some cases, for the supply of a customer’s requirements for the life of a particular vehicle model, rather than for the purchase of a specific quantity of products. In addition, it is possible that customers could elect to manufacture components internally that are currently produced by outside suppliers, such as the Company. The discontinuation of, the loss of business with respect to or a lack of commercial success of a particular vehicle model for which the Company is a significant supplier, could reduce the Company’s sales and harm the Company’s profitability.
The automotive industry is cyclical and significant declines in the production levels of the Company’s major customers could reduce the Company’s sales and harm its profitability.
Demand for the Company’s products is directly related to the automotive vehicle production of the Company’s major customers. Automotive sales and production is cyclical and can be affected by general economic or industry conditions, labor relations issues, fuel prices, regulatory requirements, government initiatives, trade agreements, the cost and availability of credit and other factors.
The Company is highly dependent on Ford Motor Company and decreases in such customers’ vehicle production volumes would adversely affect the Company.
Ford is one of the Company’s largest customers and accounted for 30%, 34% and 41% of sales in 2016, 2015 and 2014, respectively. Accordingly, any change in Ford's vehicle production volumes may have a significant impact on the Company’s sales volume and profitability.
The Company's inability to effectively manage the timing, quality and costs of new program launches could adversely affect its financial performance.
In connection with the award of new business, the Company often obligates itself to deliver new products and services that are subject to its customers’ timing, performance and quality standards. Additionally, as a Tier 1 supplier, the Company must effectively coordinate the activities of numerous suppliers in order to launch programs successfully. Given the complexity of new program
10
launches, especially involving new and innovative technologies, the Company may experience difficulties managing product quality, timeliness and associated costs. In addition, new program launches require a significant ramp up of costs; however, the sales related to these new programs generally are dependent upon the timing and success of the introduction of new vehicles by the Company's customers. The Company's inability to effectively manage the timing, quality and costs of these new program launches could adversely affect its financial condition, operating results and cash flows.
The Company’s pension expense and funding levels of pension plans could materially deteriorate or the Company may be unable to generate sufficient excess cash flow to meet increased pension benefit obligations.
The Company’s assumptions used to calculate pension obligations as of the annual measurement date directly impact the expense to be recognized in future periods. While the Company’s management believes that these assumptions are appropriate, significant differences in actual experience or significant changes in these assumptions may materially affect the Company’s pension obligations and future expense. For more information on sensitivities to changing assumptions, please see “Critical Accounting Estimates” in Item 7 and Note14 “Employee Benefit Plans” in Item 8 of this report.
The Company’s expected annual effective tax rate could be volatile and could materially change as a result of changes in mix of earnings and other factors.
Changes in the Company’s debt and capital structure, among other items, may impact its effective tax rate. The Company is in a position whereby losses incurred in certain tax jurisdictions generally provide no current financial statement benefit. In addition, certain jurisdictions have statutory rates greater than or less than the United States statutory rate. As such, changes in the mix and source of earnings between jurisdictions could have a significant impact on the Company’s overall effective tax rate in future periods. Changes in tax law and rates, changes in rules related to accounting for income taxes or adverse outcomes from tax audits that regularly are in process in any of the jurisdictions in which the Company operates could also have a significant impact on the Company’s overall effective rate in future periods.
The Company may not be able to fully utilize its U.S. net operating losses and other tax attributes.
Visteon's emergence from bankruptcy in 2010 resulted in a change of ownership within the meaning of Internal Revenue Code (“IRC”) Sections 382 and 383, causing the use of Visteon's pre-emergence U.S. federal net operating loss (“NOL”) and various other tax attributes to be limited in the post-emergence period. However, NOLs and other tax attributes generated in the post-emergence period are generally not limited by the emergence from bankruptcy, but could be limited if there is a subsequent change of ownership. If the Company were to have another change of ownership within the meaning of IRC Sections 382 and 383, its post-emergence NOL and other tax attributes could be limited to an amount equal to its market capitalization at the time of the subsequent ownership change multiplied by the federal long-term tax exempt rate. The Company cannot provide any assurance that such an ownership change will not occur, in which case the availability of the Company's NOLs and other tax attributes could be significantly limited or possibly eliminated. Certain tax benefit preservation provisions of its corporate documents could delay or prevent a change of control, even if that change would be beneficial to stockholders.
Privacy and security concerns relating to the Company's current or future products and services could damage its reputation and deter current and potential users from using them.
The Company may gain access to sensitive, confidential or personal data or information that is subject to privacy and security laws, regulations and customer-imposed controls. Concerns about the Company's practices with regard to the collection, use, disclosure, or security of personal information or other privacy related matters, even if unfounded, could damage its reputation and adversely affect its operating results.
Furthermore, regulatory authorities around the world are considering a number of legislative and regulatory proposals concerning cybersecurity and data protection. In addition, the interpretation and application of consumer and data protection laws in the U.S., Europe and elsewhere are often uncertain and in flux. Complying with these various laws could cause the Company to incur substantial costs.
Escalating price pressures from customers may adversely affect the Company’s business.
Downward pricing pressures by automotive manufacturers, while characteristic of the automotive industry, is increasing. Virtually all automakers have implemented aggressive price reduction initiatives and objectives each year with their suppliers, and such actions are expected to continue in the future. In addition, estimating such amounts is subject to risk and uncertainties because any price reductions are a result of negotiations and other factors. Accordingly, suppliers must be able to reduce their operating costs in order to maintain profitability. The Company has taken steps to reduce its operating costs and other actions to offset customer price reductions; however, price reductions have impacted the Company’s sales and profit margins and are expected to
11
continue to do so in the future. If the Company is unable to offset customer price reductions in the future through improved operating efficiencies, new manufacturing processes, sourcing alternatives and other cost reduction initiatives, the Company’s results of operations and financial condition will likely be adversely affected.
The Company could be negatively impacted by the distress of its supplier or other shortages.
In an effort to manage and reduce the costs of purchased goods and services, the Company, like many suppliers and automakers, has been consolidating its supply base. In addition, certain materials and components used by the Company are in high demand but of limited availability. As a result, the Company is dependent on single or limited sources of supply for certain components used in the manufacture of its products. The Company selects its suppliers based on total value (including price, delivery and quality), taking into consideration production capacities and financial condition. However, there can be no assurance that strong demand, capacity limitations or other problems experienced by the Company’s suppliers will not result in occasional shortages or delays in the supply of components. If the Company were to experience a significant or prolonged shortage of critical components from any of its suppliers, particularly those who are sole sources, and could not procure the components from other sources, the Company would be unable to meet its production schedules for some of its key products or to ship such products to its customers in a timely fashion, which would adversely affect sales, margins, and customer relations. Furthermore, unfavorable economic or industry conditions could result in financial distress within the Company's supply base, thereby increasing the risk of supply disruption. Although market conditions generally have improved in recent years, uncertainty remains and another economic downturn or other unfavorable industry conditions in one or more of the regions in which the Company operates could cause a supply disruption and thereby adversely affect the Company's financial condition, operating results and cash flows.
Work stoppages and similar events could significantly disrupt the Company’s business.
Because the automotive industry relies heavily on just-in-time delivery of components during the assembly and manufacture of vehicles, a work stoppage at one or more of the Company’s manufacturing and assembly facilities could have material adverse effects on the business. Similarly, if one or more of the Company’s customers were to experience a work stoppage, that customer would likely halt or limit purchases of the Company’s products, which could result in the shutdown of the related manufacturing facilities. A significant disruption in the supply of a key component due to a work stoppage at one of the Company’s suppliers or any other supplier could have the same consequences, and accordingly, have a material adverse effect on the Company’s financial results.
The Company may incur significant restructuring charges.
The Company has taken, and expects to take, restructuring actions to realign and resize its production capacity and cost structure to meet current and projected operational and market requirements. Charges related to these actions could have a material adverse effect on the Company's financial condition, operating results and cash flows. Moreover, there can be no assurances that any future restructuring will be completed as planned or achieve the desired results.
A disruption in the Company's information technology systems could adversely affect its business and financial performance.
The Company relies on the accuracy, capacity and security of its information technology systems. Despite the security and risk-prevention measures we have implemented, the Company's systems could be breached, damaged or otherwise interrupted by computer viruses, unauthorized physical or electronic access or other natural or man-made incidents or disasters. Such a breach or interruption could result in business disruption, theft of the Company intellectual property or trade secrets and unauthorized access to personnel information. To the extent that business is interrupted or data is lost, destroyed or inappropriately used or disclosed, such disruptions could adversely affect competitive position, relationships with customers, financial condition, operating results and cash flows.
The Company is involved from time to time in legal proceedings and commercial or contractual disputes, which could have an adverse effect on its business, results of operations and financial position.
The Company is involved in legal proceedings and commercial or contractual disputes that, from time to time, are significant. These are typically claims that arise in the normal course of business including, without limitation, commercial or contractual disputes (including disputes with suppliers), intellectual property matters, personal injury claims and employment matters. No assurances can be given that such proceedings and claims will not have a material adverse impact on the Company’s profitability and financial position.
12
The Company is subject to significant foreign currency risks and foreign exchange exposure.
As a result of Visteon global presence, a significant portion of the Company's revenues and expenses is denominated in currencies other than the U.S. dollar. The Company is therefore subject to foreign currency risks and foreign exchange exposure. The Company's primary exposures are to the Euro, Japanese Yen, Mexican Peso and Chinese Renminbi. While the Company employs financial instruments to hedge transactional foreign exchange exposure, including multi-year contracts, exchange rates are difficult to predict and such actions may not insulate the Company' completely from those exposures. As a result, volatility in certain exchange rates could adversely impact Visteon financial results and comparability of results from period to period.
Item 1B. | Unresolved Staff Comments |
None
Item 2. | Properties |
The Company's principal executive offices are located in Van Buren Township, Michigan. At December 31, 2016, the Company and its consolidated subsidiaries owned or leased approximately:
• | 31 corporate offices, technical and engineering centers and customer service centers in twelve countries around the world, of which 30 were leased and 1 was owned. |
• | 17 Electronics manufacturing and/or assembly facilities in Mexico, Portugal, Russia, Slovakia, France, Tunisia, India, Japan, South Korea, China, Thailand and Brazil, of which 13 were leased and 4 were owned. |
In addition, the Company's non-consolidated affiliates operate approximately 6 manufacturing and/or assembly locations, primarily in the Asia Pacific region. The Company considers its facilities to be adequate for its current uses.
Item 3. | Legal Proceedings |
Certain legal proceedings in which we are involved are discussed in Note 21 - "Commitments and Contingencies" of Part II, Item 8 "Financial Statements and Supplementary Data" and should be considered an integral part of Part I, Item 3 "Legal Proceedings."
Item 4. | Mine Safety Disclosures |
None
13
Item 4A. Executive Officers and Key Employees
The following table shows information about the executive officers of the Company and other key employees. Ages are as of February 1, 2017:
Name | Age | Position | ||
Sachin S. Lawande | 49 | Director, President and Chief Executive Officer | ||
Christian A. Garcia | 53 | Executive Vice President and Chief Financial Officer | ||
Sunil K. Bilolikar | 55 | Senior Vice President, Operations and Procurement | ||
Matthew M. Cole | 47 | Senior Vice President, Product Development Engineering | ||
Steven S. Fitzgerald | 52 | Senior Vice President and Chief Human Resources Officer | ||
Brett D. Pynnonen | 48 | Senior Vice President and General Counsel | ||
Markus J. Schupfner | 47 | Senior Vice President and Chief Technology Officer | ||
Robert R. Vallance | 56 | Senior Vice President, Customer Business Groups | ||
William M. Robertson | 55 | Vice President, Operations Finance and Investor Relations | ||
Stephanie S. Marianos | 48 | Vice President and Chief Accounting Officer | ||
Sachin S. Lawande has been Visteon’s Chief Executive Officer, President and a director of the Company since June 29, 2015. Before joining Visteon, Mr. Lawande served as Executive Vice President and President, Infotainment Division of Harman International Industries, Inc., an automotive supplier, from July 2013 to June 2015. From July 2011 to June 2013, he served as Executive Vice President and President of Harman’s Lifestyle Division, and from July 2010 to June 2011 as Executive Vice President and Co-President, Automotive Division. Prior to that he served as Harman’s Executive Vice President and Chief Technology Officer since February 2009. Mr. Lawande joined Harman International in 2006, following senior roles at QNX Software Systems and 3Com Corporation. He also serves on the board of directors of Computer Sciences Corporation.
Christian A. Garcia has been Visteon’s Executive Vice President and Chief Financial Officer since October 2016. Prior to joining the Company, Mr. Garcia served as Senior Vice President, Finance and Interim Chief Financial Officer of Hallibuton Company, a global provider of products and services to the energy sector, from January 2015 to August 2016. From January 2014 to December 2015, he served as Halliburton’s Chief Accounting Officer and from September 2011 to December 2014 as Halliburton’s Treasurer. Prior to that, he was Senior Vice President, Investor Relations of Halliburton from January 2011 to August 2011. He also held a series of senior financial positions with Landmark Graphics, a software and consulting provider that was acquired by Halliburton. Prior to joining Landmark Graphics, he worked at Bell and Howell and San Miguel Corp. in the Philippines in various roles.
Sunil K. Bilolikar has been Visteon’s Senior Vice President, Operations and Purchasing since December 2016. Prior to that, he was Group Vice President, Operations and Purchasing since July 2014, Global Director, Operations and Purchasing from January 2012 to June 2014, and Global Director, Operations from 2005 to 2012. During his career with Visteon and Ford Motor Company, he has held several engineering and operations leadership positions in the U.S., Canada, India, Portugal and Germany.
Matthew M. Cole has been Visteon’s Senior Vice President, Product Development since December 2016. Prior to that, he was Vice President, Product Development upon rejoining the Company in July 2014. From July 2011 to June 2014, he served as Vice President, Engineering at Johnson Controls, Inc., an automotive supplier. From July 2010 to June 2011, he served as Johnson Control’s Vice President, Product Management. Prior to that, he spent 19 years at Ford Motor Company and Visteon in product development, engineering and leadership positions in the U.S. and Asia.
Steven S. Fitzgerald has been Visteon’s Senior Vice President and Chief Human Resources Officer since December 2016. Prior to that, he was Vice President and Chief Human Resources Officer since June 2016. Before joining Visteon, he was Vice President, Human Resources, for Avaya, a global communications technology firm, from April 2008 to February 2016. Prior to that, he was Senior Vice President, Human Resources, at Vail Resorts, led global talent management at Sun Microsystems, and served as Senior Director of Organizational Learning and Effectiveness at StorageTek. He started his career at Ford Motor Company, holding a variety of roles over a 14-year period in labor relations, strategy and various operating disciplines.
Brett D. Pynnonen has been Visteon’s Senior Vice President and General Counsel since December 2016. Prior to that, he was Vice President and General Counsel since joining the Company in March 2016. Before joining Visteon he was Senior Vice President, General Counsel and Corporate Secretary of Federal-Mogul Holdings Corporation, a global automotive supplier, from November 2007 to March 2016. Prior to that, he was General Counsel and Secretary of Covansys Corporation, a technology services company, and an attorney at the law firm of Butzel Long.
14
Markus J. Schupfner has been Visteon’s Senior Vice President and Chief Technology Officer since December 2016. Prior to that, he was Vice President and Chief Technology Officer since joining the Company in April 2016. Before joining Visteon he was Executive Vice President of Operations at Elektrobit Automotive GmbH, a supplier of embedded software solutions and services, since February 2014, and from November 2009 to January 2014, he was Elektrobit’s Vice President, Infotainment Solutions. Prior to that, he served as Vice President of Navigation for the Infotainment Division of Harman International Industries and held director-level roles at Siemens VDO and Siemens.
Robert R. Vallance has been Visteon’s Senior Vice President, Customer Business Groups since December 2016. Prior to that, he was Vice President, Customer Business Groups upon rejoining the Company in July 2014. From February 2008 to June 2015, he served as Vice President, Electronics Business Group of Johnson Controls, Inc., an automotive supplier. Prior to that, he spent 23 years at Ford Motor Company and Visteon in product development, program and commercial management, strategy and planning, product marketing and manufacturing.
William M. Robertson has been Visteon’s Vice President, Operations Finance and Investor Relations since October 2016. Prior to that, he was Vice President and Corporate Controller since June 2015. He served as the Company’s interim Chief Financial Officer from March 31, 2016 to September 30, 2016. Prior to that, he was Director, Corporate Finance since 2003; Manager, Corporate Finance since April 2001; and Operations Manager since joining the Company in May, 2000. Before joining Visteon, he served as Vehicle Operations Controller for Ford Motor Company.
Stephanie S. Marianos has been Visteon’s Vice President and Chief Accounting Officer since February 2017. Prior to that, she was Chief Accounting Officer since June 2015; Assistant Corporate Controller since July 2014; Associate Director, Corporate Finance since May 2012; Associate Director, Corporate Accounting since April 2008; and Senior Manager, Corporate Accounting since joining the Company in September 2005. Before joining Visteon, she was an independent accounting consultant serving manufacturing, insurance and health care companies. Ms. Marianos began her career at Ernst & Young LLP and is a certified public accountant.
15
Part II
Item 5. | Market for Registrant’s Common Equity, Related Stockholder Matters and Issuer Purchases of Equity Securities |
As of February 16, 2017, the Company had 32,811,170 shares of its common stock, $0.01 par value per share, outstanding, which were owned by 7,593 shareholders of record. The table below shows the high and low sales prices per share for the Company’s common stock as reported by the NYSE for each quarterly period for the last two years.
2016 | |||||||
First Quarter* | Second Quarter | Third Quarter | Fourth Quarter | ||||
High | $80.85 | $81.04 | $73.13 | $84.48 | |||
Low | $54.71 | $64.11 | $63.04 | $64.95 | |||
*The company paid a special distribution of $43.40 per share of common stock on January 22, 2016. Stock price before the distribution has been adjusted to proforma distribution as of January 1, 2016.
2015 | |||||||
First Quarter | Second Quarter | Third Quarter | Fourth Quarter | ||||
High | $107.45 | $110.48 | $106.71 | $121.65 | |||
Low | $95.15 | $95.96 | $95.11 | $100.85 | |||
No dividends were paid by the Company on its common stock during the years ended December 31, 2015 or 2014. On January 22, 2016, the Company paid a special distribution of $43.40 per share of common stock. The Company’s Board of Directors (the “Board”) evaluates the Company’s dividend policy based on all relevant factors. The Company’s credit agreements limit the amount of cash payments for dividends that may be made. Additionally, the ability of the Company’s subsidiaries to transfer assets is subject to various restrictions, including regulatory requirements and governmental restraints. Refer to Note 6, “Non-Consolidated Affiliates,” in Item 8 of this Report.
The following table summarizes information relating to purchases made by or on behalf of the Company, or an affiliated purchaser, of shares of the Company’s common stock during the fourth quarter of 2016.
Period | Total Number of Shares (or Units) Purchased (1) | Average Price Paid per Share (or Unit) | Total Number of Shares (or units) Purchased as Part of Publicly Announced Plans or Programs (2) | Approximate Dollar Value of Shares (or Units) that May Yet Be Purchased Under the Plans or Programs (3) (in millions) | |||||
Oct. 1, 2016 to Oct. 31, 2016 | — | $0.00 | 1,211,979 | $0.00 | |||||
Nov. 1, 2016 to Nov. 30, 2016 | — | $0.00 | — | $0.00 | |||||
Dec. 1, 2016 to Dec. 31, 2016 | — | $0.00 | — | $0.00 | |||||
Total | — | $0.00 | 1,211,979 | $0.00 | |||||
(1) | This column includes 0 shares surrendered to the Company by employees to satisfy tax withholding obligations in connection with the vesting of restricted share and stock unit awards made pursuant to the Visteon Corporation 2010 Incentive Plan. |
(2) | In total, the Company purchased 5,582,657 shares at an average price of $70.75 under this ASB program. |
(3) | On January 10, 2017, the Company's board of directors authorized a $400 million share repurchase program to be completed through March 2018. |
The following information in Item 5 is not deemed to be “soliciting material” or be “filed” with the SEC or subject to Regulation 14A or 14C under the Securities Exchange Act of 1934 (“Exchange Act”) or to the liabilities of Section 18 of the Exchange Act, and will not be deemed to be incorporated by reference into any filing under the Securities Act of 1933 or the Exchange Act, except to the extent the Company specifically incorporates it by reference into such a filing.
16
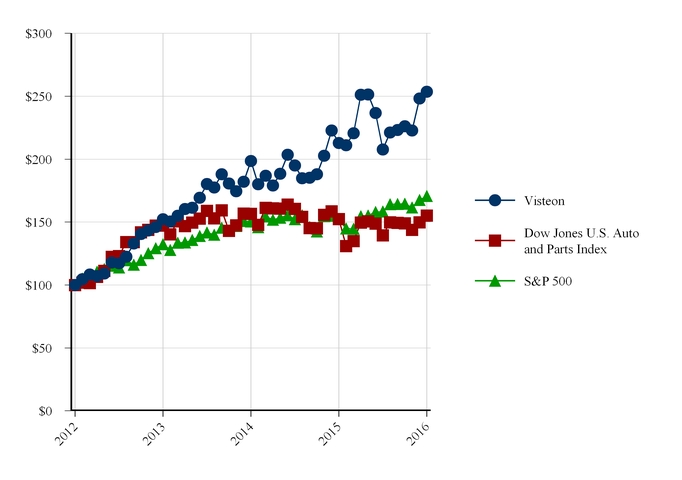
Performance Graph
The following graph compares the cumulative total stockholder return from December 31, 2012 through December 31, 2016 for its existing common stock, the S&P 500 Index and the Dow Jones U.S. Auto Parts Index. The graph below assumes that $100 was invested on December 31, 2012 in each of the Company's common stock, the stocks comprising the S&P 500 Index and the stocks comprising the Dow Jones U.S. Auto Parts Index, and that all that dividends have been reinvested.
December 31, 2012 | December 31, 2013 | December 31, 2014 | December 31, 2015 | December 31, 2016 | |
Visteon Corporation | $100.00 | $152.20 | $198.60 | $212.70 | $253.60 |
Dow Jones U.S. Auto & Parts Index | $100.00 | $147.30 | $156.70 | $152.40 | $155.20 |
S&P 500 | $100.00 | $132.40 | $150.50 | $152.50 | $170.80 |
The above comparisons are required by the Securities and Exchange Commission and are not intended to forecast or be indicative of possible future performance of the Company's common stock or the referenced indices.
17
Item 6. | Selected Financial Data |
The following statement of operations, statement of cash flows and balance sheet data were derived from the Company's consolidated financial statements for the years ended December 31, 2016, 2015, 2014, 2013 and 2012. This information should be read in conjunction with Item 7, “Management's Discussion and Analysis of Financial Condition and Results of Operations” and Item 8, “Financial Statements and Supplementary Data” in this Report.
Year Ended December 31 | Year Ended December 31 | Year Ended December 31 | Year Ended December 31 | Year Ended December 31 | |||||||||||||||
2016 | 2015 | 2014 | 2013 | 2012 | |||||||||||||||
(Dollars in Millions, Except Per Share Amounts) | |||||||||||||||||||
Statement of Operations Data: | |||||||||||||||||||
Net sales | $ | 3,161 | $ | 3,245 | $ | 2,586 | $ | 1,724 | $ | 1,625 | |||||||||
Net income (loss) from continuing operations | 131 | 42 | (75 | ) | 555 | 56 | |||||||||||||
(Loss) income from discontinued operations, net of tax | (40 | ) | 2,286 | (131 | ) | 220 | 111 | ||||||||||||
Net income (loss) attributable to Visteon Corporation | $ | 75 | $ | 2,284 | $ | (295 | ) | $ | 690 | $ | 100 | ||||||||
Basic earnings (loss) per share | |||||||||||||||||||
Continuing operations | $ | 3.28 | $ | 0.52 | $ | (2.14 | ) | $ | 11.10 | $ | 1.06 | ||||||||
Discontinued operations | (1.14 | ) | 53.48 | (4.30 | ) | 2.70 | 0.83 | ||||||||||||
Basic earnings (loss) attributable to Visteon Corporation | $ | 2.14 | $ | 54.00 | $ | (6.44 | ) | $ | 13.80 | $ | 1.89 | ||||||||
Diluted earnings (loss) per share | |||||||||||||||||||
Continuing operations | $ | 3.25 | $ | 0.51 | $ | (2.14 | ) | $ | 10.86 | $ | 1.05 | ||||||||
Discontinued operations | (1.13 | ) | 52.12 | (4.30 | ) | 2.64 | 0.83 | ||||||||||||
Diluted earnings (loss) attributable to Visteon Corporation | $ | 2.12 | $ | 52.63 | $ | (6.44 | ) | $ | 13.50 | $ | 1.88 | ||||||||
Balance Sheet Data: | |||||||||||||||||||
Total assets | $ | 2,373 | $ | 4,681 | $ | 5,323 | $ | 6,027 | $ | 5,156 | |||||||||
Total debt, excluding held for sale | $ | 382 | $ | 383 | $ | 616 | $ | 399 | $ | 491 | |||||||||
Total Visteon Corporation stockholders' equity | $ | 586 | $ | 1,057 | $ | 865 | $ | 1,920 | $ | 1,385 | |||||||||
Statement of Cash Flows Data: | |||||||||||||||||||
Cash provided from operating activities | $ | 120 | $ | 338 | $ | 284 | $ | 312 | $ | 239 | |||||||||
Cash provided from (used by) investing activities | $ | 302 | $ | 2,358 | $ | (740 | ) | $ | 698 | $ | (40 | ) | |||||||
Cash used by financing activities | $ | (2,262 | ) | $ | (774 | ) | $ | (359 | ) | $ | (141 | ) | $ | (115 | ) | ||||
Year Ended December 31, 2016
On December 1, 2016 the Company completed the sale of its Interiors operations in Argentina and Brazil, incurring a loss of $19 million representing the final working capital cash contribution and related contractual obligations, completing the Interiors Divestiture.
During the fourth quarter of 2016, the Company sold its South Africa climate operations and recorded a loss of $11 million related to foreign currency translation amounts previously recorded in accumulated other comprehensive loss.
On December 9, 2015, the Company declared a special distribution of $43.40 per share of its common stock outstanding as of January 15, 2016, or approximately $1.75 billion in the aggregate. On January 22, 2016 approximately $1.74 billion was paid.
Year Ended December 31, 2015
On June 9, 2015, Visteon completed the sale to Hahn & Co. Auto Holdings Co., Ltd. (“Hahn”) and Hankook Tire Co., Ltd. (“Hankook” and, together with Hahn, the “Purchasers”) of all of its shares of Halla Visteon Climate Control Corporation, a Korean corporation (“HVCC”), for approximately $3.4 billion, or KRW 52,000 per share after adjusting for the 2014 dividend paid by HVCC to Visteon (the “Climate Transaction”), pursuant to and in accordance with the Share Purchase Agreement, dated as of December 17, 2014 (the “Purchase Agreement”), among Visteon and the Purchasers. The respective results of operations of the
18
HVCC Climate business have been reclassified to Net (loss) income from discontinued operations, net of tax for all periods presented.
On December 1, 2015, Visteon Corporation and its wholly owned subsidiary, Visteon Deutschland GmbH, which operates the Berlin, Germany interiors plant completed the sale to APCH Automotive Plastic Components Holding GmbH. The Company recorded a loss of $105 million in connection with the sale. Although the divestiture represents a continuation of the Company’s exit from the Interiors business, the divestiture is not considered a strategic shift given the size of the operations representing $86 million in 2015 sales. Therefore, the operations do not qualify for discontinued operations presentation and operating results prior to the sale are classified within Other as continuing operations.
Year Ended December 31, 2014
In May 2014, pursuant to a Master Purchase Agreement, as subsequently amended, Visteon agreed to divest substantially all of
its global Interiors business (the "Interiors Divestiture") in exchange for the assumption of certain liabilities related to the Company's Interiors business and the payment of nominal cash consideration. In connection with the Interiors Divestiture, the Company recorded losses totaling $326 million during the year ended December 31, 2014. These losses included an asset impairment loss of $190 million recorded during the second quarter of 2014 pursuant to execution of the Purchase Agreement and additional losses of $136 million during the fourth quarter of 2014 pursuant to the Master Closing on November 1, 2014 and the completion of the sale of an Interiors operation in India on December 1, 2014. The operating results of Interiors businesses subject to the Interiors Divestiture have been reclassified to Net (loss) income from discontinued operations, net of tax for all periods presented.
On July 1, 2014, the Company completed the acquisition of substantially all of the global automotive electronics business of Johnson Controls Inc. for an aggregate purchase price of $299 million, including $31 million of cash and equivalents at the acquired business. The Company commenced consolidation of the acquired business from date of acquisition.
19
Item 7. | Management's Discussion and Analysis of Financial Condition and Results of Operations |
Management’s Discussion and Analysis (“MD&A”) is intended to help the reader understand the results of operations, financial condition and cash flows of Visteon Corporation (“Visteon” or the “Company”). MD&A is provided as a supplement to, and should be read in conjunction with, the Company’s consolidated financial statements and related notes appearing in Item 8 “Financial Statements and Supplementary Data” of this Report.
Executive Summary
Strategic Initiatives
Visteon has transformed into a technology-focused, pure-play supplier of automotive cockpit electronics and connected car solutions. During 2016, the Company’s three strategic initiatives included strengthening the core, moving selectively to adjacent products, and expanding into the autonomous driving space.
• | Strengthen the Core - Visteon offers technology and related manufacturing operations for instrument clusters, information displays, infotainment systems, audio systems, telematics solutions, and head up displays. Backlog, defined as cumulative remaining life of program booked sales, is approximately $16.5 billion as of December 31, 2016, or 5.3 times the last twelve months of sales, reflecting a strong booked sales base on which to launch future growth. This is $1.6 billion higher than the $14.9 billion backlog as of December 31, 2015. |
Core business financial results continue to improve with Adjusted EBITDA margin for electronics of 11.1% in the year ended 2016 compared with 9.5% in the same period of 2015. The Company expects to deliver cost efficiencies by streamlining selling, general and administration costs and engineering costs, improving free cash flow, optimizing the capital structure and driving savings benefits as revenue grows.
During 2016, the Company initiated a restructuring of its engineering and administration organization to focus on technology and execution and also to align the engineering and administrative footprint with its core technologies and customers. The organization will be comprised of customer regional engineering, product management and advanced technologies, and global centers of competence.
• | Move Selectively to Adjacent Products - As consumer demand continues to evolve with an increase in electronics content per vehicle, the Company is advancing its expertise in the areas of cockpit domain controllers, next generation safety applications, and vehicle cybersecurity. Each of these areas require careful assessments of shifting consumer needs and how these new products complement Visteon's core products. |
During 2016 Visteon acquired AllGo Embedded Systems Private Limited, a leading developer of embedded multimedia system solutions for global vehicle manufacturers. The acquisition adds greater scale and depth to the Company's infotainment software capabilities.
• | Expand into Autonomous Driving - The Company's approach to autonomous driving is to feature fail-safe centralized domain hardware, designed for algorithmic developers, and applying artificial intelligence for object detection and other functions. The Company is developing a secure autonomous driving domain controller platform with an open framework based on neural networks. The Company projects a launch of the technology in 2018. |
2017 Strategic Imperatives
Building on the momentum of the initiatives advanced in 2016, it is imperative that Visteon continues to strengthen its core business and further develop its autonomous driving platform. In addition, it is imperative that the Company accelerate its China business as China’s economic environment offers significant growth opportunities in sales and new technology launches. Visteon will continue to leverage joint venture relationships to drive adoption of new offerings.
20
Financial Results
Significant aspects of the Company's financial results for the year ended December 31, 2016 include the following.
• | The Company recorded sales of $3,161 million representing a decrease of $84 million when compared with the year ended December 31, 2015. Sales for the Electronics Product Group were consistent with the prior year while sales for the Other operations decreased by $99 million primarily reflecting the sale of the Germany interiors facility in November 2015. Electronics sales were consistent with the prior year reflecting higher production volumes, and new business, partially offset by unfavorable currency and customer pricing. |
• | Gross margin was $464 million or 14.7% of sales for the year ended December 31, 2016 compared to $430 million or 13.3% of sales for the same period of 2015. The increase reflected increased volumes and new business, favorable currency, and improved cost performance. |
• | Net income attributable to Visteon was $75 million for the year ended December 31, 2016, which included a net loss from discontinued operations of $40 million and restructuring expense of $49 million, higher year over year gross margin of $34 million, and lower year over year selling, general and administrative expenses of $25 million. Net income attributable to Visteon was $2,284 million for the year ended December 31, 2015, which included net income from discontinued operations of $2,286 million including the Climate Transaction gain, a gain on sale of non-consolidated affiliates of $62 million, partially offset by a loss on the Germany Divestiture of $105 million, and restructuring expense of $36 million. |
• | Total cash and short-term investments, excluding amounts held for sale, were $882 million, $1,901 million lower than cash balances of $2,783 million on December 31, 2015, primarily attributable to a special distribution of approximately $1,736 million and share repurchases of $500 million, partially offset by the Climate Transaction withholding tax refund of $356 million. |
• | Including discontinued operations, the Company generated $120 million of cash from operating activities for the year ended December 31, 2016, $218 million lower than cash from operating activities of $338 million for the year ended December 31, 2015, primarily attributable to the 2015 Climate Transaction and higher income tax payments. |
• | Cash provided by investing activities of $302 million, inclusive of discontinued operations, for the year ended December 31, 2016 was $2,056 million lower than cash provided by investing activities of $2,358 million for the year ended December 31, 2015. The decrease was primarily attributable to proceeds from the 2015 Climate Transaction of $2,664 million, net of the 2015 Germany Interiors Divestiture contribution of $141 million, partially offset by the 2016 withholding tax refund of $356 million and lower 2016 capital expenditures. |
• | On December 9, 2015, the Company declared a special distribution of $43.40 per share of its common stock outstanding as of January 15, 2016, or approximately $1.75 billion in the aggregate. On January 22, 2016 approximately $1.74 billion was paid. The special cash distribution was funded from Climate Transaction proceeds. |
During 2016, Visteon entered into accelerated stock buyback programs with a third-party financial institution to purchase shares of common stock for an aggregate purchase price of $500 million. Under these programs, Visteon purchased 7,190,506 shares at an average price of $69.48.
21
The pie charts below highlight the sales breakdown for Visteon's Electronics segment for the year ended December 31, 2016.
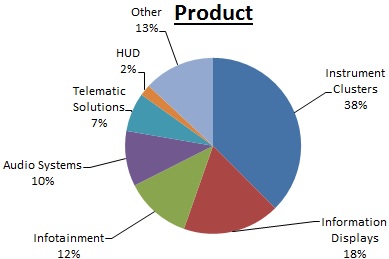
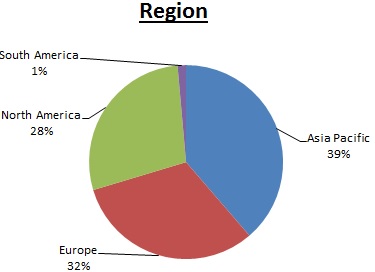

Global Automotive Market Conditions and Production Levels
During 2016 the global automotive industry continued to experience modest growth. China production grew 14% in 2016, far surpassing the global average due to strong demand related to expiring tax cuts on certain vehicles and growth in demand for utility vehicles. The established markets in North America and Europe also continued to grow at a lower than average rate. South America production volumes contracted in 2016 although at a lower rate than in prior years. Production in the remaining regions was mixed due to varying economic, political and social factors.
Light vehicle production levels for 2016 by geographic region are provided below (units in millions):
Light Vehicle Production | ||||||||
2016 | 2015 | Change | ||||||
Global | 93.0 | 88.7 | 4.9 | % | ||||
Asia Pacific | 48.7 | 45.2 | 7.6 | % | ||||
Europe | 21.5 | 20.9 | 2.6 | % | ||||
North America | 17.8 | 17.5 | 1.9 | % | ||||
South America | 2.7 | 3.1 | (10.9 | )% | ||||
Other | 2.3 | 2.0 | 17.5 | % | ||||
Source: IHS Automotive | ||||||||
22
Consolidated Results of Operations - 2016 Compared with 2015
The Company's consolidated results of operations for the years ended December 31, 2016 and 2015 were as follows:
Year Ended December 31 | |||||||||||
2016 | 2015 | Change | |||||||||
(Dollars in Millions) | |||||||||||
Sales | $ | 3,161 | $ | 3,245 | $ | (84 | ) | ||||
Cost of sales | 2,697 | 2,815 | (118 | ) | |||||||
Gross margin | 464 | 430 | 34 | ||||||||
Selling, general and administrative expenses | 220 | 245 | (25 | ) | |||||||
Restructuring expense | 49 | 36 | 13 | ||||||||
Interest expense | 18 | 19 | (1 | ) | |||||||
Interest income | 6 | 5 | 1 | ||||||||
Equity in net income of non-consolidated affiliates | 2 | 7 | (5 | ) | |||||||
Loss on debt extinguishment | — | 5 | (5 | ) | |||||||
Loss on divestiture | — | 105 | (105 | ) | |||||||
Gain on non-consolidated affiliate transactions, net | — | 62 | (62 | ) | |||||||
Other expense, net | 24 | 25 | (1 | ) | |||||||
Provision for income taxes | 30 | 27 | 3 | ||||||||
Net income from continuing operations | 131 | 42 | 89 | ||||||||
Net (loss) income from discontinued operations, net of tax | (40 | ) | 2,286 | (2,326 | ) | ||||||
Net income (loss) | 91 | 2,328 | (2,237 | ) | |||||||
Net income attributable to non-controlling interests | 16 | 44 | (28 | ) | |||||||
Net income (loss) attributable to Visteon Corporation | $ | 75 | $ | 2,284 | $ | (2,209 | ) | ||||
Adjusted EBITDA* | $ | 337 | $ | 282 | $ | 55 | |||||
* Adjusted EBITDA is a Non-GAAP financial measure, as further discussed below. | |||||||||||
Sales
Sales for the year ended December 31, 2016 totaled $3,161 million, which represents an decrease of $84 million compared with the same period of 2015. Electronics sales were consistent with the prior year, while sales for the Other operations decreased sales by $99 million. For Electronics, higher production volumes, product mix, and net new business increased sales by $115 million. Unfavorable currency decreased Electronics sales by $27 million, primarily attributable to the Chinese Renminbi, Euro, and Indian Rupee, partially offset by the Japanese Yen. Other reductions were associated with customer pricing, net of design savings. The decrease in sales for the Other operations was primarily related to the sale of the Germany Interiors facility on December 1, 2015 which decreased sales for the year ended December 31, 2016 by $86 million and the wind-down of legacy climate facilities in South America.
Cost of Sales
Cost of sales decreased $118 million for the year ended December 31, 2016 when compared with the same period in 2015. Cost of sales for Electronics decreased $32 million while cost of sales for the Other operations decreased $101 million. For Electronics, higher volumes, product mix, and net new business increased cost of sales by $100 million. Foreign currency decreased cost of sales by $37 million primarily attributable to the Chinese Renminbi, Mexican Peso, Euro, Brazilian Real, and British Pound, partially offset by the Japanese Yen. Net efficiencies, including material, design and usage economics and manufacturing efficiencies decreased cost of sales by $95 million. The decrease in cost of sales for the Other operations was primarily related to the sale of the Germany Interiors facility which decreased cost of sales by $83 million and the wind-down of legacy climate facilities in South America.
Gross Margin
The Company's gross margin was $464 million or 14.7% of sales for the year ended December 31, 2016 compared to $430 million or 13.3% of sales for the same period of 2015. Electronics gross margin increased year-over-year by $32 million while Other gross
23
margin increased year-over-year by $2 million. The increase in the Electronics gross margin included $15 million from favorable volumes, net new business and product mix and $10 million from favorable currency. Electronics gross margin also included $7 million of favorable net cost performance, driven by material and manufacturing cost efficiencies, which more than offset customer pricing reductions.
Selling, General and Administrative Expenses
Selling, general, and administrative expenses were $220 million, or 7.0% of sales, and $245 million, or 7.6% of sales, during the years ended December 31, 2016 and 2015, respectively. The decrease of $25 million is primarily related to net efficiencies and lower incentive compensation expense.
Restructuring Expense
Electronics: During the first quarter of 2016, the Company announced a restructuring program to transform the Company's engineering organization and supporting functional areas to focus on execution and technology. The organization will be comprised of regional engineering, product management and advanced technologies, and global centers of competence. During the year ended December 31, 2016, the Company recorded approximately $11 million of restructuring expenses, net of reversals, under this program, associated with approximately 100 employees.
During the fourth quarter of 2016, the Company announced a restructuring program impacting engineering and administrative functions to further align the Company's engineering and related administrative footprint with its core product technologies and customers. The Company expects to incur up to $45 million of restructuring costs for this program. During the year ended December 31, 2016, the Company recorded approximately $27 million of restructuring expenses under this program, associated with approximately 250 employees.
In connection with the Electronics Acquisition, the Company commenced a restructuring program designed to achieve cost savings through transaction synergies. During the year ended December 31, 2015 the Company recorded $20 million of severance and termination benefits, net of reversals, under this program associated with approximately 400 employees.
During October 2015, the Company announced a restructuring program designed to reduce the workforce at a European Electronics facility. The Company recorded $12 million of severance and termination benefits under this program associated with approximately 100 employees,
Other and Discontinued Operations: During 2016, the Company recorded $16 million of restructuring expenses, related to severance and termination benefits of which $14 million relates to the wind-down of certain operations in South America.
Interest Expense, Net
Net interest expense for the year ended December 31, 2016 was $12 million, a decrease of $2 million when compared to $14 million for the same period of 2015. Interest expense of $18 million and $19 million, respectively, for the years ended December 31, 2016 and December 31, 2015 is primarily associated with the Company's Term Facility due April 9, 2021 with original principal of $600 million and prepaid down to $350 million following the Climate Transaction in June 2015.
Equity in Net Income of Non-Consolidated Affiliates
Equity in net income of non-consolidated affiliates was $2 million and $7 million for the years ended December 31, 2016 and 2015, respectively. The income in 2015 was primarily attributable to dividend recognition for a cost basis investment.
Loss on Debt Extinguishment
Loss on debt extinguishment of $5 million during the year ended December 31, 2015 included unamortized original issue discount, debt fees and other debt costs. The loss on debt extinguishment was related to the $246 million repayment of the Company's Term Facility, reducing the outstanding aggregate principal to $350 million.
Loss on Divestiture
On December 1, 2015, Visteon completed the Germany Interiors Divestiture by contributing cash of approximately $141 million, assets of $27 million, and liabilities of $198 million, including pension related liabilities. The Company recognized a pretax loss on divestiture of $105 million related to foreign currency translation and pension benefit plan amounts previously recorded in
24
accumulated other comprehensive loss. The Company will make a final contribution payment of approximately $31 million during the first half of 2017 upon fulfillment of buyer contractual commitments.
Gain on Non-Consolidated Affiliates, Net
During the year ended December 31, 2016, Visteon agreed to sell its 50% interest in an equity method investment for approximately $7 million and has recorded an impairment loss of approximately $5 million.
On July 22, 2016, the Company sold a cost method investment to a third party for proceeds of approximately $11 million and recorded a pretax gain on sale of approximately $5 million.
During the year ended December 31, 2015, the Company completed the sale of its 12.5% ownership interest in Yanfeng Visteon Jinqiao Automotive Trim Systems Company, Limited, a Chinese automotive interiors supplier, for proceeds of $91 million and recorded a pretax gain on sale of $62 million.
Other Expense, Net
Other expense, net consists of the following:
Year Ended December 31 | |||||||
2016 | 2015 | ||||||
(Dollars in Millions) | |||||||
Foreign currency translation charge | $ | 11 | $ | — | |||
Transformation initiatives | 9 | 25 | |||||
Transaction hedging and exchange (gains) losses | 1 | (15 | ) | ||||
Integration costs | 2 | 14 | |||||
Loss on asset contributions | 2 | 1 | |||||
Recoverable taxes | (1 | ) | — | ||||
$ | 24 | $ | 25 | ||||
During the year ended December 31, 2016, the Company recorded a charge of approximately $11 million related to foreign currency translation amounts recorded in accumulated other comprehensive loss associated with the sale of the Company's South Africa climate operations.
Transformation initiatives include information technology separation costs and financial and advisory services incurred in connection with the execution of the Company's comprehensive value creation plan and certain severance costs associated with the acquisition of substantially all of the global automotive electronics business of Johnson Controls Inc. (the "Electronics Acquisition") and the Climate Transaction. Transaction hedging and exchange losses (gains) of $1 million and $(15) million for the years ended December 31, 2016 and 2015, respectively, relate to the Climate Transaction proceeds and the Germany Interiors Divestiture contribution.
During the years ended December 31, 2016 and 2015, the Company recorded $2 million and $14 million, respectively, of costs to integrate the businesses associated with Electronics Acquisition. Integration costs included re-branding, facility modification, information technology readiness and related professional services.
In connection with the closure of the Climate facility in Argentina, the Company contributed land and building with a net book value of $2 million to the local municipality for the benefit of former employees. The Company also recorded gains of $1 million during the year ended December 31, 2016 to adjust recoverable value-added taxes to net realizable value attributable to business exit activities.
Income Taxes
The Company's provision for income tax was $30 million for year ended December 31, 2016 and reflects income tax expense related to those countries where the Company is profitable, accrued withholding taxes, ongoing assessments related to the recognition and measurement of uncertain tax benefits, the inability to record a tax benefit for pretax losses and/or recognize tax expense for pretax income in certain jurisdictions (including the U.S.) due to valuation allowances, and other non-recurring tax items.
25
The Company's provision for income taxes increased $3 million for the year ended December 31, 2016 compared with 2015. The increase included an $11 million year-over-year increase in unrecognized tax benefits, including interest and penalties, related primarily to the non-recurrence of favorable audit developments and statute expirations during 2015, and unfavorable adjustments in 2016, primarily in connection with intercompany transactions between the U.S. and non-U.S. taxing jurisdictions. Other increases include the non-recurrence of an $18 million income tax benefit on pretax U.S. losses from continuing operations recognized during the 2015. Although the Company maintains a full valuation allowance against net deferred tax assets in the U.S., the level of other categories of income generated in the U.S. during 2015 (primarily related to discontinued operations) resulted in a charge to discontinued operations income tax expense of $18 million with the offsetting benefit recognized in continuing operations, effectively resulting from a reduction in the valuation allowance against deferred tax assets. These increases were partially offset by the non-recurrence of $8 million income tax expense related to the withholding tax associated with the sale of its non-consolidated affiliate located in China and favorable developments in connection with certain Portuguese income tax incentives formally approved during 2016 resulting in a discrete income tax benefit of $3 million, and year-over-year tax benefits of $3 million resulting from the partial elimination of valuation allowances in Mexico and France. Other changes in the Company’s deferred tax asset valuation allowances did not materially impact net tax expense during the years ended December 31, 2016 or 2015. Other decreases reflect the year-over-year changes in the mix of earnings and differing tax rates between jurisdictions. Additionally, during 2016, the Company recorded an $11 million income tax benefit in connection with the recognition of a worthless stock deduction (“WSD”) for U.S. income tax purposes related to Visteon SA (the Company’s wholly owned subsidiary associated with the Company’s Climate facility in Argentina where manufacturing operations have ceased), which resulted in an estimated current year U.S. net operating loss (NOL) allowing the Company to carryback such NOL against its 2015 U.S. taxable income. Consequently, the Company recorded a $3 million income tax receivable which represents the remaining income tax paid in 2015 relating to the Climate sale (which should be refunded after carrying back the current year NOL to 2015 and filing a refund claim), and an $8 million reduction in unrecognized tax benefits that impact the effective rate.
Discontinued Operations
The operations subject to the Interiors Divestiture and Climate Transaction met conditions required to qualify for discontinued operations reporting. Accordingly, the results of operations for the Interiors and Climate businesses have been reclassified to Net income (loss) from discontinued operations, net of tax in the Consolidated Statements of Operations for the years ended December 31, 2016 and 2015. See Note 5 "Discontinued Operations" for additional disclosures.
Net Income
Net income attributable to Visteon was $75 million for the year ended December 31, 2016, which included a net loss from discontinued operations of $40 million, restructuring expense of $49 million, higher year over year gross margin of $34 million, and lower year over year selling, general and administrative expenses of $25 million. Net income attributable to Visteon was $2,284 million for the year ended December 31, 2015, which included net income from discontinued operations of $2,286 million including the Climate Transaction gain, a gain on sale of non-consolidated affiliates of $62 million, partially offset by a loss on the Germany Divestiture of $105 million, and restructuring expense of $36 million.
Adjusted EBITDA
Adjusted EBITDA (a non-GAAP financial measure, as defined below) was $337 million for the year ended December 31, 2016, representing an increase of $55 million when compared with Adjusted EBITDA of $282 million for the same period of 2015. Adjusted EBITDA for the Electronics product group in 2016 was $346 million, a year-over-year increase of $52 million. Adjusted EBITDA for the Other operations in 2016 was a loss of $9 million, a year-over-year improvement of $3 million, primarily attributable to year over year customer pricing and exchange improvements.
The increase in Electronics Adjusted EBITDA included $15 million of favorable volume and mix, primarily attributable to increased production volumes and new business in Asia Pacific. Currency movements favorably impacted Electronics Adjusted EBITDA for the year ended December 31, 2016 by $12 million, largely related to the impact of the Mexican Peso, Brazilian Real, Chinese Renminbi, and British Pound, partially offset by the Japanese Yen. Electronics Adjusted EBITDA in 2016 was also impacted by selling, general and administrative cost efficiencies of $14 million and gross margin cost efficiencies of $11 million. Gross margin cost efficiencies included material, manufacturing efficiencies, which more than offset customary customer pricing productivity.
Adjusted EBITDA is presented as a supplemental measure of the Company's financial performance that management believes is useful to investors because the excluded items may vary significantly in timing or amounts and/or may obscure trends useful in evaluating and comparing the Company's operating activities across reporting periods. The Company defines Adjusted EBITDA as net income attributable to the Company adjusted to eliminate the impact of depreciation and amortization, restructuring expense, net interest expense, loss on debt extinguishment, equity in net income of non-consolidated affiliates, loss on divestiture, gain on
26
non-consolidated affiliate transactions, other net expense, provision for income taxes, discontinued operations, net income attributable to non-controlling interests, non-cash stock-based compensation expense and other non-operating gains and losses.
Adjusted EBITDA is not a recognized term under accounting principles generally accepted in the United States and does not purport to be a substitute for net income as an indicator of operating performance or cash flows from operating activities as a measure of liquidity. Adjusted EBITDA has limitations as an analytical tool and is not intended to be a measure of cash flow available for management's discretionary use, as it does not consider certain cash requirements such as interest payments, tax payments and debt service requirements. In addition, the Company uses Adjusted EBITDA (i) as a factor in incentive compensation decisions, (ii) to evaluate the effectiveness of the Company's business strategies and (iii) because the Company's credit agreements use measures similar to Adjusted EBITDA to measure compliance with certain covenants. Adjusted EBITDA, as determined and measured by the Company should not be compared to similarly titled measures reported by other companies. The reconciliation of Adjusted EBITDA to net income attributable to Visteon for the years ended December 31, 2016 and 2015 is as follows:
Year Ended December 31 | |||||||||||
2016 | 2015 | Change | |||||||||
(Dollars in Millions) | |||||||||||
Adjusted EBITDA | $ | 337 | $ | 282 | $ | 55 | |||||
Depreciation and amortization | 84 | 85 | (1 | ) | |||||||
Restructuring expense | 49 | 36 | 13 | ||||||||
Interest expense, net | 12 | 14 | (2 | ) | |||||||
Equity in net income of non-consolidated affiliates | (2 | ) | (7 | ) | 5 | ||||||
Loss on debt extinguishment | — | 5 | (5 | ) | |||||||
Loss on divestiture | — | 105 | (105 | ) | |||||||
Gain on non-consolidated affiliate transactions, net | — | (62 | ) | 62 | |||||||
Other expense, net | 24 | 25 | (1 | ) | |||||||
Provision for income taxes | 30 | 27 | 3 | ||||||||
Net loss (income) from discontinued operations, net of tax | 40 | (2,286 | ) | 2,326 | |||||||
Net income attributable to non-controlling interests | 16 | 44 | (28 | ) | |||||||
Non-cash, stock-based compensation expense | 8 | 8 | — | ||||||||
Other | 1 | 4 | (3 | ) | |||||||
Net income attributable to Visteon Corporation | $ | 75 | $ | 2,284 | $ | (2,209 | ) | ||||
Segment Results of Operations - 2016 compared with 2015
The Company's operating structure is organized into two global product groups - Electronics and Other. These global product groups have financial and operating responsibility over the design, development and manufacture of the Company's product portfolio. Certain functions such as procurement, information technology and other administrative activities are managed on a global basis with regional deployment. The Company's two reportable segments are as follows:
• | Electronics - The Company's Electronics segment provides vehicle cockpit electronics products to customers, including instrument clusters, information displays, infotainment, audio systems, telematics solutions, and head up displays. |
• | Other - Other includes South Africa climate operations sold on November 1, 2016 and South America climate operations substantially exited during the fourth quarter of 2016. During 2015, Other also included the Berlin, Germany operations previously associated with the Interiors business and sold during the fourth quarter of 2015. |
27
Sales
Electronics | Other | Eliminations | Total | ||||||||||||
(Dollars in Millions) | |||||||||||||||
December 31, 2015 | $ | 3,107 | $ | 153 | $ | (15 | ) | $ | 3,245 | ||||||
Volume and mix | 115 | (11 | ) | 15 | 119 | ||||||||||
Currency | (27 | ) | (1 | ) | — | (28 | ) | ||||||||
Germany Interiors Divestiture | — | (86 | ) | — | (86 | ) | |||||||||
Other | (88 | ) | (1 | ) | — | (89 | ) | ||||||||
December 31, 2016 | $ | 3,107 | $ | 54 | $ | — | $ | 3,161 | |||||||
Electronics sales were $3,107 million for the year ended December 31, 2016, consistent with prior year sales. Higher production volumes and new business increased sales by $115 million. Volume, mix, and net new business improved in Asia Pacific and Europe. Volumes were consistent in North America, while South America deteriorated. Unfavorable currency, primarily related to the Chinese Renminbi and Euro partially offset by the Japanese Yen, decreased sales by $27 million. Other reductions reflected customer pricing net of design changes.
Other sales decreased during the year end December 31, 2016 by $99 million. The Germany Interiors Divestiture, effective December 1, 2015, resulted in a decrease in sales of $86 million. Lower production volumes related to the wind down of certain South America businesses reduced sales by $11 million.
Cost of Sales
Electronics | Other | Eliminations | Total | ||||||||||||
(Dollars in Millions) | |||||||||||||||
December 31, 2015 | $ | 2,666 | $ | 164 | $ | (15 | ) | $ | 2,815 | ||||||
Currency | (37 | ) | (7 | ) | — | (44 | ) | ||||||||
Volume, mix, and net new business | 100 | (10 | ) | 15 | 105 | ||||||||||
Germany Interiors Divestiture | — | (83 | ) | — | (83 | ) | |||||||||
Other | (95 | ) | (1 | ) | — | (96 | ) | ||||||||
December 31, 2016 | $ | 2,634 | $ | 63 | $ | — | $ | 2,697 | |||||||
Electronics cost of sales decreased during the year ended December 31, 2016 by $32 million when compared with the same period in 2015. Cost of sales increased $100 million attributable to higher volumes as well as changes in product mix, representing the variable nature of material and labor costs. Foreign currency decreased cost of sales by $37 million primarily attributable to the Chinese Renminbi, Euro, and Mexican Peso, partially offset by the Japanese Yen. Additionally, the Company recognized $95 million of net efficiencies related to material and manufacturing costs.
Cost of sales for Other decreased $101 million, reflecting the impacts of the Germany Interiors Divestiture during the fourth quarter of 2015, and lower production volumes related to the wind down for certain businesses in South America.
Cost of sales includes net engineering costs, comprised of gross engineering expenses related to forward model program development and advanced engineering activities, partially offset by engineering cost recoveries from customers. Electronics gross engineering expenses were $399 million for the year ended December 31, 2016, an increase of $23 million compared to the same period of 2015. Engineering recoveries were $104 million for the year ended December 31, 2016, an increase of $22 million compared to the same period of 2015. Engineering cost recoveries can fluctuate period to period depending on underlying contractual terms and conditions and achievement of related development milestones.
28
Adjusted EBITDA
Electronics | Other | Total | |||||||||
(Dollars in Millions) | |||||||||||
December 31, 2015 | $ | 294 | $ | (12 | ) | $ | 282 | ||||
Volume and mix | 15 | (4 | ) | 11 | |||||||
Currency | 12 | 6 | 18 | ||||||||
Other | 25 | 1 | 26 | ||||||||
December 31, 2016 | $ | 346 | $ | (9 | ) | $ | 337 | ||||
Electronics Adjusted EBITDA increased $52 million for the year ended December 31, 2016 when compared to the same period of 2015. Higher volumes and new business, primarily in Asia, increased Adjusted EBITDA by $15 million. Currency increased adjusted EBITDA by $12 million primarily related to the Mexican Peso partially offset by the Japanese Yen. Net cost performance increased adjusted EBITDA by $25 million primarily reflecting material, manufacturing, and selling, general and administrative efficiencies, partially offset by customer pricing.
Other Adjusted EBITDA for the year ended December 31, 2016 increased by $3 million compared to the same period of 2015 primarily reflecting favorable currency related to the Argentine Peso and net cost efficiencies related to the wind-down of the legacy Climate facilities, partially offset by the impact of the sale of Germany Interiors Divestiture during the fourth quarter of 2015.
Consolidated Results of Operations - 2015 Compared with 2014
The Company's consolidated results of operations for the years ended December 31, 2015 and 2014 were as follows:
Year Ended December 31 | |||||||||||
2015 | 2014 | Change | |||||||||
(Dollars in Millions) | |||||||||||
Sales | $ | 3,245 | $ | 2,586 | $ | 659 | |||||
Cost of sales | 2,815 | 2,246 | 569 | ||||||||
Gross margin | 430 | 340 | 90 | ||||||||
Selling, general and administrative expenses | 245 | 228 | 17 | ||||||||
Restructuring expense | 36 | 54 | (18 | ) | |||||||
Interest expense | 19 | 25 | (6 | ) | |||||||
Interest income | 5 | 4 | 1 | ||||||||
Equity in net income of non-consolidated affiliates | 7 | 2 | 5 | ||||||||
Loss on debt extinguishment | 5 | 23 | (18 | ) | |||||||
Loss on divestiture | 105 | — | 105 | ||||||||
Gain on non-consolidated affiliate transactions, net | 62 | 2 | 60 | ||||||||
Other expense, net | 25 | 61 | (36 | ) | |||||||
Provision for income taxes | 27 | 32 | (5 | ) | |||||||
Net income (loss) from continuing operations | 42 | (75 | ) | 117 | |||||||
Net income (loss) from discontinued operations, net of tax | 2,286 | (131 | ) | 2,417 | |||||||
Net income (loss) | 2,328 | (206 | ) | 2,534 | |||||||
Net income attributable to non-controlling interests | 44 | 89 | (45 | ) | |||||||
Net income (loss) attributable to Visteon Corporation | $ | 2,284 | $ | (295 | ) | $ | 2,579 | ||||
Adjusted EBITDA* | $ | 282 | $ | 177 | $ | 105 | |||||
* Adjusted EBITDA is a Non-GAAP financial measure, as previously described. | |||||||||||
29
Sales
Sales for the year ended December 31, 2015 totaled $3,245 million, which represents an increase of $659 million compared with the same period of 2014. The primary drivers of the sales increase included the Electronics Acquisition effective July 1, 2014 which increased sales by $691 million. Additionally, higher production volumes and new business favorably impacted sales by $199 million. Favorable volumes increased sales in the Electronics segment but this was partially offset by unfavorable volumes in Other, primarily driven by the wind-down of certain South American businesses and the sale of the Germany Interiors facility on December 1, 2015. Currency unfavorably impacted sales by $175 million, primarily attributable to the weakening Euro, Japanese Yen, Brazilian Real, and the Chinese Renminbi. Other reductions of $56 million were associated with customer pricing, net of design savings.
Cost of Sales
Cost of sales increased $569 million for the year ended December 31, 2015 when compared with the same period in 2014. The increase includes $771 million attributable to increased production volumes, including the Electronics Acquisition, as well as changes in product mix, representing the variable nature of material and labor costs. These increases were partially offset by foreign currency which decreased cost of sales by $142 million, attributable to the weakening of the Euro, Japanese Yen, Brazilian Real, and Chinese Renminbi, the non-recurrence of a 2014 pension settlement gain of $25 million and increased warranty costs primarily attributable to three customer actions related to defective supplier parts of $14 million. Additionally, the Company realized $85 million of net efficiencies related to material, design, and usage economics and other costs.
Gross Margin
The Company's gross margin was $430 million or 13.3% of sales for the year ended December 31, 2015 compared to $340 million or 13.1% of sales for the same period of 2014. The $90 million increase in gross margin included $119 million from favorable volumes and mix, including the impacts of the Electronics Acquisition. Gross margin also included favorable net cost performance of $43 million, primarily reflecting material cost efficiencies. These increases were partially offset by $33 million of unfavorable currency, $25 million related to the non-recurrence of a 2014 pension settlement gain and $14 million of increased warranty costs primarily attributable to three customer actions related to defective supplier parts.
Selling, General and Administrative Expenses
Selling, general, and administrative expenses were $245 million or 7.6% of sales and $228 million or 8.8% of sales during the years ended December 31, 2015 and 2014, respectively. The increase of $17 million is attributable to the Electronics Acquisition which increased costs $48 million and lower cost recoveries associated with divested businesses which increased costs $10 million. These increases were partially offset by cost efficiencies and foreign currency impacts.
Restructuring Expense
Electronics: In connection with the Electronics Acquisition, the Company commenced a restructuring program designed to achieve cost savings through transaction synergies, of approximately $70 million. During the years ended December 31, 2015 and 2014, the Company recorded $20 million and $37 million, respectively, of severance and termination benefits, net of reversals, under this program associated with approximately 1,100 employees.
During October 2015, the Company announced a restructuring program designed to reduce the workforce at a European Electronics facility. The Company recorded $12 million of severance and termination benefits under this program associated with approximately 100 employees.
The Company previously announced a restructuring program designed to reduce fixed costs and to improve operational efficiencies by addressing certain under-performing operations. In connection with that program, the Company announced plans to realign its corporate and administrative functions directly to their corresponding operational beneficiary. During the year ended December 31, 2015, the Company recorded $4 million for restructuring expenses, primarily related to severance and termination benefits associated with certain executives.
Other: During 2014, the Company announced the closure of a Climate facility located in Quilmes, Argentina. In connection with the closure, the Company recorded $13 million of restructuring expenses, primarily related to severance and termination benefits associated with approximately 270 employees. During 2014, the Company recorded $8 million of costs associated with closing facilities in South Africa and Spain.
30
Discontinued Operations: Restructuring activities for discontinued operations, included in Other, primarily consist of the following:
• | The Company recorded and paid cash to settle employee severance and termination benefits of $2 million and $3 million, respectively, for the years ended December 31, 2015 and 2014 at the Company's Climate operations in France, under a previously announced program designed to commonize global business systems and processes across its Climate operations for the purpose of reducing costs. |
• | During 2014, the Company recorded $5 million of employee severance and termination benefit costs associated with a previously announced plan to restructure three Interiors facilities located in France and made cash payments of approximately $18 million for related employee severance and termination benefits. |
• | During 2014, the Company announced a plan to further reduce the workforce and related processes at an Interiors operation in Brazil and recorded an additional $3 million for employee severance and termination benefits associated with approximately 50 employees. |
Interest Expense
Interest expense for the year ended December 31, 2015 of $19 million decreased $6 million when compared to $25 million for the same period of 2014. Interest expense for the year ended December 31, 2015 of $19 million is primarily associated with the Company's Term Facility due April 9, 2021 with original principal of $600 million and prepaid down to $350 million following the Climate Transaction in June 2015. During the year ended December 31, 2014, interest expense of $25 million primarily included interest expense of $10 million associated with the Company's 6.75% Senior Notes which were redeemed in April 2014 and interest expense of $13 million associated with the Company's Term Facility at original principal balance of $600 million.
Interest Income
Interest income was $5 million and $4 million for the years ended December 31, 2015 and 2014, respectively. Interest income for 2015 benefited from the investment of Climate Transaction proceeds received in June 2015, while interest income for 2014 benefited from the investment of Yanfeng divestiture proceeds received at the end of 2013.
Equity in Net Income of Non-Consolidated Affiliates
Equity in net income of non-consolidated affiliates was $7 million and $2 million for the years ended December 31, 2015 and 2014, respectively. The increase was primarily attributable to dividend recognition for a cost basis investment.
Loss on Debt Extinguishment
The Company recorded losses on debt extinguishment of $5 million and $23 million during the years ended December 31, 2015 and 2014, respectively. Loss on debt extinguishment of $5 million during the year ended December 31, 2015 related to the $246 million repayment of the Company's Term Facility, reducing the outstanding aggregate principal $350 million, including unamortized original issue discount, debt fees and other debt costs. Loss on debt extinguishment of $23 million during the year ended December 31, 2014 related to the repayment and redemption of the Company's 6.75% senior notes due April 15, 2019 including premium paid on the redemption and unamortized original issue discount, debt fees and other debt issue costs.
Loss on Divestiture
On December 1, 2015, Visteon completed the Germany Interiors Divestiture by contributing cash of approximately $141 million, assets of $27 million, and liabilities of $198 million, including pension related liabilities. The Company will make a final contribution payment of approximately $31 million during the first half of 2017 upon fulfillment of buyer contractual commitments. The Company recognized a pretax loss on divestiture of $105 million related to foreign currency translation and pension benefit plan amounts previously recorded in accumulated other comprehensive loss.
Gain on Non-Consolidated Affiliate Transactions, Net
During the year ended December 31, 2015, the Company completed the sale of its 12.5% ownership interest in Yanfeng Visteon Jinqiao Automotive Trim Systems Company, Limited, a Chinese automotive interiors supplier, for proceeds of $91 million and recorded a pretax gain on sale of $62 million.
During the year ended December 31, 2014, the Company completed the sale of its 50% ownership interest in Duckyang Industry Co., Ltd. ("Duckyang"), a Korean automotive interiors supplier. In connection with the transaction, the Company received total
31
cash of approximately $31 million, including $6 million of dividends. The Company recorded a pretax gain of approximately $2 million on this transaction during the year ended December 31, 2014.
Other Expense, Net
Other expense, net consists of the following:
Year Ended December 31 | |||||||
2015 | 2014 | ||||||
(Dollars in Millions) | |||||||
Transformation costs | $ | 25 | $ | 22 | |||
Integration costs | 14 | 18 | |||||
Transaction hedging and exchange (income) loss | (15 | ) | 10 | ||||
Provision for losses on recoverable taxes | — | 8 | |||||
Loss on asset contribution | 1 | 3 | |||||
$ | 25 | $ | 61 | ||||
The Company recorded transformation costs of $25 million and $22 million for the years ended December 31, 2015 and 2014, respectively, related to financial and advisory services associated with continued execution of its comprehensive shareholder value creation plan and certain severance costs associated with the Electronics Acquisition and the Climate Transaction. Hedging and exchange gains of $15 million and losses of $10 million for the years ended December 31, 2015 and 2014 respectively, relate to the Climate Transaction proceeds and the Germany Interiors Divestiture contribution.
During the years ended December 31, 2015 and 2014, the Company recorded $14 million and $18 million , respectively, of costs to integrate the businesses associated with the Electronics Acquisition. Integration costs incurred were related to re-branding, facility modification, information technology readiness and related professional services.
The Company recorded $8 million during the year ended December 31, 2014 to adjust recoverable value-added taxes to net realizable value attributable to business exit activities. In connection with the closure of the Climate facility located in Quilmes, Argentina in 2014, the Company contributed land and building with a net book value of $3 million to the local municipality for the benefit of former employees.
Income Taxes
The Company's provision for income tax was $27 million for year ended December 31, 2015 reflects income tax expense related to those countries where the Company is profitable, accrued withholding taxes, ongoing assessments related to the recognition and measurement of uncertain tax benefits, the inability to record a tax benefit for pretax losses in the U.S. and certain other jurisdictions due to valuation allowances, and other non-recurring tax items.
The Company's provision for income taxes decreased $5 million for the year ended December 31, 2015 compared with 2014. The decrease included a $9 million year-over-year reduction in unrecognized tax benefits, including interest and penalties, related primarily to favorable audit developments in Asia during the first quarter of 2015, and statute expirations in Europe during 2015, as well as an $18 million income tax benefit on pretax U.S. losses from continuing operations. Although the Company maintains a full valuation allowance against net deferred tax assets in the U.S., the level of other categories of income generated in the U.S. during 2015 (primarily related to discontinued operations) resulted in a charge to discontinued operations income tax expense of $18 million with the offsetting benefit recognized in continuing operations, effectively resulting from a reduction in the valuation allowance against deferred tax assets. Other changes in the Company’s deferred tax asset valuation allowances did not materially impact net tax expense during the years ended December 31, 2015 or 2014. These decreases were partially offset by $12 million attributable to overall changes in the mix of earnings and tax rates between jurisdictions, $8 million related to China tax in connection with the sale of Yanfeng Visteon Jinqiao Automotive Trim Systems Company, Limited and $4 million related to the non-recurrence of a tax benefit related to the partial elimination of valuation allowances in Mexico during 2014.
Visteon's emergence from bankruptcy in 2010 resulted in a change of ownership within the meaning of Internal Revenue Code (“IRC”) Sections 382 and 383, causing the use of Visteon's pre-emergence U.S. federal net operating loss (“NOL”) and various other tax attributes to be limited in the post-emergence period. However, NOLs and other tax attributes generated in the post emergence period are generally not limited by the emergence from bankruptcy, but could be limited if there is a subsequent change of ownership. If the Company were to have another change of ownership within the meaning of IRC Sections 382 and 383, its
32
post-emergence NOL and other tax attributes could be limited to an amount equal to its market capitalization at the time of the subsequent ownership change multiplied by the federal long-term tax exempt rate. The Company cannot provide any assurance that such an ownership change will not occur, in which case the availability of the Company's NOLs and other tax attributes could be significantly limited or possibly eliminated. In order to continue to protect the Company's pre and post-emergence period tax attributes and reduce the likelihood that the Company will experience an additional ownership change, once the Company's market capitalization falls below $1.5 billion Board of Director approval is required should a person or group become a 5-percent shareholder and/or an existing 5-percent shareholder intend to increase its ownership interest.
Discontinued Operations
The operations subject to the Interiors Divestiture and Climate Transaction met conditions required to qualify for discontinued operations reporting. Accordingly, the results of operations for the Interiors and Climate businesses have been reclassified to Net income (loss) from discontinued operations in the Consolidated Statements of Operations for the years ended December 31, 2015 and 2014. See Note 5 "Discontinued Operations" for additional disclosures.
Net Income (Loss)
Net income attributable to Visteon was $2,284 million for the year ended December 31, 2015, representing an increase of $2,579 million when compared with net loss attributable to Visteon of $295 million for the year ended December 31, 2014. Net income attributable to Visteon in 2015 included a gain on the Climate Transaction of $2,324 million and a gain on sale of a non-consolidated affiliate of $62 million, partially offset by a loss on the Germany Divestiture of $105 million. Net loss attributable to Visteon was $295 million for the year ended December 31, 2015, including total losses on the Interiors Divestiture of $326 million. Net income (loss) was also impacted by discontinued operations including the timing of the Climate Transaction effective in June of 2015 and the vast majority of the Interiors Divestiture in November of 2014.
Adjusted EBITDA
Year Ended December 31 | |||||||||||
2015 | 2014 | Change | |||||||||
(Dollars in Millions) | |||||||||||
Adjusted EBITDA | $ | 282 | $ | 177 | $ | 105 | |||||
Depreciation and amortization | 85 | 70 | 15 | ||||||||
Restructuring expense | 36 | 54 | (18 | ) | |||||||
Interest expense, net | 14 | 21 | (7 | ) | |||||||
Loss on debt extinguishment | 5 | 23 | (18 | ) | |||||||
Equity in net income of non-consolidated affiliates | (7 | ) | (2 | ) | (5 | ) | |||||
Gain on non-consolidated affiliate transactions | (62 | ) | (2 | ) | (60 | ) | |||||
Loss on divestiture | 105 | — | 105 | ||||||||
Other expense, net | 25 | 61 | (36 | ) | |||||||
Provision for income taxes | 27 | 32 | (5 | ) | |||||||
Net (income) loss from discontinued operations, net of tax | (2,286 | ) | 131 | (2,417 | ) | ||||||
Net income attributable to non-controlling interests | 44 | 89 | (45 | ) | |||||||
Non-cash, stock-based compensation expense | 8 | 12 | (4 | ) | |||||||
Pension settlement gain | — | (25 | ) | 25 | |||||||
Other | 4 | 8 | (4 | ) | |||||||
Net income (loss) attributable to Visteon Corporation | $ | 2,284 | $ | (295 | ) | $ | 2,579 | ||||
33
Segment Results of Operations - 2015 compared with 2014
Sales
Electronics | Other | Eliminations | Total | ||||||||||||
(Dollars in Millions) | |||||||||||||||
December 31, 2014 | $ | 2,386 | $ | 251 | $ | (51 | ) | $ | 2,586 | ||||||
Volume and mix | 240 | (77 | ) | 36 | 199 | ||||||||||
Currency | (156 | ) | (19 | ) | — | (175 | ) | ||||||||
Electronics Acquisition | 691 | — | — | 691 | |||||||||||
Other | (54 | ) | (2 | ) | — | (56 | ) | ||||||||
December 31, 2015 | $ | 3,107 | $ | 153 | $ | (15 | ) | $ | 3,245 | ||||||
Electronics sales increased during the year ended December 31, 2015 by $721 million. The largest driver of the sales increase was attributable to the Electronics Acquisition, representing $691 million of the increase. Higher production volumes, primarily in Asia and Europe, increased sales by $240 million. Unfavorable currency, primarily related to the Euro, Japanese Yen, and Chinese Renminbi decreased sales by $156 million. Other changes, totaling $54 million, reflected customer pricing net of design changes.
Other sales decreased during the year ended December 31, 2015 by $98 million, including unfavorable volume and product mix of $77 million primarily reflecting the wind down of certain South America businesses and the sale of the Germany Interiors facility on December 1, 2015. Unfavorable currency, primarily related to the Euro and Brazilian Real, was $19 million.
Cost of Sales
Electronics | Other | Eliminations | Total | ||||||||||||
(Dollars in Millions) | |||||||||||||||
December 31, 2014 | $ | 2,062 | $ | 235 | $ | (51 | ) | $ | 2,246 | ||||||
Currency | (128 | ) | (14 | ) | — | (142 | ) | ||||||||
Volume, mix, and net new business | 805 | (70 | ) | 36 | 771 | ||||||||||
Other | (73 | ) | 13 | — | (60 | ) | |||||||||
December 31, 2015 | $ | 2,666 | $ | 164 | $ | (15 | ) | $ | 2,815 | ||||||
Substantially all of the increases in Electronics cost of sales are attributable to the Electronics Acquisition effective July 1, 2014.
Net engineering costs are comprised of gross engineering expenses related to forward model program development and advanced engineering activities, partially offset by engineering cost recoveries from customers. Electronics gross engineering expenses were $376 million for the year ended December 31, 2015, an increase of $75 million compared to the same period of 2014. Engineering recoveries were $82 million for the year ended December 31, 2015, an increase of $35 million compared to the same period of 2014. Engineering cost recoveries can fluctuate period to period depending on underlying contractual terms and conditions and achievement of related development milestones.
Other cost of sales decreased year over year, primarily related to a $46 million reduction in material costs, a $10 million reduction in freight costs, and a $24 million reduction in labor and overhead costs, reflecting lower production volumes related to the wind down for certain programs in South America and the sale of the Germany Interiors facility on December 1, 2015. Cost of sales in Other also increased $17 million driven by the non-recurrence of a $12 million tax settlement in Brazil and the non-recurrence of a $7 million pension settlement gain.
Adjusted EBITDA
Electronics | Other | Total | |||||||||
(Dollars in Millions) | |||||||||||
December 31, 2014 | $ | 171 | $ | 6 | $ | 177 | |||||
Volume and mix | 93 | (7 | ) | 86 | |||||||
Currency | (18 | ) | (5 | ) | (23 | ) | |||||
Other | 48 | (6 | ) | 42 | |||||||
December 31, 2015 | $ | 294 | $ | (12 | ) | $ | 282 | ||||
34
Electronics Adjusted EBITDA increased $123 million for the year ended December 31, 2015 when compared to the same period of 2014. Higher volumes, including the Electronics Acquisition, new business, and favorable product mix, increased Adjusted EBITDA by $93 million. Currency, largely related to the Euro, Japanese Yen and Chinese Renminbi, had an unfavorable impact of $18 million. Other net cost efficiencies of $48 million include $53 million of material, design, and manufacturing costs, $9 million of selling, general, and administrative cost efficiencies, partially offset by $14 million of one time warranty costs.
Other Adjusted EBITDA for the year ended December 31, 2015 decreased by $18 million compared to the same period of 2014. The decrease was partially explained by the non-recurrence of a $12 million Brazil tax settlement in 2014. The additional decrease is attributable to lower production volumes, the Germany Interiors facility sale on December 1, 2015, and unfavorable currency.
Liquidity
Overview
The Company's primary sources of liquidity are cash flows from operations, existing cash balances, and borrowings under available credit facilities, if necessary. The Company believes that funds generated from these sources will be adequate to fund its liquidity requirements.
A portion of the Company's cash flows from operations are generated outside of the U.S. Accordingly, the Company utilizes a combination of cash repatriation strategies, including dividends, royalties, intercompany loan repayments and other distributions and advances to provide the funds necessary to meet obligations globally. The Company’s ability to access funds from its subsidiaries using these repatriation strategies is subject to, among other things, customary regulatory and statutory requirements and contractual arrangements including joint venture agreements and local debt agreements. Additionally, such repatriation strategies may be adjusted or modified as the Company continues to, among other things, rationalize its business portfolio and cost structure.
The Company's ability to fund its liquidity needs is dependent on the level, variability and timing of its customers' worldwide vehicle production, which may be affected by many factors including, but not limited to, general economic conditions, specific industry conditions, financial markets, competitive factors and legislative and regulatory changes. The Company monitors the macroeconomic environment and its impact on vehicle production volumes in relation to the Company's specific cash needs. The Company's intra-year needs are impacted by seasonal effects in the industry, such as mid-year shutdowns, the subsequent ramp-up of new model production and the additional year-end shutdowns by primary customers.
To the extent that the Company's liquidity needs exceed cash provided by its operating activities, the Company would look to cash balances on hand, a $350 million Term Facility due April 9, 2021 ("Term Facility"), its $200 million revolving credit facility due April 9, 2019 ("Revolving Facility"), other affiliate working capital lines of credit, or additional capital through debt or equity markets. Availability under outstanding affiliate credit facilities as of December 31, 2016 is approximately $34 million. See Note 13 "Debt" to the accompanying consolidated financial statements for a more comprehensive discussion of the Company's Term Revolving Facilities. Access to additional capital through the debt or equity markets is influenced by the Company's credit ratings. In March 2016, the Company's credit rating was upgraded by S&P to BB- from B+ and Moody's upgraded the Company's credit rating to Ba3 from B1.
Cash Balances
As of December 31, 2016, the Company had total cash of $882 million, including $4 million of restricted cash. Cash balances totaling $582 million were located in jurisdictions outside of the United States, of which approximately $220 million is considered permanently reinvested for funding ongoing operations outside of the U.S. If such permanently reinvested funds are repatriated to operations in the U.S., the Company would be required to accrue additional tax expense, primarily related to foreign withholding taxes.
Restructuring
During the year ended December 31, 2016, the Company paid $44 million related to restructuring activities. The Company expects to pay $40 million in 2017. See Note 7 "Restructuring" to the Company's consolidated financial statements included in Item 8 of this Report for further information.
35
Other Items Affecting Liquidity
In 2015, the Company entered an agreement to repurchase from the buyer certain electronics operations located in India for an estimated purchase price of $50 million and recorded this obligation in 2015. This transaction is expected to close during the first half of 2017 after legal separation and regulatory approvals requirements are met.
During the first half of 2017, the Company expects to make remaining payments of approximately $31 million related to the Germany Interiors Divestiture that closed on December 1, 2015.
During the year ended December 31, 2016, cash contributions to the Company's U.S. and non-U.S. defined benefit pension plan were $12 million. The Company expects to make cash contributions to its defined benefit pension plans of $7 million in 2017. Estimated cash contributions for 2018 through 2020, under current regulations and market assumptions are approximately $29 million.
Cash Flows
Operating Activities
Including discontinued operations, the Company generated $120 million of cash from operating activities during the year ended December 31, 2016, compared to $338 million during the same period of 2015 for a decrease of $218 million. The decrease in cash provided by operating activities is primarily attributable to the divestiture of climate operations which provided $186 million in the first half of 2015. The remaining $32 million decrease in cash from operating activities reflects higher income tax payments of approximately $51 million primarily related to Japan, China and Europe, partially offset by the non-recurrence of taxes withheld in connection with the 2015 sale of a non-consolidated affiliate. The decrease in cash from operating activities is also impacted by higher information technology transition agreements payments of $15 million and higher restructuring payments of $13 million. These decreases were partially offset by the non-recurrence of 2015 Climate Transaction related labor and incentive payments of $48 million.
The Company generated $338 million of cash from operating activities during the year ended December 31, 2015, compared to $284 million during the same period of 2014 for an increase of $54 million. The increase during the year ended December 31, 2015 is attributable to lower working capital requirements primarily related to an approximate $97 million reduction in HVCC operations, the impact of capitalized engineering recoveries of $17 million and lower restructuring cash payments of $23 million. These increases were partially offset by Climate Transaction related payments of $69 million, primarily labor and incentive payments of $48 million, information technology transition agreements payments of $18 million, interiors divestitures related information technology transition agreement payments of $5 million, and lower dividends from non-consolidated affiliates of $9 million.
Investing Activities
Cash provided from investing activities during the year ended December 31, 2016 totaled $302 million, compared to net cash provided from investing activities of $2,358 million in the same period in 2015 for a decrease of $2,056 million. Net cash provided from investing activities during the year ended December 31, 2016, includes the Climate Transaction withholding tax recovery of $356 million, liquidation of short-term investments of $47 million, and proceeds from a cost-basis investment of $11 million. These increases were partially offset by capital expenditures of $75 million, payments related to the South America interiors divestiture of $10 million and a three-year term loan of $10 million provided to the buyer, the acquisition of AllGo Embedded Systems Private Limited of $15 million and net loans to non-consolidated affiliates of $8 million.
Cash provided from investing activities during the year ended December 31, 2015 totaled $2,358 million, compared to net cash used by investing activities of $740 million for the same period in 2014 for an increase of $3,098 million. Net cash provided from investing activities during the year ended December 31, 2015 included the impacts of divestiture activity including Climate Transaction net proceeds of $2,664 million and non-consolidated affiliate divestiture proceeds of $91 million, partially offset by the Germany Interiors Divestiture contribution of $141 million and other transaction related payments of $15 million. Additional investing activity included capital expenditures of $187 million and short-term net investments of $47 million.
Financing Activities
Cash used by financing activities during the year ended December 31, 2016 totaled $2,262 million, compared to $774 million for the same period in 2015 for an increase in cash used by financing activities of $1,488 million. Cash used by financing activities during the year ended December 31, 2016 included a distribution payment of $1,736 million, share repurchases of $500 million,
36
stock based compensation tax withholding payments of $11 million, non-controlling interest dividends of $13 million, and capital lease and net debt payments of $2 million.
Cash used by financing activities during the year ended December 31, 2015 totaled $774 million, compared to $359 million for the same period in 2014 for an increase in cash used by financing activities of $415 million. Cash used by financing activities during the year ended December 31, 2015 included $500 million in share repurchases, the prepayment on the Company's term facility, including fees, of $250 million, non-controlling interest dividends of $55 million, partially offset by option and warrant exercises of $40 million.
Debt and Capital Structure
The Company’s short and long-term debt consists of the following:
Weighted Average Interest Rate | Carrying Value | ||||||||||||
Maturity | 2016 | 2015 | 2016 | 2015 | |||||||||
(Dollars in Millions) | |||||||||||||
Short-term debt: | |||||||||||||
Current portion of long-term debt | 4.2% | 4.6% | $ | 3 | $ | 3 | |||||||
Short-term borrowings | 2.6% | 2.4% | 33 | 34 | |||||||||
Total short-term debt | $ | 36 | $ | 37 | |||||||||
Long-term debt: | |||||||||||||
Term facility due April 9, 2021 | 2021 | 4.0% | 3.5% | $ | 346 | $ | 345 | ||||||
Other | 2016-2020 | 13.4% | 4.1% | — | 1 | ||||||||
Total long-term debt | $ | 346 | $ | 346 | |||||||||
See "Liquidity" above and also see Notes 13 "Debt" and Note 17 "Stockholders' Equity and Non-controlling Interests" to the Company's consolidated financial statements included in Item 8 of this Report for further information.
Stock Warrants
In October 2010, the Company issued ten year warrants expiring October 1, 2020 at an exercise price of $9.66 per share. As of December 31, 2016 and 2015, there are 909 warrants outstanding. The warrants may be net share settled and are recorded as permanent equity in the Company’s consolidated balance sheets. These warrants were valued at $15.00 per share on the October 1, 2010 issue date using the Black-Scholes option pricing model.
Pursuant to the Ten Year Warrant Agreement, the original exercise price of $9.66 for the ten year warrants is subject to adjustment as a result of the special distribution of $43.40 per share to shareholders at the beginning of 2016. The new exercise price for each of the remaining 909 ten year warrants outstanding as of December 31, 2016 is reduced to a nominal $0.01 and each warrant is entitled to approximately 1.4 shares of stock upon exercise based on share price as of December 31, 2016.
Share Repurchase Program
On January 10, 2017 the Company announced that its board of directors authorized a share repurchase program of up to $400 million of common stock to be executed through March 2018.
During 2016, the Company paid $500 million and repurchased 7,190,506 shares of common stock. During 2015, the Company paid $500 million and repurchased 4,771,262 shares of common stock.
The Company anticipates that additional repurchases of common stock, if any, would occur from time to time in open market transactions or in privately negotiated transactions depending on market and economic conditions, share price, trading volume, alternative uses of capital and other factors. See Note 17 "Stockholder's Equity and Non-controlling Interests" in Item 8 of this Report for more information on the Company's share repurchase programs.
37
Treasury Stock
As of December 31, 2016 and 2015, the Company held 22,211,410 and 15,182,372 shares of common stock in treasury. These shares may be used in satisfying obligations under employee incentive compensation arrangements. The Company values shares of common stock held in treasury at cost.
Off-Balance Sheet Arrangements
The Company does not have any off-balance sheet arrangements.
Contractual Obligations
The following table summarizes the Company's contractual obligations existing as of December 31, 2016:
Total | 2017 | 2018-2019 | 2020-2021 | 2022 & After | |||||||||||||||
(Dollars in Millions) | |||||||||||||||||||
Debt, including capital leases | $ | 386 | $ | 36 | $ | — | $ | 350 | $ | — | |||||||||
Purchase obligations | 129 | 65 | 38 | 19 | 7 | ||||||||||||||
Interest payments on long-term debt | 58 | 13 | 27 | 18 | — | ||||||||||||||
Operating leases | 155 | 23 | 38 | 30 | 64 | ||||||||||||||
Transaction obligations | 81 | 81 | — | — | — | ||||||||||||||
Total contractual obligations | $ | 809 | $ | 218 | $ | 103 | $ | 417 | $ | 71 | |||||||||
This table excludes amounts related to the Company's income tax liabilities associated with uncertain tax positions impacting the effective rate of $12 million as the Company is unable to make reasonable estimates for the periods in which these liabilities may become due.
The Company also has minimum funding requirements with respect to pension obligations. The Company may elect to make contributions in excess of the minimum funding requirements in response to investment performance or changes in interest rates. During 2017, the Company expects to make cash contributions to its U.S. defined benefit and non-U.S. defined benefit pension plans of $1 million and $6 million, respectively. The Company’s expected 2017 contributions may be revised.
Critical Accounting Estimates
The Company’s significant accounting policies have been disclosed in the consolidated financial statements and accompanying notes under Note 2 “Summary of Significant Accounting Policies.” Certain policies relate to estimates that involve matters that are highly uncertain at the time the accounting estimate is made and different estimates or changes to an estimate could have a material impact on the reported financial position, changes in financial condition or results of operations. Such critical estimates are discussed below. For these, materially different amounts could be reported under varied conditions and assumption. Other items in the Company's consolidated financial statements require estimation, however, in our judgment, they are not as critical as those discussed below.
Product Warranty and Recall
The Company accrues for warranty obligations for products sold based on management estimates, with support from the Company’s sales, engineering, quality and legal functions, of the amount that eventually will be required to settle such obligations. This accrual is based on several factors, including contractual arrangements, past experience, current claims, production changes, industry developments and various other considerations. The Company accrues for product recall claims related to potential financial participation in customer actions to provide remedies as a result of actual or threatened regulatory or court actions or the Company’s determination of the potential for such actions. The Company's accrual for recall claims is based on specific facts and circumstances underlying individual claims with support from the Company’s engineering, quality and legal functions. Amounts accrued are based upon management’s best estimate of the amount that will ultimately be required to settle such claims. See Note 21 "Commitments and Contingencies" in Item 8 of this Report for additional information.
38
Restructuring
The Company accrued costs in connection with its restructuring of the engineering and administration organization. These accruals include estimates primarily related to employee termination costs. Actual costs may vary from these estimates. These accruals are reviewed on a quarterly basis and changes to restructuring actions are appropriately recognized when identified. See Note 7 “Restructuring” in Item 8 of this report for additional information.
Pension Plans
Many of the Company’s employees participate in defined benefit pension plans or retirement/termination indemnity plans. The Company has approximately $289 million in unfunded pension liabilities as of December 31, 2016, of which approximately $220 million and $69 million are attributable to U.S. and non-U.S. pension plans, respectively. The determination of the Company’s obligations and expense for its pension plans is dependent on the Company’s selection of certain assumptions used by actuaries in calculating such amounts. Selected assumptions are described in Note 14 “Employee Retirement Benefits” to the Company’s consolidated financial statements included in Item 8 “Financial Statements and Supplementary Data” of this Annual Report on Form 10-K, which are incorporated herein by reference, including the discount rate, expected long-term rate of return on plan assets and rate of increase in compensation.
Actual results that differ from assumptions used are accumulated and amortized over future periods and, accordingly, generally affect recognized expense in future periods. Therefore, assumptions used to calculate benefit obligations as of the annual measurement date directly impact the expense to be recognized in future periods. The primary assumptions affecting the Company’s accounting for employee benefits, as of December 31, 2016 are as follows:
• | Long-term rate of return on plan assets: The expected long-term rate of return is used to calculate net periodic pension cost. The required use of the expected long-term rate of return on plan assets may result in recognized returns that are greater or less than the actual returns on those plan assets in any given year. Over time the expected long-term rate of return on plan assets is designed to approximate actual returns. The expected long-term rate of return for pension assets has been estimated based on various inputs, including historical returns for the different asset classes held by the Company’s trusts and its asset allocation, as well as inputs from internal and external sources regarding expected capital market returns, inflation and other variables. |
In determining its pension expense for 2016, the Company used long-term rates of return on plan assets ranging from 3.5% to 12.7% outside the U.S. and 7.0% in the U.S. The Company has set the assumptions for its 2017 pension expense which range from 2.9% to 11.5% outside the U.S. and 6.75% in the U.S. Actual returns on U.S. pension assets for 2016, 2015 and 2014 were 8.4%, (3.8)% and 14.4%, respectively, compared to the expected rate of return assumption of 7% for each of those years. The Company’s market-related value of pension assets reflects changes in the fair value of assets over a five-year period, with a one-third weighting to the most recent year. Market-related value was reset to fair value at October 1, 2010.
• | Discount rate: The discount rate is used to calculate pension obligations. The discount rate assumption is based on market rates for a hypothetical portfolio of high-quality corporate bonds rated Aa or better with maturities closely matched to the timing of projected benefit payments for each plan at its annual measurement date. The Company used discount rates ranging from .8% to 12.7% to determine its pension and other benefit obligations as of December 31, 2016, including weighted average discount rates of 4.12% for U.S. pension plans, and 4.39% for non-U.S. pension plans. |
2016 Discount Rate for Estimated Service and Interest Cost: Through December 31, 2015, the Company recognized service and interest components of pension expense using a single weighted average discount rate derived from the yield curve used to measure the benefit obligation at the beginning of the period. The single weighted average discount method represents the constant annual rate required to discount all future benefit payments related to past service from the date of expected future payment to the measurement date, such that the aggregate present value equals the obligation. The U.S. and certain non-U.S. frozen plans do not have a service component, as additional benefits are no longer accrued.
During the fourth quarter of 2015, the Company changed the method used to estimate the service and interest components of net periodic benefit cost for pension benefits for its U.S. and certain non-U.S. plans. The Company has elected to utilize an approach that discounts individual expected cash flows underlying interest and service costs using the applicable spot rates derived from the yield curve used to determine the benefit obligation to the relevant projected cash flows. The election and adoption of this method provides a more precise measurement of service and interest costs by improving the correlation between projected benefit cash flows and the corresponding spot yield curve rates. The use of disaggregated discount rates results in a different amount of interest cost compared to the traditional single weighted-average discount rate approach because of different weightings given to each subset of payments. The use of disaggregated discount rates affects the amount of service cost because the benefit payments
39
associated with new service credits for active employees tend to be of longer duration than the overall benefit payments associated with the plan’s benefit obligation. As a result, the payments would be associated with longer-term spot rates on the yield curve, resulting in lower present values than the calculations using the traditional single weighted-average discount rate.
This change does not affect the measurement of the total benefit obligation, but resulted in a decrease in the service and interest components of benefit cost beginning in 2016. Based on current economic conditions, the Company estimates that the service cost and interest cost for the affected plans was reduced by approximately $6 million in 2016 as a result of the change in method. The Company has accounted for this as a change in accounting estimate that is inseparable from a change in accounting principle, and accordingly has accounted for it on a prospective basis.
While the Company believes that these assumptions are appropriate, significant differences in actual experience or significant changes in these assumptions may materially affect the Company’s pension benefit obligations and its future expense. The following table illustrates the sensitivity to a change in certain assumptions for Company sponsored U.S. and non-U.S. pension plans on its 2016 funded status and 2017 pretax pension expense.
Impact on U.S. 2017 Pretax Pension Expense | Impact on U.S. Plan 2016 Funded Status | Impact on Non-U.S. 2017 Pretax Pension Expense | Impact on Non-U.S. Plan 2016 Funded Status | ||||
25 basis point decrease in discount rate (a)(b) | -$1 million | -$27 million | Less than +$1 million | -$11 million | |||
25 basis point increase in discount rate (a)(b) | + $1 million | +$26 million | Less than -$1 million | +$8 million | |||
25 basis point decrease in expected return on assets (a) | +$1.5 million | Less than +$1 million | |||||
25 basis point increase in expected return on assets (a) | -$1.5 million | Less than -$1 million | |||||
____________ | |||||||
(a) Assumes all other assumptions are held constant. | |||||||
(b) Excludes impact of assets used to hedge discount rate volatility. | |||||||
Income Taxes
The Company is subject to income taxes in the U.S. and numerous non-U.S. jurisdictions. Significant judgment is required in determining the Company’s worldwide provision for income taxes, deferred tax assets and liabilities and the valuation allowance recorded against the Company’s net deferred tax assets. Deferred tax assets and liabilities are recorded for the future tax consequences attributable to differences between financial statement carrying amounts of existing assets and liabilities and their respective tax bases and operating loss and tax credit carry forwards.
Deferred tax assets and liabilities are measured using enacted tax rates expected to apply to taxable income in the years in which those temporary differences are expected to be recovered or settled. The Company records a valuation allowance to reduce deferred tax assets when, based on all available evidence, both positive and negative, it is more likely than not that such assets will not be realized. This assessment, which is completed on a jurisdiction-by-jurisdiction basis, requires significant judgment, and in making this evaluation, the evidence considered by the Company includes, historical and projected financial performance, as well as the nature, frequency and severity of recent losses along with any other pertinent information.
In the ordinary course of the Company’s business, there are many transactions and calculations where the final tax determination is uncertain. The Company is regularly audited by tax authorities. Where appropriate, the Company accrues for contingencies related to income tax risks and non-income tax risks. See Note 16 "Income Taxes" in Item 8 of this Report for additional information.
Fair Value Measurements
The Company uses fair value measurements in the preparation of its financial statements, utilizing various inputs including those that can be readily observable, corroborated or are generally unobservable. The Company utilizes market-based data and valuation techniques that maximize the use of observable inputs and minimize the use of unobservable inputs. Additionally, the Company applies assumptions that market participants would use in pricing an asset or liability, including assumptions about risk. See Note 19 "Fair Value Measurements" in Item 8 of this Report for additional information.
40
Recent Accounting Pronouncements
See Note 2 “Summary of Significant Accounting Policies” to the accompanying consolidated financial statements under Item 8 of this Report for a discussion of recent accounting pronouncements.
Forward-Looking Statements
Certain statements contained or incorporated in this Annual Report on Form 10-K which are not statements of historical fact constitute “Forward-Looking Statements” within the meaning of the Private Securities Litigation Reform Act of 1995 (the “Reform Act”). Forward-looking statements give current expectations or forecasts of future events. Words such as “anticipate”, “expect”, “intend”, “plan”, “believe”, “seek”, “estimate” and other words and terms of similar meaning in connection with discussions of future operating or financial performance signify forward-looking statements. These statements reflect the Company’s current views with respect to future events and are based on assumptions and estimates, which are subject to risks and uncertainties including those discussed in Item 1A under the heading “Risk Factors” and elsewhere in this report. Accordingly, undue reliance should not be placed on these forward-looking statements. Also, these forward-looking statements represent the Company’s estimates and assumptions only as of the date of this report. The Company does not intend to update any of these forward-looking statements to reflect circumstances or events that occur after the statement is made and qualifies all of its forward-looking statements by these cautionary statements.
You should understand that various factors, in addition to those discussed elsewhere in this document, could affect the Company’s future results and could cause results to differ materially from those expressed in such forward-looking statements, including:
• | Visteon’s ability to satisfy its future capital and liquidity requirements; Visteon’s ability to access the credit and capital markets at the times and in the amounts needed and on terms acceptable to Visteon; Visteon’s ability to comply with covenants applicable to it; and the continuation of acceptable supplier payment terms. |
• | Visteon’s ability to satisfy its pension and other postretirement employee benefit obligations, and to retire outstanding debt and satisfy other contractual commitments, all at the levels and times planned by management. |
• | Visteon’s ability to access funds generated by its foreign subsidiaries and joint ventures on a timely and cost effective basis. |
• | Changes in the operations (including products, product planning and part sourcing), financial condition, results of operations or market share of Visteon’s customers. |
• | Changes in vehicle production volume of Visteon’s customers in the markets where it operates, and in particular changes in Ford’s vehicle production volumes and platform mix. |
• | Increases in commodity costs or disruptions in the supply of commodities, including steel, resins, aluminum, copper, fuel and natural gas. |
• | Visteon’s ability to generate cost savings to offset or exceed agreed upon price reductions or price reductions to win additional business and, in general, improve its operating performance; to achieve the benefits of its restructuring actions; and to recover engineering and tooling costs and capital investments. |
• | Visteon’s ability to compete favorably with automotive parts suppliers with lower cost structures and greater ability to rationalize operations; and to exit non-performing businesses on satisfactory terms, particularly due to limited flexibility under existing labor agreements. |
• | Restrictions in labor contracts with unions that restrict Visteon’s ability to close plants, divest unprofitable, noncompetitive businesses, change local work rules and practices at a number of facilities and implement cost-saving measures. |
• | The costs and timing of facility closures or dispositions, business or product realignments, or similar restructuring actions, including potential asset impairment or other charges related to the implementation of these actions or other adverse industry conditions and contingent liabilities. |
• | Significant changes in the competitive environment in the major markets where Visteon procures materials, components or supplies or where its products are manufactured, distributed or sold. |
• | Legal and administrative proceedings, investigations and claims, including shareholder class actions, inquiries by regulatory agencies, product liability, warranty, employee-related, environmental and safety claims and any recalls of products manufactured or sold by Visteon. |
• | Changes in economic conditions, currency exchange rates, changes in foreign laws, regulations or trade policies or political stability in foreign countries where Visteon procures materials, components or supplies or where its products are manufactured, distributed or sold. |
41
• | Shortages of materials or interruptions in transportation systems, labor strikes, work stoppages or other interruptions to or difficulties in the employment of labor in the major markets where Visteon purchases materials, components or supplies to manufacture its products or where its products are manufactured, distributed or sold. |
• | Changes in laws, regulations, policies or other activities of governments, agencies and similar organizations, domestic and foreign, that may tax or otherwise increase the cost of, or otherwise affect, the manufacture, licensing, distribution, sale, ownership or use of Visteon’s products or assets. |
• | Possible terrorist attacks or acts of war, which could exacerbate other risks such as slowed vehicle production, interruptions in the transportation system or fuel prices and supply. |
• | The cyclical and seasonal nature of the automotive industry. |
• | Visteon’s ability to comply with environmental, safety and other regulations applicable to it and any increase in the requirements, responsibilities and associated expenses and expenditures of these regulations. |
• | Visteon’s ability to protect its intellectual property rights, and to respond to changes in technology and technological risks and to claims by others that Visteon infringes their intellectual property rights. |
• | Visteon’s ability to quickly and adequately remediate control deficiencies in its internal control over financial reporting. |
• | Other factors, risks and uncertainties detailed from time to time in Visteon’s Securities and Exchange Commission filings. |
Item 7A. | Quantitative and Qualitative Disclosures About Market Risk |
The primary market risks to which the Company is exposed include changes in foreign currency exchange rates, interest rates and certain commodity prices. The Company manages these risks through derivative instruments and various operating actions including fixed price contracts with suppliers and cost sourcing arrangements with customers. The Company's use of derivative instruments is limited to mitigation of market risks, including hedging activities. However, derivative instruments are not used for speculative or trading purposes, as per clearly defined risk management policies. Additionally, the Company's use of derivative instruments creates exposure to credit loss in the event of non-performance by the counter-party to the derivative financial instruments. The Company limits this exposure by entering into agreements directly with a variety of major financial institutions with high credit standards and that are expected to fully satisfy their obligations under the contracts. Additionally, the Company's ability to utilize derivatives to manage market risk is dependent on credit conditions and market conditions given the current economic environment.
Foreign Currency Risk
The Company's net cash inflows and outflows that are exposed to the risk of changes in exchange rates arise from the sale of products in countries other than the manufacturing source, foreign currency denominated supplier payments, debt and other payables, subsidiary dividends, investments in subsidiaries and anticipated foreign currency denominated transaction proceeds. Where possible, the Company utilizes derivative financial instruments to manage foreign currency exchange rate risks. Forward and option contracts may be utilized to reduce the impact to the Company's cash flow from adverse movements in exchange rates. Foreign currency exposures are reviewed periodically and any natural offsets are considered prior to entering into a derivative financial instrument. The Company’s primary hedged foreign currency exposures include the Euro, Japanese Yen, and Mexican Peso. Where possible, the Company utilizes a strategy of partial coverage for transactions in these currencies. As of December 31, 2016 and 2015, the net fair value of foreign currency forward and option contracts was an asset of less than $1 million and $6 million, respectively, maturities of these instruments generally do not exceed eighteen months.
The hypothetical pretax gain or loss in fair value from a 10% favorable or adverse change in quoted currency exchange rates would be approximately $31 million and $26 million for foreign currency derivative financial instruments as of December 31, 2016 and 2015, respectively. These estimated changes assume a parallel shift in all currency exchange rates and include the gain or loss on financial instruments used to hedge investments in subsidiaries. Because exchange rates typically do not all move in the same direction, the estimate may overstate the impact of changing exchange rates on the net fair value of the Company's financial derivatives. It is also important to note that gains and losses indicated in the sensitivity analysis would generally be offset by gains and losses on the underlying exposures being hedged.
In addition to the transactional exposure described above, the Company's operating results are impacted by the translation of its foreign operating income into U.S. dollars. The Company does not enter into foreign exchange contracts to mitigate this exposure.
42
Interest Rate Risk
The Company is subject to interest rate risk, principally in relation to variable rate debt. The Company may use derivative financial instruments to manage exposure to fluctuations in interest rates.
During 2015, the Company entered into interest rate swaps with a notional amount of $150 million that effectively convert designated cash flows associated with underlying interest payments on the Term Facility from a variable interest rate to a fixed interest rate, the maturities of these swaps will not exceed the underlying Term Facility. The instruments have been designated as cash flow hedges with the effective portion of the gain or loss reported in the Accumulated other comprehensive income component of Stockholders' equity in the Company's consolidated balance sheets and such gains and losses will be reclassified at the time the underlying hedged transactions are realized. The ineffective portion of these swaps is assessed based on the hypothetical derivative method and is recorded as interest expense in the Company's consolidated statements of comprehensive income. As of December 31, 2016 there was no ineffectiveness associated with these derivatives and the fair value was a liability of $1 million.
The Company significantly reduced interest rate exposure after the swap transactions by reducing variable rate basis of debt to approximately 59% from 98% as of December 31, 2016.
Commodity Risk
The Company's exposures to market risk from changes in the price of production material are managed primarily through negotiations with suppliers and customers, although there can be no assurance that the Company will recover all such costs. The Company continues to evaluate derivatives available in the marketplace and may decide to utilize derivatives in the future to manage select commodity risks if an acceptable hedging instrument is identified for the Company's exposure level at that time, as well as the effectiveness of the financial hedge among other factors.
43
Item 8. | Financial Statements and Supplementary Data |
Visteon Corporation and Subsidiaries
Index to Consolidated Financial Statements
Page No. | |
44
Management's Report on Internal Control Over Financial Reporting
Management is responsible for establishing and maintaining adequate internal control over financial reporting as such term is defined under Rule 13a-15(f) of the Securities Exchange Act of 1934. Under the supervision and with the participation of the principal executive and financial officers of the Company, an evaluation of the effectiveness of internal control over financial reporting was conducted based on the framework in Internal Control – Integrated Framework issued by the Committee of Sponsoring Organizations (“the COSO 2013 Framework”) of the Treadway Commission.
Based on the evaluation performed under the COSO 2013 Framework as of December 31, 2016, management has concluded that the Company’s internal control over financial reporting is effective. Additionally, Ernst & Young LLP, an independent registered public accounting firm, has audited the effectiveness of the Company’s internal control over financial reporting as of December 31, 2016, as stated in their report which is included herein.
45
Report of Independent Registered Public Accounting Firm
The Board of Directors and Shareholders
Visteon Corporation
We have audited Visteon Corporation and subsidiaries' internal control over financial reporting as of December 31, 2016, based on criteria established in Internal Control-Integrated Framework issued by the Committee of Sponsoring Organizations of the Treadway Commission (2013 framework) (the COSO criteria). Visteon Corporation and subsidiaries' management is responsible for maintaining effective internal control over financial reporting, and for its assessment of the effectiveness of internal control over financial reporting included in the accompanying Management's Report on Internal Control over Financial Reporting. Our responsibility is to express an opinion on the Company's internal control over financial reporting based on our audit.
We conducted our audit in accordance with the standards of the Public Company Accounting Oversight Board (United States). Those standards require that we plan and perform the audit to obtain reasonable assurance about whether effective internal control over financial reporting was maintained in all material respects. Our audit included obtaining an understanding of internal control over financial reporting, assessing the risk that a material weakness exists, testing and evaluating the design and operating effectiveness of internal control based on the assessed risk, and performing such other procedures as we considered necessary in the circumstances. We believe that our audit provides a reasonable basis for our opinion.
A company's internal control over financial reporting is a process designed to provide reasonable assurance regarding the reliability of financial reporting and the preparation of financial statements for external purposes in accordance with generally accepted accounting principles. A company's internal control over financial reporting includes those policies and procedures that (1) pertain to the maintenance of records that, in reasonable detail, accurately and fairly reflect the transactions and dispositions of the assets of the company; (2) provide reasonable assurance that transactions are recorded as necessary to permit preparation of financial statements in accordance with generally accepted accounting principles, and that receipts and expenditures of the company are being made only in accordance with authorizations of management and directors of the company; and (3) provide reasonable assurance regarding prevention or timely detection of unauthorized acquisition, use, or disposition of the company's assets that could have a material effect on the financial statements.
Because of its inherent limitations, internal control over financial reporting may not prevent or detect misstatements. Also, projections of any evaluation of effectiveness to future periods are subject to the risk that controls may become inadequate because of changes in conditions, or that the degree of compliance with the policies or procedures may deteriorate.
In our opinion, Visteon Corporation and subsidiaries maintained, in all material respects, effective internal control over financial reporting as at December 31, 2016, based on the COSO criteria.
We also have audited, in accordance with the standards of the Public Company Accounting Oversight Board (United States), the 2016 consolidated financial statements of Visteon Corporation and subsidiaries and our report dated February 23, 2017 expressed an unqualified opinion thereon.
/s/ Ernst & Young LLP
Detroit, Michigan
February 23, 2017
46
Report of Independent Registered Public Accounting Firm
The Board of Directors and Shareholders
Visteon Corporation
We have audited the accompanying consolidated balance sheets of Visteon Corporation and subsidiaries as of December 31, 2016 and 2015, and the related consolidated statements of operations, comprehensive income (loss), cash flows and changes in equity for each of the three years in the period ended December 31, 2016. Our audits also included the financial statement schedule included in Item 15(a)(2). These financial statements and schedule are the responsibility of the Company's management. Our responsibility is to express an opinion on these financial statements and schedule based on our audits.
We conducted our audits in accordance with the standards of the Public Company Accounting Oversight Board (United States). Those standards require that we plan and perform the audit to obtain reasonable assurance about whether the financial statements are free of material misstatement. An audit includes examining, on a test basis, evidence supporting the amounts and disclosures in the financial statements. An audit also includes assessing the accounting principles used and significant estimates made by management, as well as evaluating the overall financial statement presentation. We believe that our audits provide a reasonable basis for our opinion.
In our opinion, the financial statements referred to above present fairly, in all material respects, the consolidated financial position of Visteon Corporation and subsidiaries as of December 31, 2016 and 2015, and the consolidated results of their operations and their cash flows for each of the three years in the period ended December 31, 2016, in conformity with U.S. generally accepted accounting principles. Also, in our opinion, the related financial statement schedule, when considered in relation to the basic financial statements as a whole, presents fairly in all material respects the information set forth therein.
We also have audited, in accordance with the standards of the Public Company Accounting Oversight Board (United States), Visteon Corporation and subsidiaries' internal control over financial reporting as of December 31, 2016, based on criteria established in Internal Control-Integrated Framework issued by the Committee of Sponsoring Organizations of the Treadway Commission (2013 framework) and our report dated February 23, 2017 expressed an unqualified opinion thereon.
/s/ Ernst & Young LLP
Detroit, Michigan
February 23, 2017
47
VISTEON CORPORATION AND SUBSIDIARIES
CONSOLIDATED STATEMENTS OF OPERATIONS
Year Ended December 31 | |||||||||||
2016 | 2015 | 2014 | |||||||||
(Dollars in Millions, Except Per Share Amounts) | |||||||||||
Sales | $ | 3,161 | $ | 3,245 | $ | 2,586 | |||||
Cost of sales | 2,697 | 2,815 | 2,246 | ||||||||
Gross margin | 464 | 430 | 340 | ||||||||
Selling, general and administrative expenses | 220 | 245 | 228 | ||||||||
Restructuring expense | 49 | 36 | 54 | ||||||||
Interest expense | 18 | 19 | 25 | ||||||||
Interest income | 6 | 5 | 4 | ||||||||
Equity in net income of non-consolidated affiliates | 2 | 7 | 2 | ||||||||
Loss on debt extinguishment | — | 5 | 23 | ||||||||
Loss on divestiture | — | 105 | — | ||||||||
Gain on non-consolidated affiliate transactions, net | — | 62 | 2 | ||||||||
Other expense, net | 24 | 25 | 61 | ||||||||
Income (loss) before income taxes | 161 | 69 | (43 | ) | |||||||
Provision for income taxes | 30 | 27 | 32 | ||||||||
Net income (loss) from continuing operations | 131 | 42 | (75 | ) | |||||||
Net (loss) income from discontinued operations, net of tax | (40 | ) | 2,286 | (131 | ) | ||||||
Net income (loss) | 91 | 2,328 | (206 | ) | |||||||
Net income attributable to non-controlling interests | 16 | 44 | 89 | ||||||||
Net income (loss) attributable to Visteon Corporation | $ | 75 | $ | 2,284 | $ | (295 | ) | ||||
Basic earnings (loss) per share: | |||||||||||
Continuing operations | $ | 3.28 | $ | 0.52 | $ | (2.14 | ) | ||||
Discontinued operations | (1.14 | ) | 53.48 | (4.30 | ) | ||||||
Basic earnings (loss) per share attributable to Visteon Corporation | $ | 2.14 | $ | 54.00 | $ | (6.44 | ) | ||||
Diluted earnings (loss) per share: | |||||||||||
Continuing operations | $ | 3.25 | $ | 0.51 | $ | (2.14 | ) | ||||
Discontinued operations | (1.13 | ) | 52.12 | (4.30 | ) | ||||||
Diluted earnings (loss) per share attributable to Visteon Corporation | $ | 2.12 | $ | 52.63 | $ | (6.44 | ) | ||||
See accompanying notes to the consolidated financial statements.
48
VISTEON CORPORATION AND SUBSIDIARIES
CONSOLIDATED STATEMENTS OF COMPREHENSIVE INCOME (LOSS)
Year Ended December 31 | |||||||||||
2016 | 2015 | 2014 | |||||||||
(Dollars in Millions) | |||||||||||
Net income (loss) | $ | 91 | $ | 2,328 | $ | (206 | ) | ||||
Other comprehensive (loss) income | |||||||||||
Foreign currency translation adjustments | (5 | ) | (33 | ) | (130 | ) | |||||
Benefit plans, net of tax (a) | (39 | ) | 121 | (185 | ) | ||||||
Unrealized hedging (losses) gains and other, net of tax (b) | (6 | ) | 8 | (8 | ) | ||||||
Other comprehensive (loss) income, net of tax | (50 | ) | 96 | (323 | ) | ||||||
Comprehensive income (loss) | 41 | 2,424 | (529 | ) | |||||||
Comprehensive income attributable to non-controlling interests | 9 | 31 | 53 | ||||||||
Comprehensive income (loss) attributable to Visteon Corporation | $ | 32 | $ | 2,393 | $ | (582 | ) | ||||
(a) Other comprehensive income (loss) is net of tax benefit of $3 million for the year ended December 31, 2016, tax expense of $3 million for the year ended December 31,2015, and a tax benefit of $8 million for the year ended December 31, 2014.
(b) Other comprehensive income (loss) is net of a tax benefit of $2 million for the year ended December 31, 2016, tax expense of $2 million for the year ended December 31, 2015, and a tax benefit of $2 million for the year ended December 31, 2014.
See accompanying notes to the consolidated financial statements.
49
VISTEON CORPORATION AND SUBSIDIARIES
CONSOLIDATED BALANCE SHEETS
December 31 | |||||||
2016 | 2015 | ||||||
(Dollars in Millions) | |||||||
ASSETS | |||||||
Cash and equivalents | $ | 878 | $ | 2,728 | |||
Short-term investments | — | 47 | |||||
Restricted cash | 4 | 8 | |||||
Accounts receivable, net | 505 | 502 | |||||
Inventories, net | 151 | 187 | |||||
Other current assets | 170 | 581 | |||||
Total current assets | 1,708 | 4,053 | |||||
Property and equipment, net | 345 | 351 | |||||
Intangible assets, net | 129 | 133 | |||||
Investments in non-consolidated affiliates | 45 | 56 | |||||
Other non-current assets | 146 | 88 | |||||
Total assets | $ | 2,373 | $ | 4,681 | |||
LIABILITIES AND EQUITY | |||||||
Distribution payable | $ | 15 | $ | 1,751 | |||
Short-term debt, including current portion of long-term debt | 36 | 37 | |||||
Accounts payable | 463 | 482 | |||||
Accrued employee liabilities | 103 | 132 | |||||
Other current liabilities | 294 | 370 | |||||
Total current liabilities | 911 | 2,772 | |||||
Long-term debt | 346 | 346 | |||||
Employee benefits | 303 | 268 | |||||
Deferred tax liabilities | 20 | 21 | |||||
Other non-current liabilities | 69 | 75 | |||||
Stockholders’ equity: | |||||||
Preferred stock (par value $0.01, 50 million shares authorized, none outstanding as of December 31, 2016 and 2015) | — | — | |||||
Common stock (par value $0.01, 250 million shares authorized, 55 million and 55 million shares issued, 33 million and 40 million shares outstanding as of December 31, 2016 and 2015, respectively) | 1 | 1 | |||||
Additional paid-in capital | 1,327 | 1,345 | |||||
Retained earnings | 1,269 | 1,194 | |||||
Accumulated other comprehensive loss | (233 | ) | (190 | ) | |||
Treasury stock | (1,778 | ) | (1,293 | ) | |||
Total Visteon Corporation stockholders’ equity | 586 | 1,057 | |||||
Non-controlling interests | 138 | 142 | |||||
Total equity | 724 | 1,199 | |||||
Total liabilities and equity | $ | 2,373 | $ | 4,681 | |||
See accompanying notes to the consolidated financial statements.
50
VISTEON CORPORATION AND SUBSIDIARIES
CONSOLIDATED STATEMENTS OF CASH FLOWS1
Year Ended December 31 | |||||||||||
2016 | 2015 | 2014 | |||||||||
(Dollars in Millions) | |||||||||||
Operating Activities | |||||||||||
Net income (loss) | $ | 91 | $ | 2,328 | $ | (206 | ) | ||||
Adjustments to reconcile net income (loss) to net cash provided from operating activities: | |||||||||||
Loss (gain) on Climate Transaction | 2 | (2,324 | ) | — | |||||||
Gain on non-consolidated affiliate transactions | — | (62 | ) | (2 | ) | ||||||
Depreciation and amortization | 84 | 169 | 270 | ||||||||
Losses on other divestitures and impairments | 22 | 121 | 326 | ||||||||
Pension settlement gain | — | — | (23 | ) | |||||||
Equity in net (income) loss of non-consolidated affiliates, net of dividends remitted | (1 | ) | 1 | 10 | |||||||
Non-cash stock-based compensation | 8 | 8 | 8 | ||||||||
Loss on debt extinguishment | — | 5 | 23 | ||||||||
Other non-cash items | 24 | 6 | 11 | ||||||||
Changes in assets and liabilities: | |||||||||||
Accounts receivable | (19 | ) | 1 | (121 | ) | ||||||
Inventories | 30 | (20 | ) | (27 | ) | ||||||
Accounts payable | (10 | ) | 33 | 22 | |||||||
Accrued income taxes | (63 | ) | 6 | 14 | |||||||
Other assets and other liabilities | (48 | ) | 66 | (21 | ) | ||||||
Net cash provided from operating activities | 120 | 338 | 284 | ||||||||
Investing Activities | |||||||||||
Capital expenditures | (75 | ) | (187 | ) | (340 | ) | |||||
Short-term investments, net | 47 | (47 | ) | — | |||||||
Loans to non-consolidated affiliate, net of repayments | (8 | ) | (9 | ) | — | ||||||
Net proceeds from Climate Transaction, including withholding tax refund | 356 | 2,664 | — | ||||||||
Proceeds from asset sales and business divestitures | 17 | 92 | 66 | ||||||||
Acquisition of businesses, net of cash acquired | (15 | ) | (4 | ) | (311 | ) | |||||
Payments on divestiture of businesses | (10 | ) | (157 | ) | (147 | ) | |||||
Other, net | (10 | ) | 6 | (8 | ) | ||||||
Net cash provided from (used by) investing activities | 302 | 2,358 | (740 | ) | |||||||
Financing Activities | |||||||||||
Short-term debt, net | — | 2 | 39 | ||||||||
Proceeds from issuance of debt, net of issuance costs | — | — | 619 | ||||||||
Principal payments on debt | (2 | ) | (250 | ) | (18 | ) | |||||
Distribution payments | (1,736 | ) | — | — | |||||||
Repurchase of common stock | (500 | ) | (500 | ) | (500 | ) | |||||
Repurchase of long-term notes | — | — | (419 | ) | |||||||
Dividends paid to non-controlling interests | (13 | ) | (55 | ) | (97 | ) | |||||
Exercised warrants and stock options | — | 40 | 17 | ||||||||
Stock based compensation tax withholding payments | (11 | ) | (10 | ) | — | ||||||
Other | — | (1 | ) | — | |||||||
Net cash used by financing activities | (2,262 | ) | (774 | ) | (359 | ) | |||||
Effect of exchange rate changes on cash and equivalents | (11 | ) | (20 | ) | (35 | ) | |||||
Net (decrease) increase in cash and equivalents | (1,851 | ) | 1,902 | (850 | ) | ||||||
Cash and equivalents at beginning of the year | 2,729 | 827 | 1,677 | ||||||||
Cash and equivalents at end of the year | $ | 878 | $ | 2,729 | $ | 827 | |||||
Supplemental Disclosures: | |||||||||||
Cash paid for interest | $ | 14 | $ | 24 | $ | 39 | |||||
Cash paid for income taxes, net of refunds | $ | 92 | $ | 67 | $ | 130 | |||||
1 The Company has combined cash flows from discontinued operations with cash flows from continuing operations within the operating, investing and financing categories. As such, cash and equivalents above include $1 million and $351 million of assets held for sale reflected in Current assets held for sale on the Consolidated Balance Sheets as of December 31, 2015 and 2014, respectively.
See accompanying notes to the consolidated financial statements.
51
VISTEON CORPORATION AND SUBSIDIARIES
CONSOLIDATED STATEMENTS OF CHANGES IN EQUITY
Total Visteon Corporation Stockholders' Equity | |||||||||||||||||||||||||||||||||||
Common Stock | Stock Warrants | Additional Paid-In Capital | Retained Earnings | Accumulated Other Comprehensive Income (Loss) | Treasury Stock | Total Visteon Corporation Stockholders' Equity | Non-Controlling Interests | Total Equity | |||||||||||||||||||||||||||
(Dollars in Millions) | |||||||||||||||||||||||||||||||||||
December 31, 2013 | $ | 1 | $ | 6 | $ | 1,291 | $ | 956 | $ | (12 | ) | $ | (322 | ) | $ | 1,920 | $ | 953 | $ | 2,873 | |||||||||||||||
Net (loss) income | — | — | — | (295 | ) | — | — | (295 | ) | 89 | (206 | ) | |||||||||||||||||||||||
Other comprehensive loss | — | — | — | — | (287 | ) | — | (287 | ) | (36 | ) | (323 | ) | ||||||||||||||||||||||
Stock-based compensation, net | — | — | 9 | — | — | 12 | 21 | — | 21 | ||||||||||||||||||||||||||
Repurchase of shares of common stock | — | — | (63 | ) | — | — | (437 | ) | (500 | ) | — | (500 | ) | ||||||||||||||||||||||
Warrant exercises | — | (3 | ) | 9 | — | — | — | 6 | — | 6 | |||||||||||||||||||||||||
Cash dividends | — | — | — | — | — | — | — | (89 | ) | (89 | ) | ||||||||||||||||||||||||
Acquisition of business | — | — | — | — | — | — | — | 48 | 48 | ||||||||||||||||||||||||||
Business divestiture | — | — | — | — | — | — | — | (9 | ) | (9 | ) | ||||||||||||||||||||||||
December 31, 2014 | $ | 1 | $ | 3 | $ | 1,246 | $ | 661 | $ | (299 | ) | $ | (747 | ) | $ | 865 | $ | 956 | $ | 1,821 | |||||||||||||||
Net income | — | — | — | 2,284 | — | — | 2,284 | 44 | 2,328 | ||||||||||||||||||||||||||
Other comprehensive income (loss) | — | — | — | — | 109 | — | 109 | (13 | ) | 96 | |||||||||||||||||||||||||
Stock-based compensation, net | — | — | (9 | ) | — | — | 17 | 8 | — | 8 | |||||||||||||||||||||||||
Stock-based compensation tax windfall | — | — | 8 | — | — | — | 8 | — | 8 | ||||||||||||||||||||||||||
Repurchase of shares of common stock | — | — | 63 | — | — | (563 | ) | (500 | ) | — | (500 | ) | |||||||||||||||||||||||
Warrant exercises | — | (3 | ) | 37 | — | — | — | 34 | — | 34 | |||||||||||||||||||||||||
Distribution payable | — | — | — | (1,751 | ) | — | — | (1,751 | ) | — | (1,751 | ) | |||||||||||||||||||||||
Cash dividends | — | — | — | — | — | — | — | (60 | ) | (60 | ) | ||||||||||||||||||||||||
Business divestiture | — | — | — | — | — | — | — | (785 | ) | (785 | ) | ||||||||||||||||||||||||
December 31, 2015 | $ | 1 | $ | — | $ | 1,345 | $ | 1,194 | $ | (190 | ) | $ | (1,293 | ) | $ | 1,057 | $ | 142 | $ | 1,199 | |||||||||||||||
Net income | — | — | — | 75 | — | — | 75 | 16 | 91 | ||||||||||||||||||||||||||
Other comprehensive loss | — | — | — | — | (43 | ) | — | (43 | ) | (7 | ) | (50 | ) | ||||||||||||||||||||||
Stock-based compensation, net | — | — | (18 | ) | — | — | 15 | (3 | ) | — | (3 | ) | |||||||||||||||||||||||
Repurchase of shares of common stock | — | — | — | — | — | (500 | ) | (500 | ) | — | (500 | ) | |||||||||||||||||||||||
Cash dividends | — | — | — | — | — | — | — | (13 | ) | (13 | ) | ||||||||||||||||||||||||
December 31, 2016 | $ | 1 | $ | — | $ | 1,327 | $ | 1,269 | $ | (233 | ) | $ | (1,778 | ) | $ | 586 | $ | 138 | $ | 724 | |||||||||||||||
See accompanying notes to the consolidated financial statements.
52
VISTEON CORPORATION AND SUBSIDIARIES
NOTES TO CONSOLIDATED FINANCIAL STATEMENTS
NOTE 1. Description of Business
Visteon Corporation (the "Company" or "Visteon") is a global automotive supplier that designs, engineers and manufactures innovative electronics products for nearly every original equipment vehicle manufacturer ("OEM") worldwide including Ford, Mazda, Nissan/Renault, General Motors, Honda, BMW and Daimler. Visteon is headquartered in Van Buren Township, Michigan and has an international network of manufacturing operations, technical centers and joint venture operations, supported by approximately 10,000 employees, dedicated to the design, development, manufacture and support of its product offerings and its global customers. The Company's manufacturing and engineering footprint is principally located outside of the U.S., with a heavy concentration in low-cost geographic regions. Visteon delivers value for its customers and stockholders through its technology-focused core vehicle cockpit electronics business. The Company's cockpit electronics product portfolio includes instrument clusters, information displays, infotainment systems, audio systems, telematics solutions, and head up displays. The Company's vehicle cockpit electronics business is comprised of and reported under the Electronics segment. In addition to the Electronics segment, the Company has residual operations in South America and Europe previously associated with the former Interiors and Climate businesses, not subject to discontinued operations classification, that comprise Other.
NOTE 2. Summary of Significant Accounting Policies
Basis of Presentation: The Company's financial statements have been prepared in conformity with accounting principles generally accepted in the United States ("GAAP") on a going concern basis, which contemplates the continuity of operations, realization of assets and satisfaction of liabilities in the normal course of business.
Principles of Consolidation: The consolidated financial statements include the accounts of the Company and its subsidiaries that are more than 50% owned and over which the Company exercises control. Investments in affiliates of greater than 20% and for which the Company does not exercise control, but does have the ability to exercise significant influence over operating and financial policies, are accounted for using the equity method. All other investments in non-consolidated affiliates are accounted for using the cost method.
The Company determines whether joint ventures in which it has invested is a Variable Interest Entity (“VIE”) at the start of each new venture and when a reconsideration event has occurred. An enterprise must consolidate a VIE if it is determined to be the primary beneficiary of the VIE. The primary beneficiary has both the power to direct the activities of the VIE that most significantly impact the entity’s economic performance and the obligation to absorb losses or the right to receive benefits from the VIE that could potentially be significant to the VIE.
Use of Estimates: The preparation of financial statements in conformity with GAAP requires management to make estimates and assumptions that affect amounts reported herein. Considerable judgment is involved in making these determinations and the use of different estimates or assumptions could result in significantly different results. Management believes its assumptions and estimates are reasonable and appropriate. However, actual results could differ from those reported herein.
Reclassifications: Certain prior period amounts have been reclassified to conform to current period presentation.
Revenue Recognition: The Company records revenue when persuasive evidence of an arrangement exists, delivery occurs or services are rendered, the sales price or fee is fixed or determinable and collectibility is reasonably assured. The Company delivers products and records revenue pursuant to commercial agreements with its customers generally in the form of an approved purchase order, including the effects of contractual customer price productivity. The Company does negotiate discrete price changes with its customers, which are generally the result of unique commercial issues between the Company and its customers. The Company records discrete price changes as a reduction to revenue when specific facts and circumstances indicate that a price reduction is probable and the amounts are reasonably estimable. The Company records amounts associated with discrete price changes as an increase to revenue upon execution of a legally enforceable contractual agreement and when collectibility is reasonably assured.
Foreign Currency: Assets and liabilities for most of the Company’s non-U.S. businesses are translated into U.S. Dollars at end-of-period exchange rates, income and expense accounts of the Company’s non-U.S. businesses are translated into U.S. Dollars at average-period exchange rates, and the related translation adjustments are recorded in accumulated other comprehensive income (loss) ("AOCI") in the consolidated balance sheets. The effects of remeasuring assets and liabilities of the Company’s non-U.S. businesses that use the U.S. Dollar as their functional currency are recorded as transaction gains and losses in the consolidated statements of operations. Additionally, gains and losses resulting from transactions denominated in a currency other than the functional currency are recorded as transaction gains and losses in the consolidated statements of operations. Net transaction gains
53
and losses, inclusive of amounts associated with discontinued operations, decreased net income by $10 million, $10 million and $18 million for the years ended December 31, 2016, 2015 and 2014 respectively.
Restructuring Expense: The Company defines restructuring expense to include costs directly associated with exit or disposal activities. Such costs include employee severance and termination benefits, special termination benefits, contract termination fees and penalties, and other exit or disposal costs. In general, the Company records involuntary employee-related exit and disposal costs when there is a substantive plan for employee severance and related costs are probable and estimable. For one-time termination benefits (i.e no substantive plan) and employee retention costs, expense is recorded when the employees are entitled to receive such benefits and the amount can be reasonably estimated. Contract termination fees and penalties and other exit and disposal costs are generally recorded when incurred.
Debt Issuance Costs: The costs related to issuance or modification of long-term debt are deferred and amortized into interest expense over the life of each respective debt issue. Deferred amounts associated with debt extinguished prior to maturity are expensed upon extinguishment.
Other Costs within Cost of Goods Sold: Repair and maintenance costs, research and development costs, and pre-production operating costs are expensed as incurred. Research and development expenses include salary and related employee benefits, contractor fees, information technology, occupancy, telecommunications and depreciation. Research and development costs net of recoveries were $295 million, $294 million, and $257 million in 2016, 2015 and 2014, respectively. Shipping and handling costs are recorded in the Company's consolidated statements of operations as "Cost of sales."
Other Expense, Net:
Year Ended December 31 | |||||||||||
2016 | 2015 | 2014 | |||||||||
(Dollars in Millions) | |||||||||||
Foreign currency translation charge | $ | 11 | $ | — | $ | — | |||||
Transformation initiatives | 9 | 25 | 22 | ||||||||
Transaction hedging and exchange losses (gains) | 1 | (15 | ) | 10 | |||||||
Integration costs | 2 | 14 | 18 | ||||||||
Loss on asset contributions | 2 | 1 | 3 | ||||||||
Recoverable taxes | (1 | ) | — | 8 | |||||||
$ | 24 | $ | 25 | $ | 61 | ||||||
During the year ended December 31, 2016, the Company recorded a charge of approximately $11 million related to foreign currency translation amounts recorded in accumulated other comprehensive loss associated with the sale of the Company's South Africa climate operations.
Transformation initiatives include information technology separation costs and financial and advisory services incurred in connection with the execution of the Company's comprehensive value creation plan and certain severance costs associated with the acquisition of substantially all of the global automotive electronics business of Johnson Controls Inc. (the "Electronics Acquisition") and the exit of climate business ("Climate Transaction"). Transaction hedging and exchange losses (gains) of $1 million, $(15) million and $10 million for the years ended December 31, 2016 , 2015, and 2014 respectively, relate to the Climate Transaction proceeds and the Germany Interiors Divestiture contribution.
During the years ended December 31, 2016, 2015 and 2014, the Company recorded $2 million, $14 million and $18 million, respectively, of costs to integrate the businesses associated with Electronics Acquisition. Integration costs included re-branding, facility modification, information technology readiness and related professional services.
In connection with the closure of the Climate facilities located in Argentina in 2016 and 2014, the Company contributed land and building with a net book value of $2 million and $3 million, respectively, to the local municipality for the benefit of former employees. The Company also recorded (gains)losses of $(1) million and $8 million during the years ended December 31, 2016 and 2014, respectively, to adjust recoverable value-added taxes to net realizable value attributable to business exit activities.
Net Earnings (Loss) Per Share Attributable to Visteon: Basic earnings per share is calculated by dividing net income attributable to Visteon, by the average number of shares of common stock outstanding. Diluted earnings per share is computed by dividing net income by the average number of common and potential dilutive common shares outstanding after deducting undistributed
54
income allocated to participating securities. Performance based share units are considered contingently issuable shares, and are included in the computation of diluted earnings per share if their conditions have been satisfied as if the reporting date was the end of the contingency period.
Cash and Equivalents: The Company considers all highly liquid investments purchased with a maturity of three months or less, including short-term time deposits, commercial paper, repurchase agreements and money market funds to be cash equivalents. As of December 31, 2016 the Company's cash balances are invested in a diversified portfolio of cash and highly liquid cash equivalents including money market funds, commercial paper rated A2/P2 and above with maturity under three months, time deposits and other short-term cash investments, which mature under three months with highly rated banking institutions. The cost of such funds approximates fair value based on the nature of the investment.
Short-Term Investments: Short-term investments of $47 million as of December 31, 2015 include corporate bonds, asset backed securities and commercial paper with maturities between three and twelve months held as part of the Company's separately managed accounts. The cost of these Level 1 investments approximates fair value. These investments were liquidated during the first quarter of 2016.
Restricted Cash: Restricted cash represents amounts designated for uses other than current operations and includes $3 million related to a Letter of Credit Facility, and $1 million related to cash collateral for other corporate purposes as of December 31, 2016.
Accounts Receivable: Accounts receivable are stated at cost less an allowance for bad debts. An allowance for doubtful accounts is recorded when it is probable amounts will not be collected based on specific identification of customer circumstances or age of the receivable. The allowance for doubtful accounts balance was $10 million and $14 million as of December 31, 2016 and 2015, respectively. Included in selling, general and administrative expenses are provisions for estimated uncollectible accounts receivable of $2 million, $4 million and less than $1 million for the years ended December 31, 2016 and 2015, and 2014. Accounts are written off against the allowance when collection efforts have been exhausted.
Inventories: Inventories are stated at the lower of cost, determined on a first-in, first-out (“FIFO”) basis, or market. Cost includes the cost of materials, direct labor, in-bound freight and the applicable share of manufacturing overhead. The cost of inventories is reduced for excess and obsolete inventories based on management’s review of on-hand inventories compared to historical and estimated future sales and usage.
Product Tooling: Product tooling includes molds, dies and other tools used in production of a specific part or parts of the same basic design. It is generally required that non-reimbursable design and development costs for products to be sold under long-term supply arrangements be expensed as incurred and costs incurred for molds, dies and other tools that will be owned by the Company or its customers and used in producing the products under long-term supply arrangements be capitalized and amortized over the shorter of the expected useful life of the assets or the term of the supply arrangement. Product tooling owned by the Company is capitalized as property and equipment and is amortized to cost of sales over its estimated economic life, generally not exceeding six years. The Company had receivables of $14 million and $12 million as of December 31, 2016 and 2015, respectively, related to production tools in progress, which will not be owned by the Company and for which there is a contractual agreement for reimbursement from the customer.
Contractually Reimbursable Engineering Costs: Engineering, testing and other costs incurred in the design and development of production parts are expensed as incurred, unless the costs reimbursement is contractually guaranteed in a customer contract for which costs are capitalized as an asset as incurred and subsequently reduced upon lump sum or piece price recoveries.
Property and Equipment: Property and equipment is stated at cost or fair value for impaired assets. Property and equipment is depreciated principally using the straight-line method of depreciation over the related asset's estimated useful life. Generally, buildings and improvements are depreciated over a 40-year estimated useful life, leasehold improvements are depreciated on a straight-line basis over the initial lease term period, and machinery, equipment and other are depreciated over estimated useful lives ranging from 3 to 15 years. Certain costs incurred in the acquisition or development of software for internal use are capitalized. Capitalized software costs are amortized using the straight-line method over estimated useful lives generally ranging from 3 to 8 years.
Asset impairment charges are recorded for assets held-in-use when events and circumstances indicate that such assets may not be recoverable and the undiscounted net cash flows estimated to be generated by those assets are less than their carrying amounts. If estimated future undiscounted cash flows are not sufficient to recover the carrying value of the assets, an impairment charge is recorded for the amount by which the carrying value of the assets exceeds fair value. The Company classifies assets and liabilities as held for sale when management approves and commits to a formal plan of sale, generally following board of director approval,
55
and it is probable that the sale will be completed within one year. The carrying value of assets and liabilities held for sale is recorded at the lower of carrying value or fair value less cost to sell, and the recording of depreciation is ceased. For impairment purposes, fair value is determined using appraisals, management estimates or discounted cash flow calculations.
Goodwill: The Company performs either a qualitative or quantitative assessment of goodwill for impairment on an annual basis. Goodwill impairment testing is performed at the reporting unit level. The qualitative assessment considers several factors at the reporting unit level including the excess of fair value over carrying value as of the last quantitative impairment test, the length of time since the last fair value measurement, the current carrying value, market and industry metrics, actual performance compared to forecast performance, and the Company's current outlook on the business. If the qualitative assessment indicates it is more likely than not that goodwill is impaired, the reporting unit is quantitatively tested for impairment. To quantitatively test goodwill for impairment, the fair value of each reporting unit is determined and compared to the carrying value. If the carrying value exceeds the fair value, then impairment may exist and further evaluation is required.
Intangible Assets: Definite-lived intangible assets are amortized over their estimated useful lives, and tested for impairment in accordance with the methodology discussed above under "Property and Equipment." Definite-lived intangible assets include:
• | Developed technology intangible assets, which are amortized over average, estimated useful lives generally ranging from 6 to 12 years. |
• | Customer-related intangible assets, which are amortized over average, estimated useful lives generally ranging from 7 to 12 years. |
• | Capitalized software intangible assets are amortized using the straight-line method over estimated useful lives generally ranging from 3 to 8 years. |
Product Warranty and Recall: Amounts accrued for product warranty and recall claims are based on management’s best estimates of the amounts that will ultimately be required to settle such items. The Company’s estimates for product warranty and recall obligations are developed with support from its sales, engineering, quality and legal functions and include due consideration of contractual arrangements, past experience, current claims and related information, production changes, industry and regulatory developments and various other considerations.
Income Taxes: Deferred tax assets and liabilities are recognized for the future tax consequences attributable to differences between financial statement carrying amounts of existing assets and liabilities and their respective tax bases and operating loss and tax credit carryforwards. Deferred tax assets and liabilities are measured using enacted tax rates expected to apply to taxable income in the years in which those temporary differences are expected to be recovered or settled. The Company records a valuation allowance to reduce deferred tax assets when it is more likely than not that such assets will not be realized. This assessment requires significant judgment, and must be done on a jurisdiction-by-jurisdiction basis. In determining the need for a valuation allowance, all available positive and negative evidence, including historical and projected financial performance, is considered along with any other pertinent information.
Value Added Taxes: The Company follows a net basis policy with regard to value added taxes collected from customers and remitted to government authorities, which excludes them from both net sales and expenses.
Fair Value Measurements: The Company uses fair value measurements in the preparation of its financial statements, which utilize various inputs including those that can be readily observable, corroborated or are generally unobservable. The Company utilizes market-based data and valuation techniques that maximize the use of observable inputs and minimize the use of unobservable inputs. Additionally, the Company applies assumptions that market participants would use in pricing an asset or liability, including assumptions about risk.
Financial Instruments: The Company uses derivative financial instruments, including forward contracts, swaps, and options to manage exposures to changes in currency exchange rates and interest rates. The Company's policy specifically prohibits the use of derivatives for speculative or trading purposes.
Business Combinations: In accounting for business combinations, the purchase price of an acquired business is allocated to its identifiable assets and liabilities based on estimated fair values. The excess of the purchase price over the amount allocated to the assets and liabilities, if any, is recorded as goodwill. Determining the fair values of assets acquired and liabilities assumed requires management's judgment, the utilization of independent appraisal firms and often involves the use of significant estimates and assumptions with respect to the timing and amount of future cash flows, market rate assumptions, actuarial assumptions, and appropriate discount rates, among other items.
56
Discontinued Operations: As of January 1, 2015, the Company adopted Accounting Standards Update ("ASU") No. 2014-8, "Reporting Discontinued Operations and Disclosures of Disposals of Components of an Entity." This ASU changed the requirements for reporting discontinued operations to disposals of components of an entity that represent strategic shifts that have a major effect on an entity’s operations and financial results and does not prohibit continuing involvement.The Company reports operating results for discontinued operations separately from continuing operations to distinguish the financial impact of disposal transactions from ongoing operations. Through December 31, 2014, the Company reported discontinued operations when the operations and cash flows of a component of the Company had been eliminated from ongoing operations. For a component to be disposed of by sale, financial results were classified as discontinued only when held for sale criteria were met. For a component to be disposed of other than by sale, financial results were not classified as discontinued until abandonment, distribution, or exchange occurred, depending on the manner of disposal. The operating results associated with the 2015 Climate Transaction and the 2014 Interiors Divestiture are presented as discontinued operations.
Recently Issued Accounting Pronouncements: In May 2014, the Financial Accounting Standards Board ("FASB") issued ASU No. 2014-9, "Revenue from Contracts with Customers," which is the new comprehensive revenue recognition standard that will supersede existing revenue recognition guidance under U.S. GAAP. The standard's core principle is that a company will recognize revenue when it transfers promised goods or services to a customer in an amount that reflects the consideration to which the company expects to be entitled in exchange for those goods and services. To achieve this principle, an entity identifies the contract with a customer, identifies the separate performance obligations in the contract, determines the transaction price, allocates the transaction price to the separate performance obligations and recognizes revenue when each separate performance obligation is satisfied. This ASU allows for both retrospective and prospective methods of adoption. The Company will adopt this standard January 1, 2018 and has not yet selected a transition method. The Company continues to evaluate the impact of adopting this standard on its consolidated financial statements. Customer reimbursements for customer owned tooling, pre-production engineering, and product engineering costs connected with activities that would be identified as performance obligations under the new standard are currently recorded as a reduction to costs. Under the new standard, the Company expects these reimbursements to be recognized as revenue. While our evaluation is ongoing, we do not expect the adoption of this standard to have a material impact on the Company’s results of operations or financial position.
In April 2015, the FASB issued ASU No. 2015-3, "Simplifying the Presentation of Debt Issuance Cost." The ASU requires debt issuance costs associated with a recognized debt liability to be presented on the balance sheet as a direct deduction from the carrying amount of the corresponding debt liability. This new guidance is effective for interim and annual reporting periods beginning after December 15, 2015, with early adoption permitted. The Company adopted the guidance on a retrospective basis during the three months ending March 31, 2016 and accordingly, previously issued debt issuance costs in the amount of $1 million as of December 31, 2015 have been reclassified as a reduction of the corresponding debt liability.
In January 2016, the FASB issued ASU 2016-01, "Financial Instruments—Overall (Subtopic 825-10):" Recognition and Measurement of Financial Assets and Financial Liabilities." The amendments require all investments in equity securities to be measured at fair value with changes in the fair value recognized through net income (other than those accounted for under equity method of accounting or those that result in consolidation of the investee). The amendments also require an entity to present separately in other comprehensive income the portion of the total change in the fair value of a liability resulting from a change in the instrument-specific credit risk when the entity has elected to measure the liability at fair value in accordance with the fair value option for financial instruments. In addition the amendments eliminate the requirement to disclose the method(s) and significant assumptions used to estimate the fair value that is required to be disclosed for financial instruments measured at amortized cost on the balance sheet. This new guidance is effective for fiscal years beginning after December 15, 2018, and interim periods within fiscal years beginning after December 15, 2019. The Company does not expect the adoption of this ASU to have a material impact on its consolidated financial statements.
In February 2016, the FASB issued ASU 2016-02, "Leases (Topic 842):" The amendments supersede current lease requirements in Topic 840 which require lessees to recognize most leases on their balance sheets as lease liabilities with corresponding right-of-use assets. The objective of Topic 842 is to establish the principles that lessees and lessors shall apply to report useful information to users of financial statements about the amount, timing, and uncertainty of cash flows arising from a lease. This new guidance is effective for interim and annual reporting periods beginning after December 15, 2018, with early adoption permitted. The Company is currently evaluating the impact of adopting this standard on its consolidated financial statements.
In March 2016, the FASB issued ASU 2016-09, "Compensation - Stock Compensation (Topic 718):" Improvements to Employee Share-Based Payment Accounting. The ASU includes multiple provisions intended to simplify various aspects of the accounting for share-based payments. While aimed at reducing the cost and complexity of the accounting for share-based payments, these amendments are not expected to significantly impact net income, earnings per share, and the statement of cash flows. This new
57
guidance is effective for interim and annual reporting periods beginning after December 15, 2016, with early adoption permitted. The Company's adoption of this standard will not have a material impact on its consolidated financial statements.
In August 2016, the FASB issued ASU 2016-15, "Statement of Cash Flows (Topic 230):" Classification of certain cash receipts and cash payments. The ASU addresses eight specific cash flow issues with the objective of reducing the existing diversity in practice in how certain transactions are classified in the statement of cash flows. The ASU will be applied using a retrospective transition method to each period presented. This new guidance is effective for interim and annual reporting periods beginning after December 15, 2017 with early adoption permitted. The Company is currently evaluating the impact of adopting this standard on its consolidated financial statements.
In January 2017, the FASB issued ASU 2017-04, "Intangibles - Goodwill and Other (Topic 350):" Which removes step 2 from the goodwill impairment test. Under the new guidance, if a reporting unit’s carrying amount exceeds its fair value, an entity will record an impairment charge based on that difference. The impairment charge will be limited to the amount of goodwill allocated to that reporting unit. The standard will be applied prospectively and is effective for annual and interim impairment tests performed in periods beginning after December 15, 2019 with early adoption permitted. The Company is currently evaluating the impact of adopting this standard on its consolidated financial statements but does not expect a material impact.
NOTE 3. Business Acquisitions
AllGo Purchase
On July 8, 2016 Visteon acquired AllGo Embedded Systems Private Limited, a leading developer of embedded multimedia system solutions to global vehicle manufacturers, for a purchase price of $17 million ("AllGo Purchase") including $2 million of contingent consideration to be paid over the next year if certain technology milestones are achieved. In addition, the purchase agreement includes contingent payments of $5 million if key employees remain employed through July 2019, which is being accounted for as compensation expense. The AllGo Purchase is expected to add greater scale and depth to the Company's infotainment software capabilities. The operating results for the business acquired have been included in the Electronics segment from the date of acquisition. During the year ended December 31, 2016, the Company incurred acquisition-related costs of approximately $1 million. These amounts were recorded as incurred and have been classified as "Other expenses, net" within the Company's consolidated statements of comprehensive income.
The AllGo Purchase was accounted for as a business combination, with the purchase price allocation reflecting the final valuation results, is shown below (dollars in millions):
Assets Acquired: | Liabilities Assumed: | |||||||
Accounts receivable | $ | 1 | Deferred tax liabilities | $ | 2 | |||
Intangible assets | 7 | Total liabilities assumed | 2 | |||||
Goodwill | 11 | |||||||
Total assets acquired | $ | 19 | Purchase price | $ | 17 | |||
Assets acquired and liabilities assumed were recorded at estimated fair values based on management's estimates, available information, and reasonable and supportable assumptions. Additionally, the Company utilized a third-party to assist with certain estimates of fair values. Fair values for intangible assets were based on the income approach including excess earnings and relief from royalty methods. These fair value measurements are classified within level 3 of the fair value hierarchy. The purchase price allocation resulted in goodwill of $11 million, which is not deductible for income tax purposes; however, purchase accounting requires the establishment of deferred tax liabilities on the fair value increments related primarily to intangible assets that will be recognized as a future income tax benefit as the related assets are amortized.
The pro forma effect of the AllGo Purchase does not materially impact the Company's reported results for any period presented, and as a result no pro forma financial statements are presented.
Electronics Acquisition
On July 1, 2014, the Company completed the acquisition of substantially all of the global automotive electronics business of Johnson Controls Inc. (the "Electronics Acquisition") for an aggregate purchase price of $299 million, including $31 million of cash and equivalents at the acquired business. The Electronics Acquisition is expected to enhance Visteon's competitive position in the fast-growing vehicle cockpit electronics segment by strengthening its global scale, manufacturing and engineering footprint,
58
product portfolio and customer penetration. The operating results for the business acquired have been included in the Electronics segment from the date of acquisition. Reflected in the Company's results of operation for the year ended December 31, 2014, are sales of $665 million and gross margin of $103 million related to the Electronics Acquisition. Additionally, through the year ended December 31, 2014, the Company incurred acquisition-related costs of approximately $10 million, which were recorded as incurred and have been classified as "Other expense, net" within the Consolidated Statements of Operations.
Pro forma financial information is presented in the following table for the year ended December 31, 2014, as if the Electronics Acquisition had occurred on January 1, 2014. The pro forma financial information is unaudited, is provided for informational purposes only and does not purport to be indicative of the results which would have actually been attained had the acquisition occurred on January 1, 2014, or that may be attained in the future.
Year Ended December 31 | |||
2014 | |||
(Dollars in Millions, Unaudited) | |||
Sales | $ | 3,282 | |
Gross margin | $ | 408 | |
(Loss) income from continuing operations before income taxes | $ | (29 | ) |
NOTE 4. Divestitures
Climate Transaction
On June 9, 2015, Visteon Corporation and its wholly owned subsidiary, VIHI, LLC (collectively, “Visteon”) completed the sale to Hahn & Co. Auto Holdings Co., Ltd. and Hankook Tire Co., Ltd. (together, the “Purchasers”) of all of its shares of Halla Visteon Climate Control Corporation, a Korean corporation (“HVCC”), for approximately $3.4 billion, or KRW 52,000 per share, after adjusting for the 2014 dividend paid by HVCC to Visteon (the “Climate Transaction”). The Company received net cash proceeds of approximately $2.7 billion and recognized a pretax gain of approximately $2.3 billion in connection with the closing of the Climate Transaction in the second quarter 2015. The results of operations for the Climate business have been classified as income (loss) from discontinued operations, net of tax in the consolidated statements of operation for the years ended December 31, 2015 and 2014.
In connection with the closing of the Climate Transaction, Visteon, HVCC and/or the Purchasers have entered into certain other agreements, including a transition agreement (pursuant to which the parties will provide certain transition services for a specified period following the closing), a remediation agreement (pursuant to which Visteon will provide certain information technology services for a period of time), engineering and support agreements (pursuant to which the parties will support certain operations of the other following the closing), and a letter agreement (pursuant to which Visteon has agreed to purchase from HVCC certain electronics operations located in India). Assets and liabilities associated with the Climate Transaction met the "held for sale" criteria during the second quarter ended June 30, 2015.
The gain is summarized below (dollars in millions):
Gross proceeds | (1) | $ | 3,423 | |
Korea withholding tax | (2) | (377 | ) | |
Professional fees | (3) | (20 | ) | |
Korea security transaction tax | (4) | (17 | ) | |
Divested cash balances | (5) | (345 | ) | |
Net cash provided from investing activities | 2,664 | |||
Net assets divested, excluding cash balances | (5) | (565 | ) | |
Information technology separation and service obligations | (6) | (53 | ) | |
Employee related charges | (7) | (45 | ) | |
Electronics business repurchase obligation | (8) | (50 | ) | |
Professional fees | (3) | (4 | ) | |
Korea withholding tax recoverable | (2) | 377 | ||
Net gain on Climate Transaction | $ | 2,324 | ||
59
(1) Gross proceeds of $3.423 billion were received in connection with the Climate Transaction, translated at a spot rate of 1121.5 KRW to USD on June 9, 2015. Impacts of related hedging activities and exchange on proceeds conversion into USD are included in the Company's consolidated statements of comprehensive income as "Other expense, net" for the years ended December 31, 2015 and 2014.
(2) In connection with the transaction, the Company recorded a tax recoverable of $377 million for Korean capital gains tax withheld by the Purchasers and paid to the Korean government. This amount reduced proceeds classified as net cash provided from investing activities within the Company's consolidated statements of cash flows for the year ended December 31, 2015. The Company received the entire amount of the expected capital gains withholding tax in January 2016, amounting to $356 million as adjusted for interest and exchange as the refund was denominated in Korean won. Net exchange and interest impacts are recorded as provision for income taxes within discontinued operations.
(3) Professional fees of $24 million, representing fees paid to financial advisors, were based on a percentage of the gross proceeds, partially offset by previously paid retainer fees of $4 million, for a net payment of $20 million reducing proceeds classified as net cash provided from investing activities within the Company's consolidated statements of cash flows for the year ended December 31, 2015.
(4) Security transaction taxes of $17 million were remitted to the Korean government as of the transaction close, reducing proceeds classified as net cash provided from investing activities within the Company's consolidated statements of cash flows for the year ended December 31, 2015.
(5) Net assets of $910 million, including assets, liabilities, accumulated other comprehensive income and non-controlling interests, were divested in connection with the Climate Transaction. Divested assets included $345 million of cash balances, reflected as a reduction of transaction proceeds classified as net cash provided from investing activities within the Company's consolidated statements of cash flows for the year ended December 31, 2015.
(6) In connection with the Climate Transaction, the Company has entered an agreement pursuant to which Visteon will provide information technology ongoing and separation services for HVCC to fully operate as an independent entity with estimated costs of approximately $53 million. The remaining information technology liability is included in the Company's consolidated balance sheets as "Other current liabilities" as of December 31, 2016 and 2015.
(7) Employee related charges of $45 million include bonus payments, the Company's assumption of incentive plan liabilities, and impacts of employment change in control provisions. Bonus payments of $30 million are classified in the Company's net cash provided from operating activities within the Company's consolidated statements of cash flows for the year ended December 31, 2015. Amounts remaining to be paid are included in the Company's consolidated balance sheets as "Accrued employee liabilities" as of December 31, 2016 and 2015.
(8) In connection with the Climate Transaction, the Company has entered an agreement to purchase certain electronics operations located in India, expected to close during the first half of 2017. The Company has recorded a repurchase obligation of $50 million, representing the estimated purchase price of the subject business. The Company continues to consolidate the business, with net assets of approximately $16 million as of December 31, 2016, based on the Company’s continued controlling financial interest. The Company’s controlling financial interest was evaluated based on continued operating control and obligation to fund losses or benefit from earnings. The business is included in a legal entity currently owned by HVCC and therefore the Electronics business assets are not available for general corporate purposes. The repurchase commitment is included in the Company’s consolidated balance sheets as “Other current liabilities” as of December 31, 2016 and 2015.
During the fourth quarter of 2016, the Company separately sold its South Africa climate operations with 2015 annual sales of $9 million for proceeds of $2 million, and recorded a loss of $11 million related to foreign currency translation amounts previously recorded in accumulated other comprehensive loss, included in the Company's consolidated statements of comprehensive as "Other expense, net" for the year ended December 31, 2016. This disposal did not qualify for discontinued operations treatment.
Interiors Transactions
Germany Interiors Divestiture
On December 1, 2015, Visteon completed the Germany Interiors Divestiture. The Company contributed cash, of approximately $141 million, assets of $27 million, and liabilities of $198 million including pension related liabilities. The Company will make a final contribution payment of approximately $31 million during the first half of 2017 upon fulfillment of buyer contractual
60
commitments, included in the Company's consolidated balance sheet as "Other current liabilities" as of December 31, 2016 and 2015. The Company recognized a pretax loss on divestiture of $105 million during the year ended December 31, 2015, related to foreign currency translation and pension benefit plan amounts previously recorded in accumulated other comprehensive loss in 2015.
Although the Germany Interiors Divestiture represents a continuation of the Company’s exit from the Interiors business, the divestiture is not considered a strategic shift given the size of the operations representing $86 million in 2015 sales. Therefore, the operations did not qualify for discontinued operations presentation and operating results prior to the sale are classified within Other as continuing operations.
Interiors Divestiture
In May 2014, pursuant to a Master Purchase Agreement as subsequently amended, Visteon agreed to divest substantially all of its global Interiors business in exchange for the assumption of certain liabilities related to the Company's Interiors business and the payment of nominal cash consideration. Effective November 1, 2014, the Company closed on the majority of the Interiors Divestiture. Subsequent to the Master Closing, Visteon completed the sale of Interiors operations in India, and Thailand on December 1, 2014 and February 2, 2015, respectively. On December 1, 2016 the Company completed the sale of its Interiors operations in Argentina and Brazil, recording a loss of $19 million representing the final working capital cash contribution of $10 million, and related contractual obligations, representing the completion of the Interiors Divestiture. The Company recorded losses of $22 million, $16 million and $326 million of impairment and divestiture losses during the years ended December 31, 2016, 2015 and 2014, respectively, in connection with the divestitures. The results of operations for the Interiors business have been classified as income (loss) from discontinued operations, net of tax in the consolidated statements of operation for the year ended December 31, 2016, 2015 and 2014.
In accordance with the Interiors Divestitures, the buyer had the option to request replacement of the existing revolving credit facility with a three year term loan between $5 million and $10 million. Upon closing on December 1, 2016, the buyer exercised the option and entered into a three year term loan for $10 million.
NOTE 5. Discontinued Operations
The operations subject to the Interiors Divestiture and Climate Transaction met conditions required to qualify for discontinued operations reporting. Accordingly, the results of operations for the Interiors and Climate businesses have been reclassified to Net income (loss) from discontinued operations in the Consolidated Statements of Operations for the years ended December 31, 2016, 2015 and 2014.
Discontinued operations are summarized as follows: | Year Ended December 31 | ||||||||||
2016 | 2015 | 2014 | |||||||||
(Dollars in Millions) | |||||||||||
Sales | $ | 45 | $ | 2,199 | $ | 5,757 | |||||
Cost of sales | 59 | 2,039 | 5,239 | ||||||||
Gross margin | (14 | ) | 160 | 518 | |||||||
Selling, general and administrative expenses | 5 | 77 | 194 | ||||||||
Loss (gain) on Climate Transaction | 2 | (2,324 | ) | — | |||||||
Long-lived asset impairment | 1 | 4 | 190 | ||||||||
Loss on interiors divestiture | 19 | 12 | 136 | ||||||||
Restructuring expense | 4 | 2 | 17 | ||||||||
Interest expense, net | — | 2 | 7 | ||||||||
Equity in net income of non-consolidated affiliates | — | 6 | 13 | ||||||||
Other expense, net | 2 | 10 | 25 | ||||||||
(Loss) Income from discontinued operations before income taxes | (47 | ) | 2,383 | (38 | ) | ||||||
(Benefit) provision for income taxes | (7 | ) | 97 | 93 | |||||||
Net (loss) income from discontinued operations | (40 | ) | 2,286 | (131 | ) | ||||||
Net income attributable to non-controlling interests | — | 24 | 66 | ||||||||
Net (loss) income from discontinued operations attributable to Visteon | $ | (40 | ) | $ | 2,262 | $ | (197 | ) | |||
61
During the year ended December 31, 2016, the Company recorded a $17 million income tax benefit to reflect change in estimates associated with the filing of the Company’s U.S. tax returns that resulted in a reduction in U.S. income tax related to the 2015 Climate Transaction, partially offset by $10 million of income tax expense primarily associated with $8 million adverse currency impacts in connection with the Korean capital gains withholding tax recovered and uncertain tax positions identified during 2016
As of December 31, 2015, held for sale balances include assets and liabilities associated with operations subject to the Interiors Divestiture located in Argentina and Brazil. Held for sale balances as of December 31, 2015, classified as "Other current assets" and "Other current liabilities" on the consolidated balance sheets are summarized as follows (dollars in millions):
Assets Held for Sale | Liabilities Held for Sale | |||||||
Cash and equivalents | $ | 1 | Accounts payable | $ | 6 | |||
Accounts receivable, net | 9 | Employee benefits | 2 | |||||
Inventories, net | 4 | Other current liabilities | 1 | |||||
Other current assets | 3 | |||||||
Total assets held for sale | $ | 17 | Total liabilities held for sale | $ | 9 | |||
The Company has combined cash flows from discontinued operations with cash flows from continuing operations within the operating, investing and financing categories within the consolidated statement of cash flows. Cash and non-cash items for certain operating and investing activities related to discontinued operations for the years ended December 31, 2016, 2015 and 2014 are as follows:
Year Ended December 31 | |||||||||||
2016 | 2015 | 2014 | |||||||||
(Dollars in Millions) | |||||||||||
Depreciation and amortization | $ | — | $ | 85 | $ | 200 | |||||
Asset impairments and losses on divestitures | $ | 20 | $ | 16 | $ | 326 | |||||
Capital expenditures | $ | 1 | $ | 81 | $ | 244 | |||||
NOTE 6. Non-Consolidated Affiliates
Non-Consolidated Affiliate Transactions
In November 2013, Visteon and Yangfeng Visteon Automotive Trim Systems Co. Ltd. ("YFV") formed a joint venture under the name of Yanfeng Visteon Electronic (China) Investment Co., Ltd. ("YFVIC") that is owned 50% by the Company and 50% by YFV.
In October 2014, YFVIC completed the purchase of YFV’s 49% direct ownership in Yanfeng Visteon Automotive Electronics Co., Ltd ("YFVE") a consolidated joint venture of the Company. The purchase by YFVIC was financed through a shareholder loan from YFV and external borrowings of approximately $40 million which were guaranteed by Visteon, and the outstanding amount of the external borrowings as of December 31, 2016 is approximately $22 million. The guarantee contains standard non-payment provisions to cover the borrowers in event of non-payment of principal, accrued interest, and other fees, and the loan is expected to be fully paid by September 2019.
As of December 31, 2014, YFVE completed the sale of its ownership interests in certain joint ventures to YFVIC for cash proceeds of $37 million. No gains or losses were recorded on these transactions by YFVE due to the Company's 50% ownership interest in YFVIC. Differences between carrying value and proceeds on these investments, if any, have been deferred as a basis adjustment to the Company's investment in YFVIC.
In June 2015, the Company completed the sale of its 12.5% ownership interest in Yangfeng Visteon Jinqiao Automotive Trim Systems Co., Ltd. ("Jinqiao"), a Chinese automotive supplier, as contemplated under the Master Agreement, for proceeds of approximately $91 million and recorded a pretax gain of $62 million during the year ended December 31, 2015.
On July 22, 2016, the Company sold a cost method investment to a third party for proceeds of approximately $11 million. The Company recorded a pretax gain of $5 million during the year ended December 31, 2016, classified as "Gain on sale of non-consolidated affiliates, net."
62
During the year ended December 31, 2016, the Company agreed to sell its 50% interest in an equity method investment for approximately $7 million and recorded an impairment loss of approximately $5 million related to this transaction, classified as "Gain on sale of non-consolidated affiliates, net."
Equity in Net Income in Non-Consolidated Affiliates
The Company recorded equity in the net income of non-consolidated affiliates of $2 million, $7 million and $2 million for the years ended December 31, 2016, 2015 and 2014, respectively.
The Company monitors its investments in affiliates for indicators of other-than-temporary declines in value on an ongoing basis. If the Company determines that an “other-than-temporary” decline in value has occurred, an impairment loss will be recorded, which is measured as the difference between the recorded book value and the fair value of the investment. As of December 31, 2016 the Company's retained earnings did not contain any undistributed income of non-consolidated affiliates accounted for using the equity method.
Investments in Non-Consolidated Affiliates
Investments in non-consolidated affiliates were $45 million and $56 million as of December 31, 2016 and 2015, respectively. As of December 31, 2016 and 2015, non-consolidated affiliates accounted for under the equity method totaled $40 million and $45 million while non-consolidated affiliates accounted for under the cost method totaled $5 million and $11 million, respectively.
A summary of the Company's investments in non-consolidated affiliates is provided below.
December 31 | |||||||
2016 | 2015 | ||||||
(Dollars in Millions) | |||||||
YFVIC (50%) | $ | 22 | $ | 23 | |||
Chongqing Changan Visteon Engine Control Systems Co., Ltd. (50%) | 7 | 13 | |||||
Changchun FAWAY Auto Electronics Co., Ltd. (50%) | 8 | 7 | |||||
OpenSynergy GMBH (18.5%) | — | 6 | |||||
Others | 8 | 7 | |||||
Total investments in non-consolidated affiliates | $ | 45 | $ | 56 | |||
The Company determined that Yanfeng Visteon Electronics (China) Investment Co., Ltd. (YFVIC), is a variable interest entity (VIE). The Company holds a variable interest in YFVIC primarily related to its ownership interests and subordinated financial support. The Company and YFV each own 50% of YFVIC, therefore YFVIC is not consolidated since the Company is not the primary beneficiary of YFVIC.
As of December 31, 2016, the Company has receivables due from YFVIC, including trade receivables and other advances of $15 million, subordinated loan receivables of $22 million and payables related to YFVIC of $14 million. As of December 31, 2015, the Company has trade receivables and other advances of $36 million, a subordinated loan receivable of $10 million and payables of $17 million related to YFVIC.
As of December 31, 2016, the Company’s maximum exposure to loss in YFVIC is $81 million, which includes assets previously described and a $22 million loan guarantee.
A summary of transactions with affiliates is shown below: | Year Ended December 31 | ||||||
2016 | 2015 | ||||||
(Dollars in Millions) | |||||||
Sales to affiliates (a) | $ | 36 | $ | 44 | |||
Purchases from affiliates (b) | $ | 63 | $ | 51 | |||
(a) Primarily refers to parts and engineering services | |||||||
(b) Primarily refers to engineering services as well as selling, general, and administrative expenses | |||||||
63
NOTE 7. Restructuring Activities
The Company has undertaken various restructuring activities to achieve its strategic and financial objectives. Restructuring activities include, but are not limited to, plant closures, production relocation, administrative cost structure realignment and consolidation of available capacity and resources. The Company expects to finance restructuring programs through cash on hand, cash generated from operations, reimbursements pursuant to customer accommodation and support agreements or through cash available under its existing debt agreements, subject to the terms of applicable covenants. Restructuring costs are recorded as elements of a plan are finalized and the timing of activities and the amount of related costs are not likely to change. However, such costs are estimated based on information available at the time such charges are recorded. In general, management anticipates that restructuring activities will be completed within a time frame such that significant changes to the plan are not likely. Due to the inherent uncertainty involved in estimating restructuring expenses, actual amounts paid for such activities may differ from amounts initially estimated.
Including amounts associated with discontinued operations, the Company recorded restructuring expenses of $57 million, $42 million and $71 million during the years ended December 31, 2016, 2015 and 2014, respectively. Significant restructuring programs are summarized below by product group.
Electronics
During the first quarter of 2016, the Company announced a restructuring program to transform the Company's engineering organization and supporting functional areas to focus on execution and technology. The organization will be comprised of regional engineering, product management and advanced technologies, and global centers of competence. The Company expects to incur up to $25 million of restructuring costs for this program. During the year ended December 31, 2016, the Company has recorded approximately $11 million, net of reversals of restructuring expenses under this program, associated with approximately100 employees, of which $4 million remains accrued as of December 31, 2016. The Company expects to record additional restructuring costs related to this program as the underlying plan is finalized.
During the fourth quarter of 2016, the Company announced a restructuring program impacting engineering and administrative functions to further align the Company's engineering and related administrative footprint with its core product technologies and customers. The Company expects to incur up to $45 million of restructuring costs for this program. During the year ended December 31, 2016, the Company has recorded approximately $27 million of restructuring expenses under this program, associated with approximately 250 employees, of which $20 million remains accrued as of December 31, 2016. The Company expects to record additional restructuring costs related to this program as the underlying plan is finalized.
In connection with the Electronics Acquisition, the Company commenced a restructuring program designed to achieve cost savings through transaction synergies. During the years ended December 31, 2015 and 2014, the Company recorded $20 million, net of reversals, and $37 million, respectively, of severance and termination benefits under this program associated with approximately 1,100 employees. Charges for the program are considered substantially complete and approximately $2 million remains accrued as of December 31, 2016.
During October 2015, the Company announced a restructuring program designed to reduce the workforce at a European Electronics facility. The Company recorded $12 million of severance and termination benefits under this program associated with approximately 100 employees, which approximately $6 million remains accrued as of December 31, 2016. The Company expects to record additional restructuring costs related to this program as the underlying plan is finalized.
The Company previously announced a restructuring program designed to reduce fixed costs and to improve operational efficiencies by addressing certain under-performing operations. In connection with that program, the Company announced plans to realign its corporate and administrative functions directly to their corresponding operational beneficiary. During the year ended December 31, 2015, the Company recorded $4 million for restructuring expenses, primarily related to severance and termination benefits associated with certain executives.
Other and Discontinued Operations
During the year ended December 31, 2016, the Company recorded $16 million of restructuring expenses related to severance and termination benefits, of which $14 million relates to the wind-down of certain operations in South America and $6 million remains accrued as of December 31, 2016.
During 2014, the Company announced the closure of a Climate facility located in Quilmes, Argentina. In connection with the closure, the Company recorded $13 million of restructuring expenses, primarily related to severance and termination benefits associated with approximately 270 employees. As of December 31, 2016, the plan is considered substantially complete. The
64
Company also announced the closure of a Climate facility located in Port Elizabeth, South Africa in 2014. In connection with the closure, the Company recorded and paid $2 million of restructuring expenses, primarily related to severance and termination benefits associated with approximately 90 employees.
Additionally, during 2014, the Company recorded $6 million of employee severance and termination benefit costs associated with approximately 100 employees at two European Interior facilities located in Spain. The Company made cash payments of approximately $3 million related to employee severance and termination benefits and approximately $3 million was divested as a result of the Interiors Divestiture.
During 2014, the Company announced a plan to reduce the workforce at an Interiors operation in Brazil and recorded $3 million for employee severance and termination benefits associated with approximately 50 employees.
In connection with the reorganization of the Company's Climate operations in France, the Company recorded and paid cash to settle employee severance and termination benefits of $2 million and $3 million, respectively, for the years ended December 31, 2015 and 2014, associated with approximately 135 employees.
During 2012 the Company announced a plan to restructure three European Interiors facilities located in France. During 2014 the Company recorded an additional $5 million of employee severance and termination benefits related to this action.
Restructuring costs associated with entities subject to the Interiors Divestiture and Climate Transaction have been classified within discontinued operations on the Consolidated Statements of Operations for the years ended December 31, 2016, 2015 and 2014.
Restructuring Reserves
Restructuring reserve balances of $40 million and $38 million as of December 31, 2016 and 2015, respectively, are classified as Other current liabilities on the Consolidated Balance Sheets. The Company anticipates that the activities associated with the restructuring reserve balance as of December 31, 2016 will be substantially completed by the end of 2017. The Company’s consolidated restructuring reserves and related activity are summarized below including amounts associated with discontinued operations.
Electronics | Other | Total | |||||||||
(Dollars in Millions) | |||||||||||
December 31, 2013 | $ | 3 | $ | 26 | $ | 29 | |||||
Expense | 38 | 33 | 71 | ||||||||
Utilization | (10 | ) | (46 | ) | (56 | ) | |||||
Business divestiture | — | (3 | ) | (3 | ) | ||||||
Foreign currency | (1 | ) | (1 | ) | (2 | ) | |||||
December 31, 2014 | 30 | 9 | 39 | ||||||||
Expense | 40 | 2 | 42 | ||||||||
Reversals | (4 | ) | — | (4 | ) | ||||||
Utilization | (31 | ) | (3 | ) | (34 | ) | |||||
Business divestiture | — | (1 | ) | (1 | ) | ||||||
Foreign currency | (2 | ) | (2 | ) | (4 | ) | |||||
December 31, 2015 | 33 | 5 | 38 | ||||||||
Expense | 41 | 16 | 57 | ||||||||
Reversals | (4 | ) | — | (4 | ) | ||||||
Utilization | (38 | ) | (12 | ) | (50 | ) | |||||
Foreign currency | (1 | ) | — | (1 | ) | ||||||
December 31, 2016 | $ | 31 | $ | 9 | $ | 40 | |||||
Given the economically-sensitive and highly competitive nature of the automotive industry, the Company continues to closely monitor current market factors and industry trends taking action as necessary, including but not limited to, additional restructuring actions. However, there can be no assurance that any such actions will be sufficient to fully offset the impact of adverse factors on the Company or its results of operations, financial position and cash flows.
65
NOTE 8. Inventories
Inventories consist of the following components: | December 31 | ||||||
2016 | 2015 | ||||||
(Dollars in Millions) | |||||||
Raw materials | $ | 83 | $ | 90 | |||
Work-in-process | 34 | 53 | |||||
Finished products | 34 | 44 | |||||
$ | 151 | $ | 187 | ||||
NOTE 9. Other Assets
Other current assets are comprised of the following components: | December 31 | ||||||
2016 | 2015 | ||||||
(Dollars in Millions) | |||||||
Recoverable taxes | $ | 60 | $ | 425 | |||
Joint venture receivables | 39 | 44 | |||||
Prepaid assets and deposits | 35 | 28 | |||||
Notes receivable | 18 | 21 | |||||
Contractually reimbursable engineering costs | 7 | 34 | |||||
Foreign currency hedges | 6 | 6 | |||||
Assets held for sale | — | 17 | |||||
Other | 5 | 6 | |||||
$ | 170 | $ | 581 | ||||
Recoverable taxes as of December 31, 2015, include Korean capital gains tax withheld by the Purchasers and paid to the Korean government in connection with the Climate Transaction of $364 million adjusted for currency and interest impacts. In January 2016, the Company recovered the entire amount of the Korean capital gains withholding tax, adjusted for currency impacts, of $356 million.
Notes receivable represent bank notes generally maturing within six months.
Other non-current assets are comprised of the following components:
December 31 | |||||||
2016 | 2015 | ||||||
(Dollars in Millions) | |||||||
Deferred tax assets | $ | 48 | $ | 34 | |||
Recoverable taxes | 34 | 21 | |||||
Joint venture note receivables | 25 | 13 | |||||
Contractually reimbursable engineering costs | 11 | 4 | |||||
Long term notes receivable | 10 | — | |||||
Other | 18 | 16 | |||||
$ | 146 | $ | 88 | ||||
In accordance with the Interiors Divestiture, the buyer had the option to request replacement of the existing revolving credit facility with a three year term loan between $5 million and $10 million. Upon the South America closing on December 1, 2016, the buyer exercised the option and entered into a three year term loan for $10 million.
Current and non-current contractually reimbursable engineering costs of $7 million and $11 million, respectively, as of December 31, 2016, are related to pre-production design and development costs incurred pursuant to long-term supply arrangements that are contractually guaranteed for reimbursement by customers. The Company expects to receive cash reimbursement payments of approximately $7 million in 2017, $4 million in 2018 and $7 million in 2019.
66
NOTE 10. Property and Equipment
Property and equipment, net consists of the following: | December 31 | ||||||
2016 | 2015 | ||||||
(Dollars in Millions) | |||||||
Land | $ | 16 | $ | 15 | |||
Buildings and improvements | 65 | 64 | |||||
Machinery, equipment and other | 401 | 353 | |||||
Construction in progress | 54 | 75 | |||||
Total property and equipment | 536 | 507 | |||||
Accumulated depreciation | (210 | ) | (170 | ) | |||
326 | 337 | ||||||
Product tooling, net of amortization | 19 | 14 | |||||
Property and equipment, net | $ | 345 | $ | 351 | |||
Depreciation and amortization expenses for property and equipment, excluding discontinued operations, are summarized as follows:
Year Ended December 31 | |||||||||||
2016 | 2015 | 2014 | |||||||||
(Dollars in Millions) | |||||||||||
Depreciation | $ | 66 | $ | 66 | $ | 54 | |||||
Amortization | 3 | 4 | 2 | ||||||||
$ | 69 | $ | 70 | $ | 56 | ||||||
The net book value of capitalized software costs was approximately $7 million and $8 million as of December 31, 2016 and 2015, respectively. Related amortization expense was approximately $4 million for the years ended December 31, 2016, 2015 and 2014. Amortization expense of approximately $3 million, $2 million, $1 million, $1 million and less than $1 million is expected for the annual periods ended December 31, 2017, 2018, 2019, 2020, and 2021, respectively.
NOTE 11. Intangible Assets
Intangible assets as of December 31, 2016 and 2015, were as follows:
December 31, 2016 | December 31, 2015 | ||||||||||||||||||||||||
Estimated Weighted Average Useful Life (years) | Gross Carrying Value | Accumulated Amortization | Net Carrying Value | Gross Carrying Value | Accumulated Amortization | Net Carrying Value | |||||||||||||||||||
(Dollars in Millions) | |||||||||||||||||||||||||
Definite-Lived: | |||||||||||||||||||||||||
Developed technology | 9 | $ | 40 | $ | 25 | $ | 15 | $ | 39 | $ | 20 | $ | 19 | ||||||||||||
Customer related | 10 | 83 | 25 | 58 | 84 | 17 | 67 | ||||||||||||||||||
Other | 32 | 12 | 1 | 11 | 8 | 1 | 7 | ||||||||||||||||||
Subtotal | 135 | 51 | 84 | 131 | 38 | 93 | |||||||||||||||||||
Indefinite-Lived: | |||||||||||||||||||||||||
Goodwill | 45 | — | 45 | 40 | — | 40 | |||||||||||||||||||
Total | $ | 180 | $ | 51 | $ | 129 | $ | 171 | $ | 38 | $ | 133 | |||||||||||||
In connection with the AllGo Purchase, the Company recorded intangible assets including developed technology of $2 million and customer related assets of $5 million. These definite lived intangible assets are being amortized using the straight-line method over their estimated useful lives of 10 to 12 years for developed technology and 7 to 12 years for customer related assets. Additionally,
67
the Company recorded goodwill of $11 million for the excess of the net purchase price over the fair values of the identifiable assets and liabilities acquired.
The Company recorded approximately $15 million of amortization expense related to definite-lived intangible assets for the years ended December 31, 2016 and 2015. The Company currently estimates annual amortization expense to be $12 million each year from 2017 through 2019, $11 million for 2020 and $10 million for 2021. Indefinite-lived intangible assets are not amortized but are tested for impairment at least annually, or earlier when events and circumstances indicate that it is more likely than not that such assets have been impaired.
A roll-forward of the net carrying amounts of intangible assets is presented below:
Definite-lived intangibles | Indefinite-lived intangibles | ||||||||||||||||||
Developed Technology | Customer Related | Other | Goodwill | Total | |||||||||||||||
(Dollars in Millions) | |||||||||||||||||||
Electronics: | |||||||||||||||||||
December 31, 2014 | $ | 26 | $ | 77 | $ | 7 | $ | 46 | $ | 156 | |||||||||
Foreign currency | — | (2 | ) | — | (4 | ) | (6 | ) | |||||||||||
Amortization | (7 | ) | (8 | ) | — | — | (15 | ) | |||||||||||
YFVE purchase adjustment | — | — | — | (2 | ) | (2 | ) | ||||||||||||
December 31, 2015 | $ | 19 | $ | 67 | $ | 7 | $ | 40 | $ | 133 | |||||||||
Additions | 2 | 5 | 4 | 11 | 22 | ||||||||||||||
Foreign currency | — | (5 | ) | — | (2 | ) | (7 | ) | |||||||||||
Amortization | (6 | ) | (9 | ) | — | — | (15 | ) | |||||||||||
Other -YFVE purchase adjustment | — | — | — | (4 | ) | (4 | ) | ||||||||||||
December 31, 2016 | $ | 15 | $ | 58 | $ | 11 | $ | 45 | $ | 129 | |||||||||
NOTE 12. Other Liabilities
Other current liabilities are summarized as follows:
December 31 | |||||||
2016 | 2015 | ||||||
(Dollars in Millions) | |||||||
Electronics operations repurchase commitment | $ | 50 | $ | 50 | |||
Product warranty and recall accruals | 43 | 26 | |||||
Restructuring reserves | 40 | 38 | |||||
Contribution payable | 31 | 33 | |||||
Rents and royalties | 23 | 33 | |||||
Joint venture payables | 22 | 18 | |||||
Income taxes payable | 22 | 63 | |||||
Deferred income | 14 | 11 | |||||
Non-income taxes payable | 8 | 20 | |||||
Foreign currency hedges | 7 | 1 | |||||
Dividends payable | 5 | 6 | |||||
Information technology separation and service obligations | 2 | 37 | |||||
Liabilities held for sale | — | 9 | |||||
Other | 27 | 25 | |||||
$ | 294 | $ | 370 | ||||
68
In connection with the Climate Transaction, the Company entered an agreement to purchase certain electronics operations located in India, expected to close in 2017 after legal separation and regulatory approvals are met. The Company has recorded a repurchase commitment of $50 million, representing the contractual purchase price of the subject business.
In connection with the Climate Transaction and the Interiors Divestiture, the Company has certain information technology separation and service obligations. As of December 31, 2016 and 2015, remaining obligations totaled $2 million and $37 million, respectively.
In connection with the Germany Interiors Divestiture, the Company will make a final contribution payment during the first half of 2017 upon fulfillment of buyer contractual commitments. See Note 4 "Divestitures" for additional disclosures.
Other non-current liabilities are summarized as follows:
December 31 | |||||||
2016 | 2015 | ||||||
(Dollars in Millions) | |||||||
Income tax reserves | $ | 14 | $ | 25 | |||
Deferred income | 18 | 15 | |||||
Product warranty and recall accruals | 12 | 12 | |||||
Non-income tax reserves | 10 | 10 | |||||
Other | 15 | 13 | |||||
$ | 69 | $ | 75 | ||||
As of December 31, 2016 and 2015, deferred income, other non-current liabilities, includes approximately $15 million of deferred gain on the sale-leaseback of the Company's corporate headquarters. The gain on the sale is being amortized into income on a straight-line basis over the term of the lease which terminates in 2027.
69
NOTE 13. Debt
The Company’s short and long-term debt consists of the following:
Weighted Average Interest Rate | Carrying Value | ||||||||||||
Maturity | 2016 | 2015 | 2016 | 2015 | |||||||||
(Dollars in Millions) | |||||||||||||
Short-Term Debt: | |||||||||||||
Current portion of long-term debt | 4.2% | 4.6% | $ | 3 | $ | 3 | |||||||
Short-term borrowings | 2.6% | 2.4% | 33 | 34 | |||||||||
$ | 36 | $ | 37 | ||||||||||
Long-Term Debt: | |||||||||||||
Term facility due April 9, 2021 | 2021 | 4.0% | 3.5% | $ | 346 | $ | 345 | ||||||
Other | 2016-2020 | 13.4% | 4.1% | — | 1 | ||||||||
$ | 346 | $ | 346 | ||||||||||
Short-Term Debt
Short-term borrowings are primarily related to the Company's non-U.S. joint venture and are payable in Chinese Renminbi and India Rupee. As of December 31, 2016 and 2015, the Company had short-term borrowings of $33 million and $34 million, respectively. Short-term borrowings decreased slightly in 2016 primarily due to changes in working capital needs.
Available borrowings on outstanding affiliate credit facilities as of December 31, 2016, are approximately $32 million and certain
of these facilities have pledged assets as security.
Long-Term Debt
On April 9, 2014, the Company entered into a credit agreement (the “Credit Agreement”), by and among the Company as borrower, each lender from time to time party thereto, each letter of credit issuer from time to time party thereto and Citibank, N.A. as administrative agent (the “Administrative Agent”), which provides for (i) delayed draw term loans in an aggregate principal of $600 million (the “Term Facility”) and (ii) a $200 million revolving credit facility (the “Revolving Facility”). The Company and certain of its subsidiaries have granted a security interest in substantially all of their respective property, subject to certain limitations.
At the Company’s option, loans under the Term Facility and Revolving Facility may be maintained from time to time at an interest rate equal to the applicable rate (“Applicable Rate”) plus the applicable domestic rate (“Base Rate”) or the LIBOR-based rate (“Eurodollar Rate”). The Base Rate shall be a fluctuating rate per annum equal to the highest of (i) the rate equal to the weighted average of the rates on overnight federal funds transactions with members of the Federal Reserve System arranged by federal funds brokers, as published by the Federal Reserve Bank of New York on the following Business Day, plus 0.50%; (ii) the rate established by the Administrative Agent as its “prime rate” at its principal U.S. office and (iii) the Eurodollar Rate (which, for the purposes of establishing the Base Rate, shall not be less than 0.75%) plus 1%. The Eurodollar Rate shall be equal to the quotient obtained by dividing (a) the ICE Benchmark Administration Limited LIBOR Rate by (b) the difference between 1.00 and the reserve percentage under regulations issued from time to time by the Board of Governors of the Federal Reserve System of the United States for determining the maximum reserve requirement with respect to Eurocurrency funding. The Applicable Rate varies based on certain corporate credit ratings at the time of borrowing, and ranges from 1.00% to 1.75% for Base Rate loans and 2.00% to 2.75% for Eurodollar Rate loans.
Up to $75 million of the Revolving Facility is available for the issuance of letters of credit, and any such issuance of letters of credit will reduce the amount available for loans under the Revolving Facility. Up to $20 million of the Revolving Facility is available for swing line advances, and any such swing line advances will reduce the amount available for loans under the Revolving Facility. The Company may request increases in the limits under the Term Facility and the Revolving Facility and may request the addition of one or more term loan facilities under the Credit Agreement.
Loans made under the Term Facility and the Revolving Facility are due and payable in full on April 9, 2021 and April 9, 2019, respectively. Outstanding borrowings may be prepaid without penalty (other than borrowings made for the purpose of reducing the effective interest rate margin or weighted average yield of the loans) in $100,000 increments over $500,000 for loans maintained under the Base Rate and in $250,000 increments over $1,000,000 for loans maintained under the Eurodollar Rate. There are
70
mandatory prepayments of principal in connection with: (i) excess cash flow sweeps (in the amount of 50%, with step downs to 25% and 0% of the excess cash flow, depending on the then-applicable leverage), (ii) certain asset sales or other dispositions (including as a result of casualty or condemnation), (iii) certain refinancing of indebtedness and (iv) over-advances under the Revolving Facility. The Company was also required to repay quarterly 0.25% of the initial term loan drawn.
The Credit Agreement requires the Company and its subsidiaries to comply with customary affirmative and negative covenants, including financial covenants and contains customary events of default. The Term Facility and the Revolving Facility require that, as of the last day of any four consecutive fiscal quarters of the Company last ended (commencing as of June 30, 2014), the Company maintain a total net leverage ratio no greater than 3.00:1.00 (the “Financial Maintenance Covenant”). During any period when the Company’s corporate and family ratings meet certain specified ratings, certain of the negative covenants shall be suspended and the Financial Maintenance Covenant shall only be tested with respect to the Revolving Facility. As of December 31, 2016, the Company was in compliance with the Financial Maintenance Covenant.
All obligations under the Credit Agreement and obligations in respect of certain cash management services and swap agreements with the lenders and their affiliates are unconditionally guaranteed by certain of the Company’s subsidiaries. Under the terms of the Credit Agreement, (i) the Company, certain of its subsidiaries and the Administrative Agent entered into a Security Agreement (the “Security Agreement”), (ii) certain subsidiaries of the Company and the Administrative Agent entered into a Guaranty Agreement (the “Guaranty Agreement”) and (iii) the Company, certain of its subsidiaries and the Administrative Agent entered into an Intellectual Property Security Agreement (together with the Security Agreement and the Guaranty Agreement, the “Security Documents”). Pursuant to the Security Documents, all obligations under the Credit Agreement are secured by a first-priority perfected lien (subject to certain exceptions) in substantially all of the property of the Company and the subsidiaries party to the Security Agreement, subject to certain limitations.
The Company executed an Amendment to the Credit Agreement on March 25, 2015 to, among other things, provide for certain modifications to permit Visteon’s sale of its ownership interest in HVCC and otherwise to update the Credit Agreement to account for HVCC no longer being a subsidiary of Visteon following the Climate Transaction. Under the Amendment, Term Lenders agree to waive the 100% Net Cash Proceeds prepayment requirement, so long as such Net Cash Proceeds are used to prepay the Term Loans within five Business Days of the receipt in an amount sufficient to reduce the aggregate principal amount of Term Loans outstanding after giving effect to such prepayment, to no more than $350 million. Visteon consummated the Climate Transaction on June 9, 2015 and subsequently paid down $246 million term loan principal on June 12, 2015 to reduce aggregate principal amount of Term Loans outstanding to $350 million. In connection with the principal reduction, the 0.25% mandatory quarterly prepayment obligation was considered met, therefore Visteon ceased making quarterly amortization payments. During the year ended December 31, 2015, the Company recorded a $5 million loss on debt extinguishment costs, representing unamortized original issue discount, debt fees and amendment fees associated with the pay-down. As of December 31, 2016, the term loan balance remains at $350 million face value and there were no outstanding borrowings under the Revolving Facility.
On April 9, 2014, the Company issued a call notice and redeemed the remaining $350 million of certain outstanding Senior Notes on May 9, 2014. The Company recorded a $23 million loss on extinguishment of debt in the year ended December 31, 2014, related to the premium paid on the debt redemption and unamortized original issue discount, debt fees and other debt issue costs associated with the Senior Notes.
Debt Obligations
Debt obligations are primarily related to short term borrowings, lease obligations and the corporate Term Facility. As of December 31, 2016, debt obligations included maturities as follows: 2017 — $36 million and 2021 — $350 million. There are no debt obligations due during 2018, 2019 and 2020. The corporate Term Facility with face value of $350 million matures on April 9, 2021.
Other
The Company has a $15 million letter of credit facility whereby the Company must maintain a collateral account equal to 103% of the aggregate stated amount of issued letters of credit (or 110% for non-U.S. currencies) and must reimburse any amounts drawn under issued letters of credit. The Company had $3 million and $6 million of outstanding letters of credit issued under this facility secured by restricted cash, as of December 31, 2016 and 2015, respectively.
Additionally, the Company had $17 million and $16 million of locally issued letters of credit as of December 31, 2016 and 2015, respectively, to support various tax appeals, customs arrangements and other obligations at its local affiliates, of which less than$1 million and $2 million is secured by cash collateral for the years ended December 31, 2016 and 2015, respectively.
71
NOTE 14. Employee Benefit Plans
Defined Benefit Plans
The Company sponsors pay related benefit plans for employees in the U.S., UK, Germany, Brazil, France, Mexico, Japan, India, and Canada. Employees in the U.S. are no longer accruing benefits under the Company's defined benefit plans as these plans were frozen. The Company’s defined benefit plans are partially funded with the exception of certain supplemental benefit plans for executives and certain non-U.S. plans, primarily in Germany, which are unfunded.
On July 22, 2014, the Company purchased a non-participating annuity contract from Prudential Insurance Company of America (“Prudential”) for certain participants under the U.S. defined benefit pension plan (the “Plan”). The annuity purchase covered approximately 3,900 participants and resulted in the use of approximately $350 million of plan assets for the settlement of approximately $350 million of the outstanding pension benefit obligation (“PBO”). In connection with the annuity purchase, the Company recorded a settlement gain of $25 million during the year ended December 31, 2014. This gain is the pro-rata portion of the existing unamortized gain in AOCI and was calculated based on the percentage of the Plan's PBO that was settled as part of the annuity purchase. Prudential has unconditionally and irrevocably guaranteed the full payment of benefits to plan participants associated with the annuity purchase and benefits payment will be in the same form that was in effect under the Plan. Prudential has also assumed all investment risk associated with the assets that were delivered as annuity contract premiums.
The Company's expense for all defined benefit pension plans, is as follows:
U.S. Plans | Non-U.S. Plans | ||||||||||||||||||||||
Year Ended December 31 | Year Ended December 31 | ||||||||||||||||||||||
2016 | 2015 | 2014 | 2016 | 2015 | 2014 | ||||||||||||||||||
(Dollars in Millions) | |||||||||||||||||||||||
Costs Recognized in Income: | |||||||||||||||||||||||
Service cost | $ | — | $ | — | $ | — | $ | 3 | $ | 14 | $ | 25 | |||||||||||
Interest cost | 28 | 34 | 43 | 10 | 19 | 31 | |||||||||||||||||
Expected return on plan assets | (42 | ) | (42 | ) | (54 | ) | (10 | ) | (17 | ) | (22 | ) | |||||||||||
Amortization of losses and other | — | 1 | — | 1 | 8 | 3 | |||||||||||||||||
Settlements and curtailments | — | — | (23 | ) | 1 | — | (2 | ) | |||||||||||||||
Special termination benefits (a) | 6 | — | — | 1 | — | — | |||||||||||||||||
Net pension (income) expense | $ | (8 | ) | $ | (7 | ) | $ | (34 | ) | $ | 6 | $ | 24 | $ | 35 | ||||||||
Weighted Average Assumptions: | |||||||||||||||||||||||
Discount rate | 4.37 | % | 4.00 | % | 4.75 | % | 4.60 | % | 3.17 | % | 4.30 | % | |||||||||||
Compensation increase | N/A | N/A | N/A | 3.70 | % | 3.49 | % | 3.55 | % | ||||||||||||||
Long-term return on assets | 7.00 | % | 7.00 | % | 7.00 | % | 4.87 | % | 4.87 | % | 5.10 | % | |||||||||||
(a) Primarily related to restructuring actions announced and recognized in during the fourth quarter | |||||||||||||||||||||||
The Company's total accumulated benefit obligations for all defined benefit plans was $1,047 million and $860 million as of December 31, 2016 and 2015, respectively. The benefit plan obligations for employee retirement plans with accumulated benefit obligations in excess of plan assets were as follows:
Year Ended December 31 | |||||||
2016 | 2015 | ||||||
(Dollars in Millions) | |||||||
Accumulated benefit obligation | $ | 1,019 | $ | 860 | |||
Projected benefit obligation | 1.049 | 847 | |||||
Fair value of plan assets | 764 | 615 | |||||
72
Assumptions used by the Company in determining its defined benefit pension obligations as of December 31, 2016 and 2015 are summarized in the following table:
U.S. Plans | Non-U.S. Plans | |||||||||||
Weighted Average Assumptions | 2016 | 2015 | 2016 | 2015 | ||||||||
Discount rate | 4.12 | % | 4.37 | % | 4.39 | % | 4.60 | % | ||||
Rate of increase in compensation | N/A | N/A | 3.70 | % | 3.70 | % | ||||||
The Company’s obligation for all defined benefit pension plans, is as follows:
U.S. Plans | Non-U.S. Plans | ||||||||||||||
Year Ended December 31 | Year Ended December 31 | ||||||||||||||
2016 | 2015 | 2016 | 2015 | ||||||||||||
(Dollars in Millions) | |||||||||||||||
Change in Benefit Obligation: | |||||||||||||||
Benefit obligation — beginning | $ | 803 | $ | 864 | $ | 231 | $ | 617 | |||||||
Service cost | — | — | 3 | 14 | |||||||||||
Interest cost | 28 | 34 | 10 | 19 | |||||||||||
Actuarial loss (gain) | 34 | (51 | ) | 46 | (11 | ) | |||||||||
Settlements and curtailments | — | — | (5 | ) | (2 | ) | |||||||||
Special termination benefits | 6 | — | 1 | — | |||||||||||
Foreign exchange translation | — | — | (27 | ) | (79 | ) | |||||||||
Divestitures | — | — | (4 | ) | (312 | ) | |||||||||
Benefits paid and other | (43 | ) | (44 | ) | (6 | ) | (15 | ) | |||||||
Benefit obligation — ending | $ | 828 | $ | 803 | $ | 249 | $ | 231 | |||||||
Change in Plan Assets: | |||||||||||||||
Plan assets — beginning | $ | 604 | $ | 676 | $ | 174 | $ | 351 | |||||||
Actual return on plan assets | 43 | (28 | ) | 43 | 9 | ||||||||||
Sponsor contributions | 4 | — | 8 | 22 | |||||||||||
Settlements | — | — | (4 | ) | — | ||||||||||
Foreign exchange translation | — | — | (21 | ) | (45 | ) | |||||||||
Divestitures | — | — | (4 | ) | (148 | ) | |||||||||
Benefits paid and other | (43 | ) | (44 | ) | (6 | ) | (15 | ) | |||||||
Plan assets — ending | $ | 608 | $ | 604 | $ | 190 | $ | 174 | |||||||
Total funded status at end of period, continuing operations | $ | (220 | ) | $ | (199 | ) | $ | (59 | ) | $ | (57 | ) | |||
Balance Sheet Classification: | |||||||||||||||
Other non-current assets | $ | — | $ | — | $ | 6 | $ | 2 | |||||||
Accrued employee liabilities | — | (3 | ) | — | (1 | ) | |||||||||
Employee benefits | (220 | ) | (196 | ) | (67 | ) | (58 | ) | |||||||
Accumulated other comprehensive loss: | |||||||||||||||
Actuarial loss | 54 | 22 | 31 | 23 | |||||||||||
Tax effects/other | (10 | ) | (9 | ) | |||||||||||
$ | 54 | $ | 22 | $ | 21 | $ | 14 | ||||||||
73
Components of the net change in AOCI related to all defined benefit pension plans, exclusive of amounts attributable to non-controlling interests on the Company’s Consolidated Statements of Changes in Equity for the years ended December 31, 2016 and 2015, are as follows:
U.S. Plans | Non-U.S. Plans | ||||||||||||||
2016 | 2015 | 2016 | 2015 | ||||||||||||
(Dollars in Millions) | |||||||||||||||
Actuarial loss (gain) | $ | 32 | $ | 18 | $ | 15 | $ | (4 | ) | ||||||
Deferred taxes | — | — | (3 | ) | 3 | ||||||||||
Currency/other | — | 1 | (4 | ) | (18 | ) | |||||||||
Reclassification to net income | — | — | (1 | ) | (7 | ) | |||||||||
Divestitures | — | — | — | (113 | ) | ||||||||||
$ | 32 | $ | 19 | $ | 7 | $ | (139 | ) | |||||||
Actuarial losses for the year ended December 31, 2016 are primarily related to a decrease in discount rates. Actuarial losses of $2 million for the non-U.S. retirement plans are expected to be amortized to income during 2017. Actuarial gains and losses are amortized using the 10% corridor approach representing 10% times the greater of plan assets and the projected benefit obligation. Generally, the expected return is determined using a market-related value of assets where gains (losses) are recognized in a systematic manner over five years. For less significant plans, fair value is used.
Benefit payments, which reflect expected future service, are expected to be paid by the Company plans as follows:
U.S. Plans | Non-U.S. Plans | ||||||
(Dollars in Millions) | |||||||
2017 | $ | 45 | $ | 5 | |||
2018 | 40 | 6 | |||||
2019 | 39 | 6 | |||||
2020 | 40 | 7 | |||||
2021 | 40 | 8 | |||||
Years 2022 - 2026 | 213 | 52 | |||||
During the year ended December 31, 2016, cash contributions to the Company's U.S. defined benefit plans were $4 million and non-U.S. defined benefit pension plans were $8 million. Additionally, the Company expects to make cash contributions to its U.S. defined benefit pension plans of $1 million in 2017. Contributions to non-U.S. defined benefit pension plans are expected to be $6 million during 2017. The Company’s expected 2017 contributions may be revised.
On April 28, 2016, the Company purchased a non-participating annuity contract for all participants of the Canada non-represented plan. The annuity purchase covered 52 participants and resulted in the use of $5 million of plan assets for pension benefit obligation settlements of approximately $5 million. In connection with the annuity purchase, the Company recorded a settlement loss of approximately $1 million during the year ended December 31, 2016.
Substantially all of the Company’s defined benefit pension plan assets are managed by external investment managers and held in trust by third-party custodians. The selection and oversight of these external service providers is the responsibility of the investment committees and their advisers. The selection of specific securities is at the discretion of the investment manager and is subject to the provisions set forth by written investment management agreements and related policy guidelines regarding permissible investments, risk management practices and the use of derivative securities. Derivative securities may be used by investment managers as efficient substitutes for traditional securities, to reduce portfolio risks or to hedge identifiable economic exposures. The use of derivative securities to engage in unrelated speculation is expressly prohibited.
The primary objective of the pension funds is to pay the plans’ benefit and expense obligations when due. Given the relatively long time horizon of these obligations and their sensitivity to interest rates, the investment strategy is intended to improve the funded status of its U.S. and non-U.S. plans over time while maintaining a prudent level of risk. Risk is managed primarily by diversifying each plan’s target asset allocation across equity, fixed income securities and alternative investment strategies, and then maintaining the allocation within a specified range of its target. In addition, diversification across various investment subcategories within each plan is also maintained within specified ranges.
74
The Company’s retirement plan asset allocation as of December 31, 2016 and 2015 and target allocation for 2017 are as follows:
Target Allocation | Percentage of Plan Assets | ||||||||||||||||
U.S. | Non-U.S. | U.S. | Non-U.S. | ||||||||||||||
2017 | 2017 | 2016 | 2015 | 2016 | 2015 | ||||||||||||
Equity securities | 36 | % | 31 | % | 38 | % | 33 | % | 25 | % | 34 | % | |||||
Fixed income | 19 | % | 46 | % | 16 | % | 22 | % | 52 | % | 55 | % | |||||
Alternative strategies | 45 | % | 14 | % | 45 | % | 44 | % | 16 | % | 8 | % | |||||
Cash | — | % | 9 | % | 1 | % | 1 | % | 7 | % | 3 | % | |||||
100 | % | 100 | % | 100 | % | 100 | % | 100 | % | 100 | % | ||||||
The expected long-term rate of return for defined benefit pension plan assets was selected based on various inputs, including returns projected by various external sources for the different asset classes held by and to be held by the Company’s trusts and its targeted asset allocation. These projections incorporate both historical returns and forward looking views regarding capital market returns, inflation and other variables. Pension plan assets are valued at fair value using various inputs and valuation techniques. A description of the inputs and valuation techniques used to measure the fair value for each class of plan assets is included in Note 19 Fair Value Measurements.
2016 Discount Rate for Estimated Service and Interest Cost: Through December 31, 2015, the Company recognized service and interest cost components of pension expense using a single weighted average discount rate derived from the yield curve used to measure the benefit obligation at the beginning of the period. The single weighted average discount method represents the constant annual rate required to discount all future benefit payments related to past service from the date of expected future payment to the measurement date, such that the aggregate present value equals the obligation. The U.S. and certain non-U.S. frozen plans do not have a service component, as additional benefits are no longer accrued.
During the fourth quarter of 2015, the Company changed the method used to estimate the service and interest components of net periodic benefit cost for pension benefits for its U.S. and certain non-U.S. plans. The Company has elected to utilize an approach that discounts individual expected cash flows underlying interest and service costs using the applicable spot rates derived from the yield curve used to determine the benefit obligation to the relevant projected cash flows. The election and adoption of this method provides a more precise measurement of service and interest costs by improving the correlation between projected benefit cash flows and the corresponding spot yield curve rates. The use of disaggregated discount rates results in a different amount of interest cost compared to the traditional single weighted-average discount rate approach because of different weightings given to each subset of payments. The use of disaggregated discount rates affects the amount of service cost because the benefit payments associated with new service credits for active employees tend to be of longer duration than the overall benefit payments associated with the plan’s benefit obligation. As a result, the payments would be associated with longer-term spot rates on the yield curve, resulting in lower present values than the calculations using the traditional single weighted-average discount rate.
This change does not affect the measurement of the total benefit obligation, but resulted in a decrease in the service and interest components of benefit cost in 2016. The service cost and interest cost for the affected plans reduced by approximately $6 million in 2016 as a result of the change in method. The Company has accounted for this as a change in accounting estimate that is inseparable from a change in accounting principle, and accordingly has accounted for it on a prospective basis.
Defined Contribution Plans
Most U.S. salaried employees and certain non-U.S. employees are eligible to participate in defined contribution plans by contributing a portion of their compensation, which is partially matched by the Company. Matching contributions for the U.S. defined contribution plan are 100% on the first 6% of pay contributed. The expense related to all matching contributions was approximately $6 million in 2016, $10 million in 2015, and $13 million in 2014.
Other Postretirement Employee Benefit Plans
In the U.S. and Canada, the Company has a financial obligation for the cost of providing other postretirement health care and life insurance benefits to certain of its employees under Company-sponsored plans. These plans generally pay for the cost of health care and life insurance for retirees and dependents, less retiree contributions and co-pays. Other postretirement benefit obligations were $2 million and $2 million as of December 31, 2016 and 2015, respectively.
75
NOTE 15. Stock-Based Compensation
The Visteon Corporation 2010 Incentive Plan (the “2010 Incentive Plan”) provides for the grant of up to 5.6 million shares of common stock for restricted stock awards (“RSAs”), restricted stock units (“RSUs”), non-qualified stock options ("Stock Options"), stock appreciation rights (“SARs”), performance based share units ("PSUs"), and other stock based awards. The Company's stock-based compensation instruments are accounted for as equity awards or liability awards based on settlement intention as follows.
• | For equity settled stock-based compensation instruments, compensation cost is measured based on grant date fair value of the award and is recognized over the applicable service period. For equity settled stock-based compensation instruments, the delivery of Company shares may be on a gross settlement basis or on a net settlement basis, as determined by the recipient. The Company's policy is to deliver such shares using treasury shares or issuing new shares. |
• | Cash settled stock-based compensation instruments are subject to liability accounting. At the end of each reporting period, the vested portion of the obligation for cash settled stock-based compensation instruments is adjusted to fair value based on the period-ending market prices of the Company's common stock. Related compensation expense is recognized based on changes to the fair value over the applicable service period. |
Generally, the Company's stock-based compensation instruments are subject to graded vesting and recognized on an accelerated basis. The settlement intention of the awards is at the discretion of the Organization and Compensation Committee of the Company's Board of Directors. These stock-based compensation awards generally provide for accelerated vesting upon a change-in-control, which is defined in the 2010 Incentive Plan and requires a double-trigger. Accordingly, the Company may be required to accelerate recognition of related expenses in future periods in connection with the change-in-control events and subsequent changes in employee responsibilities, if any.
On December 9, 2015, the Company approved a special cash distribution in the amount of $43.40 per share with a record date of January 15, 2016 and a payment date of January 22, 2016. Additionally, the Company recognized an incremental distribution payable of $15 million representing the distribution equivalent payments to be made to certain RSU and PSU holders upon vesting pursuant to the terms of the 2010 Incentive Plan and related RSU and PSU Agreements. In total, the Company recorded approximately $1.75 billion of Distribution payable on the Consolidated Balance Sheets as of December 31, 2015. Subsequent to this special cash distribution in January 2016, the Company modified exercise prices for outstanding stock options and SARs in accordance with the anti-dilution provision in the 2010 Incentive Plan and no incremental compensation expense was recognized.
The total recognized and unrecognized stock-based compensation expense, including discontinued operations, was as follows:
Year Ended December 31 | Unrecognized Stock-Based Compensation Expense | ||||||||||||||
2016 | 2015 | 2014 | December 31, 2016 | ||||||||||||
(Dollars in Millions) | |||||||||||||||
Performance based share units | $ | 4 | $ | 12 | $ | 14 | $ | 6 | |||||||
Restricted stock units | 6 | 4 | 6 | 6 | |||||||||||
Stock options | 2 | 1 | — | 1 | |||||||||||
Stock appreciation rights | — | — | 1 | — | |||||||||||
Total stock-based compensation expense | $ | 12 | $ | 17 | $ | 21 | $ | 13 | |||||||
Performance Based Share Units
PSUs that are expected to be settled in shares of the Company's common stock are recorded as equity awards. PSUs that are expected to be settled in cash are accounted for as liability awards. The Company's Compensation Committee determined a final payout of 56% and 100%, respectively, based on the Company's achievement of a pre-established relative total shareholder return goal compared to its peer group of automotive companies and a total shareholder return metric over a three year period. The number of such PSUs that will vest is based on the Company's achievement of a pre-established relative total shareholder return goal compared to its peer group over a three year period, which may range from 0% to 150% of the target award. A portion of each grant is expected to be settled in stock and cash.
76
A summary of activity for PSUs, including award grants, vesting and forfeitures is provided below.
PSUs | Weighted Average Grant Date Fair Value | |||||
(In Thousands) | ||||||
Non-vested as of December 31, 2013 | 989 | $ | 33.59 | |||
Granted | 30 | 90.45 | ||||
Forfeited | (25 | ) | 35.92 | |||
Non-vested as of December 31, 2014 | 994 | 35.25 | ||||
Granted | 44 | 104.81 | ||||
Vested | (255 | ) | 36.57 | |||
Forfeited | (121 | ) | 43.21 | |||
Non-vested as of December 31, 2015 | 662 | 37.92 | ||||
Granted | 82 | 89.79 | ||||
Vested | (324 | ) | 32.58 | |||
Forfeited | (6 | ) | 68.70 | |||
Non-vested as of December 31, 2016 | 414 | $ | 51.94 | |||
The grant date fair value for PSU's was determined using the Monte Carlo valuation model. Unrecognized compensation expense as of December 31, 2016 for PSU's to be settled in shares of the Company's common stock was $5 million for the non-vested portion and will be recognized over the remaining vesting period of approximately 1.8 years. The Company made cash settlement payments of $8 million during the year ended December 31, 2016 for PSU's expected to be settled in cash. Unrecognized compensation expense as of December 31, 2016 was $1 million for the non-vested portion of these awards and will be recognized over the remaining vesting period of approximately 1.7 years.
The Monte Carlo valuation model requires management to make various assumptions including the expected volatility, risk free interest rate and dividend yield. Expected volatility was calculated based on a rolling average of the daily stock closing prices of a peer group of companies with a period equal to the expected life of the award. The peer group of companies was used due to the relatively short history of the Company's common stock since its emergence from bankruptcy and due to the significant Company transformation between 2012 and 2016. The peer group was established using the criteria of similar industry (utilizing product mix), size (measured by market capitalization), leverage (measured using debt to equity ratio) and length of history. The risk-free rate was based on the U.S. Treasury yield curve in relation to the contractual life of the stock-based compensation instrument. The dividend yield was based on historical patterns and future expectations for Company dividends.
Weighted average assumptions used to estimate the fair value of PSUs granted during the years ended as of December 31, 2016 and 2015 are as follows:
Year Ended December 31 | |||||
2016 | 2015 | ||||
Expected volatility | 33.9 | % | 33.0 | % | |
Risk-free rate | 0.83 | % | 0.95 | % | |
Expected dividend yield | — | % | — | % | |
Restricted Stock Awards and Restricted Stock Units
RSAs and RSUs expected to be settled in shares of the Company's common stock are recorded as equity awards. Grant date fair value is measured as the average of the high and low market price of the Company's common stock as traded on the New York Stock Exchange on the date of grant. All RSAs have been fully vested and settled and there is no unrecognized compensation expense as of December 31, 2016. The Company granted 94,000, 50,000 and 12,000 RSUs, expected to be settled in shares, during the years ended December 31, 2016, 2015 and December 31, 2014, respectively, at a weighted average grant date fair value of $81.54, $103.89 and $84.67 per share, respectively. These awards generally vest in one-third increments on the grant date anniversary over a three year vesting period. Unrecognized compensation expense as of December 31, 2016 and 2015 was $5 million and $4 million for non-vested RSUs and will be recognized over the remaining vesting period of approximately 2.0 years.
77
RSUs expected to be settled in cash are accounted for as liability awards. The Company granted 18,000, 6,000 and 4,000 RSUs of these awards during the years ended December 31, 2016, 2015 and 2014, respectively, at weighted average grant date fair values $78.49, $101.66 and $84.34 per share, respectively. The Company made cash settlement payments of less than $1 million, $7 million and $1 million during the years ended December 31, 2016, 2015 and 2014, respectively. These awards generally vest in one third increments on the grant date anniversary over a three year vesting period. Unrecognized compensation expense as of December 31, 2016 was $1 million for non-vested RSUs and will be recognized on a weighted average basis over the remaining vesting period of approximately 1.8 years. Additionally, as of December 31, 2016, the Company has 2,000 outstanding RSUs awarded at a weighted average grant date fair value of $108.41 under the Non-Employee Director Stock Unit Plan which vest immediately but are not cash settled until the participant terminates service.
A summary of activity for RSAs and RSUs, including grants, vesting and forfeitures is provided below.
RSAs | RSUs | Weighted Average Grant Date Fair Value | |||||||
(In Thousands) | |||||||||
Non-vested as of December 31, 2013 | 19 | 161 | $ | 48.26 | |||||
Granted | — | 16 | 84.58 | ||||||
Vested | (10 | ) | (80 | ) | 53.68 | ||||
Forfeited | — | (6 | ) | 52.49 | |||||
Non-vested as of December 31, 2014 | 9 | 91 | 54.64 | ||||||
Granted | — | 55 | 103.66 | ||||||
Vested | (9 | ) | (50 | ) | 54.47 | ||||
Forfeited | — | (10 | ) | 71.33 | |||||
Non-vested as of December 31, 2015 | — | 86 | 84.26 | ||||||
Granted | — | 112 | 81.05 | ||||||
Vested | — | (17 | ) | 90.45 | |||||
Forfeited | — | (11 | ) | 79.11 | |||||
Non-vested as of December 31, 2016 | — | 170 | $ | 83.30 | |||||
Stock Options and Stock Appreciation Rights
Stock Options expected to be settled in shares of the Company's common stock are recorded as equity awards with an exercise price equal to the average of the high and low market price at which the Company's common stock was traded on the New York Stock Exchange on the date of grant. The grant date fair value of these awards is measured using the the Black-Scholes option pricing model. Stock Options generally vest in one-third increments on the grant date anniversary over a three year vesting period and have an expiration date 7 or 10 years from the date of grant. The Company received payments of less than $1 million, $6 million and $13 million related to the exercise of stock options with total intrinsic value of options exercised of less than $1 million, $3 million and $4 million during the years ended December 31, 2016, 2015 and 2014, respectively. Unrecognized compensation expense for non-vested Stock Options as of December 31, 2016 was approximately $1 million and is expected to be recognized over a weighted average period of 2.1 years.
SARs expected to be settled in cash are accounted for as liability awards with an exercise price equal to the average of the high and low market price at which the Company's common stock was traded on the New York Stock Exchange on the date of grant. The fair value of SARs is determined at each period-end using the Black-Scholes option pricing model. SARs generally vest in one-third increments on the grant date anniversary over a three year vesting period and have an expiration date 7 or 10 years from the date of grant. Unrecognized compensation expense as of December 31, 2016 was less than $1 million for non-vested SARs and will be recognized on a weighted average basis over the remaining vesting period of 1.3 years.
The Black-Scholes option pricing model requires management to make various assumptions including the expected term, expected volatility, risk-free interest rate, and dividend yield. The expected term represents the period of time that granted awards are expected to be outstanding and is estimated based on considerations including the vesting period, contractual term and anticipated employee exercise patterns. Expected volatility is calculated based on a rolling average of the daily stock closing prices of a peer group of companies with a period equal to the expected life of the award. The peer group of companies was used due to the relatively short history of the Company's common stock since its emergence from bankruptcy and due to the significant Company transformation between 2012 and 2016. The peer group was established using the criteria of similar industry (utilizing product mix), size (measured by market capitalization), leverage (measured using debt to equity ratio) and length of history. The risk-free
78
rate is based on the U.S. Treasury yield curve in relation to the contractual life of the stock-based compensation instrument. The dividend yield is based on historical patterns and future expectations for Company dividends.
Weighted average assumptions used to estimate the fair value of awards granted during the years ended December 31, 2016, 2015 and 2014 are as follows:
Stock Options | SARs | ||||||||||||||||
2016 | 2015 | 2014 | 2016 | 2015 | 2014 | ||||||||||||
Expected term (in years) | 5.00 | 5.00 | 5.00 | 4.50 | 4.41 | 5.00 | |||||||||||
Expected volatility | 36.84 | % | 38.19 | % | 43.61 | % | 34.65 | % | 37.19 | % | 43.61 | % | |||||
Risk-free interest rate | 1.37 | % | 1.60 | % | 1.72 | % | 1.83 | % | 1.63 | % | 1.72 | % | |||||
Expected dividend yield | — | % | — | % | — | % | — | % | — | % | — | % | |||||
A summary of activity for Stock Options and SARs, including award grants, vesting and forfeitures is provided below.
Stock Options | Weighted Average Exercise Price | SARs | Weighted Average Exercise Price | ||||||||||
(In Thousands) | (In Thousands) | ||||||||||||
December 31, 2013 | 206 | $ | 68.74 | 76 | $ | 69.06 | |||||||
Granted | 32 | 84.67 | 11 | 84.67 | |||||||||
Exercised | (160 | ) | 70.88 | (40 | ) | 71.15 | |||||||
Forfeited or expired | (4 | ) | 66.75 | (1 | ) | 76.28 | |||||||
December 31, 2014 | 74 | 71.22 | 46 | 70.46 | |||||||||
Granted | 54 | 102.59 | 9 | 101.58 | |||||||||
Exercised | (71 | ) | 71.12 | (38 | ) | 69.81 | |||||||
Forfeited or expired | (9 | ) | 101.58 | (2 | ) | 98.46 | |||||||
December 31, 2015 | 48 | 101.40 | 15 | 86.35 | |||||||||
Granted | 96 | 73.02 | 2 | 78.24 | |||||||||
Exercised | (6 | ) | 99.45 | (3 | ) | 73.27 | |||||||
Forfeited or expired | (23 | ) | 75.04 | (1 | ) | 101.58 | |||||||
December 31, 2016 | 115 | $ | 83.06 | 13 | $ | 86.70 | |||||||
There were no Stock Options and SARs exercisable as of December 31, 2016.
Stock Options and SARs Outstanding | |||||||||
Exercise Price | Number Outstanding | Weighted Average Remaining Life | Weighted Average Exercise Price | ||||||
(In Thousands) | (In Years) | ||||||||
$50.01 - $70.00 | 1 | 5.17 | $ | 53.57 | |||||
$70.01 - $90.00 | 83 | 6.14 | $ | 73.52 | |||||
$90.01 - $110.00 | 44 | 5.35 | $ | 102.83 | |||||
128 | |||||||||
79
NOTE 16. Income Taxes
Income Tax Provision
Details of the Company's income tax provision from continuing operations are provided in the table below:
Year Ended December 31 | |||||||||||
2016 | 2015 | 2014 | |||||||||
(Dollars in Millions) | |||||||||||
Income (Loss) Before Income Taxes: (a) | |||||||||||
U.S | $ | 41 | $ | (69 | ) | $ | (76 | ) | |||
Non-U.S | 118 | 131 | 31 | ||||||||
Total income before income taxes | $ | 159 | $ | 62 | $ | (45 | ) | ||||
Current Tax Provision: | |||||||||||
U.S. federal | $ | (11 | ) | $ | (18 | ) | $ | — | |||
Non-U.S | 54 | 71 | 45 | ||||||||
U.S. state and local | — | — | — | ||||||||
Total current tax provision | 43 | 53 | 45 | ||||||||
Deferred Tax Provision (Benefit): | |||||||||||
U.S. federal | — | — | — | ||||||||
Non-U.S | (13 | ) | (26 | ) | (13 | ) | |||||
Total deferred tax provision (benefit) | (13 | ) | (26 | ) | (13 | ) | |||||
Provision for income taxes | $ | 30 | $ | 27 | $ | 32 | |||||
(a) Income (loss) before income taxes excludes equity in net income of non-consolidated affiliates. | |||||||||||
A summary of the differences between the provision for income taxes calculated at the U.S. statutory tax rate of 35% and the consolidated provision for income taxes is shown below:
Year Ended December 31 | |||||||||||
2016 | 2015 | 2014 | |||||||||
(Dollars in Millions) | |||||||||||
Income before income taxes, excluding equity in net income of non-consolidated affiliates, at U.S. statutory rate of 35% | $ | 56 | $ | 22 | $ | (16 | ) | ||||
Impact of foreign operations | (26 | ) | 33 | 34 | |||||||
Non-U.S withholding taxes | 13 | 9 | 9 | ||||||||
Tax holidays in foreign operations | (7 | ) | (10 | ) | (7 | ) | |||||
State and local income taxes | (1 | ) | 1 | 11 | |||||||
Tax reserve adjustments | 5 | (9 | ) | 8 | |||||||
Change in valuation allowance | 25 | (53 | ) | (8 | ) | ||||||
Germany interiors divestiture | — | 48 | — | ||||||||
Impact of tax law change | 26 | 2 | — | ||||||||
Worthless stock deduction | (58 | ) | — | — | |||||||
Research credits | (3 | ) | — | — | |||||||
Tax benefits allocated to loss from continuing operations | — | (18 | ) | — | |||||||
Other | — | 2 | 1 | ||||||||
Provision for income taxes | $ | 30 | $ | 27 | $ | 32 | |||||
The Company’s provision for income taxes for continuing operations was $30 million for the year ended December 31, 2016. The favorable impact of foreign operations of $26 million includes a $19 million favorable variance due to income taxes on foreign earnings taxed at rates lower than the U.S. statutory rate, and a $7 million tax benefit, net of foreign tax credits, related to U.S. income taxes in connection with repatriation of earnings, entirely offset by a corresponding $7 million increase in the U.S. valuation allowance. The favorable worthless stock deduction variance relates to the Company’s investment in its Argentina Climate subsidiary where manufacturing operations have ceased, resulting in a $58 million tax benefit that generated a current year U.S.
80
net operating loss, the majority of which was offset by the U.S. valuation allowance, while $3 million reduced the Company’s income tax liability for the 2015 tax year and $8 million reduced the Company’s unrecognized tax benefits that impact the effective tax rate. Tax reserve adjustments of $5 million primarily reflect adverse developments associated with ongoing negotiations to settle certain transfer pricing issues raised with an ongoing audit in Mexico of $2 million and $3 million related to various matters in the U.S. and India for which the uncertainty is expected to be resolved while a full valuation allowance is maintained, and thus, are entirely offset by a corresponding reduction in the valuation allowance. The $26 million unfavorable impact of tax law change in 2016 reflects the reduction in deferred tax assets, including net operating loss carryforwards, primarily attributable to the reduction in the corporate income tax rates in Hungary and Japan, which were largely offset by the related valuation allowance in Hungary of $24 million.
The Company’s provision for income tax for continuing operations was $27 million for year ended December 31, 2015. The unfavorable impact of foreign operations of $33 million includes a $25 million favorable variance due to income taxes on foreign earnings taxed at rates lower than the U.S. statutory rate. These amounts were more than offset by $27 million U.S. and non-U.S. income taxes related to the repatriation of earnings, and $31 million represents foreign tax credit adjustments primarily related to electing to deduct expiring credits. The U.S. income tax consequences of repatriation of earnings and foreign tax credit adjustments approximate $58 million and were entirely offset by the U.S. valuation allowance. Tax reserve adjustments of $9 million primarily related to favorable audit developments in Asia during the first quarter of 2015, and statue expirations in Europe during the fourth quarter of 2015. The unfavorable $48 million variance related to the German interiors divestiture primarily reflects the inability to recognize the loss for German tax purposes, partially offset by a loss recognized for U.S. tax purposes and other adjustments which were fully offset by the U.S. valuation allowance.
Accounting for income taxes generally requires that the amount of tax expense or benefit allocated to continuing operations be determined without regard to the tax effects of other categories of income or loss, such as discontinued operations and other comprehensive income. However, an exception to the general rule is provided when there is a pretax loss from continuing operations and aggregate pretax income from other categories in the current year. In such instances, income from other categories must offset the current loss from operations, the tax benefit of such offset being reflected in continuing operations even when a valuation allowance has been established against the deferred tax assets.
Prior to considering the effects of income taxes, the Company’s operations in the U.S. reported losses from continuing operations primarily as a result of the Germany Interiors Divestiture completed during the fourth quarter of 2015. Also in 2015, the Company reported net pretax income from other categories of income or loss, in particular, U.S. pretax income from discontinued operations attributable to the Climate Divestiture. The exception described in the preceding paragraph resulted in a tax charge to discontinued operations of $18 million and an offsetting tax benefit was recognized in continuing operations.
The Company's provision for income tax for continuing operations was $32 million for the year ended December 31, 2014. The unfavorable impact of foreign operations of $34 million includes a $4 million unfavorable variance due to income taxes on foreign earnings taxed at rates higher than the U.S. statutory rate, $8 million U.S. and non-U.S. income taxes related to the repatriation of earnings, and $22 million represents foreign tax credit adjustments primarily related to electing to deduct expiring credits. The U.S. income tax consequences of repatriation of earnings and foreign tax credit adjustment items approximate $30 million and were entirely offset by the U.S. valuation allowance. The $11 million impact of state and local income taxes primarily reflects the elimination of state net operating loss carryforwards resulting from formally exiting certain states during 2014 and was entirely offset by the U.S. valuation allowance. Tax reserve adjustments of $8 million primarily related to changes in uncertain tax benefits in connection with the Internal Revenue Service completing its audit during the fourth quarter of 2014 which was fully offset by the U.S. valuation allowance.
Deferred Income Taxes and Valuation Allowances
The Company recorded deferred tax liabilities, net of valuation allowances, for U.S. and non-U.S. income taxes and non-U.S. withholding taxes of approximately $16 million and $14 million as of December 31, 2016 and 2015, respectively, on the undistributed earnings of certain consolidated and unconsolidated foreign affiliates as such earnings are intended to be repatriated in the foreseeable future. The amount the Company expects to repatriate is based upon a variety of factors including current year earnings of the foreign affiliates, foreign investment needs and the cash flow needs the Company has in the U.S. With the completion of the Company's business plan in December 2016, the Company reassessed the amount of foreign earnings determined to be permanently reinvested from its consolidated foreign affiliates and concluded that the remaining amount will be repatriated to the U.S. in the foreseeable future. As such, the Company has recorded a deferred tax liability of $170 million which is fully offset against the U.S. valuation allowance as the Company anticipates the planned timing of future repatriations should be sheltered against existing U.S. tax attributes without jeopardizing anticipated U.S. cash flow needs. The Company has not provided for deferred income taxes or foreign withholding taxes on the remainder of undistributed earnings from consolidated foreign affiliates
81
because such earnings are considered to be permanently reinvested. It is not practicable to determine the amount of deferred tax liability on such earnings as the actual tax liability, if any, is dependent on circumstances existing when remittance occurs.
The need to maintain valuation allowances against deferred tax assets in the U.S. and other affected countries will cause variability in the Company’s quarterly and annual effective tax rates. Full valuation allowances against deferred tax assets in the U.S. and applicable foreign countries will be maintained until sufficient positive evidence exists to reduce or eliminate them.
The components of deferred income tax assets and liabilities are as follows:
December 31 | |||||||
2016 | 2015 | ||||||
(Dollars in Millions) | |||||||
Deferred Tax Assets: | |||||||
Employee benefit plans | $ | 119 | $ | 114 | |||
Capitalized expenditures for tax reporting | 15 | 26 | |||||
Net operating losses and credit carryforwards | 1,495 | 1,422 | |||||
Fixed assets and intangibles | 15 | 17 | |||||
Restructuring | 20 | 24 | |||||
Deferred income | 8 | 8 | |||||
Warranty | 7 | 8 | |||||
All other | 81 | 82 | |||||
Valuation allowance | (1,532 | ) | (1,498 | ) | |||
Total deferred tax assets | $ | 228 | $ | 203 | |||
Deferred Tax Liabilities: | |||||||
Fixed assets and intangibles | $ | 21 | $ | 24 | |||
Investment in foreign affiliates, including withholding tax | 174 | 159 | |||||
All other | 5 | 7 | |||||
Total deferred tax liabilities | $ | 200 | $ | 190 | |||
Net deferred tax assets (liabilities) | $ | 28 | $ | 13 | |||
Consolidated Balance Sheet Classification: | |||||||
Other non-current assets | 48 | 34 | |||||
Deferred tax liabilities non-current | 20 | 21 | |||||
Net deferred tax assets (liabilities) | $ | 28 | $ | 13 | |||
At December 31, 2016, the Company had available non-U.S. net operating loss carryforwards and capital loss carryforwards of $1.3 billion and $4 million, respectively, which have carryforward periods ranging from 5 years to indefinite. The Company had available U.S. federal net operating loss carryforwards of $1.8 billion at December 31, 2016, which will expire at various dates between 2027 and 2030. U.S. foreign tax credit carryforwards are $475 million at December 31, 2016. These credits will begin to expire in 2021. U.S. research tax credit carryforwards are $13 million at December 31, 2016. These credits will begin to expire in 2030. The Company had available tax-effected U.S. state operating loss carryforwards of $23 million at December 31, 2016, which will expire at various dates between 2020 and 2036.
In connection with the Company's emergence from bankruptcy and resulting change in ownership on the Effective Date, an annual limitation was imposed on the utilization of U.S. net operating losses, U.S. credit carryforwards and certain U.S. built-in losses (collectively referred to as “tax attributes”) under Internal Revenue Code (“IRC”) Sections 382 and 383. The collective limitation is approximately $120 million per year on tax attributes in existence at the date of change in ownership. Additionally, the Company has approximately $475 million of U.S. foreign tax credits that are not subject to any current limitation since they were realized after the Effective Date.
As of the end of 2016, valuation allowances totaling $1.5 billion have been recorded against the Company’s deferred tax assets. Of this amount, $1.1 billion relates to the Company’s deferred tax assets in the U.S. and $379 million relates to deferred tax assets in certain foreign jurisdictions, primarily Germany and France.
82
Unrecognized Tax Benefits, Inclusive of Discontinued Operations
The Company operates in multiple jurisdictions throughout the world and the income tax returns of its subsidiaries in various tax jurisdictions are subject to periodic examination by respective tax authorities. The Company regularly assesses the status of these examinations and the potential for adverse and/or favorable outcomes to determine the adequacy of its provision for income taxes. The Company believes that it has adequately provided for tax adjustments that it believes are more likely than not to be realized as a result of any ongoing or future examination. Accounting estimates associated with uncertain tax positions require the Company to make judgments regarding the sustainability of each uncertain tax position based on its technical merits. If the Company determines it is more likely than not a tax position will be sustained based on its technical merits, the Company records the largest amount that is greater than 50% likely of being realized upon ultimate settlement. These estimates are updated at each reporting date based on the facts, circumstances and information available. Due to the complexity of these uncertainties, the ultimate resolution may result in a payment that is materially different from the Company's current estimate of the liabilities recorded.
Gross unrecognized tax benefits at December 31, 2016 and 2015 were $35 million and $37 million, respectively. Of these amounts, approximately $12 million and $29 million, respectively, represent the amount of unrecognized benefits that, if recognized, would impact the effective tax rate. The gross unrecognized tax benefit differs from that which would impact the effective tax rate due to uncertain tax positions embedded in other deferred tax attributes carrying a full valuation allowance. Since the uncertainty is expected to be resolved while a full valuation allowance is maintained, these uncertain tax positions should not impact the effective tax rate in current or future periods. The Company records interest and penalties related to uncertain tax positions as a component of income tax expense and related amounts accrued at December 31, 2016 and 2015 were $4 million and $3 million, respectively.
There were several items that impacted the Company’s unrecognized tax benefits resulting in a $10 million net reduction in income tax expense, inclusive of interest and penalties, during 2016, of which $7 million and $3 million of income tax benefits were reflected in continuing operations and discontinued operations, respectively. The $7 million income tax benefit in continuing operations reflects the $8 million reduction in unrecognized tax benefits that impact the effective rate due to the ability to utilize estimated U.S. net operating loss via carryback against U.S. income tax liabilities, partially offset by primarily adverse audit developments in Mexico. The $3 million income tax benefit in discontinued operations primarily relates to change in estimates associated with the filing of the Company’s 2015 U.S. tax returns that resulted in a reduction in U.S. income tax after utilizing available tax attributes related to the 2015 Climate Transaction, partially offset by adverse developments in connection with several ongoing audits related to former discontinued operations.
During 2015, the Company received a favorable order from the Joint Commissioner of Income Tax in India related to numerous appeals in connection with assessments initiated over seven years ago associated with the transfer price used to value certain share transactions. During 2015, the Internal Revenue Service ("IRS") completed consecutive audits of the Company's U.S. climate affiliate for the 2011 through 2013 tax years. In connection with the Climate Transaction, the Company eliminated substantially all of the unrecognized tax benefits associated with the climate legal entities by $21 million. Also in connection with this transaction, the amount of unrecognized tax benefits that impact the rate increased by $12 million to reflect the anticipated U.S. income tax related to the 2015 tax year after utilizing available tax attributes. As a consequence of the Company abandoning its pursuit of further appeals related to the alleged underpayment of withholding tax on dividends paid from its Korean affiliates, the Company recorded $7 million of income tax expense related to dividends paid from its former Korean affiliates. In February 2016, the Company received, and subsequently paid, tax assessments from the Korean tax authorities in the amount of $7 million related to underpayment of withholding taxes.
With few exceptions, the Company is no longer subject to U.S. federal tax examinations for years before 2012 or state and local, or non-U.S. income tax examinations for years before 2003 although U.S. net operating losses and other tax attributes carried forward into open tax years technically remain open to adjustment. The Company expects the U.S. federal income tax examination of years 2012 and 2013 to be completed sometime during the first half of 2017. The closure of this examination could materially change the Company’s gross unrecognized tax benefits but should not impact the Company’s effective tax rate. Although it is not possible to predict the timing of the resolution of all other ongoing tax audits with accuracy, it is reasonably possible that certain tax proceedings in Europe, Asia, and Mexico could conclude within the next twelve months and result in a significant increase or decrease in the balance of gross unrecognized tax benefits. Given the number of years, jurisdictions and positions subject to examination, the Company is unable to estimate the full range of possible adjustments to the balance of unrecognized tax benefits. The long-term portion of uncertain income tax positions (including interest) in the amount of $14 million, is included in Other non-current liabilities on the consolidated balance sheet, while the current portion in the amount of $2 million, is included in Other current liabilities on the consolidated balance sheet.
83
A reconciliation of the beginning and ending amount of unrecognized tax benefits including amounts attributable to discontinued operations is as follows:
Year Ended December 31 | |||||||
2016 | 2015 | ||||||
(Dollars in Millions) | |||||||
Beginning balance | $ | 37 | $ | 60 | |||
Tax positions related to current period | |||||||
Additions | 4 | 3 | |||||
Tax positions related to prior periods | |||||||
Additions | 3 | 12 | |||||
Reductions | (2 | ) | (35 | ) | |||
Settlements with tax authorities | (7 | ) | (1 | ) | |||
Lapses in statute of limitations | — | (2 | ) | ||||
Ending balance | $ | 35 | $ | 37 | |||
During 2012, Brazil tax authorities issued tax assessment notices to Visteon Sistemas Automotivos (“Sistemas”) related to the sale of its chassis business to a third party, which required a deposit in the amount of $15 million during 2013 necessary to open a judicial proceeding against the government in order to suspend the debt and allow Sistemas to operate regularly before the tax authorities after attempts to reopen an appeal of the administrative decision failed. Adjusted for currency impacts and accrued interest, the deposit amount is approximately $15 million, as of December 31, 2016. The Company believes that the risk of a negative outcome is remote once the matter is fully litigated at the highest judicial level. These appeal payments, as well as income tax refund claims associated with other jurisdictions, total $18 million as of December 31, 2016, and are included in Other non-current assets on the consolidated balance sheet.
NOTE 17. Stockholders’ Equity and Non-controlling Interests
Share Repurchase Program
In May 2014, the Company entered into a accelerated stock buyback ("ASB") program to purchase shares of common stock for an aggregate purchase price of $500 million. Under the program, the Company paid the financial institution $500 million and received an initial delivery of 3,394,157 shares of common stock using a reference price of $92.07, and an additional delivery of 1,129,001 shares of common stock following the conclusion of the hedge period which determined a certain minimum amount of shares guaranteed under a portion of the program that had a maximum per share price of $100.54. On October 15, 2014, the capped portion of the program concluded, and the Company received an additional 112,269 shares. The final settlement price for all shares delivered under the capped portion of the program was $96.19. On May 1, 2015, the uncapped portion of the program concluded, and the Company received an additional 534,214 shares. The final settlement price for all shares delivered under the uncapped portion of the program was $97.25.
During 2015, the Company entered into another $500 million ASB program. Under this program the Company paid $500 million and repurchased 4,771,262 shares of common stock for an average settlement price of $104.79. This program concluded in December 2015.
During 2016, Visteon entered into stock buyback programs with a third-party financial institution to purchase shares of common stock for an aggregate purchase price of $500 million. Under these programs, Visteon purchased 7,190,506 shares at an average price of $69.48.
On January 10, 2017, the Company's board of directors authorized $400 million of share repurchase of its shares of common stock through March 30, 2018. The Company anticipates that additional repurchases of common stock, if any, would occur from time to time in open market transactions or in privately negotiated transactions depending on market and economic conditions, share price, trading volume, alternative uses of capital and other factors.
Distribution
On December 9, 2015, the Company declared a special distribution of $43.40 per share of its common stock outstanding as of January 15, 2016, or approximately $1.75 billion in the aggregate. On January 22, 2016 approximately $1.74 billion was paid. The remaining $15 million will be paid over a two-year period upon vesting and settlement of restricted stock units and performance-based share units previously granted to the Company's employees. These amounts were classified as "Distribution payable" on
84
the Consolidated Balance Sheets as of December 31, 2016 and 2015. The special cash distribution was funded from Climate Transaction proceeds.
Treasury Stock
As of December 31, 2016, the Company's board of directors has authorized a total of $1.8 billion in share repurchases since July of 2012. Since then, the Company's treasury stock has increased by $1,766 billion. As of December 31, 2016 and 2015, the Company held 22,211,410 and 15,182,372 shares of common stock in treasury for use in satisfying obligations under employee incentive compensation arrangements. The Company values shares of common stock held in treasury at cost.
Non-Controlling Interests
Non-controlling interests in the Visteon Corporation economic entity are as follows:
December 31 | |||||||
2016 | 2015 | ||||||
(Dollars in Millions) | |||||||
Yanfeng Visteon Automotive Electronics Co., Ltd. | 97 | 100 | |||||
Shanghai Visteon Automotive Electronics, Co., Ltd. | 39 | 41 | |||||
Other | 2 | 1 | |||||
Total non-controlling interests | $ | 138 | $ | 142 | |||
Stock Warrants
In October 2010, the Company issued ten year warrants expiring October 1, 2020 at exercise price of $9.66 per share. As of December 31, 2016, 2015, and 2014 there are 909 warrants outstanding. The warrants may be net share settled and are recorded as permanent equity in the Company’s consolidated balance sheets. These warrants were valued at $15.00 per share on the October 1, 2010 issue date using the Black-Scholes option pricing model.
Pursuant to the Ten Year Warrant Agreement, the original exercise price of $9.66 for the ten year warrants is subject to adjustment as a result of the special distribution of $43.40 per share to shareholders at the beginning of 2016. The new exercise price for each of the remaining 909 ten year warrants outstanding as of December 31, 2016 is reduced to a nominal $0.01 and each warrant is entitled to approximately 1.4 shares of stock upon exercise based on share price as of December 31, 2016.
In October 2010, the Company also issued five year warrants. During 2014, five year warrant holders exercised 741,951 of the 1,548,387 outstanding warrants for shares of common stock on a 1-for-1 basis. During 2015, the five year warrant holders exercised 671,674 of the outstanding warrants for shares of common stock on a 1-for-1 basis. The remaining 134,762 five year warrants expired in 2015.
Restricted Net Assets
Restricted net assets related to the Company’s non-consolidated affiliates were approximately $45 million and $56 million, respectively, as of December 31, 2016 and 2015. Restricted net assets related to the Company’s consolidated subsidiaries were approximately $164 million and $156 million, respectively as of December 31, 2016 and 2015. Restricted net assets of consolidated subsidiaries are attributable to the Company’s consolidated joint ventures in China, where certain regulatory requirements and governmental restraints result in significant restrictions on the Company’s consolidated subsidiaries ability to transfer funds to the Company.
85
Accumulated Other Comprehensive Income (Loss)
Changes in AOCI and reclassifications out of AOCI by component includes:
Year Ended December 31 | |||||||
2016 | 2015 | ||||||
(Dollars in Millions) | |||||||
Changes in AOCI: | |||||||
Beginning balance | $ | (190 | ) | $ | (299 | ) | |
Other comprehensive loss before reclassification, net of tax | (58 | ) | (73 | ) | |||
Amounts reclassified from AOCI | 3 | (10 | ) | ||||
Divestitures | 12 | 192 | |||||
Ending balance | $ | (233 | ) | $ | (190 | ) | |
Changes in AOCI by component: | |||||||
Foreign currency translation adjustments | |||||||
Beginning balance | $ | (155 | ) | $ | (138 | ) | |
Other comprehensive loss before reclassification, net of tax (a) | (13 | ) | (96 | ) | |||
Amounts reclassified from AOCI | 3 | (1 | ) | ||||
Divestitures (b) | 12 | 80 | |||||
Ending balance | (153 | ) | (155 | ) | |||
Benefit plans | |||||||
Beginning balance | (36 | ) | (156 | ) | |||
Other comprehensive income (loss) before reclassification, net of tax (a) | (40 | ) | — | ||||
Amounts reclassified from AOCI (c) | 1 | 7 | |||||
Divestitures (b) | — | 113 | |||||
Ending balance | (75 | ) | (36 | ) | |||
Unrealized hedging gain (loss) | |||||||
Beginning balance | 1 | (5 | ) | ||||
Other comprehensive (loss) income before reclassification, net of tax (d) | (5 | ) | 23 | ||||
Amounts reclassified from AOCI | (1 | ) | (16 | ) | |||
Divestitures (b) | — | (1 | ) | ||||
Ending balance | (5 | ) | 1 | ||||
AOCI ending balance | $ | (233 | ) | $ | (190 | ) | |
(a) There were no income tax effects for either period due to the recording of valuation allowance.
(b) Amounts are included in Loss on Divestiture and Net (loss) income from discontinued operations, net of tax, on the Consolidated Statements
of Operations.
(c) Amount included in the computation of net periodic pension cost. (See Note 14 Employee benefit plans for additional details.) Net tax benefit of $3 million and net tax expense of $3 million related to benefit plans for the years ended December 31, 2016 and 2015, respectively.
(d) Net tax benefit of $2 million and net tax expense of $2 million are related to unrealized hedging (loss) gain for the years ended December 31, 2016 and 2015, respectively.
86
NOTE 18. Earnings (Loss) Per Share
A summary of information used to compute basic and diluted earnings (loss) per share attributable to Visteon is as follows:
Year Ended December 31 | |||||||||||
2016 | 2015 | 2014 | |||||||||
(In Millions, Except Per Share Amounts) | |||||||||||
Numerator: | |||||||||||
Net income (loss) from continuing operations attributable to Visteon | $ | 115 | $ | 22 | $ | (98 | ) | ||||
Net (loss) income from discontinued operations attributable to Visteon | (40 | ) | 2,262 | (197 | ) | ||||||
Net income (loss) attributable to Visteon | $ | 75 | $ | 2,284 | $ | (295 | ) | ||||
Denominator: | |||||||||||
Average common stock outstanding - basic | 35.0 | 42.3 | 45.8 | ||||||||
Dilutive effect of warrants and PSUs | 0.4 | 1.1 | — | ||||||||
Diluted shares | 35.4 | 43.4 | 45.8 | ||||||||
Basic and Diluted Per Share Data: | |||||||||||
Basic earnings (loss) per share attributable to Visteon: | |||||||||||
Continuing operations | $ | 3.28 | $ | 0.52 | $ | (2.14 | ) | ||||
Discontinued operations | (1.14 | ) | 53.48 | (4.30 | ) | ||||||
$ | 2.14 | $ | 54.00 | $ | (6.44 | ) | |||||
Diluted earnings (loss) per share attributable to Visteon: | |||||||||||
Continuing operations | $ | 3.25 | $ | 0.51 | $ | (2.14 | ) | ||||
Discontinued operations | (1.13 | ) | 52.12 | (4.30 | ) | ||||||
$ | 2.12 | $ | 52.63 | $ | (6.44 | ) | |||||
The potentially dilutive impact of common stock, warrants, restricted stock units, performance-based share units, and stock options were excluded from the computation of weighted average diluted shares outstanding as of December 31, 2014 as inclusion of such items would be anti-dilutive. These amounts are as follows, in millions except for exercise price:
Year Ended December 31 | ||||
2014 | ||||
Anti-Dilutive Shares: | ||||
Number of warrants | 1.3 | |||
Exercise price | $ | 58.80 | ||
Number of performance stock units | 1.0 | |||
Number of stock options | 0.1 | |||
Exercise price | $53.48 - $84.67 | |||
The potentially dilutive impact of common stock, warrants, restricted stock units, performance-based share units, and stock options were immaterial as of December 31, 2016 and 2015.
87
NOTE 19. Fair Value Measurements
Fair Value Hierarchy
The Company uses a three-level fair value hierarchy that categorizes assets and liabilities measured at fair value based on the observability of the inputs utilized in the valuation. The fair value hierarchy gives the highest priority to the quoted prices in active markets for identical assets and liabilities and lowest priority to unobservable inputs.
• | Level 1 – Financial assets and liabilities whose values are based on unadjusted quoted market prices for identical assets and liabilities in an active market that the Company has the ability to access. |
• | Level 2 – Financial assets and liabilities whose values are based on quoted prices in markets that are not active or model inputs that are observable for substantially the full term of the asset or liability. |
• | Level 3 – Financial assets and liabilities whose values are based on prices or valuation techniques that require inputs that are both unobservable and significant to the overall fair value measurement. |
The fair value hierarchy for assets and liabilities measured at fair value on a recurring basis are as follows.
December 31, 2016 | ||||||||||||||||||||
Level 1 | Level 2 | Level 3 | NAV | Total | ||||||||||||||||
(Dollars in Millions) | ||||||||||||||||||||
Asset Category: | ||||||||||||||||||||
Retirement plan assets | $ | 311 | $ | 380 | $ | 11 | $ | 96 | $ | 798 | ||||||||||
Foreign currency instruments | — | 6 | — | — | 6 | |||||||||||||||
Liability Category: | ||||||||||||||||||||
Foreign currency instruments | $ | — | $ | 6 | $ | — | $ | — | $ | 6 | ||||||||||
Interest rate swaps | $ | — | $ | 1 | $ | — | $ | — | $ | 1 | ||||||||||
December 31, 2015 | ||||||||||||||||||||
Level 1 | Level 2 | Level 3 | NAV | Total | ||||||||||||||||
(Dollars in Millions) | ||||||||||||||||||||
Asset Category: | ||||||||||||||||||||
Retirement plan assets | $ | 270 | $ | 377 | $ | 10 | $ | 121 | $ | 778 | ||||||||||
Foreign currency instruments | — | 7 | — | — | 7 | |||||||||||||||
Liability Category: | ||||||||||||||||||||
Foreign currency instruments | $ | — | $ | 1 | $ | — | $ | — | $ | 1 | ||||||||||
Interest rate swaps | $ | — | $ | 1 | $ | — | $ | — | $ | 1 | ||||||||||
Foreign currency instruments and interest rate swaps are valued using industry-standard models that consider various assumptions, including time value, volatility factors, current market and contractual prices for the underlying and non-performance risk. Substantially all of these assumptions are observable in the marketplace throughout the full term of the instrument, can be derived from observable data or are supported by observable levels at which transactions are executed in the marketplace. The carrying amounts of all other non-retirement plan financial instruments approximate their fair values due to their relatively short-term maturities.
Retirement plan assets pertain to a diverse set of securities and investment vehicles held by the Company’s defined benefit pension plans. These assets possess varying fair value measurement attributes such that certain portions are categorized within each level of the fair value hierarchy as based upon the level of observability of the inputs utilized in the valuation of the particular asset. The fair value of securities and investment vehicles reflected as level 1 assets reflects the unadjusted quoted market prices for identical assets in an active market. Retirement plan assets categorized as level 2 have values that are based quoted prices in less active markets or are otherwise derived using generally accepted valuation techniques that that utilize readily observable inputs. Level 3 retirement plan assets represent securities and investment vehicles whose fair value measurement may require valuation techniques that include inputs that are both unobservable and significant to the overall fair value measurement.
88
Retirement Plan Assets
Retirement plan assets consist of the following:
• | Cash and cash equivalents represent assets that are immediately available or are highly liquid and not subject to significant market risk. These assets are comprised of short-term sovereign debt or high credit-quality money market securities held directly by the plan or via a registered investment fund and are categorized as Level 1. Cash and cash equivalent assets denominated in currencies other than the U.S. dollar are reflected in U.S. dollar terms at the exchange rate prevailing at the balance sheet dates. |
• | Registered investment companies are mutual funds that are registered with the Securities and Exchange Commission. Mutual funds may invest in various types of securities or combinations thereof including equities, fixed income securities, and other assets that are subject to varying levels of market risk and are categorized as Level 1. The share prices for mutual funds are published at the close of each business day. |
• | Treasury and government securities consist of debt securities issued by the U.S. and non-U.S. sovereign governments and agencies, thereof. Assets with a high degree of liquidity and frequent trading activity are categorized as Level 1 while others are valued by independent valuation firms that employ standard methodologies associated with valuing fixed-income securities and are categorized as Level 2. |
• | Corporate debt securities consist of fixed income securities issued by corporations. Assets with a high degree of liquidity and frequent trading activity are categorized as Level 1 while others are valued by independent valuation firms that employ standard methodologies associated with valuing fixed-income securities and are categorized as Level 2. |
• | Common trust funds are comprised of shares or units in commingled funds that are not publicly traded. The underlying assets in these funds, including equities and fixed income securities, are generally publicly traded in regulated markets that provide readily available market prices and are categorized as Level 1. Funds for which the underlying assets do not have readily available market prices and are categorized as Level 2. |
• | Liability Driven Investing (“LDI”) is an investment strategy that utilizes interest-rate swaps and other financial derivative instruments intended to hedge the changes in pension liabilities associated with changes in the actuarial discount rate as applied to the plan’s liabilities. The valuation methodology of the financial derivative instruments contained in this category of assets utilizes standard pricing models associated with fixed income derivative instruments and are categorized as Level 2. |
• | Other investments include miscellaneous assets and liabilities and are primarily comprised of pending transactions and collateral settlements and are categorized as Level 2. |
• | Global tactical asset allocation funds (“GTAA”) are common trust funds that are not publicly traded. GTAA investment managers have broad discretion to vary the funds allocation over time across many conventional as well as alternative asset classes in an attempt to exploit short-term mis-pricing among a global set of assets within specific strategy guidelines. The underlying assets in these funds may include equities or fixed-income securities transacted in active markets as well as other assets that have values less readily observable and may require valuation techniques that require inputs that are not readily observable. Investment in these funds may be subject to a specific notice period, one month, prior to the intended transaction date. In addition, transactions in these funds may require longer settlement terms than traditional mutual funds. These assets are valued based on their respective net asset values ("NAV") as a practical expedient to estimate fair value due to the absence of readily available market prices. |
• | Limited partnership is an asset category intended to represent investments in hedge funds of funds (“HFF”). A fund of hedge funds is an investment vehicle that consists of a portfolio invested in multiple hedge funds. Due to the private nature of the partnership investments, pricing inputs are not readily observable. Asset valuations are developed by the general partners that manage the partnerships. Generally, monthly or quarterly notice is required to redeem these funds. Transactions of these funds normally require settlement terms that may exceed 90 days. In addition, liquidation transactions and partial redemptions may be subject to certain hold back provisions. These assets are valued based on their respective NAV as a practical expedient to estimate fair value due to the absence of readily available market prices. |
• | Insurance contracts are reported at cash surrender value and have significant unobservable inputs and are categorized as Level 3. |
89
The fair values of the Company’s U.S. retirement plan assets are as follows:
December 31, 2016 | ||||||||||||||||
Asset Category | Level 1 | Level 2 | NAV | Total | ||||||||||||
(Dollars in Millions) | ||||||||||||||||
Registered investment companies | $ | 180 | $ | — | $ | — | $ | 180 | ||||||||
Common trust funds | — | 296 | — | 296 | ||||||||||||
LDI | — | 53 | — | 53 | ||||||||||||
Limited partnerships | — | — | 76 | 76 | ||||||||||||
Short-term investments | — | 3 | — | 3 | ||||||||||||
Total | $ | 180 | $ | 352 | $ | 76 | $ | 608 | ||||||||
December 31, 2015 | ||||||||||||||||
Asset Category | Level 1 | Level 2 | NAV | Total | ||||||||||||
(Dollars in Millions) | ||||||||||||||||
Registered investment companies | $ | 152 | $ | — | $ | — | $ | 152 | ||||||||
Common trust funds | — | 258 | — | 258 | ||||||||||||
LDI | — | 85 | — | 85 | ||||||||||||
Limited partnerships | — | — | 107 | 107 | ||||||||||||
Short-term investments | — | 2 | — | 2 | ||||||||||||
Total | $ | 152 | $ | 345 | $ | 107 | $ | 604 | ||||||||
The fair value measurements which used significant unobservable inputs are as follows:
Actual Return on Plan Assets | GTAA | Limited Partnerships | Insurance Contracts | |||||||||
(Dollars in Millions) | ||||||||||||
December 31, 2013 | $ | 70 | $ | 247 | $ | 8 | ||||||
Return on assets held at the reporting date | — | 4 | — | |||||||||
Purchases, sales and settlements | (70 | ) | (62 | ) | (8 | ) | ||||||
Transfer to Level 2 | — | (69 | ) | — | ||||||||
December 31, 2014 | $ | — | $ | 120 | $ | — | ||||||
Return on assets held at the reporting date | — | (3 | ) | — | ||||||||
Purchases, sales and settlements | — | (10 | ) | — | ||||||||
December 31, 2015 | $ | — | $ | 107 | $ | — | ||||||
Return on assets held at the reporting date | — | — | — | |||||||||
Purchases, sales and settlements | — | (31 | ) | — | ||||||||
December 31, 2016 | $ | — | $ | 76 | $ | — | ||||||
The transfer from Level 3 to Level 2 in 2014 is due to the increase in the availability of observable inputs in determining the fair value of this investment. The Company's policy is that such transfers occur at the beginning of the reporting period.
90
The fair values of the Company’s Non-U.S. retirement plan assets are as follows:
December 31, 2016 | ||||||||||||||||||||
Asset Category | Level 1 | Level 2 | Level 3 | NAV | Total | |||||||||||||||
(Dollars in Millions) | ||||||||||||||||||||
Registered investment companies | $ | 71 | $ | — | $ | — | $ | — | $ | 71 | ||||||||||
Treasury and government securities | 47 | 23 | — | — | 70 | |||||||||||||||
Cash and cash equivalents | 8 | — | — | — | 8 | |||||||||||||||
Corporate debt securities | 3 | 5 | — | — | 8 | |||||||||||||||
Common trust funds | 2 | — | — | — | 2 | |||||||||||||||
Limited partnerships | — | — | — | 20 | 20 | |||||||||||||||
Insurance contracts | — | — | 11 | — | 11 | |||||||||||||||
Total | $ | 131 | $ | 28 | $ | 11 | $ | 20 | $ | 190 | ||||||||||
December 31, 2015 | ||||||||||||||||||||
Asset Category | Level 1 | Level 2 | Level 3 | NAV | Total | |||||||||||||||
(Dollars in Millions) | ||||||||||||||||||||
Registered investment companies | $ | 84 | $ | — | $ | — | $ | — | $ | 84 | ||||||||||
Treasury and government securities | 24 | 25 | — | — | 49 | |||||||||||||||
Cash and cash equivalents | 4 | — | — | — | 4 | |||||||||||||||
Corporate debt securities | 4 | 5 | — | — | 9 | |||||||||||||||
Common and preferred stock | 2 | — | — | — | 2 | |||||||||||||||
Common trust funds | — | 4 | — | — | 4 | |||||||||||||||
Limited partnerships | — | — | — | 14 | 14 | |||||||||||||||
Insurance contracts | — | — | 10 | — | 10 | |||||||||||||||
Other | — | (2 | ) | — | — | (2 | ) | |||||||||||||
Total | $ | 118 | $ | 32 | $ | 10 | $ | 14 | $ | 174 | ||||||||||
Fair value measurements which used significant unobservable inputs are as follows:
Actual Return on Plan Assets | Insurance Contracts | Limited Partnership | ||||||
(Dollars in Millions) | ||||||||
December 31, 2013 | $ | 185 | $ | 10 | ||||
Return on assets held at the reporting date | (14 | ) | 1 | |||||
Purchases, sales and settlements | (2 | ) | — | |||||
December 31, 2014 | $ | 169 | $ | 11 | ||||
Return on assets held at the reporting date | — | (1 | ) | |||||
Purchases, sales and settlements | — | 4 | ||||||
Divestitures | (159 | ) | — | |||||
December 31, 2015 | $ | 10 | $ | 14 | ||||
Return on assets held at the reporting date | — | 2 | ||||||
Purchases, sales and settlements | 1 | 4 | ||||||
December 31, 2016 | $ | 11 | $ | 20 | ||||
91
Items Measured at Fair Value on a Non-recurring Basis
In addition to items that are measured at fair value on a recurring basis, the Company measures certain assets and liabilities at fair value on a non-recurring basis, which are not included in the table above. As these non-recurring fair value measurements are generally determined using unobservable inputs, these fair value measurements are classified within Level 3 of the fair value hierarchy. As further described in Note 3, "Business Acquisitions", the Company utilized a third party to assist in the fair value determination of the purchase price allocation for the AllGo Acquisition. Management’s allocation of fair values to asset and liabilities was completed through a combination of cost, market and income approaches. These fair value measurements are classified within Level 3 of the fair value hierarchy. As further described in Note 4, "Divestitures", the fair value of the assets and liabilities subject to the Interiors Divestiture was less than the carrying value. As a result, the long-lived assets were reduced to zero and impairment loss of $1 million, $4 million and $190 million was recorded in the years ended December 31, 2016, 2015 and 2014, respectively. As the impairment was determined using other observable inputs, the fair value measurements are classified within Level 2 of the fair value hierarchy.
Fair Value of Debt
The fair value of debt, excluding amounts classified as held for sale, was approximately $389 million and $385 million as of December 31, 2016 and 2015, respectively. Fair value estimates were based on quoted market prices or current rates for the same or similar issues, or on the current rates offered to the Company for debt of the same remaining maturities. Accordingly, the Company's debt is classified as Level 1 "Market Prices," and Level 2 "Other Observable Inputs" in the fair value hierarchy, respectively.
NOTE 20. Financial Instruments
The Company is exposed to various market risks including, but not limited to, changes in foreign currency exchange rates and market interest rates. The Company manages these risks, in part, through the use of derivative financial instruments. The maximum length of time over which the Company hedges the variability in the future cash flows for forecast transactions excluding those forecast transactions related to the payment of variable interest on existing debt is up to eighteen months from the date of the forecast transaction. The maximum length of time over which the Company hedges forecast transactions related to the payment of variable interest on existing debt is the term of the underlying debt. The use of derivative financial instruments creates exposure to credit loss in the event of nonperformance by the counter-party to the derivative financial instruments. The Company limits this exposure by entering into agreements including master netting arrangements directly with a variety of major financial institutions with high credit standards that are expected to fully satisfy their obligations under the contracts. Additionally, the Company’s ability to utilize derivatives to manage risks is dependent on credit and market conditions. The Company presents its derivative positions and any related material collateral under master netting arrangements that provide for the net settlement of contracts, by counterparty, in the event of default or termination. Derivative financial instruments designated and non-designated as hedging instruments are included in the Company’s consolidated balance sheets. There is no cash collateral on any of these derivatives.
Accounting for Derivative Financial Instruments
Derivative financial instruments are recorded as assets or liabilities in the consolidated balance sheets at fair value. The fair values of derivatives used to hedge the Company’s risks fluctuate over time, generally in relation to the fair values or cash flows of the underlying hedged transactions or exposures. The accounting for changes in fair value of a derivative instrument depends on whether it has been designated and qualifies as part of a hedging relationship and, further, on the type of hedging relationship.
At inception, the Company formally designates and documents the financial instrument as a hedge of a specific underlying exposure, as well as the risk management objectives and strategies for undertaking the hedge transaction, including designation of the instrument as a fair value hedge, a cash flow hedge or a hedge of a net investment in a foreign operation. Additionally, at inception and at least quarterly thereafter, the Company formally assesses whether the financial instruments that are used in hedging transactions are effective at offsetting changes in either the fair value or cash flows of the related underlying exposure.
For a designated cash flow hedge, the effective portion of the change in the fair value of the derivative instrument is recorded in AOCI in the consolidated balance sheet. When the underlying hedged transaction is realized, the gain or loss included in AOCI is recorded in earnings and reflected in the consolidated statement of operations on the same line as the gain or loss on the hedged item attributable to the hedged risk. Any ineffective portion of a financial instrument's change in fair value is immediately recognized in operating results. For a designated fair value hedge, both the effective and ineffective portions of the change in the fair value of the derivative instrument are recorded in earnings and reflected in the consolidated statement of operations on the same line as the gain or loss on the hedged item attributable to the hedged risk. For a designated net investment hedge, the effective portion of the change in the fair value of the derivative instrument is recorded as a cumulative translation adjustment in AOCI in the
92
consolidated balance sheet. Cash flows associated with designated hedges are reported in the same category as the underlying hedged item. Derivatives not designated as a hedge are adjusted to fair value through operating results. Cash flows associated with derivatives are reported in Net cash provided from operating activities in the Company’s consolidated statements of cash flows.
Foreign Currency Exchange Rate Risk
Foreign Exchange Risk: The Company’s net cash inflows and outflows exposed to the risk of changes in foreign currency exchange rates arise from the sale of products in countries other than the manufacturing source, foreign currency denominated supplier payments, debt and other payables, subsidiary dividends and investments in subsidiaries. The Company utilizes derivative financial instruments, including forward and option contracts, to protect the Company’s cash flow from changes in exchange rates. Foreign currency exposures are reviewed periodically and any natural offsets are considered prior to entering into a derivative financial instrument. The Company’s current primary hedged foreign currency exposures include the Japanese Yen, Euro, Thai Baht, and Mexican Peso. Where possible, the Company utilizes a strategy of partial coverage for transactions in these currencies.
As of December 31, 2016 and 2015, the Company had derivative instruments that consisted primarily of option and forward contracts to hedge changes in foreign currency exchange rates with notional amounts of approximately $169 million and $147 million, respectively. Fair value estimates of these contracts are based on quoted market prices and other observable inputs. As of December 31, 2016 and December 31, 2015, respectively, approximately $138 million and $114 million of the instruments have been designated as cash flow hedges with the effective portion of the gain or loss reported in the "AOCI" component of Stockholders’ equity in the Company’s consolidated balance sheet. There was no ineffectiveness associated with such derivatives as of December 31, 2016 and 2015, and the fair value of these derivatives was a liability of $6 million and an asset of $2 million, respectively. The difference between the gross amounts recognized and the gross amounts subject to offsetting of these derivatives is not material. The estimated AOCI that is expected to be reclassified into earnings within the next 12 months is $5 million.
During 2015, the Company entered into currency exchange derivatives with a notional amount of $150 million to manage foreign currency exposure on certain non-U.S. denominated foreign entities. These derivatives have been designated as hedges of the Company's net investments in European affiliates with the effective portion of the gain or loss reported in the "Accumulated other comprehensive loss" component of Stockholder's equity in the Company's consolidated balance sheets. There was no ineffectiveness associated with such derivatives as of December 31, 2016 and 2015, and the fair value of these derivatives was an asset of $6 million and $4 million, respectively.
During the year ended December 31, 2014, the Company entered into a foreign currency option contract with a notional value of $2,229 million to manage foreign currency exposure on anticipated KRW denominated proceeds in connection with the Climate Transaction. Approximately $660 million of this option contract was designated as a hedge of the Company's net investment in HVCC with the effective portion of the gain or loss reported in the AOCI component of Stockholders’ equity in the Company’s consolidated balance sheets. The gain or loss from the non-designated portion of this foreign currency option contract is recorded as "Other expense, net" in the Company’s consolidated statement of operations. Final settlement of these hedges occurred during the second quarter of 2015 in connection with the closing of the Climate Transaction. The Company recorded a gain of $3 million for the year ended December 31, 2015, reflecting the change in the fair value of the foreign currency option and forward contracts, which was classified as "Other expense, net" in the Company’s consolidated statements of comprehensive income.
Interest Rate Risk: The Company is subject to interest rate risk principally in relation to variable-rate debt. The Company uses derivative financial instruments to manage exposure to fluctuations in interest rates in connection with its risk management policies. During 2015, the Company entered into interest rate swaps with a notional amount of $150 million that effectively convert designated cash flows associated with underlying interest payments on the Term Facility from a variable interest rate to a fixed interest rate, the maturities of these swaps will not exceed the underlying Term Facility. The instruments have been designated as cash flow hedges with the effective portion of the gain or loss reported in "AOCI" component of Stockholders' equity in the Company's consolidated balance sheets and such gains and losses will be reclassified at the time the underlying hedged transactions are realized. The ineffective portion of these swaps is assessed based on the hypothetical derivative method and is recorded as interest expense in the Company's consolidated statements of comprehensive income. There was no ineffectiveness associated with such derivatives as of December 31, 2016 and 2015, and the fair value was a liability of $1 million.
The interest rate swaps are valued under an income approach using industry-standard models that consider various assumptions, including time value, volatility factors, current market and contractual prices for the underlying and non-performance risk. Substantially all of these assumptions are observable in the marketplace throughout the full term of the instrument, can be derived from observable data or are supported by observable levels at which transactions are executed in the marketplace. Accordingly, the Company's interest rate swaps are classified as Level 2, "Other Observable Inputs" in the fair value hierarchy.
93
Financial Statement Presentation
Gains and losses on derivative financial instruments, which includes both continuing and discontinued operations, for the year ended December 31, 2016 and 2015 are as follows:
Amount of Gain (Loss) | |||||||||||||||||||||||
Recorded (Loss) Income in AOCI, net of tax | Reclassified from AOCI into (Income) Loss | Recorded in (Income) Loss | |||||||||||||||||||||
2016 | 2015 | 2016 | 2015 | 2016 | 2015 | ||||||||||||||||||
(Dollars in Millions) | |||||||||||||||||||||||
Foreign currency risk – Cost of sales: | |||||||||||||||||||||||
Cash flow hedges | $ | (3 | ) | $ | 28 | $ | (3 | ) | $ | (8 | ) | $ | — | $ | — | ||||||||
Net investment hedges | 5 | 5 | — | — | — | — | |||||||||||||||||
Non-designated cash flow hedges | — | — | — | — | (2 | ) | (3 | ) | |||||||||||||||
Interest rate risk - Interest expense, net: | |||||||||||||||||||||||
Interest rate swap | (2 | ) | — | 2 | — | — | — | ||||||||||||||||
Foreign currency risk - Other expense, net: | |||||||||||||||||||||||
KRW option and forward contracts | — | (4 | ) | — | (8 | ) | — | 5 | |||||||||||||||
Non-designated cash flow hedges | — | — | — | — | 2 | 4 | |||||||||||||||||
$ | — | $ | 29 | $ | (1 | ) | $ | (16 | ) | $ | — | $ | 6 | ||||||||||
Commodity Risk
The Company's exposures to market risk from changes in the price of production material are managed primarily through negotiations with suppliers and customers, although there can be no assurance that the Company will recover all such costs. While the Company periodically evaluates derivatives available in the marketplace, currently no such derivatives are utilized to manage or hedge the Company's commodity risks.
Concentrations of Credit Risk
Financial instruments including cash equivalents, derivative contracts, and accounts receivable, expose the Company to counter-party credit risk for non-performance. The Company’s counterparties for cash equivalents and derivative contracts are banks and financial institutions that meet the Company’s requirement of high credit standing. The Company’s counterparties for derivative contracts are substantially investment and commercial banks with significant experience using such derivatives. The Company manages its credit risk through policies requiring minimum credit standing and limiting credit exposure to any one counter-party and through monitoring counter-party credit risks. The Company’s concentration of credit risk related to derivative contracts as of December 31, 2016 and 2015 is not material.
Ford, Mazda and Renault/Nissan are the Company's largest customers and in 2016 accounted for sales of approximately 30%, 17% and 15%, respectively. In 2015 and 2014, Ford accounted for 34% and 41%, respectively, Mazda and Nissan/Renault accounted for 16% and 14% of sales for 2015 and did not individually account for greater than 10% of sales for 2014. The Company's credit risk with any individual customer does not exceed ten percent of total accounts receivable except for Ford and its affiliates represent 16% and 18%, Mazda represent 10% and 10% and Renault/Nissan represent 10% and less than 10% as of December 31, 2016 and 2015, respectively. Management periodically performs credit evaluations of its customers and generally does not require collateral.
94
NOTE 21. Commitments and Contingencies
Litigation and Claims
In 2003, the Local Development Finance Authority of the Charter Township of Van Buren, Michigan (the “Township”) issued approximately $28 million in bonds finally maturing in 2032, the proceeds of which were used at least in part to assist in the development of the Company’s U.S. headquarters located in the Township. During January 2010, the Company and the Township entered into a settlement agreement (the “Settlement Agreement”) that, among other things, reduced the taxable value of the headquarters property to current market value and facilitated certain claims of the Township in the Company’s chapter 11 proceedings. The Settlement Agreement also provided that the Company would negotiate in good faith with the Township in the event that property tax payments was inadequate to permit the Township to meet its payment obligations with respect to the bonds. In September 2013, the Township notified the Company in writing that it is estimating a shortfall in tax revenues of between $25 million and $36 million, which could render it unable to satisfy its payment obligations under the bonds. On May 12, 2015, the Township commenced a proceeding against the Company in the U. S. Bankruptcy Court for the District of Delaware in connection with the foregoing. Upon the Company’s motion to dismiss, the Township dismissed the proceeding before the Delaware Bankruptcy Court and re-commenced the proceeding against the Company in the Michigan Wayne County Circuit Court for the State of Michigan on July 2, 2015. The Township sought damages or, alternatively, declaratory judgment that, among other things, the Company is responsible under the Settlement Agreement for payment of any shortfall in the bond debt service payments. On February 2, 2016 the Wayne County Circuit Court dismissed the Township’s lawsuit without prejudice on the basis that the Township’s claims were not ripe for adjudication and the Township has appealed this decision to the Michigan Court of Appeals. The Company disputes the factual and legal assertions made by the Township and intends to vigorously defend the matter. The Company is not able to estimate the possible loss or range of loss in connection with this matter.
The Company is currently involved in disputes with its former President and Chief Executive Officer, Timothy D. Leuliette. Mr. Leuliette filed an arbitration demand against the Company with the American Arbitration Association, alleging claims relating to the cessation of his employment. The Company subsequently filed a complaint against Mr. Leuliette in the U.S. District Court for the Eastern District of Michigan, seeking to enjoin the arbitration and asserting additional claims. The federal litigation is currently stayed pending a ruling in the arbitration. The Company disputes the factual and legal assertions made by Mr. Leuliette, has asserted counterclaims against him in the arbitration, and, although there can be no assurances, the Company does not currently believe that the resolution of these disputes will have a material adverse impact on its results of operations or financial condition.
In November 2013, the Company and HVCC, jointly filed an Initial Notice of Voluntary Self-Disclosure statement with the U.S. Treasury Department’s Office of Foreign Assets Control (“OFAC”) regarding certain sales of automotive HVAC components by a minority-owned, Chinese joint venture of HVCC into Iran. The Company updated that notice in December 2013, and subsequently filed a voluntary self-disclosure regarding these sales with OFAC in March 2014. In May 2014, the Company voluntarily filed a supplementary self-disclosure identifying additional sales of automotive HVAC components by the Chinese joint venture, as well as similar sales involving an HVCC subsidiary in China, totaling approximately $12 million, and filed a final voluntary-self disclosure with OFAC on October 17, 2014. OFAC is currently reviewing the results of the Company’s investigation. Following that review, OFAC may conclude that the disclosed sales resulted in violations of U.S. economic sanctions laws and warrant the imposition of civil penalties, such as fines, limitations on the Company's ability to export products from the United States, and/or referral for further investigation by the U.S. Department of Justice. Any such fines or restrictions may be material to the Company’s financial results in the period in which they are imposed, but is not able to estimate the possible loss or range of loss in connection with this matter. Additionally, disclosure of this conduct and any fines or other action relating to this conduct could harm the Company’s reputation and have a material adverse effect on our business, operating results and financial condition. The Company cannot predict when OFAC will conclude its own review of our voluntary self-disclosures or whether it may impose any of the potential penalties described above.
The Company's operations in Brazil and Argentina are subject to highly complex labor, tax, customs and other laws. While the Company believes that it is in compliance with such laws, it is periodically engaged in litigation regarding the application of these laws. As of December 31, 2016, the Company maintained accruals of approximately $10 million and $6 million for claims aggregating approximately $65 million and $34 million in Brazil and Argentina, respectively. The amounts accrued represent claims that are deemed probable of loss and are reasonably estimable based on the Company's assessment of the claims and prior experience with similar matters.
While the Company believes its accruals for litigation and claims are adequate, the final amounts required to resolve such matters could differ materially from recorded estimates and the Company's results of operations and cash flows could be materially affected.
95
Product Warranty and Recall
Amounts accrued for product warranty and recall claims are based on management’s best estimates of the amounts that will ultimately be required to settle such items. The Company’s estimates for product warranty and recall obligations are developed with support from its sales, engineering, quality and legal functions and include due consideration of contractual arrangements, past experience, current claims and related information, production changes, industry and regulatory developments and various other considerations. The Company can provide no assurances that it will not experience material claims in the future or that it will not incur significant costs to defend or settle such claims beyond the amounts accrued or beyond what the Company may recover from its suppliers. During the year ended December 31, 2016, the Company recorded $15 million for specific cause actions representing customer actions related to defective supplier parts and related software. The following table provides a reconciliation of changes in the product warranty and recall claims liability:
Year Ended December 31 | |||||||
2016 | 2015 | ||||||
(Dollars in Millions) | |||||||
Beginning balance | $ | 38 | $ | 46 | |||
Accruals for products shipped | 17 | 15 | |||||
Change in estimates | 6 | (1 | ) | ||||
Specific cause actions | 15 | 17 | |||||
Recoverable warranty/recalls | 2 | 5 | |||||
Foreign currency translation | (2 | ) | (2 | ) | |||
Business divestiture | — | (25 | ) | ||||
Settlements | (21 | ) | (17 | ) | |||
Ending balance | $ | 55 | $ | 38 | |||
Guarantees and Commitments
The Company provided a $22 million loan guarantee to YFVIC. The guarantee contains standard non-payment provisions to cover the borrowers in event of non-payment of principal, accrued interest, and other fees, and the loan is expected to be fully paid by September 2019.
As part of the agreements of the Climate Transaction and Interiors Divestiture, the Company continues to provide lease guarantees to divested Climate and Interiors entities. As of December 31, 2016, the Company has approximately $8 million and $6 million outstanding guarantees respectively, related to divested Climate and Interiors entities. These guarantees will generally cease upon expiration of current lease agreements.
In accordance with the Interiors Divestiture, the buyer had the option to request replacement of the existing revolving credit facility with a three year term loan between $5 million and $10 million. Upon closing on December 1, 2016, the buyer exercised the option and entered into a three years term loan for $10 million.
Environmental Matters
The Company is subject to the requirements of federal, state, local and foreign environmental and occupational safety and health laws and regulations and ordinances. These include laws regulating air emissions, water discharge and waste management. The Company is also subject to environmental laws requiring the investigation and cleanup of environmental contamination at properties it presently owns or operates and at third-party disposal or treatment facilities to which these sites send or arranged to send hazardous waste. The Company is aware of contamination at some of its properties. These sites are in various stages of investigation and cleanup. The Company currently is, has been, and in the future may become the subject of formal or informal enforcement actions or procedures.
Costs related to environmental assessments and remediation efforts at operating facilities, previously owned or operated facilities, or other waste site locations are accrued when it is probable that a liability has been incurred and the amount of that liability can be reasonably estimated. Estimated costs are recorded at undiscounted amounts, based on experience and assessments, and are regularly evaluated. The liabilities are recorded in "Other current liabilities" and "Other non-current liabilities" in the consolidated balance sheets. As of December 31, 2016, the Company had recorded a reserve of less than $1 million for environmental matters. However, estimating liabilities for environmental investigation and cleanup is complex and dependent upon a number of factors
96
beyond the Company’s control and which may change dramatically. Accordingly, although the Company believes its reserve is adequate based on current information, the Company cannot provide any assurance that its ultimate environmental investigation and cleanup costs and liabilities will not exceed the amount of its current reserve.
Operating Leases
As of December 31, 2016, the Company had the following minimum rental commitments under non-cancelable operating leases: 2017 — $23 million; 2018 — $20 million; 2019 — $18 million; 2020 — $17 million; 2021 — $13 million; thereafter — $64 million. Rent expense was approximately $35 million, $45 million, and $36 million for the years ended December 31, 2016, 2015 and 2014, respectively.
Other Contingent Matters
Various legal actions, governmental investigations and proceedings and claims are pending or may be instituted or asserted in the future against the Company, including those arising out of alleged defects in the Company’s products; governmental regulations relating to safety; employment-related matters; customer, supplier and other contractual relationships; intellectual property rights; product warranties; product recalls; and environmental matters. Some of the foregoing matters may involve compensatory, punitive or antitrust or other treble damage claims in very large amounts, or demands for recall campaigns, environmental remediation programs, sanctions, or other relief which, if granted, would require very large expenditures. The Company enters into agreements that contain indemnification provisions in the normal course of business for which the risks are considered nominal and impracticable to estimate.
Contingencies are subject to many uncertainties, and the outcome of individual litigated matters is not predictable with assurance. Reserves have been established by the Company for matters discussed in the immediately foregoing paragraph where losses are deemed probable and reasonably estimable. It is possible, however, that some of the matters discussed in the foregoing paragraph could be decided unfavorably to the Company and could require the Company to pay damages or make other expenditures in amounts, or a range of amounts, that cannot be estimated as of December 31, 2016 and that are in excess of established reserves. The Company does not reasonably expect, except as otherwise described herein, based on its analysis, that any adverse outcome from such matters would have a material effect on the Company’s financial condition, results of operations or cash flows, although such an outcome is possible.
NOTE 22. Segment Information
Financial results for the Company's reportable segments have been prepared using a management approach, which is consistent with the basis and manner in which financial information is evaluated by the Company's chief operating decision-maker in allocating resources and in assessing performance. The Company’s chief operating decision maker, the Chief Executive Officer, evaluates the performance of the Company’s segments primarily based on net sales, before elimination of inter-company shipments, Adjusted EBITDA (non-GAAP financial measure) and operating assets. Corporate functions have been reclassified into Electronics.
The accounting policies for the reportable segments are the same as those described in the Note 2 "Summary of Significant Accounting Policies” to the Company’s consolidated financial statements.
The Company’s reportable segments are as follows:
• | Electronics — Electronics segment provides cockpit electronics products, including instrument clusters, information displays, infotainment systems, audio systems, telematics solutions, and head up displays. Electronics accounted for approximately 98%, 95%, and 90% of the Company’s total product sales, excluding intra-product group eliminations, for the years ended December 31, 2016, 2015 and 2014, respectively. |
• | Other — Other includes South Africa climate operations sold on November 1, 2016 and South America climate operations substantially exited during the fourth quarter of 2016. During 2015 and 2014, Other also included the Berlin, Germany operations previously associated with the Interiors business and sold during the fourth quarter of 2015. On December 1, 2015, Visteon completed the Germany Interiors Divestiture with sales of $86 million for the year ended December 31, 2015. Other accounted for approximately 2%, 5%, and 10% of the Company’s total product sales, excluding intra-product group eliminations, for the years ended December 31, 2016, 2015 and 2014, respectively. |
97
Key financial measures reviewed by the Company’s chief operating decision maker are as follows.
Segment Sales
Year Ended December 31 | |||||||||||
2016 | 2015 | 2014 | |||||||||
(Dollars in Millions) | |||||||||||
Electronics | $ | 3,107 | $ | 3,107 | $ | 2,386 | |||||
Other | 54 | 153 | 251 | ||||||||
Eliminations | — | (15 | ) | (51 | ) | ||||||
Total consolidated sales | $ | 3,161 | $ | 3,245 | $ | 2,586 | |||||
Segment Adjusted EBITDA
The Company defines Adjusted EBITDA as net income attributable to the Company adjusted to eliminate the impact of depreciation and amortization, restructuring expense, net interest expense, loss on debt extinguishment, equity in net income of non-consolidated affiliates, loss on divestiture, gain on non-consolidated affiliate transactions, other net expense, provision for income taxes, discontinued operations, net income attributable to non-controlling interests, non-cash stock-based compensation expense, pension settlement gains and other non-operating gains and losses.
Adjusted EBITDA is presented as a supplemental measure of the Company's financial performance that management believes is useful to investors because the excluded items may vary significantly in timing or amounts and/or may obscure trends useful in evaluating and comparing the Company's operating activities across reporting periods. Not all companies use identical calculations and, accordingly, the Company's presentation of Adjusted EBITDA may not be comparable to other similarly titled measures of other companies. Adjusted EBITDA is not a recognized term under GAAP and does not purport to be a substitute for net income as an indicator of operating performance or cash flows from operating activities as a measure of liquidity. Adjusted EBITDA has limitations as an analytical tool and is not intended to be a measure of cash flow available for management's discretionary use, as it does not consider certain cash requirements such as interest payments, tax payments and debt service requirements. In addition, the Company uses Adjusted EBITDA (i) as a factor in incentive compensation decisions, (ii) to evaluate the effectiveness of the Company's business strategies and (iii) the Company's credit agreements use measures similar to Adjusted EBITDA to measure compliance with certain covenants.
Segment Adjusted EBITDA for the years ended December 31, 2016, 2015 and 2014 is summarized below.
Year Ended December 31 | |||||||||||
2016 | 2015 | 2014 | |||||||||
(Dollars in Millions) | |||||||||||
Electronics | $ | 346 | $ | 294 | $ | 171 | |||||
Other | (9 | ) | (12 | ) | 6 | ||||||
Adjusted EBITDA | $ | 337 | $ | 282 | $ | 177 | |||||
98
The reconciliation of Adjusted EBITDA to net income (loss) attributable to Visteon for the years ended December 31, 2016, 2015 and 2014 is as follows:
Year Ended December 31 | |||||||||||
2016 | 2015 | 2014 | |||||||||
(Dollars in Millions) | |||||||||||
Adjusted EBITDA | $ | 337 | $ | 282 | $ | 177 | |||||
Depreciation and amortization | 84 | 85 | 70 | ||||||||
Restructuring expense | 49 | 36 | 54 | ||||||||
Interest expense, net | 12 | 14 | 21 | ||||||||
Equity in net income of non-consolidated affiliates | (2 | ) | (7 | ) | (2 | ) | |||||
Loss on debt extinguishment | — | 5 | 23 | ||||||||
Loss on divestiture | — | 105 | — | ||||||||
Gain on non-consolidated affiliate transactions | — | (62 | ) | (2 | ) | ||||||
Other expense, net | 24 | 25 | 61 | ||||||||
Provision for income taxes | 30 | 27 | 32 | ||||||||
Net loss (income) from discontinued operations, net of tax | 40 | (2,286 | ) | 131 | |||||||
Net income attributable to non-controlling interests | 16 | 44 | 89 | ||||||||
Non-cash, stock-based compensation expense | 8 | 8 | 12 | ||||||||
Pension settlement gain | — | — | (25 | ) | |||||||
Other | 1 | 4 | 8 | ||||||||
Net income (loss) attributable to Visteon Corporation | $ | 75 | $ | 2,284 | $ | (295 | ) | ||||
Segment Total Assets
Total Assets | |||||||
Year Ended December 31 | |||||||
2016 | 2015 | ||||||
(Dollars in Millions) | |||||||
Electronics | $ | 2,370 | $ | 4,649 | |||
Other | 3 | 32 | |||||
Total segment operating assets | $ | 2,373 | $ | 4,681 | |||
Segment Expenditures
Depreciation and Amortization | Capital Expenditures | ||||||||||||||||||||||
Year Ended December 31 | Year Ended December 31 | ||||||||||||||||||||||
2016 | 2015 | 2014 | 2016 | 2015 | 2014 | ||||||||||||||||||
(Dollars in Millions) | (Dollars in Millions) | ||||||||||||||||||||||
Electronics | $ | 84 | $ | 83 | $ | 62 | $ | 74 | $ | 102 | $ | 94 | |||||||||||
Other | — | 2 | 8 | — | 4 | 2 | |||||||||||||||||
Total segment | $ | 84 | $ | 85 | $ | 70 | $ | 74 | $ | 106 | $ | 96 | |||||||||||
99
Financial Information by Geographic Region
Sales (a) | Property and Equipment, net | ||||||||||||||||||
Year Ended December 31 | |||||||||||||||||||
2016 | 2015 | 2014 | 2016 | 2015 | |||||||||||||||
(Dollars in Millions) | |||||||||||||||||||
United States | $ | 822 | $ | 844 | $ | 739 | $ | 12 | $ | 14 | |||||||||
Mexico | 72 | 73 | 43 | 50 | 59 | ||||||||||||||
North America | 894 | 917 | 782 | 62 | 73 | ||||||||||||||
Portugal | 443 | 419 | 470 | 62 | 57 | ||||||||||||||
Slovakia | 288 | 262 | 118 | 29 | 27 | ||||||||||||||
Germany | — | 86 | 115 | 2 | 3 | ||||||||||||||
Tunisia | 151 | 185 | 106 | 12 | 15 | ||||||||||||||
France | 113 | 144 | 90 | 21 | 26 | ||||||||||||||
Other Europe | 49 | 98 | 74 | 6 | 14 | ||||||||||||||
Intra-region eliminations | (31 | ) | (71 | ) | (48 | ) | — | — | |||||||||||
Europe | 1,013 | 1,123 | 925 | 132 | 142 | ||||||||||||||
China | 711 | 688 | 578 | 75 | 69 | ||||||||||||||
Japan | 516 | 498 | 240 | 16 | 11 | ||||||||||||||
India | 66 | 73 | 66 | 26 | 25 | ||||||||||||||
Thailand | 82 | 86 | 56 | 10 | 10 | ||||||||||||||
Korea | 18 | 20 | 23 | 1 | 1 | ||||||||||||||
Intra-region eliminations | (163 | ) | (171 | ) | (76 | ) | — | — | |||||||||||
Asia | 1,230 | 1,194 | 887 | 128 | 116 | ||||||||||||||
South America | 91 | 124 | 182 | 23 | 20 | ||||||||||||||
Inter-region eliminations | (67 | ) | (113 | ) | (190 | ) | — | — | |||||||||||
$ | 3,161 | $ | 3,245 | $ | 2,586 | $ | 345 | $ | 351 | ||||||||||
(a) Company sales based on geographic region where sale originates and not where customer is located. | |||||||||||||||||||
100
NOTE 23. Summary Quarterly Financial Data (Unaudited)
The following table presents summary quarterly financial data:
2016 | 2015 | ||||||||||||||||||||||||||||||
First Quarter | Second Quarter | Third Quarter | Fourth Quarter | First Quarter | Second Quarter | Third Quarter | Fourth Quarter | ||||||||||||||||||||||||
(Dollars in Millions, Except Per Share Amounts) | |||||||||||||||||||||||||||||||
Sales | $ | 802 | $ | 773 | $ | 770 | $ | 816 | $ | 816 | $ | 812 | $ | 808 | $ | 809 | |||||||||||||||
Gross margin | 121 | 109 | 105 | 129 | 112 | 99 | 105 | 114 | |||||||||||||||||||||||
Income (loss) from continuing operations before income taxes | 49 | 48 | 30 | 34 | 33 | 89 | 31 | (84 | ) | ||||||||||||||||||||||
Net income (loss) from continuing operations | 36 | 39 | 25 | 31 | 24 | 65 | 21 | (68 | ) | ||||||||||||||||||||||
Net income (loss) | 23 | 30 | 32 | 6 | 70 | 2,224 | 10 | 24 | |||||||||||||||||||||||
Net income (loss) attributable to Visteon Corporation | $ | 19 | $ | 26 | $ | 28 | $ | 2 | $ | 50 | $ | 2,208 | $ | 5 | $ | 21 | |||||||||||||||
Per Share Data: | |||||||||||||||||||||||||||||||
Basic earnings per share attributable to Visteon Corporation | $ | 0.50 | $ | 0.77 | $ | 0.83 | $ | 0.06 | $ | 1.13 | $ | 50.88 | $ | 0.12 | $ | 0.52 | |||||||||||||||
Diluted earnings per share attributable to Visteon Corporation | $ | 0.49 | $ | 0.76 | $ | 0.81 | $ | 0.06 | $ | 1.10 | $ | 49.73 | $ | 0.12 | $ | 0.52 | |||||||||||||||
For the quarter ended December 31, 2015, net income (loss) from continuing operations and net income (loss) attributable to Visteon Corporation includes income of approximately $11 million and $5 million, respectively, for corrections of overstated liabilities and discontinued operations related to previous quarters in 2015 and 2014.
Net income (loss) and net income (loss) attributable to Visteon Corporation for the quarter ended June 30, 2015 included a gain on the Climate Transaction of $2.3 billion and a gain on sale of non-consolidated affiliates of $62 million. Net income (loss) and net income (loss) attributable to Visteon Corporation for the quarter ended December 31, 2015 included a loss on the Germany Interiors Divestiture of $105 million.
For the quarter ended December 31, 2016, net income attributable to Visteon Corporation includes loss of approximately $19 million from the sale of Company's Interiors operations in Argentina and Brazil, representing the final working capital cash contribution of $10 million and related contractual obligations, representing the completion of the Interiors Divestiture.
101
Item 9. | Changes in and Disagreements With Accountants on Accounting and Financial Disclosure |
None.
Item 9A. | Controls and Procedures |
Disclosure Controls and Procedures
The Company maintains disclosure controls and procedures that are designed to ensure that information required to be disclosed in periodic reports filed with the SEC under the Securities Exchange Act of 1934 is recorded, processed, summarized, and reported within the time periods specified in the SEC’s rules and forms, and that such information is accumulated and communicated to the Company’s management, including its Chief Executive Officer and Chief Financial Officer, as appropriate, to allow timely decisions regarding required disclosure.
At December 31, 2016, an evaluation was performed under the supervision and with the participation of the Company’s management, including its Chief Executive and Financial Officers, of the effectiveness of the design and operation of disclosure controls and procedures. Based on that evaluation, the Chief Executive Officer and the Chief Financial Officer concluded that the Company’s disclosure controls and procedures were effective as of December 31, 2016.
Internal Control over Financial Reporting
Management’s report on internal control over financial reporting is presented in Item 8 “Financial Statements and Supplementary Data” of this Annual Report on Form 10-K along with the attestation report of Ernst & Young LLP, the Company’s independent registered public accounting firm, on the effectiveness of internal control over financial reporting as at December 31, 2016. There were no changes in the Company's internal control over financial reporting during the year ended December 31, 2016 that have materially affected, or are reasonably likely to materially affect, the Company's internal control over financial reporting.
Part III
Item 10. | Directors, Executive Officers and Corporate Governance |
Except as set forth herein, the information required by Item 10 regarding its directors is incorporated by reference from the information under the captions “Item 1. Election of Directors,” “Corporate Governance - Board Committees,” "2017 Stockholder Proposals and Nominations" and “Section 16(a) Beneficial Ownership Reporting Compliance” in its 2016 Proxy Statement. The information required by Item 10 regarding its executive officers appears as Item 4A under Part I of this Report.
The Company has a code of ethics, as such phrase is defined in Item 406 of Regulation S-K, that applies to all directors, officers and employees of the Company and its subsidiaries, including the Chief Executive Officer, the Chief Financial Officer and the Chief Accounting Officer. The code, entitled “Ethics and Integrity Policy,” is available on the Company's website at www.visteon.com.
Item 11. | Executive Compensation |
The information required by Item 11 is incorporated by reference from the information under the captions “Compensation Committee Report,” “Executive Compensation” and “Director Compensation” in its 2017 Proxy Statement.
102
Item 12. | Security Ownership of Certain Beneficial Owners and Management and Related Stockholder Matters |
Except as set forth herein, the information required by Item 12 is incorporated by reference from the information under the caption “Stock Ownership” in its 2017 Proxy Statement.
The following table summarizes information as of December 31, 2016 relating to its equity compensation plans pursuant to which grants of stock options, stock appreciation rights, stock rights, restricted stock, restricted stock units and other rights to acquire shares of its common stock may be made from time to time.
Plan Category | Number of Securities to be Issued Upon Exercise of Outstanding Options, Warrants and Rights (a)(1) | Weighted-Average Exercise Price of Outstanding Options, Warrants and Rights (b)(1) | Number of Securities Remaining Available for Future Issuance Under Equity Compensation Plans (excluding securities reflected in column (a)) (c)(2) | |||||||
Equity compensation plans approved by security holders | 718,853 | $ | 66.63 | 1,823,912 | ||||||
Equity compensation plans not approved by security holders | — | $ | — | — | ||||||
Total | 718,853 | $ | 66.63 | 1,823,912 | ||||||
(1) | Comprised of stock options, stock appreciation rights, which may be settled in stock or cash at the election of the Company, and outstanding restricted stock and performance stock units, which may be settled in stock or cash at the election of the Company without further payment by the holder, granted pursuant to the Visteon Corporation 2010 Incentive Plan. The weighted-average exercise price of outstanding options, warrants and rights does not take into account restricted stock or performance stock units that will be settled without any further payment by the holder. |
(2) | Excludes an indefinite number of stock units that may be awarded under the Visteon Corporation Non-Employee Director Stock Unit Plan, which units may be settled in cash or shares of the Company’s common stock. Such plan provides for an annual, automatic grant of stock units worth $105,000 to each non-employee director of the Company. There is no maximum number of securities that may be issued under this Plan; however, the Plan will terminate on December 15, 2020 unless earlier terminated by the Board of Directors |
Item 13. | Certain Relationships and Related Transactions, and Director Independence |
The information required by Item 13 is incorporated by reference from the information under the captions “Corporate Governance - Director Independence” and “Transactions with Related Persons” in its 2017 Proxy Statement.
Item 14. | Principal Accountant Fees and Services |
The information required by Item 14 is incorporated by reference from the information under the captions “Audit Fees” and “Audit Committee Pre-Approval Process and Policies” in its 2017 Proxy Statement.
103
Part IV
Item 15. | Exhibits and Financial Statement Schedules |
(a) | The following documents are filed as part of this report: |
1. | Financial Statements |
See “Index to Consolidated Financial Statements” in Part II, Item 8 hereof.
2. | Financial Statement Schedules |
Schedule II — Valuation and Qualifying Accounts
All other financial statement schedules are omitted because they are not required or applicable under instructions contained in Regulation S-X or because the information called for is shown in the financial statements and notes thereto.
3. Exhibits
The exhibits listed on the "Exhibit Index" on pages 108-111 hereof are filed with this report or incorporated by reference as set forth therein.
104
VISTEON CORPORATION AND SUBSIDIARIES
SCHEDULE II — VALUATION AND QUALIFYING ACCOUNTS
Balance at Beginning of Period | (Benefits)/ Charges to Income | Deductions(a) | Other(b) | Balance at End of Period | |||||||||||||||
(Dollars in Millions) | |||||||||||||||||||
Year Ended December 31, 2016: | |||||||||||||||||||
Allowance for doubtful accounts | $ | 14 | $ | 2 | $ | (6 | ) | $ | — | $ | 10 | ||||||||
Valuation allowance for deferred taxes | 1,498 | 25 | — | 9 | 1,532 | ||||||||||||||
Year Ended December 31, 2015: | |||||||||||||||||||
Allowance for doubtful accounts | $ | 15 | $ | 4 | $ | (3 | ) | $ | (2 | ) | $ | 14 | |||||||
Valuation allowance for deferred taxes | 1,687 | (53 | ) | — | (136 | ) | 1,498 | ||||||||||||
Year Ended December 31, 2014: | |||||||||||||||||||
Allowance for doubtful accounts | $ | 7 | $ | 1 | $ | — | $ | 7 | $ | 15 | |||||||||
Valuation allowance for deferred taxes | 1,710 | (8 | ) | — | (15 | ) | 1,687 | ||||||||||||
____________
(a) | Deductions represent uncollectible accounts charged off. |
(b) | Doubtful accounts - represents discontinued operations activity and divestitures. |
(c) | Deferred taxes valuation allowance - represents adjustments recorded through other comprehensive income, exchange, expiration of tax attribute carryforwards, valuation allowance charges allocated to discontinued operations, and various tax return true-up adjustments, all of which impact deferred taxes and the related valuation allowances. In 2016, the $9 million overall increase in the valuation allowance for deferred taxes is comprised of $10 million related to other comprehensive income and $23 million for various tax return true-up adjustments and other items. These increases were partially offset by $13 million related to exchange and $11 million related to valuation allowance benefits allocated to discontinued operations. In 2015, the $136 million overall reduction in the valuation allowance for deferred taxes is comprised of $72 million related to valuation allowance benefits allocated to discontinued operations, $46 million related to exchange, and $31 million related to other comprehensive income. These decreases were partially offset by $13 million increases in the valuation allowance for various tax return true-up adjustments and other items. |
105
Signatures
Pursuant to the requirements of Section 13 of the Securities Exchange Act of 1934, Visteon Corporation has duly caused this Report to be signed on its behalf by the undersigned, thereunto duly authorized.
VISTEON CORPORATION | ||
By: | /s/ Stephanie S. Marianos | |
Stephanie S. Marianos | ||
Vice President and Chief Accounting Officer | ||
Date: February 23, 2017
106
Signature | Title | |
/s/ SACHIN LAWANDE | Director, President and Chief Executive Officer | |
Sachin Lawande | (Principal Executive Officer) | |
/s/ CHRISTIAN A. GARCIA | Executive Vice President and Chief Financial Officer | |
Christian A. Garcia | (Principal Financial Officer) | |
/s/ STEPHANIE S. MARIANOS | Vice President and Chief Accounting Officer | |
Stephanie S. Marianos | (Principal Accounting Officer) | |
/s/ JAMES J. BARRESE* | Director | |
James J. Barrese | ||
/s/ NAOMI M. BERGMAN* | Director | |
Naomi M. Bergman | ||
/s/ JEFFREY D. JONES* | Director | |
Jeffrey D. Jones | ||
/s/ JOANNE M. MAGUIRE* | Director | |
Joanne M. Maguire | ||
/s/ ROBERT MANZO* | Director | |
Robert Manzo | ||
/s/ FRANCIS M. SCRICCO* | Director | |
Francis M. Scricco | ||
/s/ DAVID L. TREADWELL* | Director | |
David L. Treadwell | ||
/s/ HARRY J. WILSON* | Director | |
Harry J. Wilson | ||
/s/ ROUZBEH YASSINI-FARD* | Director | |
Rouzbeh Yassini-Fard | ||
*By: | /s/ BRETT PYNNONEN | |
Brett Pynnonen | ||
Attorney-in-Fact | ||
107
Exhibit Index
Exhibit No. | Description | |
2.1 | Fifth Amended Joint Plan of Reorganization, filed August 31, 2010 (incorporated by reference to Exhibit 2.1 to the Current Report on Form 8-K of Visteon Corporation filed on September 7, 2010 (File No. 001-15827)). | |
2.2 | Fourth Amended Disclosure Statement, filed June 30, 2010 (incorporated by reference to Exhibit 2.2 to the Current Report on Form 8-K of Visteon Corporation filed on September 7, 2010 (File No. 001-15827)). | |
2.3 | Master Purchase Agreement, dated as of May 1, 2014, by and among Visteon Corporation, VIHI, LLC and Promontoria Holding 103 B.V. (incorporated by reference to Exhibit 2.1 to the Current Report on Form 8-K of Visteon Corporation filed on May 7, 2014). *** | |
2.4 | Share Purchase Agreement, dated as of December 17, 2014, by and among Visteon Corporation, VIHI, LLC, Hahn & Co. Auto Holdings Co., Ltd and Hankook Tire Co., Ltd. (incorporated by reference to Exhibit 2.1 to the Current Report on Form 8-K of Visteon Corporation filed on December 22, 2014).*** | |
3.1 | Second Amended and Restated Certificate of Incorporation of Visteon Corporation (incorporated by reference to Exhibit 3.1 to the Registration Statement on Form 8-A of Visteon Corporation filed on September 30, 2010 (File No. 000-54138)). | |
3.2 | Amended and Restated Bylaws of Visteon Corporation, as amended through June 9, 2016 (incorporated by reference to Exhibit 3.2.a to the Current Report on Form 8-K of Visteon Corporation filed on June 10, 2016). | |
4.1 | Warrant Agreement, dated as of October 1, 2010, by and between Visteon Corporation and Mellon Investor Services LLC (incorporated by reference to Exhibit 10.1 to the Registration Statement on Form 8-A of Visteon Corporation filed on September 30, 2010 (File No. 000-54138)). | |
4.2 | Warrant Agreement, dated as of October 1, 2010, by and between Visteon Corporation and Mellon Investor Services LLC (incorporated by reference to Exhibit 10.2 to the Registration Statement on Form 8-A of Visteon Corporation filed on September 30, 2010 (File No. 000-54138)). | |
4.3 | Form of Common Stock Certificate of Visteon Corporation (incorporated by reference to Exhibit 4.4 to the Current Report on Form 8-K of Visteon Corporation filed on October 1, 2010 (File No. 001-15827)). | |
4.4 | Indenture, dated as of April 6, 2011, among Visteon Corporation, the guarantors party thereto and The Bank of New York Mellon Trust Company, N.A., as trustee, including the Form of 6.75% Senior Note due 2019 (incorporated by reference to Exhibit 4.1 to the Current Report on Form 8-K of Visteon Corporation filed on April 7, 2011 (File No. 001-15827)). | |
4.5 | Indenture, dated as of December 20, 2011, by and between Visteon Corporation and The Bank of New York Mellon Trust Company, N.A., as trustee (incorporated by reference to Exhibit 4.04 to the Registration Statement on Form S-3 of Visteon Corporation filed on December 20, 2011 (File No. 333-178639)). | |
10.1 | Employment Agreement, dated June 8, 2015, between Visteon Corporation and Sachin Lawande (incorporated by reference to Exhibit 10.1 to the Current Report on Form 8-K of Visteon Corporation filed on June 10, 2015).* | |
10.2 | Purchase Agreement, dated as of January 12, 2014, by and between Johnson Controls, Inc. and Visteon Corporation (incorporated by reference to Exhibit 10.1 to the Current Report on Form 8-K of Visteon Corporation filed on January 15, 2014). | |
10.3 | Credit Agreement, dated as of April 9, 2014, among Visteon Corporation, each lender from time to time party thereto, each L/C Issuer from time to time party thereto and Citibank, N.A. as Administrative Agent (incorporated by reference to Exhibit 10.1 to the Current Report on Form 8-K of Visteon Corporation filed on April 14, 2014). | |
10.3.1 | Amendment No. 1, dated as of March 25, 2015, to Credit Agreement, dated as of April 9, 2014, by and among Visteon Corporation, each lender from time to time party thereto and Citibank, N.A., as administrative agent (incorporated by reference to Exhibit 10.1 to the Current Report on Form 8-K of Visteon Corporation filed on March 27, 2015). | |
10.4 | Visteon Corporation 2010 Incentive Plan, as amended as of June 11, 2015 (incorporated by reference to Appendix B to the Definitive Proxy Statement on Schedule 14A of Visteon Corporation filed on May 4, 2015).* | |
10.4.1 | Form of Performance Stock Unit Grant Agreement (2014) under the Visteon Corporation 2010 Incentive Plan (incorporated by reference to Exhibit 10.4.1 to the Annual Report on Form 10-K of Visteon Corporation filed on February 25, 2016).* | |
108
Exhibit No. | Description | |
10.4.2 | Form of Restricted Stock Unit Grant Agreement (2014) under the Visteon Corporation 2010 Incentive Plan (incorporated by reference to Exhibit 10.4.2 to the Annual Report on Form 10-K of Visteon Corporation filed on February 25, 2016).* | |
10.4.3 | Form of Terms and Conditions of Nonqualified Stock Options (2015) under the Visteon Corporation 2010 Incentive Plan (incorporated by reference to Exhibit 10.4.3 to the Annual Report on Form 10-K of Visteon Corporation filed on February 25, 2016).* | |
10.4.4 | Form of Performance Stock Unit Grant Agreement (2015) under the Visteon Corporation 2010 Incentive Plan (incorporated by reference to Exhibit 10.4.4 to the Annual Report on Form 10-K of Visteon Corporation filed on February 25, 2016).* | |
10.4.5 | Form of Restricted Stock Unit Grant Agreement (2015) under the Visteon Corporation 2010 Incentive Plan (incorporated by reference to Exhibit 10.4.5 to the Annual Report on Form 10-K of Visteon Corporation filed on February 25, 2016).* | |
10.4.6 | Restricted Stock Unit Grant Agreement for Sachin Lawande under the Visteon Corporation 2010 Incentive Plan (incorporated by reference to Exhibit 10.4.6 to the Annual Report on Form 10-K of Visteon Corporation filed on February 25, 2016).* | |
10.4.7 | Restricted Stock Unit Grant Agreement for Sachin Lawande under the Visteon Corporation 2010 Incentive Plan (incorporated by reference to Exhibit 10.4.7 to the Annual Report on Form 10-K of Visteon Corporation filed on February 25, 2016).* | |
10.4.8 | Performance Stock Unit Grant Agreement for Sachin Lawande under the Visteon Corporation 2010 Incentive Plan (incorporated by reference to Exhibit 10.4.8 to the Annual Report on Form 10-K of Visteon Corporation filed on February 25, 2016).* | |
10.4.9 | Restricted Stock Unit Grant Agreement for Timothy D. Leuliette under the Visteon Corporation 2010 Incentive Plan (incorporated by reference to Exhibit 10.3 to the Current Report on Form 8-K of Visteon Corporation filed on October 2, 2012).* | |
10.4.10 | Performance Stock Unit Grant Agreement for Timothy D. Leuliette under the Visteon Corporation 2010 Incentive Plan (incorporated by reference to Exhibit 10.4 to the Current Report on Form 8-K of Visteon Corporation filed on October 2, 2012).* | |
10.4.11 | Form of executive Performance Stock Unit Grant Agreement (incorporated by reference to Exhibit 10.3 to the Current Report on Form 8-K of Visteon Corporation filed on October 31, 2012).* | |
10.4.12 | Form of executive Restricted Stock Unit Grant Agreement (incorporated by reference to Exhibit 10.4 to the Current Report on Form 8-K of Visteon Corporation filed on October 31, 2012).* | |
10.4.13 | Restricted Stock Unit Grant Agreement between Visteon Corporation and Francis M. Scricco, Chairman (incorporated by reference to Exhibit 10.4.13 to the Annual Report on Form 10-K of Visteon Corporation filed on February 25, 2016).* | |
10.5 | Visteon Corporation Amended and Restated Deferred Compensation Plan for Non-Employee Directors (incorporated by reference to Exhibit 10.11 to the Registration Statement on Form S-1 of Visteon Corporation filed on October 22, 2010 (File No. 333-107104)).* | |
10.6 | Visteon Corporation 2010 Supplemental Executive Retirement Plan, as amended and restated (incorporated by reference to Exhibit 10.1 to the Quarterly Report on Form 10-Q of Visteon Corporation filed on November 3, 2011 (File No. 001-15827)).* | |
10.6.1 | Amendment, dated as of September 13, 2012, to the Visteon Corporation 2010 Supplemental Executive Retirement Plan (incorporated by reference to Exhibit 10.1 to the Current Report on Form 8-K of Visteon Corporation filed on September 18, 2012).* | |
10.7 | Visteon Corporation 2011 Savings Parity Plan (incorporated by reference to Exhibit 10.2 to the Quarterly Report on Form 10-Q of Visteon Corporation filed on November 3, 2011 (File No. 001-15827)).* | |
10.7.1 | Amendment, dated as of September 13, 2012, to the Visteon Corporation 2011 Savings Parity Plan, as amended through September 13, 2012 (incorporated by reference to Exhibit 10.2 to the Current Report on Form 8-K of Visteon Corporation filed on September 18, 2012).* | |
10.8 | 2010 Visteon Executive Severance Plan, as amended and restated as of October 18, 2012 (incorporated by reference to Exhibit 10.1 to the Current Report on Form 8-K of Visteon Corporation filed on October 31, 2012).* | |
10.9 | Visteon Corporation Non-Employee Director Stock Unit Plan (incorporated by reference to Exhibit 10.15 to Amendment No. 2 to the Registration Statement on Form S-1 of Visteon Corporation filed on December 22, 2010 (File No. 333-170104)).* | |
109
Exhibit No. | Description | |
10.10 | Employment Agreement by and between Timothy D. Leuliette and Visteon Corporation, dated as of September 30, 2012 (incorporated by reference to Exhibit 10.1 to the Current Report on Form 8-K of Visteon Corporation filed on October 2, 2012).* | |
10.10.1 | Amendment to Employment Agreement, dated June 12, 2014, between Visteon Corporation and Timothy D. Leuliette (incorporated by reference to Exhibit 10.1 to the Current Report on Form 8-K of Visteon Corporation filed on June 16, 2014).* | |
10.11 | Change in Control Agreement by and between Timothy D. Leuliette and Visteon Corporation, dated as of September 30, 2012 (incorporated by reference to Exhibit 10.2 to the Current Report on Form 8-K of Visteon Corporation filed on October 2, 2012).* | |
10.12 | Form of Change in Control Agreement between Visteon Corporation and executive officers of Visteon Corporation (incorporated by reference to Exhibit 10.2 to the Current Report on Form 8-K of Visteon Corporation filed on October 31, 2012).* | |
10.12.1 | Schedule identifying substantially identical agreements to Officer Change in Control Agreement constituting Exhibit 10.12 hereto entered into by Visteon Corporation with Messrs. Stafeil, Robertson and Ziparo.* | |
10.13 | Separation Agreement, dated June 28, 2015, between Visteon Corporation and Martin T. Thall (incorporated by reference to Exhibit 10.1 to the Current Report on Form 8-K of Visteon Corporation filed on June 30, 2015).* | |
10.13.1 | Separation Agreement, dated March 31, 2016 between Visteon and Jeff Stafeil (incorporated by reference to Exhibit 10.1 of the Quarterly Report on Form 10-Q of Visteon Corporation filed on April 28, 2016)* | |
10.13.2 | Separation Agreement, dated March 31, 2016 between Visteon and Peter Ziparo (incorporated by reference to Exhibit 10.2 of the Quarterly Report on Form 10-Q of Visteon Corporation filed on April 28, 2016)* | |
10.14 | Master Confirmation, dated as of June 16, 2015, between Visteon Corporation and Goldman, Sachs & Co. (incorporated by reference to Exhibit 10.1 to the Current Report on Form 8-K of Visteon Corporation filed on June 18, 2015). | |
10.14.1 | Supplemental Confirmation, dated June 16, 2015, between Visteon Corporation and Goldman, Sachs & Co. (incorporated by reference to Exhibit 10.2 to the Current Report on Form 8-K of Visteon Corporation filed on June 18, 2015). | |
10.14.2 | Amendment, dated as of June 18, 2015, between Visteon Corporation and Goldman, Sachs & Co. (incorporated by reference to Exhibit 10.3 to the Current Report on Form 8-K of Visteon Corporation filed on June 18, 2015). | |
10.14.3 | Master Confirmation, dated as of March 1, 2016, between Visteon Corporation and Citigroup Global Markets, Inc. (incorporated by reference to Exhibit 10.1 to the Current Report on Form 8-K of Visteon Corporation filed on March 2, 2016). | |
10.14.4 | Supplemental Confirmation, dated March 1, 2016, between Visteon Corporation and Citigroup Global Markets, Inc. (incorporated by reference to Exhibit 10.2 to the Current Report on Form 8-K of Visteon Corporation filed on March 2, 2016). | |
12.1 | Statement re: Computation of Ratios. | |
14.1 | Visteon Corporation - Ethics and Integrity Policy (code of business conduct and ethics) (incorporated by reference to Exhibit 14.1 to the Quarterly Report on Form 10-Q of Visteon dated July 30, 2008). | |
21.1 | Subsidiaries of Visteon Corporation. | |
23.1 | Consent of Independent Registered Public Accounting Firm, Ernst & Young LLP. | |
24.1 | Powers of Attorney relating to execution of this Annual Report on Form 10-K. | |
31.1 | Rule 13a-14(a) Certification of Chief Executive Officer dated February 23, 2017. | |
31.2 | Rule 13a-14(a) Certification of Chief Financial Officer dated February 23, 2017. | |
32.1 | Section 1350 Certification of Chief Executive Officer dated February 23, 2017. | |
32.2 | Section 1350 Certification of Chief Financial Officer dated February 23, 2017. | |
101.INS | XBRL Instance Document.** | |
101.SCH | XBRL Taxonomy Extension Schema Document.** | |
101.CAL | XBRL Taxonomy Extension Calculation Linkbase Document.** | |
101.LAB | XBRL Taxonomy Extension Label Linkbase Document.** | |
110
Exhibit No. | Description | |
101.PRE | XBRL Taxonomy Extension Presentation Linkbase Document.** | |
101.DEF | XBRL Taxonomy Extension Definition Linkbase Document.** | |
* | Indicates that exhibit is a management contract or compensatory plan or arrangement. |
** Pursuant to Rule 406T of Regulation S-T, the Interactive Data Files as Exhibit 101 hereto are deemed not filed or part of a registration
statement or prospectus for purposes of Sections 11 or 12 of the Securities Act of 1933, as amended, are deemed not filed for purposes
of Section 18 of the Securities and Exchange Act of 1934, as amended, and otherwise are not subject to liability under those sections.
*** Schedules and exhibits omitted pursuant to Item 601(b)(2) of Regulation S-K. Registrant agrees to furnish supplementally a copy of
any such schedules or exhibits to the Securities and Exchange Commission upon request.
In lieu of filing certain instruments with respect to long-term debt of the kind described in Item 601(b)(4) of Regulation S-K, Visteon agrees to furnish a copy of such instruments to the Securities and Exchange Commission upon request.
111