Attached files
| file | filename |
|---|---|
| 8-K - 8-K - CENVEO, INC | a8-kq42016earningsrelease.htm |

News Release
Cenveo Reports Fourth Quarter and Full Year 2016 Results
Announces Two-Year, $50 Million Profitability Improvement Plan
Redeeming Remaining 11.5% Notes
STAMFORD, CT – (February 22, 2017) - Cenveo, Inc. (NYSE: CVO) reported financial results for the fourth quarter and full year ended December 31, 2016. The reported results for all periods presented exclude the operating results of the Company’s packaging operating segment and its top-sheet lithographic print operation ("Packaging Business"), which have been classified in the Company’s consolidated financial statements as discontinued operations. Additionally, the comparative results discussed below were meaningfully impacted by a 13 week fiscal fourth quarter and 52 week fiscal year in 2016, as compared to a 14 week fiscal fourth quarter and 53 week fiscal year in 2015.
Fourth Quarter 2016 vs. Fourth Quarter 2015 Overview
• | Net sales of $417.2 million compared to $479.0 million. |
• | Net loss of $0.2 million compared to a net loss of $17.5 million. |
• | Adjusted EBITDA of $32.5 million compared to $44.1 million. |
• | Cash flow provided by operating activities of continuing operations of $36.0 million compared to $14.7 million. |
Full Year 2016 vs. Full Year 2015 Overview
• | Net sales of $1.66 billion compared to $1.74 billion. |
• | Net income of $67.9 million compared to a net loss of $30.9 million. |
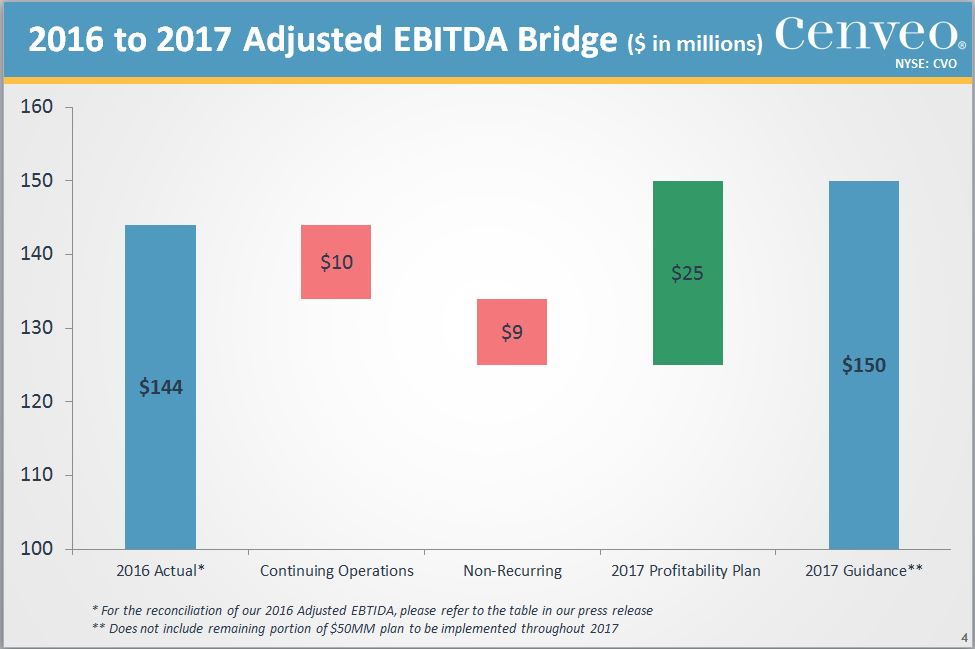
• | Adjusted EBITDA of $143.9 million compared to $158.0 million. |
• | Cash flow provided by operating activities of continuing operations of $49.4 million compared to $16.2 million. |
1
Management Commentary
“Despite most of our businesses performing to our expectation, our fourth quarter results were negatively impacted by significant sales volume declines and increased price pressures within our office product envelope and related wholesale envelope product lines,” said Robert G. Burton, Sr., Chairman and CEO of Cenveo. “This was driven by measures undertaken by our customers in response to a regulatory decision mid-way through 2016. This trend accelerated throughout the fourth quarter as we saw sales in the office products business decline more than 20% from the same period in 2015.
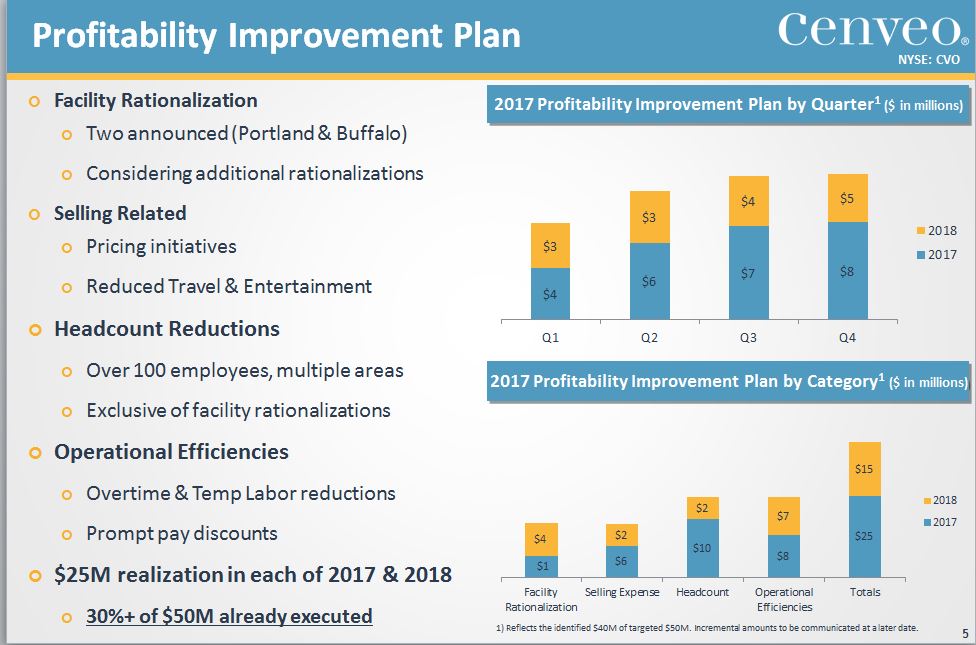
“As a result of these substantial changes in the marketplace, we have taken significant action to bring our cost structure in line with our ongoing revenue base. Late in the fourth quarter of 2016, we initiated a two-year, company-wide profitability improvement plan which we expect will yield $50 million of combined cost savings and margin improvement, $25 million of which we expect to realize in 2017. This program is designed to reduce our fixed cost infrastructure, lower SG&A costs, reduce back office headcount and further streamline our geographic footprint by bringing multiple products under one roof.”
Financial Results
Net sales in the fourth quarter of 2016 were $417.2 million compared to $479.0 million in the same period last year, a 12.9% decline. Net sales were $1.66 billion for the full year 2016 compared to $1.74 billion for the full year 2015, a 4.7% decline. The sales declines were primarily driven by: (i) lower sales in the envelope segment, primarily due to lower demand in office product and wholesale envelope product lines due to cost savings and inventory rationalization efforts by those customers, offset by higher sales in the direct mail envelope product line; (ii) lower sales as a result of one less week in the fourth quarter of 2016 versus 2015; and (iii) lower sales in the label segment primarily due to the decision to exit the coating operation, which was completed in the second quarter of 2016.
2
Operating income in the fourth quarter declined 33.2% to $16.6 million, compared to $24.8 million in the same period last year. For the full year, operating income declined 9.3% to $76.0 million from $83.8 million in 2015. The decrease was primarily due to lower gross profit due to lower office product envelope customer demand, continued pricing pressures associated with print related products, and the impact of the decision to exit the coating operation, which were partially offset by lower selling, general and administrative expenses. Non-GAAP operating income in the fourth quarter of 2016 was $21.3 million compared to non-GAAP operating income of $27.6 million for the same period last year. Non-GAAP operating income was $94.3 million for the full year 2016 compared to $105.1 million in 2015. A reconciliation of all non-GAAP figures are reported in the tables below.
Loss from continuing operations during the fourth quarter of 2016 was $1.8 million, or $(0.21) per diluted share, compared to a loss of $4.4 million, or $(0.51) per diluted share, in the fourth quarter of 2015. For the full year 2016, income from continuing operations was $70.8 million, or $7.63 per diluted share, compared to a loss of $19.5 million, or $(2.30) per diluted share, in 2015. The reduced loss in the fourth quarter of 2016 was primarily driven by income tax expense recognized during 2015 in conjunction with the sale of the Packaging Business. For the full year, the significant increase was primarily driven by gains on the early extinguishment of debt of $82.5 million, partially offset by the aforementioned declines in customer demand. Non-GAAP income from continuing operations in the fourth quarter of 2016 was $0.3 million, or $0.03 per diluted share, compared to income of $5.7 million, or $0.52 per diluted share, in the same period last year. Non-GAAP income from continuing operations for the full year 2016 was $7.8 million, or $0.82 per diluted share, compared to income of $10.7 million, or $0.97 per diluted share, in 2015.
Net loss in the fourth quarter of 2016 was $0.2 million compared to a net loss of $17.5 million for the same period last year. Net income for the full year of 2016 was $67.9 million, compared to a net loss of $30.9 million in 2015.
3
Adjusted EBITDA was $32.5 million in the fourth quarter of 2016 compared to $44.1 million for the same period last year. For the full year 2016, Adjusted EBITDA was $143.9 million compared to $158.0 million in 2015.
During the fourth quarter 2016, cash flow provided by operating activities of continuing operations was $36.0 million compared to $14.7 million for the same period last year. For the full year 2016, cash flow provided by operating activities of continuing operations was $49.4 million compared to $16.2 million in 2015. The improvement was primarily due to changes in working capital, particularly the timing of sales and collections from customers and the timing of payments to vendors, as well as the success of various inventory management programs.
At December 31, 2016, cash and cash equivalents totaled $5.5 million, compared to $7.8 million at January 2, 2016. Total principal debt outstanding declined 14.6% to $1.05 billion from $1.23 billion at January 2, 2016. The Company also has announced and is in the process of redeeming the remaining outstanding principal balance of its 11.5% notes, and anticipates this transaction will be completed on February 27, 2017. Additionally, the Company expects the remaining $5.5 million principal balance of its 7% convertible notes will be retired prior to or at maturity in May 2017 using cash flow from operations or availability under its ABL facility.
2017 Outlook
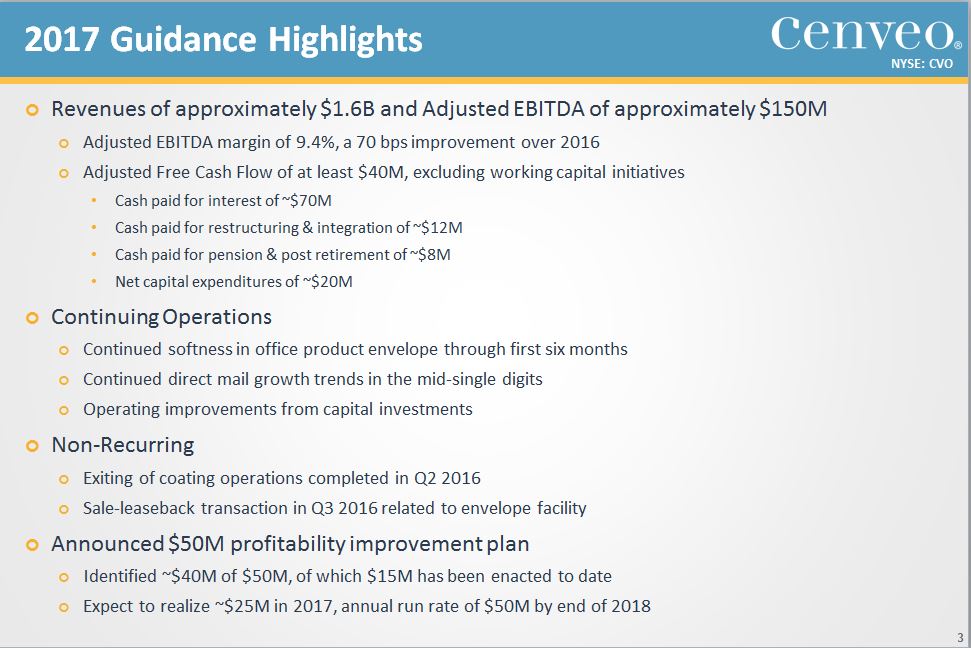
Burton, Sr. continued: "As all of our focus is now on 2017, we are looking to follow up our 2016 balance sheet improvements with significant operational improvements. As of today, we have identified approximately $40 million of our two-year $50 million profitability improvement plan and are evaluating our options to achieve at least the additional $10 million of cost savings and profitability initiatives. Of the targeted $50 million of combined cost savings and margin improvements, we have already implemented over 30% and expect to see the full benefits of the plan by the end of 2018.
4
"Taking into consideration the timing of the profitability improvement plan, anticipated continued softness through the first half of 2017 within our office product and wholesale envelope product lines, and other current marketplace dynamics, we are issuing initial 2017 guidance for net sales of approximately $1.6 billion and Adjusted EBITDA of approximately $150 million. We also believe that successful implementation of our profitability improvement plan will position us to achieve an annualized run rate of approximately $180 million in Adjusted EBITDA by the end of 2018."
Certain components of the guidance provided above are presented on a non-GAAP basis only, without accompanying reconciliation to directly comparable GAAP information because the items that impact the preparation of a reconciliation could not be reasonably predicted. Accordingly, a reconciliation could not be accomplished without “unreasonable efforts.” In particular, the Company does not have access to certain information that would be necessary to provide such reconciliation, including non-recurring items that are not indicative of the Company’s ongoing operations. Such items include, but are not limited to, integration, acquisition and other charges, impairment of intangible assets, restructuring and other charges, (gain) loss on early extinguishment of debt, net and other similar gains or losses not reflective of the Company's ongoing operations.
Conference Call and Accompanying Slides
Cenveo will host a conference call tomorrow, Thursday, February 23, 2017 at 9:00 a.m. Eastern Time. The conference call will be available via webcast, which can be accessed on the investor relations section of the Company's website at www.cenveo.com. During the call, Cenveo will refer to a supplementary slide presentation, which can also be accessed on the investor relations section of the website.
5
About Cenveo
Cenveo (NYSE: CVO), world headquartered in Stamford, Connecticut, is a leading global provider of print and related resources, offering world-class solutions in the areas of custom labels, envelopes, commercial print, content management and publisher solutions. The company provides a one-stop offering through services ranging from design and content management to fulfillment and distribution. With a worldwide distribution platform, we pride ourselves on delivering quality solutions and service every day for our diverse base of customers. For more information please visit us at www.cenveo.com
Use of Non-GAAP Measures
In addition to results presented in accordance with accounting principles generally accepted in the U.S. ("GAAP"), we use certain non-GAAP financial measures, including Adjusted EBITDA, non-GAAP income (loss) from continuing operations, non-GAAP operating income, non-GAAP operating income margin, and adjusted free cash flow. Non-GAAP operating income is defined as operating income excluding integration, acquisition and other charges, stock-based compensation provision, and restructuring and other charges. Non-GAAP operating income margin is calculated by dividing non-GAAP operating income into net sales. Non-GAAP income (loss) from continuing operations excludes integration, acquisition and other charges, stock-based compensation provision, impairment of intangible assets, restructuring and other charges, (gain) loss on early extinguishment of debt, net, and an adjustment to income taxes to reflect an estimated cash tax rate. Adjusted EBITDA is defined as earnings before interest, taxes, depreciation, amortization, integration, acquisition and other charges, stock-based compensation provision, restructuring and other charges, impairment of intangible assets, gain on bargain purchase, (gain) loss on early extinguishment of debt, net, and (loss) income from discontinued operations, net of taxes. Adjusted free cash flow is defined as Adjusted EBITDA less cash interest, cash taxes, and capital expenditures, net of proceeds from the sale of plant, property and equipment. These are non-GAAP financial measures, as defined herein, and should be read in conjunction with GAAP financial measures. A reconciliation of income (loss) from continuing operations to non-GAAP income (loss) from continuing operations, operating income to non-GAAP operating income, and net income (loss) to Adjusted EBITDA is presented in the tables below. These non-GAAP financial measures are not presented as an alternative to cash flows from continuing operations, as a measure of our liquidity or as an alternative to reported net loss as an indicator of our
6
operating performance. The non-GAAP financial measures as used herein may not be comparable to similarly titled measures reported by competitors.
We believe the use of Adjusted EBITDA, non-GAAP income (loss) from continuing operations, non-GAAP operating income, non-GAAP operating income margin and adjusted free cash flow alongside GAAP financial measures enhances the understanding of our operating results and may be useful to investors in comparing our operating performance with that of our competitors and estimating our enterprise value. Adjusted EBITDA is also a useful tool in evaluating the core operating results of the Company given the significant variation that can result from, for example, the timing of capital expenditures, the amount of intangible assets recorded or the differences in assets’ lives. We also use Adjusted EBITDA internally to evaluate the operating performance of our segments, to allocate resources and capital to such segments, to measure performance for incentive compensation programs, and to evaluate future growth opportunities. The non-GAAP financial measures included in this press release are reconciled to their most directly comparable GAAP financial measures in the tables included herein.
Forward-Looking Statements
Statements made in this release, other than those concerning historical financial information, may be considered "forward-looking statements," examples of which include statements relating to our 2017 outlook and future financial condition and operating results, as well as any other statement that does not directly relate to any historical or current fact. These forward-looking statements are based upon current expectations and involve a number of assumptions, risks and uncertainties that could cause actual results to differ materially from such forward-looking statements. In view of such uncertainties, investors should not place undue reliance on our forward-looking statements. Such statements speak only as of the date of this release, and we undertake no obligation to publicly update or revise any forward-looking statements, whether as a result of new information, future events or otherwise. Factors which could cause actual results to differ materially from management’s expectations include, without limitation: (i) our substantial level of indebtedness could materially adversely affect our financial condition, liquidity and ability to service or refinance our debt, and prevent us from fulfilling our business obligations; (ii) our ability to pay the principal of, or to reduce or refinance, our outstanding indebtedness; (iii) the terms of our indebtedness imposing significant restrictions on our operating and financial flexibility; (iv) additional borrowings available to us could further exacerbate our risk
7
exposure from debt; (v) United States and global economic conditions have adversely affected us and could continue to adversely affect us; (vi) our ability to successfully integrate acquired businesses with our business; (vii) a decline in our consolidated profitability or profitability within one of our individual reporting units could result in the impairment of our assets, including goodwill and other long-lived assets; (viii) the industries in which we operate our business are highly competitive and extremely fragmented; (ix) a general absence of long-term customer agreements in our industry, subjecting our business to quarterly and cyclical fluctuations; (x) factors affecting the United States postal services impacting demand for our products; (xi) the availability of the Internet and other electronic media adversely affecting our business; (xii) increases in paper costs and decreases in the availability of raw materials; (xiii) increases in energy and transportation costs; (xiv) our labor relations; (xv) our compliance with environmental laws; (xvi) our dependence on key management personnel; and (xvii) any failure, interruption or security lapse of our information technology systems. This list of factors is not exhaustive, and new factors may emerge or changes to the foregoing factors may occur that would impact our business. Additional information regarding these and other factors can be found in Cenveo, Inc.’s periodic filings with the SEC, which are available at www.cenveo.com.
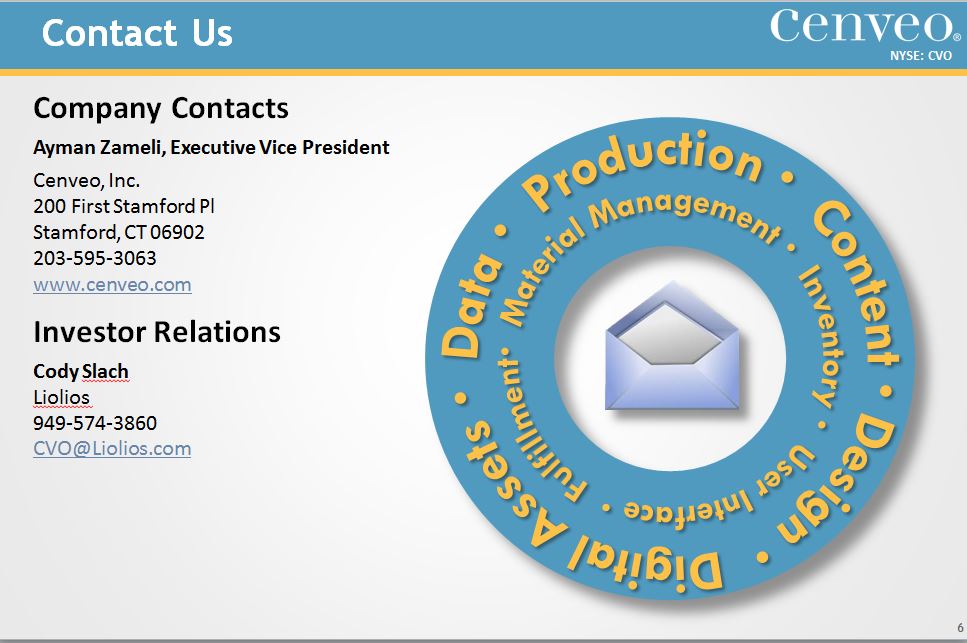
Inquiries from analysts and investors should be directed to Ayman Zameli at (203) 595-3063.
8
Cenveo, Inc. and Subsidiaries Condensed Consolidated Statements of Comprehensive (Loss) Income (in thousands, except per share data) (unaudited) | ||||||||||||||||
For the Three Months Ended | For the Years Ended | |||||||||||||||
December 31, 2016 | January 2, 2016 | December 31, 2016 | January 2, 2016 | |||||||||||||
Net sales | $ | 417,244 | $ | 478,960 | $ | 1,660,001 | $ | 1,741,779 | ||||||||
Cost of sales | 353,624 | 400,872 | 1,386,746 | 1,450,876 | ||||||||||||
Selling, general and administrative expenses | 41,992 | 50,190 | 179,525 | 186,749 | ||||||||||||
Amortization of intangible assets | 1,383 | 2,029 | 5,744 | 7,785 | ||||||||||||
Restructuring and other charges | 3,670 | 1,047 | 11,954 | 12,576 | ||||||||||||
Operating income | 16,575 | 24,822 | 76,032 | 83,793 | ||||||||||||
Interest expense, net | 19,828 | 24,804 | 85,753 | 100,805 | ||||||||||||
(Gain) loss on early extinguishment of debt, net | (2,153 | ) | 693 | (82,481 | ) | 1,252 | ||||||||||
Other expense (income), net | 481 | (2,423 | ) | (2,344 | ) | (3,196 | ) | |||||||||
(Loss) income from continuing operations before income taxes | (1,581 | ) | 1,748 | 75,104 | (15,068 | ) | ||||||||||
Income tax expense | 198 | 6,113 | 4,258 | 4,393 | ||||||||||||
(Loss) income from continuing operations | (1,779 | ) | (4,365 | ) | 70,846 | (19,461 | ) | |||||||||
Income (loss) from discontinued operations, net of taxes | 1,538 | (13,159 | ) | (2,897 | ) | (11,390 | ) | |||||||||
Net (loss) income | (241 | ) | (17,524 | ) | 67,949 | (30,851 | ) | |||||||||
Other comprehensive (loss) income: | ||||||||||||||||
Changes in pension and other employee benefit accounts, net of taxes | (6,711 | ) | (7,555 | ) | 756 | (3,438 | ) | |||||||||
Currency translation adjustment, net | (197 | ) | (1,163 | ) | 1,945 | (4,295 | ) | |||||||||
Total other comprehensive (loss) income | (6,908 | ) | (8,718 | ) | 2,701 | (7,733 | ) | |||||||||
Comprehensive (loss) income | $ | (7,149 | ) | $ | (26,242 | ) | $ | 70,650 | $ | (38,584 | ) | |||||
(Loss) income per share – basic: | ||||||||||||||||
Continuing operations | $ | (0.21 | ) | $ | (0.51 | ) | $ | 8.31 | $ | (2.30 | ) | |||||
Discontinued operations | 0.18 | (1.56 | ) | (0.34 | ) | (1.34 | ) | |||||||||
Net (loss) income | $ | (0.03 | ) | $ | (2.07 | ) | $ | 7.97 | $ | (3.64 | ) | |||||
(Loss) income per share – diluted: | ||||||||||||||||
Continuing operations | $ | (0.21 | ) | $ | (0.51 | ) | $ | 7.63 | $ | (2.30 | ) | |||||
Discontinued operations | 0.18 | (1.56 | ) | (0.31 | ) | (1.34 | ) | |||||||||
Net (loss) income | $ | (0.03 | ) | $ | (2.07 | ) | $ | 7.32 | $ | (3.64 | ) | |||||
Weighted average shares outstanding: | ||||||||||||||||
Basic | 8,552 | 8,484 | 8,527 | 8,479 | ||||||||||||
Diluted | 8,552 | 8,484 | 9,492 | 8,479 | ||||||||||||
9
CENVEO, INC. AND SUBSIDIARIES CONSOLIDATED STATEMENTS OF CASH FLOWS (in thousands) (unaudited) | |||||||
For The Years Ended | |||||||
2016 | 2015 | ||||||
Cash flows from operating activities: | |||||||
Net income (loss) | $ | 67,949 | $ | (30,851 | ) | ||
Adjustments to reconcile net income (loss) to net cash provided by operating activities: | |||||||
(Gain) loss on sale of discontinued operations, net of taxes | (69 | ) | 4,987 | ||||
Loss from discontinued operations, net of taxes | 2,966 | 6,403 | |||||
Depreciation | 41,456 | 41,904 | |||||
Amortization of intangible assets | 5,744 | 7,785 | |||||
Non-cash interest expense, net | 9,003 | 10,057 | |||||
Deferred income taxes | 1,280 | 2,743 | |||||
Gain on sale of assets | (4,330 | ) | (5,356 | ) | |||
Non-cash restructuring and other charges, net | 3,638 | 5,936 | |||||
(Gain) loss on early extinguishment of debt, net | (82,481 | ) | 1,252 | ||||
Provisions for bad debts | 1,415 | 2,567 | |||||
Provisions for inventory obsolescence | 2,826 | 2,359 | |||||
Stock-based compensation provision | 1,468 | 1,636 | |||||
Changes in operating assets and liabilities, excluding the effects of acquired businesses: | |||||||
Accounts receivable | 18,397 | (3,953 | ) | ||||
Inventories | 16,820 | (5,130 | ) | ||||
Accounts payable and accrued compensation and related liabilities | (33,781 | ) | (16,363 | ) | |||
Other working capital changes | (2,534 | ) | 3,103 | ||||
Other, net | (384 | ) | (12,853 | ) | |||
Net cash provided by operating activities of continuing operations | 49,383 | 16,226 | |||||
Net cash (used in) provided by operating activities of discontinued operations | (10,512 | ) | 15,968 | ||||
Net cash provided by operating activities | 38,871 | 32,194 | |||||
Cash flows from investing activities: | |||||||
Cost of business acquisitions, net of cash acquired | — | (1,996 | ) | ||||
Capital expenditures | (41,137 | ) | (25,928 | ) | |||
Proceeds from sale of property, plant and equipment | 8,330 | 8,558 | |||||
Proceeds from sale of assets | 2,000 | 2,180 | |||||
Net cash used in investing activities of continuing operations | (30,807 | ) | (17,186 | ) | |||
Net cash provided by (used in) investing activities of discontinued operations | 95,866 | (2,282 | ) | ||||
Net cash provided by (used in) investing activities | 65,059 | (19,468 | ) | ||||
Cash flows from financing activities: | |||||||
Proceeds from issuance of 4% senior secured notes due 2021 | 50,000 | — | |||||
Payment of financing related costs and expenses and debt issuance discounts | (11,576 | ) | (1,596 | ) | |||
Proceeds from issuance of other long-term debt | — | 12,500 | |||||
Repayments of other long-term debt | (5,578 | ) | (16,545 | ) | |||
Repayment of 11.5% senior notes due 2017 | (24,725 | ) | (22,720 | ) | |||
Repayment of 7% senior exchangeable notes due 2017 | (45,903 | ) | — | ||||
Repayment of 8.500% junior secured priority notes due 2022 | (4,550 | ) | — | ||||
Purchase and retirement of common stock upon vesting of restricted stock units | (346 | ) | (216 | ) | |||
Borrowings under asset-based revolving credit facility due 2021 | 474,300 | 468,300 | |||||
Repayments under asset-based revolving credit facility due 2021 | (540,800 | ) | (454,800 | ) | |||
Net cash used in financing activities of continuing operations | (109,178 | ) | (15,077 | ) | |||
Net cash used in financing activities of discontinued operations | (8 | ) | (473 | ) | |||
Net cash used in financing activities | (109,186 | ) | (15,550 | ) | |||
Effect of exchange rate changes on cash and cash equivalents | 232 | (1,213 | ) | ||||
Net decrease in cash and cash equivalents | (5,024 | ) | (4,037 | ) | |||
Cash and cash equivalents at beginning of period | 10,556 | 14,593 | |||||
Cash and cash equivalents at end of period | 5,532 | 10,556 | |||||
Less cash and cash equivalents of discontinued operations | — | (2,771 | ) | ||||
Cash and cash equivalents of continuing operations at end of period | $ | 5,532 | $ | 7,785 | |||
Supplemental cash flow disclosures: | |||||||
Cash paid for interest | $ | 79,267 | $ | 91,455 | |||
Cash paid for taxes, net | 4,698 | 739 | |||||
Non-cash origination of capital leases | 1,280 | 2,518 | |||||
10
Cenveo, Inc. and Subsidiaries Condensed Consolidated Balance Sheets (in thousands) (unaudited) | |||||||
2016 | 2015 | ||||||
Assets | |||||||
Current assets: | |||||||
Cash and cash equivalents | $ | 5,532 | $ | 7,785 | |||
Accounts receivable, net | 234,187 | 254,042 | |||||
Inventories, net | 101,950 | 121,615 | |||||
Prepaid and other current assets | 41,576 | 46,731 | |||||
Assets of discontinued operations - current | — | 48,566 | |||||
Total current assets | 383,245 | 478,739 | |||||
Property, plant and equipment, net | 207,679 | 210,578 | |||||
Goodwill | 175,209 | 175,338 | |||||
Other intangible assets, net | 124,831 | 130,450 | |||||
Other assets, net | 21,995 | 24,070 | |||||
Assets of discontinued operations - long-term | — | 62,851 | |||||
Total assets | $ | 912,959 | $ | 1,082,026 | |||
Liabilities and Shareholders’ Deficit | |||||||
Current liabilities: | |||||||
Current maturities of long-term debt | $ | 31,727 | $ | 5,373 | |||
Accounts payable | 175,896 | 200,120 | |||||
Accrued compensation and related liabilities | 24,684 | 31,961 | |||||
Other current liabilities | 82,899 | 88,814 | |||||
Liabilities of discontinued operations - current | — | 22,268 | |||||
Total current liabilities | 315,206 | 348,536 | |||||
Long-term debt | 986,939 | 1,203,250 | |||||
Other liabilities | 199,971 | 198,926 | |||||
Liabilities of discontinued operations - long-term | — | 1,153 | |||||
Commitments and contingencies | |||||||
Shareholders’ deficit: | |||||||
Preferred stock, $0.01 par value; 25 shares authorized, no shares issued | — | — | |||||
Common stock, $0.01 par value; 15,000 and 12,500 shares authorized, 8,553 and 8,484 shares issued and outstanding as of the years ended 2016 and 2015, respectively | 86 | 85 | |||||
Paid-in capital | 382,271 | 372,240 | |||||
Retained deficit | (868,285 | ) | (936,234 | ) | |||
Accumulated other comprehensive loss | (103,229 | ) | (105,930 | ) | |||
Total shareholders’ deficit | (589,157 | ) | (669,839 | ) | |||
Total liabilities and shareholders’ deficit | $ | 912,959 | $ | 1,082,026 | |||
11
Cenveo, Inc. and Subsidiaries Reconciliation of Operating Income to Non-GAAP Operating Income (in thousands) (unaudited) | ||||||||||||||||
For the Three Months Ended | For the Years Ended | |||||||||||||||
December 31, 2016 | January 2, 2016 | December 31, 2016 | January 2, 2016 | |||||||||||||
Operating income | $ | 16,575 | $ | 24,822 | $ | 76,032 | $ | 83,793 | ||||||||
Integration, acquisition and other charges | 834 | 1,608 | 4,881 | 7,095 | ||||||||||||
Stock-based compensation provision | 238 | 155 | 1,468 | 1,636 | ||||||||||||
Restructuring and other charges | 3,670 | 1,047 | 11,954 | 12,576 | ||||||||||||
Non-GAAP operating income | $ | 21,317 | $ | 27,632 | $ | 94,335 | $ | 105,100 | ||||||||
12
Cenveo, Inc. and Subsidiaries Reconciliation of (Loss) Income from Continuing Operations to Non-GAAP Income from Continuing Operations and Related Per Share Data (in thousands, except per share data) (unaudited) | ||||||||||||||||
For the Three Months Ended | For the Years Ended | |||||||||||||||
December 31, 2016 | January 2, 2016 | December 31, 2016 | January 2, 2016 | |||||||||||||
(Loss) income from continuing operations | $ | (1,779 | ) | $ | (4,365 | ) | $ | 70,846 | $ | (19,461 | ) | |||||
Integration, acquisition and other charges | 834 | 1,608 | 4,881 | 7,095 | ||||||||||||
Stock-based compensation provision | 238 | 155 | 1,468 | 1,636 | ||||||||||||
Restructuring and other charges | 3,670 | 1,047 | 11,954 | 12,576 | ||||||||||||
(Gain) loss on early extinguishment of debt, net | (2,153 | ) | 693 | (82,481 | ) | 1,252 | ||||||||||
Income tax (benefit) expense | (570 | ) | 5,586 | (440 | ) | 3,656 | ||||||||||
Interest expense on 7% Notes, net of taxes | 56 | 977 | 1,572 | 3,908 | ||||||||||||
Non-GAAP income from continuing operations | $ | 296 | $ | 5,701 | $ | 7,800 | $ | 10,662 | ||||||||
(Loss) income per share – diluted: | ||||||||||||||||
Continuing operations | $ | (0.20 | ) | $ | (0.40 | ) | $ | 7.46 | $ | (1.77 | ) | |||||
Integration, acquisition and other charges | 0.09 | 0.15 | 0.52 | 0.65 | ||||||||||||
Stock-based compensation provision | 0.03 | 0.01 | 0.15 | 0.15 | ||||||||||||
Restructuring and other charges | 0.42 | 0.10 | 1.26 | 1.14 | ||||||||||||
(Gain) loss on early extinguishment of debt, net | (0.25 | ) | 0.06 | (8.69 | ) | 0.11 | ||||||||||
Income tax (benefit) expense | (0.07 | ) | 0.51 | (0.05 | ) | 0.33 | ||||||||||
Interest expense on 7% Notes, net of taxes | 0.01 | 0.09 | 0.17 | 0.36 | ||||||||||||
Non-GAAP income from continuing operations | $ | 0.03 | $ | 0.52 | $ | 0.82 | $ | 0.97 | ||||||||
Weighted average shares - diluted | 8,727 | 10,998 | 9,492 | 10,992 | ||||||||||||
13
Cenveo, Inc. and Subsidiaries Reconciliation of Net (Loss) Income to Adjusted EBITDA (in thousands) (unaudited) | ||||||||||||||||
For the Three Months Ended | For the Years Ended | |||||||||||||||
December 31, 2016 | January 2, 2016 | December 31, 2016 | January 2, 2016 | |||||||||||||
Net (loss) income | $ | (241 | ) | $ | (17,524 | ) | $ | 67,949 | $ | (30,851 | ) | |||||
Interest expense, net | 19,828 | 24,804 | 85,753 | 100,805 | ||||||||||||
Income tax expense | 198 | 6,113 | 4,258 | 4,393 | ||||||||||||
Depreciation | 10,272 | 12,027 | 41,456 | 41,904 | ||||||||||||
Amortization of intangible assets | 1,383 | 2,029 | 5,744 | 7,785 | ||||||||||||
Integration, acquisition and other charges | 834 | 1,608 | 4,881 | 7,095 | ||||||||||||
Stock-based compensation provision | 238 | 155 | 1,468 | 1,636 | ||||||||||||
Restructuring and other charges | 3,670 | 1,047 | 11,954 | 12,576 | ||||||||||||
(Gain) loss on early extinguishment of debt, net | (2,153 | ) | 693 | (82,481 | ) | 1,252 | ||||||||||
(Income) loss from discontinued operations, net of taxes | (1,538 | ) | 13,159 | 2,897 | 11,390 | |||||||||||
Adjusted EBITDA, as defined | $ | 32,491 | $ | 44,111 | $ | 143,879 | $ | 157,985 | ||||||||
14

15
16
17
18
19
20