Attached files
| file | filename |
|---|---|
| EX-32.2 - EXHIBIT 32.2 - CENVEO, INC | cvo-20161231xex322.htm |
| EX-32.1 - EXHIBIT 32.1 - CENVEO, INC | cvo-20161231xex321.htm |
| EX-31.2 - EXHIBIT 31.2 - CENVEO, INC | cvo-20161231xex312.htm |
| EX-31.1 - EXHIBIT 31.1 - CENVEO, INC | cvo-20161231xex311.htm |
| EX-23.1 - EXHIBIT 23.1 - CENVEO, INC | ex231consentofbdousallp2016.htm |
| EX-21.1 - EXHIBIT 21.1 - CENVEO, INC | ex211subsidiariesofregistr.htm |
UNITED STATES
SECURITIES AND EXCHANGE COMMISSION
Washington, D.C. 20549
FORM 10-K
ANNUAL REPORT PURSUANT TO SECTION 13 OR 15(d) OF THE
SECURITIES EXCHANGE ACT OF 1934
For the fiscal year ended December 31, 2016
Commission file number 1-12551
CENVEO, INC.
(Exact name of Registrant as specified in its charter.)
COLORADO | 84-1250533 | |
(State or other jurisdiction of incorporation or organization) | (I.R.S. Employer Identification No.) | |
200 FIRST STAMFORD PLACE | ||
STAMFORD, CT | 06902 | |
(Address of principal executive offices) | (Zip Code) | |
203-595-3000 | ||
(Registrant’s telephone number, including area code) | ||
Securities Registered Pursuant to Section 12(b) of the Act:
Title of Each Class | Name of Each Exchange on Which Registered | |
Common Stock, par value $0.01 per share | New York Stock Exchange | |
Indicate by check mark if the registrant is a well-known seasoned issuer, as defined in Rule 405 of the Securities Act.
Yes o No ý
Indicate by check mark if the registrant is not required to file reports pursuant to Section 13 or Section 15(d) of the Exchange Act. Yes o No ý
Indicate by check mark whether the registrant (1) has filed all reports required to be filed by Section 13 or 15(d) of the Securities Exchange Act of 1934 during the preceding 12 months (or for such shorter period that the Registrant was required to file such reports), and (2) has been subject to such filing requirements for the past 90 days. Yes ý No o
Indicate by check mark whether the registrant has submitted electronically and posted on its corporate Web site, if any, every Interactive Data File required to be submitted and posted pursuant to Rule 405 of Regulation S-T during the preceding 12 months (or for such shorter period that the registrant was required to submit and post such files). Yes ý No o
Indicate by check mark if disclosure of delinquent filers pursuant to Item 405 of Regulation S-K is not contained herein, and will not be contained, to the best of registrant’s knowledge, in definitive proxy or information statements incorporated by reference in Part III of this Form 10-K or any amendment to this Form 10-K. o
Indicate by check mark whether the registrant is a large accelerated filer, an accelerated filer, a non-accelerated filer or a smaller reporting company. See definition of "accelerated filer and large accelerated filer" in Rule 12b-2 of the Exchange Act. Large accelerated filer o Accelerated filer o Non-accelerated filer o Smaller reporting company ý
Indicate by check mark whether the registrant is a shell company (as defined in Rule 12b-2 of the Exchange Act). Yes o No ý
As of July 2, 2016, the aggregate market value of the registrant’s common stock held by non-affiliates of the registrant was approximately $46.8 million based on the closing sale price as reported on the New York Stock Exchange.
As of February 22, 2017, the registrant had 8,553,167 shares of common stock, par value $0.01 per share, outstanding.
DOCUMENTS INCORPORATED BY REFERENCE
Certain information required by Part II (Item 5) and Part III of this form (Items 11, 12, 13 and 14, and part of Item 10) is incorporated by reference from the Registrant’s Proxy Statement to be filed pursuant to Regulation 14A with respect to the Registrant’s Annual Meeting of Shareholders to be held on or about April 27, 2017.
CENVEO, INC. AND SUBSIDIARIES
TABLE OF CONTENTS
PART I | ||
Page | ||
PART II | ||
PART III | ||
PART IV | ||
1
PART I
Item 1. Business
Overview
Cenveo, Inc. ("Cenveo," the "Company," "we," "our," or "us") is a diversified manufacturing company focused on print-related products. Our broad portfolio of products includes envelope converting, commercial printing, and label manufacturing. We operate an extensive network of strategically located manufacturing facilities, serving a diverse base of customers. We operate our business in three complementary reportable segments: envelope, print and label.
Envelope. We are the largest envelope manufacturer in North America. Our envelope segment had net sales of $865.2 million and $908.7 million and operating income of $60.7 million and $66.4 million for the years ended 2016 and 2015, respectively. Total assets for our envelope segment were $403.2 million and $445.4 million as of the years ended 2016 and 2015, respectively. Our envelope segment represented approximately 52.1% of our consolidated net sales for the year ended 2016.
Our envelope segment offers direct mail products used for customer solicitations and transactional envelopes used for billing and remittance by end users including financial institutions, insurance and telecommunications companies. We also produce a broad line of specialty and stock envelopes which are sold through wholesalers, distributors and national catalogs for the office product markets and office product superstores.
Print. We are one of the leading commercial printers in North America. Our print segment had net sales of $493.5 million and $511.0 million and operating income of $17.6 million and $15.1 million for the years ended 2016 and 2015, respectively. Total assets for our print segment were $256.9 million and $266.1 million as of the years ended 2016 and 2015, respectively. Our print segment represented approximately 29.7% of our consolidated net sales for the year ended 2016.
Our print segment primarily caters to the consumer products, automotive, travel and leisure and telecommunications industries. We provide a wide array of print offerings to our customers including electronic prepress, digital asset archiving, direct-to-plate technology, high-quality color printing on web and sheet-fed presses, digital printing and content management. The broad selection of print products we produce includes car brochures, annual reports, direct mail products, advertising literature, corporate identity materials and brand marketing materials. Our content management business offers complete solutions, including: editing, content processing, content management, electronic peer review, production, distribution and reprint marketing.
Label. We are a leading label manufacturer and one of the largest North American prescription label manufacturers for retail pharmacy chains. Our label segment had net sales of $301.4 million and $322.1 million and operating income of $30.5 million and $39.5 million for the years ended 2016 and 2015, respectively. Total assets for our label segment were $216.6 million and $223.5 million as of the years ended 2016 and 2015, respectively. Our label segment represented approximately 18.2% of our consolidated net sales for the year ended 2016.
Our label segment produces a diverse line of custom labels for a broad range of industries including manufacturing, warehousing, packaging, food and beverage, and health and beauty, which we sell through extensive networks within the resale channels. We provide direct mail and overnight packaging labels, food and beverage labels, and shelf and scale labels for national and regional customers. We produce pressure-sensitive prescription labels for the retail pharmacy chain market.
The primary methods of distribution of the principal products for our three segments are by freight carriers, direct shipment via express mail and the United States postal system.
Acquisitions and Divestitures
Acquisitions
On August 7, 2015, we acquired certain assets of Asendia USA, Inc., which we refer to as Asendia. The acquired assets provide letter shop, data processing, bindery and digital printing offerings.
We may, from time to time, complete acquisitions in areas we believe will strengthen our manufacturing platform, improve our operating margin performance or provide additional product offerings.
See Note 2 to our consolidated financial statements for further discussion regarding our acquisitions.
2
Divestitures
During 2015, we began actively moving forward with our plan to review and potentially divest certain non-strategic assets that did not fit within our long-term strategy. As a result of this strategic review, during the first quarter of 2016, we completed the sale of our folded carton and shrink sleeve packaging businesses, along with our top-sheet lithographic print operation, which we refer to as the Packaging Business. The financial results of the Packaging Business have been accounted for as discontinued operations. Our historical, consolidated financial statements have been retroactively adjusted to give recognition to the discontinued operations for all periods presented. See Note 3 to our consolidated financial statements for further discussion regarding our discontinued operations.
Our Business Strategy
Our business strategy has been, and continues to be, focused on improving our operating margins, improving our capital structure and providing quality product offerings to our customers. We also are continuing to review options for our non-strategic assets and product lines. We also continue to make strategic investments and focused capital expenditures. The strategic investments focus on improving our e-commerce customer experience. Our focused capital expenditures in label equipment included two new digital presses added in both 2016 and 2015 and the initiation of a multi-phased, multi-year plan to reinvest into state-of-the-art labeling equipment, which should significantly increase our capabilities, minimize machine downtime and allow for margin expansion within our label operations.
Improving Operating Margins
In 2014, we substantially completed our integration of certain assets of National Envelope Corporation, which we refer to as National, which allowed us to focus on profitability improvement and other cost reduction actions in our envelope platform throughout 2015 and into early 2016. We believe the accelerated integration plan we completed during 2014 has provided meaningful improvements in our envelope segment's operating results during 2015 and 2016, as we realized significant increases in gross profit and operating income, as compared to 2014.
During 2016, we experienced significant sales volume decline and increased price pressures within our office product envelope and related wholesale envelope product lines due to measures undertaken by our customers in those product lines as a result of a regulatory decision mid-way through our 2016 fiscal year. In reaction to this decline and other continued marketplace challenges within our industry, we initiated a two year $50 million cost savings and profitability plan, which we refer to as the 2017 Profitability Improvement Plan, to offset the impact of these marketplace challenges and continue to improve our operating margins. With this plan, we expect higher restructuring, impairment and other charges primarily resulting from severance expense, facility rationalization costs and impairments associated with equipment footprint reductions. We believe these incremental charges will ultimately be offset by improved gross profit margins and lower selling, general and administrative expenses as we operate through 2017 and into 2018; however, this cannot be assured. These actions are aimed to reduce our fixed cost infrastructure, back office headcount and further streamline our geographic footprint. We believe that despite the facility rationalization, we will still be able to serve our national customer base with less facilities at the same or improved service levels that they are used to receiving from us.
Improving our Capital Structure
Since the beginning of 2012, we have been focused on improving our capital structure through a number of initiatives including working capital improvements, exiting underperforming or non-strategic businesses, and taking advantage of strategic refinancing opportunities and attractive leveraged loan and high yield debt market conditions. We have been able to accomplish this while reinvesting cash into our businesses via three acquisitions and focused capital expenditures. In connection with these activities, through the end of 2016, we continued to successfully reduce our outstanding debt and weighted average interest rate, which we believe will result in annual cash interest savings of approximately $40 million in 2017 as compared to 2012. Additionally, we have called for redemption during the first quarter of 2017 the remaining $20.5 million of our 11.5% senior notes due 2017, which we refer to as the 11.5% Notes. That addresses all but $5.5 million of our debt maturing in 2017. We expect that remaining $5.5 million of our 7% senior exchangeable notes due 2017, which we refer to as the 7% Notes, will be addressed prior to or at maturity in May of 2017. These redemptions or retirements will be made using cash flow from operations or availability under our asset-based revolving credit facility due 2021, which we refer to as the ABL Facility.
3
Provide Quality Product Offerings
We conduct regular reviews of our product offerings, manufacturing processes and distribution methods to ensure that they meet the changing needs of our customers. We are also investing in digital and variable technology in particular, as we have seen increased customer demand for these technologies. Additionally, we have expanded our managed services portfolio and integrated customer supply chain capabilities via strategic investments in information technology and knowledge product specialists. By expanding our product offerings, we intend to increase cross-selling opportunities to our existing customer base and mitigate the impact of any decline in a given market or product.
Our Industry
The overall industry for print-related products is highly fragmented with excess capacity. We face price sensitivity and price pressures in many of our businesses. In the envelope market, we compete primarily with a few multi-plant and many single-plant companies servicing regional and local markets. In the commercial printing market, we compete against a few large, diversified and financially stronger printing companies, as well as smaller regional and local commercial printers, many of which are capable of competing with us on volume, price and production quality.
The information set forth below is applicable to the operating environments within all our segments.
Raw Materials
The primary materials used in our businesses are paper, ink, film, offset plates and chemicals, with paper accounting for the majority of total material costs. We purchase these materials from a number of key suppliers and have not experienced any significant difficulties in obtaining the raw materials necessary for our operations. However, in times of limited supply, we have occasionally experienced minor delays in delivery. We believe we purchase our materials and supplies at competitive prices, primarily due to the size and scope of our purchasing power; however, our businesses are sensitive to pressure related to increases in the cost of materials used in the production of our products.
Patents, Trademarks and Trade Names
Our sales do not materially depend upon any single patent or group of related patents; however, we do market products under a number of trademarks and trade names. We also hold or have rights to use various patents relating to our businesses. Our patents expire between 2018 and 2032 and our trademarks expire between 2017 and 2030.
Seasonality
Our envelope market and certain segments of the direct mail market have historically experienced seasonality with a higher percentage of volume of products sold to these markets during the third and fourth quarters of the year, primarily related to back-to-school campaigns and holiday purchases.
Our print plants experience seasonal variations. Revenues associated with consumer publications, such as holiday catalogs and automobile brochures tend to be concentrated from July through October. Revenues associated with the educational and scholastic market and promotional materials tend to decline in the summer. As a result of these seasonal variations, some of our print operations operate at or near capacity at certain times throughout the year.
Our custom label business has historically experienced a seasonal increase in net sales during the first and second quarters of the year, primarily resulting from the release of our product catalogs to the trade channel customers and our customers’ spring advertising campaigns. Our prescription label business has historically experienced seasonality in net sales due to cold and flu seasons, generally concentrated in the fourth and first quarters of the year. As a result of these seasonal variations, some of our label operations operate at or near capacity at certain times throughout the year.
Backlog
Backlog generally is not considered a significant factor in our business due to the relatively short delivery periods and frequent inventory turnover many of our businesses experience. Our backlog of customer orders to be produced or shipped was approximately $87.4 million and $104.9 million as of the years ended 2016 and 2015, respectively.
4
Competition
We compete with a few multi-plant and many single-plant companies which primarily service regional and local markets in selling our envelope products. We also face competition from alternative sources of communication and information transfer such as electronic mail, the internet, interactive television and electronic retailing. Although these sources of communication and advertising may eliminate some domestic envelope sales in the future, we believe we will experience continued demand for envelope products due to: (i) the ability of our customers to obtain a relatively low-cost information delivery vehicle that may be customized with text, color, graphics and action devices to achieve the desired presentation effect; (ii) the ability of our direct mail customers to penetrate desired markets as a result of the widespread delivery of mail to residences and businesses through the United States Postal Service; and (iii) the ability of our direct mail customers to include return materials inside their mailings. Principal competitive factors in the envelope business are quality, service and price. Although all three factors are equally important, various customers may emphasize one or more over the others.
In selling our commercial print product offerings, we compete with large multinational commercial printing companies, as well as regional and local printers. The commercial printing industry continues to have excess capacity, and is highly competitive in most of our product categories and geographic regions. This excess capacity has resulted in a competitive pricing environment, in which companies have focused on reducing costs in order to preserve operating margins. Competition is based largely on price, quality and servicing the special requirements of customers. We believe this environment, combined with recent economic trends, will continue to lead to more consolidation within the commercial print industry as companies seek economies of scale, broader customer relationships, geographic coverage and product breadth to overcome or offset excess industry capacity and pricing pressures.
In selling our printed labels products, we compete with other label manufacturers with nationwide locations as well as regional and local printers that typically sell within a few hundred mile radius of their plants. Printed labels competition is based mainly on quick-turn customization, quality of products, pricing and customer service levels.
Employees
We employed approximately 7,300 people worldwide as of the year ended 2016, approximately 23% of whom were members of various local labor unions. Collective bargaining agreements, each of which cover the workers at a particular facility, expire from time to time and are negotiated separately. Accordingly, we believe no single collective bargaining agreement is material to our operations as a whole.
Environmental Regulations
Our operations are subject to federal, state, local and foreign environmental laws and regulations, including those relating to air emissions, waste generation, handling, management and disposal, and remediation of contaminated sites. We have implemented environmental programs designed to ensure that we operate in compliance with the applicable laws and regulations governing environmental protection. We believe we are in substantial compliance with applicable laws and regulations relating to environmental protection, and we do not anticipate material capital expenditures will be required to achieve or maintain compliance with environmental laws and regulations. However, there can be no assurance that newly discovered conditions, or new laws and regulations or stricter interpretations of existing laws and regulations, will not result in increased compliance or remediation costs.
Executive Officers
The following presents a list of our executive officers, their age, present position, the year elected to their present position and other positions they have held during the past five years. Robert G. Burton, Jr. and Michael G. Burton are the sons of Robert G. Burton, Sr. There are no undisclosed arrangements or understandings pursuant to which any person was selected as an officer. This information is presented as of the date of the Form 10-K filing.
5
Name | Age | Position | Year Elected to Present Position | ||||
Robert G. Burton, Sr. | 76 | Chairman and Chief Executive Officer | 2005 | ||||
Robert G. Burton, Jr. | 41 | President | 2011 | ||||
Scott J. Goodwin | 39 | Chief Financial Officer | 2012 | ||||
Michael G. Burton | 39 | Chief Operating Officer | 2014 | ||||
Ian R. Scheinmann | 48 | Senior Vice President, Legal Affairs and Corporate Secretary | 2010/2015 | ||||
Robert G. Burton, Sr. Mr. Burton, 76, has been Cenveo’s Chairman and Chief Executive Officer since September 2005. In January 2003, he formed Burton Capital Management, LLC, a company which invests in manufacturing companies, and has been its Chairman, Chief Executive Officer and sole managing member since its formation. From December 2000 through December 2002, Mr. Burton was the Chairman, President, and Chief Executive Officer of Moore Corporation Limited, a leading printing company with over $2.0 billion in revenue for fiscal year 2002. Preceding his employment at Moore, Mr. Burton was Chairman, President, and Chief Executive Officer of Walter Industries, Inc., a diversified holding company. From April 1991 through October 1999, he was the Chairman, President, and Chief Executive Officer of World Color Press, Inc., a $3.0 billion diversified printing company. From 1981 through 1991, he held a series of senior executive positions at Capital Cities/ABC, including President of ABC Publishing. Mr. Burton was also employed for 10 years as a senior executive of SRA, the publishing division of IBM.
Robert G. Burton, Jr. Mr. Burton, Jr., 41, has served as Cenveo’s President since August 2011. From December 2010 to August 2011, Mr. Burton was President of Corporate Operations, with a primary focus on Mergers and Acquisitions, Treasury, Information Technology, Human Resources, Legal and Investor Relations. From September 2005 to December 2010, Mr. Burton was Executive Vice President of Investor Relations, Treasury, Human Resources and Legal at Cenveo. He has been a member of the Chairman’s Executive Committee since joining Cenveo. From 2004 to 2005, Mr. Burton was also President of Burton Capital Management, LLC and was the primary investment officer before he joined Cenveo on September 2005. Mr. Burton has over 16 years of business experience as an Investor Relations, Mergers and Acquisitions, and financial professional. Mr. Burton also served as the Senior Vice President, Investor Relations and Corporate Communications for Moore Wallace Incorporated (and its predecessor, Moore Corporation) from December 2001 to May 2003. Mr. Burton served as Vice President, Investor Relations of Walter Industries in 2000. From 1996 through December 1999, Mr. Burton held various management positions at World Color Press, Inc., including Vice President, Investor Relations. Mr. Burton earned a B.A. degree from Vanderbilt University.
Scott J. Goodwin. Mr. Goodwin, 39, has served as Cenveo's Chief Financial Officer since August 2012 and was Chief Accounting Officer from April 2012 to August 2012. From June 2009 to April 2012, Mr. Goodwin served as Cenveo's Corporate Controller. Mr. Goodwin joined Cenveo as its Assistant Corporate Controller in June 2006. Prior to joining Cenveo, Mr. Goodwin spent seven years in public accounting at Deloitte & Touche LLP. Mr. Goodwin is a Certified Public Accountant and received his degree in accounting from The Citadel.
Michael G. Burton. Mr. Burton, 39, has served as Cenveo’s Chief Operating Officer since July 2014. From July 2013 to July 2014, Mr. Burton served as President, Print, Label and Packaging Group. In November 2010 Mr. Burton became President of the Label division and subsequently became responsible for the Packaging division in January 2012. From September 2005 to November 2010, Mr. Burton was Senior Vice President, Operations with a primary focus on, Procurement, Information Technology, Environmental Health and Safety, and Human Resources. From 2003 to 2005, Mr. Burton was also Executive Vice President, Operations of Burton Capital Management, LLC. He was a founding member of this group before he joined Cenveo on September 2005. Mr. Burton was previously Vice President of Commercial and Subsidiary Operations, a $600 million division of Moore Corporation Limited. Mr. Burton received his B.A. degree from the University of Connecticut where he was captain of the football team.
Ian R. Scheinmann. Mr. Scheinmann, 48, has served as Cenveo’s Senior Vice President, Legal Affairs since August 2010. From May 2010 until August 2010, he served as Cenveo’s in-house real estate counsel. He has also served as Cenveo’s Corporate Secretary since June 2015. Prior to joining Cenveo, Mr. Scheinmann was Cenveo’s outside real estate counsel as a member of Rudoler & DeRosa, LLC where his practice covered a wide range of real estate and business transactions. Prior to joining Rudoler & DeRosa, Mr. Scheinmann was a real estate shareholder with Greenberg Traurig, LLP from August 2002 until March 2009. From 1995 until 2002, he was engaged in private practice with (i) Dilworth Paxson, LLP (September 2000 until July 2002); (ii) Anderson, Kill and Olick, P.C. (November 1996 until May 2000); and (iii) Weiner Lesniak (October 1995 until October
6
1996). Mr. Scheinmann received his B.S.B.A. from the John M. Olin School of Business at Washington University, St. Louis, Missouri and his J.D. with honors from Seton Hall University School of Law.
Cautionary Statements
Certain statements in this report, particularly statements found in "Risk Factors," "Business" and "Management’s Discussion and Analysis of Financial Condition and Results of Operations," may constitute "forward-looking statements" within the meaning of the Private Securities Litigation Reform Act of 1995. In addition, we or our representatives have made or continue to make forward-looking statements, orally or in writing, in other contexts. These forward-looking statements generally can be identified by the use of terminology such as "may," "will," "expect," "intend," "estimate," "anticipate," "plan," "foresee," "believe" or "continue" and similar expressions, or as other statements which do not relate solely to historical facts. These statements are not guarantees of future performance and involve risks, uncertainties and assumptions which are difficult to predict or quantify. Management believes these statements to be reasonable when made. However, actual outcomes and results may differ materially from what is expressed or forecasted in these forward-looking statements. As a result, these statements speak only as of the date they were made. We undertake no obligation to publicly update or revise any forward-looking statements, whether as a result of new information, future events or otherwise. In view of such uncertainties, investors should not place undue reliance on our forward-looking statements.
Such forward-looking statements involve known and unknown risks, including, but not limited to, those identified in "Risk Factors," along with changes in general economic, business and labor conditions. More information regarding these and other risks can be found below under "Risk Factors" in Item 1A, "Business," "Management’s Discussion and Analysis of Financial Condition and Results of Operations" and other sections of this report.
Available Information
Our internet address is: www.cenveo.com. References to our website address do not constitute incorporation by reference of the information contained on the website, and the information contained on the website is not part of this document. We make available free of charge through our website our annual report on Form 10-K, quarterly reports on Form 10-Q, current reports on Form 8-K and amendments to those reports filed pursuant to the Securities Exchange Act of 1934, as amended, which we refer to as the Exchange Act, as soon as reasonably practicable after such documents are filed electronically with the Securities and Exchange Commission, which we refer to as the SEC. Our Code of Business Conduct and Ethics is also posted on our website. In addition, our earnings conference calls are archived for replay on our website. In August 2016, we submitted to the New York Stock Exchange, which we refer to as the NYSE, a certificate of our Chief Executive Officer certifying he is not aware of any violation by us of NYSE corporate governance listing standards. See further discussion in "Risk Factors" in Item 1A. We also filed as exhibits to our annual report on Form 10-K for our year ended 2015 certificates of the Chief Executive Officer and Chief Financial Officer as required under Section 302 of the Sarbanes-Oxley Act.
The public may read and copy any materials we file with the SEC at the SEC’s Public Reference Room at 100 F Street, NE, Washington, D.C. 20549. The public may obtain information about the operation of the Public Reference Room by calling the SEC at 1-800-SEC-0330. The SEC maintains an Internet site (http://www.sec.gov) which contains reports, proxy and information statements and other information regarding issuers that file electronically with the SEC.
Item 1A. Risk Factors
Many factors which affect our business and operations involve risks and uncertainties. The factors described below are some of the risks that could materially harm our business, financial conditions, results of operations or prospects.
Our substantial level of indebtedness could materially adversely affect our financial condition, liquidity and ability to service or refinance our debt, and prevent us from fulfilling our business obligations.
We currently have a substantial amount of outstanding indebtedness, which requires significant principal and interest payments. Approximately $30 million of this indebtedness matures in the next six months. As of our year ended 2016, our total indebtedness was approximately $1.0 billion, principally comprised of $20.5 million outstanding principal amount of 11.5% Notes; $5.5 million outstanding principal amount of 7% Notes; $540.0 million outstanding principal amount of 6.000% senior priority secured notes due 2019, which we refer to as the 6.000% Secured Notes; $81.7 million outstanding principal amount under the ABL Facility; $50.0 million outstanding principal amount of 4% senior secured notes due 2021, which we refer to as the 4% Secured Notes; $241.0 million outstanding principal amount of 8.500% junior priority secured notes due 2022, which we refer to as the 8.500% Notes; and $104.5 million outstanding principal amount of 6.000% senior unsecured notes due 2024, which we refer to as the 6.000% Unsecured Notes.
7
Our substantial level of indebtedness and the maturities thereof could also materially adversely affect our future operations, by, for example:
• | requiring a substantial portion of our cash flow from operations to be dedicated to the payment of principal and interest on indebtedness thereby reducing the availability of our cash flow to fund working capital, capital expenditures, acquisitions and other business purposes; |
• | making it more difficult for us to satisfy all of our debt obligations, thereby increasing the risk of triggering a cross-default provision; |
• | increasing our vulnerability to economic downturns or other adverse developments relative to less leveraged competitors; |
• | limiting our ability to obtain additional financing for working capital, capital expenditures, acquisitions or other corporate purposes in the future; |
• | increasing our cost of borrowing to satisfy business needs; or |
• | requiring refinancing, the successful completion of which cannot be assured. |
Our ability to pay the principal of, or to reduce or refinance, our outstanding indebtedness depends on many factors.
The 11.5% Notes and 7% Notes are scheduled to mature in May 2017, the 6.000% Secured Notes are scheduled to mature in August 2019, the ABL Facility is scheduled to mature in June 2021 (with a springing maturity of May 2019 in the event that more than $10 million of the 6.000% Secured Notes remain outstanding at such time), the 4% Secured Notes are scheduled to mature in December 2021, the 8.500% Notes are scheduled to mature in September 2022, and the 6.000% Unsecured Notes are scheduled to mature in May 2024. As noted above, we have called the remaining 11.5% Notes for redemption during the first quarter of 2016 and expect that the remaining $5.5 million of our 7% Notes will be addressed prior to or at maturity in May of 2017, all of which will be made using cash flow from operations or availability under our ABL Facility. Our ability to make scheduled payments on, or to reduce or refinance, our indebtedness will depend on our future financial and operating performance, and prevailing market conditions. Further, the use of cash for redemptions and maturities noted above reduces the availability of that cash for ongoing operations and future debt service, which increases the risk that at any time our available cash may be inadequate as needed, which risk would be exacerbated by a downturn in results of operations and cash flow. Our future performance will be affected by the impact of general economic, financial, competitive and other factors beyond our control, including the availability of financing in bank and capital markets. We cannot be certain our business will generate sufficient cash flow from operations in an amount necessary to service our debt. If we are unable to meet our debt obligations or to fund our other liquidity needs, we may be required to restructure or refinance all, or a portion of, our debt to avoid defaulting on our debt obligations or to meet other business needs. Such a refinancing of our indebtedness could result in higher interest rates, could require us to comply with more onerous covenants further restricting our business operations, could be restricted by another one of our debt instruments outstanding, or refinancing opportunities may not be available at all.
In connection with improving our capital structure through a number of initiatives, including working capital improvements, exiting underperforming, non-strategic or other businesses, and taking advantage of strategic refinancing opportunities and attractive leveraged loan and high yield debt market conditions, through the end of 2016 we reduced our outstanding debt and weighted average interest rate, which we believe will result in annual cash interest savings of approximately $40 million in 2017 as compared to 2012. There can be no assurances that these or other expected savings will be realized or that intervening developments will not occur to offset these savings.
The terms of our indebtedness impose significant restrictions on our operating and financial flexibility.
The agreements governing our outstanding indebtedness contain a number of significant restrictions and covenants which limit our ability (subject in each case to limited exceptions) to, among other things:
• | incur or guarantee additional indebtedness; |
• | make restricted payments, including dividends and prepaying indebtedness; |
• | create or permit certain liens; |
• | enter into business combinations and asset sale transactions; |
• | make investments, including capital expenditures; |
• | amend organizational documents and change accounting methods; |
• | enter into transactions with affiliates; and |
• | enter into new businesses. |
These restrictions could limit our ability to obtain future financing, make acquisitions or incur needed capital expenditures, withstand a future downturn in our business or the economy in general, conduct operations or otherwise take advantage of business
8
opportunities which may arise.
The ABL Facility also contains a negative covenant restricting dispositions, including dispositions the aggregate book value of which exceeds $35.0 million. Such dispositions are permitted, however, if within 360 days after the receipt of any net proceeds from such dispositions, we apply all of the net proceeds thereof: (i) to be reinvested in our business; (ii) to repay obligations under the ABL Facility under certain circumstances; or (iii) to make an offer to purchase the 6.000% Secured Notes. Each of the indentures governing the 6.000% Secured Notes, 8.500% Notes, 11.5% Notes and 6.000% Unsecured Notes and the indenture and note purchase agreement governing the 4% Secured Notes also contains a negative covenant requiring us to apply any net proceeds from an asset sale: (i) to be reinvested in our business; (ii) to repay certain of our indebtedness; or (iii) to make an offer to purchase the 6.000% Secured Notes, 8.500% Notes, 11.5% Notes, 6.000% Unsecured Notes or 4% Secured Notes, respectively. On January 19, 2016, we completed the sale of our Packaging Business, realizing total net cash proceeds of approximately $89.6 million. We have satisfied the reinvestment requirements set forth in our debt agreements with respect to such net cash proceeds.
In addition, the ABL Facility contains a minimum consolidated fixed charge coverage ratio with which, under certain circumstances, we must comply on a quarterly basis. Our ability to meet such fixed charge coverage ratio may be affected by events beyond our control, such as further deterioration in general economic conditions. We are also required to provide certain financial information on a quarterly basis. Our failure to maintain the fixed charge coverage ratio or effective internal controls could, in certain circumstances, prevent us from borrowing additional amounts, and could result in a default under the ABL Facility. Such a default could cause the indebtedness outstanding under the ABL Facility, and, by reason of cross-acceleration or cross-default provisions, the 6.000% Secured Notes, the 8.500% Notes, the 11.5% Notes, the 6.000% Unsecured Notes, the 4% Secured Notes and the 7% Notes, and any other indebtedness we may then have, to become immediately due and payable for which we would not have sufficient resources to satisfy.
If any such defaults occur and if we are unable to repay those amounts, the lenders under the ABL Facility, the indentures governing the 6.000% Secured Notes and 8.500% Notes and the indenture and note purchase agreement governing the 4% Secured Notes could initiate a bankruptcy or liquidation proceeding, or proceed against the collateral granted to them which secures that indebtedness. If the lenders under the ABL Facility and/or indentures governing the 6.000% Secured Notes and/or 8.500% Notes and/or the indenture and note purchase agreement governing the 4% Secured Notes were to accelerate the repayment of outstanding borrowings, we would not have sufficient resources to repay our indebtedness.
If we are able to incur additional borrowings, such borrowings could further exacerbate our risk exposure from debt.
Our 8.500% Notes indenture, 6.000% Secured Notes indenture, 6.000% Unsecured Notes indenture, 4% Secured Notes indenture and note purchase agreement, credit agreement governing our ABL Facility and our other debt instruments limit, but do not prohibit, us from incurring additional debt. If we are able to incur additional borrowings, the risks associated with our substantial leverage would increase.
United States and global economic conditions have adversely affected us and could continue to adversely affect us.
The United States and global economic conditions affect our results of operations and financial position. A significant part of our business relies on our customers’ printing spend. A prolonged downturn in the global economy and an uncertain economic outlook could further reduce the demand for printed materials and related offerings that we provide our customers. Consequently, reductions or delays in our customers’ spending could adversely impact our results of operations, financial position and cash flows. We believe any extended economic uncertainty will impact our operating results.
To the extent that we make select acquisitions, we may not be able to successfully integrate the acquired businesses into our business.
In the past, we have grown rapidly through acquisitions. We intend to continue to pursue select acquisition opportunities within our core and niche businesses. To the extent we seek to pursue additional acquisitions, we cannot be certain target businesses will be available on favorable terms or that, if we are able to acquire businesses on favorable terms, we will be able to successfully integrate or profitably manage them. Successfully integrating an acquisition involves minimizing disruptions and efficiently managing substantial changes, some of which may be beyond our control. An acquisition always carries the risk that such changes, including facility and equipment location, management and employee base, policies, philosophies and procedures, could have unanticipated effects, could require more resources than intended and could cause customers to temporarily or permanently seek alternate suppliers. A failure to realize acquisition synergies and savings could negatively impact the results of both our acquired and existing operations. Further, our ability to make acquisitions in the future will be limited by the availability to us of cash for that purpose.
9
A decline in our consolidated profitability or profitability within one of our individual reporting units could result in the impairment of assets, including goodwill and other long-lived assets.
We have material amounts of goodwill and other long-lived assets on our consolidated balance sheet. A decline in expected profitability, particularly the impact of an extended uncertainty in the United States and global economies, could call into question the recoverability of our related goodwill and other long-lived assets and require us to write down or write-off these assets.
The industries in which we operate our business are highly competitive and extremely fragmented.
The industries in which we compete are highly competitive and extremely fragmented. In the envelope market, we compete primarily with a few multi-plant and many single-plant companies servicing regional and local markets. In the commercial printing market, we compete against a few large, diversified and financially stronger printing companies, as well as smaller regional and local commercial printers, many of which are capable of competing with us on volume, price and production quality. We believe there currently is excess capacity in the industries in which we operate, which has resulted in substantial price competition which may continue as customers put product work out for competitive bid. We are constantly seeking ways to reduce our costs, become more efficient and attract customers. We cannot, however, be certain these efforts will be successful or our competitors will not be more successful in their similar efforts. If we fail to reduce costs and increase productivity, or to meet customer demand for new value-added products, services or technologies, we may face decreased revenues and profit margins in markets where we encounter price competition, which in turn could reduce our cash flow and profitability.
The printing business we compete in generally does not have long-term customer agreements, and our printing operations may be subject to quarterly and cyclical fluctuations.
The printing industry in which we compete is generally characterized by individual orders from customers or short-term contracts. A significant portion of our customers are not contractually obligated to purchase products or services from us. Most customer orders are for specific printing jobs, and repeat business largely depends on our customers’ satisfaction with our work product. Although our business does not depend on any one customer or group of customers, we cannot be sure that any particular customer will continue to do business with us for any period of time. In addition, the timing of particular jobs or types of jobs at particular times of year may cause significant fluctuations in the operating results of our operations in any given quarter. We depend to some extent on sales to certain industries, such as the financial services, advertising, pharmaceutical, automotive and office products industries. To the extent these industries experience downturns, the results of our operations may be adversely affected.
Factors affecting the United States Postal Service can impact demand for our products.
Postal costs are a significant component of many of our customers’ cost structure. Historically, increases in postal rates have resulted in reductions in the volume of mail sent, including direct mail, which is a meaningful portion of our envelope volume. As postal rate increases in the United States are outside our control, we can provide no assurance that any future increases in United States postal rates will not have a negative effect on the level of mail sent or the volume of envelopes purchased.
Factors other than postal rates which affect the volume of mail sent through the United States postal system may also negatively affect our business. Congress enacted a federal "Do Not Call" registry in response to consumer backlash against telemarketers. If similar legislation becomes enacted for direct mail advertisers, our business could be adversely affected. Additionally, the United States Postal Service has also indicated the potential need to reduce delivery days. We can provide no assurance that such a change would not impact our customers’ decisions to use direct mail products, which may in turn cause a decrease in our revenues and profitability; however, we do not expect such an impact.
The availability of the internet and other electronic media may adversely affect our business.
Our business is highly dependent upon the demand for envelopes sent through the mail. Such demand comes from utility companies, banks and other financial institutions, among other companies. Our printing business also depends upon demand for printed advertising among other products. Consumers increasingly use the internet and other electronic media to purchase goods and services, and for other purposes, such as paying bills and obtaining electronic versions of printed product. The level of acceptance of electronic media by consumers as well as the extent that consumers are replacing traditional printed reading materials with internet hosted media content or e-reading devices is difficult to predict. Advertisers use the internet and other electronic media for targeted campaigns directed at specific electronic user groups. We cannot be certain the acceleration of the trend towards electronic media will not cause a decrease in the demand for our products. If demand for our products decreases, our cash flow or profitability could materially decrease.
10
Increases in paper costs and any decreases in the availability of our raw materials could have a material effect on our business.
Paper costs represent a significant portion of our cost of materials. Changes in paper pricing generally do not affect the operating margins of our commercial printing business, because the transactional nature of the business allows us to pass on most announced increases in paper prices to our customers. However, our ability to pass on increases in paper prices is dependent upon the competitive environment at any given time. Paper pricing also affects the operating margins of our envelope business. We have historically been less successful in immediately passing on such paper price increases due to several factors, including contractual restrictions in certain cases and the inability to quickly update catalog prices in other instances. Moreover, rising paper costs, and their consequent impact on our pricing, could lead to a decrease in demand for our products.
We depend on the availability of paper in manufacturing most of our products. During periods of tight paper supply, many paper producers allocate shipments of paper based on the historical purchase levels of customers. In the past, we have occasionally experienced minor delays in delivery. Any future delay in availability could negatively impact our cash flow and profitability.
Increases in energy and transportation costs could have a material effect on our business.
Energy and transportation costs represent a large portion of our overall cost structure. Increases in the costs of these inputs may increase our overall costs. We may not be able to pass these costs on to our customers through higher prices. Increases in the cost of materials may adversely impact our customers’ demand for our products.
We depend on good labor relations.
As of our year ended 2016, we employed approximately 7,300 people worldwide, approximately 23% of whom were members of various local labor unions. If our unionized employees were to engage in a concerted strike or other work stoppage, or if other employees were to become unionized, we could experience a disruption of operations, higher labor costs or both. A lengthy strike could result in a material decrease in our cash flow or profitability.
Environmental laws may affect our business.
Our operations are subject to federal, state, local and foreign environmental laws and regulations, including those relating to air emissions, wastewater discharge, waste generation, handling, management and disposal, and remediation of contaminated sites. Currently unknown environmental conditions or matters at our existing and prior facilities, new laws and regulations, or stricter interpretations of existing laws and regulations could result in increased compliance or remediation costs which, if substantial, could have a material effect on our business or operations in the future.
We are dependent on key management personnel.
Our success will depend to a significant degree on our executive officers and other key management personnel. We cannot be certain we will be able to retain our executive officers and key personnel, or attract additional qualified management in the future. In addition, the success of any acquisitions we may pursue may depend, in part, on our ability to retain management personnel of the acquired companies. We do not carry key person insurance on any of our managerial personnel.
Our business could be materially adversely affected by any failure, interruption or security lapse of our information technology systems.
We are increasingly dependent on information technology systems to process transactions, manage inventory, purchase, sell and ship goods on a timely basis and maintain cost-efficient operations. We use information systems to support decision making and to monitor business performance. Our information technology systems depend on global communications providers, telephone systems, hardware, software and other aspects of internet infrastructure which can experience significant system failures and outages. Our systems are susceptible to outages due to fire, floods, power loss, telecommunications failures and similar events. Despite the implementation of network security measures, our systems are vulnerable to computer viruses and similar disruptions from unauthorized tampering with our systems. In addition, cybersecurity threats are evolving and include, but are not limited to, malicious software, attempts to gain unauthorized access to data, denial of service attacks and other electronic security breaches which could lead to disruptions in critical systems, unauthorized release of confidential or otherwise protected information and corruption of data. The occurrence of these or other events could disrupt or damage our information technology systems and inhibit internal operations, the ability to provide customer service or provide management with accurate financial and operational information essential for making decisions at various levels of management.
11
Item 1B. Unresolved Staff Comments
None.
Item 2. Properties
We currently occupy 44 manufacturing facilities within our continuing operations, primarily in North America, of which 14 are owned and 30 are leased. We lease our corporate headquarters space in Stamford, Connecticut and we lease additional facilities for our sales and support teams. We believe we have adequate facilities to conduct our current and future operations.
Item 3. Legal Proceedings
From time to time we may be involved in claims or lawsuits that arise in the ordinary course of business. Accruals for claims or lawsuits have been provided for to the extent losses are deemed probable and estimable. Although the ultimate outcome of these claims or lawsuits cannot be ascertained, on the basis of present information and advice received from counsel, it is our opinion that the disposition or ultimate determination of such claims or lawsuits will not have a material effect on our consolidated financial statements.
In the case of administrative proceedings related to environmental matters involving governmental authorities, we do not believe that any imposition of monetary damages or fines would be material.
Item 4. Mine Safety Disclosures
Not applicable.
12
PART II
Item 5. Market for Registrant’s Common Equity, Related Shareholder Matters and Issuer Purchases of Equity Securities
The certificate of incorporation, as amended, of Cenveo states that the total authorized capital stock is 15 million shares of common stock, $0.01 par value per share, which we refer to as Common Stock. Each share of voting Common Stock is entitled to one vote in respect of each share of Cenveo voting Common Stock held of record on all matters submitted to a vote of stockholders.
On July 8, 2016, we announced a reverse split of our Common Stock, at a ratio of 1-for-8, effective July 13, 2016, which we refer to as the Reverse Stock Split. The Common Stock began trading on a split-adjusted basis on July 14, 2016. The Reverse Stock Split was approved by our stockholders at the annual meeting of the stockholders held on May 26, 2016. As a result of the Reverse Stock Split, each eight pre-split shares of Common Stock outstanding were automatically combined into one new share of Common Stock without any action on the part of the respective holders, and the number of outstanding common shares on the date of the split was reduced from approximately 68.5 million shares to approximately 8.5 million shares. The Reverse Stock Split also applied to Common Stock issuable upon the exchange of our outstanding 7% Notes and upon the exercise of our outstanding warrants. Additionally, the Reverse Stock Split applied to our outstanding stock options, restricted share units, which we refer to as RSUs, and performance share units, which we refer to as PSUs; collectively which we refer to as the Equity Awards. In addition, the authorized Common Stock was initially increased from 100 million to 120 million shares and then adjusted in the Reverse Stock Split from 120 million to 15 million shares. Our historical consolidated financial statements have been retroactively adjusted to give recognition to the Reverse Stock Split for all periods presented.
Our Common Stock is traded on the NYSE under the symbol "CVO." As of January 26, 2017, there were 318 shareholders of record and, as of that date, we estimate there were approximately 8,253 beneficial owners holding stock in nominee or "street" name. The following table sets forth, for the periods indicated, the range of the high and low closing prices for our Common Stock as reported by the NYSE:
2016 | High | Low | |||||
First Quarter | $ | 7.20 | $ | 2.88 | |||
Second Quarter | 8.96 | 2.96 | |||||
Third Quarter | 9.80 | 5.52 | |||||
Fourth Quarter | 8.32 | 6.66 | |||||
2015 | High | Low | |||||
First Quarter | $ | 17.44 | $ | 14.80 | |||
Second Quarter | 20.64 | 15.68 | |||||
Third Quarter | 17.76 | 12.24 | |||||
Fourth Quarter | 16.24 | 6.80 | |||||
We have not paid a dividend on our Common Stock since our incorporation and do not anticipate paying dividends in the foreseeable future as the instruments governing a portion of our debt obligations limit our ability to pay Common Stock dividends.
For each of the years ended 2016 and 2015, we had 25,000 shares of preferred stock authorized, of which no shares were issued or outstanding.
See Note 12 to our consolidated financial statements for information regarding our stock-based compensation plans. Compensation information required by Item 11 will be presented in our 2017 definitive proxy statement, which is incorporated herein by reference.
13
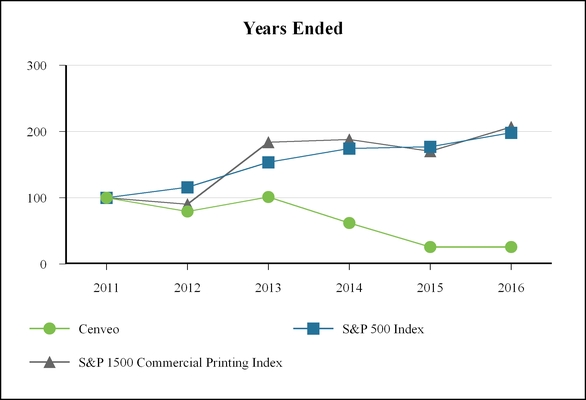
The graph below compares five-year returns of our Common Stock with those of the S&P 500 Index and the S&P 1500 Commercial Printing Index. The graph assumes that $100 was invested as of our year ended 2011 in each of our Common Stock, the S&P 500 Index, and the S&P 1500 Commercial Printing Index and that all dividends were reinvested. The S&P 1500 Commercial Printing Index is a capitalization weighted index designed to measure the performance of all NYSE-traded stocks in the commercial printing sector.
Years Ended | ||||||||||||||||||
2011 | 2012 | 2013 | 2014 | 2015 | 2016 | |||||||||||||
Cenveo | 100.00 | 79.41 | 101.18 | 61.77 | 25.63 | 25.70 | ||||||||||||
S&P 500 Index | 100.00 | 116.00 | 153.57 | 174.60 | 177.01 | 198.18 | ||||||||||||
S&P 1500 Commercial Printing Index | 100.00 | 90.39 | 183.77 | 188.15 | 170.18 | 206.87 | ||||||||||||
14
Item 6. Selected Financial Data
The following table sets forth our selected financial and operating data for the years ended December 31, 2016, January 2, 2016, December 27, 2014, December 28, 2013 and December 29, 2012, which we refer to as the years ended 2016, 2015, 2014, 2013 and 2012, respectively.
The following consolidated selected financial data has been derived from, and should be read in conjunction with, the related consolidated financial statements, either elsewhere in this report or in reports we have previously filed with the SEC. Additionally, it reflects the retroactive adjustment of amounts to give recognition to the discontinued operations for all periods presented for our Packaging Business, our Custom Envelope Group, our San Francisco manufacturing facility, our documents and forms business, and our wide-format papers business.
CENVEO, INC. AND SUBSIDIARIES (in thousands, except per share data) | |||||||||||||||||||
Years Ended | |||||||||||||||||||
Statement of Operations: | 2016 | 2015 | 2014 | 2013 | 2012 | ||||||||||||||
Net sales | $ | 1,660,001 | $ | 1,741,779 | $ | 1,761,315 | $ | 1,588,702 | $ | 1,544,073 | |||||||||
Restructuring and other charges | 11,954 | 12,576 | 21,526 | 12,586 | 26,066 | ||||||||||||||
Impairment of intangible assets | — | — | — | 24,493 | — | ||||||||||||||
Operating income | 76,032 | 83,793 | 42,774 | 32,041 | 80,214 | ||||||||||||||
(Gain) loss on early extinguishment of debt, net (1) | (82,481 | ) | 1,252 | 27,449 | 11,324 | 12,487 | |||||||||||||
Income (loss) from continuing operations (3) | 70,846 | (19,461 | ) | (95,053 | ) | (86,276 | ) | (94,321 | ) | ||||||||||
(Loss) income from discontinued operations, net of taxes (2)(4)(5) | (2,897 | ) | (11,390 | ) | 11,190 | 17,490 | 14,434 | ||||||||||||
Net income (loss) (1)(2)(3)(4)(5) | 67,949 | (30,851 | ) | (83,863 | ) | (68,786 | ) | (79,887 | ) | ||||||||||
Income (loss) per share from continuing operations: | |||||||||||||||||||
Basic | 8.31 | (2.30 | ) | (11.36 | ) | (10.69 | ) | (11.87 | ) | ||||||||||
Diluted | 7.63 | (2.30 | ) | (11.36 | ) | (10.69 | ) | (11.87 | ) | ||||||||||
(Loss) income per share from discontinued operations: | |||||||||||||||||||
Basic | (0.34 | ) | (1.34 | ) | 1.34 | 2.17 | 1.82 | ||||||||||||
Diluted | (0.31 | ) | (1.34 | ) | 1.34 | 2.17 | 1.82 | ||||||||||||
Net income (loss) per share: | |||||||||||||||||||
Basic | 7.97 | (3.64 | ) | (10.02 | ) | (8.52 | ) | (10.05 | ) | ||||||||||
Diluted | 7.32 | (3.64 | ) | (10.02 | ) | (8.52 | ) | (10.05 | ) | ||||||||||
Balance Sheet data: | |||||||||||||||||||
Total assets | $ | 912,959 | $ | 1,082,026 | $ | 1,135,721 | $ | 1,195,316 | $ | 1,179,156 | |||||||||
Total long-term debt, including current maturities | 1,018,666 | 1,208,623 | 1,210,380 | 1,166,784 | 1,160,835 | ||||||||||||||
__________________________
(1) | During the year ended 2016, we completed several transactions which resulted in a net gain on early extinguishment of debt. See further detail in Note 8 to our consolidated financial statements. |
(2) | In connection with the sale of the Packaging Business, we recorded a gain on sale of $1.4 million for the year ended 2016 and a loss on sale of $5.0 million for the year ended 2015. Additionally, we recorded a non-cash goodwill impairment charge of $9.9 million related to this transaction for the year ended 2015. |
(3) | Includes $40.6 million and $56.5 million valuation allowance charges related to deferred tax assets for the years ended 2013 and 2012, respectively. |
(4) | Includes $14.9 million gain on sale of discontinued operations, net of tax expense of $10.7 million for the year ended 2013. |
(5) | Includes $6.3 million loss on sale of discontinued operations, net of tax benefit of $2.6 million for the year ended 2012. |
15
Item 7. Management’s Discussion and Analysis of Financial Condition and Results of Operations
This Management's Discussion and Analysis of Financial Condition and Results of Operations should be read in conjunction with our consolidated financial statements included in Item 8 of this Annual Report on Form 10-K, which we refer to as the Form 10-K. Cenveo, Inc. and its subsidiaries are referred to herein as "Cenveo," the "Company," "we," "our," or "us."
Certain statements we make in this report constitute forward-looking statements under the Private Securities Litigation Reform Act of 1995. See Cautionary Statements regarding forward-looking statements in Item 1, and "Risk Factors" in Item 1A.
Factors which could cause actual results to differ materially from management’s expectations include, without limitation: (i) our substantial level of indebtedness could materially adversely affect our financial condition, liquidity and ability to service or refinance our debt, and prevent us from fulfilling our business obligations; (ii) our ability to pay the principal of, or to reduce or refinance, our outstanding indebtedness; (iii) the terms of our indebtedness imposing significant restrictions on our operating and financial flexibility; (iv) additional borrowings available to us could further exacerbate our risk exposure from debt; (v) United States and global economic conditions have adversely affected us and could continue to adversely affect us; (vi) our ability to successfully integrate acquired businesses with our business; (vii) a decline in our consolidated profitability or profitability within one of our individual reporting units could result in the impairment of our assets, including goodwill and other long-lived assets; (viii) the industries in which we operate our business are highly competitive and extremely fragmented; (ix) a general absence of long-term customer agreements in our industry, subjecting our business to quarterly and cyclical fluctuations; (x) factors affecting the United States postal services impacting demand for our products; (xi) the availability of the Internet and other electronic media adversely affecting our business; (xii) increases in paper costs and decreases in the availability of raw materials; (xiii) increases in energy and transportation costs; (xiv) our labor relations; (xv) our compliance with environmental laws; (xvi) our dependence on key management personnel; and (xvii) any failure, interruption or security lapse of our information technology systems. This list of factors is not exhaustive, and new factors may emerge or changes to the foregoing factors may occur that would impact our business. Additional information regarding these and other factors can be found elsewhere in this report, and in our other filings with the Securities and Exchange Commission, which we refer to as the SEC.
Introduction and Executive Overview
We are a diversified manufacturing company focused on print-related products. Our broad portfolio of products includes envelope converting, commercial printing, and label manufacturing. We operate a global network of strategically located manufacturing facilities, serving a diverse base of customers ranging from Fortune 100 companies to individual consumers. Our business strategy has been, and continues to be, focused on improving our operating margins, improving our capital structure and providing quality product offerings to our customers. We operate our business in three complementary reportable segments: the envelope segment, the print segment and the label segment.
See Part 1, Item 1 of this Form 10-K for a more complete description of our business.
2016 Overview and 2017 Outlook
Generally, print-related industries remain highly fragmented and extremely competitive due to over-capacity and pricing pressures. We believe these factors, combined with uncertain economic conditions in the United States, will continue to impact our results of operations. However, we believe the diversification of our revenue and operating income along with the market dynamics that exist within certain markets in which we operate will provide an opportunity for us to have operating trends that perform better than certain other print dynamic markets.
Our current management focus is on the following areas:
Improving Operating Margins
In 2014, we substantially completed our integration of certain assets of National Envelope Corporation, which we refer to as National, which allowed us to focus on profitability improvement and other cost reduction actions in our envelope platform throughout 2015 and into early 2016. We believe the accelerated integration plan we completed during 2014 has provided meaningful improvements in our envelope segment's operating results during 2015 and 2016, as we realized significant increases in gross profit and operating income, as compared to 2014.
During 2016, we experienced significant sales volume decline and increased price pressures within our office product envelope and related wholesale envelope product lines due to measures undertaken by our customers in those product lines as a result of inventory management initiatives and continued closure of distribution centers and retail store fronts. We believe this
16
was accelerated during 2016 as a result of a regulatory decision mid-way through our 2016 fiscal year. The decline in our sales and operating income in these product lines were partially offset by increased demand for direct mail envelopes which contributed mid-single digit growth compared to prior year and increased operating income. Our commercial printing operations performed generally in line with our expectations in regards to both sales and operating income. Our label segment experienced sales declines primarily driven by our decision to exit our coating operation combined with lower sales in our long-run label product line due to decisions to exit lower margin product sets and lower than expected sales within our high margin custom label product sets. The operating margin of our label segment decreased primarily due to the lower sales volume in our high margin custom label business being partially offset by the benefits of the 2016 Label Transaction, as discussed further below.
With the decline in our office product envelope and related wholesale envelope product lines and other continued marketplace challenges within our industry, we initiated a two year $50 million cost savings and profitability plan, which we refer to as the 2017 Profitability Improvement Plan, to offset the impact of these marketplace challenges and continue to improve our consolidated operating margins. With this plan, we expect higher restructuring, impairment and other charges primarily resulting from severance expense, facility rationalization costs and impairments associated with equipment footprint reductions. We believe these incremental charges will ultimately be offset by improved gross profit margins and lower selling general and administrative expenses as we operate through 2017 and into 2018; however, this cannot be assured. These actions are aimed to reduce our fixed cost infrastructure, back office headcount and further streamline our geographic footprint. We believe that despite the facility rationalization, we will still be able to serve our national customer base with less facilities at the same or improved service levels that they are used to receiving from us.
During 2017, we expect sales in our envelope segment will continue to see similar direct mail growth trends consistent with the past several years, which will be offset by lower sales due to reduced purchasing patterns within our office product envelope and wholesale envelope product lines. We expect our commercial print sales to decline at a consistent rate similar to the past several years. We expect our label segment sales will decline slightly as we reach the anniversary of our decision to exit our coating operation, which we expect will be offset by increased sales within both our custom label and long-run label product lines.
Improving our Capital Structure
Since the beginning of 2012, we have been focused on improving our capital structure through a number of initiatives including working capital improvements, exiting underperforming or non-strategic businesses, and taking advantage of strategic refinancing opportunities and attractive leveraged loan and high yield debt market conditions. In connection with these activities, through the end of 2016, we continued to successfully reduce our outstanding debt and weighted average interest rate, which will result in annual cash interest savings of approximately $40 million in 2017 as compared to 2012. We have been able to accomplish this while reinvesting cash into our businesses via three acquisitions and focused capital expenditures.
Our continued operational improvements have provided us greater flexibility to address our higher interest rate debt instruments in 2016. During the first quarter of 2016, we extinguished $34.5 million of our 7% senior exchangeable notes due 2017, which we refer to as the 7% Notes, and $10.0 million of our 11.5% senior notes due 2017, which we refer to as the 11.5% Notes.
During the second quarter of 2016, we closed on an exchange offer, which we refer to as the Exchange Offer, whereby approximately 80% of our 11.5% Notes were exchanged for newly issued 6.000% senior unsecured notes due 2024, which we refer to as the 6.000% Unsecured Notes, and warrants, which we refer to as the Warrants, to purchase shares of common stock, par value $0.01 per share, of Cenveo, Inc., which we refer to as the Common Stock, representing 16.6% of our outstanding Common Stock as of June 10, 2016. Each Warrant is currently exercisable for 0.125 shares of Common Stock (as adjusted as a result of the Company’s recent reverse stock split). For each $1,000 principal amount of 11.5% Notes exchanged, the holder received $700 aggregate principal amount of 6.000% Unsecured Notes and Warrants to purchase 9.25 shares of Common Stock. Upon closing the Exchange Offer, we emerged with lower overall debt, stronger cash flow due to significantly lower future interest expense, and no significant scheduled debt maturities until August 2019.
During the third quarter of 2016, we completed the last transactions contemplated by the Support Agreement, dated as of May 10, 2016, pursuant to which Allianz Global Investors U.S. LLC, which we refer to as Allianz, agreed to, among other things, tender and sell to us all of the 7% Notes owned by Allianz, which we refer to as the 7% Note Purchases, in the aggregate principal amount of $37.5 million, which we refer to as the Allianz 7% Note Purchase, in exchange for: (a) payment in cash in an amount equal to (i) the aggregate principal amount of such 7% Notes multiplied by 0.6 plus (ii) an amount of interest on the amount payable pursuant to the immediately preceding clause (i) at an annual interest rate of 7% per annum, such interest accruing from June 10, 2016 until (and including) the closings of the purchases and computed based on a year of 360 days; (b) payment in cash of interest that shall have accrued in respect of such 7% Notes in accordance with the indenture relating to such 7% Notes but remained unpaid at the closings of the purchases; and (c) delivery to Allianz of Warrants to purchase Common Stock, representing in the aggregate 3.3% of the outstanding Common Stock as of June 10, 2016.
17
In connection with such agreement, during 2016 we repurchased an aggregate of $37.5 million of our 7% Notes for $22.5 million and issued an aggregate of 2,239,827 Warrants.
Concurrent with the above transactions, we amended our asset-based revolving credit facility, which we refer to as the ABL Facility, to, among other things, extend its term to 2021 and reduce the commitments thereunder by $50 million to $190 million, which we refer to as the ABL Amendment No. 4. The ABL Facility now matures in June 2021, with a springing maturity of May 2019 ahead of our existing 6.000% senior priority secured notes due 2019, which we refer to as the 6.000% Secured Notes, in the event that more than $10 million of the 6.000% Secured Notes remain outstanding at such time. On the same date, we entered into a secured indenture and note purchase agreement with Allianz pursuant to which we issued new secured notes in an aggregate principal amount of $50.0 million bearing interest at 4% per annum, which we refer to as the 4% Secured Notes. We applied the proceeds to reduce the outstanding principal amount under the ABL Facility. The 4% Secured Notes mature in December 2021.
Subsequent to the completion of the Exchange Offer and the Allianz 7% Note Purchase, during the fourth quarter of 2016, we repurchased $20.0 million of our 11.5% Notes and $5.7 million of our 7% Notes at par. After these transactions, approximately $20.5 million and $5.5 million aggregate principal amount of our 11.5% Notes and 7% Notes, respectively, remain outstanding. Additionally, we repurchased $7.0 million of our 8.500% junior priority secured notes due 2022, which we refer to as the 8.500% Notes, for $4.6 million.
On January 13, 2017, we filed a notice of redemption calling the $20.5 million remaining principal balance of our 11.5% Notes at par. We intend to redeem the full outstanding principal balance of our 11.5% Notes during the first quarter of 2017. With the completion of our call notice on the remaining portion of our 11.5% Notes we will have addressed all but $5.5 million of our debt maturing in 2017. We expect the remaining $5.5 million will be addressed prior to or at maturity in May of 2017 using cash flow from operations or availability under our ABL Facility.
Provide Quality Product Offerings
We conduct regular reviews of our product offerings, manufacturing processes and distribution methods to ensure that they meet the changing needs of our customers. We have recently made, and expect to continue to make, technology investments that enhance our sales organization's ability to offer our customers a tool which allows them to manage their programs from content through distribution. We believe our multi-product offerings along with the advancement of our current technology platform will allow us to penetrate deeper into our customer’s supply chains. Additionally, with the acquisition of certain assets of Asendia USA, Inc., which we refer to as Asendia, on August 7, 2015, we added letter shop, data processing, bindery and digital print offerings to our commercial printing operations, all of which are areas we believe add value to our capabilities of serving our customer’s needs in-house. Lastly, we are also investing in digital and variable technology as we have seen increased customer demand for these technologies. By expanding our product offerings, we intend to increase cross-selling opportunities to our existing customer base and mitigate the impact of any decline in a given market or product.
Strategic Asset Review
During 2015, we began actively moving forward with our plan to review and potentially divest certain non-strategic assets. As a result of this strategic review, during the first quarter of 2016, we completed the sale of our folded carton and shrink sleeve packaging businesses, along with our top-sheet lithographic print operation, which we refer to as the Packaging Business.
During 2015, we also completed two small strategic transactions, which we refer to as the 2015 Label Transactions, which helped facilitate the exit of two non-core product lines reported within our label operating segment. As a result of these transactions, we received $2.2 million in cash proceeds, primarily from selling customer lists. Additionally, in May 2016, in connection with our previously-announced plan to exit our coating operation, we sold certain proprietary rights and specific production equipment used to produce this customer’s specific products. As a result, we recognized a gain of approximately $2.0 million associated with the sale of the proprietary rights and equipment, which was recorded in other income, net during 2016. As part of this transaction, we also earned production incentives of $3.0 million during 2016 associated with incremental production and delivery targets with this customer, which were recorded in net sales. We refer to this transaction as the 2016 Label Transaction.
18
We believe there continues to be opportunities for further transactions of various magnitudes given our desire to tighten our management focus and minimize non-core product lines and monetize assets opportunistically.
Acquisitions
On August 7, 2015, we acquired certain assets of Asendia. The acquired assets provide letter shop, data processing, bindery and digital printing offerings. We also added approximately 40 employees.
Discontinued Operations
During 2015, we began actively moving forward with our plan to review and potentially divest certain non-strategic assets. As a result of this strategic review, during the first quarter of 2016, we completed the sale of our Packaging Business.
The financial results for this transaction have been accounted for as discontinued operations for all periods presented.
Reportable Segments
We operate three complementary reportable segments: envelope, print and label. Prior to the disposition of the Packaging Business, we operated four operating segments: envelope, print, label and packaging. Based upon similar economic characteristics and management reporting, prior to the disposition of the Packaging Business, we previously aggregated the label and packaging operating segments to have a total of three reportable segments: envelope, print and label and packaging.
Consolidated Operating Results
A summary of our consolidated statements of operations is presented below. The summary presents reported net sales and operating income (loss). See Segment Operations below for a summary of net sales and operating income (loss) of our reportable segments we use internally to assess our operating performance. Our reporting periods for 2016 and 2015 consisted of 52 and 53 week periods, respectively, and ended on December 31, 2016 and January 2, 2016, respectively. We refer to such periods herein as: (i) the year ended 2016; and (ii) the year ended 2015. All references to years and year-ends herein relate to fiscal years rather than calendar years.
19
For The Years Ended | ||||||||
2016 | 2015 | |||||||
(in thousands, except per share amounts) | ||||||||
Net sales | $ | 1,660,001 | $ | 1,741,779 | ||||
Operating income (loss): | ||||||||
Envelope | $ | 60,684 | $ | 66,424 | ||||
Print | 17,613 | 15,122 | ||||||
Label | 30,549 | 39,533 | ||||||
Corporate | (32,814 | ) | (37,286 | ) | ||||
Total operating income | 76,032 | 83,793 | ||||||
Interest expense, net | 85,753 | 100,805 | ||||||
(Gain) loss on early extinguishment of debt, net | (82,481 | ) | 1,252 | |||||
Other income, net | (2,344 | ) | (3,196 | ) | ||||
Income (loss) from continuing operations before income taxes | 75,104 | (15,068 | ) | |||||
Income tax expense | 4,258 | 4,393 | ||||||
Income (loss) from continuing operations | 70,846 | (19,461 | ) | |||||
Loss from discontinued operations, net of taxes | (2,897 | ) | (11,390 | ) | ||||
Net income (loss) | $ | 67,949 | $ | (30,851 | ) | |||
Income (loss) per share – basic: | ||||||||
Continuing operations | $ | 8.31 | $ | (2.30 | ) | |||
Discontinued operations | (0.34 | ) | (1.34 | ) | ||||
Net income (loss) | $ | 7.97 | $ | (3.64 | ) | |||
Income (loss) per share – diluted: | ||||||||
Continuing operations | $ | 7.63 | $ | (2.30 | ) | |||
Discontinued operations | (0.31 | ) | (1.34 | ) | ||||
Net income (loss) | $ | 7.32 | $ | (3.64 | ) | |||
20
Net Sales
Net sales decreased $81.8 million, or 4.7%, for the year ended 2016, as compared to the year ended 2015, primarily due to lower sales from our envelope segment of $43.6 million, lower sales from our label segment of $20.7 million, and lower sales from our print segment of $17.5 million.
See Segment Operations below for a detailed discussion of the primary factors affecting the change in our net sales by reportable segment.
Operating Income
Operating income decreased $7.8 million, or 9.3%, for the year ended 2016, as compared to the year ended 2015. This decrease was due to: (i) a decrease in operating income from our label segment of $9.0 million; and (ii) a decrease in operating income from our envelope segment of $5.7 million; partially offset by (i) lower corporate expenses of $4.5 million; and (ii) an increase in operating income from our print segment of $2.5 million.
See Segment Operations below for a more detailed discussion of the primary factors for the changes in operating income by reportable segment.
Interest Expense
Interest expense decreased $15.1 million to $85.8 million for the year ended 2016, as compared to $100.8 million for the year ended 2015. The decrease was primarily due to a lower weighted average interest rate for 2016, primarily due to the Exchange Offer; the partial retirement of our 11.5% Notes during 2016 and 2015 and the partial retirement of our 7% Notes during 2016. Interest expense for the year ended 2016 reflected average outstanding debt of approximately $1.1 billion and a weighted average interest rate of 6.8%, compared to average outstanding debt of approximately $1.2 billion and a weighted average interest rate of 7.2% for the year ended 2015.
(Gain) Loss on Early Extinguishment of Debt
2016 Extinguishments
For the year ended 2016, we recorded a total gain on early extinguishment of debt of $82.5 million, comprised of the following transactions:
Subsequent to the completion of the Exchange Offer and the Allianz 7% Note Purchase, we recorded a gain on early extinguishment of debt of $2.3 million related to the repurchase of $7.0 million of our 8.500% Notes, of which $2.5 million related to a discount on the purchase price, partially offset by a write-off of unamortized debt issuance costs of $0.1 million and a write-off of original issuance discount of $0.1 million. We also recorded a loss on early extinguishment of debt of $0.1 million related to the repurchase of $20.0 million of our 11.5% Notes, all of which related to the write-off of unamortized debt issuance costs and original issuance discount. Additionally, we recorded a loss on early extinguishment of debt of less than $0.1 million related to the repurchase of $5.7 million of our 7% Notes, all of which related to the write-off of unamortized debt issuance costs.
In connection with the Allianz 7% Note Purchase, we recorded a gain on early extinguishment of debt of $12.8 million related to the repurchase of $37.5 million of our 7% Notes, of which $15.0 million related to a discount on the purchase price, partially offset by the fair value of the Warrants issued of $1.3 million, $0.6 million of transaction fees and expenses and a write-off of unamortized debt issuance costs of $0.3 million.
In connection with the Exchange Offer, we recorded a gain on early extinguishment of debt of $46.1 million, of which $49.6 million related to a discount on the difference of the net carrying value of the extinguished 11.5% Notes and the fair value of the new 6.000% Unsecured Notes, partially offset by a write-off of unamortized debt issuance costs of $0.8 million, a write-off of original issuance discount of $1.2 million, and $1.5 million of transaction fees and expenses.
In connection with ABL Amendment No. 4, we recorded a loss on early extinguishment of debt of $0.2 million related to the write off of unamortized debt issuance costs.
Prior to the Exchange Offer, we recorded a gain on early extinguishment of debt of $16.5 million related to the repurchase of $34.5 million of our 7% Notes, of which $16.8 million related to a discount on the purchase price, partially offset by a write-off of unamortized debt issuance costs of $0.3 million. Additionally, we recorded a gain on early extinguishment of debt of $5.1
21
million related to the repurchase of $10.0 million of our 11.5% Notes, of which $5.3 million related to a discount on the purchase, partially offset by a write-off of unamortized debt issuance costs of $0.1 million and a write-off of original issuance discount of $0.1 million.
2015 Extinguishments
For the year ended 2015, we recorded a total loss on early extinguishment of debt of $1.3 million. We paid in full an existing equipment loan, which had a remaining principal balance at the time of $12.3 million. In connection with this extinguishment, we recorded a loss on early extinguishment of debt of $0.7 million, of which $0.5 million related to the write-off of unamortized debt issuance costs and $0.2 million related to prepayment fees. Additionally, we recorded a loss on early extinguishment of debt of $0.6 million related to the repurchase of $22.6 million of our 11.5% Notes, of which $0.2 million related to the write-off of unamortized debt issuance costs, $0.2 million related to the write-off of original issuance discount, and $0.2 million related to a premium paid over the principal amount upon repurchase.
Other Income, Net
For the year ended 2016, we recognized other income, net, of $2.3 million, primarily comprised of a gain of approximately $2.1 million recognized in connection with a sale of a manufacturing facility within our envelope segment and a gain of approximately $2.0 million in connection with the 2016 Label Transaction, partially offset by other non-operating expenses.
For the year ended 2015, we recognized other income, net, of $3.2 million. This is primarily comprised of a gain on sale of a manufacturing facility within our print segment of $3.1 million and a gain of $2.2 million related to the 2015 Label Transactions, partially offset by other non-operating expenses and losses related to foreign currency exchange.
Income Taxes
For The Years Ended | ||||||||
2016 | 2015 | |||||||
Income tax expense from U.S. operations | $ | 3,307 | $ | 3,533 | ||||
Income tax expense from foreign operations | 951 | 860 | ||||||
Income tax expense | $ | 4,258 | $ | 4,393 | ||||
Effective income tax rate | 5.7 | % | (29.2 | )% | ||||
Income Tax Expense
In 2016, we had an income tax expense of $4.3 million and our effective tax rate during 2016 differed from the federal statutory rate primarily as a result of having a full valuation allowance related to our net deferred tax assets in the United States.
In 2015, we had an income tax expense of $4.4 million and our effective tax rate during 2015 differed from the federal statutory rate primarily as a result of having a full valuation allowance related to our net deferred tax assets in the United States.
We do not believe our unrecognized tax benefits will change significantly during the next twelve months. As of the year ended 2016, our federal tax loss carryforward was $220.0 million after utilization of $112.5 million during 2016, primarily due to gains on early extinguishment of debt and the sale of our Packaging Business.
Valuation Allowance
We review the likelihood that we will realize the benefit of our deferred tax assets and therefore the need for valuation allowances on a quarterly basis, or more frequently if events indicate that a review is required. In determining the requirement for a valuation allowance, the historical and projected financial results of the legal entity or consolidated group recording the net deferred tax asset is considered, along with all other available positive and negative evidence. The factors considered in our determination of the probability of the realization of the deferred tax assets include, but are not limited to: recent historical financial results, historical taxable income, projected future taxable income, the expected timing of the reversals of existing temporary differences, the duration of statutory carryforward periods and tax planning strategies. If, based upon the weight of available evidence, it is more likely than not the deferred tax assets will not be realized, a valuation allowance is recorded.
22
Concluding that a valuation allowance is not required is difficult when there is significant negative evidence which is objective and verifiable, such as cumulative losses in recent years. We utilize a rolling twelve quarters of pre-tax income or loss adjusted for significant permanent book to tax differences, as well as non-recurring items, as a measure of our cumulative results in recent years. In the United States, our analysis indicates that we have cumulative three year historical losses on this basis. While there are significant impairment, restructuring and refinancing charges driving our cumulative three year loss, this is considered significant negative evidence which is objective and verifiable and therefore, difficult to overcome. However, the three year loss position is not solely determinative and accordingly, we consider all other available positive and negative evidence in our analysis. Based upon our analysis, which incorporated the excess capacity and pricing pressure we have experienced in certain of our product lines, we believe it is more likely than not that the net deferred tax assets in the United States will not be fully realized in the future. Accordingly, we have a valuation allowance related to those net deferred tax assets of $117.8 million as of the year ended 2016. Deferred tax assets related to certain net operating losses also did not reach the more likely than not realizability criteria and accordingly, were subject to a valuation allowance, the balance of which, as of the year ended 2016, was $11.4 million. Our valuation allowance declined $34.0 million from January 2, 2016, primarily due to the $112.5 million federal tax loss carryforward utilization in 2016 which was driven primarily from the gain on early extinguishment of debt and the sale of our Packaging Business. We will continue to closely monitor our position with respect to the full realization of our net deferred tax assets and the corresponding valuation allowances on those assets and make adjustments as needed in the future as our facts and circumstances dictate.
There is no corresponding income tax benefit recognized with respect to losses incurred and no corresponding income tax expense recognized with respect to earnings generated in jurisdictions with a valuation allowance. This causes variability in our effective tax rate. We intend to maintain the valuation allowances until it is more likely than not that the net deferred tax assets will be realized. If operating results improve on a sustained basis, or if certain tax planning strategies are implemented, our conclusions regarding the need for valuation allowances could change, resulting in the reversal of the valuation allowances in the future, which could have a significant impact on income tax expense in the period recognized and subsequent periods.
Loss from Discontinued Operations, net of taxes
For the years ended 2016 and 2015, we had a loss from discontinued operations, net of taxes, of $2.9 million and $11.4 million, respectively. On January 19, 2016, we completed the sale of our Packaging Business. We received total cash proceeds of approximately $89.6 million, net of transaction costs of approximately $6.3 million. This resulted in the recognition of a total loss of $3.6 million, of which a gain of $1.4 million was recorded during the year ended 2016. For the year ended 2015, we recorded a non-cash loss on sale of discontinued operations of $5.0 million and a non-cash goodwill impairment charge of $9.9 million related to this transaction. This loss was based on the executed purchase agreement and the net assets of the Packaging Business. In accordance with the guidance in ASC 205-20 Presentation of Financial Statements - Discontinued Operations and ASC 360 Property, Plant & Equipment, the operating results of our Packaging Business, as well as the non-cash loss on sale of discontinued operations, are reported in discontinued operations in our consolidated financial statements for all periods presented herein.
For the years ended 2016 and 2015, we had a loss from the operations of our discontinued operations of $3.0 million and $7.8 million, respectively, primarily from our Packaging Business. Additionally, we recorded tax expense for our discontinued operations of $1.3 million for the year ended 2016 as compared to a tax benefit of $1.4 million for the year end 2015.
Segment Operations
Our Chief Executive Officer monitors the performance of the ongoing operations of our three reportable segments. We assess performance based on net sales and operating income.
Envelope
For The Years Ended | ||||||||
2016 | 2015 | |||||||
Segment net sales | $ | 865,160 | $ | 908,718 | ||||
Segment operating income | $ | 60,684 | $ | 66,424 | ||||
Operating income margin | 7.0 | % | 7.3 | % | ||||
Restructuring and other charges | $ | 2,618 | $ | 3,500 | ||||
23
Segment Net Sales
Segment net sales for our envelope segment decreased $43.6 million, or 4.8%, for the year ended 2016, as compared to the year ended 2015. Net sales for our envelope operations decreased primarily due to: (i) lower sales volumes in our office products business line, primarily due to the accelerated rationalization of customer distribution centers and retail store fronts resulting in lower demand; (ii) lower sales volumes from our wholesale business line due to inventory rationalization programs; (iii) continued lower demand for our generic transactional envelope products; and (iv) incremental sales reductions resulting from a 52 week fiscal year in 2016, as compared to a 53 week fiscal year in 2015. These decreases were partially offset by increased sales volumes within our direct mail platform, primarily driven by financial institutions.
Segment Operating Income
Segment operating income for our envelope segment decreased $5.7 million, or 8.6%, for the year ended 2016, as compared to the year ended 2015. This decrease was primarily due to lower gross margin of $8.9 million due to: (i) lower sales volumes from office products, wholesale and generic transactional products partially offset by higher sales volumes from direct mail products; and (ii) incremental sales reductions resulting from a 52 week fiscal year in 2016, as compared to a 53 week fiscal year in 2015. These decreases were partially offset by: (i) lower selling, general and administrative expenses of $2.2 million primarily due to cost reduction initiatives and lower sales volumes; and (ii) lower restructuring and other charges of $0.9 million, primarily related to charges associated with the integration of certain assets of National with our operations in 2015 as compared to cost reduction initiatives initiated during 2016.
Print
For The Years Ended | ||||||||
2016 | 2015 | |||||||
Segment net sales | $ | 493,464 | $ | 510,974 | ||||
Segment operating income | $ | 17,613 | $ | 15,122 | ||||
Operating income margin | 3.6 | % | 3.0 | % | ||||
Restructuring and other charges | $ | 2,028 | $ | 6,853 | ||||
Segment Net Sales
Segment net sales for our print segment decreased $17.5 million, or 3.4%, for the year ended 2016, as compared to the year ended 2015. The decline was primarily due to: (i) decreased sales volumes in our publisher services group due to lower customer demand; (ii) continued pricing pressures associated with print related products; and (iii) incremental sales reductions resulting from a 52 week fiscal year in 2016, as compared to a 53 week fiscal year in 2015. These decreases were partially offset by increased sales volume with certain customers within our commercial print group, primarily financial institutions; and (ii) net sales generated from Asendia, as Asendia was only included in our 2015 results beginning on August 7, 2015, the date of acquisition.
Segment Operating Income
Segment operating income for our print segment increased $2.5 million, or 16.5%, in 2016, as compared to 2015. This increase was primarily due to: (i) lower restructuring and other charges of $4.8 million primarily due to a closure of a print facility during the first quarter of 2015 as compared to cost reduction initiatives initiated during 2016; and (ii) lower selling, general and administrative expenses of $1.5 million due to lower sales volumes. These items were partially offset by lower gross margin of $4.0 million primarily due to: (i) lower customer demand; and (ii) incremental sales reductions resulting from a 52 week fiscal year in 2016, as compared to a 53 week fiscal year in 2015.
24
Label
For The Years Ended | ||||||||
2016 | 2015 | |||||||
(in thousands) | ||||||||
Segment net sales | $ | 301,377 | $ | 322,087 | ||||
Segment operating income | $ | 30,549 | $ | 39,533 | ||||
Operating income margin | 10.1 | % | 12.3 | % | ||||
Restructuring and other charges | $ | 4,771 | $ | 486 | ||||
Segment Net Sales
Segment net sales for our label segment decreased $20.7 million, or 6.4%, for the year ended 2016, as compared to the year ended 2015. This decrease is primarily due to: (i) lower sales of $12.4 million related to the exit of our coating operation; (ii) volume declines within certain of our existing long run label customers; and (iii) incremental sales reductions resulting from a 52 week fiscal year in 2016, as compared to a 53 week fiscal year in 2015. These declines were partially offset by one-time production incentives of $3.0 million related to the exit of our coating operation.
Segment Operating Income
Segment operating income for our label segment decreased $9.0 million, or 22.7%, for the year ended 2016, as compared to the year ended 2015 primarily due to (i) higher restructuring and other charges of $4.3 million related to our plans to exit our coating operation and the write down of an investment; (ii) higher selling, general and administrative expenses of $1.6 million, primarily due to higher information technology depreciation expense related to our e-commerce initiatives and increased advertising campaigns; and (iii) lower gross margins due to the exit of our coating operation and lower sales volumes primarily resulting from a 52 week fiscal year in 2016, as compared to a 53 week fiscal year in 2015. These decreases were partially offset by: (i) production incentives of $3.0 million related to the exit of our coating operation; and (ii) decreased amortization expense of $1.8 million due to the final amortization of an intangible asset during 2016.
Corporate Expenses
Corporate expenses decreased by $4.5 million, or 12.0%, for the year ended 2016, as compared to the year ended 2015, primarily due to: (i) lower selling, general and administrative expenses due to cost reduction initiatives and lower incentive compensation; and (ii) $1.7 million of income generated from our transition services agreement in connection with the sale of our Packaging Business. The decreases in corporate expenses were partially offset by increased restructuring and other charges due to cost actions implemented during 2016.
Restructuring and Other Charges
Restructuring
We currently have three active cost savings, restructuring and integration plans, which are related to the implementation of cost savings initiatives focused on overhead cost eliminations, including headcount reductions and the potential closure of certain manufacturing facilities. We refer to these plans as the 2017 Plan, the 2016 Plan and the 2015 Plan. Each plan is primarily associated with a specific fiscal year of the planned cost actions.
During 2016, we implemented the 2017 Plan and the 2016 Plan and substantially completed the 2015 Plan. At this time, we are still contemplating additional cost actions that would be associated with the 2017 Plan. During 2015, we also completed our plan to integrate certain assets of National, which we refer to as the National Plan, by completing the closure and consolidation of nine manufacturing facilities into our existing envelope operations and the opening of two new facilities.
We also currently have certain residual cost savings, restructuring and integration plans, which we refer to as the Residual Plans. As a result of these cost savings actions, over the last several years we have closed or consolidated a significant amount of manufacturing facilities and have had a significant number of headcount reductions. We do not anticipate any significant future expenses related to the Residual Plans, other than modifications to current assumptions for lease terminations and multi-employer pension withdrawal liabilities and ongoing expenses related to maintaining restructured assets.
25
During 2016, as a result of our restructuring and integration activities, we incurred $12.0 million of restructuring and other charges, which included $5.1 million of employee separation costs, $3.2 million of net non-cash charges on long-lived assets, equipment moving expenses of $0.4 million, lease termination expenses of $0.4 million, multi-employer pension withdrawal expenses of $0.8 million and building clean-up and other expenses of $2.0 million.
During 2015, as a result of our restructuring and integration activities, we incurred $12.6 million of restructuring and other charges, which included $2.6 million of employee separation costs, $2.1 million of net non-cash charges on long-lived assets, equipment moving expenses of $0.2 million, lease termination expenses of $0.5 million, multi-employer pension withdrawal expenses of $5.0 million and building clean-up and other expenses of $2.2 million.
As of the year ended 2016, our total restructuring liability was $20.9 million, of which $5.5 million is included in other current liabilities, and $15.4 million is included in other liabilities. Our multi-employer pension withdrawal liabilities, presented on a discounted basis, are $17.5 million of our remaining restructuring liability. We believe these liabilities represent our anticipated ultimate withdrawal liabilities; however, we are exposed to significant risks and uncertainties arising from our participation in these multi-employer pension plans. It is not possible to quantify the potential impact of our future actions or the future actions of other participating employers from the multi-employer pension plans for which we have exited. Our anticipated ultimate withdrawal liabilities may be significantly impacted in the future due to lower future contributions or increased withdrawals from other participating employers.
Goodwill and Intangible Asset Impairments
There were no goodwill impairments recorded for the years ended 2016 or 2015, except as disclosed in Note 3 to our consolidated financial statements, which relates to discontinued operations.
There were no intangible asset impairments for the years ended 2016 or 2015.
Liquidity and Capital Resources
Net Cash Provided By Operating Activities of Continuing Operations: Net cash provided by operating activities of continuing operations was $49.4 million for the year ended 2016, which was primarily due to: (i) a source of cash from accounts receivables due to the timing of collections from and sales to our customers; (ii) lower inventories as a result of our inventory management programs; and (iii) our net income of $67.9 million adjusted for non-cash items of $17.1 million, primarily our gain on early extinguishment of debt of $82.5 million offset by depreciation and amortization expense of $47.2 million. These inflows were partially offset by a use of cash of $36.3 million from: (i) accounts payable primarily resulting from the timing of vendor payments due to lower volumes and discounted term opportunities; and (ii) other working capital changes, primarily resulting from the timing of customer related liabilities and lower freight activity due to lower volumes.
Net cash provided by operating activities of continuing operations was $16.2 million for the year ended 2015, which was primarily due to our net loss of $30.9 million adjusted for non-cash items of $82.3 million which was partially offset by: (i) a use of cash of $22.3 million from working capital; and (ii) pension and other postretirement plan contributions of $6.7 million. The use of cash from working capital primarily resulted from: (i) a use of cash from inventory due to the timing of orders from our customers; (ii) the timing of payments to our vendors; and (iii) a use of cash from accounts receivables due to the timing of collections from and sales to our customers.
Cash provided by operating activities is generally sufficient to meet daily disbursement needs. On days when our cash receipts exceed disbursements, we reduce our credit facility balance or place excess funds in conservative, short-term investments until there is an opportunity to pay down debt. On days when our cash disbursements exceed cash receipts, we use invested cash balances and/or our credit facility to fund the difference. As a result, our daily credit facility balance fluctuates depending on working capital needs. Regardless, at all times we believe we have sufficient liquidity available to us to fund our cash needs.
Net Cash (Used In) Provided By Operating Activities of Discontinued Operations: Represents the net cash (used in) provided by operating activities of our discontinued operations.
Net Cash Used In Investing Activities of Continuing Operations: Net cash used in investing activities of continuing operations was $30.8 million for the year ended 2016, primarily resulting from capital expenditures of $41.1 million, partially offset by proceeds received from the sale of property, plant and equipment of $8.3 million and proceeds from the 2016 Label Transaction of $2.0 million.
26
Net cash used in investing activities of continuing operations was $17.2 million for the year ended 2015, primarily resulting from capital expenditures of $25.9 million and $2.0 million of cash used in the acquisition of Asendia. These uses of cash were partially offset by proceeds received from the sale of property, plant and equipment of $8.6 million and proceeds from the 2015 Label Transactions of $2.2 million.
We estimate that we will spend approximately $20.0 to $25.0 million on capital expenditures in 2017, after considering proceeds from the sale of property, plant and equipment. Our primary sources for our capital expenditures are cash generated from operations, proceeds from the sale of property, plant and equipment, and financing capacity within our current debt arrangements. These sources of funding are consistent with prior years’ funding of our capital expenditures.
Net Cash Provided By (Used In) Investing Activities of Discontinued Operations: Represents the net cash used in our discontinued operations related to investing activities. For the year ended 2016, the cash provided by discontinued investing activities of $95.9 million is comprised of gross cash proceeds received related to the sale of our Packaging Business.
For the year ended 2015, the cash used in investing activities of discontinued operations of $2.3 million resulted from capital expenditures for the Packaging Business.
Net Cash Used In Financing Activities of Continuing Operations: Net cash used in financing activities of continuing operations was $109.2 million for the year ended 2016, primarily due to: (i) net repayments of $66.5 million under our ABL Facility; (ii) cash paid of $45.9 million related to the extinguishment of $77.8 million of our 7% Notes; (iii) cash paid of $24.7 million related to the extinguishment of $30.0 million of our 11.5% Notes; (iv) financing-related costs and expenses of $11.6 million, primarily related to the Exchange Offer; (v) various repayments on other long-term debt totaling $5.6 million; and (vi) cash paid of $4.6 million related to the extinguishment of $7.0 million of our 8.500% Notes. This cash usage was partially offset by proceeds of $50.0 million from the 4% Secured Notes.
Net cash used in financing activities of continuing operations was $15.1 million for the year ended 2015, primarily due to: (i) the extinguishment of $22.6 million of our 11.5% Notes; and (ii) net repayment of other long-term debt of $4.0 million, partially offset by net borrowings of $13.5 million under our ABL Facility.
Net Cash Used In Financing Activities of Discontinued Operations: Represents the net cash used in our discontinued operations related to the repayment of other long-term debt.
Contractual Obligations and Other Commitments: The following table details our significant contractual obligations and other commitments on an undiscounted basis as of the year ended (in thousands):
Payments Due | Long-Term Debt(1) | Operating Leases | Other (2) | Total | ||||||||||||
2017 | $ | 96,930 | $ | 21,929 | $ | 23,255 | $ | 142,114 | ||||||||
2018 | 67,957 | 19,391 | 7,615 | 94,963 | ||||||||||||
2019 | 591,211 | 14,937 | 6,010 | 612,158 | ||||||||||||
2020 | 31,759 | 11,870 | 5,539 | 49,168 | ||||||||||||
2021 | 161,949 | 7,306 | 5,191 | 174,446 | ||||||||||||
Thereafter | 373,142 | 15,392 | 41,954 | 430,488 | ||||||||||||
Total | $ | 1,322,948 | $ | 90,825 | $ | 89,564 | $ | 1,503,337 | ||||||||
(1) | Includes $269.0 million of estimated interest expense over the term of our long-term debt, with variable rate debt having an average interest rate of approximately 3.4%. |
(2) | Includes projected 2017 pension contributions of $7.1 million, anticipated benefit payments related to other postretirement benefit plans of $17.1 million, anticipated workers' compensation paid losses of $11.2 million, energy commitments of $5.8 million, restructuring-related liabilities of $48.3 million, including interest expense on lease terminations and multi-employer pension withdrawal liabilities. Excluded from the table are $5.5 million of income tax contingencies as we are unable to reasonably estimate the ultimate amount payable or timing of settlement. |
27
Long-Term Debt: Our total outstanding long-term debt, including current maturities, was approximately $1.0 billion as of the year ended 2016, a decrease of $190.0 million from the year ended 2015. The decrease was primarily due to: (i) the Exchange Offer, which resulted in a decrease of $62.6 million in debt, net of capitalized debt issuance costs and original issuance discount; (ii) net repayments of $66.5 million under our ABL Facility; (iii) the extinguishment of $77.8 million of our 7% Notes; and (iv) extinguishment of $30.0 million of our 11.5% Notes, all of which is partially offset by the issuance of our 4% Secured Notes. As of the year ended 2016, approximately 92% of our debt outstanding was subject to fixed interest rates. As of February 21, 2017, we had approximately $80.4 million of borrowing availability under our ABL Facility.
From time to time, we may seek to refinance our debt obligations, or purchase our outstanding notes in open market purchases, privately negotiated transactions or other means. Such transactions, if any, will depend on prevailing market conditions, our liquidity requirements, contractual restrictions and other factors.
Debt Compliance
As of the year ended 2016, we believe we were in compliance with all debt agreement covenants. We anticipate being in compliance with all debt agreements throughout the 2017 fiscal year.
Letters of Credit
As of the year ended 2016, we had outstanding letters of credit of approximately $17.7 million related to performance and payment guarantees. Based on our experience with these arrangements, we do not believe any obligations which may arise will be significant.
Credit Ratings
Our current credit ratings are as follows:
Rating Agency | Corporate Rating | 6.000% Secured Notes | 8.500% Notes | 11.5% Notes | 6.000% Unsecured Notes | Outlook | Last Update | |||||||
Moody’s | Caa1 | B3 | Caa2 | Caa3 | NR | Stable | June 2016 | |||||||
Standard & Poor’s | CCC+ | B- | CCC | NR | CCC- | Negative | July 2016 | |||||||
In June 2016, Moody's Investors Services, which we refer to as Moody's, upgraded our Corporate Rating and the ratings on our 6.000% Secured Notes and 8.500% Notes. Additionally, Moody's affirmed the ratings on our 11.5% Notes. In July 2016, Standard & Poor's Ratings Services, which we refer to as Standard & Poor's, upgraded our Corporate Rating, rated our 6.000% Unsecured Notes for the first time and withdrew the ratings on our 11.5% Notes. Additionally, the rating on our 6.000% Secured Notes and 8.5000% Notes remained unchanged. The detail of all current ratings has been provided in the table above.
The terms of our existing debt do not have any rating triggers that impact our funding availability or influence our daily operations, including planned capital expenditures. We do not believe that our current ratings will unduly influence our ability to raise additional capital if and/or when needed. Some of our constituents closely track rating agency actions and would note any raising or lowering of our credit ratings; however, we believe that along with reviewing our credit ratings, additional quantitative and qualitative analysis must be performed to accurately judge our financial condition.
We expect our internally generated cash flows and financing available under our ABL Facility will be sufficient to fund our working capital needs for the next twelve months; however, this cannot be assured.
Off-Balance Sheet Arrangements: We had no off-balance sheet arrangements as of the year ended 2016 other than those disclosed on the Contractual Obligations and Other Commitments table.
Critical Accounting Matters
We prepare our consolidated financial statements in conformity with accounting principles generally accepted in the United States of America. This requires us to make estimates and assumptions which affect the reported amounts of assets and liabilities and the disclosure of contingent assets and liabilities at the date of the consolidated financial statements, as well as the reported amount of revenues and expenses during the reporting period. We evaluate these estimates and assumptions on an ongoing basis based on historical experience, and various other factors which we believe are reasonable under the circumstances. Actual results could differ from estimates.
28
We believe the following represent our more critical estimates and assumptions used in the preparation of our consolidated financial statements:
Allowance for Losses on Accounts Receivable: We maintain a valuation allowance based on the expected collectability of our accounts receivable, which requires a considerable amount of judgment in assessing the current credit worthiness of customers and related aging of past due balances. As of the years ended 2016 and 2015, the allowance provided for potentially uncollectible accounts receivable was $2.1 million and $5.9 million, respectively. Charges for bad debts recorded to the statement of operations for the years ended 2016 and 2015 were $1.4 million and $2.6 million, respectively. We cannot guarantee that our current credit losses will be consistent with those in the past. These estimates may prove to be inaccurate, in which case we may have overstated or understated the allowance for losses required for uncollectible accounts receivable.
Inventory Valuation: Inventories are stated at the lower of cost or market, with cost determined on a first-in, first-out or average cost basis. Cost includes materials, labor and overhead related to the purchase and production of inventories. When there is a significant decrease in demand for our products and market price is below cost, we are required to reduce our inventory balances accordingly.
Provision for Impairment of Long-Lived Assets: We evaluate long-lived assets, including property, plant and equipment and intangible assets other than goodwill and indefinite lived intangible assets, for impairment whenever events or changes in circumstances indicate the carrying amounts of specific assets or group of assets may not be recoverable. When an evaluation is required, we estimate the future undiscounted cash flows associated with the specific asset or group of assets. If the cost of the asset or group of assets cannot be recovered by these undiscounted cash flows, we would assess the fair value of the asset or asset group and if necessary, an impairment charge would be recorded. Our estimates of future cash flows are based on our experience and internal business plans. Our internal business plans require judgments regarding future economic conditions, product demand and pricing. Although we believe our estimates are appropriate, significant differences in the actual performance of an asset or group of assets may materially affect our evaluation of the recoverability of the asset values currently recorded. Additional impairment charges may be necessary in future years.
Provision for Impairment of Goodwill and Indefinite Lived Intangible Assets: We evaluate the carrying value of our goodwill and indefinite lived intangible assets annually at the end of November and whenever events or circumstances make it more likely than not an impairment may have occurred. Financial Accounting Standards Board, which we refer to as the FASB, Accounting Standards Codification 350, Goodwill and Other Intangible Assets, which we refer to as ASC 350, provides us with the option of performing a qualitative assessment, if elected, prior to calculating the fair value of an indefinite lived intangible asset or the fair value of a reporting unit for goodwill under a quantitative approach. If we determine, based on qualitative factors, the fair value of an indefinite lived intangible asset or the fair value of a reporting unit is more likely than not to be less than the respective carrying value, a quantitative impairment test would be required to be performed. Otherwise, further impairment testing would not be needed.
ASC 350 prescribes a two-step quantitative method for determining goodwill impairment. In the first step, we compare the estimated fair value of each reporting unit to its carrying amount, including goodwill. If the carrying amount of a reporting unit exceeds the estimated fair value, step two is completed to determine the amount of the impairment loss. Step two requires the allocation of the estimated fair value of the reporting unit to the assets, including any unrecognized intangible assets, and liabilities in a hypothetical purchase price allocation. Any remaining unallocated fair value represents the implied fair value of goodwill, which is compared to the corresponding carrying value of goodwill to compute the goodwill impairment amount.
As part of our quantitative impairment analysis for each reporting unit, we estimate the fair value of each reporting unit, primarily using the income approach. The income approach requires management to estimate a number of factors for each reporting unit, including projected future operating results, economic projections, anticipated future cash flows, discount rates, and the allocation of shared service or corporate items. The market approach was used as a test of reasonableness of the conclusions reached in the income approach. The market approach estimates fair value using comparable marketplace fair value data from within a comparable industry grouping.
The determination of the fair value of the reporting units and the allocation of that value to individual assets and liabilities within those reporting units requires management to make significant estimates and assumptions. These estimates and assumptions primarily include, but are not limited to: the selection of appropriate peer group companies; control premiums appropriate for acquisitions in the industries in which we compete; the discount rate; terminal growth rates; and forecasts of net sales, operating income, depreciation and amortization and capital expenditures. The allocation requires several analyses to determine the fair value of assets and liabilities including, among others, trade names, customer relationships, and property, plant and equipment. Although we believe our estimates of fair value are reasonable, actual financial results could differ from those estimates due to the inherent uncertainty involved in making such estimates. Changes in assumptions concerning future financial results or other underlying assumptions could have a significant impact on either the fair value of the reporting units, the amount of the goodwill
29
impairment charge, or both. We also compared the sum of the estimated fair values of the reporting units to our total enterprise value as implied by the market value of our equity securities. This comparison indicated that, in total, our assumptions and estimates were reasonable. However, future declines in the overall market value of our equity securities may indicate the fair value of one or more reporting units has declined below their carrying value. Such declines are reviewed in the context of the overall stock market, the business climate within the industries in which we operate and other relevant facts and circumstances.
In 2016 and 2015, we elected to bypass the qualitative only assessment and we performed quantitative assessments on goodwill. We did not record any goodwill impairment charges for the years ended 2016 or 2015, except as disclosed in Note 3 to our consolidated financial statements.
One measure of the sensitivity of the amount of goodwill impairment charges to key assumptions is the amount by which each reporting unit had fair value in excess of its carrying amount or had carrying amount in excess of fair value for the first step of the goodwill impairment test. In 2016, the envelope, print and label reporting units had fair value in excess of carrying value, with fair value exceeding carrying value by at least 30% for each reporting unit. Generally, changes in estimates of expected future cash flows would have a similar effect on the estimated fair value of the reporting unit. That is, a 1% change in estimated future cash flows would change the estimated fair value of the reporting unit by approximately 1%. Of the other key assumptions that impact the estimated fair values, most reporting units have the greatest sensitivity to changes in the estimated discount rate. In 2016, the discount rate for our reporting units was between 10% and 11.5%. A 100 basis point increase in our estimated discount rates would not have resulted in any reporting units failing step one.
Determining whether an impairment of indefinite lived intangible assets has occurred requires an analysis of the fair value of each of the related trade names. However, if our estimates of the valuations of our trade names prove to be inaccurate, an impairment charge could be necessary in future periods.
Our quantitative impairment analysis for trade names utilizes a relief-from-royalty method in which the hypothetical benefits of owning each respective trade name are valued by discounting hypothetical royalty revenue over projected revenues covered by the trade names. We utilized royalty rates of 1.5% to 2.0% for the use of the subject trade names based on comparable market rates, the profitability of the product employing the trade name, and qualitative factors, such as the strength of the name and years in usage. The discount rate utilized was between 11.5% and 13.0%, which was based on the weighted average cost of capital for the respective business plus a premium to account for the relative risks of the subject trade name.
In order to evaluate the sensitivity of the fair value calculations for all of our indefinite lived trade names, we applied a hypothetical 10% decrease to the estimated fair value of our trade names. The hypothetical decrease in fair value could be due to changes in discount rates and/or assumed royalty rates. The hypothetical 10% decrease in estimated fair value would not have resulted in any impairment of any of our identifiable indefinite lived trade names.
There were no intangible asset impairments for the years ended 2016 or 2015.
Self-Insurance Reserves: We are self-insured for the majority of our workers’ compensation and health insurance costs, subject to specific retention levels. We rely on claims experience and the advice of consulting actuaries and administrators in determining an adequate liability for self-insurance claims. While we believe these estimates of our self-insurance liabilities are reasonable, significant differences in our experience or a significant change in any of our assumptions could materially affect the amount of workers’ compensation and healthcare expenses we record on an annual basis.
Our self-insurance workers’ compensation liability is estimated based on reserves for claims which are established by a third-party administrator. The estimate of these reserves is adjusted from time to time to reflect the estimated future development of the claims. Our liability for workers’ compensation claims is the estimated total cost of the claims on a fully-developed and discounted basis which considers anticipated payment patterns. As of the years ended 2016 and 2015, the undiscounted liability was $12.1 million and $12.3 million, respectively, and the discounted liability was $11.2 million and $11.4 million, respectively, using discount rates of 2% for each of the years ended 2016 and 2015.
Our self-insured healthcare liability represents our estimate of claims which have been incurred, but not reported as of the years ended 2016 and 2015. We rely on claims experience and the advice of consulting actuaries to determine an adequate liability for self-insured plans. This liability was $3.2 million for both the years ended 2016 and 2015, and was estimated based on an analysis of actuarial completion factors that estimated incurred but unreported liabilities derived from the historical claims experience. The estimate of our liability for employee healthcare represents between 45 and 60 days of unreported claims.
Revenue Recognition: We recognize revenue when persuasive evidence of an arrangement exists, product delivery has occurred, pricing is fixed or determinable, and collection is reasonably assured, net of rebates earned by customers. Since a significant portion of our products are customer specific, it is common for customers to inspect the quality of the product at our facility prior to its shipment. Products shipped are not subject to contractual right of return provisions. The Company records sales
30
net of applicable sales tax. The costs of delivering finished goods to customers are recorded as freight costs and included in cost of sales. Freight costs that are either billed separately to the customer or included in the price of the product are included in net sales.
Accounting for Income Taxes: We are required to estimate our income taxes in each jurisdiction in which we operate, which primarily includes the United States and India. This process involves estimating our actual current tax expense, together with assessing temporary differences resulting from differing treatment of items for tax and financial reporting purposes. The tax effects of these temporary differences are recorded as deferred tax assets or deferred tax liabilities. Deferred tax assets generally represent items that can be used as a tax deduction or credit in our tax return in future years for which we have already recorded an expense in our consolidated financial statements. Deferred tax liabilities generally represent tax items that have been deducted for tax purposes, but have not yet been recorded as an expense in our consolidated financial statements. As of the years ended 2016 and 2015, we had net deferred tax liabilities of $40.4 million and $38.8 million, respectively, from our United States operations. As of the years ended 2016 and 2015, we had net deferred tax assets of $1.1 million and $0.9 million, respectively, from our foreign operations.
We review the likelihood that we will realize the benefit of our deferred tax assets and therefore the need for valuation allowances on a quarterly basis, or more frequently if events indicate that a review is required. In determining the requirement for a valuation allowance, the historical and projected financial results of the legal entity or consolidated group recording the net deferred tax asset is considered, along with all other available positive and negative evidence. The factors considered in our determination of the probability of the realization of the deferred tax assets include, but are not limited to: recent historical financial results, historical taxable income, projected future taxable income, the expected timing of the reversals of existing temporary differences, the duration of statutory carryforward periods and tax planning strategies. If, based upon the weight of available evidence, it is more likely than not the deferred tax assets will not be realized, a valuation allowance is recorded.
Concluding that a valuation allowance is not required is difficult when there is significant negative evidence which is objective and verifiable, such as cumulative losses in recent years. We utilize a rolling twelve quarters of pre-tax income or loss adjusted for significant permanent book to tax differences, as well as non-recurring items, as a measure of our cumulative results in recent years. In the United States, our analysis indicates that we have cumulative three year historical losses on this basis. While there are significant impairment, restructuring and refinancing charges driving our cumulative three year loss, this is considered significant negative evidence which is objective and verifiable and therefore, difficult to overcome. However, the three year loss position is not solely determinative and accordingly, we consider all other available positive and negative evidence in our analysis. Based upon our analysis, which incorporated the excess capacity and pricing pressure we have experienced in certain of our product lines, we believe it is more likely than not that the net deferred tax assets in the United States will not be fully realized in the future. Accordingly, we have a valuation allowance related to those net deferred tax assets of $117.8 million as of the year ended 2016. Deferred tax assets related to certain state net operating losses also did not reach the more likely than not realizability criteria and accordingly, were subject to a valuation allowance, the balance of which, as of the year ended 2016, was $11.4 million.
There is no corresponding income tax benefit recognized with respect to losses incurred and no corresponding income tax expense recognized with respect to earnings generated in jurisdictions with a valuation allowance. This causes variability in our effective tax rate. We intend to maintain the valuation allowances until it is more likely than not that the net deferred tax assets will be realized. If operating results improve on a sustained basis, or if certain tax planning strategies are implemented, our conclusions regarding the need for valuation allowances could change, resulting in the reversal of the valuation allowances in the future, which could have a significant impact on income tax expense in the period recognized and subsequent periods.
We recognize a tax position in our consolidated financial statements when it is more likely than not that the position would be sustained upon examination by tax authorities. This recognized tax position is then measured at the largest amount of benefit that is greater than fifty percent likely of being realized upon ultimate settlement. Although we believe that our estimates are reasonable, the final outcome of uncertain tax positions may be materially different from that which is reflected in our consolidated financial statements. We adjust such reserves upon changes in circumstances that would cause a change to the estimate of the ultimate liability, upon effective settlement or upon the expiration of the statute of limitations, in the period in which such event occurs. For the years ended 2016 and 2015, we did not increase nor reduce our liabilities for uncertain tax positions.
Pension and Other Postretirement Benefit Plans: The valuation of our pension and other postretirement plans requires the use of assumptions and estimates to develop actuarial valuations of expenses, assets and liabilities. Inherent in these valuations are key assumptions, which include discount rate, investment returns and mortality rates. We review our actuarial assumptions on an annual basis and make modifications to the assumptions based on current rates and trends when it is appropriate to do so. The effects of modifications are recognized immediately on our consolidated balance sheet, but are generally amortized into our consolidated statement of operations over future periods, with the deferred amount recorded in accumulated other comprehensive loss. We believe that the assumptions utilized in recording our obligations under our plans are reasonable based on our experience, market conditions and input from our actuaries and investment advisers. We select the discount rate to be used for purposes of
31
computing annual service and interest costs based on the Citigroup Pension Liability Index as of our respective year end dates. The weighted average discount rate used to determine the benefit obligation as of the years ended 2016 and 2015 was 3.75% and 4.00%, respectively. A one percentage point decrease in the discount rate at year end 2016 would increase the pension and other postretirement plans’ projected benefit obligation by approximately $45.6 million. A one percentage point increase in the discount rate at the year ended 2016 would decrease the pension and other postretirement plans’ projected benefit obligation by approximately $37.6 million.
Beginning in 2014, we began to allow certain participants in the pension plans the option of settling their vested benefits through the receipt of a lump-sum payment. Lump-sum payments made in 2015 and 2016 did not meet the criteria to apply settlement accounting. Since settlement via lump-sum payment is dependent on an employee's decision and election, the extent of future settlements and the associated losses may fluctuate significantly.
Our investment objective is to maximize the long-term return on the pension plan assets within prudent levels of risk. Investments are primarily diversified with a blend of equity securities, fixed income securities and alternative investments. Equity investments are diversified by including United States and non-United States stocks, growth stocks, value stocks and stocks of large and small companies. Fixed income securities are primarily United States governmental and corporate bonds, including mutual funds. Alternative investments are primarily private equity hedge funds and hedge fund-of-funds. We consult with our financial advisers on a regular basis regarding our investment objectives and asset performance.
New Accounting Pronouncements: We are required to adopt certain new accounting pronouncements. See Note 1 to our consolidated financial statements.
Commitments and Contingencies: Our business and operations are subject to a number of significant risks, most of which are summarized in our "Risk Factors" in Item 1A, and in Note 14 to our consolidated financial statements.
32
Item 7A. Quantitative and Qualitative Disclosures About Market Risk
We are exposed to market risks such as changes in interest and foreign currency exchange rates, which may adversely affect our results of operations and financial position.
As of the year ended 2016, we had variable rate debt outstanding of $81.7 million. A change of 1% to the current London Interbank Offered Rate, which we refer to as LIBOR, would have a minimal impact to our interest expense.
Our changes in foreign currency exchange rates are managed through normal operating and financing activities. Subsequent to the sale of the Packaging Business on January 19, 2016, we have minimal exposure to market risk for changes in foreign currency exchange rates. For the year ended 2016, a uniform 10% strengthening of the United States dollar relative to the local currency of our foreign operations would have had a minimal impact to our sales and operating income.
33
Item 8. Financial Statements
Report of Independent Registered Public Accounting Firm
Board of Directors and Shareholders
Cenveo, Inc.
Stamford, Connecticut
We have audited the accompanying consolidated balance sheets of Cenveo, Inc. and subsidiaries (the "Company") as of December 31, 2016 and January 2, 2016 and the related consolidated statements of comprehensive income (loss), changes in shareholders’ (deficit) equity, and cash flows for the years then ended. These financial statements are the responsibility of the Company’s management. Our responsibility is to express an opinion on these financial statements based on our audits.
We conducted our audits in accordance with the standards of the Public Company Accounting Oversight Board (United States). Those standards require that we plan and perform the audit to obtain reasonable assurance about whether the financial statements are free of material misstatement. An audit includes examining, on a test basis, evidence supporting the amounts and disclosures in the financial statements, assessing the accounting principles used and significant estimates made by management, as well as evaluating the overall financial statement presentation. We believe that our audits provide a reasonable basis for our opinion.
In our opinion, the consolidated financial statements referred to above present fairly, in all material respects, the financial position of Cenveo, Inc. and subsidiaries as of December 31, 2016 and January 2, 2016, and the results of their operations and their cash flows for the years then ended, in conformity with accounting principles generally accepted in the United States of America.
We also have audited, in accordance with the standards of the Public Company Accounting Oversight Board (United States), Cenveo, Inc. and subsidiaries’ internal control over financial reporting as of December 31, 2016, based on criteria established in Internal Control -Integrated Framework (2013) issued by the Committee of Sponsoring Organizations of the Treadway Commission (COSO) and our report dated February 23, 2017 expressed an unqualified opinion thereon.
/s/ BDO USA, LLP
New York, New York
February 23, 2017
34
CENVEO, INC. AND SUBSIDIARIES CONSOLIDATED BALANCE SHEETS (in thousands, except par values) | |||||||
2016 | 2015 | ||||||
Assets | |||||||
Current assets: | |||||||
Cash and cash equivalents | $ | 5,532 | $ | 7,785 | |||
Accounts receivable, net | 234,187 | 254,042 | |||||
Inventories, net | 101,950 | 121,615 | |||||
Prepaid and other current assets | 41,576 | 46,731 | |||||
Assets of discontinued operations - current | — | 48,566 | |||||
Total current assets | 383,245 | 478,739 | |||||
Property, plant and equipment, net | 207,679 | 210,578 | |||||
Goodwill | 175,209 | 175,338 | |||||
Other intangible assets, net | 124,831 | 130,450 | |||||
Other assets, net | 21,995 | 24,070 | |||||
Assets of discontinued operations - long-term | — | 62,851 | |||||
Total assets | $ | 912,959 | $ | 1,082,026 | |||
Liabilities and Shareholders’ Deficit | |||||||
Current liabilities: | |||||||
Current maturities of long-term debt | $ | 31,727 | $ | 5,373 | |||
Accounts payable | 175,896 | 200,120 | |||||
Accrued compensation and related liabilities | 24,684 | 31,961 | |||||
Other current liabilities | 82,899 | 88,814 | |||||
Liabilities of discontinued operations - current | — | 22,268 | |||||
Total current liabilities | 315,206 | 348,536 | |||||
Long-term debt | 986,939 | 1,203,250 | |||||
Other liabilities | 199,971 | 198,926 | |||||
Liabilities of discontinued operations - long-term | — | 1,153 | |||||
Commitments and contingencies | |||||||
Shareholders’ deficit: | |||||||
Preferred stock, $0.01 par value; 25 shares authorized, no shares issued | — | — | |||||
Common stock, $0.01 par value; 15,000 and 12,500 shares authorized, 8,553 and 8,484 shares issued and outstanding as of the years ended 2016 and 2015, respectively | 86 | 85 | |||||
Paid-in capital | 382,271 | 372,240 | |||||
Retained deficit | (868,285 | ) | (936,234 | ) | |||
Accumulated other comprehensive loss | (103,229 | ) | (105,930 | ) | |||
Total shareholders’ deficit | (589,157 | ) | (669,839 | ) | |||
Total liabilities and shareholders’ deficit | $ | 912,959 | $ | 1,082,026 | |||
See notes to consolidated financial statements.
35
CENVEO, INC. AND SUBSIDIARIES
CONSOLIDATED STATEMENTS OF COMPREHENSIVE INCOME (LOSS)
(in thousands, except per share data)
For The Years Ended | ||||||||
2016 | 2015 | |||||||
Net sales | $ | 1,660,001 | $ | 1,741,779 | ||||
Cost of sales | 1,386,746 | 1,450,876 | ||||||
Selling, general and administrative expenses | 179,525 | 186,749 | ||||||
Amortization of intangible assets | 5,744 | 7,785 | ||||||
Restructuring and other charges | 11,954 | 12,576 | ||||||
Operating income | 76,032 | 83,793 | ||||||
Interest expense, net | 85,753 | 100,805 | ||||||
(Gain) loss on early extinguishment of debt, net | (82,481 | ) | 1,252 | |||||
Other income, net | (2,344 | ) | (3,196 | ) | ||||
Income (loss) from continuing operations before income taxes | 75,104 | (15,068 | ) | |||||
Income tax expense | 4,258 | 4,393 | ||||||
Income (loss) from continuing operations | 70,846 | (19,461 | ) | |||||
Loss from discontinued operations, net of taxes | (2,897 | ) | (11,390 | ) | ||||
Net income (loss) | 67,949 | (30,851 | ) | |||||
Other comprehensive income (loss): | ||||||||
Changes in pension and other employee benefit accounts, net of taxes | 756 | (3,438 | ) | |||||
Currency translation adjustment, net | 1,945 | (4,295 | ) | |||||
Total other comprehensive income (loss) | 2,701 | (7,733 | ) | |||||
Comprehensive income (loss) | $ | 70,650 | $ | (38,584 | ) | |||
Income (loss) per share – basic: | ||||||||
Continuing operations | $ | 8.31 | $ | (2.30 | ) | |||
Discontinued operations | (0.34 | ) | (1.34 | ) | ||||
Net income (loss) | $ | 7.97 | $ | (3.64 | ) | |||
Income (loss) per share – diluted: | ||||||||
Continuing operations | $ | 7.63 | $ | (2.30 | ) | |||
Discontinued operations | (0.31 | ) | (1.34 | ) | ||||
Net income (loss) | $ | 7.32 | $ | (3.64 | ) | |||
Weighted average shares outstanding: | ||||||||
Basic | 8,527 | 8,479 | ||||||
Diluted | 9,492 | 8,479 | ||||||
See notes to consolidated financial statements.
36
CENVEO, INC. AND SUBSIDIARIES CONSOLIDATED STATEMENTS OF CASH FLOWS (in thousands) | |||||||
For The Years Ended | |||||||
2016 | 2015 | ||||||
Cash flows from operating activities: | |||||||
Net income (loss) | $ | 67,949 | $ | (30,851 | ) | ||
Adjustments to reconcile net income (loss) to net cash provided by operating activities: | |||||||
(Gain) loss on sale of discontinued operations, net of taxes | (69 | ) | 4,987 | ||||
Loss from discontinued operations, net of taxes | 2,966 | 6,403 | |||||
Depreciation | 41,456 | 41,904 | |||||
Amortization of intangible assets | 5,744 | 7,785 | |||||
Non-cash interest expense, net | 9,003 | 10,057 | |||||
Deferred income taxes | 1,280 | 2,743 | |||||
Gain on sale of assets | (4,330 | ) | (5,356 | ) | |||
Non-cash restructuring and other charges, net | 3,638 | 5,936 | |||||
(Gain) loss on early extinguishment of debt, net | (82,481 | ) | 1,252 | ||||
Provisions for bad debts | 1,415 | 2,567 | |||||
Provisions for inventory obsolescence | 2,826 | 2,359 | |||||
Stock-based compensation provision | 1,468 | 1,636 | |||||
Changes in operating assets and liabilities, excluding the effects of acquired businesses: | |||||||
Accounts receivable | 18,397 | (3,953 | ) | ||||
Inventories | 16,820 | (5,130 | ) | ||||
Accounts payable and accrued compensation and related liabilities | (33,781 | ) | (16,363 | ) | |||
Other working capital changes | (2,534 | ) | 3,103 | ||||
Other, net | (384 | ) | (12,853 | ) | |||
Net cash provided by operating activities of continuing operations | 49,383 | 16,226 | |||||
Net cash (used in) provided by operating activities of discontinued operations | (10,512 | ) | 15,968 | ||||
Net cash provided by operating activities | 38,871 | 32,194 | |||||
Cash flows from investing activities: | |||||||
Cost of business acquisitions, net of cash acquired | — | (1,996 | ) | ||||
Capital expenditures | (41,137 | ) | (25,928 | ) | |||
Proceeds from sale of property, plant and equipment | 8,330 | 8,558 | |||||
Proceeds from sale of assets | 2,000 | 2,180 | |||||
Net cash used in investing activities of continuing operations | (30,807 | ) | (17,186 | ) | |||
Net cash provided by (used in) investing activities of discontinued operations | 95,866 | (2,282 | ) | ||||
Net cash provided by (used in) investing activities | 65,059 | (19,468 | ) | ||||
Cash flows from financing activities: | |||||||
Proceeds from issuance of 4% senior secured notes due 2021 | 50,000 | — | |||||
Payment of financing related costs and expenses and debt issuance discounts | (11,576 | ) | (1,596 | ) | |||
Proceeds from issuance of other long-term debt | — | 12,500 | |||||
Repayments of other long-term debt | (5,578 | ) | (16,545 | ) | |||
Repayment of 11.5% senior notes due 2017 | (24,725 | ) | (22,720 | ) | |||
Repayment of 7% senior exchangeable notes due 2017 | (45,903 | ) | — | ||||
Repayment of 8.500% junior secured priority notes due 2022 | (4,550 | ) | — | ||||
Purchase and retirement of common stock upon vesting of restricted stock units | (346 | ) | (216 | ) | |||
Borrowings under asset-based revolving credit facility due 2021 | 474,300 | 468,300 | |||||
Repayments under asset-based revolving credit facility due 2021 | (540,800 | ) | (454,800 | ) | |||
Net cash used in financing activities of continuing operations | (109,178 | ) | (15,077 | ) | |||
Net cash used in financing activities of discontinued operations | (8 | ) | (473 | ) | |||
Net cash used in financing activities | (109,186 | ) | (15,550 | ) | |||
Effect of exchange rate changes on cash and cash equivalents | 232 | (1,213 | ) | ||||
Net decrease in cash and cash equivalents | (5,024 | ) | (4,037 | ) | |||
Cash and cash equivalents at beginning of period | 10,556 | 14,593 | |||||
Cash and cash equivalents at end of period | 5,532 | 10,556 | |||||
Less cash and cash equivalents of discontinued operations | — | (2,771 | ) | ||||
Cash and cash equivalents of continuing operations at end of period | $ | 5,532 | $ | 7,785 | |||
Supplemental cash flow disclosures: (1) | |||||||
Cash paid for interest | $ | 79,267 | $ | 91,455 | |||
Cash paid for taxes, net | 4,698 | 739 | |||||
Non-cash origination of capital leases | 1,280 | 2,518 | |||||
__________________________
(1) During the year ended 2016, the Company issued warrants in association with various debt transactions. See Note 8 for the description of these transactions.
See notes to consolidated financial statements.
37
CENVEO, INC. AND SUBSIDIARIES CONSOLIDATED STATEMENTS OF CHANGES IN SHAREHOLDERS’ (DEFICIT) EQUITY (in thousands) | ||||||||||||||||||||||
Common Stock | Paid-In Capital | Retained Deficit | Accumulated Other Comprehensive (Loss) Income | Total Shareholders’ (Deficit) Equity | ||||||||||||||||||
Shares | Amount | |||||||||||||||||||||
Balance as of the year ended 2014 | 8,460 | $ | 85 | $ | 370,820 | $ | (905,383 | ) | $ | (98,197 | ) | $ | (632,675 | ) | ||||||||
Comprehensive loss: | ||||||||||||||||||||||
Net loss | (30,851 | ) | (30,851 | ) | ||||||||||||||||||
Other comprehensive loss: | ||||||||||||||||||||||
Changes in pension and other employee benefit accounts, net of tax benefit of zero | (3,438 | ) | (3,438 | ) | ||||||||||||||||||
Currency translation adjustment, net | (4,295 | ) | (4,295 | ) | ||||||||||||||||||
Other comprehensive loss | (7,733 | ) | ||||||||||||||||||||
Total comprehensive loss | (38,584 | ) | ||||||||||||||||||||
Purchase and retirement of common stock upon vesting of restricted stock units | 24 | — | (216 | ) | (216 | ) | ||||||||||||||||
Amortization of stock based compensation | 1,636 | 1,636 | ||||||||||||||||||||
Balance as of the year ended 2015 | 8,484 | 85 | 372,240 | (936,234 | ) | (105,930 | ) | (669,839 | ) | |||||||||||||
Comprehensive income (loss): | ||||||||||||||||||||||
Net income | 67,949 | 67,949 | ||||||||||||||||||||
Other comprehensive income: | ||||||||||||||||||||||
Changes in pension and other employee benefit accounts, net of tax benefit of zero | 756 | 756 | ||||||||||||||||||||
Currency translation adjustment, net | 1,945 | 1,945 | ||||||||||||||||||||
Other comprehensive income | 2,701 | |||||||||||||||||||||
Total comprehensive income | 70,650 | |||||||||||||||||||||
Issuance of Warrants in connection with the Exchange Offer (1) | 6,264 | 6,264 | ||||||||||||||||||||
Impact of Exchange Offer with affiliated noteholders (1) | 1,375 | 1,375 | ||||||||||||||||||||
Issuance of Warrants in connection with the repurchase of the 7% senior exchangeable notes due 2017 (1) | 1,270 | 1,270 | ||||||||||||||||||||
Purchase and retirement of common stock upon vesting of restricted stock units | 69 | 1 | (346 | ) | (345 | ) | ||||||||||||||||
Amortization of stock based compensation | 1,468 | 1,468 | ||||||||||||||||||||
Balance as of the year ended 2016 | 8,553 | $ | 86 | $ | 382,271 | $ | (868,285 | ) | $ | (103,229 | ) | $ | (589,157 | ) | ||||||||
__________________________
(1) See Note 8 for description of the Warrants and Exchange Offer.
See notes to consolidated financial statements.
38
CENVEO, INC. AND SUBSIDIARIES
NOTES TO CONSOLIDATED FINANCIAL STATEMENTS
1. Summary of Significant Accounting Policies
Basis of Presentation: The consolidated financial statements include the results of Cenveo, Inc. and its subsidiaries and have been prepared in accordance with accounting principles generally accepted in the United States of America ("GAAP"). All intercompany transactions have been eliminated. Certain amounts in the 2015 consolidated balance sheet have been reclassified to conform to current year presentation.
Cenveo, Inc. and its wholly-owned subsidiaries (collectively, the "Company" or "Cenveo") are engaged in envelope converting, commercial printing, and the manufacturing of label products. The Company is headquartered in Stamford, Connecticut, is organized under Colorado law, and its common stock is traded on the New York Stock Exchange under the symbol "CVO." The Company operates a network of strategically located manufacturing facilities, serving a diverse base of customers. The Company’s operations are based in North America and India.
The Company’s reporting periods for 2016 and 2015 in this report consisted of 52 and 53 week periods, respectively, and ended on December 31, 2016 and January 2, 2016, respectively. Such periods are referred to herein as: (i) "as of the year ended 2016," "the year ended 2016" or "2016;" and (ii) "as of the year ended 2015," "the year ended 2015" or "2015." All references to years and year-ends herein relate to fiscal years rather than calendar years.
As a result of exploring opportunities to divest certain non-strategic or underperforming businesses within its manufacturing platform, during the first quarter of 2016 the Company completed the sale of its folded carton and shrink sleeve packaging businesses, along with its one top-sheet lithographic print operation (collectively, the "Packaging Business"). See Note 3 for information regarding the completion of sale of the Packaging Business. In accordance with the guidance in Accounting Standards Codification ("ASC") 205-20 Presentation of Financial Statements - Discontinued Operations and ASC 360 Property, Plant & Equipment, the financial results of the Packaging Business have been accounted for as discontinued operations for all periods presented.
On July 8, 2016, the Company announced a reverse split of its common stock, par value $0.01 per share (the "Common Stock"), at a ratio of 1-for-8, effective July 13, 2016 (the "Reverse Stock Split"). The Common Stock began trading on a split-adjusted basis on July 14, 2016. The Reverse Stock Split was approved by the Company’s stockholders at the annual meeting of the stockholders held on May 26, 2016. As a result of the Reverse Stock Split, each eight pre-split shares of Common Stock outstanding were automatically combined into one new share of Common Stock without any action on the part of the respective holders, and the number of outstanding common shares on the date of the split was reduced from approximately 68.5 million shares to approximately 8.5 million shares. The Reverse Stock Split also applied to Common Stock issuable upon the exchange of the Company’s outstanding 7% senior exchangeable notes due 2017 (the "7% Notes") and upon the exercise of the Company's outstanding warrants. Additionally, the Reverse Stock Split applied to the Company's outstanding stock options, restricted share units ("RSUs"), and performance share units ("PSUs"), (collectively, the "Equity Awards"). In addition, the authorized Common Stock was initially increased from 100 million to 120 million shares and then adjusted in the Reverse Stock Split from 120 million to 15 million shares. The Company's historical consolidated financial statements have been retroactively adjusted to give recognition to the Reverse Stock Split for all periods presented.
Use of Estimates: The preparation of financial statements in conformity with GAAP requires management to make estimates and assumptions that affect the reported amounts of assets and liabilities and disclosure of contingent assets and liabilities at the date of the financial statements and the reported amounts of revenues and expenses during the reporting periods. Estimates and assumptions are used for, but not limited to, establishing the allowance for doubtful accounts, valuation of inventory, purchase price allocation, depreciation and amortization lives, asset impairment evaluations, deferred tax assets and liabilities, self-insurance accruals, stock-based compensation and other contingencies. Actual results could differ from estimates.
Fair Value Measurements: Certain assets and liabilities of the Company are required to be recorded at fair value. Fair value is determined based on the exchange price that would be received for an asset or paid to transfer a liability in an orderly transaction between market participants. The fair value of cash and cash equivalents, accounts receivable and accounts payable approximate their carrying values due to their short-term nature. The Company also has other assets or liabilities that it records at fair value, such as its pension plan assets. The three-tier value hierarchy, which prioritizes the inputs used in the valuation methodologies, is as follows:
Level 1 — | Valuations based on quoted prices for identical assets and liabilities in active markets. |
Level 2 — | Valuations based on observable inputs other than quoted prices included in Level 1, such as quoted prices for similar assets and liabilities in active markets, quoted prices for identical or similar assets and liabilities in markets that are not active, or other inputs that are observable or can be corroborated by observable market data. |
39
CENVEO, INC. AND SUBSIDIARIES
NOTES TO CONSOLIDATED FINANCIAL STATEMENTS (CONTINUED)
Level 3 — | Valuations based on unobservable inputs reflecting the Company’s own assumptions, consistent with reasonably available assumptions made by other market participants. |
Cash and Cash Equivalents: Cash and cash equivalents include cash on deposit and highly liquid investments with original maturities of three months or less. The Company places its cash and cash equivalents with institutions with high credit quality. However, at certain times, such cash and cash equivalents may be in excess of Federal Deposit Insurance Corporation insurance limits. Cash and cash equivalents are stated at cost, which approximates fair value.
Accounts Receivable: Trade accounts receivable are stated net of allowances for doubtful accounts. Specific customer provisions are made when a review of significant outstanding amounts, customer creditworthiness and current economic trends indicate that collection is doubtful. In addition, provisions are made at differing amounts, based upon the balance and age of the receivable and the Company’s historical collection experience. Trade accounts are charged off against the allowance for doubtful accounts or expensed when it is probable the accounts will not be recovered. As of the years ended 2016 and 2015, accounts receivable were reduced by an allowance for doubtful accounts of $2.1 million and $5.9 million, respectively. Transactions affecting the allowance for doubtful accounts are as follows (in thousands):
For The Years Ended | ||||||||
2016 | 2015 | |||||||
Balance at beginning of year | $ | 5,872 | $ | 4,632 | ||||
Charged to expense | 1,415 | 2,567 | ||||||
Write-offs, recoveries and other, net | (5,152 | ) | (1,327 | ) | ||||
Balance at end of year | $ | 2,135 | $ | 5,872 | ||||
Inventories: Inventories are stated at the lower of cost or market, with cost primarily determined on a first-in, first-out or average cost basis and stated net of reserves for obsolescence. Cost includes materials, labor and overhead related to the purchase and production of inventories.
Property, Plant and Equipment: Property, plant and equipment are recorded at cost and depreciated over their estimated useful lives. Depreciation is provided using the straight-line method generally based on the estimated useful lives of 15 to 45 years for buildings and building improvements, 10 to 15 years for machinery and equipment and 3 to 10 years for furniture and fixtures. Leasehold improvements are amortized over the shorter of the lease term or the estimated useful life of the improvements. When an asset is retired or otherwise disposed of, the related gross cost and accumulated depreciation are removed from the accounts and any resulting gain or loss is reflected in the statement of operations. Expenditures for repairs and maintenance are charged to expense as incurred, and expenditures that increase the capacity, efficiency or useful lives of existing assets are capitalized.
Computer Software: The Company develops and purchases software for internal use. Software development costs incurred during the application development stage are capitalized. Once the software has been installed, tested and is ready for use, additional costs in connection with the software are expensed as incurred. Capitalized computer software costs are amortized over the estimated useful life of the software, generally between three and seven years. Net computer software costs included in property, plant and equipment were $20.7 million and $16.6 million as of the years ended 2016 and 2015, respectively.
Debt Issuance Costs: Direct expenses such as legal, accounting and underwriting fees incurred to issue, extend or amend debt are included as a reduction in the carrying amount of the related debt, with the exception of costs incurred in connection with the Company's asset-based revolving credit facility (the "ABL Facility") which are recorded in other assets, net. Debt issuance costs are recorded net of accumulated amortization, and are amortized to interest expense over the term of the related debt. Debt issuance costs of $18.1 million and $16.5 million were recorded as a reduction to long-term debt as of the years ended 2016 and 2015, respectively, and $3.6 million and $2.4 million were recorded in other assets, net, as of the years ended 2016 and 2015, respectively. Interest expense includes the amortization of debt issuance costs of $9.0 million and $10.1 million in 2016 and 2015, respectively.
Goodwill and Other Intangible Assets: Goodwill represents the excess of purchase price over the fair value of net assets of businesses acquired. Goodwill is not amortized. Goodwill is subject to an annual impairment test and is reviewed annually as of the end of November to determine if there is an impairment, or more frequently if an indication of possible impairment exists. Impairment testing for goodwill is performed at a reporting unit level, with all goodwill assigned to a reporting unit. The Company's reporting units are the same as its three operating segments. An impairment loss generally would be recognized when the carrying amount of the reporting unit's net assets exceeds the estimated fair value of the reporting unit. No impairment charges for goodwill were recorded for years ended 2016 and 2015, except as disclosed in Note 3, which relates to discontinued operations.
40
CENVEO, INC. AND SUBSIDIARIES
NOTES TO CONSOLIDATED FINANCIAL STATEMENTS (CONTINUED)
Other intangible assets consist primarily of customer relationships and trademarks. Other intangible assets primarily arise from the purchase price allocations of businesses acquired. Intangible assets with determinable lives are amortized on a straight-line basis over the estimated useful life assigned to these assets. Intangible assets that are expected to generate cash flows indefinitely are not amortized, but are evaluated for impairment using the relief-from-royalty method. There were no intangible asset impairments for the years ended 2016 or 2015.
Long-Lived Assets: Long-lived assets, including property, plant and equipment, and intangible assets with definite lives, are evaluated for impairment whenever events or changes in circumstances indicate that the carrying value of the assets may not be fully recoverable. An impairment is assessed if the undiscounted expected future cash flows generated from an asset are less than its carrying value. Impairment losses are recognized for the amount by which the carrying value of an asset exceeds its fair value (Level 2 and 3). Additionally, the estimated useful lives of all long-lived assets are periodically reviewed and revised, if necessary.
Self-Insurance: The Company is self-insured for the majority of its workers’ compensation costs and health insurance costs, subject to specific retention levels. The Company records its liability for workers’ compensation claims on a fully-developed basis. The Company’s liability for health insurance claims includes an estimate for claims incurred, but not reported. As of the years ended 2016 and 2015, the (i) undiscounted workers' compensation liability was $12.1 million and $12.3 million, respectively, and the discounted liability was $11.2 million and $11.4 million, respectively, using discount rates of 2% for each of the years ended 2016 and 2015; and the (ii) healthcare liability was $3.2 million for each of the years ended 2016 and 2015, respectively.
Pension and Other Postretirement Plans: The Company records expense relating to its pension and other postretirement plans based on actuarial calculations. The inputs for these estimates mainly include discount rates, anticipated mortality rates and assumed rates of return. The Company reviews its actuarial assumptions on an annual basis and modifies the assumptions based on current anticipated rates. The effect of modifications on the value of plan obligations and assets is recognized in accumulated other comprehensive income (loss) ("AOCI") and is recognized in the statement of operations over future periods.
Revenue Recognition: The Company recognizes revenue when persuasive evidence of an arrangement exists, product delivery has occurred, pricing is fixed or determinable, and collection is reasonably assured, net of rebates earned by customers. Since a significant portion of the Company’s products are customer specific, it is common for customers to inspect the quality of the product at the Company’s facility prior to its shipment. Products shipped are not subject to contractual right of return provisions.
Sales Tax: The Company records sales net of applicable sales tax.
Freight Costs: The costs of delivering finished goods to customers are recorded as freight costs and included in cost of sales. Freight costs that are either billed separately to the customer or included in the price of the product are included in net sales.
Advertising Costs: All advertising costs are expensed as incurred. Advertising costs were $3.7 million and $3.2 million for 2016 and 2015, respectively.
Stock-Based Compensation: The Company uses the fair value method of accounting for stock-based compensation. The Company uses the Black-Scholes-Merton option-pricing model ("Black-Scholes") to measure fair value of stock option awards. The Black-Scholes model requires the Company to make significant judgments regarding the assumptions used within the model, the most significant of which are the stock price volatility assumption, the expected life of the option award, the risk-free rate of return and dividends during the expected term. The Company recognizes stock-based compensation expense for share-based awards expected to vest on a straight-line basis over the requisite service period of the award based on their grant date fair value.
Foreign Currency Translation: Assets and liabilities of subsidiaries operating outside the United States with a functional currency other than the United States dollar are translated at year-end exchange rates. The effects of translation are included in shareholders’ deficit. Income and expense items and gains and losses are translated at the average monthly rate. Foreign currency transaction gains and losses are recorded in other income, net when the underlying transaction takes place.
Income Taxes: Deferred income taxes reflect the future tax effect of temporary differences between the carrying amount of assets and liabilities for financial and income tax reporting and are measured by applying statutory tax rates in effect for the year during which the differences are expected to reverse. Deferred tax assets are reduced by a valuation allowance to the extent it is more likely than not that the net deferred tax assets will not be realized. The Company has a full valuation allowance related to its net U.S. deferred tax assets as of the year ended 2016.
The Company recognizes a tax position in its consolidated financial statements when it is more likely than not that the position would be sustained upon examination by tax authorities. This recognized tax position is then measured at the largest amount of benefit that is greater than fifty percent likely of being realized upon ultimate settlement. Although the Company believes
41
CENVEO, INC. AND SUBSIDIARIES
NOTES TO CONSOLIDATED FINANCIAL STATEMENTS (CONTINUED)
that its estimates are reasonable, the final outcome of uncertain tax positions may be materially different from that which is recognized in its consolidated financial statements. The Company adjusts such reserves upon changes in circumstances that would cause a change to the estimate of the ultimate liability, upon effective settlement or upon the expiration of the statute of limitations, in the period in which such event occurs.
New Accounting Pronouncements: In May 2014, the Financial Accounting Standards Board ("FASB") issued Accounting Standards Update ("ASU") 2014-09, "Revenue from Contracts with Customers (Topic 606)." The new revenue recognition standard provides a five-step analysis to determine when and how revenue is recognized. The standard requires that a company recognizes revenue to depict the transfer of promised goods or services to customers in an amount that reflects the consideration to which a company expects to be entitled in exchange for those goods or services. This ASU is effective for annual periods beginning after December 15, 2017 and will be applied retrospectively to each period presented or as a cumulative-effect adjustment as of the date of adoption. The Company is currently evaluating the impact of the pending adoption of ASU 2014-09; however, we do not expect that the future adoption of ASU 2014-09 will have a material impact on its consolidated financial statements.
In May 2015, the FASB issued ASU 2015-07, "Fair Value Measurement (Topic 820): Disclosures for Investments in Certain Entities That Calculate Net Asset Value per Share (or Its Equivalent)". This ASU removes the requirement to categorize all investments for which fair value is measured at the net asset value per share practical expedient within the fair value hierarchy. The Company adopted ASU 2015-07 during 2016 and applied the provisions retrospectively to all periods presented. Adoption of ASU 2015-07 did not have a material impact on the Company's consolidated financial statements, other than enhancing the disclosures in Note 13.
In July 2015, the FASB issued ASU 2015-11, "Inventory (Topic 340): Simplifying the Measurement of Inventory." Under ASU 2015-11, companies utilizing the first-in, first-out or average cost method should measure inventory at the lower of cost or net realizable value, whereas net realizable value is defined as the estimated selling price in the ordinary course of business, less reasonably predictable costs of completion, disposal, and transportation. This ASU is effective for interim and annual reporting periods beginning after December 15, 2016. The Company expects that the future adoption of ASU 2015-11 will not have a material impact on its consolidated financial statements.
In November 2015, the FASB issued ASU 2015-17 "Balance Sheet Classification of Deferred Taxes." ASU 2015-17 simplifies the presentation of deferred income taxes to require that deferred tax assets and liabilities be classified as non-current in a classified balance sheet. This ASU is effective for annual periods beginning after December 15, 2016. As of year ended 2016, the Company had $3.4 million of current deferred tax assets that would be reclassified from prepaid and other current assets to other liabilities.
In February 2016, the FASB issued ASU 2016-02, "Leases (Topic 842)." The new standard establishes a right-of-use ("ROU") model that requires a lessee to record a ROU asset and a lease liability on the balance sheet for all leases with terms longer than 12 months. Leases will be classified as either finance or operating, with classification affecting the pattern of expense recognition in the statement of operations. This ASU is effective for fiscal years beginning after December 15, 2018, including interim periods within those fiscal years and early adoption is permitted. A modified retrospective transition approach is required for capital and operating leases existing at, or entered into after, the beginning of the earliest comparative period presented in the financial statements, with certain practical expedients available. At a minimum, adoption of ASU 2016-02 will require recording a ROU asset and a lease liability on the Company's consolidated balance sheet; however, the Company is still currently evaluating the impact on its consolidated financial statements. See Note 14 for the current anticipated future operating lease payments.
In March 2016, the FASB issued ASU 2016-09, "Compensation—Stock Compensation (Topic 718): Improvements to Employee Share-Based Payment Accounting." The new standard simplifies various aspects related to how share-based payments are accounted for and presented in the consolidated financial statements. The amendments include income tax consequences, the accounting for forfeitures, classification of awards as either equity or liabilities and classification on the statement of cash flows. The guidance is effective in the first quarter of fiscal 2017 and early adoption is permitted if all amendments are adopted in the same period. The Company expects that the future adoption of ASU 2016-09 will not have a material impact on its consolidated financial statements.
In August 2016, the FASB issued ASU No. 2016-15, "Statement of Cash Flows (Topic 230): Classification of Certain Cash Receipts and Cash Payments." ASU 2016-15 reduces the diversity in practice in how certain cash receipts and cash payments are presented and classified in the statement of cash flows. This ASU is effective for interim and annual reporting periods beginning after December 15, 2017. The Company expects that the future adoption of ASU 2016-15 will not have a material impact on its consolidated financial statements.
42
CENVEO, INC. AND SUBSIDIARIES
NOTES TO CONSOLIDATED FINANCIAL STATEMENTS (CONTINUED)
In January 2017, the FASB issued ASU 2017-04 "Intangibles - Goodwill and Other (Topic 350): Simplifying the Accounting for Goodwill Impairment" which removes the second step from the goodwill impairment test. A goodwill impairment will now be the amount by which a reporting unit’s carrying value exceeds its fair value, not to exceed the carrying amount of goodwill. ASU 2017-04 is effective for annual and interim periods beginning January 1, 2020, with early adoption permitted, and applied prospectively. The Company expects that the future adoption of ASU 2017-04 will not have a material impact on its consolidated financial statements.
2. Acquisitions
The Company accounts for business combinations under the provisions of ASC 805 "Business Combinations." Acquisitions are accounted for by the acquisition method, and accordingly, the assets and liabilities of the acquired businesses have been recorded at their estimated fair values on the acquisition date with the excess of the purchase price over their estimated fair values recorded as goodwill. In the event the estimated fair values of the assets and liabilities acquired exceed the purchase price paid, a bargain purchase gain is recorded in the statements of operations.
Acquisition-related costs are expensed as incurred. Acquisition-related costs, including integration costs, are included in selling, general and administrative expenses and were zero and $1.1 million for the years ended 2016 and 2015, respectively.
Asendia
On August 7, 2015, the Company acquired certain assets of Asendia USA, Inc. ("Asendia"). The acquired assets provide letter shop, data processing, bindery and digital printing offerings. The Company also added approximately 40 employees. The total purchase price of approximately $2.0 million was allocated to the tangible and identifiable intangible assets acquired based on their estimated fair values at the acquisition date, and was assigned to the Company's print segment. The acquired identifiable intangible assets relate to customer relationships of $0.1 million.
Purchase Price Allocation
The following table summarizes the allocation of the purchase price to the assets acquired and liabilities assumed in the Asendia acquisition (in thousands):
Accounts receivable, net | $ | 145 | ||
Inventories | 46 | |||
Prepaid and other current assets | 10 | |||
Property, plant and equipment | 1,662 | |||
Other intangible assets | 133 | |||
Total assets acquired | $ | 1,996 | ||
The results of operations and cash flows are included in the Company’s statements of operations and cash flows from August 7, 2015. Pro forma results for the year ended 2015 are not presented as the effect would not be material.
3. Discontinued Operations
On January 19, 2016, the Company completed the sale of the Packaging Business. The Company received total cash proceeds of approximately $89.6 million, net of transaction costs of approximately $6.3 million. This resulted in the recognition of a total loss of $3.6 million, of which a gain of $1.4 million was recorded for the year ended 2016. For the year ended 2015, the Company recorded a non-cash loss on sale of $5.0 million and a non-cash goodwill impairment charge of $9.9 million related to this transaction. This loss was based on the executed purchase agreement and the net assets of the Packaging Business. In accordance with the guidance in ASC 205-20 Presentation of Financial Statements - Discontinued Operations and ASC 360 Property, Plant & Equipment, the financial results of the Packaging Business were accounted for as discontinued operations.
The following table shows the components of assets and liabilities that are classified as discontinued operations in the Company's consolidated balance sheets as of December 31, 2016, and January 2, 2016 (in thousands):
43
CENVEO, INC. AND SUBSIDIARIES
NOTES TO CONSOLIDATED FINANCIAL STATEMENTS (CONTINUED)
2016 | 2015 | |||||||
Accounts receivable, net | $ | — | $ | 23,244 | ||||
Inventories | — | 18,603 | ||||||
Other current assets | — | 6,719 | ||||||
Assets of discontinued operations - current | — | 48,566 | ||||||
Property, plant and equipment, net | — | 48,244 | ||||||
Goodwill and other long-term assets | — | 14,607 | ||||||
Assets of discontinued operations - long-term | — | 62,851 | ||||||
Accounts payable | — | 17,917 | ||||||
Other current liabilities | — | 4,351 | ||||||
Liabilities of discontinued operations - current | — | 22,268 | ||||||
Long-term debt and other liabilities | — | 1,153 | ||||||
Liabilities of discontinued operations - long-term | — | 1,153 | ||||||
Net assets of discontinued operations | $ | — | $ | 87,996 | ||||
The following table summarizes certain statement of operations information for discontinued operations (in thousands, except per share data):
For The Years Ended | ||||||||
2016 | 2015 | |||||||
Net sales | $ | 6,637 | $ | 178,850 | ||||
Cost of sales | 6,625 | 154,570 | ||||||
Selling, general and administrative expenses | 2,242 | 20,630 | ||||||
Amortization of intangible assets | — | 2,062 | ||||||
Restructuring and other charges | — | 390 | ||||||
Impairment of goodwill | — | 9,857 | ||||||
Interest expense, net | 7 | 117 | ||||||
Other expense (income), net | 729 | (954 | ) | |||||
Loss from discontinued operations | (2,966 | ) | (7,822 | ) | ||||
Gain (loss) on sale of discontinued operations | 1,405 | (4,987 | ) | |||||
Loss from discontinued operations before income taxes | (1,561 | ) | (12,809 | ) | ||||
Income tax expense (benefit) on discontinued operations | 1,336 | (1,419 | ) | |||||
Loss from discontinued operations, net of taxes | $ | (2,897 | ) | $ | (11,390 | ) | ||
Loss per share - basic | $ | (0.34 | ) | $ | (1.34 | ) | ||
Loss per share - diluted | $ | (0.31 | ) | $ | (1.34 | ) | ||
4. Inventories
Inventories by major category are as follows (in thousands):
2016 | 2015 | |||||||
Raw materials | $ | 32,696 | $ | 40,938 | ||||
Work in process | 12,186 | 14,696 | ||||||
Finished goods | 57,068 | 65,981 | ||||||
$ | 101,950 | $ | 121,615 | |||||
44
CENVEO, INC. AND SUBSIDIARIES
NOTES TO CONSOLIDATED FINANCIAL STATEMENTS (CONTINUED)
5. Property, Plant and Equipment
Property, plant and equipment are as follows (in thousands):
2016 | 2015 | |||||||
Land and land improvements | $ | 8,537 | $ | 9,194 | ||||
Buildings and building improvements | 82,440 | 82,206 | ||||||
Machinery and equipment | 546,425 | 525,914 | ||||||
Furniture and fixtures | 9,553 | 8,696 | ||||||
Construction in progress | 10,885 | 10,181 | ||||||
657,840 | 636,191 | |||||||
Accumulated depreciation | (450,161 | ) | (425,613 | ) | ||||
$ | 207,679 | $ | 210,578 | |||||
Sale-Leaseback Transactions
During the second quarter of 2016, the Company sold one manufacturing facility, which related to its envelope segment for net proceeds of $7.9 million and entered into a five year operating lease for the same facility, with an option to renew for up to two additional five year periods. As a result, the Company recorded a gain of approximately $2.1 million in other income, net and a deferred gain of approximately $2.8 million which will be recognized ratably over the original five year lease term.
During the fourth quarter of 2015, the Company sold one manufacturing facility, which related to its print segment for net proceeds of $7.1 million and entered into a one-year operating lease for the same facility. In connection with the sale, the Company recorded a gain of $3.1 million in other income, net and a deferred gain of approximately $0.5 million which was recognized ratably over the lease term.
6. Goodwill and Other Intangible Assets
The changes in the carrying amount of goodwill as of the years ended 2016 and 2015 by reportable segment are as follows (in thousands):
Envelope | Print | Label | Total | |||||||||||||
Balance as of the year ended 2014 | $ | 23,433 | $ | 42,832 | $ | 109,277 | $ | 175,542 | ||||||||
Foreign currency translation | — | (204 | ) | — | (204 | ) | ||||||||||
Balance as of the year ended 2015 | 23,433 | 42,628 | 109,277 | 175,338 | ||||||||||||
Foreign currency translation | — | (129 | ) | — | (129 | ) | ||||||||||
Balance as of the year ended 2016 | $ | 23,433 | $ | 42,499 | $ | 109,277 | $ | 175,209 | ||||||||
As discussed in Note 1, the Company is required to perform an impairment test of goodwill at least annually. The impairment test for goodwill uses a two-step approach. Step one compares the estimated fair value of a reporting unit with goodwill to its carrying value. If the carrying value exceeds the estimated fair value, step two must be performed. Step two compares the carrying value of the reporting unit to the fair value of all of the assets and liabilities of the reporting unit (including any unrecognized intangibles) as if the reporting unit was acquired in a business combination. If the carrying amount of a reporting unit’s goodwill exceeds the implied fair value of its goodwill, an impairment loss is recognized in an amount equal to the excess. The Company's valuation of all of its reporting units was performed using the income approach in which the Company utilized a discounted cash flow analysis to determine the present value of expected future cash flows of each reporting unit. The Company performed a market approach analysis in order to support the reasonableness of the fair value determined under the income approach.
The estimated fair value for each of the Company's reporting units, as of the year ended 2016, exceeded the respective carrying values of each reporting unit. As a result, it was concluded that the goodwill assigned to each reporting unit, as of the year ended 2016, was not impaired. Additionally, there were no goodwill impairments recorded for the year ended 2015, except as disclosed in Note 3, which relates to discontinued operations.
45
CENVEO, INC. AND SUBSIDIARIES
NOTES TO CONSOLIDATED FINANCIAL STATEMENTS (CONTINUED)
Other intangible assets are as follows (in thousands):
2016 | 2015 | |||||||||||||||||||||||||||||||||
Weighted Average Remaining Amortization Period (Years) | Gross Carrying Amount | Accumulated Impairment Charges | Accumulated Amortization | Net Carrying Amount | Gross Carrying Amount | Accumulated Impairment Charges | Accumulated Amortization | Net Carrying Amount | ||||||||||||||||||||||||||
Intangible assets with definite lives: | ||||||||||||||||||||||||||||||||||
Customer relationships | 7 | $ | 114,287 | $ | (27,234 | ) | $ | (60,014 | ) | $ | 27,039 | $ | 114,345 | $ | (27,234 | ) | $ | (55,209 | ) | $ | 31,902 | |||||||||||||
Trademarks and trade names | 22 | 64,533 | (46,493 | ) | (9,138 | ) | 8,902 | 64,540 | (46,493 | ) | (8,649 | ) | 9,398 | |||||||||||||||||||||
Leasehold interest | 16 | 4,430 | — | (743 | ) | 3,687 | 4,430 | — | (516 | ) | 3,914 | |||||||||||||||||||||||
Patents | 9 | 3,528 | — | (3,225 | ) | 303 | 3,528 | — | (3,192 | ) | 336 | |||||||||||||||||||||||
Subtotal | 11 | 186,778 | (73,727 | ) | (73,120 | ) | 39,931 | 186,843 | (73,727 | ) | (67,566 | ) | 45,550 | |||||||||||||||||||||
Intangible assets with indefinite lives: | ||||||||||||||||||||||||||||||||||
Trade names | 84,900 | — | — | 84,900 | 84,900 | — | — | 84,900 | ||||||||||||||||||||||||||
Total | $ | 271,678 | $ | (73,727 | ) | $ | (73,120 | ) | $ | 124,831 | $ | 271,743 | $ | (73,727 | ) | $ | (67,566 | ) | $ | 130,450 | ||||||||||||||
Annual amortization expense of intangible assets for the next five years and all future periods is estimated to be as follows (in thousands):
Annual Estimated Expense | ||||
2017 | $ | 5,269 | ||
2018 | 5,003 | |||
2019 | 4,885 | |||
2020 | 4,885 | |||
2021 | 4,731 | |||
Thereafter | 15,158 | |||
Total | $ | 39,931 | ||
Asset Impairments
There were no intangible asset impairments for the years ended 2016 or 2015.
7. Other Current Liabilities
Other current liabilities are as follows (in thousands):
2016 | 2015 | |||||||
Accrued interest expense | $ | 21,074 | $ | 23,644 | ||||
Accrued customer rebates | 21,126 | 20,591 | ||||||
Restructuring liabilities | 5,477 | 3,198 | ||||||
Other accrued liabilities | 35,222 | 41,381 | ||||||
$ | 82,899 | $ | 88,814 | |||||
46
CENVEO, INC. AND SUBSIDIARIES
NOTES TO CONSOLIDATED FINANCIAL STATEMENTS (CONTINUED)
8. Long-Term Debt
Long-term debt is as follows (in thousands):
2016 | 2015 | |||||||
ABL Facility due 2021 (1) | $ | 81,700 | $ | 148,200 | ||||
4.0% senior secured notes due 2021 ($50.0 million outstanding principal amount as of the year ended 2016) | 49,813 | — | ||||||
8.500% junior priority secured notes due 2022 ($241.0 million and $248.0 million outstanding principal amount as of the years ended 2016 and 2015, respectively) | 234,742 | 240,533 | ||||||
6.000% senior priority secured notes due 2019 ($540.0 million outstanding principal amount as of the years ended 2016 and 2015) | 530,166 | 526,533 | ||||||
6.000% senior unsecured notes due 2024 ($104.5 million outstanding principal amount as of the year ended 2016) | 85,591 | — | ||||||
11.5% senior notes due 2017 ($20.5 million and $199.7 million outstanding principal amount as of the years ended 2016 and 2015, respectively) | 20,371 | 195,846 | ||||||
7% senior exchangeable notes due 2017 ($5.5 million and $83.3 million outstanding principal amount as of the years ended 2016 and 2015, respectively) | 5,468 | 82,430 | ||||||
Other debt including capital leases | 10,815 | 15,081 | ||||||
1,018,666 | 1,208,623 | |||||||
Less current maturities | (31,727 | ) | (5,373 | ) | ||||
Long-term debt | $ | 986,939 | $ | 1,203,250 | ||||
__________________________
(1) The weighted average interest rate outstanding for the ABL Facility was 3.4% and 2.8% as of the years ended 2016 and 2015, respectively.
The estimated fair value of the Company’s long-term debt was approximately $881.7 million and $895.7 million as of the years ended 2016 and 2015, respectively. The fair value was determined by the Company to be Level 2 under the fair value hierarchy and was based upon review of observable pricing in secondary markets for each debt instrument. Interest expense for the year ended 2016 reflected average outstanding debt of approximately $1.1 billion and a weighted average interest rate of 6.8%, compared to the average outstanding debt of approximately $1.2 billion and a weighted average interest rate of 7.2% for the year ended 2015.
Exchange Offer
On June 10, 2016, Cenveo, Inc.'s wholly-owned subsidiary, Cenveo Corporation (the "Subsidiary Issuer") closed its exchange offer (the "Exchange Offer") whereby $149.3 million, or approximately 80%, of its outstanding 11.5% senior notes due 2017 (the "11.5% Notes") were exchanged for $104.5 million of newly issued 6.000% senior unsecured notes due 2024 (the "6.000% Unsecured Notes") and warrants (the "Warrants") to purchase shares of Common Stock, representing in the aggregate 16.6% of the outstanding Common Stock as of June 10, 2016. Included in the total amount exchanged was $4.2 million of 11.5% Notes owned by affiliated noteholders, whose notes were exchanged for 6.000% Unsecured Notes and Warrants pursuant to a simultaneous and separately negotiated securities exchange agreement. In connection with the Exchange Offer, the Company capitalized debt issuance costs of $7.4 million, all of which will be amortized over the life of the 6.000% Unsecured Notes, and of which $7.1 million is unamortized as of the year ended 2016. Subsequent to the Exchange Offer, $40.5 million of 11.5% Notes remained outstanding.
For accounting purposes, the Exchange Offer was treated as an extinguishment of the 11.5% Notes and the issuance of the new 6.000% Unsecured Notes. Upon extinguishment, the net carrying amount of the 11.5% Notes was written off and the 6.000% Unsecured Notes were recorded at fair value based on market comparable transactions at the time of the Exchange Offer. The fair value of the 6.000% Unsecured Notes was based on market value pricing, using observable market-based data for similar issuances (Level 2). The Company estimates the fair value of the 6.000% Unsecured Notes on the date of issuance was $92.0 million. The discount of $12.5 million was recorded as a component of the gain on early extinguishment of debt, net, and will be amortized over the life of the 6.000% Unsecured Notes using the effective interest method.
47
CENVEO, INC. AND SUBSIDIARIES
NOTES TO CONSOLIDATED FINANCIAL STATEMENTS (CONTINUED)
The 6.000% Unsecured Notes were issued pursuant to an Indenture, dated as of June 10, 2016 (the "6.000% Unsecured Indenture"), among Cenveo, Inc., Subsidiary Issuer, the other guarantors party thereto and The Bank of New York Mellon, as trustee. The 6.000% Unsecured Notes will mature on May 15, 2024. Interest on the 6.000% Unsecured Notes is payable semi-annually in arrears on May 15 and November 15 of each year, commencing November 15, 2016. The 6.000% Unsecured Notes and the related guarantees are the Subsidiary Issuer's and the guarantors’ senior unsecured obligations. The 6.000% Unsecured Notes are fully and unconditionally guaranteed on a senior basis by Cenveo, Inc. and by certain of its existing and future U.S. subsidiaries (other than the Subsidiary Issuer) and, under certain circumstances, certain of its future Canadian subsidiaries. As such, the 6.000% Unsecured Notes rank pari passu with the Subsidiary Issuer's and the guarantors’ existing and future senior indebtedness, senior to the Subsidiary Issuer's and the guarantors’ future indebtedness that is expressly subordinated to the 6.000% Unsecured Notes, effectively junior to the Subsidiary Issuer's and the guarantors’ existing and future indebtedness that is secured by liens to the extent of the value of the collateral securing such indebtedness and structurally subordinated to all of the existing and future liabilities, including trade payables, of Cenveo, Inc.'s subsidiaries that do not guarantee the 6.000% Unsecured Notes. The 6.000% Unsecured Indenture contains a number of covenants which, among other things, restrict, subject to certain exceptions, Cenveo, Inc.'s ability and the ability of the Subsidiary Issuer and the other subsidiaries of Cenveo, Inc. to incur additional indebtedness; declare or pay dividends, redeem stock or make other distributions to shareholders; purchase or prepay subordinated indebtedness; make investments; create liens or use assets as security in other transactions; merge or consolidate, or sell, transfer, lease or dispose of assets; and engage in transactions with affiliates. The 6.000% Unsecured Indenture also contains certain customary affirmative covenants and events of default.
The Subsidiary Issuer issued 11,046,028 Warrants pursuant to a Warrant Agreement, dated as of June 10, 2016 (the "Warrant Agreement"), between Cenveo, Inc. and Computershare Trust Company, N.A., as warrant agent. Each Warrant is currently exercisable for 0.125 shares of Common Stock at $12.00 per share as adjusted as a result of Cenveo, Inc.’s recent Reverse Stock Split, subject to mandatory cashless exercise provisions. The number of shares for which a Warrant may be exercised and the exercise price are subject to adjustment in certain events. The Warrants will be exercisable at any time prior to their expiration on June 10, 2024. The Company used the Black-Scholes model, which resulted in a fair value of $6.3 million for the Warrants. The Company recorded the fair value in paid-in capital in the Company's consolidated balance sheet.
In connection with the issuance of the Warrants, Cenveo, Inc. and Allianz Global Investors U.S. LLC ("Allianz") entered into a Warrant Registration Rights Agreement, dated as of June 10, 2016 (the "Registration Rights Agreement"), pursuant to which Cenveo, Inc. initially filed a shelf registration statement on November 23, 2016, covering the resale of the Warrants and the shares of Common Stock to be issued upon exercise of the Warrants, which shelf registration statement was declared effective on December 16, 2016. Under the Registration Rights Agreement, Cenveo, Inc. is obligated to use its commercially reasonable efforts to keep such shelf registration statement effective until the earlier of: (i) the fifth anniversary of the effective date of the shelf registration statement; and (ii) the date all transfer restricted securities covered by the shelf registration statement have been sold as contemplated in the shelf registration statement. If Cenveo, Inc. fails to satisfy its obligations under the Registration Rights Agreement, it will be required to pay liquidated damages to the holders of the Warrants under certain circumstances.
ABL Amendment
Concurrent with the Exchange Offer, Cenveo, Inc. and Subsidiary Issuer entered into Amendment No. 4, dated as of June 10, 2016 (the "ABL Amendment No. 4"), to the Subsidiary Issuer's ABL Facility, which, among other things, extends the term of the ABL Facility to 2021 and reduces the commitments thereunder by $50 million to $190 million. The ABL Facility now matures in June 2021, with a springing maturity of May 2019 ahead of the Subsidiary Issuer's existing 6.000% senior priority secured notes due 2019 (the "6.000% Secured Notes") in the event that more than $10.0 million of the 6.000% Secured Notes remain outstanding at such time. In connection with this amendment, the Company capitalized debt issuance costs of $2.3 million. See below for further discussion related to the Company's ABL Facility.
Indenture and Note Purchase Agreement
Concurrent with the Exchange Offer, Cenveo, Inc. and Subsidiary Issuer also entered into a secured Indenture and Note Purchase Agreement, dated as of June 10, 2016 (the "Indenture and Note Purchase Agreement"), with certain affiliates of or funds managed by Allianz (collectively, the "Purchasers"), pursuant to which Subsidiary Issuer issued 4% senior secured notes to the Purchasers in an aggregate principal amount of $50.0 million (the "4% Secured Notes") at par, the proceeds of which were applied to reduce the outstanding principal amount under the ABL Facility. The 4% Secured Notes mature in December 2021, with a springing maturity of May 2019 ahead of the 6.000% Secured Notes. The 4% Secured Notes bear interest at 4% per annum, payable quarterly in arrears on the last day of March, June, September and December in each year, commencing September 30, 2016, and are secured by the same collateral that secures the ABL Facility, the 6.000% Secured Notes and the Subsidiary Issuer's existing 8.500% junior priority secured notes due 2022 (the "8.500% Notes"). The obligations under the 4% Secured Notes are guaranteed by the Company and each existing and future direct and indirect North American subsidiary of the Company. With respect to the
48
CENVEO, INC. AND SUBSIDIARIES
NOTES TO CONSOLIDATED FINANCIAL STATEMENTS (CONTINUED)
ABL Facility, the 4% Secured Notes rank junior with respect to all collateral up to a certain maximum principal amount of the ABL Facility. With respect to the 6.000% Secured Notes, the 4% Secured Notes rank junior with respect to notes priority collateral and senior with respect to ABL Facility priority collateral. With respect to the 8.500% Notes, the 4% Secured Notes rank senior with respect to all collateral. Such ranking of the 4% Secured Notes with respect to the 6.000% Secured Notes and the 8.500% Notes is the same ranking that the ABL Facility has with such notes. The Indenture and Note Purchase Agreement contains a number of covenants which, among other things, restrict, subject to certain exceptions, Cenveo, Inc.’s ability and the ability of the Subsidiary Issuer and the other subsidiaries of Cenveo, Inc. to incur additional indebtedness; declare or pay dividends, redeem stock or make other distributions to shareholders; purchase or prepay certain specified indebtedness; dispose of assets; make investments; grant liens on assets; merge or consolidate or transfer certain assets; and engage in transactions with affiliates. The Indenture and Note Purchase Agreement also contains certain customary affirmative covenants. In connection with the issuance of the 4% Secured Notes, the Company capitalized debt issuance costs of $0.1 million.
7% Note Purchase Agreement
In addition, on July 18, 2016, Cenveo, Inc., Subsidiary Issuer and Allianz completed the last transactions contemplated by the Support Agreement, dated as of May 10, 2016, among Cenveo, Inc., the Subsidiary Issuer and Allianz, pursuant to which Allianz agreed to, among other things, tender and sell to Subsidiary Issuer all of its 7% Notes owned by Allianz in the aggregate principal amount of $37.5 million (the "Allianz 7% Note Purchase") in exchange for: (a) payment in cash in an amount equal to (i) the aggregate principal amount of such 7% Notes multiplied by 0.6 plus (ii) an amount of interest on the amount payable pursuant to the immediately preceding clause (i) at an annual interest rate of 7% per annum, such interest accruing from June 10, 2016 until (and including) the closings of the purchases and computed based on a year of 360 days; (b) payment in cash of interest that accrued in respect of such 7% Notes in accordance with the indenture relating to such 7% Notes but remained unpaid at the closings of the purchases; and (c) delivery to Allianz of Warrants to purchase Common Stock, representing in the aggregate 3.3% of the outstanding Common Stock as of June 10, 2016. In connection with such agreement, during 2016 the Subsidiary Issuer repurchased an aggregate of $37.5 million of its 7% Notes for $22.5 million and issued an aggregate of 2,239,827 Warrants.
6.000% Senior Priority Secured Notes
On June 26, 2014, the Subsidiary Issuer issued $540.0 million aggregate principal amount of 6.000% Secured Notes, which were sold to qualified institutional buyers in accordance with Rule 144A under the Securities Act of 1933, and to certain non-U.S. persons in accordance with Regulation S under the Securities Act of 1933. The 6.000% Secured Notes were issued at par, pursuant to an indenture (the "6.000% Secured Indenture") among the Subsidiary Issuer, Cenveo, Inc. and the other guarantors party thereto, and The Bank of New York Mellon, as trustee and collateral agent. The Subsidiary Issuer pays interest on the 6.000% Secured Notes semi-annually, in cash in arrears, on February 1 and August 1 of each year, commencing on August 1, 2014. The 6.000% Secured Notes have no required principal payments prior to their maturity on August 1, 2019. The 6.000% Secured Notes are guaranteed on a senior secured basis by Cenveo, Inc. and substantially all of its existing and future North American subsidiaries (other than the Subsidiary Issuer). As such, the 6.000% Secured Notes rank pari passu with all of the Subsidiary Issuer's existing and future senior debt, and senior to any of the Subsidiary Issuer's subordinated debt and effectively junior to the Subsidiary Issuer's obligations under the ABL Facility and the 4% Secured Notes, to the extent that the ABL Facility and the 4% Secured Notes have a first priority perfected security interest in certain of the Company's assets. The Subsidiary Issuer may redeem the 6.000% Secured Notes, in whole or in part, on or after February 1, 2019, at a redemption price of 100.0% plus accrued and unpaid interest. In addition, at any time between August 1, 2017, and February 1, 2019, the Subsidiary Issuer may redeem in whole or in part the remaining aggregate principal amount of the notes originally issued at a redemption price of 100% plus accrued and unpaid interest and a "make-whole" premium of not less than 1%. At any time prior to August 1, 2017, the Subsidiary Issuer may redeem up to 35% of the aggregate principal amount of the notes originally issued with the net cash proceeds of certain public equity offerings, at a redemption price of 106.0% plus accrued and unpaid interest. Each holder of the 6.000% Secured Notes has the right to require the Subsidiary Issuer to repurchase such holder's notes at a purchase price of 101% of the principal amount thereof, plus accrued and unpaid interest thereon, upon the occurrence of certain events specified in the indenture that constitute a change of control. The 6.000% Secured Indenture contains a number of covenants which, among other things, restrict, subject to certain exceptions, Cenveo, Inc.'s ability and the ability of the Subsidiary Issuer and Cenveo, Inc.'s other subsidiaries, to incur or guarantee additional indebtedness, make restricted payments (including paying dividends on, redeeming or repurchasing the Company's capital stock), permit restricted subsidiaries to pay dividends or make other distributions or payments, dispose of assets, make investments, grant liens on assets, merge or consolidate or transfer certain assets, and enter into transactions with affiliates. With respect to a disposition of assets, the 6.000% Secured Indenture requires, within 360 days after the receipt of any net proceeds, that the Company apply all such net proceeds (i) to be reinvested in the business of the Company; (ii) to repay obligations under the ABL Facility and the 4% Secured Notes under certain circumstances; or (iii) to make an offer to purchase the 6.000% Secured Notes. The 6.000% Secured Indenture also contains certain customary affirmative covenants and events of default.
49
CENVEO, INC. AND SUBSIDIARIES
NOTES TO CONSOLIDATED FINANCIAL STATEMENTS (CONTINUED)
8.500% Junior Priority Secured Notes
Concurrently with the issuance of the 6.000% Secured Notes on June 26, 2014, the Subsidiary Issuer issued $250.0 million aggregate principal amount of 8.500% Notes, which were sold to qualified institutional buyers in accordance with Rule 144A under the Securities Act of 1933. The 8.500% Notes were issued at par, pursuant to an indenture (the "8.500% Indenture") among the Subsidiary Issuer, Cenveo, Inc. and the other guarantors party thereto, and The Bank of New York Mellon, as trustee and collateral agent. The Subsidiary Issuer pays interest on the 8.500% Notes semi-annually, in cash in arrears, on March 15 and September 15 of each year, commencing on September 15, 2014. The 8.500% Notes have no required principal payments prior to their maturity on September 15, 2022. The 8.500% Notes are guaranteed on a junior secured basis by Cenveo, Inc. and substantially all of its existing and future North American subsidiaries (other than the Subsidiary Issuer). As such, the 8.500% Notes rank junior to any senior secured obligations of the Subsidiary Issuer, senior to any existing and future unsecured obligations of the Subsidiary Issuer, and senior to all existing and future obligations of the Subsidiary Issuer that are expressly subordinated to the 8.500% Notes. The Subsidiary Issuer may redeem the 8.500% Notes, in whole or in part, on or after September 15, 2017, September 15, 2018, September 15, 2019, or September 15, 2020, at redemption prices of 106.375%, 104.250%, 102.125% and 100.00%, respectively, plus accrued and unpaid interest. At any time prior to September 15, 2017, the Subsidiary Issuer may redeem up to 35% of the aggregate principal amount of the notes originally issued with the net cash proceeds of certain public equity offerings, at a redemption price of 108.5% plus accrued and unpaid interest. Each holder of the 8.500% Notes has the right to require the Subsidiary Issuer to repurchase such holder's notes at a purchase price of 101% of the principal amount thereof, plus accrued and unpaid interest thereon, upon the occurrence of certain events specified in the indenture that constitute a change of control. The 8.500% Indenture contains a number of covenants which, among other things, restrict, subject to certain exceptions, Cenveo, Inc.'s ability and the ability of the Subsidiary Issuer and Cenveo, Inc.'s other subsidiaries, to incur or guarantee additional indebtedness, make restricted payments (including paying dividends on, redeeming or repurchasing the Company's capital stock), permit restricted subsidiaries to pay dividends or make other distributions or payments, dispose of assets, make investments, grant liens on assets, merge or consolidate or transfer certain assets, and enter into transactions with affiliates. With respect to a disposition of assets, the 8.500% Indenture requires, within 360 days after the receipt of any net proceeds, that the Company apply all such net proceeds (i) to be reinvested in the business of the Company; (ii) to repay indebtedness constituting senior priority obligations; or (iii) to make an offer to purchase the 8.500% Notes. The 8.500% Indenture also contains certain customary affirmative covenants and events of default.
Net proceeds of the 6.000% Secured Notes and 8.500% Notes were used to: (i) refinance the $360 million secured term loan facility (the "Term Loan Facility"), which at the time had a remaining principal balance of $327.3 million; (ii) refinance the 8.875% senior second lien notes due 2018 (the "8.875% Notes"), which at the time had a remaining principal balance of $400.0 million; and (iii) pay related fees, expenses and accrued interest. In connection with the issuance of the 6.000% Secured Notes and the 8.500% Notes, the Company capitalized debt issuance costs of $14.7 million and $7.1 million, respectively, all of which will be amortized over the life of the 6.000% Secured Notes and the 8.500% Notes, of which $6.5 million and $4.2 million, respectively, remain unamortized as of the year ended 2016.
A portion of the refinancing was accounted for as a modification of debt. As a result, the Company will continue to amortize a portion of the unamortized debt issuance costs on the 8.875% Notes and Term Loan Facility. The modification resulted in the recording of a discount of $5.9 million on the 6.000% Secured Notes and $2.8 million on the 8.500% Notes, of which $3.3 million and $2.0 million, respectively, remain unamortized as of the year ended 2016.
ABL Facility
On April 16, 2013, the Subsidiary Issuer completed the refinancing of its $170 million revolving credit facility due 2014 (the "Revolving Credit Facility") and its existing term loan B due 2016 (collectively with the Revolving Credit Facility, the "Refinanced Facility") by entering into: (i) a Second Amended and Restated Credit Agreement providing for the Term Loan Facility, with a syndicate of lenders arranged by Bank of America, N.A., Macquarie Capital (USA) Inc. and Barclays Bank PLC, with Bank of America, N.A. serving as administrative agent, syndication agent and documentation agent; and (ii) a Credit Agreement providing for a $200 million ABL Facility (together with the Term Loan Facility, the "2013 Credit Facilities"), with a syndicate of lenders arranged by Bank of America, N.A., Barclays Bank PLC, General Electric Capital Corporation and Wells Fargo Bank, National Association, with Bank of America, N.A. serving as administrative agent, issuing bank and swingline lender. In connection with the 2013 Credit Facilities, the Company capitalized debt issuance costs of $7.2 million. Proceeds from the 2013 Credit Facilities, together with available cash on hand, were used to refinance the outstanding term loans and revolving loans, and accrued interest thereon, under the Refinanced Facility, and to pay certain fees and expenses incurred in connection with the transactions. The Company extinguished the Term Loan Facility during 2014.
Borrowing rates under the ABL Facility are selected at the Subsidiary Issuer's option at the time of each borrowing and are generally based on London Interbank Offered Rate ("LIBOR") or the prime rate publicly announced by Bank of America,
50
CENVEO, INC. AND SUBSIDIARIES
NOTES TO CONSOLIDATED FINANCIAL STATEMENTS (CONTINUED)
N.A. from time to time, in each case plus a specified interest rate margin. LIBOR-based borrowings have an interest rate margin ranging from 2.00% to 2.50% per annum, and prime rate borrowings have an interest rate margin ranging from 1.00% to 1.50% per annum, in each case depending on average availability under the ABL Facility for the most recent fiscal quarter. Under the ABL Facility, the Subsidiary Issuer pays a commitment fee on unused revolving loan commitments of 0.375% per annum or 0.50% per annum, depending on average usage under the ABL Facility for the most recent fiscal quarter.
The ABL Facility contains a minimum consolidated fixed charge coverage ratio covenant that applies if availability thereunder falls below a certain level. In addition, the ABL Facility contains customary covenants that, among other things, place limits on the Company’s ability to incur debt, create liens, make investments and acquisitions, sell assets, pay dividends, prepay subordinated debt, merge with other entities, engage in transactions with affiliates and make capital expenditures. The ABL Facility also contains customary events of default.
The obligations under the ABL Facility are guaranteed by Cenveo, Inc. and each existing and future direct and indirect North American subsidiary (other than the Subsidiary Issuer). The ABL Facility is secured by a first priority perfected security interest in substantially all assets of Cenveo, Inc. and its North American subsidiaries, including: (i) all capital stock of each present and future subsidiary (with certain exclusions of foreign subsidiaries); (ii) all present and future inter-company debt; (iii) all intellectual property rights, including patents, trademarks and copyrights; and (iv) substantially all of the present and future other property and assets, including material real property.
On December 11, 2013, Cenveo, Inc. and Subsidiary Issuer entered into an Amendment No. 1 to the ABL Facility ("ABL Amendment No. 1"), pursuant to which the revolving commitments under the original agreement were increased by $30.0 million. Capitalized fees and expenses associated with the ABL Amendment No. 1 were approximately $0.3 million. A portion of the additional $30.0 million borrowing capacity under the ABL Facility, together with cash on hand, were used to repay $28.2 million of its Term Loan Facility.
On June 10, 2014, Cenveo, Inc. and Subsidiary Issuer entered into Amendment No. 2 to the ABL Facility, which amended the ABL Facility in order to allow the issuance of the 6.000% Secured Notes and 8.500% Notes and the related refinancing transactions.
On January 30, 2015, Cenveo, Inc. and Subsidiary Issuer entered into Amendment No. 3 to the ABL Facility ("ABL Amendment No. 3"), and an accompanying Increasing Lender Agreement on February 4, 2015, pursuant to which the revolving commitments were increased by $10.0 million to a total capacity of $240.0 million. Among other things, ABL Amendment No. 3 increased the Subsidiary Issuer's flexibility to use the proceeds of any future asset sales to prepay its other indebtedness. The amendment also generally increased the Subsidiary Issuer's flexibility to prepay outstanding indebtedness, make acquisitions and other investments, and pay dividends, subject to the satisfaction of certain conditions. In connection with this amendment, the Company capitalized debt issuance costs of $1.3 million.
On June 10, 2016, Cenveo, Inc. and Subsidiary Issuer entered into Amendment No. 4 to the ABL Facility (the "ABL Amendment No. 4"), which, among other things, extends the term of the ABL Facility through 2021 and reduces the commitments thereunder by $50 million to $190 million. The ABL Facility now matures in June 2021, with a springing maturity of May 2019 ahead of the Subsidiary Issuer's existing 6.000% Secured Notes in the event that more than $10.0 million of the 6.000% Secured Notes remain outstanding at such time. In connection with this amendment, the Company capitalized debt issuance costs of $2.3 million.
In connection with the ABL Facility, $3.6 million of debt issuance costs remained unamortized as of the year ended 2016 and is recorded in other assets, net.
Other Debt
On September 30, 2015, the Subsidiary Issuer entered into an equipment loan in the aggregate amount of $12.5 million, secured by certain machinery and equipment of the Subsidiary Issuer. Interest on the equipment loan accrues at 8.25% per year and is payable monthly in arrears beginning on November 1, 2015, through February 1, 2019. If the Subsidiary Issuer elects to prepay the loan in full before the maturity date, a prepayment fee of 3% will apply if such payment is made during the first year following closing of the equipment loan, 2% if such prepayment is made during the second year following such closing, and 1% if such prepayment is made during the third year following such closing or thereafter. Net proceeds from the equipment loan were used to repay in full the equipment loan entered into in connection with the acquisition of certain assets of National Envelope Corporation ("National") on September 16, 2013.
51
CENVEO, INC. AND SUBSIDIARIES
NOTES TO CONSOLIDATED FINANCIAL STATEMENTS (CONTINUED)
11.5% Senior Notes
On March 28, 2012, the Subsidiary Issuer issued $225 million aggregate principal amount of 11.5% Notes that were sold with registration rights to qualified institutional buyers in accordance with Rule 144A under the Securities Act of 1933, and to certain non-U.S. persons in accordance with Regulation S under the Securities Act of 1933. The 11.5% Notes were issued at a discount of approximately $8.3 million, of which less than $0.1 million remains unamortized as of December 31, 2016. The 11.5% Notes were issued pursuant to an indenture (the "11.5% Indenture") among the Subsidiary Issuer, Cenveo, Inc., certain subsidiary guarantors and U.S. Bank N.A., as trustee. The Subsidiary Issuer has paid interest on the 11.5% Notes, semi-annually, in cash in arrears, on May 15 and November 15 of each year, commencing on May 15, 2012, with the final interest payment occurring on the maturity date of May 15, 2017. The 11.5% Notes have no required principal payments prior to their maturity on May 15, 2017. The 11.5% Notes are guaranteed on a senior unsecured basis by Cenveo, Inc. and substantially all of its existing and future North American subsidiaries (other than the Subsidiary Issuer). As such, the 11.5% Notes rank pari passu with all of the Subsidiary Issuer's existing and future senior debt and senior to any of the Subsidiary Issuer's subordinated debt. The Subsidiary Issuer has the right to redeem the 11.5% Notes, in whole or in part, on or after May 15, 2015, at redemption prices ranging from 100% to 105.75%, plus accrued and unpaid interest. Each holder of the 11.5% Notes has the right to require the Subsidiary Issuer to repurchase such holder's notes at a purchase price of 101% of the principal amount thereof, plus accrued and unpaid interest thereon, upon the occurrence of certain events specified in the indenture that constitute a change of control. The 11.5% Indenture contains a number of covenants that, among other things, restrict, subject to certain exceptions, Cenveo, Inc.'s ability and the ability of the Subsidiary Issuer and Cenveo, Inc.'s other subsidiaries to incur or guarantee additional indebtedness, make restricted payments (including paying dividends on, redeeming or repurchasing the Company's capital stock), permit restricted subsidiaries to pay dividends or make other distributions or payments, dispose of assets, make investments, grant liens on assets, merge or consolidate or transfer certain assets, and enter into transactions with affiliates. With respect to a disposition of assets, the 11.5% Indenture requires, within 360 days after the receipt of any net proceeds from an asset sale, that the Company apply all such net proceeds: (i) to be reinvested in the business of the Company; (ii) to repay or retire any senior debt; or (iii) to make an offer to purchase the 11.5% Notes. The 11.5% Indenture also contains certain customary affirmative covenants.
Subsequent Event
On January 13, 2017, the Subsidiary Issuer filed a notice of redemption calling the $20.5 million remaining principal balance of its 11.5% Notes at par. The Company intends to redeem the full outstanding principal balance during the first quarter of 2017.
7% Senior Exchangeable Notes
Concurrently with the issuance of the 11.5% Notes on March 28, 2012, the Subsidiary Issuer issued $86.3 million aggregate principal amount of the 7% Notes that were sold to qualified institutional buyers in accordance with Rule 144A under the Securities Act of 1933. The 7% Notes were issued pursuant to an indenture (the "7% Indenture") among the Subsidiary Issuer, Cenveo, Inc., certain subsidiary guarantors and U.S. Bank N.A., as trustee. The Subsidiary Issuer has paid interest on the 7% Notes semi-annually, in cash in arrears, on May 15 and November 15 of each year, commencing on November 15, 2012, with the final interest payment occurring on the maturity date of May 15, 2017. The 7% Notes have no required principal payments prior to their maturity on May 15, 2017. The 7% Notes are guaranteed on a senior unsecured basis by Cenveo, Inc. and substantially all of its existing and future North American subsidiaries (other than the Subsidiary Issuer). As such, the 7% Notes rank pari passu with all of the Subsidiary Issuer's existing and future senior debt and senior to any of Subsidiary Issuer's subordinated debt. The Subsidiary Issuer may not redeem the notes at its option. Upon a fundamental change, as defined in the 7% Indenture, each holder of 7% Notes may require the Subsidiary Issuer to repurchase all or a portion of such holder's notes for cash at a repurchase price equal to 100% of the principal amount of the notes to be repurchased, plus any accrued and unpaid interest to, but excluding, the fundamental change repurchase date, as defined in the 7% Indenture. The 7% Indenture does not contain any financial covenants or any restrictions, among other things, on the payment of dividends, the incurrence of other indebtedness, or the issuance or repurchase of securities by the Subsidiary Issuer. The 7% Indenture does not contain any covenants or other provisions to protect holders of the notes in the event of a highly leveraged transaction or a change of control, except to the extent described in the 7% Indenture.
The 7% Notes are exchangeable at any time prior to the close of business on the business day immediately preceding the maturity date, for shares of Cenveo, Inc.'s common stock at an exchange rate of 30.1896 shares per $1,000 principal amount of 7% Notes (as adjusted as a result of Cenveo, Inc.’s recent Reverse Stock Split), which is equal to an exchange price of approximately $33.12 per share (as adjusted as a result of Cenveo, Inc.'s recent Reverse Stock Split), subject to adjustment under certain specified circumstances. This represents a premium of 373.8% above the last reported sale price of Cenveo, Inc.'s common stock on the New York Stock Exchange on Friday, December 30, 2016, which was $6.99 per share. If a holder elects
52
CENVEO, INC. AND SUBSIDIARIES
NOTES TO CONSOLIDATED FINANCIAL STATEMENTS (CONTINUED)
to exchange notes in connection with a make-whole fundamental change, as described in the 7% Indenture, such holder may also be entitled to receive a make-whole premium upon exchange in certain circumstances.
In connection with the issuance of the 11.5% Notes and the 7% Notes, the Company capitalized debt issuance costs of $6.0 million and $3.0 million, respectively, all of which will be amortized over the life of the 11.5% Notes and the 7% Notes, each of which have less than $0.1 million unamortized as of the year ended 2016.
2016 Extinguishments
For the year ended 2016, the Company recorded a total gain on early extinguishment of debt of $82.5 million comprised of the following transactions:
Subsequent to the completion of the Exchange Offer and the Allianz 7% Note Purchase, the Company recorded a gain on early extinguishment of debt of $2.3 million related to the repurchase of $7.0 million of its 8.500% Notes, of which $2.5 million related to a discount on the purchase price, partially offset by a write-off of unamortized debt issuance costs of $0.1 million and a write-off of original issuance discount of $0.1 million. The Company also recorded a loss on early extinguishment of debt of $0.1 million related to the repurchase of $20.0 million of its 11.5% Notes, all of which related to the write-off of unamortized debt issuance costs and original issuance discount. Additionally, the Company recorded a loss on early extinguishment of debt of less than $0.1 million related to the repurchase of $5.7 million of its 7% Notes, all of which related to the write-off of unamortized debt issuance costs.
In connection with the Allianz 7% Note Purchase, the Company recorded a gain on early extinguishment of debt of $12.8 million related to the repurchase of $37.5 million of its 7% Notes, of which $15.0 million related to a discount on the purchase price, partially offset by the fair value of the Warrants issued of $1.3 million, $0.6 million of transaction fees and expenses and a write-off of unamortized debt issuance costs of $0.3 million. The fair value of the Warrants was determined using the Black-Scholes model.
In connection with the Exchange Offer, the Company recorded a gain on early extinguishment of debt of $46.1 million, of which $49.6 million related to a discount on the difference of the net carrying value of the extinguished 11.5% Notes and the fair value of the new 6.000% Unsecured Notes, partially offset by a write-off of unamortized debt issuance costs of $0.8 million, a write-off of original issuance discount of $1.2 million, and $1.5 million of transaction fees and expenses. Additionally, $1.4 million of gain on early extinguishment of debt related to the $4.2 million exchange by affiliated noteholders was recorded as a component of paid-in capital, all of which related to a discount on the Exchange Offer.
In connection with ABL Amendment No. 4, the Company recorded a loss on early extinguishment of debt of $0.2 million related to the write off of unamortized debt issuance costs.
Prior to the Exchange Offer, the Company recorded a gain on early extinguishment of debt of $16.5 million related to the repurchase of $34.5 million of its 7% Notes, of which $16.8 million related to a discount on the purchase price, partially offset by a write-off of unamortized debt issuance costs of $0.3 million. Additionally, the Company recorded a gain on early extinguishment of debt of $5.1 million related to the repurchase of $10.0 million of its 11.5% Notes, of which $5.3 million related to a discount on the purchase, partially offset by a write-off of unamortized debt issuance costs of $0.1 million and a write-off of original issuance discount of $0.1 million.
2015 Extinguishments
For the year ended 2015, the Company recorded a total loss on early extinguishment of debt of $1.3 million. The Subsidiary Issuer paid in full an existing equipment loan, which had a remaining principal balance at the time of $12.3 million. In connection with this extinguishment, the Company recorded a loss on early extinguishment of debt of $0.7 million, of which $0.5 million related to the write-off of unamortized debt issuance costs and $0.2 million related to prepayment fees. Additionally, the Company recorded a loss on early extinguishment of debt of $0.6 million related to the repurchase of $22.6 million of its 11.5% Notes, of which $0.2 million related to the write-off of unamortized debt issuance costs, $0.2 million related to the write-off of original issuance discount, and $0.2 million related to a premium paid over the principal amount upon repurchase.
Debt Restrictions and Compliance
The agreements governing the Subsidiary Issuer's outstanding indebtedness contain a number of significant restrictions and covenants which limit the Company's ability (subject in each case to limited exceptions) to, among other things: (i) incur or guarantee additional indebtedness; (ii) make restricted payments, including dividends and prepaying indebtedness; (iii) create or
53
CENVEO, INC. AND SUBSIDIARIES
NOTES TO CONSOLIDATED FINANCIAL STATEMENTS (CONTINUED)
permit certain liens; (iv) enter into business combinations and asset sale transactions; (v) make investments, including capital expenditures; (vi) amend organizational documents and change accounting methods; (vii) enter into transactions with affiliates; and (viii) enter into new businesses.
The ABL Facility also contains a negative covenant restricting dispositions, including dispositions the aggregate book value of which exceeds $35.0 million. Such dispositions are permitted, however, if within 360 days after the receipt of any net proceeds from such dispositions, the Company applies all of the net proceeds thereof: (i) to be reinvested in the business of the Company; (ii) to repay obligations under the ABL Facility under certain circumstances; or (iii) to make an offer to purchase the 6.000% Secured Notes. Each of the indentures governing the 6.000% Secured Notes, 8.500% Notes, 11.5% Notes, and 6.000% Unsecured Notes and the Indenture and Note Purchase Agreement governing the 4% Secured Notes also contains a negative covenant requiring the Company to apply any net proceeds from an asset sale: (i) to be reinvested in the business of the Company; (ii) to repay certain of the Company's indebtedness; or (iii) to make an offer to purchase the 6.000% Secured Notes, 8.500% Notes, 11.5% Notes, 6.000% Unsecured Notes or 4% Secured Notes, respectively. On January 19, 2016, the Company completed the sale of the Packaging Business, realizing total cash proceeds of approximately $89.6 million, net of transaction costs. The Company has satisfied the reinvestment requirements set forth in the debt agreements with respect to such net cash proceeds.
In addition, the ABL Facility contains a minimum consolidated fixed charge coverage ratio with which, under certain circumstances, the Company must comply on a quarterly basis. The Company's ability to meet such fixed charge coverage ratio may be affected by events beyond the Company's control, such as further deterioration in general economic conditions. The Company is also required to provide certain financial information on a quarterly basis. Failure to maintain the fixed charge coverage ratio or effective internal controls could, in certain circumstances, prevent the Subsidiary Issuer from borrowing additional amounts, and could result in a default under the ABL Facility. Such a default could cause the indebtedness outstanding under the ABL Facility, and, by reason of cross-acceleration or cross-default provisions, the 6.000% Secured Notes, the 8.500% Notes, the 11.5% Notes, the 6.000% Unsecured Notes, the 4% Secured Notes and the 7% Notes, and any other indebtedness the Subsidiary Issuer may then have, to become immediately due and payable.
If any such defaults occur and if the Subsidiary Issuer is unable to repay those amounts, the lenders under the ABL Facility, the indentures governing the 6.000% Secured Notes and 8.500% Notes and the Indenture and Note Purchase Agreement governing the 4% Secured Notes could initiate a bankruptcy or liquidation proceeding, or proceed against the collateral granted to them which secures that indebtedness.
The obligations under the ABL Facility are guaranteed by Cenveo, Inc. and each existing and future direct and indirect North American subsidiary of Cenveo, Inc. (other than the Subsidiary Issuer). The ABL Facility is secured by a first priority perfected security interest in substantially all accounts receivable and inventory, and a junior priority perfected security interest in substantially all other assets, of Cenveo, Inc. and its North American subsidiaries. Provided the Company is in compliance with the covenants contained in the ABL Facility, the Company would also be in compliance, in most circumstances, with the Company’s incurrence tests within all of the Company’s debt indentures.
As of the year ended 2016, the Company was in compliance with all debt agreement covenants.
The aggregate annual maturities for long-term debt, including the original issuance discount, are as follows (in thousands):
2017 | $ | 31,847 | ||
2018 | 3,881 | |||
2019 | 540,736 | |||
2020 | 205 | |||
2021 | 131,796 | |||
Thereafter | 345,516 | |||
$ | 1,053,981 | |||
The Subsidiary Issuer may from time to time seek to purchase its outstanding notes in open market purchases, privately negotiated transactions or other means. Such repurchases, if any, will depend on prevailing market conditions, the Company's liquidity requirements, contractual restrictions and other factors.
54
CENVEO, INC. AND SUBSIDIARIES
NOTES TO CONSOLIDATED FINANCIAL STATEMENTS (CONTINUED)
9. Fair Value Measurements
Certain assets and liabilities of the Company are required to be recorded at fair value on either a recurring or non-recurring basis. Fair value is determined based on the price that would be received for an asset or paid to transfer a liability in an orderly transaction between market participants.
Assets and Liabilities Measured at Fair Value on a Recurring Basis:
On a recurring basis, the Company records its pension plan assets (Note 13) at fair value. No additional assets or liabilities were recorded at fair value on a recurring basis for the years ended 2016 and 2015.
Assets and Liabilities Measured at Fair Value on a Nonrecurring Basis:
Assets and liabilities measured at fair value on a nonrecurring basis relate primarily to the Company's tangible fixed assets, goodwill and other intangible assets, which are remeasured when the derived fair value is below carrying value on the consolidated balance sheets. For these assets, the Company does not periodically adjust carrying value to fair value except in the event of impairment. When the Company determines that impairment has occurred, the carrying value of the asset is reduced to fair value and the difference is recorded within operating income in the statement of operations. No impairment of fixed assets or goodwill has been recorded for the years ended 2016 or 2015, except as disclosed in Note 3 or Note 11.
Fair Value of Financial Instruments:
The Company’s financial instruments include cash and cash equivalents, accounts receivable, net, long-term debt and accounts payable. The carrying values of cash and cash equivalents, accounts receivable, net, and accounts payable are reasonable estimates of their fair values as of the years ended 2016 and 2015 due to the short-term nature of these instruments. See Note 8 for fair value of the Company’s outstanding debt. Additionally, the Company also records the assets and liabilities assumed in its acquisitions (Note 2) at fair value.
10. Income Taxes
Income Tax Expense
Income (loss) from continuing operations before income taxes was as follows for the years ended (in thousands):
2016 | 2015 | |||||||
Domestic | $ | 74,288 | $ | (17,196 | ) | |||
Foreign | 816 | 2,128 | ||||||
$ | 75,104 | $ | (15,068 | ) | ||||
Income tax expense on income (loss) from continuing operations consisted of the following for the years ended (in thousands):
2016 | 2015 | |||||||
Current tax expense: | ||||||||
Federal | $ | — | $ | — | ||||
Foreign | 1,230 | 592 | ||||||
State | 1,748 | 1,058 | ||||||
2,978 | 1,650 | |||||||
Deferred tax expense: | ||||||||
Federal | 1,165 | 1,109 | ||||||
Foreign | (279 | ) | 270 | |||||
State | 394 | 1,364 | ||||||
1,280 | 2,743 | |||||||
Income tax expense | $ | 4,258 | $ | 4,393 | ||||
55
CENVEO, INC. AND SUBSIDIARIES
NOTES TO CONSOLIDATED FINANCIAL STATEMENTS (CONTINUED)
A reconciliation of the expected tax benefit based on the federal statutory tax rate to the Company’s actual income tax expense is summarized as follows for the years ended (in thousands):
2016 | 2015 | |||||||
Expected tax expense (benefit) at federal statutory income tax rate | $ | 26,286 | $ | (5,274 | ) | |||
State and local income tax expense (benefit) | 5,917 | (3,295 | ) | |||||
State net operating loss adjustments | 1,273 | 2,259 | ||||||
Change in valuation allowance | (35,659 | ) | 5,914 | |||||
Change in contingency reserves | (132 | ) | (118 | ) | ||||
Non-U.S. tax rate differences | 665 | 116 | ||||||
Non-deductible expenses | 4,325 | 3,094 | ||||||
Change in state tax rates | 99 | 802 | ||||||
Other | 1,484 | 895 | ||||||
Income tax expense | $ | 4,258 | $ | 4,393 | ||||
Deferred Income Taxes
Deferred taxes are recorded to give recognition to temporary differences between the tax basis of assets and liabilities and their reported amounts in the financial statements. The tax effects of these temporary differences are recorded as deferred tax assets and deferred tax liabilities. Deferred tax assets generally represent items that can be used as a tax deduction or credit in future years. Deferred tax liabilities generally represent items that have been deducted for tax purposes, but have not yet been recorded in the consolidated statement of operations. The Company has not recorded a U.S. deferred tax liability with respect to its unremitted foreign earnings as the Company’s intention is to permanently reinvest those earnings in the local jurisdiction, as these amounts are not material.
The tax effects of temporary differences that give rise to the deferred tax assets and deferred tax liabilities of the Company, were as follows (in thousands):
2016 | 2015 | |||||||
Deferred tax assets: | ||||||||
Net operating loss carryforwards | $ | 81,949 | $ | 128,232 | ||||
Compensation and benefit related accruals | 50,261 | 50,255 | ||||||
Alternative minimum tax credit carryforwards | 7,307 | 7,450 | ||||||
Accounts receivable | 1,004 | 2,679 | ||||||
Inventory | 2,083 | 2,816 | ||||||
Restructuring accruals | 8,158 | 8,810 | ||||||
Accrued tax and interest | 2,015 | 1,882 | ||||||
Other | 6,292 | 4,022 | ||||||
Valuation allowance | (129,159 | ) | (163,225 | ) | ||||
Total deferred tax assets | 29,910 | 42,921 | ||||||
Deferred tax liabilities: | ||||||||
Property, plant and equipment | (19,771 | ) | (27,850 | ) | ||||
Goodwill and other intangible assets | (48,744 | ) | (52,438 | ) | ||||
Other | (630 | ) | (553 | ) | ||||
Total deferred tax liabilities | (69,145 | ) | (80,841 | ) | ||||
Net deferred tax liability | $ | (39,235 | ) | $ | (37,920 | ) | ||
56
CENVEO, INC. AND SUBSIDIARIES
NOTES TO CONSOLIDATED FINANCIAL STATEMENTS (CONTINUED)
The net deferred tax liability included the following (in thousands):
2016 | 2015 | |||||||
Current deferred tax asset (included in prepaid and other current assets) | $ | 3,382 | $ | 4,116 | ||||
Long-term deferred tax liability (included in other liabilities) | (42,617 | ) | (42,036 | ) | ||||
Total | $ | (39,235 | ) | $ | (37,920 | ) | ||
The Company has federal and state net operating loss carryforwards. The tax effect of these attributes was $81.9 million as of the year ended 2016. Federal net operating loss carryforwards of $220.0 million will expire from 2025 through 2034 and alternative minimum tax credit carryforwards of $7.3 million do not have an expiration date.
The Company reviews the likelihood that it will realize the benefit of its deferred tax assets and therefore the need for valuation allowances on a quarterly basis, or more frequently if events indicate that a review is required. In determining the requirement for a valuation allowance, the historical and projected financial results of the legal entity or consolidated group recording the net deferred tax asset is considered, along with all other available positive and negative evidence. The factors considered in the determination of the probability of the realization of the deferred tax assets include, but are not limited to: recent historical financial results, historical taxable income, projected future taxable income, the expected timing of the reversals of existing temporary differences, the duration of statutory carryforward periods and tax planning strategies. If, based upon the weight of available evidence, it is more likely than not that the deferred tax assets will not be realized, a valuation allowance is recorded.
Concluding that a valuation allowance is not required is difficult when there is significant negative evidence which is objective and verifiable, such as cumulative losses in recent years. The Company utilizes a rolling twelve quarters of pre-tax income or loss adjusted for significant permanent book to tax differences, as well as non-recurring items, as a measure of its cumulative results in recent years. In the United States, the Company's analysis indicates that it has cumulative three year historical losses on this basis. While there are significant impairment, restructuring and refinancing charges driving the cumulative three year loss, this is considered significant negative evidence which is objective and verifiable and therefore, difficult to overcome. However, the three year loss position is not solely determinative and accordingly, the Company considers all other available positive and negative evidence in its analysis. Based upon the Company's analysis, which incorporated the excess capacity and pricing pressure experienced in certain product lines, the Company believes it is more likely than not that the net deferred tax assets in the United States will not be fully realized in the future. Accordingly, the Company has a valuation allowance related to those net deferred tax assets of $117.8 million as of the year ended 2016. Deferred tax assets related to certain state net operating losses also did not reach the more likely than not realizability criteria and accordingly, were subject to a valuation allowance, the balance of which, as of the year ended 2016 was $11.4 million.
There is no corresponding income tax benefit recognized with respect to losses incurred and no corresponding income tax expense recognized with respect to earnings generated in jurisdictions with a valuation allowance. This causes variability in the Company's effective tax rate. As a result of generating an estimated $112.5 million of federal taxable income for the year ended 2016, primarily as a result of the gain on early extinguishment of debt and the sale of the Packaging Business, there is no federal income tax expense recognized for the year ended 2016. The significant reduction in the valuation allowance for the year ended 2016 is related to these transactions. The Company intends to maintain the valuation allowances until it is more likely than not that the net deferred tax assets will be realized. If operating results improve on a sustained basis, or if certain tax planning strategies are implemented, conclusions regarding the need for valuation allowances could change, resulting in a decrease of the valuation allowances in the future, which could have a significant impact on income tax expense in the period recognized and subsequent periods.
Uncertain Tax Positions
The Company accounts for uncertain tax positions by prescribing a recognition threshold and measurement attribute for the financial statement recognition and measurement of a tax position taken or expected to be taken on a tax return. During 2016 and 2015, the Company did not reduce its liability for uncertain tax positions. The Company does not anticipate significant changes to its unrecognized tax benefits in the next twelve months. The balance of the Company’s remaining unrecognized tax benefits as of the year ended 2016 includes $2.2 million of tax benefits that, if recognized would affect the effective tax rate. These amounts are included in other liabilities. The Company recognizes interest accrued related to unrecognized tax benefits and penalties as income tax expense. Related to the uncertain tax benefits noted above, the Company accrued interest of $0.4 million for the year ended 2016 and, in total, as of the year ended 2016, has recognized no liabilities for penalties and has recognized liabilities of $3.2 million for interest.
57
CENVEO, INC. AND SUBSIDIARIES
NOTES TO CONSOLIDATED FINANCIAL STATEMENTS (CONTINUED)
The Company’s unrecognized tax benefit activity for the years ended 2016, 2015 and 2014 was as follows (in thousands):
Unrecognized tax benefit – As of year end 2014 | $ | 2,226 | ||
Gross decreases – tax positions in prior period | — | |||
Gross decreases – expiration of applicable statute of limitations | — | |||
Unrecognized tax benefit – As of year end 2015 | 2,226 | |||
Gross decreases – tax positions in prior period | — | |||
Gross decreases – expiration of applicable statute of limitations | — | |||
Unrecognized tax benefit – As of year end 2016 | $ | 2,226 | ||
The Internal Revenue Service ("IRS") has examined the Company’s federal income tax returns through 2010. The Company’s federal income tax returns for tax years 2004 through 2006, 2009 through 2010, and 2012, remain subject to examination by the IRS due to a federal net operating loss generated in those years. Federal tax returns filed for 2013 forward remain subject to examination by statute. The various states in which the Company is subject to income tax audits are generally open for the tax years after 2011. The Company does not believe that the outcome of any examination will have a material impact on its consolidated financial statements.
Current Taxes
As of the years ended 2016 and 2015, the Company had income tax receivables of $2.0 million and $0.3 million, respectively, included in other current assets.
11. Restructuring and Other Charges
Cost Savings, Restructuring and Integration Plans
The Company currently has three active cost savings, restructuring and integration plans, which are related to the implementation of cost savings initiatives focused on overhead cost eliminations, including headcount reductions, and the potential closure of certain manufacturing facilities (the "2017 Plan," "2016 Plan" and the "2015 Plan"). Each plan is primarily associated with a specific fiscal year of the planned cost actions.
During 2016, the Company implemented the 2017 Plan and the 2016 Plan and substantially completed the 2015 Plan. The Company is still contemplating additional cost actions that would be associated with the 2017 Plan. During 2015, the Company also completed the plan to integrate certain assets of National into existing envelope operations (the "National Plan") by completing the closure and consolidation of nine manufacturing facilities into existing envelope operations and the opening of two new facilities.
The Company currently has certain residual cost savings, restructuring and integration plans (the "Residual Plans"). As a result of these cost savings actions over the last several years, the Company has closed or consolidated a significant amount of manufacturing facilities and has had a significant number of headcount reductions.
The Company does not anticipate any significant future expenses related to the Residual Plans other than modifications to current assumptions for lease terminations, multi-employer pension withdrawal liabilities and ongoing expenses related to maintaining restructured assets.
58
CENVEO, INC. AND SUBSIDIARIES
NOTES TO CONSOLIDATED FINANCIAL STATEMENTS (CONTINUED)
The following tables present the details of the expenses recognized as a result of these plans.
2016 Activity
Restructuring and other charges for the year ended 2016 were as follows (in thousands):
Employee Separation Costs | Asset Charges Net of Gain on Sale | Equipment Moving Expenses | Lease Termination Expenses | Multi-employer Pension Withdrawal Expenses | Building Clean-up & Other Expenses | Total | |||||||||||||||||||||||
Envelope | |||||||||||||||||||||||||||||
2017 Plan | $ | 465 | $ | — | $ | — | $ | — | $ | — | $ | — | $ | 465 | |||||||||||||||
2016 Plan | 442 | 802 | 82 | 35 | — | 145 | 1,506 | ||||||||||||||||||||||
2015 Plan | 13 | — | — | — | — | — | 13 | ||||||||||||||||||||||
Residual Plans | — | — | — | — | 54 | 9 | 63 | ||||||||||||||||||||||
Acquisition Integration Plans | — | 146 | 276 | — | — | 149 | 571 | ||||||||||||||||||||||
Total Envelope | 920 | 948 | 358 | 35 | 54 | 303 | 2,618 | ||||||||||||||||||||||
Print | |||||||||||||||||||||||||||||
2017 Plan | 660 | — | — | — | — | — | 660 | ||||||||||||||||||||||
2016 Plan | 98 | — | — | — | — | — | 98 | ||||||||||||||||||||||
2015 Plan | (3 | ) | — | — | — | — | 294 | 291 | |||||||||||||||||||||
Residual Plans | 1 | — | — | 113 | 759 | 61 | 934 | ||||||||||||||||||||||
Acquisition Integration Plans | — | — | — | 45 | — | — | 45 | ||||||||||||||||||||||
Total Print | 756 | — | — | 158 | 759 | 355 | 2,028 | ||||||||||||||||||||||
Label | |||||||||||||||||||||||||||||
2017 Plan | 220 | — | — | — | — | — | 220 | ||||||||||||||||||||||
2016 Plan | 124 | — | — | — | — | 7 | 131 | ||||||||||||||||||||||
2015 Plan | 639 | — | — | 162 | — | 1,319 | 2,120 | ||||||||||||||||||||||
Asset Impairments | — | 2,300 | — | — | — | — | 2,300 | ||||||||||||||||||||||
Total Label | 983 | 2,300 | — | 162 | — | 1,326 | 4,771 | ||||||||||||||||||||||
Corporate | |||||||||||||||||||||||||||||
2017 Plan | 655 | — | — | — | — | — | 655 | ||||||||||||||||||||||
2016 Plan | 1,889 | — | — | — | — | 3 | 1,892 | ||||||||||||||||||||||
2015 Plan | (54 | ) | — | — | — | — | — | (54 | ) | ||||||||||||||||||||
Residual Plans | — | — | — | — | — | 44 | 44 | ||||||||||||||||||||||
Total Corporate | 2,490 | — | — | — | — | 47 | 2,537 | ||||||||||||||||||||||
Total Restructuring and Other Charges | $ | 5,149 | $ | 3,248 | $ | 358 | $ | 355 | $ | 813 | $ | 2,031 | $ | 11,954 | |||||||||||||||
59
CENVEO, INC. AND SUBSIDIARIES
NOTES TO CONSOLIDATED FINANCIAL STATEMENTS (CONTINUED)
2015 Activity
Restructuring and other charges for the year ended 2015 were as follows (in thousands):
Employee Separation Costs | Asset Charges Net of Gain on Sale | Equipment Moving Expenses | Lease Termination Expenses | Multi-employer Pension Withdrawal Expenses | Building Clean-up & Other Expenses | Total | |||||||||||||||||||||||
Envelope | |||||||||||||||||||||||||||||
2015 Plan | $ | 150 | $ | — | $ | — | $ | — | $ | — | $ | — | $ | 150 | |||||||||||||||
Residual Plans | 252 | — | — | (22 | ) | 174 | 65 | 469 | |||||||||||||||||||||
Acquisition Integration Plans | 45 | 1,895 | 33 | 338 | — | 570 | 2,881 | ||||||||||||||||||||||
Total Envelope | 447 | 1,895 | 33 | 316 | 174 | 635 | 3,500 | ||||||||||||||||||||||
Print | |||||||||||||||||||||||||||||
2015 Plan | 397 | — | — | — | — | — | 397 | ||||||||||||||||||||||
Residual Plans | 65 | 181 | 52 | 163 | 4,807 | 1,188 | 6,456 | ||||||||||||||||||||||
Total Print | 462 | 181 | 52 | 163 | 4,807 | 1,188 | 6,853 | ||||||||||||||||||||||
Label | |||||||||||||||||||||||||||||
2015 Plan | 20 | — | 139 | — | — | 200 | 359 | ||||||||||||||||||||||
Residual Plans | 127 | — | — | — | — | — | 127 | ||||||||||||||||||||||
Total Label | 147 | — | 139 | — | — | 200 | 486 | ||||||||||||||||||||||
Corporate | |||||||||||||||||||||||||||||
2015 Plan | 1,552 | — | — | — | — | 171 | 1,723 | ||||||||||||||||||||||
Residual Plans | — | — | — | — | — | 14 | 14 | ||||||||||||||||||||||
Total Corporate | 1,552 | — | — | — | — | 185 | 1,737 | ||||||||||||||||||||||
Total Restructuring and Other Charges | $ | 2,608 | $ | 2,076 | $ | 224 | $ | 479 | $ | 4,981 | $ | 2,208 | $ | 12,576 | |||||||||||||||
60
CENVEO, INC. AND SUBSIDIARIES
NOTES TO CONSOLIDATED FINANCIAL STATEMENTS (CONTINUED)
A summary of the activity related to the restructuring liabilities for all the cost savings, restructuring and integration initiatives were as follows (in thousands):
Employee Separation Costs | Lease Termination Expenses | Pension Withdrawal Liabilities | Building Clean-up, Equipment Moving and Other Expenses | Total | ||||||||||||||||
2017 Plan | ||||||||||||||||||||
Balance as of the year ended 2015 | $ | — | $ | — | $ | — | $ | — | $ | — | ||||||||||
Accruals, net | 2,000 | — | — | — | 2,000 | |||||||||||||||
Payments | — | — | — | — | — | |||||||||||||||
Balance as of the year ended 2016 | $ | 2,000 | $ | — | $ | — | $ | — | $ | 2,000 | ||||||||||
2016 Plan | ||||||||||||||||||||
Balance as of the year ended 2015 | $ | — | $ | — | $ | — | $ | — | $ | — | ||||||||||
Accruals, net | 2,553 | 35 | — | 237 | 2,825 | |||||||||||||||
Payments | (1,709 | ) | (35 | ) | — | (237 | ) | (1,981 | ) | |||||||||||
Balance as of the year ended 2016 | $ | 844 | $ | — | $ | — | $ | — | $ | 844 | ||||||||||
2015 Plan | ||||||||||||||||||||
Balance as of the year ended 2014 | $ | — | $ | — | $ | — | $ | — | $ | — | ||||||||||
Accruals, net | 2,119 | — | — | 510 | 2,629 | |||||||||||||||
Payments | (1,843 | ) | — | — | (510 | ) | (2,353 | ) | ||||||||||||
Balance as of the year ended 2015 | 276 | — | — | — | 276 | |||||||||||||||
Accruals, net | 595 | 162 | — | 1,613 | 2,370 | |||||||||||||||
Payments | (624 | ) | (162 | ) | — | (1,254 | ) | (2,040 | ) | |||||||||||
Balance as of the year ended 2016 | $ | 247 | $ | — | $ | — | $ | 359 | $ | 606 | ||||||||||
Residual Plans | ||||||||||||||||||||
Balance as of the year ended 2014 | $ | 1,560 | $ | 677 | $ | 18,700 | $ | — | $ | 20,937 | ||||||||||
Accruals, net | 444 | 141 | 4,981 | 1,319 | 6,885 | |||||||||||||||
Payments | (2,001 | ) | (407 | ) | (3,839 | ) | (1,319 | ) | (7,566 | ) | ||||||||||
Balance as of the year ended 2015 | 3 | 411 | 19,842 | — | 20,256 | |||||||||||||||
Accruals, net | 1 | 113 | 813 | 114 | 1,041 | |||||||||||||||
Payments | (4 | ) | (524 | ) | (3,173 | ) | (114 | ) | (3,815 | ) | ||||||||||
Balance as of the year ended 2016 | $ | — | $ | — | $ | 17,482 | $ | — | $ | 17,482 | ||||||||||
Acquisition Integration Plans | ||||||||||||||||||||
Balance as of the year ended 2014 | $ | 77 | $ | 1,136 | $ | — | $ | — | $ | 1,213 | ||||||||||
Accruals, net | 45 | 338 | — | 603 | 986 | |||||||||||||||
Payments | (122 | ) | (1,082 | ) | — | (603 | ) | (1,807 | ) | |||||||||||
Balance as of the year ended 2015 | — | 392 | — | — | 392 | |||||||||||||||
Accruals, net | — | 45 | — | 425 | 470 | |||||||||||||||
Payments | — | (437 | ) | — | (425 | ) | (862 | ) | ||||||||||||
Balance as of the year ended 2016 | $ | — | $ | — | $ | — | $ | — | $ | — | ||||||||||
Total Restructuring Liability | $ | 3,091 | $ | — | $ | 17,482 | $ | 359 | $ | 20,932 | ||||||||||
The total restructuring liability was $20.9 million, of which $5.5 million is included in other current liabilities, and $15.4 million is included in other liabilities.
61
CENVEO, INC. AND SUBSIDIARIES
NOTES TO CONSOLIDATED FINANCIAL STATEMENTS (CONTINUED)
12. Stock-Based Compensation
The Company’s 2007 Long-Term Equity Incentive Plan, as amended, approved in May 2008 (the "2007 Plan"), authorizes the issuance of up to 562,500 shares of the Company’s common stock. Unused shares previously authorized under prior plans have been rolled over into the 2007 Plan and increased the total number of shares authorized for issuance under the 2007 Plan by 130,000.
The Company’s outstanding unvested stock options have maximum contractual terms of up to six years, principally vest ratably over four years and are granted at exercise prices equal to the market price of the Company’s common stock on the date of grant. The Company’s outstanding stock options are exercisable into shares of the Company’s common stock. The Company’s outstanding RSUs principally vest ratably over four years. Upon vesting, RSUs convert into shares of the Company’s common stock. The Company currently issues authorized shares of common stock upon vesting of restricted shares or the exercise of other equity awards. The Company has no outstanding stock appreciation rights.
The Company measures the cost of employee services received in exchange for an award of equity instruments, including grants of employee stock options, RSUs and PSUs, based on the fair value of the award at the date of grant in accordance with the modified prospective method. The Black-Scholes model requires the Company to make significant judgments regarding the assumptions used within the model, the most significant of which are the stock price volatility assumption, the expected life of the option award, the risk-free rate of return and dividends during the expected term. Stock-based compensation is expensed on a straight-line basis over the service period of the awards, with the exception of PSUs, which are expensed based on the probability that the performance condition will be satisfied.
Total stock-based compensation expense recognized in selling, general and administrative expenses was $1.5 million and $1.6 million for the years ended 2016 and 2015, respectively. The income tax benefits related to the Company’s stock-based compensation expense were $0.1 million and $0.4 million for the years ended 2016 and 2015, respectively.
As of the year ended 2016, there was approximately $1.4 million of total unrecognized compensation cost related to unvested stock-based compensation grants, which is expected to be amortized over a weighted average period of 2.1 years.
Stock Options
A summary of the Company’s outstanding stock options as of and for the years ended 2016 and 2015 is as follows:
Options | Weighted Average Exercise Price | Weighted Average Remaining Contractual Term (In Years) | Aggregate Intrinsic Value (1)(in thousands) | ||||||||||
Outstanding as of the year ended 2014 | 208,813 | $ | 41.44 | 1.4 | $ | 29 | |||||||
Granted | 85,687 | 19.04 | |||||||||||
Exercised | — | — | $ | — | |||||||||
Forfeited/expired | (104,250 | ) | 35.12 | ||||||||||
Outstanding as of the year ended 2015 | 190,250 | $ | 34.56 | 3.0 | $ | — | |||||||
Granted | — | — | |||||||||||
Exercised | — | — | $ | — | |||||||||
Forfeited/expired | (60,885 | ) | 52.09 | ||||||||||
Outstanding as of the year ended 2016 | 129,365 | $ | 26.31 | 2.9 | $ | — | |||||||
Exercisable as of the year ended 2016 | 69,684 | $ | 32.71 | 1.7 | $ | — | |||||||
__________________________
(1) | Intrinsic value for purposes of this table represents the amount by which the fair value of the underlying stock, based on the respective market prices as of the years ended 2016, 2015 and 2014, or, if exercised, the exercise dates, exceeds the exercise prices of the respective options. |
62
CENVEO, INC. AND SUBSIDIARIES
NOTES TO CONSOLIDATED FINANCIAL STATEMENTS (CONTINUED)
The weighted average grant date fair value of stock options granted during the year ended 2015, were at exercise prices equal to the market price of the stock on the grant dates, as calculated under the Black-Scholes model with the weighted average assumptions as follows:
2015 | ||||
Weighted average fair value of option grants during the year | $ | 6.88 | ||
Assumptions: | ||||
Expected option life in years | 4.25 | |||
Risk-free interest rate | 1.24 | % | ||
Expected volatility | 43.0 | % | ||
Expected dividend yield | 0.0 | % | ||
The risk-free interest rate represents the United States Treasury Bond constant maturity yield approximating the expected option life of stock options granted during the period. The expected option life represents the period of time that the stock options granted during the period are expected to be outstanding, based on the mid-point between the vesting date and contractual expiration date of the option. The expected volatility is based on the historical market price volatility of the Company’s common stock for the expected term of the options, adjusted for expected mean reversion.
There were no stock options granted during the year ended 2016.
RSUs
A summary of the Company’s non-vested RSUs as of and for the years ended 2016 and 2015 is as follows:
RSUs | Weighted Average Grant Date Fair Value | ||||||
Unvested as of the year ended 2014 | 64,108 | $ | 25.76 | ||||
Granted | 86,994 | 19.04 | |||||
Vested | (40,858 | ) | 31.36 | ||||
Forfeited | (5,157 | ) | 18.00 | ||||
Unvested as of the year ended 2015 | 105,087 | $ | 18.43 | ||||
Granted | 20,961 | 9.66 | |||||
Vested | (43,084 | ) | 18.29 | ||||
Forfeited | — | — | |||||
Unvested as of the year ended 2016 | 82,964 | $ | 16.28 | ||||
On July 28, 2016, a total of 20,961 RSUs, which vest one year from the date of issuance, were issued to the independent members of the Company's Board of Directors. The fair value of these awards was determined based on the Company's stock price on the dates of issuance.
On May 20, 2015, 72,813 RSUs were issued to certain employees of the Company, which vest ratably over four years. Additionally, 14,181 RSUs were issued to certain members of the Company's Board of Directors, which vested one year from the date of issuance. The fair value of these awards was determined based on the Company's stock price on the dates of issuance.
The total fair value of RSUs, which vested during the years ended 2016 and 2015, was $0.3 million and $0.6 million, respectively, as of the respective vesting dates.
PSUs
A summary of the Company's non-vested PSUs as of and for the years ended 2016 and 2015 is as follows:
63
CENVEO, INC. AND SUBSIDIARIES
NOTES TO CONSOLIDATED FINANCIAL STATEMENTS (CONTINUED)
PSUs | Weighted Average Grant Date Fair Value | ||||||
Unvested as of the year ended 2014 | — | $ | — | ||||
Granted | 73,750 | 19.04 | |||||
Vested | — | — | |||||
Forfeited | (3,125 | ) | 19.04 | ||||
Unvested as of the year ended 2015 | 70,625 | $ | 19.04 | ||||
Granted | — | — | |||||
Vested | (70,625 | ) | 19.04 | ||||
Forfeited | — | — | |||||
Unvested as of the year ended 2016 | — | $ | — | ||||
On May 20, 2015, 73,750 PSUs were granted to certain employees, with each award representing the right to receive one share of the Company's common stock upon the achievement of certain established performance targets and service conditions. The performance period for the awards was December 28, 2014 through January 2, 2016. Distributions under these awards were payable on the one year anniversary of the grant date provided the grantee's employment had not ceased prior to such date.
The fair value of these awards was determined based on the Company's stock price on the grant date. These awards are subject to forfeiture upon termination of employment prior to vesting.
There were no PSUs granted during the year ended 2016.
13. Retirement Plans
Pension Plans: The Company currently has two defined benefit pension plans for certain of its employees in the United States. The defined benefit plans provide benefit payments using formulas based on an employee's compensation and length of service, or stated amounts for each year of service. The Company expects to continue to fund these plans based on governmental requirements, amounts deductible for income tax purposes and as needed to ensure that plan assets are sufficient to satisfy plan liabilities. The benefits under the Company’s defined benefit pension plans are frozen.
Supplemental Executive Retirement Plans: The Company has various supplemental executive retirement plans ("SERP"), which provide benefits to certain former directors and executives. For accounting purposes, these plans are unfunded; however, one plan utilizes income from annuities to offset a portion of the cost of the plan. These annuities are included in other assets, net and are not netted against the plan's benefit obligation. Additionally, the income or loss from the annuities are not reflected in net periodic expense related to the plan.
Other Postretirement Plans: The Company has various other postretirement benefit plans ("OPEB"), primarily focused on postretirement healthcare, such as medical insurance and life insurance and related benefits for certain of its former employees and, in some instances, their spouses. Benefits, eligibility and cost-sharing provisions vary by plan documents or union collective bargaining arrangements.
Savings Plan: The Company sponsors a defined contribution plan to provide substantially all United States salaried and certain hourly employees an opportunity to accumulate personal funds for their retirement. The Company contributed $0.5 million to the plan for each of the years ended 2016 and 2015, for certain union employees. Employees participating in the plan held 342,329 shares of the Company’s common stock as of the year ended 2016.
Funded Status and Net Periodic Cost: The following tables provide a reconciliation of the changes in the Company’s pension, SERP and OPEB plans' benefit obligations and fair value of assets for 2016 and 2015, a statement of the funded status as of the years ended 2016 and 2015, respectively, and the amounts recognized in the consolidated balance sheets as of the years ended 2016 and 2015 (in thousands).
64
CENVEO, INC. AND SUBSIDIARIES
NOTES TO CONSOLIDATED FINANCIAL STATEMENTS (CONTINUED)
Pensions | SERPs | OPEBs | ||||||||||||||||||||||
2016 | 2015 | 2016 | 2015 | 2016 | 2015 | |||||||||||||||||||
Benefit obligation at beginning of year | $ | 345,901 | $ | 365,326 | $ | 16,998 | $ | 18,508 | $ | 1,504 | $ | 1,789 | ||||||||||||
Plan changes | — | — | 1,822 | — | — | — | ||||||||||||||||||
Service cost | — | — | — | — | 2 | 2 | ||||||||||||||||||
Interest cost | 13,495 | 13,341 | 640 | 656 | 58 | 63 | ||||||||||||||||||
Actuarial loss (gain) | 304 | (14,715 | ) | (531 | ) | (94 | ) | 60 | (274 | ) | ||||||||||||||
Benefits paid | (19,152 | ) | (18,051 | ) | (1,908 | ) | (2,072 | ) | (68 | ) | (76 | ) | ||||||||||||
Benefit obligation at end of year | $ | 340,548 | $ | 345,901 | $ | 17,021 | $ | 16,998 | $ | 1,556 | $ | 1,504 | ||||||||||||
The following table provides a reconciliation of the Company’s fair value of plan assets:
Pensions | SERPs | OPEBs | ||||||||||||||||||||||
2016 | 2015 | 2016 | 2015 | 2016 | 2015 | |||||||||||||||||||
Fair value of plan assets at beginning of year | $ | 247,519 | $ | 267,635 | $ | — | $ | — | $ | — | $ | — | ||||||||||||
Actual return on plan assets | 9,965 | (6,610 | ) | — | — | — | — | |||||||||||||||||
Employer contributions | 11 | 4,545 | 1,908 | 2,072 | 68 | 76 | ||||||||||||||||||
Benefits paid | (19,152 | ) | (18,051 | ) | (1,908 | ) | (2,072 | ) | (68 | ) | (76 | ) | ||||||||||||
Fair value of plan assets at end of year | $ | 238,343 | $ | 247,519 | $ | — | $ | — | $ | — | $ | — | ||||||||||||
The following table shows the funded status at the end of the year:
Pensions | SERPs | OPEBs | ||||||||||||||||||||||
2016 | 2015 | 2016 | 2015 | 2016 | 2015 | |||||||||||||||||||
Funded status at end of year | $ | (102,205 | ) | $ | (98,382 | ) | $ | (17,021 | ) | $ | (16,998 | ) | $ | (1,556 | ) | $ | (1,504 | ) | ||||||
The following table shows amounts recognized in AOCI:
Pensions | SERPs | OPEBs | ||||||||||||||||||||||
2016 | 2015 | 2016 | 2015 | 2016 | 2015 | |||||||||||||||||||
Net actuarial loss (gain) | $ | 119,450 | $ | 119,712 | $ | 4,567 | $ | 5,438 | $ | (899 | ) | $ | (1,045 | ) | ||||||||||
Prior service cost | — | — | — | — | 40 | 44 | ||||||||||||||||||
Total | $ | 119,450 | $ | 119,712 | $ | 4,567 | $ | 5,438 | $ | (859 | ) | $ | (1,001 | ) | ||||||||||
The following table shows amounts recognized in the consolidated balance sheets:
Pensions | SERPs | OPEBs | ||||||||||||||||||||||
2016 | 2015 | 2016 | 2015 | 2016 | 2015 | |||||||||||||||||||
Other current liabilities | $ | — | $ | — | $ | 2,038 | $ | 1,967 | $ | 148 | $ | 130 | ||||||||||||
Other liabilities | 102,205 | 98,382 | 14,983 | 15,031 | 1,408 | 1,374 | ||||||||||||||||||
Total liabilities | $ | 102,205 | $ | 98,382 | $ | 17,021 | $ | 16,998 | $ | 1,556 | $ | 1,504 | ||||||||||||
65
CENVEO, INC. AND SUBSIDIARIES
NOTES TO CONSOLIDATED FINANCIAL STATEMENTS (CONTINUED)
The following table provides components of the net periodic cost for the pension, SERP and OPEB plans for the years ended 2016 and 2015 (in thousands):
For The Years Ended | ||||||||
2016 | 2015 | |||||||
Service cost | $ | 2 | $ | 2 | ||||
Interest cost | 14,196 | 14,061 | ||||||
Expected return on plan assets | (19,101 | ) | (20,976 | ) | ||||
Net amortization and deferral | — | — | ||||||
Recognized net actuarial loss | 9,956 | 8,877 | ||||||
Net periodic expense | $ | 5,053 | $ | 1,964 | ||||
Interest cost on projected benefit obligation includes $0.7 million related to the Company’s SERP and OPEB plans for each of the years ended 2016 and 2015.
The pre-tax amount of actuarial losses in AOCI as of the year ended 2016 that are expected to be recognized in net periodic benefit cost in 2017 is $10.2 million for defined benefit pension plans and $0.2 million for other postretirement benefit plans, including SERP. The pre-tax amount of prior service cost included in AOCI as of the year ended 2016 that is expected to be recognized in net periodic benefit cost in 2017 is zero for all defined benefit plans.
The assumptions used were as follows:
2016 | 2015 | |||||
Discount rate used to calculate net periodic benefit expense | 4.00 | % | 3.75 | % | ||
Discount rate used to calculate projected benefit obligation | 3.75 | % | 4.00 | % | ||
Expected long-term rate of return on plan assets | 8.00 | % | 8.00 | % | ||
Rate of compensation increase | n/a | n/a | ||||
The discount rate assumption used to determine the Company’s pension obligations as of the years ended 2016 and 2015 takes into account the projected future benefit cash flow and the underlying individual yields in the Citigroup Pension Liability Index that would be available to provide for the payment of those benefits. The ultimate rate is developed by calculating an equivalent discounted present value of the benefit cash flow as of the years ended 2016 and 2015, respectively, using a single discount rate rounded to the nearest quarter percent.
The expected long-term rate of return on plan assets of 8.0% for each of the years ended 2016 and 2015 was based on historical returns and the expectations for future returns for each asset class in which plan assets are invested as well as the target asset allocation of the investments of the plan assets.
The projected benefit obligation, accumulated benefit obligation and fair value of plan assets for the Company’s pension plans with accumulated benefit obligations in excess of plan assets were as follows (in thousands):
2016 | 2015 | |||||||
Projected benefit obligation | $ | 357,569 | $ | 362,899 | ||||
Accumulated benefit obligation | 357,569 | 362,899 | ||||||
Fair value of plan assets | 238,343 | 247,519 | ||||||
The Company currently expects to contribute $7.1 million to its pension plans in 2017.
66
CENVEO, INC. AND SUBSIDIARIES
NOTES TO CONSOLIDATED FINANCIAL STATEMENTS (CONTINUED)
The estimated pension benefit payments expected to be paid by the pension plans and the estimated SERP and OPEB payments expected to be paid by the Company for the years 2017 through 2021, and in the aggregate for the years 2022 through 2026, are as follows (in thousands):
Pension | SERP | OPEB | ||||||||||
2017 | $ | 18,453 | $ | 2,076 | $ | 150 | ||||||
2018 | 18,743 | 1,897 | 145 | |||||||||
2019 | 19,078 | 1,817 | 139 | |||||||||
2020 | 19,365 | 1,733 | 133 | |||||||||
2021 | 19,650 | 1,646 | 127 | |||||||||
2022 through 2026 | 101,161 | 6,721 | 540 | |||||||||
Fair Value of Assets: The Company's investment objective is to maximize the long-term return on its pension plan assets within prudent levels of risk. Investments are primarily diversified with a blend of equity securities, fixed income securities and alternative investments. The intent is to minimize plan expenses by outperforming plan liabilities over the long run.
The Company segregated its plan assets by the following major categories and levels for determining their fair values as of the years ended 2016 and 2015:
Cash and cash equivalents - Carrying value approximates fair value. As such, these assets were classified as Level 1.
Equity - Equity investments are diversified by including United States and non-United States stocks, growth stocks, value stocks and stocks of large and small companies. The values of individual equity securities are based on quoted prices in active markets and are classified as Level 1.
Fixed income - Fixed income securities are primarily United States governmental and corporate bonds including mutual funds. The Company invests in certain fixed income funds that were priced in active markets and were classified as Level 1. The Company also invests in certain fixed income securities that are priced based on valuation models rather than a last trade basis and are not exchange-traded and are classified as Level 2.
Other - The Company also invests in group annuity contracts, which are invested in certain fixed income securities and are classified as Level 2.
Alternative investments - Alternative investments are primarily private equity hedge funds and hedge fund-of-funds. The fair value of alternative investments has been estimated using their Net Asset Values ("NAV") as reported by the investment manager of the respective alternative investment funds. NAV reported by the hedge funds is used as a practical expedient to estimate the fair value. The investment manager values these investments on a periodic basis with models that use market, income and valuation methods. The valuation inputs are not highly observable, and these investments are not actively traded in an open market.
The methods described above may produce a fair value calculation that may not be indicative of net realizable value, or reflective of future fair values. While the Company believes its valuation methods are appropriate and consistent with other market participants, the use of different methodologies or assumptions to determine the fair value of certain financial instruments could result in a different fair value measurement. The Company invests in various assets in which valuation is determined by NAV. The Company believes that the NAV is representative of fair value, as there are no significant restrictions on redemption on these investments or other reasons that indicate the investment would be redeemed at an amount different than the NAV.
67
CENVEO, INC. AND SUBSIDIARIES
NOTES TO CONSOLIDATED FINANCIAL STATEMENTS (CONTINUED)
The fair values of the Company’s pension plan assets as of the years ended 2016 and 2015, by asset category are as follows (in thousands):
2016 | 2015 | |||||||||||||||||||||||
Level 1 | Level 2 | Total | Level 1 | Level 2 | Total | |||||||||||||||||||
Cash and cash equivalents | $ | 7,624 | $ | — | $ | 7,624 | $ | 12,306 | $ | — | $ | 12,306 | ||||||||||||
Equity | 123,352 | — | 123,352 | 120,953 | — | 120,953 | ||||||||||||||||||
Fixed income | 15,908 | 46,280 | 62,188 | 12,497 | 49,993 | 62,490 | ||||||||||||||||||
Other | — | 1,369 | 1,369 | — | 1,489 | 1,489 | ||||||||||||||||||
Total of Level 1 and Level 2 assets | $ | 146,884 | $ | 47,649 | $ | 194,533 | $ | 145,756 | $ | 51,482 | $ | 197,238 | ||||||||||||
Investments at Net Asset Value (1) | ||||||||||||||||||||||||
Alternative investments | 43,810 | 50,281 | ||||||||||||||||||||||
Total net assets | $ | 238,343 | $ | 247,519 | ||||||||||||||||||||
__________________________
(1) Investments are measured at fair value using the net asset value per share practical expedient, and therefore, are not classified in the fair value hierarchy.
The range of asset allocations and the target allocations for the pension plan assets were as follows:
2016 | 2015 | Target | |||||||||||||
Equity securities | 52 | % | 61 | % | 49 | % | 62 | % | 60 | % | 75 | % | |||
Fixed income securities | 26 | % | 34 | % | 29 | % | 33 | % | 25 | % | 35 | % | |||
Alternative investments and other | 5 | % | 22 | % | 5 | % | 22 | % | 10 | % | 30 | % | |||
Multi-Employer Pension Plans: Certain of the Company’s union employees are included in multi-employer pension plans, to which the Company makes contributions in accordance with contractual union agreements. Such contributions are made on a monthly basis in accordance with the requirements of the plans and the actuarial computations and assumptions of the administrators of the plans. Contributions to the multi-employer pension plans were $0.6 million for each of the years ended 2016 and 2015. In 2016 and 2015, the Company recorded charges of $0.8 million and $5.0 million, respectively, as a result of exiting certain multi-employer pension plans in connection with its cost savings and restructuring plans.
The Company's participation in these plans for the years ended 2016 and 2015 is outlined in the table below:
Pension Fund | EIN | Pension Plan Number | Pension Protection Act Reported Status (1) | FIP/RP Status (2) | Contributions | Surcharge imposed | Expiration Date of Collective Bargaining Agreement | ||||||||
2016 | 2015 | 2016 | 2015 | ||||||||||||
(in thousands) | |||||||||||||||
GCC/IBT National Pension Fund | 526118568 | 001 | Red | Red | Implemented | $ | 183 | $ | 219 | No | 6/30/2019 | ||||
GCC/IBT National Pension Fund | 526118568 | 001 | Red | Red | Implemented | 177 | 177 | No | 2/26/2017 | ||||||
CWA/ITU Negotiated Pension Plan | 136212879 | 001 | Red | Red | Implemented | 228 | 158 | No | 3/1/2018 | ||||||
Total contributions | $ | 588 | $ | 554 | |||||||||||
__________________________
68
CENVEO, INC. AND SUBSIDIARIES
NOTES TO CONSOLIDATED FINANCIAL STATEMENTS (CONTINUED)
(1) | The most recent Pension Protection Act ("PPA") zone status available in 2016 and 2015 is for the plan's year end, not the Company's year end. The zone status is based on information that the Company received from the plan and is certified by the plan's actuary. Among other factors, plans in the red zone are generally less than 65 percent funded, plans in the yellow zone are less than 80 percent funded, and plans in the green zone are at least 80 percent funded. |
(2) | The FIP/RP Status column indicates plans for which a financial improvement plan ("FIP") or a rehabilitation plan ("RP") is either pending or has been implemented. |
14. Commitments and Contingencies
Leases: The Company leases buildings and equipment under operating lease agreements expiring at various dates through 2033. Certain leases include renewal and/or purchase options, which may be exercised by us. As of the year ended 2016, future minimum annual lease payments by year and, in the aggregate, under non-cancelable operating lease agreements with original terms of one year or more consisted of the following (in thousands):
2017 | $ | 21,929 | ||
2018 | 19,391 | |||
2019 | 14,937 | |||
2020 | 11,870 | |||
2021 | 7,306 | |||
Thereafter | 15,392 | |||
Total | $ | 90,825 | ||
Rent expense was $24.5 million and $25.3 million for the years ended 2016 and 2015, respectively.
Energy Commitments: The Company has entered into various energy contracts in order to lock-in energy prices over the next two fiscal years. Future contractual obligations under these energy contracts are $4.9 million and $0.9 million for 2017 and 2018, respectively.
Environmental: The Company is involved in certain environmental matters and has been designated as a potentially responsible party for certain hazardous waste sites. Prior to the Company’s acquisition of Nashua, Nashua was involved in certain environmental matters and was designated by the Environmental Protection Agency ("EPA") as a potentially responsible party for certain hazardous waste sites. In addition, Nashua had been notified by certain state environmental agencies that Nashua may bear responsibility for remedial action at other sites which have not been addressed by the EPA. The sites at which Nashua may have remedial responsibilities are in various stages of investigation and remediation. Due to the unique physical characteristics of each site, the remedial technology employed, the extended time-frames of each remediation, the interpretation of applicable laws and regulations and the financial viability of other potential participants, the ultimate range of outcomes cannot be predicted with certainty; therefore, the Company’s ultimate cost of remediation is an estimate and is contingent on these factors. Based on information currently available, the Company believes that Nashua’s remediation expense, if any, is not likely to have a material effect on its consolidated financial position or results of operations. As of the years ended 2016 and 2015, the undiscounted liability relating to the Company’s environmental matters was $0.7 million and $1.6 million, respectively, and is included in other liabilities. There have been no material changes related to these environmental matters since Nashua's acquisition date.
Litigation: The Company is party to various legal actions that are ordinary and incidental to its business. While the outcome of pending legal actions cannot be predicted with certainty, the Company believes the outcome of these various proceedings will not have a material effect on the Company’s consolidated financial statements. During the year ended 2016, the Company reached confidential agreements to settle controversies and disputes in connection with certain product warranty litigations. Total expense related to the litigation and associated accruals, recognized in selling, general and administrative expenses was $1.5 million for the year ended 2016.
Concentrations of Credit Risk: The Company has limited concentrations of credit risk with respect to financial instruments. Temporary cash investments and other investments are placed with high credit quality institutions, and concentrations within accounts receivable are generally limited due to the Company’s diverse customer base and its dispersion across different industries and geographic areas. The Company extends credit to customers based on its evaluation of the customer's financial condition. The Company does not require that any collateral be provided by its customers.
Letters of Credit: As of the year ended 2016, the Company had outstanding letters of credit of approximately $17.7 million and a de minimis amount of surety bonds. Based on the Company’s experience with these arrangements, it does not believe
69
CENVEO, INC. AND SUBSIDIARIES
NOTES TO CONSOLIDATED FINANCIAL STATEMENTS (CONTINUED)
that any obligations that may arise will have a material effect on the Company's consolidated financial condition or results of operations.
Tax Audits: The Company’s income, sales and use, and other tax returns are routinely subject to audit by various authorities. The Company is currently under audit related to unclaimed property, which is being led by the state of Delaware and includes other states as well. The Company believes that the resolution of any matters raised during such audits will not have a material effect on the Company’s consolidated financial position or its results of operations.
Multi-Employer Pension Plans: The Company participates in a number of multi-employer pension plans and is exposed to significant risks and uncertainties arising from its participation in these multi-employer pension plans. These risks and uncertainties, including changes in future contributions due to partial or full withdrawal of the Company and other participating employers from these multi-employer pension plans, could significantly increase the Company’s future contributions or the underfunded status of these multi-employer pension plans. Two of the multi-employer pension plans are in mass withdrawal status. While it is not possible to quantify the potential impact of future actions of the Company or other participating employers from these multi-employer pension plans, continued participation in or withdrawal from these multi-employer pension plans could have a material impact on the Company’s consolidated financial statements.
15. Accumulated Other Comprehensive Income (Loss)
The following table presents the changes in the balances of each component of AOCI, net of tax (in thousands):
Foreign Currency Translation | Pension and Other Postretirement Benefits | Total | |||||||||||
Balance as of the year ended 2014 | $ | (2,905 | ) | $ | (95,292 | ) | $ | (98,197 | ) | ||||
Other comprehensive loss before reclassifications | (4,295 | ) | (12,315 | ) | (16,610 | ) | |||||||
Amounts reclassified from AOCI | — | 8,877 | 8,877 | ||||||||||
Other comprehensive loss | (4,295 | ) | (3,438 | ) | (7,733 | ) | |||||||
Balance as of the year ended 2015 | (7,200 | ) | (98,730 | ) | (105,930 | ) | |||||||
Other comprehensive loss before reclassifications | (393 | ) | (9,200 | ) | (9,593 | ) | |||||||
Amounts reclassified from AOCI | 2,338 | 9,956 | 12,294 | ||||||||||
Other comprehensive loss | 1,945 | 756 | 2,701 | ||||||||||
Balance as of the year ended 2016 | $ | (5,255 | ) | $ | (97,974 | ) | $ | (103,229 | ) | ||||
Reclassifications from AOCI
AOCI Components | Amounts Reclassified from AOCI (in thousands) | Income Statement Line Item | |||||||||
2016 | 2015 | ||||||||||
Changes in Foreign Currency Translations | |||||||||||
Loss on foreign exchange | $ | 2,338 | $ | — | Loss from discontinued operations, net of taxes | ||||||
Changes in pension and other employee benefit accounts | |||||||||||
Net actuarial losses (1) | 9,956 | 8,877 | Cost of sales | ||||||||
12,294 | 8,877 | Total before tax | |||||||||
Taxes | — | — | Income tax expense | ||||||||
Total reclassifications for the period | $ | 12,294 | $ | 8,877 | Net of tax | ||||||
__________________________
(1) Components are included in the computation of net periodic benefit cost as presented in Note 13.
70
CENVEO, INC. AND SUBSIDIARIES
NOTES TO CONSOLIDATED FINANCIAL STATEMENTS (CONTINUED)
16. Related Party Transactions
In the fourth quarter of 2013, the Company entered into a 10-year lease of a manufacturing facility with a related party wholly-owned and managed by the Burton family. The Company believes the lease terms have not been significantly affected by the fact that the Company and the lessors are related parties. The Company recognized approximately $0.5 million in rental expense associated with the lease for each of the years ended 2016 and 2015, which is recorded in cost of sales. Future undiscounted lease payments related to this lease are $3.8 million as of the year ended 2016. The Company has no other commitments or guarantees related to the lease. In the fourth quarter of 2015, this related party also purchased land located under an adjacent Cenveo manufacturing facility. The Company is currently sub-leasing this facility under a separate agreement with an unrelated third party, which is leasing the land from the related party.
Horizon Paper Co., Inc. ("Horizon"), whose Chairman was a member of the Company’s Board of Directors through September 10, 2015, has supplied raw materials to the Company. For the year ended 2015, purchases of raw materials from Horizon made by the Company were $1.9 million. As of the year ended 2015, the balance due to Horizon was $0.2 million.
Roosevelt Paper Company ("Roosevelt") is both a paper supplier to, and a customer of, the Company. The sole owners of Roosevelt are related to Mr. Scheinmann, Senior Vice President, Legal Affairs and Corporate Secretary. Mr. Scheinmann has no ownership in Roosevelt. Purchases of paper from Roosevelt were approximately $1.4 million and $1.0 million for the years ended 2016 and 2015, respectively. The balance due to Roosevelt was $0.3 million for each of the years ended 2016 and 2015. Additionally, the Company had net sales to Roosevelt of zero and $0.1 million for the years ended 2016 and 2015, respectively. As of both the years ended 2016 and 2015, there were no balances due from Roosevelt.
17. Income (Loss) per Share
On July 8, 2016, the Company announced a Reverse Stock Split of its Common Stock at a ratio of 1-for-8, effective July 13, 2016. The Common Stock began trading on a split-adjusted basis on July 14, 2016. As a result of the Reverse Stock Split, each eight pre-split shares of Common Stock outstanding were automatically combined into one new share of Common Stock without any action on the part of the respective holders. The Reverse Stock Split also applied to Common Stock issuable upon the exchange of the Company's outstanding 7% Notes and upon the exercise of the Company's outstanding Warrants and Equity Awards. The share and per share amounts below have been retroactively adjusted to give recognition to the Reverse Stock Split for all periods presented.
Basic income (loss) per share is computed based upon the weighted average number of common shares outstanding for the period. When applicable, diluted income (loss) per share is calculated using two approaches. The first approach, the treasury stock method, reflects the potential dilution that could occur if the Equity Awards to issue Common Stock were exercised. The second approach, the if converted method, reflects the potential dilution of the Equity Awards and the 7% Notes and the Warrants being exchanged for Common Stock. Under this method, interest expense associated with the 7% Notes, net of tax, if any, is added back to income from continuing operations and the shares outstanding are increased by the underlying 7% Notes equivalent.
For the year ended 2015, the effect of approximately 2.5 million shares related to the exchange of the 7% Notes for Common Stock were excluded from the calculation of diluted income (loss) per share, as the effect would be anti-dilutive.
For the years ended 2016 and 2015, the effect of approximately 212,000 and 366,000 shares, respectively, related to the issuance of Common Stock upon exercise of Equity Awards were excluded for the calculation of diluted income (loss) per share, as the effect would be anti-dilutive.
For the years ended 2016 and 2015, the effect of approximately 1.7 million and zero shares, respectively, related to the issuance of Common Stock upon exercise of Warrants were excluded from the calculation of diluted income (loss) per share, as the effect would be anti-dilutive.
The following table sets forth the computation of basic and diluted (loss) income per share for the periods ended (in thousands, except per share data):
71
CENVEO, INC. AND SUBSIDIARIES
NOTES TO CONSOLIDATED FINANCIAL STATEMENTS (CONTINUED)
For The Years Ended | ||||||||
2016 | 2015 | |||||||
Numerator for basic and diluted loss per share: | ||||||||
Income (loss) from continuing operations | $ | 70,846 | $ | (19,461 | ) | |||
Loss from discontinued operations, net of taxes | (2,897 | ) | (11,390 | ) | ||||
Net income (loss) | $ | 67,949 | $ | (30,851 | ) | |||
Numerator for diluted income (loss) per share: | ||||||||
Income (loss) from continuing operations - as reported | $ | 70,846 | $ | (19,461 | ) | |||
Interest expense on 7% Notes, net of taxes | 1,572 | — | ||||||
Income (loss) from continuing operations - after assumed conversions of dilutive shares | 72,418 | (19,461 | ) | |||||
Loss from discontinued operations, net of taxes | (2,897 | ) | (11,390 | ) | ||||
Net income (loss) for diluted loss per share - after assumed conversions of dilutive shares | $ | 69,521 | $ | (30,851 | ) | |||
Denominator for weighted average common shares outstanding: | ||||||||
Basic shares | 8,527 | 8,479 | ||||||
Dilutive effect of 7% Notes | 965 | — | ||||||
Dilutive effect of Equity Awards | — | — | ||||||
Dilutive effect of Warrants | — | — | ||||||
Diluted shares | 9,492 | 8,479 | ||||||
Income (loss) per share – basic: | ||||||||
Continuing operations | $ | 8.31 | $ | (2.30 | ) | |||
Discontinued operations | (0.34 | ) | (1.34 | ) | ||||
Net income (loss) | $ | 7.97 | $ | (3.64 | ) | |||
Income (loss) per share – diluted: | ||||||||
Continuing operations | $ | 7.63 | $ | (2.30 | ) | |||
Discontinued operations | (0.31 | ) | (1.34 | ) | ||||
Net income (loss) | $ | 7.32 | $ | (3.64 | ) | |||
18. Segment Information
The Company operates three operating and reportable segments: envelope, print and label. The envelope segment provides direct mail offerings and transactional and stock envelopes. The print segment provides a wide array of print offerings such as high-end printed materials including car brochures, advertising literature, corporate identity and brand marketing material, digital printing and content management. The label segment specializes in the design, manufacturing and printing of labels such as custom labels, overnight packaging labels and pressure-sensitive prescription labels.
Prior to the disposition of the Packaging Business, the Company operated four operating segments: envelope, print, label and packaging. Based upon similar economic characteristics and management reporting, the Company previously aggregated the label and packaging operating segments to have a total of three reportable segments: envelope, print and label and packaging.
Operating income (loss) of each segment includes all costs and expenses directly related to the segment's operations. Corporate expenses include corporate general and administrative expenses including stock-based compensation.
Corporate identifiable assets primarily consist of cash and cash equivalents, miscellaneous receivables, deferred financing fees, deferred tax assets and other assets.
72
CENVEO, INC. AND SUBSIDIARIES
NOTES TO CONSOLIDATED FINANCIAL STATEMENTS (CONTINUED)
The following tables present certain segment information (in thousands):
For The Years Ended | ||||||||
2016 | 2015 | |||||||
Net sales: | ||||||||
Envelope | $ | 865,160 | $ | 908,718 | ||||
Print | 493,464 | 510,974 | ||||||
Label | 301,377 | 322,087 | ||||||
Total | $ | 1,660,001 | $ | 1,741,779 | ||||
Operating income (loss): | ||||||||
Envelope | $ | 60,684 | $ | 66,424 | ||||
Print | 17,613 | 15,122 | ||||||
Label | 30,549 | 39,533 | ||||||
Corporate | (32,814 | ) | (37,286 | ) | ||||
Total | $ | 76,032 | $ | 83,793 | ||||
Restructuring and other charges: | ||||||||
Envelope | $ | 2,618 | $ | 3,500 | ||||
Print | 2,028 | 6,853 | ||||||
Label | 4,771 | 486 | ||||||
Corporate | 2,537 | 1,737 | ||||||
Total | $ | 11,954 | $ | 12,576 | ||||
Depreciation and intangible asset amortization: | ||||||||
Envelope | $ | 18,982 | $ | 20,318 | ||||
Print | 18,010 | 17,424 | ||||||
Label | 6,988 | 8,584 | ||||||
Corporate | 3,220 | 3,363 | ||||||
Total | $ | 47,200 | $ | 49,689 | ||||
Capital expenditures: | ||||||||
Envelope | $ | 13,130 | $ | 7,480 | ||||
Print | 10,984 | 9,240 | ||||||
Label | 11,172 | 3,678 | ||||||
Corporate | 5,851 | 5,530 | ||||||
Total | $ | 41,137 | $ | 25,928 | ||||
Intercompany sales: | ||||||||
Envelope | $ | 6,589 | $ | 6,357 | ||||
Print | 19,983 | 17,627 | ||||||
Label | 2,833 | 4,297 | ||||||
Total | $ | 29,405 | $ | 28,281 | ||||
2016 | 2015 | |||||||
Total assets: | ||||||||
Envelope | $ | 403,157 | $ | 445,443 | ||||
Print | 256,888 | 266,074 | ||||||
Label | 216,627 | 223,534 | ||||||
Corporate | 36,287 | 35,558 | ||||||
Assets of discontinued operations | — | 111,417 | ||||||
Total | $ | 912,959 | $ | 1,082,026 | ||||
73
CENVEO, INC. AND SUBSIDIARIES
NOTES TO CONSOLIDATED FINANCIAL STATEMENTS (CONTINUED)
Geographic information is as follows as of and for the years ended (in thousands):
2016 | 2015 | |||||||
Net sales: | ||||||||
U.S. | $ | 1,654,996 | $ | 1,735,921 | ||||
Foreign | 5,005 | 5,858 | ||||||
Total | $ | 1,660,001 | $ | 1,741,779 | ||||
2016 | 2015 | |||||||
Long-lived assets (property, plant and equipment, goodwill and intangible assets): | ||||||||
U.S. | $ | 501,685 | $ | 510,205 | ||||
Foreign | 6,034 | 6,161 | ||||||
Total | $ | 507,719 | $ | 516,366 | ||||
19. Condensed Consolidating Financial Information
Cenveo, Inc. is a holding company (the "Parent Company"), which is the ultimate parent of all Cenveo subsidiaries. The Parent Company’s wholly-owned subsidiary, Cenveo Corporation (the "Subsidiary Issuer"), issued the 6.000% Secured Notes, the 8.500% Notes, the 6.000% Unsecured Notes, the 7% Notes, the 11.5% Notes, and the 4% Secured Notes (collectively the "Subsidiary Issuer Notes"), which are fully and unconditionally guaranteed, on a joint and several basis, by the Parent Company and substantially all of its wholly-owned domestic subsidiaries, other than the Subsidiary Issuer (the "Guarantor Subsidiaries").
Presented below is condensed consolidating financial information for the Parent Company, the Subsidiary Issuer, the Guarantor Subsidiaries and the Parent Company's subsidiaries other than the Subsidiary Issuer and the Guarantor Subsidiaries (the "Non-Guarantor Subsidiaries") as of and for the years ended 2016 and 2015. The condensed consolidating financial information has been presented to show the financial position, results of operations and cash flows of the Parent Company, the Subsidiary Issuer, the Guarantor Subsidiaries and the Non-Guarantor Subsidiaries, assuming the guarantee structure of the Subsidiary Issuer Notes was in effect at the beginning of the periods presented.
The supplemental condensed consolidating financial information reflects the investments of the Parent Company in the Subsidiary Issuer, the Guarantor Subsidiaries and the Non-Guarantor Subsidiaries using the equity method of accounting. The Parent Company’s primary transactions with its subsidiaries, other than the investment account and related equity in net income (loss) of subsidiaries, are the intercompany payables and receivables between its subsidiaries.
74
CENVEO, INC. AND SUBSIDIARIES
NOTES TO CONSOLIDATED FINANCIAL STATEMENTS (CONTINUED)
CENVEO, INC. AND SUBSIDIARIES CONDENSED CONSOLIDATING BALANCE SHEET December 31, 2016 (in thousands) | |||||||||||||||||||||||
Parent Company | Subsidiary Issuer | Guarantor Subsidiaries | Non-Guarantor Subsidiaries | Eliminations | Consolidated | ||||||||||||||||||
Assets | |||||||||||||||||||||||
Current assets: | |||||||||||||||||||||||
Cash and cash equivalents | $ | — | $ | 4,678 | $ | — | $ | 854 | $ | — | $ | 5,532 | |||||||||||
Accounts receivable, net | — | 131,770 | 102,417 | — | — | 234,187 | |||||||||||||||||
Inventories, net | — | 62,179 | 39,771 | — | — | 101,950 | |||||||||||||||||
Intercompany receivable | — | — | 1,783,858 | — | (1,783,858 | ) | — | ||||||||||||||||
Notes receivable from subsidiaries | — | 36,938 | 3,245 | — | (40,183 | ) | — | ||||||||||||||||
Prepaid and other current assets | — | 35,659 | 4,789 | 1,128 | — | 41,576 | |||||||||||||||||
Total current assets | — | 271,224 | 1,934,080 | 1,982 | (1,824,041 | ) | 383,245 | ||||||||||||||||
Investment in subsidiaries | (589,157 | ) | 2,112,403 | 4,173 | 7,829 | (1,535,248 | ) | — | |||||||||||||||
Property, plant and equipment, net | — | 108,395 | 98,255 | 1,029 | — | 207,679 | |||||||||||||||||
Goodwill | — | 49,170 | 121,181 | 4,858 | — | 175,209 | |||||||||||||||||
Other intangible assets, net | — | 9,770 | 114,914 | 147 | — | 124,831 | |||||||||||||||||
Other assets, net | — | 18,317 | 3,100 | 1,694 | (1,116 | ) | 21,995 | ||||||||||||||||
Total assets | $ | (589,157 | ) | $ | 2,569,279 | $ | 2,275,703 | $ | 17,539 | $ | (3,360,405 | ) | $ | 912,959 | |||||||||
Liabilities and Shareholders’ (Deficit) Equity | |||||||||||||||||||||||
Current liabilities: | |||||||||||||||||||||||
Current maturities of long-term debt | $ | — | $ | 30,709 | $ | 1,018 | $ | — | $ | — | $ | 31,727 | |||||||||||
Accounts payable | — | 114,533 | 61,098 | 265 | — | 175,896 | |||||||||||||||||
Accrued compensation and related liabilities | — | 19,245 | 4,699 | 740 | — | 24,684 | |||||||||||||||||
Other current liabilities | — | 70,118 | 11,962 | 819 | — | 82,899 | |||||||||||||||||
Intercompany payable | — | 1,783,390 | — | 468 | (1,783,858 | ) | — | ||||||||||||||||
Notes payable to issuer | — | — | 36,938 | 3,245 | (40,183 | ) | — | ||||||||||||||||
Total current liabilities | — | 2,017,995 | 115,715 | 5,537 | (1,824,041 | ) | 315,206 | ||||||||||||||||
Long-term debt | — | 984,833 | 2,106 | — | — | 986,939 | |||||||||||||||||
Other liabilities | — | 155,608 | 45,479 | — | (1,116 | ) | 199,971 | ||||||||||||||||
Shareholders’ (deficit) equity | (589,157 | ) | (589,157 | ) | 2,112,403 | 12,002 | (1,535,248 | ) | (589,157 | ) | |||||||||||||
Total liabilities and shareholders’ (deficit) equity | $ | (589,157 | ) | $ | 2,569,279 | $ | 2,275,703 | $ | 17,539 | $ | (3,360,405 | ) | $ | 912,959 | |||||||||
75
CENVEO, INC. AND SUBSIDIARIES
NOTES TO CONSOLIDATED FINANCIAL STATEMENTS (CONTINUED)
CENVEO, INC. AND SUBSIDIARIES CONDENSED CONSOLIDATING STATEMENT OF COMPREHENSIVE (LOSS) INCOME For The Year Ended 2016 (in thousands) | |||||||||||||||||||||||
Parent Company | Subsidiary Issuer | Guarantor Subsidiaries | Non-Guarantor Subsidiaries | Eliminations | Consolidated | ||||||||||||||||||
Net sales | $ | — | $ | 882,195 | $ | 775,915 | $ | 1,891 | $ | — | $ | 1,660,001 | |||||||||||
Cost of sales | — | 779,574 | 607,172 | — | — | 1,386,746 | |||||||||||||||||
Selling, general and administrative expenses | — | 110,870 | 67,907 | 748 | — | 179,525 | |||||||||||||||||
Amortization of intangible assets | — | 608 | 4,692 | 444 | — | 5,744 | |||||||||||||||||
Restructuring and other charges | — | 10,469 | 1,485 | — | — | 11,954 | |||||||||||||||||
Operating (loss) income | — | (19,326 | ) | 94,659 | 699 | — | 76,032 | ||||||||||||||||
Interest expense, net | — | 85,537 | 216 | — | — | 85,753 | |||||||||||||||||
Intercompany interest (income) expense | — | (1,008 | ) | 1,008 | — | — | — | ||||||||||||||||
Gain on early extinguishment of debt, net | — | (82,481 | ) | — | — | — | (82,481 | ) | |||||||||||||||
Other income, net | — | (490 | ) | (1,737 | ) | (117 | ) | — | (2,344 | ) | |||||||||||||
(Loss) income from continuing operations before income taxes and equity in income (loss) of subsidiaries | — | (20,884 | ) | 95,172 | 816 | — | 75,104 | ||||||||||||||||
Income tax expense | — | 2,688 | 619 | 951 | — | 4,258 | |||||||||||||||||
(Loss) income from continuing operations before equity in income (loss) of subsidiaries | — | (23,572 | ) | 94,553 | (135 | ) | — | 70,846 | |||||||||||||||
Equity in income (loss) of subsidiaries | 67,949 | 95,485 | (146 | ) | — | (163,288 | ) | — | |||||||||||||||
Income (loss) from continuing operations | 67,949 | 71,913 | 94,407 | (135 | ) | (163,288 | ) | 70,846 | |||||||||||||||
(Loss) income from discontinued operations, net of taxes | — | (3,964 | ) | 1,078 | (11 | ) | — | (2,897 | ) | ||||||||||||||
Net income (loss) | 67,949 | 67,949 | 95,485 | (146 | ) | (163,288 | ) | 67,949 | |||||||||||||||
Other comprehensive income (loss): | |||||||||||||||||||||||
Other comprehensive income (loss) of subsidiaries | 2,701 | 2,290 | (172 | ) | — | (4,819 | ) | — | |||||||||||||||
Changes in pension and other employee benefit accounts, net of taxes | — | 411 | 345 | — | — | 756 | |||||||||||||||||
Currency translation adjustment, net | — | — | 2,117 | (172 | ) | — | 1,945 | ||||||||||||||||
Total other comprehensive income (loss) | 2,701 | 2,701 | 2,290 | (172 | ) | (4,819 | ) | 2,701 | |||||||||||||||
Comprehensive income (loss) | $ | 70,650 | $ | 70,650 | $ | 97,775 | $ | (318 | ) | $ | (168,107 | ) | $ | 70,650 | |||||||||
76
CENVEO, INC. AND SUBSIDIARIES
NOTES TO CONSOLIDATED FINANCIAL STATEMENTS (CONTINUED)
CENVEO, INC. AND SUBSIDIARIES CONDENSED CONSOLIDATING STATEMENT OF CASH FLOWS For The Year Ended 2016 (in thousands) | |||||||||||||||||||||||
Parent Company | Subsidiary Issuer | Guarantor Subsidiaries | Non- Guarantor Subsidiaries | Eliminations | Consolidated | ||||||||||||||||||
Cash flows from operating activities: | |||||||||||||||||||||||
Net cash provided by (used in) operating activities of continuing operations | $ | 1,468 | $ | (93,513 | ) | $ | 142,605 | $ | (1,177 | ) | $ | — | $ | 49,383 | |||||||||
Net cash used in operating activities of discontinued operations | — | — | (10,074 | ) | (438 | ) | — | (10,512 | ) | ||||||||||||||
Net cash provided by (used in) operating activities | 1,468 | (93,513 | ) | 132,531 | (1,615 | ) | — | 38,871 | |||||||||||||||
Cash flows from investing activities: | |||||||||||||||||||||||
Capital expenditures | — | (19,281 | ) | (21,120 | ) | (736 | ) | — | (41,137 | ) | |||||||||||||
Proceeds from sale of property, plant and equipment | — | 8,189 | 141 | — | — | 8,330 | |||||||||||||||||
Proceeds from sale of assets | — | — | 2,000 | — | — | 2,000 | |||||||||||||||||
Net cash used in investing activities of continuing operations | — | (11,092 | ) | (18,979 | ) | (736 | ) | — | (30,807 | ) | |||||||||||||
Net cash provided by investing activities of discontinued operations | — | — | 89,379 | 6,487 | — | 95,866 | |||||||||||||||||
Net cash (used in) provided by investing activities | — | (11,092 | ) | 70,400 | 5,751 | — | 65,059 | ||||||||||||||||
Cash flows from financing activities: | |||||||||||||||||||||||
Proceeds from issuance of 4% senior secured notes due 2021 | — | 50,000 | — | — | — | 50,000 | |||||||||||||||||
Payment of financing related costs and expenses and debt issuance discounts | — | (11,576 | ) | — | — | — | (11,576 | ) | |||||||||||||||
Repayments of other long-term debt | — | (5,381 | ) | (197 | ) | — | — | (5,578 | ) | ||||||||||||||
Repayment of 11.5% senior notes due 2017 | — | (24,725 | ) | — | — | — | (24,725 | ) | |||||||||||||||
Repayment of 7% senior exchangeable notes due 2017 | — | (45,903 | ) | — | — | — | (45,903 | ) | |||||||||||||||
Repayment of 8.500% junior secured priority notes due 2022 | — | (4,550 | ) | — | — | — | (4,550 | ) | |||||||||||||||
Purchase and retirement of common stock upon vesting of RSUs | (346 | ) | — | — | — | — | (346 | ) | |||||||||||||||
Borrowings under ABL Facility due 2021 | — | 474,300 | — | — | — | 474,300 | |||||||||||||||||
Repayments under ABL Facility due 2021 | — | (540,800 | ) | — | — | — | (540,800 | ) | |||||||||||||||
Intercompany advances | (1,122 | ) | 212,360 | (203,366 | ) | (7,872 | ) | — | — | ||||||||||||||
Net cash (used in) provided by financing activities of continuing operations | (1,468 | ) | 103,725 | (203,563 | ) | (7,872 | ) | — | (109,178 | ) | |||||||||||||
Net cash used in financing activities of discontinued operations | — | — | (8 | ) | — | — | (8 | ) | |||||||||||||||
Net cash (used in) provided by financing activities | (1,468 | ) | 103,725 | (203,571 | ) | (7,872 | ) | — | (109,186 | ) | |||||||||||||
Effect of exchange rate changes on cash and cash equivalents | — | — | 316 | (84 | ) | — | 232 | ||||||||||||||||
Net decrease in cash and cash equivalents | — | (880 | ) | (324 | ) | (3,820 | ) | — | (5,024 | ) | |||||||||||||
Cash and cash equivalents at beginning of period | — | 5,558 | 324 | 4,674 | — | 10,556 | |||||||||||||||||
Cash and cash equivalents at end of period | $ | — | $ | 4,678 | $ | — | $ | 854 | $ | — | $ | 5,532 | |||||||||||
77
CENVEO, INC. AND SUBSIDIARIES
NOTES TO CONSOLIDATED FINANCIAL STATEMENTS (CONTINUED)
CENVEO, INC. AND SUBSIDIARIES CONDENSED CONSOLIDATING BALANCE SHEET January 2, 2016 (in thousands) | |||||||||||||||||||||||
Parent Company | Subsidiary Issuer | Guarantor Subsidiaries | Non-Guarantor Subsidiaries | Eliminations | Consolidated | ||||||||||||||||||
Assets | |||||||||||||||||||||||
Current assets: | |||||||||||||||||||||||
Cash and cash equivalents | $ | — | $ | 5,558 | $ | 235 | $ | 1,992 | $ | — | $ | 7,785 | |||||||||||
Accounts receivable, net | — | 133,232 | 120,810 | — | — | 254,042 | |||||||||||||||||
Inventories, net | — | 74,116 | 47,499 | — | — | 121,615 | |||||||||||||||||
Intercompany receivable | — | — | 1,580,492 | — | (1,580,492 | ) | — | ||||||||||||||||
Notes receivable from subsidiaries | — | 36,938 | 3,245 | — | (40,183 | ) | — | ||||||||||||||||
Prepaid and other current assets | — | 43,349 | 1,807 | 1,575 | — | 46,731 | |||||||||||||||||
Assets of discontinued operations - current | — | — | 41,821 | 6,745 | — | 48,566 | |||||||||||||||||
Total current assets | — | 293,193 | 1,795,909 | 10,312 | (1,620,675 | ) | 478,739 | ||||||||||||||||
Investment in subsidiaries | (669,839 | ) | 2,014,972 | 4,492 | 7,829 | (1,357,454 | ) | — | |||||||||||||||
Property, plant and equipment, net | — | 113,608 | 96,262 | 708 | — | 210,578 | |||||||||||||||||
Goodwill | — | 22,940 | 147,409 | 4,989 | — | 175,338 | |||||||||||||||||
Other intangible assets, net | — | 9,533 | 120,451 | 466 | — | 130,450 | |||||||||||||||||
Other assets, net | — | 20,327 | 3,154 | 1,477 | (888 | ) | 24,070 | ||||||||||||||||
Assets of discontinued operations - long-term | — | 1,226 | 62,184 | — | (559 | ) | 62,851 | ||||||||||||||||
Total assets | $ | (669,839 | ) | $ | 2,475,799 | $ | 2,229,861 | $ | 25,781 | $ | (2,979,576 | ) | $ | 1,082,026 | |||||||||
Liabilities and Shareholders’ (Deficit) Equity | |||||||||||||||||||||||
Current liabilities: | |||||||||||||||||||||||
Current maturities of long-term debt | $ | — | $ | 4,454 | $ | 919 | $ | — | $ | — | $ | 5,373 | |||||||||||
Accounts payable | — | 126,384 | 73,601 | 135 | — | 200,120 | |||||||||||||||||
Accrued compensation and related liabilities | — | 26,812 | 4,846 | 303 | — | 31,961 | |||||||||||||||||
Other current liabilities | — | 71,365 | 16,737 | 712 | — | 88,814 | |||||||||||||||||
Liabilities of discontinued operations - current | — | — | 21,543 | 725 | — | 22,268 | |||||||||||||||||
Intercompany payable | — | 1,572,152 | — | 8,340 | (1,580,492 | ) | — | ||||||||||||||||
Notes payable to issuer | — | — | 36,938 | 3,245 | (40,183 | ) | — | ||||||||||||||||
Total current liabilities | — | 1,801,167 | 154,584 | 13,460 | (1,620,675 | ) | 348,536 | ||||||||||||||||
Long-term debt | — | 1,200,848 | 2,402 | — | — | 1,203,250 | |||||||||||||||||
Other liabilities | — | 143,623 | 56,191 | — | (888 | ) | 198,926 | ||||||||||||||||
Liabilities of discontinued operations - long-term | — | — | 1,712 | — | (559 | ) | 1,153 | ||||||||||||||||
Shareholders’ (deficit) equity | (669,839 | ) | (669,839 | ) | 2,014,972 | 12,321 | (1,357,454 | ) | (669,839 | ) | |||||||||||||
Total liabilities and shareholders’ (deficit) equity | $ | (669,839 | ) | $ | 2,475,799 | $ | 2,229,861 | $ | 25,781 | $ | (2,979,576 | ) | $ | 1,082,026 | |||||||||
78
CENVEO, INC. AND SUBSIDIARIES
NOTES TO CONSOLIDATED FINANCIAL STATEMENTS (CONTINUED)
CENVEO, INC. AND SUBSIDIARIES CONDENSED CONSOLIDATING STATEMENT OF COMPREHENSIVE (LOSS) INCOME For The Year Ended 2015 (in thousands) | |||||||||||||||||||||||
Parent Company | Subsidiary Issuer | Guarantor Subsidiaries | Non-Guarantor Subsidiaries | Eliminations | Consolidated | ||||||||||||||||||
Net sales | $ | — | $ | 898,529 | $ | 839,500 | $ | 3,750 | $ | — | $ | 1,741,779 | |||||||||||
Cost of sales | — | 775,386 | 674,759 | 731 | — | 1,450,876 | |||||||||||||||||
Selling, general and administrative expenses | — | 119,149 | 66,882 | 718 | — | 186,749 | |||||||||||||||||
Amortization of intangible assets | — | 743 | 6,574 | 468 | — | 7,785 | |||||||||||||||||
Restructuring and other charges | — | 10,751 | 1,825 | — | — | 12,576 | |||||||||||||||||
Operating (loss) income | — | (7,500 | ) | 89,460 | 1,833 | — | 83,793 | ||||||||||||||||
Interest expense, net | — | 100,592 | 213 | — | — | 100,805 | |||||||||||||||||
Intercompany interest (income) expense | — | (998 | ) | 998 | — | — | — | ||||||||||||||||
Loss on early extinguishment of debt, net | — | 1,252 | — | — | — | 1,252 | |||||||||||||||||
Other income, net | — | (2,658 | ) | (258 | ) | (280 | ) | — | (3,196 | ) | |||||||||||||
(Loss) income from continuing operations before income taxes and equity in (loss) income of subsidiaries | — | (105,688 | ) | 88,507 | 2,113 | — | (15,068 | ) | |||||||||||||||
Income tax expense (benefit) | — | 5,425 | (1,893 | ) | 861 | — | 4,393 | ||||||||||||||||
(Loss) income from continuing operations before equity in (loss) income of subsidiaries | — | (111,113 | ) | 90,400 | 1,252 | — | (19,461 | ) | |||||||||||||||
Equity in (loss) income of subsidiaries | (30,851 | ) | 74,968 | 1,644 | — | (45,761 | ) | — | |||||||||||||||
(Loss) income from continuing operations | (30,851 | ) | (36,145 | ) | 92,044 | 1,252 | (45,761 | ) | (19,461 | ) | |||||||||||||
Income (loss) from discontinued operations, net of taxes | — | 5,294 | (17,076 | ) | 392 | — | (11,390 | ) | |||||||||||||||
Net (loss) income | (30,851 | ) | (30,851 | ) | 74,968 | 1,644 | (45,761 | ) | (30,851 | ) | |||||||||||||
Other comprehensive (loss) income: | |||||||||||||||||||||||
Other comprehensive (loss) income of subsidiaries | (7,733 | ) | (4,240 | ) | (760 | ) | — | 12,733 | — | ||||||||||||||
Changes in pension and other employee benefit accounts, net of taxes | — | (3,493 | ) | 55 | — | — | (3,438 | ) | |||||||||||||||
Currency translation adjustment, net | — | — | (3,535 | ) | (760 | ) | — | (4,295 | ) | ||||||||||||||
Total other comprehensive (loss) income | (7,733 | ) | (7,733 | ) | (4,240 | ) | (760 | ) | 12,733 | (7,733 | ) | ||||||||||||
Comprehensive (loss) income | $ | (38,584 | ) | $ | (38,584 | ) | $ | 70,728 | $ | 884 | $ | (33,028 | ) | $ | (38,584 | ) | |||||||
79
CENVEO, INC. AND SUBSIDIARIES
NOTES TO CONSOLIDATED FINANCIAL STATEMENTS (CONTINUED)
CENVEO, INC. AND SUBSIDIARIES CONDENSED CONSOLIDATING STATEMENT OF CASH FLOWS For The Year Ended 2015 (in thousands) | |||||||||||||||||||||||
Parent Company | Subsidiary Issuer | Guarantor Subsidiaries | Non- Guarantor Subsidiaries | Eliminations | Consolidated | ||||||||||||||||||
Cash flows from operating activities: | |||||||||||||||||||||||
Net cash provided by (used in) operating activities of continuing operations | $ | 1,636 | $ | (110,318 | ) | $ | 122,254 | $ | 2,654 | $ | — | $ | 16,226 | ||||||||||
Net cash provided by operating activities of discontinued operations | — | — | 15,230 | 738 | — | 15,968 | |||||||||||||||||
Net cash provided by (used in) operating activities | 1,636 | (110,318 | ) | 137,484 | 3,392 | — | 32,194 | ||||||||||||||||
Cash flows from investing activities: | |||||||||||||||||||||||
Cost of business acquisitions, net of cash acquired | — | (1,996 | ) | — | — | — | (1,996 | ) | |||||||||||||||
Capital expenditures | — | (18,448 | ) | (6,921 | ) | (559 | ) | — | (25,928 | ) | |||||||||||||
Proceeds from sale of property, plant and equipment | — | 7,673 | 885 | — | — | 8,558 | |||||||||||||||||
Proceeds from sale of assets | — | — | 2,180 | — | — | 2,180 | |||||||||||||||||
Net cash used in investing activities of continuing operations | — | (12,771 | ) | (3,856 | ) | (559 | ) | — | (17,186 | ) | |||||||||||||
Net cash used in investing activities of discontinued operations | — | — | (2,282 | ) | — | — | (2,282 | ) | |||||||||||||||
Net cash used in investing activities | — | (12,771 | ) | (6,138 | ) | (559 | ) | — | (19,468 | ) | |||||||||||||
Cash flows from financing activities: | |||||||||||||||||||||||
Payment of financing related costs and expenses and debt issuance discounts | — | (1,596 | ) | — | — | — | (1,596 | ) | |||||||||||||||
Proceeds from issuance of other long-term debt | — | 12,500 | — | — | — | 12,500 | |||||||||||||||||
Repayments of other long-term debt | — | (17,721 | ) | 1,176 | — | — | (16,545 | ) | |||||||||||||||
Repayment of 11.5% senior notes due 2017 | — | (22,720 | ) | — | — | — | (22,720 | ) | |||||||||||||||
Purchase and retirement of common stock upon vesting of RSUs | (216 | ) | — | — | — | — | (216 | ) | |||||||||||||||
Borrowings under ABL Facility due 2021 | — | 468,300 | — | — | — | 468,300 | |||||||||||||||||
Repayments under ABL Facility due 2021 | — | (454,800 | ) | — | — | — | (454,800 | ) | |||||||||||||||
Intercompany advances | (1,420 | ) | 133,719 | (130,879 | ) | (1,420 | ) | — | — | ||||||||||||||
Net cash (used in) provided by financing activities of continuing operations | (1,636 | ) | 117,682 | (129,703 | ) | (1,420 | ) | — | (15,077 | ) | |||||||||||||
Net cash used in financing activities of discontinued operations | — | — | (473 | ) | — | — | (473 | ) | |||||||||||||||
Net cash (used in) provided by financing activities | (1,636 | ) | 117,682 | (130,176 | ) | (1,420 | ) | — | (15,550 | ) | |||||||||||||
Effect of exchange rate changes on cash and cash equivalents | — | — | (1,690 | ) | 477 | — | (1,213 | ) | |||||||||||||||
Net (decrease) increase in cash and cash equivalents | — | (5,407 | ) | (520 | ) | 1,890 | — | (4,037 | ) | ||||||||||||||
Cash and cash equivalents at beginning of period | — | 10,965 | 844 | 2,784 | — | 14,593 | |||||||||||||||||
Cash and cash equivalents at end of period | — | 5,558 | 324 | 4,674 | — | 10,556 | |||||||||||||||||
Less cash and cash equivalents of discontinued operations | — | — | (89 | ) | (2,682 | ) | — | (2,771 | ) | ||||||||||||||
Cash and cash equivalents of continuing operations at end of period | $ | — | $ | 5,558 | $ | 235 | $ | 1,992 | $ | — | $ | 7,785 | |||||||||||
80
CENVEO, INC. AND SUBSIDIARIES
NOTES TO CONSOLIDATED FINANCIAL STATEMENTS (CONTINUED)
20. Selected Quarterly Financial Information (Unaudited)
The following table sets forth certain quarterly financial data for the periods indicated (in thousands, except per share amounts):
First Quarter | Second Quarter | Third Quarter | Fourth Quarter | ||||||||||||
Fiscal Year 2016 | |||||||||||||||
Net sales: | |||||||||||||||
Envelope | $ | 229,260 | $ | 212,277 | $ | 212,578 | $ | 211,045 | |||||||
Print | 124,487 | 114,653 | 121,739 | 132,585 | |||||||||||
Label | 79,014 | 77,111 | 71,638 | 73,614 | |||||||||||
Total | $ | 432,761 | $ | 404,041 | $ | 405,955 | $ | 417,244 | |||||||
Operating income (loss): | |||||||||||||||
Envelope | $ | 17,559 | $ | 17,213 | $ | 16,832 | $ | 9,080 | |||||||
Print | 3,377 | 1,933 | 5,446 | 6,857 | |||||||||||
Label | 4,708 | 11,901 | 6,764 | 7,176 | |||||||||||
Corporate | (8,630 | ) | (9,477 | ) | (8,169 | ) | (6,538 | ) | |||||||
Total | $ | 17,014 | $ | 21,570 | $ | 20,873 | $ | 16,575 | |||||||
Income (loss) from continuing operations (2) | 13,020 | 50,860 | 8,745 | (1,779 | ) | ||||||||||
(Loss) income from discontinued operations, net of taxes (3) | (1,817 | ) | (3,304 | ) | 686 | 1,538 | |||||||||
Net income (loss) | $ | 11,203 | $ | 47,556 | $ | 9,431 | $ | (241 | ) | ||||||
Net income (loss) per share—basic | |||||||||||||||
Continuing operations (1) | $ | 1.53 | $ | 5.97 | $ | 1.02 | $ | (0.21 | ) | ||||||
Discontinued operations (1) | (0.21 | ) | (0.39 | ) | 0.08 | 0.18 | |||||||||
Net income (loss) (1) | $ | 1.32 | $ | 5.58 | $ | 1.10 | $ | (0.03 | ) | ||||||
Net income (loss) per share—diluted | |||||||||||||||
Continuing operations (1) | $ | 1.37 | $ | 5.15 | $ | 1.00 | $ | (0.21 | ) | ||||||
Discontinued operations (1) | (0.17 | ) | (0.33 | ) | 0.08 | 0.18 | |||||||||
Net income (loss) (1) | $ | 1.20 | $ | 4.82 | $ | 1.08 | $ | (0.03 | ) | ||||||
81
CENVEO, INC. AND SUBSIDIARIES
NOTES TO CONSOLIDATED FINANCIAL STATEMENTS (CONTINUED)
First Quarter | Second Quarter | Third Quarter | Fourth Quarter | ||||||||||||
Fiscal Year 2015 | |||||||||||||||
Net sales: | |||||||||||||||
Envelope | $ | 227,410 | $ | 218,139 | $ | 218,454 | $ | 244,715 | |||||||
Print | 122,100 | 114,545 | 123,875 | 150,454 | |||||||||||
Label | 80,167 | 80,675 | 77,454 | 83,791 | |||||||||||
Total | $ | 429,677 | $ | 413,359 | $ | 419,783 | $ | 478,960 | |||||||
Operating income (loss): | |||||||||||||||
Envelope | $ | 14,840 | $ | 16,711 | $ | 17,746 | $ | 17,127 | |||||||
Print | 1,679 | 2,987 | 1,541 | 8,915 | |||||||||||
Label | 9,704 | 11,150 | 10,146 | 8,533 | |||||||||||
Corporate | (8,423 | ) | (9,193 | ) | (9,917 | ) | (9,753 | ) | |||||||
Total | $ | 17,800 | $ | 21,655 | $ | 19,516 | $ | 24,822 | |||||||
Loss from continuing operations | (8,179 | ) | (3,355 | ) | (3,562 | ) | (4,365 | ) | |||||||
Income (loss) from discontinued operations, net of taxes (3) | 500 | 950 | 319 | (13,159 | ) | ||||||||||
Net loss | $ | (7,679 | ) | $ | (2,405 | ) | $ | (3,243 | ) | $ | (17,524 | ) | |||
Net (loss) income per share—basic | |||||||||||||||
Continuing operations (1) | $ | (0.97 | ) | $ | (0.39 | ) | $ | (0.42 | ) | $ | (0.51 | ) | |||
Discontinued operations (1) | 0.06 | 0.11 | 0.04 | (1.56 | ) | ||||||||||
Net loss (1) | $ | (0.91 | ) | $ | (0.28 | ) | $ | (0.38 | ) | $ | (2.07 | ) | |||
Net (loss) income per share—diluted | |||||||||||||||
Continuing operations (1) | $ | (0.97 | ) | $ | (0.39 | ) | $ | (0.42 | ) | $ | (0.51 | ) | |||
Discontinued operations (1) | 0.06 | 0.11 | 0.04 | (1.56 | ) | ||||||||||
Net loss (1) | $ | (0.91 | ) | $ | (0.28 | ) | $ | (0.38 | ) | $ | (2.07 | ) | |||
__________________________
(1) | The quarterly earnings per share information is computed separately for each period. Therefore, the sum of such quarterly per share amounts may differ from the total year. |
(2) | During the year ended 2016, the Company completed several transactions which resulted in a net gain on early extinguishment of debt. See further detail in Note 8. |
(3) | In connection with the sale of the Packaging Business, the Company recorded a gain on sale of $1.4 million for the year ended 2016 and a loss on sale of $5.0 million for the year ended 2015. Additionally, the Company recorded a non-cash goodwill impairment charge of $9.9 million related to this transaction for the year ended 2015. |
82
Item 9. Changes in and Disagreements with Accountants on Accounting and Financial Disclosure
None.
Item 9A. Controls and Procedures
Evaluation of Disclosure Controls and Procedures
We maintain "disclosure controls and procedures," as such term is defined in Rules 13a-15(e) and 15d-15(e) of the Securities Exchange Act of 1934, as amended (the "Exchange Act"), that are designed to ensure that information required to be disclosed by us in the reports that we file or submit under the Exchange Act is recorded, processed, summarized and reported within the time period specified in the Securities and Exchange Commission’s rules and forms. Disclosure controls and procedures include, without limitation, controls and procedures designed to ensure that information required to be disclosed by us in the reports that we file or submit under the Exchange Act is accumulated and communicated to our management, including our principal executive and principal financial officers, or persons performing similar functions, as appropriate, to allow timely decisions regarding required disclosure.
We have evaluated, under the supervision and with the participation of our management, including our Chief Executive Officer and Chief Financial Officer, the effectiveness of our disclosure controls and procedures as of the end of the fiscal year covered by this Annual Report on Form 10-K. Based on that evaluation, our Chief Executive Officer and Chief Financial Officer have concluded, as of such date, our disclosure controls and procedures were effective at the reasonable assurance level.
Management’s Report on Internal Control Over Financial Reporting
The management of Cenveo, including our Chief Executive Officer and Chief Financial Officer, are responsible for establishing and maintaining adequate internal control over financial reporting. Our internal control over financial reporting is a process designed to provide reasonable assurance regarding the reliability of financial reporting and the preparation of financial statements for external purposes in accordance with accounting principles generally accepted in the United States of America. Our internal control over financial reporting includes those policies and procedures that (i) pertain to the maintenance of records that, in reasonable detail, accurately and fairly reflect the transactions and dispositions of our assets; (ii) provide reasonable assurance that transactions are recorded as necessary to permit preparation of financial statements in accordance with accounting principles generally accepted in the United States of America, and that our receipts and expenditures are being made only in accordance with authorizations of our management and directors; and (iii) provide reasonable assurance regarding prevention or timely detection of unauthorized acquisition, use, or disposition of assets which could have a material effect on our financial statements.
Management assessed the effectiveness of our internal control over financial reporting as of December 31, 2016, based on the framework set forth by the 2013 Internal Control-Integrated Framework issued by the Committee of Sponsoring Organizations of the Treadway Commission ("2013 COSO Framework"). Based on that assessment, management concluded that, as of December 31, 2016, our internal control over financial reporting was effective based on the criteria established in the 2013 COSO Framework.
Our independent registered public accounting firm, BDO USA, LLP, has issued an attestation report on the effectiveness of our internal control over financial reporting as of December 31, 2016. This report follows.
Changes in Internal Controls Over Financial Reporting
There were no changes in our internal control over financial reporting during the fourth quarter of 2016 that have materially affected or are reasonably likely to materially affect our internal control over financial reporting.
Inherent Limitations on Effectiveness of Controls
Our management, including our Chief Executive Officer and our Chief Financial Officer, does not expect that our disclosure controls or our internal control over financial reporting will prevent or detect all error and all fraud. A control system, no matter how well designed and operated, can provide only reasonable, not absolute, assurance that the control system’s objectives will be met. Our disclosure controls and procedures are designed to provide reasonable assurance of achieving their objectives. The design of a control system must reflect the fact that there are resource constraints, and the benefits of controls must be considered relative to their costs. Further, because of the inherent limitations in all control systems, no evaluation of controls can provide absolute assurance that misstatements due to error or fraud will not occur or that all control issues and instances of fraud, if any, within the Company have been detected. These inherent limitations include the realities that judgments in decision-making can be faulty and that breakdowns can occur because of simple error or mistake. Controls can also be circumvented by the individual
83
acts of some persons, by collusion of two or more people, or by management override of the controls. The design of any system of controls is based in part on certain assumptions about the likelihood of future events, and there can be no assurance that any design will succeed in achieving its stated goals under all potential future conditions. Projections of any evaluation of controls effectiveness to future periods are subject to risks. Over time, controls may become inadequate because of changes in conditions or deterioration in the degree of compliance with policies or procedures.
84
Report of Independent Registered Public Accounting Firm
Board of Directors and Shareholders
Cenveo, Inc.
Stamford, Connecticut
We have audited Cenveo, Inc. and subsidiaries’ internal control over financial reporting as of December 31, 2016, based on criteria established in Internal Control - Integrated Framework (2013) issued by the Committee of Sponsoring Organizations of the Treadway Commission (the COSO criteria). Cenveo Inc. and subsidiaries’ management is responsible for maintaining effective internal control over financial reporting and for its assessment of the effectiveness of internal control over financial reporting, included in the accompanying "Item 9A, Management’s Report on Internal Control Over Financial Reporting". Our responsibility is to express an opinion on the company’s internal control over financial reporting based on our audit.
We conducted our audit in accordance with the standards of the Public Company Accounting Oversight Board (United States). Those standards require that we plan and perform the audit to obtain reasonable assurance about whether effective internal control over financial reporting was maintained in all material respects. Our audit included obtaining an understanding of internal control over financial reporting, assessing the risk that a material weakness exists, and testing and evaluating the design and operating effectiveness of internal control based on the assessed risk. Our audit also included performing such other procedures as we considered necessary in the circumstances. We believe that our audit provides a reasonable basis for our opinion.
A company’s internal control over financial reporting is a process designed to provide reasonable assurance regarding the reliability of financial reporting and the preparation of financial statements for external purposes in accordance with generally accepted accounting principles. A company’s internal control over financial reporting includes those policies and procedures that (1) pertain to the maintenance of records that, in reasonable detail, accurately and fairly reflect the transactions and dispositions of the assets of the company; (2) provide reasonable assurance that transactions are recorded as necessary to permit preparation of financial statements in accordance with generally accepted accounting principles, and that receipts and expenditures of the company are being made only in accordance with authorizations of management and directors of the company; and (3) provide reasonable assurance regarding prevention or timely detection of unauthorized acquisition, use, or disposition of the company’s assets that could have a material effect on the financial statements.
Because of its inherent limitations, internal control over financial reporting may not prevent or detect misstatements. Also, projections of any evaluation of effectiveness to future periods are subject to the risk that controls may become inadequate because of changes in conditions, or that the degree of compliance with the policies or procedures may deteriorate.
In our opinion, Cenveo, Inc. and subsidiaries maintained, in all material respects, effective internal control over financial reporting as of December 31, 2016, based on the COSO criteria.
We also have audited, in accordance with the standards of the Public Company Accounting Oversight Board (United States), the consolidated balance sheets of Cenveo, Inc. and subsidiaries as of December 31, 2016, and January 2, 2016, and the related consolidated statements of comprehensive income (loss), changes in shareholders’ (deficit) equity, and cash flows for the years then ended and our report dated February 23, 2017 expressed an unqualified opinion thereon.
/s/ BDO USA, LLP
New York, New York
February 23, 2017
85
Item 9B. Other Information
None.
PART III
Item 10. Directors, Executive Officers and Corporate Governance
The information relating to directors and nominees of the Company and the information required by Items 401, 405, 406 and 407(c)(3), (d)(4) and (d)(5) of Regulation S-K are included in the Company’s Proxy Statement to be filed pursuant to Regulation 14A in connection with the 2017 Annual Meeting of Shareholders (2017 Proxy Statement) under the captions "Nominees for the Board of Directors", "Section 16(a) Beneficial Ownership Reporting Compliance," "Corporate Governance," "Nomination of Directors," and "Audit Committee," and such information is incorporated herein by reference.
Item 11. Executive Compensation
This information is included under the captions "Compensation of Executive Officers," "Board Compensation," "Compensation Committee Interlocks and Insider Participation" and "Compensation Committee Report" in our 2017 Proxy Statement and is incorporated herein by reference.
Item 12. Security Ownership of Certain Beneficial Owners and Management and Related Stockholder Matters
This information is included under the captions "Security Ownership of Certain Beneficial Owners and Management," "Compensation of Executive Officers" and "Equity Compensation Plan Information" in our 2017 Proxy Statement and is incorporated herein by reference.
Item 13. Certain Relationships and Related Transactions, and Director Independence
This information is included under the captions "Transactions with Related Persons, Promoters and Certain Control Persons" and "Director Independence" in our 2017 Proxy Statement and is incorporated herein by reference.
Item 14. Principal Accountant Fees and Services
This information is included under the captions "Independent Registered Public Accounting Firm" and "Report of the Audit Committee" in our 2017 Proxy Statement and is incorporated herein by reference.
PART IV
Item 15. Exhibits and Financial Statement Schedules
(a)(1) Financial Statements
Included in Part II, Item 8 of this Report.
(a)(2) Financial Statement Schedules
Included in Part II, Item 8 of this Report.
(a)(3) Exhibits
86
Exhibit Number | Description | |
2.1 | Stock Purchase Agreement dated as of July 17, 2007 among Cenveo Corporation, Commercial Envelope Manufacturing Co. Inc. and its shareholders—incorporated by reference to Exhibit 2.1 to registrant’s current report on Form 8-K, filed July 20, 2007. | |
3.1 | Articles of Incorporation—incorporated by reference to Exhibit 3(i) to registrant’s quarterly report on Form 10-Q for the quarter ended June 30, 1997, filed August 14, 1997. | |
3.2 | Articles of Amendment to the Articles of Incorporation dated May 17, 2004—incorporated by reference to Exhibit 3.2 to registrant’s quarterly report on Form 10-Q for the quarter ended June 30, 2004, filed August 2, 2004. | |
3.3 | Amendment to Articles of Incorporation and Certificate of Designations of Series A Junior Participating Preferred Stock of the registrant dated April 20, 2005—incorporated by reference to Exhibit 3.1 to registrant’s current report on Form 8-K, filed April 21, 2005. | |
3.4 | Certificate of Amendment to the Articles of Incorporation-incorporated by reference to Exhibit 3.1 to registrant’s current report on Form 8-K, filed July 15, 2016. | |
3.5 | Bylaws as amended and restated as of March 31, 2014-incorporated by reference to Exhibit 3.2 to registrant’s current report on Form 8-K, filed April 4, 2014. | |
4.1 | Indenture, dated as of March 28, 2012, among the Company, Cenveo Corporation, the other guarantors named therein and U.S. Bank National Association, as Trustee, relating to the 11.5% Notes—incorporated by reference to Exhibit 4.3 to registrant's current report on Form 8-K, filed March 30, 2012. | |
4.2 | Form of Guarantee issued by the Company and the other guarantors named therein relating to the 11.5% Notes-incorporated by reference to Exhibit 4.4 to registrant’s current report on Form 8-K, filed March 30, 2012. | |
4.3 | Registration Rights Agreement, dated as of March 28, 2012, among the Company, Cenveo Corporation, the other guarantors named therein and the initial purchasers named therein relating to the 11.5% Notes—incorporated by reference to Exhibit 4.7 to registrant's current report on Form 8-K, filed March 30, 2012. | |
4.4 | Indenture, dated as of March 28, 2012, by and among the Company, Cenveo Corporation, the other guarantors named therein and U.S. Bank National Association, as Trustee, relating to the 7% Notes—incorporated by reference to Exhibit 4.5 to registrant's current report on Form 8-K, filed March 30, 2012. | |
4.5 | Form of Guarantee issued by the Company and the other guarantors named therein relating to the 7% Notes-incorporated by reference to Exhibit 4.6 to registrant’s current report on Form 8-K, filed March 30, 2012. | |
4.6 | Indenture, dated as of June 26, 2014, by and among Cenveo, Inc., Cenveo Corporation, the other guarantors named therein and The Bank of New York Mellon, as Trustee and Collateral Agent, relating to the 6.000% Senior Priority Secured Notes due 2019-incorporated by reference to Exhibit 4.1 to registrant’s current report on Form 8-K, filed July 1, 2014. | |
4.7 | Form of Guarantee issued by Cenveo, Inc. and the other guarantors named therein relating to the 6.000% Senior Priority Secured Notes due 2019-incorporated by reference to Exhibit 4.2 to registrant’s current report on Form 8-K, filed July 1, 2014. | |
4.8 | Indenture, dated as of June 26, 2014, by and among Cenveo, Inc., Cenveo Corporation, the other guarantors named therein and The Bank of New York Mellon, as Trustee and Collateral Agent, relating to the 8.500% Junior Priority Secured Notes due 2022-incorporated by reference to Exhibit 4.3 to registrant’s current report on Form 8-K, filed July 1, 2014. | |
4.9 | Form of Guarantee issued by Cenveo, Inc. and the other guarantors named therein relating to the 8.500% Junior Priority Secured Notes due 2022-incorporated by reference to Exhibit 4.4 to registrant’s current report on Form 8-K, filed July 1, 2014. | |
4.10 | Intercreditor Agreement, dated as of June 26, 2014, by and among Cenveo, Inc., Cenveo Corporation, the other guarantors named therein, Bank of America, N.A., as ABL Agent, and The Bank of New York Mellon, as Collateral Agent with respect to the 6.000% Senior Priority Secured Notes due 2019--incorporated by reference to Exhibit 4.5 to registrant's current report on Form 8-K, filed July 1, 2014. | |
87
Exhibit Number | Description | |
4.11 | Intercreditor Agreement, dated as of June 26, 2014, by and among Cenveo, Inc., Cenveo Corporation, the other guarantors named therein, Bank of America, N.A., as ABL Agent, The Bank of New York Mellon, as Collateral Agent with respect to the 6.000% Senior Priority Secured Notes due 2019, and The Bank of New York Mellon, as Collateral Agent with respect to 8.500% Junior Priority Secured Notes due 2022--incorporated by reference to Exhibit 4.6 to registrant's current report on Form 8-K, filed July 1, 2014. | |
4.12 | Indenture, dated as of June 10, 2016, among Cenveo Corporation, Cenveo, Inc., the other guarantors party thereto and The Bank of New York Mellon, as trustee, relating to the 6.000% Senior Notes due 2024-incorporated by reference to Exhibit 4.1 to registrant’s current report on Form 8-K, filed June 16, 2016. | |
4.13 | Form of Guarantee issued by Cenveo, Inc. and the other guarantors named therein relating to the 6.000% Senior Notes due 2024-incorporated by reference to Exhibit 4.2 to registrant’s current report on Form 8-K, filed June 16, 2016. | |
4.14 | Warrant Agreement, dated as of June 10, 2016, between Cenveo, Inc. and Computershare Trust Company, N.A., as warrant agent-incorporated by reference to Exhibit 4.3 to registrant’s current report on Form 8-K, filed June 16, 2016. | |
4.15 | Warrant Registration Rights Agreement, dated as of June 10, 2016, between Cenveo, Inc. and Allianz Global Investors U.S. LLC-incorporated by reference to Exhibit 4.4 to registrant’s current report on Form 8-K, filed June 16, 2016. | |
4.16 | Indenture and Note Purchase Agreement, dated as of June 10, 2016, among Cenveo Corporation, Cenveo, Inc., the other guarantors party thereto, AllianzGI US High Yield Fund and Allianz Income and Growth Fund, as purchasers, each other noteholder from time to time party thereto and The Bank of New York Mellon, as trustee and collateral agent, relating to the 4.000% Senior Secured Notes due 2021-incorporated by reference to Exhibit 4.5 to registrant’s current report on Form 8-K, filed June 16, 2016. | |
4.17 | Intercreditor Agreement, dated as of June 10, 2016, among Cenveo Corporation, Cenveo, Inc., certain other subsidiaries of Cenveo, Inc. that become party thereto from time to time as guarantors, Bank of America, N.A., as administrative agent for the holders of the senior priority obligations, and The Bank of New York Mellon, as collateral agent for the holders of the junior priority obligations-incorporated by reference to Exhibit 4.6 to registrant’s current report on Form 8-K, filed June 16, 2016. | |
4.18 | Amendment No. 1 to the Intercreditor Agreement, dated as of June 10, 2016, among Cenveo Corporation, Cenveo, Inc., certain other subsidiaries of Cenveo, Inc. as guarantors, Bank of America, N.A., as administrative agent for the holders of the revolving credit obligations, The Bank of New York Mellon, as collateral agent for the holders of the 2016 secured notes obligations, and The Bank of New York Mellon, as collateral agent for the holders of the fixed asset obligations-incorporated by reference to Exhibit 4.7 to registrant’s current report on Form 8-K, filed June 16, 2016. | |
4.19 | Amendment No. 1 to the Intercreditor Agreement, dated as of June 10, 2016, among Cenveo Corporation, Cenveo, Inc., certain other subsidiaries of Cenveo, Inc. as guarantors, Bank of America, N.A., as administrative agent for the holders of the revolving credit obligations, The Bank of New York Mellon, as collateral agent for the holders of the 2016 secured notes obligations, The Bank of New York Mellon, as collateral agent for the holders of the senior priority fixed asset obligations, and The Bank of New York Mellon, as collateral agent for the holders of the junior priority obligations-incorporated by reference to Exhibit 4.8 to registrant’s current report on Form 8-K, filed June 16, 2016. | |
10.1+ | Form of Indemnity Agreement between Mail-Well, Inc. and each of its officers and directors-incorporated by reference to Exhibit 10.17 to registrant’s Registration Statement on Form S-1 dated March 25, 1994. | |
10.2+ | Employment Agreement, dated as of October 27, 2005, between the registrant and Robert G. Burton, Sr.-incorporated by reference to Exhibit 10.29 to registrant’s annual report on Form 10-K for the year ended December 31, 2005, filed March 2, 2006. | |
10.3+ | Amendment, dated November 8, 2006, to Employment Agreement, dated as of October 27, 2005 between the registrant and Robert G. Burton, Sr.-incorporated by reference to Exhibit 10.19 to registrant’s annual report on Form 10-K for the year ended December 30, 2006, filed February 28, 2007. | |
10.4+ | Amendment, dated November 6, 2007, to Employment Agreement, dated as of October 27, 2005, as amended, between the registrant and Robert G. Burton, Sr.-incorporated by reference to Exhibit 10.4 to registrant’s annual report on Form 10-K for the year ended December 29, 2007, filed March 28, 2008. | |
10.5+ | Amendment, dated February 27, 2008, to Employment Agreement, dated as of October 27, 2005, as amended, between the registrant and Robert G. Burton, Sr.-incorporated by reference to Exhibit 10.1 to registrant’s quarterly report on Form 10-Q for the quarter ended March 29, 2008, filed May 7, 2008. | |
88
Exhibit Number | Description | |
10.6+ | Amendment, dated December 29, 2008, to Employment Agreement, dated as of October 27, 2005, as amended, between the registrant and Robert G. Burton, Sr.-incorporated by reference to Exhibit 10.6 to registrant’s annual report on Form 10-K for the year ended January 3, 2009, filed March 19, 2009. | |
10.7+ | Amendment, dated April 30, 2015, to Employment Agreement, dated as of October 27, 2005, as amended, between the registrant and Robert G. Burton, Sr.-incorporated by reference to Exhibit 10.1 to registrant’s quarterly report on Form 10-Q for the quarter ended June 27, 2015, filed July 30, 2015. | |
10.8+ | Employment Agreement, dated as of February 25, 2014, between the registrant and Scott J. Goodwin-incorporated by reference to Exhibit 10.8 to registrant’s annual report on Form 10-K for the year ended December 28, 2013, filed February 26, 2014. | |
10.9 | Settlement and Governance Agreement by and among the registrant, Burton Capital Management, LLC and Robert G. Burton, Sr., dated September 9, 2005-incorporated by reference to Exhibit 10.1 to registrant’s current report on Form 8-K, filed September 12, 2005. | |
10.10+ | Cenveo, Inc. 2001 Long-Term Equity Incentive Plan, as amended-incorporated by reference to Exhibit 10.24 to registrant’s quarterly report on Form 10-Q for the quarter ended June 30, 2004, filed August 2, 2004. | |
10.11+ | Cenveo, Inc. 2007 Long-Term Equity Incentive Plan, as amended-incorporated by reference to Exhibit A to registrant’s Schedule 14A, filed April 6, 2009. | |
10.12+ | Form of Non-Qualified Stock Option Agreement for Employees under 2007 Long-Term Equity Incentive Plan-incorporated by reference to Exhibit 10.17 to registrant’s annual report on Form 10-K for the year ended December 29, 2007, filed March 28, 2008. | |
10.13+ | Form of Restricted Share Unit Award Agreement for Employees under 2007 Long-Term Equity Incentive Plan-incorporated by reference to Exhibit 10.18 to registrant’s annual report on Form 10-K for the year ended December 29, 2007, filed March 28, 2008. | |
10.14+ | Form of Restricted Share Unit Award Agreement for Non-Employee Directors under 2007 Long-Term Equity Incentive Plan-incorporated by reference to Exhibit 10.19 to registrant’s annual report on Form 10-K for the year ended December 29, 2007, filed March 28, 2008. | |
10.15+ | Employment Agreement, as amended, dated as of June 22, 2006, between the registrant and Robert G. Burton Jr.-incorporated by reference to Exhibit 10.2 to registrant’s quarterly report on Form 10-Q for the quarter ended October 1, 2011, filed November 9, 2011. | |
10.16 | Credit Agreement, dated as of April 16, 2013, among Cenveo Corporation, Cenveo, Inc., Bank of America, N.A., as Administrative Agent, an Issuing Bank and Swingline Lender, and the other lenders party thereto-incorporated by reference to Exhibit 10.2 to registrant’s current report on Form 8-K, filed April 22, 2013. | |
10.17 | Amendment No. 1, dated as of December 11, 2013, to Credit Agreement, dated as of April 16, 2013, among Cenveo Corporation, Cenveo, Inc., Bank of America, N.A., as Administrative Agent, and the lenders party thereto-incorporated by reference to Exhibit 10.1 to registrant’s current report on Form 8-K, filed December 17, 2013. | |
10.18 | Asset Purchase Agreement, dated as of August 21, 2013, among Cenveo Corporation, Cenveo, Inc. and NE Opco, Inc.-incorporated by reference to Exhibit 10.1 to registrant’s quarterly report on Form 10-Q for the quarter ended September 29, 2013, filed November 6, 2013. | |
10.19 | Amendment No. 2, dated as of June 10, 2014, to Credit Agreement, dated as of April 16, 2013, among Cenveo Corporation, Cenveo, Inc., Bank of America, N.A., as administrative agent, and the lenders party thereto-incorporated by reference to Exhibit 10.1 to registrant’s quarterly report on Form 10-Q for the quarter ended June 28, 2014, filed August 6, 2014. | |
10.20 | Amendment No. 3, dated as of January 30, 2015, to Credit Agreement, dated as of April 16, 2013, among Cenveo Corporation, Cenveo, Inc., Bank of America, N.A., as administrative agent, and the lenders party thereto-incorporated by reference to Exhibit 10.20 to registrant’s annual report on Form 10-K for the year ended December 27, 2014, filed February 18, 2015. | |
10.21 | Purchase Agreement, dated June 19, 2014, among Cenveo Corporation, Cenveo, Inc., the other guarantor party thereto and JP Morgan Securities LLC, as representative of the Initial Purchasers party thereto-incorporated by reference to Exhibit 10.1 to registrant’s current report on Form 8-K, filed June 25, 2014. | |
89
Exhibit Number | Description | |
10.22 | Stock and Membership Interest Purchase Agreement, dated as of December 9, 2015, among Cenveo Corporation, Cadmus Printing Group, Inc., Cadmus Knowledge Works International Ltd. and WestRock Converting Company-incorporated by reference to Exhibit 10.22 to registrant’s annual report on Form 10-K for the year ended January 2, 2016, filed February 26, 2016. | |
10.23+ | Employment Agreement, dated as of February 27, 2012, between the registrant and Ian R. Scheinmann-incorporated by reference to Exhibit 10.23 to registrant’s annual report on Form 10-K for the year ended January 2, 2016, filed February 26, 2016. | |
10.24+ | Employment Agreement, dated as of June 22, 2006, as amended December 29, 2008, between the registrant and Michael G. Burton-incorporated by reference to Exhibit 10.24 to registrant’s annual report on Form 10-K for the year ended January 2, 2016, filed February 26, 2016. | |
10.25 | Support Agreement, dated May 10, 2016, by and among Cenveo, Inc., Cenveo Corporation and Allianz Global Investors U.S. LLC-incorporated by reference to Exhibit 99.2 to registrant’s current report on Form 8-K, filed May 11, 2016. | |
10.26 | Amendment No. 4 to the Credit Agreement, dated as of June 10, 2016, among Cenveo Corporation, Cenveo, Inc., the lenders party thereto, Bank of America, N.A., as issuing bank and swingline lender, and each of the other loan parties party thereto, and acknowledged by Bank of America, N.A., as administrative agent-incorporated by reference to Exhibit 10.1 to registrant’s current report on Form 8-K, filed June 16, 2016. | |
21.1* | Subsidiaries of the registrant. | |
23.1* | Consent of BDO USA, LLP | |
24.1 | Power of Attorney—incorporated by reference to page 92. | |
31.1* | Certification by Robert G. Burton, Sr., Chief Executive Officer, pursuant to Section 302 of the Sarbanes-Oxley Act of 2002. | |
31.2* | Certification by Scott J. Goodwin, Chief Financial Officer, pursuant to Section 302 of the Sarbanes-Oxley Act of 2002. | |
32.1** | Certification of the Chief Executive Officer pursuant to Section 906 of the Sarbanes-Oxley Act of 2002, furnished as an exhibit to this report on Form 10-K. | |
32.2** | Certification of the Chief Financial Officer pursuant to Section 906 of the Sarbanes-Oxley Act of 2002, furnished as an exhibit to this report on Form 10-K. | |
101.INS* | XBRL Instance Document. | |
101.SCH* | XBRL Taxonomy Extension Schema Document. | |
101.CAL* | XBRL Taxonomy Extension Calculation Linkbase Document. | |
101.LAB* | XBRL Taxonomy Extension Label Linkbase Document. | |
101.PRE* | XBRL Taxonomy Extension Presentation Linkbase Document. | |
101.DEF* | XBRL Taxonomy Extension Definition Linkbase Document. | |
__________________________
+ | Management contract or compensatory plan or arrangement. |
* | Filed herewith. |
** | Furnished herewith. |
(b) Exhibits Filed
Included in Item 15(a) (3) of this Report.
90
SIGNATURES
Pursuant to the requirements of Section 13 or 15(d) of the Securities Exchange Act of 1934, the Registrant has duly caused this report to be signed on its behalf by the undersigned, thereunto duly authorized, in the City of Englewood, State of Colorado, on February 23, 2017.
CENVEO, INC. | ||
By: | /s/ Robert G. Burton, Sr. | |
Robert G. Burton, Sr. | ||
Chairman and Chief Executive Officer | ||
(Principal Executive Officer) | ||
By: | /s/ Scott J. Goodwin | |
Scott J. Goodwin | ||
Chief Financial Officer | ||
(Principal Financial Officer and | ||
Principal Accounting Officer) | ||
91
Pursuant to the requirements of Section 13 or 15(d) of the Securities Exchange Act of 1934, this report has been signed by the following persons in the capacities and on the dates indicated.
POWER OF ATTORNEY
Each person whose signature appears below constitutes and appoints Robert G. Burton, Sr. and Scott J. Goodwin as attorney-in-fact, each with the power of substitution, for him or her in any and all capacities, to sign any amendments to this report and to file the same, with exhibits thereto and other documents in connection therewith, with the Securities and Exchange Commission.
Signature | Title | Date | ||
/s/ ROBERT G. BURTON, SR. | Chairman and Chief Executive Officer | February 23, 2017 | ||
Robert G. Burton, Sr. | (Principal Executive Officer) | |||
/s/ SCOTT J. GOODWIN | Chief Financial Officer | February 23, 2017 | ||
Scott J. Goodwin | (Principal Financial Officer and | |||
Principal Accounting Officer) | ||||
/s/ GERALD S. ARMSTRONG | Director | February 23, 2017 | ||
Gerald S. Armstrong | ||||
/s/ ROBERT G. BURTON, JR. | Director | February 23, 2017 | ||
Robert G. Burton, Jr. | ||||
/s/ MARK J. GRIFFIN | Director | February 23, 2017 | ||
Mark J. Griffin | ||||
/s/ SUSAN HERBST | Director | February 23, 2017 | ||
Susan Herbst | ||||
/s/ JAMES G. MOORHEAD | Director | February 23, 2017 | ||
James G. Moorhead | ||||
92