Attached files
| file | filename |
|---|---|
| EX-31.1 - CENVEO, INC | ex31p1.htm |
| EX-23.2 - CENVEO, INC | ex23p2.htm |
| EX-32.1 - CENVEO, INC | ex32p1.htm |
| EX-32.2 - CENVEO, INC | ex32p2.htm |
| EX-4.28 - CENVEO, INC | ex4p28.htm |
| EX-21.1 - CENVEO, INC | ex21p1.htm |
| EX-23.1 - CENVEO, INC | ex23p1.htm |
| EX-4.29 - CENVEO, INC | ex4p29.htm |
| EX-31.2 - CENVEO, INC | ex31p2.htm |
| EX-10.20 - CENVEO, INC | ex10p20.htm |
UNITED
STATES
SECURITIES
AND EXCHANGE COMMISSION
Washington,
D.C. 20549
FORM
10-K
ANNUAL
REPORT PURSUANT TO SECTION 13 OR 15(d) OF THE
SECURITIES
EXCHANGE ACT OF 1934
For
the fiscal year ended January 2, 2010
Commission
file number 1-12551
CENVEO,
INC.
(Exact
name of Registrant as specified in its charter.)
|
COLORADO
|
84-1250533
|
|
(State
or other jurisdiction of
incorporation
or organization)
|
(I.R.S.
Employer Identification No.)
|
|
ONE
CANTERBURY GREEN
201
BROAD STREET
|
|
|
STAMFORD,
CT
|
06901
|
|
(Address
of principal executive offices)
|
(Zip
Code)
|
|
203-595-3000
|
|
|
(Registrant’s
telephone number, including area
code)
|
|
Securities
Registered Pursuant to Section 12(b) of the Act:
|
Title of Each
Class
|
Name of Each Exchange on Which
Registered
|
|
Common
Stock, par value $0.01 per share
|
New
York Stock Exchange
|
Indicate
by check mark if the registrant is a well-known seasoned issuer, as defined in
Rule 405 of the Securities Act.
Yes o No x
Indicate
by check mark if the registrant is not required to file reports pursuant to
Section 13 or Section 15(d) of the Exchange Act. Yes o No x
Indicate
by check mark whether the registrant (1) has filed all reports required to be
filed by Section 13 or 15(d) of the Securities Exchange Act of 1934 during the
preceding 12 months (or for such shorter period that the Registrant was required
to file such reports), and (2) has been subject to such filing requirements for
the past 90 days. Yes x No o
Indicate
by check mark whether the registrant has submitted electronically and posted on
its corporate Web site, if any, every Interactive Data File required to be
submitted and posted pursuant to Rule 405 of Regulation S-T during the preceding
12 months (or for such shorter period that the registrant was required to submit
and post such files). Yes o No o
Indicate
by check mark if disclosure of delinquent filers pursuant to Item 405 of
Regulation S-K is not contained herein, and will not be contained, to the best
of registrant’s knowledge, in definitive proxy or information statements
incorporated by reference in Part III of this Form 10-K or any amendment to this
Form 10-K. o
Indicate
by check mark whether the registrant is a large accelerated filer, an
accelerated filer, a non-accelerated filer or a smaller reporting company. See
definition of “accelerated filer and large accelerated filer” in Rule 12b-2 of
the Exchange Act. Large accelerated filer o Accelerated
filer x Non-accelerated
filer o Smaller reporting
company o
Indicate
by check mark whether the registrant is a shell company (as defined in Rule
12b-2 of the Exchange Act). Yes o No x
As of
June 27, 2009, the aggregate market value of the registrant’s common stock held
by non-affiliates of the registrant was $220,623,115 based on the closing sale
price as reported on the New York Stock Exchange.
As of
March 1, 2010, the registrant had 62,152,220 shares of common stock, par value
$0.01 per share, outstanding.
DOCUMENTS
INCORPORATED BY REFERENCE
Certain
information required by Part II (Item 5) and Part III of this form (Items 11,
12, 13 and 14, and part of Item 10) is incorporated by reference from the
Registrant’s Proxy Statement to be filed pursuant to Regulation 14A with respect
to the Registrant’s Annual Meeting of Shareholders to be held on or about May 5,
2010.
TABLE
OF CONTENTS
|
PART
I
|
|||
|
PAGE
|
|||
|
1
|
|||
|
7
|
|||
|
11
|
|||
|
11
|
|||
|
11
|
|||
|
PART
II
|
|||
|
12
|
|||
|
14
|
|||
|
15
|
|||
|
29
|
|||
|
30
|
|||
|
82
|
|||
|
82
|
|||
|
84
|
|||
|
PART
III
|
|||
|
84
|
|||
|
84
|
|||
|
84
|
|||
|
84
|
|||
|
84
|
|||
|
PART
IV
|
|||
|
84
|
PART
I
The
Company
Overview
We are
one of the largest diversified printing companies in North America, according to
the December 2009 Printing Impressions 400 report. Our broad portfolio of
products includes forms and labels manufacturing, packaging and publisher
offerings, envelope production and commercial printing. We operate a global
network of strategically located printing and manufacturing, fulfillment and
distribution facilities, which we refer to as manufacturing facilities, serving
a diverse base of over 100,000 customers. Since 2005, when current senior
management joined the Company, we have significantly improved profitability by
consolidating and closing plants, centralizing and leveraging our purchasing
spend, seeking operational efficiencies, and reducing corporate and field staff.
In addition, we have made investments in our businesses through acquisitions of
highly complementary companies and capital expenditures, while also divesting
non-strategic businesses. We are the successor to Mail-Well, Inc. and
were re-incorporated in Colorado in 1997.
We
operate our business in two complementary segments: envelopes, forms and labels
and commercial printing.
Envelopes,
Forms and Labels
Our
envelopes, forms and labels segment operates 35 manufacturing facilities in
North America. In 2009, we added to our envelopes, forms and labels business
with the acquisition of Nashua Corporation, which we refer to as Nashua.
Envelopes, forms and labels had net sales of $819.4 million, $916.1 million and
$897.7 million and operating income (loss) of $77.2 million, $(41.0) million and
$117.3 million, in 2009, 2008 and 2007, respectively. Total assets for
envelopes, forms and labels were $689.5 million, $624.8 million and $833.3
million, as of January 2, 2010, January 3, 2009 and December 29, 2007,
respectively.
On
September 15, 2009, we acquired all of the stock of Nashua, a manufacturer,
converter and marketer of labels and specialty papers, whose primary products
include pressure-sensitive labels, tags, transaction and financial receipts,
thermal and other coated papers, and wide-format papers. Prior to our
acquisition, Nashua had annual revenues of approximately $265 million. The total
consideration in connection with the Nashua acquisition, net of cash acquired of
$1.0 million, was $49.7 million, comprised of cash consideration of $4.2 million
and non-cash consideration of $45.5 million, primarily relating to the issuance
of approximately 7.0 million shares of Cenveo common stock, which closed on the
New York Stock Exchange at $6.53 on the date of acquisition. The combined
company is one of the largest manufacturers of pharmaceutical and scale labels
in North America, serving customers in the pharmacy, retail, and grocery
markets, as well as a leader in the point of sale and wide-format printing
markets.
Commercial
Printing
Our
commercial printing segment operates 35 manufacturing facilities in the United
States, Canada, Latin America and Asia. In 2008, we expanded our commercial
printing business with the acquisition of Rex Corporation and its manufacturing
facility, which we refer to as Rex. Commercial printing had net sales of $895.2
million, $1.2 billion and $1.1 billion and operating income (loss) of $(6.4)
million, $(136.8) million and $55.1 million in 2009, 2008 and 2007,
respectively. Total assets for commercial printing were $776.6 million, $863.2
million and $1.1 billion, as of January 2, 2010, January 3, 2009 and December
29, 2007, respectively.
Our
Products and Services
Segment
Overview
Envelopes, Forms and
Labels. We are the
largest North American prescription labels manufacturer for retail pharmacy
chains, a leading forms and labels provider, and one of the largest North
American envelope manufacturers. Our envelopes, forms and labels segment
represented approximately 48% of our net sales for the year ended January 2,
2010, primarily specializing in the design, manufacturing and printing
of:
1
|
|
·
|
Custom
labels and specialty forms;
|
|
|
·
|
Stock
envelopes, labels and business forms;
and
|
|
|
·
|
Direct
mail and customized envelopes developed for advertising, billing and
remittance.
|
Our
envelopes, forms and labels segment serves customers ranging from Fortune 50
companies to middle market and small companies serving niche markets. We produce
pressure-sensitive prescription labels for the retail pharmacy chain market. We
print a diverse line of custom labels and specialty forms for a broad range of
industries including manufacturing, warehousing, packaging, food and beverage,
and health and beauty, which we sell through extensive networks within the
resale channels. We supply a diverse line of custom products for our
small and mid-size business forms and labels customers, including both
traditional and specialty forms and labels for use with desktop PCs and laser
printers. We also provide direct mail and overnight packaging labels, food and
beverage labels, and shelf and scale labels for national and regional customer
accounts. Our printed office products include business documents, specialty
documents and short-run secondary labels, which are made of paper or film,
affixed with pressure sensitive adhesive and are used for mailing, messaging,
bar coding and other applications by large through smaller-sized customers
across a wide spectrum of industries. We produce a broad line of stock
envelopes, labels and traditional business forms that are sold through
independent distributors, contract stationers, national catalogs for the office
products market, office products superstores and quick printers. We also offer
direct mail products used for customer solicitations and custom envelopes used
for billing and remittance by end users including banks, brokerage firms and
credit card companies in addition to a broad group of other customers in various
industries.
Commercial Printing. We are one of the leading
commercial printing companies in North America and one of the largest providers
of end-to-end, content management solutions to scientific, technical and medical
journals, which we refer to as STM journals. Our commercial printing segment
represented approximately 52% of our net sales for the year ended January 2,
2010, providing one-stop print, design, content management fulfillment and
distribution offerings, including:
|
|
·
|
Specialty
packaging and high quality promotional materials for multinational
consumer products companies;
|
|
|
·
|
STM
journals, special interest and trade magazines for not-for-profit
organizations, educational institutions and specialty
publishers;
|
|
|
·
|
High-end
color printing of a wide range of premium products for major national and
regional customers; and
|
|
|
·
|
General
commercial printing products for regional and local
customers.
|
Our
commercial printing segment primarily caters to the consumer products,
pharmaceutical, financial services, publishing, and telecommunications
industries, with customers ranging from Fortune 50 companies to middle market
and small companies operating in niche markets. We provide a wide
array of commercial print offerings to our customers including electronic
prepress, digital asset archiving, direct-to-plate technology, high-quality
color printing on web and sheet-fed presses and digital printing. The broad
selection of commercial printing products we produce also includes specialty
packaging, journals and specialized periodicals, annual reports, car brochures,
direct mail products, advertising literature, corporate identity materials,
financial printing, books, directories, calendars, brand marketing materials,
catalogs, and maps. In our journal and specialty magazine business,
we offer complete solutions, including editing, content processing, content
management, electronic peer review, production, distribution and reprint
marketing. Our primary customers for our specialty packaging and promotional
products are pharmaceutical, apparel, tobacco and other large multi-national
consumer product companies.
The
primary methods of distribution of the principal products for our two segments
are by direct shipment via express mail, the U.S. postal system and freight
carriers.
Our
Business Strategy
Our goals
are to improve on profitability and pursue disciplined growth. The principal
features of our strategy are:
Improve our Cost Structure and
Profitability. We
regularly assess our operations with a view toward eliminating operations that
are not aligned with our core United States operations or are underperforming.
In September 2005, we established a goal of reducing annual operating expenses
through, among other things, consolidating our purchasing activities and
manufacturing platform, reducing corporate and field human resources,
streamlining information technology infrastructure and eliminating discretionary
spending. We achieved our cost-savings goal, which we refer to as our 2005 Plan,
before the end of 2007. In 2007 we initiated activities, which we refer to as
the 2007 Plan, in connection with our 2007 acquisitions of Commercial Envelope
Manufacturing Co. Inc., which we refer to as Commercial Envelope, Madison/Graham
ColorGraphics, Inc., which we refer to as ColorGraphics, Cadmus Communications
Corporation, which we refer to as
2
Cadmus,
and PC Ink Corp., which we refer to as Printegra and collectively with
Commercial Envelope, ColorGraphics and Cadmus, which we refer to as the 2007
Acquisitions. Under the 2007 Plan, we closed seven manufacturing facilities and
integrated those operations into acquired and existing operations.
In the
first quarter of 2009, we implemented our 2009 cost savings and restructuring
plan, which we refer to as the 2009 Plan, to reduce our operating costs and
realign our manufacturing platform in order to compete effectively during the
current economic downturn. In connection with the 2009 Plan, we implemented cost
savings initiatives throughout our operations by closing three envelope plants,
one journal printing plant, one content facility, two commercial printing plants
and a forms plant and consolidating them into existing operations while
continuing the consolidation of certain back office functions into specific
centralized locations. As a result of these 2009 actions, we reduced our
headcount by approximately 1,700. We expect to have substantially completed
these cost savings initiatives by the end of the first quarter of 2010. In
total, we took actions that resulted in significant cost savings in 2009 that
have aided us in weathering the recession and positioning us better for the
future. We expect further initiatives to improve our profitability including
additional cost-savings in connection with ongoing operations, completed
acquisitions and any future acquisitions. We continue to evaluate the sale or
closure of manufacturing facilities that do not align with our strategic goals
or meet our performance targets.
Capitalize on Scale
Advantages. We
believe there are significant advantages to being a large competitor in a highly
fragmented industry. We seek to capitalize on our size, geographic footprint and
broad product lines to offer one-stop shopping and enhance our overall value to
our customers. As we grow in scale and increase our operating leverage, we seek
to realize better profit margins through operational improvements in our
manufacturing platform.
Enhance the Supply Chain. We
continue to work with our core suppliers to improve all aspects of our
purchasing spend and other logistical capabilities as well as to ensure a stable
source of supply. We seek to lower costs through more favorable pricing and
payment terms, more effective inventory management and improved communications
with vendors. We continue to consolidate our suppliers of key production inputs
such as paper and ink, and believe that significant opportunities exist in
optimizing the rest of our supply chain. Such opportunities that still exist
include, but are not limited to: (i) consolidating our packaging suppliers,
specifically carton, film and tape, to maximize our purchasing spend with a
smaller supplier base, (ii) reducing warehousing-related costs through
better inventory management, and (iii) increasing operating results through
better waste by-product capture and return to recycling vendors.
Seek Product and Processing
Improvements. We
conduct regular reviews of our product offerings, manufacturing processes and
distribution methods to ensure that we take advantage of new technology when
practical and meet the changing needs of our customers and the demands of a
global economy. We actively explore potential new product opportunities for
expansion, particularly in market sectors that are expected to grow at a faster
pace than the broader commercial printing industry. We also strive to enter into
new markets in which we may have competitive advantages based on our existing
infrastructure, operating expertise and customer relationships. Pharmaceutical
labels, direct mail and specialty packaging are examples of product niche
markets with opportunities for faster growth into which we recently expanded or
entered. We are also investing in promising digital and variable print
technology as we see demand from our customers increasing. By expanding our
products offerings, we intend to increase cross-selling opportunities to our
existing customer base and mitigate the impact of any decline in a given
market.
Pursue Strategic
Acquisitions. We
continue to selectively review opportunities to expand within growing niche
markets, broaden our product offerings and increase our economies of scale
through acquisitions. We intend to continue practicing acquisition disciplines
and pursuing opportunities for greater expected profitability and cash flow or
improved operating efficiencies, such as increased utilization of our
manufacturing assets. Since July 2006, we have completed eight acquisitions that
we believe have and will continue to enhance our operating margins and deliver
economies of scale. We believe our acquisition strategy will allow us to both
realize increased revenue and cost-saving synergies, and apply our management
expertise to improve the operations of acquired entities. For example, our
acquisition of Nashua built upon our acquisition of Rx Technology Corporation,
which we refer to as Rx Technology. In July 2006, Rx Technology gave us entry
into and a leading market position in the pharmaceutical labels business. Nashua
further strengthened our position in the pharmaceutical labels market, while
giving us access to new shelf label market customers and allowing us to further
enhance our raw material purchasing power and rationalize our manufacturing
platform.
Our
Industry
The
United States printing industry is large and highly fragmented with just over
34,100 participants as reported in the second quarter 2009 United States
Department of Labor Quarterly Census of Employment and Wages. This is down from
approximately 36,100 participants in the second quarter of 2007. The Printing
Industries of America estimated 2008 aggregate shipment revenues for the
printing industry were in excess of $165 billion. The industry consists of a few
large companies with sales in excess of $1 billion, several mid-sized companies
with sales in excess of $100 million and thousands of smaller operations. These
printing businesses operate in a broad range of sectors, including commercial
printing,
3
envelopes,
forms and labels, specialty printing, trade publishing, and specialty packaging
among others. We estimate that in 2008 the ten largest North American commercial
printers by revenue, as reported in the Printing Impressions 400, represented
approximately 19% of total industry sales, while the market sectors in which we
primarily compete, as categorized in the 2008 PIA/GATF Print Market Atlas,
comprised approximately 70% of total industry sales.
Raw
Materials
The
primary materials used in our businesses are paper, ink, film, offset plates,
chemicals and cartons, with paper accounting for the majority of total material
costs. We purchase these materials from a number of key suppliers and
have not experienced any significant difficulties in obtaining the raw materials
necessary for our operations, though, in times of limited supply, we have
occasionally experienced minor delays in delivery. We believe that we
purchase our materials and supplies at competitive prices primarily due to the
size and scope of our purchasing power.
The
printing industry continues to experience pricing pressure related to increases
in the cost of materials used in the manufacture of our
products. Industry prices for most of the raw materials we use in our
business decreased during 2009 from 2008 pricing levels, primarily due to the
general economic downturn. We believe raw material pricing will increase in 2010
as we have received notifications of price increases in the fourth quarter of
2009 and in the first quarter of 2010.
While we
expect to continue to be able to pass along to our customers a substantial
portion of the raw material price increases, any price increase passed along
carries the risk of an offsetting decrease in demand for our
products.
Patents,
Trademarks and Trade Names
We market
products under a number of trademarks and trade names. We also hold or have
rights to use various patents relating to our businesses. Our patents
expire between 2011 and 2023 and our trademarks expire between 2010 and 2020.
Our sales do not materially depend upon any single patent or group of related
patents.
Competition
In
selling our printed labels and business forms products, we compete with other
label and document print manufacturers with nationwide locations, and regional
and local printers that typically sell within a 100- to 300-mile radius of their
plants. Printed labels and business forms competition is based mainly on
quick-turn customization quality of products and customer service levels. In
selling our envelope products, we compete with a few multi-plant and many
single-plant companies that primarily service regional and local markets. The
state of the U.S. and global economy affect the needs and buying capacity of our
customers that in turn influence our sales volume. We also face competition from
alternative sources of communication and information transfer such as electronic
mail, the internet, interactive video disks, interactive television, electronic
retailing and facsimile machines. Although these sources of communication and
advertising may eliminate some domestic envelope sales in the future, we believe
that we will experience continued demand for envelope products due to: (i) the
ability of our customers to obtain a relatively low-cost information delivery
vehicle that may be customized with text, color, graphics and action devices to
achieve the desired presentation effect; (ii) the ability of our direct mail
customers to penetrate desired markets as a result of the widespread delivery of
mail to residences and businesses through the U.S. Postal Service; and (iii) the
ability of our direct mail customers to include return materials inside their
mailings. Principal competitive factors in the envelope business are quality,
service and price. Although all three are equally important, various customers
may emphasize one or more over the others.
Our
commercial printing segment provides offerings designed to give customers
complete solutions for communicating their messages to targeted audiences. The
commercial printing industry continues to have excess capacity and is highly
competitive in most of our product categories and geographic regions, while also
influenced by the current U.S. and global economic conditions. Competition is
based largely on price, quality and servicing the special needs of customers.
The additional excess capacity resulted in a competitive pricing environment, in
which companies have focused on reducing costs in order to preserve operating
margins. We believe this environment will continue to lead to more consolidation
within the commercial print industry as companies seek economies of scale,
broader customer relationships, geographic coverage and product breadth to
overcome or offset excess industry capacity and pricing pressures.
4
Seasonality
Our
general labels business has historically experienced a seasonal increase during
the first and second quarters of the year primarily resulting from the release
of our product catalogs to the trade channel customers and our customers’ spring
advertising campaigns. Our prescription label business has historically
experienced seasonality in its sales due to cold and flu seasons generally
concentrated in the fourth and first quarters of the year. Our documents
businesses have historically experienced higher volume in the fourth quarter,
primarily resulting from tax forms and related documents. Our envelopes market
and certain segments of the direct mail market have historically experienced
seasonality with a higher percentage of volume of products sold to these markets
occurring during the fourth quarter of the year related to holiday purchases. As
a result of these seasonal variations, some of our envelopes, forms and labels
operations operate at or near capacity at certain times throughout the
year.
Our
commercial printing plants also experience seasonal variations. Revenues from
annual reports are generally concentrated from February through
April. Revenues associated with consumer publications, such as
holiday catalogs and automobile brochures; tend to be concentrated from July
through October. Revenues associated with the educational and scholarly market
and promotional materials tend to decline in the summer. As a result of these
seasonal variations, some of our commercial printing operations operate at or
near capacity at certain times throughout the year.
Backlog
At
January 2, 2010 and January 3, 2009, the backlog of customer orders to be
produced or shipped was approximately $87.1 million and $89.9 million,
respectively.
Employees
We
employed approximately 8,700 people worldwide as of January 2, 2010,
approximately 13% of whom were members of various local labor unions. Collective
bargaining agreements, each of which cover the workers at a particular facility,
expire from time to time and are negotiated separately. Accordingly, we believe
that no single collective bargaining agreement is material to our operations as
a whole.
Environmental
Regulations
Our
operations are subject to federal, state, local and foreign environmental laws
and regulations including those relating to air emissions; waste generation,
handling, management and disposal, and remediation of contaminated sites. We
have implemented environmental programs designed to ensure that we operate in
compliance with the applicable laws and regulations governing environmental
protection. Our policy is that management at all levels be aware of the
environmental impact of operations and direct such operations in compliance with
applicable standards. We believe that we are in substantial compliance with
applicable laws and regulations relating to environmental protection. We do not
anticipate that material capital expenditures will be required to achieve or
maintain compliance with environmental laws and regulations. However, there can
be no assurance that newly discovered conditions, or new laws and regulations or
stricter interpretations of existing laws and regulations, could result in
increased compliance or remediation costs.
Prior to
the acquisition, Nashua was involved in certain environmental matters and was
designated by the Environmental Protection Agency, which we refer to as the EPA,
as a potentially responsible party for certain hazardous waste sites. In
addition, Nashua had been notified by certain state environmental agencies that
Nashua may bear responsibility for remedial action at other sites which have not
been addressed by the EPA. The sites at which Nashua may have remedial
responsibilities are in various stages of investigation and remediation. Due to
the unique physical characteristics of each site, the remedial technology
employed, the extended timeframes of each remediation, the interpretation of
applicable laws and regulations and the financial viability of other potential
participants, our ultimate cost of remediation is an estimate and is contingent
on these factors. As of January 2, 2010, the liability relating to Nashua’s
environmental matters was $3.6 million and is included in other long-term
liabilities on our consolidated balance sheet. Based on information currently
available, we believe that Nashua’s remediation expense, if any, is not likely
to have a material adverse effect on our consolidated financial position or
results of operations. In an effort to mitigate any pre-acquisition
environmental matters related to Nashua, we purchased an environmental insurance
policy providing coverage for a ten year period subsequent to the date of
acquisition.
5
Executive
Officers
The
following presents a list of our executive officers, their age, prior and
present positions, the year elected to their present position and other
positions they have held during the past five years. No family
relationships exist among any of the executive officers named, nor is there any
undisclosed arrangement or understanding pursuant to which any person was
selected as an officer. This information is presented as of the date of the Form
10-K filing.
|
Name
|
|
Age
|
Position
|
|
Year
Elected
to
Present
Position
|
|
| Robert G. Burton, Sr. |
69
|
Chairman
and Chief Executive Officer
|
2005
|
|||
|
Mark
S. Hiltwein
|
46
|
Chief
Financial Officer
|
2007
|
|||
|
Dean
Cherry
|
49
|
President,
Envelope Operations
|
2008
|
|||
|
Harry
Vinson
|
49
|
President,
Publisher Services, Commercial Print and Packaging
Operations
|
2007
|
|||
|
Timothy
M. Davis
|
55
|
Senior
Vice President, General Counsel and Secretary
|
2006
|
|||
Robert G.
Burton, Sr. Mr. Burton, 69,
has been Cenveo’s Chairman and Chief Executive Officer since September 2005. In
January 2003, he formed Burton Capital Management, LLC, a company that invests
in manufacturing companies, and has been its Chairman, Chief Executive Officer
and sole managing member since its formation. From December 2000 through
December 2002, Mr. Burton was the Chairman, President and Chief Executive
Officer of Moore Corporation Limited, a leading printing company with over $2.0
billion in revenue for fiscal year 2002. Preceding his employment at
Moore, Mr. Burton was Chairman, President, and Chief Executive Officer of Walter
Industries, Inc., a diversified holding company. From April 1991
through October 1999, he was the Chairman, President and Chief Executive Officer
of World Color Press, Inc., a $3.0 billion diversified printing company. From
1981 through 1991, he held a series of senior executive positions at Capital
Cities/ABC, including President of ABC Publishing. Mr. Burton was
also employed for 10 years as a senior executive of SRA, the publishing division
of IBM.
Mark S.
Hiltwein Mr. Hiltwein, 46, has served as Cenveo’s Chief Financial Officer
since December 2009 and was Chief Financial Officer from July 2007 to June
2009. From June 2009 to December 2009, Mr. Hiltwein served as
Cenveo’s President and Field Sales Manager. From July 2005 to July
2007, he was President of Smartshipper.com, an online third party logistics
company. From February 2002 through July 2005, Mr. Hiltwein was
Executive Vice President and Chief Financial Officer of Moore Wallace
Incorporated, a $3.5 billion printing company. Prior to that, he
served as Senior Vice President and Controller from December 2000 to February
2002. Mr. Hiltwein has served in a number of financial positions from
1992 through 2000 with L.P. Thebault Company, a commercial printing company,
including Chief Financial Officer from 1997 through 2000. Mr.
Hiltwein began his career at Mortenson and Associates, a regional public
accounting firm where he held various positions in the audit department. He is a
CPA.
Dean E.
Cherry Mr. Cherry, 49, reassumed the position of Cenveo’s President
Envelope Operations in February 2010. From June 2009 through January 2010, he
served as Executive Vice President. From June 2008 through June 2009, Mr. Cherry
served as President of our Envelope, Commercial Print and Packaging Operations.
From February 1, 2008 to June 1, 2008, he was our President of Envelope
Operations. Since October 2006, Mr. Cherry was a private investor in
Renovatio Ventures, LLC. From 2004 to 2006, he was Group President of
Short-Run Commercial, and Group President of Integrated Print Communications and
Global Solutions, a $4.5 billion division of RR Donnelley & Sons, Inc. In
this position, Mr. Cherry had global P&L responsibility for Direct Mail,
Commercial Print, Global Capital Markets, Business Communication Services, Forms
and Labels, Astron (outsourcing) and Latin America. From 2001 to
2004, he held the positions of President, International and Subsidiary
Operations and President, Commercial and Subsidiary Operations, for Moore
Corporation Limited, a division of RR Donnelley. From 1991 to 1998 he held the
following positions at World Color Press, Inc.: 1991 to 1993 Vice
President, Operations; 1993 to 1994 Vice President, Regional Plant Manager; 1994
to 1996 Executive Vice President and Senior Vice President, Operations; 1997 to
1998 Executive Vice President, Investor Relations and Corporate
Communications. From 1985 to 1991, he held various financial
positions at Capital Cities/ABC Publishing division including Vice President,
Finance and Operations. Mr. Cherry is a member of University’s Dean’s
Advisory Council for the College of Business of Murray State University, and a
Trustee for the Murray State University Foundation.
Harry R.
Vinson Mr. Vinson, 49, has served as Cenveo’s President
Commercial Print, Packaging and Cadmus Publisher Services Group since October of
2009. Most recently, in October of 2009, he took on the added
responsibility of Cenveo’s Commercial Print Group after having the Global
Packaging Group responsibility added in December of 2008. From March
to December of 2007, Mr. Vinson was Cenveo’s Executive Vice President of the
Cadmus Publisher Services Group. Prior to his role at Cadmus
Publisher Services Group, Mr. Vinson was Cenveo’s Senior Vice President,
Purchasing and Logistics from September 2005 to March 2007. From
October 2003 until September 2005, he was the General Manager of
Central Region Sheetfed Operations of MAN Roland, a printing press
manufacturer. From February 2002 until July 2003, Mr. Vinson served
as Senior Vice President and General Manager of the Publication and Directory
Group at Moore Wallace (formerly Moore Corporation Limited). From
February 1990 until February 2002, he served in various senior sales positions
at Quebecor World (formerly World Color Press).
6
Timothy M.
Davis Mr. Davis, 55, has served as Cenveo’s Senior Vice
President, General Counsel and Secretary since January 2006. From July 1989
until he joined the Company, he was Senior Vice President, General Counsel and
Secretary of American Color Graphics, Inc., a commercial printing
company.
Cautionary
Statements
Certain
statements in this report, particularly statements found in “Risk Factors,”
“Business” and “Management’s Discussion and Analysis of Financial Condition and
Results of Operations,” may constitute “forward-looking statements” within the
meaning of the Private Securities Litigation Reform Act of 1995. In addition, we
or our representatives have made or continue to make forward-looking statements,
orally or in writing, in other contexts. These forward-looking statements
generally can be identified by the use of terminology such as “may,” “will,”
“expect,” “intend,” “estimate,” “anticipate,” “plan,” “foresee,” “believe” or
“continue” and similar expressions, or as other statements that do not relate
solely to historical facts. These statements are not guarantees of future
performance and involve risks, uncertainties and assumptions that are difficult
to predict or quantify. Management believes these statements to be reasonable
when made. However, actual outcomes and results may differ materially from what
is expressed or forecasted in these forward-looking statements. As a result,
these statements speak only as of the date they were made. We undertake no
obligation to publicly update or revise any forward-looking statements, whether
as a result of new information, future events or otherwise. In view of such
uncertainties, investors should not place undue reliance on our forward-looking
statements.
Such
forward-looking statements involve known and unknown risks, including, but not
limited to, those identified in Item 1A. Risk Factors along with changes in
general economic, business and labor conditions. More information regarding
these and other risks can be found below under “Risk Factors,” “Business,”
“Management’s Discussion and Analysis of Financial Condition and Results of
Operations” and other sections of this report.
Available
Information
Our
Internet address is: www.cenveo.com. References to our website address do not
constitute incorporation by reference of the information contained on the
website, and the information contained on the website is not part of this
document. We make available free of charge through our website our annual report
on Form 10-K, quarterly reports on Form 10-Q, current reports on Form 8-K and
amendments to those reports filed pursuant to Section 13(a) or 15(d) of the
Exchange Act as soon as reasonably practicable after such documents are filed
electronically with the Securities and Exchange Commission, which we refer to as
the SEC. Our Code of Business Conduct and Ethics is also posted on our website.
In addition, our earnings conference calls are archived for replay on our
website, and presentations to securities analysts are also included on our
website. In June 2009, we submitted to the New York Stock Exchange a certificate
of our Chief Executive Officer certifying that he is not aware of any violation
by us of New York Stock Exchange corporate governance listing standards. We also
filed as exhibits to our annual reports on Form 10-K and Form 10-K/A for the
fiscal year ended January 3, 2009 certificates of the Chief Executive Officer
and Chief Financial Officer as required under Section 302 of the Sarbanes-Oxley
Act.
The
public may read and copy any materials we file with the SEC at the SEC’s Public
Reference Room at 100 F Street, NE, Washington, D.C. 20549. The public may
obtain information about the operation of the Public Reference Room by calling
the SEC at 1-800-SEC-0330. The SEC maintains an Internet site (http://www.sec.gov) that contains reports, proxy
and information statements and other information regarding issuers that file
electronically with the SEC.
Many of
the factors that affect our business and operations involve risks and
uncertainties. The factors described below are some of the risks that could
materially harm our business, financial conditions, results of operations or
prospects.
The
recent U.S. and global economic conditions have adversely affected us and could
continue to do so.
The
current U.S. and global economic conditions have affected and, most likely, will
continue to affect our results of operations and financial position. A
significant part of our business relies on our customers’ printing spend. A
prolonged downturn in the U.S. and global economy and an uncertain economic
outlook has reduced the demand for printed materials and related offerings that
we provide our customers. Consequently, the reductions and delays in our
customers’ spending have adversely impacted and could continue to adversely
impact our results of operations, financial position and cash flows. We believe
the current economic downturn will result in decreased net sales, operating
income and earnings while also impacting our ability to manage our inventory and
customer receivables. The downturn may also result in increased restructuring
and related charges, impairments relating to goodwill, intangible assets and
other long-lived assets, and write-offs associated with inventories or customer
receivables. These uncertainties about future economic conditions in a very
challenging environment also make it difficult for us to forecast our operating
results and make timely decisions about future investments.
7
Our
substantial level of indebtedness could impair our financial condition and
prevent us from fulfilling our business obligations.
We
currently have a substantial amount of debt, which requires significant
principal and interest payments. As of January 2, 2010, our total
indebtedness was approximately $1.2 billion. Our level of
indebtedness could affect our future operations, for example by:
|
|
·
|
requiring
a substantial portion of our cash flow from operations to be dedicated to
the payment of principal and interest on indebtedness instead of funding
working capital, capital expenditures, acquisitions and other business
purposes;
|
|
|
·
|
making
it more difficult for us to satisfy all of our debt obligations, thereby
increasing the risk of triggering a cross-default
provision;
|
|
|
·
|
increasing
our vulnerability to economic downturns or other adverse developments
relative to less leveraged
competitors;
|
|
|
·
|
limiting
our ability to obtain additional financing for working capital, capital
expenditures, acquisitions or other corporate purposes in the future;
and
|
|
|
·
|
increasing
our cost of borrowing to satisfy business
needs.
|
We
may be unable to service or refinance our debt.
Our
ability to make scheduled payments on, or to reduce or refinance, our
indebtedness will depend on our future financial and operating performance, and
prevailing market conditions. Our future performance will be affected by the
impact of general economic, financial, competitive and other factors beyond our
control, including the availability of financing in the banking and capital
markets. We cannot be certain that our business will generate sufficient cash
flow from operations in an amount necessary to service our debt. If
we are unable to meet our debt obligations or to fund our other liquidity needs,
we will be required to restructure or refinance all or a portion of our debt to
avoid defaulting on our debt obligations or to meet other business
needs. Such a refinancing of our indebtedness could result in higher
interest rates, could require us to comply with more onerous covenants that
further restrict our business operations, could be restricted by another of our
debt instruments outstanding, or refinancing opportunities may not be available
at all.
The
terms of our indebtedness impose significant restrictions on our operating and
financial flexibility.
Our
senior subordinated and senior note indentures, and our recent senior second
lien note indenture, along with our senior secured credit facility agreement
contain various covenants that limit our ability to, among other
things:
|
|
·
|
incur
or guarantee additional
indebtedness;
|
|
|
·
|
make
restricted payments, including dividends and prepaying
indebtedness;
|
|
|
·
|
create
or permit certain liens;
|
|
|
·
|
enter
into business combinations and asset sale
transactions;
|
|
|
·
|
make
investments, including capital
expenditures;
|
|
|
·
|
amend
organizational documents and change accounting
methods;
|
|
|
·
|
enter
into transactions with affiliates;
and
|
|
|
·
|
enter
into new businesses.
|
These
restrictions could limit our ability to obtain future financing, make
acquisitions or incur needed capital expenditures, withstand a future downturn
in our business or the economy in general, conduct operations or otherwise take
advantage of business opportunities that may arise. Our senior secured credit
facility also contains a schedule of financial ratios including a minimum
interest coverage ratio that we must comply with on a quarterly basis, and
maximum first lien leverage and total leverage financial ratio that we must be
in compliance with at all times. Our ability to meet these financial ratios may
be affected by events beyond our control, such as further deterioration in
general economic conditions. We are also required to provide certain financial
information on a quarterly basis. Our failure to maintain applicable financial
ratios, in certain circumstances, or effective internal controls would prevent
us from borrowing additional amounts, and could result in a default under our
senior secured credit facility. A default could cause the indebtedness
outstanding under the senior secured credit facility and, by reason of
cross-acceleration or cross-default provisions, the senior subordinated, senior
and senior second lien notes and any other indebtedness we may then have, to
become immediately due and payable. If we are unable to repay those amounts, the
lenders under our senior secured credit facility and senior second lien
indenture could initiate a bankruptcy proceeding or liquidation proceeding, or
proceed against the collateral granted to them which secures that indebtedness.
If the lenders under our senior secured credit facility agreement and/or our
senior second lien indenture were to accelerate the repayment of outstanding
borrowings, we might not have sufficient assets to repay our
indebtedness.
8
There
are additional borrowings available to us that could further exacerbate our risk
exposure from debt.
Despite
current indebtedness levels, we may incur substantial additional indebtedness in
the future. Our senior secured credit facility and senior
subordinated, senior and senior second lien notes indentures and our other debt
instruments limit, but do not prohibit us from doing so. If we
incur additional debt above our current outstanding levels, the risks associated
with our substantial leverage would increase.
To
the extent that we make select acquisitions, we may not be able to successfully
integrate the acquired businesses into our business.
In the
past, we have grown rapidly through acquisitions. We intend to continue to
pursue select acquisition opportunities within the printing
industry. To the extent that we seek to pursue additional
acquisitions, we cannot be certain that target businesses will be available on
favorable terms or that, if we are able to acquire businesses on favorable
terms, we will be able to successfully integrate or profitably manage
them. Successfully integrating an acquisition involves minimizing
disruptions and efficiently managing substantial changes, some of which may be
beyond our control. An acquisition always carries the risk that such
changes, including to facility and equipment location, management and employee
base, policies, philosophies and procedures, could have unanticipated effects,
could require more resources than intended and could cause customers to
temporarily or permanently seek alternate suppliers. A failure to
realize acquisition synergies and savings could negatively impact the results of
both our acquired and existing operations.
A
decline in our consolidated expected profitability or profitability within one
of our individual reporting units could result in the impairment of assets,
including goodwill, other long-lived assets and deferred tax
assets.
We have
material amounts of goodwill, other long-lived assets and deferred tax assets on
our consolidated balance sheet. A decline in expected profitability,
particularly the impact of a continued decline in the U.S. and global economies,
could call into question the recoverability of our related goodwill, other
long-lived assets, or deferred tax assets and require us to write down or
write-off these assets or, in the case of deferred tax assets, recognize a
valuation allowance through a charge to income tax expense.
The
SEC has made informal requests for information from us and we cannot predict
whether the SEC will commence a formal investigation or take any other
action.
As
previously disclosed by us, during the fourth quarter of 2007, senior management
became aware of unsupported accounting entries that were recorded by a plant
controller who had responsibility for two of our envelope plants. As a result,
our audit committee initiated an internal review conducted by outside counsel
under the direction of the audit committee. The review concluded that the
accounting irregularities were isolated to those two envelope plants. As a
result, we recorded adjustments to restate our historical consolidated financial
statements for the year ended December 30, 2006 and interim periods in
2007, which decreased operating income in 2006 by approximately $2.3 million and
approximately $4.4 million in the first nine months of 2007. In connection with
these restatements and management’s evaluation of internal control over
financial reporting for 2007, we identified several internal control matters
that we believe were remediated. In connection with an informal inquiry,
commencing in September 2008, we briefed the staff of the SEC regarding the
facts surrounding our restatements and other matters. We cannot be sure of the
scope of or predict whether the SEC will take any action in connection with its
informal inquiry, and regardless of whether it ultimately leads to a formal SEC
investigation or action against us or any current or former employees, our
business (including our ability to complete financing transactions) or the
trading price of our securities may be adversely impacted.
Our
industry is highly competitive.
The
printing industry in which we compete is extremely fragmented and highly
competitive. In the commercial printing market, we compete against a
few large, diversified and financially stronger printing companies, as well as
smaller regional and local commercial printers, many of which are capable of
competing with us on volume, price and production quality. In the
envelope market, we compete primarily with a few multi-plant and many
single-plant companies servicing regional and local markets. In the
printed office products market, we compete primarily with document printers with
nationwide manufacturing locations and regional or local printers. We
believe there currently is excess capacity in the printing industry, which has
resulted in substantial price competition that may continue as customers put
product work out for competitive bid. We are constantly seeking ways
to reduce our costs, become more efficient and attract customers. We
cannot, however, be certain that these efforts will be successful, or that our
competitors will not be more successful in their similar efforts. If
we fail to reduce costs and increase productivity, or to meet customer demand
for new value-added products, services or technologies, we may face decreased
revenues and profit margins in markets where we encounter price competition,
which in turn could reduce our cash flow and profitability.
9
The
printing business we compete in generally does not have long-term customer
agreements, and our printing operations may be subject to quarterly and cyclical
fluctuations.
The
printing industry in which we compete is generally characterized by individual
orders from customers or short-term contracts. A significant portion
of our customers are not contractually obligated to purchase products or
services from us. Most customer orders are for specific printing
jobs, and repeat business largely depends on our customers’ satisfaction with
our work product. Although our business does not depend on any one
customer or group of customers, we cannot be sure that any particular customer
will continue to do business with us for any period of time. In addition, the
timing of particular jobs or types of jobs at particular times of year may cause
significant fluctuations in the operating results of our various printing
operations in any given quarter. We depend to some extent on sales to
certain industries, such as the financial services, advertising, pharmaceutical,
automotive and office products industries. To the extent these
industries experience downturns; the results of our operations may be adversely
affected.
Factors
affecting the U.S. Postal Service can impact demand for our
products.
Historically,
increases in postal rates have resulted in reductions in the volume of mail
sent, including direct mail, which is a meaningful portion of our envelope
volume. The U.S. Postal Service enacted such increases in May 2007,
May 2008 and 2009. As postal rate increases in the U.S. are outside our control,
we can provide no assurance that any future increases in U.S. postal rates will
not have a negative effect on the level of mail sent or the volume of envelopes
purchased. If such events were to occur, we may experience a decrease
in revenues and profitability.
The U.S.
Postal Service has also indicated the potential need to reduce delivery days
from six to five. We can provide no assurance that such a change
would not impact our customers’ decisions to use direct mail products, which may
in turn cause a decrease in our revenues and profitability.
Factors
other than postal rates that affect the volume of mail sent through the U.S.
postal system may also negatively affect our business. Congress enacted a
federal “Do Not Call” registry in response to consumer backlash against
telemarketers and is contemplating enacting so-called “anti-spam” legislation in
response to consumer complaints about unsolicited e-mail
advertisements. If similar legislation becomes enacted for direct
mail advertisers, our business could be adversely affected.
The
availability of the internet and other electronic media may adversely affect our
business.
Our
business is highly dependent upon the demand for envelopes sent through the
mail. Such demand comes from utility companies, banks and other
financial institutions, among other companies. Our printing business
also depends upon demand for printed advertising and business forms, among other
products. Consumers increasingly use the internet and other
electronic media to purchase goods and services, and for other purposes such as
paying utility and credit card bills. Advertisers use the internet
and other electronic media for targeted campaigns directed at specific
electronic user groups. Large and small businesses use electronic
media to conduct business, send invoices and collect bills. In
addition, companies have begun to deliver annual reports electronically rather
than in printed form, which could reduce demand for our high impact color
printing. Although other trends, such as the current growth of
targeted direct mail campaigns based upon mailing lists generated by electronic
purchases, may offset these declines in whole or in part, we cannot be certain
that the acceleration of the trend towards electronic media will not cause a
decrease in the demand for our products. If demand for our products
decreases, our cash flow or profitability could materially
decrease.
Increases
in paper costs and any decreases in the availability of paper could have a
material adverse effect on our business.
Paper
costs represent a significant portion of our cost of materials. Changes in paper
pricing generally do not affect the operating margins of our commercial printing
business because the transactional nature of the business allows us to pass on
most announced increases in paper prices to our customers. However, our ability
to pass on increases in paper price is dependent upon the competitive
environment at any given time. Paper pricing also affects the operating margins
of our envelopes, forms and labels business. We have historically been less
successful in immediately passing on such paper price increases due to several
factors, including contractual restrictions in certain cases, and the inability
to quickly update catalog prices in other instances. Moreover, rising paper
costs and their consequent impact on our pricing could lead to a decrease in
demand for our products.
10
We depend
on the availability of paper in manufacturing most of our
products. During periods of tight paper supply, many paper producers
allocate shipments of paper based on the historical purchase levels of
customers. In the past, we have occasionally experienced minor delays
in delivery. Any future delay in availability could negatively impact
our cash flow and profitability.
We
depend on good labor relations.
As of
January 2, 2010, we have approximately 8,700 employees worldwide, of which
approximately 13% of our employees are members of various local labor
unions. If our unionized employees were to engage in a concerted
strike or other work stoppage, or if other employees were to become unionized,
we could experience a disruption of operations, higher labor costs or
both. A lengthy strike could result in a material decrease in our
cash flow or profitability.
Environmental
laws may affect our business.
Our
operations are subject to federal, state, local and foreign environmental laws
and regulations, including those relating to air emissions, wastewater
discharge, waste generation, handling, management and disposal, and remediation
of contaminated sites. Currently unknown environmental conditions or
matters at our existing and prior facilities, new laws and regulations, or
stricter interpretations of existing laws and regulations could result in
increased compliance or remediation costs that, if substantial, could have a
material adverse effect on our business or operations in the
future.
We
are dependent on key management personnel.
Our
success will depend to a significant degree on our executive officers and other
key management personnel. We cannot be certain that we will be able
to retain our executive officers and key personnel, or attract additional
qualified management in the future. In addition, the success of any
acquisitions we may pursue may depend, in part, on our ability to retain
management personnel of the acquired companies. We do not carry key
person insurance on any of our managerial personnel.
None
We
currently occupy approximately 70 printing and manufacturing facilities,
primarily in North America, of which 23 are owned and 47 are leased. In addition
to on-site storage at these facilities, we store products in seven warehouses,
all of which are leased, and we have six leased sales offices. In 2009, we
ceased operations in nine facilities; two of which are available for sublease,
four of which were terminated, one is currently being sublet, one was sold and
one will be for sale. We lease 46,474 square feet of office space in Stamford,
Connecticut for our corporate headquarters. We believe that we have adequate
facilities for the conduct of our current and future operations.
From time
to time we may be involved in claims or lawsuits that arise in the ordinary
course of business. Accruals for claims or lawsuits have been provided for to
the extent that losses are deemed probable and estimable. Although the ultimate
outcome of these claims or lawsuits cannot be ascertained, on the basis of
present information and advice received from counsel, it is our opinion that the
disposition or ultimate determination of such claims or lawsuits will not have a
material adverse effect on our consolidated financial statements. In the case of
administrative proceedings related to environmental matters involving
governmental authorities, we do not believe that any imposition of monetary
damages or fines would be material.
11
PART
II
Cenveo’s
certificate of incorporation provides that the total authorized capital stock of
the Company is 100 million (100,000,000) shares of common stock, $0.01 par
value per share, which we refer to as Common Stock. Each share of voting Common
Stock is entitled to one vote in respect of each share of Cenveo voting Common
Stock held of record on all matters submitted to a vote of
stockholders.
Our
Common Stock is traded on the New York Stock Exchange, which we refer to as NYSE
under the symbol “CVO.” As of February 12, 2010, there were 491 shareholders of
record and, as of that date, we estimate that there were approximately 7,231
beneficial owners holding stock in nominee or “street” name. The following table
sets forth, for the periods indicated, the range of the intraday high and low
sales prices for our Common Stock as reported by the NYSE:
|
2009
|
High
|
Low
|
|||
|
First
Quarter
|
$
|
5.48
|
$
|
1.54
|
|
|
Second
Quarter
|
5.56
|
2.76
|
|||
|
Third
Quarter
|
7.20
|
3.60
|
|||
|
Fourth
Quarter
|
9.42
|
6.56
|
|||
|
2008
|
High
|
Low
|
|||
|
First
Quarter
|
$
|
18.16
|
$
|
9.66
|
|
|
Second
Quarter
|
13.04
|
9.21
|
|||
|
Third
Quarter
|
10.67
|
7.50
|
|||
|
Fourth
Quarter
|
7.76
|
2.24
|
|||
We have
not paid a dividend on our Common Stock since our incorporation and do not
anticipate paying dividends in the foreseeable future as the instruments
governing a significant portion of our debt obligations limit our ability to pay
Common Stock dividends.
See Note
11 to our consolidated financial statements included in Item 8 of this
Annual Report on Form 10-K for information regarding the Company’s stock
compensation plans. Compensation information required by Item II will be
presented in the Company’s 2010 definitive proxy statement, which is
incorporated herein by reference.
12
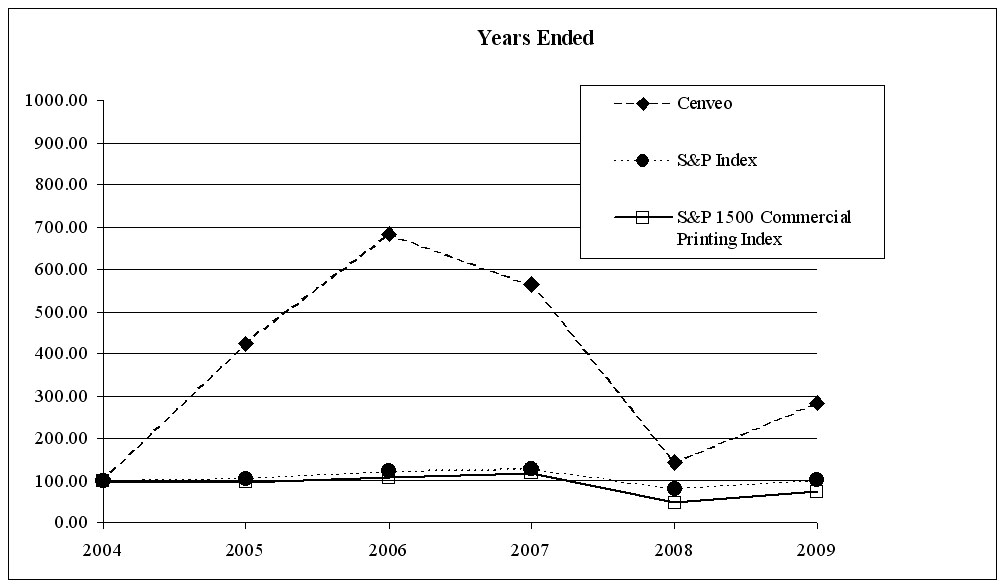
The graph
below compares five-year returns of our Common Stock with those of the S&P
500 Index, and the S&P 1500 Commercial Printing Index. The graph assumes
that $100 was invested as of December 2004 in each of our Common Stock, the
S&P 500 Index, and the S&P 1500 Commercial Printing Index and that all
dividends were reinvested. The S&P 1500 Commercial Printing Index is a
capitalization weighted index designed to measure the performance of all
NASDAQ-traded stocks in the commercial printing sector.
|
Years ended
|
|||||||
|
2004
|
2005
|
2006
|
2007
|
2008
|
2009
|
||
|
Cenveo
|
100.00
|
424.52
|
683.87
|
563.55
|
143.55
|
282.26
|
|
|
S&P
500 Index
|
100.00
|
104.83
|
121.20
|
127.87
|
81.12
|
102.15
|
|
|
S&P
1500 Commercial Printing Index
|
100.00
|
96.97
|
107.24
|
116.08
|
47.83
|
73.04
|
|
13
The
following table sets forth our selected financial and operating data for the
years ended January 2, 2010, January 3, 2009, December 29, 2007, December 30,
2006 and December 31, 2005.
The following consolidated selected financial data has been derived from, and should be read in conjunction with, the related consolidated financial statements, either elsewhere in this report or in reports we have previously filed with the SEC.
CENVEO,
INC. AND SUBSIDIARIES
(in
thousands, except per share data)
|
Years
Ended
|
||||||||||||||||
|
Statement
of Operations:
|
January
2,
2010
|
January
3,
2009
|
December
29, 2007
|
December
30, 2006
|
December
31, 2005
|
|||||||||||
|
Net
sales
|
$
|
1,714,631
|
$
|
2,098,694
|
$
|
2,046,716
|
$
|
1,511,224
|
$
|
1,594,781
|
||||||
|
Restructuring,
impairment and other
charges
|
68,034
|
399,066
|
(1)
|
40,086
|
41,096
|
77,254
|
||||||||||
|
Operating
income (loss)
|
32,188
|
(223,546
|
)
(1)
|
137,550
|
63,395
|
(26,310
|
)
|
|||||||||
|
(Gain)
loss on early extinguishment of
debt
|
(16,917
|
)
|
(14,642
|
)
|
9,256
|
32,744
|
—
|
|||||||||
|
Income
(loss) from continuing operations
|
(39,837
|
)
|
(296,976
|
)(2)
|
23,985
|
(11,148
|
)
|
(148,101
|
)
|
|||||||
|
Income
(loss) from discontinued operations,
net of taxes
|
8,898
|
(1,051
|
)
|
16,796
|
(3)
|
126,519
|
(4)
|
13,049
|
||||||||
|
Net
income (loss)
|
(30,939
|
)
|
(298,027
|
)(2)
|
40,781
|
(3)
|
115,371
|
(4)
|
(135,052
|
)
|
||||||
|
Income
(loss) per share from continuing operations:
|
||||||||||||||||
|
Basic
|
(0.70
|
)
|
(5.51
|
)
|
0.45
|
(0.21
|
)
|
(2.96
|
)
|
|||||||
|
Diluted
|
(0.70
|
)
|
(5.51
|
)
|
0.44
|
(0.21
|
)
|
(2.96
|
)
|
|||||||
|
Income
(loss) per share from discontinued operations:
|
||||||||||||||||
|
Basic
|
0.16
|
(0.02
|
)
|
0.31
|
2.38
|
0.26
|
||||||||||
|
Diluted
|
0.16
|
(0.02
|
)
|
0.31
|
2.38
|
0.26
|
||||||||||
|
Net
income (loss) per share:
|
||||||||||||||||
|
Basic
|
(0.54
|
)
|
(5.53
|
)
|
0.76
|
2.17
|
(2.70
|
)
|
||||||||
|
Diluted
|
(0.54
|
)
|
(5.53
|
)
|
0.75
|
2.17
|
(2.70
|
)
|
||||||||
|
Balance
Sheet data:
|
||||||||||||||||
|
Total
assets
|
1,525,773
|
1,552,114
|
2,002,722
|
999,892
|
1,079,564
|
|||||||||||
|
Total
long-term debt, including current maturities
|
1,233,917
|
1,306,355
|
1,444,637
|
675,295
|
812,136
|
|||||||||||
|
|
(1) Includes
$372.8 million pre-tax goodwill impairment
charges.
|
|
|
(2) Includes
$330.7 million goodwill impairment charges, net of tax benefit of $42.1
million.
|
|
|
(3) Includes
a $17.0 million gain on a disposal of discontinued operations, net of
taxes of $8.4 million.
|
|
|
(4) Includes
a $113.5 million gain on a disposal of discontinued operations, net of
taxes of $22.5 million.
|
14
This
Management’s Discussion and Analysis of Financial Condition and Results of
Operations, which we refer to as MD&A, of Cenveo, Inc. and its subsidiaries,
which we refer to as Cenveo, should be read in conjunction with our consolidated
financial statements included in Item 8 of this Annual Report on Form 10-K,
which we refer to as the Form 10-K. Certain statements we make under this Item 7
constitute forward-looking statements under the Private Securities Litigation
Reform Act of 1995. See Cautionary Statements regarding forward-looking
statements in Item 1 and Risk Factors in Item 1A.
Introduction
and Executive Overview
We are
one of the largest diversified printing companies in North America, according to
the December 2009 Printing Impressions 400 report. Our broad portfolio of
products includes forms and labels manufacturing, packaging and publisher
offerings, envelope production and commercial printing. We operate a global
network of strategically located printing and manufacturing, fulfillment and
distribution facilities, which we refer to as manufacturing facilities, serving
a diverse base of over 100,000 customers. Since 2005, when current senior
management joined the Company, we have significantly improved profitability by
consolidating and closing plants, centralizing and leveraging our purchasing
spend, seeking operational efficiencies, and reducing corporate and field staff.
In addition, we have made investments in our businesses through acquisitions of
highly complementary companies and capital expenditures, while also divesting
non-strategic businesses.
Our
management team is primarily focused on two main areas affecting our business:
(i) printing industry challenges, primarily pricing pressures experienced
throughout our operations and overcapacity in certain of the markets that we
operate in, and (ii) financial flexibility, which includes servicing our current
debt level, investing in our business through strategic acquisitions and capital
expenditures, and increasing our economies of scale to help improve the
performance of our current operations.
The
United States printing industry is highly fragmented, with a broad range of
sectors, including commercial printing and labels, envelopes and forms among
others. We believe the printing industry has excess capacity and continues to be
highly competitive with many of our customers focusing on price as a key
decision driver. We believe that given the current economic downturn, our
customers will continue to focus on price. We continue to pursue cost savings
measures in an effort to align our cost structure with our anticipated revenues
and mitigate the impact of pricing pressures. Such measures could require
additional plant closures and/or consolidation and employee headcount reductions
throughout our operating platform.
Our
financial flexibility depends heavily on our ability to maintain relationships
with existing customers, attract new financially viable customers and maximize
our operating profits, all of which are vital to our ability to service our
current debt level. Our level of indebtedness, which requires significant
principal and interest payments, could potentially impact our ability to
reinvest cash flows from operations into our business via capital expenditures
or niche acquisitions. We therefore closely monitor working capital, including
the credit we extend to and the collections we receive from customers, inventory
levels, and vendor pricing and sales terms, while continuously seeking
improvements to increase our cash flow.
We offer
our customers a wide range of print products and certain of our key customers
have recently provided us the opportunity to become a single source supplier for
all of their printed product needs. This trend benefits our customers as they
seek to leverage their buying power and helps us improve operating efficiencies
in our plants with increased throughput. We believe that our manufacturing
platform, strategically located facilities and our industry experienced
management team will enable us to improve our operating margins. We also
continue to work with our vendors and focus on supply chain enhancements to
lower our input costs and improve our operating margins.
See Part
1 Item 1 of this Form 10-K for a more complete description of our
business.
2010
Outlook
The
current U.S. and global economic conditions have affected and, most likely, will
continue to affect our results of operations and financial position. These
uncertainties about future economic conditions in a very challenging environment
make it difficult for us to forecast our future operating
results. One critical success factor for us is maintaining our
reputation for reliability, quality and superior customer service. This is vital
to securing new customers and retaining current ones. At the same time, we must
continue to contain costs and maximize efficiencies.
15
In the
second half of 2009 and the first two months of 2010, we saw several
developments that we anticipate impacting our business in 2010. These
developments include, but are not limited to: (i) raw material price increases
for some of our key manufacturing inputs, and (ii) increased unit volume for our
direct mail envelope customers, primarily financial institutions, during the
fourth quarter of 2009 as compared to the first half of 2009. Our ability
to pass on raw material price increases over time to our customers should limit
the impact of the manufacturing input price increases on our operating results,
while direct mailers returning to market in 2010 should allow our envelope
operations to capitalize on capacity reductions and manufacturing efficiencies
resulting from our 2009 Plan. We anticipate the economic environment currently
influencing our operations to continue through the first half of 2010.
Therefore, we will continue our pursuit of additional cost savings opportunities
in an effort to mitigate the impacts of the current economic
environment.
In 2010,
we are focused on completing the integration of Nashua into our existing
manufacturing platform and believe that expected synergies resulting from the
Nashua acquisition will be available to us for a substantial portion of the
year. In January of 2010, we announced the closure of Nashua’s Omaha,
Nebraska labels facility and we are currently integrating it into our existing
operations. In addition, cost savings actions that we began in the first quarter
of 2009, as part of our 2009 Plan, which we continued implementing
throughout our 2009 fiscal year, should increase our profitability in 2010.
We
anticipate our net sales in 2010 to increase compared to 2009, primarily due to
the inclusion of a full year of Nashua’s operations in our results, increased
unit volumes in our envelope reporting unit and raw material price increases
being passed onto our customers in certain of our businesses.
In
February of 2010, we completed a refinancing that included an amendment, which
we refer to as the 2010 Amendment, to our revolving credit facility due 2012,
which we refer to as the Revolving Credit Facility, and our term loans and
delayed-draw term loans due 2013, which we refer to as the Term Loans, which
collectively with the Revolving Credit Facility we refer to as the Amended
Credit Facilities, and the issuance of $400 million 8⅞% Senior Second Lien
Notes due 2018, which we refer to as the 8⅞% Notes. This refinancing extended
maturities on approximately one quarter of our total debt and provides immediate
financial flexibility with the elimination of amounts outstanding under our
Revolving Credit Facility. We currently anticipate 2010 net capital expenditures
to be relatively consistent with our 2009 net capital expenditures. Our cash
taxes are expected to be minimal given our level of net operating loss
carryfowards while we expect cash interest to increase as a result of our 2010
Amendment and issuance of our 8⅞% Notes. Our pension and other
postretirement plan expenses and expected contributions related to our pension
and other postretirement plans will increase slightly in 2010, primarily due to
the Nashua acquisition, offset in part by the investment return on plan assets
in 2009.
We
regularly explore and evaluate possible strategic transactions and alliances. We
also periodically engage in discussions with businesses that could complement or
strengthen our existing product categories and others regarding such matters,
which may include joint ventures and strategic relationships as well as business
combinations or the acquisition or disposition of assets. In order to pursue
certain of these opportunities, we will require additional funds. There can be
no assurance that we will enter into additional strategic transactions or
alliances, nor do we know if we will be able to obtain the necessary financing
for these transactions on favorable terms, if at all.
Consolidated
Operating Results
This
MD&A includes an overview of our consolidated results of operations for
2009, 2008 and 2007 followed by a discussion of the results of each of our
reportable segments for the same period. Our results of operations for the year
ended January 2, 2010 include the operating results of Nashua subsequent to its
acquisition date of September 15, 2009. Our results of operations for the year
ended January 3, 2009 include the operating results of Rex, subsequent to its
acquisition date on March 31, 2008. Our results of operations for the year ended
December 29, 2007 include the operating results of the 2007 Acquisitions,
subsequent to their respective acquisition dates, except for ColorGraphics which
was included in our operating results from July 1, 2007.
2009
Our
results for the year ended January 2, 2010, reflect the unfavorable economic
conditions we and our customers encountered in 2009. Excluding the effects of
our acquisitions in 2009 and 2008, net sales decreased 22.5%. Our commercial
printing segment results were primarily influenced by volume and price declines
in substantially all of the markets we serve due to excess capacity and intense
pricing pressures. Our envelope, forms and labels segment also experienced price
and volume declines primarily attributable to our financial services customers
who historically reached targeted customers via our direct mail capabilities. In
order to compete effectively in this environment, we continue to focus on
improving productivity and creating operating efficiencies through cost
reductions. For example, in 2009, we reduced our employee headcount by
approximately 1,700 and closed and consolidated nine manufacturing
facilities. In addition, we continued pursuing working capital
initiatives to increase cash flow generation from operations despite the decline
in our net sales.
16
A summary
of our consolidated statement of operations is presented below. The summary
presents reported net sales and operating income (loss). See Segment Operations
below for a summary of net sales and operating income (loss) of our operating
segments that we use internally to assess our operating performance. Our
reporting periods for 2009, 2008 and 2007 consisted of 52, 53 and 52 week
periods, respectively, ending on the Saturday closest to the last day of the
calendar month and ended on January 2, 2010, January 3, 2009, and December 29,
2007, respectively. We refer to such periods herein as (i) the year ended
January 2, 2010 or 2009, (ii) the year ended January 3, 2009 or 2008 and (iii)
the year ended December 29, 2007 or 2007. All references to years and year-ends
herein relate to fiscal years rather than calendar years. We do not believe the
additional week in 2008 had a material impact on our consolidated results of
operations.
|
Years
Ended
|
||||||||||||
|
January
2,
2010
|
January
3,
2009
|
December
29,
2007
|
||||||||||
|
(in
thousands, except per share amount)
|
||||||||||||
|
Net
sales
|
$ | 1,714,631 | $ | 2,098,694 | $ | 2,046,716 | ||||||
|
Operating
income (loss):
|
||||||||||||
|
Envelopes,
forms and
labels
|
$ | 77,200 | $ | (40,979 | ) | $ | 117,342 | |||||
|
Commercial
printing
|
(6,397 | ) | (136,828 | ) | 55,085 | |||||||
|
Corporate
|
(38,615 | ) | (45,739 | ) | (34,877 | ) | ||||||
|
Total
operating income
(loss)
|
32,188 | (223,546 | ) | 137,550 | ||||||||
|
Gain
on sale of non-strategic businesses
|
— | — | (189 | ) | ||||||||
|
Interest
expense,
net
|
106,063 | 107,321 | 91,467 | |||||||||
|
(Gain)
loss on early extinguishment of debt
|
(16,917 | ) | (14,642 | ) | 9,256 | |||||||
|
Other
(income) expense,
net
|
(1,368 | ) | (637 | ) | 3,131 | |||||||
|
Income
(loss) from continuing operations before income taxes
|
(55,590 | ) | (315,588 | ) | 33,885 | |||||||
|
Income
tax expense
(benefit)
|
(15,753 | ) | (18,612 | ) | 9,900 | |||||||
|
Income
(loss) from continuing operations
|
(39,837 | ) | (296,976 | ) | 23,985 | |||||||
|
Income
(loss) from discontinued operations, net of taxes
|
8,898 | (1,051 | ) | 16,796 | ||||||||
|
Net
income
(loss)
|
$ | (30,939 | ) | $ | (298,027 | ) | $ | 40,781 | ||||
|
Income
(loss) per share—basic:
|
||||||||||||
|
Continuing
operations
|
$ | (0.70 | ) | $ | (5.51 | ) | $ | 0.45 | ||||
|
Discontinued
operations
|
0.16 | (0.02 | ) | 0.31 | ||||||||
|
Net
income
(loss)
|
$ | (0.54 | ) | $ | (5.53 | ) | $ | 0.76 | ||||
|
Income
(loss) per share—diluted:
|
||||||||||||
|
Continuing
operations
|
$ | (0.70 | ) | $ | (5.51 | ) | $ | 0.44 | ||||
|
Discontinued
operations
|
0.16 | (0.02 | ) | 0.31 | ||||||||
|
Net
income
(loss)
|
$ | (0.54 | ) | $ | (5.53 | ) | $ | 0.75 | ||||
Net
Sales
Net sales
for the 2009 decreased $384.1 million, as compared to 2008, due to lower sales
from our commercial printing segment of $287.3 million and from our envelopes,
forms and labels segment of $96.7 million. These decreases were largely due to
volume declines, changes in product mix and lower material costs, primarily due
to the current general economic conditions that we experienced during 2009, and
lost sales resulting from plant closures as part of our restructuring plans.
These declines were partially offset by increased sales for our envelopes, forms
and labels segment from the integration of Nashua into our operations, as Nashua
was not included in our results in 2008.
Net sales
for 2008 increased $52.0 million, as compared to 2007. This increase was
primarily due to the $249.9 million of sales generated from the integration of
Rex and the 2007 Acquisitions into our operations, for which Rex was not
included in our results in 2007, and the 2007 Acquisitions were included in our
results for less than a full year in 2007. This increase was partially offset by
lower sales from our commercial printing and envelopes, forms and labels
segments of $138.7 million and $59.2 million, respectively, primarily due to
plant closures and lower volumes due to general economic conditions, partially
offset by price increases net of changes in product mix. See Segment Operations
below for a more detailed discussion of the primary factors for our net sales
changes.
Operating
Income
Operating income,
excluding the 2008 non-cash goodwill impairment charges of $372.8 million for
our commercial print and envelope reporting units, decreased $117.1 million in
2009, as compared to 2008. This decrease was primarily due to lower
operating income for our envelopes, forms and labels segment of $50.3 million
and our commercial printing segment of $74.0 million. These declines were
primarily due to the current general economic conditions that we experienced
during 2009 and increased restructuring and impairment charges resulting from
cost savings initiatives taken to mitigate the current general economic
conditions. See Segment Operations below for a more detailed discussion of the
primary factors for the changes in operating income by reportable
segment.
17
Operating
income for 2008 decreased $361.1 million, as compared to 2007. This decrease was
primarily due to: (i) increased restructuring, impairment and other charges of
$359.0 million, primarily relating to non-cash goodwill impairment charges of
$372.8 million related to our commercial print and envelope reporting units, and
(ii) higher selling, general and administrative expenses of $13.0 million
primarily due to the acquisition of Rex in 2008, for which Rex was not included
in our results in 2007, and the 2007 Acquisitions, which were not included in
our results for a full year in 2007, offset in part by our cost savings
programs. These decreases were partially offset by (i) increased gross margins
of $9.5 million primarily due to the acquisition of Rex, for which Rex was not
included in our results in 2007, and the 2007 Acquisitions, which were not
included in our results for a full year in 2007 and our cost savings programs,
offset in part by higher manufacturing costs primarily due to material price
increases and higher distribution costs and lower gross margins due to plant
closures, and (ii) lower amortization of $1.4 million. See Segment Operations
below for a more detailed discussion of the primary factors for the changes in
operating income by reportable segment.
Interest Expense. Interest expense decreased
$1.3 million to $106.1 million in 2009, from $107.3 million in 2008, primarily
due to our lower debt balances resulting from: (i) the repurchase and retirement
of a portion of our 8⅜% senior subordinated notes due 2014, which we refer to as
the 8⅜% Notes, 10½% senior notes due 2016, which we refer to as the 10½% Notes,
and 7⅞% senior subordinated notes due 2013, which we refer to as the 7⅞% Notes,
and (ii) the repayment of a portion of Term Loans, primarily from a mandatory
excess cash flow payment made in March 2009 and other debt. The
decrease in interest expense was partially offset by higher interest rates
resulting from the April 2009 amendment of our Amended Credit Facilities, which
we refer to as the 2009 Amendment. Interest expense in 2009 reflected average
outstanding debt of approximately $1.3 billion and a weighted average interest
rate of 7.7%, compared to the average outstanding debt of approximately $1.4
billion and a weighted average interest rate of 7.2% in 2008. We expect interest
expense in 2010 to be higher than 2009 largely due to the 2010 Amendment and the
issuance of our 8⅞% Notes.
Interest
expense increased $15.9 million to $107.3 million in 2008, from $91.5 million in
2007, primarily due to additional debt incurred to finance Rex and the 2007
Acquisitions, offset in part by lower interest rates. Interest expense in 2008
reflected average outstanding debt of approximately $1.4 billion and a weighted
average interest rate of 7.2%, compared to the average outstanding debt of
approximately $1.2 billion and a weighted average interest rate of 7.5% in
2007.
(Gain) Loss on Early Extinguishment
of Debt. In 2009, we
recognized net gains on early extinguishment of debt of $16.9 million,
comprising of gains of $21.9 million from the repurchase and retirement of
principal amounts of $40.1 million of our 8⅜% Notes; $7.1 million of our 7⅞%
Notes; and $5.0 million of our 10½% Notes. These gains were partially offset by
the loss on early extinguishment of debt related to the 2009 Amendment of $5.0
million, of which $3.9 million related to fees paid to consenting lenders and
$1.1 million related to the write-off of previously unamortized debt issuance
costs.
In 2008,
we: (i) repurchased $31.8 million of our 8⅜% Notes and $16.6 million of our 7⅞%
Notes, and recognized a gain on early extinguishment of debt of $18.5 million,
and (ii) converted our $175.0 million senior unsecured loan due 2015, which we
refer to as the Senior Unsecured Loan, into our 10½% Notes, and recognized a
$4.2 million loss on early extinguishment debt.
In 2007,
we: (i) retired the remaining $10.5 million of our 9⅝% senior notes due 2012,
which we refer to as the 9⅝% Notes, (ii) executed a tender offer for repayment
on March 19, 2007 of $20.9 million of our 8⅜% Notes, and (iii) refinanced our
then existing $525.0 million senior secured credit facilities, which we refer to
as the Credit Facilities, in connection with the Cadmus acquisition, for which
we incurred losses on early extinguishment of debt of $9.3 million.
Income
Taxes
|
Years
Ended
|
|||||||||
|
January
2,
2010
|
January
3,
2009
|
December
29, 2007
|
|||||||
|
(in
thousands)
|
|||||||||
|
Income
tax expense (benefit) for U.S. operations
|
$
|
(18,342
|
)
|
$
|
(17,969
|
)
|
$
|
11,903
|
|
|
Income
tax expense (benefit) for foreign operations
|
2,589
|
(643
|
)
|
(2,003
|
)
|
||||
|
Income
tax expense (benefit)
|
$
|
(15,753
|
)
|
$
|
(18,612
|
)
|
$
|
9,900
|
|
|
Effective
income tax rate
|
(28.3
|
)%
|
(5.9
|
)%
|
29.2
|
%
|
|||
In 2009,
we had an income tax benefit of $15.8 million, which primarily relates to the
tax benefit on our domestic operations. Our effective tax benefit rate in 2009
was lower than the federal statutory rate, primarily due to non-deductible
expenses, offset in part by state tax benefits. The non-deductible expenses
primarily relate to stock-based compensation expense resulting from a difference
in tax deductions available to us based on the market price of our stock-based
compensation at the time of exercise as compared to our recorded stock-based
compensation expense. If we generated pre-tax income, this would cause our
effective income tax rate to be higher than our statutory federal
rate.
18
We assess
the recoverability of our deferred tax assets and, to the extent recoverability
does not satisfy the “more likely than not” recognition criteria under ASC 740,
Income Taxes, record a
valuation allowance against our deferred tax assets. We record valuation
allowances to reduce our deferred tax assets to an amount that is more likely
than not to be realized. We considered our recent operating results and
anticipated future taxable income in assessing the need for our valuation
allowance. The Company’s valuation allowance was reduced in 2009 by $3.6
million, which primarily consisted of a $5.3 million reduction related to our
uncertain tax positions due to the expiration of the statute of limitations,
partially offset by the valuation allowance recorded related to the deferred tax
assets acquired in the Nashua transaction of $1.2 million. There is a reasonable
possibility that within the next twelve months we may decrease our liability for
uncertain tax positions by approximately $10.3 million due to the expiration of
certain statute of limitations.
In 2008,
we had an income tax benefit of $18.6 million, which primarily relates to the
$42.1 million income tax benefit recorded in connection with the non-cash
goodwill impairment charges, offset in part by taxes on our domestic operations.
Our effective tax benefit rate in 2008 was lower than the federal statutory
rate, primarily due to non-deductible goodwill impairment charges, offset in
part by state tax benefits. The non-deductible goodwill impairment charges
accounted for a reduction to the effective tax benefit rate of approximately
30%.
In 2007,
we had income tax expense of $9.9 million, which primarily relates to taxes on
our domestic operations. Our effective tax rate in 2007 was lower
than the statutory rate primarily due to release of valuation allowances. See
the Critical Accounting Matters section of this MD&A.
Income (Loss) from Discontinued
Operations, net of taxes. Income from
discontinued operations for 2009 primarily relates to the reduction of our
liabilities for uncertain tax positions of $12.1 million, net of deferred tax
assets of $2.6 million, as a result of the expiration of certain statute of
limitations on uncertain tax positions related to the Supremex Income Fund,
which we refer to as the Fund.
Income
from discontinued operations for 2007 includes the $17.0 million gain on sale of
our remaining interest in the Fund, on March 13, 2007, net of taxes of $8.4
million, and equity income related to our retained interest in the Fund from
January 1, 2007 through March 13, 2007.
Segment
Operations
Our
Chief Executive Officer monitors the performance of the ongoing operations of
our two reportable segments. We assess performance based on net sales and
operating income.
Envelopes,
Forms and Labels
|
Years
Ended
|
|||||||||
|
January
2,
2010
|
January
3,
2009
|
December
29, 2007
|
|||||||
|
(in
thousands)
|
|||||||||
|
Segment
net
sales
|
$
|
819,399
|
$
|
916,145
|
$
|
897,722
|
|||
|
Segment
operating income
(loss)
|
$
|
77,200
|
$
|
(40,979
|
)
|
$
|
117,342
|
||
|
Operating
income (loss)
margin
|
9.4
|
%
|
(4.5
|
)%
|
13.1
|
%
|
|||
|
Items
included in segment operating income:
|
|||||||||
|
Restructuring
and impairment charges
|
$
|
17,405
|
$
|
174,178
|
$
|
11,350
|
|||
Net
Sales
Segment
net sales for our envelopes, forms and labels segment decreased $96.7 million,
or 10.6%, in 2009, as compared to 2008. This decrease was primarily due
to: (i) lower sales volume of $148.8 million, primarily due to the current
general economic conditions which has had a significant impact on our envelope
business, for which we have seen a shift from direct mail and customized
envelopes to generic transactional envelopes and lost sales in connection with
the closure of three envelope plants and one forms plant that were integrated
into our existing envelope operations, and (ii) lower pricing and product mix of
$21.2 million, primarily due to pricing pressures in the current envelope
marketplace and lower material costs. These decreases were partially offset by
$73.3 million of increased sales from the integration of Nashua into our
operations, as Nashua was not included in our results in 2008.
19
Segment
net sales for our envelopes, forms and labels segment increased $18.4 million,
or 2.1% in 2008, as compared to 2007. This increase was primarily due to: (i)
the $77.6 million of sales generated from the integration of Commercial Envelope
and Printegra into our operations in 2008, including the impact of sales changes
for work transitioned into these acquired operations from other legacy plants,
as Printegra and Commercial Envelope were not included in our results for a full
year in 2007, and (ii) higher sales of approximately $31.6 million, primarily
due to material price increases that have historically been passed onto our
customers, net of changes in product mix. This increase was offset in part by
lower sales volume of approximately $90.8 million, primarily due to general
economic conditions which have had a significant impact on our envelope, forms
and labels business and the closing of plants in connection with the integration
of Printegra and Commercial Envelope into our operations.
Segment
Operating Income
Segment
operating income for our envelopes, forms and labels segment, excluding the 2008
non-cash goodwill impairment charge of $168.4 million, decreased $50.3 million
or 39.4% in 2009, as compared to 2008. This decrease was primarily due to: (i)
lower gross margins of $41.3 million, primarily due to the current general
economic conditions, which has resulted in increased pricing pressures, lower
sales volume and product mix changes from high color direct mail envelopes to
transactional envelope products, partially offset by lower material costs and
increased gross margins from Nashua, as Nashua was not included in our results
for 2008, and (ii) increased restructuring and impairment charges, excluding the
2008 non-cash goodwill impairment charge of $168.4 million, of $11.7 million,
primarily due to the closure of three envelope plants and one forms plant. These
decreases were partially offset by lower selling, general and administrative
expenses and other expenses of $2.7 million, primarily due to our cost reduction
programs, lower commission expenses resulting from lower sales, offset in part
by increased selling, general and administrative expenses from Nashua, which was
not included in our results for 2008.
Segment
operating income for our envelopes, forms and labels segment decreased $158.3
million, or 134.9%, in 2008, as compared to 2007. This decrease was primarily
due to: (i) increased restructuring and impairment charges of $162.8 million,
primarily due to the $168.4 million goodwill impairment charge, (ii) higher
selling, general and administrative expenses of $3.2 million primarily due to
the acquisition of Commercial Envelope and Printegra, which were not included in
our results for a full year in 2007, offset in part by our cost reduction
programs, and (iii) higher amortization expense of $1.9 million primarily due to
the acquisition of Commercial Envelope and Printegra. These decreases were
partially offset by increased gross margins of $9.6 million primarily due to the
acquisition of Commercial Envelope and Printegra, which were not included in our
results for a full year in 2007, and our cost savings programs, offset in part
by higher material costs primarily due to material price increases and higher
distribution costs.
Commercial
Printing
|
Years
Ended
|
|||||||||
|
January
2,
2010
|
January
3,
2009
|
December
29, 2007
|
|||||||
|
(in
thousands)
|
|||||||||
|
Segment
net
sales
|
$
|
895,232
|
$
|
1,182,549
|
$
|
1,148,994
|
|||
|
Segment
operating income
(loss)
|
$
|
(6,397)
|
$
|
(136,828
|
)
|
$
|
55,085
|
||
|
Operating
income (loss)
margin
|
(0.7)
|
%
|
(11.6
|
)%
|
4.8
|
%
|
|||
|
Items
included in segment operating income:
|
|||||||||
|
Restructuring
and impairment charges
|
$
|
48,744
|
$
|
217,568
|
$
|
28,279
|
|||
Net
Sales
Segment net sales for our
commercial printing segment decreased $287.3 million, or 24.3%, in 2009, as
compared to 2008. This decrease was primarily due to the current general
economic conditions, which resulted in lower sales of: (i) $286.3 million
related to volume declines and lost sales from the closure of two commercial
printing plants in the first half of 2009 and (ii) $11.0 million resulting from
increased pricing pressures, changes in product mix and lower material costs.
These decreases were partially offset by increased sales of $10.0 million from
the integration of Rex into our operations, as Rex was not included in our
results for a full year in 2008.
Net sales
for our commercial printing segment increased $33.6 million, or 2.9%, in 2008,
as compared to 2007. This increase was primarily due to the $172.3 million of
sales generated from the integration of Rex, ColorGraphics and Cadmus into our
operations in 2008, including the impact of sales changes for work transitioned
into these acquired operations from other legacy plants, including two plants we
closed in 2007, as Rex was not included in our results in 2007 and Cadmus and
ColorGraphics were not included in our results for a full year in 2007. This
increase was partially offset by lower sales of approximately: (i) $41.7 million
resulting from other plant closures in 2007, and (ii) $97.0 million resulting
from pricing pressures, volume declines, and changes in product mix, primarily
due to the general economic conditions, and foreign currency fluctuations,
offset in part by higher sales due to material price increases.
20
Segment
Operating Income
Segment
operating income for our commercial printing segment, excluding the 2008
non-cash goodwill impairment charge of $204.4 million, decreased $74.0 million,
or 109.5%, in 2009, as compared to 2008. This decrease was primarily due to (i)
lower gross margins of $64.1 million, largely due to the current general
economic conditions, which has resulted in increased pricing pressures and
product mix changes from high color to more generic commercial print products,
partially offset by lower material costs and increased gross margins from Rex,
as Rex was not included in our results for a full year in 2008, and (ii)
increased restructuring and impairment charges of $35.6 million primarily due to
the closure of four commercial printing plants during 2009. These decreases were
partially offset by lower selling, general and administrative expenses of $25.7
million primarily due to our cost reduction programs and lower commission
expenses resulting from lower sales, partially offset by increased selling,
general and administrative expenses for Rex, as Rex was not included in our
results for the full year in 2008.
Segment
operating income for our commercial printing segment decreased $191.9 million,
or 348.4%, in 2008, as compared to 2007. This decrease was primarily due to: (i)
increased restructuring and impairment charges of $189.3 million, primarily due
to the $204.4 million goodwill impairment charge, (ii) higher selling, general
and administrative expenses of $1.3 million, primarily due to the acquisition of
Rex, ColorGraphics and Cadmus, for which Rex was not included in our results in
2007 and for which ColorGraphics and Cadmus were not included in our results for
a full year in 2007, offset in part by our cost savings programs, and (iii)
higher manufacturing costs due to material price increases and higher
distribution costs, offset in part by decreased gross margins of $4.7 million,
primarily due to the acquisition of Rex, ColorGraphics and Cadmus, as Rex was
not included in our results in 2007 and for which Cadmus and ColorGraphics were
not included in our results for a full year in 2007, and lower gross margins due
to plant closures. These decreases were offset in part by lower amortization
expense of $3.3 million.
Corporate Expenses. Corporate expenses include
the costs of running our corporate headquarters. Corporate expenses were lower
in 2009, as compared to 2008, primarily due to lower stock-based compensation
expense. Corporate expenses were higher in 2008, as compared to 2007, primarily
due to increased stock-based compensation, and the $6.7 million non-recurring
charge incurred for professional fees in connection with the internal review
conducted by our audit committee, offset in part by other lower net
costs.
Restructuring, Impairment and Other
Charges. In the
first quarter of 2009, we implemented the 2009 Plan, to reduce our operating
costs and realign our manufacturing platform in order to compete effectively
during the current economic downturn. Upon the acquisition of Nashua, we
developed and implemented our plan to integrate Nashua into our existing
operations, which we refer to as the Nashua Plan. In the fourth quarter of 2009,
such activities related to the Nashua Plan, included the closure and
consolidation of Nashua’s Vernon, California point-of-sale facility into our
existing Los Angeles, California envelope facility, elimination of duplicative
headcount and public company costs. As a
result of these two plans, in 2009, we implemented cost saving
initiatives throughout our business, including the closure of nine
manufacturing facilities and integrated them into existing operations and a
reduction in headcount of approximately 1,700. We are pursuing additional cost
savings opportunities in an effort to mitigate the impacts of the current
economic conditions and to ensure our cost structure is aligned with our
estimated net sales. We anticipate being substantially complete with the
implementation of these cost savings initiatives in the first quarter of
2010.
In 2008,
we continued our 2007 Plan and completed the integration of the 2007
Acquisitions into our operations. As a result of actions taken under this plan,
we closed seven manufacturing facilities and reduced headcount by approximately
1,200.
In the
fourth quarter 2007, we completed our 2005 Plan, which among other things,
included consolidating our purchasing activities and manufacturing platform with
the closure of two manufacturing facilities in 2007 that were integrated into
existing operations, reducing corporate and field human resources, streamlining
our information technology infrastructure and eliminating discretionary
spending.
As of
January 2, 2010, our total restructuring liability was $27.0 million, of which
$10.4 million is included in other current liabilities and $16.6 million, which
is expected to be paid through 2018, is included in other liabilities in our
consolidated balance sheet. We anticipate lower restructuring and impairment
charges in 2010.
2009. During 2009, in
connection with both the 2009 Plan and Nashua Plan, we incurred $68.0 million of
restructuring and impairment charges, which included $20.5 million of employee
separation costs, asset impairment charges, net of $15.3 million, equipment
moving expenses of $5.5 million, lease termination expenses of $5.6 million,
pension withdrawal expense of $13.4 million and building clean-up and other
expenses of $7.7 million.
21
2008. During 2008, we incurred
$399.1 million of restructuring, impairment and other charges, which included
non-cash goodwill impairment charges of $372.8 million, a $6.7 million
non-recurring charge for professional fees related to the internal review
initiated by our audit committee, $9.2 million of employee separation costs,
asset impairment charges, net of $2.3 million, equipment moving expenses of $1.5
million, lease termination expenses of $2.9 million, pension withdrawal income
of ($0.2) million and building clean-up and other expenses of $3.9
million.
During
the fourth quarter of 2008, our reporting units experienced declines in their
net sales, gross profit and operating income on a comparable basis with the
third quarter of 2008. Historically, the fourth quarter has been our strongest
quarter for net sales, gross profit and operating income for our reporting
units. These declines primarily resulted from reduced sales volume
across our business platform due to the effects of the current economic downturn
that exacerbated in late 2008, as our customers began reducing their print
related spend and pricing pressure that intensified from competitors who began
pricing print work at or below breakeven levels. As a result of these volume
declines, we lowered our estimates of future cash flows for our reporting
units.
2007. During 2007, we incurred
$40.1 million of restructuring and impairment charges, which included $10.2
million of employee separation costs, $12.0 million of asset impairment charges,
net, equipment moving expenses of $3.9 million, a pension withdrawal liability
of $2.1 million, lease termination expenses of $5.4 million, and building
clean-up and other expenses of $6.5 million.
Liquidity
and Capital Resources
Net Cash Provided by Operating
Activities. Net
cash provided by operating activities was $72.1 million in 2009, which was
primarily due to our net loss adjusted for non-cash items of $45.2 million and a
decrease in our working capital of $31.9 million. The decrease in our working
capital primarily resulted from a reduction in inventories due to the timing of
work performed for our customers and a decrease in receivables due to lower
sales volume and the timing of collections from and sales to our customers,
partially offset by a decrease in accounts payable due to lower sales volume and
the timing of payments to our vendors and accrued compensation liabilities
primarily due to lower employee headcount.
Cash
provided by operating activities is generally sufficient to meet our daily
disbursement needs. On days when our cash receipts exceed disbursements, we
historically reduced our Revolving Credit Facility balance or placed excess
funds in conservative, short-term investments until there is an opportunity to
pay down debt. On days when our cash disbursements exceed cash receipts, we used
our invested cash balance and/or our Revolving Credit Facility to fund the
difference. As a result, our daily Revolving Credit Facility loan balance
fluctuated depending on working capital needs. The 2010 Amendment along with the
issuance of our 8⅞% Notes resulted in the elimination of nearly all of our
Revolving Credit Facility balances and thereby substantially increasing our
liquidity position, which may cause us to modify what we do with accumulating
cash in the future. Regardless, at all times we believe we have sufficient
liquidity available to us to fund our cash needs.
Net cash
provided by operating activities was $209.8 million in 2008, which was primarily
due to our net loss adjusted for non-cash items of $141.3 million and a source
of cash from a decrease in our working capital of $74.1 million. The decrease in
our working capital primarily resulted from a decrease in receivables, primarily
due to the timing of collections from our customers and lower sales in the
fourth quarter of 2008 as compared to the same period in 2007.
Net Cash Used in Investing
Activities. Net cash used in investing
activities was $9.8 million in 2009, primarily from capital expenditures of
$25.2 million and cost of business acquisitions of $3.2 million for Nashua,
offset by $14.6 million of proceeds from the sale of property, plant and
equipment and $4.0 million of proceeds from the sale of an
investment.
Our debt
agreements limit capital expenditures to $45.0 million in 2010 plus any unused
permitted amounts from 2009. We estimate that we will spend approximately $25.0
million on capital expenditures in 2010, before considering proceeds from the
sale of property, plant and equipment. Our primary sources for our
capital expenditures are cash generated from
operations, proceeds from the sale of property, plant and equipment, and
financing capacity within our current debt arrangements. These
sources of funding are consistent with prior years’ funding of our capital
expenditures.
Net cash
used in investing activities was $82.1 million in 2008, primarily resulting from
capital expenditures of $49.2 million and the cost of business acquisitions of
$47.4 million, primarily for Rex, offset in part by $18.3 million of proceeds
from the sale of property, plant and equipment.
22
Net Cash Used in Financing
Activities. Net cash used in financing activities was $61.7 million in
2009, primarily resulting from: (i) aggregate payments of $30.6 million related
to the repurchase and retirement of $40.1 million, $7.1 million and $5.0 million
of our 8⅜% Notes, 7⅞% Notes and 10½% Notes, respectively, (ii) the
repayment of $24.6 million of Term Loans, primarily related to our March 2009
mandatory excess cash flow requirement under our Amended Credit Facilities,
(iii) the repayment of $12.2 million of other long-term debt, and (iv) the
payment of $7.3 million in fees and expenses for the 2009 Amendment, offset in
part by the proceeds of net borrowings of $14.5 million under our Revolving
Credit Facility.
Net cash
used in financing activities was $132.5 million in 2008, primarily resulting
from the conversion of the senior unsecured loan, net repayments under our
Revolving Credit Facility of $83.2 million, repurchases of $19.6 million of our
8⅜% Notes, payments of our other long-term debt of $18.9 million, repurchases of
$10.6 million of our 7⅞% Notes, repayments of our Term Loans of $7.2 million and
$5.3 million for the payment of debt issuance costs on the issuance of our 10½%
Notes, offset in part by the proceeds from the issuance of our $175.0 million
10½% Notes and $12.9 million of borrowings of other long-term debt.
Contractual Obligations and Other
Commitments. The
following table details our significant contractual obligations and other
commitments as of January 2, 2010 (in thousands):
|
Payments
Due
|
Long-Term
Debt(1)
|
Operating
Leases
|
Other
(2)
|
Total
|
|||||||||
|
2010
|
$
|
109,894
|
$
|
25,026
|
$
|
47,234
|
$
|
182,154
|
|||||
|
2011
|
93,339
|
20,253
|
24,072
|
137,664
|
|||||||||
|
2012
|
110,476
|
14,781
|
2,497
|
127,754
|
|||||||||
|
2013
|
1,021,314
|
11,327
|
1,754
|
1,034,395
|
|||||||||
|
2014
|
55,270
|
7,099
|
1,409
|
63,778
|
|||||||||
|
Thereafter
|
184,262
|
12,508
|
4,604
|
201,374
|
|||||||||
|
Total
|
$
|
1,574,555
|
$
|
90,994
|
$
|
81,570
|
$
|
1,747,119
|
|
(1)
|
Includes
$340.6 million of estimated interest expense over the term of our
long-term debt, with variable rate debt having an average interest rate of
approximately 4.7%.
|
|
(2)
|
Includes
pension and other postretirement contributions of $10.6 million,
anticipated worker’s compensation paid losses of $13.6 million,
restructuring related liabilities of $28.1 million, including interest
expense on lease terminations, income tax contingencies of $10.4 million,
derivative liabilities of $16.9 million, and purchase commitments for
equipment of $2.0 million. Excluded from the table are $3.5 million income
tax contingencies as we are unable to reasonably estimate the ultimate
amount payable or timing of
settlement.
|
Long-Term
Debt. Our total
outstanding long-term debt, including current maturities, was approximately $1.2
billion as of January 2, 2010, a decrease of $72.4 million from January 3, 2009.
This decrease was primarily due to: (i) the open market repurchase and
retirement of aggregate principal amounts of $52.2 million of our 7⅞% Notes, 8⅜%
Notes and 10½% Notes during 2009, and (ii) paying down our debt with cash flows
provided by operating activities. The open market purchases were made within
permitted restricted payment limits under our debt agreements at the time of
purchase; however, potential future open market purchases will be restricted for
some time as a result of the 2009 Amendment. As of January 2, 2010,
approximately 83% of our outstanding debt was subject to fixed interest rates.
See the remainder of this Long-Term Debt section that follows. As of March 1,
2010, we had $115.1 million borrowing availability under our Revolving Credit
Facility.
Amended
Credit Facilities and Debt Compliance
Our
Amended Credit Facilities, which are secured by a first priority lien on
substantially all of our assets, contain, prior to the 2010 Amendment, two
financial covenants that must be complied with: a maximum consolidated leverage
ratio, which we refer to as the Leverage Covenant, and a minimum consolidated
interest coverage ratio, which we refer to as the Interest Coverage
Covenant.
On April
24, 2009, we completed the 2009 Amendment which included, among other things,
modifications to the Leverage Covenant and the Interest Coverage
Covenant. The Leverage Covenant, with which we must be in pro forma
compliance
at all times, was increased to 6.25:1.00 through March 31, 2010, and then
proceeds to step down through the end of the term of the Amended Credit
Facilities. The Interest Coverage Covenant, with which we must be in pro forma
compliance on a quarterly basis, was reduced to 1.85:1.00 through December 31,
2009, and then proceeds to step up through the end of the term of the Amended
Credit Facilities. Additionally, the calculations of these two financial
covenants have been modified to permit the adding back of certain amounts. We
were in compliance with all debt agreement covenants as of January 2,
2010.
23
As
conditions to the 2009 Amendment, we agreed, among other things, to increase the
pricing on all outstanding Revolving Credit Facility balances and Term Loans to
include interest at the three-month London Interbank Offered Rate (LIBOR) plus a
spread ranging from 400 basis points to 450 basis points, depending on the
quarterly Leverage Covenant calculation then in effect. Previously, the
Revolving Credit Facility’s borrowing spread over LIBOR ranged from 175 basis
points to 200 basis points based upon the Leverage Covenant calculation, and the
borrowing spread over LIBOR for the Term Loans was 200 basis points. Further,
the 2009 Amendment: (i) reduced the Revolving Credit Facility from $200.0
million to $172.5 million; (ii) increased the unfunded commitment fee paid to
revolving credit lenders from 50 basis points to 75 basis points; (iii)
eliminated our ability to request a $300.0 million incremental term loan
facility; (iv) limited new senior unsecured debt and debt assumed from
acquisitions to $50.0 million while the Leverage Covenant calculation is above
4.50:1.00; (v) eliminated the restricted payments basket while the Leverage
Covenant calculation exceeds certain thresholds; (vi) required that certain
additional financial information be delivered; (vii) lowered the annual amount
that can be spent on capital expenditures to $30.0 million in 2009; and (viii)
increased certain mandatory prepayments. An amendment fee of 50 basis points was
paid to all consenting lenders who approved the 2009 Amendment.
8⅞%
Notes Issuance and 2010 Amendment
On
February 5, 2010, we issued our 8⅞% Notes that were sold
with registration rights to qualified institutional buyers in accordance with
Rule 144A under the Securities Act of 1933, and to certain non-U.S. persons in
accordance with Regulation S under the Securities Act of 1933. Net
proceeds after fees and expenses were used to pay down $300.0 million of Term
Loans and $88.0 million outstanding under the Revolving Credit Facility
simultaneously in conjunction with the 2010 Amendment.
The
8⅞% Notes were
issued pursuant to an indenture among us, certain subsidiary guarantors and
Wells Fargo Bank, National Association, as trustee, and an Intercreditor
Agreement among us, certain subsidiary grantors, Bank of America, N.A., as first
lien agent and control agent, and Wells Fargo Bank, National
Association, as second lien collateral agent. The 8⅞% Notes pay interest
semi-annually on February 1 and August 1, commencing August 1, 2010. The
8⅞% Notes have no
required principal payments prior to their maturity on February 1,
2018. The 8⅞% Notes are guaranteed on
a senior secured basis by us and substantially all of our domestic subsidiaries
with a second priority lien on substantially all of the assets that secure the
Amended Credit Facilities, and on a senior unsecured basis by substantially all
of our Canadian subsidiaries. As such the 8⅞% Notes rank pari passu
with all our senior debt and senior in right of payment to all of our
subordinated debt. We can redeem the 8⅞% Notes, in whole or in
part, on or after February 1, 2014, at redemption prices ranging from 100.0% to
approximately 104.4%, plus accrued and unpaid interest. In addition, at any time
prior to February 1, 2013, we may redeem up to 35% of the aggregate principal
amount of the notes originally issued with the net cash proceeds of certain
public equity offerings. We may also redeem up to 10% of the aggregate principal
amount of notes per twelve-month period before February 1, 2014 at a redemption
price of 103% of the principal amount, plus accrued and unpaid interest, and
redeem some or all of the notes before February 1, 2014 at a redemption price of
100% of the principal amount, plus accrued and unpaid interest, if any, to the
redemption date, plus a “make whole” premium. Each holder of the 8⅞% Notes has the right to
require us to repurchase such holder’s notes at a purchase price of 101% of the
principal amount thereof, plus accrued and unpaid interest thereon, upon the
occurrence of certain events specified in the indenture that constitute a change
in control. The 8⅞% Notes contain
covenants, representations, and warranties substantially similar to our 10½%
Notes, including a senior secured debt to consolidated cash flow liens
incurrence test.
The 2010
Amendment provided us, among other things, the ability to pay down at least
$300.0 million of Term Loans and a portion of the Revolving Credit Facility then
outstanding with net proceeds from the 8⅞% Notes. The Leverage
Covenant threshold within the Amended Credit Facilities was reset requiring us
to not exceed 6.50:1.00 at any time during fiscal year 2010, stepping down to
6.25:1.00 during fiscal year 2011 and then reducing to 5.50:1.00 for the
remainder of the term of the Amended Credit Facilities. The Interest
Coverage Covenant was also reset, primarily to allow for interest to be paid on
the 8⅞% Notes,
requiring us to not be less than 1.70:1.00 through the end of the third quarter
of 2010, then the threshold steps up thereafter starting at 1.85:1.00 in the
fourth quarter of 2010 reaching 2.25:1.00 in 2012. Lenders to the
Amended Credit Facilities also granted us the ability to increase the Revolving
Credit Facility or Terms Loans by $100.0 million subject to our compliance with
the terms and conditions contained within the Amended Credit Facilities.
Additionally, the fiscal year 2009 mandatory excess cash flow payment that was
to be made in March 2010 was waived given the substantial pay down of the Term
Loans with net proceeds from the 8⅞% Notes.
As
conditions to the 2010 Amendment, we agreed to reduce the Revolving Credit
Facility borrowing capacity, following a $15.0 million capacity increase, from
$187.5 million to $150.0 million when the 2010 Amendment became
effective. Further, the 2010 Amendment, among other things,: (i)
added a maximum first lien leverage ratio covenant that we must be in pro forma
compliance with at all times, which we refer to as the First Lien Leverage
Covenant, which ratio may not exceed 2.50:1.00 for the first half of fiscal year
2010 and must be below 2.25:1.00 thereafter to maturity of the Amended Credit
Facilities, and (ii) in calculating our financial covenants, modified
our ability to add back certain amounts during a given 12-month period and
certain cost savings resulting from acquisitions. No changes were
made to pricing on the Revolving Credit Facility or Terms Loans, while a 15
basis points fee on a post-amendment balance basis was paid to all consenting
lenders who approved the 2010 Amendment.
24
In
connection with the 2010 Amendment in the first quarter of 2010, we will incur a
loss on early extinguishment of debt of $3.5 million, of which $2.0 million
relates to the write-off of previously unamortized debt issuance costs and $1.5
million relates to fees paid to consenting lenders. In addition, we
will capitalize $2.1 million related to the 2010 Amendment, of which $1.5
million relates to amendment expenses and $0.6 million relates to fees paid to
consenting lenders, both of which will be amortized over the remaining life of
the Amended Credit Facilities. In connection with the issuance of the
8⅞% Notes, we will
capitalize $12.2 million related to the issuance of the 8⅞% Notes, of which $7.6
million relates to fees paid to lenders, $2.8 million relates to the original
issuance discount and $1.8 million relates to offering expenses, all of which
will be amortized over the eight year life of the 8⅞% Notes.
Except as
provided for in the 2009 Amendment and 2010 Amendment, all other provisions of
our Amended Credit Facilities remain in full force and effect, including our
failure to operate within the revised Leverage Covenant and Interest Coverage
Covenant and new First Lien Leverage Covenant ratio thresholds, in certain
circumstances, or failure to have effective internal controls would prevent us
from borrowing additional amounts and could result in a default under the
Amended Credit Facilities. Such default could cause the indebtedness outstanding
under the Amended Credit Facilities and, by reason of cross-acceleration or
cross-default provisions, all of our then outstanding notes and any other
indebtedness we may then have, to become immediately due and
payable.
As the
Amended Credit Facilities have senior secured and first priority lien position
in our capital structure and the most restrictive covenants, then provided we
are in compliance with the Amended Credit Facilities, we would, in most
circumstances, also be in compliance with the senior secured debt to
consolidated cash flow lien incurrence tests within our 8⅞% Notes and 10½% Notes
indentures and the fixed charge coverage lien incurrence tests within all of our
outstanding notes indentures.
Letters
of Credit
On
January 2, 2010, we had outstanding letters of credit of approximately $21.5
million and a de minimis amount of surety bonds related to performance and
payment guarantees. Based on our experience with these arrangements, we do not
believe that any obligations that may arise will be significant.
Credit
Ratings
Our
current credit ratings are as follows:
|
Rating Agency
|
Corporate
Rating
|
Amended
Credit
Facilities
|
8⅞%
Notes
|
10½%
Notes
|
7⅞%
Notes
|
8⅜%
Notes
|
Outlook
|
Last Update
|
||||||||||
|
Moody’s
|
B2
|
Ba2
|
B2
|
B3
|
Caa1
|
Caa1
|
Negative
|
January
2010
|
||||||||||
|
Standard
& Poor’s
|
B+
|
BB
|
B
|
B-
|
B-
|
B-
|
Negative
|
January
2010
|
In March
2009, Standard & Poor's Ratings Services, which we refer to as Standard
& Poor’s, lowered our Corporate Rating from BB- to B+ and all of our debt
credit ratings citing the negative impact of the current general economic
environment and its anticipated impact on our results of
operations. In May 2009, Moody’s Investors Services, which we refer
to as Moody’s, lowered our Corporate Rating to B2 from B1 along with all of our
debt credit ratings citing a combination of poor industry fundamentals, the
expectation that an economic recovery will be quite slow and our leverage level.
In January 2010, Moody’s and Standard & Poor’s affirmed our Corporate Rating
and the ratings on our 10½% Notes, 7⅞% Notes and 8⅜% Notes, while raising the
rating on our Amended Credit Facilities from Ba3 to Ba2 and BB- to BB,
respectively, in conjunction with the 2010 Amendment and 8⅞% Notes offering, which
was rated B2 and B, respectively.
The terms
of our existing debt do not have any rating triggers that impact our funding
availability or influence our daily operations, including planned capital
expenditures. We do not believe that our current ratings will unduly influence
our ability to raise additional capital if and/or when needed. Some of our
constituents closely track rating agency actions and would note any raising or
lowering of our credit ratings; however, we believe that along with reviewing
our credit ratings, additional quantitative and qualitative analyses must be
performed to accurately judge our financial condition.
We expect
that our internally generated cash flows and financing available under our
Revolving Credit Facility will be sufficient to fund our working capital needs
through 2010; however, this cannot be assured.
25
Off-Balance Sheet
Arrangements. It is not our business practice to enter into off-balance
sheet arrangements. Accordingly, as of January 2, 2010 and January 3, 2009, we
do not have any off-balance sheet arrangements.
Guarantees. In connection with the
disposition of certain operations, we have indemnified the purchasers for
certain contingencies as of the date of disposition. We have accrued the
estimated probable cost of these contingencies.
Critical
Accounting Matters
The
preparation of our consolidated financial statements in conformity with
accounting principles generally accepted in the United States of America
requires us to make estimates and assumptions that affect the reported amounts
of assets and liabilities and the disclosure of contingent assets and
liabilities at the date of the consolidated financial statements and the
reported amount of revenues and expenses during the reporting period. We
evaluate these estimates and assumptions on an ongoing basis based on historical
experience and on various other factors which we believe are reasonable under
the circumstances. Actual results could differ from estimates.
We
believe that the following represent our more critical estimates and assumptions
used in the preparation of our consolidated financial statements:
Allowance for Losses on Accounts
Receivable. We
maintain a valuation allowance based on the expected collectability of our
accounts receivable, which requires a considerable amount of judgment in
assessing the current creditworthiness of customers and related aging of past
due balances. As of January 2, 2010 and January 3, 2009, the allowance provided
for potentially uncollectible accounts receivable was $7.6 million and $6.0
million, respectively. Charges for bad debts recorded to the statement of
operations were $5.4 million in 2009, $4.7 million in 2008 and $5.4 million in
2007. We cannot guarantee that our current credit losses will be consistent with
those in the past. These estimates may prove to be inaccurate, in which case we
may have overstated or understated the allowance for losses required for
uncollectible accounts receivable.
Inventory Valuation.
Inventories are stated at the lower of cost or market, with cost
determined on a first-in, first-out or average cost basis. Cost includes
materials, labor and overhead related to the purchase and production of
inventories. If there were to be a significant decrease in demand for our
products, we could be required to reduce our inventory balances
accordingly.
Provision for Impairment of
Long-Lived Assets. We evaluate long-lived
assets, including property, plant and equipment and intangible assets other than
goodwill and indefinite lived intangible assets, for impairment whenever events
or changes in circumstances indicate that the carrying amounts of specific
assets or group of assets may not be recoverable. When an evaluation is
required, we estimate the future undiscounted cash flows associated with the
specific asset or group of assets. If the cost of the asset or group of assets
cannot be recovered by these undiscounted cash flows, we would assess the fair
value of the asset or asset group and if necessary, an impairment charge would
be recorded. Our estimates of future cash flows are based on our experience and
internal business plans. Our internal business plans require judgments regarding
future economic conditions, product demand and pricing. During 2009, 2008 and
2007, in connection with our restructuring and integration programs, we recorded
impairment charges, net on long-lived assets of $15.3 million, $2.3 million and
$12.0 million, respectively. Although we believe our estimates are appropriate,
significant differences in the actual performance of an asset or group of assets
may materially affect our evaluation of the recoverability of the asset values
currently recorded. Additional impairment charges may be necessary in future
years.
Provision for Impairment of Goodwill
and Indefinite Lived Intangible Assets. We evaluate the carrying
value of our goodwill and indefinite lived intangible assets annually at the
beginning of December and whenever events or circumstances make it more likely
than not that an impairment may have occurred. Accounting Standards Codification
(“ASC”) 350, Goodwill and
Other Intangible Assets, prescribes a two-step method for determining
goodwill impairment. In the first step, we compare the estimated fair value of
each reporting unit to its carrying amount, including goodwill. If the carrying
amount of a reporting unit exceeds the estimated fair value, step two is
completed to determine the amount of the impairment loss. Step two requires the
allocation of the estimated fair value of the reporting unit to the assets,
including any unrecognized intangible assets, and liabilities in a hypothetical
purchase price allocation. Any remaining unallocated fair value represents the
implied fair value of goodwill, which is compared to the corresponding carrying
value of goodwill to compute the goodwill impairment amount. In 2009 and 2007,
we did not record any goodwill impairment charges. In 2008, we recorded non-cash
goodwill impairment charges of $204.4 million and $168.4 million related to our
commercial print and envelope reporting units, respectively.
26
As part
of our impairment analysis for each reporting unit, we estimate the fair value
of each unit, primarily using the income approach. The income approach requires
management to estimate a number of factors for each reporting unit, including
projected future operating results, economic projections, anticipated future
cash flows, discount rates, and the allocation of shared service or corporate
items. The market approach was used as a test of reasonableness of the
conclusions reached in the income approach. The market approach estimates fair
value using comparable marketplace fair value data from within a comparable
industry grouping.
The
determination of the fair value of the reporting units and the allocation of
that value to individual assets and liabilities within those reporting units
requires management to make significant estimates and assumptions. These
estimates and assumptions primarily include, but are not limited to: the
selection of appropriate peer group companies; control premiums appropriate for
acquisitions in the industries in which we compete; the discount rate; terminal
growth rates; and forecasts of net sales, operating income, depreciation and
amortization and capital expenditures. The allocation requires several analyses
to determine the fair value of assets and liabilities including, among others,
trade names, customer relationships, and property, plant and equipment. Although
we believe our estimates of fair value are reasonable, actual financial results
could differ from those estimates due to the inherent uncertainty involved in
making such estimates. Changes in assumptions concerning future financial
results or other underlying assumptions could have a significant impact on
either the fair value of the reporting units, the amount of the goodwill
impairment charge, or both. We also compared the sum of the estimated fair
values of the reporting units to our total enterprise value as implied by the
market value of our equity securities. This comparison indicated that, in total,
our assumptions and estimates were not unreasonable. However, future declines in
the overall market value of our equity securities may indicate that the fair
value of one or more reporting units has declined below their carrying
value.
One
measure of the sensitivity of the amount of goodwill impairment charges to key
assumptions is the amount by which each reporting unit had fair value in excess
of its carrying amount or had carrying amount in excess of fair value for the
first step of the goodwill impairment test. In 2009, each reporting unit had
fair value in excess of carrying value with fair value exceeding carrying value
by at least 30%. Generally, changes in estimates of expected future cash flows
would have a similar effect on the estimated fair value of the reporting unit.
That is, a 1% change in estimated future cash flows would decrease the estimated
fair value of the reporting unit by approximately 1%. Of the other key
assumptions that impact the estimated fair values, most reporting units have the
greatest sensitivity to changes in the estimated discount rate. In 2009, the
discount rate for each reporting unit was estimated to be 10.0%. A 50 basis
point increase in our estimated discount rates would not have resulted in any
additional reporting units failing step one.
Determining
whether an impairment of indefinite lived intangible assets has occurred
requires an analysis of the fair value of each of the related tradenames. We
determined that there was no impairment of our indefinite lived intangible
assets; however, if our estimates of the valuations of our tradenames prove to
be inaccurate, an impairment charge could be necessary in future
periods.
Our
annual impairment analysis for trade names utilizes a relief-from-royalty method
in which the hypothetical benefits of owning each respective trade name are
valued by discounting hypothetical royalty revenue over projected revenues
covered by the trade names. We utilized royalty rates of 1.5% to 3.5% for the
use of the subject trade names based on comparable market rates, the
profitability of the product employing the trade name, and qualitative factors,
such as the strength of the name and years in usage. We utilized a discount rate
of 11%, which was based on the weighted average cost of capital for the
respective business plus a premium to account for the relative risks of the
subject trade name.
In order
to evaluate the sensitivity of the fair value calculations for all of our
indefinite-lived trade names, we applied hypothetical 5%, 10% and 15% decreases
to the estimated fair value of our trade names. Such hypothetical decreases in
fair value could be due to changes in discount rates and/or assumed royalty
rates. These hypothetical 5%, 10% and 15% decreases in estimated fair value
would not have resulted in an impairment of any of our identifiable
indefinite-lived trade names.
Self-Insurance Reserves. We are self-insured for the
majority of our workers’ compensation costs and health insurance costs, subject
to specific retention levels. We rely on claims experience and the advice of
consulting actuaries and administrators in determining an adequate liability for
self-insurance claims. Our self-insurance workers’ compensation liability is
estimated based on reserves for claims that are established by a third-party
administrator. The estimate of these reserves is adjusted from time to time to
reflect the estimated future development of the claims. Our liability for
workers’ compensation claims is the estimated total cost of the claims on a
fully-developed and discounted basis that considers anticipated payment
patterns. As of January 2, 2010 and January 3, 2009, the undiscounted liability
was $13.7 million and $12.4 million, respectively, and the discounted liability
was $11.8 million and $10.5 million, respectively, using a 4% discount rate.
Workers’ compensation expense incurred in 2009, 2008 and 2007 was $3.3 million,
$3.2 million and $4.1 million, respectively, and was based on actuarial
estimates.
Our
self-insured healthcare liability represents our estimate of claims that have
been incurred but not reported as of January 2, 2010 and January 3, 2009. We
rely on claims experience and the advice of consulting actuaries to determine an
adequate liability for self-insured plans. This liability was $5.7 million and
$5.7 million as of January 2, 2010 and January 3, 2009, respectively, and was
estimated based on an analysis of actuarial completion factors that estimated
incurred but unreported
liabilities derived from the historical claims experience. The estimate of our
liability for employee healthcare represents between 45 and 50 days of
unreported claims.
While we
believe that the estimates of our self-insurance liabilities are reasonable,
significant differences in our experience or a significant change in any of our
assumptions could materially affect the amount of workers’ compensation and
healthcare expenses we have recorded.
27
Revenue Recognition. We recognize revenue when
persuasive evidence of an arrangement exists, product delivery has occurred,
pricing is fixed or determinable, and collection is reasonably assured. Since a
significant portion of our products are customer specific, it is common for our
customers to inspect the quality of the product at our facilities prior to
shipment. Products shipped are not subject to contractual right of return
provisions.
We have
rebate agreements with certain customers. These rebates are recorded as
reductions of sales and are accrued using sales data and rebate percentages
specific to each customer agreement. We record sales net of applicable sales tax
and freight costs that are included in the price of the product are included in
net sales while the costs of delivering finished goods to customers are recorded
as freight costs and included in cost of sales.
Accounting for Income
Taxes. We are
required to estimate our income taxes in each jurisdiction in which we operate
which primarily includes the U.S., Canada and India. This process involves
estimating our actual current tax expense, together with assessing temporary
differences resulting from differing treatment of items for tax and financial
reporting purposes. The tax effects of these temporary differences are recorded
as deferred tax assets or deferred tax liabilities. Deferred tax assets
generally represent items that can be used as a tax deduction or credit in our
tax return in future years for which we have already recorded an expense in our
consolidated financial statements. Deferred tax liabilities generally represent
tax items that have been deducted for tax purposes, but have not yet been
recorded as an expense in our consolidated financial statements. As of January
2, 2010 and January 3, 2009, we had net deferred tax assets of $18.0 million and
$3.9 million, respectively, from our U.S. operations. The change in U.S. net
deferred taxes is primarily due to an increase in our tax loss carryforward that
can be used to offset taxable income in future years partially offset by an
increase in deferred tax liability related to our intangible assets acquired in
the Nashua acquisition. As of January 2, 2010 and January 3, 2009, we had
foreign net deferred tax liabilities of $1.2 million and $2.0 million,
respectively.
We assess
the recoverability of our deferred tax assets and, to the extent recoverability
does not satisfy the “more likely than not” recognition criteria under ASC 740,
record a valuation allowance against the deferred tax assets. We record
valuation allowances to reduce our deferred tax assets to an amount that is more
likely than not to be realized. We considered our recent operating results and
anticipated future taxable income in assessing the need for our valuation
allowance. As a result, in the fourth quarter of 2009 and 2008, we adjusted our
valuation allowance by approximately $12.5 million, primarily due to the release
of valuation allowance against goodwill in connection with the acquisition of
Nashua, and approximately $1.3 million, respectively, to reflect the realization
of deferred tax assets. The
remaining portion of our valuation allowance will be maintained until there is
sufficient positive evidence to conclude that it is more likely than not that
our remaining deferred tax assets will be realized. When sufficient positive
evidence occurs, our income tax expense will be reduced to the extent we
decrease the amount of our valuation allowance. The increase or reversal of all
or a portion of our tax valuation allowance could have a significant negative or
positive impact on future earnings.
We
recognize a tax position in our consolidated financial statements when it is
more likely than not that the position would be sustained upon examination by
tax authorities. This recognized tax position is then measured at the largest
amount of benefit that is greater than fifty percent likely of being realized
upon ultimate settlement. Although we believe that our estimates are reasonable,
the final outcome of uncertain tax positions may be materially different from
that which is reflected in our consolidated financial statements. We adjust such
reserves upon changes in circumstances that would cause a change to the estimate
of the ultimate liability, upon effective settlement or upon the expiration of
the statute of limitations, in the period in which such event occurs. During
2009, we reduced our liabilities for uncertain tax positions by $12.1 million as
a result of the expiration of certain statute of limitations. There is a
reasonable possibility that within the next twelve months we may decrease our
liability for uncertain tax positions by approximately $10.3 million due to the
expiration of certain statute of limitations.
Pension and Other Postretirement
Benefit Plans. We record annual amounts relating to our pension and other
postretirement benefit plans based on calculations which include various
actuarial assumptions including discount rates, anticipated rates of return,
compensation increases and current mortality rates. We review our actuarial
assumptions on an annual basis and make modifications to the assumptions based
on current rates and trends when it is appropriate to do so. The effects of
modifications are recognized immediately on our consolidated balance sheet, but
are generally amortized into our consolidated statement of operations over
future periods, with the deferred amount recorded in accumulated other
comprehensive loss. We believe that the assumptions utilized in recording our
obligations under our plans are reasonable based on our experience, market
conditions and input from our actuaries and investment advisors. We determine
our assumption for the discount rate to be used for purposes of computing annual
service and interest costs based on the Citigroup Pension Liability Index as of
our respective year end dates. The weighted-average discount rates for pension
and other postretirement benefits at January 2, 2010 and January 3, 2009, were
5.75% and 6.25%, respectively. A one percentage point decrease in the discount
rates at January 2, 2010 would increase the pension and other postretirement
plans’ projected benefit obligation by approximately $35.4 million. A one
percentage point increase in the discount rates at January 2, 2010 would
decrease the pension and other postretirement plans’ projected benefit
obligation by approximately $29.2 million.
Our
investment objective is to maximize the long-term return on the pension plan
assets within prudent levels of risk. Investments are primarily diversified with
a blend of equity securities, fixed income securities and alternative
investments. Equity investments are diversified by including U.S. and non-U.S.
stocks, growth stocks, value stocks and stocks of large and small companies.
Fixed income securities are primarily U.S. governmental and corporate bonds,
including mutual funds. Alternative investments are primarily private equity
hedge funds and hedge fund-of-funds. We consult with our financial advisors on a
regular basis regarding our investment objectives and asset
performance.
28
New
Accounting Pronouncements
We are
required to adopt certain new accounting pronouncements. See Note 1 to our
consolidated financial statements included in Item 8 of this Annual Report on
Form 10-K.
Commitments
and Contingencies
Our
business and operations are subject to a number of significant risks, the most
of which are summarized in Item 1A-Risk Factors and in Note 13 to our
consolidated financial statements.
We are
exposed to market risks such as changes in interest and foreign currency
exchange rates, which may adversely affect results of operations and financial
position. Risks from interest rate fluctuations and changes in foreign currency
exchange rates are managed through normal operating and financing activities. We
do not utilize derivatives for speculative purposes.
From time
to time, we enter into interest rate swap agreements to hedge interest rate
exposure of notional amounts of our floating rate debt. As of January
2, 2010 and January 3, 2009, we had $500.0 million and $595.0 million,
respectively, of such interest rate swaps. On June 22, 2009, $220.0 million
notional amount interest rate swap agreements matured and were partially
replaced by $125.0 million of forward-starting interest rate swaps that went
effective on the same date as the maturing swap agreements. Our hedges of
interest rate risk were designated and documented at inception as cash flow
hedges and are evaluated for effectiveness at least quarterly.
In
conjunction with the 2010 Amendment and issuance of the 8⅞% Notes in the first
quarter of 2010, we de-designated $125.0 million of interest rate swap
agreements previously used to hedge interest rate exposure on notional floating
rate debt, of which $75.0 million are to mature in the second quarter of 2011
and $50.0 million are to mature in March 2010. We did not terminate these
interest rate swap agreements; however we may terminate them at any time prior
to each respective scheduled maturity date. Any ineffectiveness, as a result of
these de-designations, will be marked-to-market through interest expense, net in
the consolidated statement of operations. The fair value of these
de-designated swaps currently recorded in accumulated other comprehensive loss
in the consolidated balance sheet will be amortized to interest expense, net in
the consolidated statement of operations over the remaining life of each
respective interest rate swap agreement.
Exposure
to market risk from changes in interest rates relates primarily to our variable
rate debt obligations. The interest on this debt is primarily LIBOR plus a
margin. As of January 2, 2010, we had variable rate debt outstanding of $212.6
million, after considering our interest rate swaps. A 1% increase in LIBOR on
debt outstanding subject to variable interest rates would increase our annual
interest expense by approximately $2.1 million.
We have
foreign operations, primarily in Canada, and thus are exposed to market risk for
changes in foreign currency exchange rates. For the year ended January 2, 2010,
a uniform 10% strengthening of the U.S. dollar relative to the local currency of
our foreign operations would have resulted in a decrease in sales and operating
income of approximately $7.9 million and $1.1 million, respectively. The effects
of foreign currency exchange rates on future results would also be impacted by
changes in sales levels or local currency prices.
29
Report
of Independent Registered Public Accounting Firm
Board of
Directors and Stockholders
Cenveo,
Inc.
We have
audited the accompanying consolidated balance sheets of Cenveo, Inc. and
Subsidiaries (the “Company”) as of January 2, 2010 and January 3, 2009, and the
related consolidated statements of operations, shareholders’ (deficit) equity,
and cash flows for the fiscal years then ended. Our audits of the
basic financial statements included the financial statement schedule listed in
the index appearing under Item
15 (a)(2). These financial statements and financial statement
schedule are the responsibility of the Company's management. Our responsibility is
to express an opinion on these financial statements and financial statement
schedule based on our audits.
We
conducted our audits in accordance with the standards of the Public Company
Accounting Oversight Board (United States). Those standards require that we plan
and perform the audit to obtain reasonable assurance about whether the
consolidated financial statements are free of material misstatement. An audit
includes examining, on a test basis, evidence supporting the amounts and
disclosures in the consolidated financial statements. An audit also includes
assessing the accounting principles used and significant estimates made by
management, as well as evaluating the overall financial statement presentation.
We believe that our audits provide a reasonable basis for our
opinion.
In our
opinion, the consolidated financial statements referred to above present fairly,
in all material respects, the financial position of Cenveo, Inc. and
Subsidiaries as of January 2, 2010 and January 3, 2009, and the results of their
operations and their cash flows for the fiscal years then ended, in conformity
with accounting principles generally accepted in the United States of America.
Also in our opinion, the related financial statement schedule, when considered
in relation to the basic financial statements taken as a whole, presents fairly,
in all material respects, the information set forth therein.
We have
also audited, in accordance with the standards of the Public Company Accounting
Oversight Board (United States), Cenveo, Inc. and Subsidiaries’ internal control
over financial reporting as of January 2, 2010, based on criteria established in
Internal Control —
Integrated Framework issued by the Committee of Sponsoring Organizations
of the Treadway Commission (COSO) and our report dated March 3, 2010 expressed
an unqualified opinion thereon.
/s/
GRANT THORNTON LLP
Melville,
New York
March 3,
2010
30
Report
of Independent Registered Public Accounting Firm
To the
Board of Directors and Stockholders of Cenveo, Inc.
Stamford,
Connecticut:
We have
audited the accompanying consolidated statements of operations, changes in
stockholder's equity, and cash flows of Cenveo, Inc. and subsidiaries (the
"Company") for the year ended December 29, 2007. Our audit also included the
financial statement schedule on page S-II. These financial statements and
the financial statement schedule are the responsibility of the Company’s
management. Our responsibility is to express an opinion on the financial
statements and the financial statement schedule based on our audit.
We
conducted our audit in accordance with the standards of the Public Company
Accounting Oversight Board (United States). Those standards require that
we plan and perform the audit to obtain reasonable assurance about whether the
financial statements are free of material misstatement. An audit includes
examining, on a test basis, evidence supporting the amounts and disclosures in
the financial statements. An audit also includes assessing the accounting
principles used and significant estimates made by management, as well as
evaluating the overall financial statement presentation. We believe that
our audit provides a reasonable basis for our opinion.
In our
opinion, such consolidated financial statements present fairly, in all material
respects, the results of Cenveo, Inc. and subsidiaries operations and cash flows
for the year ended December 29, 2007 in conformity with accounting principles
generally accepted in the United States of America. Also, in our opinion, such
financial statement schedules of Cenveo, Inc. and subsidiaries, when considered
in relation to the basic consolidated financial statements taken as a whole,
present fairly, in all material respects, the information set forth
therein.
/s/
DELOITTE & TOUCHE LLP
Stamford,
Connecticut
March 28,
2008
31
CENVEO,
INC. AND SUBSIDIARIES
CONSOLIDATED
BALANCE SHEETS
(in
thousands, except par values)
|
January
2,
|
January
3,
|
||||||
|
2010
|
2009
|
||||||
|
Assets
|
|||||||
|
Current
assets:
|
|||||||
|
Cash
and cash equivalents
|
$
|
10,796
|
$
|
10,444
|
|||
|
Accounts
receivable, net
|
268,563
|
270,145
|
|||||
|
Inventories
|
145,228
|
159,569
|
|||||
|
Prepaid
and other current assets
|
64,843
|
74,890
|
|||||
|
Total
current assets
|
489,430
|
515,048
|
|||||
|
Property,
plant and equipment, net
|
387,879
|
420,457
|
|||||
|
Goodwill
|
319,756
|
311,183
|
|||||
|
Other
intangible assets, net
|
295,418
|
276,944
|
|||||
|
Other
assets, net
|
33,290
|
28,482
|
|||||
|
Total
assets
|
$
|
1,525,773
|
$
|
1,552,114
|
|||
|
Liabilities
and Shareholders’ Deficit
|
|||||||
|
Current
liabilities:
|
|||||||
|
Current
maturities of long-term debt
|
$
|
15,057
|
$
|
24,314
|
|||
|
Accounts
payable
|
183,940
|
174,435
|
|||||
|
Accrued
compensation and related liabilities
|
29,841
|
37,319
|
|||||
|
Other
current liabilities
|
98,079
|
88,870
|
|||||
|
Total
current liabilities
|
326,917
|
324,938
|
|||||
|
Long-term
debt
|
1,218,860
|
1,282,041
|
|||||
|
Deferred
income taxes
|
5,004
|
26,772
|
|||||
|
Other
liabilities
|
151,502
|
139,318
|
|||||
|
Commitments
and contingencies
|
|||||||
|
Shareholders’
deficit:
|
|||||||
|
Preferred
stock, $0.01 par value; 25 shares authorized, no
shares issued
|
—
|
—
|
|||||
|
Common
stock, $0.01 par value; 100,000 shares authorized, 62,033
and 54,245 shares issued and outstanding
as of January
2, 2010 and January 3, 2009, respectively
|
620
|
542
|
|||||
|
Paid-in
capital
|
331,051
|
271,821
|
|||||
|
Retained
deficit
|
(477,905
|
)
|
(446,966
|
)
|
|||
|
Accumulated
other comprehensive loss
|
(30,276
|
)
|
(46,352
|
)
|
|||
|
Total
shareholders’ deficit
|
(176,510
|
)
|
(220,955
|
)
|
|||
|
Total
liabilities and shareholders’ deficit
|
$
|
1,525,773
|
$
|
1,552,114
|
|||
See notes
to consolidated financial statements.
32
CENVEO,
INC. AND SUBSIDIARIES
CONSOLIDATED
STATEMENTS OF OPERATIONS
(in
thousands, except per share data)
|
Years
Ended
|
||||||||||
|
January
2,
|
January
3,
|
December
29,
|
||||||||
|
2010
|
2009
|
2007
|
||||||||
|
Net
sales
|
$
|
1,714,631
|
$
|
2,098,694
|
$
|
2,046,716
|
||||
|
Cost
of sales
|
1,394,778
|
1,671,185
|
1,628,706
|
|||||||
|
Selling,
general and administrative expenses
|
209,578
|
242,981
|
229,961
|
|||||||
|
Amortization
of intangible assets
|
10,053
|
9,008
|
10,413
|
|||||||
|
Restructuring,
impairment and other charges
|
68,034
|
399,066
|
40,086
|
|||||||
|
Operating
income (loss)
|
32,188
|
(223,546
|
)
|
137,550
|
||||||
|
Gain
on sale of non-strategic businesses
|
—
|
—
|
(189
|
)
|
||||||
|
Interest
expense, net
|
106,063
|
107,321
|
91,467
|
|||||||
|
(Gain)
loss on early extinguishment of debt
|
(16,917
|
)
|
(14,642
|
)
|
9,256
|
|||||
|
Other
(income) expense, net
|
(1,368
|
)
|
(637
|
)
|
3,131
|
|||||
|
Income
(loss) from continuing operations before income taxes
|
(55,590
|
)
|
(315,588
|
)
|
33,885
|
|||||
|
Income
tax expense (benefit)
|
(15,753
|
)
|
(18,612
|
)
|
9,900
|
|||||
|
Income
(loss) from continuing operations
|
(39,837
|
)
|
(296,976
|
)
|
23,985
|
|||||
|
Income
(loss) from discontinued operations, net of taxes
|
8,898
|
(1,051
|
)
|
16,796
|
||||||
|
Net
income (loss)
|
$
|
(30,939
|
)
|
$
|
(298,027
|
)
|
$
|
40,781
|
||
|
Income
(loss) per share—basic:
Continuing
operations
|
$
|
(0.70
|
)
|
$
|
(5.51
|
)
|
$
|
0.45
|
||
|
Discontinued
operations
|
0.16
|
(0.02
|
)
|
0.31
|
||||||
|
Net
income (loss)
|
$
|
(0.54
|
)
|
$
|
(5.53
|
)
|
$
|
0.76
|
||
|
Income
(loss) per share—diluted:
Continuing
operations
|
$
|
(0.70
|
)
|
$
|
(5.51
|
)
|
$
|
0.44
|
||
|
Discontinued
operations
|
0.16
|
(0.02
|
)
|
0.31
|
||||||
|
Net
income (loss)
|
$
|
(0.54
|
)
|
$
|
(5.53
|
)
|
$
|
0.75
|
||
|
Weighted
average shares:
|
||||||||||
|
Basic
|
56,787
|
53,904
|
53,584
|
|||||||
|
Diluted
|
56,787
|
53,904
|
54,645
|
|||||||
See notes
to consolidated financial statements.
33
CENVEO,
INC. AND SUBSIDIARIES
CONSOLIDATED
STATEMENTS OF CASH FLOWS
(in
thousands)
|
Years
Ended
|
|||||||||
|
January
2,
|
January
3,
|
December
29,
|
|||||||
|
2010
|
2009
|
2007
|
|||||||
|
Cash
flows from operating activities:
|
|||||||||
|
Net
income (loss)
|
$
|
(30,939
|
)
|
$
|
(298,027
|
)
|
$
|
40,781
|
|
|
Adjustments
to reconcile net income (loss) to net cash provided
by operating activities:
|
|||||||||
|
Gain
on sale of discontinued operations, net of taxes
|
—
|
—
|
(17,007
|
)
|
|||||
|
Loss
(income) from discontinued operations, net of taxes
|
(8,898
|
)
|
1,051
|
211
|
|||||
|
Depreciation
|
56,350
|
65,001
|
55,095
|
||||||
|
Amortization
of other intangible assets
|
10,053
|
9,008
|
10,413
|
||||||
|
Non-cash
interest expense, net
|
2,304
|
1,773
|
1,410
|
||||||
|
Deferred
income taxes
|
(17,573
|
)
|
(24,287
|
)
|
8,763
|
||||
|
Non-cash
restructuring, impairment and other charges, net
|
32,204
|
378,688
|
19,729
|
||||||
|
(Gain)
loss on early extinguishment of debt
|
(16,917
|
)
|
(14,642
|
)
|
9,256
|
||||
|
Provisions
for bad debts
|
5,428
|
4,660
|
5,363
|
||||||
|
Provisions
for inventory obsolescence
|
3,895
|
902
|
2,851
|
||||||
|
Stock-based
compensation provision
|
14,274
|
18,140
|
10,280
|
||||||
|
(Gain)
loss on disposal of assets
|
(5,006
|
)
|
(4,364
|
)
|
(369
|
)
|
|||
|
(Gain)
loss on sale of non-strategic businesses
|
—
|
—
|
(189
|
)
|
|||||
|
Other
non-cash charges, net
|
—
|
3,350
|
—
|
||||||
|
Changes
in operating assets and liabilities, excluding the effects
of acquired businesses:
|
|||||||||
|
Accounts
receivable
|
21,620
|
70,376
|
(6,086
|
)
|
|||||
|
Inventories
|
33,075
|
5,198
|
1,193
|
||||||
|
Accounts
payable and accrued compensation and related liabilities
|
(19,672
|
)
|
(2,928
|
)
|
(9,101
|
)
|
|||
|
Other
working capital changes
|
(3,110
|
)
|
1,454
|
(36,580
|
)
|
||||
|
Other,
net
|
(5,036
|
)
|
(5,505
|
)
|
(9,805
|
)
|
|||
|
Net
cash provided by continuing operating activities
|
72,052
|
209,848
|
86,208
|
||||||
|
Net
cash provided by discontinued operating activities
|
—
|
—
|
2,198
|
||||||
|
Net
cash provided by operating activities
|
72,052
|
209,848
|
88,406
|
||||||
|
Cash
flows from investing activities:
|
|||||||||
|
Capital
expenditures
|
(25,227
|
)
|
(49,243
|
)
|
(31,538
|
)
|
|||
|
Cost
of business acquisitions, net of cash acquired
|
(3,189
|
)
|
(47,412
|
)
|
(627,304
|
)
|
|||
|
Acquisition
payments
|
—
|
(3,653
|
)
|
(3,653
|
)
|
||||
|
Proceeds
from sale of property, plant and equipment
|
14,619
|
18,258
|
8,949
|
||||||
|
Proceeds
from sale of investment
|
4,032
|
—
|
—
|
||||||
|
Proceeds
from divestitures, net
|
—
|
—
|
431
|
||||||
|
Net
cash used in investing activities of continuing operations
|
(9,765
|
)
|
(82,050
|
)
|
(653,115
|
)
|
|||
|
Proceeds
from the sale of discontinued operations
|
—
|
—
|
73,628
|
||||||
|
Net
cash provided by investing activities of discontinued
operations
|
—
|
—
|
73,628
|
||||||
|
Net
cash used in investing activities
|
(9,765
|
)
|
(82,050
|
)
|
(579,487
|
)
|
|||
|
Cash
flows from financing activities:
|
|||||||||
|
Repayments
of term loans
|
(24,594
|
)
|
(7,200
|
)
|
(4,900
|
)
|
|||
|
Repayment
of 8⅜% senior subordinated notes
|
(23,024
|
)
|
(19,567
|
)
|
(20,880
|
)
|
|||
|
Repayments
of other long-term debt
|
(12,178
|
)
|
(18,933
|
)
|
(29,053
|
)
|
|||
|
Payment
of amendment and debt issuance costs
|
(7,296
|
)
|
(5,297
|
)
|
(5,906
|
)
|
|||
|
Repayment
of 7⅞% senior subordinated notes
|
(4,295
|
)
|
(10,561
|
)
|
—
|
||||
|
Repayment
of 10½% senior notes
|
(3,250
|
)
|
—
|
—
|
|||||
|
Purchase
and retirement of common stock upon vesting of RSUs
|
(2,043
|
)
|
(1,054
|
)
|
(1,302
|
)
|
|||
|
Borrowings
(repayment) under revolving credit facility, net
|
14,500
|
(83,200
|
)
|
75,700
|
|||||
|
Proceeds
from exercise of stock options
|
532
|
1,876
|
304
|
||||||
|
Repayment of senior unsecured loan
|
—
|
(175,000
|
)
|
—
|
|||||
|
Tax
(liability) asset from stock-based compensation
|
—
|
(1,377
|
)
|
67
|
|||||
|
Payment
of refinancing or repurchase fees, redemption premiums and
expenses
|
(94
|
) |
(130
|
)
|
(8,045
|
)
|
|||
|
Proceeds
from issuance of 10½% senior notes
|
—
|
175,000
|
—
|
||||||
|
Proceeds
from issuance of other long-term debt
|
—
|
12,927
|
—
|
||||||
|
Proceeds
from issuance of term loans
|
—
|
—
|
720,000
|
||||||
|
Proceeds
from senior unsecured loan
|
—
|
—
|
175,000
|
||||||
|
Repayment
of term loan B
|
—
|
—
|
(324,188
|
)
|
|||||
|
Repayment
of Cadmus revolving senior bank credit facility
|
—
|
—
|
(70,100
|
)
|
|||||
|
Repayment of 9⅝% senior notes
|
—
|
—
|
(10,498
|
)
|
|||||
|
Net
cash (used in) provided by financing activities
|
(61,742
|
)
|
(132,516
|
)
|
496,199
|
||||
|
Effect
of exchange rate changes on cash and cash equivalents
of continuing operations
|
(193
|
)
|
(720
|
)
|
206
|
||||
|
Net
increase (decrease) in cash and cash equivalents
|
352
|
(5,438
|
)
|
5,324
|
|||||
|
Cash
and cash equivalents at beginning of year
|
10,444
|
15,882
|
10,558
|
||||||
|
Cash
and cash equivalents at end of year
|
$
|
10,796
|
$
|
10,444
|
$
|
15,882
|
|||
See notes
to consolidated financial statements.
34
CENVEO,
INC. AND SUBSIDIARIES
CONSOLIDATED
STATEMENTS OF CHANGES IN SHAREHOLDERS’ (DEFICIT) EQUITY
(in
thousands)
|
Common
Stock
|
Paid-In
Capital
|
Retained
Deficit
|
Accumulated
Other
Comprehensive
(Loss)
Income
|
Total
Shareholders’
Equity
(Deficit)
|
||||||||||||||||||||
|
Shares
|
Amount
|
|||||||||||||||||||||||
|
Balance
as of December 30, 2006
|
53,515 | $ | 535 | $ | 244,894 | $ | (189,720 | ) | $ | 2,748 | $ | 58,457 | ||||||||||||
|
Comprehensive
income (loss):
|
||||||||||||||||||||||||
|
Net
income
|
40,781 | 40,781 | ||||||||||||||||||||||
|
Other
comprehensive income (loss):
|
||||||||||||||||||||||||
|
Pension
liability adjustment, net of tax expense of $145
|
(2,131 | ) | (2,131 | ) | ||||||||||||||||||||
|
Unrealized
loss on cash flow hedges, net of tax benefit of $4,985
|
(7,780 | ) | (7,780 | ) | ||||||||||||||||||||
|
Currency
translation adjustment
|
6,151 | 6,151 | ||||||||||||||||||||||
|
Reclassifications
to earnings on sale of discontinued operations:
|
||||||||||||||||||||||||
|
Currency
translation adjustment
|
(5,501 | ) | (5,501 | ) | ||||||||||||||||||||
|
Other
comprehensive
loss
|
(9,261 | ) | ||||||||||||||||||||||
|
Total
comprehensive income
|
31,520 | |||||||||||||||||||||||
|
Exercise
of stock
options
|
304 | 304 | ||||||||||||||||||||||
|
Purchase
and retirement of common stock upon vesting of RSUs
|
2 | (1,304 | ) | (1,302 | ) | |||||||||||||||||||
|
Amortization
of stock based compensation
|
10,280 | 10,280 | ||||||||||||||||||||||
|
Excess
tax benefit from stock based compensation
|
67 | 67 | ||||||||||||||||||||||
|
Balance
as of December 29, 2007
|
53,700 | 537 | 254,241 | (148,939 | ) | (6,513 | ) | 99,326 | ||||||||||||||||
|
Comprehensive
income (loss):
|
||||||||||||||||||||||||
|
Net
loss
|
(298,027 | ) | (298,027 | ) | ||||||||||||||||||||
|
Other
comprehensive income (loss):
|
||||||||||||||||||||||||
|
Pension
liability adjustment, net of tax benefit of $14,586
|
(22,614 | ) | (22,614 | ) | ||||||||||||||||||||
|
Unrealized
loss on cash flow hedges, net of tax benefit of $5,115
|
(7,731 | ) | (7,731 | ) | ||||||||||||||||||||
|
Currency
translation adjustment
|
(8,508 | ) | (8,508 | ) | ||||||||||||||||||||
|
Reclassifications
of currency translation adjustment to earnings resulting
from goodwill
impairment charges
|
(986 | ) | (986 | ) | ||||||||||||||||||||
|
Other
comprehensive
loss
|
(39,839 | ) | ||||||||||||||||||||||
|
Total
comprehensive
loss
|
(337,866 | ) | ||||||||||||||||||||||
|
Exercise
of stock
options
|
5 | 1,871 | 1,876 | |||||||||||||||||||||
|
Purchase
and retirement of common stock upon vesting of RSUs
|
(1,054 | ) | (1,054 | ) | ||||||||||||||||||||
|
Amortization
of stock based compensation
|
18,140 | 18,140 | ||||||||||||||||||||||
|
Excess
tax benefit from stock based compensation
|
(1,377 | ) | (1,377 | ) | ||||||||||||||||||||
|
Balance
as of January 3, 2009
|
54,245 | 542 | 271,821 | (446,966 | ) | (46,352 | ) | (220,955 | ) | |||||||||||||||
|
Comprehensive
income (loss):
|
||||||||||||||||||||||||
|
Net
loss
|
(30,939 | ) | (30,939 | ) | ||||||||||||||||||||
|
Other
comprehensive income (loss):
|
||||||||||||||||||||||||
|
Pension
liability adjustment, net of tax expense of $2,704
|
4,618 | 4,618 | ||||||||||||||||||||||
|
Unrealized
loss on cash flow hedges, net of tax expense of $4,666
|
7,020 | 7,020 | ||||||||||||||||||||||
|
Currency
translation adjustment
|
4,438 | 4,438 | ||||||||||||||||||||||
|
Other
comprehensive
loss
|
16,076 | |||||||||||||||||||||||
|
Total
comprehensive
loss
|
(14,863 | ) | ||||||||||||||||||||||
|
Exercise
of stock
options
|
532 | 532 | ||||||||||||||||||||||
|
Common
stock issued in connection with Nashua Corporation
acquisition
|
71 | 46,474 | 46,545 | |||||||||||||||||||||
|
Purchase
and retirement of common stock upon vesting of RSUs
|
7 | (2,050 | ) | (2,043 | ) | |||||||||||||||||||
|
Amortization
of stock based compensation
|
14,274 | 14,274 | ||||||||||||||||||||||
|
Balance
as of January 2, 2010
|
62,033 | $ | 620 | $ | 331,051 | $ | (477,905 | ) | $ | (30,276 | ) | $ | (176,510 | ) | ||||||||||
See notes to consolidated financial
statements.
35
CENVEO,
INC. AND SUBSIDIARIES
NOTES
TO CONSOLIDATED FINANCIAL STATEMENTS
1.
Summary of Significant Accounting Policies
Basis of
Presentation. The
consolidated financial statements include the results of Cenveo Inc. and its
subsidiaries and have been prepared in accordance with accounting principles
generally accepted in the United States of America (“GAAP”). All intercompany
transactions have been eliminated.
Cenveo,
Inc. and its wholly-owned subsidiaries (collectively, the “Company” or “Cenveo”)
are engaged in the printing and manufacturing of envelopes, business forms and
labels and commercial printing. The Company is headquartered in Stamford,
Connecticut, is organized under Colorado law, and its common stock is traded on
the New York Stock Exchange under the symbol “CVO”. The
Company operates a global network of strategically located printing and
manufacturing, fulfillment and distribution facilities, serving a diverse base
of over 100,000 customers. The Company’s operations are primarily based in North
America, Latin America and Asia.
The
Company’s reporting periods for 2009, 2008 and 2007 in this report consist of
52, 53 and 52 week periods, respectively, ending on the Saturday closest to the
last day of the calendar month, and ended on January 2, 2010, January 3, 2009,
and December 29, 2007, respectively. Such periods are referred to herein as (i)
“the year ended January 2, 2010” or “2009”, (ii) “the year ended January 3,
2009” or “2008” and (iii) “the year ended December 29, 2007” or “2007”. All
references to years and year-ends herein relate to fiscal years rather than
calendar years.
The
Company acquired Nashua Corporation (“Nashua”) in the third quarter of
2009. The Company’s results for the year ended January 2, 2010
include the operating results of Nashua subsequent to its acquisition date. The
Company acquired Rex Corporation and its manufacturing facility (“Rex”) in the
second quarter of 2008. The Company’s results for the year ended
January 3, 2009 include the operating results of Rex subsequent to its
acquisition date. The Company acquired PC Ink Corp. (“Printegra”) and
Cadmus Communications Corporation (“Cadmus”) in the first quarter of 2007 and
Madison/Graham ColorGraphics, Inc. (“ColorGraphics”) and Commercial Envelope
Manufacturing Co., Inc. (“Commercial Envelope”) in the third quarter of 2007
(collectively the “2007 Acquisitions”). The Company’s results for the
year ended December 29, 2007 include the operating results of the 2007
Acquisitions subsequent to their respective acquisition dates, except for
ColorGraphics, which is included in the Company’s operating results from July 1,
2007.
Use of
Estimates. The
preparation of financial statements in conformity with accounting principles
generally accepted in the United States of America requires management to make
estimates and assumptions that affect the reported amounts of assets and
liabilities and disclosure of contingent assets and liabilities at the date of
the financial statements and the reported amounts of revenues and expenses
during the reporting periods. Estimates and assumptions are used for, but not
limited to, establishing the allowance for doubtful accounts, purchase price
allocation, depreciation and amortization lives, asset impairment evaluations,
tax assets and liabilities, self-insurance accruals, stock-based compensation
and other contingencies. Actual results could differ from
estimates.
Cash and Cash
Equivalents. Cash
and cash equivalents include cash on deposit and highly liquid investments with
original maturities of three months or less. Cash and cash equivalents are
stated at cost, which approximates fair value.
Accounts
Receivable. Trade
accounts receivable are stated net of allowances for doubtful accounts. Specific
customer provisions are made when a review of significant outstanding amounts,
customer creditworthiness and current economic trends, indicates that collection
is doubtful. In addition, provisions are made at differing amounts, based upon
the balance and age of the receivable and the Company’s historical collection
experience. Trade accounts are charged off against the allowance for doubtful
accounts or expense when it is probable the accounts will not be recovered. As
of January 2, 2010 and January 3, 2009, accounts receivable were reduced by an
allowance for doubtful accounts of $7.6 million and $6.0 million,
respectively.
Inventories. Inventories are stated at
the lower of cost or market, with cost determined on a first-in, first-out or
average cost basis. Cost includes materials, labor and overhead related to the
purchase and production of inventories.
36
CENVEO,
INC. AND SUBSIDIARIES
NOTES
TO CONSOLIDATED FINANCIAL STATEMENTS (CONTINUED)
1.
Summary of Significant Accounting Policies (Continued)
Property, Plant
and Equipment.
Property, plant and equipment are recorded at cost and depreciated over there
estimated useful lives. Depreciation is provided using the straight-line method
based on the estimated useful lives of 15 to 45 years for buildings and building
improvements, 10 to 15 years for machinery and equipment and three to 10 years
for furniture and fixtures. Leasehold improvements are amortized over the
shorter of the lease term on the estimated useful life of the improvements. When
assets are retired or otherwise disposed of, the related costs and accumulated
depreciation are removed from the accounts and any resulting gain or loss is
reflected in operations. Expenditures for repairs and maintenance are charged to
expense as incurred, and expenditures that increase the capacity, efficiency or
useful lives of existing assets are capitalized.
Computer
Software. The Company develops and purchases software for internal use.
Software development costs incurred during the application development stage are
capitalized. Once the software has been installed and tested and is ready for
use, additional costs incurred in connection with the software are expensed as
incurred. Capitalized computer software costs are amortized over the estimated
useful life of the software, usually between three and seven years. Net computer
software costs included in property, plant and equipment were $3.3 million and
$5.6 million as of January 2, 2010 and January 3, 2009,
respectively.
Debt Issuance
Costs. Direct expenses such as legal, accounting, underwriting and
consent fees incurred to issue, extend or amend debt are included in other
assets, net in the consolidated balance sheets. Debt issuance costs were $10.5
million and $10.7 million as of January 2, 2010 and January 3, 2009,
respectively, net of accumulated amortization, and are amortized to interest
expense over the term of the related debt. On April 24, 2009, the Company
amended its revolving credit facility due 2012 (the “Revolving Credit
Facility”), and its term loans and delayed-draw term loans due 2013 (the “Term
Loans” and collectively with the Revolving Credit Facility, the “Amended Credit
Facilities”) (the “2009 Amendment”). In connection with the 2009
Amendment, the Company capitalized $3.4 million of third party costs and fees
paid to consenting lenders and wrote off $1.1 million of previously unamortized
debt issuance costs. In 2008, in connection with the issuance of the
Company’s 10½% senior notes due 2016 (“10½% Notes”), the Company capitalized
$5.3 million of debt issuance costs and incurred a loss on early extinguishment
of debt of $4.2 million related to the previously unamortized debt issuance
costs associated with the $175.0 million senior unsecured loan due 2015 upon
conversion to the 10½% Notes.
Interest
expense includes the amortization of debt issuance costs of $2.4 million, $2.1
million and $1.5 million in 2009, 2008 and 2007, respectively.
Goodwill and
Other Intangible Assets. Goodwill represents the
excess of acquisition costs over the fair value of net assets of businesses
acquired. Goodwill is not amortized. Goodwill is subject to an annual impairment
test and is reviewed annually as of the beginning of December to determine if
there is an impairment or more frequently if an indication of possible
impairment exists. In 2008, the Company recorded non-cash impairment charges to
write-off goodwill of $204.4 million and $168.4 million related to its
commercial print and envelope reporting units, respectively. No impairment
charges for goodwill were recorded in 2009 or 2007 or for other intangible
assets in 2009, 2008 or 2007.
Other
intangible assets consist primarily of customer relationships and trademarks.
Other intangible assets primarily arise from the purchase price allocations of
businesses acquired. Intangible assets with determinable lives are amortized on
a straight-line basis over the estimated useful life assigned to these assets.
Intangible assets that are expected to generate cash flows indefinitely are not
amortized, but are evaluated for impairment similar to goodwill.
Long-Lived
Assets.
Long-lived assets, including property, plant and equipment, and intangible
assets with determinable lives, are evaluated for impairment whenever events or
changes in circumstances indicate that the carrying value of the assets may not
be fully recoverable. An impairment is assessed if the undiscounted expected
future cash flows generated from an asset are less than its carrying amount.
Impairment losses are recognized for the amount by which the carrying value of
an asset exceeds its fair value. The estimated useful lives of all long-lived
assets are periodically reviewed and revised if necessary.
Self-Insurance. The Company is self-insured
for the majority of its workers’ compensation costs and health insurance costs,
subject to specific retention levels. The Company records its liability for
workers’ compensation claims on a fully-developed basis. The Company’s liability
for health insurance claims includes an estimate for claims incurred but not
reported. As of January 2, 2010 and January 3, 2009, the (i) undiscounted
worker’s compensation liability was $13.7 million and $12.4 million,
respectively, and the discounted liability was $11.8 million and $10.5 million,
respectively, using a 4% discount rate and (ii) healthcare liability was $5.7
million and $5.7 million, respectively.
37
CENVEO,
INC. AND SUBSIDIARIES
NOTES
TO CONSOLIDATED FINANCIAL STATEMENTS (CONTINUED)
1.
Summary of Significant Accounting Policies (Continued)
Financial
Instruments. The Company uses
derivative financial instruments to hedge exposures to interest rate
fluctuations by balancing its exposure to fixed and variable interest rates. The
implied gains and losses associated with interest rate swaps offset changes in
interest rates. All derivatives in effect as of the fiscal year ended
January 2, 2010, and as evaluated for prior fiscal periods, are included in
other current liabilities and other liabilities in the consolidated balance
sheets at their respective fair values with unrealized losses included in
accumulated other comprehensive loss in shareholders’ deficit in the
consolidated balance sheet, net of applicable income taxes. At inception of a
hedge transaction, the Company formally documents the hedge relationship and the
risk management objective for undertaking the hedge. In addition, the Company
assesses, both at inception of the hedge and on an ongoing basis, whether the
derivative in the hedging transaction has been highly effective in offsetting
changes in fair value or cash flows of the hedged item and whether the
derivative is expected to continue to be highly effective. The impact of
ineffectiveness, if any, is recognized in the statement of
operations.
Fair Value
Measurements.
Certain assets and liabilities of the Company are required to be recorded
at fair value. Fair value is determined based on the exchange price that would
be received for an asset or paid to transfer a liability in an orderly
transaction between market participants. The fair value of cash and cash
equivalents, accounts receivable, short-term debt and accounts payable
approximate their carrying values. The Company also has other assets or
liabilities that it records at the fair value, such as its interest rate swap
contracts, pension and other postretirement plan assets and liabilities,
long-lived assets held and used, long-lived assets held for sale, goodwill and
other intangible assets. The three-tier value hierarchy, which prioritizes the
inputs used in the valuation methodologies, is as follows:
| Level 1 — | Valuations based on quoted prices for identical assets and liabilities in active markets. |
| Level 2 — |
Valuations
based on observable inputs other than quoted prices included in Level 1,
such as quoted prices for similar assets and liabilities in active
markets, quoted prices for identical or similar assets and liabilities in
markets that are not active, or other inputs that are observable or can be
corroborated by observable market data.
|
| Level 3 — |
Valuations
based on unobservable inputs reflecting the Company’s own assumptions,
consistent with reasonably available assumptions made by other market
participants.
|
Revenue
Recognition. The
Company recognizes revenue when persuasive evidence of an arrangement exists,
product delivery has occurred, pricing is fixed or determinable, and collection
is reasonably assured. Since a
significant portion of the Company’s products are customer specific, it is
common for customers to inspect the quality of the product at the Company’s
facility prior to its shipment. Products shipped are not subject to contractual
right of return provisions.
The
Company has rebate agreements with certain customers. These rebates are recorded
as reductions of sales and are accrued using sales data and rebate percentages
specific to each customer agreement. Accrued customer rebates are included in
other current liabilities in the consolidated balance sheets.
Sales Tax.
The Company records sales net of applicable sales tax.
Freight
Costs. The costs
of delivering finished goods to customers are recorded as freight costs and
included in cost of sales. Freight costs that are included in the price of the
product are included in net sales.
Advertising
Costs. All
advertising costs are expensed as incurred. Advertising costs were $2.7 million
in 2009 and $2.6 million for 2008 and 2007, respectively.
Foreign Currency
Translation.
Assets and liabilities of subsidiaries operating outside the United States with
a functional currency other than the U.S. dollar are translated at year-end
exchange rates. The effects of translation are included as a component of
accumulated other comprehensive loss in shareholders’ deficit in the
consolidated balance sheet. Income and expense items and gains and losses are
translated at the average monthly rate. Foreign currency transaction gains and
losses are recorded in other (income) expense, net.
38
CENVEO,
INC. AND SUBSIDIARIES
NOTES
TO CONSOLIDATED FINANCIAL STATEMENTS (CONTINUED)
1. Summary of Significant Accounting Policies (Continued)
Stock-Based
Compensation. The
Company uses the fair value method of accounting for stock-based compensation,
pursuant to the provisions of Accounting Standard Codification (“ASC”) 718 –
“Compensation –Stock
Compensation.” The Company uses the Black-Scholes-Merton option-pricing
model (“Black-Scholes”) to measure fair value of these stock option awards. The
Black-Scholes model requires us to make significant judgments regarding the
assumptions used within the model, the most significant of which are the stock
price volatility assumption, the expected life of the option award, the
risk-free rate of return and dividends during the expected term.
Income
Taxes. Deferred
income taxes reflect the future tax effect of temporary differences between the
carrying amount of assets and liabilities for financial and income tax reporting
and are measured by applying statutory tax rates in effect for the year during
which the differences are expected to reverse. Deferred tax assets are reduced
by a valuation allowance to the extent it is more likely than not that the
deferred tax assets will not be realized.
The
Company recognizes a tax position in its consolidated financial statements when
it is more likely than not that the position would be sustained upon examination
by tax authorities. This recognized tax position is then measured at the largest
amount of benefit that is greater than fifty percent likely of being realized
upon ultimate settlement. Although the Company believes that its estimates are
reasonable, the final outcome of uncertain tax positions may be materially
different from that which is reflected in the Company’s consolidated financial
statements. The Company adjusts such reserves upon changes in circumstances that
would cause a change to the estimate of the ultimate liability, upon effective
settlement or upon the expiration of the statute of limitations, in the period
in which such event occurs.
New Accounting
Pronouncements. Effective January 4, 2009,
the Company adopted the accounting pronouncement relating changes in the
disclosure requirements for derivative instruments and hedging activities. The
adoption of this pronouncement did not have a material impact on the Company’s
consolidated financial statements.
Effective
January 4, 2009, the Company adopted the accounting pronouncement relating to
business combinations, which establishes revised principles and requirements for
how the Company recognizes and measures assets and liabilities acquired in a
business combination. This pronouncement is effective for business combinations
completed by the Company on or after January 4, 2009. In accordance
with the transition guidance in this pronouncement, the Company recorded a
charge of $1.4 million in the fourth quarter of 2008. Acquisition-related costs
for the year ended January 2, 2010 were $2.9 million, and are included in
selling, general and administrative expenses in the consolidated statements of
operations.
Effective
January 4, 2009, the Company adopted the accounting pronouncement relating to
employers’ disclosures about postretirement benefit plan assets, which requires
the Company to provide guidance on an employer’s disclosures about plan assets
of a defined benefit pension or other retirement plan.
Effective
January 4, 2009, the Company adopted the accounting pronouncement that amends
the factors that should be considered in developing renewal or extension
assumptions used to determine the useful life of a recognized intangible asset.
The intent of this pronouncement is to improve the consistency between the
useful life of a recognized intangible asset and the period of expected cash
flows used to measure the fair value of the asset under the applicable
accounting literature. The adoption of this pronouncement did not have a
material impact on the Company’s consolidated financial statements.
Effective
January 4, 2009, the Company adopted the accounting pronouncement relating to
non-controlling interests in consolidated financial statements. This
pronouncement establishes accounting and reporting standards for the
non-controlling interests in a subsidiary and for the deconsolidation of a
subsidiary. The adoption of this pronouncement had no impact on the Company’s
consolidated financial statements.
Effective
June 27, 2009, the Company adopted the accounting pronouncement relating to the
disclosure of the date through which an entity has evaluated subsequent events
and the basis for that date, whether that date represents the date the financial
statements were issued or were available to be issued. The Company now
recognizes in its consolidated financial statements the effects of all
subsequent events that provide additional evidence about conditions that existed
at the date of the balance sheet, including the estimates inherent in the
process of preparing its consolidated financial statements. Events that provide
evidence about conditions that did not exist at the date of the balance sheet
but arose after that date are now disclosed in a footnote. In accordance with
this pronouncement, the Company evaluated events and transactions after the
close of its consolidated balance sheet on January 2, 2010, until the date of
the Company’s Annual Report on Form 10-K filing with the SEC on March 3, 2010,
for potential recognition or disclosure in the Company’s consolidated financial
statements.
39
CENVEO,
INC. AND SUBSIDIARIES
NOTES
TO CONSOLIDATED FINANCIAL STATEMENTS (CONTINUED)
1.
Summary of Significant Accounting Policies (Continued)
In June
2009, the FASB issued amendments to the accounting pronouncement for variable
interest entities (“VIEs”) and for transfers of financial assets. The amendments
require an enterprise to make a qualitative assessment whether it has (i) the
power to direct the activities of the VIE that most significantly impact the
entity’s economic performance and (ii) the obligation to absorb losses of the
VIE or the right to receive benefits from the VIE that could potentially be
significant to the VIE. If an enterprise has both of these characteristics, the
enterprise is considered the primary beneficiary and must consolidate the VIE.
The amendment will be effective for the Company on January 3, 2010. The adoption
of these amendments is not expected to have a material impact on the Company’s
consolidated financial statements.
In August
2009, the FASB issued an accounting pronouncement that provides guidance on the
measurement of liabilities at fair value. The guidance provides clarification
for circumstances in which a quoted market price in an active market for an
identical liability is not available, an entity is required to measure fair
value using a valuation technique that uses the quoted price of an identical
liability when traded as an asset or, if unavailable, quoted prices for similar
liabilities or similar assets when traded as assets. If none of this information
is available, an entity should use a valuation technique in accordance with
existing fair value principles. The adoption of this pronouncement is not
expected to have a material impact on the Company’s consolidated financial
statements.
In
October 2009, the FASB issued an accounting pronouncement which amends revenue
recognition guidance for arrangements with multiple deliverables. The new
guidance eliminates the residual method of revenue recognition and allows the
use of management’s best estimate of selling price for individual elements of an
arrangement when vendor specific objective evidence (“VSOE”), vendor objective
evidence (“VOE”) or third-party evidence (“TPE”) is unavailable. Full
retrospective application of the new guidance is optional. The adoption of this
pronouncement is not expected to have a material impact on the Company’s
consolidated financial statements.
2.
Acquisitions
The
Company accounts for business combinations under the provisions of the Business
Combination Topic of the FASB ASC 805 (“ASC 805”). Acquisitions are
accounted for by the acquisition method, and, accordingly, the assets and
liabilities of the acquired businesses have been recorded at their estimated
fair value on the acquisition date with the excess of the purchase price over
their estimated fair value recorded as goodwill.
2009
Nashua
On
September 15, 2009, the Company acquired all of the stock of Nashua. Nashua,
founded in 1854, is a manufacturer, converter and marketer of labels and
specialty papers whose primary products include pressure-sensitive labels, tags,
transaction and financial receipts, thermal and other coated papers, and
wide-format papers. The Company believes that Nashua further strengthens its
position in the pharmaceutical labels market, while giving it access to new
shelf label market customers. Under the terms of acquisition, each share of
Nashua common stock was converted into the right to receive (i) $0.75 per share
in cash, without interest, and (ii) 1.265 shares of Cenveo common
stock. The total consideration in connection with the Nashua
acquisition, net of cash acquired of $1.0 million, was $49.7 million, which is
comprised of cash consideration of $4.2 million and non-cash consideration of
$45.5 million, primarily relating to the issuance of 7.0 million shares of
Cenveo common stock, which closed on the New York Stock Exchange at $6.53 on
September 15, 2009. The total purchase price was allocated to the tangible and
identifiable assets acquired and liabilities assumed based on their estimated
fair values at the acquisition date. The Nashua acquisition preliminarily
resulted in $8.4 million of goodwill, none of which is deductible for income tax
purposes, and which was assigned entirely to the Company’s envelopes, forms and
labels segment. The acquired identifiable intangible assets, aggregating $29.6
million, include: (i) the Nashua trademark of $16.0 million, which has been
assigned an indefinite useful life due to the Company’s intention to continue
using the Nashua name, the long operating history of Nashua and its existing
customer base, (ii) customer relationships of $13.0 million, which are being
amortized over their estimated weighted average useful lives of 6.5 years; and
(iii) a royalty agreement of $0.6 million, which is being amortized over the
contract life of 9 years.
In
connection with the Nashua acquisition, the Company incurred transaction costs
of $2.5 million, which is included in selling, general and administrative
expenses in its consolidated statements of operations.
40
CENVEO,
INC. AND SUBSIDIARIES
NOTES
TO CONSOLIDATED FINANCIAL STATEMENTS (CONTINUED)
2.
Acquisitions (Continued)
Preliminary
Purchase Price Allocation
The
following table summarizes the preliminary allocation of the purchase price of
Nashua to the assets acquired and liabilities assumed in the acquisition (in
thousands):
|
As
of
September
15, 2009
|
||||
|
Accounts
receivable, net
|
$
|
24,056
|
||
|
Other
current assets
|
29,045
|
|||
|
Property,
plant and equipment
|
27,985
|
|||
|
Goodwill
|
8,423
|
|||
|
Other
intangible assets
|
29,600
|
|||
|
Other
assets
|
2,960
|
|||
|
Total
assets acquired
|
122,069
|
|||
|
Current
liabilities, excluding current maturities of long-term debt
|
25,990
|
|||
|
Current
maturities of long-term debt
|
2,800
|
|||
|
Other
liabilities
|
42,617
|
|||
|
Total
liabilities assumed
|
71,407
|
|||
|
Net
assets acquired
|
50,662
|
|||
|
Less
cash acquired
|
(1,001)
|
|||
|
Cost
of Nashua acquisition, net of cash acquired
|
$
|
49,661
|
||
The fair
values of property, plant and equipment, goodwill and intangible assets
associated with the Nashua acquisition were determined to be Level 3 under the
fair value hierarchy. Property, plant and equipment values were estimated based
on discussions with machinery and equipment brokers, internal expertise related
to the equipment and current marketplace conditions. Intangible asset values,
including the Nashua tradename and customer relationships, were estimated based
on future cash flows, customer attrition rates, as applicable, discounted using
an estimated weighted-average cost of capital. The purchase price remains
preliminary for certain assets and liabilities that are contingent in
nature.
Nashua’s
results of operations and cash flows are included in the Company’s consolidated
statements of operations and cash flows from September 15, 2009 and are not
included in 2008 or 2007. Net sales of $73.3 million are included in the
Company’s consolidated statement of operations for 2009.
Unaudited Pro Forma Operating Data
The
following supplemental pro forma consolidated summary operating data of the
Company for 2009 and 2008 presented herein has been prepared by adjusting the
historical data as set forth in its consolidated statements of operations
to give effect to the Nashua acquisition as if it had been consummated as of the
beginning of fiscal year 2008 (in thousands, except per share
amounts):
|
Years
Ended
|
||||||||||||||||
|
2009
|
2008
|
|||||||||||||||
|
As
Reported
|
Pro
Forma
|
As
Reported
|
Pro
Forma
|
|||||||||||||
|
Net
sales
|
$ | 1,714,631 | $ | 1,887,748 | $ | 2,098,694 | $ | 2,363,597 | ||||||||
|
Operating
income (loss)
|
32,188 | 31,347 | (223,546 | ) | (241,645 | ) | ||||||||||
|
Income
(loss) from continuing operations
|
(39,837 | ) | (40,673 | ) | (296,976 | ) | (318,025 | ) | ||||||||
|
Net
income (loss)
|
(30,939 | ) | (31,775 | ) | (298,027 | ) | (319,076 | ) | ||||||||
|
Income
(loss) per share – basic and diluted:
|
||||||||||||||||
|
Continuing
operations
|
$ | (0.70 | ) | $ | (0.66 | ) | $ | (5.51 | ) | $ | (5.22 | ) | ||||
|
Net
income (loss)
|
$ | (0.54 | ) | $ | (0.51 | ) | $ | (5.53 | ) | $ | (5.23 | ) | ||||
|
Weighted
average shares:
|
||||||||||||||||
|
Basic
and diluted
|
56,787 | 61,730 | 53,904 | 60,960 | ||||||||||||
The pro
forma information is presented for comparative purposes only and does not
purport to be indicative of the Company’s actual consolidated results
of operations had the Nashua acquisition actually been consummated as of the
beginning of each of the respective periods noted above, or of the Company’s
expected future results of operations.
41
CENVEO,
INC. AND SUBSIDIARIES
NOTES
TO CONSOLIDATED FINANCIAL STATEMENTS (CONTINUED)
2.
Acquisitions (Continued)
2008
Rex
On March
31, 2008, the Company acquired all of the stock of Rex. Rex was an independent
manufacturer of premium and high-quality packaging solutions, with annual sales
of approximately $40 million prior to its acquisition by the Company. The total
cash consideration in connection with the Rex acquisition, excluding assumed
debt of approximately $7.4 million, was approximately $43.1 million, including
approximately $1.0 million of related expenses. The purchase price allocation
was finalized in 2009. The Rex acquisition resulted in $8.3 million of goodwill,
all of which is deductible for income tax purposes, and which was assigned
entirely to the Company’s commercial printing segment. The acquired identifiable
intangible assets, aggregating $13.8 million, include: (i) the Rex trademark of
$9.3 million, which has been assigned an indefinite useful life due to the
Company’s intention to continue using the Rex name, Rex’s long operating history
and existing customer base, and (ii) customer relationships of $4.5 million,
which are being amortized over their estimated weighted average useful lives of
13 years.
Rex’s
results of operations and cash flows are included in the Company’s consolidated
statements of operations and cash flows from March 31, 2008 and are not included
in 2007. Pro-forma results for the years ended January 3, 2009 and December 29,
2007, assuming the acquisition of Rex had been made on December 31, 2006, have
not been presented since the effect would not be material.
2007
Commercial
Envelope
On August 30, 2007, the Company
acquired all of the stock of Commercial Envelope. Commercial Envelope
was one of the largest independent envelope manufacturers in the United States,
with approximately $160 million in annual revenues prior to its acquisition by
the Company. The total cash consideration in connection with the
Commercial Envelope acquisition, excluding assumed debt of approximately $20.3
million, was approximately $213.3 million, including approximately $3.8 million
of related expenses. The purchase price allocation was finalized in
2008.
The
Commercial Envelope acquisition resulted in $100.2 million of goodwill, none of
which is deductible for income tax purposes, and which was assigned entirely to
the Company’s envelopes, forms and labels segment. Such goodwill reflects the
substantial value of Commercial Envelope’s historical envelope business.
Goodwill also reflects the Company’s expectation of being able to grow the
Commercial Envelope business and improve its operating efficiencies through
economies of scale. The acquired identifiable intangible assets,
aggregating $87.8 million, include: (i) the Commercial Envelope trademark of
$51.4 million, which has been assigned an indefinite life due to its strong
brand recognition, the Company’s intention to continue using the Commercial
Envelope name, including rebranding its existing commercial envelope operations
with the Commercial Envelope name, the long operating history of Commercial
Envelope, its existing customer base and its significant market position; (ii)
customer relationships of $36.0 million, which are being amortized over their
estimated weighted average useful lives of 15 years; and (iii) covenants not to
compete of $0.4 million which are amortizable over their estimated useful lives
of five years. The Company also acquired favorable leases of $0.5
million, which are being amortized as an increase to rent expense over their
weighted average useful lease term of approximately five years. Each of the
above amounts represent the estimated fair value of the respective property,
plant and equipment and other intangible assets. Commercial Envelope’s results
of operations and cash flows have been included in the Company’s consolidated
statements of operations and cash flows from the August 30, 2007 acquisition
date.
Unaudited Pro Forma Operating
Data
The
following supplemental pro forma consolidated summary operating data of the
Company for each of the periods presented herein has been prepared by adjusting
the historical data as set forth in its consolidated statements of operations to
give effect to the Commercial Envelope acquisition as if it had been consummated
as of the beginning of fiscal year 2007 (in thousands, except per share
amounts):
42
CENVEO,
INC. AND SUBSIDIARIES
NOTES
TO CONSOLIDATED FINANCIAL STATEMENTS (CONTINUED)
2.
Acquisitions (Continued)
|
2007
|
||||||||
|
As
Reported
|
Pro
Forma
|
|||||||
|
Net
sales
|
$ | 2,046,716 | $ | 2,148,368 | ||||
|
Operating
income
|
137,550 | 150,168 | ||||||
|
Income
(loss) from continuing operations
|
23,985 | 23,369 | ||||||
|
Net
income
|
40,781 | 40,165 | ||||||
|
Income
(loss) per share – basic:
|
||||||||
|
Continuing
operations
|
$ | 0.45 | $ | 0.44 | ||||
|
Net
income
|
$ | 0.76 | $ | 0.75 | ||||
|
Income
(loss) per share – diluted:
|
||||||||
|
Continuing
operations
|
$ | 0.44 | $ | 0.43 | ||||
|
Net
income
|
$ | 0.75 | $ | 0.74 | ||||
The pro
forma information is presented for comparative purposes only and does not
purport to be indicative of the Company’s actual consolidated results
of operations had the Commercial Envelope acquisition actually been consummated
as of the beginning of fiscal year 2007, or of the Company’s expected future
results of operations.
ColorGraphics
On July
9, 2007, the Company acquired all of the stock of
ColorGraphics. ColorGraphics was one of the largest independent
commercial printers in the western United States, with approximately $170
million in annual revenues prior to its acquisition by the
Company. ColorGraphics produces high quality annual reports, car
books, catalogs and other corporate communication materials. The
total cash consideration in connection with the ColorGraphics acquisition,
excluding assumed debt of approximately $28.6 million, was approximately $71.7
million, including approximately $0.9 million of related expenses. The purchase
price allocation was finalized in 2008. The ColorGraphics acquisition resulted
in $38.1 million of goodwill, of which approximately $2.1 million is deductible
for income tax purposes, and which was assigned entirely to the Company’s
commercial printing segment. The acquired identifiable intangible assets,
aggregating $22.0 million, include: (i) the ColorGraphics trademark of $18.8
million, which has been assigned an indefinite useful life due to the Company’s
intention to continue using the ColorGraphics name, and the long operating
history, existing customer base and significant market position of
ColorGraphics; (ii) customer relationships of $2.6 million, which are being
amortized over their estimated weighted average useful lives of 11 years; and
(iii) a non-compete agreement of $0.6 million which is amortizable over its
estimated useful life of three years.
ColorGraphics’
results of operations and cash flows have been included in the Company’s
consolidated statements of operations and cash flows from July 1, 2007. Pro
forma results for the year ended December 29, 2007, assuming the acquisition of
ColorGraphics had been made on January 1, 2006, have not been presented since
the effect was not material.
Cadmus
On March
7, 2007, the Company acquired all of the stock of Cadmus for $24.75 per share,
by merging an indirect wholly-owned subsidiary of Cenveo with and into Cadmus.
As a result, Cadmus became an indirect wholly-owned subsidiary of Cenveo.
Following the merger, Cadmus was merged into Cenveo Corporation, a direct
wholly-owned subsidiary of the Company. Cadmus is one of the world’s largest
providers of content management and print offerings to scientific, technical and
medical journals, one of the largest periodicals printers in North America,
and a leading provider of specialty packaging and promotional printing products,
with annual sales of approximately $450 million prior to its acquisition by the
Company. The total cash consideration in connection with the Cadmus acquisition,
excluding assumed debt of approximately $210.1 million, was approximately $248.7
million, consisting of: (i) $228.9 million in cash for all of the common stock
of Cadmus, (ii) payments of $17.7 million for vested stock options and
restricted shares of Cadmus and for change in control provisions in Cadmus’
incentive plans, and (iii) $2.1 million of related expenses. The purchase price
allocation was finalized in 2008.
43
CENVEO,
INC. AND SUBSIDIARIES
NOTES
TO CONSOLIDATED FINANCIAL STATEMENTS (CONTINUED)
2.
Acquisitions (Continued)
In
connection with the Cadmus acquisition, the Company refinanced its existing
indebtedness and $70.1 million of Cadmus debt.
The
Cadmus acquisition resulted in $233.0 million of goodwill, none of which is
deductible for income tax purposes, and which was assigned entirely to the
Company’s commercial printing segment. Such goodwill reflects the substantial
value of Cadmus’ historically profitable journal, periodicals and specialty
packaging printing business. Goodwill also reflects the Company’s expectation of
being able to grow Cadmus’ business and improve its operating efficiencies
through economies of scale. The acquired identifiable intangible assets,
aggregating $111.6 million, include: (i) the Cadmus trademark of $48.0 million,
which has been assigned an indefinite life due to its strong brand recognition,
the Company’s intention to continue using the Cadmus name, the long operating
history of Cadmus, its existing customer base and its significant market
position, and (ii) customer relationships of $63.6 million, which are being
amortized over their estimated weighted average useful lives of approximately 20
years. The Company also acquired unfavorable leases of $3.2 million, which are
being amortized as a reduction to rent expense over their weighted average
useful lease term of approximately 11 years. Each of the above amounts represent
the estimated fair value of the respective property, plant and equipment and
other intangible assets.
Cadmus’
results of operations and cash flows have been included in the Company’s
consolidated statements of operations and cash flows from the March 7, 2007
acquisition date.
Unaudited
Pro Forma Operating Data
The
following supplemental pro forma consolidated summary operating data of the
Company for each of the periods presented herein has been prepared by adjusting
the historical data as set forth in its consolidated statements of operations to
give effect to the Cadmus acquisition as if it had been consummated as of the
beginning of fiscal year 2007 (in thousands, except per share
amounts):
|
2007
|
||||||||
|
As
Reported
|
Pro
Forma
|
|||||||
|
Net
sales
|
$ | 2,046,716 | $ | 2,128,533 | ||||
|
Operating
income
|
137,550 | 140,874 | ||||||
|
Income
(loss) from continuing operations
|
23,985 | 19,029 | ||||||
|
Net
income
|
40,781 | 35,825 | ||||||
|
Income
(loss) per share – basic:
|
||||||||
|
Continuing
operations
|
$ | 0.45 | $ | 0.36 | ||||
|
Net
income
|
$ | 0.76 | $ | 0.67 | ||||
|
Income
(loss) per share – diluted:
|
||||||||
|
Continuing
operations
|
$ | 0.44 | $ | 0.35 | ||||
|
Net
income
|
$ | 0.75 | $ | 0.66 | ||||
The pro
forma information is presented for comparative purposes only and does not
purport to be indicative of the Company’s actual consolidated results of
operations had the Cadmus acquisition actually been consummated as of the
beginning of fiscal year 2007, or of the Company’s expected future results of
operations.
Printegra
On
February 12, 2007, the Company acquired all of the stock of Printegra, with
annual sales of approximately $90 million prior to its acquisition by the
Company. Printegra produces printed business communication documents regularly
consumed by small and large businesses, including laser cut sheets, envelopes,
business forms, security documents and labels. The final aggregate purchase
price for Printegra was approximately $78.1 million, which included $0.5 million
of related expenses. The purchase price allocation was finalized in 2008. The
Printegra acquisition resulted in $38.1 million of goodwill, of which
approximately $4.4 million is deductible for income tax purposes, and which was
assigned entirely to the Company’s envelopes, forms and labels segment. The
acquired identifiable intangible assets, aggregating $27.7 million, include: (i)
customer relationships of $21.7 million, which are being amortized over their
estimated weighted average useful lives of 25 years; and (ii) trademarks of $6.0
million, which are being amortized over their estimated weighted average useful
lives of approximately 17 years.
44
CENVEO,
INC. AND SUBSIDIARIES
NOTES
TO CONSOLIDATED FINANCIAL STATEMENTS (CONTINUED)
2.
Acquisitions (Continued)
Printegra’s
results of operations and cash flows have been included in the Company’s
consolidated statements of operations and cash flows from the February 12, 2007
acquisition date. Pro forma results for the year ended December 29, 2007,
assuming the acquisition of Printegra had been made on January 1, 2006, have not
been presented since the effect was not material.
Acquisition
related Restructuring Activities
Upon the
adoption of a new accounting pronouncement on January 4, 2009, the Company is
required to expense restructuring and integration related costs that it
previously included in the purchase price allocation of its prior year
acquisitions. As a result, restructuring and impairment charges incurred in
connection with the integration of Nashua into the Company’s operations are
included in restructuring, impairment and other charges in the consolidated
statements of operations. Upon the acquisition of Nashua, the Company
developed and implemented its plan to integrate Nashua into its existing
operations (the “Nashua Plan”). In the fourth quarter of 2009, activities
related to this plan included the closure and consolidation of Nashua’s Vernon,
California point-of-sale facility into the Company’s existing Los Angeles,
California envelope facility and elimination of duplicative headcount and
public company costs. Restructuring and impairment charges for the year ended
January 2, 2010 related to the Nashua Plan were as follows (in
thousands):
|
Nashua
|
|||
|
Employee
separation
costs
|
$
|
710
|
|
|
Asset
impairments
|
35
|
||
|
Equipment
moving
expenses
|
211
|
||
|
Lease
termination
expenses
|
159
|
||
|
Building
clean-up and other expenses
|
69
|
||
|
Total
restructuring and impairment charges
|
$
|
1,184
|
|
In
connection with the 2008 and 2007 acquisitions, the Company recorded liabilities
in the purchase price allocations in connection with its plan to exit certain
activities and, in connection with the Nashua acquisition, the Company assumed
related liabilities on the date of acquisition, and incurred liabilities in
connection with its integration into the Company’s operations. A summary of the
activity recorded for these liabilities is as follows (in
thousands):
|
Lease
Termination
Costs
|
Employee
Separation
Costs
|
Other
Exit Costs
|
Total
|
|||||||||||||
|
Balance
as of December 29, 2007
|
$ | 3,453 | $ | 495 | $ | 351 | $ | 4,299 | ||||||||
|
Accruals,
net
|
62 | 1,049 | 149 | 1,260 | ||||||||||||
|
Payments
|
(1,251 | ) | (1,544 | ) | (500 | ) | (3,295 | ) | ||||||||
|
Balance
as of January 3, 2009
|
2,264 | — | — | 2,264 | ||||||||||||
|
Assumed
in Nashua acquisition
|
877 | 123 | — | 1,000 | ||||||||||||
|
Nashua
Plan
|
159 | 710 | — | 869 | ||||||||||||
|
Payments
|
(509 | ) | (301 | ) | — | (810 | ) | |||||||||
|
Balance
as of January 2, 2010
|
$ | 2,791 | $ | 532 | $ | — | $ | 3,323 | ||||||||
Subsequent Event
On
February 11, 2010, the Company announced its acquisition of Clixx Direct
Marketing Services Inc. (“Clixx”). Clixx is a market leader delivering a full
suite of customer products and services.
45
CENVEO,
INC. AND SUBSIDIARIES
NOTES
TO CONSOLIDATED FINANCIAL STATEMENTS (CONTINUED)
3.
Discontinued Operations
On March
31, 2006, the Company sold to the Supremex Income Fund (the “Fund”), all of the
shares of Supremex, Inc. and certain other assets (“Supremex”), and retained a
36.5% economic and voting interest in the Fund. On March 13, 2007, the Company
sold its remaining 28.6% economic and voting interest in the Fund for $67.2
million and recorded a gain in 2007 of approximately $17.0 million, net of taxes
of $8.4 million. Income from discontinued operations for the year ended December
29, 2007 includes equity income of $2.2 million related to the Company’s
retained interest in the Fund from January 1, 2007 through the March 13, 2007
date of sale, net of related taxes.
The
acquisition agreement pursuant to which the Company sold Supremex on March 31,
2006 to the Fund contains representations and warranties regarding the business
that was sold that are customary for transactions of this nature. The
acquisition agreement also required the Company to provide specified indemnities
(subject to agreed-upon limitations) including, without limitation: (i) an
indemnity in the event that its representations and warranties in the
acquisition agreement were inaccurate: (ii) an indemnity regarding certain
inquiries by the Canadian Competition Bureau; and (iii) an indemnity for certain
contingencies. The Company does not believe that the foregoing representations,
warranties and related indemnities will result in the Company making any
material payments to the Fund. During the third quarter of 2009, the Company
reduced its liabilities for uncertain tax positions by $12.1 million, net of
deferred tax assets of $2.6 million, as a result of the expiration of certain
statute of limitations. The release of these uncertain tax positions were
recorded in discontinued operations, net of taxes, in the Company’s consolidated
statement of operations as they relate to the sale of Supremex.
4.
Inventories
Inventories
by major category are as follows (in thousands):
|
January
2,
2010
|
January
3,
2009
|
|||||||
|
Raw
materials
|
$ | 60,332 | $ | 67,236 | ||||
|
Work
in
process
|
25,812 | 27,011 | ||||||
|
Finished
goods
|
59,084 | 65,322 | ||||||
| $ | 145,228 | $ | 159,569 | |||||
5.
Property, Plant and Equipment
Property,
plant and equipment are as follows (in thousands):
|
January
2,
2010
|
January
3,
2009
|
|||||||
|
Land
and land
improvements
|
$ | 18,622 | $ | 21,421 | ||||
|
Buildings
and
improvements
|
106,785 | 111,208 | ||||||
|
Machinery
and
equipment
|
616,022 | 622,929 | ||||||
|
Furniture
and
fixtures
|
12,652 | 12,589 | ||||||
|
Construction
in
progress
|
12,143 | 14,558 | ||||||
| 766,224 | 782,705 | |||||||
| Accumulated depreciation | (378,345 | ) | (362,248 | ) | ||||
| $ | 387,879 | $ | 420,457 | |||||
In
December 2009, the Company sold a closed commercial printing facility, which had
a net book value of $6.8 million. Net proceeds of $6.9 million were received in
December 2009 and excluded $0.9 million of amounts held in escrow that are
subject to contingent future events. In connection with the sale, the Company
recorded a gain of $0.1 million, which is included in restructuring, impairment
and other charges in the consolidated statement of operations.
46
CENVEO,
INC. AND SUBSIDIARIES
NOTES
TO CONSOLIDATED FINANCIAL STATEMENTS (CONTINUED)
5.
Property, Plant and Equipment (Continued)
In June
2009, the Company sold one of its envelope facilities which had a net book value
of $2.9 million for net proceeds of $3.7 million and entered into a two-year
operating lease for the same facility. In connection with the sale, the Company
recorded a deferred gain of $0.8 million, which is being amortized on a
straight-line basis over the term of the lease as a reduction to rent expense in
cost of sales.
In 2008,
the Company sold a property for net proceeds of approximately $6.2 million and
recorded a gain of approximately $1.9 million, which is included in selling,
general and administrative. In 2008, the Company also sold one of its envelope
facilities for net proceeds of $11.5 million and entered into an operating lease
for the same facility. In connection with the sale, the Company recorded a gain
of $7.8 million, of which $2.3 million was recognized upon such sale and
included in cost of sales. The remaining gain was deferred and is being
amortized on a straight-line basis over the seven year term of the lease as a
reduction to rent expense in cost of sales.
Assets
Held for Sale
In
December 2009, the Company announced the closure of a commercial printing
facility located in Baltimore, Maryland (“Baltimore”). Upon the announcement of
the closure, the Company began a program to sell the press assets and tradename
associated with the operations. As such, the Company has recorded these assets
as available for sale in other assets, net on its consolidated balance
sheet and has presented them at the lower of their net book value or fair value
less estimated cost to sell. The results of operations and cash flows of its
Baltimore facility have not been presented in the Company’s consolidated
financial statements as discontinued operations as migration of certain cash
flows to other Company locations will occur.
6.
Goodwill and Other Intangible Assets
The
changes in the carrying amount of goodwill as of January 2, 2010 and January 3,
2009 by reportable segment are as follows (in thousands):
|
Envelopes,
Forms
and
Labels
|
Commercial
Printing
|
Total
|
||||||||||
|
Balance
as of December 29, 2007
|
$ | 305,025 | $ | 364,777 | $ | 669,802 | ||||||
|
Acquisitions
|
6,902 | 9,775 | 16,677 | |||||||||
|
Foreign
currency
translation
|
— | (1,475 | ) | (1,475 | ) | |||||||
|
Impairment
charge
|
(168,429 | ) | (205,392 | ) | (373,821 | ) | ||||||
|
Balance
as of January 3,
2009
|
143,498 | 167,685 | 311,183 | |||||||||
|
Acquisitions
|
8,573 | — | 8,573 | |||||||||
|
Balance
as of January 2,
2010
|
$ | 152,071 | $ | 167,685 | $ | 319,756 | ||||||
In the
fourth quarter of 2008, the Company recorded non-cash impairment charges of
goodwill of $204.4 million and $168.4 million related to its commercial print
and envelope reporting units, respectively. These charges resulted from
reductions in the estimated fair value of these reporting units primarily due to
the impact of the current economic downturn on these reporting units. These
reporting units were valued using a higher discount rate applied to estimated
future cash flows, which reflects increased borrowing rates and equity risk
premiums implied by current market conditions as of the beginning of December
2008, as compared to the same period in 2007. Since the fair values of these
reporting units were below their carrying amounts including goodwill, the
Company performed additional fair value measurement calculations to determine
total impairment. As part of this impairment calculation, the Company also
estimated the fair value of the significant tangible and intangible long-lived
assets of each reporting unit.
47
CENVEO,
INC. AND SUBSIDIARIES
NOTES
TO CONSOLIDATED FINANCIAL STATEMENTS (CONTINUED)
6.
Goodwill and Other Intangible Assets (Continued)
Other
intangible assets are as follows (in thousands):
|
January
2, 2010
|
January
3, 2009
|
|||||||||||||||||||
|
Weighted
Average
Remaining Amortization Period (Years)
|
Gross
Carrying
Amount
|
Accumulated
Amortization
|
Net
Carrying
Amount
|
Gross
Carrying
Amount
|
Accumulated
Amortization
|
Net
Carrying
Amount
|
||||||||||||||
|
Intangible
assets with determinable lives:
|
||||||||||||||||||||
|
Customer
relationships
|
15
|
$
|
172,205
|
$
|
(38,394
|
)
|
$
|
133,811
|
$
|
159,206
|
$
|
(29,875
|
)
|
$
|
129,331
|
|||||
|
Trademarks
and tradenames
|
24
|
21,011
|
(4,986
|
)
|
16,025
|
21,011
|
(4,089
|
)
|
16,922
|
|||||||||||
|
Patents
|
4
|
3,028
|
(2,023
|
)
|
1,005
|
3,028
|
(1,755
|
)
|
1,273
|
|||||||||||
|
Non-compete
agreements
|
2
|
2,456
|
(1,958
|
)
|
498
|
2,456
|
(1,634
|
)
|
822
|
|||||||||||
|
Other
|
9
|
802
|
(223
|
)
|
579
|
768
|
(392
|
)
|
376
|
|||||||||||
|
199,502
|
(47,584
|
)
|
151,918
|
186,469
|
(37,745
|
)
|
148,724
|
|||||||||||||
|
Intangible
assets with indefinite lives:
|
||||||||||||||||||||
|
Trademarks
|
143,500
|
—
|
143,500
|
127,500
|
—
|
127,500
|
||||||||||||||
|
Pollution
credits
|
—
|
—
|
—
|
720
|
—
|
720
|
||||||||||||||
|
Total
|
$
|
343,002
|
$
|
(47,584
|
)
|
$
|
295,418
|
$
|
314,689
|
$
|
(37,745
|
)
|
$
|
276,944
|
||||||
Annual
amortization expense for intangible assets is estimated to be as follows for the
five years ending January 3, 2014 (in thousands):
|
Annual
Estimated Expense
|
||||
|
2010
|
$ | 11,542 | ||
|
2011
|
11,319 | |||
|
2012
|
11,236 | |||
|
2013
|
11,000 | |||
|
2014
|
10,759 | |||
7.
Other Current Liabilities
Other
current liabilities are as follows (in thousands):
|
January
2,
2010
|
January
3,
2009
|
|||||||
|
Accrued
customer
rebates
|
$ | 15,613 | $ | 18,427 | ||||
|
Other
accrued liabilities
|
82,466 | 70,443 | ||||||
| $ | 98,079 | $ | 88,870 | |||||
48
CENVEO,
INC. AND SUBSIDIARIES
NOTES
TO CONSOLIDATED FINANCIAL STATEMENTS (CONTINUED)
8.
Long-Term Debt
Long-term
debt is as follows (in thousands):
|
January
2,
2010
|
January
3,
2009
|
|||||||
|
Term
loan, due
2013
|
$ | 683,306 | $ | 707,900 | ||||
|
7⅞%
senior subordinated notes, due 2013
|
296,270 | 303,370 | ||||||
|
10½%
senior notes, due
2016
|
170,000 | 175,000 | ||||||
|
8⅜%
senior subordinated notes, due 2014 ($32.2 million and $72.3 million
outstanding
principal amount as of January 2, 2010 and January 3, 2009,
respectively)
|
32,715 | 73,581 | ||||||
|
Revolving
credit facility, due
2012
|
22,500 | 8,000 | ||||||
|
Other
|
29,126 | 38,504 | ||||||
| 1,233,917 | 1,306,355 | |||||||
|
Less
current
maturities
|
(15,057 | ) | (24,314 | ) | ||||
|
Long-term
debt
|
$ | 1,218,860 | $ | 1,282,041 | ||||
10½%
Notes
On June
13, 2008, the Company issued the 10½% Notes upon the conversion of the Company’s
Senior Unsecured Loan. The 10½% Notes were then sold to qualified
institutional buyers in accordance with Rule 144A under the Securities Act of
1933, and to certain non-U.S. persons in accordance with Regulation S under the
Securities Act of 1933. The Company did not receive any net proceeds as a result
of this transaction.
The 10½% Notes were issued pursuant to
an indenture among the Company, certain subsidiary guarantors and U.S. Bank
National Association, as trustee. The 10½% Notes pay interest semi-annually on
February 15 and August 15, commencing August 15, 2008. The 10½% Notes have no
required principal payments prior to their maturity on August 15, 2016,
constitute senior unsecured obligations and are guaranteed by the Company and
substantially all of the Company’s subsidiaries. The Company can
redeem the 10½% Notes, in whole or in part, on or after August 15, 2012, at
redemption prices ranging from 100% to 105¼%, plus accrued and unpaid
interest. In addition, at any time prior to August 15, 2011, the
Company may redeem up to 35% of the aggregate principal amount of the notes
originally issued at a redemption price of 110½% of the principal amount thereof,
plus accrued and unpaid interest with the net cash proceeds of certain public
equity offerings. Each holder of the 10½% Notes has the right to require the
Company to repurchase such holder’s notes at a purchase price of 101% of the
principal amount thereof, plus accrued and unpaid interest thereon, upon the
occurrence of certain events specified in the indenture that constitute a change
in control of the Company. The 10½% Notes contain covenants, representations,
and warranties substantially similar to the Company’s $320.0 million 7⅞% senior
subordinated notes due 2013 (“7⅞% Notes”) and the $125.0 million 8⅜% senior
subordinated notes (“8⅜% Notes”), and include a senior secured debt to
consolidated cash flow liens incurrence test.
Upon the
issuance of the 10½% Notes and the conversion of the Senior Unsecured Loan, the
Company incurred a loss on early extinguishment of debt of $4.2 million on the
write-off of unamortized debt issuance costs. The Company capitalized debt
issuance costs of approximately $5.3 million, which are being amortized over the
life of the 10½% Notes.
In 2009,
the Company purchased in the open market approximately $5.0 million of its 10½%
Notes and retired them for $3.3 million plus accrued and unpaid
interest. In connection with the retirement of these 10½% Notes, the
Company recorded a gain on extinguishment of debt of $1.6 million, which
included $0.1 million of unamortized deferred costs. These open
market purchases were made within permitted restricted payment limits under the
Company debt agreements.
49
CENVEO,
INC. AND SUBSIDIARIES
NOTES
TO CONSOLIDATED FINANCIAL STATEMENTS (CONTINUED)
8.
Long-Term Debt (Continued)
8⅜%
Notes
On March
5, 2007, the Company commenced a cash tender offer and consent solicitation (the
“Cadmus Tender Offer”) for any and all of the outstanding 8⅜% Notes at total
consideration equal to 101.5% of outstanding principal plus any accrued and
unpaid interest thereon for 8⅜% Notes validly tendered and not withdrawn by
March 16, 2007. Interest on the 8⅜% Notes is payable semi-annually on June 15
and December 15 with no required principal payments prior to maturity on June
15, 2014. In connection with the acquisition of Cadmus, the Company recorded a
$2.8 million increase to the value of the 8⅜% Notes to record them at their fair
value, which fair value increase is being amortized over the life of the 8⅜%
Notes.
On March
19, 2007, the Company paid approximately $20.9 million for the 8⅜% Notes
tendered in the Cadmus Tender Offer, using $20.0 million of delayed-draw term
loan funding under the Amended Credit Facilities and cash on hand. In connection
with the 8⅜% Notes tendered, the Company recorded a loss on early extinguishment
of debt of approximately $0.3 million, which included $0.8 million of tender
premiums and tender-related expenses and the write-off of $0.5 million of the
fair value increase to the 8⅜% Notes recorded in connection with the Cadmus
acquisition. The merger of Cadmus into Cenveo was a “change of control” of
Cadmus under the 8⅜% Notes indenture. On March 23, 2007 and in connection with
the foregoing change of control, the Company extended the scheduled expiration
of the Cadmus Tender Offer until April 18, 2007, modified the offer to purchase
each 8⅜% Note tendered for a price equal to 101.0% of outstanding principal plus
any accrued and unpaid interest, and waived certain consent-related conditions
(the “Change of Control Offer”). On April 23, 2007, the Company settled payment
on all 8⅜% Notes tendered under the Change of Control Offer, and terminated the
remaining amount of the delayed-draw term loan facility under the Amended Credit
Facilities.
In 2009,
the Company purchased in the open market approximately $40.1 million of its 8⅜%
Notes and retired them for $23.0 million plus accrued and unpaid
interest. In connection with the retirement of these 8⅜% Notes, the
Company recorded a gain on extinguishment of debt of $17.6 million, which
included the write off of $0.6 million of above noted fair value increase to the
8⅜% Notes and $0.1 million of fees. In 2008, the Company purchased in the open
market approximately $31.8 million of its 8⅜% Notes and retired them for $19.6
million plus accrued and unpaid interest. In connection with the
retirement of these 8⅜% Notes, the Company recorded a gain on extinguishment of
debt of $12.6 million, which included the write off of $0.5 million of above
noted fair value increase to the 8⅜% Notes and $0.1 million of fees. These open
market purchases were made within permitted restricted payment limits under the
Company debt agreements.
7⅞%
Notes
In 2004,
the Company issued $320.0 million of the 7⅞% Notes, with semi-annual interest
payments due on June 1 and December 1, and no required principal payments prior
to the maturity on December 1, 2013. The Company may redeem these notes, in
whole or in part, at redemption prices from 103.938% to 100%, plus accrued and
unpaid interest.
In 2009,
the Company purchased in the open market approximately $7.1 million of its 7⅞%
Notes and retired them for $4.3 million plus accrued and unpaid
interest. In connection with the retirement of these 7⅞% Notes, the
Company recorded a gain on extinguishment of debt of $2.8 million, which
included the write off of $0.1 million of unamortized debt issuance costs. In
2008, the Company purchased in the open market approximately $16.6 million of
its 7⅞% Notes and retired them for $10.6 million plus accrued and unpaid
interest. In connection with the retirement of these 7⅞% Notes, the
Company recorded a gain on extinguishment of debt of $5.8 million, which
included the write off of $0.2 million of unamortized debt issuance
costs. These open market purchases were made within permitted
restricted payment limits under the Company debt agreements.
Supplemental
Indentures
The
Company entered into supplemental indentures, dated April 16, 2008, August 20,
2008 and October 15, 2009 to the indenture dated June 15, 2004, among Cadmus,
each of the subsidiary guarantors (as defined therein) and U.S. Bank National
Association (as successor trustee), as trustee, pursuant to which the 8⅜% Notes
were issued. Simultaneously, the Company entered into supplemental indentures,
dated April 16, 2008, August 20, 2008 and October 15, 2009 to the indenture
dated February 4, 2004 among the Company, the guarantors named therein and U.S.
Bank National Association, as trustee, pursuant to which the Company’s 7⅞% Notes
were issued. Additionally, on August 20, 2008 and October 15, 2009 the Company
entered into a supplemental indenture among the Company, the guarantors named
therein and U.S. Bank National Association, as trustee, pursuant to which the
10½% Notes were issued. These supplemental indentures provide for the
addition of acquisition subsidiaries as guarantors of the 8⅜%, 7⅞% and 10½%
Notes.
50
CENVEO,
INC. AND SUBSIDIARIES
NOTES
TO CONSOLIDATED FINANCIAL STATEMENTS (CONTINUED)
8.
Long-Term Debt (Continued)
Amended
Credit Facilities and Debt Compliance
The
Company’s Amended Credit Facilities, which are secured by a first priority lien
on substantially all of the Company’s assets, contain, prior to effectiveness of
the February 2010 amendment discussed below, two financial covenants that must
be complied with: a maximum consolidated leverage ratio (the “Leverage
Covenant”), and a minimum consolidated interest coverage ratio (the “Interest
Coverage Covenant”).
On April
24, 2009, the Company completed the 2009 Amendment which included, among other
things, modifications to the Leverage Covenant and the Interest Coverage
Covenant. The Leverage Covenant, with which the Company must be in
pro forma compliance at all times, was increased to 6.25:1.00 through March 31,
2010, and then proceeds to step down through the end of the term of the Amended
Credit Facilities. The Interest Coverage Covenant, with which the Company must
be in pro forma compliance on a quarterly basis, was reduced to 1.85:1.00
through December 31, 2009, and then proceeds to step up through the end of the
term of the Amended Credit Facilities. Additionally, the calculations of these
two financial covenants have been modified to permit the adding back of certain
amounts. The Company was in compliance with all debt agreement covenants as of
January 2, 2010.
As
conditions to the 2009 Amendment, the Company agreed, among other things, to
increase the pricing on all outstanding Revolving Credit Facility balances and
Term Loans to include interest at the three-month London Interbank Offered Rate
(LIBOR) plus a spread ranging from 400 basis points to 450 basis points,
depending on the quarterly Leverage Covenant calculation then in effect.
Previously, the Revolving Credit Facility’s borrowing spread over LIBOR ranged
from 175 basis points to 200 basis points based upon the Leverage Covenant
calculation, and the borrowing spread over LIBOR for the Term Loans was 200
basis points. Further, the 2009 Amendment: (i) reduced the Revolving Credit
Facility from $200.0 million to $172.5 million; (ii) increased the unfunded
commitment fee paid to revolving credit lenders from 50 basis points to 75 basis
points; (iii) eliminated the Company’s ability to request a $300.0 million
incremental term loan facility; (iv) limited new senior unsecured debt and debt
assumed from acquisitions to $50.0 million while the Leverage Covenant
calculation is above 4.50:1.00; (v) eliminated the restricted payments basket,
which includes dividends, share repurchases, debt repurchases and other similar
transactions, while the Leverage Covenant calculation exceeds certain
thresholds; (vi) required that certain additional financial information be
delivered; (vii) lowered the annual amount that can be spent on capital
expenditures to $30.0 million in 2009; and (viii) increased certain mandatory
prepayments. An amendment fee of 50 basis points was paid to all consenting
lenders who approved the 2009 Amendment.
In
connection with the 2009 Amendment, the Company incurred a loss on early
extinguishment of debt of $5.0 million, of which $3.9 million relates to fees
paid to consenting lenders and $1.1 million relates to the write-off of
previously unamortized debt issuance costs. In addition, the Company
capitalized $3.4 million of third party costs and fees paid to consenting
lenders, which are being amortized over the remaining life of the Amended Credit
Facilities.
In
connection with the Cadmus acquisition in 2007, the Company amended and
refinanced its then outstanding credit facilities and recorded a loss on early
extinguishment of debt of $8.4 million, which includes $6.7 million of related
fees and the write-off of $1.7 million of unamortized debt issuance
costs.
Other
Extinguishments
On May 4,
2007, the Company retired the remaining $10.5 million of its $350.0 million 9⅝%
senior notes due 2012 (the “9⅝% Notes”) for 104.813% of the principal amount
plus accrued interest, which was funded with its Revolving Credit
Facility. In connection with this retirement, the Company recorded a
loss on early extinguishment of debt of $0.5 million, representing premiums
paid.
Other
Debt
Other
debt as of January 2, 2010 primarily consisted of equipment loans. Of this debt,
$22.4 million had an average fixed interest rate of 4.9% while $6.8 million had
variable interest rates with an average interest rate of 2.0%.
51
CENVEO,
INC. AND SUBSIDIARIES
NOTES
TO CONSOLIDATED FINANCIAL STATEMENTS (CONTINUED)
8.
Long-Term Debt (Continued)
The
aggregate annual maturities for long-term debt are as follows (in
thousands):
|
2010
|
$ | 15,057 | ||
|
2011
|
13,463 | |||
|
2012
|
33,924 | |||
|
2013
|
963,345 | |||
|
2014
|
35,896 | |||
|
Thereafter
|
172,232 | |||
| $ | 1,233,917 | |||
Cash
interest payments on long-term debt were $103.7 million in 2009, $100.5 million
in 2008 and $89.2 million in 2007.
The
estimated fair value of the Company’s long-term debt was approximately $1.2
billion and $750.0 million as of January 2, 2010 and January 3, 2009,
respectively. The fair value was determined by the Company to be Level 2 under
the fair value hierarchy and was based upon review of interest rates on
financing options available to the Company with similar terms and
maturities.
Interest
expense in 2009 reflected average outstanding debt of approximately $1.3 billion
and a weighted average interest rate of 7.7%, compared to the average
outstanding debt of approximately $1.4 billion and a weighted average interest
rate of 7.2% in 2008.
Interest
Rate Swaps
From time
to time the Company enters into interest rate swap agreements to hedge interest
rate exposure of notional amounts of its floating rate debt. As of
January 2, 2010 and January 3, 2009, the Company had $500.0 million and $595.0
million, respectively, of such interest rate swaps. On June 22, 2009, $220.0
million notional amount interest rate swap agreements matured and were partially
replaced by $125.0 million of forward-starting interest rate swaps that went
effective on the same date as the maturing swap agreements. The Company’s hedges
of interest rate risk were designated and documented at inception as cash flow
hedges and are evaluated for effectiveness at least quarterly. Effectiveness of
the hedges is calculated by comparing the fair value of the derivatives to
hypothetical derivatives that would be a perfect hedge of floating rate debt.
The accounting for gains and losses associated with changes in the fair value of
cash flow hedges and the effect on the Company’s consolidated financial
statements depends on whether the hedge is highly effective in achieving
offsetting changes in fair value of cash flows of the liability hedged. The
effective portion of gain or loss on a cash flow hedge is recorded as a
component of accumulated other comprehensive income in the Company’s
consolidated balance sheet (Note 14). Ineffectiveness, if any, would be
reclassified to interest expense, net in the Company’s consolidated statement of
operations in the period in which the hedged transaction becomes
ineffective.
The
Company’s interest rate swaps are valued using discounted cash flows, as no
quoted market prices exist for the specific instruments. The primary inputs to
the valuation are maturity and interest rate yield curves, specifically
three-month LIBOR, using commercially available market sources. The interest
rate swaps are categorized as Level 2 as required by the Fair Value Measurements
and Disclosures Topic of the ASC 820. The table below presents the fair value of
the Company’s interest rate swaps (in thousands):
|
January
2, 2010
|
January
3, 2009
|
|||||||
|
Current
Liabilities:
|
||||||||
|
Interest
Rate Swaps
|
$ | 9,044 | $ | 4,483 | ||||
|
Long-Term
Liabilities:
|
||||||||
|
Interest
Rate Swaps
|
7,875 | 23,180 | ||||||
|
Forward
Starting Swaps
|
— | 943 | ||||||
8⅞%
Notes Issuance and 2010 Amendment
On
February 5, 2010, the Company issued $400 million of 8⅞% Senior Second Lien
Notes due 2018 (the “8⅞% Notes”) that were sold
with registration rights to qualified institutional buyers in accordance with
Rule 144A under the Securities Act of 1933, and to certain non-U.S. persons in
accordance with Regulation S under the Securities Act of 1933. Net
proceeds after fees and expenses were used to pay down $300.0 million of Term
Loans and $88.0 million outstanding under the Revolving Credit Facility
simultaneously in combination with an amendment to the Company’s Amended Credit
Facilities (the “2010 Amendment”).
52
CENVEO,
INC. AND SUBSIDIARIES
NOTES
TO CONSOLIDATED FINANCIAL STATEMENTS (CONTINUED)
8.
Long-Term Debt (Continued)
The
8⅞% Notes were
issued pursuant to an indenture among the Company, certain subsidiary guarantors
and Wells Fargo Bank, National Association, as trustee, and an Intercreditor
Agreement among the Company, certain subsidiary grantors, Bank of America,
N.A. as first lien agent and control agent, and Wells Fargo Bank,
National Association, as second lien collateral agent. The 8⅞% Notes pay interest
semi-annually on February 1 and August 1, commencing August 1, 2010. The
8⅞% Notes have no
required principal payments prior to their maturity on February 1,
2018. The 8⅞% Notes are guaranteed on
a senior secured basis by the Company and substantially all of its domestic
subsidiaries with a second priority lien on substantially all of the assets that
secure the Amended Credit Facilities, and on a senior unsecured basis by
substantially all of the Company’s Canadian subsidiaries. As such the 8⅞% Notes rank pari passu
with all the Company’s senior debt and senior in right of payment to all of the
Company’s subordinated debt. The Company can redeem the 8⅞% Notes, in whole or in
part, on or after February 1, 2014, at redemption prices ranging from 100.0% to
approximately 104.4%, plus accrued and unpaid interest. In addition, at any time
prior to February 1, 2013, the Company may redeem up to 35% of the aggregate
principal amount of the notes originally issued with the net cash proceeds of
certain public equity offerings. The Company may also redeem up to 10% of the
aggregate principal amount of notes per twelve-month period before February 1,
2014 at a redemption price of 103% of the principal amount, plus accrued and
unpaid interest, and redeem some or all of the notes before February 1, 2014 at
a redemption price of 100% of the principal amount, plus accrued and unpaid
interest, if any, to the redemption date, plus a “make whole” premium. Each
holder of the 8⅞% Notes has the right to
require the Company to repurchase such holder’s notes at a purchase price of
101% of the principal amount thereof, plus accrued and unpaid interest thereon,
upon the occurrence of certain events specified in the indenture that constitute
a change in control. The 8⅞% Notes contain
covenants, representations, and warranties substantially similar to the
Company’s 10½% Notes, including a senior secured debt to consolidated cash flow
liens incurrence test.
The 2010
Amendment provided us, among other things, the ability to pay down at least
$300.0 million of Term Loans and a portion of the Revolving Credit Facility then
outstanding with net proceeds from the 8⅞% Notes. The Leverage
Covenant threshold within the Amended Credit Facilities was reset requiring the
Company to not exceed 6.50:1.00 at any time during fiscal year 2010, stepping
down to 6.25:1.00 during fiscal year 2011 and then reducing to 5.50:1.00 for the
remainder of the term of the Amended Credit Facilities. The Interest Coverage
Covenant was also reset, primarily to allow for interest to be paid on the
8⅞% Notes,
requiring the Company to not be less than 1.70:1.00 through the end of the third
quarter of 2010, and the threshold steps up thereafter starting at 1.85:1.00 in
the fourth quarter of 2010 reaching 2.25:1.00 in 2012. Lenders to the
Amended Credit Facilities also granted the Company the ability to increase the
Revolving Credit Facility or Terms Loans by $100.0 million subject to the
Company’s compliance with the terms contained within the Amended Credit
Facilities. Additionally, the fiscal year 2009 mandatory excess cash flow
payment that was to be made in March 2010 was waived given the substantial pay
down of the Term Loans with net proceeds from the 8⅞% Notes.
As
conditions to the 2010 Amendment, the Company agreed to reduce the Revolving
Credit Facility borrowing capacity, following a $15.0 million capacity increase,
from $187.5 million to $150.0 million when the 2010 Amendment became
effective. Further, the 2010 Amendment, among other things,: (i)
added a maximum first lien leverage ratio covenant that the Company must be in
pro forma compliance with at all times (the “First Lien Leverage Covenant”),
which ratio may not exceed 2.50:1.00 for the first half of fiscal year 2010 and
must be below 2.25:1.00 thereafter to maturity of the Amended Credit Facilities,
and (ii) in calculating its financial covenants, modified the Company’s ability
to add back certain amounts during a given 12-month period and certain cost
savings resulting from acquisitions. No changes were made to pricing
on the Revolving Credit Facility or Terms Loans, while a 15 basis points fee on
a post-amendment balance basis was paid to all consenting lenders who approved
the 2010 Amendment.
In
connection with the 2010 Amendment in the first quarter of 2010, the Company
will incur a loss on early extinguishment of debt of $3.5 million, of which $2.0
million relates to the write-off of previously unamortized debt issuance costs
and $1.5 million relates to fees paid to consenting lenders. In addition, we
will capitalize $2.1 million related to the 2010 Amendment, of which $1.5
million relates to amendment expenses and $0.6 million relates to fees paid to
consenting lenders, both of which will be amortized over the remaining life of
the Amended Credit Facilities. In connection with the issuance of the 8⅞% Notes, the Company will
capitalize $12.2 million related to the issuance of the 8⅞% Notes, of which $7.6
million relates to fees paid to lenders, $2.8 million relates to the
original issuance discount and $1.8 million relates to offering expenses, all of
which will be amortized over the eight year life of the 8⅞% Notes.
53
CENVEO,
INC. AND SUBSIDIARIES
NOTES
TO CONSOLIDATED FINANCIAL STATEMENTS (CONTINUED)
8.
Long-Term Debt (Continued)
Except as
provided in the 2009 Amendment and 2010 Amendment, all other provisions of the
Company’s Amended Credit Facilities remain in full force and effect, including
failure to operate within the revised Leverage Covenant and Interest Coverage
Covenant and new First Lien Leverage Covenant ratio thresholds, in certain
circumstances, or failure to have effective internal controls would prevent the
Company from borrowing additional amounts and could result in a default under
the Amended Credit Facilities. Such default could cause the indebtedness
outstanding under the Amended Credit Facilities and, by reason of
cross-acceleration or cross-default provisions, all of the aforementioned notes
and any other indebtedness the Company may then have, to become immediately due
and payable.
As the
Amended Credit Facilities have senior secured and first priority lien position
in the Company’s capital structure and the most restrictive covenants, then
provided the Company is in compliance with the Amended Credit Facilities, the
Company would also be in compliance, in most circumstances, with the senior
secured liens to consolidated cash flow debt incurrence tests within the
Company’s 8⅞% Notes and 10½% Notes
indentures and the fixed charge coverage liens incurrence tests within all Notes
indentures.
In
conjunction with the 2010 Amendment and issuance of the 8⅞% Notes in the first
quarter of 2010, the Company de-designated $125.0 million of interest rate swap
agreements previously used to hedge interest rate exposure on notional floating
rate debt, of which $75.0 million are to mature in the second quarter of 2011
and $50.0 million are to mature in March 2010. The Company did not
terminate these interest rate swap agreements; however the Company may terminate
them at any time prior to each respective scheduled maturity date. Any
ineffectiveness, as a result of these de-designations, will be marked-to-market
through interest expense, net in the consolidated statement of
operations. The fair value of these de-designated swaps currently
recorded in accumulated other comprehensive loss in the consolidated balance
sheet will be amortized to interest expense, net in the consolidated statement
of operations over the remaining life of each respective interest rate swap
agreement.
9.
Income Taxes
Income
(loss) from continuing operations before income taxes, was as follows for the
years ended (in thousands):
|
January
2,
2010
|
January
3,
2009
|
December
29, 2007
|
||||||||||
|
Domestic
|
$ | (61,391 | ) | $ | (315,140 | ) | $ | 35,712 | ||||
|
Foreign
|
5,801 | (448 | ) | (1,827 | ) | |||||||
| $ | (55,590 | ) | $ | (315,588 | ) | $ | 33,885 | |||||
Income
tax expense (benefit) on income (loss) from continuing operations consisted of
the following for the years ended (in thousands):
|
January
2,
2010
|
January
3,
2009
|
December
29, 2007
|
||||||||||
|
Current
tax expense (benefit):
|
||||||||||||
|
Federal
|
$ | (1,815 | ) | $ | 2,011 | $ | 747 | |||||
|
Foreign
|
2,276 | 960 | (1,300 | ) | ||||||||
|
State
|
1,359 | 2,704 | 1,690 | |||||||||
| 1,820 | 5,675 | 1,137 | ||||||||||
|
Deferred
expense (benefit):
|
||||||||||||
|
Federal
|
(14,643 | ) | (13,889 | ) | 7,400 | |||||||
|
Foreign
|
313 | (1,603 | ) | (703 | ) | |||||||
|
State
|
(3,243 | ) | (8,795 | ) | 2,066 | |||||||
| (17,573 | ) | (24,287 | ) | 8,763 | ||||||||
|
Income
tax expense (benefit)
|
$ | (15,753 | ) | $ | (18,612 | ) | $ | 9,900 | ||||
54
CENVEO,
INC. AND SUBSIDIARIES
NOTES
TO CONSOLIDATED FINANCIAL STATEMENTS (CONTINUED)
9.
Income Taxes (Continued)
A
reconciliation of the expected tax expense (benefit) based on the federal
statutory tax rate to the Company’s actual income tax expense (benefit) is
summarized as follows for the years ended (in thousands):
|
January
2,
2010
|
January
3,
2009
|
December
29,
2007
|
||||||||||
|
Expected
tax expense (benefit) at federal statutory income tax
rate
|
$ | (19,456 | ) | $ | (110,456 | ) | $ | 11,860 | ||||
|
State
and local income tax expense (benefit)
|
(1,230 | ) | (1,302 | ) | 2,352 | |||||||
|
Change
in valuation
allowance
|
356 | (1,298 | ) | (4,621 | ) | |||||||
|
Change
in contingency
reserves
|
265 | (4 | ) | 299 | ||||||||
|
Non-U.S.
tax rate
differences
|
560 | (486 | ) | (478 | ) | |||||||
|
Non-deductible
goodwill
|
— | 90,990 | — | |||||||||
|
Non-deductible
expenses
|
4,516 | 2,883 | 1,349 | |||||||||
|
Non-deductible
investment expense
|
— | — | 274 | |||||||||
|
Statutory
foreign rate
change
|
— | — | (921 | ) | ||||||||
|
Other
|
(764 | ) | 1,061 | (214 | ) | |||||||
|
Income
tax expense
(benefit)
|
$ | (15,753 | ) | $ | (18,612 | ) | $ | 9,900 | ||||
Deferred
taxes are recorded to give recognition to temporary differences between the tax
basis of assets and liabilities and their reported amounts in the financial
statements. The tax effects of these temporary differences are recorded as
deferred tax assets and deferred tax liabilities. Deferred tax assets generally
represent items that can be used as a tax deduction or credit in future years.
Deferred tax liabilities generally represent items that have been deducted for
tax purposes, but have not yet been recorded in the consolidated statements of
operations. The tax effects of temporary differences that give rise to the
deferred tax assets and deferred tax liabilities of the Company, were as follows
(in thousands):
|
January
2,
2010
|
January
3,
2009
|
|||||||
|
Deferred
tax assets:
|
||||||||
|
Net
operating loss
carryforwards
|
$ | 89,263 | $ | 63,539 | ||||
|
Capital
loss
carryback
|
— | 3,647 | ||||||
|
Compensation
and benefit related accruals
|
55,774 | 43,077 | ||||||
|
Foreign
tax credit
carryforwards
|
16,661 | 16,661 | ||||||
|
Alternative
minimum tax credit carryforwards
|
10,644 | 10,000 | ||||||
|
Accounts
receivable
|
3,006 | 3,275 | ||||||
|
Restructuring
accruals
|
9,699 | 5,428 | ||||||
|
Accrued
tax and
interest
|
5,014 | 12,307 | ||||||
|
Other
|
16,544 | 18,841 | ||||||
|
Valuation
allowance
|
(24,461 | ) | (28,081 | ) | ||||
|
Total
deferred tax
assets
|
182,144 | 148,694 | ||||||
|
Deferred
tax liabilities:
|
||||||||
|
Property,
plant and
equipment
|
(62,126 | ) | (60,944 | ) | ||||
|
Goodwill
and other intangible assets
|
(96,644 | ) | (86,633 | ) | ||||
|
Inventory
|
365 | 1,029 | ||||||
|
Other
|
(6,943 | ) | (234 | ) | ||||
|
Total
deferred tax
liabilities
|
(165,348 | ) | (146,782 | ) | ||||
|
Net
deferred tax
asset
|
$ | 16,796 | $ | 1,912 | ||||
55
CENVEO,
INC. AND SUBSIDIARIES
NOTES
TO CONSOLIDATED FINANCIAL STATEMENTS (CONTINUED)
9.
Income Taxes (Continued)
The net
deferred tax asset (liability) included the following (in
thousands):
|
January
2,
2010
|
January
3,
2009
|
|||||||
|
Current
deferred tax asset (included in prepaid and other current
assets)
|
$ | 21,800 | $ | 28,684 | ||||
|
Long-term
deferred tax
liability
|
(5,004 | ) | (26,772 | ) | ||||
|
Total
|
$ | 16,796 | $ | 1,912 | ||||
The
Company has federal and state net operating loss carryforwards. The tax effect
of these attributes was $89.3 million as of January 2, 2010. Federal net
operating loss carryforwards of $223.1 million will expire in 2024 through 2029,
foreign tax credit carryforwards of $16.7 million will expire in 2012 through
2015 and alternative minimum tax credit carryforwards of $10.6 million do not
have an expiration date.
The
Company assesses the recoverability of its deferred tax assets and, to the
extent recoverability does not satisfy the “more likely than not” recognition
criteria under ASC 740, records a valuation allowance against its deferred tax
assets. The Company considered its recent operating results and anticipated
future taxable income in assessing the need for its valuation allowance. As a
result, in the fourth quarter of 2009 and 2008, we adjusted our valuation
allowance by approximately $12.5 million, primarily due to the release of
valuation allowance against goodwill in connection with the acquisition of
Nashua, and approximately $1.3 million, respectively, to reflect the realization
of deferred tax assets.
The
remaining portion of the Company’s valuation allowance as of January 2, 2010
will be maintained until there is sufficient positive evidence to conclude that
it is more likely than not that the remaining deferred tax assets will be
realized. When sufficient positive evidence exists, the Company’s income tax
expense will be reduced by the decrease in its valuation allowance. An increase
or reversal of the Company’s valuation allowance could have a significant
negative or positive impact on the Company’s future earnings.
Effective
January 1, 2007, the Company adopted ASC 740 subtopic 10, which clarifies the
accounting for uncertainty in income taxes recognized in the consolidated
financial statements by prescribing a recognition threshold and measurement
attribute for the financial statement recognition and measurement of a tax
position taken or expected to be taken on a tax return. As a result of this
adoption, the Company did not record an adjustment to its liability for
unrecognized income tax benefits or retained deficit. Included in the balance of
unrecognized tax benefits as of January 2, 2010 are $6.7 million of tax benefits
that, if recognized would affect the effective tax rate. Also
included in the balance of unrecognized tax benefits as of January 2, 2010 are
tax benefits that, if recognized would result in adjustments of $2.9 million to
other tax accounts. There is a reasonable possibility that within the next
twelve months the Company may decrease its liability for uncertain tax positions
by approximately $10.3 million, which is included in other current liabilities
in the consolidated balance sheet, due to the expiration of certain statutes of
limitations. The Company recognizes interest accrued related to unrecognized tax
benefits and penalties as income tax expense. Related to the
uncertain tax benefits noted above, the Company accrued interest of $1.3 million
during 2009 and, in total, as of January 2, 2010, has recognized a liability for
penalties of $0.1 million and interest of $4.3 million.
The
Company’s unrecognized tax benefit activity for the years ending 2007, 2008 and
2009 was as follows (in thousands):
| Unrecognized tax benefit – December 30, 2006 | $ | 10,748 | ||
|
Gross
increases - tax positions in prior period
|
540 | |||
|
Gross
increases - tax positions in current
period
|
6,743 | |||
|
Unrecognized
tax benefit – December 29, 2007
|
18,031 | |||
|
Gross
increases - tax positions in prior period
|
308 | |||
|
Gross
decreases - tax positions in prior period
|
(1,162 | ) | ||
|
Unrecognized
tax benefit – January 3, 2009
|
17,177 | |||
|
Gross
increases - tax positions in prior period
|
203 | |||
|
Gross
decreases – expiration of applicable statute of limitations
|
(7,798 | ) | ||
|
Unrecognized
tax benefit – January 2, 2010
|
$ | 9,582 |
56
CENVEO,
INC. AND SUBSIDIARIES
NOTES
TO CONSOLIDATED FINANCIAL STATEMENTS (CONTINUED)
9.
Income Taxes (Continued)
The
Internal Revenue Service (“IRS”) has reviewed the Company’s federal income tax
returns through 2002. The Company’s federal income tax returns for tax years
after 2002 remain subject to examination by the IRS. The various states in which
the Company is subject to income tax are generally open for the tax years after
2004. In Canada, the Company remains subject to audit for tax years after 2002.
The Company does not believe that the outcome of any examination will have a
material impact on its consolidated financial statements.
Net cash
payments for income taxes were $1.5 million in 2009, $1.6 million in 2008 and
$3.8 million in 2007.
10.
Restructuring, Impairment and Other Charges
The
Company has two active and two residual cost savings plans: (i) the Nashua Plan
(Note 2) and the 2009 Cost Savings and Restructuring Plan; and (ii) the 2007
Cost Savings and Integration Plan and the 2005 Cost Savings and Restructuring
Plan.
2009
Cost Savings and Restructuring Plan
In the
first quarter of 2009, the Company developed and implemented its 2009 cost
savings and restructuring plan to reduce its operating costs and realign its
manufacturing platform in order to compete effectively during the current
economic downturn. In connection with the 2009 plan, the Company implemented
cost savings initiatives throughout its operations and closed three envelope
plants in Deer Park, New York, Boone, Iowa and Carlstadt, New Jersey, one
journal printing plant in Easton, Maryland, one commercial printing plant in Los
Angeles, California, a forms plant in Jaffrey, New Hampshire and a content
facility in Columbus, Ohio and consolidated them into existing operations. The
Company also continued the consolidation of certain back office functions into
specific centralized locations. In the fourth quarter, the Company announced the
closure of its commercial printing plant in Baltimore, Maryland. As a result of
the completed or announced actions in 2009, the Company has reduced its
headcount by approximately 1,700. The Company anticipates being substantially
complete with the implementation of these cost savings initiatives in the first
quarter of 2010. The following tables present the details of the expenses
recognized as a result of this plan.
2009
Activity
Restructuring
and impairment charges for the year ended January 2, 2010 were as follows (in
thousands):
|
Envelopes,
Forms
and
Labels
|
Commercial
Printing
|
Corporate
|
Total
|
|||||||||||||
|
Employee
separation costs
|
$ | 5,505 | $ | 12,842 | $ | 1,156 | $ | 19,503 | ||||||||
|
Asset
impairments, net of gains on sale
|
2,944 | 11,077 | 143 | 14,164 | ||||||||||||
|
Equipment
moving expenses
|
1,863 | 3,427 | — | 5,290 | ||||||||||||
|
Lease
termination expenses
|
3,126 | 1,687 | 210 | 5,023 | ||||||||||||
|
Multi-employer
pension withdrawal expenses
|
— | 11,303 | — | 11,303 | ||||||||||||
|
Building
clean-up and other expenses
|
2,196 | 3,728 | 184 | 6,108 | ||||||||||||
|
Total
restructuring and impairment charges
|
$ | 15,634 | $ | 44,064 | $ | 1,693 | $ | 61,391 | ||||||||
A summary
of the activity charged to the restructuring liabilities for the 2009 Cost
Savings and Restructuring Plan was as follows (in thousands):
|
Lease
Termination
|
Employee
Separation
Costs
|
Pension
Withdrawal
Liabilities
|
Building
Clean-up
and
Other
Expenses
|
Total
|
||||||||||||||||
|
Balance
at January 3, 2009
|
$ | — | $ | — | $ | — | $ | — | $ | — | ||||||||||
|
Accruals,
net
|
5,023 | 19,503 | 11,303 | 6,108 | 41,937 | |||||||||||||||
|
Payments
|
(2,799 | ) | (16,100 | ) | — | (5,968 | ) | (24,867 | ) | |||||||||||
|
Balance
at January 2, 2010
|
$ | 2,224 | $ | 3,403 | $ | 11,303 | $ | 140 | $ | 17,070 | ||||||||||
57
CENVEO,
INC. AND SUBSIDIARIES
NOTES
TO CONSOLIDATED FINANCIAL STATEMENTS (CONTINUED)
10.
Restructuring, Impairment and Other Charges (Continued)
2007
Cost Savings and Integration Plan
In 2007,
the Company formulated its cost savings and integration plan related to its 2007
Acquisitions. In connection with the implementation of this plan, during 2007,
the Company closed its envelope plant in O’Fallon, Missouri, its forms plant in
Girard, Kansas and commercial printing plants in San Francisco, California,
Seattle, Washington, and Philadelphia, Pennsylvania and integrated these
operations into acquired and other operations. In 2008, the Company continued
the implementation of cost savings initiatives throughout its operations and
closed a commercial printing plant in St. Louis, Missouri. As a result of cost
savings and integration plan actions in 2008, the Company reduced its headcount
by approximately 1,200. The following tables present the details of the expenses
recognized as a result of this plan.
2009
Activity
Restructuring
and impairment charges for the year ended January 2, 2010 were as follows (in
thousands):
|
Envelopes,
Forms
and
Labels
|
Commercial
Printing
|
Corporate
|
Total
|
|||||||||||||
|
Employee
separation costs
|
$ | 122 | $ | 87 | $ | 29 | $ | 238 | ||||||||
|
Asset
impairments, net of gain on sale
|
67 | 981 | — | 1,048 | ||||||||||||
|
Equipment
moving expenses
|
— | 59 | — | 59 | ||||||||||||
|
Lease
termination expenses
|
140 | (51 | ) | 3 | 92 | |||||||||||
|
Multi-employer
pension withdrawal income
|
— | 2,133 | — | 2,133 | ||||||||||||
|
Building
clean-up and other expenses
|
182 | 698 | 67 | 947 | ||||||||||||
|
Total
restructuring and impairment charges
|
$ | 511 | $ | 3,907 | $ | 99 | $ | 4,517 | ||||||||
2008
Activity
Restructuring
and impairment charges for the year ended January 3, 2009 were as follows (in
thousands):
|
Envelopes,
Forms
and
Labels
|
Commercial
Printing
|
Corporate
|
Total
|
|||||||||||||
|
Goodwill
impairment charges
|
$ | 168,429 | $ | 204,392 | $ | — | $ | 372,821 | ||||||||
|
Employee
separation costs
|
2,739 | 5,961 | 290 | 8,990 | ||||||||||||
|
Asset
impairments, net of gain on sale
|
1,130 | 1,421 | — | 2,551 | ||||||||||||
|
Equipment
moving expenses
|
324 | 658 | — | 982 | ||||||||||||
|
Lease
termination expenses
|
665 | 1,591 | 63 | 2,319 | ||||||||||||
|
Multi-employer
pension withdrawal income
|
— | (236 | ) | — | (236 | ) | ||||||||||
|
Building
clean-up and other expenses
|
562 | 1,671 | 51 | 2,284 | ||||||||||||
|
Total
restructuring and impairment charges
|
$ | 173,849 | $ | 215,458 | $ | 404 | $ | 389,711 | ||||||||
2007
Activity
Restructuring
and impairment charges for the year ended December 29, 2007 were as follows (in
thousands):
|
Envelopes,
Forms
and
Labels
|
Commercial
Printing
|
Total
|
||||||||||
|
Employee
separation costs
|
$ | 2,381 | $ | 2,684 | $ | 5,065 | ||||||
|
Asset
impairments
|
3,989 | 4,159 | 8,148 | |||||||||
|
Equipment
moving expenses
|
1,389 | 1,166 | 2,555 | |||||||||
|
Lease
termination expenses
|
126 | 3,773 | 3,899 | |||||||||
|
Multi-employer
pension withdrawal expenses
|
— | 2,092 | 2,092 | |||||||||
|
Building
clean-up and other expenses
|
885 | 1,784 | 2,669 | |||||||||
|
Total
restructuring and impairment charges
|
$ | 8,770 | $ | 15,658 | $ | 24,428 | ||||||
58
CENVEO,
INC. AND SUBSIDIARIES
NOTES
TO CONSOLIDATED FINANCIAL STATEMENTS (CONTINUED)
10.
Restructuring, Impairment and Other Charges (Continued)
A summary
of the activity charged to restructuring liabilities relating to the 2007 cost
savings and integration plan is as follows (in thousands):
|
Lease
Termination
Costs
|
Employee
Separation
Costs
|
Pension
Withdrawal
Liabilities
|
Total
|
|||||||||||||
|
Balance
as of December 29, 2007
|
$ | 3,582 | $ | 541 | $ | 2,092 | $ | 6,215 | ||||||||
|
Accruals,
net
|
2,319 | 8,990 | (236 | ) | 11,073 | |||||||||||
|
Payments
|
(2,312 | ) | (7,556 | ) | (56 | ) | (9,924 | ) | ||||||||
|
Balance
as of January 3, 2009
|
3,589 | 1,975 | 1,800 | 7,364 | ||||||||||||
|
Accruals,
net
|
92 | 238 | 2,133 | 2,463 | ||||||||||||
|
Payments
|
(2,040 | ) | (2,212 | ) | (777 | ) | (5,029 | ) | ||||||||
|
Balance
as of January 2, 2010
|
$ | 1,641 | $ | 1 | $ | 3,156 | $ | 4,798 | ||||||||
2005
Cost Savings and Restructuring Plan
In the
fourth quarter of 2007, the Company completed the implementation of its 2005
cost savings and restructuring plan that it initiated in September 2005, that
among other things, included consolidating purchasing activities and
manufacturing platform with the closure of two manufacturing facilities in 2007
that were integrated into existing operations, reducing corporate and field
human resources, streamlining information technology infrastructure and
eliminating discretionary spending. As a result of these actions, the
Company reduced headcount by approximately 100 employees and closed and
consolidated two commercial printing operations in 2007. During 2006, the
Company reduced headcount by approximately 900 employees, consolidated seven
manufacturing facilities and closed three printing operations. The cumulative
total costs incurred through January 2, 2010 related to this plan for envelopes,
forms and labels, commercial printing and corporate were $33.9 million, $73.4
million and $30.4 million, respectively. The following tables and discussion
present the details of the expenses recognized as a result of this
plan.
2009
Activity
Restructuring
and impairment charges for the year ended January 2, 2010 were as follows (in
thousands):
|
Envelopes,
Forms
and
Labels
|
Commercial
Printing
|
Corporate
|
Total
|
|||||||||||||
|
Employee
separation
costs
|
$ | — | $ | — | $ | — | $ | — | ||||||||
|
Asset
impairments, net of gain on sale
|
— | 18 | — | 18 | ||||||||||||
|
Equipment
moving
expenses
|
— | 14 | — | 14 | ||||||||||||
|
Lease
termination
expenses
|
(203 | ) | 419 | 93 | 309 | |||||||||||
|
Building
clean-up and other expenses
|
279 | 322 | — | 601 | ||||||||||||
|
Total
restructuring and impairment charges
|
$ | 76 | $ | 773 | $ | 93 | $ | 942 | ||||||||
2008
Activity
Restructuring
and impairment charges for the year ended January 3, 2009 were as follows (in
thousands):
|
Envelopes,
Forms
and
Labels
|
Commercial
Printing
|
Corporate
|
Total
|
|||||||||||||
|
Employee
separation
costs
|
$ | 36 | $ | 132 | $ | 35 | $ | 203 | ||||||||
|
Asset
impairments, net of gain on sale
|
— | (226 | ) | — | (226 | ) | ||||||||||
|
Equipment
moving
expenses
|
— | 520 | — | 520 | ||||||||||||
|
Lease
termination
expenses
|
(93 | ) | 492 | 218 | 617 | |||||||||||
|
Building
clean-up and other expenses
|
386 | 1,192 | 25 | 1,603 | ||||||||||||
|
Total
restructuring and impairment charges
|
$ | 329 | $ | 2,110 | $ | 278 | $ | 2,717 | ||||||||
59
CENVEO,
INC. AND SUBSIDIARIES
NOTES
TO CONSOLIDATED FINANCIAL STATEMENTS (CONTINUED)
10.
Restructuring, Impairment and Other Charges (Continued)
2007
Activity
Restructuring
and impairment charges for the year ended December 29, 2007 were as follows (in
thousands):
|
Envelopes,
Forms
and
Labels
|
Commercial
Printing
|
Corporate
|
Total
|
|||||||||||||
|
Employee
separation
costs
|
$ | 1,888 | $ | 2,960 | $ | 251 | $ | 5,099 | ||||||||
|
Asset
impairments, net of gain on sale
|
(349 | ) | 4,242 | — | 3,893 | |||||||||||
|
Equipment
moving
expenses
|
792 | 554 | — | 1,346 | ||||||||||||
|
Lease
termination
expenses
|
(132 | ) | 1,471 | 112 | 1,451 | |||||||||||
|
Building
clean-up and other expenses
|
381 | 3,394 | 94 | 3,869 | ||||||||||||
|
Total
restructuring and impairment charges
|
$ | 2,580 | $ | 12,621 | $ | 457 | $ | 15,658 | ||||||||
A summary
of the activity charged to the restructuring liabilities as a result of the 2005
cost savings and restructuring plan is as follows (in thousands):
|
Lease
Termination
Costs
|
Employee
Separation
Costs
|
Pension
Withdrawal
Liabilities
|
Total
|
||||||||||||
|
Balance
as of December 29, 2007
|
$
|
4,793
|
$
|
1,163
|
$
|
297
|
$
|
6,253
|
|||||||
|
Accruals,
net
|
617
|
203
|
—
|
820
|
|||||||||||
|
Payments
|
(1,533
|
)
|
(1,366
|
)
|
(89
|
)
|
(2,988
|
)
|
|||||||
|
Balance
as of January 3, 2009
|
3,877
|
—
|
208
|
4,085
|
|||||||||||
|
Accruals,
net
|
309
|
—
|
—
|
309
|
|||||||||||
|
Payments
|
(2,508
|
)
|
—
|
(120
|
)
|
(2,628
|
)
|
||||||||
|
Balance
as of January 2, 2010
|
$
|
1,678
|
$
|
—
|
$
|
88
|
$
|
1,766
|
|||||||
Other
Charges
In
connection with the internal review conducted by outside counsel under the
direction of the Company’s audit committee in the first quarter of 2008, the
Company incurred a non-recurring charge in 2008 of approximately $6.7 million
for professional fees.
11.
Stock-Based Compensation
The
Company’s 2007 Long-Term Equity Incentive Plan, as amended and approved in May
2008 (the “2007 Plan”) authorizes the issuance of up to 4,500,000 shares of the
Company’s common stock. Upon approval of the 2007 Plan, the Company ceased
making awards under its prior equity plans, including the Company’s 2001
Long-Term Equity Incentive Plan. Unused shares previously authorized under prior
plans have been rolled over into the 2007 Plan and increased the total number of
shares authorized for issuance under the 2007 Plan by 320,750 shares as of
January 2, 2010.
The
Company’s outstanding unvested stock options have maximum contractual terms of
up to ten years, principally vest ratably over four years and were granted at
exercise prices equal to the market price of the Company’s common stock on the
date of grant. The Company’s outstanding stock options are exercisable into
shares of the Company’s common stock. The Company’s outstanding restricted share
units (“RSUs”) principally vest ratably over four years. Upon vesting, RSUs
convert into shares of the Company’s common stock. The Company currently issues
authorized shares of common stock upon vesting of restricted shares or the
exercise of other equity awards. The Company has no outstanding restricted
shares or stock appreciation rights.
The
Company measures the cost of employee services received in exchange for an award
of equity instruments, including grants of employee stock options, restricted
stock and restricted share units, based on the fair value of the award at the
date of grant in accordance with the modified prospective method under ASC 718.
The Company uses the Black-Scholes model for purposes of determining the fair
value of stock options granted and recognizes compensation costs ratably over
the requisite service period for each separately vesting portion of the award,
net of estimated forfeitures.
60
CENVEO,
INC. AND SUBSIDIARIES
NOTES
TO CONSOLIDATED FINANCIAL STATEMENTS (CONTINUED)
11.
Stock-Based Compensation (Continued)
Total
share-based compensation expense recognized in selling, general and
administrative expenses in the Company’s consolidated statements of operations
was $14.3 million, $18.1 million and $10.3 million for the years ended January
2, 2010, January 3, 2009, and December 29, 2007, respectively. Income
tax benefit related to the Company’s stock-based compensation expense was $2.2
million, $5.7 million and $3.3 million for the years ended January 2, 2010,
January 3, 2009, and December 29, 2007, respectively.
As of
January 2, 2010, there was approximately $23.7 million of total unrecognized
compensation cost related to unvested share-based compensation grants, which is
expected to be amortized over a weighted-average period of 2.0
years.
Stock
Options
A summary
of the Company’s outstanding stock options as of and for the years ended January
2, 2010, January 3, 2009 and December 29, 2007 are as follows:
|
Options
|
Weighted
Average
Exercise
Price
|
Weighted
Average
Remaining
Contractual
Term
(In
Years)
|
Aggregate
Intrinsic
Value(a)
(in
thousands)
|
|||||||
|
Outstanding
as of December 30, 2006
|
3,326,780
|
$
|
14.71
|
5.7
|
$
|
21,589
|
||||
|
Granted
|
780,000
|
17.89
|
||||||||
|
Exercised
|
(34,175
|
)
|
8.92
|
$
|
463
|
|||||
|
Forfeited
|
(222,625
|
)
|
18.84
|
|||||||
|
Outstanding
as of December 29, 2007
|
3,849,980
|
$
|
15.14
|
4.8
|
$
|
13,661
|
||||
|
Granted
|
—
|
—
|
||||||||
|
Exercised
|
(209,880
|
)
|
8.93
|
$
|
516
|
|||||
|
Forfeited
|
(718,125
|
)
|
17.04
|
|||||||
|
Outstanding
as of January 3, 2009
|
2,921,975
|
$
|
15.12
|
3.9
|
$
|
32
|
||||
|
Granted
|
1,315,328
|
(b)
|
4.27
|
|||||||
|
Exercised
|
(106,452
|
)
|
3.82
|
$
|
421
|
|||||
|
Forfeited
|
(213,000
|
)
|
16.13
|
|||||||
|
Outstanding
as of January 2, 2010
|
3,917,851
|
$
|
11.73
|
3.7
|
$
|
5,513
|
||||
|
Exercisable
as of December 29, 2007
|
1,316,855
|
$
|
12.71
|
4.5
|
$
|
7,503
|
||||
|
Exercisable
as of January 3, 2009
|
1,678,225
|
$
|
13.76
|
3.9
|
$
|
32
|
||||
|
Exercisable
as of January 2, 2010
|
2,288,226
|
$
|
13.81
|
2.8
|
$
|
437
|
||||
________________________
|
|
(a)
|
Intrinsic
value for purposes of this table represents the amount by which the fair
value of the underlying stock, based on the respective market prices as of
January 2, 2010, January 3, 2009 and December 29, 2007 or, if exercised,
the exercise dates, exceeds the exercise prices of the respective
options.
|
|
|
(b)
|
Includes
176,328 stock options assumed in connection with the acquisition of
Nashua.
|
61
CENVEO,
INC. AND SUBSIDIARIES
NOTES
TO CONSOLIDATED FINANCIAL STATEMENTS (CONTINUED)
11.
Stock-Based Compensation (Continued)
The
weighted-average grant date fair value of stock options granted in 2007 and
2009, were at exercise prices equal to the market price of the stock on the
grant dates, as calculated under the Black-Scholes Model with the
weighted-average assumptions are as follows:
|
January
2,
2010
|
December
29,
2007
|
||||||
|
Weighted
average fair value of option grants during the year
|
$
|
1.68
|
$
|
6.31
|
|||
|
Assumptions:
|
|||||||
|
Expected option life in
years
|
4.25
|
4.25
|
|||||
|
Risk-free interest
rate
|
2.09
|
%
|
4.05
|
%
|
|||
|
Expected
volatility
|
0.460
|
0.363
|
|||||
|
Expected dividend
yield
|
0.0
|
%
|
0.0
|
%
|
|||
The
risk-free interest rate represents the U.S. Treasury Bond constant maturity
yield approximating the expected option life of stock options granted during the
period. The expected option life represents the period of time that the stock
options granted during the period are expected to be outstanding, based on the
mid-point between the vesting date and contractual expiration date of the
option. The expected volatility is based on the historical market price
volatility of the Company’s common stock for the expected term of the options,
adjusted for expected mean reversion.
Restricted
Shares and RSUs
A summary
of the Company’s non-vested restricted shares and RSUs as of and for the three
years ended January 2, 2010 is as follows:
|
Restricted
Shares
|
Weighted
Average
Grant
Date
Fair
Value
|
RSUs
|
Weighted
Average
Grant
Date
Fair
Value
|
||||||||
|
Unvested
as of December 30, 2006
|
150,000
|
$
|
9.52
|
607,150
|
$
|
19.19
|
|||||
|
Granted
|
—
|
—
|
761,750
|
17.89
|
|||||||
|
Vested
|
(50,000
|
)
|
9.52
|
(173,900
|
)
|
20.55
|
|||||
|
Forfeited
|
—
|
—
|
(62,850
|
)
|
18.97
|
||||||
|
Unvested
as of December 29, 2007
|
100,000
|
$ |
9.52
|
1,132,150
|
$ |
18.36
|
|||||
|
Granted
|
—
|
—
|
1,930,410
|
9.77
|
|||||||
|
Vested
|
(50,000
|
)
|
9.52
|
(395,600
|
)
|
18.19
|
|||||
|
Forfeited
|
—
|
—
|
(136,171
|
)
|
17.59
|
||||||
|
Unvested
as of January 3, 2009
|
50,000
|
$ |
9.52
|
2,530,789
|
$ |
11.95
|
|||||
|
Granted
|
171,144
|
(a)
|
6.53
|
562,960
|
4.22
|
||||||
|
Vested
|
(50,000
|
)
|
9.52
|
(1,136,715
|
)
|
11.89
|
|||||
|
Forfeited
|
(10,000
|
)
|
6.53
|
(60,449
|
)
|
9.59
|
|||||
|
Unvested
as of January 2, 2010
|
161,144
|
$ |
6.53
|
1,896,585
|
$ |
9.72
|
|||||
________________________
|
|
(a)
|
Represents
restricted shares that were granted in connection with the acquisition of
Nashua.
|
The total
fair value of restricted shares and RSUs which vested during 2009 was $0.3
million and $5.8 million, respectively, as of the respective vesting dates. The
total fair value of restricted shares and RSUs which vested during 2008 was $0.5
million and $3.8 million, respectively, as of the respective vesting dates. The
total fair value of restricted shares and RSUs which vested during 2007 was $0.9
million and $3.1 million, respectively, as of the respective vesting
dates.
The
Black-Scholes model has limitations on its effectiveness including that it was
developed for use in estimating the fair value of traded options which have no
vesting restrictions and are fully transferable and that the model requires the
use of parameters, such as stock price volatility that must be estimated from
historical data. The Company’s stock option awards to employees have
characteristics significantly different from those of traded options and
parameter estimation methodologies can materially affect fair value
estimates.
62
CENVEO,
INC. AND SUBSIDIARIES
NOTES
TO CONSOLIDATED FINANCIAL STATEMENTS (CONTINUED)
12.
Retirement Plans
Savings
Plan. The Company
sponsors a defined contribution plan to provide substantially all U.S. salaried
and certain hourly employees an opportunity to accumulate personal funds for
their retirement. In 2009, 2008 and 2007, the Company matched only certain union
employee’s voluntary contributions and contributions required under the
collective bargaining agreements assumed with the Nashua acquisition and the
2007 Acquisitions. Company contributions to the plan were $0.1 million in 2009
and 2008 and $1.1 million in 2007. Employees participating in the plan held
2,259,679 shares of the Company’s common stock as of January 2,
2010.
Pension
Plans. The Company currently
maintains pension plans for certain of its employees in the U.S. under
collective bargaining agreements with unions representing these employees. The
Company expects to continue to fund these plans based on governmental
requirements, amounts deductible for income tax purposes and as needed to ensure
that plan assets are sufficient to satisfy plan liabilities.
Nashua,
which was acquired by the Company on September 15, 2009, had two defined benefit
pension plans, which cover eligible Nashua regular full-time employees. Benefits
available under these plans are generally determined by years of service and the
levels of compensation during those years. Prior to the Company’s acquisition of
Nashua, the benefits under the Nashua pension plans were frozen to mitigate the
volatility in pension expense and required cash contributions expected in future
years. Based on actuarial data at the date of acquisition, the Nashua pension
plans were under-funded by approximately $33.3 million.
In
connection with the acquisition of Cadmus, the Company assumed certain defined
benefit pension plans, including participation in one multi-employer retirement
plan that provides defined benefits to employees covered by two collective
bargaining agreements. The defined benefit plans provide benefit payments using
formulas based on an employees compensation and length of service, or stated
amounts for each year of service. Prior to the Company’s acquisition of Cadmus,
the benefits under the Cadmus pension plans, except for one plan, were frozen to
mitigate the volatility in pension expense and required cash contributions
expected in future years.
Supplemental
Executive Retirement Plans. As a result of prior
acquisitions, including Nashua in 2009 and Cadmus in 2007, the Company assumed
responsibility for supplemental executive retirement plans (“SERP”), which
provide benefits to certain former directors and executives. The Nashua SERP,
which was under funded by approximately $2.9 million based on actuarial data at
the date of acquisition, was frozen prior to the acquisition by the Company. For
accounting purposes, these plans are unfunded; however, one plan has annuities
that cover a portion of the liability to the participants in its plan and the
income from the annuities offsets a portion of the cost of the plan. These
annuities are included in other assets, net in the consolidated balance
sheets.
Other Postretirement Plans. Prior to the
acquisition by the Company in 2007, Cadmus maintained
separate postretirement benefit plans (medical and life insurance (“OPEB”)) for
certain of its former employees, which were amended by the Company upon
acquisition. Certain Cadmus employees are eligible for retiree medical coverage
for themselves and their spouses if they retire on or after reaching age 55 with
ten or more years of service. Benefits differ depending upon the date of
retirement.
Nashua
also maintained separate postretirement benefit plans for certain of its former
employees. The plans provide certain postretirement health care and related
benefits to eligible retired employees and their spouses. Salaried participants
generally became eligible for retiree health care benefits after reaching age 60
with ten years of service and retiring prior to January 1, 2003. Benefits,
eligibility and cost-sharing provisions for hourly employees vary by location or
bargaining arrangement. Based on actuarial data at the date of acquisition, the
Nashua postretirement plans were under-funded by approximately $0.3
million.
63
CENVEO,
INC. AND SUBSIDIARIES
NOTES
TO CONSOLIDATED FINANCIAL STATEMENTS (CONTINUED)
12.
Retirement Plans (Continued)
Funded
Status. The
following table provides a reconciliation of the changes in the Company’s
pension, SERP and OPEB plans benefit obligations and fair value of assets for
2009 and 2008, a statement of the funded status as of January 2, 2010 and
January 3, 2009, respectively, and the amounts recognized in the consolidated
balance sheets as of January 2, 2010 and January 3, 2009 (in
thousands).
|
Pensions
|
SERPs
|
OPEBs
|
||||||||||||||||||||||
|
2009
|
2008
|
2009
|
2008
|
2009
|
2008
|
|||||||||||||||||||
|
Reconciliation
of benefit obligation:
|
||||||||||||||||||||||||
|
Benefit
obligation at beginning of year
|
$ | 151,371 | $ | 155,793 | $ | 16,329 | $ | 17,215 | $ | 2,189 | $ | 2,425 | ||||||||||||
|
Projected
benefit obligation assumed from
acquisitions
|
102,724 | — | 2,908 | — | 341 | — | ||||||||||||||||||
|
Service
cost
|
543 | 480 | — | — | — | — | ||||||||||||||||||
|
Interest
cost
|
10,821 | 9,030 | 1,347 | 935 | 133 | 137 | ||||||||||||||||||
|
Actuarial
(gain) loss
|
6,374 | (5,995 | ) | 395 | 110 | 355 | (149 | ) | ||||||||||||||||
|
Plan
amendment (gain) loss
|
— | — | — | — | — | (47 | ) | |||||||||||||||||
|
Benefits
paid
|
(9,467 | ) | (7,937 | ) | (2,014 | ) | (1,931 | ) | (171 | ) | (177 | ) | ||||||||||||
|
Benefit
obligation at end of year
|
$ | 262,366 | $ | 151,371 | $ | 18,965 | $ | 16,329 | $ | 2,847 | $ | 2,189 | ||||||||||||
|
Reconciliation
of fair value of plan assets:
|
||||||||||||||||||||||||
|
Fair
value of plan assets at beginning of year
|
$ | 98,226 | $ | 132,989 | $ | — | $ | — | $ | — | $ | — | ||||||||||||
|
Fair
value of plan assets assumed from
acquisitions
|
69,412 | — | — | — | — | — | ||||||||||||||||||
|
Actual
return on plan assets
|
20,668 | (32,934 | ) | — | — | — | — | |||||||||||||||||
|
Employer
contributions
|
4,594 | 6,108 | 2,014 | 1,931 | 171 | 177 | ||||||||||||||||||
|
Benefits
paid
|
(9,467 | ) | (7,937 | ) | (2,014 | ) | (1,931 | ) | (171 | ) | (177 | ) | ||||||||||||
|
Fair
value of plan assets at end of year
|
183,433 | 98,226 | — | — | — | — | ||||||||||||||||||
|
Funded
status at end of period
|
$ | (78,933 | ) | $ | (53,145 | ) | $ | (18,965 | ) | $ | (16,329 | ) | $ | (2,847 | ) | $ | (2,189 | ) | ||||||
|
Amounts
recognized in accumulated other comprehensive
loss:
|
||||||||||||||||||||||||
|
Net
actuarial loss
|
$ | 34,636 | $ | 42,063 | $ | 1,264 | $ | 870 | $ | 111 | $ | (248 | ) | |||||||||||
|
Prior
service cost
|
10 | 18 | — | — | (42 | ) | (47 | ) | ||||||||||||||||
|
Total
|
$ | 34,646 | $ | 42,081 | $ | 1,264 | $ | 870 | $ | 69 | $ | (295 | ) | |||||||||||
|
Amounts
recognized in the consolidated balance
sheets:
|
||||||||||||||||||||||||
|
Current
liabilities
|
$ | — | $ | — | $ | 2,129 | $ | 1,939 | $ | 367 | $ | 265 | ||||||||||||
|
Long-term
liabilities
|
78,933 | 53,145 | 16,836 | 14,390 | 2,480 | 1,924 | ||||||||||||||||||
|
Total
liabilities
|
$ | 78,933 | $ | 53,145 | $ | 18,965 | $ | 16,329 | $ | 2,847 | $ | 2,189 | ||||||||||||
64
CENVEO,
INC. AND SUBSIDIARIES
NOTES
TO CONSOLIDATED FINANCIAL STATEMENTS (CONTINUED)
12.
Retirement Plans (Continued)
The
following table provides components of the net periodic cost for the pension,
SERP and OPEB plans for the years ended 2009, 2008 and 2007 (in
thousands):
|
January
2,
2010
|
January
3,
2009
|
December
29,
2007
|
||||||||||
|
Service
cost
|
$ | 543 | $ | 480 | $ | 413 | ||||||
|
Interest
cost on projected benefit obligation
|
12,301 | 10,102 | 8,731 | |||||||||
|
Expected
return on plan assets
|
(9,251 | ) | (10,624 | ) | (8,339 | ) | ||||||
|
Net
amortization and deferral
|
2 | 8 | 8 | |||||||||
|
Recognized
actuarial
loss
|
2,383 | 221 | 224 | |||||||||
|
Net
periodic
cost
|
$ | 5,978 | $ | 187 | $ | 1,037 | ||||||
Interest
cost on projected benefit obligation includes $1.5 million, $1.1 million and
$1.1 million related to the Company’s SERP and OPEB plans in 2009, 2008 and
2007, respectively.
The
assumptions used in computing the net periodic cost and the funded status were
as follows:
|
January
2,
2010
|
January
3,
2009
|
December
29, 2007
|
||||||||||
|
Weighted
average discount
rate
|
5.75% | 6.25% | 6.00% | |||||||||
|
Expected
long-term rate of return on plan assets
|
8.00% | 8.00% | 8.00% | |||||||||
|
Rate
of compensation
increase
|
4.00% | 4.00% | 4.00% | |||||||||
The
discount rate assumption used to determine the Company’s pension obligations as
of January 2, 2010 and January 3, 2009 takes into account the projected future
benefit cash flow and the underlying individual yields in the Citigroup Pension
Liability Index that would be available to provide for the payment of those
benefits. The ultimate rate is developed by calculating an equivalent discounted
present value of the benefit cash flow as of January 2, 2010 and January 3,
2009, respectively, using a single discount rate rounded to the nearest
0.25%.
The
expected long-term rate of return on plan assets of 8.0% for the year ended
January 2, 2010 and January 3, 2009, was based on historical returns and the
expectations for future returns for each asset class in which plan assets are
invested as well as the target asset allocation of the investments of the plan
assets.
The range
of asset allocations and the target allocations for the pension and other
post-retirement asset investments were as follows:
|
January
2,
2010
|
January
3,
2009
|
Target
|
|||||||||||
|
Equity
securities
|
46-61% | 46-71% |
|
60-75% |
|
||||||||
|
Fixed
income
securities
|
20-35% | 25-38% |
|
25-35% |
|
||||||||
|
Alternative
investments and
other
|
4-29% | 4-16% |
|
0-10% |
|
||||||||
65
CENVEO,
INC. AND SUBSIDIARIES
NOTES
TO CONSOLIDATED FINANCIAL STATEMENTS (CONTINUED)
12.
Retirement Plans (Continued)
The
Company’s investment objective is to maximize the long-term return on the
pension plan assets within prudent levels of risk. Investments are primarily
diversified with a blend of equity securities, fixed income securities and
alternative investments. Equity investments are diversified by including U.S.
and non-U.S. stocks, growth stocks, value stocks and stocks of large and small
companies. Fixed income securities are primarily U.S. governmental and corporate
bonds, including mutual funds. Alternative investments are primarily private
equity hedge funds and hedge fund-of-funds.
The fair
values of the Company’s pension plan assets at January 2, 2010, by asset
category are as follows (in thousands):
|
Quoted
Market Prices In Active Markets
(Level
1)
|
Significant
Other Observable Inputs
(Level
2)
|
Significant
Unobservable Inputs
(Level
3)
|
Total
|
|||||||||||||
|
Cash
and cash equivalents
|
$ | 4,492 | $ | — | $ | — | $ | 4,492 | ||||||||
|
Fixed
income
|
39,562 | 1,815 | — | 41,377 | ||||||||||||
|
Commodities
|
2,938 | — | — | 2,938 | ||||||||||||
|
Equity
|
96,778 | — | — | 96,778 | ||||||||||||
|
Alternative
investments
|
— | — | 35,707 | 35,707 | ||||||||||||
|
Group
annuity contracts
|
— | 2,141 | — | 2,141 | ||||||||||||
|
Total
|
$ | 143,770 | $ | 3,956 | $ | 35,707 | $ | 183,433 | ||||||||
The
following table provides a summary of changes in the fair value of the Company’s
Level 3 assets (in thousands):
|
Alternative
Investments
|
||||
|
Balance
as of January 3, 2009
|
$ | 16,314 | ||
|
Assumed
in acquisition
|
17,083 | |||
|
Unrealized
gains
|
2,628 | |||
|
Purchases,
sales and settlements
|
(318 | ) | ||
|
Balance
as of January 2, 2010
|
$ | 35,707 | ||
The
projected benefit obligation, accumulated benefit obligation and fair value of
plan assets for the Company’s pension plans with accumulated benefit obligations
in excess of plan assets were as follows (in thousands):
|
January
2,
2010
|
January
3,
2009
|
|||||||
|
Projected
benefit
obligation
|
$ | 281,331 | $ | 167,700 | ||||
|
Accumulated
benefit
obligation
|
280,463 | 166,928 | ||||||
|
Fair
value of plan
assets
|
183,433 | 98,226 | ||||||
The
Company currently expects to contribute approximately $8.1 million to its
pension plans and approximately $2.5 million to its SERP and OPEB plans in
2010.
The
estimated pension benefit payments expected to be paid by the pension plans and
the estimated SERP and OPEB payments expected to be paid by the Company for the
years 2010 through 2014, and in the aggregate for the years 2015 through 2019,
are as follows (in thousands):
|
Pension Plans
|
SERP
|
OPEB
|
|||||||||||
|
2010
|
$ | 13,622 | $ | 2,116 | $ | 377 | |||||||
|
2011
|
14,041 | 2,026 | 340 | ||||||||||
|
2012
|
14,697 | 2,104 | 316 | ||||||||||
|
2013
|
15,246 | 2,164 | 293 | ||||||||||
|
2014
|
15,834 | 2,082 | 271 | ||||||||||
| 2015 – 2019 | 86,635 | 7,731 | 1,075 | ||||||||||
66
CENVEO,
INC. AND SUBSIDIARIES
NOTES
TO CONSOLIDATED FINANCIAL STATEMENTS (CONTINUED)
12.
Retirement Plans (Continued)
Certain
other U.S. employees are included in multi-employer pension plans to which the
Company makes contributions in accordance with contractual union agreements.
Such contributions are made on a monthly basis in accordance with the
requirements of the plans and the actuarial computations and assumptions of the
administrators of the plans. Contributions to multi-employer plans were $2.7
million in 2009, $3.8 million in 2008 and $3.7 million in 2007. In 2009 and
2007, the Company recorded withdrawal liabilities of $13.4 million and $2.1
million, respectively, from certain multi-employer pension plans that were
incurred in connection with its restructuring programs.
13.
Commitments and Contingencies
Leases.
The Company leases buildings and equipment under operating lease agreements
expiring at various dates through 2018. Certain leases include renewal and/or
purchase options, which may be exercised by us. As of January 2, 2010, future
minimum annual lease payments by year and in the aggregate under non-cancelable
lease agreements with original terms of one year or more consisted of the
following (in thousands):
|
2010
|
$ | 25,026 | ||
|
2011
|
20,253 | |||
|
2012
|
14,781 | |||
|
2013
|
11,327 | |||
|
2014
|
7,099 | |||
|
Thereafter
|
12,508 | |||
|
Total
|
$ | 90,994 |
Rent
expense was $33.4 million, $40.2 million and $43.4 million in 2009, 2008 and
2007, respectively.
Environmental. Prior
to the Company’s acquisition of Nashua, Nashua was involved in certain
environmental matters and was designated by the Environmental Protection Agency
(“EPA”) as a potentially responsible party for certain hazardous waste sites. In
addition, Nashua had been notified by certain state environmental agencies that
Nashua may bear responsibility for remedial action at other sites which have not
been addressed by the EPA. The sites at which Nashua may have remedial
responsibilities are in various stages of investigation and remediation. Due to
the unique physical characteristics of each site, the remedial technology
employed, the extended timeframes of each remediation, the interpretation of
applicable laws and regulations and the financial viability of other potential
participants, the Company’s ultimate cost of remediation is an estimate and is
contingent on these factors. As of January 2, 2010, the liability, relating to
Nashua’s environmental matters, was $3.6 million and is included in other
long-term liabilities on the Company’s consolidated balance sheet. Based on
information currently available, the Company believes that Nashua’s remediation
expense, if any, is not likely to have a material adverse effect on its
consolidated financial position or results of operations.
Litigation. The Company is party to
various legal actions that are ordinary and incidental to its business. While
the outcome of pending legal actions cannot be predicted with certainty,
management believes the outcome of these various proceedings will not have a
material adverse effect on the Company’s consolidated financial condition or
results of operations.
Concentrations of
Credit Risk. The
Company has limited concentrations of credit risk with respect to financial
instruments. Temporary cash investments and other investments are placed with
high credit quality institutions, and concentrations within accounts receivable
are generally limited due to the Company’s diverse customer base and its
dispersion across different industries and geographic areas.
Letters of
Credit. As of
January 2, 2010, the Company had outstanding letters of credit of approximately
$21.5 million and a de minimis amount of surety bonds related to performance and
payment guarantees. Based on the Company’s experience with these arrangements,
it does not believe that any obligations that may arise will be
significant.
Tax
Audits. The
Company’s income, sales and use, and other tax returns are routinely subject to
audit by various authorities. The Company believes that the resolution of any
matters raised during such audits will not have a material adverse effect on the
Company’s consolidated financial position or its results of
operations.
67
CENVEO,
INC. AND SUBSIDIARIES
NOTES
TO CONSOLIDATED FINANCIAL STATEMENTS (CONTINUED)
14.
Accumulated Other Comprehensive Loss
The
components of accumulated other comprehensive loss is as follows (in
thousands):
|
January
2,
2010
|
January
3,
2009
|
|||||||
|
Currency
translation
adjustments
|
$ | 3,539 | $ | (899 | ) | |||
|
Unrealized
loss on cash flow hedges, net of tax expense of $4,666 and tax
benefit of $10,101 as of January 2, 2010 and January 3, 2009,
respectively
|
(11,483 | ) | (18,503 | ) | ||||
|
Pension
liability adjustments, net of tax expense of $2,704 and tax benefit of
$13,292 as of January 2, 2010 and January 3, 2009,
respectively
|
(22,332 | ) | (26,950 | ) | ||||
|
Total
accumulated other comprehensive
loss
|
$ | (30,276 | ) | $ | (46,352 | ) | ||
In
connection with the non-cash goodwill impairment charges recorded in the fourth
quarter of 2008, the Company reclassified $1.0 million of currency translation
adjustment into restructuring, impairment and other charges.
15.
Income (Loss) Per Share
Basic
income (loss) per share is computed based upon the weighted average number of
common shares outstanding for the period. Diluted income (loss) per share
reflects the potential dilution that could occur if stock options and RSUs to
issue common stock were exercised under the treasury stock method. For the years
ended January 2, 2010, January 3, 2009 and December 29, 2007, the effect of
approximately 5,865,940, 5,342,400 and 4,021,078 stock options outstanding and
unvested RSUs, which would be calculated using the treasury stock method, were
excluded from the calculation of diluted loss per share.
The
following table sets forth the computation of basic and diluted income (loss)
per share for the years ended (in thousands, except per share
data):
|
January
2, 2010
|
January
3,
2009
|
December
29, 2007
|
||||||||||
|
Numerator
for basic and diluted income (loss) per share:
|
||||||||||||
|
Income
(loss) from continuing
operations
|
$ | (39,837 | ) | $ | (296,976 | ) | $ | 23,985 | ||||
|
Income
(loss) from discontinued operations, net of taxes
|
8,898 | (1,051 | ) | 16,796 | ||||||||
|
Net
income
(loss)
|
$ | (30,939 | ) | $ | (298,027 | ) | $ | 40,781 | ||||
|
Denominator
weighted average common shares outstanding:
|
||||||||||||
|
Basic
shares
|
56,787 | 53,904 | 53,584 | |||||||||
|
Dilutive
effect of equity
awards
|
— | — | 1,061 | |||||||||
|
Diluted
shares
|
56,787 | 53,904 | 54,645 | |||||||||
|
Income
(loss) per share – basic:
|
||||||||||||
|
Continuing
operations
|
$ | (0.70 | ) | $ | (5.51 | ) | $ | 0.45 | ||||
|
Discontinued
operations
|
0.16 | (0.02 | ) | 0.31 | ||||||||
|
Net
income
(loss)
|
$ | (0.54 | ) | $ | (5.53 | ) | $ | 0.76 | ||||
|
Income
(loss) per share - diluted:
|
||||||||||||
|
Continuing
operations
|
$ | (0.70 | ) | $ | (5.51 | ) | $ | 0.44 | ||||
|
Discontinued
operations
|
0.16 | (0.02 | ) | 0.31 | ||||||||
|
Net
income
(loss)
|
$ | (0.54 | ) | $ | (5.53 | ) | $ | 0.75 | ||||
68
CENVEO,
INC. AND SUBSIDIARIES
NOTES
TO CONSOLIDATED FINANCIAL STATEMENTS (CONTINUED)
16.
Segment Information
The
Company is organized into two operating segments: the envelopes, forms and
labels segment and the commercial printing segment. The envelopes, forms and
labels segment specializes in the design, manufacturing and printing of: (i)
custom labels and specialty forms sold through an extensive network of resale
distributors for industries including food and beverage, manufacturing and
pharmacy chains; (ii) stock envelopes, labels and business forms generally sold
to independent distributors, office-products suppliers and office-products
retail chains; and (iii) direct mail and customized envelopes developed for the
advertising, billing and remittance needs of a variety of customers, including
financial services companies. The commercial printing segment
provides print, design and content management offerings, including: (i)
specialty packaging and high quality promotional materials for multinational
consumer products companies; (ii) scientific, technical and medical journals,
special interest and trade magazines for non-profit organizations, educational
institutions and specialty publishers; (iii) high-end color printing of a wide
range of premium products for major national and regional customers; and (iv)
general commercial printing products for regional and local
customers.
Operating
income of each segment includes substantially all costs and expenses directly
related to the segment’s operations. Corporate expenses include corporate
general and administrative expenses including stock-based
compensation.
Corporate
identifiable assets primarily consist of cash and cash equivalents,
miscellaneous receivables, deferred financing fees, deferred tax assets and
other assets.
69
CENVEO,
INC. AND SUBSIDIARIES
NOTES
TO CONSOLIDATED FINANCIAL STATEMENTS (CONTINUED)
16.
Segment Information (Continued)
|
January
2,
2010
|
January
3,
2009
|
December
29,
2007
|
||||||||||
|
Net
sales:
|
||||||||||||
|
Envelopes,
Forms and
Labels
|
$ | 819,399 | $ | 916,145 | $ | 897,722 | ||||||
|
Commercial
Printing
|
895,232 | 1,182,549 | 1,148,994 | |||||||||
|
Total
|
$ | 1,714,631 | $ | 2,098,694 | $ | 2,046,716 | ||||||
|
Operating
income (loss)(1):
|
||||||||||||
|
Envelopes,
Forms and
Labels
|
$ | 77,200 | $ | (40,979 | ) | $ | 117,342 | |||||
|
Commercial
Printing
|
(6,397 | ) | (136,828 | ) | 55,085 | |||||||
|
Corporate
|
(38,615 | ) | (45,739 | ) | (34,877 | ) | ||||||
|
Total
|
$ | 32,188 | $ | (223,546 | ) | $ | 137,550 | |||||
|
Restructuring,
impairment and other charges:
|
||||||||||||
|
Envelopes,
Forms and
Labels
|
$ | 17,405 | $ | 174,178 | $ | 11,350 | ||||||
|
Commercial
Printing
|
48,744 | 217,568 | 28,279 | |||||||||
|
Corporate
|
1,885 | 7,320 | 457 | |||||||||
|
Total
|
$ | 68,034 | $ | 399,066 | $ | 40,086 | ||||||
|
Significant
non-cash charges:
|
||||||||||||
|
Envelopes,
Forms and
Labels
|
$ | 4,011 | $ | 169,916 | $ | 3,640 | ||||||
|
Commercial
Printing
|
27,919 | 210,172 | 16,089 | |||||||||
|
Corporate
|
274 | 1,950 | — | |||||||||
|
Total
|
$ | 32,204 | $ | 382,038 | $ | 19,729 | ||||||
|
Depreciation
and intangible asset amortization:
|
||||||||||||
|
Envelopes,
Forms and
Labels
|
$ | 24,561 | $ | 25,410 | $ | 21,015 | ||||||
|
Commercial
Printing
|
39,825 | 47,164 | 43,346 | |||||||||
|
Corporate
|
2,017 | 1,435 | 1,147 | |||||||||
|
Total
|
$ | 66,403 | $ | 74,009 | $ | 65,508 | ||||||
|
Capital
expenditures:
|
||||||||||||
|
Envelopes,
Forms and
Labels
|
$ | 4,239 | $ | 7,181 | $ | 5,145 | ||||||
|
Commercial
Printing
|
18,150 | 39,819 | 24,546 | |||||||||
|
Corporate
|
2,838 | 2,243 | 1,847 | |||||||||
|
Total
|
$ | 25,227 | $ | 49,243 | $ | 31,538 | ||||||
|
Net
sales by product line:
|
||||||||||||
|
Envelopes
|
$ | 517,512 | $ | 651,235 | $ | 604,351 | ||||||
|
Commercial
Printing and Packaging
|
600,294 | 815,388 | 823,195 | |||||||||
|
Journals
and
Periodicals
|
293,891 | 365,490 | 323,370 | |||||||||
|
Labels
and Business
Forms
|
302,934 | 266,581 | 295,800 | |||||||||
|
Total
|
$ | 1,714,631 | $ | 2,098,694 | $ | 2,046,716 | ||||||
|
Intercompany
sales:
|
||||||||||||
|
Envelopes,
Forms and Labels to Commercial Printing
|
$ | 4,350 | $ | 6,415 | $ | 8,802 | ||||||
|
Commercial
Printing to Envelopes, Forms and Labels
|
1,865 | 3,655 | 6,985 | |||||||||
|
Total
|
$ | 6,215 | $ | 10,070 | $ | 15,787 | ||||||
70
CENVEO,
INC. AND SUBSIDIARIES
NOTES
TO CONSOLIDATED FINANCIAL STATEMENTS (CONTINUED)
16.
Segment Information (Continued)
Summarized
financial information concerning the Company’s reportable segments is as follows
as of and for the years ended (in thousands):
|
January
2,
2010
|
January
3,
2009
|
|||||||
|
Identifiable
assets:
|
||||||||
|
Envelopes,
Forms and
Labels
|
$ | 689,516 | $ | 624,760 | ||||
|
Commercial
Printing
|
776,637 | 863,224 | ||||||
|
Corporate
|
59,620 | 64,130 | ||||||
|
Total
|
$ | 1,525,773 | $ | 1,552,114 | ||||
Geographic
information is as follows as of and for the years ended (in
thousands):
|
January
2,
2010
|
January
3,
2009
|
December
29,
2007
|
||||||||||
|
Net
sales:
|
||||||||||||
|
U.S.
|
$ | 1,636,112 | $ | 2,014,412 | $ | 1,961,505 | ||||||
|
Foreign
|
78,519 | 84,282 | 85,211 | |||||||||
|
Total
|
$ | 1,714,631 | $ | 2,098,694 | $ | 2,046,716 | ||||||
|
January
2,
2010
|
January
3,
2009
|
|||||||
|
Long-lived
assets (property plant and equipment, goodwill and intangible
assets:
|
||||||||
|
U.S.
|
$
|
980,452
|
$
|
991,596
|
||||
|
Foreign
|
22,601
|
16,988
|
||||||
|
Total
|
$
|
1,003,053
|
$
|
1,008,584
|
||||
|
(1)
|
The
Company’s segment operating income (loss) of each reportable segment for
the three-months ended March 28, 2009, three- and six-months ended June
27, 2009 and three- and nine-months ended October 3, 2009, have been
revised to correct an immaterial error related to certain corporate
allocations to each reportable segment during the fourth quarter of
2009. The Company does not believe the effect of these revisions is
material, quantitatively or qualitatively, to its consolidated financial
statements. The table below presents the impact of this revision for each
reportable segment’s operating income (loss) for each period
presented:
|
|
Three
Months Ended
March
28, 2009
|
Three
Months Ended
June
27, 2009
|
Three
Months Ended
October
3, 2009
|
||||||||||||||||
|
As
Reported
|
As
Adjusted
|
As
Reported
|
As
Adjusted
|
As
Reported
|
As
Adjusted
|
|||||||||||||
|
Operating
income (loss):
|
||||||||||||||||||
|
Envelopes,
Forms and Labels
|
$
|
8,406
|
$
|
10,475
|
$
|
10,647
|
$
|
16,457
|
$
|
19,872
|
$
|
27,522
|
||||||
|
Commercial
Printing
|
1,430
|
(639
|
)
|
(7,408
|
)
|
(13,218
|
)
|
14,364
|
6,714
|
|||||||||
|
Corporate
|
(9,615
|
)
|
(9,615
|
)
|
(8,716
|
)
|
(8,716
|
)
|
(9,234
|
)
|
(9,234
|
)
|
||||||
|
Total
|
$
|
221
|
$
|
221
|
$
|
(5,477
|
)
|
$
|
(5,477
|
)
|
$
|
25,002
|
$
|
25,002
|
||||
|
Six
Months Ended
June
27, 2009
|
Nine
Months Ended
October
3, 2009
|
|||||||||||||||||
|
As
Reported
|
As
Adjusted
|
As
Reported
|
As
Adjusted
|
|||||||||||||||
|
Operating
income (loss):
|
||||||||||||||||||
|
Envelopes,
Forms and Labels
|
$
|
19,053
|
$
|
26,932
|
$
|
38,925
|
$
|
54,454
|
||||||||||
|
Commercial
Printing
|
(5,978
|
)
|
(13,857
|
)
|
8,386
|
(7,143
|
)
|
|||||||||||
|
Corporate
|
(18,331
|
)
|
(18,331
|
)
|
(27,565
|
)
|
(27,565
|
)
|
||||||||||
|
Total
|
$
|
(5,256
|
)
|
$
|
(5,256
|
)
|
$
|
19,746
|
$
|
19,746
|
||||||||
71
CENVEO,
INC. AND SUBSIDIARIES
NOTES
TO CONSOLIDATED FINANCIAL STATEMENTS (CONTINUED)
17.
Financial Information for Subsidiary Issuers, Guarantor and Non-Guarantor
Subsidiaries
Cenveo is
a holding company (the “Parent Company”), which is the ultimate parent of all
Cenveo subsidiaries. In January 2004, the Parent Company’s wholly owned
subsidiary, Cenveo Corporation (the “Subsidiary Issuer”), issued the 7⅞% Notes
and, in connection with the acquisition of Cadmus in 2007, assumed Cadmus’ 8⅜%
Notes (the “Subsidiary Issuer Notes”), which are fully and unconditionally
guaranteed, on a joint and several basis, by the Parent Company and
substantially all of its wholly-owned subsidiaries (the “Guarantor
Subsidiaries”).
Presented
below is condensed consolidating financial information for the Parent Company,
the Subsidiary Issuer, the Guarantor Subsidiaries and the Non-Guarantor
Subsidiaries for the three years ended 2009, 2008 and 2007. The condensed
consolidating financial information has been presented to show the nature of
assets held, results of operations and cash flows of the Parent Company, the
Subsidiary Issuer, the Guarantor Subsidiaries and the Non-Guarantor
Subsidiaries, assuming the guarantee structure of the Subsidiary Issuer Notes
was in effect at the beginning of the periods presented.
The
supplemental condensed consolidating financial information reflects the
investments of the Parent Company in the Subsidiary Issuer, the Guarantor
Subsidiaries and the Non-Guarantor Subsidiaries using the equity method of
accounting. The Company’s primary transactions with its subsidiaries other than
the investment account and related equity in net income (loss) of unconsolidated
subsidiaries are the intercompany payables and receivables between its
subsidiaries.
72
CENVEO,
INC. AND SUBSIDIARIES
NOTES
TO CONSOLIDATED FINANCIAL STATEMENTS (CONTINUED)
17.
Financial Information for Subsidiary Issuers, Guarantor and Non-Guarantor
Subsidiaries (Continued)
CENVEO,
INC. AND SUBSIDIARIES
CONDENSED
CONSOLIDATING BALANCE SHEET
January
2, 2010
(in
thousands)
|
Parent
|
Subsidiary
|
Guarantor
|
Non-Guarantor
|
|||||||||||||||||||||
|
Company
|
Issuer
|
Subsidiaries
|
Subsidiaries
|
Eliminations
|
Consolidated
|
|||||||||||||||||||
|
Assets
|
||||||||||||||||||||||||
|
Current
assets:
|
||||||||||||||||||||||||
|
Cash
and cash equivalents
|
$ | — | $ | 8,971 | $ | 764 | $ | 1,061 | $ | — | $ | 10,796 | ||||||||||||
|
Accounts
receivable, net
|
— | 111,687 | 151,046 | 5,830 | — | 268,563 | ||||||||||||||||||
|
Inventories
|
— | 70,252 | 73,715 | 1,261 | — | 145,228 | ||||||||||||||||||
|
Notes
receivable from subsidiaries
|
— | 36,938 | — | — | (36,938 | ) | — | |||||||||||||||||
|
Prepaid
and other current assets
|
— | 50,319 | 13,501 | 1,023 | — | 64,843 | ||||||||||||||||||
|
Total
current assets
|
— | 278,167 | 239,026 | 9,175 | (36,938 | ) | 489,430 | |||||||||||||||||
|
Investment
in subsidiaries
|
(176,510 | ) | 1,537,082 | 4,225 | 6,725 | (1,371,522 | ) | — | ||||||||||||||||
|
Property,
plant and equipment, net
|
— | 125,694 | 261,765 | 420 | — | 387,879 | ||||||||||||||||||
|
Goodwill
|
— | 29,243 | 290,513 | — | — | 319,756 | ||||||||||||||||||
|
Other
intangible assets, net
|
— | 7,590 | 287,828 | — | — | 295,418 | ||||||||||||||||||
|
Other
assets, net
|
— | 26,664 | 6,278 | 348 | — | 33,290 | ||||||||||||||||||
|
Total
assets
|
$ | (176,510 | ) | $ | 2,004,440 | $ | 1,089,635 | $ | 16,668 | $ | (1,408,460 | ) | $ | 1,525,773 | ||||||||||
|
Liabilities
and Shareholders’ (Deficit) Equity
|
||||||||||||||||||||||||
|
Current
liabilities:
|
||||||||||||||||||||||||
|
Current
maturities of long-term debt
|
$ | — | $ | 7,610 | $ | 7,447 | $ | — | $ | — | $ | 15,057 | ||||||||||||
|
Accounts
payable
|
— | 97,442 | 84,657 | 1,841 | — | 183,940 | ||||||||||||||||||
|
Accrued
compensation and related liabilities
|
— | 15,670 | 14,171 | — | — | 29,841 | ||||||||||||||||||
|
Other
current liabilities
|
— | 76,919 | 20,357 | 803 | — | 98,079 | ||||||||||||||||||
|
Intercompany
payable (receivable)
|
— | 781,625 | (786,378 | ) | 4,753 | — | — | |||||||||||||||||
|
Notes
payable to issuer
|
— | — | 36,938 | — | (36,938 | ) | — | |||||||||||||||||
|
Total
current liabilities
|
— | 979,266 | (622,808 | ) | 7,397 | (36,938 | ) | 326,917 | ||||||||||||||||
|
Long-term
debt
|
— | 1,197,461 | 21,399 | — | — | 1,218,860 | ||||||||||||||||||
|
Deferred
income tax liability (asset)
|
— | (47,298 | ) | 53,981 | (1,679 | ) | — | 5,004 | ||||||||||||||||
|
Other
liabilities
|
— | 51,521 | 99,981 | — | — | 151,502 | ||||||||||||||||||
|
Shareholders’
(deficit) equity
|
(176,510 | ) | (176,510 | ) | 1,537,082 | 10,950 | (1,371,522 | ) | (176,510 | ) | ||||||||||||||
|
Total
liabilities and shareholders’ (deficit) equity
|
$ | (176,510 | ) | $ | 2,004,440 | $ | 1,089,635 | $ | 16,668 | $ | (1,408,460 | ) | $ | 1,525,773 | ||||||||||
73
CENVEO,
INC. AND SUBSIDIARIES
NOTES
TO CONSOLIDATED FINANCIAL STATEMENTS (CONTINUED)
17.
Financial Information for Subsidiary Issuers, Guarantor and Non-Guarantor
Subsidiaries (Continued)
CENVEO,
INC. AND SUBSIDIARIES
CONDENSED
CONSOLIDATING STATEMENT OF OPERATIONS
For
the year ended January 2, 2010
(in
thousands)
|
Parent
|
Subsidiary
|
Guarantor
|
Non-Guarantor
|
|||||||||||||||||||||
|
Company
|
Issuer
|
Subsidiaries
|
Subsidiaries
|
Eliminations
|
Consolidated
|
|||||||||||||||||||
|
Net
sales
|
$ | — | $ | 745,381 | $ | 949,974 | $ | 19,276 | $ | — | $ | 1,714,631 | ||||||||||||
|
Cost
of sales
|
— | 629,246 | 753,096 | 12,436 | — | 1,394,778 | ||||||||||||||||||
|
Selling,
general and administrative
|
— | 118,328 | 90,825 | 425 | — | 209,578 | ||||||||||||||||||
|
Amortization
of intangible assets
|
— | 425 | 9,628 | — | — | 10,053 | ||||||||||||||||||
|
Restructuring
and impairment charges
|
— | 43,651 | 24,383 | — | — | 68,034 | ||||||||||||||||||
|
Operating
income (loss)
|
— | (46,269 | ) | 72,042 | 6,415 | — | 32,188 | |||||||||||||||||
|
Interest
expense, net
|
— | 104,585 | 1,538 | (60 | ) | — | 106,063 | |||||||||||||||||
|
Intercompany
interest expense (income)
|
— | (1,042 | ) | 1,042 | — | — | — | |||||||||||||||||
|
(Gain)
loss on early extinguishment of debt
|
— | (16,917 | ) | — | — | — | (16,917 | ) | ||||||||||||||||
|
Other
(income) expense, net
|
— | 930 | (2,586 | ) | 288 | — | (1,368 | ) | ||||||||||||||||
|
Income
(loss) from continuing operations before
income taxes and equity in income of
unconsolidated subsidiaries
|
— | (133,825 | ) | 72,048 | 6,187 | — | (55,590 | ) | ||||||||||||||||
|
Income
tax expense (benefit)
|
— | 893 | (19,431 | ) | 2,785 | — | (15,753 | ) | ||||||||||||||||
|
Income
(loss) from continuing operations before
equity in income of unconsolidated subsidiaries
|
— | (134,718 | ) | 91,479 | 3,402 | — | (39,837 | ) | ||||||||||||||||
|
Equity
in income of unconsolidated
subsidiaries
|
(30,939 | ) | 94,881 | 3,402 | — | (67,344 | ) | — | ||||||||||||||||
|
Income
(loss) from continuing operations
|
(30,939 | ) | (39,837 | ) | 94,881 | 3,402 | (67,344 | ) | (39,837 | ) | ||||||||||||||
|
Income
from discontinued operations, net of taxes
|
— | 8,898 | — | — | — | 8,898 | ||||||||||||||||||
|
Net
income (loss)
|
$ | (30,939 | ) | $ | (30,939 | ) | $ | 94,881 | $ | 3,402 | $ | (67,344 | ) | $ | (30,939 | ) | ||||||||
74
CENVEO,
INC. AND SUBSIDIARIES
NOTES
TO CONSOLIDATED FINANCIAL STATEMENTS (CONTINUED)
17.
Financial Information for Subsidiary Issuers, Guarantor and Non-Guarantor
Subsidiaries (Continued)
CENVEO,
INC. AND SUBSIDIARIES
CONDENSED
CONSOLIDATING STATEMENT OF CASH FLOWS
For
the year ended January 2, 2010
(in thousands)
|
Parent
|
Subsidiary
|
Guarantor
|
Non-
Guarantor
|
|||||||||||||||||||||
|
Company
|
Issuer
|
Subsidiaries
|
Subsidiaries
|
Eliminations
|
Consolidated
|
|||||||||||||||||||
|
Cash
flows from operating activities:
|
||||||||||||||||||||||||
|
Net
cash provided by (used in) operating activities
|
$ | 14,274 | $ | (79,440 | ) | $ | 134,516 | $ | 2,702 | $ | — | $ | 72,052 | |||||||||||
|
Cash
flows from investing activities:
|
||||||||||||||||||||||||
|
Capital
expenditures
|
— | (8,863 | ) | (16,364 | ) | — | — | (25,227 | ) | |||||||||||||||
|
Cost
of business acquisitions, net of cash acquired
|
— | (3,189 | ) | — | — | — | (3,189 | ) | ||||||||||||||||
|
Intercompany
note
|
— | 2,257 | — | — | (2,257 | ) | — | |||||||||||||||||
|
Investment
in guarantor subsidiary preferred shares
|
— | — | — | (6,725 | ) | 6,725 | — | |||||||||||||||||
|
Proceeds
from sale of property, plant and equipment
|
— | 13,041 | 1,578 | — | — | 14,619 | ||||||||||||||||||
|
Proceeds
from sale of investment
|
— | — | 4,032 | — | — | 4,032 | ||||||||||||||||||
|
Net
cash (used in) provided by investing activities
|
— | 3,246 | (10,754 | ) | (6,725 | ) | 4,468 | (9,765 | ) | |||||||||||||||
|
Cash
flows from financing activities:
|
||||||||||||||||||||||||
|
Repayment
of term loans
|
— | (24,594 | ) | — | — | — | (24,594 | ) | ||||||||||||||||
|
Repayment
of 8⅜% senior subordinated notes
|
— | (23,024 | ) | — | — | — | (23,024 | ) | ||||||||||||||||
|
Repayments
of other long-term debt
|
— | (385 | ) | (11,793 | ) | — | — | (12,178 | ) | |||||||||||||||
|
Payment
of amendment and debt issuance costs
|
— | (7,296 | ) | — | — | — | (7,296 | ) | ||||||||||||||||
|
Repayment
of 7⅞% senior subordinated notes
|
— | (4,295 | ) | — | — | — | (4,295 | ) | ||||||||||||||||
|
Repayment
of 10½% senior notes
|
— | (3,250 | ) | — | — | — | (3,250 | ) | ||||||||||||||||
|
Purchase
and retirement of common stock upon vesting
of RSUs
|
(2,043 | ) | — | — | — | — | (2,043 | ) | ||||||||||||||||
|
Payment
of fees on repurchase and retirement of debt
|
— | (94 | ) | — | — | — | (94 | ) | ||||||||||||||||
|
Borrowings
under revolving credit facility, net
|
— | 14,500 | — | — | — | 14,500 | ||||||||||||||||||
|
Proceeds
from exercise of stock options
|
532 | — | — | — | — | 532 | ||||||||||||||||||
|
Proceeds
from issuance of preferred shares
|
— | — | 6,725 | ― | (6,725 | ) | — | |||||||||||||||||
|
Intercompany
note
|
— | — | (2,257 | ) | — | 2,257 | — | |||||||||||||||||
|
Intercompany
advances
|
(12,763 | ) | 128,888 | (116,427 | ) | 302 | — | — | ||||||||||||||||
|
Net
cash (used in) provided by financing activities
|
(14,274 | ) | 80,450 | (123,752 | ) | 302 | (4,468 | ) | (61,742 | ) | ||||||||||||||
|
Effect
of exchange rate changes on cash and cash equivalents
|
— | — | (299 | ) | 106 | — | (193 | ) | ||||||||||||||||
|
Net
increase (decrease) in cash and cash equivalents
|
— | 4,256 | (289 | ) | (3,615 | ) | — | 352 | ||||||||||||||||
|
Cash
and cash equivalents at beginning of period
|
— | 4,715 | 1,053 | 4,676 | — | 10,444 | ||||||||||||||||||
|
Cash
and cash equivalents at end of period
|
$ | — | $ | 8,971 | $ | 764 | $ | 1,061 | $ | — | $ | 10,796 | ||||||||||||
75
CENVEO,
INC. AND SUBSIDIARIES
NOTES
TO CONSOLIDATED FINANCIAL STATEMENTS (CONTINUED)
17.
Financial Information for Subsidiary Issuers, Guarantor and Non-Guarantor
Subsidiaries (Continued)
CENVEO,
INC. AND SUBSIDIARIES
CONDENSED
CONSOLIDATING BALANCE SHEET
January
3, 2009
(in
thousands)
|
Parent
|
Subsidiary
|
Guarantor
|
Non-Guarantor
|
|||||||||||||||||||||
|
Company
|
Issuer
|
Subsidiaries
|
Subsidiaries
|
Eliminations
|
Consolidated
|
|||||||||||||||||||
|
Assets
|
||||||||||||||||||||||||
|
Current
assets:
|
||||||||||||||||||||||||
|
Cash
and cash equivalents
|
$ | — | $ | 4,715 | $ | 1,053 | $ | 4,676 | $ | — | $ | 10,444 | ||||||||||||
|
Accounts
receivable, net
|
— | 127,634 | 137,746 | 4,765 | — | 270,145 | ||||||||||||||||||
|
Inventories
|
— | 86,219 | 72,149 | 1,201 | — | 159,569 | ||||||||||||||||||
|
Notes
receivable from subsidiaries
|
— | 39,195 | — | — | (39,195 | ) | — | |||||||||||||||||
|
Prepaid
and other current assets
|
— | 62,961 | 9,879 | 2,050 | — | 74,890 | ||||||||||||||||||
|
Total
current assets
|
— | 320,724 | 220,827 | 12,692 | (39,195 | ) | 515,048 | |||||||||||||||||
|
Investment
in subsidiaries
|
(220,955 | ) | 1,380,326 | 7,063 | — | (1,166,434 | ) | — | ||||||||||||||||
|
Property,
plant and equipment, net
|
— | 165,140 | 254,841 | 476 | — | 420,457 | ||||||||||||||||||
|
Goodwill
|
— | 29,245 | 281,938 | — | — | 311,183 | ||||||||||||||||||
|
Other
intangible assets, net
|
— | 9,089 | 267,855 | — | — | 276,944 | ||||||||||||||||||
|
Other
assets, net
|
— | 21,936 | 6,205 | 341 | — | 28,482 | ||||||||||||||||||
|
Total
assets
|
$ | (220,955 | ) | $ | 1,926,460 | $ | 1,038,729 | $ | 13,509 | $ | (1,205,629 | ) | $ | 1,552,114 | ||||||||||
|
Liabilities
and Shareholders’ (Deficit) Equity
|
||||||||||||||||||||||||
|
Current
liabilities:
|
||||||||||||||||||||||||
|
Current
maturities of long-term debt
|
$ | — | $ | 15,956 | $ | 8,358 | $ | — | $ | — | $ | 24,314 | ||||||||||||
|
Accounts
payable
|
— | 99,150 | 73,402 | 1,883 | — | 174,435 | ||||||||||||||||||
|
Accrued
compensation and related liabilities
|
— | 21,311 | 16,008 | — | — | 37,319 | ||||||||||||||||||
|
Other
current liabilities
|
— | 74,653 | 13,302 | 915 | — | 88,870 | ||||||||||||||||||
|
Intercompany
payable (receivable)
|
— | 658,885 | (663,337 | ) | 4,452 | — | — | |||||||||||||||||
|
Notes
payable to issuer
|
— | — | 39,195 | — | (39,195 | ) | — | |||||||||||||||||
|
Total
current liabilities
|
— | 869,955 | (513,072 | ) | 7,250 | (39,195 | ) | 324,938 | ||||||||||||||||
|
Long-term
debt
|
— | 1,259,175 | 22,866 | — | — | 1,282,041 | ||||||||||||||||||
|
Deferred
income tax liability (asset)
|
— | (56,500 | ) | 84,076 | (804 | ) | — | 26,772 | ||||||||||||||||
|
Other
liabilities
|
— | 74,785 | 64,533 | — | — | 139,318 | ||||||||||||||||||
|
Shareholders’
(deficit) equity
|
(220,955 | ) | (220,955 | ) | 1,380,326 | 7,063 | (1,166,434 | ) | (220,955 | ) | ||||||||||||||
|
Total
liabilities and shareholders’ (deficit) equity
|
$ | (220,955 | ) | $ | 1,926,460 | $ | 1,038,729 | $ | 13,509 | $ | (1,205,629 | ) | $ | 1,552,114 | ||||||||||
76
CENVEO,
INC. AND SUBSIDIARIES
NOTES
TO CONSOLIDATED FINANCIAL STATEMENTS (CONTINUED)
17.
Financial Information for Subsidiary Issuers, Guarantor and Non-Guarantor
Subsidiaries (Continued)
CENVEO,
INC. AND SUBSIDIARIES
CONDENSED
CONSOLIDATING STATEMENT OF OPERATIONS
For
the year ended January 3, 2009
(in
thousands)
|
Parent
|
Subsidiary
|
Guarantor
|
Non-Guarantor
|
|||||||||||||||||||||
|
Company
|
Issuer
|
Subsidiaries
|
Subsidiaries
|
Eliminations
|
Consolidated
|
|||||||||||||||||||
|
Net
sales
|
$ | — | $ | 993,403 | $ | 1,085,130 | $ | 20,161 | $ | — | $ | 2,098,694 | ||||||||||||
|
Cost
of sales
|
— | 809,380 | 847,861 | 13,944 | — | 1,671,185 | ||||||||||||||||||
|
Selling,
general and administrative
|
— | 144,490 | 97,929 | 562 | — | 242,981 | ||||||||||||||||||
|
Amortization
of intangible assets
|
— | 447 | 8,561 | — | — | 9,008 | ||||||||||||||||||
|
Restructuring
and impairment charges
|
— | 167,897 | 231,169 | — | — | 399,066 | ||||||||||||||||||
|
Operating
income (loss)
|
— | (128,811 | ) | (100,390 | ) | 5,655 | — | (223,546 | ) | |||||||||||||||
|
Interest
expense, net
|
— | 105,739 | 1,747 | (165 | ) | — | 107,321 | |||||||||||||||||
|
Intercompany
interest expense (income)
|
— | (2,320 | ) | 2,320 | — | — | — | |||||||||||||||||
|
(Gain)
loss on early extinguishment of debt
|
— | (14,642 | ) | — | — | — | (14,642 | ) | ||||||||||||||||
|
Other
(income) expense, net
|
— | 305 | (197 | ) | (745 | ) | — | (637 | ) | |||||||||||||||
|
Income
(loss) from continuing operations before income taxes and equity in income
of unconsolidated subsidiaries
|
— | (217,893 | ) | (104,260 | ) | 6,565 | — | (315,588 | ) | |||||||||||||||
|
Income
tax expense (benefit)
|
— | (15,549 | ) | (3,270 | ) | 207 | — | (18,612 | ) | |||||||||||||||
|
Income
(loss) from continuing operations before equity in income of
unconsolidated subsidiaries
|
— | (202,344 | ) | (100,990 | ) | 6,358 | — | (296,976 | ) | |||||||||||||||
|
Equity
in income of unconsolidated subsidiaries
|
(298,027 | ) | (94,632 | ) | 6,358 | — | 386,301 | — | ||||||||||||||||
|
Income
(loss) from continuing operations
|
(298,027 | ) | (296,976 | ) | (94,632 | ) | 6,358 | 386,301 | (296,976 | ) | ||||||||||||||
|
Income
from discontinued operations, net of taxes
|
— | (1,051 | ) | — | — | — | (1,051 | ) | ||||||||||||||||
|
Net
income (loss)
|
$ | (298,027 | ) | $ | (298,027 | ) | $ | (94,632 | ) | $ | 6,358 | $ | 386,301 | $ | (298,027 | ) | ||||||||
77
CENVEO,
INC. AND SUBSIDIARIES
NOTES
TO CONSOLIDATED FINANCIAL STATEMENTS (CONTINUED)
17.
Financial Information for Subsidiary Issuers, Guarantor and Non-Guarantor
Subsidiaries (Continued)
CENVEO,
INC. AND SUBSIDIARIES
CONDENSED
CONSOLIDATING STATEMENT OF CASH FLOWS
For
the year ended January 3, 2009
(in
thousands)
|
Parent
|
Subsidiary
|
Guarantor
|
Non-
Guarantor
|
|||||||||||||||||||||
|
Company
|
Issuer
|
Subsidiaries
|
Subsidiaries
|
Eliminations
|
Consolidated
|
|||||||||||||||||||
|
Cash
flows from operating activities:
|
||||||||||||||||||||||||
|
Net
cash provided (used in) by operating activities
|
$ | 18,140 | $ | (69,095 | ) | $ | 258,441 | $ | 2,362 | $ | — | $ | 209,848 | |||||||||||
|
Cash
flows from investing activities:
|
||||||||||||||||||||||||
|
Cost
of business acquisitions, net of cash acquired
|
— | (47,412 | ) | — | — | — | (47,412 | ) | ||||||||||||||||
|
Capital
expenditures
|
— | (27,368 | ) | (21,875 | ) | — | — | (49,243 | ) | |||||||||||||||
|
Intercompany
note
|
— | 913 | — | — | (913 | ) | — | |||||||||||||||||
|
Acquisition
payments
|
— | (3,653 | ) | — | — | — | (3,653 | ) | ||||||||||||||||
|
Proceeds
from sale of property, plant and equipment
|
— | 17,944 | 314 | — | — | 18,258 | ||||||||||||||||||
|
Net
cash (used in) provided by investing activities
|
— | (59,576 | ) | (21,561 | ) | — | (913 | ) | (82,050 | ) | ||||||||||||||
|
Cash
flows from financing activities:
|
||||||||||||||||||||||||
|
Repayment
of senior unsecured loan
|
— | (175,000 | ) | — | — | — | (175,000 | ) | ||||||||||||||||
|
Repayment
under revolving credit facility, net
|
— | (83,200 | ) | — | — | — | (83,200 | ) | ||||||||||||||||
|
Repayment
of 8⅜% senior subordinated notes
|
— | (19,567 | ) | — | — | — | (19,567 | ) | ||||||||||||||||
|
Repayments
of other long-term debt
|
— | (1,137 | ) | (17,796 | ) | — | — | (18,933 | ) | |||||||||||||||
|
Repayment
of 7⅞% senior subordinated notes
|
— | (10,561 | ) | — | — | — | (10,561 | ) | ||||||||||||||||
|
Repayments
of term loans
|
— | (7,200 | ) | — | — | — | (7,200 | ) | ||||||||||||||||
|
Payment
of debt issuance costs
|
— | (5,297 | ) | — | — | — | (5,297 | ) | ||||||||||||||||
|
Purchase
and retirement of common stock upon vesting
of RSUs
|
(1,054 | ) | — | — | — | — | (1,054 | ) | ||||||||||||||||
|
Tax
liability from stock-based compensation
|
(1,377 | ) | — | — | — | — | (1,377 | ) | ||||||||||||||||
|
Payment
of refinancing fees, redemption, premiums and
expenses
|
— | (130 | ) | — | — | — | (130 | ) | ||||||||||||||||
|
Proceeds
from issuance of 10½% senior notes
|
— | 175,000 | — | — | — | 175,000 | ||||||||||||||||||
|
Proceeds
from issuance of other long-term debt
|
— | 6,927 | 6,000 | — | — | 12,927 | ||||||||||||||||||
|
Proceeds
from exercise of stock options
|
1,876 | — | — | — | — | 1,876 | ||||||||||||||||||
|
Intercompany
note
|
— | — | (913 | ) | — | 913 | — | |||||||||||||||||
|
Intercompany
advances
|
(17,585 | ) | 240,460 | (224,000 | ) | 1,125 | — | — | ||||||||||||||||
|
Net
cash (used in) provided by financing activities
|
(18,140 | ) | 120,295 | (236,709 | ) | 1,125 | 913 | (132,516 | ) | |||||||||||||||
|
Effect
of exchange rate changes on cash and cash equivalents of continuing
operations
|
— | — | — | (720 | ) | — | (720 | ) | ||||||||||||||||
|
Net
(decrease) increase in cash and cash
equivalents
|
— | (8,376 | ) | 171 | 2,767 | — | (5,438 | ) | ||||||||||||||||
|
Cash
and cash equivalents at beginning of year
|
— | 13,091 | 882 | 1,909 | — | 15,882 | ||||||||||||||||||
|
Cash
and cash equivalents at end of year
|
$ | — | $ | 4,715 | $ | 1,053 | $ | 4,676 | $ | — | $ | 10,444 | ||||||||||||
78
CENVEO,
INC. AND SUBSIDIARIES
NOTES
TO CONSOLIDATED FINANCIAL STATEMENTS (CONTINUED)
17.
Financial Information for Subsidiary Issuers, Guarantor and Non-Guarantor
Subsidiaries (Continued)
CENVEO,
INC. AND SUBSIDIARIES
CONDENSED
CONSOLIDATING STATEMENT OF OPERATIONS
For
the year ended December 29, 2007
(in
thousands)
|
Parent
Company
|
Subsidiary
Issuer
|
Guarantor
Subidiaries
|
Non-Guarantor
Subsidiaries
|
Eliminations | Consolidated | |||||||||||||||||||
|
Net
sales
|
$ | — | $ | 1,162,075 | $ | 872,947 | $ | 11,694 | $ | — | $ | 2,046,716 | ||||||||||||
|
Cost
of sales
|
— | 954,373 | 665,472 | 8,861 | — | 1,628,706 | ||||||||||||||||||
|
Selling,
general and administrative
|
— | 164,620 | 64,907 | 434 | — | 229,961 | ||||||||||||||||||
|
Amortization
of intangible assets
|
— | 4,826 | 5,587 | — | — | 10,413 | ||||||||||||||||||
|
Restructuring
and impairment charges
|
— | 39,956 | 130 | — | — | 40,086 | ||||||||||||||||||
|
Operating
income (loss)
|
— | (1,700 | ) | 136,851 | 2,399 | — | 137,550 | |||||||||||||||||
|
Gain
on sale of non-strategic businesses
|
— | (189 | ) | — | — | — | (189 | ) | ||||||||||||||||
|
Interest
expense, net
|
— | 90,070 | 1,411 | (14 | ) | — | 91,467 | |||||||||||||||||
|
Intercompany
interest expense (income)
|
— | (3,598 | ) | 3,598 | — | — | — | |||||||||||||||||
|
Loss
on early extinguishment of debt
|
— | 9,186 | 70 | — | — | 9,256 | ||||||||||||||||||
|
Other
expense, net
|
— | 1,091 | 1,681 | 359 | — | 3,131 | ||||||||||||||||||
|
Income
(loss) from continuing operations before
income taxes and equity in income of unconsolidated
subsidiaries
|
— | (98,260 | ) | 130,091 | 2,054 | — | 33,885 | |||||||||||||||||
|
Income
tax expense (benefit)
|
— | 12,303 | (2,504 | ) | 101 | — | 9,900 | |||||||||||||||||
|
Income
(loss) from continuing operations before
equity in income of unconsolidated subsidiaries
|
— | (110,563 | ) | 132,595 | 1,953 | — | 23,985 | |||||||||||||||||
|
Equity
in income of unconsolidated
subsidiaries
|
40,781 | 134,548 | 1,953 | — | (177,282 | ) | — | |||||||||||||||||
|
Income
(loss) from continuing operations
|
40,781 | 23,985 | 134,548 | 1,953 | (177,282 | ) | 23,985 | |||||||||||||||||
|
Income
from discontinued operations, net of taxes
|
— | 16,796 | — | — | — | 16,796 | ||||||||||||||||||
|
Net
income (loss)
|
$ | 40,781 | $ | 40,781 | $ | 134,548 | $ | 1,953 | $ | (177,282 | ) | $ | 40,781 | |||||||||||
79
CENVEO,
INC. AND SUBSIDIARIES
NOTES
TO CONSOLIDATED FINANCIAL STATEMENTS (CONTINUED)
17.
Financial Information for Subsidiary Issuers, Guarantor and Non-Guarantor
Subsidiaries (Continued)
CENVEO,
INC. AND SUBSIDIARIES
CONDENSED
CONSOLIDATING STATEMENT OF CASH FLOWS
For
the year ended December 29, 2007
(in
thousands)
|
Parent
|
Subsidiary
|
Guarantor
|
Non-Guarantor
|
|||||||||||||||||||||
|
Company
|
Issuer
|
Subsidiaries
|
Subsidiaries
|
Eliminations
|
Consolidated
|
|||||||||||||||||||
|
Cash
flows from operating activities:
|
||||||||||||||||||||||||
|
Net
cash (used in) provided by continuing operating
activities
|
$ | 10,280 | $ | (65,159 | ) | $ | 139,178 | $ | 1,909 | $ | — | $ | 86,208 | |||||||||||
|
Net
cash provided by discontinued operating activities
|
— | 2,198 | — | — | — | 2,198 | ||||||||||||||||||
|
Net
cash (used in) provided by operating activities
|
10,280 | (62,961 | ) | 139,178 | 1,909 | — | 88,406 | |||||||||||||||||
|
Cash
flows from investing activities:
|
||||||||||||||||||||||||
|
Cost
of business acquisitions, net of cash acquired
|
— | (627,304 | ) | — | — | — | (627,304 | ) | ||||||||||||||||
|
Capital
expenditures
|
— | (14,016 | ) | (17,522 | ) | — | — | (31,538 | ) | |||||||||||||||
|
Intercompany
note
|
— | 2,733 | — | — | (2,733 | ) | — | |||||||||||||||||
|
Acquisition
payments
|
— | (3,653 | ) | — | — | — | (3,653 | ) | ||||||||||||||||
|
Proceeds
from sale of property, plant and equipment
|
— | 8,702 | 247 | — | — | 8,949 | ||||||||||||||||||
|
Proceeds
from divestitures, net
|
— | 431 | — | — | — | 431 | ||||||||||||||||||
|
Net
cash provided by (used in) investing activities of continuing
operations
|
— | (633,107 | ) | (17,275 | ) | — | (2,733 | ) | (653,115 | ) | ||||||||||||||
|
Proceeds
from the sale of discontinued operations
|
— | 73,628 | — | — | — | 73,628 | ||||||||||||||||||
|
Net
cash provided by investing activities of discontinued
operations
|
— | 73,628 | — | — | — | 73,628 | ||||||||||||||||||
|
Net
cash provided by (used in) investing activities
|
— | (559,479 | ) | (17,275 | ) | — | (2,733 | ) | (579,487 | ) | ||||||||||||||
|
Cash
flows from financing activities:
|
||||||||||||||||||||||||
|
Proceeds
from issuance of term loans
|
— | 720,000 | — | — | — | 720,000 | ||||||||||||||||||
|
Proceeds
from unsecured loan
|
— | 175,000 | — | — | — | 175,000 | ||||||||||||||||||
|
Borrowings
under revolving credit facility, net
|
— | 75,700 | — | — | — | 75,700 | ||||||||||||||||||
|
Proceeds
from exercise of stock options
|
304 | — | — | — | — | 304 | ||||||||||||||||||
|
Proceeds
from excess tax benefit from stock based
compensation
|
67 | — | — | — | — | 67 | ||||||||||||||||||
|
Repayment
of term loan B
|
— | (324,188 | ) | — | — | — | (324,188 | ) | ||||||||||||||||
|
Repayment
of Cadmus revolving senior bank credit
facility
|
— | (70,100 | ) | — | — | — | (70,100 | ) | ||||||||||||||||
|
Repayment
of 8⅜% senior subordinated notes
|
— | (20,880 | ) | — | — | — | (20,880 | ) | ||||||||||||||||
|
Repayment
of 9⅝% notes
|
— | (10,498 | ) | — | — | — | (10,498 | ) | ||||||||||||||||
|
Repayments
of term loans
|
— | (4,900 | ) | — | — | — | (4,900 | ) | ||||||||||||||||
|
Repayments
of other long-term debt
|
— | (2,477 | ) | (26,576 | ) | — | — | (29,053 | ) | |||||||||||||||
|
Payment
of refinancing fees, redemption, premiums and
expenses
|
— | (8,045 | ) | — | — | — | (8,045 | ) | ||||||||||||||||
|
Payment
of debt issuance costs
|
— | (5,906 | ) | — | — | — | (5,906 | ) | ||||||||||||||||
|
Purchase
and retirement of common stock upon vesting
of RSUs
|
(1,302 | ) | — | — | — | — | (1,302 | ) | ||||||||||||||||
|
Intercompany
note
|
— | — | (2,733 | ) | — | 2,733 | — | |||||||||||||||||
|
Intercompany
advances
|
(9,349 | ) | 103,170 | (93,821 | ) | — | — | — | ||||||||||||||||
|
Net
cash provided by (used in) financing activities
|
(10,280 | ) | 626,876 | (123,130 | ) | — | 2,733 | 496,199 | ||||||||||||||||
|
Effect
of exchange rate changes on cash and cash equivalents of continuing
operations
|
— | — | 206 | — | — | 206 | ||||||||||||||||||
|
Net
increase (decrease) in cash and cash equivalents
|
— | 4,436 | (1,021 | ) | 1,909 | — | 5,324 | |||||||||||||||||
|
Cash
and cash equivalents at beginning of year
|
— | 8,655 | 1,903 | — | — | 10,558 | ||||||||||||||||||
|
Cash
and cash equivalents at end of year
|
$ | — | $ | 13,091 | $ | 882 | $ | 1,909 | $ | — | $ | 15,882 | ||||||||||||
80
CENVEO,
INC. AND SUBSIDIARIES
NOTES
TO CONSOLIDATED FINANCIAL STATEMENTS (CONTINUED)
18.
Selected Quarterly Financial Information (Unaudited)
The
following table sets forth certain quarterly financial data for the periods
indicated (in thousands, except per share amounts):
|
First
Quarter
|
Second
Quarter
|
Third
Quarter
|
Fourth
Quarter
|
|||||||||||||
|
Year
Ended 2009
|
||||||||||||||||
|
Net
sales
|
$ | 412,100 | $ | 397,644 | $ | 448,039 | $ | 456,848 | ||||||||
|
Operating
income
(loss)
|
221 | (5,477 | ) | 25,002 | 12,442 | |||||||||||
|
Income
(loss) from continuing operations
|
(4,187 | ) | (17,841 | ) | (8,432 | ) | (9,377 | ) | ||||||||
|
Income
(loss) from discontinued operations, net of taxes
|
(124 | ) | (411 | ) | 9,505 | (72 | ) | |||||||||
|
Net
income
(loss)
|
(4,311 | ) | (18,252 | ) | 1,073 | (9,449 | ) | |||||||||
|
Income
(loss) per share from continuing operations—
|
||||||||||||||||
|
Basic
and diluted(1)
|
(0.08 | ) | (0.33 | ) | (0.15 | ) | (0.15 | ) | ||||||||
|
Income
(loss) per share from discontinued operations—
|
||||||||||||||||
|
Basic
and diluted(1)
|
— | (0.01 | ) | 0.17 | — | |||||||||||
|
Net
income (loss) per share—basic and diluted(1)
|
(0.08 | ) | (0.34 | ) | 0.02 | (0.15 | ) | |||||||||
|
First
Quarter
|
Second
Quarter
|
Third
Quarter
|
Fourth
Quarter
|
||||||||||||||
|
Year
Ended 2008
|
|||||||||||||||||
|
Net
sales
|
$ | 534,328 | $ | 524,501 | $ | 522,705 | $ | 517,160 | |||||||||
|
Operating
income
(loss)
|
22,980 | 36,151 | 48,176 | (330,853 | ) | (2) | |||||||||||
|
Income
(loss) from continuing operations
|
(2,743 | ) | 3,066 | 12,387 | (309,686 | ) | (3) | ||||||||||
|
Income
(loss) from discontinued operations, net of taxes
|
(656 | ) | (399 | ) | (59 | ) | 63 | ||||||||||
|
Net
income
(loss)
|
(3,399 | ) | 2,667 | 12,328 | (309,623 | ) | (3) | ||||||||||
|
Income
(loss) per share from continuing operations—
|
|||||||||||||||||
|
Basic
and diluted(1)
|
(0.05 | ) | 0.06 | 0.23 | (5.71 | ) | |||||||||||
|
Income
(loss) per share from discontinued operations—
|
|||||||||||||||||
|
Basic
and diluted(1)
|
(0.01 | ) | (0.01 | ) | — | — | |||||||||||
|
Net
income (loss) per share—basic and diluted(1)
|
(0.06 | ) | 0.05 | 0.23 | (5.71 | ) | |||||||||||
________________________
|
(1)
|
The
quarterly earnings per share information is computed separately for each
period. Therefore, the sum of such quarterly per share amounts may differ
from the total year.
|
|
(2)
|
Includes
$372.8 million of pre-tax goodwill impairment
charges.
|
|
(3)
|
Includes
$330.7 million of goodwill impairment charges, net of a tax benefit of
$42.1 million.
|
81
None.
Evaluation
of Disclosure Controls and Procedures
Disclosure
controls and procedures are the controls and other procedures of an issuer that
are designed to provide reasonable assurance that information required to be
disclosed by the issuer in the reports that it files or submits under the
Securities Exchange Act of 1934 is recorded, processed, summarized and reported
within the time period specified in the Securities and Exchange Commission’s
rules and forms. Disclosure controls and procedures include, without limitation,
controls and procedures designed to ensure that material information required to
be disclosed by an issuer in the reports that it files or submits under the
Securities Exchange Act of 1934 is accumulated and communicated to the issuer’s
management, including its principal executive and principal financial officers,
or persons performing similar functions, as appropriate to allow timely
decisions regarding required disclosure.
We have
evaluated, under the supervision and with the participation of our management,
including our Chief Executive Officer and Chief Financial Officer, the
effectiveness of our disclosure controls and procedures, as defined in Rules
13a-15(e) and 15d-15(e) of the Securities Exchange Act of 1934, as of the end of
the fiscal year covered by this annual report. Based on that evaluation, our
Chief Executive Officer and Chief Financial Officer have concluded that our
disclosure controls and procedures were effective at the reasonable assurance
level, as of the fiscal year end covered by this Annual Report on Form
10-K.
Management’s
Report on Internal Control Over Financial Reporting
Management
is responsible for establishing and maintaining adequate internal control over
financial reporting, as such term is defined in Rule 13a-15(f) of the Exchange
Act. The Company’s internal control over financial reporting is a process
designed under the supervision of the Company’s Chief Executive Officer and
Chief Financial Officer to provide reasonable assurance regarding the
reliability of financial reporting and the preparation of the Company’s
consolidated financial statements for external reporting purposes in accordance
with accounting principles generally accepted in the United States. Our internal
control over financial reporting includes policies and procedures that pertain
to the maintenance of records that, in reasonable detail, accurately and fairly
reflect transactions and dispositions of assets; provide reasonable assurances
that transactions are recorded as necessary to permit preparation of financial
statements in accordance with accounting principles generally accepted in the
United States and that receipts and expenditures are being made only in
accordance with authorizations of management and the directors of the Company;
and provide reasonable assurance regarding prevention or timely detection of
unauthorized acquisition, use or disposition of the Company’s assets that could
have a material effect on the financial statements.
Management
has conducted an assessment of the effectiveness of the Company’s internal
control over financial reporting based on the framework established in Internal
Control—Integrated Framework issued by the Committee of Sponsoring Organizations
of the Treadway Commission. Based on this assessment, management has determined
that the Company’s internal control over financial reporting as of January 2,
2010 is effective.
The
Company’s internal control over financial reporting as of January 2, 2010 has
been audited by Grant Thornton LLP, an independent registered public accounting
firm, as stated in their report appearing on page 83.
Changes
in Internal Controls Over Financial Reporting
There
were no changes in our internal control over financial reporting during the
quarter ended January 2, 2010 that have materially affected or are reasonably
likely to materially affect our internal control over financial
reporting.
Inherent
Limitations on Effectiveness of Controls
Our
management, including our Chief Executive Officer and our Chief Financial
Officer, does not expect that our disclosure controls or our internal control
over financial reporting will prevent or detect all error and all fraud. A
control system, no matter how well designed and operated, can provide only
reasonable, not absolute, assurance that the control system’s objectives will be
met. Our disclosure controls and procedures are designed to provide reasonable
assurance of achieving their objectives. The design of a control system must
reflect the fact that there are resource constraints, and the benefits of
controls must be considered relative to their costs. Further, because of the
inherent limitations in all control systems, no evaluation of controls can
provide absolute assurance that misstatements due to error or fraud will not
occur or that all control issues and instances of fraud, if any, within the
Company have been
detected. These inherent limitations include the realities that judgments in
decision-making can be faulty and that breakdowns can occur because of simple
error or mistake. Controls can also be circumvented by the individual acts of
some persons, by collusion of two or more people, or by management override of
the controls. The design of any system of controls is based in part on certain
assumptions about the likelihood of future events, and there can be no assurance
that any design will succeed in achieving its stated goals under all potential
future conditions. Projections of any evaluation of controls effectiveness to
future periods are subject to risks. Over time, controls may become inadequate
because of changes in conditions or deterioration in the degree of compliance
with policies or procedures.
82
Report
of Independent Registered Public Accounting Firm
Board of
Directors and Stockholders
Cenveo,
Inc.
We have
audited Cenveo, Inc. and Subsidiaries’ (the “Company”) internal control over
financial reporting as of January 2, 2010, based on criteria established in
Internal Control —
Integrated Framework issued by the Committee of Sponsoring Organizations
of the Treadway Commission (COSO). The Company’s management is responsible for
maintaining effective internal control over financial reporting and for its
assessment of the effectiveness of internal control over financial reporting,
included in the accompanying Management’s Report on Internal Control Over
Financial Reporting. Our responsibility is to express an opinion on the
Company’s internal control over financial reporting based on our
audit.
We
conducted our audit in accordance with the standards of the Public Company
Accounting Oversight Board (United States). Those standards require that we plan
and perform the audit to obtain reasonable assurance about whether effective
internal control over financial reporting was maintained in all material
respects. Our audit included obtaining an understanding of internal control over
financial reporting, assessing the risk that a material weakness exists, testing
and evaluating the design and operating effectiveness of internal control based
on the assessed risk, and performing such other procedures as we considered
necessary in the circumstances. We believe that our audit provides a reasonable
basis for our opinion.
A
company’s internal control over financial reporting is a process designed to
provide reasonable assurance regarding the reliability of financial reporting
and the preparation of financial statements for external purposes in accordance
with generally accepted accounting principles. A company’s internal control over
financial reporting includes those policies and procedures that (1) pertain
to the maintenance of records that, in reasonable detail, accurately and fairly
reflect the transactions and dispositions of the assets of the company;
(2) provide reasonable assurance that transactions are recorded as
necessary to permit preparation of financial statements in accordance with
generally accepted accounting principles, and that receipts and expenditures of
the company are being made only in accordance with authorizations of management
and directors of the company; and (3) provide reasonable assurance
regarding prevention or timely detection of unauthorized acquisition, use, or
disposition of the company’s assets that could have a material effect on the
financial statements.
Because
of its inherent limitations, internal control over financial reporting may not
prevent or detect misstatements. Also, projections of any evaluation of
effectiveness to future periods are subject to the risk that controls may become
inadequate because of changes in conditions, or that the degree of compliance
with the policies or procedures may deteriorate.
In our
opinion, Cenveo, Inc. and Subsidiaries maintained, in all material respects,
effective internal control over financial reporting as of January 2, 2010, based
on criteria established in Internal Control — Integrated
Framework issued by COSO.
We also
have audited, in accordance with the standards of the Public Company Accounting
Oversight Board (United States), the consolidated balance sheets of the Company
as of January 2, 2010 and January 3, 2009, and the related consolidated
statements of operations, shareholders’ (deficit) equity and cash flows for the
fiscal years then ended and our report dated March 3, 2010 expressed an
unqualified opinion on those financial statements.
/s/ GRANT
THORNTON LLP
Melville,
New York
March 3,
2010
83
None.
PART
III
The
information relating to directors and nominees of the Company and the
information required by Items 405, 406 and 407(c)(3), (d)(4) and (d)(5) of
Regulation S-K are included in the Company’s Proxy Statement to be filed
pursuant to Regulation 14A in connection with the 2010 Annual Meeting of
Stockholders (2010 Proxy Statement) under the captions “Nominees for the Board
of Directors”, “Section 16(a) Beneficial Ownership Reporting Compliance,”
“Corporate Governance,” “Nomination of Directors,” and “Audit Committee,” and
such information is incorporated herein by reference.
This
information is included under the captions “Compensation of Executive Officers,”
“Board Compensation,” “Compensation Committee Interlocks and Insider
Participation” and “Compensation Committee Report” in our 2010 Proxy Statement
and is incorporated herein by reference.
This
information is included under the captions “Ownership of Voting Securities” and
“Compensation of Executive Officers—Equity Compensation Plan Information” in our
2010 Proxy Statement and is incorporated herein by reference.
This
information is included under the captions “Certain Relationships and Related
Person Transactions” and “Director Independence” in our 2010 Proxy Statement and
is incorporated herein by reference.
This
information is included under the captions “Independent Public Auditors” and
“Report of the Audit Committee” in our 2010 Proxy Statement and is incorporated
herein by reference.
PART
IV
(a)(1)
Financial Statements
Included
in Part II, Item 8 of this Report.
(a)(2)
Financial Statement Schedules
Included
in Part IV of this Report:
|
Page
|
|||
|
Schedule
II
|
Valuation
and Qualifying Accounts for the Years Ended
|
||
|
January
2, 2010, January 3, 2009 and December 29, 2007
|
91
|
84
(a)(3)
Exhibits
|
Exhibit
Number
|
Description
|
|
|
2.1
|
Stock
Purchase Agreement dated as of July 17, 2007 among Cenveo Corporation,
Commercial Envelope Manufacturing Co. Inc. and its
shareholders—incorporated by reference to Exhibit 2.1 to registrant’s
current report on Form 8-K filed July 20, 2007.
|
|
|
3.1
|
Articles
of Incorporation—incorporated by reference to Exhibit 3(i) of the
registrant’s quarterly report on Form 10-Q for the quarter ended June 30,
1997, filed August 14, 1997.
|
|
|
3.2
|
Articles
of Amendment to the Articles of Incorporation dated May 17,
2004—incorporated by reference to Exhibit 3.2 to registrant’s quarterly
report on Form 10-Q for the quarter ended June 30, 2004, filed August 2,
2004.
|
|
|
3.3
|
Amendment
to Articles of Incorporation and Certificate of Designations of Series A
Junior Participating Preferred Stock of the registrant dated April 20,
2005—incorporated by reference to Exhibit 3.1 to registrant’s current
report on Form 8-K filed April 21, 2005.
|
|
|
3.4
|
Bylaws
as amended and restated effective February 22, 2007—incorporated by
reference to Exhibit 3.2 to registrant’s current report on Form 8-K filed
August 30, 2007.
|
|
|
4.1
|
Indenture
dated as of February 4, 2004 between Mail-Well I Corporation, the
Guarantors named therein and U.S. Bank National Association, as Trustee,
and Form of Senior Subordinated Note and Guarantee relating to Mail-Well I
Corporation’s 7⅞% Senior Subordinated Notes due 2013—incorporated by
reference to Exhibit 4.5 to registrant’s annual report on Form 10-K for
the year ended December 31, 2003, filed February 27,
2004.
|
|
|
4.2
|
Supplemental
Indenture, dated as of June 21, 2006 among Cenveo Corporation (f/k/a
Mail-Well I Corporation), the Guarantors named therein and U.S. Bank
National Association, as Trustee, to the Indenture dated as of February 4,
2004 relating to the 7⅞% Senior Subordinated Notes due 2013—incorporated
by reference to Exhibit 4.2 to registrant’s current report on Form 8-K
filed June 27, 2006.
|
|
|
4.3
|
Third
Supplemental Indenture, dated as of March 7, 2007 among Cenveo Corporation
(f/k/a Mail-Well I Corporation), the Guarantors named therein and U.S.
Bank National Association, as Trustee, to the Indenture dated as of
February 4, 2004 relating to the 7⅞% Senior Subordinated Notes due 2013—
incorporated by reference to Exhibit 4.7 to registrant’s quarterly report
on Form 10-Q for the quarter ended March 31, 2007, filed May 9,
2007.
|
|
|
4.4
|
Fourth
Supplemental Indenture, dated as of July 9, 2007 among Cenveo Corporation
(f/k/a Mail-Well I Corporation), the Guarantors named therein and U.S.
Bank National Association, as Trustee, to the Indenture dated as of
February 4, 2004 relating to the 7⅞% Senior Subordinated Notes due 2013—
incorporated by reference to Exhibit 4.8 to registrant’s quarterly report
on Form 10-Q for the quarter ended June 30, 2007, filed August 8,
2007.
|
|
|
4.5
|
Fifth
Supplemental Indenture, dated as of August 30, 2007 among Cenveo
Corporation (f/k/a Mail-Well I Corporation), the Guarantors named therein
and U.S. Bank National Association, as Trustee, to the Indenture dated as
of February 4, 2004 relating to the 7⅞% Senior Subordinated Notes due
2013—incorporated by reference to Exhibit 4.6 to registrant’s quarterly
report on Form 10-Q for the quarter ended September 29, 2007, filed
November 8, 2007.
|
|
4.6
|
Sixth
Supplemental Indenture, dated as of April 16, 2008 among Cenveo
Corporation (f/k/a Mail-Well I Corporation), the Guarantors named therein
and U.S. Bank National Association, as Trustee, to the Indenture dated as
of February 4, 2004, relating to the 7⅞% Senior Subordinated Notes due
2013—incorporated by reference to Exhibit 4.7 to registrant’s quarterly
report on Form 10-Q for the quarter ended June 28, 2008, filed August 7,
2008.
|
|
4.7
|
Seventh
Supplemental Indenture, dated as of August 20, 2008 among Cenveo
Corporation (f/k/a Mail-Well I Corporation), the Guarantors named therein
and U.S. Bank National Association, as Trustee, to the Indenture dated as
of February 4, 2004, relating to the 7⅞% Senior Subordinated Notes due
2013—incorporated by reference to Exhibit 4.8 to registrant’s quarterly
report on Form 10-Q for the quarter ended September 27, 2008, filed
November 5, 2008.
|
85
|
4.8
|
Eighth
Supplemental Indenture, dated as of October 15, 2009 among Cenveo
Corporation (f/k/a Mail-Well I Corporation), the Guarantors named therein
and U.S. Bank National Association, as Trustee, to the Indenture dated as
of February 4, 2004, relating to the 7⅞% Senior Subordinated Notes due
2013—incorporated by reference to Exhibit 4.1 to registrant’s current
report on Form 8-K filed October 16, 2009.
|
|
|
4.9
|
Indenture,
dated as of June 15, 2004, among Cadmus Communications Corporation, the
Guarantors named therein and Wachovia Bank, National Association, as
Trustee, relating to the 8⅜% Senior Subordinated Notes due
2014—incorporated by reference to Exhibit 4.9 to Cadmus Communications
Corporation’s registration statement on Form S-4 filed August 24,
2004.
|
|
|
4.10
|
First
Supplemental Indenture, dated as of March 1, 2005, to the Indenture dated
as of June 15, 2004, among Cadmus Communications Corporation, the
Guarantors named therein, Mack Printing, LLC and Wachovia Bank, National
Association, as Trustee, relating to the 8⅜% Senior Subordinated Notes due
2014—incorporated by reference to Exhibit 4.9.1 to Cadmus Communications
Corporation’s quarterly report on Form 10-Q for the quarter ended March
31, 2005, filed May 13, 2005.
|
|
4.11
|
Second
Supplemental Indenture, dated as of May 19, 2006, to the Indenture dated
as of June 15, 2004, among Cadmus Communications Corporation, the
Guarantors named therein and U.S. Bank National Association (successor to
Wachovia Bank, National Association), as Trustee, relating to the 8⅜%
Senior Subordinated Notes due 2014—incorporated by reference to Exhibit
4.9.2 to Cadmus Communications Corporation’s annual report on Form 10-K
for the year ended July 1, 2006, filed September 13,
2006.
|
|
4.12
|
Third
Supplemental Indenture, dated as of March 7, 2007, to the Indenture dated
as of June 15, 2004, among Cenveo Corporation (as successor to Cadmus
Communications Corporation), the Guarantors named therein and U.S. Bank
National Association (successor to Wachovia Bank, National Association),
as Trustee, relating to the 8⅜% Senior Subordinated Notes due
2014—incorporated by reference to Exhibit 4.11 to registrant’s quarterly
report on Form 10-Q for the quarter ended March 31, 2007, filed May 9,
2007.
|
|
| 4.13 | Fourth Supplemental Indenture, dated as of July 9, 2007, to the Indenture dated as of June 15, 2004, among Cenveo Corporation (as successor to Cadmus Communications Corporation), the Guarantors named therein and U.S. Bank National Association (successor to Wachovia Bank, National Association), as Trustee, relating to the 8⅜% Senior Subordinated Notes due 2014—incorporated by reference to Exhibit 4.13 to registrant’s quarterly report on Form 10-Q for the quarter ended June 30, 2007, filed August 8, 2007. |
|
4.14
|
Fifth
Supplemental Indenture, dated as of August 30, 2007, to the Indenture
dated as of June 15, 2004, among Cenveo Corporation (as successor to
Cadmus Communications Corporation), the Guarantors named therein and U.S.
Bank National Association (successor to Wachovia Bank, National
Association), as Trustee, relating to the 8⅜% Senior Subordinated Notes
due 2014—incorporated by reference to Exhibit 4.13 to registrant’s
quarterly report on Form 10-Q for the quarter ended September 29, 2007,
filed November 8, 2007.
|
86
|
4.15
|
Sixth
Supplemental Indenture, dated as of November 7, 2007, to the Indenture
dated as of June 15, 2004, among Cenveo Corporation (as successor to
Cadmus Communications Corporation), the Guarantors named therein and U.S.
Bank National Association (successor to Wachovia Bank, National
Association), as Trustee, relating to the 8⅜% Senior Subordinated Notes
due 2014—incorporated by reference to Exhibit 4.12 to registrant’s annual
report on Form 10-K for the year ended December 29, 2007, filed on March
28, 2008.
|
|
|
4.16
|
Seventh
Supplemental Indenture, dated as of April 16, 2008, to the Indenture dated
as of June 15, 2004, among Cenveo Corporation (as
successor to Cadmus Communications Corporation), the Guarantors named
therein and U.S. Bank National Association (successor to Wachovia Bank,
National Association), as Trustee, relating to the 8⅜% Senior Subordinated
Notes due 2014—incorporated by reference to Exhibit 4.16 to registrant’s
quarterly report on Form 10-Q for the quarter ended June 28, 2008, filed
on August 7, 2008.
|
|
|
4.17
|
Eighth
Supplemental Indenture, dated as of August 20, 2008, to the Indenture
dated as of June 15, 2004, among Cenveo Corporation (as successor to
Cadmus Communications Corporation), the Guarantors named therein and U.S.
Bank National Association (successor to Wachovia Bank, National
Association), as Trustee, relating to the 8⅜% Senior Subordinated Notes
due 2014—incorporated by reference to Exhibit 4.18 to registrant’s
quarterly report on Form 10-Q for the quarter ended September 27, 2008,
filed November 5, 2008.
|
|
|
4.18
|
Ninth
Supplemental Indenture, dated as of October 15, 2009, to the Indenture
dated as of June 15, 2004, among Cenveo Corporation (as successor to
Cadmus Communications Corporation), the Guarantors named therein and U.S.
Bank National Association (successor to Wachovia Bank, National
Association), as Trustee, relating to the 8⅜% Senior Subordinated Notes
due 2014—incorporated by reference to Exhibit 4.2 to registrant’s current
report on Form 8-K filed October 16, 2009.
|
|
|
4.19
|
Indenture,
dated as of June 13, 2008, between Cenveo Corporation and U.S. Bank
National Association, as Trustee, relating to the 10½% Notes of Cenveo
Corporation—incorporated by reference to Exhibit 4.1 to registrant’s
current report on Form 8-K filed June 13, 2008.
|
|
|
4.20
|
Guarantee
by Cenveo, Inc. and the other guarantors named therein relating to the
10½% Notes of Cenveo Corporation—incorporated by reference to Exhibit 4.2
to registrant’s current report on Form 8-K dated (date of earliest event
reported) June 9, 2008, filed June 13, 2008.
|
|
|
4.21
|
First
Supplemental Indenture, dated as of August 20, 2008, to the Indenture of
June 13, 2008 between Cenveo Corporation and U.S. Bank National
Association, as Trustee, relating to the 10½% Notes of Cenveo
Corporation—incorporated by reference to Exhibit 4.21 to registrant’s
quarterly report on Form 10-Q for the quarter ended September 27, 2008,
filed November 5, 2008.
|
|
|
4.22
|
Second
Supplemental Indenture, dated as of October 15, 2009, to the Indenture of
June 13, 2008 between Cenveo Corporation and U.S. Bank National
Association, as Trustee, relating to the 10½% Notes of Cenveo
Corporation—incorporated by reference to Exhibit 4.3 to registrant’s
current report on Form 8-K filed October 16, 2009.
|
|
|
4.23
|
Registration
Rights Agreement dated as of June 13, 2008, among Cenveo Corporation,
Cenveo, Inc., the other Guarantors named therein and Lehman Brothers
Inc.—incorporated by reference to Exhibit 10.1 to registrant’s current
report on Form 8-K dated (date of earliest event reported) June 9, 2008,
filed June 13, 2008.
|
|
|
4.24
|
Indenture
dated as of February 5, 2010 among Cenveo Corporation, the Guarantors
named therein and Wells Fargo Bank, National Association, as
Trustee—incorporated by reference to Exhibit 4.1 to registrant’s current
report on Form 8-K filed February 9,
2010.
|
87
|
4.25
|
Form
of Guarantee issued by Cenveo, Inc. and the other Guarantors named
therein—incorporated by reference to Exhibit 4.2 to registrant’s current
report on Form 8-K filed February 9, 2010.
|
|
|
4.26
|
Registration
Rights Agreement dated as of February 5, 2010 among Cenveo Corporation,
Cenveo, Inc., the other Guarantors named therein and the initial
purchasers named therein—incorporated by reference to Exhibit 4.3 to
registrant’s current report on Form 8-K filed February 9,
2010.
|
|
|
4.27
|
Intercreditor
Agreement dated as of February 5, 2010 among Cenveo Corporation, Cenveo,
Inc., the grantors named therein, Wells Fargo Bank, National Association,
as second lien collateral agent, Bank of America, N.A., as first lien
agent and control agent—incorporated by reference to Exhibit 4.4 to
registrant’s current report on Form 8-K filed February 9,
2010.
|
|
|
4.28*
|
Second
Lien Pledge and Security Agreement dated as of February 5, 2010 among
Cenveo Corporation, Cenveo, Inc., the other grantors named therein and
Wells Fargo Bank, National Association, as collateral
agent.
|
|
|
4.29*
|
Second
Lien Intellectual Property Security Agreement dated as of February 5, 2010
among Cenveo Corporation, Cenveo, Inc., the other grantors named therein
and Wells Fargo Bank, National Association, as collateral
agent.
|
|
| 10.1+ | Form of Indemnity Agreement between Mail-Well, Inc. and each of its officers and directors—incorporated by reference from Exhibit 10.17 of the registrant's Registration Statement on Form S-1 dated March 25, 1994. | |
|
10.2+
|
Employment
Agreement dated as of October 27, 2005 between the registrant and Robert
G. Burton, Sr.—incorporated by reference to Exhibit 10.29 of registrant’s
annual report on Form 10-K filed for the year ended December 31, 2005,
filed March 2, 2006.
|
|
|
10.3+
|
Amendment,
dated November 8, 2006, to Employment Agreement dated as of October 27,
2005 between the registrant and Robert G. Burton, Sr.—incorporated by
reference to Exhibit 10.19 of registrant’s annual report on Form 10-K
filed for the year ended December 30, 2006, filed February 28,
2007.
|
|
|
10.4+
|
Amendment,
dated November 6, 2007, to Employment Agreement dated as of October 27,
2005, as amended, between the registrant and Robert G. Burton,
Sr.—incorporated by reference to Exhibit 10.4 to registrant’s annual
report on Form 10-K for the year ended December 29, 2007, filed March 28,
2008.
|
|
|
10.5+
|
Amendment,
dated February 27, 2008, to Employment Agreement dated as of October 27,
2005, as amended, between the registrant and Robert G. Burton,
Sr.—incorporated by reference to Exhibit 10.1 to registrant’s quarterly
report on Form 10-Q for the quarter ended March 29, 2008, filed May 7,
2008.
|
|
|
10.6+
|
Amendment,
dated December 29, 2008, to Employment Agreement dated as of October 27,
2005, as amended, between the registrant and Robert G. Burton,
Sr.—incorporated by reference to Exhibit 10.6 to registrant’s annual
report on Form 10-K for the fiscal year ended January 3, 2009, filed March
19, 2009.
|
|
|
10.7+
|
Employment
Agreement dated as of February 1, 2008 between the registrant and Dean
Cherry—incorporated by reference to Exhibit 10.5 to registrant’s annual
report on Form 10-K for the year ended December 29, 2007, filed on March
28, 2008.
|
|
|
10.8+
|
Employment
Agreement dated as of July 11, 2007 between the registrant and Mark
Hiltwein—incorporated by reference to Exhibit 10.2 to registrant’s
quarterly report on Form 10-Q for the quarter ended September 29, 2007,
filed November 8, 2007.
|
|
|
10.9+
|
Employment
Agreement dated as of June 22, 2006 between the registrant and Timothy
Davis—incorporated by reference to Exhibit 10.22 to registrant’s quarterly
report on Form 10-Q for the quarter ended July 1, 2006, filed August 9,
2006.
|
88
|
10.10
|
Settlement
and Governance Agreement by and among the registrant, Burton Capital
Management, LLC and Robert G. Burton, Sr., dated September 9,
2005—incorporated by reference to Exhibit 10.1 to the registrant’s current
report on Form 8-K filed September 12, 2005.
|
|
|
10.11+
|
Cenveo,
Inc. 2001 Long-Term Equity Incentive Plan, as amended—incorporated by
reference to Exhibit 10.24 to registrant’s quarterly report on Form 10-Q
for the quarter ended June 30, 2004, filed August 2,
2004.
|
|
|
10.12+
|
Cenveo,
Inc. 2007 Long-Term Equity Incentive Plan, as amended—incorporated by
reference to Exhibit A to registrant’s Schedule 14A filed April 6,
2009.
|
|
|
10.13+
|
Form
of Non-Qualified Stock Option Agreement for Employees under 2007 Long-Term
Equity Incentive Plan—incorporated by reference to Exhibit 10.17 to
registrant’s annual report on Form 10-K for the year ended December 29,
2007, filed on March 28, 2008.
|
|
|
10.14+
|
Form
of Restricted Share Unit Award Agreement for Employees under 2007
Long-Term Equity Incentive Plan—incorporated by reference to Exhibit 10.18
to registrant’s annual report on Form 10-K for the year ended December 29,
2007, filed on March 28, 2008.
|
|
|
10.15+
|
Form
of Restricted Share Unit Award Agreement for Non-Employee Directors under
2007 Long-Term Equity Incentive Plan—incorporated by reference to Exhibit
10.19 to registrant’s annual report on Form 10-K for the year ended
December 29, 2007, filed on March 28, 2008.
|
|
|
10.16
|
Credit
Agreement dated as of June 21, 2006 among Cenveo Corporation, Cenveo,
Inc., Bank of America, N.A., as Administrative Agent, Swing Line Lender
and L/C Issuer, and the other lenders party thereto—incorporated by
reference to Exhibit 4.1 to registrant’s current report on Form 8-K filed
June 27, 2006.
|
|
|
10.17
|
First
Amendment, dated as of March 7, 2007, to Credit Agreement dated as of June
21, 2006, among Cenveo Corporation, Cenveo, Inc., Bank of America, N.A.,
as Administrative Agent, and the other lenders party thereto—incorporated
by reference to Exhibit 10.1 to registrant’s quarterly report on Form 10-Q
for the quarter ended March 31, 2007, filed May 9,
2007.
|
|
|
10.18
|
Credit
Agreement Supplement, dated as of July 9, 2007, to Credit Agreement dated
as of June 21, 2006, among Cenveo Corporation, Cenveo, Inc., Bank of
America, N.A., as Administrative Agent, and the other lenders party
thereto—incorporated by reference to Exhibit 10.2 to registrant’s
quarterly report on Form 10-Q for the quarter ended June 30, 2007, filed
August 8, 2007.
|
|
|
10.19
|
Third
Amendment, dated as of April 24, 2009, to Credit Agreement dated as of
June 21, 2006, among Cenveo Corporation, Cenveo, Inc., Bank of America,
N.A., as Administrative Agent, and the other lenders party
thereto—incorporated by reference to Exhibit 10.1 to registrant’s current
report on Form 8-K filed April 27, 2009 and incorporated by reference to
Exhibit 10.1 to registrant’s current report on Form 8-K filed July 30,
2009.
|
|
|
10.20*
|
Fourth
Amendment, dated as of January 25, 2010, to Credit Agreement dated as of
June 21, 2006, among Cenveo Corporation, Cenveo, Inc., Bank of America,
N.A, as Administrative Agent, and the other lenders party
thereto.
|
|
|
10.21
|
Loan
Agreement, dated as of August 30, 2007, among Cenveo Corporation, Cenveo,
Inc., Lehman Commercial Paper Inc., as Administrative Agent, the lenders
party thereto and Lehman Brothers Inc., as Sole Lead Arranger and Sole
Book Manager—incorporated by reference to Exhibit 10.3 to registrant’s
quarterly report on Form 10-Q for the quarter ended September 29, 2007,
filed November 8, 2007.
|
89
|
21.1*
|
Subsidiaries
of the registrant.
|
|
|
23.1*
|
Consent
of Deloitte & Touche LLP.
|
|
|
23.2*
|
Consent
of Grant Thornton LLP.
|
|
|
24.1
|
Power
of Attorney—incorporated by reference to page 93.
|
|
|
31.1*
|
Certification
by Robert G. Burton, Sr., Chief Executive Officer, pursuant to Section 302
of the Sarbanes-Oxley Act of 2002.
|
|
|
31.2*
|
Certification
by Mark S. Hiltwein, Chief Financial Officer, pursuant to Section 302 of
the Sarbanes-Oxley Act of 2002.
|
|
32.1*
|
Certification
of the Chief Executive Officer pursuant to Section 906 of the
Sarbanes-Oxley Act of 2002, furnished as an exhibit to this report on Form
10-K.
|
|
|
32.2*
|
Certification
of the Chief Financial Officer pursuant to Section 906 of the
Sarbanes-Oxley Act of 2002, furnished as an exhibit to this report on Form
10-K.
|
____________
|
+
|
Management
contract or compensatory plan or
arrangement.
|
|
*
|
Filed
herewith.
|
(b)
Exhibits Filed
Included
in Item 15(a)(3) of this Report.
(c)
Financial Statement Schedules Filed
Included
in Item 15(a)(2) of this Report.
90
SCHEDULE
II
CENVEO,
INC. AND SUBSIDIARIES
Supplemental
Valuation and Qualifying Accounts
(in
thousands)
|
For
The Years Ended
|
||||||||||||
|
January
2, 2010
|
January
3, 2009
|
December
29, 2007
|
||||||||||
|
Accounts
receivable allowances
|
||||||||||||
|
Balance
at beginning of
year
|
$ | 6,016 | $ | 9,911 | $ | 4,802 | ||||||
|
Charged
to costs and
expenses
|
5,428 | 4,660 | 5,363 | |||||||||
|
Recoveries
and other charges(2)
|
1,064 | (554 | ) | 3,466 | ||||||||
|
Deductions(1)
|
(4,869 | ) | (8,001 | ) | (3,720 | ) | ||||||
|
Balance
at end of
year
|
$ | 7,639 | $ | 6,016 | $ | 9,911 | ||||||
_______________
|
(1)
|
Amounts
written off.
|
|
(2)
|
Other
charges include balances related to acquisitions and changes attributable
to foreign currency
translation.
|
91
SIGNATURES
Pursuant
to the requirements of Section 13 or 15(d) of the Securities Exchange Act of
1934, the Registrant has duly caused this report to be signed on its behalf by
the undersigned, thereunto duly authorized, in the City of Englewood, State of
Colorado, on March 3, 2010.
|
CENVEO,
INC.
|
||
|
By:
|
/S/ ROBERT
G. BURTON, SR.
|
|
|
Robert
G. Burton, Sr., Chairman and
Chief
Executive Officer
(Principal
Executive Officer)
|
||
|
By:
|
/S/ MARK
S. HILTWEIN
|
|
|
Mark
S. Hiltwein,
Chief
Financial Officer
(Principal
Financial Officer and
Principal
Accounting Officer)
|
||
92
Pursuant
to the requirements of Section 13 or 15(d) of the Securities Exchange Act of
1934, this report has been signed by the following persons in the capacities and
on the dates indicated.
POWER
OF ATTORNEY
Each
person whose signature appears below constitutes and appoints Robert G. Burton,
Sr. and Mark S. Hiltwein as attorney-in-fact, each with the power of
substitution, for him or her in any and all capacities, to sign any amendments
to this report and to file the same, with exhibits thereto and other documents
in connection therewith, with the Securities and Exchange
Commission.
|
Signature
|
Title
|
Date
|
|||
|
/s/ Robert G. Burton,
Sr.
|
Chairman
and Chief Executive Officer
|
March
3, 2010
|
|||
|
Robert
G. Burton, Sr.
|
(Principal
Executive Officer)
|
||||
|
/s/ Mark S.
Hiltwein
|
Chief
Financial Officer
|
March
3, 2010
|
|||
|
Mark
S. Hiltwein
|
(Principal
Financial Officer and
|
||||
|
Principal
Accounting Officer)
|
|||||
|
/s/ Gerald S.
Armstrong
|
Director
|
March
3, 2010
|
|||
|
Gerald
S. Armstrong
|
|||||
|
/s/ Leonard C.
Green
|
Director
|
March
3, 2010
|
|||
|
Leonard
C. Green
|
|||||
|
/s/ Mark J.
Griffin
|
Director
|
March
3, 2010
|
|||
|
Mark
J. Griffin
|
|||||
|
/s/ Robert
Obernier
|
Director
|
March
3, 2010
|
|||
|
Robert
Obernier
|
|||||
93