Attached files
| file | filename |
|---|---|
| 8-K - 8-K - Yellow Corp | d301035d8k.htm |
| EX-99.1 - EX-99.1 - Yellow Corp | d301035dex991.htm |
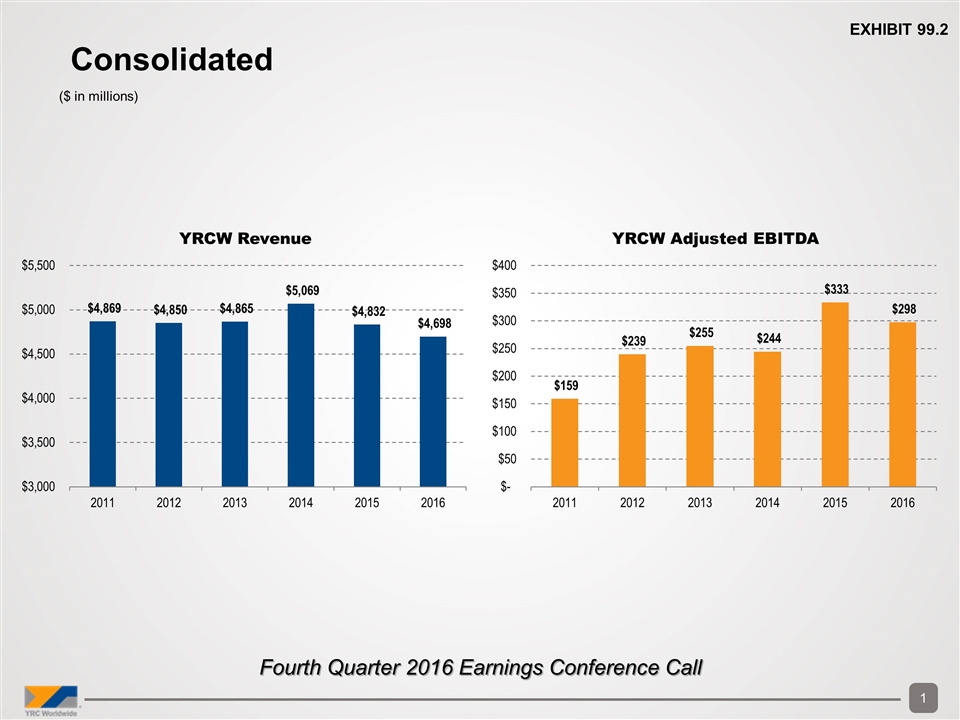
Fourth Quarter 2016 Earnings Conference Call Consolidated ($ in millions) Exhibit 99.2
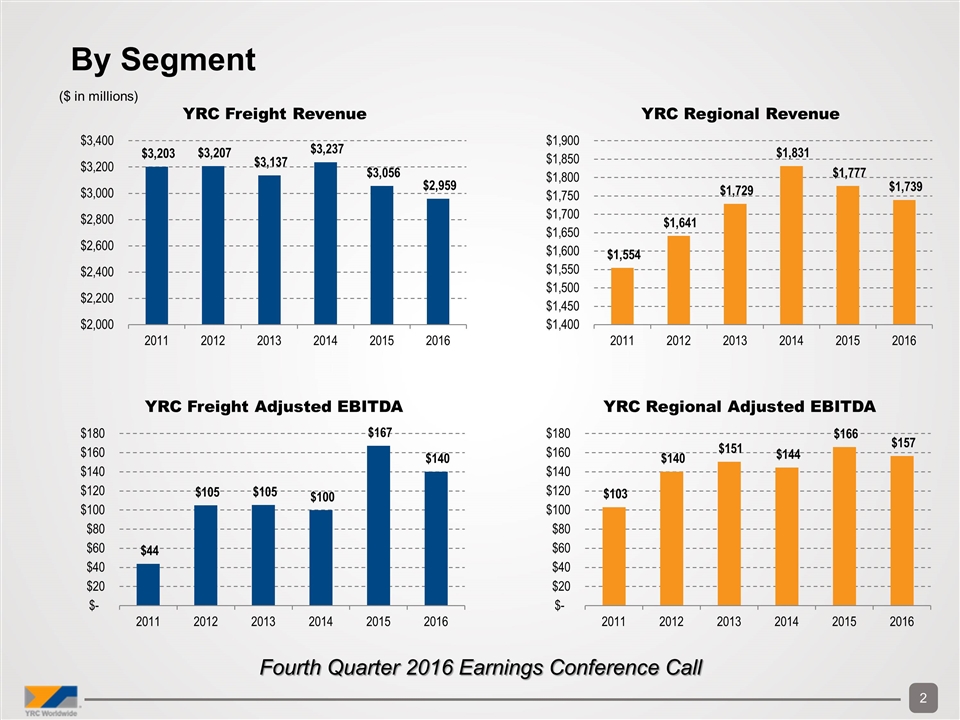
($ in millions) By Segment Fourth Quarter 2016 Earnings Conference Call
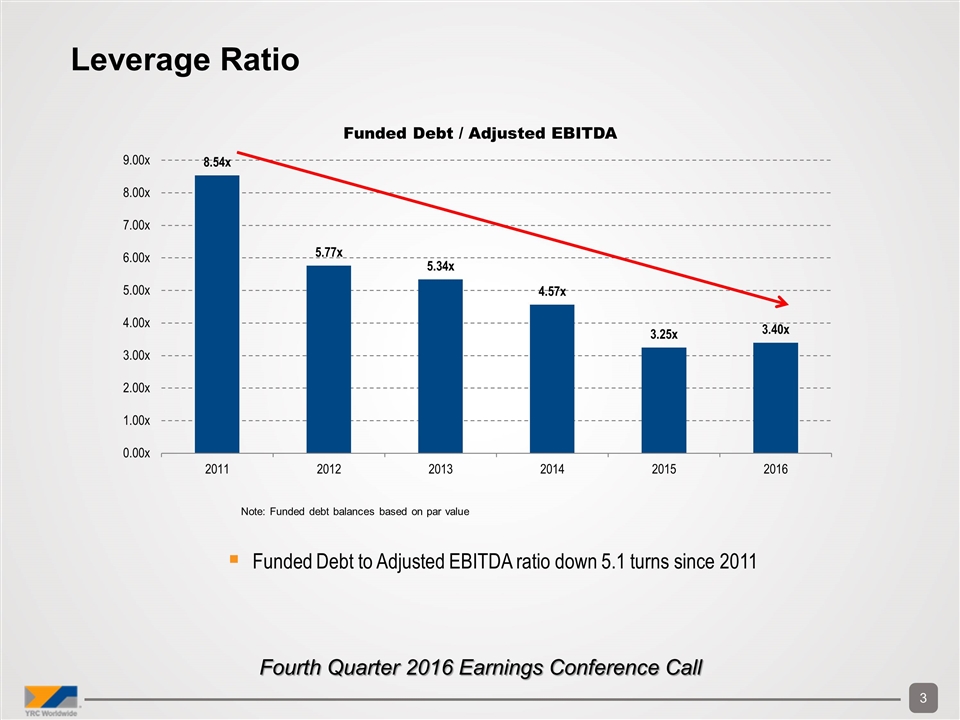
Funded Debt to Adjusted EBITDA ratio down 5.1 turns since 2011 Note: Funded debt balances based on par value Leverage Ratio Fourth Quarter 2016 Earnings Conference Call
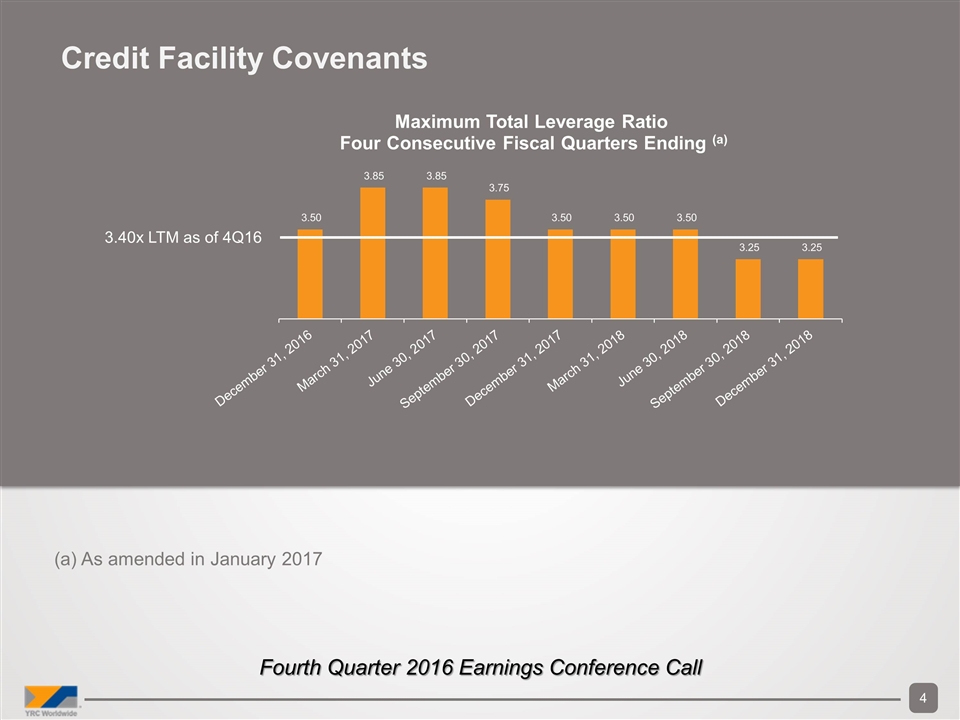
Credit Facility Covenants (a) As amended in January 2017 3.40x LTM as of 4Q16 Fourth Quarter 2016 Earnings Conference Call
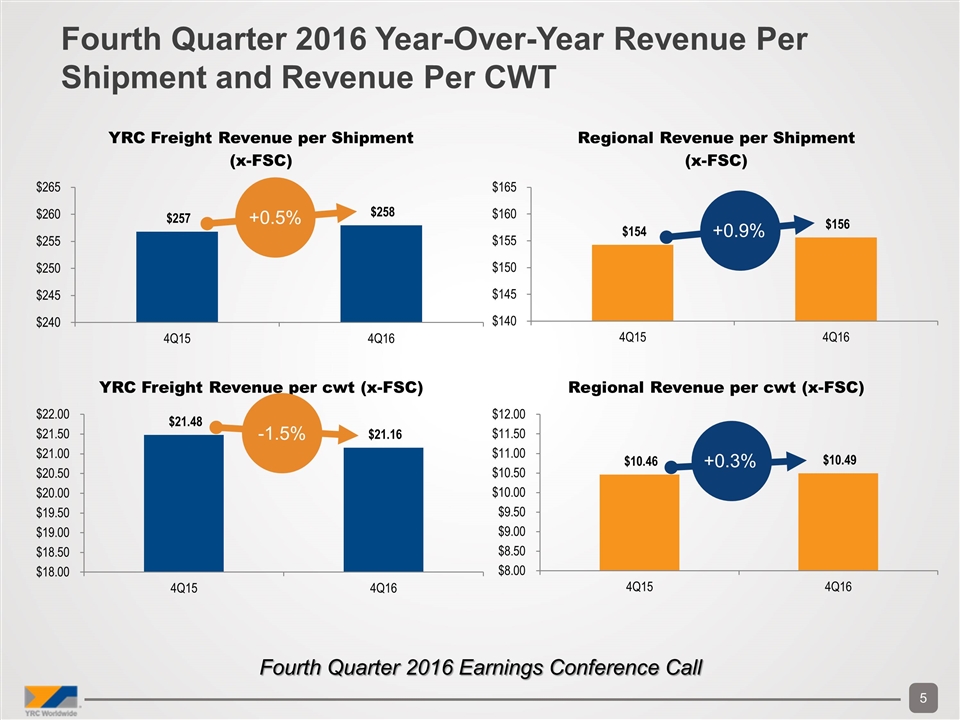
+0.5% Fourth Quarter 2016 Year-Over-Year Revenue Per Shipment and Revenue Per CWT Fourth Quarter 2016 Earnings Conference Call -1.5% +0.9% +0.3%
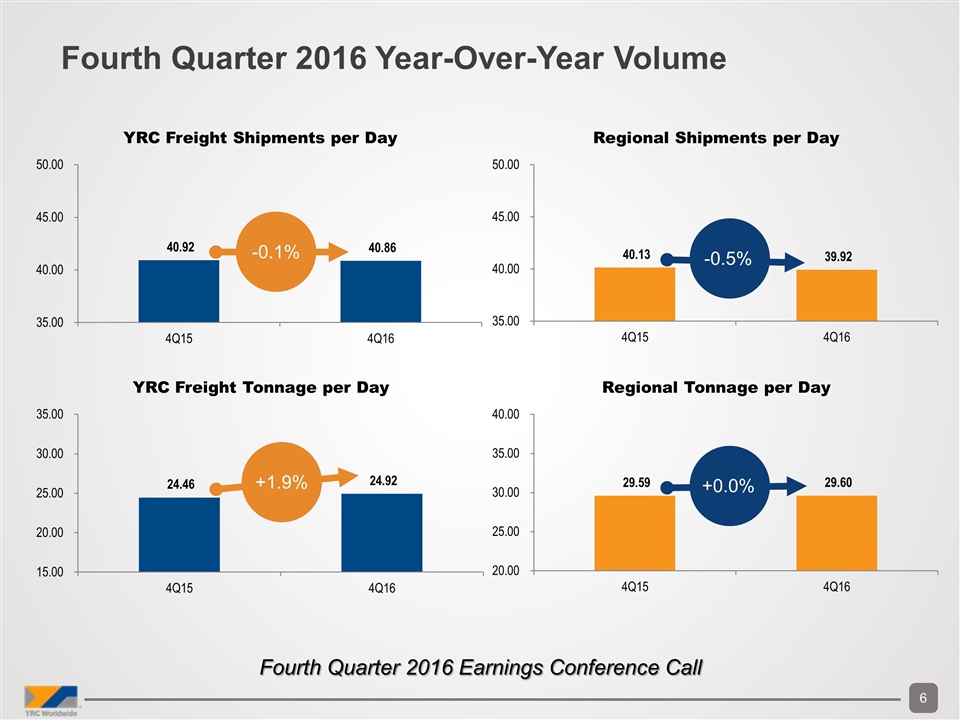
Fourth Quarter 2016 Year-Over-Year Volume Fourth Quarter 2016 Earnings Conference Call -0.1% +1.9% +0.0% -0.5%
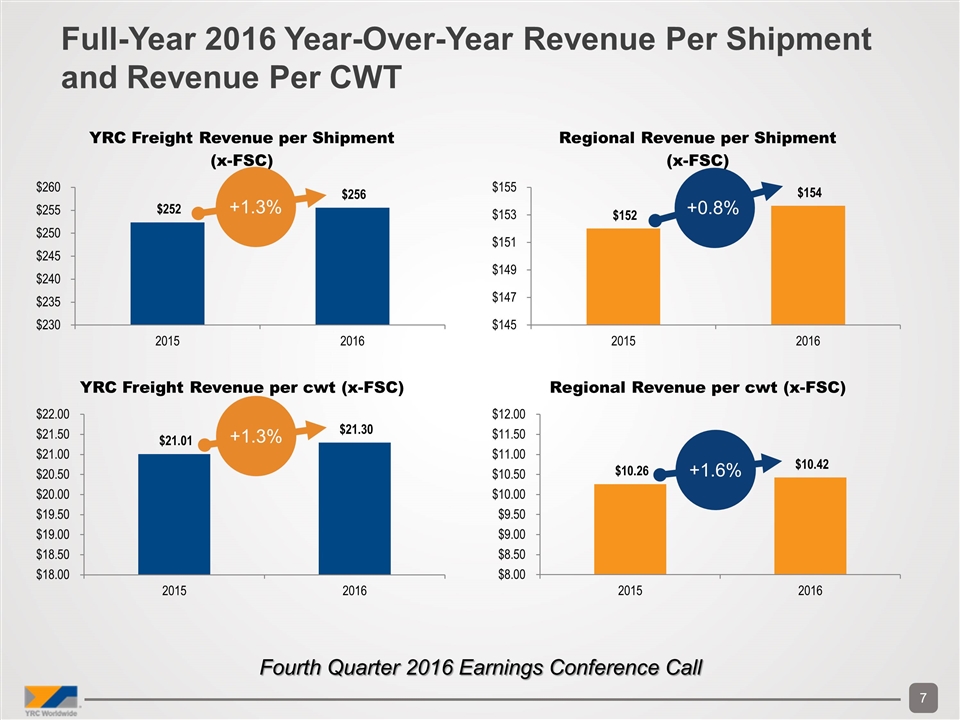
Full-Year 2016 Year-Over-Year Revenue Per Shipment and Revenue Per CWT +1.3% +0.8% +1.6% Fourth Quarter 2016 Earnings Conference Call +1.3%
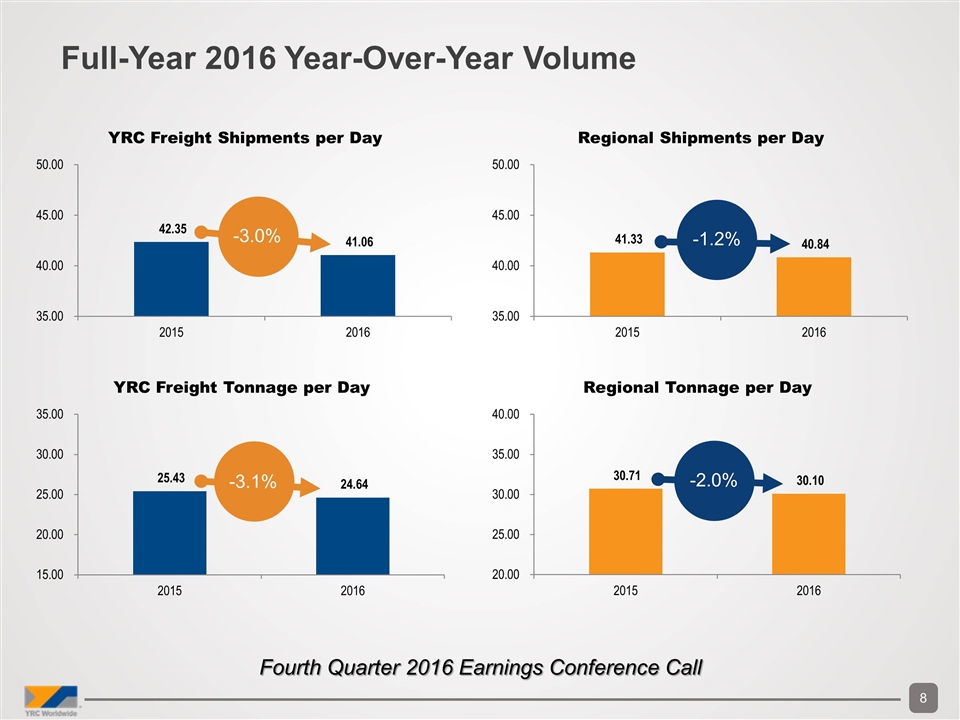
Full-Year 2016 Year-Over-Year Volume -3.0% -3.1% -1.2% -2.0% Fourth Quarter 2016 Earnings Conference Call
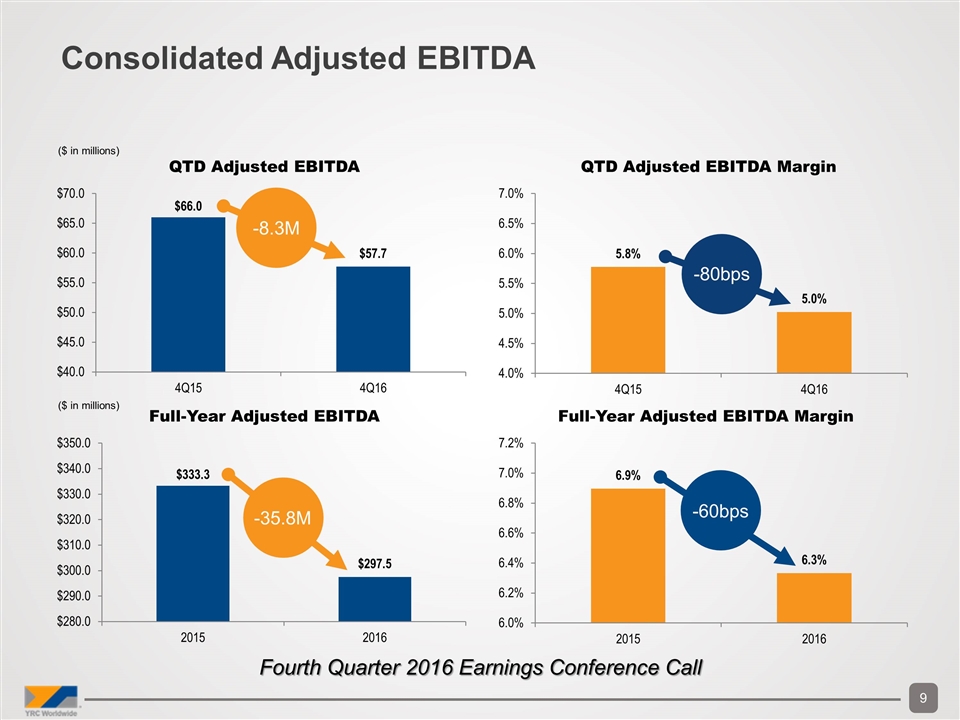
Consolidated Adjusted EBITDA ($ in millions) -8.3M -80bps -35.8M -60bps Fourth Quarter 2016 Earnings Conference Call ($ in millions)
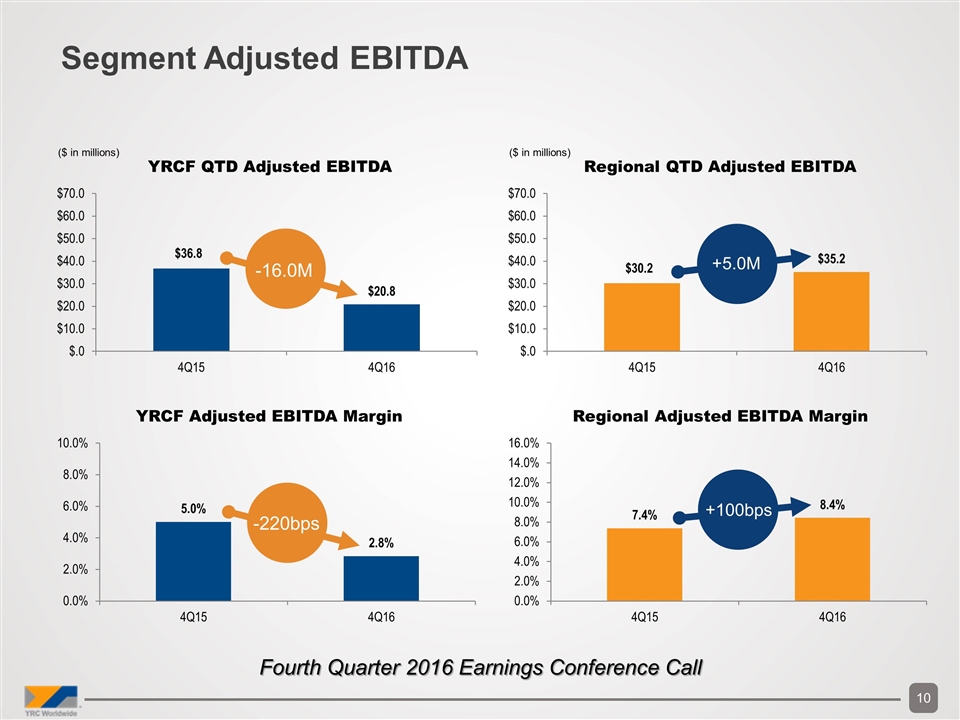
Segment Adjusted EBITDA ($ in millions) -16.0M +5.0M -220bps +100bps Fourth Quarter 2016 Earnings Conference Call ($ in millions)
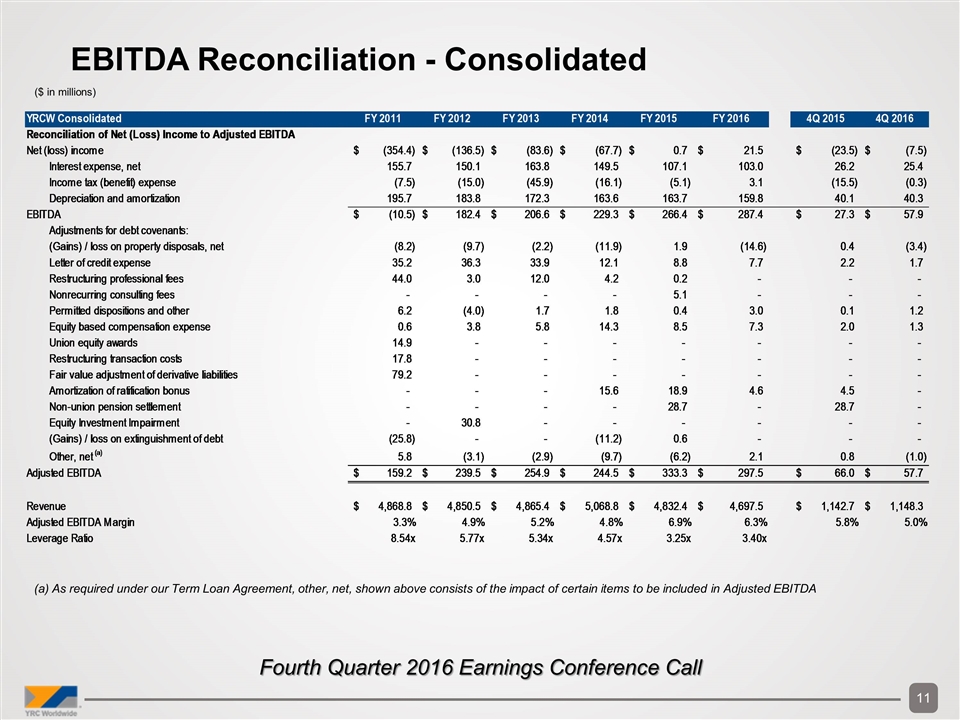
(a) As required under our Term Loan Agreement, other, net, shown above consists of the impact of certain items to be included in Adjusted EBITDA Fourth Quarter 2016 Earnings Conference Call EBITDA Reconciliation - Consolidated ($ in millions) YRCW Inc. Reconciliation of Operating Income / Loss to EBITDA YRCW Consolidated 40602 40633 40663 40694 40724 40755 40786 40816 40847 40877 40908 40939 40968 40999 41029 41060 41090 41121 41152 41182 41213 41243 41274 41305 41333 41364 41394 41425 41455 41486 41517 41547 41578 41608 41639 41670 41698 41729 41759 41790 41820 41851 41882 41912 41943 41973 42004 42035 42063 42094 42124 42155 42185 42216 42247 42277 42308 42338 42369 42400 42429 42460 42490 42521 42551 42582 42613 42643 42674 42704 42735 42766 42794 42825 42855 42886 42916 42947 42978 43008 43039 43069 43100 43131 43159 43190 43220 43251 43281 43312 43343 43373 43404 43434 43465 43496 43524 43555 43585 43616 43646 43677 43708 43738 43769 43799 43830 43861 43890 43921 43951 43982 44012 44043 44074 44104 44135 44165 44196 3Q15 4Q15 1Q16 2Q16 3Q16 4Q16 FY 2011 FY 2012 FY 2013 FY 2014 FY 2015 FY 2016 LTM 3Q 2016 4Q 2015 4Q 2016 Reconciliation of Net (Loss) Income to Adjusted EBITDA Net (loss) income $,-33,652.127849640114 $,-32,187.325768550763 $,-22,111.369875875065 $,-11,768.214502606243 $-8,255.2299866962512 $,-42,307.83920245192 $-,820.9463640508136 $,-75,720.227195263564 $,-14,597.510753252969 $,-18,850.912037272101 $,-55,829.874061704795 $,-36,449.43417477471 $,-21,936.792217109345 $,-27,390.944528893757 $,-15,673.40045272787 $-5,989.8930621222262 $-,930.45375997948133 $,-14,835.601134407361 $-2,276.3532414046035 $20,132.55606639848 $-6,679.8457787150792 $-8,346.6698662784329 $,-20,206.42197774578 $,-32,056.59607441581 $,-12,174.37930048657 $19,685.284353610612 $-7,592.1908994249898 $,-19,358.75706169482 $11,863.796627305826 $,-15,006.215258536349 $-7,164.2573412661004 $,-22,261.135859566308 $-7,704.7169258559825 $,-15,151.528784923572 $23,319.379064305333 $,-55,021.641396347215 $-9,828.59853177892 $-5,319.3193577971815 $54.697960385325857 $-3,353.6898825248113 $-1,559.2372350131081 $-3,061.8954753968906 $-4,010.3464048516498 $8,209.3794850056147 $8,031.9994548807126 $-5,618.6629341540565 $3,832.1543069467393 $,-11,836.113610231339 $,-17,440.574979703266 $7,681.1005161797166 $5,085.83798110491 $1,858.3879185416527 $19,022.959210054069 $4,115.134803475321 $8,808.2552128705811 $6,880.4950813623309 $6,546.8736535686903 $-3,328.2363901122944 $,-30,922.1161570615 $,-15,113.201872679656 $-2,589.9981495442171 $6,787.929988808939 $5,563.5465003782228 $10,590.66825681435 $11,302.766963581227 $1,461.6850174429567 $14,780.199739594465 $13,081.881921050068 $11,540.406018252606 $6,639.777296470962 $5,937.2876432335061 $-8,078.8863914906387 $-1,341.538141080469 $18,176.162311865319 $8,585.1516140391304 $20,324.679700020264 $31,395.218456660677 $9,342.7527780547643 $16,069.100609593283 $16,946.203523238903 $18,986.692239492917 $8,279.6059402841311 $10,045.434225467216 $-1,545.9432232393967 $-1,444.1844504544922 $15,669.265810827566 $17,412.426277862523 $20,081.998692656682 $22,403.910150046686 $12,109.946911255272 $20,159.454532444885 $16,435.54187802563 $23,359.151497984451 $9,764.9902166404554 $8,797.1347655839891 $-7,679.8426902497504 $165.67590286877584 $15,939.83933727676 $18,881.479370405643 $20,641.466295538321 $26,965.296607430279 $11,720.495832061957 $19,192.895172496948 $26,358.353591746247 $20,879.116051822661 $12,860.921258869488 $8,738.4706414184966 $-2,141.5870629236656 $-,424.7989158708153 $17,431.193159028553 $21,119.55410800768 $14,540.725699359962 $29,925.385218640015 $18,655.36043164273 $16,613.46562634685 $28,892.565908951921 $21,655.146305239719 $10,055.62652822771 $11,132.152109252651 $19,803.763774580446 $,-27,703.478893605105 $,-10,915.270033414932 $27,456.380289640885 $29,323.76667808749 $24,117.470957957074 $-,354.4 $-,136.5 $-83.614999999999995 $-67.7 $0.65100000000000002 $21.500000000000178 $5.5 $-23.500000000000171 $-7.49999999999946 Interest expense, net $12,262.60876099529 $13,764.427676363357 $13,038.397882492789 $12,421.240928078394 $14,408.89769917776 $12,649.43375051652 $11,642.470425964233 $12,887.627285681781 $15,566.326103275715 $11,333.604253253176 $16,212.142274523096 $12,178.543204405207 $12,139.585593965156 $11,681.144665541011 $12,041.844205860281 $12,083.726971637156 $17,125.923042546914 $11,701.818999143659 $12,286.479268110854 $9,680.2011339337314 $12,228.9485762507 $12,050.149895437244 $14,685.524417222212 $15,553.402502515151 $11,813.37194011358 $11,825.46454257375 $12,226.127214140528 $15,806.778490225712 $13,861.551679620659 $18,268.213152776425 $12,397.844713138591 $12,438.427435852516 $12,398.150725727966 $13,995.371132080374 $13,218.704503264747 $32,434.832665500569 $10,198.636763550689 $15,471.980373079954 $10,424.693073156981 $10,558.544735459089 $10,611.900554633899 $10,572.144695317918 $14,765.117134571337 $7,194.3999149066012 $9,518.2164627843777 $9,203.69240693545 $8,486.2355763697597 $9,614.8545503552068 $8,978.7259036461674 $8,832.4092526505701 $8,945.9611027699884 $9,070.1247415232338 $9,814.3773707912333 $9,080.1527319126108 $8,935.2890880508712 $7,605.9428046790017 $8,482.7299887274821 $8,626.4447251244437 $8,784.740623203159 $8,785.6422757643795 $8,328.3616830003739 $8,662.6079460818328 $8,487.6790919806081 $8,647.872894959135 $8,451.8850208131771 $8,628.4512668999214 $8,611.368644077334 $8,416.1156368473603 $8,591.9466812191331 $8,398.7040915887683 $8,553.3386595795509 $8,562.1859977147633 $8,027.8965845857992 $8,541.3975056399231 $8,379.5783789471425 $8,545.8009720688769 $8,359.1486385685075 $8,620.4226697556678 $8,611.2641068239209 $8,421.8559302167851 $8,669.7256723225037 $8,490.701026702518 $8,573.5509283962219 $8,639.4005793453343 $8,105.5672508217349 $8,626.8035976388619 $8,505.7272046064118 $8,685.2944738860897 $8,493.3760547947277 $8,731.8130657474176 $8,731.6411396782332 $8,538.4123104301834 $8,780.8996968386782 $8,598.2413113245639 $8,767.5923785647028 $8,833.7713269078031 $7,908.524867911824 $8,447.9429299528492 $8,263.9900324577666 $8,447.8654484749513 $8,251.60819952274 $8,436.1600684216082 $8,435.9733515374428 $8,239.809951313804 $8,601.511109852669 $8,412.1239111970099 $8,587.634923997586 $8,588.690929813045 $8,023.368813478344 $8,761.9473107198319 $8,386.814782076613 $8,573.884938159561 $8,372.5523073688328 $8,559.8208886617722 $8,559.6341717776104 $8,358.8865845636992 $8,701.1814458087665 $8,509.242527802384 $8,686.7768556954816 100.0% 100.0% 100.0% 100.0% 100.0% 100.0% 155.69999999999999 150.14400000000001 163.803 149.5 107.05200000000001 103 103.8 26.2 25.400000000000006 Income tax (benefit) expense $-30.410529500998202 $-4,550.5490064462438 $67.852361987768262 $50.950671100635233 $-2,695.1648282067113 $234.18564461170936 $45.473099463027154 $-8,938.713993725712 $52.268378809850361 $201.61790179915261 $8,079.4762113096895 $74.193763887441008 $53.4689546292594 $-3,284.460164052702 $361.67173641876525 $-,199.84928938918799 $-,912.66567709865001 $226.9282430896296 $107.19312394850699 $-9,568.5038334107085 $220.52665888620987 $36.403212078400003 $-2,126.616394054996 $7.2133929567418003 $15.090430163437 $-4,477.7773724782719 $77.108695086157198 $26.263172289118998 $,-10,135.28757314909 $55.463784381490008 $19.4088890127898 $7,253.2974787394305 $45.410167827689804 $15.4935677080499 $,-38,825.989729574139 $15.1759042389182 $-91.514455272939799 $-4,039.6833905799813 $9.2884578979007806 $167.070563605453 $-8,051.9652954738704 $11.080877695443951 $-1,960.7797309388059 $-2,459.59801676302 $10.71683702 $5.7495961883039604 $253.54171742973995 $20.039899999999996 $10.863106971503999 $1,413.1609998866238 $48.519092303549996 $15.725722261669999 $2,238.8129390908398 $19.741035283399999 $29.771941589397997 $6,609.8652650694003 $12.1078034459 $390.98263964044418 $390.98263964044418 $-3,265.8069430794521 $-,559.67186904549101 $1,466.8016131421484 $1,202.2249780124878 $2,288.4041421762386 $2,442.411286280781 $315.85504638760148 $3,193.8486189962009 $2,826.8596665503192 $2,493.762633350098 $1,434.7873453946954 $1,282.9865816444533 $-1,011.2467951552728 $-,167.86179504590064 $2,275.1385519489218 $1,074.6168017368693 $2,544.718204493319 $3,929.7884026365032 $1,169.4469196506029 $2,011.3943562313898 $2,121.1826943097308 $2,376.5938456579856 $1,036.3711737647088 $1,257.4026510815286 $-,183.89796541535344 $-,171.79323155643777 $1,863.9404467426077 $2,071.2984262992509 $2,388.857912462589 $2,665.61324379546 $1,440.5410009827556 $2,398.71686379034 $1,955.929597106606 $2,778.6922376793759 $1,161.5962385592272 $1,046.4648122624149 $-,830.50075926224201 $17.916247594324254 $1,723.6578720175519 $2,041.8494994727932 $2,232.1750746919356 $2,916.362014490847 $1,267.4583425797812 $2,075.52610855379 $2,850.4011805658497 $2,257.8745988870351 $1,390.7843299789868 $944.98114026510893 $-,222.36838885330022 $-44.03368131509059 $1,809.9410505740477 $2,192.916319678553 $1,509.8138210221823 $3,107.2562082994509 $1,937.168884264247 $1,724.990060891869 $3,000.15008607862 $2,248.5287092203048 $1,044.519186153153 $1,155.8898406983019 -7.4519609606818973 -15.015000000000001 -45.923999999999999 -16.130916934952857 -5.0999999999999996 3.1 -12.1 -15.5 -0.29999999999999982 Depreciation and amortization $15,237.334212487187 $18,696.322029551702 $15,956.997240084502 $15,042.60048871255 $16,558.357088901808 $15,284.428732915088 $15,372.795712276782 $15,545.19521859771 $15,230.574910012845 $14,558.760739823198 $21,279.732094075323 $15,931.33180448407 $16,127.50721066473 $16,969.474610124391 $15,391.990549579361 $14,929.307337871733 $14,653.434704660611 $14,338.882737442158 $15,131.776702950361 $15,117.534480419745 $15,335.844263122532 $14,403.465191965264 $14,665.668886177988 $14,527.260491016519 $13,964.730963793987 $15,078.724068459438 $14,362.455045300365 $14,363.955976215659 $14,862.447676923557 $14,331.555786457966 $14,305.334663576752 $14,577.204068647 $14,456.394084141197 $13,411.144531577085 $14,087.901685110131 $13,679.116023371878 $13,068.6531028446 $14,274.767926711193 $13,771.912656866927 $13,230.527466386358 $14,017.676014122611 $13,428.296220419077 $13,299.751705973842 $14,162.862329033676 $13,635.609494785162 $12,664.721159443056 $14,378.815017869105 $13,430.254372397851 $13,346.14553246036 $14,803.41299291297 $13,694.518184105196 $13,010.697812506594 $14,624.765597649135 $13,467.56206149125 $13,144.793862969624 $14,080.744204464971 $13,244.581236556058 $12,683.73466972258 $13,970.793190979004 $13,123.149712921186 $13,530.122981889952 $14,952.44327006381 $13,737.654637875041 $13,958.63075477021 $15,262.222472557274 $13,859.481343085978 $14,769.890399156602 $15,484.28683746508 $14,510.751109110603 $14,405.842191994967 $15,758.68105983106 $13,583.616367598459 $13,535.446802203331 $15,484.694461715557 $13,617.172948442896 $14,523.835394691758 $15,723.920664639498 $14,154.102988922701 $15,215.131272034494 $15,705.239702182831 $15,213.5455774632 $14,815.237319806849 $15,899.658424267102 $15,523.66761246707 $15,198.430160520689 $16,886.16224912948 $15,677.549867030582 $16,224.637795511953 $17,211.245343654969 $16,090.760461827451 $16,964.223269668488 $17,090.305395183783 $17,258.920139388363 $16,455.23639936906 $17,186.817357172655 $17,140.400936128193 $16,529.49555856702 $18,458.972841882289 $17,430.757375172212 $17,879.342237337329 $18,581.633266439738 $18,083.125078761313 $18,354.366643488691 $19,172.169528747942 $18,780.459397519448 $17,473.60509538067 $19,337.281300410494 $18,673.340012974328 $18,168.331115336252 $20,423.769067445748 $18,802.327173634181 $18,523.511287361183 $20,570.70134894191 $18,977.626159002662 $18,873.590398012708 $20,570.5190527952 $19,421.333555136818 $18,466.50662083042 $20,683.810271533912 195.666 183.761 172.32900000000001 163.61206254601134 163.72800000000001 159.80000000000001 159.6 40.099999999999994 40.300000000000011 EBITDA $-6,183.1432905543934 $-4,277.125069081947 $6,951.8776086899943 $15,746.37145444043 $20,016.859973176604 $,-14,139.791074408602 $26,239.792873653227 $,-56,225.651787094575 $16,251.658638845442 $7,243.708576034249 $,-10,258.523481796688 $-8,265.2732687364169 $6,383.3130525515426 $-2,024.3712696336261 $12,122.106039130536 $20,823.291957997473 $29,936.238310129393 $11,432.28845268085 $25,249.95853605118 $35,361.787847341249 $21,104.620000918731 $18,143.348433202475 $7,018.7096862489198 $-1,968.1832209531694 $13,619.155404022347 $42,111.277503849153 $19,073.50005510206 $10,838.921932561007 $30,452.767226535132 $17,649.17465079531 $19,558.330924462032 $12,007.591095712109 $19,195.238051840872 $12,270.480446441938 $11,799.995523106072 $-8,892.5168032358506 $13,346.530307527275 $20,387.745551413984 $24,260.592148307136 $20,602.452882926089 $15,018.374038269532 $20,949.626318035549 $22,093.742704754724 $27,107.43712182873 $31,196.542249470251 $16,254.877062170848 $26,950.746618615343 $11,229.35212521718 $4,895.285841604418 $32,729.712068008204 $27,774.6758989781 $23,954.93619483315 $45,700.915117585275 $26,682.469309034794 $30,918.110105480475 $35,177.47355575705 $28,286.292682298132 $18,372.925644375173 $-7,775.5997032388932 $3,529.7831729264581 $18,708.81464630062 $31,869.383875039301 $28,991.105208246358 $35,484.406938293832 $37,459.28574323246 $24,265.472673816457 $41,354.975622155005 $39,808.885908194257 $37,136.866441932441 $30,879.110925449393 $31,532.293944288569 $13,055.669178667311 $20,054.427777635181 $44,477.392831169724 $31,656.519743166034 $45,938.38788723023 $59,408.76162505189 $33,286.725356383737 $41,906.890344683088 $43,194.48184994825 $45,246.66315219723 $32,621.915460558208 $35,776.46229212065 $22,433.227003157655 $21,688.19729331492 $43,046.172104338519 $43,667.1775798766 $47,380.788874517311 $50,773.592872875932 $38,373.61439812896 $48,253.390628170644 $44,019.352543350251 $52,177.663571890866 $35,979.851406461152 $35,798.9313583767 $17,463.828813524004 $24,621.166574231625 $44,569.657577580365 $46,618.76277508415 $49,200.849056042542 $56,714.26895271367 $39,507.239321824658 $48,058.761276076868 $56,620.734252373848 $50,518.501159214415 $40,136.890009583556 $37,607.796574493856 $24,897.453654178666 $25,723.254423781913 $48,426.850587768182 $50,500.87907952808 $43,147.935745902883 $61,975.263869202492 $48,129.499979255132 $45,771.261193316866 $60,821.986554918687 $52,026.190015405606 $38,074.189486301366 $41,658.629077180347 $-10.485960960681894 $182.39 $206.59300000000002 $229.28114561105849 $266.39999999999998 $287.4000000000002 $256.8 $27.299999999999823 $57.90000000000056 Adjustments for debt covenants: (Gains) / loss on property disposals, net 102.20925585670025 1,218.2440881486 -3,799.2125006308597 -,937.74651382144987 -2,539.7955586324629 -,797.9215743279301 -8,355.7539221168408 -1,636.5893129642 218.60482397229899 -,140.10127408089849 12,859.982041240199 -,907 -,745 10,014 -4,145 -,987 -1,409 -12 -61 -2,268 212 -,507 -8,916 34 -4,826 321 -98 1,229 138 230 190 850 -,205 338 -,392 48 -,467 607 -4,259 -2,817 609 260 -98 -6.8916199999992003 -1,327.6902678099 -1,930.8871455292101 -2,475.4839327477998 -55.938586850528964 21.008317892994 1,324.1975344000002 -41.471978808968004 309.00265557780006 -,917.28990205279797 171.50874357615095 49.762224247229796 645.29321860100038 322.08225569414981 187 -1,023.3 0 0 0 0 7.9999999999997726 0 0 0 0 0 0 0 0 0 -3,200 0 0 -9,700 0 0 0 0 0 -7,700 -0.18600000000014916 0 0 0 0 0 0 0 0 0 0 0 0 0 0 0 0 0 0 0 0 0 0 0 0 0 0 0 0 0 0 0 0 0 0 0 866.56418642438109 -,514.21774430585015 0 7.9999999999997726 0 0 -8.2460000000000004 -9.7319999999999993 -2.1909999999999998 -11.858331725058001 1.9339999999999999 -14.6 -10.8 0.39999999999999991 -3.4000000000000004 Letter of credit expense 2,508.6331399999999 2,799.742 2,713.2262600000004 2,783.4268 2,686.1681200000003 2,963.2266100000015 3,241.6316200000001 3,138.147399999996 3,242.75510000001 3,137.51971 3,238.2580500000004 3,238 1,592 3,234 3,120 3,217 3,113 3,217 3,223 3,081 3,174 3,026 3,101 3,102 2,800 3,035 2,929 3,022 2,863 2,751 2,719 2,575 2,655 2,666 2,816 2,831 1,561 793 801 771 572 927 781 748.01559677083321 764.14997082986099 739.49997177083321 765.37705416319443 764.53650207986095 675.7713208749999 748.17539096874987 723.59538843749988 741.57163749652773 717.64997177083319 749.49689631944443 749.49689631944443 720.31957708333323 749.49689631944443 720.76749374999986 744.79307687499988 757.06391020833325 708.2210772916668 746.8382157638888 722.7466604166666 736.61252131944445 712.85082708333323 736.61252131944445 736.61252131944445 702.95499374999986 726.38682687499988 702.95499374999986 726.38682687499988 726.38682687499988 656.09132750000003 720.93448659722219 697.6785354166667 715.48214631944438 692.40207708333332 715.48214631944438 715.48214631944438 687.12561874999994 710.02980604166657 687.12561874999994 710.02980604166657 710.02980604166657 641.31724416666668 706.60419840277768 683.81051458333332 703.17859076388879 680.49541041666669 703.17859076388879 703.17859076388879 677.18030624999994 699.7529831249999 677.18030624999994 699.7529831249999 699.7529831249999 632.03495250000003 697.02681298611105 674.54207708333331 694.30064284722221 671.90384791666668 694.30064284722221 694.30064284722221 669.26561874999993 691.57447270833325 669.26561874999993 691.57447270833325 691.57447270833325 624.6479108333333 712.45832666666661 667.92968124999993 688.81353520833329 666.59374374999993 688.81353520833329 688.81353520833329 665.25780624999993 687.43306645833331 665.25780624999993 687.43306645833331 2,219.313369722222 2,215.574669444441 2,212.1232032638891 2,172.2100088194443 2,176.1800363888888 2,155.7286474999996 35.225999999999999 36.335000000000001 33.933 12.053042593534721 8.7880000000000003 7.7 8.1999999999999993 2.1999999999999993 1.7000000000000002 Restructuring professional fees #REF! #REF! #REF! #REF! #REF! #REF! #REF! #REF! #REF! #REF! #REF! 118 -10 357 2,742 164 -,340 #REF! #REF! #REF! #REF! #REF! #REF! 500 820 443 372 665 1,455 944 827 759 3,206 2,027 1,918 -,558 -,206 -,263 13 45 #REF! #REF! #REF! #REF! #REF! #REF! 0 0 0 0 0 0 0 0 186.25 0 0 0 0 0 0 0 0 0 0 0 0 0 0 0 0 0 0 0 0 0 0 0 0 0 0 0 0 0 0 0 0 0 0 0 0 0 0 0 0 0 0 0 0 0 0 0 0 0 0 0 0 0 0 0 0 0 0 0 0 0 0 0 186.25 0 0 0 0 0 44 3.0310000000000001 12.016999999999999 4.1649852900000006 0.186 0 0 0 0 Nonrecurring consulting fees 0 0 0 0 0 0 0 0 0 0 0 0 0 0 0 0 0 0 0 0 0 0 0 0 0 0 0 0 0 0 0 0 0 0 0 0 0 0 0 0 0 0 0 0 0 0 0 1,002.7140000000001 937.21100000000001 956.47289999999998 968.39859999999999 978.32830000000001 1,018.8948 960.47820000000002 -1,720 0 0 0 0 0 0 0 0 0 0 0 0 0 0 0 0 0 0 0 0 0 0 0 0 0 0 0 0 0 0 0 0 0 0 0 0 0 0 0 0 0 0 0 0 0 0 0 0 0 0 0 0 0 0 0 0 0 0 0 0 0 0 0 0 0 0 0 0 5.1020000000000003 0 0 0 0 Permitted dispositions and other 0 0 0 0 0 0 0 0 0 0 0 32.469000000000001 32.72 -1,973.9621399999999 31.5283300000001 31.433330000000101 -,276.79167000000001 45.558330000000304 45.5023300000001 -,951.97115000000008 47.680330000000104 39.358330000000102 -1,086.4696899999999 36.613330000000005 35.913330000000002 24.0427 30.209330000000001 10.12533 -,248.99967000000001 80.92841 80.133669999999995 1.3522500000000299 79.370070000000013 79.598199999999991 1,436.9757 81.752210000000005 1.3801099999999999 -13.85032 29.744700000000002 28.490599999999997 173.01335 29.728679999999898 28.303879999999999 1,363.7727399999999 28.473460000000198 27.834259999999798 -36.7833299999998 27.47634 31.110430000000001 79.524559999999994 55.605669999999996 27.287790000000001 88.581240000000008 26.987359999999999 27.10519 -34.218440000000001 27.128720000000001 0 0 0 0 0 0 0 0 0 0 0 0 0 0 0 0 0 0 0 0 0 0 0 0 0 0 0 0 0 0 0 0 0 0 0 0 0 0 0 0 0 0 0 0 0 0 0 0 0 0 19.874110000000002 27.128720000000001 0 0 0 0 6.2380000000000004 -3.9830000000000001 1.7 1.8 0.4 3 1.9 0.1 1.2 Equity based compensation expense -1,412.73118 122.13996999999999 156.90369000000001 161.61656000000002 69.054000000000002 15,029.16576 145.19094000000041 255.06851999999998 160.39893000000001 206.96299999999999 327.44934000000001 76 578 399 222 407 402 241 244 384 247 246 356 196 275 571 278 569 2,131 304 310 -,100 282 272 705 272 4,535 1,776 650 637 1,232 648 652 740.85405000000094 658.53922000000102 658.18901000000005 1,882.8900100000001 596.31939 508.78190000000001 -,581.75029000000006 653.87718999999993 1,623.3994 919.68944999999997 1,342.13301 734.33249999999998 718.38615000000004 713.58420000000001 708.9 708.9 670.2 947.3 724.96 724.96 1,866.2750000000001 722.7 721.97299999999996 718.97900000000004 716.1 716.1 715.9 719.9 650 650 1,200 650 650 1,200 650 650 1,200 650 650 1,200 650 650 1,200 650 650 1,200 650 650 1,200 650 650 1,200 650 650 1,200 650 650 1,200 650 650 1,200 650 650 1,200 650 650 1,200 650 650 1,200 650 650 1,200 650 650 1,200 2,794.8516600000003 2,131.3842 2,342.46 3,313.9350000000004 2,157.520000000001 2,151.9 0.626 3.802 5.7939999999999996 14.344472290000002 8.4730000000000008 7.3 8 2 1.2999999999999998 Union equity awards 14.884 0 0 0 0 0 0 0 0 Restructuring transaction costs 17.783000000000001 0 0 0 0 0 0 0 0 Fair value adjustment of derivative liabilities 79.221000000000004 0 0 0 0 0 0 0 0 Amortization of ratification bonus 1,695 1,695 1,823 1,695 1,695 1,823 1,695 1,695 1,823 1,696.3290084615385 1,696.3290084615385 1,841.532383076923 1,484.2446016346153 1,484.2446016346153 1,591.7605254807693 1,507.2768953846153 1,484.2446016346153 1,591.7605254807693 1,503.7446016346153 1,503.7446016346153 1,612.2605254807693 1,503.7446016346153 1,503.7446016346153 1,612.2605254807693 4,583.2820224999996 4,619.74972875 4,619.74972875 0 0 0 0 0 0 15.638999999999999 18.934000000000001 4.5999999999999996 9.1 4.5 0 Non-union pension settlement 0 0 0 0 0 0 0 0 0 0 0 30,000 0 0 0 0 0 0 0 0 0 0 0 0 0 0 0 0 0 0 0 0 0 0 0 0 0 0 0 0 0 0 0 0 0 0 0 0 0 0 0 0 0 0 0 0 0 0 0 0 0 0 0 0 0 0 0 0 0 0 0 0 0 0 0 0 28.687999999999999 0 28.722999999999999 28.7 0 Equity Investment Impairment 0 30.8 0 0 0 0 0 0 0 (Gains) / loss on extinguishment of debt -50.340809999999998 ,-13,690.743060000001 2,498.7998900000002 0 0 0 0 0 0 0 0 0 0 0 570.33420999999998 0 0 0 0 0 0 0 0 0 0 0 0 0 0 0 0 0 0 0 0 0 0 0 0 0 0 0 0 0 0 0 0 0 0 0 0 0 0 0 0 0 0 0 0 0 0 0 0 0 0 0 0 0 0 0 0 0 0 0 0 0 0 0 0 0 0 0 0 0 -25.794 0 0 -11.24228398 0.56999999999999995 0 0 0 0 Other, net (a) -,143.90078114786695 3,917.992935236268 188.00806980672519 645.29898845105106 1,880.7053123871301 -,223.8550403141078 -,184.32515068410896 5,973.8447879241721 -2,263.5749563525642 278.11015060199554 2,765.775414569272 -,209.19573126358318 -,397.3305255154282 3,768.3334096336257 -74.63436913053738 8.2747120025269396 190.55335987060607 #REF! #REF! #REF! #REF! #REF! #REF! -90.429907196690465 5.9315535177356651 -,372.32005704553012 13.290870037017157 -,259.4698158331485 -,380.76738847453817 -,335.94565777415119 -,166.46436245106815 -51.945244549558993 -,368.60790035862738 -,190.78840297836 -,678.97122310607301 -,110.89459676414936 -,259.16735752727254 -3,606.6951214139845 -,189.33684830713537 -,299.94348292608993 209.6126117304666 #REF! #REF! #REF! #REF! #REF! #REF! -2,247.7718662125881 627.95943861002161 -1,291.6987564538722 1,113.7437697470705 -1,984.7705795420879 386.79879721591715 -1,333.3504143150058 -,855.5151768176074 -1,326.838386740812 550.67064405365818 -,195.7134588784138 -,197.59561497628238 -23.002138147736332 -19.241576665866887 -22.615014523755235 1,479.5448451281736 -21.96320416364324 -20.297057807452802 -21.767748552450939 -21.779836933004844 -18.839475474385836 -20.73132454304141 -19.605156537880248 -21.072186808138213 -20.788233600118474 -15.610027391176118 -20.548969738694723 -18.791481456588372 -19.584440812832327 -18.079491016484099 -20.432407959953707 -20.000115872702736 -17.880051000596723 -19.432735540540307 -17.759015149342304 -19.294704493066092 -18.201377783527278 -14.305092066912039 -18.076092947740108 -16.371891422721092 -18.25856038373604 -16.896504222117073 -17.889815534697846 -18.468408903398085 -16.545158086730225 -18.012085263988411 -16.320977904637402 -17.944186538974463 -18.10972108612259 -13.364942361280555 -18.009127316152444 -16.31177901448973 -17.227313312803744 -15.959529176325304 -17.878312015353004 -17.48046870631515 -15.622582382697146 -17.038587586168433 -15.302323644296848 -17.049470230311272 -17.651036832063255 -13.02785782180581 -19.102046710926516 -15.917133755778195 -16.897800351354817 -15.718410685585695 -17.574128496431513 -17.168012475543946 -15.426545778027503 -16.799749067569792 -15.008286912183394 -16.890988708277291 -3,515.2403187375785 157.361570198962 -64.858729337358454 1,437.2845831570776 -62.387060959841619 -61.408667889059871 5.8 -3.1 -2.8559999999999999 -9.6735311541805356 -6.2 2.1 3.9 0.8 -1 Adjusted EBITDA $-2,178.944271737374 $6,623.9804239506902 $13,119.831269883485 $23,934.752643343891 $27,473.740958059221 $5,106.6922539450716 $21,953.627011782079 $27,590.259715220702 $19,230.446548573855 $9,521.4937323893319 $12,534.728738293024 $-5,917 $7,434 $13,774 $14,018 $23,664 $31,616 $14,732 $28,414 $35,554 $24,595 $20,827 $30,776 $1,310.20185014 $12,410.287540082 $46,510.146803621 $22,669.255139079 $15,782.280977692 $35,620.168060593 $22,134.21730538 $23,635.232010963 $16,108.99810116255 $22,397.221482245 $18,641.9998061441 $17,714 $-3,903 $4,469 $22,236 $22,725 $20,630 $19,682 $23,362.893923792533 $26,181.5150000006 $32,085.25028567496 $32,933 $16,574.999992373971 $27,468.999999999884 $13,012.7 $9,393.1999999999971 $36,376.5 $32,732 $27,134 $49,507 $30,107 $31,388 $37,678 $32,153 $21,297.624280881377 $24,069.458284140594 $6,437.7895466216705 $21,848.838748561033 $34,930.827601760204 $31,918.356713791196 $38,073.331255449637 $38,874.539512508338 $25,702.290446583447 $42,788.787306541446 $41,209.101426469868 $38,558.6219442644 $32,278.360762661516 $32,957.508584355433 $14,411.267771942192 $21,344.909077744003 $43,177.778348028252 $32,985.40679712611 $47,284.285592736844 $51,582.398748572035 $34,631.775094743229 $43,252.372375129831 $45,063.72741769765 $46,586.663385720851 $33,941.282064158862 $29,966.781330760667 $23,774.869431415795 $22,965.31881431249 $44,934.700209793555 $44,984.440398959377 $48,715.708904897467 $52,637.191779070483 $39,708.35021504209 $49,588.100810031137 $45,879.987691513517 $53,509.404469751877 $37,290.710734806511 $37,679.818110169792 $18,795.47207556288 $25,889.836584370343 $46,448.675263250327 $47,926.306575577255 $50,527.92238557696 $58,569.971214011712 $40,833.661652656527 $49,385.581450217775 $58,474.377288741154 $51,843.37044336583 $41,440.853304689263 $39,482.321576971881 $26,221.377090054935 $26,984.87447679344 $50,320.206867723922 $51,802.891627022305 $44,469.851480759862 $63,826.13920226691 $49,450.739385967034 $47,092.906716049656 $62,671.817815390663 $53,346.823332796368 $39,374.439005639186 $43,529.171154930402 $99,173 $77,520.82565021963 $63,217.455896942905 $,108,866.22748174917 $,109,700.17917959476 $,103,794.49129128136 $159.19999999999999 $239.54300000000001 $254.9 $244.5084989253547 $333.27499999999998 $297.50000000000023 $305.82299999999998 $65.999999999999815 $57.700000000000564 Revenue $4,868.8450000000003 $4,850.480681463574 $4,865.4342518556286 $5,068.8 $4,832.3999999999996 $4,697.4710078968801 $4,691.8999999999996 $1,142.6999999999998 $1,148.3000000000002 Adjusted EBITDA Margin 3.3% 4.9% 5.2% 4.8% 6.9% 6.3% 6.5% 5.8% 5.2% Leverage Ratio 8.5351758793969861 5.7651444625808308 5.3405256963515102 4.565076489798261 3.2462680969169608 3.395966386554619 3.4510157836395567 YRC Freight Segment 1Q12 2Q12 3Q12 4Q12 1Q13 2Q13 3Q13 4Q13 1Q14 2Q14 3Q14 4Q14 1Q15 FY 2013 FY 2014 FY 2015 4Q14 4Q15 FY 2011 FY 2012 FY 2013 FY 2014 FY 2015 FY 2016 LTM 3Q 2016 4Q 2015 4Q 2016 Reconciliation of operating income (loss) to adjusted EBITDA Operating (loss) income $-31.2 $0.5 $18 $24.5 $-21.4 $-88.48 $-37.299999999999997 $-31.2 $0.5 $18 $53.2 $31.856999999999999 $-21.4 $-9.9999999999994316E-2 Depreciation and amortization 109.1 98 93.1 23.8 22.599999999999994 102.91500000000001 119.8 109.1 98 93.1 90.3 90.488 22.6 22.399999999999991 (Gains) losses on property disposals, net -3 -15.9 1.9 -9.1 0.19999999999999996 -10.478 -9.9 -3 -15.9 1.9 -15.7 -11.840999999999999 0.2 -3.6999999999999993 Letter of credit expense 25.8 8.3000000000000007 6.1 1.5 1.5 28.093 29.6 25.8 8.3000000000000007 6.1 5 5.427999999999999 1.5 1.1000000000000001 Union equity awards 10.311 0 0 0 0 0 0 0 0 Nonrecurring consulting fees 0 0 5.0999999999999996 0 0 0 0 0 0 5.0999999999999996 0 0 0 0 Amortization of ratification bonus 0 10 12.2 3.3 2.8999999999999986 0 0 0 10 12.2 3 5.9039999999999999 2.9 0 Non-union pension settlement charge 0 0 28.7 0 28.7 0 0 0 0 28.7 0 28.710118740000002 28.7 0 Other, net (a) 4.5 -1.1000000000000001 2.1 0 2.3000000000000003 1.4 2.7 4.5 -1.1000000000000001 2.1 4.3 5.5 2.2999999999999998 1.0999999999999996 Adjusted EBITDA $105.19999999999999 $99.8 $167.19999999999996 $43.999999999999993 $36.79999999999999 $43.7 $104.89999999999999 $105.19999999999999 $99.8 $167.19999999999996 $140.10000000000002 $156.14611873999999 $36.799999999999997 $20.799999999999997 Revenue $3,203.369999999998 $3,206.9133781 $3,136.7610459000002 $3,237.376861499999 $3,055.7 $2,958.9 $2,962.28653222091 $733.69999999999982 $730.30000000000018 Adjusted EBITDA Margin 1.4% 3.3% 3.4% 3.8% 5.5% 4.7% 5.3% 5.2% 2.8% Regional Transportation Segment 1Q12 2Q12 3Q12 4Q12 1Q13 2Q13 3Q13 4Q13 1Q14 2Q14 3Q14 4Q14 1Q15 FY 2013 FY 2014 FY 2015 4Q14 4Q15 FY 2011 FY 2012 FY 2013 FY 2014 FY 2015 FY 2016 LTM 3Q 2016 4Q 2015 4Q 2016 Reconciliation of operating income to adjusted EBITDA Operating Income $79.900000000000006 $66.099999999999994 $85.4 $10.599999999999994 $9.5 $32.880000000000003 $70 $79.900000000000006 $66.099999999999994 $85.4 $81.3 $74.418000000000006 $9.5 $16.399999999999991 Depreciation and amortization 63.1 65.8 70.7 16.8 17.5 61.561999999999998 63.3 63.1 65.8 70.7 69.5 69.106999999999999 17.5 17.899999999999999 (Gains) losses on property disposals, net 0.6 4 0.2 3.3 0.2 -2.6549999999999998 0.7 0.6 4 0.2 1.1000000000000001 1.2 0.2 0.20000000000000007 Letter of credit expense 6.8 2.9 2.1 0.6 0.60000000000000009 6.6079999999999997 6.2 6.8 2.9 2.1 2.5 2.5269999999999997 0.6 0.5 Union equity awards 4.5730000000000004 0 0 0 0 0 0 0 0 Amortization of ratification bonus 0 5.6 6.6999999999999993 1.9 1.5999999999999996 0 0 0 5.6 6.7 1.5999999999999996 3.222 1.6 0 Other, net (a) 0.1 0 0.8 0 0.8 0.1 0 0.1 0 0.8 0.5 1.0780000000000001 0.8 0.2 Adjusted EBITDA $150.5 $144.39999999999998 $165.9 $33.199999999999996 $30.2 $103.06800000000001 $140.19999999999999 $150.5 $144.39999999999998 $165.9 $156.5 $151.452 $30.200000000000003 $35.199999999999996 Revenue $1,554.2729999999999 $1,640.6 $1,728.6 $1,831.4 $1,776.9 $1,739.3 $1,730.4731513499999 $409.20000000000005 $418 Adjusted EBITDA Margin 6.6% 8.5% 8.7% 7.9% 9.3% 8.9978727074110282 8.8% 7.4% 8.4%
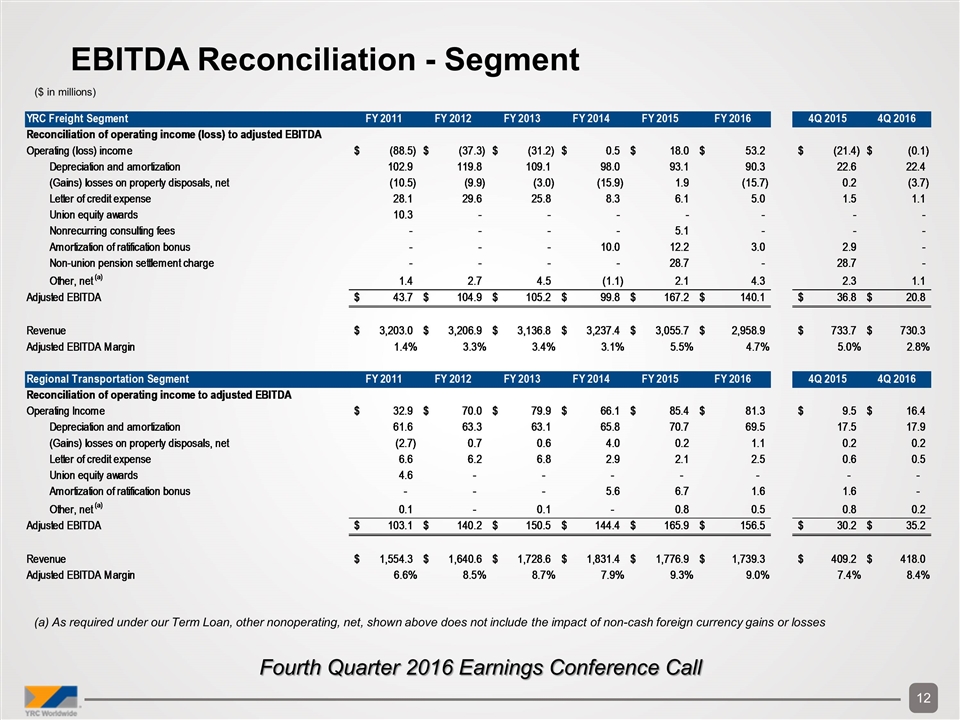
(a) As required under our Term Loan, other nonoperating, net, shown above does not include the impact of non-cash foreign currency gains or losses Fourth Quarter 2016 Earnings Conference Call EBITDA Reconciliation - Segment ($ in millions) YRCW Inc. Reconciliation of Operating Income / Loss to EBITDA YRCW Consolidated 40602 40633 40663 40694 40724 40755 40786 40816 40847 40877 40908 40939 40968 40999 41029 41060 41090 41121 41152 41182 41213 41243 41274 41305 41333 41364 41394 41425 41455 41486 41517 41547 41578 41608 41639 41670 41698 41729 41759 41790 41820 41851 41882 41912 41943 41973 42004 42035 42063 42094 42124 42155 42185 42216 42247 42277 42308 42338 42369 42400 42429 42460 42490 42521 42551 42582 42613 42643 42674 42704 42735 42766 42794 42825 42855 42886 42916 42947 42978 43008 43039 43069 43100 43131 43159 43190 43220 43251 43281 43312 43343 43373 43404 43434 43465 43496 43524 43555 43585 43616 43646 43677 43708 43738 43769 43799 43830 43861 43890 43921 43951 43982 44012 44043 44074 44104 44135 44165 44196 3Q15 4Q15 1Q16 2Q16 3Q16 4Q16 FY 2011 FY 2012 FY 2013 FY 2014 FY 2015 FY 2016 LTM 3Q 2016 4Q 2015 4Q 2016 Reconciliation of Net (Loss) Income to Adjusted EBITDA Net (loss) income $,-33,652.127849640114 $,-32,187.325768550763 $,-22,111.369875875065 $,-11,768.214502606243 $-8,255.2299866962512 $,-42,307.83920245192 $-,820.9463640508136 $,-75,720.227195263564 $,-14,597.510753252969 $,-18,850.912037272101 $,-55,829.874061704795 $,-36,449.43417477471 $,-21,936.792217109345 $,-27,390.944528893757 $,-15,673.40045272787 $-5,989.8930621222262 $-,930.45375997948133 $,-14,835.601134407361 $-2,276.3532414046035 $20,132.55606639848 $-6,679.8457787150792 $-8,346.6698662784329 $,-20,206.42197774578 $,-32,056.59607441581 $,-12,174.37930048657 $19,685.284353610612 $-7,592.1908994249898 $,-19,358.75706169482 $11,863.796627305826 $,-15,006.215258536349 $-7,164.2573412661004 $,-22,261.135859566308 $-7,704.7169258559825 $,-15,151.528784923572 $23,319.379064305333 $,-55,021.641396347215 $-9,828.59853177892 $-5,319.3193577971815 $54.697960385325857 $-3,353.6898825248113 $-1,559.2372350131081 $-3,061.8954753968906 $-4,010.3464048516498 $8,209.3794850056147 $8,031.9994548807126 $-5,618.6629341540565 $3,832.1543069467393 $,-11,836.113610231339 $,-17,440.574979703266 $7,681.1005161797166 $5,085.83798110491 $1,858.3879185416527 $19,022.959210054069 $4,115.134803475321 $8,808.2552128705811 $6,880.4950813623309 $6,546.8736535686903 $-3,328.2363901122944 $,-30,922.1161570615 $,-15,113.201872679656 $-2,589.9981495442171 $6,787.929988808939 $5,563.5465003782228 $10,590.66825681435 $11,302.766963581227 $1,461.6850174429567 $14,780.199739594465 $13,081.881921050068 $11,540.406018252606 $6,639.777296470962 $5,937.2876432335061 $-8,078.8863914906387 $-1,341.538141080469 $18,176.162311865319 $8,585.1516140391304 $20,324.679700020264 $31,395.218456660677 $9,342.7527780547643 $16,069.100609593283 $16,946.203523238903 $18,986.692239492917 $8,279.6059402841311 $10,045.434225467216 $-1,545.9432232393967 $-1,444.1844504544922 $15,669.265810827566 $17,412.426277862523 $20,081.998692656682 $22,403.910150046686 $12,109.946911255272 $20,159.454532444885 $16,435.54187802563 $23,359.151497984451 $9,764.9902166404554 $8,797.1347655839891 $-7,679.8426902497504 $165.67590286877584 $15,939.83933727676 $18,881.479370405643 $20,641.466295538321 $26,965.296607430279 $11,720.495832061957 $19,192.895172496948 $26,358.353591746247 $20,879.116051822661 $12,860.921258869488 $8,738.4706414184966 $-2,141.5870629236656 $-,424.7989158708153 $17,431.193159028553 $21,119.55410800768 $14,540.725699359962 $29,925.385218640015 $18,655.36043164273 $16,613.46562634685 $28,892.565908951921 $21,655.146305239719 $10,055.62652822771 $11,132.152109252651 $19,803.763774580446 $,-27,703.478893605105 $,-10,915.270033414932 $27,456.380289640885 $29,323.76667808749 $24,117.470957957074 $-,354.4 $-,136.5 $-83.614999999999995 $-67.7 $0.65100000000000002 $21.500000000000178 $5.5 $-23.500000000000171 $-7.49999999999946 Interest expense, net $12,262.60876099529 $13,764.427676363357 $13,038.397882492789 $12,421.240928078394 $14,408.89769917776 $12,649.43375051652 $11,642.470425964233 $12,887.627285681781 $15,566.326103275715 $11,333.604253253176 $16,212.142274523096 $12,178.543204405207 $12,139.585593965156 $11,681.144665541011 $12,041.844205860281 $12,083.726971637156 $17,125.923042546914 $11,701.818999143659 $12,286.479268110854 $9,680.2011339337314 $12,228.9485762507 $12,050.149895437244 $14,685.524417222212 $15,553.402502515151 $11,813.37194011358 $11,825.46454257375 $12,226.127214140528 $15,806.778490225712 $13,861.551679620659 $18,268.213152776425 $12,397.844713138591 $12,438.427435852516 $12,398.150725727966 $13,995.371132080374 $13,218.704503264747 $32,434.832665500569 $10,198.636763550689 $15,471.980373079954 $10,424.693073156981 $10,558.544735459089 $10,611.900554633899 $10,572.144695317918 $14,765.117134571337 $7,194.3999149066012 $9,518.2164627843777 $9,203.69240693545 $8,486.2355763697597 $9,614.8545503552068 $8,978.7259036461674 $8,832.4092526505701 $8,945.9611027699884 $9,070.1247415232338 $9,814.3773707912333 $9,080.1527319126108 $8,935.2890880508712 $7,605.9428046790017 $8,482.7299887274821 $8,626.4447251244437 $8,784.740623203159 $8,785.6422757643795 $8,328.3616830003739 $8,662.6079460818328 $8,487.6790919806081 $8,647.872894959135 $8,451.8850208131771 $8,628.4512668999214 $8,611.368644077334 $8,416.1156368473603 $8,591.9466812191331 $8,398.7040915887683 $8,553.3386595795509 $8,562.1859977147633 $8,027.8965845857992 $8,541.3975056399231 $8,379.5783789471425 $8,545.8009720688769 $8,359.1486385685075 $8,620.4226697556678 $8,611.2641068239209 $8,421.8559302167851 $8,669.7256723225037 $8,490.701026702518 $8,573.5509283962219 $8,639.4005793453343 $8,105.5672508217349 $8,626.8035976388619 $8,505.7272046064118 $8,685.2944738860897 $8,493.3760547947277 $8,731.8130657474176 $8,731.6411396782332 $8,538.4123104301834 $8,780.8996968386782 $8,598.2413113245639 $8,767.5923785647028 $8,833.7713269078031 $7,908.524867911824 $8,447.9429299528492 $8,263.9900324577666 $8,447.8654484749513 $8,251.60819952274 $8,436.1600684216082 $8,435.9733515374428 $8,239.809951313804 $8,601.511109852669 $8,412.1239111970099 $8,587.634923997586 $8,588.690929813045 $8,023.368813478344 $8,761.9473107198319 $8,386.814782076613 $8,573.884938159561 $8,372.5523073688328 $8,559.8208886617722 $8,559.6341717776104 $8,358.8865845636992 $8,701.1814458087665 $8,509.242527802384 $8,686.7768556954816 100.0% 100.0% 100.0% 100.0% 100.0% 100.0% 155.69999999999999 150.14400000000001 163.803 149.5 107.05200000000001 103 103.8 26.2 25.400000000000006 Income tax (benefit) expense $-30.410529500998202 $-4,550.5490064462438 $67.852361987768262 $50.950671100635233 $-2,695.1648282067113 $234.18564461170936 $45.473099463027154 $-8,938.713993725712 $52.268378809850361 $201.61790179915261 $8,079.4762113096895 $74.193763887441008 $53.4689546292594 $-3,284.460164052702 $361.67173641876525 $-,199.84928938918799 $-,912.66567709865001 $226.9282430896296 $107.19312394850699 $-9,568.5038334107085 $220.52665888620987 $36.403212078400003 $-2,126.616394054996 $7.2133929567418003 $15.090430163437 $-4,477.7773724782719 $77.108695086157198 $26.263172289118998 $,-10,135.28757314909 $55.463784381490008 $19.4088890127898 $7,253.2974787394305 $45.410167827689804 $15.4935677080499 $,-38,825.989729574139 $15.1759042389182 $-91.514455272939799 $-4,039.6833905799813 $9.2884578979007806 $167.070563605453 $-8,051.9652954738704 $11.080877695443951 $-1,960.7797309388059 $-2,459.59801676302 $10.71683702 $5.7495961883039604 $253.54171742973995 $20.039899999999996 $10.863106971503999 $1,413.1609998866238 $48.519092303549996 $15.725722261669999 $2,238.8129390908398 $19.741035283399999 $29.771941589397997 $6,609.8652650694003 $12.1078034459 $390.98263964044418 $390.98263964044418 $-3,265.8069430794521 $-,559.67186904549101 $1,466.8016131421484 $1,202.2249780124878 $2,288.4041421762386 $2,442.411286280781 $315.85504638760148 $3,193.8486189962009 $2,826.8596665503192 $2,493.762633350098 $1,434.7873453946954 $1,282.9865816444533 $-1,011.2467951552728 $-,167.86179504590064 $2,275.1385519489218 $1,074.6168017368693 $2,544.718204493319 $3,929.7884026365032 $1,169.4469196506029 $2,011.3943562313898 $2,121.1826943097308 $2,376.5938456579856 $1,036.3711737647088 $1,257.4026510815286 $-,183.89796541535344 $-,171.79323155643777 $1,863.9404467426077 $2,071.2984262992509 $2,388.857912462589 $2,665.61324379546 $1,440.5410009827556 $2,398.71686379034 $1,955.929597106606 $2,778.6922376793759 $1,161.5962385592272 $1,046.4648122624149 $-,830.50075926224201 $17.916247594324254 $1,723.6578720175519 $2,041.8494994727932 $2,232.1750746919356 $2,916.362014490847 $1,267.4583425797812 $2,075.52610855379 $2,850.4011805658497 $2,257.8745988870351 $1,390.7843299789868 $944.98114026510893 $-,222.36838885330022 $-44.03368131509059 $1,809.9410505740477 $2,192.916319678553 $1,509.8138210221823 $3,107.2562082994509 $1,937.168884264247 $1,724.990060891869 $3,000.15008607862 $2,248.5287092203048 $1,044.519186153153 $1,155.8898406983019 -7.4519609606818973 -15.015000000000001 -45.923999999999999 -16.130916934952857 -5.0999999999999996 3.1 -12.1 -15.5 -0.29999999999999982 Depreciation and amortization $15,237.334212487187 $18,696.322029551702 $15,956.997240084502 $15,042.60048871255 $16,558.357088901808 $15,284.428732915088 $15,372.795712276782 $15,545.19521859771 $15,230.574910012845 $14,558.760739823198 $21,279.732094075323 $15,931.33180448407 $16,127.50721066473 $16,969.474610124391 $15,391.990549579361 $14,929.307337871733 $14,653.434704660611 $14,338.882737442158 $15,131.776702950361 $15,117.534480419745 $15,335.844263122532 $14,403.465191965264 $14,665.668886177988 $14,527.260491016519 $13,964.730963793987 $15,078.724068459438 $14,362.455045300365 $14,363.955976215659 $14,862.447676923557 $14,331.555786457966 $14,305.334663576752 $14,577.204068647 $14,456.394084141197 $13,411.144531577085 $14,087.901685110131 $13,679.116023371878 $13,068.6531028446 $14,274.767926711193 $13,771.912656866927 $13,230.527466386358 $14,017.676014122611 $13,428.296220419077 $13,299.751705973842 $14,162.862329033676 $13,635.609494785162 $12,664.721159443056 $14,378.815017869105 $13,430.254372397851 $13,346.14553246036 $14,803.41299291297 $13,694.518184105196 $13,010.697812506594 $14,624.765597649135 $13,467.56206149125 $13,144.793862969624 $14,080.744204464971 $13,244.581236556058 $12,683.73466972258 $13,970.793190979004 $13,123.149712921186 $13,530.122981889952 $14,952.44327006381 $13,737.654637875041 $13,958.63075477021 $15,262.222472557274 $13,859.481343085978 $14,769.890399156602 $15,484.28683746508 $14,510.751109110603 $14,405.842191994967 $15,758.68105983106 $13,583.616367598459 $13,535.446802203331 $15,484.694461715557 $13,617.172948442896 $14,523.835394691758 $15,723.920664639498 $14,154.102988922701 $15,215.131272034494 $15,705.239702182831 $15,213.5455774632 $14,815.237319806849 $15,899.658424267102 $15,523.66761246707 $15,198.430160520689 $16,886.16224912948 $15,677.549867030582 $16,224.637795511953 $17,211.245343654969 $16,090.760461827451 $16,964.223269668488 $17,090.305395183783 $17,258.920139388363 $16,455.23639936906 $17,186.817357172655 $17,140.400936128193 $16,529.49555856702 $18,458.972841882289 $17,430.757375172212 $17,879.342237337329 $18,581.633266439738 $18,083.125078761313 $18,354.366643488691 $19,172.169528747942 $18,780.459397519448 $17,473.60509538067 $19,337.281300410494 $18,673.340012974328 $18,168.331115336252 $20,423.769067445748 $18,802.327173634181 $18,523.511287361183 $20,570.70134894191 $18,977.626159002662 $18,873.590398012708 $20,570.5190527952 $19,421.333555136818 $18,466.50662083042 $20,683.810271533912 195.666 183.761 172.32900000000001 163.61206254601134 163.72800000000001 159.80000000000001 159.6 40.099999999999994 40.300000000000011 EBITDA $-6,183.1432905543934 $-4,277.125069081947 $6,951.8776086899943 $15,746.37145444043 $20,016.859973176604 $,-14,139.791074408602 $26,239.792873653227 $,-56,225.651787094575 $16,251.658638845442 $7,243.708576034249 $,-10,258.523481796688 $-8,265.2732687364169 $6,383.3130525515426 $-2,024.3712696336261 $12,122.106039130536 $20,823.291957997473 $29,936.238310129393 $11,432.28845268085 $25,249.95853605118 $35,361.787847341249 $21,104.620000918731 $18,143.348433202475 $7,018.7096862489198 $-1,968.1832209531694 $13,619.155404022347 $42,111.277503849153 $19,073.50005510206 $10,838.921932561007 $30,452.767226535132 $17,649.17465079531 $19,558.330924462032 $12,007.591095712109 $19,195.238051840872 $12,270.480446441938 $11,799.995523106072 $-8,892.5168032358506 $13,346.530307527275 $20,387.745551413984 $24,260.592148307136 $20,602.452882926089 $15,018.374038269532 $20,949.626318035549 $22,093.742704754724 $27,107.43712182873 $31,196.542249470251 $16,254.877062170848 $26,950.746618615343 $11,229.35212521718 $4,895.285841604418 $32,729.712068008204 $27,774.6758989781 $23,954.93619483315 $45,700.915117585275 $26,682.469309034794 $30,918.110105480475 $35,177.47355575705 $28,286.292682298132 $18,372.925644375173 $-7,775.5997032388932 $3,529.7831729264581 $18,708.81464630062 $31,869.383875039301 $28,991.105208246358 $35,484.406938293832 $37,459.28574323246 $24,265.472673816457 $41,354.975622155005 $39,808.885908194257 $37,136.866441932441 $30,879.110925449393 $31,532.293944288569 $13,055.669178667311 $20,054.427777635181 $44,477.392831169724 $31,656.519743166034 $45,938.38788723023 $59,408.76162505189 $33,286.725356383737 $41,906.890344683088 $43,194.48184994825 $45,246.66315219723 $32,621.915460558208 $35,776.46229212065 $22,433.227003157655 $21,688.19729331492 $43,046.172104338519 $43,667.1775798766 $47,380.788874517311 $50,773.592872875932 $38,373.61439812896 $48,253.390628170644 $44,019.352543350251 $52,177.663571890866 $35,979.851406461152 $35,798.9313583767 $17,463.828813524004 $24,621.166574231625 $44,569.657577580365 $46,618.76277508415 $49,200.849056042542 $56,714.26895271367 $39,507.239321824658 $48,058.761276076868 $56,620.734252373848 $50,518.501159214415 $40,136.890009583556 $37,607.796574493856 $24,897.453654178666 $25,723.254423781913 $48,426.850587768182 $50,500.87907952808 $43,147.935745902883 $61,975.263869202492 $48,129.499979255132 $45,771.261193316866 $60,821.986554918687 $52,026.190015405606 $38,074.189486301366 $41,658.629077180347 $-10.485960960681894 $182.39 $206.59300000000002 $229.28114561105849 $266.39999999999998 $287.4000000000002 $256.8 $27.299999999999823 $57.90000000000056 Adjustments for debt covenants: (Gains) / loss on property disposals, net 102.20925585670025 1,218.2440881486 -3,799.2125006308597 -,937.74651382144987 -2,539.7955586324629 -,797.9215743279301 -8,355.7539221168408 -1,636.5893129642 218.60482397229899 -,140.10127408089849 12,859.982041240199 -,907 -,745 10,014 -4,145 -,987 -1,409 -12 -61 -2,268 212 -,507 -8,916 34 -4,826 321 -98 1,229 138 230 190 850 -,205 338 -,392 48 -,467 607 -4,259 -2,817 609 260 -98 -6.8916199999992003 -1,327.6902678099 -1,930.8871455292101 -2,475.4839327477998 -55.938586850528964 21.008317892994 1,324.1975344000002 -41.471978808968004 309.00265557780006 -,917.28990205279797 171.50874357615095 49.762224247229796 645.29321860100038 322.08225569414981 187 -1,023.3 0 0 0 0 7.9999999999997726 0 0 0 0 0 0 0 0 0 -3,200 0 0 -9,700 0 0 0 0 0 -7,700 -0.18600000000014916 0 0 0 0 0 0 0 0 0 0 0 0 0 0 0 0 0 0 0 0 0 0 0 0 0 0 0 0 0 0 0 0 0 0 0 866.56418642438109 -,514.21774430585015 0 7.9999999999997726 0 0 -8.2460000000000004 -9.7319999999999993 -2.1909999999999998 -11.858331725058001 1.9339999999999999 -14.6 -10.8 0.39999999999999991 -3.4000000000000004 Letter of credit expense 2,508.6331399999999 2,799.742 2,713.2262600000004 2,783.4268 2,686.1681200000003 2,963.2266100000015 3,241.6316200000001 3,138.147399999996 3,242.75510000001 3,137.51971 3,238.2580500000004 3,238 1,592 3,234 3,120 3,217 3,113 3,217 3,223 3,081 3,174 3,026 3,101 3,102 2,800 3,035 2,929 3,022 2,863 2,751 2,719 2,575 2,655 2,666 2,816 2,831 1,561 793 801 771 572 927 781 748.01559677083321 764.14997082986099 739.49997177083321 765.37705416319443 764.53650207986095 675.7713208749999 748.17539096874987 723.59538843749988 741.57163749652773 717.64997177083319 749.49689631944443 749.49689631944443 720.31957708333323 749.49689631944443 720.76749374999986 744.79307687499988 757.06391020833325 708.2210772916668 746.8382157638888 722.7466604166666 736.61252131944445 712.85082708333323 736.61252131944445 736.61252131944445 702.95499374999986 726.38682687499988 702.95499374999986 726.38682687499988 726.38682687499988 656.09132750000003 720.93448659722219 697.6785354166667 715.48214631944438 692.40207708333332 715.48214631944438 715.48214631944438 687.12561874999994 710.02980604166657 687.12561874999994 710.02980604166657 710.02980604166657 641.31724416666668 706.60419840277768 683.81051458333332 703.17859076388879 680.49541041666669 703.17859076388879 703.17859076388879 677.18030624999994 699.7529831249999 677.18030624999994 699.7529831249999 699.7529831249999 632.03495250000003 697.02681298611105 674.54207708333331 694.30064284722221 671.90384791666668 694.30064284722221 694.30064284722221 669.26561874999993 691.57447270833325 669.26561874999993 691.57447270833325 691.57447270833325 624.6479108333333 712.45832666666661 667.92968124999993 688.81353520833329 666.59374374999993 688.81353520833329 688.81353520833329 665.25780624999993 687.43306645833331 665.25780624999993 687.43306645833331 2,219.313369722222 2,215.574669444441 2,212.1232032638891 2,172.2100088194443 2,176.1800363888888 2,155.7286474999996 35.225999999999999 36.335000000000001 33.933 12.053042593534721 8.7880000000000003 7.7 8.1999999999999993 2.1999999999999993 1.7000000000000002 Restructuring professional fees #REF! #REF! #REF! #REF! #REF! #REF! #REF! #REF! #REF! #REF! #REF! 118 -10 357 2,742 164 -,340 #REF! #REF! #REF! #REF! #REF! #REF! 500 820 443 372 665 1,455 944 827 759 3,206 2,027 1,918 -,558 -,206 -,263 13 45 #REF! #REF! #REF! #REF! #REF! #REF! 0 0 0 0 0 0 0 0 186.25 0 0 0 0 0 0 0 0 0 0 0 0 0 0 0 0 0 0 0 0 0 0 0 0 0 0 0 0 0 0 0 0 0 0 0 0 0 0 0 0 0 0 0 0 0 0 0 0 0 0 0 0 0 0 0 0 0 0 0 0 0 0 0 186.25 0 0 0 0 0 44 3.0310000000000001 12.016999999999999 4.1649852900000006 0.186 0 0 0 0 Nonrecurring consulting fees 0 0 0 0 0 0 0 0 0 0 0 0 0 0 0 0 0 0 0 0 0 0 0 0 0 0 0 0 0 0 0 0 0 0 0 0 0 0 0 0 0 0 0 0 0 0 0 1,002.7140000000001 937.21100000000001 956.47289999999998 968.39859999999999 978.32830000000001 1,018.8948 960.47820000000002 -1,720 0 0 0 0 0 0 0 0 0 0 0 0 0 0 0 0 0 0 0 0 0 0 0 0 0 0 0 0 0 0 0 0 0 0 0 0 0 0 0 0 0 0 0 0 0 0 0 0 0 0 0 0 0 0 0 0 0 0 0 0 0 0 0 0 0 0 0 0 5.1020000000000003 0 0 0 0 Permitted dispositions and other 0 0 0 0 0 0 0 0 0 0 0 32.469000000000001 32.72 -1,973.9621399999999 31.5283300000001 31.433330000000101 -,276.79167000000001 45.558330000000304 45.5023300000001 -,951.97115000000008 47.680330000000104 39.358330000000102 -1,086.4696899999999 36.613330000000005 35.913330000000002 24.0427 30.209330000000001 10.12533 -,248.99967000000001 80.92841 80.133669999999995 1.3522500000000299 79.370070000000013 79.598199999999991 1,436.9757 81.752210000000005 1.3801099999999999 -13.85032 29.744700000000002 28.490599999999997 173.01335 29.728679999999898 28.303879999999999 1,363.7727399999999 28.473460000000198 27.834259999999798 -36.7833299999998 27.47634 31.110430000000001 79.524559999999994 55.605669999999996 27.287790000000001 88.581240000000008 26.987359999999999 27.10519 -34.218440000000001 27.128720000000001 0 0 0 0 0 0 0 0 0 0 0 0 0 0 0 0 0 0 0 0 0 0 0 0 0 0 0 0 0 0 0 0 0 0 0 0 0 0 0 0 0 0 0 0 0 0 0 0 0 0 19.874110000000002 27.128720000000001 0 0 0 0 6.2380000000000004 -3.9830000000000001 1.7 1.8 0.4 3 1.9 0.1 1.2 Equity based compensation expense -1,412.73118 122.13996999999999 156.90369000000001 161.61656000000002 69.054000000000002 15,029.16576 145.19094000000041 255.06851999999998 160.39893000000001 206.96299999999999 327.44934000000001 76 578 399 222 407 402 241 244 384 247 246 356 196 275 571 278 569 2,131 304 310 -,100 282 272 705 272 4,535 1,776 650 637 1,232 648 652 740.85405000000094 658.53922000000102 658.18901000000005 1,882.8900100000001 596.31939 508.78190000000001 -,581.75029000000006 653.87718999999993 1,623.3994 919.68944999999997 1,342.13301 734.33249999999998 718.38615000000004 713.58420000000001 708.9 708.9 670.2 947.3 724.96 724.96 1,866.2750000000001 722.7 721.97299999999996 718.97900000000004 716.1 716.1 715.9 719.9 650 650 1,200 650 650 1,200 650 650 1,200 650 650 1,200 650 650 1,200 650 650 1,200 650 650 1,200 650 650 1,200 650 650 1,200 650 650 1,200 650 650 1,200 650 650 1,200 650 650 1,200 650 650 1,200 650 650 1,200 650 650 1,200 2,794.8516600000003 2,131.3842 2,342.46 3,313.9350000000004 2,157.520000000001 2,151.9 0.626 3.802 5.7939999999999996 14.344472290000002 8.4730000000000008 7.3 8 2 1.2999999999999998 Union equity awards 14.884 0 0 0 0 0 0 0 0 Restructuring transaction costs 17.783000000000001 0 0 0 0 0 0 0 0 Fair value adjustment of derivative liabilities 79.221000000000004 0 0 0 0 0 0 0 0 Amortization of ratification bonus 1,695 1,695 1,823 1,695 1,695 1,823 1,695 1,695 1,823 1,696.3290084615385 1,696.3290084615385 1,841.532383076923 1,484.2446016346153 1,484.2446016346153 1,591.7605254807693 1,507.2768953846153 1,484.2446016346153 1,591.7605254807693 1,503.7446016346153 1,503.7446016346153 1,612.2605254807693 1,503.7446016346153 1,503.7446016346153 1,612.2605254807693 4,583.2820224999996 4,619.74972875 4,619.74972875 0 0 0 0 0 0 15.638999999999999 18.934000000000001 4.5999999999999996 9.1 4.5 0 Non-union pension settlement 0 0 0 0 0 0 0 0 0 0 0 30,000 0 0 0 0 0 0 0 0 0 0 0 0 0 0 0 0 0 0 0 0 0 0 0 0 0 0 0 0 0 0 0 0 0 0 0 0 0 0 0 0 0 0 0 0 0 0 0 0 0 0 0 0 0 0 0 0 0 0 0 0 0 0 0 0 28.687999999999999 0 28.722999999999999 28.7 0 Equity Investment Impairment 0 30.8 0 0 0 0 0 0 0 (Gains) / loss on extinguishment of debt -50.340809999999998 ,-13,690.743060000001 2,498.7998900000002 0 0 0 0 0 0 0 0 0 0 0 570.33420999999998 0 0 0 0 0 0 0 0 0 0 0 0 0 0 0 0 0 0 0 0 0 0 0 0 0 0 0 0 0 0 0 0 0 0 0 0 0 0 0 0 0 0 0 0 0 0 0 0 0 0 0 0 0 0 0 0 0 0 0 0 0 0 0 0 0 0 0 0 0 -25.794 0 0 -11.24228398 0.56999999999999995 0 0 0 0 Other, net (a) -,143.90078114786695 3,917.992935236268 188.00806980672519 645.29898845105106 1,880.7053123871301 -,223.8550403141078 -,184.32515068410896 5,973.8447879241721 -2,263.5749563525642 278.11015060199554 2,765.775414569272 -,209.19573126358318 -,397.3305255154282 3,768.3334096336257 -74.63436913053738 8.2747120025269396 190.55335987060607 #REF! #REF! #REF! #REF! #REF! #REF! -90.429907196690465 5.9315535177356651 -,372.32005704553012 13.290870037017157 -,259.4698158331485 -,380.76738847453817 -,335.94565777415119 -,166.46436245106815 -51.945244549558993 -,368.60790035862738 -,190.78840297836 -,678.97122310607301 -,110.89459676414936 -,259.16735752727254 -3,606.6951214139845 -,189.33684830713537 -,299.94348292608993 209.6126117304666 #REF! #REF! #REF! #REF! #REF! #REF! -2,247.7718662125881 627.95943861002161 -1,291.6987564538722 1,113.7437697470705 -1,984.7705795420879 386.79879721591715 -1,333.3504143150058 -,855.5151768176074 -1,326.838386740812 550.67064405365818 -,195.7134588784138 -,197.59561497628238 -23.002138147736332 -19.241576665866887 -22.615014523755235 1,479.5448451281736 -21.96320416364324 -20.297057807452802 -21.767748552450939 -21.779836933004844 -18.839475474385836 -20.73132454304141 -19.605156537880248 -21.072186808138213 -20.788233600118474 -15.610027391176118 -20.548969738694723 -18.791481456588372 -19.584440812832327 -18.079491016484099 -20.432407959953707 -20.000115872702736 -17.880051000596723 -19.432735540540307 -17.759015149342304 -19.294704493066092 -18.201377783527278 -14.305092066912039 -18.076092947740108 -16.371891422721092 -18.25856038373604 -16.896504222117073 -17.889815534697846 -18.468408903398085 -16.545158086730225 -18.012085263988411 -16.320977904637402 -17.944186538974463 -18.10972108612259 -13.364942361280555 -18.009127316152444 -16.31177901448973 -17.227313312803744 -15.959529176325304 -17.878312015353004 -17.48046870631515 -15.622582382697146 -17.038587586168433 -15.302323644296848 -17.049470230311272 -17.651036832063255 -13.02785782180581 -19.102046710926516 -15.917133755778195 -16.897800351354817 -15.718410685585695 -17.574128496431513 -17.168012475543946 -15.426545778027503 -16.799749067569792 -15.008286912183394 -16.890988708277291 -3,515.2403187375785 157.361570198962 -64.858729337358454 1,437.2845831570776 -62.387060959841619 -61.408667889059871 5.8 -3.1 -2.8559999999999999 -9.6735311541805356 -6.2 2.1 3.9 0.8 -1 Adjusted EBITDA $-2,178.944271737374 $6,623.9804239506902 $13,119.831269883485 $23,934.752643343891 $27,473.740958059221 $5,106.6922539450716 $21,953.627011782079 $27,590.259715220702 $19,230.446548573855 $9,521.4937323893319 $12,534.728738293024 $-5,917 $7,434 $13,774 $14,018 $23,664 $31,616 $14,732 $28,414 $35,554 $24,595 $20,827 $30,776 $1,310.20185014 $12,410.287540082 $46,510.146803621 $22,669.255139079 $15,782.280977692 $35,620.168060593 $22,134.21730538 $23,635.232010963 $16,108.99810116255 $22,397.221482245 $18,641.9998061441 $17,714 $-3,903 $4,469 $22,236 $22,725 $20,630 $19,682 $23,362.893923792533 $26,181.5150000006 $32,085.25028567496 $32,933 $16,574.999992373971 $27,468.999999999884 $13,012.7 $9,393.1999999999971 $36,376.5 $32,732 $27,134 $49,507 $30,107 $31,388 $37,678 $32,153 $21,297.624280881377 $24,069.458284140594 $6,437.7895466216705 $21,848.838748561033 $34,930.827601760204 $31,918.356713791196 $38,073.331255449637 $38,874.539512508338 $25,702.290446583447 $42,788.787306541446 $41,209.101426469868 $38,558.6219442644 $32,278.360762661516 $32,957.508584355433 $14,411.267771942192 $21,344.909077744003 $43,177.778348028252 $32,985.40679712611 $47,284.285592736844 $51,582.398748572035 $34,631.775094743229 $43,252.372375129831 $45,063.72741769765 $46,586.663385720851 $33,941.282064158862 $29,966.781330760667 $23,774.869431415795 $22,965.31881431249 $44,934.700209793555 $44,984.440398959377 $48,715.708904897467 $52,637.191779070483 $39,708.35021504209 $49,588.100810031137 $45,879.987691513517 $53,509.404469751877 $37,290.710734806511 $37,679.818110169792 $18,795.47207556288 $25,889.836584370343 $46,448.675263250327 $47,926.306575577255 $50,527.92238557696 $58,569.971214011712 $40,833.661652656527 $49,385.581450217775 $58,474.377288741154 $51,843.37044336583 $41,440.853304689263 $39,482.321576971881 $26,221.377090054935 $26,984.87447679344 $50,320.206867723922 $51,802.891627022305 $44,469.851480759862 $63,826.13920226691 $49,450.739385967034 $47,092.906716049656 $62,671.817815390663 $53,346.823332796368 $39,374.439005639186 $43,529.171154930402 $99,173 $77,520.82565021963 $63,217.455896942905 $,108,866.22748174917 $,109,700.17917959476 $,103,794.49129128136 $159.19999999999999 $239.54300000000001 $254.9 $244.5084989253547 $333.27499999999998 $297.50000000000023 $305.82299999999998 $65.999999999999815 $57.700000000000564 Revenue $4,868.8450000000003 $4,850.480681463574 $4,865.4342518556286 $5,068.8 $4,832.3999999999996 $4,697.4710078968801 $4,691.8999999999996 $1,142.6999999999998 $1,148.3000000000002 Adjusted EBITDA Margin 3.3% 4.9% 5.2% 4.8% 6.9% 6.3% 6.5% 5.8% 5.2% Leverage Ratio 8.5351758793969861 5.7651444625808308 5.3405256963515102 4.565076489798261 3.2462680969169608 3.395966386554619 3.4510157836395567 YRC Freight Segment 1Q12 2Q12 3Q12 4Q12 1Q13 2Q13 3Q13 4Q13 1Q14 2Q14 3Q14 4Q14 1Q15 FY 2013 FY 2014 FY 2015 4Q14 4Q15 FY 2011 FY 2012 FY 2013 FY 2014 FY 2015 FY 2016 LTM 3Q 2016 4Q 2015 4Q 2016 Reconciliation of operating income (loss) to adjusted EBITDA Operating (loss) income $-31.2 $0.5 $18 $24.5 $-21.4 $-88.48 $-37.299999999999997 $-31.2 $0.5 $18 $53.2 $31.856999999999999 $-21.4 $-9.9999999999994316E-2 Depreciation and amortization 109.1 98 93.1 23.8 22.599999999999994 102.91500000000001 119.8 109.1 98 93.1 90.3 90.488 22.6 22.399999999999991 (Gains) losses on property disposals, net -3 -15.9 1.9 -9.1 0.19999999999999996 -10.478 -9.9 -3 -15.9 1.9 -15.7 -11.840999999999999 0.2 -3.6999999999999993 Letter of credit expense 25.8 8.3000000000000007 6.1 1.5 1.5 28.093 29.6 25.8 8.3000000000000007 6.1 5 5.427999999999999 1.5 1.1000000000000001 Union equity awards 10.311 0 0 0 0 0 0 0 0 Nonrecurring consulting fees 0 0 5.0999999999999996 0 0 0 0 0 0 5.0999999999999996 0 0 0 0 Amortization of ratification bonus 0 10 12.2 3.3 2.8999999999999986 0 0 0 10 12.2 3 5.9039999999999999 2.9 0 Non-union pension settlement charge 0 0 28.7 0 28.7 0 0 0 0 28.7 0 28.710118740000002 28.7 0 Other, net (a) 4.5 -1.1000000000000001 2.1 0 2.3000000000000003 1.4 2.7 4.5 -1.1000000000000001 2.1 4.3 5.5 2.2999999999999998 1.0999999999999996 Adjusted EBITDA $105.19999999999999 $99.8 $167.19999999999996 $43.999999999999993 $36.79999999999999 $43.7 $104.89999999999999 $105.19999999999999 $99.8 $167.19999999999996 $140.10000000000002 $156.14611873999999 $36.799999999999997 $20.799999999999997 Revenue $3,203.369999999998 $3,206.9133781 $3,136.7610459000002 $3,237.376861499999 $3,055.7 $2,958.9 $2,962.28653222091 $733.69999999999982 $730.30000000000018 Adjusted EBITDA Margin 1.4% 3.3% 3.4% 3.8% 5.5% 4.7% 5.3% 5.2% 2.8% Regional Transportation Segment 1Q12 2Q12 3Q12 4Q12 1Q13 2Q13 3Q13 4Q13 1Q14 2Q14 3Q14 4Q14 1Q15 FY 2013 FY 2014 FY 2015 4Q14 4Q15 FY 2011 FY 2012 FY 2013 FY 2014 FY 2015 FY 2016 LTM 3Q 2016 4Q 2015 4Q 2016 Reconciliation of operating income to adjusted EBITDA Operating Income $79.900000000000006 $66.099999999999994 $85.4 $10.599999999999994 $9.5 $32.880000000000003 $70 $79.900000000000006 $66.099999999999994 $85.4 $81.3 $74.418000000000006 $9.5 $16.399999999999991 Depreciation and amortization 63.1 65.8 70.7 16.8 17.5 61.561999999999998 63.3 63.1 65.8 70.7 69.5 69.106999999999999 17.5 17.899999999999999 (Gains) losses on property disposals, net 0.6 4 0.2 3.3 0.2 -2.6549999999999998 0.7 0.6 4 0.2 1.1000000000000001 1.2 0.2 0.20000000000000007 Letter of credit expense 6.8 2.9 2.1 0.6 0.60000000000000009 6.6079999999999997 6.2 6.8 2.9 2.1 2.5 2.5269999999999997 0.6 0.5 Union equity awards 4.5730000000000004 0 0 0 0 0 0 0 0 Amortization of ratification bonus 0 5.6 6.6999999999999993 1.9 1.5999999999999996 0 0 0 5.6 6.7 1.5999999999999996 3.222 1.6 0 Other, net (a) 0.1 0 0.8 0 0.8 0.1 0 0.1 0 0.8 0.5 1.0780000000000001 0.8 0.2 Adjusted EBITDA $150.5 $144.39999999999998 $165.9 $33.199999999999996 $30.2 $103.06800000000001 $140.19999999999999 $150.5 $144.39999999999998 $165.9 $156.5 $151.452 $30.200000000000003 $35.199999999999996 Revenue $1,554.2729999999999 $1,640.6 $1,728.6 $1,831.4 $1,776.9 $1,739.3 $1,730.4731513499999 $409.20000000000005 $418 Adjusted EBITDA Margin 6.6% 8.5% 8.7% 7.9% 9.3% 8.9978727074110282 8.8% 7.4% 8.4%
