Attached files
| file | filename |
|---|---|
| 8-K - Owens Realty Mortgage, Inc. | orm8k120816.htm |
Investor Presentation Q3 2016

IMPORTANT NOTICE:This presentation contains forward-looking statements, within the meaning of the safe harbor provisions of the United States Private Securities Litigation Reform Act of 1995 (the “Reform Act”). All such forward-looking statements are intended to be subject to the safe harbor and other protections provided by the Reform Act and applicable securities laws. The forward-looking statements included in this presentation reflect Owens Realty Mortgage, Inc.’s (“ORM’s”) current views about future events and are subject to numerous known and unknown risks, uncertainties, assumptions and changes in circumstances that may cause ORM’s actual results to differ significantly from those expressed in any forward-looking statement and, consequently, readers should not rely on these forward-looking statements as predictions of future events. Statements regarding the following subjects, among others, may be forward-looking: ORM’s business and investment strategy; projected dividend yields; ORM’s projected expenses and operating results; ORM’s projected capital expenditures and construction related expenses; economic, demographic, lending or real estate developments in ORM’s markets; early terminations of or non-renewal of leases by ORM’s tenants; ORM’s ability to obtain financing arrangements; general volatility of the markets in which ORM participates; construction progress and completion dates, permit, entitlement, zoning and other property related approvals, expected real estate planning and policies of city, county, state, and other regional municipalities, including zoning, land annexation, and building and development approvals, expected listing and sale dates, occupancy rates and dates, and marketability of ORM’s real estate assets; ORM’s ability to qualify and maintain ORM’s qualification as a REIT; market trends in ORM’s industry, including interest rates, real estate values, vacancy and absorption rates, lease rates, land, residential and commercial property statistics, regional population and income growth, or the general economy; and statements about ORM’s current expectations, plans, strategies, prospects, beliefs, targets, assumptions, and forecasts. Words such as “expect,” “target,” “assume,” “estimate,” “project,” “budget,” “forecast,” “anticipate,” “intend,” “approximate,” “plan,” “may,” “will,” “could,” “should,” “believe,” “predicts,” “potential,” “continue,” and similar expressions are intended to identify such forward-looking statements. Readers are cautioned not to place undue reliance upon any forward-looking statements, which speak only as of the date made. The Company does not guarantee the assumptions underlying such forward-looking statements and does not undertake or accept any obligation to release publicly any updates or revisions to any forward-looking statement to reflect any change in its expectations or any change in events, conditions or circumstances on which any such statement is based. Certain important factors that could cause actual results to differ materially from those contained in the forward-looking statements are included in our periodic reports filed with the Securities and Exchange Commission (“SEC”). Copies are available on the SEC’s website at www.sec.gov. Investors are encouraged to read the following presentation in conjunction with our periodic reports including, without limitation, the Risk Factors section in the Annual Report on Form 10-K for the year ended December 31, 2015. All subsequent written and oral forward-looking statements concerning the Company or matters attributable to the Company or any person acting on its behalf are expressly qualified in their entirety by the cautionary statements above. DISCLAIMERS:Pro Forma Dividend YieldThe projected dividend yield in this presentation is meant to provide an estimated dividend yield range, for informational purposes only and is not a forecast of expected results. The pro forma dividend represents annualized distributions of $1.70 to $1.95 per share, based on an average annualized loan investment rate of 8.50%, less projected 5.50% weighted average cost of capital, divided by a hypothetical stock price of $20.00 per share. 2 Forward-Looking Statements and Other Disclaimers

Ticker (NYSE MKT) ORM Shares Outstanding1 10,247,477 Market Capitalization2 $180M Recent Share Price2 $17.58 Book Value per Common Share1 $21.28 Dividend Yield3 1.80% Price to Book Ratio4 0.83x 3 As of quarter ending September 30, 2016.As of December 1, 2016Based on the $0.08 regular quarterly dividend per share of common stock, annualized, and ORM’s closing price per share of $17.58 on December 1, 2016.Based on the closing price per share of $17.58 on December 1, 2016 and the book value per common share of $21.28 as of quarter ending September 30, 2016. Company Overview Owens Realty Mortgage, Inc. is a specialty finance company organized as a REIT that focuses on the origination, investment and management of small-balance and middle-market commercial real estate loans.We provide customized, short-term acquisition and transition capital to commercial real estate investors that require speed and flexibility.

4 Company Overview During recession, beginning in 2009, foreclosed on 50%+ of loan portfolio, LP redemptions and lending activity suspended. During recovery repositioned and improved real estate assets, maximizing potential market value. In May 2013, ORM completed a reorganization into a publicly-traded REIT. Its predecessor, Owens Mortgage Investment Fund, a California LP, was formed in 1983 and became a SEC registered public filer in 1988. We are managed by Owens Financial Group, Inc., a specialized commercial real estate management company that has originated, serviced and managed alternative commercial real estate investments since 1951. Strategy is to liquidate real estate assets, invest proceeds into commercial real estate loans, and deliver a consistent, competitive risk-adjusted yield to shareholders.

5 Our Strategy Liquidate Real Estate Owned AssetsSeven Sales/20 Percent RuleSell majority of REO by end of 20171Complete property improvement/development projectsGrow Commercial Loan Investment PortfolioStrong market demandMinimize non-performing loansIncrease Leverage to 1x Stockholders’ EquityContinue to improve lending facility rates and termsIncrease DividendsREITs must distribute at least 90% of net taxable incomeAverage yield 1989 – 2007 was ~ 8.40%2Pro forma dividend yield ~ 8.50% - 9.50%3 Based on GAAP book basisBased upon annual income distributions to investors from 1989 through 2007 divided by year end book capital and averaged over applicable period. The average dividend from 2008 through 2012 was 2.70%Constitutes forward-looking information. Actual future dividend yields could vary significantly from the pro forma projection presented. See Forward-Looking Statements and Other Disclaimers disclosure on page 1

6 Investment Opportunity ORM trading at discount to book value and NAVRecent closing price per share $17.58 vs. book value per share $21.281Unlock Embedded NAV Gains Potential in Real Estate PortfolioAnalyst estimates $2.50-$3.00 book value per share2Favorable Market ConditionsCRE fundamentals strongRegulatory environment limiting lending capacity of banks Increased demand for speedCommitment to Increasing DividendsCurrent annualized regular dividend $0.32 per common share3Pro forma dividend ~ $1.70 - $1.95 per common share4 Closing price per share on December 1, 2016 and book value per common share as of quarter ending September 30, 2016.As per JMP Securities analyst initiating report dated November 17, 2016. Potential NAV gains per share as of the 9/30/16 real estate portfolio.Based on the $0.08 regular quarterly dividend per share of common stock, annualized.Constitutes forward-looking information. Actual future dividend yields could vary significantly from the pro forma projection presented. See Forward-Looking Statements and Other Disclaimers disclosure on page 1

7 Significant Progress Since 2015 Real Estate Owned Assets Decreased9 properties or 32% net decrease1Increased Stockholder’s Equity$4.14 per share or 24.2% increase in book value per shareIncreased Commercial Loan Investment Portfolio$45M or 67% net increase2 Reduced Non-Performing Loans$15M or 66% net decrease3Increased LeveragePotential borrowing capacity increased to $50M (with $25M accordion feature)4Share RepurchasesRepurchased total of 950,642 ORM common shares or ~ 8.5% of total outstanding shares for $13.52 average price per share5Analyst Coverage JMP Securities initiated coverage on January 15, 2016 Represents net of real estate properties owned between January 1, 2015 and September 30, 2016.Represents net of loan originations and loan repayments between January 1, 2015 and September 30, 2016.Represents net of non-performing loan payoffs and additions between January 1, 2015 and September 30, 2016.Credit facility with syndicate led by California Bank and Trust includes potential to increase borrowing capacity by an additional $25M.Based on total ORM shares repurchased between September 1, 2013 and September 30, 2016, and 11,198,112 beginning total outstanding common shares.
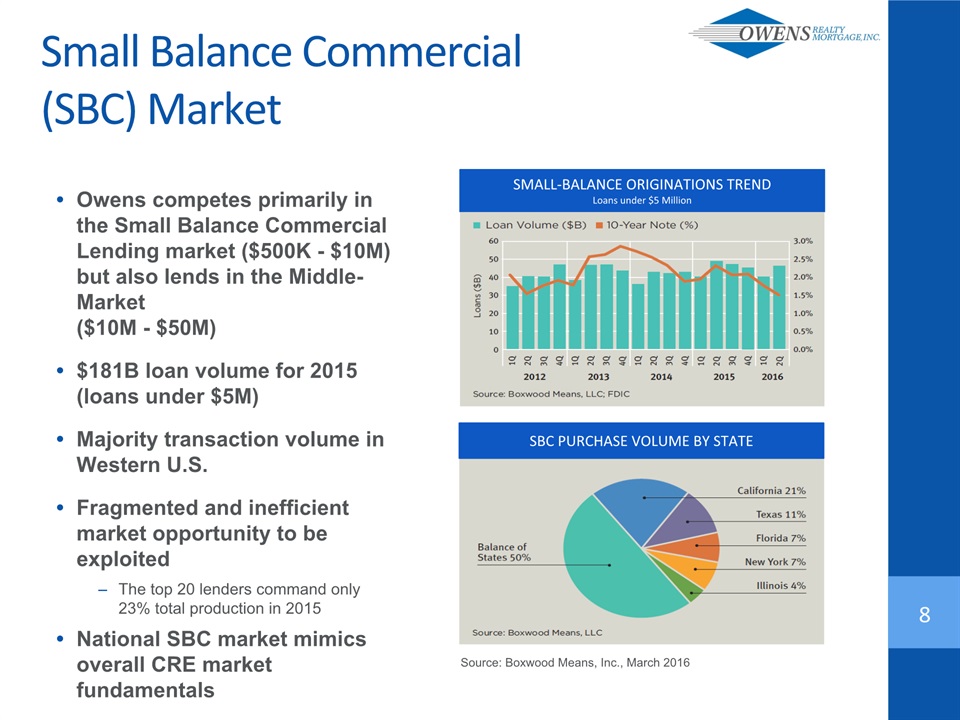
Owens competes primarily in the Small Balance Commercial Lending market ($500K - $10M) but also lends in the Middle-Market ($10M - $50M)$181B loan volume for 2015 (loans under $5M)Majority transaction volume in Western U.S.Fragmented and inefficient market opportunity to be exploitedThe top 20 lenders command only 23% total production in 2015National SBC market mimics overall CRE market fundamentals 8 Source: Boxwood Means, Inc., March 2016 Small Balance Commercial(SBC) Market SMALL-BALANCE ORIGINATIONS TRENDLoans under $5 Million SBC PURCHASE VOLUME BY STATE

9 CRE prices are recovering from recessionary lows – positive macro fundamentalsIncreased regulation creating opportunities for alternative lendersBasel III/Dodd-Frank/Volcker Ruletightening underwriting standardsIncreasing CRE Sales VolumeLimited supply of new commercial constructionStable interest rate environment Commercial Real Estate (CRE) Market Source: Boxwood Means, Inc., March 2016 NATIONAL CRE SALES PRICE TREND COMPARISON

10 Competitive Advantage ORMCompetitive Advantage Experienced Management Team – 50 years Flexible and Creative Investment Structures Strong Brand Recognition in SBC Strong Relationships Fast Funding Capabilities Direct Origination & Servicing Strong Brand Identity in Western U.S.Commercial lending business for over 50 yearsDirect Origination PlatformSpecialty FinancingManagement structure designed to allow creative, customized financing structuresTransaction SpeedOur structure also provides the ability to fund commercial RE loans very rapidly – loan commitments in as little as 24 hours and funding in less than 2 weeksREO Asset ManagerProven ability to manage non-performing loans and foreclosed real estate assetsLoss mitigation through experienced property management, repositioning, and development – maximizing terminal asset valueMinimal Interest Rate Sensitivity Short-term bridge loans (1-3 years)Portfolio turns over on average every 18 months providing hedge against interest rate volatility

11 INVESTMENT STRATEGY Loan Size $500K ‐ $20M Security: Primarily first deed position Property Type All commercial types Geography USA (focus Western US) Loan-to-Value Up to 75% Term 1 – 3 years Rates 7% - 10% (fixed and floating rates) Amortization Typically Interest only Loan Investment Profile

12 Sample Transaction:University Plaza, Santa Clara CA $5.85M first position trust deed8.0% interest only loan2-year term73% LTV51,978 SF Retail over OfficeAcquisition bridge financing required 3 week closeStrong sponsor, direct origination through relationship

Property Location 13 As of quarter ended September 30, 2016LTV refers to loan-to-value ratio of the loans in the portfolio at the time of origination. Property Type Loan Portfolio Overview ($ millions) Total Loan Portfolio $113M total loan portfolio159% weighted-average LTV28% weighted average interest rate98% senior collateral position

Real Estate Portfolio Overview Tax Basis 14 23 Properties1 (1) Total properties does not include book value of equity investment in 1850 De La Cruz, LLC(2) As of quarter ended September 30, 2016 $168M2 GAAP Book Value $111M2

11.5 acre Resort Property Located at Stateline CA/NVPhase I – Chateau at Lake Tahoe Retail $17M book value / $17M tax basis123k rentable SF$61 average annual NNN per SF296% occupancy3Phase II – Zalanta Resort at the Village 1 & 2Condominium / retail project under developmentZalanta Phase 1 – 30 condos over ~ 19k SF of retailZalanta Phase II – 60 condos$30M book value / $32M tax basis1Expected completion Zalanta 1 - Q1 2017Listed for salePhase III – Chateau at Lake Tahoe ResidentialResidential / hospitality land ~387 units available for development $29M book value / $38M tax basis1In contract for $42.5M net$29M Bank Financing1 15 Property at Lake Tahoe South Lake Tahoe, CA As of quarter ended September 30, 2016Rent per square foot (as of September 30, 2016) is calculated by dividing total base rent per month by total rented square feet, multiplied by 12 to annualize. Common area maintenance fees and other income are not included in these amounts.Occupancy rates are approximate and calculated by dividing square footage leased by total rentable square feet.

16 Investment Highlights Back to Basics Execution → Simplifying Balance Sheet and Increasing Income Liquidate Real Estate Assets Grow Loan Portfolio Lower Cost of Capital and Create Value Through Prudent Use of Leverage Consistently Deliver Attractive Dividend Yields Improving CRE market conditionsIncreasing demand for transitional assetsComplete improvement/redevelopment projectsLeverage management domain experience, brand identity, and origination platformFocus on new investment originationsReduce non-performing loansImprove balance sheet ratiosLower cost and improved capital termsPrudent leverage of up to 1x stockholder’s equity, providing opportunity to deliver attractive returnsCommitted to increasing dividends as income increasesAverage yield 1989 – 2007 ~ 8.40%1Pro forma dividend yield ~ 8.50% - 9.50%2 Based upon annual income distributions to investors from 1989 through 2007 divided by year end book capital and averaged over applicable period. The average dividend from 2008 through 2012 was 2.70%Constitutes forward-looking information. Actual future dividend yields could vary significantly from the pro forma projection presented. See Forward-Looking Statements and Other Disclaimers disclosure on page 1
17 Appendix

Pre-2008 2008 - 2012 2013 CORPORATE PORTFOLIO Timeline 18 Average dividend yield of 8.40%¹ Deployed up to $160M annually Completed conversion to a Maryland REIT Started trading on the NYSE MKT Entered into stock repurchase plan to purchase $7 M or 5% of shares outstanding Completed full or partial sale of six real estate properties Merger between Owens Mortgage Investment Fund and OwensRealty Mortgage Predecessor company, Owens Mortgage Investment Fund, a CA LP, in business for 30 years 50%+ of portfolio foreclosed Based upon annual income distributions to investors from 1989 through 2007 divided by year end book capital and averaged over applicable period.Based upon annual income distributions to investors from 2008 through 2012 divided by year end book capital and averaged over applicable period. Average dividend yield of 2.70%²

2014 2015 2016 CORPORATE PORTFOLIO 19 Initiated sale of real estate properties that offer net taxable gain Ramping up commercial lending to small balance and middle market investors Secured up to $74M in bank debt financing Rebuilding capital resources through asset sales Plan to grow interest revenue Completed initial retail portion of the Chateau Development Project in South Lake Tahoe, CA Completed repurchase of 430,118 shares or 3.80% of shares outstanding at $12.44 average price per share Began construction of Zalanta Resort at the Village in South Lake Tahoe, CA Timeline Repurchased 520,524 ORM shares or 4.83% in 2015 at $14.41 avg price/share Increased maximum potential CB&T credit facility from $30M to $50M Closed $14.5M maximum potential term loan with RaboBank secured by Tahoe