Attached files
| file | filename |
|---|---|
| EX-99.1 - PRESS RELEASE - Simulations Plus, Inc. | simulations_8k-ex9901.htm |
| 8-K - FORM 8-K - Simulations Plus, Inc. | simulations_8k-111116.htm |
Exhibit 99.2
(NASDAQ:SLP) Investor Conference Call November 11, 2016

2 With the exception of historical information, the matters discussed in this presentation are forward - looking statements that involve a number of risks and uncertainties . The actual results of the Company could differ significantly from those statements . Factors that could cause or contribute to such differences include, but are not limited to : continuing demand for the Company’s products, competitive factors, the Company’s ability to finance future growth, the Company’s ability to produce and market new products in a timely fashion, the Company’s ability to continue to attract and retain skilled personnel, and the Company’s ability to sustain or improve current levels of productivity . Further information on the Company’s risk factors is contained in the Company’s quarterly and annual reports and filed with the Securities and Exchange Commission . Safe Harbor Statement

3 Highlights Walt Woltosz Chairman and Chief Executive Officer

4 • Major provider of software and consulting services for pharma R&D • Earliest drug discovery – when a chemist first draws a molecule • Preclinical development (lab and animals) through first - in - human trials • Phase 2 and 3 clinical trials • Beyond patent life to supporting generic companies • Enhancing every existing software product • PKPlus – exciting new product launched at end of FY2016 • Investigating new applications in aerospace and general healthcare based on our machine - learning technologies (were on hold for PKPlus) • 4QFY16 • revenues up $ 246,000 (6.6%) to $3.96 million • net income up $298,000 (60.6%) to $ 789,000 • diluted EPS up 58.9% to $0.046 (5¢) per share from $ 0.029 (3¢) in 4QFY15 • FY2016 • revenues up $1.66 Million (9.1%) to $ 19.97 Million • net income up $1.11 Million ( 28.8%) to $4.95 million • diluted EPS up 27.5% to $0.288(29¢) per share from $ 0.226 (23¢) in FY2015. Overview

5 • Software renewal rates: 88% (accounts); 97%(fees) • 19 new software client sites added • Product development • PKPlus™ released just prior to the end of the fiscal year • new software product for noncompartmental analysis and compartmental analysis for regulatory submissions • potential to become significant contributor to revenues and earnings • Finalizing Version 9.5 of GastroPlus™ • Intramuscular dosing and enhanced ocular dosing model (2 FDA RCAs helping) • Antibody - drug conjugates (ADCs) • New animal physiologies for Additional Dosing Routes • Version 8.0 of ADMET Predictor™ released • major overhaul of user interface and code refactoring – extensive QA testing • greater integration with MedChem Studio™ • Version 5.0 of DDDPlus™ released • several new dosage forms • tablet disintegration addition • biorelevant solubilities • tablet compression model • Consulting services impacted somewhat by failed drug trials of sponsors • Announcement of $4.7MM/5 - year contract • Current backlog is strong 4QFY16 Highlights

* Yahoo! Data 11/9/2016 Two - year stock performance compared to DOW, NASDAQ, & S&P 500 *

7 • Completed second year of up to 3 - year, $200,000/year collaboration for improved ocular dosing simulations – contract renewed for 3rd year • Met all milestones during second full year • Established consortium of leading pharmaceutical companies • The global ophthalmic drugs market was valued at $16 billion in 2012, and was expected to reach an estimated value of $21.6 billion in 2018 • Prevalence of eye disorders is increasing as the population ages (e.g., diabetic retinopathy, macular degeneration) FDA Office of Generic Drugs (OGD) Funded Collaborations • Began second year of up to 3 - year, $200,000/year collaboration for simulation of long - acting injectable microspheres • Formed consortium of industry partners, FDA scientists, and Simulations Plus • Added intramuscular dosing to GastroPlus (V. 9.5) • Developed enhancements to DDDPlus to simulate in vitro dissolution/release from polymer microspheres

8 Financial Overview John Kneisel Chief Financial Officer

9 Income Statement 4QFY16 Compared to 4QFY15 (in millions) Lancaster Buffalo 4QFY16 4QFY15 Diff % chg Net sales $ 2.696 $ 1.262 $ 3.958 $ 3.712 $ 0.246 6.6% Gross profit 2.215 0.683 2.898 2.635 0.263 10.0% Gross profit margin 82.16% 54.12% 73.22% 70.99% 2.23% 3.1% SG&A 1.096 0.517 1.613 1.510 0.103 6.8% R&D 0.260 0.024 0.284 0.347 - 0.063 - 18.2% Total operating expenses 1.356 0.542 1.898 1.856 0.042 2.3% Income from operations 0.859 0.141 1.000 0.778 0.222 28.5% Other income (expense) 0.026 - 0.026 (0.099) 0.125 - 126.3% Income from operations before income taxes 0.886 0.141 1.027 0.679 0.348 51.3% Net income $ 0.702 $ 0.087 $ 0.789 $ 0.491 0.298 60.6% Diluted earnings per share (in dollars) $ 0.046 $ 0.029 $ 0.0170 58.9% EBITDA 1.271 0.238 1.509 1.185 0.324 27.3%

10 Income Statement FY2016 Compared to FY2015 (in millions) Lancaster Buffalo FY2016 FY2015 Diff % chg Net sales $ 14.418 $ 5.554 $ 19.972 $ 18.314 $ 1.658 9.1% Gross profit 12.150 3.220 15.370 $ 13.922 1.448 10.4% Gross profit margin 84.27% 57.98% 76.96% 76.02% 0.94% 1.2% SG&A 4.472 2.221 6.693 $ 6.737 - 0.044 - 0.7% R&D 1.347 0.098 1.445 $ 1.328 0.117 8.8% Total operating expenses 5.819 2.319 8.138 $ 8.065 0.073 0.9% Income from operations 6.331 0.901 7.232 5.857 1.375 23.5% Other income (expense) 0.004 0 0.005 (0.164) 0.169 - 103.0% Income from operations before income taxes 6.335 0.902 7.237 5.693 1.544 27.1% Net income $ 4.392 $ 0.558 $ 4.950 $ 3.843 1.107 28.8% Diluted earnings per share (in dollars) $ 0.288 $ 0.226 $ 0.062 27.5% EBITDA 7.891 1.278 9.169 7.671 1.498 19.5%
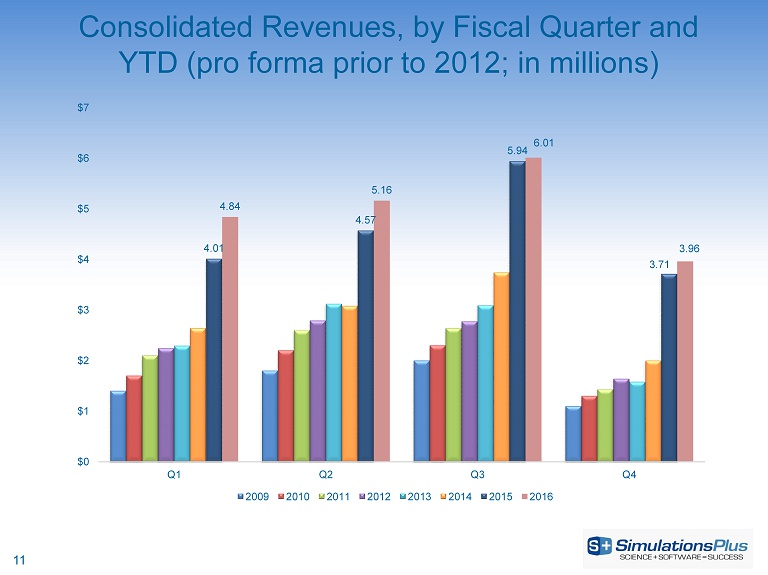
11 Consolidated Revenues, by Fiscal Quarter and YTD (pro forma prior to 2012; in millions) 4.01 4.57 5.94 3.71 4.84 5.16 6.01 3.96 $0 $1 $2 $3 $4 $5 $6 $7 Q1 Q2 Q3 Q4 2009 2010 2011 2012 2013 2014 2015 2016

12 Consolidated Net Income, by Fiscal Quarter and YTD (pro forma prior to 2012; in millions) $0.53 $0.97 $1.85 $0.49 $1.11 $1.15 $1.91 $0.79 $ - $0.50 $1.00 $1.50 $2.00 $2.50 Q1 Q2 Q3 Q4 2009 2010 2011 2012 2013 2014 2015 2016

13 Consolidated Diluted Earnings Per Share 0 0.02 0.04 0.06 0.08 0.1 0.12 Q1 Q2 Q3 Q4 $0.03 $0.06 $0.11 $0.03 $0.06 $0.07 $0.11 $0.05 Quarterly EPS FY09 FY10 FY11 FY12 FY13 FY14 FY15 FY16

14 Consolidated EBITDA, by Fiscal Quarter & YTD (in millions) 1.22 1.97 3.33 1.19 2.2 2.18 3.28 1.51 $0 $1 $2 $3 $4 Q1 Q2 Q3 Q4 2009 2010 2011 2012 2013 2014 2015 2016
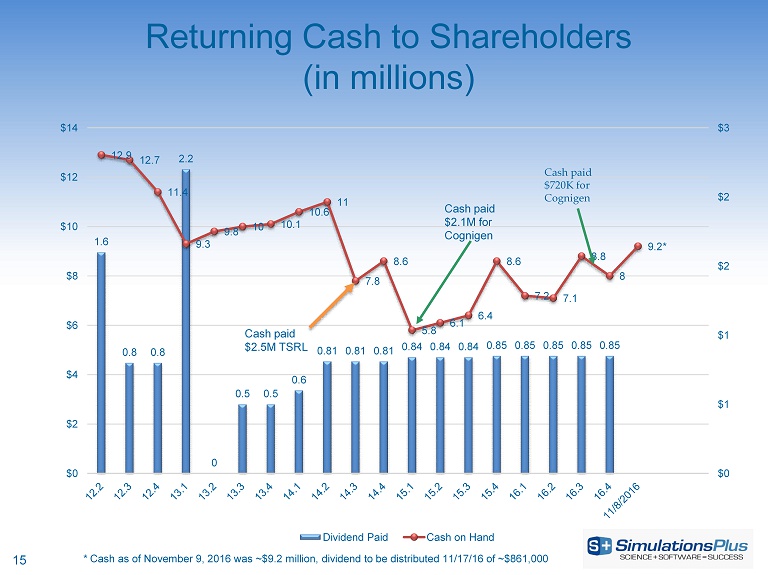
15 Returning Cash to Shareholders (in millions) 1.6 0.8 0.8 2.2 0 0.5 0.5 0.6 0.81 0.81 0.81 0.84 0.84 0.84 0.85 0.85 0.85 0.85 0.85 12.9 12.7 11.4 9.3 9.8 10 10.1 10.6 11 7.8 8.6 5.8 6.1 6.4 8.6 7.2 7.1 8.8 8 9.2* $0 $1 $1 $2 $2 $3 $0 $2 $4 $6 $8 $10 $12 $14 Dividend Paid Cash on Hand Cash paid $2.5M TSRL Cash paid $2.1M for Cognigen Cash paid $720K for Cognigen * Cash as of November 9, 2016 was ~$9.2 million, dividend to be distributed 11/17/16 of ~$861,000
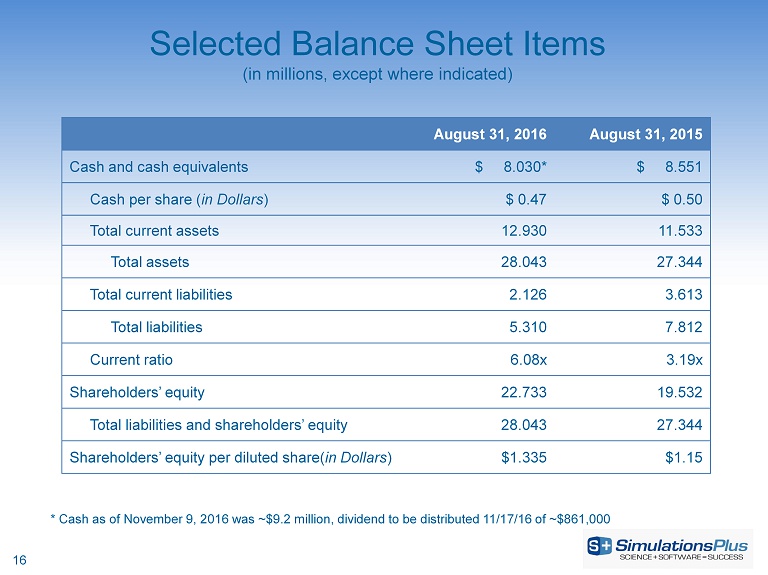
16 Selected Balance Sheet Items (in millions, except where indicated) August 31, 2016 August 31, 2015 Cash and cash equivalents $ 8.030* $ 8.551 Cash per share ( in Dollars ) $ 0.47 $ 0.50 Total current assets 12.930 11.533 Total assets 28.043 27.344 Total current liabilities 2.126 3.613 Total liabilities 5.310 7.812 Current ratio 6.08x 3.19x Shareholders’ equity 22.733 19.532 Total liabilities and shareholders’ equity 28.043 27.344 Shareholders’ equity per diluted share( in Dollars ) $1.335 $1.15 * Cash as of November 9, 2016 was ~$9.2 million, dividend to be distributed 11/17/16 of ~$861,000

17 Marketing and Sales John DiBella VP of Marketing and Sales

18 End - to - end M&S Solutions Provider N H O OH O CH 3 CH 3 CH 3 ADMET Predictor™ GastroPlus ™ MedChem Studio™ MedChem Designer™ DDDPlus ™ MembranePlus™ Consulting Services and Collaborations Discovery Preclinical Clinical PKPlus™ KIWI™

19 • Version 9.5 scheduled for end of 2016 ‒ Intramuscular dosing model – optional add - on model ‒ Antibody - drug conjugate (ADC) models for biologics • Version 8.1 scheduled for end of 2016 ‒ 64 - bit compatibility & minor bug fixes ‒ Rebuilt toxicity models • Version 4.0 still licensed by clients ‒ Many features merged into ADMET Predictor 8.0 as optional add - on to consolidate under one GUI Software Product News • Version 5.0 released in April 2016 ‒ Integration of models from ADMET Predictor™ – optional add - on ‒ New dosage form options for immediate & controlled release formulations • Version 1.5 scheduled for mid - 2017 ‒ Ability to model multiple compounds to optimize in vitro drug - drug interaction parameters • Version 1.0 released in August 2016 ‒ Number of small sales orders over the first 2 months of release ‒ Numerous evaluations ongoing/planned ‒ Will look to release v1.5 in couple of months to address several items from clients
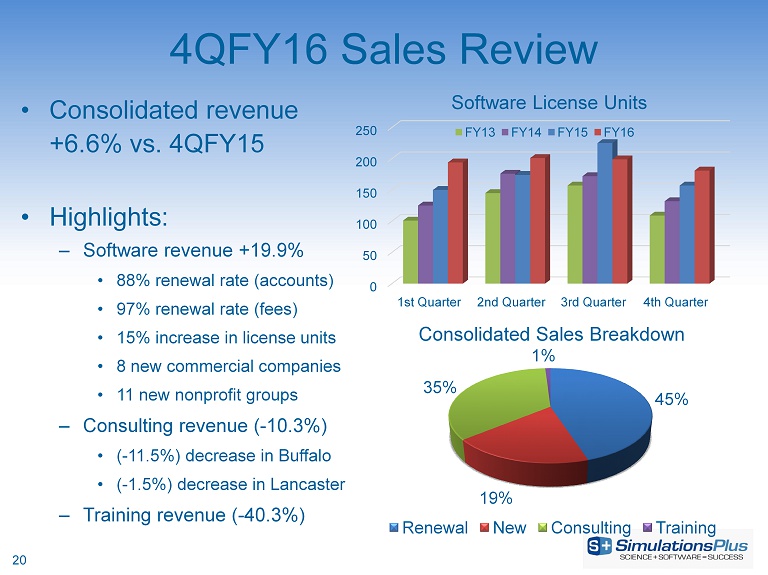
4QFY16 Sales Review • Consolidated revenue +6.6% vs. 4QFY15 • Highlights: – Software revenue +19.9% • 88% renewal rate (accounts) • 97% renewal rate (fees) • 15% increase in license units • 8 new commercial companies • 11 new nonprofit groups – Consulting revenue ( - 10.3%) • ( - 11.5%) decrease in Buffalo • ( - 1.5%) decrease in Lancaster – Training revenue ( - 40.3%) 45% 19% 35% 1% Consolidated Sales Breakdown Renewal New Consulting Training 0 50 100 150 200 250 1st Quarter 2nd Quarter 3rd Quarter 4th Quarter Software License Units FY13 FY14 FY15 FY16 20

FY2016 Sales Review • Consolidated revenue +9.1% vs. FY2015 • Highlights: – Software revenue +10.6% • 87% renewal rate (accounts) • 94% renewal rate (fees) • 10% increase in license units • 37 new commercial companies • 38 new nonprofit groups – Consulting revenue +5.9% • 6.6% increase in Buffalo • 1.4% increase in Lancaster – Workshop revenue ( - 8.9%) 55% 13% 31% 1% Consolidated Sales Breakdown Renewal New Consulting Training 0 50 100 150 200 250 1st Quarter 2nd Quarter 3rd Quarter 4th Quarter Software License Units FY13 FY14 FY15 FY16 21

FY2016 Software Revenue – by Region Europe 28% (+10% vs. FY15) North America 47% (+9% vs. FY15) Asia 25% (+14% vs. FY15) South America <1% (No change vs. FY15) Japan = 58% China = 18% India = 16% Korea = 4% 22

Major Marketing Activities Website Redesign • Website launched: November 9 th – Continue to update content – both written and visual – Continue to migrate over to new ShareFile system for file exchange/downloads Workshops and Conferences • GastroPlus/pop PK workshops held in Bethesda in October – GastroPlus workshops in Tokyo and Orlando scheduled in December • Attended 20 scientific conferences; 18 scientific presentations Strategic Digital Marketing Initiatives • Hosted 4 webinars on GastroPlus modeling applications • Continued creating bank of training/promotional videos • Continued with active social media campaigns 23

24 Buffalo Division Update Re - imagining the future of science - based research and development Ted Grasela President

25 Consulting Services • Strategic and synergistic benefits of the Buffalo (Cognigen) acquisition are being realized • Strong collaborations between Buffalo and Lancaster scientists have identified new and innovative ways of using modeling and simulation to bringing value to our clients • Consulting projects help shape management and regulatory decision - making process • Successful projects help drive additional consulting and software sales
26 Status Report - Consulting • In FY2016 worked with 33 companies on 58 drugs, 107 projects – 9 new companies in FY2016 – 9 new projects in FY2016Q4 – 1 project expanded scope in FY2016Q4 – 4 projects delayed because of slow trial enrollment – 4 projects cancelled because of failed studies – 13 outstanding proposals with 20 different companies • In FY2016, presented 15 posters and published 3 papers – Working on 17 publications and 4 conference abstracts • Most common therapeutic area is oncology, followed by neurology and immunology – ~25% of projects result directly in regulatory interaction.
27 Presentations of Note • Presentation of an application of ADMET Predictor™ and GastroPlus™ at the Japanese Society for the Study of Xenobiotics meeting in Matsumoto Japan opened up conversations about value of our products to support drug discovery • Presentation at EU SimInhale Consortium meeting in Prague highlighted our innovations in pulmonary absorption incorporated into GastroPlus and enabled evaluation of emerging science for future GastroPlus modules

28 • Continued to work on $4.7 million contract with a major foundation to implement a KIWI platform for global teams engaged in model - based drug development; 5 - year term contingent on satisfactory completion of milestones • Project builds on our extensive process - related research; enables substantial enhancements to the KIWI platform • Enhancements will provide a scaffold with broad applicability and will be available to academic and industry clients of KIWI • Currently have 6 KIWI licenses; 2 were signed in FY2016Q4 • Have several KIWI demonstrations ongoing with research groups ranging from academics to large pharma . KIWI Update

29 Summary Buffalo division is strong and growing • Consulting activities continuing to expand, and realizing synergies with Lancaster division for PBPK modeling in clinical pharmacology • Foundation contract to enhance the KIWI platform is a major step forward in our long - term vision for the product • Continued interest in the academic and industry communities regarding licensing the product

30 Final Summary Walt Woltosz Chairman and Chief Executive Officer

31 • 4QFY16 • revenues up $246,000 (6.6%) to $3.96 million • net income up $298,000 (60.6%) to $ 789,000 • diluted EPS up 58.9% to $ 0.046 (5¢) per share from $ 0.029 (3¢) in 4QFY15. • FY2016 • revenues up $ 1.66 Million (9.1%) to $ 19.97 million • net income up $ 1.11 Million ( 28.8%) to $4.95 million • diluted EPS up 27.5% to $0.288(29¢) per share from $0.226 (23¢) in FY2015. • California and Buffalo divisions both performing well • Expected synergies being realized • Addressing regulatory agency interests in applying PBPK modeling in clinical pharmacology • 5 - year, $4.7 million contract with research foundation • Offers potential for additional such contracts with other organizations • Software sales continue strong growth trend • We believe Simulations Plus continues to lead the trend toward greater use of modeling and simulation in drug development Summary