Attached files
| file | filename |
|---|---|
| 8-K - 8-K - VISTEON CORP | d288201d8k.htm |
| Exhibit 99.1
|
Visteon Corporation
Baird Industrial Conference
November 10, 2016
Sachin Lawande
President and CEO
Christian Garcia
Executive Vice President and CFO
Visteon Confidential
|
|
Forward-looking information
This presentation contains “forward-looking statements” within the meaning of the Private Securities Litigation Reform Act of 1995. Forward- looking statements are not guarantees of future results and conditions but rather are subject to various factors, risks and uncertainties that could cause our actual results to differ materially from those expressed in these forward-looking statements, including, but not limited to: conditions within the automotive industry, including (i) the automotive vehicle production volumes and schedules of our customers, (ii) the financial condition of our customers and the effects of any restructuring or reorganization plans that may be undertaken by our customers, including work stoppages at our customers, and (iii) possible disruptions in the supply of commodities to us or our customers due to financial distress, work stoppages, natural disasters or civil unrest; our ability to execute on our transformational plans and cost-reduction initiatives in the amounts and on the timing contemplated; our ability to satisfy future capital and liquidity requirements; including our ability to access the credit and capital markets at the times and in the amounts needed and on terms acceptable to us; our ability to comply with financial and other covenants in our credit agreements; and the continuation of acceptable supplier payment terms; our ability to satisfy pension and other post-employment benefit obligations; our ability to access funds generated by foreign subsidiaries and joint ventures on a timely and cost effective basis; general economic conditions, including changes in interest rates and fuel prices; the timing and expenses related to internal restructurings, employee reductions, acquisitions or dispositions and the effect of pension and other post-employment benefit obligations; increases in raw material and energy costs and our ability to offset or recover these costs, increases in our warranty, product liability and recall costs or the outcome of legal or regulatory proceedings to which we are or may become a party; and those factors identified in our filings with the SEC (including our Annual Report on Form 10-K for the fiscal year ended December 31, 2015). Caution should be taken not to place undue reliance on our forward-looking statements, which represent our view only as of the date of this presentation, and which we assume no obligation to update. The financial results presented herein are preliminary and unaudited; final financial results will be included in the company’s Quarterly Report on Form 10-Q for the fiscal quarter ended September 30, 2016. New business wins, re-wins and backlog do not represent firm orders or firm commitments from customers, but are based on various assumptions, including the timing and duration of product launches, vehicle productions levels, customer price reductions and currency exchange rates.
2
|
|
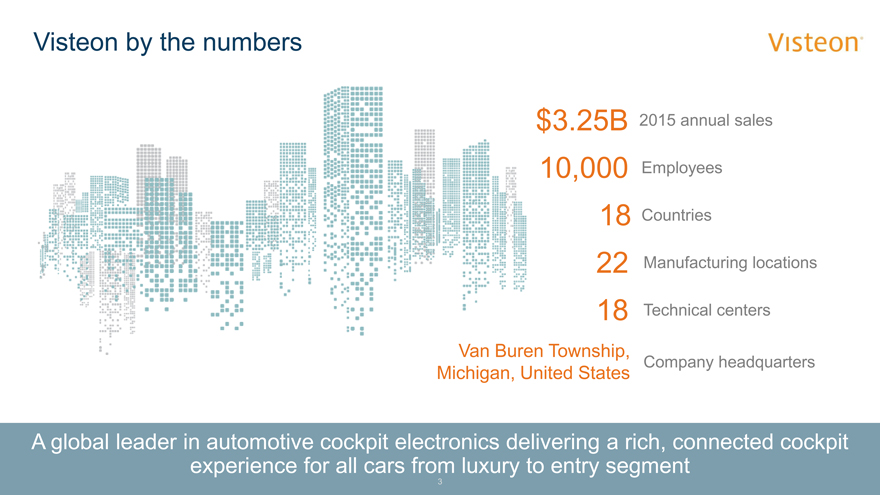
Visteon by the numbers
$3.25B 2015 annual sales 10,000 Employees
18 Countries
22 Manufacturing locations
18 Technical centers
Township,
Company headquarters
Michigan, United States
A global leader in automotive cockpit electronics delivering a rich, connected cockpit experience for all cars from luxury to entry segment
3
|
|
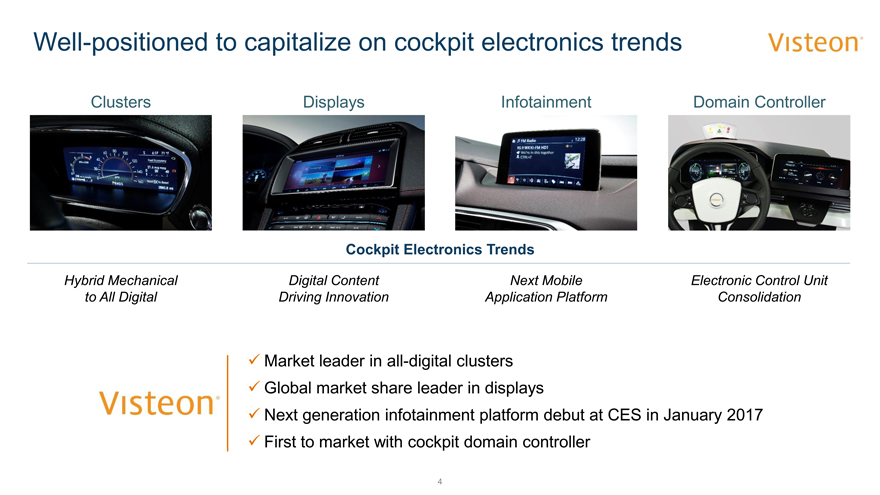
Well-positioned to capitalize on cockpit electronics trends
Clusters Displays Infotainment Domain Controller
Cockpit Electronics Trends
Hybrid Mechanical Digital Content Next MobileElectronic Control Unit
to All Digital Driving Innovation Application PlatformConsolidation
Market leader in all-digital clusters
Global market share leader in displays
Next generation infotainment platform debut at CES inJanuary2017
First to market with cockpit domain controller
4
|
|
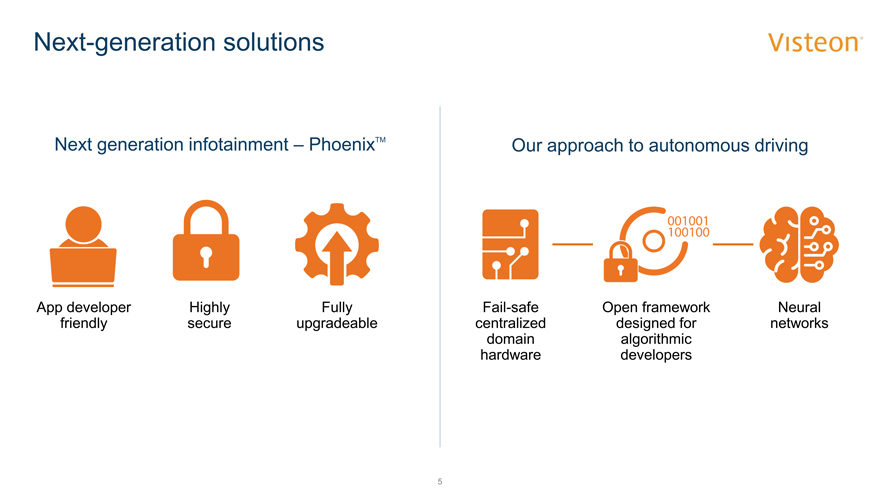
Next-generation solutions
Next generation infotainment PhoenixTM
Our approach to autonomous driving
App developer Highly FullyFail-safeOpen frameworkNeural
friendly secure upgradeablecentralizeddesigned fornetworks
domainalgorithmic
hardwaredevelopers
5
|
|
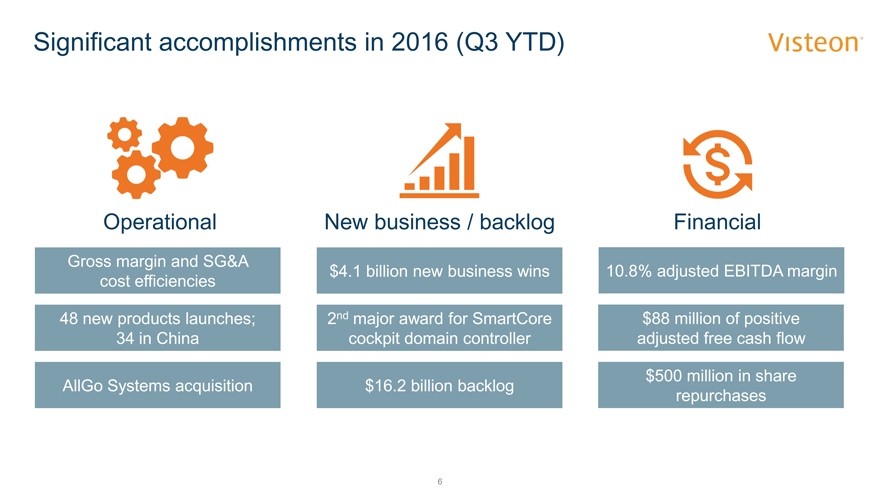
Significant accomplishments in 2016 (Q3 YTD)
Operational New business / backlog Financial
Gross margin and SG&A $4.1 billion new business wins10.8% adjusted EBITDA margin
cost efficiencies
48 new products launches; 2nd major award for SmartCore$88 million of positive
34 in China cockpit domain controller adjusted free cash flow
$500 million in share
AllGo Systems acquisition $16.2 billion backlog repurchases
6
|
|
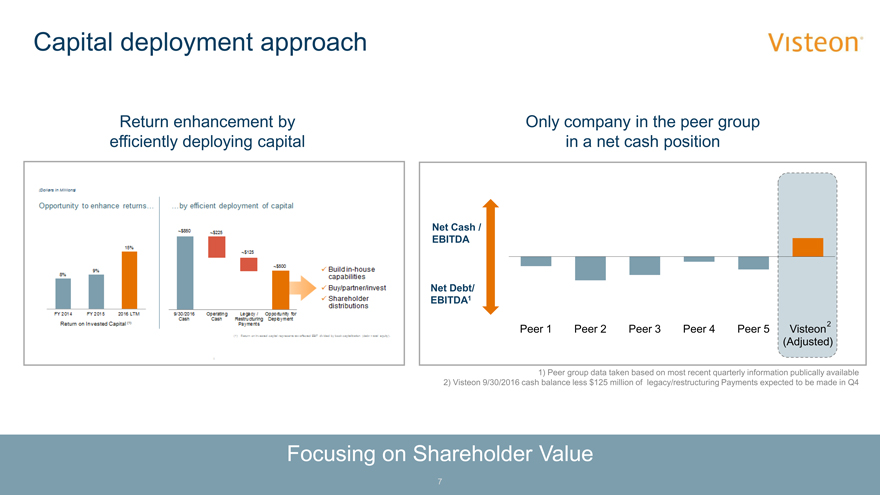
Capital deployment approach
Return enhancement by Only company in the peer group efficiently deploying capital in a net cash position
Net Cash / EBITDA
Net Debt/ EBITDA1
Peer 1 Peer 2 Peer 3 Peer 4 Peer 5 Visteon2 (Adjusted)
1) Peer group data taken based on most recent quarterly information publically available
2) Visteon 9/30/2016 cash balance less $125 million of legacy/restructuring Payments expected to be made in Q4
Focusing on Shareholder Value
7
|
|
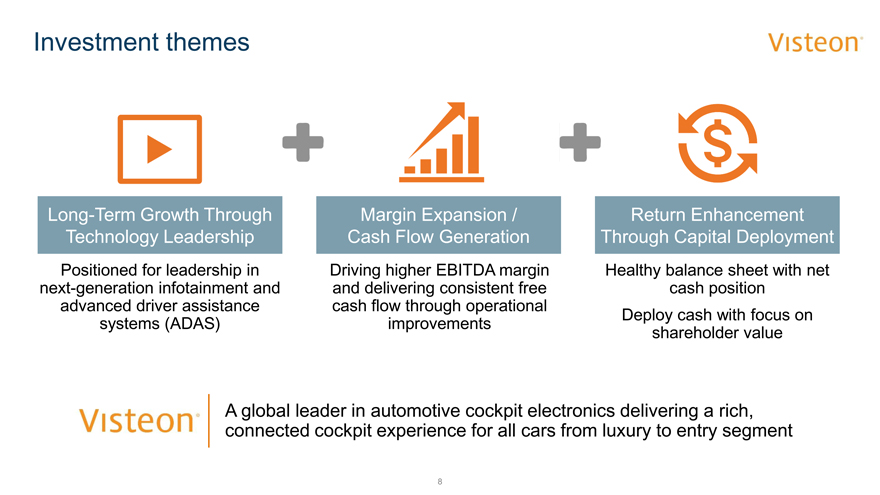
Investment themes
Long-Term Growth Through Margin Expansion / Return Enhancement
Technology Leadership Cash Flow Generation Through Capital Deployment
Positioned for leadership in Driving higher EBITDA margin Healthy balance sheet with net
next-generation infotainment and and delivering consistent free cash position
advanced driver assistance cash flow through operational
systems (ADAS) improvements Deploy cash with focus on
shareholder value
A global leader in automotive cockpit electronics delivering a rich, connected cockpit experience for all cars from luxury to entry segment
8
|
|

Appendix
Visteon Corporation
Baird Global Industrial Conference
|
|
Use of non-GAAP financial information
Because not all companies use identical calculations, adjusted EBITDA, free cash flow and adjusted free cash flow used throughout this presentation may not be comparable to other similarly titled measures of other companies. In order to provide the forward-looking non-GAAP financial measures for full-year 2016, the Company is providing reconciliations to the most directly comparable GAAP financial measures on the subsequent slides. The provision of these comparable GAAP financial measures is not intended to indicate that the Company is explicitly or implicitly providing projections on those GAAP financial measures, and actual results for such measures are likely to vary from those presented. The reconciliations include all information reasonably available to the Company at the date of this presentation and the adjustments that management can reasonably predict.
10
|
|
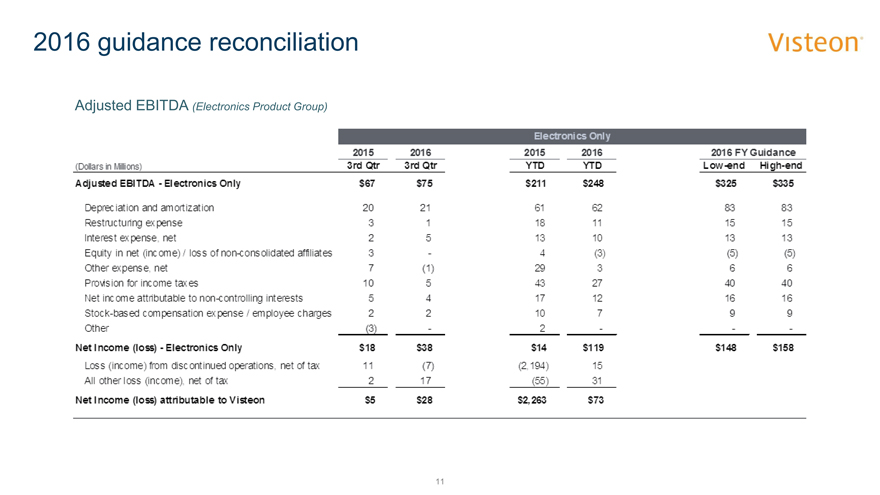
2016 guidance reconciliation
Adjusted EBITDA (Electronics Product Group)
Electronics Only
2015 2016201520162016 FY Guidance
(Dollars in Millions) 3rd Qtr 3rd QtrYTDYTDLow-endHigh-end
Adjusted EBITDA—Electronics Only $67 $75$211$248$325$335
Depreciation and amortization 20 2161628383
Restructuring expense 3 118111515
Interest expense, net 2 513101313
Equity in net (income) / loss of non-consolidated affiliates 3 -4(3)(5)(5)
Other expense, net 7 (1)29366
Provision for income taxes 10 543274040
Net income attributable to non-controlling interests 5 417121616
Stock-based compensation expense / employee charges 2 210799
Other (3) -2---
Net Income (loss)—Electronics Only $18 $38$14$119$148$158
Loss (income) from discontinued operations, net of tax 11 (7)(2,194)15
All other loss (income), net of tax 2 17(55)31
Net Income (loss) attributable to Visteon $5 $28$2,263$73
11
|
|
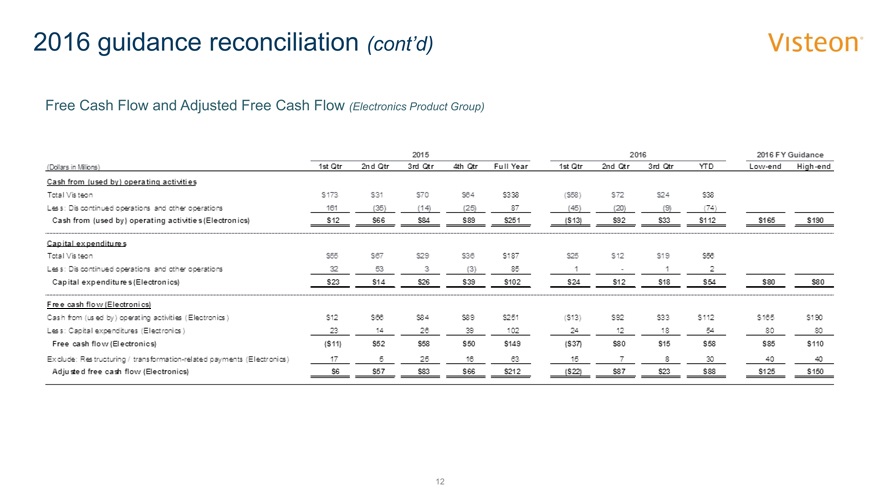
2016 guidance reconciliation (cont’d)
Free Cash Flow and Adjusted Free Cash Flow (Electronics Product Group)
201520162016 FY Guidance
(Dollars in Millions) 1st Qtr 2nd Qtr3rd Qtr4th QtrFull Year1st Qtr2nd Qtr3rd QtrYTDLow-endHigh-end
Cash from (used by) operating activities
Total Visteon $173 $31$70$64$338($58)$72$24$38
Less: Discontinued operations and other operations 161 (35)(14)(25)87(45)(20)(9)(74)
Cash from (used by) operating activities (Electronics) $12 $66$84$89$251($13)$92$33$112$165$190
Capital expenditures
Total Visteon $55 $67$29$36$187$25$12$19$56
Less: Discontinued operations and other operations 32 533(3)851-12
Capital expenditures (Electronics) $23 $14$26$39$102$24$12$18$54$80$80
Free cash flow (Electronics)
Cash from (used by) operating activities (Electronics) $12 $66$84$89$251($13)$92$33$112$165$190
Less: Capital expenditures (Electronics) 23 142639102241218548080
Free cash flow (Electronics) ($11) $52$58$50$149($37)$80$15$58$85$110
Exclude: Restructuring / transformation-related payments (Electronics) 17 52516631578304040
Adjusted free cash flow (Electronics) $6 $57$83$66$212($22)$87$23$88$125$150
12
|
|
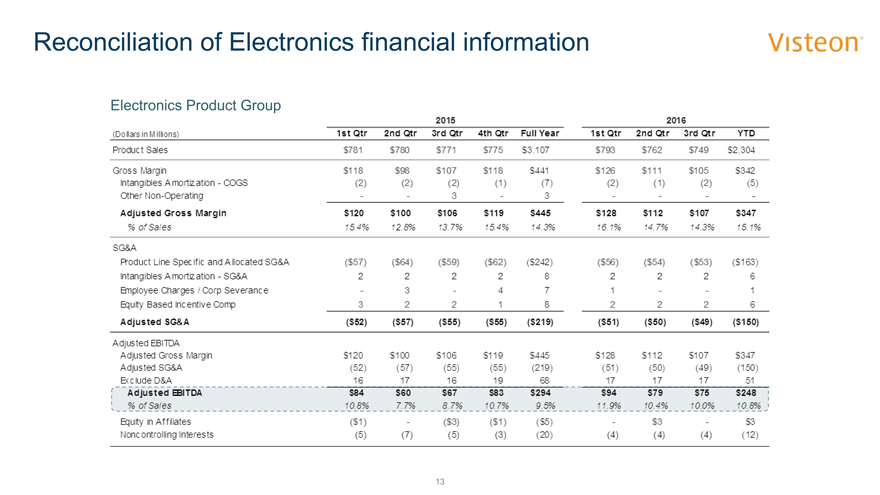
Reconciliation of Electronics financial information
Electronics Product Group
20152016
(Dollars in Millions) 1st Qtr 2nd Qtr3rd Qtr4th QtrFull Year1st Qtr2nd Qtr3rd QtrYTD
Product Sales $781 $780$771$775$3,107$793$762$749$2,304
Gross Margin $118 $98$107$118$441$126$111$105$342
Intangibles Amortization—COGS (2) (2)(2)(1)(7)(2)(1)(2)(5)
Other Non-Operating - -3-3----
Adjusted Gross Margin $120 $100$106$119$445$128$112$107$347
% of Sales 15.4% 12.8%13.7%15.4%14.3%16.1%14.7%14.3%15.1%
SG&A
Product Line Specific and Allocated SG&A ($57) ($64)($59)($62)($242)($56)($54)($53)($163)
Intangibles Amortization—SG&A 2 22282226
Employee Charges / Corp Severance - 3-471--1
Equity Based Incentive Comp 3 22182226
Adjusted SG&A ($52) ($57)($55)($55)($219)($51)($50)($49)($150)
Adjusted EBITDA
Adjusted Gross Margin $120 $100$106$119$445$128$112$107$347
Adjusted SG&A (52) (57)(55)(55)(219)(51)(50)(49)(150)
Exclude D&A 16 1716196817171751
Adjusted EBITDA $84 $60$67$83$294$94$79$75$248
% of Sales 10.8% 7.7%8.7%10.7%9.5%11.9%10.4%10.0%10.8%
Equity in Affiliates ($1) -($3)($1)($5)-$3-$3
Noncontrolling Interests (5) (7)(5)(3)(20)(4)(4)(4)(12)
13
|
|

VISTEON