Attached files
| file | filename |
|---|---|
| EX-99.1 - PRESS RELEASE - HMS HOLDINGS CORP | exh_991.htm |
| 8-K - FORM 8-K - HMS HOLDINGS CORP | f8k_110916.htm |
EXHIBIT 99.2

November 9, 2016 Q3 2016 Investor Presentation

Disclaimers FORWARD-LOOKINGSTATEMENTSThispresentationcontains"forward-lookingstatements"withinthemeaningoftheU.S.PrivateSecuritiesLitigationReformActof1995.Such statements giveourprojectionsorforecastsoffutureeventsandarebasedonourcurrentexpectations andassumptions regardingourbusiness,theeconomyandotherfuture conditions; they do not relate strictly to historical or current facts. Forward-looking statements can be identified by words such as “aims,” “anticipates,” “believes,” “estimates,” “expects,”“forecasts,”“intends,”“likely,”“may,”“plans,”“projects,”“seeks,”“targets,”“will,”“would,”“could,”“should,”andsimilarexpressionsandreferencestoguidance,although someforward-lookingstatements maybeexpressed differently.Inparticular,theseincludestatements relatingtofutureactions,businessplans,objectivesandprospects, future operating or financial performance, and specifically include the information under “Financial Performance Highlights,” “Commercial Health Plan Business” and “the Essette Acquisition.”Factorsoreventsthatcouldcauseactualresultstodiffermayemergefromtimetotimeanditisnotpossibleforustopredictallofthem.Shouldknownorunknown risksoruncertainties materialize, orshould underlying assumptions prove inaccurate, actual results could differ materially frompast results and those anticipated, estimated or projected.Wecautionyouthereforeagainstrelyingonanyoftheseforward-lookingstatements.Factorsthatcouldcauseorcontributetosuchdifferences,include,butarenotlimited to:changesintheU.S.healthcareenvironmentorhealthcarefinancingsystem;negativeorreducedgrowthrateofspendingonMedicaid/Medicare;ourabilitytoretaincustomersor thelossofoneormoremajorcustomers;theunexpectedreductioninscopeorterminationofasignificantcontract;customerdissatisfactionorournon-compliancewithcontractual provisions orregulatory requirements;our failure to meet performance standards triggering significant costs orliabilities under our contracts;emergence of newcompetitors or competitors’introductionofneworsuperiorproductsorservices;intellectualpropertyrights,confidential andproprietaryinformation;thecancellationordelayofprocurementsor contractimplementation duetoprotestsorchallengestogovernmentawards;regulatory,budgetaryorpoliticalactionsthataffectprocurement practices;ourabilitytocontinueto secure contracts or favorable contract terms through the competitive bidding process; our ability to execute our business plans or growth strategy; variations in our results of operations;developmentandimplementation ofnewproductsolutionsornewprocessimprovements;theriskthatguidancemaynotbeachieved;ourabilitytomaintaineffective informationandtechnologysystemsandnetworks,andtoprotectthemfromdamage,interruptionorbreach,includingcyber-securitybreachesandotherdisruptions;ourfailureto complywithapplicablelawsandregulationsgoverningtheconductofcertainelectronichealthtransactionsandtheconfidentialityofindividuallyidentifiablehealthinformationorto protect such information from theft andmisuse; the nature of investment and acquisition opportunities we arepursuing, and the successful execution of such investments and acquisitions; our ability to successfully integrate acquired businesses; the failure to realize the full value of goodwill or intangible assets from acquisitions; negative results of government or customer reviews, audits or investigations; state or federal limitations related to the outsourcing of certain government programs or functions; our reliance on subcontractors,vendorsorotherthirdpartyprovidersandsourcestoperformservices;pendingorthreatenedlitigation;unfavorableoutcomesinlegalproceedings;restrictionson biddingorperformingcertainworkduetoperceivedconflictsofinterests;ourabilitytoattractandretainqualifiedemployeesandkeypersonnelandtomanageleadershiptransitions effectively;ourcashflowsfromoperations,availablecashandabilitytogeneratesufficientcashtocoverourinterestandprincipalpaymentsunderourcreditfacilityortoborrowor usecredit;unanticipatedchangesinoureffectivetaxrates;unanticipatedincreasesinthenumberoramountofclaimsforwhichweareself-insured;themarketpriceofourcommon stockandlackofdividendpayments;risksrelatedtointernalcontroloverfinancialreporting;anti-takeoverprovisionsinourcorporategovernancedocuments;andotherfactors, risks and uncertainties described in our most recent Annual Report on Form 10-K and subsequent filings with the Securities and Exchange Commission. Any forward-looking statementsaremadeasofthedateofthispresentation.Exceptasmayberequiredbylaw,wedisclaimanyobligationtopubliclyupdateforward-lookingstatements,whetherasa resultofnewinformation,futureeventsorotherwise. NON-GAAPFINANCIALINFORMATION.Thispresentationcontainscertainnon-GAAPmeasures.Thesenon-GAAPmeasures,ascalculatedbytheCompany,arenotnecessarily comparable tosimilarlytitledmeasuresreported byother companies.Additionally, these non-GAAPmeasures arenotmeasurements offinancialperformance orliquidityunder GAAPandshouldnotbeconsidered alternatives totheCompany's otherfinancialinformation determined underGAAP.Seeslide9fordefinitions andreconciliations ofcertain non-GAAPmeasures. MARKETANDINDUSTRYDATA.Thispresentationcontainsmarketandindustrydataandforecaststhathavebeenobtainedfrompubliclyavailableinformation,variousindustry publications,otherpublishedindustrysourcesandourinternaldataandestimates.Wehavenotindependentlyverifiedtheinformationandcannotmakeanyrepresentationastothe accuracyorcompletenessofsuchinformation.Noneofthereportsandothermaterialsofthirdpartysourcesreferredtointhispresentationwerepreparedforusein,orinconnection with,thispresentation.Ourinternaldataandestimatesarebaseduponinformationobtainedfromourcustomers,ourpartners,tradeandbusinessorganizations,publiclyavailable informationandothercontacts inthemarketsinwhichweoperateandourmanagement’s understanding ofindustry conditions.Estimates aredifficulttodevelopandinherently uncertain andwecannot assure youthat theyareaccurate.Ourestimates involve risksanduncertainties andaresubject tochange based onvarious factors, including those discussedabove. HMSY Q3 2016 Investor Presentation / November 9, 2016

Presentation Outline HMSY Q3 2016 Investor Presentation / November 9, 2016 Q3 Financial Results ▪ Financial Performance Highlights ▪ Quarterly Financial Information ▪ QuarterlyMarketand Product Revenue 1-3 Commercial Health Plan Business ▪ 2014-2016 Quarterly Revenue ▪ Q3’16 Sales 4-5 State Government Business ▪MedicaidEnrollment Growth 6 The EssetteAcquisition 7-8 Adjusted EPS Reconciliation to GAAP 9

HMSY Q3 2016 Investor Presentation / November 9, 2016 / 1 Financial Performance Highlights ▪ Q3GAAPEPSof$0.16perdilutedshareandadjusted EPSof$0.24perdilutedshare 1 includedacumulative tax benefit in connection with certain tax credits and deductionsforprioryearsrecognizedinthequarter 2 ▪ Revenueof$124.6millionforQ3was5.2%higheryear- over-year. Revenue for the first nine months of 2016 increased to $367.9 (+6.4%), compared to the same periodin2015 ▪ CommercialhealthplanrevenueforQ3increased13.9% year-over-year and increased 17.9% for the first nine monthsof2016,comparedtothesameperiodin2015 ▪ Stategovernmentrevenuedeclined2.9%year-over-year and declined 6.0% for the first nine months of 2016, comparedtothesameperiodin2015 3 ▪ Payment Integrity revenue, excluding Medicare RAC, increased 9.3% year-over-year for Q3 and increased 7.6%forthefirstninemonthsof2016,comparedtothe sameperiodin2015 ▪ Theannualeffectivetaxrateisprojectedtodeclineby ~300basispointsto~37.0% Q3 Financial Results 1 AdjustedEPSisanon-GAAPmeasure(seereconciliationonslide9) 2 Net income in the quarter included a tax benefit of approximately $1.1 millionor $0.01 per diluted share in connectionwith2016year-to-dateand$6.2millionor$0.07perdilutedshareinconnectionwithcertainprior openyearsResearchandDevelopment(“R&D”)creditsanddomesticmanufacturingdeductionsrecognizedin thequarter 3 Declinewasdueprimarilytothenon-recurringspilloverbenefitofseveralmilliondollarsreceivedinQ1’15asa resultofthe2014MedicaidexpansionpursuanttotheAffordableCareAct

HMSY Q3 2016 Investor Presentation / November 9, 2016 / 2 Q3 Financial Results Quarterly Financial Information 1 Diluted adjusted EPS is a non-GAAP measure (see reconciliation on slide 9) (Unaudited, $ in thousands, except per share amounts) Q3'15 Q4'15 Revenue $ 118,444 $ 128,514 $ 119,763 $ 123,550 $ 124,604 Cost of services: Compensation 43,628 46,694 46,401 47,343 48,298 Data processing 10,023 10,409 9,624 9,104 9,541 Occupancy 4,188 3,765 3,627 3,631 3,388 Direct project costs 12,702 14,776 14,483 11,473 10,997 Other operating costs 6,551 8,453 5,776 6,407 8,465 Amortization of acquisition related software and intangible assets 7,041 7,012 7,013 7,013 6,390 Total cost of services 84,133 91,109 86,924 84,971 87,079 Selling, general & administrative expenses 21,295 22,582 22,930 22,227 24,875 Total operating expenses 105,428 113,691 109,854 107,198 111,954 Operating income 13,016 14,823 9,909 16,352 12,650 Interest expense (1,948) (1,970) (2,091) (2,100) (2,121) Interest income 11 15 47 60 105 Income before income taxes 11,079 12,868 7,865 14,312 10,634 Income taxes 4,217 4,143 3,305 5,746 (2,874) Net income $ 6,862 $ 8,725 $ 4,560 $ 8,566 $ 13,508 Net income per diluted share $ 0.08 $ 0.10 $ 0.05 $ 0.10 $ 0.16 Weighted average common shares, diluted 87,792 87,110 84,479 84,528 84,853 Diluted adjusted EPS 1 $ 0.15 $ 0.19 $ 0.14 $ 0.18 $ 0.24 Q3'16Q1'16 Q2'16
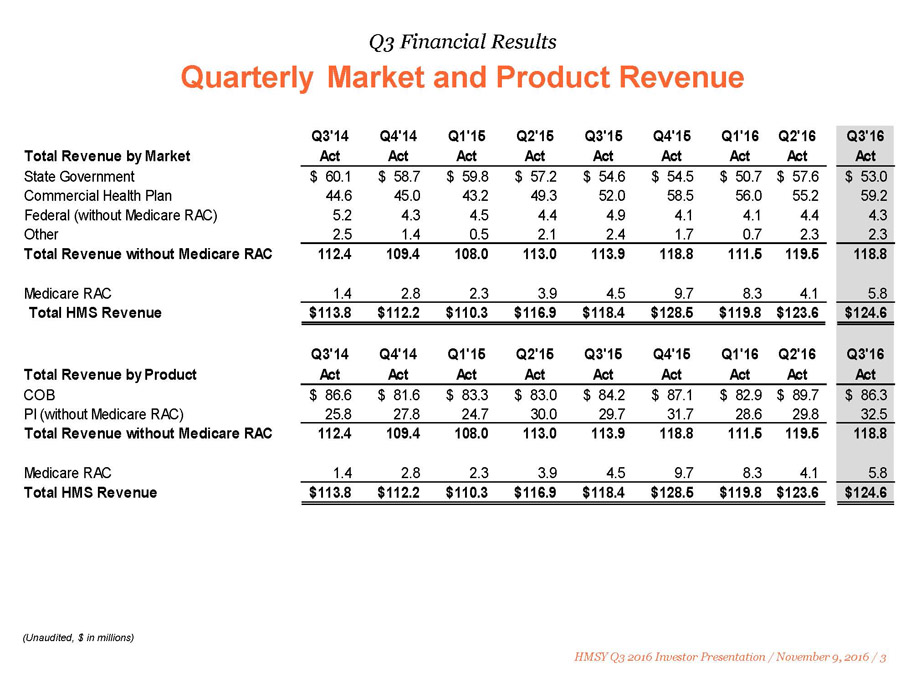
HMSY Q3 2016 Investor Presentation / November 9, 2016 / 3 Q3 Financial Results QuarterlyMarket and Product Revenue (Unaudited, $ in millions) Q3'14 Q4'14 Q1'15 Q2'15 Q3'15 Q4'15 Q1'16 Q2'16 Q3'16 Total Revenue by Market Act Act Act Act Act Act Act Act Act State Government 60.1$ 58.7$ 59.8$ 57.2$ 54.6$ 54.5$ 50.7$ 57.6$ 53.0$ Commercial Health Plan 44.6 45.0 43.2 49.3 52.0 58.5 56.0 55.2 59.2 Federal (without Medicare RAC) 5.2 4.3 4.5 4.4 4.9 4.1 4.1 4.4 4.3 Other 2.5 1.4 0.5 2.1 2.4 1.7 0.7 2.3 2.3 Total Revenue without Medicare RAC 112.4 109.4 108.0 113.0 113.9 118.8 111.5 119.5 118.8 Medicare RAC 1.4 2.8 2.3 3.9 4.5 9.7 8.3 4.1 5.8 Total HMS Revenue 113.8$ 112.2$ 110.3$ 116.9$ 118.4$ 128.5$ 119.8$ 123.6$ 124.6$ Q3'14 Q4'14 Q1'15 Q2'15 Q3'15 Q4'15 Q1'16 Q2'16 Q3'16 Total Revenue by Product Act Act Act Act Act Act Act Act Act COB 86.6$ 81.6$ 83.3$ 83.0$ 84.2$ 87.1$ 82.9$ 89.7$ 86.3$ PI (without Medicare RAC) 25.8 27.8 24.7 30.0 29.7 31.7 28.6 29.8 32.5 Total Revenue without Medicare RAC 112.4 109.4 108.0 113.0 113.9 118.8 111.5 119.5 118.8 Medicare RAC 1.4 2.8 2.3 3.9 4.5 9.7 8.3 4.1 5.8 Total HMS Revenue 113.8$ 112.2$ 110.3$ 116.9$ 118.4$ 128.5$ 119.8$ 123.6$ 124.6$

HMSY Q3 2016 Investor Presentation / November 9, 2016 / 4 Commercial Health Plan Business Commercial Health Plan Revenue 2014-2016 (Unaudited, $ in thousands) ▪ 17.9% YTD Revenue Growth Compared to the First Nine Months of 2015

HMSY Q3 2016 Investor Presentation / November 9, 2016 / 5 ▪ New commercial health plan customer sales covering approximately 0.6 million lives ▪ Additional products sold to current commercial health plan customers covering approximately 10.8 million lives 1 Commercial Health Plan Business Q3 Commercial Health Plan Sales 1 In some instances both COB and PI products were sold to the same customer life, but such sales are only counted once for purposes of this calculation 2 Percentage of additional products sold to current customers based on projected revenue Note: Data as of September 30, 2016 2 2 2 2

State Government Business New Medicaid Enrollment Through August 2016 1 CMS Medicaid & CHIP: August 2016 Monthly Applications, Eligibility Determinations and Enrollment Report, November 3, 2016. This analysis compares Medicaid enrollment of ~15.7 million lives reported through 8/31/16 to enrollment as of 10/1/13, which was the beginning of Marketplace open enrollment and the CMS baseline for measuring expansion ~14.2M of ~15.7M new CMS-reported 1 Medicaid lives are in HMS customer eligibility files 250,000 or more (20) 100,000 –249,000 (6) 30,000 –99,999 (10) 1 –29,999 (10+DC) No growth (3) No data reported (2) CA NV OR WA ID MT ND SD NE KS OK TX HI AK AZ UT WY CO NM MO IA MN WI MI AR LA MS AL GA FL SC TN NC KY IL IN OH PA NY WV VA ME MD DE NJ CT RI MA VT NH DC HMSY Q3 2016 Investor Presentation / November 9, 2016 / 6

The EssetteAcquisition ▪ A proven, scalable, and market leading web-based care management and care coordination platform ▪ An important first step in the HMS strategy to build a broad foundation of technology and service solutions to help customers better manage their members through the care continuum HMSY Q3 2016 Investor Presentation / November 9, 2016 / 7

Care Analytics and Risk Management Solutions Coordination of Benefits Solutions Payment Integrity Solutions A New Solution for Customers HMSY Q3 2016 Investor Presentation / November 9, 2016 / 8

Reconciliation of Net Income to GAAP EPS and Adjusted EPS HMSY Q3 2016 Investor Presentation / November 9, 2016 / 9 Note: The Company believes that the non-GAAP financial measure above provides useful information to the Company's management,investorsandotherinterestedpartiesabouttheCompany'soperatingperformancebecauseitallowsthemto understand and comparethe Company's operating results during the current periods to the prior year periods in a more consistentmanner.Thenon-GAAPmeasurepresentedinthisslidemaynotbecomparabletosimilarlytitledmeasuresused byothercompanies. 1 In periods prior to 2016, legal fees related to disputes involving PCG were not included in adjustedearningsbecausetheywerenotconsiderednon-recurringatthetime (Unaudited,$inthousands,exceptpersharedata) As summarized in the following table, diluted earnings per share adjusted for stock-based compensationexpense,non-recurringlegalexpense,amortizationofacquisitionrelatedsoftwareand intangibleassetsandrelatedtaxes(adjustedEPS)was$0.24forthethirdquarterof2016. 2 Taxeffectofadjustmentsiscomputedasthepre-taxeffectoftheadjustmentsmultipliedbythe annualeffectivetaxrateforthethreemonths Legal fees related to disputes involving PCG $ 943 $ 1,351 Income taxes on legal fees (2) (343) (451) Sub-total $ 600 $ 900 Diluted Adjusted EPS $ 0.01 $ 0.01 Q3'15 Q4'15 Net income $ 6,862 $ 8,725 $ 4,560 $ 8,566 $ 13,508 Stock-based compensation 3,140 4,089 4,240 4,405 2,102 Non-recurring legal fees (1) - - 1,248 315 - Amortization of acquisition related software and intangible assets 7,041 7,013 7,013 7,013 7,015 (3,711) (3,350) (5,253) (4,704) (2,644) Sub-total $ 13,332 $ 16,477 11,808 15,595 19,981 Weighted average common shares, diluted 87,792 87,110 84,479 84,528 84,853 Diluted GAAP EPS 0.08$ 0.10$ $ 0.05 $ 0.10 $ 0.16 Diluted Adjusted EPS 0.15$ 0.19$ $ 0.14 $ 0.18 $ 0.24 Income tax related adjustments (2) Q3'16Q3'15 Q4'15 Q1'16 Q2'16

Enterprising healthcare