Attached files
| file | filename |
|---|---|
| 8-K - CURRENT REPORT OF MATERIAL EVENTS OR CORPORATE CHANGES - RACKSPACE HOSTING, INC. | a16-19796_18k.htm |
Exhibit 99.1
Lender Presentation October 13, 2016
Disclaimer ACCEPTANCE OF THIS PRESENTATION CONSTITUTES AN AGREEMENT TO BE BOUND BY THE TERMS OF THE “NOTICE TO AND UNDERTAKING BY RECIPIENT” AND THE “SPECIAL NOTICE REGARDING PUBLICLY AVAILABLE INFORMATION” CONTAINED IN THE CONFIDENTIAL INFORMATION MEMOMANDUM DATED OCTOBER 2016. PROSPECTIVE LENDERS SHOULD BASE THEIR EVALUATION OF THE COMPANY AND THEIR DECISION WHETHER OR NOT TO PARTICIPATE IN THE TRANSACTIONS DESCRIBED IN THIS PRESENTATION SOLELY BASED ON THE INFORMATION CONTAINED IN THIS PRESENTATION AND THE RELATED CONFIDENTIAL INFORMATION MEMORANDUM AND NOT BASED ON ANY INFORMATION INCLUDED IN RACKSPACE’S FILINGS WITH THE SECURITIES AND EXCHANGE COMMISSION. ALL INFORMATION CONTAINED IN THIS PRESENTATION THAT CONCERNS OR RELATES TO COST SAVINGS AND SYNERGIES, BUSINESS STRATEGIES, FINANCIAL POLICIES, AND FUTURE FINANCIALS RESULTS AND OTHER RELATED MATTERS WITH RESPECT TO THE COMPANY AND ITS SUBSIDIARIES RELATES TO MATTERS THAT ARE EXPECTED TO OCCUR ONLY AFTER THE CONSUMMATION OF THE ACQUISITION OF THE COMPANY BY APOLLO (AS SUCH TERM IS DEFINED HEREIN), REPRESENT THE VIEWS OF APOLLO AND DO NOT REPRESENT THE VIEWS OF THE COMPANY OR THE COMPANY’S CURRENT BOARD OF DIRECTORS. FORWARD LOOKING STATEMENTS THIS PRESENTATION CONTAINS STATEMENTS THAT CONSTITUTE FORWARD-LOOKING STATEMENTS THAT INVOLVE RISKS AND UNCERTAINTIES. THESE STATEMENTS INCLUDE DESCRIPTIONS WITH RESPECT TO THE CONSOLIDATED RESULTS OF OPERATIONS AND FINANCIAL CONDITION, FUTURE EVENTS AND PLANS REGARDING THE COMPANY, PROJECTED SYNERGIES RELATED TO THE ACQUISITION, AND THE SUCCESSFUL CONSUMMATION OF THE ACQUISITION. THESE STATEMENTS CAN BE RECOGNIZED BY THE USE OF WORDS SUCH AS “EXPECTS,” “PLANS,” “WILL,” “ESTIMATES,” “PROJECTS,” OR WORDS OF SIMILAR MEANING. SUCH FORWARD-LOOKING STATEMENTS ARE NOT GUARANTEES OF FUTURE PERFORMANCE AND ACTUAL RESULTS MAY DIFFER FROM THOSE IN THE FORWARD-LOOKING STATEMENTS AS A RESULT OF VARIOUS FACTORS AND ASSUMPTIONS. THESE STATEMENTS ARE SUBJECT TO RISKS, UNCERTAINTIES, CHANGES IN CIRCUMSTANCES, ASSUMPTIONS AND OTHER IMPORTANT FACTORS, MANY OF WHICH ARE OUTSIDE MANAGEMENT'S CONTROL THAT COULD CAUSE ACTUAL RESULTS TO DIFFER MATERIALLY FROM THE RESULTS DISCUSSED IN THE FORWARD-LOOKING STATEMENTS. YOU ARE CAUTIONED NOT TO PLACE UNDUE RELIANCE ON THESE FORWARD LOOKING STATEMENTS. THERE IS NO UNDERTAKING TO REVISE FORWARD-LOOKING STATEMENTS TO REFLECT FUTURE EVENTS OR CIRCUMSTANCES. NON-GAAP FINANCIAL MEASURES THIS PRESENTATION INCLUDES CERTAIN NON-GAAP FINANCIAL MEASURES, INCLUDING ADJUSTED EBITDA, PRO FORMA ADJUSTED EBITDA, FREE CASH FLOW AND ADJUSTED EBITDA - CAPEX. THESE NON-GAAP FINANCIAL MEASURES ARE NOT MEASURES OF FINANCIAL PERFORMANCE IN ACCORDANCE WITH GAAP AND MAY EXCLUDE ITEMS THAT ARE SIGNIFICANT IN UNDERSTANDING AND ASSESSING OUR FINANCIAL RESULTS. THEREFORE, THESE MEASURES SHOULD NOT BE CONSIDERED IN ISOLATION OR AS AN ALTERNATIVE OR SUPERIOR TO GAAP MEASURES. YOU SHOULD BE AWARE THAT OUR PRESENTATION OF THESE MEASURES MAY NOT BE COMPARABLE TO SIMILARLY-TITLED MEASURES USED BY OTHER COMPANIES. PLEASE SEE THE RECONCILIATIONS INCLUDED AT THE END OF THIS PRESENTATION. MARKET AND INDUSTRY DATA UNLESS OTHERWISE INDICATED, INFORMATION CONTAINED IN THIS PRESENTATION CONCERNING THE COMPANY’S INDUSTRY RANKING AND THE MARKETS IN WHICH THE COMPANY OPERATES, INCLUDING GENERAL EXPECTATIONS AND MARKET OPPORTUNITY, IS BASED ON INFORMATION FROM INDEPENDENT INDUSTRY ORGANIZATIONS AND OTHER THIRD-PARTY SOURCES (INCLUDING A THIRD-PARTY MARKET STUDY, INDUSTRY PUBLICATIONS, SURVEYS AND FORECASTS). THIRD PARTY INFORMATION HAS NOT BEEN INDEPENDENTLY VERIFIED AND IS INHERENTLY IMPRECISE. IN ADDITION, PROJECTIONS, ASSUMPTIONS AND ESTIMATES OF THE FUTURE PERFORMANCE OF THE INDUSTRY IN WHICH THE COMPANY OPERATES AND ITS FUTURE PERFORMANCE ARE NECESSARILY SUBJECT TO A HIGH DEGREE OF UNCERTAINTY AND RISK DUE TO A VARIETY OF FACTORS. THESE AND OTHER FACTORS COULD CAUSE RESULTS TO DIFFER MATERIALLY FROM THOSE EXPRESSED. THE STATEMENTS AND INFORMATION IN THIS PRESENTATION REGARDING COST SAVINGS AND SIMILAR INFORMATION RELATE TO THE COST SAVINGS AND SYNERGIES BEING TARGETED BY APOLLO (AS DEFINED HEREIN) FOLLOWING THE CONSUMMATION OF THE ACQUISITION OF THE COMPANY. SUCH STATEMENTS AND INFORMATION DO NOT RELATE TO THE COMPANY ON A STANDALONE BASIS PRIOR TO THE ACQUISITION.
Agenda & Presenters Transaction Overview Sponsor Overview and Investment Thesis Market & Company Overview Key Credit Highlights Historical Financial Performance Transaction Details Q&A Citi Aaron Sobel, Principal, Apollo Taylor Rhodes, CEO, Rackspace Taylor Rhodes, CEO, Rackspace Karl Pichler, CFO, Rackspace Karl Pichler, CFO, Rackspace Citi
Transaction Overview
Executive Summary On August 26, 2016, Inception Parent, Inc., an entity controlled by funds affiliated with or controlled by Apollo Global Management, LLC and its subsidiaries (“Apollo” or “Sponsor”), signed a definitive agreement to acquire (the “Acquisition”) Rackspace Hosting, Inc. (“Rackspace” or “the Company”) for $32.00 per share in cash1, representing a firm value of $4.4 billion. Upon completion of the Acquisition, Rackspace will become a privately held company Rackspace is a leading global multi-cloud solutions provider and generated LTM 6/30/16 revenue and PF Adj. EBITDA of $2.1 billion and $810 million2, respectively The Acquisition is expected to be financed as follows: $225 million, 5-year Senior Secured Revolving Credit Facility, undrawn at close $2,000 million, 7-year Senior Secured Term Loan B $1,200 million, 8-year Senior Unsecured Notes $1,258 million of new equity, provided by a syndicate led by Apollo in partnership with certain co-investors, including funds affiliated with Searchlight Capital Partners, L.P. (“Searchlight”) Pro forma for the transaction, net secured and net total leverage as of 6/30/16 is expected by Apollo to be 2.5x and 4.0x, respectively, based on LTM 6/30/16 PF Adj. EBITDA of $810 million2 The Acquisition is expected to close in Q4 2016, subject to receipt of Rackspace stockholder approval, regulatory approvals and other customary closing conditions 1. Without interest and less any applicable withholding taxes. 2. See Adj. EBITDA reconciliation on page 42.
Sources & Uses and Pro Forma Capitalization Sources & Uses ($mm) – As of 6/30/16 Pro Forma Capitalization ($mm) 6 Note: Certain numbers may not sum due to rounding. Represents expected amount invested by funds affiliated with or controlled by Apollo and certain co-investors, including Searchlight. Sponsor Equity is 28% of Total Sources of Funds when excluding Cash from Balance Sheet. Represents the estimated aggregate Merger Consideration payable to equity holders of Rackspace on the closing date of the Acquisition. In addition, a total of up to approximately $213 million will be payable under the Merger Agreement to certain holders of Rackspace stock-based awards following the closing of the Acquisition, subject to the continued employment of such holders or their experiencing a qualifying termination of employment, with up to approximately $103 million payable in 2017, up to approximately $80 million payable in 2018, and up to approximately $30 million payable in 2019. Represents the $500 million aggregate principal amount of Rackspace’s outstanding 6.500% Senior Notes due 2024 (the “6.500% Notes”) and an approximately $91 million “make-whole” redemption premium assuming the redemption occurred on June 30, 2016. Does not include approximately $19.5 million of accrued interest as of June 30, 2016 relating to the 6.500% Notes that was paid on July 15, 2016. The final redemption price will vary based on the date of redemption, the “make-whole” premium calculated under the indenture governing the 6.500% Notes based on the redemption date and accrued and unpaid interest on the 6.500% Notes to the date of redemption. Represents the estimated fees and expenses associated with the transactions, including financing fees, advisory fees and other transaction costs and professional fees. Pro forma for 9/30/16 cash balance of ~$632 million, post transaction total liquidity (cash and fully-funded revolver) is expected to be ~$423 million. See Adj. EBITDA reconciliation on page 42. 1 5 Pro forma 9/30/16 cash balance is ~$198 million5 6/30/2016A PF 6/30/2016A Amt. Out. x Cum. Mult. Trans. Adj. Amt. Out. x Cum. Mult. Cash and Cash Equivalents $544 ($434) $110 Revolving Credit Facility ($225mm) $0 0.0x $0 $0 0.0x Term Loan B 0 0.0 2,000 2,000 2.5 Capital Leases and Finance Lease Obligations 154 0.2 0 154 2.7 Total Senior Secured Debt $154 0.2x $2,154 2.7x Total Net Senior Secured Debt ($391) NM $2,043 2.5x Existing Senior 6.500% Notes $500 0.8x ($500) $0 2.7x Senior Unsecured Notes 0 0.8 1,200 1,200 4.1 Total Debt $654 0.8x $3,354 4.1x Total Net Debt $109 0.1x $3,243 4.0x LTM PF Adj. EBITDA $810 $810 Total Liquidity (Cash and Fully Funded Revolver) $335 Sources of Funds Amount % Term Loan B $2,000 41% Senior Unsecured Notes 1,200 25% Sponsor Equity 1,258 26% Cash from Balance Sheet 434 9% Total Sources of Funds $4,892 100% Uses of Funds Amount % Merger Consideration 2 $4,088 84% Redemption of Existing Senior 6.500% Notes 3 591 12% Transaction Fees and Expenses 4 214 4% Total Uses of Funds $4,892 100%
Sponsor Overview and Investment Thesis
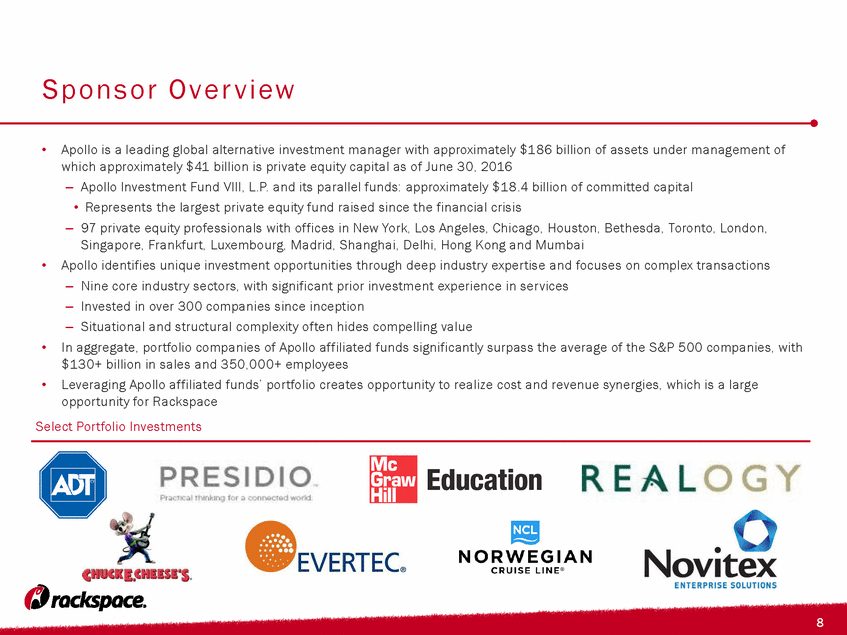
Sponsor Overview Apollo is a leading global alternative investment manager with approximately $186 billion of assets under management of which approximately $41 billion is private equity capital as of June 30, 2016 Apollo Investment Fund VIII, L.P. and its parallel funds: approximately $18.4 billion of committed capital Represents the largest private equity fund raised since the financial crisis 97 private equity professionals with offices in New York, Los Angeles, Chicago, Houston, Bethesda, Toronto, London, Singapore, Frankfurt, Luxembourg, Madrid, Shanghai, Delhi, Hong Kong and Mumbai Apollo identifies unique investment opportunities through deep industry expertise and focuses on complex transactions Nine core industry sectors, with significant prior investment experience in services Invested in over 300 companies since inception Situational and structural complexity often hides compelling value In aggregate, portfolio companies of Apollo affiliated funds significantly surpass the average of the S&P 500 companies, with $130+ billion in sales and 350,000+ employees Leveraging Apollo affiliated funds’ portfolio creates opportunity to realize cost and revenue synergies, which is a large opportunity for Rackspace Select Portfolio Investments
Sponsor Investment Thesis Leading Global Multi-Cloud Solutions Provider Strong Free Cash Flow Profile Robust Secular Tailwinds Operational Improvement Opportunity Market leader – Leading player in high growth markets, including the leading position in its core Single Tenant business (~9% market share), which generates ~90% of the Company’s FCF4 Unique offering and high-value proposition – One of the only multi-cloud providers offering a broad portfolio of data center services, which provides tremendous value to Fortune 2000 companies with limited in-house IT staff Leading customer service – Differentiates itself from peers by providing customers with “Fanatical Support” across all offerings Continued outsourcing of data centers leads to large opportunity ahead – Businesses outsource only 12%1 of their data center requirements today, which compares to 8%1 three years ago, and this is expected to grow to 21%1 by 2019 Growth in workloads – Over the past five years, workloads have grown at a 23%2 CAGR, which has further increased demand for outsourced data center services Shift towards multi-cloud – 75%3 of cloud users have adopted the multi-cloud model (e.g. combination of Single Tenant and Public Cloud), and Fortune 2000 companies continue to shift away from in-house IT, a trend Rackspace is best positioned to benefit from Growth on all platforms – Double-digit annual growth expected over the next couple of years in each market the Company serves, and the Company’s comprehensive product portfolio provide a natural hedge regardless of future data center outsourcing trends Inflection point – Well-positioned to capitalize on growth in cloud by offering management and support services across private and public cloud providers, such as AWS and Microsoft Strong and improving FCF margins – Opportunities for capex efficiencies, as business mix shifts towards capital-light Managed Cloud Services Strong Single Tenant business and limited dependency on Public Cloud Business –Single Tenant offering generates ~90% of FCF4 while Public Cloud offering generates only ~10%4 Flexible cost structure – 93% of cost is variable; disciplined resource allocation approach drives stable margins Material near-term cost savings – Identified significant potential cost savings that are targeted by Apollo to be realized, on a run-rate basis, within 12 months following closing Business development opportunities through new owners – Well-positioned to execute on new business development opportunities from the Apollo and Searchlight portfolio of companies Recurring Revenue Business Model Provides Material Downside Protection Recurring revenue – 99% monthly recurring revenues in Single Tenant offering (which generates ~90% of the Company’s FCF4) and positive installed base growth (i.e. same store growth) almost every quarter since going public Organic growth – EBITDA has increased ~155% in the past five years, and the Company has never experienced a year-over-year decline in revenue in its 17-year history Attractive unit economics and low churn – Average payback of 2-3 years relative to implied average customer life of ~6-8 years based on current churn of ~0.7% which is well below peers 1. Source: IDC. Based on square footage. 2. Source: Cisco Global Cloud Index. 3. Source: Rightscale. 4. FCF for 2015 defined as EBITDA – Capex. Strong Management Team and Culture that Drives Success Highly committed team – Team is passionate about the business and is committed to the next phase of the Company’s growth Corporate culture – Company employees (“Rackers”) are loyal and highly committed to company vision Decades of experience – Senior management team averages over 25 years of experience
Sponsor Market and Company Overview
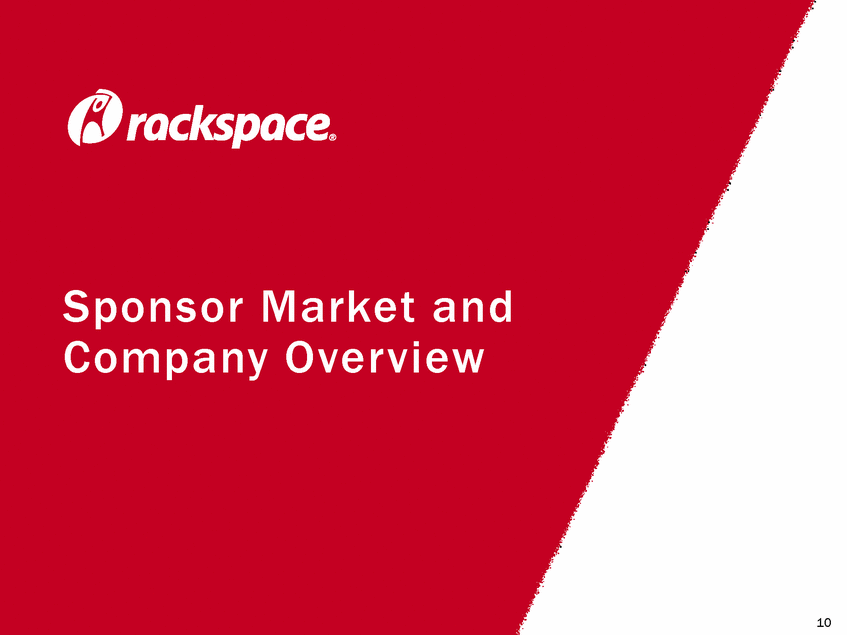
Post-Closing Value Proposition is Unique and Powerful Dedicated Hosting Managed Cloud Services Public Cloud Private Cloud Rackspace provides vendor agnostic, differentiated Fanatical Support across various platforms Comprehensive product set addresses every facet of data center outsourcing, providing Rackspace with a natural hedge regardless of future outsourcing trends Fanatical Support
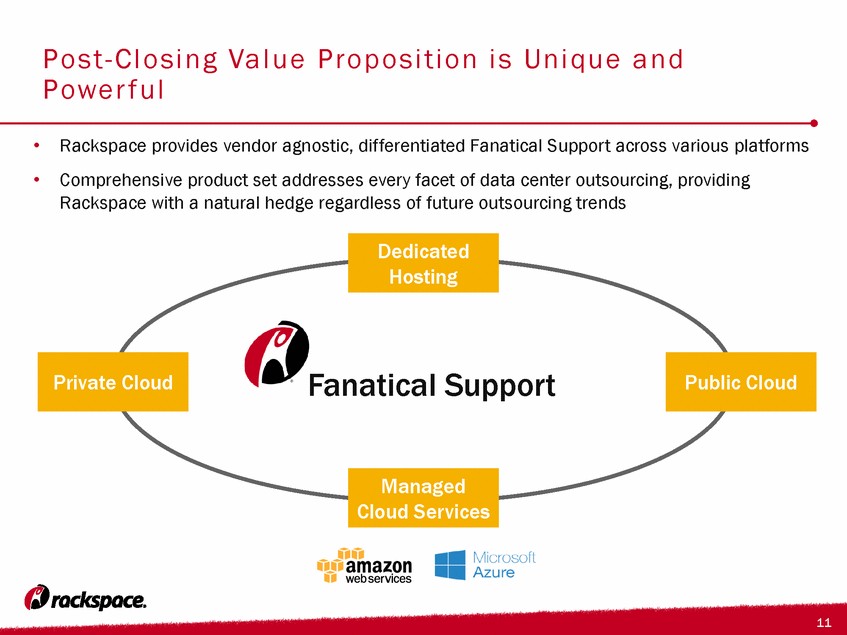
Large and Growing End Markets Across All of RAX’s Key Offerings $86bn Total Addressable Market Expected ’16 – ‘19 CAGR: 20% $31bn Expected ’16 – ‘19 CAGR: 12% Single Tenant (Dedicated Hosting & Private Cloud) Expected ’16 – ’19 CAGR: 26% Public Cloud $3bn Expected ’16 – ‘19 CAGR: 11% Cloud Office RAX Market Position Source: IDC, Radicati Cloud Business Email Market 2015, Third-party market study. Note: Market size refers to 2019 projected market size. 1. FCF for 2015 defined as EBITDA – Capex. #1 #4 #2 Single Tenant represents ~90% of RAX’s 2015 FCF1 Expected ’16 – ‘19 CAGR: 39% Managed Cloud Services Top 10 $3bn Public Cloud represents ~10% of RAX’s 2015 FCF1 Robust TAM growth driven by continued outsourcing and growth in complex and demanding workloads $50bn
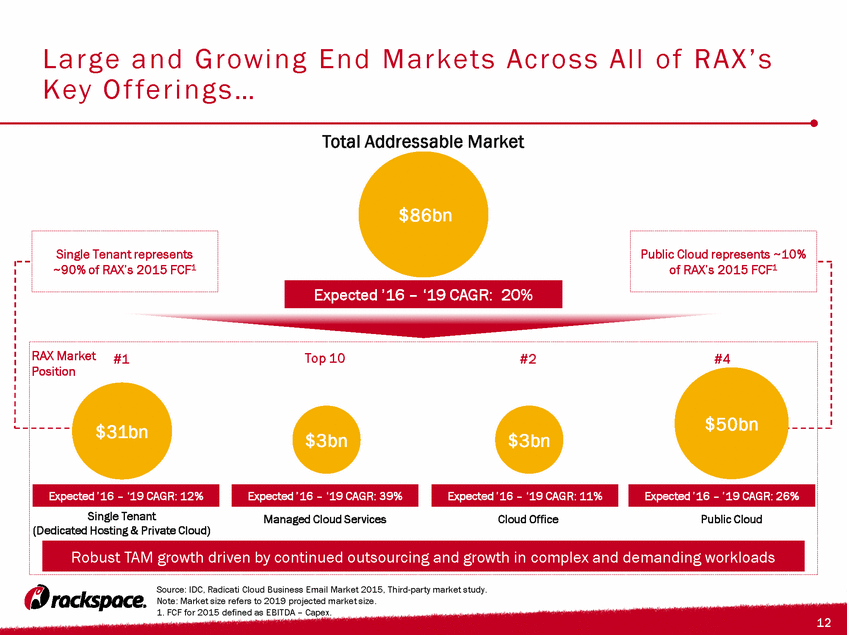
Driven by Workload Growth, Outsourcing and Move to Multi-cloud Model ’14-’19 CAGR: 20% CAGR (‘13–’16E) CAGR (’16-’19E) 21% 22% (1%) 3% ACCELERATED WORKLOAD GROWTH GLOBAL INSTALLED WORKLOADS (MILLIONS) CONTINUED OUTSOURCING OF DATA CENTERS Macro Trends: Adoption and proliferation of Big Data, Internet of Things, Machine Learning, Mobile and Social applications are driving growth in data and need for more IT infrastructure Increased Complexity: Workloads are increasingly complex, which means companies need a variety of outsourcing strategies to help them cope % Off- Premise Installed Data Center Capacity (MMSF) 8% 12% 21% Significant Economies of Scale: Real estate costs, cooling costs, utilization of computer equipment across companies, and shared service providers Risk Mitigation: Physical distance between company headquarters and data centers can reduce risk that a single event shuts down operations (e.g. blackout) Specialization: Outsourcing management of the data center can both be cheaper and more effective Flexibility: More flexibility to increase or decrease capacity with IT requirement Diverse IT Needs: Many customers have IT environments and applications that straddle multiple technology platforms Optimal Platform: Multi-cloud solution is the optimal solution for increasingly complex and varied workloads One-Stop Shop: Rackspace offers a convenient one-stop shop for multi-cloud customers TREND TOWARDS MULTI-CLOUD Bullet 5 Operational Expense vs. Capital Expense: Smaller operating expense with more modest IT staffing requirements (approx. 20-50% savings Public Cloud Managed Cloud Services Multi-Cloud Single Tenant Note: Single Tenant included Dedicated Hosting and Private Cloud. Source: IDC, Cisco Global Cloud Index, 2015. 130 162 194 233 277 320 2014 2015 2016 2017 2018 2019 0 500 1,000 1,500 2,000 2013 2016 2019 Off - Premise On - Premise
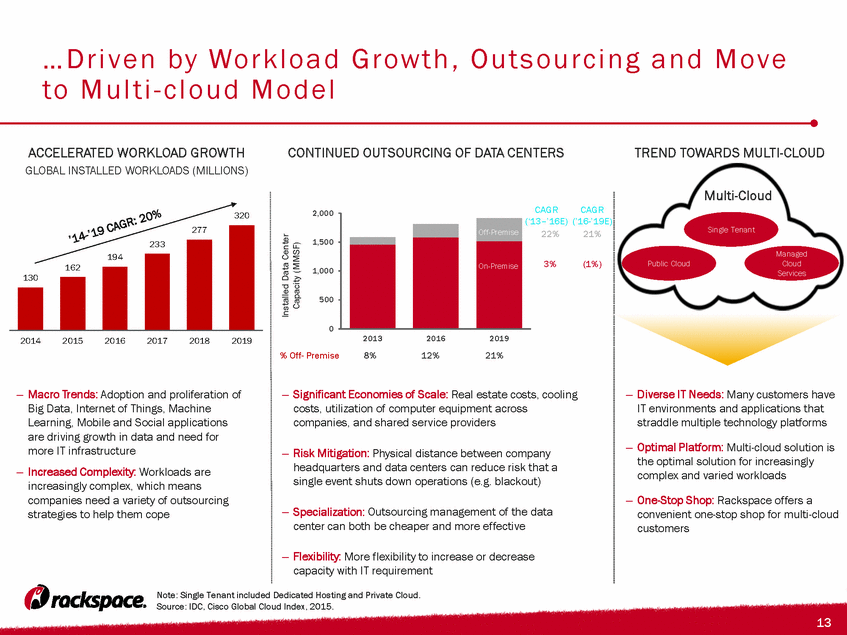
Companies are Seeking Multi-Cloud Support to Manage their Increasing Workloads Source: Lit. Search; third-party market study. 75% Multi-Cloud 19% Public Cloud Only 6% Private Cloud Only 75% of Cloud Users are Multi-Cloud Users Single Tenant (Dedicated Hosting and Private Cloud) Legacy workloads which are costly to move to the cloud, or new workloads requiring security / compliance, data control, customization and low latency Public Cloud Multi-Cloud (Typically employed strategy) Less “mission critical” workloads that require greater dynamism and scalability Combines a range of the above data center outsourcing solutions to match workloads with their optimal setting and provide support for legacy workloads, which are difficult or costly to move Optimal Platform Types of Workload Companies have a variety of increasingly complex workloads that need to sit on a range of platforms Only a multi-cloud solution can address limitations inherent in any one platform Managed Cloud Services Workloads that companies want to run on the Public Cloud but lack the in-house expertise to set-up and manage the environment Leveraging six clouds on average 6 3 3 3 Total Clouds Public Clouds Private Clouds
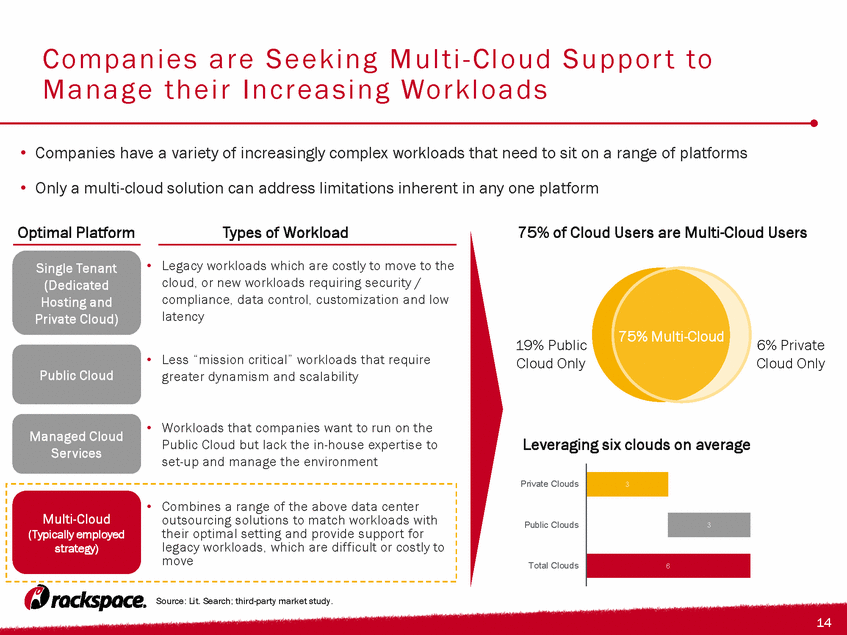
Single Tenant and Managed Cloud Services Provide Cost Effective Solutions for Different Types of Workloads MOST APPLICATIONS ARE SHIFTING TOWARDS OUTSOURCED DATA CENTERS Change in apps mix, businesses with Rackspace presence (’16–’19E, p.p) 2016 2019 Businesses with Rackspace workload Environment mix by application type (% of customers) 2016 2019 10% 16% 9% 16% 10% 9% 16% 14% 15% 14% 13% 15% 10% 17% 16% Business Intelligence Corporate Website Custom Web App Database/ Storage Developing/ Testing Email Finance Human Resources Office Suites Security Supply Chain Mgmt. Team Collab. Telephony ERP CRM Flat 100% utilization throughout WORKLOAD PROFILE DETERMINES OPTIMAL PLATFORM Single Tenant ~60% discount to Managed Cloud Services ~50% utilization all the time with minor fluctuations with potential for spike Neutral <30% utilization half the time and >70% utilization the other half of the time Managed Cloud Services ~15% discount to Single Tenant Source: Third-party market study. Workload Profile Best Value 0% 20% 40% 60% 80% 100% 1 3 5 7 9 11 13 15 17 19 21 23 25 27 29 31 33 35 37 39 41 43 Colocation / On-Premise Single Tenant Public Cloud 0% 50% 100% 1 24 Time of Day 0% 50% 100% 1 24 Time of Day 0% 50% 100% 1 24 Time of Day
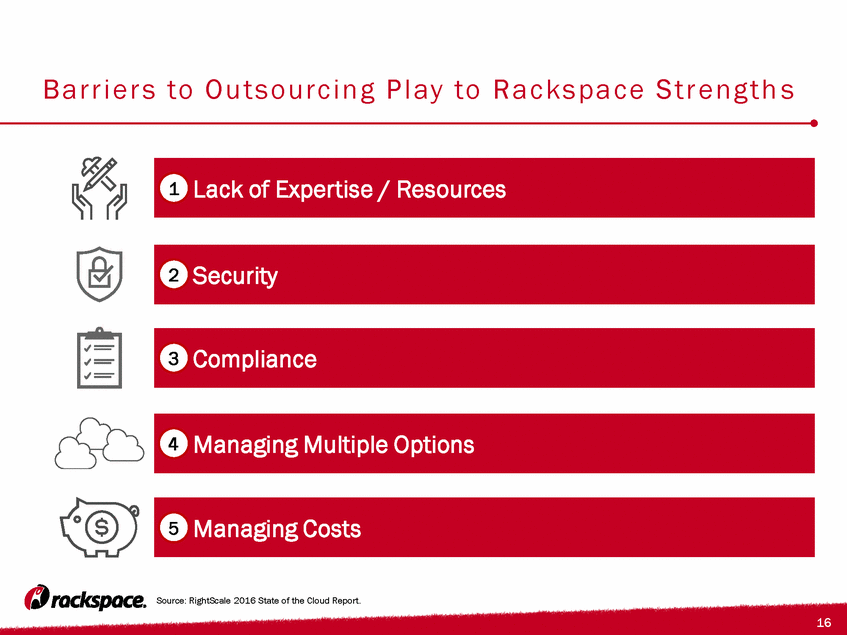
Barriers to Outsourcing Play to Rackspace Strengths Lack of Expertise / Resources 1 Security 2 Compliance 3 Managing Multiple Options 4 Managing Costs 5 Source: RightScale 2016 State of the Cloud Report.
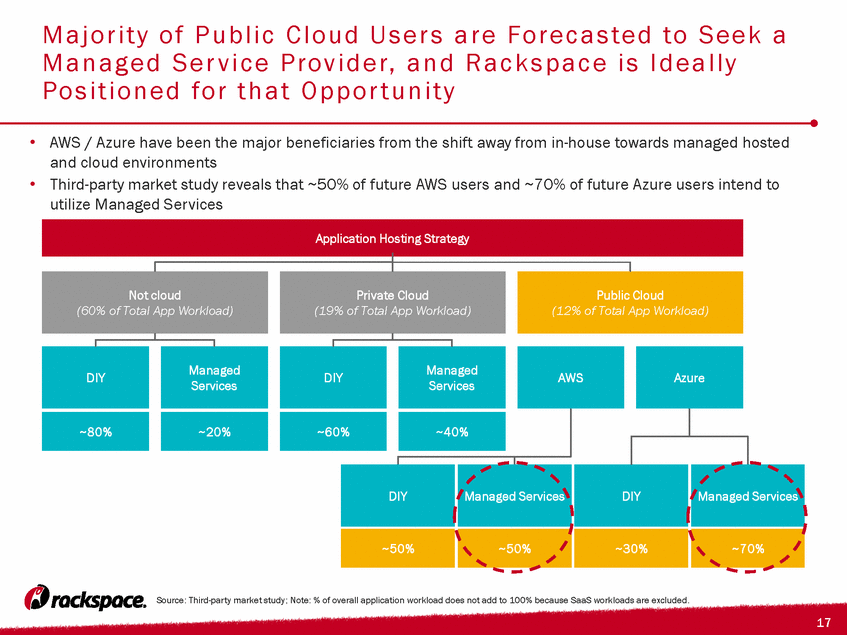
Majority of Public Cloud Users are Forecasted to Seek a Managed Service Provider, and Rackspace is Ideally Positioned for that Opportunity Source: Third-party market study; Note: % of overall application workload does not add to 100% because SaaS workloads are excluded. DIY Managed Services Application Hosting Strategy Not cloud (60% of Total App Workload) Private Cloud (19% of Total App Workload) Public Cloud (12% of Total App Workload) DIY Managed Services DIY Managed Services AWS Azure ~80% ~20% ~60% ~40% ~50% ~50% ~30% ~70% AWS / Azure have been the major beneficiaries from the shift away from in-house towards managed hosted and cloud environments Third-party market study reveals that ~50% of future AWS users and ~70% of future Azure users intend to utilize Managed Services DIY Managed Services Managed Services
Key Credit Highlights Post-Closing
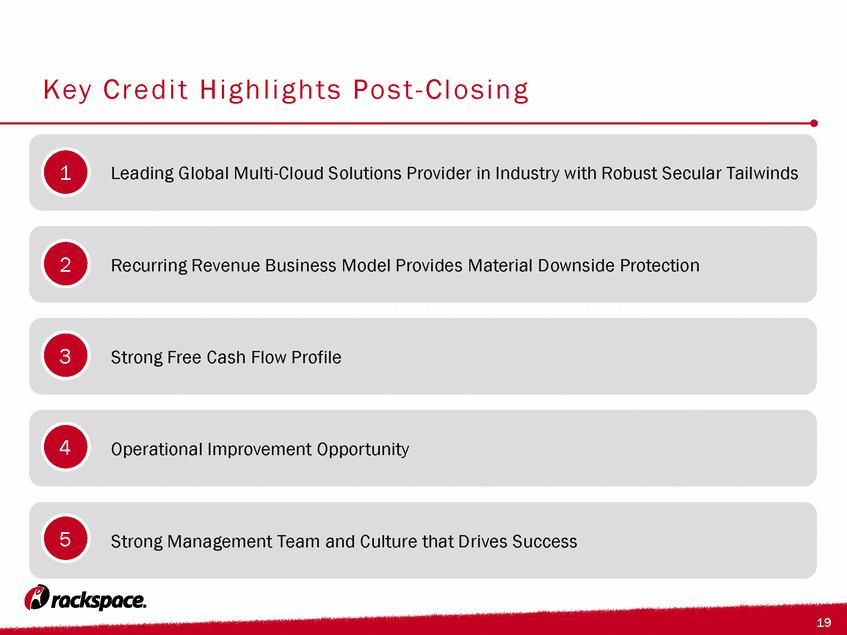
Leading Global Multi-Cloud Solutions Provider in Industry with Robust Secular Tailwinds Operational Improvement Opportunity Strong Free Cash Flow Profile Strong Management Team and Culture that Drives Success Key Credit Highlights Post-Closing 1 3 4 5 Recurring Revenue Business Model Provides Material Downside Protection 2
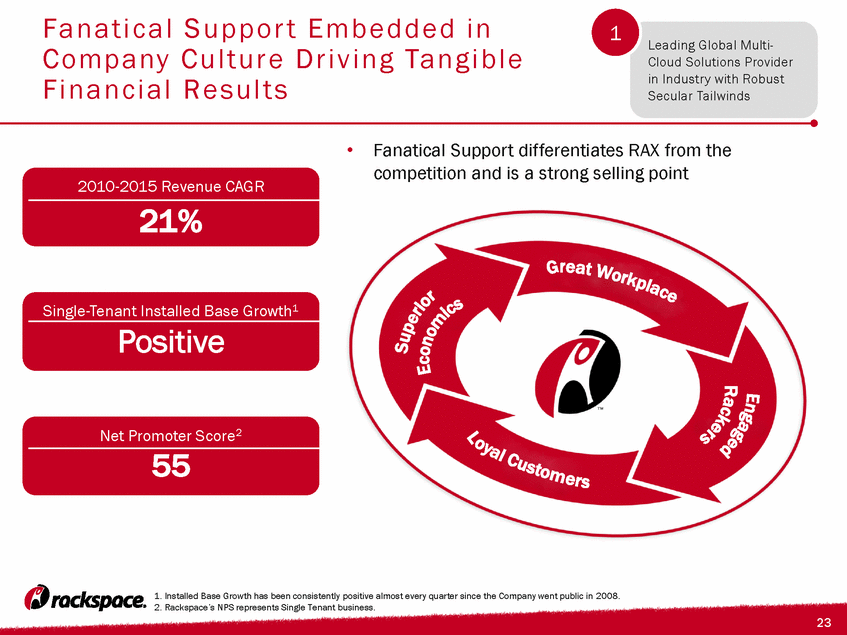
Market Leadership through Diversified Business Model Serving Fast Growing End Markets Single Tenant – 72% of Revenue, 79% of EBITDA, 90% of FCF1 Single Tenant includes Dedicated Hosting and Private Cloud Provides dedicated servers and storage space to a single customer Monthly subscription model for servers and Fanatical Support Serves customers who need an IT staff as well as server capacity Optimal format for workloads which require high levels of security / compliance, or for workloads with consistently high utilization Managed Cloud Services – 0% of Revenue, (1)% of EBITDA, (4)% of FCF1 Resells AWS or Microsoft Azure infrastructure and provides managed services on top of it Serves customers who want to run workloads on the Public Cloud but do not have the skillset in-house to set-up and manage the environment Cloud Office – 5% of Revenue, 3% of EBITDA, 4% of FCF1 Provides management of applications for email, Office 365 (Microsoft), and collaboration tools (i.e. SharePoint) Monthly subscription model with tiered pricing levels based on users Top 2 player with 6% market share Serves customers who want to use email, Office 365, and collaboration tools but do not have the resources in-house to set-up and manage these applications Public Cloud – 23% of Revenue, 19% of EBITDA, 10% of FCF1 Provides shared servers and server space allocated across multiple customers on an as-needed basis Cloud contracts are generally a pay-as-you-go model Serves customers who want to buy infrastructure as a service and require server capacity with variable usage; Rackspace’s Public Cloud is based on OpenStack technology and appeals to customers who prefer open-source technology Optimal format for workloads which have low security requirements and variable utilization Rackspace Serves Every Facet of Outsourced Data Centers as the Leader, All of which are Experiencing Extraordinary Growth and Provide Natural Hedge RAX’S MARKET SHARE IN DEDICATED HOSTING HAS BEEN GROWING TAM $13B $13B $14B $15B Source: IDC; Radicati Group; Company Financials; Third-party market study. Note: Growth rates are for TAMs. EBITDA and FCF percentages calculated by allocating shared infrastructure and corporate resources. FCF defined as EBITDA – Capex. All data relate to FY2015. Growth Opportunity Core Business Other Leading Global Multi-Cloud Solutions Provider in Industry with Robust Secular Tailwinds 1 RAX is #1 Player #1 Top 10 #2 # 4 HISTORICAL AND PROJECTED TAM GROWTH Market Position Core Business: Recurring, Steady Cash Flow Single Tenant TAM growth driven by stable, complex workloads that are not suited for public cloud environments $31bn $3bn $3bn #1 Market Position Historical ’14-’16 growth: 13% Expected ’16-’19 growth: 12% Top 10 Market Position Historical ’14-’16 growth: 58% Expected ’16-’19 growth: 39% #2 Market Position Historical ’14-’16 growth: 12% Expected ’16-’19 growth: 11% #4 Market Position Historical ’14-’16 growth: 32% Expected ’16-’19 growth: 26% Total Addressable Market (In 2019) $50bn
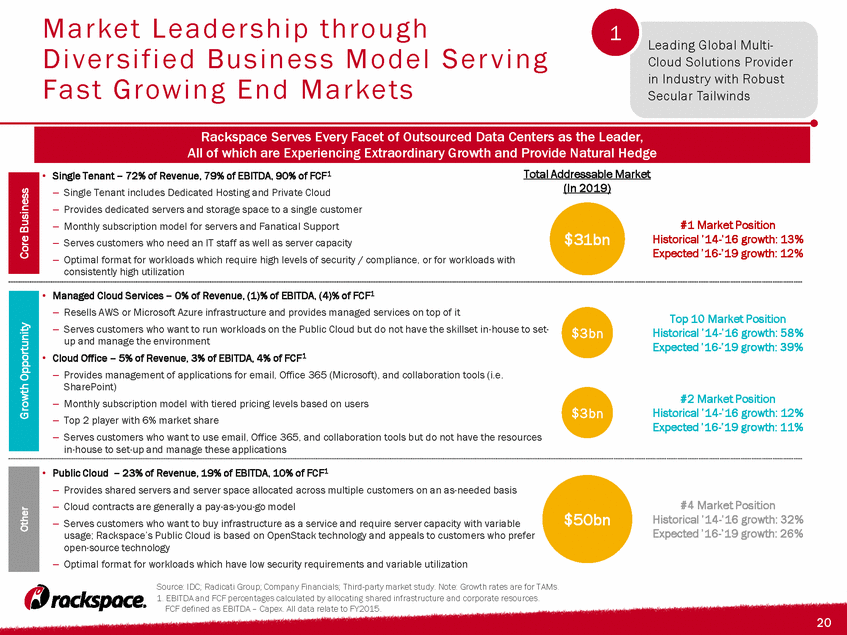
Exiting Cloud Providers Tech Providers, TelCos and Niche Players TelCos No Competitor Offers an Equivalent Customer Value Proposition Recognized Specialist Software DNA Vendor Neutral Multi-Cloud Service Expertise Leading Global Multi-Cloud Solutions Provider in Industry with Robust Secular Tailwinds 1
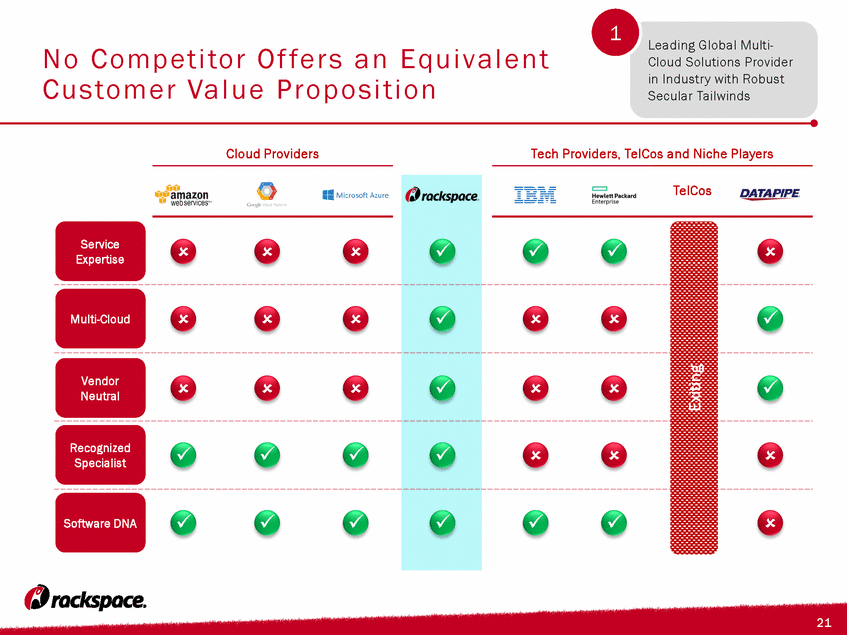
Industry Leadership Based on Operational Excellence “Gartner clients consistently report high levels of satisfaction with Rackspace and customer loyalty is strong”1 “Rackspace is willing to adopt its business models as market demands change”1 Ability to Execute Completeness of Vision Partners Customers Employees Leaders Visionaries Niche Players Challengers Datapipe Rackspace Verizon Century Link AT&T IBM Dimension Data Virtustream CSC Sunguard Availability Services Internap Cloud-Enabled Dedicated Hosting, North America (July 2015)1 Recent Accolades Leading Global Multi-Cloud Solutions Provider in Industry with Robust Secular Tailwinds 1 1. Source: Gartner.
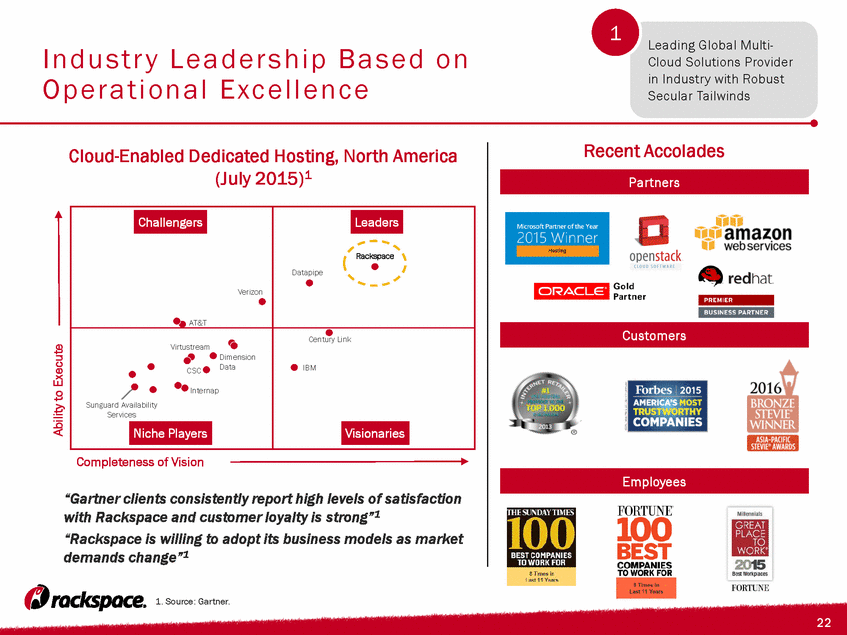
Fanatical Support Embedded in Company Culture Driving Tangible Financial Results 2010-2015 Revenue CAGR 21% Single-Tenant Installed Base Growth1 Positive Net Promoter Score2 55 Leading Global Multi-Cloud Solutions Provider in Industry with Robust Secular Tailwinds 1 Great Workplace Engaged Rackers Happy Customers Superior Economics Great Workplace Engaged Rackers Loyal Customers Superior Economics Fanatical Support differentiates RAX from the competition and is a strong selling point 1. Installed Base Growth has been consistently positive almost every quarter since the Company went public in 2008. 2. Rackspace’s NPS represents Single Tenant business.
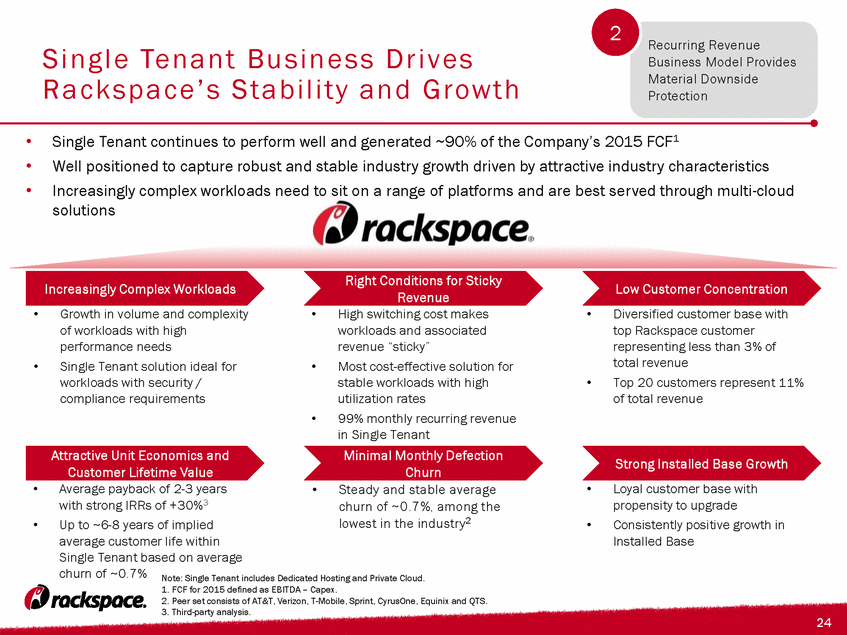
Single Tenant Business Drives Rackspace’s Stability and Growth Note: Single Tenant includes Dedicated Hosting and Private Cloud. FCF for 2015 defined as EBITDA – Capex. Peer set consists of AT&T, Verizon, T-Mobile, Sprint, CyrusOne, Equinix and QTS. Third-party analysis. Increasingly Complex Workloads Single Tenant continues to perform well and generated ~90% of the Company’s 2015 FCF1 Well positioned to capture robust and stable industry growth driven by attractive industry characteristics Increasingly complex workloads need to sit on a range of platforms and are best served through multi-cloud solutions Low Customer Concentration Attractive Unit Economics and Customer Lifetime Value Strong Installed Base Growth Minimal Monthly Defection Churn Right Conditions for Sticky Revenue Growth in volume and complexity of workloads with high performance needs Single Tenant solution ideal for workloads with security / compliance requirements High switching cost makes workloads and associated revenue “sticky” Most cost-effective solution for stable workloads with high utilization rates 99% monthly recurring revenue in Single Tenant Diversified customer base with top Rackspace customer representing less than 3% of total revenue Top 20 customers represent 11% of total revenue Steady and stable average churn of ~0.7%, among the lowest in the industry2 Average payback of 2-3 years with strong IRRs of +30%3 Up to ~6-8 years of implied average customer life within Single Tenant based on average churn of ~0.7% Loyal customer base with propensity to upgrade Consistently positive growth in Installed Base Recurring Revenue Business Model Provides Material Downside Protection 2
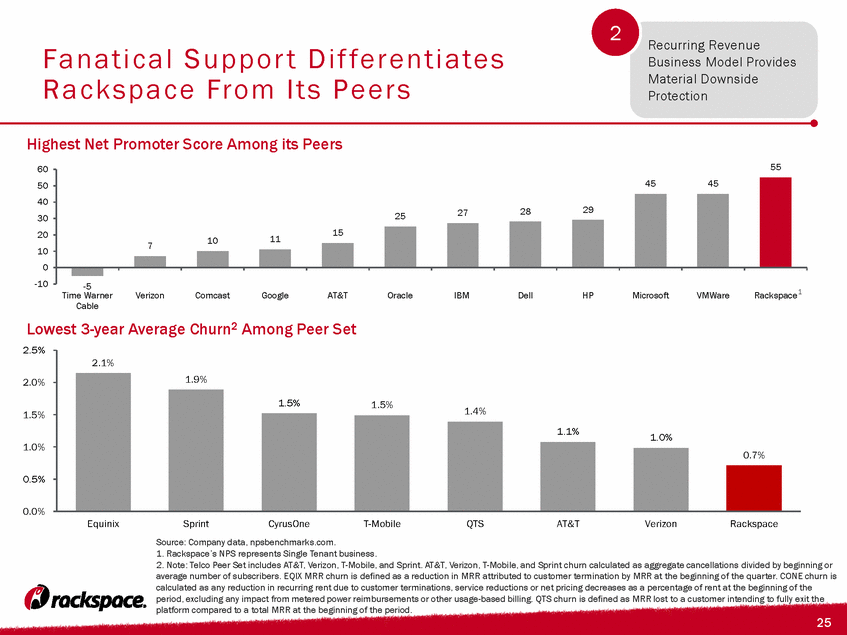
Fanatical Support Differentiates Rackspace From Its Peers Recurring Revenue Business Model Provides Material Downside Protection 2 Highest Net Promoter Score Among its Peers Lowest 3-year Average Churn2 Among Peer Set Source: Company data, npsbenchmarks.com. 1. Rackspace’s NPS represents Single Tenant business. 2. Note: Telco Peer Set includes AT&T, Verizon, T-Mobile, and Sprint. AT&T, Verizon, T-Mobile, and Sprint churn calculated as aggregate cancellations divided by beginning or average number of subscribers. EQIX MRR churn is defined as a reduction in MRR attributed to customer termination by MRR at the beginning of the quarter. CONE churn is calculated as any reduction in recurring rent due to customer terminations, service reductions or net pricing decreases as a percentage of rent at the beginning of the period, excluding any impact from metered power reimbursements or other usage-based billing. QTS churn is defined as MRR lost to a customer intending to fully exit the platform compared to a total MRR at the beginning of the period. 1 - 5 7 10 11 15 25 27 28 29 45 45 55 -10 0 10 20 30 40 50 60 Time Warner Cable Verizon Comcast Google AT&T Oracle IBM Dell HP Microsoft VMWare Rackspace 2.1% 1.9% 1.5% 1.5% 1.4% 1.1% 1.0% 0.7% 0.0% 0.5% 1.0% 1.5% 2.0% 2.5% Equinix Sprint CyrusOne T-Mobile QTS AT&T Verizon Rackspace
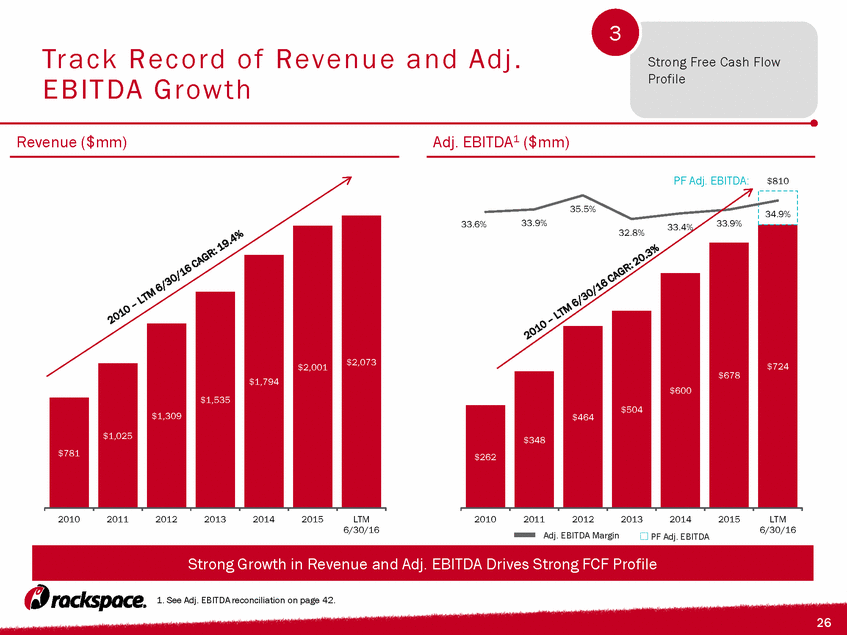
Track Record of Revenue and Adj. EBITDA Growth Adj. EBITDA1 ($mm) 2010 – LTM 6/30/16 CAGR: 19.4% 2010 – LTM 6/30/16 CAGR: 20.3% PF Adj. EBITDA PF Adj. EBITDA: 1. See Adj. EBITDA reconciliation on page 42. Revenue ($mm) Strong Free Cash Flow Profile 3 Adj. EBITDA Margin Strong Growth in Revenue and Adj. EBITDA Drives Strong FCF Profile $262 $348 $464 $504 $600 $678 $724 $810 33.6% 33.9% 35.5% 32.8% 33.4% 33.9% 34.9% 2010 2011 2012 2013 2014 2015 LTM 6/30/16 $781 $1,025 $1,309 $1,535 $1,794 $2,001 $2,073 2010 2011 2012 2013 2014 2015 LTM 6/30/16
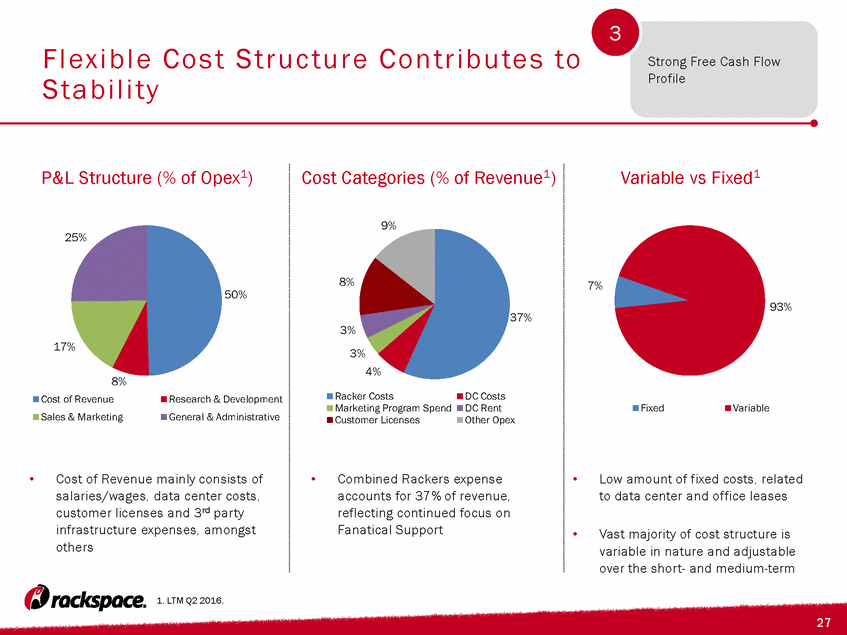
Strong Free Cash Flow Profile Flexible Cost Structure Contributes to Stability 3 1. LTM Q2 2016. P&L Structure (% of Opex1) Cost Categories (% of Revenue1) Variable vs Fixed1 Cost of Revenue mainly consists of salaries/wages, data center costs, customer licenses and 3rd party infrastructure expenses, amongst others Combined Rackers expense accounts for 37% of revenue, reflecting continued focus on Fanatical Support Low amount of fixed costs, related to data center and office leases Vast majority of cost structure is variable in nature and adjustable over the short- and medium-term 37% 4% 3% 3% 8% 9% Racker Costs DC Costs Marketing Program Spend DC Rent Customer Licenses Other Opex 50% 8% 17% 25% Cost of Revenue Research & Development Sales & Marketing General & Administrative 7% 93% Fixed Variable
Strong Free Cash Flow Profile Business Model Evolution Leads to High FCF Generation 3 Lower capex intensity driven by reduced growth capex requirements and further reduced by shift to Managed Cloud Services Q2 2016 Adj. EBITDA1 - Capex margin of 20.1% Significant Growth in Adj. EBITDA1 - Capex Operating Cash Flow “No-growth FCF” Maint. Capex RAX FCF Growth Capex Success-based Capex ($mm) The business continues to focus on generating higher Adj. EBITDA1 - Capex margins as the business mix shifts more towards Managed Cloud Services, which has lower capital intensity 1. See Adj. EBITDA reconciliation on page 42. $31 $165 $212 $339 $504 $600 $678 $724 2.0% 9.2% 10.6% 16.3% 0% 5% 10% 15% 20% $0 $200 $400 $600 $800 2013 2014 2015 LTM 6/30/16 Adj. EBITDA - Capex CAPEX Adj. EBITDA - Capex Margin Adj. EBITDA
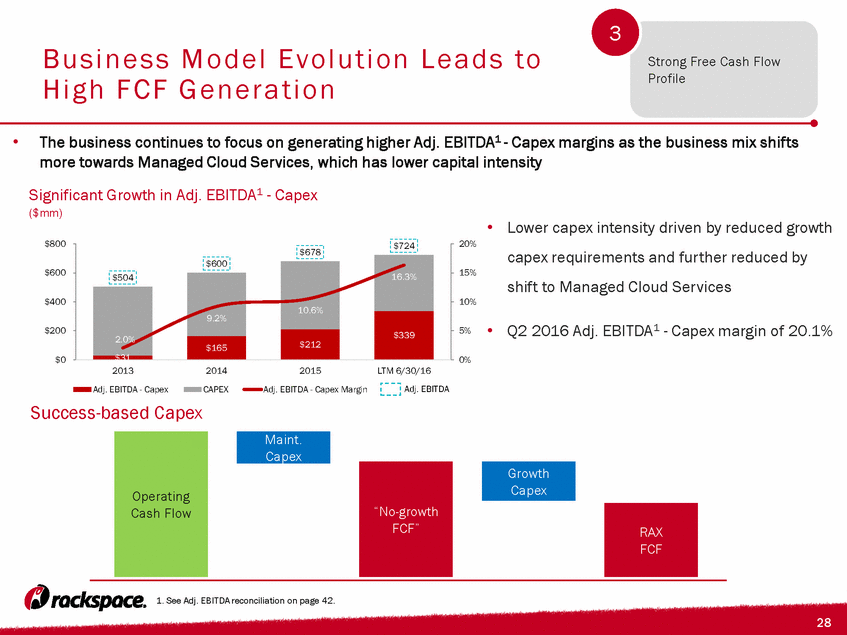
Sponsor Cost Savings Approach and Opportunity Operational Improvement Opportunity 4 Near-Term, Run-Rate Opex Cost Savings Breakdown Apollo Targeting $100+ Million of Identified Run-Rate Cost Savings Expected in the First 12 Months after Closing and Incremental Opportunities Thereafter Cost savings opportunities identified by Apollo through a detailed analysis of cost structure ($ in millions) THE INFORMATION ABOVE REGARDING COST SAVINGS AND SIMILAR INFORMATION ELSEWHERE IN THIS PRESENTATION RELATE TO THE COST SAVINGS AND SYNERGIES BEING TARGETED BY APOLLO FOLLOWING THE CONSUMMATION OF THE ACQUISITION OF THE COMPANY. THE ESTIMATES AND FORWARD-LOOKING STATEMENTS ARE NECESSARILY SPECULATIVE IN NATURE AND IT CAN BE EXPECTED THAT SOME OR ALL OF THE ASSUMPTIONS RELATING TO SUCH INFORMATION MAY NOT MATERIALIZE OR WILL VARY SIGNIFICANTLY FROM ACTUAL RESULTS. AS A RESULT, THERE IS NO ASSURANCE THAT THE COST SAVINGS WILL BE REALIZED. WE UNDERTAKE NO OBLIGATION TO UPDATE PUBLICLY ANY INFORMATION RELATING TO COST SAVINGS OR OTHER FORWARD-LOOKING STATEMENT FOR ANY REASON AFTER THE DATE OF THIS DOCUMENT TO CONFORM THESE STATEMENTS TO ACTUAL RESULTS OR TO CHANGES TO OUR EXPECTATIONS. Rationalization of maintenance contracts on non-standard hardware De-prioritization of low priority software and internal IT projects Fees /equity and legal counsel for Board of Directors, and other compliance costs Group purchasing of healthcare costs Representative Example Vast majority of opportunity Reduction of 3rd party spend Consolidation of IT infrastructure, facilities and other OpEx Public to private savings Apollo portfolio synergies Opportunity 1 2 3 4 $100 Targeted Cost Savings
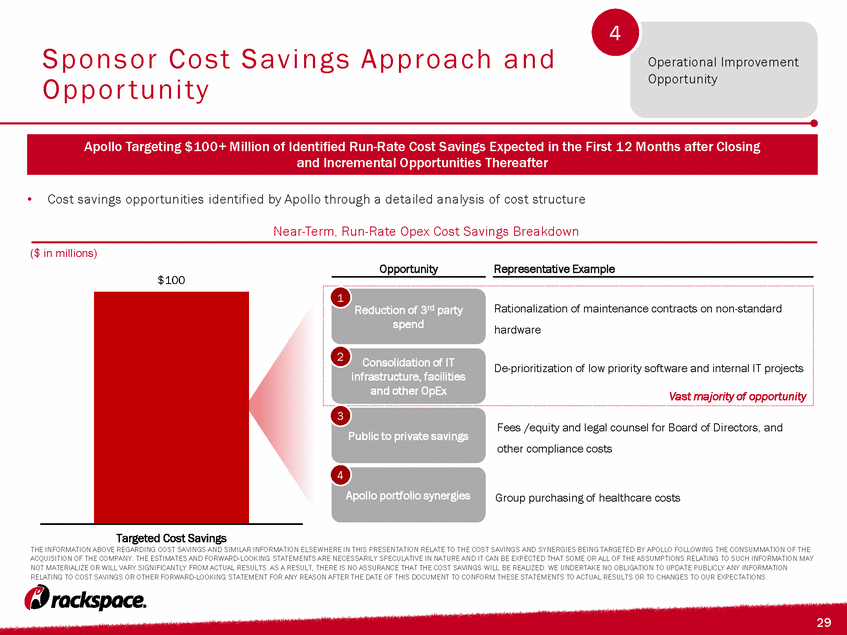
Deep Management Bench with History of Success Taylor Rhodes President and CEO Karl Pichler SVP, Chief Financial Officer & Treasurer Mark Roenigk Chief Operating Officer Scott Crenshaw SVP, Strategy & Product Alex Pinchev EVP, President of Global Sales and Marketing Industry Experience (Years) 30 41 29 Industry Experience (Years) 17 15 38 Strong Management and Culture that Drives Success 5 Joseph Saporito Chief Accounting Officer
Historical Financial Performance
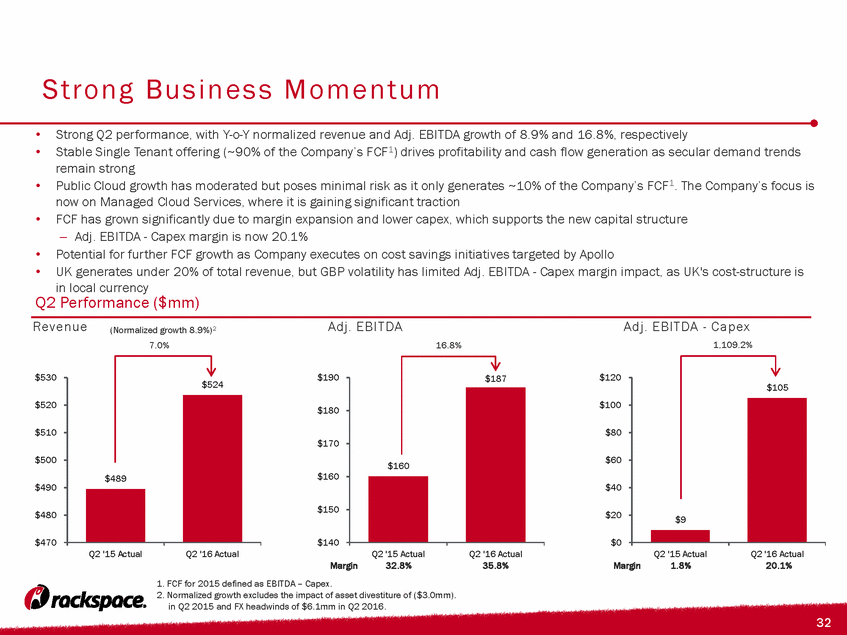
Strong Business Momentum Revenue Q2 Performance ($mm) Adj. EBITDA Adj. EBITDA - Capex Strong Q2 performance, with Y-o-Y normalized revenue and Adj. EBITDA growth of 8.9% and 16.8%, respectively Stable Single Tenant offering (~90% of the Company’s FCF1) drives profitability and cash flow generation as secular demand trends remain strong Public Cloud growth has moderated but poses minimal risk as it only generates ~10% of the Company’s FCF1. The Company’s focus is now on Managed Cloud Services, where it is gaining significant traction FCF has grown significantly due to margin expansion and lower capex, which supports the new capital structure Adj. EBITDA - Capex margin is now 20.1% Potential for further FCF growth as Company executes on cost savings initiatives targeted by Apollo UK generates under 20% of total revenue, but GBP volatility has limited Adj. EBITDA - Capex margin impact, as UK's cost-structure is in local currency 35.8% 32.8% Margin 1.8% 20.1% Margin 7.0% 16.8% 1,109.2% (Normalized growth 8.9%)2 1. FCF for 2015 defined as EBITDA – Capex. 2. Normalized growth excludes the impact of asset divestiture of ($3.0mm). in Q2 2015 and FX headwinds of $6.1mm in Q2 2016. $160 $187 $140 $150 $160 $170 $180 $190 Q2 '15 Actual Q2 '16 Actual $9 $105 $0 $20 $40 $60 $80 $100 $120 Q2 '15 Actual Q2 '16 Actual $489 $524 $470 $480 $490 $500 $510 $520 $530 Q2 '15 Actual Q2 '16 Actual
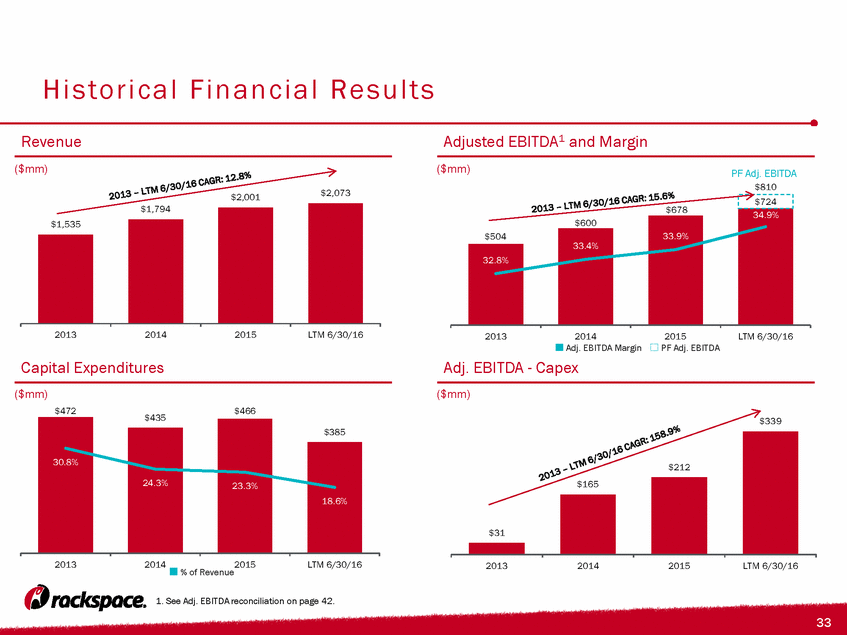
Historical Financial Results Adjusted EBITDA1 and Margin Capital Expenditures Adj. EBITDA - Capex Revenue 1. See Adj. EBITDA reconciliation on page 42. ($mm) Adj. EBITDA Margin PF Adj. EBITDA % of Revenue ($mm) ($mm) ($mm) 2013 – LTM 6/30/16 CAGR: 12.8% 2013 – LTM 6/30/16 CAGR: 15.6% PF Adj. EBITDA 2013 – LTM 6/30/16 CAGR: 158.9% $504 $600 $678 $724 $810 32.8% 33.4% 33.9% 34.9% 2013 2014 2015 LTM 6/30/16 $31 $165 $212 $339 2013 2014 2015 LTM 6/30/16 $472 $435 $466 $385 30.8% 24.3% 23.3% 18.6% 2013 2014 2015 LTM 6/30/16 $1,535 $1,794 $2,001 $2,073 2013 2014 2015 LTM 6/30/16
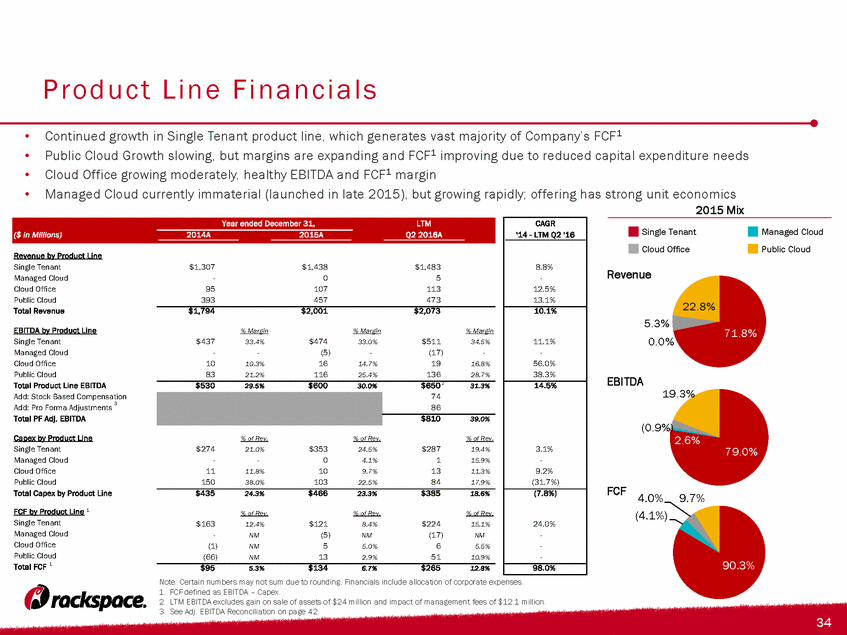
Product Line Financials Continued growth in Single Tenant product line, which generates vast majority of Company’s FCF1 Public Cloud Growth slowing, but margins are expanding and FCF1 improving due to reduced capital expenditure needs Cloud Office growing moderately, healthy EBITDA and FCF1 margin Managed Cloud currently immaterial (launched in late 2015), but growing rapidly; offering has strong unit economics 2015 Mix Single Tenant Managed Cloud Public Cloud Cloud Office Revenue EBITDA FCF Note: Certain numbers may not sum due to rounding. Financials include allocation of corporate expenses. FCF defined as EBITDA – Capex. LTM EBITDA excludes gain on sale of assets of $24 million and impact of management fees of $12.1 million. See Adj. EBITDA Reconciliation on page 42. 71.8% 0.0% 5.3% 22.8% 90.3% (4.1%) 4.0% 9.7% 79.0% (0.9%) 2.6% 19.3% Year ended December 31, LTM CAGR ($ in Millions) 2014A 2015A Q2 2016A '14 - LTM Q2 '16 Revenue by Product Line Single Tenant $1,307 $1,438 $1,483 8.8% Managed Cloud - 0 5 - Cloud Office 95 107 113 12.5% Public Cloud 393 457 473 13.1% Total Revenue $1,794 $2,001 $2,073 10.1% EBITDA by Product Line % Margin % Margin % Margin Single Tenant $437 33.4% $474 33.0% $511 34.5% 11.1% Managed Cloud - - (5) - (17) - - Cloud Office 10 10.3% 16 14.7% 19 16.8% 56.0% Public Cloud 83 21.2% 116 25.4% 136 28.7% 38.3% Total Product Line EBITDA $530 29.5% $600 30.0% $650 31.3% 14.5% Add: Stock Based Compensation 74 Add: Pro Forma Adjustments 86 Total PF Adj. EBITDA $810 39.0% Capex by Product Line % of Rev. % of Rev. % of Rev. Single Tenant $274 21.0% $353 24.5% $287 19.4% 3.1% Managed Cloud - - 0 4.1% 1 15.9% - Cloud Office 11 11.8% 10 9.7% 13 11.3% 9.2% Public Cloud 150 38.0% 103 22.5% 84 17.9% (31.7%) Total Capex by Product Line $435 24.3% $466 23.3% $385 18.6% (7.8%) FCF by Product Line % of Rev. % of Rev. % of Rev. Single Tenant $163 12.4% $121 8.4% $224 15.1% 24.0% Managed Cloud - NM (5) NM (17) NM - Cloud Office (1) NM 5 5.0% 6 5.5% - Public Cloud (66) NM 13 2.9% 51 10.9% - Total FCF $95 5.3% $134 6.7% $265 12.8% 98.0% 2 1 1 3
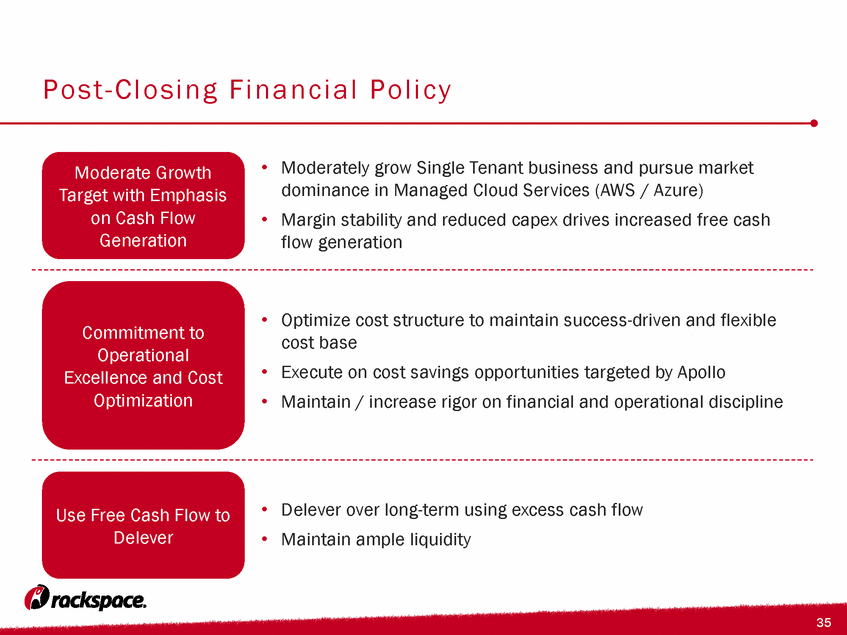
Post-Closing Financial Policy Moderately grow Single Tenant business and pursue market dominance in Managed Cloud Services (AWS / Azure) Margin stability and reduced capex drives increased free cash flow generation Commitment to Operational Excellence and Cost Optimization Moderate Growth Target with Emphasis on Cash Flow Generation Use Free Cash Flow to Delever Optimize cost structure to maintain success-driven and flexible cost base Execute on cost savings opportunities targeted by Apollo Maintain / increase rigor on financial and operational discipline Delever over long-term using excess cash flow Maintain ample liquidity
Transaction Details
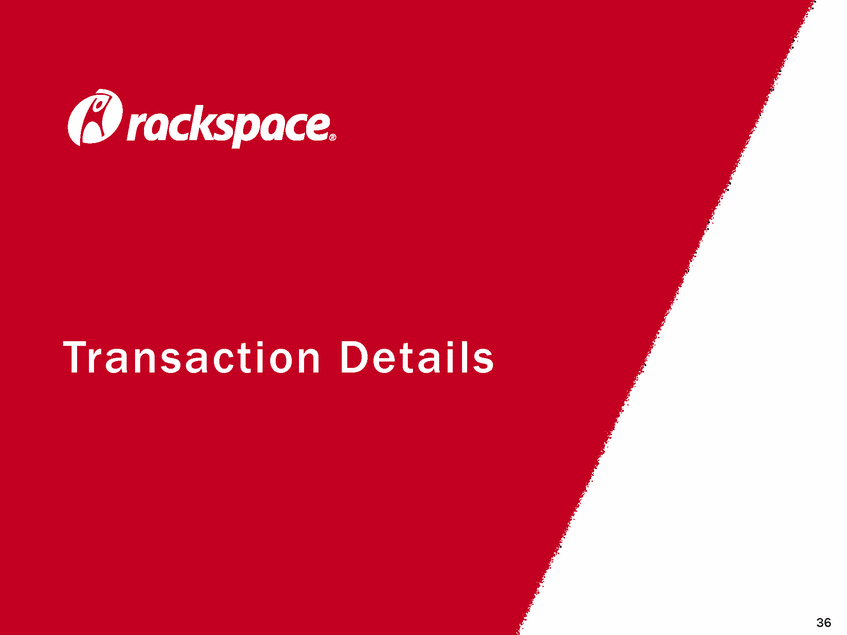
Summary of Terms: Senior Secured Credit Facility Borrower: Prior to the merger, Inception Merger Sub, Inc., and thereafter, Rackspace Hosting, Inc. Facilities: $225 million Senior Secured Revolving Credit Facility (“RCF”) $2,000 million Senior Secured Term Loan B (“TLB”) Guarantors: Inception Parent, Inc. (“Holdings”) and substantially all existing and future, direct or indirect, wholly-owned domestic subsidiaries of the Borrower, subject to certain exceptions Security: A perfected first-priority lien on (i) the equity interests of the Borrower held by Holdings and (ii) substantially all material owned assets of the Borrower and Subsidiary Guarantors, including the equity interests held by the Borrower or Subsidiary Guarantors (subject to customary 65 % voting stock limits for first-tier foreign subsidiaries) Incremental Facilities: Not to exceed the sum of (i) $700 million, plus (ii) additional debt so long as in pro forma compliance with (1) if pari debt, closing date Net First Lien Leverage Ratio and (2) if junior debt, 0.50x greater than closing date Net Secured Leverage Ratio, subject to 50 bps MFN for pari term loan debt with 12 month sunset Tenor: RCF: 5 years TLB: 7 years Amortization: RCF: N/A TLB: 1% per annum, payable quarterly Call Protection: RCF: None TLB: 101 soft call for 6 months Mandatory Prepayments: 50% of excess cash flow (subject to leverage-based step-downs to 25% and 0% at 0.75x and 1.25x, respectively, inside closing date Net First Lien Leverage) 100% of asset sale proceeds in excess of threshold amount (subject to reinvestment rights and leverage-based step downs to 50% and 0% at 0.75x and 1.25x, respectively, inside closing date Net First Lien Leverage) 100% of debt issuance proceeds (other than permitted debt) Negative Covenants: Usual and customary for transactions of this type, including but not limited to limitations on restricted payments, indebtedness, investments, liens, asset sales and transactions with affiliates Financial Covenants: RCF: Springing maximum Net First Lien Leverage Ratio based on a 30% cushion to Consolidated EBITDA as of the Closing Date when the aggregate amount of revolving loans and LCs outstanding is greater than 30% of Revolving Commitments (excluding all cash-collateralized letters of credit and $25 million LC carveout) TLB: None
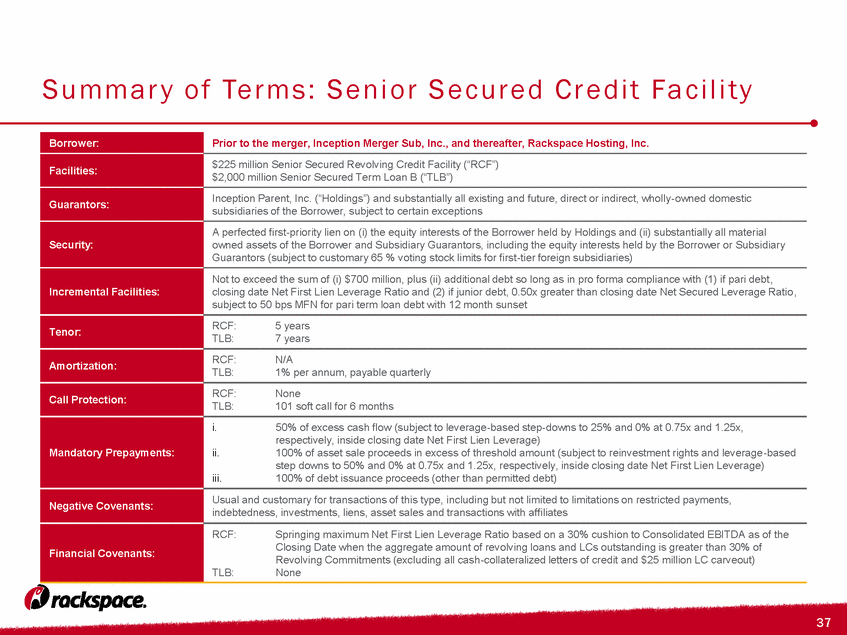
Transaction Timeline Date: October 13th Bank meeting October 26th Commitments due November 2nd Shareholder vote Early to Mid-November Close and fund credit facilities Market Holiday Key Transaction Date October-2016 S M T W T F S 1 2 3 4 5 6 7 8 9 10 11 12 13 14 15 16 17 18 19 20 21 22 23 24 25 26 27 28 29 30 31 November-2016 S M T W T F S 1 2 3 4 5 6 7 8 9 10 11 12 13 14 15 16 17 18 19 20 21 22 23 24 25 26 27 28 29 30 December-2016 S M T W T F S 1 2 3 4 5 6 7 8 9 10 11 12 13 14 15 16 17 18 19 20 21 22 23 24 25 26 27 28 29 30 31
Q&A
Appendix
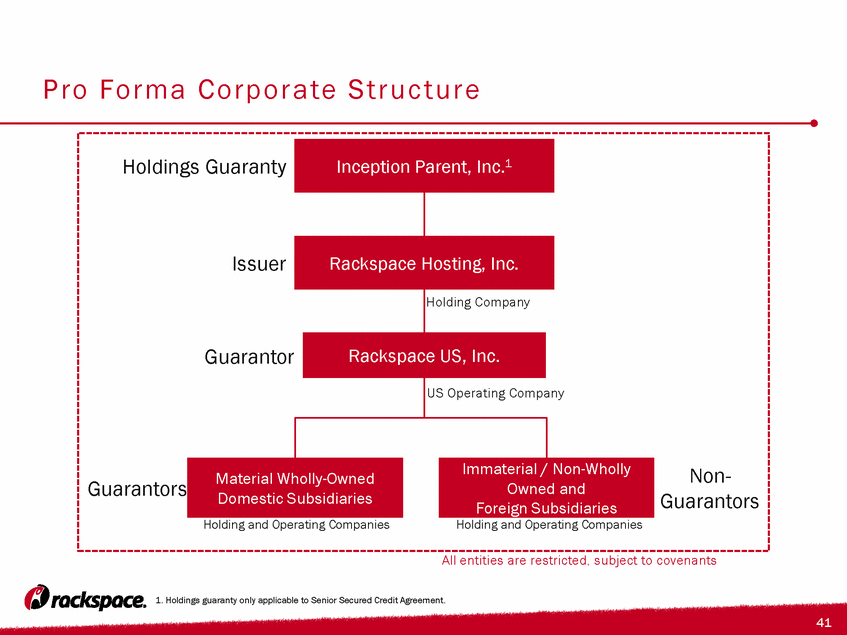
Pro Forma Corporate Structure Rackspace Hosting, Inc. Rackspace US, Inc. Immaterial / Non-Wholly Owned and Foreign Subsidiaries Material Wholly-Owned Domestic Subsidiaries Issuer Guarantor Holding Company US Operating Company Holding and Operating Companies Holding and Operating Companies All entities are restricted, subject to covenants Inception Parent, Inc.1 Holdings Guaranty 1. Holdings guaranty only applicable to Senior Secured Credit Agreement. Guarantors Non- Guarantors
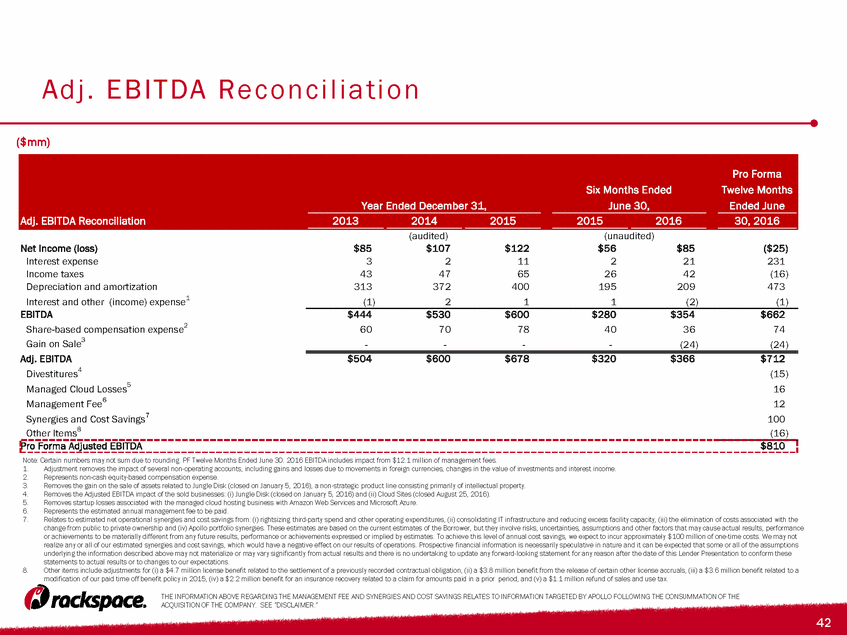
Adj. EBITDA Reconciliation ($mm) Note: Certain numbers may not sum due to rounding. PF Twelve Months Ended June 30. 2016 EBITDA includes impact from $12.1 million of management fees. Adjustment removes the impact of several non-operating accounts, including gains and losses due to movements in foreign currencies, changes in the value of investments and interest income. Represents non-cash equity-based compensation expense. Removes the gain on the sale of assets related to Jungle Disk (closed on January 5, 2016), a non-strategic product line consisting primarily of intellectual property. Removes the Adjusted EBITDA impact of the sold businesses: (i) Jungle Disk (closed on January 5, 2016) and (ii) Cloud Sites (closed August 25, 2016). Removes startup losses associated with the managed cloud hosting business with Amazon Web Services and Microsoft Azure. Represents the estimated annual management fee to be paid. Relates to estimated net operational synergies and cost savings from: (i) rightsizing third-party spend and other operating expenditures, (ii) consolidating IT infrastructure and reducing excess facility capacity, (iii) the elimination of costs associated with the change from public to private ownership and (iv) Apollo portfolio synergies. These estimates are based on the current estimates of the Borrower, but they involve risks, uncertainties, assumptions and other factors that may cause actual results, performance or achievements to be materially different from any future results, performance or achievements expressed or implied by estimates. To achieve this level of annual cost savings, we expect to incur approximately $100 million of one-time costs. We may not realize any or all of our estimated synergies and cost savings, which would have a negative effect on our results of operations. Prospective financial information is necessarily speculative in nature and it can be expected that some or all of the assumptions underlying the information described above may not materialize or may vary significantly from actual results and there is no undertaking to update any forward-looking statement for any reason after the date of this Lender Presentation to conform these statements to actual results or to changes to our expectations. Other items include adjustments for (i) a $4.7 million license benefit related to the settlement of a previously recorded contractual obligation, (ii) a $3.8 million benefit from the release of certain other license accruals, (iii) a $3.6 million benefit related to a modification of our paid time off benefit policy in 2015, (iv) a $2.2 million benefit for an insurance recovery related to a claim for amounts paid in a prior period, and (v) a $1.1 million refund of sales and use tax. THE INFORMATION ABOVE REGARDING THE MANAGEMENT FEE AND SYNERGIES AND COST SAVINGS RELATES TO INFORMATION TARGETED BY APOLLO FOLLOWING THE CONSUMMATION OF THE ACQUISITION OF THE COMPANY. SEE “DISCLAIMER.” Year Ended December 31, Six Months Ended June 30, Pro Forma Twelve Months Ended June Adj. EBITDA Reconciliation 2013 2014 2015 2015 2016 30, 2016 (audited) (unaudited) Net Income (loss) $85 $107 $122 $56 $85 ($25) Interest expense 3 2 11 2 21 231 Income taxes 43 47 65 26 42 (16) Depreciation and amortization 313 372 400 195 209 473 Interest and other (income) expense 1 (1) 2 1 1 (2) (1) EBITDA $444 $530 $600 $280 $354 $662 Share-based compensation expense 2 60 70 78 40 36 74 Gain on Sale 3 - - - - (24) (24) Adj. EBITDA $504 $600 $678 $320 $366 $712 Divestitures 4 (15) Managed Cloud Losses 5 16 Management Fee 6 12 Synergies and Cost Savings 7 100 Other Items 8 (16) Pro Forma Adjusted EBITDA $810
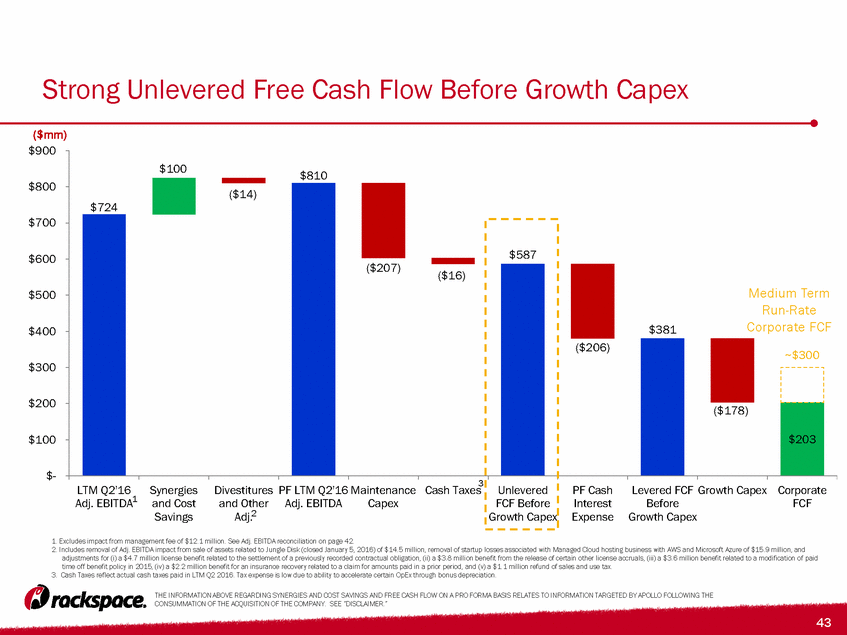
Strong Unlevered Free Cash Flow Before Growth Capex 1. Excludes impact from management fee of $12.1 million. See Adj. EBITDA reconciliation on page 42. 2. Includes removal of Adj. EBITDA impact from sale of assets related to Jungle Disk (closed January 5, 2016) of $14.5 million, removal of startup losses associated with Managed Cloud hosting business with AWS and Microsoft Azure of $15.9 million, and adjustments for (i) a $4.7 million license benefit related to the settlement of a previously recorded contractual obligation, (ii) a $3.8 million benefit from the release of certain other license accruals, (iii) a $3.6 million benefit related to a modification of paid time off benefit policy in 2015, (iv) a $2.2 million benefit for an insurance recovery related to a claim for amounts paid in a prior period, and (v) a $1.1 million refund of sales and use tax. 3. Cash Taxes reflect actual cash taxes paid in LTM Q2 2016. Tax expense is low due to ability to accelerate certain OpEx through bonus depreciation. 3 ($mm) 2 1 Medium Term Run-Rate Corporate FCF THE INFORMATION ABOVE REGARDING SYNERGIES AND COST SAVINGS AND FREE CASH FLOW ON A PRO FORMA BASIS RELATES TO INFORMATION TARGETED BY APOLLO FOLLOWING THE CONSUMMATION OF THE ACQUISITION OF THE COMPANY. SEE “DISCLAIMER.” $100 $203 ($14) ($207) ($16) ($206) ($178) $724 $810 $587 $381 ~$300 $- $100 $200 $300 $400 $500 $600 $700 $800 $900 LTM Q2'16 Adj. EBITDA Synergies and Cost Savings Divestitures and Other Adj. PF LTM Q2'16 Adj. EBITDA Maintenance Capex Cash Taxes Unlevered FCF Before Growth Capex PF Cash Interest Expense Levered FCF Before Growth Capex Growth Capex Corporate FCF
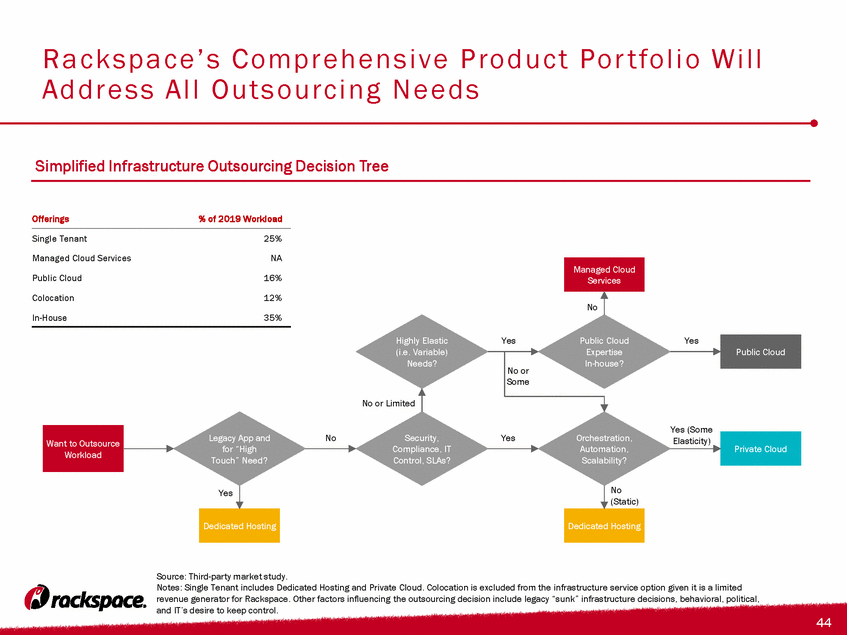
Source: Third-party market study. Notes: Single Tenant includes Dedicated Hosting and Private Cloud. Colocation is excluded from the infrastructure service option given it is a limited revenue generator for Rackspace. Other factors influencing the outsourcing decision include legacy “sunk” infrastructure decisions, behavioral, political, and IT’s desire to keep control. Want to Outsource Workload Private Cloud Public Cloud Managed Cloud Services Dedicated Hosting Dedicated Hosting Legacy App and for “High Touch” Need? Security, Compliance, IT Control, SLAs? Orchestration, Automation, Scalability? Highly Elastic (i.e. Variable) Needs? Public Cloud Expertise In-house? No Yes Yes No (Static) Yes (Some Elasticity) Yes Yes No No or Limited No or Some Rackspace’s Comprehensive Product Portfolio Will Address All Outsourcing Needs Simplified Infrastructure Outsourcing Decision Tree Offerings % of 2019 Workload Single Tenant 25% Managed Cloud Services NA Public Cloud 16% Colocation 12% In-House 35%
[LOGO]
