Attached files
UNITED STATES
SECURITIES AND EXCHANGE COMMISSION
Washington, D.C. 20549
FORM 10-K
(Mark one)
R | ANNUAL REPORT PURSUANT TO SECTION 13 OR 15(d) OF THE SECURITIES EXCHANGE ACT OF 1934 |
For the fiscal year ended December 31, 2015.
OR
o | TRANSITION REPORT PURSUANT TO SECTION 13 OR 15(d) OF THE SECURITIES EXCHANGE ACT OF 1934 |
For the transition period from ______ to ______.
Commission file number 001-34143
RACKSPACE HOSTING, INC.
(Exact Name of registrant as specified in its charter)

Delaware | 74-3016523 | |
(State or other jurisdiction of incorporation or organization) | (IRS Employer Identification No.) | |
1 Fanatical Place
City of Windcrest
San Antonio, Texas 78218
(Address of principal executive offices, including zip code)
(210) 312-4000
(Registrant’s telephone number, including area code)
Securities registered pursuant to Section 12(b) of the Act:
Title of each class | Name of each exchange of which registered | |
Common Stock, par value $0.001 per share | New York Stock Exchange | |
Securities registered pursuant to Section 12(g) of the Act:
None
(Title of Class)
Indicate by check mark if the registrant is a well-known seasoned issuer, as defined in Rule 405 of the Securities Act. Yes R No o
Indicate by check mark if the registrant is not required to file reports pursuant to Section 13 or Section 15(d) of the Act. Yes o No R
Indicate by check mark whether the registrant (1) has filed all reports required to be filed by Section 13 or 15(d) of the Securities Exchange Act of 1934 during the preceding 12 months (or for such shorter period that the registrant was required to file such reports), and (2) has been subject to such filing requirements for the past 90 days. Yes R No o
Indicate by check mark whether the registrant has submitted electronically and posted on its corporate Web site, if any, every Interactive Data File required to be submitted and posted pursuant to Rule 405 of Regulation S-T (§232.405 of this chapter) during the preceding 12 months (or for such shorter period that the registrant was required to submit and post such files). Yes R No o
Indicate by check mark if disclosure of delinquent filers pursuant to Item 405 of Regulation S-K (§229.405 of this chapter) is not contained herein, and will not be contained, to the best of the registrant's knowledge, in definitive proxy or information statements incorporated by reference in Part III of this Form 10-K or any amendment to this Form 10-K. o
Indicate by check mark whether the registrant is a large accelerated filer, an accelerated filer, a non-accelerated filer, or a smaller reporting company. See definition of “large accelerated filer," "accelerated filer" and "smaller reporting company” in Rule 12b-2 of the Exchange Act. (Check one):
Large accelerated filer R | Accelerated filer o | Non-accelerated filer o | Smaller reporting company o | |||
Indicate by check mark whether the registrant is a shell company (as defined in Rule 12b-2 of the Exchange Act). Yes o No R
As of June 30, 2015, the aggregate market value of shares held by non-affiliates of the registrant (based upon the closing sale price of such shares on the New York Stock Exchange on June 30, 2015) was $2.5 billion.
On February 16, 2016, 130,993,039 shares of the registrant’s Common Stock, $0.001 par value, were outstanding.
DOCUMENTS INCORPORATED BY REFERENCE
Portions of the Proxy Statement for the Registrant's 2016 Annual Meeting of Stockholders, to be filed within 120 days of the Registrant's fiscal year ended December 31, 2015, are incorporated by reference into Part III of this Form 10-K.
RACKSPACE HOSTING, INC.
TABLE OF CONTENTS
Page | ||
Item 1. | ||
Item 1A. | ||
Item 1B. | ||
Item 2. | ||
Item 3. | ||
Item 4. | ||
Item 5. | ||
Item 6. | ||
Item 7. | ||
Item 7A. | ||
Item 8. | ||
Item 9. | ||
Item 9A. | ||
Item 9B. | ||
Item 10. | ||
Item 11. | ||
Item 12. | ||
Item 13. | ||
Item 14. | ||
Item 15. | ||
SPECIAL NOTE REGARDING FORWARD-LOOKING STATEMENTS
We have made forward-looking statements in this Annual Report on Form 10-K that are subject to risks and uncertainties. Forward-looking statements within the meaning of Section 27A of the Securities Act of 1933, as amended, and Section 21E of the Securities Exchange Act of 1934, as amended, are subject to the “safe harbor” created by those sections. The forward-looking statements in this report are based on our management’s beliefs and assumptions and on information currently available to our management. In some cases, you can identify forward-looking statements by terms such as “anticipates,” “aspires,” “believes,” “can,” “continue,” “could,” “estimates,” “expects,” “intends,” “may,” “plans,” “projects,” “seeks,” “should,” “will” or “would” or the negative of these terms and similar expressions intended to identify forward-looking statements. These statements involve known and unknown risks, uncertainties and other factors, which may cause our actual results, performance, time frames or achievements to be materially different from any future results, performance, time frames or achievements expressed or implied by the forward-looking statements. We discuss many of these risks, uncertainties and other factors in this document in greater detail under the heading “Risk Factors.” We believe it is important to communicate our expectations to our investors. However, there may be events in the future that we are not able to predict accurately or over which we have no control. The risks described in “Risk Factors” included in this report, as well as any other cautionary language in this report, provide examples of risks, uncertainties and events that may cause our actual results to differ materially from the expectations we describe in our forward-looking statements. You should be aware that the occurrence of the events described in “Risk Factors” and elsewhere in this report could harm our business.
Given these risks, uncertainties and other factors, you should not place undue reliance on these forward-looking statements. Also, these forward-looking statements represent our estimates and assumptions only as of the date of this filing. You should read this document completely and with the understanding that our actual future results may be materially different from what we expect. We hereby qualify our forward-looking statements by these cautionary statements. Except as required by law, we assume no obligation to update these forward-looking statements publicly, or to update the reasons actual results could differ materially from those anticipated in these forward-looking statements, even if new information becomes available in the future.
TRADEMARKS AND SERVICE MARKS
Rackspace®, Fanatical Support®, and RackConnect® are service marks of Rackspace US, Inc. registered in the United States and other countries. OpenStack® is either a registered trademark or trademark of OpenStack, LLC in the United States and/or other countries. Net Promoter, Net Promoter Score and NPS are trademarks of Satmetrix Systems, Inc., Bain & Company, Inc. and Fred Reichheld. EVA® is a registered trademark of Stern Stewart & Co. and EVA Dimensions. Other trademarks and tradenames appearing in this report are the property of their respective holders. We do not intend our use or display of other companies’ tradenames, trademarks, or service marks to imply a relationship with, or endorsement or sponsorship of us by, these other companies.
- 3 -
PART I
ITEM 1 - BUSINESS
References to “we,” “our,” “our company,” “us,” “the company,” “Rackspace Hosting,” or “Rackspace” refer to Rackspace Hosting, Inc. and its consolidated subsidiaries. See “Management’s Discussion and Analysis of Financial Condition and Results of Operations” and the Consolidated Financial Statements and the related Notes for additional information regarding the business and our operating results.
Overview
Rackspace is the world leader in the managed cloud segment of the business information technology ("IT") market. As a global company, we sell our services in more than 120 countries to more than 300,000 business customers, including a majority of the Fortune 100 companies. We help customers tap the power of cloud computing by delivering world-class service on the world's leading technology platforms. We are experts in IT, so our customers do not have to be.
Our global corporate headquarters is located in San Antonio. We also have operations located in multiple cities across the United States, as well as in London, Amsterdam, Zurich, Hong Kong, Sydney, and Mexico City. The majority of our revenue is generated by our operations in the U.S. and U.K. In 2015, 68% of our net revenue was from U.S. customers, and no single customer accounted for more than 2% of our net revenue in any of the past three years.
We offer a broad portfolio of integrated IT solutions for common business needs across two primary form factors, which represent configurations of hardware and software components: (i) dedicated cloud and private clouds, and (ii) managed public clouds. Using these two form factors, we deliver flexible, secure, cost-efficient, and high-performance managed infrastructure environments (“IT environments”). We can also combine these form factors to create hybrid clouds to better optimize our customers’ IT environments. As a result, we are capable of offering private, public and hybrid clouds in our 11 data centers located on four continents, in Microsoft Azure and Amazon Web Services data centers, as well as in customer-owned data centers. Each form factor has specific customer benefits, and through hybrid cloud, the various technologies can be combined and adjusted to address each customer's changing and diverse needs.
On these form factors, we support a broad range of leading hardware and software technologies, and every customer we serve receives managed services from us. Rackspace’s set of managed support services and Fanatical Support are critical in this new world of computing as customers increasingly need help to make needed transitions and optimize their IT environments. These services include dedicated customer care and technical support, such as operating system patching, application monitoring, network and firewall configurations, and identity management. We also offer specialized services for certain applications, including e-commerce and web content management sites, business-productivity applications such as email and collaboration, and data stores. We back all of our services with Fanatical Support, our premium customer service model where we commit to robust service level agreements, which include 24x7x365 service.
We were incorporated in Delaware in March 2000, but our operations began in 1998 as a limited partnership, which became our subsidiary through a corporate reorganization completed in August 2001.
Our Industry and Competition
The cloud computing industry can be broadly described as one that delivers computing, storage, and applications as a service over the Internet. This industry is fast-growing and crowded, and Rackspace has earned a well-defined role within it, as leader of the managed cloud segment of the industry. We are a company of specialists, with expertise in key skill-sets around hybrid cloud configurations, the deployment and operation of leading technologies such as OpenStack, Linux, VMware and Windows, and the management of complex applications ranging from MongoDB to Hybris and SharePoint. Our employees, who we call Rackers, are available to customers around the clock, and deliver industry-leading customer service.
To understand the growth and segmentation of our industry, it is useful to consider the four primary ways in which businesses can fulfill their IT requirements:
- 4 -
1. | The first approach is in-house IT and colocation. This is the legacy approach in which a business retains complete ownership and responsibility for ongoing maintenance and management of, among other things, servers, software, networking equipment, and IT staff. Companies may choose to house this equipment in their own data centers or server closets or may rent data center space from a colocation provider. Many companies that handle all of their computing in-house spend more on their IT budgets and payrolls than anticipated as their need for engineering talent has expanded significantly in recent years due to the proliferation of complex cloud tools and applications. Companies that provide colocation services include AT&T, Equinix, CenturyLink, and other telecommunications companies. We believe that over time it will be difficult for the most businesses to replicate the economies of scale and economies of expertise achieved by specialized service providers, making this do-it-yourself option less attractive. |
2. | The second approach is IT outsourcing, where businesses transfer full responsibility for their computing systems, operations, and employees to a third party, often a systems integrator such as HP, IBM or CSC. This approach helps the client focus on its core business. It is typically more costly than other alternatives to in-house computing, and can require very long lead times to deliver new projects or capabilities. As such, outsourcing has long been an option for only the largest companies because of the cost, complexity and duration of outsourcing contracts. Rarely is this a viable option for small and medium-sized businesses with rapidly changing needs. Even some large corporations are questioning the cost-benefit ratio and the slow response times associated with the outsourcing approach. |
3. | The third approach is unmanaged cloud, in which businesses use an unmanaged cloud provider such as Amazon Web Services, Google or Microsoft. These providers essentially provide access to computer hardware and software on demand over the Internet and require the customer to either manage it alone or manage multiple providers of infrastructure and support. This approach requires companies to take on the full burden of operating IT infrastructure and learning to use the fast-expanding set of tools necessary to leverage cloud computing. For most companies, this approach requires hiring and retaining expensive engineers with specialized expertise in the latest cloud technologies. The unmanaged approach has been popular among early adopters of cloud computing such as software developers and founders of small technology startup companies. However, other companies often find it difficult, expensive, and distracting to hire or contract with all of the specialized engineering talent that is required to manage raw infrastructure and all the complex cloud tools and applications that run on top of that infrastructure. They receive few assurances in terms of business outcomes, and little in the way of specialized expertise, advice or support. |
4. | The fourth approach is managed cloud, where business customers access computing resources and managed services, specialized expertise, advice and support, along with explicit assurances of business outcomes through service level agreements. This approach allows customers to focus their leaders and their scarce technical talent on tasks that differentiate their businesses. Major competitors in managed cloud include HP, IBM, and several large telecommunication companies. We believe that the addressable market for managed cloud is large and growing rapidly, including among large enterprise customers. |
Our Customer Service
Fanatical Support, our differentiated approach to the customer experience, is backed by a complex business process that we have built and refined over the past 17 years, and it distinguishes our company in the market. Our process for delivering Fanatical Support involves everything from the way we recruit, interview and test prospective employees; to the way we continuously train new and veteran Rackers alike; to the way we make the specialized expertise of U.S. and U.K. based technicians available to customers 24/7 by phone, email or chat; to the way we empower those Rackers to serve our customers; to the way we measure customer satisfaction and churn on a daily basis, team by team; to the way we reward and celebrate successful teams and managers; to the way we design and implement solutions and processes to make our services highly reliable and easy for the customer to use and navigate.
When we first launched Fanatical Support, it was mainly about answering the phone and providing extraordinary support when things went wrong with a customer's computing. But we quickly expanded our support to meet customer demands for expertise in Linux, Windows and network security. Our concept of Fanatical Support has continued to expand and evolve to include technological improvements that make our services more reliable and easier to use. We now offer prescriptive advice to customers and prospects about which applications work best on specific architectures, in public cloud and private cloud, on dedicated cloud and in hybrid cloud.
- 5 -
Fanatical Support has moved up the technology stack to include specialist expertise in complex applications such as MongoDB, Hadoop, Redis, SQL Server, MySQL, MariaDB, Percona Server, Magento, Hybris, Sitecore, Adobe Experience Manager, Drupal, WordPress, SharePoint, Exchange, Office365, and Google Apps for Work.
Fanatical Support is also expanding outside our data centers. We offer private clouds powered by VMware, Microsoft, and OpenStack. We offer support for many technologies sold by Amazon, Google, Microsoft, and VMware, and our list of partners and supported technologies is growing rapidly.
We have built our business around an understanding, born of experience, that things go wrong in computing and always will in a field so complex and fast-changing. We believe that many business customers want a trusted partner who is available 24/7 to help them safely and reliably take advantage of the enhanced capabilities and cost savings available through cloud computing.
Our Cloud Form Factors
Everything that we do at Rackspace falls under the umbrella of cloud computing, broadly defined as the delivery of computing, storage, and applications over the Internet. Nearly all of our computer resources are located in our secure, enterprise-grade data centers in the U.S., the U.K., Hong Kong, and Australia. We have the flexibility to configure our resources to implement different cloud form factors to address specific customer workloads and to provide services to support different cloud form factors.
Public cloud refers to multi-tenant pools of computing resources delivered on-demand over the Internet. Virtualization and other cloud technologies allow us to effectively provision and manage pools of computing resources across a large base of customers and deliver more resources to businesses when they need them. At the same time, pooled cloud computing substantially lowers the cost of IT services for some applications. There are multiple varieties of public cloud services that are priced on a pay-per-use basis and that can be quickly and easily scaled up or down on-demand.
Dedicated cloud refers to computing resources accessed by a specific customer. Our basic support level for this service frees the customer from the burden of managing the data center, network, hardware devices, and operating system software that comprise the solution for a specific workload. We provide a customer portal and other management tools. We also offer higher support levels that assume more cloud management tasks, including for many popular applications. Dedicated cloud hosting is largely a recurring, subscription-based service.
Private cloud refers to a pool of computing resources that is virtualized for greater efficiency and nimbleness and that is available for a specific customer workload. The computing resources can be located in our data centers or in the customer's facilities. This approach is especially popular with some of our larger corporate customers who value the security and compliance advantages that it offers. We offer private clouds powered by VMware, Microsoft, and OpenStack. The breadth of our portfolio, and our hybrid cloud approach, have generated significant interest in our private cloud offerings.
Hybrid cloud is an emerging category in which we are a pioneer which enables customers to easily and seamlessly utilize the benefits of both dedicated cloud and public cloud in its data centers or ours or those of a third-party. We are also working to add private cloud to the technologies that can be linked through our hybrid cloud. A customer using hybrid cloud is able to utilize any combination of dedicated and pooled resources and to manage them seamlessly through our innovative RackConnect service. Each cloud computing form factor has specific and unique customer benefits, and through hybrid cloud, the various technologies can be combined and adjusted to address each customer's changing and diverse workloads. Furthermore, Rackspace’s set of managed support services and Fanatical Support are critical in this new world of computing as customers increasingly need help to make the transition and utilize these new services.
Our Sources of Competitive Advantage
The following key principles form the foundation of our business model and consistently differentiate us from our competitors:
- 6 -
Superior Service Delivery via Fanatical Support - Our mission is to be recognized as one of the world’s great service companies. Because companies must trust their managed cloud provider with mission-critical IT assets, service reputation is often a critical selection criterion. We believe that an excellent customer experience creates customer loyalty, which in turn delivers greater customer retention and future purchases while reducing customer acquisition and marketing costs. We have deep institutionalized business practices that go above and beyond customers’ expectations and we brand this industry-leading customer service model "Fanatical Support."
To continually improve our service, we closely track customer retention and new customer acquisitions. We ask customers why they stay with us, why they spend more or less with us, and why they leave. We study patterns within account teams, technology sets, geographies and more. We then strive to build on our areas of strength and enhance areas in which customers may be dissatisfied. We also make extensive use of the Net Promoter Score ("NPS") index to track the likelihood that customers will refer us to friends or colleagues. We conduct surveys on an ongoing basis that are broken down by support team, with results summarized monthly and analyzed to determine areas for improvement. We work with our customers to understand what they consider “must haves” and what they would like to see in terms of incremental improvements to our service offerings.
Specialist Focus - We specialize in providing managed cloud via a global footprint of 11 data centers that serve over 300,000 customers in more than 120 countries worldwide. Modern computing infrastructure is complex and ever-changing, so this specialist focus has allowed us to build a broad set of repeatable services utilizing leading technologies that are scalable, efficient and valuable to our customers. Every service that we offer is managed, backed by specialized expertise, tools and automation.
Our specialist focus is a key differentiator as customers consider how to fulfill their IT requirements. Customers can choose a do-it-yourself approach, which includes in-house IT, colocation and unmanaged, public clouds. Alternatively, customers can choose a do-it-together approach, which includes our services and the services offered by the traditional technology and telecom providers. Our focus on managed cloud enables us to concentrate our capital and our Rackers' talents on our mission. As a result, we can more rapidly and accurately deploy, upgrade and scale our computing resources, technologies and services. This approach allows us to deliver a higher quality IT experience, at a better value, when compared to the do-it-yourself approach or the approach taken by traditional technology and telecom providers. Our differentiated approach has been recognized as we have been cited for each of the last two years as one of the leaders in Gartner’s Magic Quadrant for Cloud-Enabled Managed Hosting Providers.
Comprehensive Managed Cloud Offering - Some competitors only offer public cloud form factors, while other competitors only offer dedicated and private cloud form factors. In contrast, we offer managed services across all the leading cloud form factors and technologies. For public cloud form factors, we support OpenStack, Microsoft Azure, and Amazon Web Services platforms. We also offer dedicated cloud and private cloud form factors, which include bare metal offerings, and support for VMware, OpenStack and Microsoft platforms. Our portfolio of services allows us to deliver an approach that caters to each customer's unique workloads- enabling the optimization of a customer's IT environment within their budget. In addition, because of the breadth of our portfolio, customers can host their entire IT environments with us, allowing them to benefit from the simplicity of working with one managed cloud specialist rather than managing multiple providers.
Economies of Expertise - We have become one of the core hubs for IT expertise in the world. Today, we employ more than 3,000 managed cloud engineers. Additionally, hundreds of our employees hold certifications in leading technologies, such as Red Hat, Microsoft, Cisco, Amazon Web Services, VMware and OpenStack. This concentration of IT expertise creates a critical mass for learning, training, recruiting, and retaining our employees, and, as a result, we believe this provides the foundation for our industry-leading talent pool. While some companies choose to build this expertise in-house, our customers prefer to rely on our teams because they cannot hire qualified talent as effectively as us or they do not want to spend internal resources on non-differentiating business activities. Part of creating, and increasing, our economies of expertise is ensuring that our most valuable asset, our employees, also known as Rackers, enjoy coming to work every day. We strive to recruit, hire, train and retain employees with the personality traits that fit well within our culture and our teams. As a result, in six of the last eight years, Fortune magazine has honored us in its list of “100 Best Companies to Work For.” We believe that our differentiated workplace culture provides a competitive advantage because it cannot be easily or quickly replicated.
Business Strategies
Key components of our business and growth strategies include the following:
- 7 -
Deepen our Service Delivery on Industry-Leading Platforms—In the past year, we have announced relationships with Intel, Microsoft Azure, and Amazon Web Services. With Intel, we are operating the OpenStack Innovation Center, the goal of which is to accelerate the adoption of OpenStack in the enterprise market. OpenStack, Microsoft Azure, and Amazon Web Services are industry-leading private and public cloud platforms that represent growth opportunities for us. Enterprise customers are deploying OpenStack in our data centers and their data centers to create large private clouds positioning us to benefit from this demand. With Microsoft Azure and Amazon Web Services, our goal is to help customers migrate, architect, secure and operate IT environments on these platforms. Companies of all sizes are deploying IT environments on top of Microsoft Azure and Amazon Web Services. These platforms accelerate our global reach—for example, we can now offer our products and services to customers that require a data center presence in Singapore.
Increase our Service Differentiation—Customers are asking service providers to play an increasingly active role in the management of their IT environments. New approaches to infrastructure management and next-generation technologies create increasing complexity for businesses. As a result, customers want our help with IT environment architecture, security, reliability, cost management, and portability. Throughout our history, we have launched offerings in response to customer demand, and we have a track record of delivering service offerings to drive continued growth. Most recently, we launched Rackspace Managed Security, which is a service offering focused on helping customers protect against cyber attacks. We intend to continue investing in existing and new capabilities to strengthen our service differentiation to capture customer demand.
Improve the Customer Experience via Hybrid Choice—Many of our customers have IT environments that straddle multiple form factors and technology platforms. Human preference, application type, and other factors drive the decision on where and how to architect and deploy an IT environment. Given our breadth of offering and depth of expertise, we are able to support customers who want to straddle multiple form factors and technology platforms. Over time, we intend to improve our offerings so that these customers can more easily migrate, architect, secure, and operate these hybrid IT environments. We believe that creating this hybrid experience will be valuable to our new and existing customers.
Promote our Industry-Leading Managed Cloud Expertise—We are a pioneer in the managed cloud market and have built an established brand. Our leadership position has been validated by industry experts, our partners and our customers. Gartner has positioned us as the industry leader in Cloud-Enabled Managed Hosting in North America and Europe. We have won numerous accolades from our partners, including winning Microsoft Hosting Partner of the Year for a record five times, most recently in 2015. We are the #1 hosting provider for the top 1,000 e-commerce sites, and Forbes recently recognized us as one of America’s Most Trustworthy Companies. We believe, these awards demonstrate our business and growth strategies are working, and we will continue to promote our leadership position. This continued promotion of our leadership position is critical to our ability to attract new and retain existing customers.
Research and Development
We believe that business adoption of managed cloud is a paradigm shift in IT, and we are investing heavily to take advantage of this opportunity. For the years ended December 31, 2013, 2014 and 2015, we incurred $90.2 million, $117.0 million and $124.9 million of research and development expense, respectively. Our research and development efforts are focused on developing new services including deployment of new technologies to address customer demands in public cloud, private cloud, hybrid cloud and dedicated cloud; and development and enhancement of proprietary tools.
Intellectual Property Rights
We rely on a combination of patent, copyright, trademark, service mark and trade secret laws in the U.S., the European Union, and various countries in Asia, South America, and elsewhere and contractual restrictions to establish and protect certain proprietary rights in our data, applications, and services. We have patents issued as well as patent applications pending in the U.S. and the European Union. We have trademarks registered or pending in the U.S., the European Union, and various countries in Asia, South America, and elsewhere for our name and certain words and phrases that we use in our business. We rely on copyright laws and licenses to use and protect software and certain other elements of our proprietary technologies. We also enter into confidentiality and invention assignment agreements with our employees and consultants and confidentiality agreements with other third parties, and we actively monitor access to our proprietary technologies. In addition, we license third-party software, open source software and other technologies that are used in the provision of or incorporated into some elements of our services. Many parts of our business are significantly reliant on proprietary technology and/or licensed technology. Although we rigorously protect our rights to use this technology, any significant impairment of, or third-party claim against, our intellectual property rights could harm our business or our ability to compete.
- 8 -
Employees
As of December 31, 2015, we employed 6,189 Rackers. None of our employees is represented by a collective bargaining agreement, nor have we experienced any work stoppages. We believe that our relations with our employees are good.
Sales and Marketing
Our services are sold via direct sales teams, through third-party channel partners and via online orders. Our direct sales model is based on centralized sales teams with leads generated primarily from customer referrals and corporate marketing efforts. This model also includes a centralized enterprise field sales force, which targets select businesses. Our channel partners include management and technical consultancies, technology integrators, software application providers, and web developers. Online sales occur via online stores located in the relevant sections of our website.
Our marketing efforts generate interest and market demand by communicating the advantages of our services and unique support model. Our marketing activities include web-based paid and natural search, participation in technology trade shows, conferences and customer events, advertisements in traditional and electronic (web and email-based) media, and targeted regional public relations activities.
Seasonality
Our business is affected by seasonality, as utility consumption typically rises in the fourth quarter before trending down in the first quarter and because larger enterprises slow their buying activities in the fourth quarter due to the holidays and corporate budget cycles, which impacts revenue growth in the first quarter.
Our Support Team Structure
Our support teams are specifically structured based on our customers' form factor and service choices. Service teams are comprised of specialized experts who can address a wide range of business and technical issues for a customer and are available 24x7x365.
Financial Information About Geographic Areas
See Item 8 of Part II, “Financial Statements and Supplementary Data – Note 12 – Segment Information” for financial information related to our geographic areas. For information regarding certain risks relating to our foreign operations, please see the risk titled, “Our ability to operate and expand our business is susceptible to risks associated with international sales and operations” in Item 1A, “Risk Factors.”
Available Information
The company's annual reports on Form 10-K, quarterly reports on Form 10-Q, current reports on Form 8-K, and all amendments to those reports are available free of charge on the company's website at www.rackspace.com as soon as reasonably practicable after such material is electronically filed with, or furnished to, the Securities and Exchange Commission ("SEC").
Our SEC filings are also available to the public at the SEC’s website at www.sec.gov. Additionally, our board committee charters and code of ethics are available on our website and in print to any stockholder who requests them. The information contained on our website is not incorporated herein by reference and does not comprise a part of this Annual Report on Form 10-K.
- 9 -
ITEM 1A – RISK FACTORS
The following risks and uncertainties, as well as others described elsewhere herein, could materially adversely affect our business, operating results and financial condition:
If we are unable to adapt to evolving technologies and customer demands in a timely and cost-effective manner, our ability to sustain and grow our business may suffer.
Our market is characterized by rapidly changing technology, evolving industry standards, and frequent new product announcements, all of which impact the way our services are marketed and delivered. The adoption of new technologies, changes in industry standards or the introduction of more attractive products or services could make some or all of our offerings less desirable or even obsolete. These potential changes are magnified by the continued rapid growth of the Internet and the intense competition in our industry. To be successful, we must adapt to our rapidly changing market by forecasting customer demands; improving the performance, features, and reliability of our offerings; and modifying our business strategies accordingly. We may not be able to (i) adapt to these changing technologies in a timely and cost-effective manner, (ii) identify the emergence of new alternatives successfully, (iii) modify our services accordingly, or (iv) develop and bring new offerings to market in a timely and cost-effective manner to address these changes. Our failure to provide offerings that successfully compete with new technologies or the obsolescence of our offerings would likely lead us to lose current and potential customers or cause us to incur substantial costs by attempting to catch our offerings up to the changed environment. Our ability to sustain and grow our business would suffer if we fail to respond to these changes in a timely and cost-effective manner.
Even if we succeed in adapting to a new technology or a chnaged industry standard or are able to develop attractive offerings and successfully bringing them to market, there is no assurance that our use of such new technology or standard or our introduction of the new offerings would have a positive impact on our financial performance. For example, we could incur substantial additional costs if we needed to materially improve our data center infrastructure due to things such as: (i) the development of new systems to deliver power to or eliminate heat from the servers we house, (ii) the development of new server technologies that require levels of critical load and heat removal that our facilities are not currently designed to provide, or (iii) a fundamental change in the way in which we deliver services. Also if one of our new offerings were competitive to our prior offerings and represented an adequate or superior alternative, customers could decide to abandon prior offerings that produce higher revenue or better margins than the new offering. Therefore, the adaptation to new technologies or standards or the development and launch of new offerings could result in lower revenue, lower margins and/or higher costs, which could negatively impact our financial performance.
If we do not prevent security breaches and other interruptions to our infrastructure, we may be exposed to lawsuits, lose customers, suffer harm to our reputation, and incur additional costs.
The services we offer involve the transmission of large amounts of sensitive and proprietary information over public communications networks, as well as the processing and storage of confidential customer information. Unauthorized access, remnant data exposure, computer viruses, denial of service attacks, accidents, employee error or malfeasance, intentional misconduct by computer “hackers” and other disruptions can occur, and infrastructure gaps, hardware and software vulnerabilities, inadequate or missing security controls and exposed or unprotected customer data can exist that (i) interfere with the delivery of services to our customers, (ii) impede our customers' ability to do business, or (iii) compromise the security of systems and data, which exposes information to unauthorized third parties. We are a constant target of cyber attacks of varying degrees on a regular basis, and we have encountered security breaches in the past, although they did not have a material adverse effect on our operating results. There can be no assurance of a similar result in a future security breach.
- 10 -
Techniques used to obtain unauthorized access to or to sabotage systems change frequently and generally are not recognized until launched against a target. We may be unable to implement security measures in a timely manner, or, if and when implemented, these measures could be circumvented as a result of accidental or intentional actions by parties within or outside of our organization. Any breaches that occur could expose us to increased risk of lawsuits, loss of existing or potential customers, harm to our reputation and increases in our security costs. Although we typically require our customers to agree to terms of service that contain provisions attempting to limit our liability for security breaches, we cannot assure you that a court would enforce any contractual limitations on our liability in the event that one of our customers brings a lawsuit against us as the result of a security breach that they may ascribe to us. Additionally, we may decide to negotiate settlements with affected customers regardless of such contractual limitations. The outcome of any such lawsuit would depend on the specific facts of the case and legal and policy considerations that we may not be able to mitigate. In such cases, we could be liable for substantial damage awards that may significantly exceed our liability insurance coverage by unknown but significant amounts, which could seriously impair our financial condition. The laws of some states and countries may also require us to inform any person whose data was accessed or stolen, which could harm our reputation and business. Complying with the applicable notice requirements in the event of a security breach could result in significant costs. We may also be subject to investigation and penalties by regulatory authorities and potential claims by persons whose information was disclosed, even if such person was not actually a customer.
We may not be able to compete successfully against current and future competitors.
The market for cloud computing is highly competitive. We expect to face intense competition from our existing competitors as well as additional competition from new market entrants in the future as the actual and potential market for hosting and cloud computing continues to grow.
Our current and potential competitors vary by size, service offerings and geographic region. These competitors may elect to partner with each other or with focused companies like us to grow their businesses. They include:
▪ | In-house and Colocation solutions with a colocation partner; |
▪ | IT outsourcing providers; |
▪ | Unmanaged cloud computing providers; and |
▪ | Other managed cloud computing companies. |
The primary competitive factors in our market are: customer service and technical expertise, security reliability and functionality, reputation and brand recognition, financial strength, breadth of services offered, and price.
Many of our current and potential competitors have substantially greater financial, technical and marketing resources; larger customer bases; longer operating histories; greater brand recognition; and more established relationships in the industry than we do. As a result, some of these competitors may be able to:
▪ | Develop superior products or services, gain greater market acceptance, and expand their service offerings more efficiently or more rapidly; |
▪ | Adapt to new or emerging technologies and changes in customer requirements more quickly; |
▪ | Bundle hosting services with other services they provide at reduced prices; |
▪ | Take advantage of acquisition and other opportunities more readily; |
▪ | Adopt more aggressive pricing policies and devote greater resources to the promotion, marketing, and sales of their services, which could cause us to have to lower prices for certain products or services to remain competitive in the market; and |
▪ | Devote greater resources to the research and development of their products and services. |
- 11 -
Our physical infrastructure is concentrated in a few facilities, and any failure in our physical infrastructure or services could lead to significant costs and disruptions and could reduce our revenue, harm our business reputation and have a material adverse effect on our financial results.
Our network, power supplies and data centers are subject to various points of failure. Problems with our cooling equipment, generators, uninterruptible power supply ("UPS"), routers, switches, or other equipment, whether or not within our control, could result in service interruptions for our customers as well as equipment damage. Because our service offerings do not require geographic proximity of our data centers to our customers, our infrastructure is consolidated into a few large facilities. While data backup services and disaster recovery services are available as a part of our service offerings, the majority of our customers do not elect to pay the additional fees required to have disaster recovery services store their backup data offsite in a separate facility, which could substantially mitigate the adverse effect to a customer from a single data center failure. Accordingly, any failure or downtime in one of our data center facilities could affect a significant percentage of our customers. The total destruction or severe impairment of any of our data center facilities could result in significant downtime of our services and the loss of customer data. Since our ability to attract and retain customers depends on our ability to provide customers with highly reliable service, even minor interruptions in our service could harm our reputation. The services we provide are subject to failure resulting from numerous factors, including:
▪ | Power loss; |
▪ | Equipment failure; |
▪ | Human error or accidents; |
▪ | Sabotage and vandalism; |
▪ | Failure by us or our vendors to provide adequate service or maintenance to our equipment; |
▪ | Network connectivity downtime; |
▪ | Security breaches to our infrastructure; |
▪ | Improper building maintenance by the landlords of the buildings in which our facilities are located; |
▪ | Physical or electronic security breaches; |
▪ | Fire, earthquake, hurricane, tornado, flood, and other natural disasters; |
▪ | Water damage; and |
▪ | Terrorism. |
Additionally, in connection with the expansion or consolidation of our existing data center facilities from time to time, there is an increased risk that service interruptions may occur as a result of server relocation or other unforeseen construction-related issues.
We have experienced interruptions in service in the past due to such things as power outages, power equipment failures, cooling equipment failures, routing problems, security issues, hard drive failures, database corruption, system failures, software failures, and other computer failures. While we have not experienced a material increase in customer attrition following these events, the extent to which our reputation suffers is difficult to assess. We have taken and continue to take steps to improve our infrastructure to prevent service interruptions, including upgrading our electrical and mechanical infrastructure. However, service interruptions continue to be a significant risk for us and could materially impact our business.
Any future service interruptions could:
▪ | Cause our customers to seek damages for losses incurred; |
▪ | Require us to replace existing equipment or add redundant facilities; |
▪ | Affect our reputation as a reliable provider of hosting services; |
▪ | Cause existing customers to cancel or elect to not review their contracts; or |
▪ | Make it more difficult for us to attract new customers. |
- 12 -
Any of these events could materially increase our expenses or reduce our revenue, which would have a material adverse effect on our operating results.
Our operating results may fluctuate significantly, which could make our future results difficult to predict and could cause our operating results to fall below investor or analyst expectations.
Our operating results may fluctuate due to a variety of factors, including many of the risks described in this section, which are outside of our control. As a result, comparing our operating results on a period-to-period basis may not be meaningful. Our prior period operating results are not an indication of our future operating performance. Fluctuations in our revenue can lead to even greater fluctuations in our operating results. Our budgeted expense levels depend in part on our expectations of long-term future revenue. Given the fixed nature of certain operating costs related to our personnel and facilities, any substantial adjustment to our expenses to account for lower than expected levels of revenue will be difficult. Consequently, if our revenue does not meet projected levels, our operating expenses would be high relative to our revenue, which would negatively affect our operating performance.
If our revenue or operating results do not meet or exceed the expectations of investors or securities analysts, the price of our common stock or debt securities may decline.
If we fail to hire and retain qualified employees and management personnel, our growth strategy and our operating results could be harmed.
Our growth strategy depends on our ability to identify, hire, train, and retain executives, IT professionals, technical engineers, software developers, operations employees, and sales and senior management personnel who maintain relationships with our customers and who can provide the technical, strategic, and marketing skills required for our company to grow. There is a shortage of qualified personnel in these fields, specifically in the San Antonio, Texas area, where we are headquartered and a majority of our employees are located. We compete with other companies for this limited pool of potential employees. In addition, as our industry becomes more competitive, it could become especially difficult to retain personnel with unique in-demand skills and knowledge, whom we would expect to become recruiting targets for our competitors. There is no assurance that we will be able to recruit or retain qualified personnel, and this failure could cause a dilution of our service-oriented culture and our inability to develop and deliver new products and services, which could cause our operations and financial results to be negatively impacted.
We have been accused of infringing the proprietary rights of others and may be accused of infringing on the proprietary rights of others in the future, which could subject us to costly and time consuming litigation and require us to discontinue services that infringe the rights of others.
There may be intellectual property rights held by others, including issued or pending patents, trademarks and service marks, that cover significant aspects of our technologies, branding or business methods, including technologies and intellectual property we have licensed from third parties. Companies in the technology industry and other patent and trademark holders seeking to profit from royalties in connection with grants of licenses own large numbers of patents, copyrights, trademarks, service marks and trade secrets and frequently enter into litigation based on allegations of infringement or other violations of intellectual property rights. These or other parties have claimed in the past and could claim in the future that we have misappropriated or misused intellectual property rights. Any such current or future intellectual property claim against us, regardless of merit, could be time consuming and expensive to settle or litigate and could divert the attention of our technical and management personnel. An adverse determination also could prevent us from offering our services to our customers and may require that we procure or develop substitute services that do not infringe. For any intellectual property rights claim against us or our customers, we may also have to pay damages, indemnify our customers against damages or stop using technology or intellectual property found to be in violation of a third party’s rights. We may be unable to replace those technologies with technologies that have the same features or functionality and that are of equal quality and performance standards on commercially reasonable terms or at all. Licensing replacement technologies and intellectual property may significantly increase our operating expenses or may require us to restrict our business activities in one or more respects. We may also be required to develop alternative non-infringing technology and intellectual property, which could require significant effort, time, and expense, and ultimately may not be an alternative that functions as well as the original or is accepted in the marketplace.
- 13 -
Failure to maintain adequate internal systems could cause us to be unable to properly provide service to our customers, causing us to lose customers, suffer harm to our reputation, and incur additional costs.
Some of our enterprise systems have been designed to support individual service offerings, resulting in a fragmentation among various internal systems, making it difficult to serve customers who use multiple service offerings. This causes us to implement manual processes to overcome the fragmentation, which can result in increased expense and manual errors.
We have systems initiatives underway that are likely to drive significant change in both infrastructure and business processes and contain overlaps and dependencies among the programs. Our inability to manage competing priorities, execute multiple parallel program tracks, plan effectively, manage resources effectively and meet deadlines and budgets could result in us not being able to implement the systems needed to deliver our services in a compelling manner to our customers.
We provide service level commitments to our customers, which could require us to issue credits for future services if the stated service levels are not met for a given period and could significantly decrease our revenue and harm our reputation.
Our customer agreements provide that we maintain certain service level commitments to our customers relating primarily to network uptime, critical infrastructure availability, and hardware replacement. If we are unable to meet the stated service level commitments, we may be contractually obligated to provide these customers with credits for future services. As a result, a failure to deliver services for a relatively short duration could cause us to issue these credits to a large number of affected customers. In addition, we cannot be assured that our customers will accept these credits in lieu of other legal remedies that may be available to them. Our failure to meet our commitments could also result in substantial customer dissatisfaction or loss. Because of the loss of future revenue through these credits, potential customer loss and other potential liabilities, our revenue could be significantly impacted if we cannot meet our service level commitments to our customers.
If we are unable to maintain a high level of customer service, customer satisfaction and demand for our services could suffer.
We believe that our success depends on our ability to provide customers with quality service that not only meets our stated commitments, but meets and then exceeds customer service expectations. We refer to this high quality of customer service as Fanatical Support. If we are unable to provide customers with quality customer support in a variety of areas, we could face customer dissatisfaction, dilution of our brand, weakening of our main market differentiator, decreased overall demand for our services, and loss of revenue. In addition, our inability to meet customer service expectations may damage our reputation and could consequently limit our ability to retain existing customers and attract new customers, which would adversely affect our ability to generate revenue and negatively impact our operating results.
Our existing customers could elect to reduce or terminate the services they purchase from us because many of our contracts with our customers can be canceled at any time without penalty, which could adversely affect our operating results.
Customer contracts for our dedicated cloud services typically have initial terms of 12-36 months which, unless terminated, may be renewed or automatically extended on a month-to-month basis. Our customers have no obligation to renew their services after their initial contract periods expire on these contracts. In addition, many of our other service offerings, including most of our public cloud offerings, can be canceled at any time without penalty. Our costs associated with maintaining revenue from existing customers are generally much lower than costs associated with generating revenue from new customers. Therefore, a reduction in revenue from our existing customers, even if offset by an increase in revenue from new customers, could reduce our operating margins. Any failure by us to continue to retain our existing customers could have a material adverse effect on our operating results.
Customers with mission-critical applications could potentially expose us to lawsuits for their lost profits or damages, which could impair our financial condition.
Because our services are critical to many of our customers’ businesses, any significant disruption in our services could result in lost profits or other indirect or consequential damages to our customers. Although we require our customers to sign agreements that contain provisions attempting to limit our liability for service outages, we cannot be assured that a court would enforce any contractual limitations on our liability in the event that one of our customers brings a lawsuit against us as the result of a service interruption or other Internet site or application problems that they may ascribe to us. The outcome of any such lawsuit would depend on the specific facts of the case and any legal and policy considerations that we may not be able to mitigate. In such cases, we could be liable for substantial damage awards that may exceed our liability insurance coverage by unknown but significant amounts, which could materially impair our financial condition.
- 14 -
Our use of open source software and contributions to open source projects could impose limitations on our ability to provide our services, expose us to litigation, and cause us to impair some assets, which could adversely affect our financial condition and operating results.
We utilize open source software, including Linux-based software, in providing a substantial portion of our services. The terms of many open source licenses have not been interpreted by U.S. courts, and there is a risk that such licenses could be construed in a manner that could impose unanticipated conditions or restrictions on our ability to offer our services. Additionally, the use and distribution of open source software can lead to greater risks than the use of third-party commercial software, as open source software does not come with warranties or other contractual protections regarding infringement claims or the quality of the code. From time to time parties have asserted claims against companies that distribute or use open source software in their products and services, asserting that open source software infringes their intellectual property rights. We have been subject to suits, and could be subject to suits in the future, by parties claiming infringement of intellectual property rights with respect to what we believe to be open source software. In such an event, we could be required to seek licenses from third parties in order to continue using such software or offering certain of our services or to discontinue the use of such software or the sale of our affected services in the event we could not obtain such licenses, any of which could adversely affect our business, operating results and financial condition. In addition, if we combine our proprietary software with open source software in a certain manner, we could, under some of the open source licenses, be required to release the source code of our proprietary software.
We also participate in the OpenStack Foundation, which we initially founded to foster the emergence of cloud computing technology standards and cloud interoperability. Our participation included the release of our previously proprietary core cloud storage code, and we continue to participate through ongoing code contributions. In addition, we also participate in other open source projects and plan to continue to do so in the future. Our utilization of open source software and open data center design projects like the Facebook Open Compute project could cause us to use open source solutions as opposed to existing proprietary solutions and could result in an impairment of design and development assets.
In addition, our activities with these open source projects could subject us to additional risks of litigation, including indirect infringement claims based on third-party contributors because of our participation in these projects.
We may not be successful in protecting and enforcing our intellectual property rights, which could adversely affect our financial condition and operating results.
We rely primarily on patent, copyright, trademark, service mark, and trade secret laws, as well as confidentiality procedures and contractual restrictions, to establish and protect our proprietary rights, all of which provide only limited protection. We rely on copyright laws to protect software and certain other elements of our proprietary technologies. We cannot be assured that any future copyright, trademark or service mark registrations will be issued for pending or future applications or that any registered or unregistered copyrights, trademarks or service marks will be enforceable or provide adequate protection of our proprietary rights. We currently have patents issued and patent applications pending in the U.S. and the European Union. Our patent applications may be challenged and/or ultimately rejected, and our issued patents may be contested, circumvented, found unenforceable or invalidated.
We endeavor to enter into agreements with our employees, contractors, and parties with whom we do business to limit access to and disclosure of our proprietary information. The steps we have taken, however, may not prevent unauthorized use or the reverse engineering of our technology. Moreover, others may independently develop technologies that are substantially equivalent, superior to, or otherwise competitive to the technologies we employ in our services or that infringe our intellectual property. We may be unable to prevent competitors from acquiring trademarks or service marks and other proprietary rights that are similar to, infringe upon, or diminish the value of our trademarks and service marks and our other proprietary rights. Enforcement of our intellectual property rights also depends on successful legal actions against infringers and parties who misappropriate our proprietary information and trade secrets, but these actions may not be successful, even when our rights have been infringed.
In addition, the laws of some foreign countries do not protect our proprietary rights to the same extent as the laws of the U.S. Despite the measures taken by us, it may be possible for a third party to copy or otherwise obtain and use our technology and information without authorization. Policing unauthorized use of our proprietary technologies and other intellectual property and our services is difficult, and litigation could become necessary in the future to enforce our intellectual property rights. Any litigation could be time consuming and expensive to prosecute or resolve, result in substantial diversion of management attention and resources, and harm our business, financial condition, and results of operations.
- 15 -
Our corporate culture has contributed to our success, and if we cannot maintain this culture, we could lose the innovation, creativity, and teamwork fostered by our culture, and our operating results may be harmed.
We believe that a critical contributor to our success has been our corporate culture, which we believe fosters innovation, creativity, and teamwork. If we implement more complex organizational management structures because of growth or other structural changes or create disparities in personal wealth among our employees through our compensation philosophy and benefit plan utilization, we may find it increasingly difficult to maintain the beneficial aspects of our corporate culture. If we cannot maintain a favorable corporate culture, then we can lose employee engagement, which can cause employees to lose the desire to innovate, foster teamwork and strive to delight our customers. Ultimately, we believe that the delivery of exceptional service to our customers by our employees is what produces customer "promoters" and fuels our growth aspirations. Therefore, if the corporate culture is not maintained, it could negatively impact our future operating results.
If we are unable to manage our growth effectively, our financial results could suffer.
The growth of our business and our service offerings could strain our operating and financial resources. Further, we intend to continue expanding our overall business, customer base, headcount, and operations. Creating a global organization and managing a geographically dispersed workforce requires substantial management effort and significant additional investment in our operating and financial system capabilities and controls. If our information systems are unable to support the demands placed on them by our growth, we may be forced to implement new systems, which would be disruptive to our business. We may be unable to manage our expenses effectively in the future due to the expenses associated with these expansions, which may negatively impact our gross margins or operating expenses. If we fail to improve our operational systems or to expand our customer service capabilities to keep pace with the growth of our business, we could experience customer dissatisfaction, cost inefficiencies, and lost revenue opportunities, which may materially and adversely affect our operating results.
We may not be able to continue to add new customers and increase sales to our existing customers, which could adversely affect our operating results.
Our growth is dependent on our ability to continue to attract new customers while retaining and expanding our service offerings to existing customers. Growth in the demand for our services may be inhibited, and we may be unable to sustain growth in our customer base for a number of reasons, such as:
▪ | A reduction in the demand for our services due to macroeconomic factors in the markets in which we operate; |
▪ | Our inability to market our services in a cost-effective manner to new customers; |
▪ | The inability of our customers to differentiate our services from those of our competitors or our inability to effectively communicate such distinctions; |
▪ | Our inability to successfully communicate the benefits of our services to businesses; |
▪ | The decision of businesses to host internally or in colocation facilities as an alternative to the use of our services; |
▪ | Our inability to penetrate international markets; |
▪ | Our inability to provide compelling services or effectively market them to existing customers; |
▪ | Our inability to strengthen awareness of our brand; and |
▪ | Reliability, quality or compatibility problems with our services. |
A substantial amount of our revenue growth is derived from purchases of service upgrades and additional services by existing customers. Our costs associated with increasing revenue from existing customers are generally lower than costs associated with generating revenue from new customers. Therefore, a reduction in the rate of revenue increase or a revenue decrease from our existing customers, even if offset by an increase in revenue from new customers, could reduce our operating margins.
Any failure by us to continue attracting new customers or grow our revenue from existing customers for a prolonged period of time could have a material adverse effect on our operating results.
- 16 -
If we overestimate or underestimate our data center capacity requirements, our operating margins and profitability could be adversely affected.
The costs of building out, leasing, and maintaining our data centers constitute a significant portion of our capital and operating expenses. In order to manage growth and ensure adequate capacity for new and existing customers while minimizing unnecessary excess capacity costs, we continuously evaluate our short and long-term data center capacity requirements. If we overestimate the demand for our services and therefore secure excess data center capacity, our operating margins could be materially reduced. If we underestimate our data center capacity requirements, we may not be able to service the expanding needs of our existing customers and may be required to limit new customer acquisition, which may materially impair our revenue growth.
In the past, we have leased data center facilities and built or maintained the facilities ourselves. Due to the lead time in expanding existing data centers or building new data centers, if we build or expand data centers ourselves, we are required to estimate demand for our services as far as two years into the future. This requirement to make customer demand estimates so far in advance makes it difficult to accurately estimate our data center space needs. Building and maintaining data center facilities is also quite expensive.
More recently, we have leased data centers from data center operators who have built or maintained the facilities for us. If there are facilities available for lease that suit our needs, our lead time to make capacity decisions is decreased. However, there is still substantial lead time necessary in making sure that available space is adequate for our needs and maximizes our investment return. If we inaccurately forecast our space needs, we may be forced to enter into a lease that is not ideal for our needs and may potentially be required to pay more to secure the space if the current customer demand were to require immediate space expansion.
We currently intend to continue to lease from data center operators, but we could be forced to re-evaluate those plans depending on the availability and cost of data center facilities, the ability to impact and control certain design aspects of the data center and economic conditions affecting the data center operator's ability to add additional facilities.
We may not be able to renew the leases on our existing facilities on terms acceptable to us, if at all, which could adversely affect our operating results.
We do not own the facilities occupied by our current data centers but occupy them pursuant to commercial leasing arrangements. The initial terms of our main existing data center leases expire over the next 20 to 30 years. Upon the expiration or termination of our data center facility leases, we may not be able to renew these leases on terms acceptable to us, if at all. If we fail to renew any data center lease and are required or choose to move the data center to a new facility, we would face significant challenges due to the technical complexity, risk, and high costs of relocating the equipment. For example, if we are required to migrate customer servers to a new facility, such migration could result in significant downtime for our affected customers. This could damage our reputation and lead us to lose current and potential customers, which would harm our operating results and financial condition.
Even if we are able to renew the leases on our existing data centers, we expect that rental rates, which will be determined based on then-prevailing market rates with respect to the renewal option periods and which will be determined by negotiation with the landlord after the renewal option periods, will be higher than rates we currently pay under our existing lease agreements. If we fail to increase revenue in our existing data centers by amounts sufficient to offset any increases in rental rates for these facilities, our operating results may be materially and adversely affected.
We rely on a number of third-party providers for data center space, equipment, maintenance and other services, and the loss of, or problems with, one or more of these providers may impede our growth or cause us to lose customers.
We rely on third-party providers to supply data center space, equipment and maintenance. For example, we lease data center space from third-party landlords, purchase equipment from equipment providers, and source equipment maintenance through third parties. While we have entered into various agreements for the lease of data center space, equipment, maintenance and other services, the third party could fail to live up to the contractual obligations under those agreements. For example, a data center landlord may fail to adequately maintain its facilities or provide an appropriate data center infrastructure for which it is responsible. If that were to happen, we would not likely be able to deliver the services to our customers that we have agreed to provide according to our standards or at all. Additionally, if the third parties that we rely on do fail to deliver on their obligations, our customers may lose confidence in our company, which would make it likely that we would not able to retain those customers, and therefore negatively impede our growth and financial results.
- 17 -
We rely on third-party software that may be difficult to replace or which could cause errors or failures of our service that could lead to lost customers or harm to our reputation.
We rely on software licensed from third parties to offer our services. This software may not continue to be available to us on commercially reasonable terms, or at all. Any loss of the right to use any of this software could result in delays in the provisioning of our services until equivalent technology is either developed by us, or, if available, is identified, obtained, and integrated, which could harm our business. Any errors or defects in third-party software or inadequate or delayed support by the third party could result in errors or a failure of our service, which could harm our operating results by adversely affecting our revenue or operating costs.
We engage and rely on third-party consultants who may fail to provide effective guidance or solutions, which could result in increased costs and loss of business opportunity.
We engage third-party consultants who provide us with guidance and solutions relating to everything from overall corporate strategy to data center operations to employee engagement. We engage these parties based on our perception of their expertise and ability to provide valuable insight or solutions in the areas that we believe need to be addressed in our business. However, these consultants may provide us with ineffective or even harmful guidance or solutions, which, if followed or implemented, could result in a loss of resources, operational failures or a loss of critical business opportunities.
Increased energy costs, power outages, and limited availability of electrical resources may adversely affect our operating results.
Our data centers are susceptible to increased regional, national or international costs of power and to electrical power outages. Our customer contracts do not allow us to pass on any increased costs of energy to our customers, which could affect our operating margins. Increases in our power costs could impact our operating results and financial condition. Since we rely on third parties to provide our data centers with power sufficient to meet our needs, our data centers could have a limited or inadequate amount of electrical resources necessary to meet our customer requirements. We attempt to limit exposure to system downtime due to power outages by using backup generators and power supplies. However, these protections may not limit our exposure to power shortages or outages entirely. Any system downtime resulting from insufficient power resources or power outages could damage our reputation and lead us to lose current and potential customers, which would harm our operating results and financial condition.
Increased Internet bandwidth costs and network failures may adversely affect our operating results.
Our success depends in part upon the capacity, reliability, and performance of our network infrastructure, including the capacity leased from our Internet bandwidth suppliers. We depend on these companies to provide uninterrupted and error-free service through their telecommunications networks. Some of these providers are also our competitors. We exercise little control over these providers, which increases our vulnerability to problems with the services they provide. We have experienced and expect to continue to experience interruptions or delays in network service. Any failure on our part or the part of our third-party suppliers to achieve or maintain high data transmission capacity, reliability or performance could significantly reduce customer demand for our services and damage our business.
As our customer base grows and usage of telecommunications capacity increases, we will be required to make additional investments in our capacity to maintain adequate data transmission speeds, the availability of which may be limited or the cost of which may be on terms unacceptable to us. If adequate capacity is not available to us as our customers’ usage increases, our network may be unable to achieve or maintain sufficiently high data transmission capacity, reliability or performance. In addition, our business would suffer if our network suppliers increased the prices for their services and we were unable to pass along the increased costs to our customers.
- 18 -
We could be required to repay substantial amounts of money to certain state and local governments if we lose tax exemptions or grants previously awarded to us, which could adversely affect our operating results.
In August 2007, we entered into an agreement with the State of Texas (Texas Enterprise Fund Grant) under which we received $14 million in state enterprise fund grants based on meeting certain employment levels in the State of Texas paying an average compensation of at least $56,000 per year (subject to increases).We are responsible for maintaining all of the jobs used in calculating these disbursements through January 2022. If we eliminate jobs for which we have drawn funds, we are subject to a clawback on the amounts we have drawn plus 3.4% interest on such amounts per year.
On August 3, 2007, we entered into a lease for approximately 67 acres of land and a 1.2 million square foot facility in Windcrest, Texas, which is in the San Antonio, Texas area, to house our corporate headquarters. In connection with this lease, we also entered into a Master Economic Incentives Agreement (“MEIA”) with the Cities of Windcrest and San Antonio, Texas; Bexar County; and certain other parties, pursuant to which we agreed to locate existing and future employees at the new facility location. The agreement requires that we meet certain employment levels each year. On July 24, 2012, the parties to the MEIA entered into an amendment which acknowledged Rackspace's achievement of the required employment commitment levels. In addition to requiring a set number of employees to be hired, the MEIA requires that the median compensation of those employees be no less than $51,000 per year. In exchange for meeting these employment obligations, the parties agreed to enter into the lease structure, pursuant to which, as a lessee of the Windcrest Economic Development Corporation, we will not be subject to most of the property taxes associated with the property for a 14-year period. If we fail to maintain these job creation requirements, we could lose a portion or all of the tax benefit being provided during the 14-year period by having to make payments in lieu of taxes ("PILOT") to the City of Windcrest. The amount of the PILOT payment would be calculated based on the amount of taxes that would have been owed for that period if the property were not exempt, and then such amount would be adjusted pursuant to certain factors, such as the percentage of employment achieved compared to the stated requirements.
Our substantial indebtedness could adversely affect our operations and financial results and prevent us from fulfilling our obligations, and we may incur substantially more debt in the future, which could exacerbate these risks.
As of December 31, 2015, we had $500 million of aggregate principal amount of indebtedness outstanding, as well as $200 million of unused borrowing capacity under our credit facility. We also have equipment and other lease obligations. The principal balance of these capital lease obligations totaled $2 million as of December 31, 2015. This amount of indebtedness could have important consequences, including: making it more difficult for us to satisfy our cash obligations; limiting our ability to fund potential acquisitions; requiring us to dedicate a portion of our cash flow from operations to payments on our indebtedness, which would reduce the availability of cash flow to fund working capital requirements, capital expenditures and other general corporate purposes; limiting our flexibility in planning for, or reacting to, general adverse economic conditions or changes in our business or industry in which we operate; and placing us at a competitive disadvantage compared to our competitors that have less debt.
In addition, we may be able to incur substantial additional indebtedness in the future. If new debt is added to the current debt levels, the related risks that we now face could intensify. Changes by any rating agency to our outlook or credit rating could negatively affect the value of both our debt and equity securities and increase the interest amounts we pay on outstanding or future debt.
We may not be able to generate sufficient cash to service our debt and other obligations.
Our ability to make payments on our indebtedness and our other obligations will depend on our financial and operating performance, which is subject to prevailing economic and competitive conditions and to certain financial, business and other factors beyond our control. We may be unable to maintain a level of cash flows from operating activities sufficient to permit us to pay the principal, premium, if any, and interest on our indebtedness.
If our cash flows and capital resources are insufficient to fund our debt service obligations, we may be forced to reduce or delay investments and capital expenditures, or to sell assets, seek additional capital or restructure or refinance our indebtedness. These alternative measures may not be successful and may not permit us to meet our scheduled debt service obligations. We cannot assure you that we would be able to implement any of these alternatives on satisfactory terms or at all. In the absence of such operating results and resources, we could face substantial liquidity problems and might be required to dispose of material assets or operations to meet our debt service and other obligations. We may not be able to consummate those dispositions or to obtain the proceeds that we could realize from them, and these proceeds may not be adequate to meet any debt service obligations then due.
- 19 -
If we are unable to service our debt obligations from cash flows, we may need to refinance all or a portion of our debt obligations prior to maturity. Our ability to refinance or restructure our debt will depend upon the condition of the capital markets and our financial condition at such time. Any refinancing of our debt could be at higher interest rates and may require us to comply with more onerous covenants, which could further restrict our business operations. We may not be able to refinance any of our indebtedness on commercially reasonable terms or at all. A failure to service our indebtedness or obtain additional financing as needed could have a material adverse effect on our business, operating results and financial condition.
The payment obligations under our equipment leases are generally secured by a significant portion of the hardware used in our data centers. If we are unable to generate sufficient cash flow from our operations or cash from other sources in order to meet the payment obligations under these equipment leases, we may lose the right to possess and operate the equipment used in our data centers, which would substantially impair our ability to provide our services, which could have a material adverse effect on our liquidity or results of operations.
Our debt agreements include restrictive covenants limiting our flexibility to manage our business; failure to comply with these covenants could result in an event of default, which could materially and adversely affect our financial position and operating results.
Our credit facility and other debt agreements require compliance with a set of financial and non-financial covenants that limit our ability to engage in activities that may be in our long-term best interests. Those covenants include financial leverage limitations and interest rate coverage requirements, as well as limitations on our ability to incur additional debt or liens, make restricted payments, sell assets, enter into affiliate transactions, merge or consolidate with other companies, make certain acquisitions and take other actions. Our failure to comply with these restrictions or covenants could result in a default under the agreements governing the related indebtedness. If a default under any such debt agreement, including our credit facility, is not cured or waived, the default could result in the acceleration of debt or other payment obligations under our debt or other agreements that contain cross-acceleration, cross-default or similar provisions, which could require us to repurchase or pay debt or other obligations prior to the date it is otherwise due, which could materially and adversely affect our liquidity and business.
Our ability to comply with covenants contained in our debt or other agreements to which we are or may become a party, including our credit facility, may be affected by events beyond our control, including prevailing economic, financial and industry conditions. Even if we are able to comply with all of the applicable covenants, the restrictions on our ability to manage our business in our sole discretion could adversely affect our business by, among other things, limiting our ability to take advantage of financings, mergers, acquisitions and other corporate opportunities that we believe would be beneficial to us.
We may require additional capital and may not be able to secure additional financing on favorable terms to meet our future capital needs, which could adversely affect our financial position and result in stockholder dilution.
In order to fund future growth, we will be dependent on significant capital expenditures. We may need to raise additional funds through equity or debt financings in the future in order to meet our operating and capital needs. We may not be able to secure additional debt or equity financing on favorable terms, or at all, at the time when we need such funding. If we are unable to raise additional funds, we may not be able to pursue our growth strategy, and our business could suffer. If we raise additional funds through further issuances of equity or convertible debt securities, our existing stockholders could suffer significant dilution in their percentage ownership of our company, and any new equity securities we issue could have rights, preferences, and privileges senior to those of holders of our common stock. In addition, any debt financing that we may obtain in the future could have restrictive covenants relating to our capital raising activities and other financial and operational matters, which may make it more difficult for us to obtain additional capital and to pursue business opportunities, including potential acquisitions.
We are exposed to commodity and market price risks that have the potential to substantially influence our profitability and liquidity.
We are a large consumer of power. During 2015, we expensed approximately $33 million to utility companies to power our data centers. We anticipate an increase in our consumption of power in the future as our sales grow. Power costs vary by locality and are subject to substantial seasonal fluctuations and changes in energy prices. Our largest exposure to energy prices currently exists at our Grapevine, Texas facility in the Dallas-Fort Worth area, where the energy market is deregulated. Power costs have historically tracked the general costs of energy, and continued increases in electricity costs may negatively impact our gross margins or operating expenses. We periodically evaluate the advisability of entering into fixed-price utilities contracts and have entered into certain fixed-price utilities contracts for some of our power consumption. If we choose not to enter into a fixed-price contract, we expose our cost structure to this commodity price risk. If we do choose to enter into a fixed-price contract, we lose the opportunity to reduce our power costs if the price for power falls below the fixed cost.
- 20 -
We have a revolving line of credit with a base rate determined by variable market rates, including the Prime Rate and the London Interbank Offered Rate ("LIBOR"). These market rates of interest are fluctuating and expose our interest expense to risk. At this point, our credit agreement does not obligate us to hedge any interest rate risk with any instruments, such as interest rate swaps or interest rate options, and we do not have any such instruments in place. As we borrow, we may enter into swaps to continuously control our interest rate risk. As a result, we are exposed to interest rate risk on our borrowings. As an example of the impact of this interest rate risk, a 100 basis point increase in LIBOR would increase the interest expense on $10 million of borrowings that are not hedged by $0.1 million annually. As of December 31, 2015, we did not have an outstanding balance on our credit facility and our debt balance consisted entirely of the fixed-rate Senior Notes due 2024.
The majority of our customers are invoiced, and the majority of our expenses are paid, by us or our subsidiaries in the functional currency of our company or our subsidiaries, respectively. However, some of our customers are currently invoiced in currencies other than the applicable functional currency. As a result, we may incur foreign currency losses based on changes in exchange rates between the date of the invoice and the date of collection. In addition, large changes in foreign exchange rates relative to our functional currencies could increase the costs of our services to non-U.S. customers relative to local competitors, thereby causing us to lose existing or potential customers to these local competitors. Thus, our results of operations and cash flows are subject to fluctuations due to changes in foreign currency exchange rates. Further, as we grow our international operations, our exposure to foreign currency risk could become more significant. To date, we have not entered into any foreign currency hedging contracts, although we may do so in the future.
We may be liable for the material that content providers distribute over our network, and we may have to terminate customers that provide content that is determined to be illegal, which could adversely affect our operating results.
The law relating to the liability of private network operators for information carried on, stored on, or disseminated through their networks is still unsettled in many jurisdictions. We have been and expect to continue to be subject to legal claims relating to the content disseminated on our network, including claims under the Digital Millennium Copyright Act, other similar legislation and common law. In addition, there are other potential customer activities, such as online gambling and pornography, where we, in our role as a hosting provider, may be held liable as an aider or abettor of our customers. If we need to take costly measures to reduce our exposure to these risks, terminate customer relationships and the associated revenue or defend ourselves against such claims, our financial results could be negatively affected.
Government regulation is continuously evolving and, depending on its evolution, may adversely affect our operating results.
We are subject to varying degrees of regulation in each of the jurisdictions in which we provide services. Local laws and regulations, and their interpretation and enforcement, differ significantly among those jurisdictions. These regulations and laws may cover taxation, privacy, data protection, pricing, content, copyrights, distribution, mobile communications, electronic device certification, electronic waste, electronic contracts and other communications, consumer protection, web services, the provision of online payment services, unencumbered Internet access to our services, the design and operation of websites, and the characteristics and quality of products and services. These laws can be costly to comply with, can be a significant diversion to management’s time and effort, and can subject us to claims or other remedies, as well as negative publicity. Many of these laws were adopted prior to the advent of the Internet and related technologies and, as a result, do not contemplate or address the unique issues that the Internet and related technologies produce. Some of the laws that do reference the Internet and related technologies have been and continue to be interpreted by the courts, but their applicability and scope remain largely uncertain.
In addition, future regulatory, judicial, and legislative changes may have a material adverse effect on our ability to deliver services within various jurisdictions. National regulatory frameworks have only recently been, or are still being, put in place in many countries. Accordingly, many countries are still in the early stages of providing for and adapting to a liberalized telecommunications market. As a result, in these markets we may encounter more protracted and difficult procedures to obtain any necessary licenses or negotiate interconnection agreements, which could negatively impact our ability to expand in these markets or increase our operating costs in these markets.
Our financial results may be adversely affected by changes in accounting principles generally accepted in the United States.
We prepare our consolidated financial statements in accordance with accounting principles generally accepted in the U.S. These principles are subject to interpretation by the Securities and Exchange Commission and various bodies formed to interpret and create appropriate accounting principles and guidance. A change in these principles or guidance, or in their interpretation, may have a significant effect on our reported results and may retroactively affect previously reported results.
- 21 -
Privacy concerns relating to our technology could damage our reputation and deter current and potential users from using our products and services.
Since our service offerings are web-based, we store substantial amounts of data for our customers on our servers, including personal information. Any systems failure or compromise of our security that results in the release of our customers’ data could (i) subject us to substantial damage claims from our customers, (ii) expose us to costly regulatory remediation and (iii) harm our reputation and brand. We may also need to expend significant resources to protect against security breaches. The risk that these types of events could seriously harm our business is likely to increase as we expand our hosting footprint.
Regulatory authorities around the world are considering a number of legislative proposals concerning data protection. In addition, the interpretation and application of data protection laws in Europe and elsewhere are still uncertain and in flux. It is possible that these laws may be interpreted and applied in a manner that is inconsistent with our data practices. If so, in addition to the possibility of fines, this could result in an order requiring that we change our data practices, which could have an adverse effect on our business. Complying with these various laws could cause us to incur substantial costs or require us to change our business practices in a manner adverse to our business.
Our ability to operate and expand our business is susceptible to risks associated with international sales and operations.
We anticipate that, for the foreseeable future, a significant portion of our revenue will continue to be derived from sources outside of the U.S. A key element of our growth strategy is to further expand our customer base internationally and successfully operate data centers in foreign markets. We have limited experience operating in foreign jurisdictions other than the U.K. and Hong Kong and expect to continue to grow our international operations. Managing a global organization is difficult, time consuming, and expensive. Our inexperience in operating our business globally increases the risk that international expansion efforts that we may undertake will not be successful. In addition, conducting international operations subjects us to new risks that we have not generally faced. These risks include:
▪ | Localization of our services, including translation into foreign languages and adaptation for local practices and regulatory requirements; |
▪ | Lack of familiarity with and unexpected changes in foreign regulatory requirements; |
▪ | Longer accounts receivable payment cycles and difficulties in collecting accounts receivable; |
▪ | Difficulties in managing and staffing international operations; |
▪ | Fluctuations in currency exchange rates; |
▪ | Potentially adverse tax consequences, including the complexities of transfer pricing, foreign value added tax systems, and restrictions on the repatriation of earnings; |
▪ | Dependence on certain third parties, including channel partners with whom we do not have extensive experience; |
▪ | The burdens of complying with a wide variety of foreign laws and legal standards; |
▪ | Increased financial accounting and reporting burdens and complexities; |
▪ | Political, social, and economic instability abroad, terrorist attacks and security concerns in general; and |
▪ | Reduced or varied protection for intellectual property rights in some countries. |
Operating in international markets also requires significant management attention and financial resources. The investment and additional resources required to establish operations and manage growth in other countries may not produce desired levels of revenue or profitability.
- 22 -
Our referral and reseller partners provide revenue to our business, and we benefit from our association with them. The loss of these participants could adversely affect our business.
Our referral and reseller partners drive revenue to our business. Most of these partners offer services that are complementary to our services; however, some may actually compete with us in one or more of our product or service offerings. These network partners may decide in the future to terminate their agreements with us and/or to market and sell a competitor’s or their own services rather than ours, which could cause our revenue to decline.
Also, we derive tangible and intangible benefits from our association with some of our network partners, particularly high profile partners that reach a large number of companies through the Internet. If a substantial number of these partners terminate their relationship with us, our business could be adversely affected.
Our acquisitions may divert our management’s attention, result in dilution to our stockholders and consume resources that are necessary to sustain our business.
We have made acquisitions, and, if appropriate opportunities present themselves, we may make additional acquisitions or investments or enter into joint ventures or strategic alliances with other companies. Risks commonly encountered in such transactions include:
▪ | The difficulty of assimilating the operations and personnel of the combined companies; |
▪ | The potential post-acquisition loss of personnel acquired through an acquisition; |
• | The risk that we may not be able to integrate the acquired services or technologies with our current services, products, and technologies; |
▪ | The potential disruption of our ongoing business; |
▪ | The diversion of management attention from our existing business; |
▪ | The inability of management to maximize our financial and strategic position through the successful integration of the acquired businesses; |
▪ | Difficulty in maintaining controls, procedures, and policies; |
▪ | The impairment of relationships with employees, suppliers, and customers as a result of any integration; |
▪ | The loss of an acquired base of customers and accompanying revenue; and |
▪ | The assumption of leased facilities, other long-term commitments or liabilities that could have a material adverse impact on our profitability and cash flow. |
As a result of these potential problems and risks, businesses that we may acquire or invest in may not produce the revenue, earnings, or business synergies that we anticipated. In addition, there can be no assurance that any potential transaction will be successfully identified and completed or that, if completed, the acquired business or investment will generate sufficient revenue to offset the associated costs or other potential harmful effects on our business.
- 23 -
Our operations and operations of our third party channel partners in countries outside of the United States are subject to a number of U.S. federal laws and regulations, including restrictions imposed by the Foreign Corrupt Practices Act, as well as trade sanctions administered by the Office of Foreign Assets Control and the Commerce Department.
We operate internationally and must comply with complex foreign and U.S. laws including the United States Foreign Corrupt Practices Act (“FCPA”), the U.K. Bribery Act 2010, and the United Nations Convention Against Corruption, which prohibit engaging in certain activities to obtain or retain business or to influence a person working in an official capacity. We must also comply with economic and trade sanctions administered by the Office of Foreign Assets Control (“OFAC”) and the U.S. Commerce Department based on U.S. foreign policy and national security goals against targeted foreign states, organizations and individuals. We do business and may in the future do additional business in countries and regions in which we may face, directly or indirectly, corrupt demands by officials or by private entities in which corrupt offers are expected. Furthermore, many of our operations require us to use third parties to conduct business or to interact with people who are deemed to be governmental officials under the FCPA. Thus, we face the risk of unauthorized payments or offers of payments or other things of value by our employees, contractors or agents. While it is our policy to implement compliance procedures to prohibit these practices, our due diligence policy and the procedures we undertake may not sufficiently vet our third party channel partners for these risks prior to entering into a contractual relationship with them. As a result, despite our policies and any safeguards and any future improvements made to them, our employees, contractors, third party channel partners and agents may engage in conduct for which we might be held responsible, regardless of whether such conduct occurs within or outside the United States. We may also be held responsible for any violations by an acquired company that occurs prior to an acquisition, or subsequent to the acquisition but before we are able to institute our compliance procedures. A violation of any of these laws, even if prohibited by our policies, may result in severe criminal and/or civil sanctions and other penalties and could have a material adverse effect on our business. Actual or alleged violations could damage our reputation, be expensive to defend, and impair our ability to do business.
Compliance with U.S. regulations on trade sanctions and embargoes administered by OFAC and the U.S Commerce Department also poses a risk to us. We cannot provide products or services to certain countries subject to U.S. trade sanctions. Furthermore, the laws and regulations concerning import activity, export recordkeeping and reporting, export control and economic sanctions are complex and constantly changing. Any failure to comply with applicable legal and regulatory trading obligations could result in criminal and civil penalties and sanctions, such as fines, imprisonment, debarment from governmental contracts, seizure of shipments and loss of import and export privileges.
Concerns about greenhouse gas emissions and the global climate change may result in environmental taxes, charges, assessments or penalties.
The effects of human activity on the global climate change have attracted considerable public and scientific attention, as well as the attention of the United States government. Efforts are being made to reduce greenhouse emissions, particularly those from coal combustion by power plants, some of which we may rely upon for power. The added cost of any environmental taxes, charges, assessments or penalties levied on these power plants could be passed on to us, increasing the cost to run our data centers. Additionally, environmental taxes, charges, assessments or penalties could be levied directly on us in proportion to our carbon footprint. Any enactment of laws or passage of regulations regarding greenhouse gas emissions by the United States, or any domestic or foreign jurisdiction we perform business in, could adversely affect our operations and financial results.
- 24 -
The trading price of our common stock may be volatile.
The market price of our common stock has been highly volatile and could be subject to wide fluctuations in response to, among other things, the factors discussed in this Risk Factors section and elsewhere in this periodic report, operating results that do not meet market analyst expectations, and other factors beyond our control, such as stock market volatility and fluctuations in the valuation of companies perceived by investors to be comparable to us. For example, between December 31, 2014 and December 31, 2015, the closing trading price of our common stock was very volatile, ranging between $24.03 and $55.39 per share, including single-day increases of up to 12.0% and declines up to 13.5%.
Further, the stock markets have experienced price and volume fluctuations that have affected our stock price and the market prices of equity securities of many other companies. These fluctuations often have been unrelated or disproportionate to the operating performance of those companies.
In the past, many companies that have experienced volatility in the market price of their stock have been subject to securities class action litigation. We may be the target of this type of litigation in the future. Securities litigation against us could result in substantial costs and divert our management’s attention from other business concerns, which could seriously harm our business.
We do not intend to pay dividends on our common stock.
We have never declared or paid any cash dividend on our capital stock. We currently intend to retain any future earnings and do not expect to pay any dividends in the foreseeable future.
Anti-takeover provisions in our organizational documents and Delaware law may discourage or prevent a change of control, even if an acquisition would be beneficial to our stockholders, which could affect our stock price adversely and prevent attempts by our stockholders to replace or remove our current management.
Our restated certificate of incorporation and amended and restated bylaws contain provisions that could delay or prevent a change of control of our company or changes in our board of directors deemed undesirable by our board of directors that our stockholders might consider favorable. Some of these provisions:
• | Authorize the issuance of blank check preferred stock, which can be created and issued by our board of directors without prior stockholder approval, with voting, liquidation, dividend, and other rights senior to those of our common stock; |
• | Provide for a classified board of directors, with each director serving a staggered three-year term; |
• | Prohibit our stockholders from filling board vacancies or increasing the size of our board, calling special stockholder meetings or taking action by written consent; |
• | Provide for the removal of a director only with cause and by the affirmative vote of the holders of a majority of the shares then entitled to vote at an election of our directors; and |
• | Require advance written notice of stockholder proposals and director nominations. |
In addition, we are subject to the provisions of Section 203 of the Delaware General Corporation Law, which may prohibit certain business combinations with stockholders owning 15% or more of our outstanding voting stock. These and other provisions in our restated certificate of incorporation, amended and restated bylaws and Delaware law could make it more difficult for stockholders or potential acquirers to obtain control of our board of directors or initiate actions that are opposed by our then-current board of directors, including a merger, tender offer or proxy contest involving our company. Any delay or prevention of a change of control transaction or changes in our board of directors could cause the market price of our common stock to decline.
- 25 -
ITEM 1B - UNRESOLVED STAFF COMMENTS
None.
ITEM 2 - PROPERTIES
Office Space
Our corporate headquarters facility is located in San Antonio, Texas and consists of a 1.2 million square foot facility located on approximately 67 acres of land. We have remodeled and are currently using approximately 0.8 million square feet of office space and will continue to remodel the formerly vacant facility as needed to facilitate our future growth and office requirements. In addition to our corporate headquarters, we have office locations throughout the U.S., the U.K., the Netherlands, Hong Kong, Switzerland, Australia, and Mexico City. As of December 31, 2015, we utilized approximately 1.2 million square feet of leased office space for customer service, operations, sales, corporate and administrative functions.
Data Centers
As of December 31, 2015, we leased data centers located in the U.S. (in Texas, Virginia, and Illinois), the U.K., Hong Kong and Australia. At December 31, 2015, we were utilizing 32 Megawatts of power at our data centers and had 62 Megawatts of power under contract.
We are continuously looking for additional data center space to accommodate future growth or that would present an attractive business opportunity for us. However, we believe that our existing office space and data center facilities are adequate for our current needs and that suitable additional or alternative space will be available in the future to meet our anticipated needs.
ITEM 3 – LEGAL PROCEEDINGS
We are party to various legal and administrative proceedings, which we consider routine and incidental to our business. For additional information, see Item 8 of Part II, "Financial Statements and Supplementary Data - Note 8 - Commitments and Contingencies."
ITEM 4 – MINE SAFETY DISCLOSURES
Not applicable.
- 26 -
PART II
ITEM 5 - MARKET FOR REGISTRANT'S COMMON EQUITY, RELATED STOCKHOLDER MATTERS AND ISSUER PURCHASES OF EQUITY SECURITIES
Market Information for Common Stock
Our common stock began trading on the New York Stock Exchange under the symbol "RAX" beginning on August 8, 2008. The following table sets forth the high and low closing prices for our common stock for the periods indicated, as reported by the New York Stock Exchange.
Fiscal Year 2014 Quarters: | High | Low | ||||||
First Quarter | $ | 40.36 | $ | 31.26 | ||||
Second Quarter | $ | 38.28 | $ | 26.28 | ||||
Third Quarter | $ | 39.79 | $ | 29.50 | ||||
Fourth Quarter | $ | 48.24 | $ | 32.80 | ||||
Fiscal Year 2015 Quarters: | High | Low | ||||||
First Quarter | $ | 54.15 | $ | 44.85 | ||||
Second Quarter | $ | 55.39 | $ | 36.98 | ||||
Third Quarter | $ | 39.25 | $ | 24.68 | ||||
Fourth Quarter | $ | 30.33 | $ | 24.03 | ||||
The last reported sale price for our common stock on the New York Stock Exchange was $46.81, $25.32 and $18.17 per share on December 31, 2014, December 31, 2015, and February 16, 2016, respectively.
Dividend Policy
We have never declared or paid any cash dividends on our common stock. We currently intend to retain any future earnings and do not expect to pay any dividends in the foreseeable future.
Stockholders
As of February 16, 2016, there were 308 registered stockholders of record of our common stock. Because many of our shares of common stock are held by brokers and other institutions on behalf of stockholders, we are unable to estimate the total number of stockholders represented by these stockholders of record.
Securities Authorized for Issuance Under Equity Compensation Plans
For information regarding securities authorized for issuance under equity compensation plans, see Part III, Item 12 - "Security Ownership of Certain Beneficial Owners and Management and Related Stockholder Matters."
- 27 -
Stock Performance Graph
The graph set forth below compares the five-year cumulative total stockholder return on our common stock between December 31, 2010 and December 31, 2015 with the cumulative total return of (i) the Russell 1000 Index and (ii) the Nasdaq Internet Total Return Index over the same period. This graph assumes the investment of $100 on December 31, 2010 in our common stock, the Russell 1000 Index and the Nasdaq Internet Total Return Index and assumes the reinvestment of dividends, if any. The Russell 1000 Index, of which Rackspace is a member, measures the performance of the large-cap segment of U.S. equities. The Nasdaq Internet Total Return Index consists of U.S. listed companies engaged in Internet-related businesses.
The comparisons shown in the graph below are based upon historical data. We caution that the stock price performance shown in the graph below is not necessarily indicative of, nor is it intended to forecast, the potential future performance of our common stock.
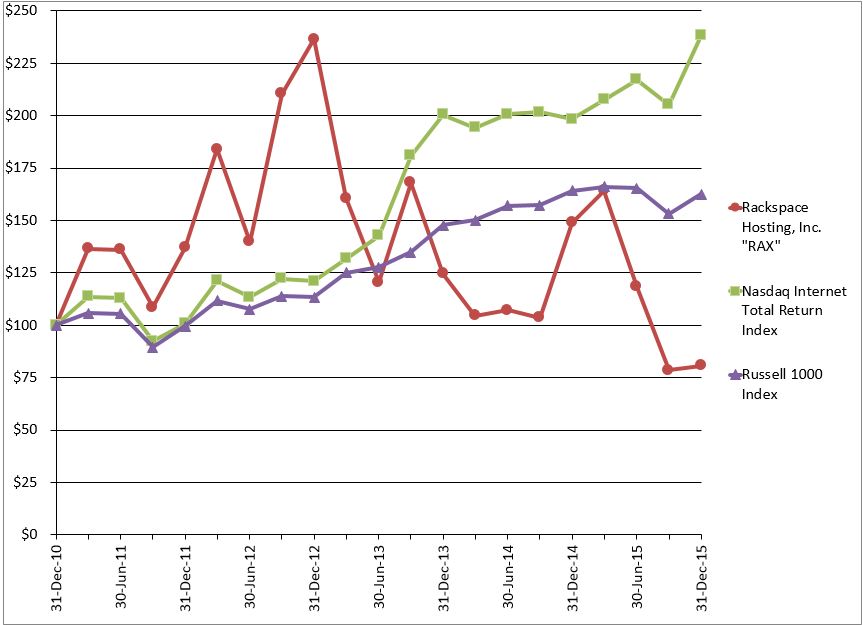
- 28 -
Issuer Purchases of Equity Securities
The table below sets forth information regarding the company’s purchases of its common stock during its fourth fiscal quarter ended December 31, 2015:
Period | Total Number of Shares Purchased | Average Price Paid per Share | Total Number of Shares Purchased as Part of Publicly Announced Programs (1) | Maximum Dollar Value of Shares that May Yet Be Purchased Under the Programs | ||||||||||
November 1, 2015-November 30, 2015 | 1,648,508 | $ | 28.13 | 1,648,508 | $ | 703,620,343 | ||||||||
December 1, 2015- December 31, 2015 | 2,373,976 | $ | 29.68 | 2,373,976 | $ | 633,165,136 | ||||||||
Total | 4,022,484 | 4,022,484 | ||||||||||||
(1) | On November 6, 2014, our board of directors authorized a program to repurchase up to $500 million of our common stock. On August 5, 2015, our board of directors increased the authorization under the existing program to a total of up to $1 billion, in addition to $200 million already purchased under the initial authorization. The program will remain in effect for a period not to exceed 24 months from authorization. Under this program, shares may be repurchased from time to time through both open market and privately negotiated transactions. |
- 29 -
ITEM 6 - SELECTED FINANCIAL DATA
The following selected financial data should be read in conjunction with our audited consolidated financial statements and the notes thereto, as well as “Management’s Discussion and Analysis of Financial Condition and Results of Operations,” included elsewhere in this document. Historical results are not necessarily indicative of future results.
The selected financial data as of December 31, 2014 and 2015 and for the years ended December 31, 2013, 2014 and 2015 have been derived from our audited consolidated financial statements, which are included elsewhere in this document. The selected financial data as of December 31, 2011, 2012 and 2013 and for the years ended December 31, 2011 and 2012 have been derived from our audited consolidated financial statements as of and for those periods, which are not included in this document.
Year Ended December 31, | |||||||||||||||||||
(In millions, except per share data) | 2011 | 2012 | 2013 | 2014 | 2015 | ||||||||||||||
Statement of comprehensive income data | |||||||||||||||||||
Net revenue | $ | 1,025.1 | $ | 1,309.2 | $ | 1,534.8 | $ | 1,794.4 | $ | 2,001.3 | |||||||||
Income from operations | $ | 123.5 | $ | 172.7 | $ | 133.1 | $ | 163.5 | $ | 206.1 | |||||||||
Net income | $ | 76.4 | $ | 105.4 | $ | 86.7 | $ | 110.6 | $ | 126.2 | |||||||||
Net income per share (1) | |||||||||||||||||||
Basic | $ | 0.59 | $ | 0.78 | $ | 0.63 | $ | 0.78 | $ | 0.91 | |||||||||
Diluted | $ | 0.55 | $ | 0.75 | $ | 0.61 | $ | 0.77 | $ | 0.90 | |||||||||
Balance sheet data | |||||||||||||||||||
Cash and cash equivalents | $ | 159.9 | $ | 292.1 | $ | 259.7 | $ | 213.5 | $ | 484.7 | |||||||||
Total assets (2) | $ | 1,017.5 | $ | 1,286.2 | $ | 1,481.0 | $ | 1,616.1 | $ | 2,014.2 | |||||||||
Non-current liabilities (2) | $ | 180.3 | $ | 187.1 | $ | 167.1 | $ | 265.5 | $ | 800.8 | |||||||||
(1) | See Item 8 of Part II, "Financial Statements and Supplementary Data- Note 2- Net Income Per Share" for an explanation of the method used to determine the number of shares used in computing basic and diluted net income per common share. |
(2) | In the fourth quarter of 2015, we elected to early adopt accounting guidance related to the balance sheet classification of deferred taxes. Prior period amounts have been revised to reflect the impact of this adoption. See Item 8 of Part II, "Financial Statements and Supplementary Data- Note 1- Company Overview, Basis of Presentation, and Summary of Significant Accounting Policies" for further discussion. |
- 30 -
ITEM 7 - MANAGEMENT’S DISCUSSION AND ANALYSIS OF FINANCIAL CONDITION AND RESULTS OF OPERATIONS
The following Management’s Discussion and Analysis (“MD&A”) is intended to help readers understand our results of operations, financial condition and cash flows and should be read in conjunction with the audited consolidated financial statements and the related notes included elsewhere in this document. References to “we,” “our,” “our company,” “us,” “the company,” “Rackspace Hosting,” or “Rackspace” refer to Rackspace Hosting, Inc. and its consolidated subsidiaries.
The MD&A is organized as follows:
• | Overview - Discussion of the nature and key trends of our business and overall analysis of financial highlights and key metrics in order to provide context for the remainder of the MD&A. |
• | Results of Operations - An analysis of our financial results comparing the year 2015 to 2014 and 2014 to 2013. |
• | Liquidity and Capital Resources - Discussion of our financial condition, sources of liquidity, changes in cash flows and capital expenditure requirements. |
• | Critical Accounting Policies and Estimates - Discussion of accounting estimates that we believe are most important to understanding the assumptions and judgments incorporated in our consolidated financial statements. |
• | Supplemental Information - Description and reconciliation of Non-GAAP Financial Measures used throughout this MD&A and financial information and key metrics for the most recent five quarters. |
This discussion contains forward-looking statements that are subject to risks and uncertainties. Actual results may differ materially from those contained in any forward-looking statements. See “Special Note Regarding Forward-Looking Statements” contained elsewhere in this document.
Overview
In 2015, we focused on deepening our service delivery and service differentiation on industry leading platforms and promoting our industry leading managed cloud expertise. Highlights from the year include:
• | Net revenue reached $2 billion on revenue growth of 11.5% from 2014 |
• | We launched managed service offerings on leading public cloud technologies Amazon Web Services and Microsoft Azure |
• | We launched our Managed Security offering to assist customers in addressing data security, protecting critical business processes, and mitigating risks from potential cyber-attacks and threats |
• | We opened a new state-of-the art data center in London |
• | We completed a $500 million offering of Senior Notes |
• | We purchased and retired $367 million of shares of our common stock through our authorized share repurchase program |
Trends in our Business
The following trends have impacted our results of our operations, and we anticipate that they will continue to impact our future results:
Emergence of Managed Cloud
The fast-growing and crowded cloud computing industry is dividing into two segments: unmanaged cloud and managed cloud. As a reflection of this trend, in 2014, Gartner Inc. distinguished for the first time between unmanaged, or “infrastructure as a service,” cloud providers and those who deliver managed cloud. For the second year in a row, Rackspace has been ranked as a leader in the Gartner Magic Quadrant for Cloud-Enabled Managed Hosting, in both North America and Europe. In a March 2015 industry report, 451 Research named Rackspace the segment leader in the "managed hosting" market segment, where managed services are wrapped around cloud infrastructure.
We believe that the managed cloud segment of the cloud computing market is a large market that represents a significant opportunity. We see a high level of interest building from companies who want to focus their scarce engineering assets on their core business and want a trusted partner to manage their cloud. They want Fanatical Support every step of the way and they want specialized expertise in running the ever-expanding set of technologies that are at the heart of cloud scale applications.
- 31 -
We believe demand for managed cloud will continue to grow for four reasons:
1. | Lack of In-House IT Expertise. As business IT applications grow in number and complexity, most companies do not have the IT staff needed to deliver a robust, reliable online presence, and to leverage their data for insights about customer behavior and internal operations. As a result, many companies have difficulty finding and hiring the specialized engineers that they need. |
2. | Strategic Resource Utilization. Larger companies that do have specialized, dedicated IT engineers would rather focus these expensive resources on strategic areas that differentiate their business rather than managing computing resources or running a website. |
3. | Market Acceptance. As companies have experienced the benefits of using managed cloud providers to handle some of their IT workloads, they have become more comfortable having those providers manage additional IT services. We expect this trend will accelerate as various barriers to the adoption of managed cloud are broken down. Advances such as software-defined networking, API-accessible single-tenant servers, and hybrid cloud are easing customers' concerns about the security of cloud computing. As time goes by, we believe businesses will move more and more of their IT workloads to managed cloud. |
4. | Accelerated Business Creation. Cloud computing has removed many of the traditional barriers to new business formation through the low costs and capital efficiency that it brings to IT infrastructure. Managed cloud does the same thing for the costs associated with infrastructure management and application expertise. Managed cloud is driving innovation and new business formation at a rapid rate and the rising supply of powerful, easy-to-use cloud computing is creating new demand. |
Our focus on the managed cloud separates us from the big providers of unmanaged, commodity cloud computing, who provide access to raw cloud infrastructure and then expect customers to do everything required to operate that infrastructure, as well as the many complex tools and applications that run on top of it. These unmanaged cloud providers have reduced the prices that they charge business customers for access to raw cloud infrastructure. This decline in cloud infrastructure prices has encouraged a proliferation of complex cloud tools and applications, requiring specialized expertise to adopt and manage. Many companies have difficulty finding and hiring the specialized engineers that they need and as a result, more businesses are turning to managed cloud providers such as Rackspace.
Our Service Delivery on Industry-Leading Platforms
In the past year, we have announced relationships with Microsoft Azure and Amazon Web Services, which are industry-leading public cloud platforms that represent growth opportunities for us. Our goal is to help customers migrate, architect, secure and operate IT environments on these platforms. Companies of all sizes are deploying IT environments on top of Microsoft Azure and Amazon Web Services. These platforms accelerate our global reach and we can now offer our services to customers that require a data center presence in locations where we do not operate a data center.
Revenue Growth
While we believe our position as a leader in managed cloud and our strategy of delivery of service on the industry-leading platforms uniquely positions us in the long-term to dominate this significant multi-billion-dollar, high-growth market, annual revenue growth decelerated in 2015. There were a number of factors that contributed to the overall revenue growth decline from 2014 to 2015, including sales and marketing issues and operational challenges in our public cloud. While we believe that we have identified many of the key challenges we faced in 2015, and taken steps to correct them, we expect the overall annual revenue growth deceleration trend to continue through 2016. This is due in part to our increased efforts to focus attention and resources on new service offerings, such as Fanatical Support for AWS and Microsoft Azure, private cloud, and managed security. These represent large and rapidly growing target markets in which Rackspace is well positioned, but as with any new businesses we project that they will take time to reach the scale required to re-accelerate our revenue growth.
Another factor that impacts our revenue growth from period to period is the timing of revenue materialization for certain large contracts. We have seen a trend of successfully acquiring large, enterprise contracts and expect that trend to continue. As we acquire more of these enterprise contracts, the volatility of revenue materialization from period to period may increase. While this factor negatively affected our revenue growth rate in the first half of 2015, the revenue growth rate in the second half of 2015 was favorably impacted by a large, multi-year agreement that began to materialize during the third quarter.
- 32 -
Financial Highlights and Key Metrics
We carefully track several financial and operational metrics to monitor and manage our growth, financial performance, and capacity. Our key metrics are structured around growth, profitability, capital efficiency, infrastructure capacity, and utilization.
The following discussion includes the presentation of constant currency revenue growth, Adjusted EBITDA, and Return on Capital which are non-GAAP financial measures. Generally, a non-GAAP financial measure is a numerical measure of a company’s performance, financial position, or cash flows that either excludes or includes amounts that are not normally included or excluded in the most directly comparable measure calculated and presented in accordance with GAAP. Other companies may calculate non-GAAP measures differently, limiting their usefulness as a comparative measure. We believe constant currency revenue growth, Adjusted EBITDA, and Return on Capital provide helpful information with respect to evaluating our performance. We have reconciled each of these non-GAAP measures to the applicable most comparable GAAP measure in the “Supplemental Information” section of this MD&A.
Growth
Three Months Ended | Year Ended | ||||||||||||||||
(Dollar amounts in millions, except average monthly revenue per server) | September 30, 2015 | December 31, 2015 | December 31, 2014 | December 31, 2015 | |||||||||||||
Net revenue | $ | 508.9 | $ | 522.8 | $ | 1,794.4 | $ | 2,001.3 | |||||||||
Revenue growth (year over year) | 10.7 | % | 10.7 | % | 16.9 | % | 11.5 | % | |||||||||
Constant currency revenue growth (year over year) | 12.9 | % | 12.0 | % | 15.5 | % | 13.7 | % | |||||||||
Number of servers deployed at period end | 118,654 | 118,177 | 112,628 | 118,177 | |||||||||||||
Average monthly revenue per server | $ | 1,444 | $ | 1,472 | $ | 1,382 | $ | 1,438 | |||||||||
Number of employees (Rackers) at period end | 6,177 | 6,189 | 5,936 | 6,189 | |||||||||||||
Total net revenue in 2015 increased 11.5% from 2014, to $2.0 billion. Revenue growth was negatively impacted by a stronger U.S. dollar relative to other foreign currencies in 2015 compared to 2014. Net revenue for 2015 would have been $39 million higher had foreign exchange rates remained constant from the prior year. On a constant currency basis, year-over-year revenue growth was 13.7%.
Our year-over-year revenue growth rate stabilized at 10.7% during the fourth quarter of 2015 after decelerating during the first three quarters of the year. Changes in foreign exchange rates negatively impacted our fourth quarter results, continuing the unfavorable trend experienced during the first three quarters of 2015. Fourth quarter net revenue of $523 million increased 2.8% on a sequential basis, which includes the negative impact of $2 million due to changes in foreign exchange rates.
We had a total of 118,177 servers deployed as of December 31, 2015, an increase of 5,549 servers from December 31, 2014 and a decrease of 477 servers from September 30, 2015. During the fourth quarter of 2015, we decommissioned approximately 2,400 servers in order to replace older, less efficient gear and also as part of the migration of customers from existing data centers to our new London data center. The decommissioned equipment was fully depreciated and retired as of December 31, 2015.
- 33 -
Profitability
Three Months Ended | Year Ended | ||||||||||||||||
(Dollar amounts in millions, except per share amounts) | September 30, 2015 | December 31, 2015 | December 31, 2014 | December 31, 2015 | |||||||||||||
Adjusted EBITDA | $ | 177.4 | $ | 183.6 | $ | 605.4 | $ | 684.1 | |||||||||
Adjusted EBITDA margin | 34.9 | % | 35.1 | % | 33.7 | % | 34.2 | % | |||||||||
Income from operations | $ | 56.5 | $ | 61.5 | $ | 163.5 | $ | 206.1 | |||||||||
Operating income margin | 11.1 | % | 11.8 | % | 9.1 | % | 10.3 | % | |||||||||
Net income | $ | 36.5 | $ | 32.1 | $ | 110.6 | $ | 126.2 | |||||||||
Net income margin | 7.2 | % | 6.1 | % | 6.2 | % | 6.3 | % | |||||||||
Diluted net income per share | $ | 0.26 | $ | 0.24 | $ | 0.77 | $ | 0.90 | |||||||||
On a year-over-year basis our margins improved, as Adjusted EBITDA increased 50 basis points to 34.2% of net revenue, income from operations increased 120 basis points to 10.3% of net revenue and net income increased 10 basis points to 6.3% of net revenue in 2015 compared to 2014. Our margins were positively impacted by lower employee-related expenses as a percentage of net revenue, because an increase in non-equity incentive bonus expense was more than offset by decreases across nearly all other employee-related expenses, with the largest decrease in employee paid time off expense due to a modification of our paid time off benefit policy. Marketing expense and professional and consulting fees also decreased as a percentage of net revenue. The impact of these decreases was partially offset by an increase in license expense due to price increases from our largest vendors and higher volume to support our growth. The overall positive impact from changes in operating expenses and depreciation and amortization expense on our net income margin was mostly offset by higher interest expense, the unfavorable impact of foreign exchange rate movements and a higher effective tax rate in 2015 compared to 2014.
Capital Efficiency, Infrastructure Capacity and Utilization
Three Months Ended | Year Ended | ||||||||||||||||
(Dollar amounts in millions) | September 30, 2015 | December 31, 2015 | December 31, 2014 | December 31, 2015 | |||||||||||||
Capital expenditures | |||||||||||||||||
Customer gear | $ | 87.1 | $ | 61.8 | $ | 276.6 | $ | 324.9 | |||||||||
Data center build outs | $ | 18.8 | $ | 10.6 | $ | 50.6 | $ | 58.6 | |||||||||
Office build outs | $ | 6.1 | $ | 7.8 | $ | 21.2 | $ | 19.5 | |||||||||
Capitalized software and other projects | $ | 15.7 | $ | 16.3 | $ | 86.7 | $ | 63.0 | |||||||||
Total capital expenditures | $ | 127.7 | $ | 96.5 | $ | 435.1 | $ | 466.0 | |||||||||
Capital efficiency and returns | |||||||||||||||||
Average capital base (1) | $ | 1,027.0 | $ | 1,060.7 | $ | 923.1 | $ | 1,002.9 | |||||||||
Capital turnover (1) (2) | 1.98 | 1.97 | 1.94 | 2.00 | |||||||||||||
Return on capital (1) (2) | 15.0 | % | 12.8 | % | 12.3 | % | 13.2 | % | |||||||||
Infrastructure capacity and utilization | |||||||||||||||||
Megawatts under contract at period end (3) | 63.6 | 62.2 | 58.1 | 62.2 | |||||||||||||
Megawatts available for use at period end (4) | 55.3 | 54.4 | 49.7 | 54.4 | |||||||||||||
Megawatts utilized at period end | 32.7 | 32.2 | 30.5 | 32.2 | |||||||||||||
Net revenue per average Megawatt of power utilized (2) | $ | 63.3 | $ | 64.5 | $ | 61.9 | $ | 63.3 | |||||||||
(1) | December 31, 2014 amounts have been revised to reflect the impact of a reclassification of certain finance obligations associated with build-to-suit leases in the consolidated balance sheets. See Item 8 of Part II, "Financial Statements and Supplementary Data - Note 7 - Leases" for further discussion. |
(2) | Metrics for the three months ended September 30, 2015 and December 31, 2015 are annualized. |
(3) | Megawatts under contract at period end represents data center capacity for which we have a contract enabling us to take control of the space. For our newest data center in London, beginning March 31, 2015, we have included four megawatts. |
(4) | Megawatts available for customer use at period end represents data center capacity that is built-out and is being used to provide service to customers. |
- 34 -
Return on Capital ("ROC") increased from 12.3% in 2014 to 13.2% in 2015, primarily due to the increase in income from operations partially offset by the negative impact of a higher effective tax rate of 34.8% compared to 30.7% in the prior year. While our average capital base increased 9% between periods, our capital turnover also increased to 2.00 for 2015, compared to 1.94 for 2014.
Our capital expenditures relate to customer gear, data center build-outs, office build-outs, and capitalized software and other projects. Each category is defined below:
Customer gear - Includes servers, firewalls, load balancers, cabinets, backup libraries, storage arrays and drives, and network cabling used in customers' computing environments.
Data center build-outs - Includes generators, uninterruptible power supplies ("UPS"), power distribution units, mechanical and electrical plants, chillers, raised floor, data center gear and other data center building improvements.
Office build-outs - Includes building improvements, raised floor, furniture and equipment.
Capitalized software and other projects - Includes salaries and payroll-related costs of employees and consultants who devote time to the development of certain internal-use software projects, purchased software licenses, and other projects that meet the criteria for capitalization.
Capital expenditures were $466 million in 2015, compared to $435 million in 2014. Higher capital expenditures in 2015 were due to increased data center costs and purchases of customer gear, largely attributable to the opening of our new London data center. During the fourth quarter of 2015, we successfully migrated hardware and customer data from two existing London data centers into our new facility. We were able to consolidate servers for more efficient usage of resources, which resulted in a decline in megawatts overall.
Our data center infrastructure is leased and tenant improvements are built-out to accommodate future revenue growth. While we try to match the amount of capacity to customer demand, we consider appropriate lead times for these leases and associated leasehold improvements, which requires us to lease and build capacity ahead of actual revenue growth. We also strive to align our investment in data center infrastructure with our revenue growth to keep utilization rates high. We measure our utilization rate as the power being consumed by all electrical equipment relative to the total available capacity in our data centers excluding portions of the data center that have not been placed on line. We pursue a modular lease and build-out strategy within our data centers that expands the operational footprint when needed. From time to time, we will be required to make significant investments in new data centers or enter into long-term facility leases to support expected growth beyond our ability to build out additional modules in existing facilities.
Disciplined Use of Capital and Management of Profitability
We have achieved net income profitability since the first quarter of 2004 through focused management of capital and profitability. We use the Economic Value Added model ("EVA"), which was developed by Stern Stewart & Co., as a tool to help ensure our growth is profitable and creates sustainable shareholder value. Virtually all capital expenditures are evaluated against this metric using a standard cost of capital. EVA is calculated for products and offerings to manage growth and profitability.
We are also very careful with our facility and data center expansion practices. Currently, we sell to businesses in more than 120 countries. Unlike a colocation provider, we do not need to be located near our customers, allowing us to build or lease centralized, cost-optimized facilities with teams of highly-trained staff. We strive to locate our regional facilities and data centers in lower-cost locations, which reduces rent, power and labor costs. We also focus on either leasing or building sections of data centers in increments so that capital expenditures or rental expenses are more closely matched to revenue growth.
We have achieved a critical mass that generates long-term cost advantages. Like any service that moves from distributed to centralized production, scale is a factor in ensuring costs are low enough to drive mass adoption. We are able to generate significant cost advantages based on our large installed customer base and growth profile. We purchase large quantities of computing and data center assets, which allows us to negotiate higher volume pricing savings.
- 35 -
Subsequent Event
On January 5, 2016, we completed the sale of assets, consisting primarily of intellectual property with an immaterial remaining net book value, of a non-strategic product line for total cash consideration of $24.0 million and other non-cash consideration. We will recognize a pre-tax gain on the disposal of these assets in our consolidated statements of comprehensive income in the first quarter of 2016.
- 36 -
Results of Operations
The following tables set forth our results of operations for the specified periods and as a percentage of our revenue for those same periods. The period-to-period comparison of financial results is not necessarily indicative of future results.
Consolidated Statements of Income:
Year Ended December 31, | ||||||||||||
(In millions) | 2013 | 2014 | 2015 | |||||||||
Net revenue | $ | 1,534.8 | $ | 1,794.4 | $ | 2,001.3 | ||||||
Costs and expenses: | ||||||||||||
Cost of revenue | 492.5 | 582.3 | 675.5 | |||||||||
Research and development | 90.2 | 117.0 | 124.9 | |||||||||
Sales and marketing | 208.4 | 237.6 | 243.5 | |||||||||
General and administrative | 297.5 | 322.1 | 351.4 | |||||||||
Depreciation and amortization | 313.1 | 371.9 | 399.9 | |||||||||
Total costs and expenses | 1,401.7 | 1,630.9 | 1,795.2 | |||||||||
Income from operations | 133.1 | 163.5 | 206.1 | |||||||||
Other income (expense): | ||||||||||||
Interest expense | (3.1 | ) | (1.9 | ) | (11.3 | ) | ||||||
Interest and other income (expense) | 0.7 | (2.0 | ) | (1.2 | ) | |||||||
Total other income (expense) | (2.4 | ) | (3.9 | ) | (12.5 | ) | ||||||
Income before income taxes | 130.7 | 159.6 | 193.6 | |||||||||
Income taxes | 44.0 | 49.0 | 67.4 | |||||||||
Net income | $ | 86.7 | $ | 110.6 | $ | 126.2 | ||||||
Consolidated Statements of Income, as a Percentage of Net Revenue:
Year Ended December 31, | |||||||||
(Percent of net revenue) | 2013 | 2014 | 2015 | ||||||
Net revenue | 100.0 | % | 100.0 | % | 100.0 | % | |||
Costs and expenses: | |||||||||
Cost of revenue | 32.1 | % | 32.5 | % | 33.8 | % | |||
Research and development | 5.9 | % | 6.5 | % | 6.2 | % | |||
Sales and marketing | 13.6 | % | 13.2 | % | 12.2 | % | |||
General and administrative | 19.4 | % | 17.9 | % | 17.6 | % | |||
Depreciation and amortization | 20.4 | % | 20.7 | % | 20.0 | % | |||
Total costs and expenses | 91.3 | % | 90.9 | % | 89.7 | % | |||
Income from operations | 8.7 | % | 9.1 | % | 10.3 | % | |||
Other income (expense): | |||||||||
Interest expense | (0.2 | )% | (0.1 | )% | (0.6 | )% | |||
Interest and other income (expense) | — | % | (0.1 | )% | (0.1 | )% | |||
Total other income (expense) | (0.2 | )% | (0.2 | )% | (0.6 | )% | |||
Income before income taxes | 8.5 | % | 8.9 | % | 9.7 | % | |||
Income taxes | 2.9 | % | 2.7 | % | 3.4 | % | |||
Net income | 5.7 | % | 6.2 | % | 6.3 | % | |||
Due to rounding, totals may not equal the sum of the line items in the table above.
- 37 -
Year ended December 31, 2015 Compared to Year ended December 31, 2014
Net Revenue
Net revenue increased $207 million, or 12%, primarily due to both the acquisition of new customers and incremental services rendered to existing customers.
Net revenue was negatively impacted by a stronger U.S. dollar relative to the functional currencies of our foreign operations in 2015 compared to 2014. Net revenue for 2015 would have been $39 million higher had foreign exchange rates remained constant from the prior year.
Cost of Revenue
Cost of revenue primarily consists of employee-related costs of our customer support teams and data center employees, as well as the costs to lease and operate our data centers. Many of our data center costs vary with the volume of services sold, including power, bandwidth, software licenses and costs related to maintenance and the replacement of IT equipment components.
Cost of revenue increased $93 million, or 16%. Of this increase, $39 million was attributable to license expense, resulting from the combination of higher costs of $32 million and the impact of a $7 million benefit recorded in 2014 for a refund of sales tax paid on previous license purchases. The $32 million increase in expense reflects price increases from our largest vendors in addition to higher volume to support our growth. Employee-related expenses increased $34 million, or 12%, driven by an 8% increase in average headcount to support business growth, higher average salaries, and an increase in non-equity incentive bonus due to a higher bonus payout percentage, partially offset by lower employee paid time off expense due to a modification of our paid time off benefit policy. Data center costs increased $14 million due to higher maintenance and rent expenses. As a percentage of net revenue, cost of revenue increased 130 basis points, from 32.5% in 2014 to 33.8% in 2015 due to higher license expense.
Research and Development Expenses
Research and development expenses are mainly costs for employees and consultants who are focused on the deployment of new technologies to address emerging trends and the development and enhancement of proprietary tools.
Research and development expenses increased $8 million, or 7%, primarily due to higher employee-related expenses resulting from a $14 million decrease in costs capitalized for the development of internal-use software in 2015 as compared to 2014. This was partially offset by a $5 million decrease in contract labor expense. Smaller increases in non-equity incentive bonus expense and share-based compensation expense were offset by lower employee paid time off expense due to a modification of our paid time off benefit policy.
Sales and Marketing Expenses
Sales and marketing expenses consist of employee-related costs of our sales and marketing employees, including sales commissions, compensation paid to certain channel partners, and costs for advertising and promoting our services and to generate customer demand.
Sales and marketing expenses increased $6 million, or 2%. Higher employee-related expenses reflected increases in salaries, sales commissions, and non-equity incentive bonus due to a higher bonus payout percentage, partially offset by lower employee paid time off expense due to a modification of our paid time off benefit policy. Spending on marketing activities increased, including an increase in the number of Rackspace::Solve events held during 2015 compared to 2014. As a percentage of net revenue, sales and marketing expenses decreased 100 basis points, from 13.2% in 2014 to 12.2% in 2015, primarily driven by a decrease of 60 basis points for employee-related expenses.
- 38 -
General and Administrative Expenses
General and administrative expenses include employee-related and facility costs for functions such as finance and accounting, human resources, information technology, and legal, as well as professional fees, general corporate costs and overhead.
General and administrative expenses increased $29 million, or 9%. Employee-related expenses increased $21 million, or 11%, primarily due to an 8% increase in average headcount, higher share-based compensation expense resulting from larger executive forfeitures in 2014 as compared to 2015, and an increase in non-equity incentive bonus expense due to increased headcount and a higher bonus payout percentage, partially offset by lower employee paid time off expense due to a modification of our paid time off benefit policy. Internal software support and maintenance expenses increased $7 million to support the growth of our business. Offsetting these increases was a decrease of $3 million for expenses, primarily legal and other professional fees, incurred in connection with a formal evaluation by our board of directors of our long-term strategic alternatives during 2014 that did not repeat in 2015.
Depreciation and Amortization Expense
Depreciation and amortization expense includes depreciation of our data center equipment, leasehold improvements and infrastructure and amortization of our customer-based intangible assets related to acquisitions, internally-developed technology, and software licenses purchased from third-party vendors.
Depreciation and amortization expense increased $28 million, or 8%. The increase was due to purchases of property and equipment to support the growth of our business, with depreciable customer gear assets representing the majority of additions. Partially offsetting the impact of these additions was a $4 million abandonment charge recorded in 2014 related to an unimproved portion of our corporate headquarters building that we intend to demolish and redevelop. As a percentage of net revenue, depreciation and amortization expense decreased 70 basis points, from 20.7% in 2014 to 20.0% in 2015. The headquarters building abandonment charge represented 20 basis points of change between years.
Other Income (Expense)
Other expense increased $9 million, from $4 million in 2014 to $13 million in 2015 . The increase was primarily due to interest expense on our finance lease obligations for build-to-suit leases. In addition, we recognized $3 million of interest expense related to the November 25, 2015 issuance of our Senior Notes.
Income Taxes
Our effective tax rate increased from 30.7% in 2014 to 34.8% in 2015. The differences between our effective tax rate and the U.S. federal statutory rate of 35% principally result from our geographical distribution of taxable income, tax credits, contingency reserves for uncertain tax positions and permanent differences between the book and tax treatment of certain items. The effective tax rate increased in 2015 primarily as a result of a smaller portion of our profits earned outside of the U.S. compared to 2014. Our foreign earnings are generally taxed at lower rates than in the United States.
For a full reconciliation of our effective tax rate to the U.S. federal statutory rate of 35% and further explanation of our provision for taxes, see Item 8 of Part II, “Financial Statements and Supplementary Data – Note 11 – Taxes.”
Net Income
Net income increased $16 million, or 14%, from $111 million in 2014 to $126 million in 2015. Net income per diluted share was $0.90 in 2015, an increase of $0.13, or 17% from 2014. Net income per diluted share for 2015 includes the positive impact of a 2% decrease in our weighted-average diluted shares outstanding, primarily due to the purchase and retirement of shares under our share repurchase program.
- 39 -
Year ended December 31, 2014 Compared to Year ended December 31, 2013
Net Revenue
Net revenue increased $260 million, or 17%, primarily due to both the acquisition of new customers and incremental services rendered to existing customers.
Also contributing to the revenue increase was the positive impact of a weaker U.S. dollar relative to the functional currencies of our foreign operations in 2014 compared to 2013. Net revenue for 2014 would have been approximately $22 million lower had foreign exchange rates remained constant from the prior year.
Cost of Revenue
Cost of revenue increased $90 million, or 18%. Of this increase, $45 million was attributable to employee-related expenses, such as salaries, benefits and incentive compensation, driven by an 11% increase in average headcount to support business growth. License costs increased $27 million, as higher expenses of $34 million related to our growth were partially offset by a $7 million benefit recorded in the third quarter of 2014 related to a refund of sales tax paid on previous license purchases. Data center costs increased $22 million, mostly related to rent, maintenance and utilities. As a percentage of net revenue, cost of revenue increased 40 basis points, from 32.1% in 2013 to 32.5% in 2014, primarily driven by higher license expense.
Research and Development Expenses
Research and development expenses increased $27 million, or 30% due to increased employee-related expenses, such as salaries, benefits and incentive compensation. During 2014, we invested in additional headcount to support research and development activities to enhance our existing offerings and develop new products and services.
Sales and Marketing Expenses
Sales and marketing expenses increased $29 million, or 14%. Employee-related expenses increased $22 million primarily due to increased headcount and higher sales commissions consistent with our revenue growth. The remaining increase was primarily due to increased spending on marketing and promotional activities such as online advertising, customer events and sponsorships, partially offset by a decrease related to the 2013 open cloud branding campaign.
General and Administrative Expenses
General and administrative expenses increased $25 million, or 8%, but decreased as a percentage of net revenue from 19.4% in 2013 to 17.9% in 2014. Included in general and administrative expenses was $3 million of expenses, primarily legal and other professional fees, incurred in connection with a formal evaluation by our board of directors of the company's long-term strategic alternatives during 2014. Employee-related expenses increased $16 million, primarily due to increased headcount, salaries and contract labor, while share-based compensation was flat as expense from new grants was offset by certain executive forfeitures in early 2014. Internal software support and maintenance expenses increased $5 million to support the growth of the business. Professional fees decreased $3 million, primarily due to higher spending in 2013 on strategic consulting projects.
Depreciation and Amortization Expense
Depreciation and amortization expense increased $59 million, or 19%. During 2014, we recorded a $4 million abandonment charge related to an unimproved portion of our corporate headquarters building that we intend to demolish and redevelop. The remaining increase was due to purchases of property and equipment to support the growth of our business, with depreciable customer gear assets representing the majority of additions. Depreciation and amortization expense increased as a percentage of net revenue, from 20.4% in 2013 to 20.7% in 2014. The headquarters building abandonment charge represented 20 basis points of the increase between years.
Other Income (Expense)
Other expense was $3.9 million and $2.4 million for 2014 and 2013, respectively. The increase in other expense of $1.5 million between years was mostly driven by the unfavorable impact of foreign exchange rate movements, partially offset by lower interest expense related to a reduction in the average balance of outstanding interest-bearing debt.
- 40 -
Income Taxes
Our effective tax rate decreased from 33.7% in 2013 to 30.7% in 2014. The differences between our effective tax rate and the U.S. federal statutory rate of 35% principally result from our geographical distribution of taxable income, tax credits, contingency reserves for uncertain tax positions and permanent differences between the book and tax treatment of certain items. The effective tax rate decreased in 2014 primarily as a result of a larger portion of our profits earned outside of the U.S. compared to 2013. Our foreign earnings are generally taxed at lower rates than in the United States.
For a full reconciliation of our effective tax rate to the U.S. federal statutory rate of 35% and further explanation of our provision for taxes, see Item 8 of Part II, “Financial Statements and Supplementary Data – Note 11 – Taxes.”
Liquidity and Capital Resources
We primarily finance our operations and capital expenditures with internally-generated cash from operations and, if necessary, borrowings under our revolving credit facility. We believe that our current sources of funds will be sufficient to meet our operating and capital needs in the foreseeable future.
Our long-term future capital requirements will depend on many factors, most importantly our revenue growth and our investments in new technologies and services. Our future ability to generate cash from operations will depend on our financial performance, general economic conditions, technology trends and developments, and other factors. We could seek additional funding in the form of debt or equity. We maintain debt levels that we establish through consideration of a number of factors, including cash flow expectations, cash requirements for operations, investment plans (including acquisitions), share repurchase plans, and our overall cost of capital. As of December 31, 2015, our target debt level under our capital structure policy is 0.75X Adjusted EBITDA for the most recent four quarters.
Cash and Cash Equivalents
At December 31, 2015, we held $485 million in cash and cash equivalents, of which $145 million is held by foreign entities. We consider the undistributed earnings of our foreign subsidiaries as of December 31, 2015 to be permanently reinvested and, accordingly, no U.S. income taxes have been provided thereon. We have not repatriated earnings to the U.S., and we do not anticipate the need to do so in the future as we believe sources of funds available in the U.S. are sufficient to meet our domestic liquidity needs arising in the ordinary course of business.
Capital and Finance Lease Obligations
In prior years, we financed a portion of our purchases of data center equipment through capital leases with our major vendors. Although we have shifted our strategy in recent years and currently pay cash for our equipment purchases, we believe borrowings from vendor-financed arrangements will continue to be available if we choose this method of financing in the future. As of December 31, 2014 and December 31, 2015, we had $17 million and $2 million outstanding with respect to these arrangements, respectively.
Additionally, we have entered into multiple real estate development and build-to-suit lease arrangements with independent real estate developers to design, construct and finance certain real estate projects that result in finance lease obligations. As of December 31, 2014 and December 31, 2015, we had $117 million and $164 million outstanding with respect to these arrangements, respectively. See Item 8 of Part II, "Financial Statements and Supplementary Data - Note 7- Leases" for more information on our finance lease obligations.
- 41 -
Debt
Revolving Credit Facility
On November 25, 2015, we entered into a new, five-year $200 million unsecured revolving credit facility (the "Revolving Credit Facility"), with proceeds from loans under the facility available for working capital and general corporate purposes. We have the option to increase the amount of the Revolving Credit Facility by up to an additional $200 million, subject to certain terms and conditions. The Revolving Credit Facility matures on November 25, 2020 and replaced our previous revolving credit facility that was to mature on September 26, 2016. Outstanding borrowings of $140 million under the previous revolving credit facility were repaid on November 25, 2015 using proceeds from the issuance of the Senior Notes, discussed below. As of December 31, 2015, we had no outstanding borrowings under the Revolving Credit Facility and $0.4 million of undrawn letters of credit.
The facility requires the maintenance of a maximum consolidated total leverage ratio and a minimum consolidated fixed charge ratio in addition to customary affirmative and negative covenants, including covenants that limit or restrict our ability to grant liens, incur indebtedness, sell assets, make investments and make restricted payments subject to customary exceptions for a credit facility of this size and type. As of December 31, 2015, we were in compliance with all covenants under this facility.
Senior Notes
On November 25, 2015, we completed the issuance of $500 million aggregate principal amount of 6.5% Senior Notes due 2024 (the "Senior Notes"). The Senior Notes will mature on January 15, 2024 and bear interest at a rate of 6.5% per year, payable semi-annually on January 15 and July 15 of each year. The first interest payment date is July 15, 2016.
The Senior Notes indenture contains covenants that, among other things, limit our ability to incur additional debt, pay dividends or make other restricted payments, purchase, redeem or retire capital stock or subordinated debt, make asset sales, incur liens, enter into sale-leaseback transactions, provide subsidiary guarantees, engage in certain transactions with affiliates, make investments, and engage in mergers or consolidations. As of December 31, 2015, the outstanding principal amount of the Senior Notes was $500 million, and we were in compliance with all covenants under the indenture.
Share Repurchase Program
On November 6, 2014, our board of directors authorized a share repurchase program to repurchase up to $500 million of our common stock.
On November 12, 2014, we entered into an accelerated share repurchase ("ASR") agreement with a financial institution and paid $200 million to repurchase our common stock. We received an initial delivery of 3.3 million shares of common stock in November 2014, and we received an additional 0.9 million shares of common stock in May 2015 as final settlement of the ASR. All shares received were subsequently retired.
On August 5, 2015, our board of directors increased the authorization under the existing share repurchase program to a total of up to $1 billion, in addition to the $200 million already purchased under the ASR. The program will remain in effect for a period not to exceed 24 months from authorization. Under this program, shares may be repurchased from time to time through both open market and privately negotiated transactions.
In addition to the 0.9 million shares of common stock received as final settlement of the ASR, we repurchased $367 million, or 12.2 million shares, of our common stock on the open market during 2015. These shares were subsequently retired. Therefore, as of December 31, 2015, approximately $633 million remained available for additional purchases under the current program. We intend to make additional purchases in 2016, subject to market conditions, cash needs to support our business, the terms of our debt agreements and arrangement of financing. We expect to fund our future share repurchases with proceeds from debt issuances and future free cash flow.
- 42 -
Cash Flows
The following table sets forth a summary of our cash flows for the periods indicated:
Year Ended December 31, | ||||||||||||
(In millions) | 2013 | 2014 | 2015 | |||||||||
Cash provided by operating activities | $ | 444.1 | $ | 542.5 | $ | 583.6 | ||||||
Cash used in investing activities | $ | (464.2 | ) | $ | (428.1 | ) | $ | (479.4 | ) | |||
Cash provided by (used in) financing activities | $ | (11.8 | ) | $ | (157.3 | ) | $ | 171.5 | ||||
Cash Provided by Operating Activities
Net cash provided by operating activities results primarily from cash received from customers for our cloud computing service offerings, offset by cash payments made for employee and consultant compensation (less amounts capitalized related to internal-use software that are reflected as cash used in investing activities), data center costs, license costs, marketing programs, taxes, and other general corporate expenditures.
From 2014 to 2015, net cash provided by operating activities increased $41 million, or 8%, primarily driven by a $35 million increase in net income adjusted for non-cash items including depreciation and amortization expense, share-based compensation expense and excess tax benefits from share-based compensation arrangements. Additionally, changes in operating assets and liabilities resulted in a $6 million increase in net cash provided by operating activities between years, with the largest changes in accounts receivable, prepaid expenses and other current assets, and deferred revenue. The change in accounts receivable resulted in a $13 million increase in operating cash flow between years primarily due to improved collections at the end of 2015, as the increase in our accounts receivable balance during 2015 was in line with the 12% increase in net revenue. An increase in advance payments from certain customers during 2015 resulted in a higher deferred revenue balance and drove a $13 million increase in operating cash flow in 2015 compared to 2014. Partially offsetting these increases was a decrease of $16 million in operating cash flow related to prepaid expenses and other current assets, primarily due to timing differences of rent payments at the end of 2015 compared to 2014 and increases in certain prepaid operating expenses to support the growth of our business, such as licenses and internal software support and maintenance.
From 2013 to 2014, net cash provided by operating activities increased $98 million, or 22%, primarily due to the increase in net income adjusted for depreciation and amortization expense and share-based compensation expense. Changes in operating assets and liabilities did not have a material effect on the change in net cash provided by operating activities.
Cash Used in Investing Activities
Net cash used in investing activities primarily consists of capital expenditures to meet the demands of our growing customer base. The largest outlays of cash are for purchases of customer gear, data center and office build-outs, and capitalized payroll costs related to internal-use software development.
From 2014 to 2015, net cash used in investing activities increased $51 million primarily due to a $45 million increase in cash purchases of property and equipment. Higher capital expenditures in 2015 were due to increased data center costs and purchases of customer gear, largely attributable to the opening of our new London data center, partially offset by decreases in software purchases and capitalized software development costs.
From 2013 to 2014, net cash used in investing activities decreased $36 million largely due to a $22 million decrease in cash purchases of property and equipment. Capital expenditures were higher in 2013 due to increased equipment and data center costs associated with the global launch of our Performance Cloud Servers, the purchase of land for future expansion of our U.K. data center and the tenant improvement build-out of several office facilities. Additionally, there was a $10 million decrease in net cash paid for acquisitions because we did not make any acquisitions in 2014.
- 43 -
Cash Provided by or Used in Financing Activities
Financing activities generally include cash activity related to debt and other long-term credit arrangements (i.e. capital and finance lease obligations), including proceeds from and repayments of borrowings, and cash activity related to the issuance and repurchase of equity.
Net cash provided by financing activities was $172 million in 2015 compared to net cash used in financing activities of $157 million in 2014, a change of $329 million. The largest driver of this change was the receipt of $500 million in proceeds from the issuance of the Senior Notes in November 2015, partially offset by an increase of $167 million in repurchases of our common stock between years. Other notable financing activities in 2015 include the repayment of the $25 million balance that was outstanding on our previous revolving credit facility as of December 31, 2014 and the borrowing and subsequent repayment of $140 million under this facility during 2015.
From 2013 to 2014, net cash used in financing activities increased $146 million, primarily due to $200 million paid for shares of our common stock under the ASR agreement described above, partially offset by $25 million borrowed under our revolving credit facility. Furthermore, there was an additional $14 million cash outflow in 2014 for the withholding of shares related to the vesting of certain restricted stock in satisfaction of employee tax obligations. All shares purchased in 2014 were subsequently retired. These financing cash outflows were partially offset by a $26 million decrease in capital lease payments resulting from our shift away from using capital leases for equipment purchases, a $9 million increase in proceeds from employee stock plans, and $6 million received from the Texas Enterprise fund grant.
Contractual Obligations
The following table summarizes our contractual obligations as of December 31, 2015:
(In millions) | Total | 2016 | 2017-2018 | 2019-2020 | 2021 and Beyond | |||||||||||||||
Debt (1) | $ | 764.6 | $ | 19.5 | $ | 65.0 | $ | 65.0 | $ | 615.1 | ||||||||||
Capital leases (2) | 1.9 | 1.7 | 0.2 | — | — | |||||||||||||||
Build-to-suit leases (3) | 345.1 | 8.7 | 27.5 | 32.6 | 276.3 | |||||||||||||||
Operating leases (4) | 846.1 | 71.4 | 132.9 | 126.6 | 515.2 | |||||||||||||||
Purchase obligations (5) | 89.0 | 74.5 | 12.8 | 0.6 | 1.1 | |||||||||||||||
Asset retirement obligations (6) | 8.1 | — | 0.2 | 3.9 | 4.0 | |||||||||||||||
Total contractual obligations (7) | $ | 2,054.8 | $ | 175.8 | $ | 238.6 | $ | 228.7 | $ | 1,411.7 | ||||||||||
(1) | Debt obligations consist of principal and interest on our $500 million aggregate principal amount of 6.5% Senior Notes due 2024. |
(2) | Capital lease obligations include principal and interest on our capital lease agreements to finance certain equipment. |
(3) | Build-to-suit lease obligations include principal and interest on our build-to-suit lease arrangements with independent real estate developers to design, construct and lease certain real estate projects. |
(4) | Operating lease obligations represent minimum payments on our operating leases for data center facilities and office space. |
(5) | Non-cancelable purchase obligations primarily relate to minimum commitments for certain software licenses, hardware purchases, and costs associated with our data centers, including bandwidth and electricity. |
(6) | Asset retirement obligations represent our best estimate of commitments to return leased property to original condition upon lease termination. |
(7) | We have excluded $31 million of uncertain tax positions as we are unable to make a reasonably reliable estimate of the timing of payments. |
- 44 -
Off-Balance Sheet Arrangements
During the periods presented, we did not have any relationships with unconsolidated entities or financial partnerships, such as entities often referred to as structured finance or special purpose entities. These entities are typically established for the purpose of facilitating off-balance sheet arrangements or other contractually narrow or limited purposes.
We have entered into various indemnification arrangements with third parties, including vendors, customers, landlords, our officers and directors, stockholders of acquired companies, and third parties to whom and from whom we license technology. Generally, these indemnification agreements require us to reimburse losses suffered by third parties due to various events, such as lawsuits arising from patent or copyright infringement or our negligence. Certain of these agreements require us to indemnify the other party against certain claims relating to property damage, personal injury or the acts or omissions by us, our employees, agents or representatives. These indemnification obligations are considered off-balance sheet arrangements. To date, we have not encountered material costs as a result of such obligations and have not accrued any material liabilities related to such indemnification obligations in our consolidated financial statements.
See Item 8 of Part II, "Financial Statements and Supplementary Data – Note 8 – Commitments and Contingencies" for more information related to these indemnification arrangements.
Critical Accounting Policies and Estimates
Our consolidated financial statements are prepared in accordance with GAAP. In many cases, the accounting treatment of a particular transaction is specifically dictated by GAAP and does not require management’s judgment in its application, while in other cases, significant judgment is required in making estimates and selecting among available alternative accounting standards that allow different accounting treatment for similar transactions. These judgments and estimates affect the reported amounts of assets, liabilities, revenue, costs and expenses and related disclosures. We consider these policies that require significant management judgment and estimates to be used in the preparation of our consolidated financial statements to be critical accounting policies.
We review our estimates and judgments on an ongoing basis, including those related to revenue recognition, service credits, allowance for doubtful accounts, property and equipment, goodwill and intangibles, contingencies, the fair valuation of stock related to share-based compensation, software development, and income taxes.
We base our estimates on historical experience and on various other assumptions that we believe to be reasonable under the circumstances to determine the carrying values of assets and liabilities. In many instances, we could have reasonably used different accounting estimates, and in other instances changes in the accounting estimates are reasonably likely to occur from period-to-period. Accordingly, actual results could differ significantly from the estimates made by our management. To the extent that there are material differences between these estimates and actual results, our future financial statement presentation, financial condition, results of operations and cash flows will be affected.
Revenue Recognition
We recognize revenue when persuasive evidence of an arrangement exists, service has been provided to the customer, the amount of fees to be paid by the customer is fixed or determinable, and collectibility is reasonably assured. We provide managed cloud computing services to our customers and generally recognize revenue on a monthly basis, as services are delivered. For services that are billed according to customer usage, revenue is recognized in the month in which the usage is consumed. Implementation and set-up fees are amortized over the estimated average customer life. If a customer terminates its relationship with us before the expiration of the estimated average customer life, any unamortized installation fees are recognized as revenue at that time. Amounts that have been invoiced and accruals for unbilled usage are recorded in accounts receivable and in deferred revenue or revenue, depending on whether the revenue recognition criteria have been met. Therefore, deferred revenue primarily consists of prepaid service fees and set-up fees.
Our customers generally have the right to cancel their contracts by providing prior notice to us of their intent to cancel the remainder of the contract term. In the event that a customer cancels their contract, they are not entitled to a refund for services already rendered.
- 45 -
For multiple-element arrangements, judgment is required to determine whether elements can be accounted for as separate units of accounting, and if so, the fair value for each of the elements using a hierarchy for allocating revenue to the elements: (i) vendor-specific objective evidence of fair value, (ii) third-party evidence, and (iii) best estimate of selling price. Revenue arrangements with multiple deliverables are divided into separate units of accounting when the delivered item(s) has value to the customer on a standalone basis, which is normally the situation for our services contracts. In this circumstance, revenue is recognized for each unit of accounting based on its relative estimated selling price. Estimated selling prices are management’s best estimates of the prices that we would charge our customers if we were to sell the standalone elements separately and include considerations of customer demand, prices charged by us and others for similar deliverables, and the cost of providing the service. When elements are delivered in different periods of time, revenue is recognized as each element is delivered.
Valuation of Accounts Receivable and Service Credits
We record an allowance for doubtful accounts on trade accounts receivable for estimated losses resulting from the inability of our customers to make required payments. When evaluating the adequacy of the allowance, we analyze the overall quality of our accounts receivable portfolio, current economic conditions and trends, historical bad debt write-offs, customer creditworthiness, and specifically identified customer risks. If actual collections of customer receivables differ from our estimates, additional allowances may be required which could have an impact on our results of operations.
Our customer agreements provide that we will achieve certain service levels related primarily to network uptime, critical infrastructure availability, and hardware replacement. To the extent that such service levels are not achieved, we may be obligated to provide credits to our customers. We record a reserve for estimated customer credits on trade accounts receivable to recognize estimated adjustments to receivables and record a reduction to revenue. We base this reserve on historical experience and specific knowledge of factors impacting our delivery of services such as third-party power or service issues, unfavorable weather, or other interruptions or conditions. If actual service levels achieved vary from our estimates, we may be required to increase our reserve which could have an impact on our results of operations.
Property, Equipment, and Other Long-Lived Assets
In providing services to our customers, we utilize significant amounts of property and equipment, which we depreciate on a straight-line basis over their estimated useful lives. As changes in technology or changes in the intended use of property and equipment may cause the estimated useful life or the value of these assets to change, we periodically review the appropriateness of the estimated economic useful lives for each category of property and equipment.
Long-lived assets, including property and equipment and intangible assets, are reviewed for impairment whenever events or changes in circumstances indicate that the carrying amount may not be recoverable. Recoverability of assets to be held and used is measured by a comparison of the carrying amount of an asset in conjunction with its asset group compared to the estimated undiscounted future cash flows expected to be generated by the asset group. If the carrying amount of the asset group exceeds its estimated future cash flows, an impairment charge is recognized in the amount by which the carrying amount of the asset group exceeds the fair value of the assets. There were no impairment charges recorded in 2013, 2014 or 2015.
Goodwill
Goodwill is subject to periodic testing for impairment at the reporting unit level. We are required to perform an evaluation of goodwill on an annual basis or more frequently if events or circumstances indicate a potential impairment. The annual test for impairment is conducted as of October 1st. The evaluation of goodwill for impairment is judgmental in nature and requires the use of significant estimates and assumptions around the identification of reporting units and determination of the fair value of a reporting unit. Changes in these estimates and assumptions could produce materially different results.
We did not identify any triggering events in 2015 that required us to perform an interim impairment test. Additionally, upon conclusion of our 2015 annual test, we noted that the fair value of our reporting unit was substantially in excess of the carrying value of the reporting unit’s net assets.
- 46 -
Contingencies
We accrue for contingent obligations when the obligation is probable and the amount is reasonably estimable. As facts concerning contingencies become known, we reassess our position and make appropriate adjustments to the consolidated financial statements. Estimates that are particularly sensitive to future changes include those related to tax, legal, and other regulatory matters, changes in the interpretation and enforcement of international laws, and the impact of local economic conditions and practices, which are all subject to change as events evolve and as additional information becomes available during the administrative and litigation process. Changes in our estimates and assumptions could have a material impact on our business, results of operations, financial position, or cash flows.
Share-Based Compensation
Share-based compensation cost is measured at the grant date based on the fair value of the award and is recognized as expense over the requisite service period. Determining the fair value of share-based awards at the grant date and the probability of performance awards vesting require judgment, as does estimating the amount of share-based awards that are expected to be forfeited. If actual results differ significantly from these estimates, share-based compensation expense and our results of operations could be impacted.
Software Development
We capitalize the salaries and related compensation costs of employees and consultants who devote time to the development of certain internal-use software projects. Judgment is required in determining whether an enhancement to previously developed software is significant and creates additional functionality to the software, thus resulting in capitalization. All other software development costs are expensed as incurred. Capitalized software development costs are amortized over the expected useful life of the software, which is generally three years; however, we evaluate the nature and utility of each project which can result in a useful life ranging between one and five years for certain projects.
Income Taxes
We are subject to income taxes in the U.S. and numerous foreign jurisdictions. Significant judgments and estimates are required in evaluating our tax positions and determining our provision for income taxes. Although we believe we have adequately reserved for our uncertain tax positions, no assurance can be given that the final tax outcome of these matters will not be different. To the extent that the final tax outcome of these matters is different than the amounts recorded, such differences will impact the provision for income taxes in the period in which such determination is made.
Historically, our effective tax rates have not differed significantly from the statutory rate, and any differences are primarily due to the tax impact of foreign operations, research and development tax credits, state taxes, contingency reserves for uncertain tax positions and certain benefits realized related to share based compensation. Our future effective tax rates could be adversely affected by earnings being lower than anticipated in countries where we have lower statutory rates and higher than anticipated in countries where we have higher statutory rates, by changes in the valuation of our deferred tax assets or liabilities, or by changes in tax laws, regulations, accounting principles, or interpretations thereof. In addition, we are subject to the continuous examination of our income tax returns by the Internal Revenue Service and other tax authorities. We regularly assess the likelihood of adverse outcomes resulting from these examinations to determine the adequacy of our provision for income taxes.
Deferred income taxes arise from temporary differences between the tax basis of assets and liabilities and their reported amounts in the consolidated financial statements, which will result in taxable or deductible amounts in the future. In evaluating our ability to recover our deferred tax assets within the jurisdiction from which they arise, we consider all available positive and negative evidence, including scheduled reversals of deferred tax liabilities, projected future taxable income, tax-planning strategies, and results of recent operations. The assumptions about future taxable income require significant judgment and are consistent with the plans and estimates we are using to manage the underlying businesses.
Recent Accounting Pronouncements
For a description of accounting pronouncements recently issued, see Item 8 of Part II, "Financial Statements and Supplementary Data - Note 1- Company Overview, Basis of Presentation, and Summary of Significant Accounting Policies."
- 47 -
Supplemental Information
Non-GAAP Financial Measures
Throughout this MD&A, we have utilized certain non-GAAP financial measures in discussions and analysis of our financial performance. For each of these non-GAAP financial measures, we have described the reasons for their use and have provided reconciliations to the most directly comparable GAAP measure below.
Return on Capital ("ROC")
We believe that ROC is an important metric for investors in evaluating our company’s performance. ROC measures how effectively a company generates profits from the capital that is deployed. We calculate ROC by dividing net operating profit after tax by our average capital base. The following tables present a reconciliation of ROC to return on assets, which we calculate directly from amounts on the Consolidated Statements of Comprehensive Income and the Consolidated Balance Sheets.
Year Ended December 31, | ||||||||||||
(In millions) | 2013 | 2014 | 2015 | |||||||||
Income from operations | $ | 133.1 | $ | 163.5 | $ | 206.1 | ||||||
Adjustment for build-to-suit lease impact (1) | — | — | (3.8 | ) | ||||||||
Income from operations, adjusted | $ | 133.1 | $ | 163.5 | $ | 202.3 | ||||||
Effective tax rate | 33.7 | % | 30.7 | % | 34.8 | % | ||||||
Net operating profit after tax (NOPAT) | $ | 88.3 | $ | 113.3 | $ | 131.9 | ||||||
Net income | $ | 86.7 | $ | 110.6 | $ | 126.2 | ||||||
Total assets at period end (2) | $ | 1,481.0 | $ | 1,616.1 | $ | 2,014.2 | ||||||
Add: Unamortized debt issuance costs (3) | — | — | 7.6 | |||||||||
Less: Excess cash (4) | (210.8 | ) | (156.8 | ) | (422.0 | ) | ||||||
Less: Accounts payable and accrued expenses, accrued compensation and benefits, and income and other taxes payable | (195.8 | ) | (215.8 | ) | (205.6 | ) | ||||||
Less: Deferred revenue (current and non-current) | (26.6 | ) | (22.3 | ) | (31.2 | ) | ||||||
Less: Other non-current liabilities, deferred income taxes, deferred rent, and finance lease obligations for build-to-suit leases (2) (5) | (145.0 | ) | (262.6 | ) | (306.6 | ) | ||||||
Capital base (5) | $ | 902.8 | $ | 958.6 | $ | 1,056.4 | ||||||
Average total assets (2) (6) | $ | 1,382.1 | $ | 1,601.4 | $ | 1,778.3 | ||||||
Average capital base (5) (6) | $ | 802.8 | $ | 923.1 | $ | 1,002.9 | ||||||
Return on assets (Net income/Average total assets) (2) | 6.3 | % | 6.9 | % | 7.1 | % | ||||||
Return on capital (NOPAT/Average capital base) (5) | 11.0 | % | 12.3 | % | 13.2 | % | ||||||
(1) | Reflects additional expense we would have expected to record if our build-to-suit lease arrangements had been deemed operating leases instead of finance lease obligations for build-to-suit leases. Calculated as the excess of estimated straight-line rent expense over actual depreciation expense for completed real estate projects under build-to-suit lease arrangements. |
(2) | In the fourth quarter of 2015, we elected to early adopt accounting guidance related to the balance sheet classification of deferred taxes. Prior period amounts have been revised to reflect the impact of this adoption. See Item 8 of Part II, "Financial Statements and Supplementary Data- Note 1- Company Overview, Basis of Presentation, and Summary of Significant Accounting Policies" for further discussion. |
(3) | Amount recorded as a direct deduction from the carrying value of the long-term debt liability in the consolidated balance sheets. |
(4) | Defined as the amount of cash and cash equivalents that exceeds our operating cash requirements, which is calculated as three percent of our annualized net revenue for the three months prior to the period end. |
(5) | In the first quarter of 2015, we reclassified certain finance obligations associated with build-to-suit leases in the consolidated balance sheets. Prior period amounts have been revised to reflect the impact of this reclassification. See Item 8 of Part II, "Financial Statements and Supplementary Data - Note 7 - Leases" for further discussion. |
(6) | Average based on ending balances for the most recent five quarters. |
- 48 -
Three Months Ended | ||||||||||||||||||||
(In millions) | December 31, 2014 | March 31, 2015 | June 30, 2015 | September 30, 2015 | December 31, 2015 | |||||||||||||||
Income from operations | $ | 50.0 | $ | 44.4 | $ | 43.7 | $ | 56.5 | $ | 61.5 | ||||||||||
Adjustment for build-to-suit lease impact (1) | — | — | (0.4 | ) | (1.1 | ) | (2.3 | ) | ||||||||||||
Income from operations, adjusted | $ | 50.0 | $ | 44.4 | $ | 43.3 | $ | 55.4 | $ | 59.2 | ||||||||||
Effective tax rate | 25.1 | % | 32.4 | % | 32.4 | % | 30.6 | % | 42.5 | % | ||||||||||
Net operating profit after tax (NOPAT) | $ | 37.5 | $ | 30.0 | $ | 29.3 | $ | 38.4 | $ | 34.0 | ||||||||||
Net income | $ | 37.0 | $ | 28.4 | $ | 29.2 | $ | 36.5 | $ | 32.1 | ||||||||||
Total assets at period end (2) | $ | 1,616.1 | $ | 1,685.4 | $ | 1,826.6 | $ | 1,749.2 | $ | 2,014.2 | ||||||||||
Add: Unamortized debt issuance costs (3) | — | — | — | — | 7.6 | |||||||||||||||
Less: Excess cash (4) | (156.8 | ) | (218.1 | ) | (258.4 | ) | (128.0 | ) | (422.0 | ) | ||||||||||
Less: Accounts payable and accrued expenses, accrued compensation and benefits, and income and other taxes payable | (215.8 | ) | (214.8 | ) | (256.4 | ) | (236.9 | ) | (205.6 | ) | ||||||||||
Less: Deferred revenue (current and non-current) | (22.3 | ) | (26.1 | ) | (29.7 | ) | (31.8 | ) | (31.2 | ) | ||||||||||
Less: Other non-current liabilities, deferred income taxes, deferred rent, and finance lease obligations for build-to-suit leases (2) (5) | (262.6 | ) | (280.8 | ) | (293.3 | ) | (287.5 | ) | (306.6 | ) | ||||||||||
Capital base (5) | $ | 958.6 | $ | 945.6 | $ | 988.8 | $ | 1,065.0 | $ | 1,056.4 | ||||||||||
Average total assets (2) | $ | 1,665.5 | $ | 1,650.7 | $ | 1,756.0 | $ | 1,787.9 | $ | 1,881.7 | ||||||||||
Average capital base (5) | $ | 956.0 | $ | 952.1 | $ | 967.2 | $ | 1,027.0 | $ | 1,060.7 | ||||||||||
Return on assets (annualized) (2) | 8.9 | % | 6.9 | % | 6.6 | % | 8.2 | % | 6.8 | % | ||||||||||
Return on capital (annualized) (5) | 15.7 | % | 12.6 | % | 12.1 | % | 15.0 | % | 12.8 | % | ||||||||||
(1) | Reflects additional expense we would have expected to record if our build-to-suit lease arrangements had been deemed operating leases instead of finance lease obligations for build-to-suit leases. Calculated as the excess of estimated straight-line rent expense over actual depreciation expense for completed real estate projects under build-to-suit lease arrangements. |
(2) | In the fourth quarter of 2015, we elected to early adopt accounting guidance related to the balance sheet classification of deferred taxes. Prior period amounts have been revised to reflect the impact of this adoption. See Item 8 of Part II, "Financial Statements and Supplementary Data- Note 1- Company Overview, Basis of Presentation, and Summary of Significant Accounting Policies" for further discussion. |
(3) | Amount recorded as a direct deduction from the carrying value of the long-term debt liability in the consolidated balance sheets. |
(4) | Defined as the amount of cash and cash equivalents that exceeds our operating cash requirements, which is calculated as three percent of our annualized net revenue for the three months prior to the period end. |
(5) | In the first quarter of 2015, we reclassified certain finance obligations associated with build-to-suit leases in the consolidated balance sheets. Prior period amounts have been revised to reflect the impact of this reclassification. See Item 8 of Part II, "Financial Statements and Supplementary Data - Note 7 - Leases" for further discussion. |
- 49 -
Adjusted EBITDA
We use Adjusted EBITDA as a supplemental measure to review and assess our performance. Adjusted EBITDA is a metric that is used by analysts and investors for comparative and valuation purposes. We disclose this metric in order to support and facilitate the dialogue with research analysts and investors.
We define Adjusted EBITDA as net income, plus income taxes, total other (income) expense, depreciation and amortization, and non-cash charges for share-based compensation. The following tables present a reconciliation of Adjusted EBITDA to net income.
Year Ended December 31, | ||||||||||||
(In millions) | 2013 | 2014 | 2015 | |||||||||
Net revenue | $ | 1,534.8 | $ | 1,794.4 | $ | 2,001.3 | ||||||
Income from operations | $ | 133.1 | $ | 163.5 | $ | 206.1 | ||||||
Net income | $ | 86.7 | $ | 110.6 | $ | 126.2 | ||||||
Plus: Income taxes | 44.0 | 49.0 | 67.4 | |||||||||
Plus: Total other (income) expense | 2.4 | 3.9 | 12.5 | |||||||||
Plus: Depreciation and amortization | 313.1 | 371.9 | 399.9 | |||||||||
Plus: Share-based compensation expense | 59.6 | 70.0 | 78.1 | |||||||||
Adjusted EBITDA | $ | 505.8 | $ | 605.4 | $ | 684.1 | ||||||
Operating income margin | 8.7 | % | 9.1 | % | 10.3 | % | ||||||
Adjusted EBITDA margin | 33.0 | % | 33.7 | % | 34.2 | % | ||||||
Three Months Ended | ||||||||||||||||||||
(In millions) | December 31, 2014 | March 31, 2015 | June 30, 2015 | September 30, 2015 | December 31, 2015 | |||||||||||||||
Net revenue | $ | 472.5 | $ | 480.2 | $ | 489.4 | $ | 508.9 | $ | 522.8 | ||||||||||
Income from operations | $ | 50.0 | $ | 44.4 | $ | 43.7 | $ | 56.5 | $ | 61.5 | ||||||||||
Net income | $ | 37.0 | $ | 28.4 | $ | 29.2 | $ | 36.5 | $ | 32.1 | ||||||||||
Plus: Income taxes | 12.3 | 13.6 | 14.0 | 16.1 | 23.7 | |||||||||||||||
Plus: Total other (income) expense | 0.7 | 2.4 | 0.5 | 3.9 | 5.7 | |||||||||||||||
Plus: Depreciation and amortization | 95.2 | 96.9 | 97.7 | 101.3 | 104.0 | |||||||||||||||
Plus: Share-based compensation expense | 20.2 | 20.0 | 20.4 | 19.6 | 18.1 | |||||||||||||||
Adjusted EBITDA | $ | 165.4 | $ | 161.3 | $ | 161.8 | $ | 177.4 | $ | 183.6 | ||||||||||
Operating income margin | 10.6 | % | 9.3 | % | 8.9 | % | 11.1 | % | 11.8 | % | ||||||||||
Adjusted EBITDA margin | 35.0 | % | 33.6 | % | 33.1 | % | 34.9 | % | 35.1 | % | ||||||||||
- 50 -
Constant currency revenue growth
We use constant currency revenue growth as an additional metric for understanding and assessing our growth excluding the effect of foreign currency rate fluctuations on our international business operations. We also believe this is an important metric to help investors evaluate our performance in comparison to prior periods. The information presented is calculated by translating current period results using the average exchange rate from the comparative period rather than the actual exchange rates in effect during the respective period. The following table presents a reconciliation of constant currency revenue growth.
Three Months Ended | Three Months Ended | ||||||||||||||||||||||
(In millions) | September 30, 2014 | September 30, 2015 | Percent Change | December 31, 2014 | December 31, 2015 | Percent Change | |||||||||||||||||
Net revenue | $ | 459.7 | $ | 508.9 | 10.7 | % | $ | 472.5 | $ | 522.8 | 10.7 | % | |||||||||||
Foreign currency translation | — | 10.2 | — | 6.3 | |||||||||||||||||||
Net revenue in constant currency | $ | 459.7 | $ | 519.1 | 12.9 | % | $ | 472.5 | $ | 529.1 | 12.0 | % | |||||||||||
Year Ended | ||||||||||||
(In millions) | December 31, 2014 | December 31, 2015 | Percent Change | |||||||||
Net revenue | $ | 1,794.4 | $ | 2,001.3 | 11.5 | % | ||||||
Foreign currency translation | — | 39.1 | ||||||||||
Net revenue in constant currency | $ | 1,794.4 | $ | 2,040.4 | 13.7 | % | ||||||
Adjusted Free Cash Flow
We believe that Adjusted Free Cash Flow is a performance metric used by investors to evaluate the strength and performance of a company's ongoing business. We define Adjusted Free Cash Flow as Adjusted EBITDA plus non-cash deferred rent, less total capital expenditures (including non-cash purchases of property and equipment), cash payments for interest and cash payments for income taxes. The following table presents a reconciliation of Adjusted Free Cash Flow to Adjusted EBITDA as a supplement to our reconciliation of Adjusted EBITDA to net income provided above.
Year Ended December 31, | ||||||||||||
(In millions) | 2013 | 2014 | 2015 | |||||||||
Adjusted EBITDA | $ | 505.8 | $ | 605.4 | $ | 684.1 | ||||||
Non-cash deferred rent | 11.6 | 7.4 | 0.1 | |||||||||
Total capital expenditures | (472.1 | ) | (435.1 | ) | (466.0 | ) | ||||||
Cash payments for interest, net of interest received | (3.2 | ) | (1.7 | ) | (4.0 | ) | ||||||
Cash payments for income taxes, net of refunds | (14.9 | ) | (13.5 | ) | (17.8 | ) | ||||||
Adjusted free cash flow | $ | 27.2 | $ | 162.5 | $ | 196.4 | ||||||
Quarterly Key Metrics and Results of Operations
The following tables set forth our quarterly key metrics and also our results of operations in dollars and as a percentage of revenue for each of our most recent five quarters as of the period ended December 31, 2015. The quarterly data presented below has been prepared on a basis consistent with the audited consolidated financial statements included elsewhere in this document and, in the opinion of management, reflects all adjustments, consisting only of normal recurring adjustments, necessary for a fair presentation of this information. You should read this information together with our audited consolidated financial statements and related notes included elsewhere in this document. Our results for these quarterly periods are not necessarily indicative of the results of operations for a full year or any period.
- 51 -
Three Months Ended | |||||||||||||||||||||
(Dollar amounts in millions, except average monthly revenue per server) | December 31, 2014 | March 31, 2015 | June 30, 2015 | September 30, 2015 | December 31, 2015 | ||||||||||||||||
Growth | |||||||||||||||||||||
Net revenue | $ | 472.5 | $ | 480.2 | $ | 489.4 | $ | 508.9 | $ | 522.8 | |||||||||||
Revenue growth (year over year) | 15.8 | % | 14.1 | % | 11.0 | % | 10.7 | % | 10.7 | % | |||||||||||
Number of employees (Rackers) at period end | 5,936 | 5,964 | 6,115 | 6,177 | 6,189 | ||||||||||||||||
Number of servers deployed at period end | 112,628 | 114,105 | 116,329 | 118,654 | 118,177 | ||||||||||||||||
Average monthly revenue per server | $ | 1,412 | $ | 1,412 | $ | 1,416 | $ | 1,444 | $ | 1,472 | |||||||||||
Profitability | |||||||||||||||||||||
Income from operations | $ | 50.0 | $ | 44.4 | $ | 43.7 | $ | 56.5 | $ | 61.5 | |||||||||||
Depreciation and amortization | $ | 95.2 | $ | 96.9 | $ | 97.7 | $ | 101.3 | $ | 104.0 | |||||||||||
Share-based compensation expense | $ | 20.2 | $ | 20.0 | $ | 20.4 | $ | 19.6 | $ | 18.1 | |||||||||||
Adjusted EBITDA (1) | $ | 165.4 | $ | 161.3 | $ | 161.8 | $ | 177.4 | $ | 183.6 | |||||||||||
Adjusted EBITDA margin | 35.0 | % | 33.6 | % | 33.1 | % | 34.9 | % | 35.1 | % | |||||||||||
Operating income margin | 10.6 | % | 9.3 | % | 8.9 | % | 11.1 | % | 11.8 | % | |||||||||||
Income from operations | $ | 50.0 | $ | 44.4 | $ | 43.7 | $ | 56.5 | $ | 61.5 | |||||||||||
Adjustment for build-to-suit lease impact (2) | $ | — | $ | — | $ | (0.4 | ) | $ | (1.1 | ) | $ | (2.3 | ) | ||||||||
Income from operations, adjusted | $ | 50.0 | $ | 44.4 | $ | 43.3 | $ | 55.4 | $ | 59.2 | |||||||||||
Effective tax rate | 25.1 | % | 32.4 | % | 32.4 | % | 30.6 | % | 42.5 | % | |||||||||||
Net operating profit after tax (NOPAT) (1) | $ | 37.5 | $ | 30.0 | $ | 29.3 | $ | 38.4 | $ | 34.0 | |||||||||||
NOPAT margin | 7.9 | % | 6.3 | % | 6.0 | % | 7.6 | % | 6.5 | % | |||||||||||
Capital efficiency and returns | |||||||||||||||||||||
Interest bearing debt (3) (4) | $ | 41.6 | $ | 10.8 | $ | 6.9 | $ | 143.6 | $ | 501.9 | |||||||||||
Stockholders' equity | $ | 1,073.8 | $ | 1,152.9 | $ | 1,240.3 | $ | 1,049.4 | $ | 976.5 | |||||||||||
Less: Excess cash | $ | (156.8 | ) | $ | (218.1 | ) | $ | (258.4 | ) | $ | (128.0 | ) | $ | (422.0 | ) | ||||||
Capital base (3) | $ | 958.6 | $ | 945.6 | $ | 988.8 | $ | 1,065.0 | $ | 1,056.4 | |||||||||||
Average capital base (3) | $ | 956.0 | $ | 952.1 | $ | 967.2 | $ | 1,027.0 | $ | 1,060.7 | |||||||||||
Capital turnover (annualized) (3) | 1.98 | 2.02 | 2.02 | 1.98 | 1.97 | ||||||||||||||||
Return on capital (annualized) (1) (3) | 15.7 | % | 12.6 | % | 12.1 | % | 15.0 | % | 12.8 | % | |||||||||||
Capital expenditures | |||||||||||||||||||||
Cash purchases of property and equipment | $ | 107.2 | $ | 92.5 | $ | 104.7 | $ | 134.7 | $ | 143.0 | |||||||||||
Non-cash purchases of property and equipment (5) | $ | (2.6 | ) | $ | (2.3 | ) | $ | 46.9 | $ | (7.0 | ) | $ | (46.5 | ) | |||||||
Total capital expenditures | $ | 104.6 | $ | 90.2 | $ | 151.6 | $ | 127.7 | $ | 96.5 | |||||||||||
Customer gear | $ | 72.5 | $ | 58.7 | $ | 117.3 | $ | 87.1 | $ | 61.8 | |||||||||||
Data center build outs | $ | 11.1 | $ | 13.4 | $ | 15.8 | $ | 18.8 | $ | 10.6 | |||||||||||
Office build outs | $ | 1.6 | $ | 2.3 | $ | 3.3 | $ | 6.1 | $ | 7.8 | |||||||||||
Capitalized software and other projects | $ | 19.4 | $ | 15.8 | $ | 15.2 | $ | 15.7 | $ | 16.3 | |||||||||||
Total capital expenditures | $ | 104.6 | $ | 90.2 | $ | 151.6 | $ | 127.7 | $ | 96.5 | |||||||||||
Infrastructure capacity and utilization | |||||||||||||||||||||
Megawatts under contract at period end (6) | 58.1 | 63.2 | 63.6 | 63.6 | 62.2 | ||||||||||||||||
Megawatts available for customer use at period end (7) | 49.7 | 52.0 | 54.1 | 55.3 | 54.4 | ||||||||||||||||
Megawatts utilized at period end | 30.5 | 31.0 | 31.6 | 32.7 | 32.2 | ||||||||||||||||
Annualized net revenue per average Megawatt of power utilized | $ | 62.6 | $ | 62.5 | $ | 62.5 | $ | 63.3 | $ | 64.5 | |||||||||||
(1) | See discussion and reconciliation of our Non-GAAP financial measures to the most comparable GAAP measures. |
(2) | Reflects additional expense we would have expected to record if our build-to-suit lease arrangements had been deemed operating leases instead of finance lease obligations for build-to-suit leases. Calculated as the excess of estimated straight-line rent expense over actual depreciation expense for completed real estate projects under build-to-suit lease arrangements. |
(3) | In the first quarter of 2015, we reclassified certain finance obligations associated with build-to-suit leases in the consolidated balance sheets. Prior period amounts have been revised to reflect the impact of this reclassification. See Item 8 of Part II, "Financial Statements and Supplementary Data - Note 7 - Leases" for further discussion. |
(4) | Includes the outstanding principal amount of debt and capital lease obligations. |
(5) | Non-cash purchases of property and equipment primarily represents changes in amounts accrued but not yet paid. |
(6) | Megawatts under contract at period end represents data center capacity for which we have a contract enabling us to take control of the space. For our newest data center in London, beginning March 31, 2015, we have included four megawatts. |
(7) | Megawatts available for customer use at period end represents data center capacity that is built-out and is being used to provide service to customers. |
- 52 -
Consolidated Statements of Income by Quarter:
Three Months Ended | ||||||||||||||||||||
(In millions) | December 31, 2014 | March 31, 2015 | June 30, 2015 | September 30, 2015 | December 31, 2015 | |||||||||||||||
Net revenue | $ | 472.5 | $ | 480.2 | $ | 489.4 | $ | 508.9 | $ | 522.8 | ||||||||||
Costs and expenses: | ||||||||||||||||||||
Cost of revenue | 153.9 | 161.3 | 163.9 | 171.2 | 179.1 | |||||||||||||||
Research and development | 31.4 | 32.0 | 33.2 | 29.9 | 29.8 | |||||||||||||||
Sales and marketing | 59.2 | 59.0 | 64.4 | 61.8 | 58.3 | |||||||||||||||
General and administrative | 82.8 | 86.6 | 86.5 | 88.2 | 90.1 | |||||||||||||||
Depreciation and amortization | 95.2 | 96.9 | 97.7 | 101.3 | 104.0 | |||||||||||||||
Total costs and expenses | 422.5 | 435.8 | 445.7 | 452.4 | 461.3 | |||||||||||||||
Income from operations | 50.0 | 44.4 | 43.7 | 56.5 | 61.5 | |||||||||||||||
Other income (expense): | ||||||||||||||||||||
Interest expense | (0.4 | ) | (0.4 | ) | (1.9 | ) | (2.8 | ) | (6.2 | ) | ||||||||||
Interest and other income (expense) | (0.3 | ) | (2.0 | ) | 1.4 | (1.1 | ) | 0.5 | ||||||||||||
Total other income (expense) | (0.7 | ) | (2.4 | ) | (0.5 | ) | (3.9 | ) | (5.7 | ) | ||||||||||
Income before income taxes | 49.3 | 42.0 | 43.2 | 52.6 | 55.8 | |||||||||||||||
Income taxes | 12.3 | 13.6 | 14.0 | 16.1 | 23.7 | |||||||||||||||
Net income | $ | 37.0 | $ | 28.4 | $ | 29.2 | $ | 36.5 | $ | 32.1 | ||||||||||
Consolidated Statements of Income by Quarter, as a Percentage of Net Revenue:
Three Months Ended | |||||||||||||||
(Percent of net revenue) | December 31, 2014 | March 31, 2015 | June 30, 2015 | September 30, 2015 | December 31, 2015 | ||||||||||
Net revenue | 100.0 | % | 100.0 | % | 100.0 | % | 100.0 | % | 100.0 | % | |||||
Costs and expenses: | |||||||||||||||
Cost of revenue | 32.6 | % | 33.6 | % | 33.5 | % | 33.7 | % | 34.3 | % | |||||
Research and development | 6.6 | % | 6.7 | % | 6.8 | % | 5.9 | % | 5.7 | % | |||||
Sales and marketing | 12.5 | % | 12.3 | % | 13.2 | % | 12.1 | % | 11.2 | % | |||||
General and administrative | 17.5 | % | 18.0 | % | 17.7 | % | 17.3 | % | 17.2 | % | |||||
Depreciation and amortization | 20.2 | % | 20.2 | % | 20.0 | % | 19.9 | % | 19.9 | % | |||||
Total costs and expenses | 89.4 | % | 90.7 | % | 91.1 | % | 88.9 | % | 88.2 | % | |||||
Income from operations | 10.6 | % | 9.3 | % | 8.9 | % | 11.1 | % | 11.8 | % | |||||
Other income (expense): | |||||||||||||||
Interest expense | (0.1 | )% | (0.1 | )% | (0.4 | )% | (0.5 | )% | (1.2 | )% | |||||
Interest and other income (expense) | (0.1 | )% | (0.4 | )% | 0.3 | % | (0.2 | )% | 0.1 | % | |||||
Total other income (expense) | (0.1 | )% | (0.5 | )% | (0.1 | )% | (0.8 | )% | (1.1 | )% | |||||
Income before income taxes | 10.4 | % | 8.8 | % | 8.8 | % | 10.3 | % | 10.7 | % | |||||
Income taxes | 2.6 | % | 2.8 | % | 2.9 | % | 3.2 | % | 4.5 | % | |||||
Net income | 7.8 | % | 5.9 | % | 6.0 | % | 7.2 | % | 6.1 | % | |||||
Due to rounding, totals may not equal the sum of the line items in the table above.
- 53 -
ITEM 7A – QUANTITATIVE AND QUALITATIVE DISCLOSURES ABOUT MARKET RISK
Power Prices. We are a large consumer of power. During 2015, we expensed approximately $33 million that was paid to utility companies to power our data centers, representing approximately 2% of our net revenue. Because we anticipate further revenue growth for the foreseeable future, we expect to consume more power in the future. Power costs vary by geography, the source of power generation, and seasonal fluctuations and are subject to certain proposed legislation that may increase our exposure to increased power costs. We have fixed-price power contracts for data centers in the Dallas-Fort Worth and London areas that allow us to procure power either on a fixed price or on a variable price basis. These contracts have been designated as meeting the normal purchases and normal sales exception and thus are not accounted for as derivatives.
Interest Rates. We have a revolving line of credit with a base rate determined by variable market rates, including the Prime Rate and the London Interbank Offered Rate ("LIBOR"). These market rates of interest are fluctuating and expose our interest expense to risk. As of December 31, 2015, we did not have an outstanding balance on our credit facility and our debt balance consisted entirely of the fixed-rate Senior Notes due 2024. Therefore, we have limited interest rate risk.
Foreign Currencies. The majority of our customers are invoiced, and the majority of our expenses are paid, by us or our subsidiaries in the functional currency of our company or our subsidiaries, respectively. A relatively insignificant amount of customers are invoiced in currencies other than the applicable functional currency. Therefore, our results of operations and cash flows are subject to fluctuations in foreign currency exchange rates. We also have exposure to foreign currency transaction gains and losses as the result of certain receivables due from our foreign subsidiaries. During 2015, we recognized foreign currency losses of $2 million within other income (expense). We have not entered into any currency hedging contracts, although we may do so in the future. As we grow our international operations, our exposure to foreign currency risk could become more significant.
- 54 -
ITEM 8 - FINANCIAL STATEMENTS AND SUPPLEMENTARY DATA
RACKSPACE HOSTING, INC.
INDEX TO CONSOLIDATED FINANCIAL STATEMENTS
Page | |
Financial Statements: | |
- 55 -
Report of Independent Registered Public Accounting Firm
The Board of Directors and Stockholders
Rackspace Hosting, Inc.:
We have audited the accompanying consolidated balance sheets of Rackspace Hosting, Inc. and subsidiaries as of December 31, 2014 and 2015, and the related consolidated statements of comprehensive income, cash flows, and stockholders' equity for each of the years in the three-year period ended December 31, 2015. In connection with our audits of the consolidated financial statements, we have also audited financial statement schedule II. These consolidated financial statements and financial statement schedule are the responsibility of the Company's management. Our responsibility is to express an opinion on these consolidated financial statements and financial statement schedule based on our audits.
We conducted our audits in accordance with the standards of the Public Company Accounting Oversight Board (United States). Those standards require that we plan and perform the audit to obtain reasonable assurance about whether the financial statements are free of material misstatement. An audit includes examining, on a test basis, evidence supporting the amounts and disclosures in the financial statements. An audit also includes assessing the accounting principles used and significant estimates made by management, as well as evaluating the overall financial statement presentation. We believe that our audits provide a reasonable basis for our opinion.
In our opinion, the consolidated financial statements referred to above present fairly, in all material respects, the financial position of Rackspace Hosting, Inc. and subsidiaries as of December 31, 2014 and 2015, and the results of their operations and their cash flows for each of the years in the three-year period ended December 31, 2015, in conformity with U.S. generally accepted accounting principles. Also in our opinion, the related financial statement schedule, when considered in relation to the basic consolidated financial statements taken as a whole, presents fairly, in all material respects, the information set forth therein.
We also have audited, in accordance with the standards of the Public Company Accounting Oversight Board (United States), Rackspace Hosting, Inc.'s internal control over financial reporting as of December 31, 2015, based on criteria established in Internal Control - Integrated Framework (2013) issued by the Committee of Sponsoring Organizations of the Treadway Commission (COSO), and our report dated February 25, 2016 expressed an unqualified opinion on the effectiveness of the Company's internal control over financial reporting.
/s/ KPMG LLP
San Antonio, Texas
February 25, 2016
- 56 -
Report of Independent Registered Public Accounting Firm
The Board of Directors and Stockholders
Rackspace Hosting, Inc.:
We have audited Rackspace Hosting, Inc. and subsidiaries' (the Company) internal control over financial reporting as of December 31, 2015, based on criteria established in Internal Control - Integrated Framework (2013) issued by the Committee of Sponsoring Organizations of the Treadway Commission (COSO). The Company's management is responsible for maintaining effective internal control over financial reporting and for its assessment of the effectiveness of internal control over financial reporting, included in the accompanying Report of Management on Internal Control over Financial Reporting. Our responsibility is to express an opinion on the Company's internal control over financial reporting based on our audit.
We conducted our audit in accordance with the standards of the Public Company Accounting Oversight Board (United States). Those standards require that we plan and perform the audit to obtain reasonable assurance about whether effective internal control over financial reporting was maintained in all material respects. Our audit included obtaining an understanding of internal control over financial reporting, assessing the risk that a material weakness exists, and testing and evaluating the design and operating effectiveness of internal control based on the assessed risk. Our audit also included performing such other procedures as we considered necessary in the circumstances. We believe that our audit provides a reasonable basis for our opinion.
A company's internal control over financial reporting is a process designed to provide reasonable assurance regarding the reliability of financial reporting and the preparation of financial statements for external purposes in accordance with generally accepted accounting principles. A company's internal control over financial reporting includes those policies and procedures that (1) pertain to the maintenance of records that, in reasonable detail, accurately and fairly reflect the transactions and dispositions of the assets of the company; (2) provide reasonable assurance that transactions are recorded as necessary to permit preparation of financial statements in accordance with generally accepted accounting principles, and that receipts and expenditures of the company are being made only in accordance with authorizations of management and directors of the company; and (3) provide reasonable assurance regarding prevention or timely detection of unauthorized acquisition, use, or disposition of the company's assets that could have a material effect on the financial statements.
Because of its inherent limitations, internal control over financial reporting may not prevent or detect misstatements. Also, projections of any evaluation of effectiveness to future periods are subject to the risk that controls may become inadequate because of changes in conditions, or that the degree of compliance with the policies or procedures may deteriorate.
In our opinion, Rackspace Hosting, Inc. maintained, in all material respects, effective internal control over financial reporting as of December 31, 2015, based on criteria established in Internal Control - Integrated Framework (2013) issued by the Committee of Sponsoring Organizations of the Treadway Commission (COSO).
We also have audited, in accordance with the standards of the Public Company Accounting Oversight Board (United States), the consolidated balance sheets of Rackspace Hosting, Inc. and subsidiaries as of December 31, 2014 and 2015, and the related consolidated statements of comprehensive income, cash flows, and stockholders' equity for each of the years in the three-year period ended December 31, 2015, and our report dated February 25, 2016 expressed an unqualified opinion on those consolidated financial statements.
/s/ KPMG LLP
San Antonio, Texas
February 25, 2016
- 57 -
RACKSPACE HOSTING, INC. AND SUBSIDIARIES—
CONSOLIDATED BALANCE SHEETS
(In millions, except per share data) | December 31, 2014 | December 31, 2015 | ||||||
ASSETS | ||||||||
Current assets: | ||||||||
Cash and cash equivalents | $ | 213.5 | $ | 484.7 | ||||
Accounts receivable, net of allowance for doubtful accounts and customer credits of $5.3 as of December 31, 2014 and $7.3 as of December 31, 2015 | 156.5 | 174.4 | ||||||
Prepaid expenses | 33.6 | 46.6 | ||||||
Other current assets | 8.8 | 12.7 | ||||||
Total current assets | 412.4 | 718.4 | ||||||
Property and equipment, net | 1,057.7 | 1,148.0 | ||||||
Goodwill | 81.1 | 81.1 | ||||||
Intangible assets, net | 16.6 | 9.1 | ||||||
Other non-current assets | 48.3 | 57.6 | ||||||
Total assets | $ | 1,616.1 | $ | 2,014.2 | ||||
LIABILITIES AND STOCKHOLDERS' EQUITY | ||||||||
Current liabilities: | ||||||||
Accounts payable and accrued expenses | $ | 137.3 | $ | 136.3 | ||||
Accrued compensation and benefits | 66.7 | 57.3 | ||||||
Income and other taxes payable | 11.8 | 12.0 | ||||||
Deferred revenue | 20.9 | 29.6 | ||||||
Capital lease obligations | 15.0 | 1.7 | ||||||
Debt | 25.1 | — | ||||||
Total current liabilities | 276.8 | 236.9 | ||||||
Non-current liabilities: | ||||||||
Deferred revenue | 1.4 | 1.6 | ||||||
Capital lease obligations | 1.5 | 0.2 | ||||||
Finance lease obligations for build-to-suit leases | 117.4 | 164.3 | ||||||
Debt | — | 492.4 | ||||||
Deferred income taxes | 63.0 | 60.0 | ||||||
Deferred rent | 49.9 | 49.5 | ||||||
Other liabilities | 32.3 | 32.8 | ||||||
Total liabilities | 542.3 | 1,037.7 | ||||||
Commitments and Contingencies | ||||||||
Stockholders' equity: | ||||||||
Common stock, $0.001 par value per share: 300.0 shares authorized; 140.9 shares issued and outstanding as of December 31, 2014; 130.9 shares issued and outstanding as of December 31, 2015 | 0.1 | 0.1 | ||||||
Additional paid-in capital | 696.0 | 834.5 | ||||||
Accumulated other comprehensive loss | (20.7 | ) | (36.2 | ) | ||||
Retained earnings | 398.4 | 178.1 | ||||||
Total stockholders’ equity | 1,073.8 | 976.5 | ||||||
Total liabilities and stockholders’ equity | $ | 1,616.1 | $ | 2,014.2 | ||||
See accompanying notes to the consolidated financial statements.
- 58 -
RACKSPACE HOSTING, INC. AND SUBSIDIARIES—
CONSOLIDATED STATEMENTS OF COMPREHENSIVE INCOME
Year Ended December 31, | ||||||||||||
(In millions, except per share data) | 2013 | 2014 | 2015 | |||||||||
Net revenue | $ | 1,534.8 | $ | 1,794.4 | $ | 2,001.3 | ||||||
Costs and expenses: | ||||||||||||
Cost of revenue | 492.5 | 582.3 | 675.5 | |||||||||
Research and development | 90.2 | 117.0 | 124.9 | |||||||||
Sales and marketing | 208.4 | 237.6 | 243.5 | |||||||||
General and administrative | 297.5 | 322.1 | 351.4 | |||||||||
Depreciation and amortization | 313.1 | 371.9 | 399.9 | |||||||||
Total costs and expenses | 1,401.7 | 1,630.9 | 1,795.2 | |||||||||
Income from operations | 133.1 | 163.5 | 206.1 | |||||||||
Other income (expense): | ||||||||||||
Interest expense | (3.1 | ) | (1.9 | ) | (11.3 | ) | ||||||
Interest and other income (expense) | 0.7 | (2.0 | ) | (1.2 | ) | |||||||
Total other income (expense) | (2.4 | ) | (3.9 | ) | (12.5 | ) | ||||||
Income before income taxes | 130.7 | 159.6 | 193.6 | |||||||||
Income taxes | 44.0 | 49.0 | 67.4 | |||||||||
Net income | $ | 86.7 | $ | 110.6 | $ | 126.2 | ||||||
Other comprehensive income, net of tax | ||||||||||||
Foreign currency translation adjustments | $ | 3.6 | $ | (16.2 | ) | $ | (15.5 | ) | ||||
Other comprehensive income (loss) | 3.6 | (16.2 | ) | (15.5 | ) | |||||||
Comprehensive income | $ | 90.3 | $ | 94.4 | $ | 110.7 | ||||||
Net income per share | ||||||||||||
Basic | $ | 0.63 | $ | 0.78 | $ | 0.91 | ||||||
Diluted | $ | 0.61 | $ | 0.77 | $ | 0.90 | ||||||
Weighted average number of shares outstanding | ||||||||||||
Basic | 138.6 | 142.0 | 139.0 | |||||||||
Diluted | 143.0 | 144.5 | 141.0 | |||||||||
See accompanying notes to the consolidated financial statements.
- 59 -
RACKSPACE HOSTING, INC. AND SUBSIDIARIES—
CONSOLIDATED STATEMENTS OF CASH FLOWS
Year Ended December 31, | ||||||||||||
(In millions) | 2013 | 2014 | 2015 | |||||||||
Cash Flows From Operating Activities | ||||||||||||
Net income | $ | 86.7 | $ | 110.6 | $ | 126.2 | ||||||
Adjustments to reconcile net income to net cash provided by operating activities: | ||||||||||||
Depreciation and amortization | 313.1 | 371.9 | 399.9 | |||||||||
Deferred income taxes | (2.1 | ) | 0.4 | (4.0 | ) | |||||||
Share-based compensation expense | 59.6 | 70.0 | 78.1 | |||||||||
Excess tax benefits from share-based compensation arrangements | (33.5 | ) | (34.5 | ) | (48.6 | ) | ||||||
Other operating activities | 5.5 | 8.2 | 9.8 | |||||||||
Changes in operating assets and liabilities: | ||||||||||||
Accounts receivable | (34.5 | ) | (41.7 | ) | (28.3 | ) | ||||||
Prepaid expenses and other current assets | (12.3 | ) | (1.1 | ) | (17.2 | ) | ||||||
Accounts payable, accrued expenses, and other current liabilities | 35.3 | 55.4 | 49.2 | |||||||||
Deferred revenue | 5.4 | (3.7 | ) | 9.1 | ||||||||
Deferred rent | 11.6 | 7.4 | 0.1 | |||||||||
Other non-current assets and liabilities | 9.3 | (0.4 | ) | 9.3 | ||||||||
Net cash provided by operating activities | 444.1 | 542.5 | 583.6 | |||||||||
Cash Flows From Investing Activities | ||||||||||||
Purchases of property and equipment | (452.6 | ) | (430.3 | ) | (474.9 | ) | ||||||
Acquisitions, net of cash acquired | (9.9 | ) | — | — | ||||||||
All other investing activities | (1.7 | ) | 2.2 | (4.5 | ) | |||||||
Net cash used in investing activities | (464.2 | ) | (428.1 | ) | (479.4 | ) | ||||||
Cash Flows From Financing Activities | ||||||||||||
Proceeds from debt | — | 25.0 | 640.0 | |||||||||
Repayments of debt | (1.9 | ) | (1.9 | ) | (165.1 | ) | ||||||
Payments for debt issuance costs | — | — | (8.3 | ) | ||||||||
Proceeds from finance lease obligations for build-to-suit leases | — | — | 6.2 | |||||||||
Principal payments of capital and build-to-suit leases | (65.9 | ) | (39.7 | ) | (15.0 | ) | ||||||
Payments for deferred acquisition obligations | (1.4 | ) | (0.2 | ) | (0.2 | ) | ||||||
Receipt of Texas Enterprise Fund grant | — | 5.5 | — | |||||||||
Repurchase of common stock | — | (200.0 | ) | (367.0 | ) | |||||||
Shares of common stock withheld for employee taxes | — | (13.6 | ) | — | ||||||||
Proceeds from employee stock plans | 23.9 | 33.1 | 32.3 | |||||||||
Excess tax benefits from share-based compensation arrangements | 33.5 | 34.5 | 48.6 | |||||||||
Net cash provided by (used in) financing activities | (11.8 | ) | (157.3 | ) | 171.5 | |||||||
Effect of exchange rate changes on cash and cash equivalents | (0.5 | ) | (3.3 | ) | (4.5 | ) | ||||||
Increase (decrease) in cash and cash equivalents | (32.4 | ) | (46.2 | ) | 271.2 | |||||||
Cash and cash equivalents, beginning of period | 292.1 | 259.7 | 213.5 | |||||||||
Cash and cash equivalents, end of period | $ | 259.7 | $ | 213.5 | $ | 484.7 | ||||||
Supplemental Cash Flow Information | ||||||||||||
Cash payments for interest, net of amount capitalized | $ | 3.2 | $ | 1.8 | $ | 4.0 | ||||||
Cash payments for income taxes, net of refunds | $ | 14.9 | $ | 13.5 | $ | 17.8 | ||||||
Non-cash Investing and Financing Activities | ||||||||||||
Acquisition of property and equipment by capital leases | $ | 7.2 | $ | 0.9 | $ | 0.4 | ||||||
Increase (decrease) in property and equipment in accounts payable and accrued expenses | 12.3 | 3.9 | (9.3 | ) | ||||||||
Non-cash purchases of property and equipment | $ | 19.5 | $ | 4.8 | $ | (8.9 | ) | |||||
Shares issued in business combinations | $ | 4.5 | $ | — | $ | — | ||||||
Additional finance lease obligations for build-to-suit leases and other | $ | — | $ | 117.6 | $ | 50.4 | ||||||
See accompanying notes to the consolidated financial statements.
- 60 -
RACKSPACE HOSTING, INC. AND SUBSIDIARIES—
CONSOLIDATED STATEMENTS OF STOCKHOLDERS' EQUITY
Years Ended December 31, 2013, 2014, and 2015 | ||||||||||||||||||||||
Common Stock | Additional Paid-In Capital | Accumulated Other Comprehensive Income (Loss) | Retained Earnings | Total Stockholders' Equity | ||||||||||||||||||
(In millions) | Shares | Amount | ||||||||||||||||||||
Balance at December 31, 2012 | 137.8 | $ | 0.1 | $ | 515.2 | $ | (8.1 | ) | $ | 336.4 | $ | 843.6 | ||||||||||
Issuance of common stock | ||||||||||||||||||||||
Exercise of stock options and release of stock awards (including excess tax benefit of $33.5) | 3.0 | — | 51.2 | — | — | 51.2 | ||||||||||||||||
Issuance of shares from Employee Stock Purchase Plans | 0.2 | — | 6.2 | — | — | 6.2 | ||||||||||||||||
Issuance of shares in acquisitions | 0.1 | — | 4.5 | — | — | 4.5 | ||||||||||||||||
Total issuance of common stock | 3.3 | — | 61.9 | — | — | 61.9 | ||||||||||||||||
Share-based compensation expense | — | — | 59.6 | — | — | 59.6 | ||||||||||||||||
Net income | — | — | — | — | 86.7 | 86.7 | ||||||||||||||||
Foreign currency translation adjustments | — | — | — | 3.6 | — | 3.6 | ||||||||||||||||
Balance at December 31, 2013 | 141.1 | $ | 0.1 | $ | 636.7 | $ | (4.5 | ) | $ | 423.1 | $ | 1,055.4 | ||||||||||
Issuance of common stock | ||||||||||||||||||||||
Exercise of stock options and release of stock awards (including excess tax benefit of $34.5), net of shares withheld for employee taxes | 2.9 | — | 59.5 | — | (11.7 | ) | 47.8 | |||||||||||||||
Issuance of shares from Employee Stock Purchase Plans | 0.2 | — | 6.2 | — | — | 6.2 | ||||||||||||||||
Total issuance of common stock | 3.1 | — | 65.7 | — | (11.7 | ) | 54.0 | |||||||||||||||
Repurchase of common stock | (3.3 | ) | — | (76.4 | ) | — | (123.6 | ) | (200.0 | ) | ||||||||||||
Share-based compensation expense | — | — | 70.0 | — | — | 70.0 | ||||||||||||||||
Net income | — | — | — | — | 110.6 | 110.6 | ||||||||||||||||
Foreign currency translation adjustments | — | — | — | (16.2 | ) | — | (16.2 | ) | ||||||||||||||
Balance at December 31, 2014 | 140.9 | $ | 0.1 | $ | 696.0 | $ | (20.7 | ) | $ | 398.4 | $ | 1,073.8 | ||||||||||
Issuance of common stock | ||||||||||||||||||||||
Exercise of stock options and release of stock awards (including excess tax benefit of $48.6) | 2.9 | — | 75.2 | — | — | 75.2 | ||||||||||||||||
Issuance of shares from Employee Stock Purchase Plans | 0.2 | — | 5.7 | — | — | 5.7 | ||||||||||||||||
Total issuance of common stock | 3.1 | — | 80.9 | — | — | 80.9 | ||||||||||||||||
Repurchase of common stock | (13.1 | ) | — | (20.5 | ) | — | (346.5 | ) | (367.0 | ) | ||||||||||||
Share-based compensation expense | — | — | 78.1 | — | — | 78.1 | ||||||||||||||||
Net income | — | — | — | — | 126.2 | 126.2 | ||||||||||||||||
Foreign currency translation adjustments | — | — | — | (15.5 | ) | — | (15.5 | ) | ||||||||||||||
Balance at December 31, 2015 | 130.9 | $ | 0.1 | $ | 834.5 | $ | (36.2 | ) | $ | 178.1 | $ | 976.5 | ||||||||||
See accompanying notes to the consolidated financial statements.
- 61 -
RACKSPACE HOSTING, INC. AND SUBSIDIARIES—
NOTES TO THE CONSOLIDATED FINANCIAL STATEMENTS
1. Company Overview, Basis of Presentation, and Summary of Significant Accounting Policies
Nature of Operations
As used in this report, the terms “Rackspace,” “Rackspace Hosting,” “we,” “our company,” “the company,” “us,” or “our” refer to Rackspace Hosting, Inc. and its subsidiaries. Rackspace Hosting, Inc., through its operating subsidiaries, is a provider of managed cloud services in the business information technology ("IT") market. We serve our customers from our data centers on four continents. We help customers tap the power of cloud computing by delivering world-class service on the world's leading technology platforms. We are experts in IT, so our customers do not have to be.
Our operations began in 1998 as a limited partnership, and Rackspace Hosting, Inc. was incorporated in Delaware in March 2000.
Basis of Consolidation
The accompanying consolidated financial statements include the accounts of Rackspace Hosting and our wholly-owned subsidiaries, which include, among others, Rackspace US, Inc., our domestic operating entity, and Rackspace Limited, our United Kingdom operating entity. Intercompany transactions and balances have been eliminated in consolidation.
Use of Estimates
The preparation of consolidated financial statements in conformity with accounting principles generally accepted in the United States ("GAAP") requires us to make estimates and assumptions that affect the reported amounts of assets and liabilities, revenue and expenses, and related disclosures of contingent assets and liabilities in the consolidated financial statements and accompanying notes. On an ongoing basis, we evaluate our estimates, including those related to accounts receivable and customer credits, property and equipment, fair values of intangible assets and goodwill, useful lives of intangible assets, fair value of share-based compensation, contingencies, and income taxes, among others. We base our estimates on historical experience and on various other assumptions that we believe to be reasonable, the results of which form the basis for making judgments about the carrying values of assets and liabilities. Actual results could differ from our estimates.
Cash and Cash Equivalents
For the purposes of the consolidated financial statements, we consider all highly liquid investments with original maturities of three months or less when acquired to be cash equivalents. Our available cash and cash equivalents are held in bank deposits, overnight sweep accounts, and money market funds. Gains and losses are included in interest and other income in our accompanying consolidated statements of comprehensive income.
We actively monitor the third-party depository institutions that hold our deposits. Our emphasis is primarily on safety of principal, secondly on the liquidity of our investments, and finally on maximizing yield on those funds. Our money market mutual funds invest exclusively in high-quality, short-term obligations that include securities issued or guaranteed by the U.S. government or by U.S. government agencies and floating rate and variable rate demand notes of U.S. and foreign corporations.
Accounts Receivable, Net
Trade accounts receivable are recorded at the invoiced amount and do not bear interest. We generally do not request collateral from our customers; however, some customers choose to prepay for their services. We record an allowance for doubtful accounts for estimated losses resulting from the inability of our customers to make required payments. When evaluating the adequacy of the allowance, we analyze the overall quality of our accounts receivable portfolio, current economic conditions and trends, historical bad debt write-offs, customer creditworthiness, and specifically identified customer risks.
In addition, our hosting arrangements contain service level commitments with our customers. To the extent that such service levels are not achieved or are otherwise disputed due to third-party power or service issues, unfavorable weather, or other service interruptions or conditions, we are required to issue service credits for a portion of the hosting service fees paid by our customers. At each reporting period, we estimate the amount of service level credits to be issued and record a reduction to revenue. To estimate service credits, we utilize historical data and specific knowledge of factors impacting the delivery of services to our customers.
- 62 -
Prepaid Expenses and Other Assets
Prepaid expenses and other assets consist primarily of prepaid software and equipment maintenance contracts and prepaid operating expenses. Maintenance contracts are amortized over the agreement period, generally one to three years. Prepaid operating expenses are expensed in the period in which services are received.
Property and Equipment, Net
Property and equipment is stated at cost, net of accumulated depreciation and amortization. Included in property and equipment are capitalized costs related to computer software developed or acquired for internal use. Capitalized computer software costs consist of purchased software licenses, implementation costs, and salaries and related compensation costs of employees and consultants for certain projects that qualify for capitalization.
Replacements and major improvements to property and equipment are capitalized, while maintenance and repairs are charged to expense as incurred. We also capitalize interest costs incurred during the acquisition, development and construction of certain assets until the asset is ready for its intended use. For the years ended December 31, 2014 and 2015, we capitalized interest of $2.1 million and $7.1 million, respectively. There was no interest capitalized during the year ended December 31, 2013.
Property and equipment is depreciated on a straight-line basis over the estimated useful life of the asset. Leasehold improvements are depreciated over the shorter of their estimated useful lives or the remaining lease term. The following table shows estimated useful lives of property and equipment:
Classification | Estimated Useful Lives | |
Computers and equipment | 3 to 5 years | |
Computer software | 3 years | |
Furniture and fixtures | 7 years | |
Buildings and leasehold improvements | 2 to 39 years | |
The cost of assets and related accumulated depreciation and amortization are written off upon retirement or sale, and any resulting gain or loss is credited or charged to income from operations.
Goodwill and Intangible Assets
Goodwill consists of the excess of the purchase price over the fair value of identifiable net assets of businesses acquired. Goodwill is evaluated for impairment at a reporting unit level using a fair value approach on an annual basis at the beginning of the fourth quarter or whenever events or circumstances indicate that impairment may have occurred. No goodwill impairment was recognized in any of the years presented, and there were no changes in the carrying amount of goodwill in 2014 or 2015.
Intangible assets, including purchased technology, customer contracts and relationships, certain tradenames, license agreements, and non-compete agreements arising principally from acquisitions, are recorded at cost less accumulated amortization, and the definite-lived intangibles are amortized using a method that reflects the pattern in which the economic benefits of the related intangible asset are consumed or utilized.
Impairment of Long-Lived Assets
Long-lived assets, including property and equipment and intangible assets, are reviewed for impairment whenever events or changes in circumstances indicate that the carrying amount of an asset may not be recoverable. Recoverability of assets is measured at the asset group level and if the carrying amount of the asset group exceeds its estimated undiscounted future cash flows, an impairment charge is recognized.
- 63 -
Leases
We lease most of our data center facilities and office space under non-cancelable operating lease agreements. Total rent payments, inclusive of rent increases, rent holidays, rent concessions, leasehold incentives or any other unusual provisions or conditions, are expensed on a straight-line basis over the lease period. The difference between the straight-line expense and the cash payment is recorded as deferred rent.
We lease certain equipment under capital lease agreements with major vendors. The assets held under capital lease and related obligations are recorded at the lesser of the present value of aggregate future minimum lease payments, including estimated bargain purchase options, or the fair value of the assets held under capital lease. Such assets, included within "property and equipment, net" on our consolidated balance sheets, are depreciated on a straight-line basis over the shorter of the terms of the leases or the estimated useful lives of the assets. For assets for which the lease agreement includes a bargain purchase option or transfer of ownership at the completion of the lease and the lease term is shorter than the estimated useful life of the asset, the asset is depreciated over its estimated useful life. Interest expense is recorded on the outstanding capital lease obligation throughout the lease term.
Additionally, we have entered into complex real estate development and build-to-suit lease arrangements with independent real estate developers to design, construct and lease certain real estate projects. While the independent developers legally own the real estate projects and must finance the overall construction, we agreed to fund certain structural improvements and/or retain obligations related to certain potential construction cost overruns. As a result of our involvement during the construction period, we are considered the owner of these construction projects for accounting purposes. During the construction period, we record construction costs for these projects as a work in process asset within "property and equipment, net" and a corresponding long-term liability within "finance lease obligations for build-to-suit leases" on our consolidated balance sheets. The cost of these real estate projects is not depreciated during the construction period. When construction of a project is complete, we evaluate whether the build-to-suit lease arrangement qualifies for sales recognition under sale-leaseback accounting guidance. If the lease meets the criteria to qualify as a sale-leaseback, the asset and liability can be derecognized and the lease is accounted for as an operating lease with rent expense recognized over the lease term. If the sale-leaseback criteria are not met, the asset and liability remain on our consolidated balance sheets. The asset is then depreciated over the term of the lease, and rental payments are recorded as a reduction of the corresponding liability and as interest expense. At the end of the lease term, the remaining lease obligation and residual asset balance are derecognized.
The Company has asset retirement obligations associated with commitments to return properties subject to operating and build-to-suit leases to their original condition upon lease termination. The Company's asset retirement obligations were $3.6 million and $4.0 million as of December 31, 2014 and 2015, respectively, and are recorded in "accounts payable and accrued expenses" and "other liabilities" on our consolidated balance sheets.
Debt Issuance Costs
Debt issuance costs, such as underwriting, financial advisory, professional fees and other similar fees are capitalized and recognized in interest expense over the estimated life of the related debt instrument using the effective interest method or straight-line method, as applicable. Refer to "Recent Accounting Pronouncements" below for information on our adoption of new accounting guidance on the presentation of debt issuance costs in the balance sheet.
Revenue and Deferred Revenue
We provide cloud computing to customers, which is broadly defined as the delivery of computing, storage and applications over the Internet. Cloud computing is a service transaction for which revenue is recognized when persuasive evidence of an arrangement exists, usually either a signed, written contract or customer acknowledgment of online terms of service; services have been delivered to the customer; the amounts to be received for the services delivered are fixed or determinable; and collection of such amounts is reasonably assured.
Customers primarily consume our principal service offerings in one of two ways: (i) via dedicated computing resources or (ii) via multi-tenant pools of computing resources provided on demand. We also offer customers the flexibility to select the best combination of the two in order to meet the requirements of their unique applications and provide the technology to operate and manage multiple cloud computing environments seamlessly.
- 64 -
Each service offering is priced according to the terms of our committed resources and services. Contracts for dedicated computing resources are generally fixed term agreements with a 12-36 month term with a monthly recurring fee based on the computing resources reserved and provided to the customer, the complexity of the underlying infrastructure and the level of support we provide. At the end of the initial term, contracts may be renewed or automatically extended on a month-to-month basis. Customers generally have the right to cancel their contracts by providing prior written notice to us of their intent to cancel the remainder of the contract term. In the event that a customer cancels their contract, they are not entitled to a refund for services already rendered. In certain instances we may charge a non-refundable installation fee. Beginning on the date the service is made available to customers, the monthly recurring fee is recognized monthly as services are provided and installation fees are recognized ratably over the estimated average life of a customer relationship. If a customer terminates its relationship with us before the expiration of the estimated average customer life, any unamortized installation fees are recognized as revenue at that time. Setup and other direct implementation activities performed at the inception of a customer contract are expensed as incurred.
Contracts for services utilizing pooled resources on demand can be canceled at any time without penalty. Customers are billed according to usage for only the resources consumed, and revenue is recognized in the month in which the customer uses the services.
Revenue recognition for multiple-element arrangements requires judgment to determine whether elements can be accounted for as separate units of accounting, and if so, the fair value for each of the elements using a hierarchy for allocating revenue to the elements: (i) vendor-specific objective evidence of fair value, (ii) third-party evidence, and (iii) best estimate of selling price. Revenue arrangements with multiple deliverables are divided into separate units of accounting when the delivered item(s) has value to the customer on a standalone basis, which is normally the situation for our services contracts. In this circumstance, revenue is recognized for each unit of accounting based on its relative estimated selling price. Estimated selling prices are management’s best estimates of the prices that we would charge our customers if we were to sell the standalone elements separately and include considerations of customer demand, prices charged by us and others for similar deliverables, and the cost of providing the service. Revenue is recognized as each element is delivered.
Revenue is reported net of customer credits and sales and use tax. Invoiced amounts and accrued unbilled usage is recorded in accounts receivable and either deferred revenue or revenue, depending on whether the revenue recognition criteria have been met. Therefore, deferred revenue primarily consists of amounts that have been prepaid or deferred installation fees. As of December 31, 2015, of the total $31.2 million in deferred revenue recorded on our balance sheet (the majority of which related to prepaid amounts), $29.6 million, $1.4 million and $0.2 million will be amortized to revenue in 2016, 2017 and 2018, respectively.
Cost of Revenue
Cost of revenue consists primarily of expenses related to personnel, licenses, and our data center facilities. Personnel expenses include the salaries, non-equity incentive compensation, share-based compensation and related expenses of our support teams and data center employees, and data center facility costs include rental fees, power costs, maintenance fees, and bandwidth.
Advertising Costs
We charge advertising costs to sales and marketing expense in the period incurred. Advertising expenses for the years ended December 31, 2013, 2014 and 2015 were approximately $58.9 million, $59.2 million and $58.4 million, respectively.
Share-Based Compensation
We grant equity awards, including stock options and restricted stock, to eligible participants. The fair value of stock options is determined using the Black-Scholes valuation model, which requires us to make assumptions and judgments about variables related to our common stock and the related awards. We recognize share-based compensation expense on a straight-line basis over the vesting period.
All restricted stock grants include a service requirement for vesting. We have also granted restricted stock that includes either a performance or market condition. The fair value of restricted stock with either solely a service requirement or with the combination of service and performance requirements is based on the closing fair market value of our common stock on the date of grant. The fair value of restricted stock with vesting conditions dependent market performance is determined using a Monte Carlo simulation. Share-based compensation expense is recognized on a straight-line basis over the service period or over our best estimate of the period over which the performance condition will be met, as applicable.
- 65 -
Income Taxes
Income taxes are accounted for using the asset and liability method. Deferred income taxes are provided for temporary differences in recognizing certain income, expense, and credit items for financial reporting purposes and tax reporting purposes. Such deferred income taxes primarily relate to the difference between the tax bases of assets and liabilities and their financial reporting amounts. Deferred tax assets and liabilities are measured by applying enacted statutory tax rates applicable to the future years in which deferred tax assets or liabilities are expected to be settled or realized. In assessing the realizability of deferred tax assets, management considers whether it is more likely than not that some portion or all of the deferred tax assets will be realized. The ultimate realization of deferred tax assets is dependent upon the generation of future taxable income during the periods in which those temporary differences become deductible. Management considers the scheduled reversals of deferred tax liabilities, projected future taxable income and tax planning strategies in making this assessment. Based upon projections of future taxable income over the periods in which the deferred tax assets are deductible, management believes it is more likely than not that we will realize the benefits of these deductible differences.
We are currently under income tax audits in the U.K., California, and Pennsylvania. Due to the complexity involved with certain tax matters, there is the possibility that the various taxing authorities may disagree with certain tax positions filed on our income tax returns. We have considered all relevant facts and circumstances and believe that we have made adequate provision for all income tax uncertainties. For a further discussion of the impact of uncertain tax positions, see Note 11, "Taxes."
We do not provide for a U.S. income tax liability on undistributed earnings of our foreign subsidiaries. The earnings of non-U.S. subsidiaries, which reflect full provision for non-U.S. income taxes, are currently indefinitely reinvested in non-U.S. operations.
Refer to "Recent Accounting Pronouncements" below for information on our adoption of new accounting guidance on the presentation of deferred taxes in the balance sheet.
Fair Value of Financial Instruments
Fair value is defined as the price that would be received to sell an asset or paid to transfer a liability in an orderly transaction between market participants at the measurement date. There is a three-tier fair value hierarchy, which prioritizes the inputs used in measuring fair value as follows:
Level 1 – Observable inputs such as quoted prices in active markets for identical assets or liabilities;
Level 2 – Inputs other than Level 1 that are observable, either directly or indirectly, such as quoted prices for similar assets or liabilities, quoted prices in markets that are not active, or other inputs that are observable or can be corroborated by observable market data for substantially the full term of the assets or liabilities; and
Level 3 – Unobservable inputs that are supported by little or no market activity, which require management judgment or estimation.
Money market funds, classified in cash and cash equivalents, were $11 million and $226 million as of December 31, 2014 and 2015, respectively, and are Level 1 financial instruments. See Note 6, "Debt" for discussion on the fair value of our debt instruments.
Foreign Currency
We have assessed the functional currency of each of our international subsidiaries and have generally designated the local currency to be their respective functional currencies. The consolidated financial statements of these foreign subsidiaries are translated into the U.S. dollar. All assets and liabilities are translated to the U.S. dollar at the end-of-period exchange rates. Capital accounts are determined to be of a permanent nature and are therefore translated using historical exchange rates. Revenue and expenses are translated using average exchange rates.
Foreign currency translation adjustments arising from differences in exchange rates from period to period are included in the foreign currency translation adjustment account in accumulated comprehensive income (loss). The income tax expense allocated to foreign currency translation adjustments during the year ended December 31, 2015 was $0.2 million. There was no income taxes allocated in the years ended December 31, 2013 or 2014.
- 66 -
Transaction gains or losses in currencies other than the functional currency are included as a component of other income (expense) in the consolidated statements of comprehensive income.
Recent Accounting Pronouncements
Revenue Recognition
In May 2014, the Financial Accounting Standards Board ("FASB") issued a new standard on revenue recognition. The core principle of the new guidance is that an entity should recognize revenue to depict the transfer of promised goods or services to customers in an amount that reflects the consideration to which the entity expects to be entitled in exchange for those goods or services. In addition, the standard requires capitalization of incremental costs to obtain a contract and significantly expanded quantitative and qualitative disclosures. In August 2015, the FASB issued guidance which deferred the effective date by one year. The standard is effective for annual reporting periods beginning after December 15, 2017, including interim periods within that reporting period, with early adoption permitted for annual periods beginning after December 15, 2016. We intend to adopt the standard on January 1, 2018. Upon adoption, the new guidance will be applied retrospectively using one of two methods. One method is to apply the guidance retrospectively to each prior period presented with practical expedients available. The second method is to apply the guidance retrospectively with the cumulative effect of initially applying the standard recognized at the date of initial application. We are continuing to evaluate our method of adoption and the impact this new accounting standard will have on our consolidated financial statements.
Debt Issuance Costs
In April 2015, the FASB issued guidance to simplify the presentation of debt issuance costs in the balance sheet. The guidance requires that debt issuance costs be presented as a direct deduction from the carrying value of the related debt liability. The recognition and measurement guidance for debt issuance costs are not affected by this new guidance. In August 2015, the FASB issued additional guidance to clarify the views of the SEC staff on the presentation of debt issuance costs related to line-of-credit arrangements. Under the additional guidance, an entity can defer and present debt issuance costs related to a line-of-credit arrangement as an asset and subsequently amortize the such costs ratably over the term of the line-of-credit arrangement, regardless of whether there are any outstanding borrowings under the arrangement.
We elected to early adopt this guidance in the fourth quarter of 2015. As a result, we have classified debt issuance costs related to the November 25, 2015 issuance of 6.5% Senior Notes due 2024 as a direct deduction from the carrying value of the debt liability on our consolidated balance sheet as of December 31, 2015. Debt issuance costs related to our new Revolving Credit Facility due 2020 entered into on November 25, 2015 are classified as an asset within "Other non-current assets" on our consolidated balance sheet as of December 31, 2015. We are required to apply this new guidance on a retrospective basis; however, there was no retrospective impact on our balance sheet as of December 31, 2014, as all capitalized debt issuance costs were related to our previous Revolving Credit Facility due 2016 and were classified as an asset within "Other non-current assets."
Balance Sheet Classification of Deferred Taxes
In November 2015, the FASB issued guidance to simplify the presentation of deferred taxes in the balance sheet. The new guidance eliminates the requirement that companies must present all deferred tax assets and liabilities as current and non-current in the balance sheet. Under the new guidance, companies are required to classify all deferred tax assets and liabilities as non-current.
We elected to early adopt this new standard in the fourth quarter of 2015 on a retrospective basis. All prior period financial information has been adjusted to reflect the retrospective application of this new guidance. The reclassification of our consolidated balance sheet as of December 31, 2014 resulted in a net decrease of $8.2 million in total assets, including a $9.3 million reduction in current assets and a $1.1 million increase in non-current assets, with an offsetting decrease of $8.2 million in non-current liabilities.
- 67 -
2. Net Income Per Share
The following table sets forth the computation of basic and diluted net income per share:
Year Ended December 31, | ||||||||||||
(In millions except per share data) | 2013 | 2014 | 2015 | |||||||||
Basic net income per share: | ||||||||||||
Net income | $ | 86.7 | $ | 110.6 | $ | 126.2 | ||||||
Weighted average shares outstanding: | ||||||||||||
Common stock | 138.6 | 142.0 | 139.0 | |||||||||
Number of shares used in per share computations | 138.6 | 142.0 | 139.0 | |||||||||
Net income per share | $ | 0.63 | $ | 0.78 | $ | 0.91 | ||||||
Diluted net income per share: | ||||||||||||
Net income | $ | 86.7 | $ | 110.6 | $ | 126.2 | ||||||
Weighted average shares outstanding: | ||||||||||||
Common stock | 138.6 | 142.0 | 139.0 | |||||||||
Stock options, awards and employee share purchase plans | 4.4 | 2.5 | 2.0 | |||||||||
Number of shares used in per share computations | 143.0 | 144.5 | 141.0 | |||||||||
Net income per share | $ | 0.61 | $ | 0.77 | $ | 0.90 | ||||||
We excluded 3.5 million, 5.0 million and 3.9 million potential common shares from the computation of dilutive net income per share for the years ended December 31, 2013, 2014 and 2015, respectively, because the effect would have been anti-dilutive.
- 68 -
3. Property and Equipment, net
Property and equipment, net, at December 31, 2014 and 2015 consisted of the following:
(In millions) | December 31, 2014 | December 31, 2015 | ||||||
Computers and equipment | $ | 1,495.2 | $ | 1,787.2 | ||||
Computer software | 318.9 | 370.6 | ||||||
Furniture and fixtures | 56.7 | 63.5 | ||||||
Buildings and leasehold improvements | 253.6 | 355.7 | ||||||
Land | 27.9 | 28.1 | ||||||
Property and equipment, at cost | 2,152.3 | 2,605.1 | ||||||
Less: Accumulated depreciation and amortization | (1,249.5 | ) | (1,539.7 | ) | ||||
Work in process | 154.9 | 82.6 | ||||||
Property and equipment, net | $ | 1,057.7 | $ | 1,148.0 | ||||
The composition of the work in process balance was as follows:
(In millions) | December 31, 2014 | December 31, 2015 | ||||||
Office facility build outs | $ | 51.3 | $ | 11.5 | ||||
Data center build outs | 80.5 | 49.0 | ||||||
Capitalized software | 23.1 | 22.1 | ||||||
Work in process | $ | 154.9 | $ | 82.6 | ||||
During 2015, we placed into service and began depreciating $51.4 million of construction costs related to the completed portion of a data center in the U.K. and $47.7 million of construction costs related to the completion of our new U.K. office. We are deemed the owner of both buildings for accounting purposes. See Note 7. "Leases" for more information.
Depreciation and amortization expense on property and equipment was $303.2 million, $362.2 million and $390.4 million in 2013, 2014 and 2015, respectively. Included in these amounts was amortization expense for capitalized computer software costs of $50.6 million, $63.7 million and $61.4 million, respectively. As of December 31, 2014 and 2015, the unamortized balance of computer software costs on our balance sheets was $103.4 million and $94.1 million, respectively.
- 69 -
4. Intangible Assets
The following tables provide information regarding our intangible assets, other than goodwill:
December 31, 2014 | |||||||||||
(In millions) | Gross carrying amount | Accumulated amortization | Net carrying amount | ||||||||
Intangible assets: | |||||||||||
Licenses | $ | 32.5 | $ | (25.4 | ) | $ | 7.1 | ||||
Purchased technologies | 13.2 | (10.0 | ) | 3.2 | |||||||
Non-compete agreements | 2.1 | (2.0 | ) | 0.1 | |||||||
Customer relationships | 6.1 | (5.6 | ) | 0.5 | |||||||
Other | 12.7 | (7.0 | ) | 5.7 | |||||||
Total | $ | 66.6 | $ | (50.0 | ) | $ | 16.6 | ||||
December 31, 2015 | |||||||||||
(In millions) | Gross carrying amount | Accumulated amortization | Net carrying amount | ||||||||
Intangible assets: | |||||||||||
Licenses | $ | 33.5 | $ | (29.8 | ) | $ | 3.7 | ||||
Purchased technologies | 12.4 | (11.7 | ) | 0.7 | |||||||
Non-compete agreements | 2.1 | (2.1 | ) | — | |||||||
Customer relationships | 5.9 | (5.6 | ) | 0.3 | |||||||
Other | 13.8 | (9.4 | ) | 4.4 | |||||||
Total | $ | 67.7 | $ | (58.6 | ) | $ | 9.1 | ||||
Amortization expense on intangibles was $9.8 million, $9.7 million and $9.5 million in 2013, 2014 and 2015, respectively. Intangible assets are recorded at cost and are amortized on a straight-line basis over their estimated useful lives, which generally range from two to five years.
As of December 31, 2015, amortization expense on intangible assets for the next five years was expected to be as follows:
(In millions) | |||
Year ending: | Amount | ||
2016 | $ | 6.7 | |
2017 | 1.4 | ||
2018 | 0.5 | ||
2019 | 0.2 | ||
2020 | 0.2 | ||
Thereafter | 0.1 | ||
Total | $ | 9.1 | |
5. Cost-Method Investments
We have several direct investments accounted for under the cost method. The aggregate carrying amount of our cost-method investments, which are recorded as Other non-current assets, as of December 31, 2014 and December 31, 2015 was $1.1 million and $11.6 million, respectively. We have determined that it is not practicable to estimate the fair value of these investments. If we identify events or changes in circumstances that may have a significant adverse effect on the fair value of these investments, we will then estimate their fair values and determine if any decline in the fair value of the investments below carrying value is other-than-temporary. No events or circumstances indicating a potential impairment were identified as of December 31, 2015.
- 70 -
6. Debt
Debt consisted of:
December 31, 2014 | |||||||||||||||
(In millions) | Revolving Credit Facility | Senior Notes due 2024 | Note Payable | Total | |||||||||||
Principal balance | $ | 25.0 | $ | — | $ | 0.1 | $ | 25.1 | |||||||
Unamortized debt issuance costs | — | — | — | — | |||||||||||
Total debt | 25.0 | — | 0.1 | 25.1 | |||||||||||
Less: current portion of debt | (25.0 | ) | — | (0.1 | ) | (25.1 | ) | ||||||||
Debt, excluding current portion | $ | — | $ | — | $ | — | $ | — | |||||||
December 31, 2015 | |||||||||||||||
(In millions) | Revolving Credit Facility | Senior Notes due 2024 | Note Payable | Total | |||||||||||
Principal balance | $ | — | $ | 500.0 | $ | — | $ | 500.0 | |||||||
Unamortized debt issuance costs | — | (7.6 | ) | — | (7.6 | ) | |||||||||
Total debt | — | 492.4 | — | 492.4 | |||||||||||
Less: current portion of debt | — | — | — | — | |||||||||||
Debt, excluding current portion | $ | — | $ | 492.4 | $ | — | $ | 492.4 | |||||||
Revolving Credit Facility
On November 25, 2015, we entered into a new, five-year $200 million unsecured revolving credit facility (the "Revolving Credit Facility"), with proceeds from loans under the facility available for working capital and general corporate purposes. We have the option to increase the amount of the Revolving Credit Facility by up to an additional $200 million, subject to certain terms and conditions. The Revolving Credit Facility matures on November 25, 2020 and replaced our previous revolving credit facility that was to mature on September 26, 2016. Outstanding borrowings of $140 million under the previous revolving credit facility were repaid on November 25, 2015 using proceeds from the issuance of the Senior Notes, discussed below. As of December 31, 2015, we had no outstanding borrowings under the Revolving Credit Facility and $0.4 million of undrawn letters of credit.
Borrowings will bear interest, at our option, at either (i) an annual floating rate equal to the base rate plus a margin of between 0.25% and 1.00% or (ii) an annual rate equal to the reserve adjusted Eurodollar rate plus a margin of between 1.25% and 2.00%. Both margins are dependent on our degree of financial leverage. The base rate is defined as the greatest of (A) JPMorgan Chase Bank N.A.'s prime rate, (B) the federal funds rate plus 0.50% or (C) the rate at which deposits in U.S. dollars are offered in the London interbank market for a period of one month plus 1.00%. The Eurodollar rate is determined as the rate at which deposits in U.S. dollars are offered in the London interbank market for the applicable interest period. We also pay a fee on the committed but unused amount of the facility, which ranges from 0.25% to 0.40%, also depending on our degree of financial leverage.
Rackspace Hosting, Inc. is the borrower under the Revolving Credit Facility, and all obligations under the facility are currently guaranteed by Rackspace Hosting, Inc. and Rackspace US, Inc., a wholly owned, domestic subsidiary of Rackspace Hosting, Inc. The facility describes certain terms and conditions under which other current or future domestic subsidiaries could also become guarantors of the facility. The facility requires the maintenance of a maximum consolidated total leverage ratio and a minimum consolidated fixed charge ratio in addition to customary affirmative and negative covenants, including covenants that limit or restrict our ability to grant liens, incur indebtedness, sell assets, make investments and make restricted payments subject to customary exceptions for a credit facility of this size and type. As of December 31, 2015, we were in compliance with all covenants under this facility.
Debt issuance costs of $1.0 million related to the Revolving Credit Facility were classified as an asset within "Other non-current assets" on the consolidated balance sheets and are being amortized over the term of the Revolving Credit Facility on a straight-line basis.
- 71 -
Senior Notes due 2024
On November 25, 2015, we completed the issuance of $500 million aggregate principal amount of 6.5% Senior Notes due 2024 (the "Senior Notes") to qualified institutional buyers pursuant to Rule 144A under the Securities Act of 1933, as amended (the "Securities Act"), and outside the United States to non-U.S. persons pursuant to Regulation S under the Securities Act. The Senior Notes will mature on January 15, 2024 and bear interest at a rate of 6.5% per year, payable semi-annually on January 15 and July 15 of each year. The first interest payment date is July 15, 2016.
Rackspace Hosting, Inc. is the issuer of the Senior Notes, and obligations under the Senior Notes are guaranteed on a senior unsecured basis by Rackspace Hosting, Inc. and Rackspace US, Inc., a wholly owned, domestic subsidiary of Rackspace Hosting Inc. The Senior Notes indenture describes certain terms and conditions under which other current and future domestic subsidiaries could also become guarantors of the Senior Notes.
The Senior Notes indenture contains covenants that, among other things, limit our ability to incur additional debt, pay dividends or make other restricted payments, purchase, redeem or retire capital stock or subordinated debt, make asset sales, incur liens, enter into sale-leaseback transactions, provide subsidiary guarantees, engage in certain transactions with affiliates, make investments, and engage in mergers or consolidations.
Debt issuance costs of $7.7 million related to the Senior Notes were classified as a direct deduction from the carrying value of the long-term debt liability on the consolidated balance sheets and are being amortized over the term of the Senior Notes on a straight-line basis.
As of December 31, 2015, the outstanding principal amount of the Senior Notes was $500 million and we were in compliance with all covenants under the indenture.
The fair value of the Senior Notes as of December 31, 2015 was $482.5 million, based on quoted market prices for identical assets that are traded in over-the-counter secondary markets that are not considered active. The fair value of the Senior Notes is classified as Level 2 in the fair value hierarchy.
- 72 -
7. Leases
Operating Leases
We lease most of our data center facilities and office space under non-cancelable operating lease agreements, which expire at various dates through 2033. Facility leases generally include renewal options and may include escalating rental payment provisions. Additionally, they may require us to pay a portion of the related operating expenses. Rent expense was $66.0 million, $74.0 million and $79.4 million for 2013, 2014 and 2015, respectively.
As of December 31, 2015, future minimum rental payments under operating leases with an initial non-cancelable lease term in excess of one year were as follows:
(In millions) | |||
Year ending: | Amount | ||
2016 | $ | 71.4 | |
2017 | 69.2 | ||
2018 | 63.7 | ||
2019 | 63.7 | ||
2020 | 62.9 | ||
Thereafter | 515.2 | ||
Total minimum operating lease payments | $ | 846.1 | |
Capital Leases
We lease certain equipment under capital lease agreements. Assets recorded as property and equipment under capital leases and the accumulated depreciation thereon as of December 31, 2014 and 2015 were as follows:
(In millions) | December 31, 2014 | December 31, 2015 | |||||
Computers and equipment | $ | 74.0 | $ | 10.4 | |||
Less: Accumulated depreciation | (57.9 | ) | (6.7 | ) | |||
Net book value of property and equipment under capital leases | $ | 16.1 | $ | 3.7 | |||
Note that amounts as of December 31, 2014 have been revised to exclude assets that had transferred ownership upon the conclusion of the capital lease to conform to current year presentation.
As of December 31, 2015, future minimum lease payments under capital leases were as follows:
(In millions) | |||
Year ending: | Amount | ||
2016 | $ | 1.7 | |
2017 | 0.1 | ||
2018 | 0.1 | ||
Total minimum capital lease payments | 1.9 | ||
Less amount representing interest | — | ||
Present value of net minimum capital lease payments | $ | 1.9 | |
- 73 -
Build-to-Suit Leases
We have entered into build-to-suit lease arrangements under which we are considered the accounting owner of certain real estate projects. Assets recorded as property and equipment under build-to-suit leases and the accumulated depreciation thereon as of December 31, 2014 and 2015 were as follows:
(In millions) | December 31, 2014 | December 31, 2015 | |||||
Work in process | $ | 110.0 | $ | 48.5 | |||
Buildings | 7.7 | 103.6 | |||||
Less: Accumulated depreciation | (0.2 | ) | (2.3 | ) | |||
Net book value of property and equipment under build-to-suit leases | $ | 117.5 | $ | 149.8 | |||
During the first quarter of 2015, construction of a data center in the U.K. was partially completed, and we commenced the lease on this portion of the project. However, since the project is considered one unit of accounting, we will not perform a sale-leaseback analysis until the entire project is completed, which is not expected to occur until 2021. As a result, we placed into service and began depreciating $51.4 million of construction costs related to the completed portion of the project. Quarterly payments will be made through January 2041. The lease includes certain fair value renewal options that have not been included in the lease term.
During the third quarter of 2015, construction of an office building in the U.K was completed. We performed a sale-leaseback analysis, and, due to our continuing involvement in the project, we were precluded from derecognizing the asset and liability. As a result, we placed into service and began depreciating $47.7 million of construction costs over the 10-year term of the lease. There are no renewal options within the lease.
As of December 31, 2015, future minimum lease payments under build-to-suit leases were as follows:
(In millions) | |||
Year ending: | Amount | ||
2016 | $ | 8.7 | |
2017 | 12.5 | ||
2018 | 15.0 | ||
2019 | 15.5 | ||
2020 | 17.1 | ||
Thereafter | 276.3 | ||
Total minimum build-to-suit lease payments | 345.1 | ||
Plus amount representing residual asset balance | 60.3 | ||
Less amount representing executory costs | (0.8 | ) | |
Less amount representing interest | (240.3 | ) | |
Finance lease obligations for build-to-suit leases | $ | 164.3 | |
During 2015, we changed our non-current liability account title for finance lease obligations for assets under construction to finance lease obligations for build-to-suit leases. This non-current liability account now includes all build-to-suit finance lease obligations, including those for assets under construction as well as projects that did not qualify as a sale-leaseback at the completion of construction. As a result, finance lease obligations of $7.4 million as of December 31, 2014 associated with a build-to-suit construction projects that failed sale leaseback have been reclassified from capital lease obligations to finance lease obligations for build-to-suit leases in the consolidated balance sheets to conform to the current period presentation.
- 74 -
8. Commitments and Contingencies
Purchase Commitments
Non-cancelable purchase commitments primarily consist of commitments for certain software licenses, hardware purchases, and costs associated with our data centers, including bandwidth and electricity. The agreements can generally extend up to five years and provide for either penalties for early termination or may require minimum commitments for the remaining term. The minimum commitments for all of these agreements as of December 31, 2015 approximated $74.5 million, $11.7 million, $1.1 million, $0.3 million, and $0.3 million for the years ended December 31, 2016, 2017, 2018, 2019 and 2020, respectively.
We also have purchase orders and construction contracts primarily related to data center equipment and facility build-outs. We generally have the right to cancel these open purchase orders prior to delivery or terminate the contracts without cause.
Legal Proceedings
We are party to various legal and administrative proceedings that we consider routine and incidental to our business. Although the outcome of these matters is currently not determinable, management expects that any losses that are incurred as a result of these matters, which are in excess of amounts already accrued in its consolidated balance sheet, would not be material to the consolidated financial statements as a whole.
We are also a party to various claims that certain of our services and technologies infringe the intellectual property rights of others. Adverse results in these lawsuits may include awards of substantial monetary damages, costly royalty or licensing agreements, or orders preventing us from offering certain features, products, or services, and may also cause us to change our business practices and require development of non-infringing products or technologies, which could result in a loss of revenue for us and otherwise harm our business. We have disputed the allegations of wrongdoing in these proceedings and intend to vigorously defend ourselves in all such matters.
We cannot predict the impact, if any, that any of the matters described above may have on our business, results of operations, financial position, or cash flows. Because of the inherent uncertainties of such matters, including the early stage and lack of specific damage claims in many of them, we cannot estimate the range of possible losses from them.
We record to cost of revenue state sales taxes related to software licenses acquired to provide hosting services to customers. We also remit state sales taxes collected from our customers for hosting services invoiced to our customers, with such services including the use of the aforementioned software licenses. During the year ended December 31, 2014, we recorded a $7 million benefit to cost of revenue for settlement of a dispute related to sales taxes paid on such software licenses for the period September 2007 through April 2014.
Indemnifications
As permitted under Delaware law, we have agreements whereby we indemnify our officers and directors for certain events or occurrences while the officer or director is, or was, serving at our request in such capacity. The term of the indemnification period is for the officer’s or director’s lifetime. The maximum potential amount of future payments we could be required to make under these indemnification agreements is unlimited; however, we have a director and officer insurance policy that limits our exposure and enables us to recover a portion of any future amounts paid. As a result of the insurance policy coverage, we believe the estimated fair value of these indemnification agreements is minimal. We had no significant liabilities recorded for these agreements as of December 31, 2014 or 2015.
Additionally, in the normal course of business, we indemnify certain parties, including customers, vendors and lessors, with respect to certain matters. We have agreed to hold certain parties harmless against losses arising from a breach of representations or covenants or out of intellectual property infringement or other claims made against certain parties. These agreements may limit the time within which an indemnification claim can be made and the amount of the claim. We had no significant liabilities recorded for these agreements as of December 31, 2014 or 2015.
- 75 -
Incentive Arrangements
In August 2007, we entered into a lease for our corporate headquarters. In connection with this lease, we also entered into a Master Economic Incentives Agreement ("MEIA") with the Cities of Windcrest and San Antonio, Texas; Bexar County; and certain other parties, pursuant to which we agreed to locate existing and future employees at the new facility location. The agreement required that we meet certain employment levels each year in exchange for a 14-year exemption from most of the property taxes associated with the property. If we fail to meet these job creation requirements, we could lose a portion or all of the tax exemption provided during the 14-year period and would then be obligated to repay the exemption amount. We have met the requirements for the employment level for the year ended December 31, 2015, and we believe that it is probable that we will continue to meet the requirements throughout the exemption period. The exemption period began in 2009.
Additionally, we entered into an agreement with the State of Texas, under which we received $5.0 million in 2007, $3.5 million in 2012, and $5.5 million in 2014 for meeting certain new employment levels in the State of Texas. We are responsible for maintaining the jobs until January 2022. If we eliminate jobs for which we have drawn funds, we are subject to a clawback on the amounts we have drawn plus 3.4% interest on such amounts per year. As of December 31, 2015, the $14.0 million received was deferred and recorded as other non-current liabilities. Amounts will be recognized into income upon the achievement of the performance criteria and the determination that the cash is no longer refundable to the State of Texas.
9. Stockholders' Equity
Common Stock
At December 31, 2014 and 2015, we had 140.9 million and 130.9 million shares of our common stock legally issued and outstanding, respectively.
We have one class of authorized common stock. The rights and privileges provided to our common stockholders are as follows:
•Dividend Rights—Subject to preferences that may apply to shares of preferred stock outstanding at the time, the holders of our common stock are entitled to receive dividends, at the discretion of our board of directors.
•Voting Rights—All holders of common stock are entitled to one vote per share on all matters to be voted on by Rackspace Hosting's stockholders.
•Right to Receive Liquidation Distributions—Upon liquidation, dissolution or winding-up, the holders of our common stock are entitled to share equally in all of our assets remaining after payment of all liabilities and the liquidation preferences of any outstanding preferred stock.
Preferred Stock
As of December 31, 2014 and 2015, there were 50 million authorized shares of preferred stock, of which none was issued or outstanding.
Share Repurchase Program
On November 6, 2014, our board of directors authorized a share repurchase program to repurchase up to $500 million of our common stock.
On November 12, 2014, we entered into an accelerated share repurchase ("ASR") agreement with a financial institution and paid $200 million to repurchase our common stock. The payment was accounted for as a reduction to stockholders' equity in our consolidated balance sheet as of December 31, 2014. We received an initial delivery of 3.3 million shares of common stock in November 2014, and we received an additional 0.9 million shares of common stock in May 2015 as final settlement of the ASR. All shares were subsequently retired.
We reflected the ASR agreement as a repurchase of common stock for purposes of calculating earnings per share and as a forward contract indexed to our common stock. The forward contract met all the applicable criteria for equity classification, and therefore, was not accounted for as a derivative instrument.
- 76 -
On August 5, 2015, our board of directors increased the authorization under the existing share repurchase program to a total of up to $1 billion, in addition to the $200 million already purchased under the ASR. The program will remain in effect for a period not to exceed 24 months from authorization. Under this program, shares may be repurchased from time to time through both open market and privately negotiated transactions.
In addition to the 0.9 million shares of common stock received as final settlement of the ASR, we repurchased $367 million, or 12.2 million shares, of our common stock on the open market during 2015. These shares were subsequently retired. Therefore, as of December 31, 2015, approximately $633 million remained available for additional purchases under the current program.
10. Share-Based Compensation
Our 2007 Long-Term Incentive Plan, as amended and restated (the "2007 Stock Plan"), provides for the grant of equity awards, including incentive and non-qualified stock options or rights to purchase common stock, stock appreciation rights, restricted stock awards, restricted stock units, performance awards, cash-based awards, and dividend equivalents, to eligible participants. All awards, excluding incentive stock options, may be granted to employees, officers, directors, or any other non-employee service provider to the company. Incentive stock options may be granted only to employees of the company or a subsidiary. The exercise price of a stock option granted under the 2007 Stock Plan is determined by our Compensation Committee at the time the option is granted and generally may not be less than 100% of the fair market value of a share of common stock as of the date of grant.
Under our 2007 Stock Plan, we have granted stock options and restricted stock, including restricted stock units and restricted stock awards. Collectively, all such grants are referred to as "awards." Stock options and restricted stock granted under the 2007 Stock Plan prior to May 2012 deduct one share from the number of shares available for issuance for each share granted. Beginning in May 2012, new grants of restricted stock counted against the numerical limits of the 2007 Stock Plan as 1.76 shares for every one share that was subject to such an award, and, beginning in May 2014, this was increased to 1.93 shares. To the extent awards granted under the 2007 Stock Plan terminate, expire or lapse, shares subject to such awards generally will again be available for future grant.
In addition to the 2007 Stock Plan, we maintain the 2005 Stock Plan and plans assumed through acquisitions, collectively referred to as "Other Stock Plans."
As of December 31, 2015, the total number of shares authorized, outstanding and available for future grants under our stock plans was as follows:
(In millions) | Shares Authorized | Shares Outstanding | Shares Available for Future Grants | ||||
2007 Stock Plan | 40.2 | 9.8 | 10.1 | ||||
Other Stock Plans | 11.7 | 0.1 | — | ||||
Total | 51.9 | 9.9 | 10.1 | ||||
The composition of the equity awards outstanding as of December 31, 2014 and 2015 was as follows:
(In millions) | December 31, 2014 | December 31, 2015 | ||
Restricted stock | 4.3 | 5.4 | ||
Stock options | 6.8 | 4.5 | ||
Total outstanding awards | 11.1 | 9.9 | ||
- 77 -
Restricted Stock
Restricted stock grants generally vest as the employee continues to be employed with us, in four equal installments, on each of the first, second, third and fourth anniversaries of the grant date. The fair value of these service-vesting awards is measured based on the closing fair market value of our common stock on the date of grant, and share-based compensation expense is recognized ratably over the four-year service period.
In addition to our service-vesting restricted stock awards, historically, certain members of our executive team received restricted stock that contained vesting conditions dependent upon predetermined market results measured at the end of three years. The fair values of these market-vesting awards were measured using a Monte Carlo simulation based on the date of grant, with share-based compensation expense recognized ratably over the three-year vesting period. During 2015, the awards that reached their measurement date did not meet the predetermined market results, and the awards were cancelled with no shares being issued. As of December 31, 2015, 0.2 million of these awards remain outstanding with measurement dates occurring throughout 2016.
Additionally, we have granted awards to members of our executive team with vesting dependent upon the attainment of predetermined financial performance results over the next one to three years. The fair values of these performance-vesting awards is measured based on the closing fair market value of our common stock on the date of grant, and share-based compensation expense is recognized ratably over our best estimate of the period over which the performance condition will be met. In 2015, we granted 0.3 million of these awards.
The following table summarizes our restricted stock activity for the year ended December 31, 2015:
Number of Units or Shares (in millions) | Weighted-Average Grant-Date Fair Value | |||||
Outstanding at December 31, 2014 | 4.3 | $ | 34.49 | |||
Granted | 3.0 | $ | 35.39 | |||
Released | (1.2) | $ | 38.47 | |||
Cancelled | (0.7) | $ | 36.15 | |||
Outstanding at December 31, 2015 | 5.4 | $ | 35.48 | |||
Expected to vest after December 31, 2015* | 4.5 | $ | 35.68 | |||
The weighted-average grant-date fair value of restricted stock granted during 2013 and 2014 was $39.24 and $34.87, respectively. The total pre-tax intrinsic value of the restricted stock released during 2013, 2014 and 2015 was $29.7 million, $52.7 million and $46.8 million, respectively.
- 78 -
Stock Options
Stock options have generally been granted for terms of either seven or ten years and generally vest ratably over a four-year period or cliff-vest at the third anniversary date of the grant.
The following table summarizes the stock option activity for the year ended December 31, 2015:
Number of Shares (in millions) | Weighted-Average Exercise Price | Weighted-Average Remaining Contractual Life | Aggregate Intrinsic Value (in millions) | |||||||||
Outstanding at December 31, 2014 | 6.8 | $ | 32.62 | 4.21 | $ | 104.3 | ||||||
Granted | 0.0 | $ | 37.65 | |||||||||
Exercised | (1.7) | $ | 15.73 | |||||||||
Forfeited | (0.4) | $ | 44.59 | |||||||||
Expired | (0.2) | $ | 47.31 | |||||||||
Outstanding at December 31, 2015 | 4.5 | $ | 37.34 | 3.58 | $ | 15.1 | ||||||
Vested and exercisable at December 31, 2015 | 3.2 | $ | 34.15 | 3.20 | $ | 15.1 | ||||||
Vested and exercisable at December 31, 2015 and expected to vest thereafter* | 4.4 | $ | 37.11 | 3.54 | $ | 15.1 | ||||||
The total pre-tax intrinsic value of the stock options exercised during 2013, 2014 and 2015 was $76.4 million, $44.1 million and $55.5 million, respectively.
The following table presents the assumptions used to estimate the fair values of the stock options granted in the periods presented:
Years Ended December 31, | ||||||
2013 | 2014 | 2015 | ||||
Expected stock volatility (1) | 46% - 47% | 46% - 48% | 45% | |||
Expected dividend yield (2) | —% | —% | —% | |||
Risk-free interest rate (3) | 0.57% - 0.93% | 1.08% - 1.27% | 1.23% - 1.42% | |||
Expected life (4) | 3.79 years | 3.82 years | 3.87 years | |||
Weighted-average grant-date fair value of options granted during the year (5) | $15.86 | $15.34 | $13.52 | |||
(1) | Management estimates volatility by evaluating the weighted average of the implied volatility and the mean reversion volatility of the company’s stock. |
(2) | We have not issued dividends to date and do not anticipate issuing dividends. |
(3) | Based on the implied yield currently available on U.S. Treasury zero-coupon issues with an equivalent expected term. |
(4) | Represents the period that our share-based awards are expected to be outstanding. Management uses historical exercise data in our estimation of the expected life. |
(5) | Based on the end of day market price on the grant date. |
- 79 -
Employee Stock Purchase Plan
An Employee Stock Purchase Plan (the "ESPP") for U.S. employees was approved by the company's board of directors in 2011 and adopted on January 1, 2012. Under the ESPP, eligible employees may purchase a limited number of shares of our common stock at the lesser of 85% of the market value on the enrollment date or 85% of the market value on the purchase date. The ESPP is made up of a series of offering periods. Each offering period has a maximum term of 24 months and is divided into semi-annual purchase intervals. Eligible employees may enroll at the beginning of any semi-annual purchase interval. During 2015, we issued 0.2 million shares through the ESPP. The fair value on each enrollment date was determined using the Black-Scholes option-pricing model. Share-based compensation expense related to the ESPP was $3.1 million in each of the years 2013, 2014 and 2015.
Share-Based Compensation Expense
Share-based compensation expense was recognized as follows:
Year Ended December 31, | ||||||||||||
(In millions) | 2013 | 2014 | 2015 | |||||||||
Cost of revenue | $ | 12.6 | $ | 16.4 | $ | 16.8 | ||||||
Research and development | 8.1 | 12.6 | 13.7 | |||||||||
Sales and marketing | 7.3 | 9.6 | 9.7 | |||||||||
General and administrative | 31.6 | 31.4 | 37.9 | |||||||||
Pre-tax share-based compensation | 59.6 | 70.0 | 78.1 | |||||||||
Less: Income tax benefit | (20.1 | ) | (21.5 | ) | (27.2 | ) | ||||||
Total share-based compensation expense, net of tax | $ | 39.5 | $ | 48.5 | $ | 50.9 | ||||||
As of December 31, 2015, there was $168.7 million of total unrecognized compensation cost related to restricted stock, stock options and the ESPP, which will be amortized on a straight-line basis over a weighted-average period of 2.6 years.
11. Taxes
The provision for income taxes consisted of:
Year Ended December 31, | |||||||||||
(In millions) | 2013 | 2014 | 2015 | ||||||||
Current: | |||||||||||
Federal | $ | 35.9 | $ | 38.3 | $ | 48.1 | |||||
Foreign | 12.1 | 11.1 | 10.5 | ||||||||
State | 4.1 | 5.3 | 7.3 | ||||||||
Total current | 52.1 | 54.7 | 65.9 | ||||||||
Deferred: | |||||||||||
Federal | (3.9 | ) | (2.4 | ) | 3.0 | ||||||
Foreign | (1.6 | ) | (2.9 | ) | (2.5 | ) | |||||
State | (2.6 | ) | (0.4 | ) | 1.0 | ||||||
Total deferred | (8.1 | ) | (5.7 | ) | 1.5 | ||||||
Total provision for income taxes | $ | 44.0 | $ | 49.0 | $ | 67.4 | |||||
- 80 -
Income before income taxes from U.S. and foreign operations were as follows:
Year Ended December 31, | |||||||||||
(In millions) | 2013 | 2014 | 2015 | ||||||||
U.S. | $ | 91.0 | $ | 95.2 | $ | 137.4 | |||||
Foreign | 39.7 | 64.4 | 56.2 | ||||||||
Total income before income taxes | $ | 130.7 | $ | 159.6 | $ | 193.6 | |||||
A reconciliation of the statutory federal tax rate to the effective tax rate is as follows:
Year Ended December 31, | ||||||||
2013 | 2014 | 2015 | ||||||
Statutory federal tax rate | 35.0 | % | 35.0 | % | 35.0 | % | ||
State taxes, net of federal benefit | 0.7 | % | 1.7 | % | 2.8 | % | ||
Tax rate differentials for international jurisdictions | (3.8 | )% | (10.5 | )% | (6.9 | )% | ||
Permanent differences | 1.6 | % | 3.5 | % | 3.0 | % | ||
Deferred impact of intercompany transfers | 3.5 | % | 3.2 | % | 2.6 | % | ||
Research and development credit (current year) | (3.1 | )% | (2.1 | )% | (1.5 | )% | ||
Return to provision | (1.1 | )% | (0.7 | )% | (1.7 | )% | ||
Transfer pricing reserve | 2.8 | % | (0.2 | )% | 1.4 | % | ||
Other, net | (1.9 | )% | 0.8 | % | 0.1 | % | ||
Effective tax rate | 33.7 | % | 30.7 | % | 34.8 | % | ||
The tax rate differential for international jurisdictions has decreased from 2014 to 2015 as a decreased portion of our profits were earned outside the U.S. The impact of permanent differences has decreased from 2014 to 2015 as the global profit has increased, resulting in the permanent differences having a lesser impact on our global effective tax rate. State income taxes have increased from 2014 to 2015 as a result of legislative changes that were first effective in 2015 and increased profitability in the U.S.
In December 2015, the Protecting Americans from Tax Hikes (PATH) Act was signed into law which retroactively reinstated the Federal research credit, bonus depreciation and other provisions that expired on December 31, 2014. The extension of the Federal research credit resulted in a reduction of our effective tax rate in 2015. The Federal research credit has been extended permanently, and we expect the credit to continue to decrease our effective tax rate for years after 2015.
- 81 -
Deferred Taxes
Deferred income taxes reflect the net effects of temporary differences between the carrying amounts of assets and liabilities for financial reporting purposes. Significant components of our deferred tax assets and liabilities are as follows:
(In millions) | December 31, 2014 | December 31, 2015 | |||||
Deferred tax assets: | |||||||
Share-based compensation | $ | 27.2 | $ | 31.8 | |||
State income taxes | 2.2 | 2.5 | |||||
Vacation accruals | 3.5 | 0.3 | |||||
Deferred revenue | 5.3 | 6.1 | |||||
Deferred rent | 16.2 | 19.1 | |||||
Accruals not currently deductible | 8.4 | 12.5 | |||||
Net operating loss carryforwards | 4.8 | 6.0 | |||||
Foreign tax credit | 1.7 | 1.8 | |||||
Research and development credits | 13.4 | 16.4 | |||||
Other | 4.3 | 7.9 | |||||
Total gross deferred tax assets | 87.0 | 104.4 | |||||
Deferred tax liabilities: | |||||||
Depreciation | 134.6 | 145.9 | |||||
Prepaids | 4.0 | 6.2 | |||||
Other | 0.1 | 0.4 | |||||
Total gross deferred tax liabilities | 138.7 | 152.5 | |||||
Net deferred tax liabilities | $ | 51.7 | $ | 48.1 | |||
Realization of deferred tax assets is dependent upon future earnings, if any, the timing and amount of which are uncertain. Immaterial valuation allowances were established in 2014 and 2015 related to foreign tax credits that are expected to expire before they are utilized. For the rest of the deferred tax assets, valuation allowances were not deemed necessary based upon the determination that future profits are anticipated to utilize deferred tax assets in the future.
The company has not recognized a deferred tax liability for undistributed earnings of its foreign subsidiaries because such earnings are considered indefinitely invested in a foreign country. As of December 31, 2015, undistributed earnings of the company’s foreign subsidiaries considered indefinitely invested were $268.4 million. We intend to reinvest these earnings in active non-U.S. business operations and do not currently intend to repatriate these earnings to fund U.S. operations through either a dividend, liquidation or other means. In addition, estimates of future domestic cash generation will be sufficient to meet future domestic cash needs. Further, it is expected that the undistributed earnings of the company's foreign subsidiaries will be used to fund the additional investments made outside of the U.S. The determination of the amount of unrecognized deferred tax liability related to undistributed earnings is not practicable because of the complexities of the hypothetical calculation.
We have $98.6 million of federal net operating loss carryforwards and $25.3 million of federal tax credit carryforwards expiring at various dates through 2035. Of the $98.6 million of federal net operating loss carryforwards, $95.4 million are due to gross excess tax benefits from stock option exercises that have not been recorded as of December 31, 2015. We have $3.8 million of foreign net operating loss carryforwards, which have an indefinite expiration date.
Uncertain Tax Positions
We file income tax returns in each jurisdiction in which we operate, both domestically and internationally. Due to the complexity involved with certain tax matters, we have considered all relevant facts and circumstances for the financial statement recognition, measurement, presentation and disclosure of uncertain tax positions taken or expected to be taken in income tax returns. We believe that there are no other jurisdictions in which the outcome of uncertain tax matters is likely to be material to our results of operations, financial position or cash flows. We further believe that we have made adequate provision for all income tax uncertainties.
- 82 -
A reconciliation of our unrecognized tax benefits, excluding accrued interest, for 2014 and 2015 is as follows:
(In millions) | 2014 | 2015 | |||||
Balance, beginning of year | $ | 23.2 | $ | 21.0 | |||
Additions based on tax positions related to the current year | 2.5 | 1.1 | |||||
Additions for tax positions of prior years | 3.6 | 9.8 | |||||
Reduction for statute expiration | (0.9 | ) | — | ||||
Reductions for tax positions of prior years | (7.4 | ) | (1.1 | ) | |||
Balance, end of year | $ | 21.0 | $ | 30.8 | |||
Unrecognized tax benefits of $21.0 million and $30.8 million for 2014 and 2015, respectively, are included in other non-current liabilities on the balance sheet. At December 31, 2014 and 2015, respectively, approximately $13.1 million and $16.8 million of these unrecognized tax benefits, if recognized, would favorably impact our effective tax rate in any future period. Also included in the balance of unrecognized tax benefits at December 31, 2015 are liabilities of $14.0 million that, if recognized, would be recorded as an adjustment to other current and non-current assets. We do not expect the amount of unrecognized tax benefits disclosed above to change significantly over the next 12 months.
We recognize interest expense and penalties related to income tax matters within income tax expense on our consolidated statements of comprehensive income. Accrued interest and penalties as of December 31, 2014 and 2015 were not material.
We are subject to U.S. federal income tax and various state, local, and international income taxes in numerous jurisdictions. Our domestic and international tax liabilities are subject to the allocation of revenue and expenses in different jurisdictions and the timing of recognizing revenue and expenses. As such, our effective tax rate is impacted by the geographical distribution of income and mix of profits in the various jurisdictions. Additionally, the amount of income taxes paid is subject to our interpretation of applicable tax laws in the jurisdictions in which we file.
We currently file income tax returns in the U.S. and all foreign jurisdictions in which we have entities, which are periodically under audit by federal, state, and international tax authorities. These audits can involve complex matters that may require an extended period of time for resolution. We remain subject to U.S. federal and state income tax examinations for the tax years 2009 through 2015 and in the international jurisdictions in which we operate for varying periods from 2007 through 2015. We currently have income tax examinations open in the State of California for 2010, 2011 and 2012, the State of Pennsylvania for 2013 and 2014, and the United Kingdom for 2012. Although the outcome of open tax audits is uncertain, in management’s opinion, adequate provisions for income taxes have been made. If actual outcomes differ materially from these estimates, they could have a material impact on our financial condition and results of operations. Differences between actual results and assumptions or changes in assumptions in future periods are recorded in the period they become known. To the extent additional information becomes available prior to resolution, such accruals are adjusted to reflect probable outcomes.
Other
During 2015 we received a federal income tax refund of $0.7 million. We experienced taxable profits in the U.S. and U.K. in 2015 before consideration of excess tax benefits, and therefore we anticipate utilizing benefits of tax deductions related to stock compensation. As a result, we have recognized an excess tax benefit in the U.S. and U.K.
During 2011, 2012 and 2013, Rackspace US, Inc. sold certain intangible assets to a wholly-owned offshore subsidiary in taxable transactions. As a result of these transactions, there is an asset on the consolidated balance sheet as of December 31, 2015 of $22.2 million (of which $18.6 million was recorded in other non-current assets) that will be amortized through income tax expense over the lives of the applicable intangible assets. Although the transactions were taxable, the resulting gains were entirely offset against existing net operating losses, including excess stock compensation deductions. Thus, there was no cash tax impact from the sales of the intangible assets.
On July 27, 2015, in Altera Corp. v. Commissioner, the U.S. Tax Court issued an opinion related to the treatment of share-based compensation expense in an intercompany cost-sharing arrangement. At this time, the U.S. Department of the Treasury has not withdrawn the requirement to include share-based compensation from its regulations and the Internal Revenue Service may appeal. Until a final decision has been reached, we will continue to monitor developments related to the regulation and the possible impact, if any, of those developments on the consolidated financial statements.
- 83 -
12. Segment Information
We operate as one reportable segment based upon a number of factors including the basis for our budget and forecasts, the overall organization and management structure, and the consolidated financial information regularly used by our chief executive officer, who is the chief operating decision maker, to make key operating decisions and to assess performance. Since we operate in one reportable segment, all relevant financial information used to allocate resources and assess performance can be found in the consolidated financial statements.
We generate revenue from a single type of service offering. Every service we offer is managed cloud, with our managed cloud service offering available across all the leading cloud form factors and technologies.
We attribute revenue to geographic location based on the customer's billing address, either the U.S. or International, primarily the U.K. Total net revenue by geographic region was as follows:
Year Ended December 31, | ||||||||||||
(In millions) | 2013 | 2014 | 2015 | |||||||||
United States | $ | 1,076.3 | $ | 1,232.2 | $ | 1,366.8 | ||||||
International | 458.5 | 562.2 | 634.5 | |||||||||
Total net revenue | $ | 1,534.8 | $ | 1,794.4 | $ | 2,001.3 | ||||||
Our long-lived assets are primarily located in the U.S. and the U.K., and to a lesser extent Hong Kong and Australia. Property and equipment, net by geographic region was as follows:
(In millions) | December 31, 2014 | December 31, 2015 | ||||||
United States | $ | 718.3 | $ | 736.2 | ||||
International | 339.4 | 411.8 | ||||||
Total property and equipment, net | $ | 1,057.7 | $ | 1,148.0 | ||||
13. Employee Benefit Plans
We sponsor defined contribution plans whereby employees may elect to contribute a portion of their annual compensation to the plans, after complying with certain limitations. The plans also include a discretionary employer contribution. During 2013, 2014 and 2015, contribution expense recognized for these plans was $10.3 million, $13.2 million and $13.9 million, respectively.
14. Subsequent Event
On January 5, 2016, we completed the sale of assets, consisting primarily of intellectual property with an immaterial remaining net book value, of a non-strategic product line for total cash consideration of $24.0 million and other non-cash consideration. We will recognize a pre-tax gain on the disposal of these assets in our consolidated statements of comprehensive income in the first quarter of 2016.
- 84 -
SUPPLEMENTARY FINANCIAL DATA
(UNAUDITED)
Quarters Ended | ||||||||||||||||
(In millions, except per share amounts) | March 31, 2014 | June 30, 2014 | September 30, 2014 | December 31, 2014 | ||||||||||||
Net revenue | $ | 421.0 | $ | 441.2 | $ | 459.7 | $ | 472.5 | ||||||||
Cost of revenue | $ | 140.4 | $ | 145.1 | $ | 142.9 | $ | 153.9 | ||||||||
Net income | $ | 25.4 | $ | 22.5 | $ | 25.7 | $ | 37.0 | ||||||||
Net income per share - basic | $ | 0.18 | $ | 0.16 | $ | 0.18 | $ | 0.26 | ||||||||
Net income per share - diluted | $ | 0.18 | $ | 0.16 | $ | 0.18 | $ | 0.26 | ||||||||
Quarters Ended | ||||||||||||||||
(In millions, except per share amounts) | March 31, 2015 | June 30, 2015 | September 30, 2015 | December 31, 2015 | ||||||||||||
Net revenue | $ | 480.2 | $ | 489.4 | $ | 508.9 | $ | 522.8 | ||||||||
Cost of revenue | $ | 161.3 | $ | 163.9 | $ | 171.2 | $ | 179.1 | ||||||||
Net income | $ | 28.4 | $ | 29.2 | $ | 36.5 | $ | 32.1 | ||||||||
Net income per share - basic | $ | 0.20 | $ | 0.20 | $ | 0.26 | $ | 0.24 | ||||||||
Net income per share - diluted | $ | 0.20 | $ | 0.20 | $ | 0.26 | $ | 0.24 | ||||||||
- 85 -
ITEM 9 - CHANGES IN AND DISAGREEMENTS WITH ACCOUNTANTS ON ACCOUNTING AND FINANCIAL DISCLOSURE
None.
ITEM 9A - CONTROLS AND PROCEDURES
(a) Evaluation of disclosure controls and procedures
Under the supervision and with the participation of our senior management, including our chief executive officer and chief financial officer, we conducted an evaluation of the effectiveness of the design and operation of our disclosure controls and procedures, as defined in Rules 13a-15(e) and 15d-15(e) under the Securities Exchange Act of 1934 (the “Exchange Act”), as amended, as of the end of the period covered by this annual report (the “Evaluation Date”). Based on this evaluation, our chief executive officer and chief financial officer concluded that, as of the Evaluation Date, our disclosure controls and procedures were effective such that the information relating to the company, including our consolidated subsidiaries, required to be disclosed in our SEC reports (i) is recorded, processed, summarized and reported within the time periods specified in SEC rules and forms, and (ii) is accumulated and communicated to our management, including our chief executive officer and chief financial officer, as appropriate to allow timely decisions regarding required disclosure.
Inherent limitations of internal controls
Our management, including our chief executive officer and chief financial officer, does not expect that our disclosure controls and procedures or our internal controls will prevent all error and all fraud. A control system, no matter how well conceived and operated, can provide only reasonable, not absolute, assurance that the objectives of the control system are met. Because of the inherent limitations in all control systems, no evaluation of controls can provide absolute assurance that all control issues and instances of fraud, if any, within the company have been detected. These inherent limitations include the realities that judgments in decision-making can be faulty and that breakdowns can occur because of a simple error or mistake. Additionally, controls can be circumvented by the individual acts of some persons, by collusion of two or more people, or by management override of the control. The design of any system of controls is also based in part upon certain assumptions about the likelihood of future events, and there can be no assurance that any design will succeed in achieving its stated goals under all potential future conditions. Over time, controls may become inadequate because of changes in conditions, or the degree of compliance with the policies or procedures may deteriorate. Because of the inherent limitations in a cost-effective control system, misstatements due to error or fraud may occur and not be detected.
(b) Report of Management on Internal Control over Financial Reporting
Our management is responsible for establishing and maintaining adequate internal control over financial reporting, as defined in Exchange Act Rule 13a-15(f). Management conducted an evaluation of the effectiveness of our internal control over financial reporting based on the framework in Internal Control - Integrated Framework (2013) issued by the Committee of Sponsoring Organizations of the Treadway Commission. Based on this evaluation, management concluded that our internal control over financial reporting was effective as of December 31, 2015. Management reviewed the results of its assessment with our Audit Committee. The effectiveness of our internal control over financial reporting as of December 31, 2015 has been audited by KPMG LLP, an independent registered public accounting firm, as stated in its attestation report, which is included in Item 8 of this Annual Report on Form 10-K.
(c) Changes in internal control over financial reporting
There were no changes in our internal controls over financial reporting during our most recent fiscal year reporting period identified in connection with management’s evaluation that have materially affected, or are reasonably likely to materially affect, our internal control over financial reporting.
ITEM 9B - OTHER INFORMATION
None.
- 86 -
PART III
ITEM 10 - DIRECTORS, EXECUTIVE OFFICERS AND CORPORATE GOVERNANCE
The information required by this item is incorporated by reference to Rackspace Hosting’s Proxy Statement for its 2016 Annual Meeting of Stockholders to be filed with the SEC within 120 days after the end of the fiscal year ended December 31, 2015.
We have adopted the Rackspace Hosting, Inc. Code of Business Conduct and Ethics (the “code of conduct”) that applies to all of our employees, officers and directors, including, without limitation, our Chief Executive Officer, Chief Financial Officer, Chief Accounting Officer, and other finance organization employees. The code of conduct, as well as any waiver of a provision of the code of conduct granted to any senior officer or director or material amendment to the code of conduct, if any, may be found in the “Investors” section of our website at www.rackspace.com.
ITEM 11 - EXECUTIVE COMPENSATION
The information required by this item is incorporated by reference to Rackspace Hosting's Proxy Statement for its 2016 Annual Meeting of Stockholders to be filed with the SEC within 120 days after the end of the fiscal year ended December 31, 2015.
ITEM 12 - SECURITY OWNERSHIP OF CERTAIN BENEFICIAL OWNERS AND MANAGEMENT AND RELATED STOCKHOLDER MATTERS
The information required by this item is incorporated by reference to Rackspace Hosting's Proxy Statement for its 2016 Annual Meeting of Stockholders to be filed with the SEC within 120 days after the end of the fiscal year ended December 31, 2015.
ITEM 13 - CERTAIN RELATIONSHIPS AND RELATED TRANSACTIONS, AND DIRECTOR INDEPENDENCE
The information required by this item is incorporated by reference to Rackspace Hosting's Proxy Statement for its 2016 Annual Meeting of Stockholders to be filed with the SEC within 120 days after the end of the fiscal year ended December 31, 2015.
ITEM 14 - PRINCIPAL ACCOUNTANT FEES AND SERVICES
The information required by this item is incorporated by reference to Rackspace Hosting's Proxy Statement for its 2016 Annual Meeting of Stockholders to be filed with the SEC within 120 days after the end of the fiscal year ended December 31, 2015.
- 87 -
PART IV
ITEM 15 - EXHIBITS AND FINANCIAL STATEMENT SCHEDULES
(a) Financial Statements
(1) | The consolidated financial statements filed as part of this report are listed on the Index to Consolidated Financial Statements in Item 8 of this Annual Report on Form 10-K. |
(2) | Any financial statement schedules required to be filed as part of this report are set forth in section (c) below. |
(b) Exhibits - See the Index to Exhibits at the end of this report, which is incorporated by reference.
(c) Financial Statement Schedules
The following financial statement schedule is filed as a part of this Annual Report:
•Schedule II - Valuation and Qualifying Accounts
All other schedules are omitted because they are not required or the required information is shown in the consolidated financial statements or notes thereto.
(In millions) | Beginning Balance | Additions (1) | Write-offs of Accounts Receivable and Credit Memos Paid | Ending Balance | |||||||||||
Allowance for doubtful accounts and customer credits for the years ending December 31: | |||||||||||||||
2013 | $ | 4.2 | $ | 16.9 | $ | (17.2 | ) | $ | 3.9 | ||||||
2014 | $ | 3.9 | $ | 16.5 | $ | (15.1 | ) | $ | 5.3 | ||||||
2015 | $ | 5.3 | $ | 20.2 | $ | (18.2 | ) | $ | 7.3 | ||||||
(1) | Additions to the allowance for doubtful accounts are charged to expense. Additions to the allowance for customer credits are charged to revenue. |
- 88 -
SIGNATURES
Pursuant to the requirements of Section 13 or 15(d) of the Securities Exchange Act of 1934, the Registrant has duly caused this Annual Report on Form 10-K to be signed on its behalf by the undersigned, thereunto duly authorized, on February 25, 2016.
Rackspace Hosting, Inc. | |||||
Date: | February 25, 2016 | By: | /s/ WILLIAM TAYLOR RHODES | ||
William Taylor Rhodes | |||||
President and Chief Executive Officer | |||||
(Principal Executive Officer) | |||||
Pursuant to the requirements of the Securities Exchange Act of 1934, this report has been signed below by the following persons on behalf of the Registrant and in the capacities and on the dates indicated.
Name | Title | Date | ||
/s/ WILLIAM TAYLOR RHODES | President and Chief Executive Officer | February 25, 2016 | ||
William Taylor Rhodes | (Principal Executive Officer) | |||
/s/ KARL PICHLER | Chief Financial Officer and Treasurer | February 25, 2016 | ||
Karl Pichler | (Principal Financial Officer) | |||
/s/ JOSEPH SAPORITO | Chief Accounting Officer | February 25, 2016 | ||
Joseph Saporito | (Principal Accounting Officer) | |||
/s/ GRAHAM WESTON | Chairman | February 25, 2016 | ||
Graham Weston | ||||
/s/ KEVIN COSTELLO | Director | February 25, 2016 | ||
Kevin Costello | ||||
/s/ OSSA FISHER | Director | February 25, 2016 | ||
Ossa Fisher | ||||
/s/ MICHAEL SAM GILLILAND | Director | February 25, 2016 | ||
Michael Sam Gilliland | ||||
/s/ JOHN HARPER | Director | February 25, 2016 | ||
John Harper | ||||
/s/ LEWIS J. MOORMAN | Director | February 25, 2016 | ||
Lewis J. Moorman | ||||
/s/ FRED REICHHELD | Director | February 25, 2016 | ||
Fred Reichheld | ||||
/s/ LILA TRETIKOV | Director | February 25, 2016 | ||
Lila Tretikov | ||||
- 89 -
INDEX TO EXHIBITS
Exhibits | Description | |
3.1(A) | Form of Restated Certificate of Incorporation of the Registrant (2) | |
3.1(B) | Certificate of Amendment to the Restated Certificate of Incorporation of the Registrant (3) | |
3.2 | Amended and Restated Bylaws of Rackspace Hosting, Inc. (17) | |
4.1 | Form of Common Stock Certificate of the Registrant (3) | |
4.2 | Founder's Registration Rights Agreement, dated October 1, 2002, among the Registrant and certain stockholders (1) | |
4.3 | Investor's Registration Rights Agreement, dated October 1, 2002, among the Registrant and certain stockholders (1) | |
10.1 | 2003 Stock Option Plan and form of agreement thereunder (1) | |
10.2 | Webmail.us., Inc. 2004 Stock Incentive Plan, as amended in 2006 (1) | |
10.3 | 2005 Non-Qualified Stock Option Plan and form of agreement thereunder (1) | |
10.4 | Global Amendment to the Registrant's 1999 Assumed Stock Option Plan, 2003 Stock Option Plan, 2005 Non-Qualified Stock Option Plan, Webmail.us, Inc. 2004 Stock Incentive Plan and Amended and Restated 2007 Long-Term Incentive Plan (2) | |
10.5(A) | 2007 Long-Term Incentive Plan as Amended and Restated (26) | |
10.5(B) | Form of RSU Agreement Under 2007 Long-Term Incentive Plan (Time-Based) (5) | |
10.5(C) | Form of RSU Agreement Under 2007 Long-Term Incentive Plan (Performance-Based) (5) | |
10.5(D) | Form of RSU Agreement Under 2007 Long-Term Incentive Plan (SLT Performance-Based) (12) | |
10.5(E) | Rules of the Rackspace Hosting, Inc. 2010 HM Revenue & Customs U.K. Approved Sub-plan (10) | |
10.5(F) | Form of the 2010 HM Revenue & Customs U.K. Approved Sub-plan, Notice of Grant of Stock Options (10) | |
10.5(G) | Notice of Grant of RSUs for Outside Directors (18) | |
10.6(A) | Economic Development Agreement between the State of Texas and Rackspace US, Inc., dated August 1, 2007 (1) | |
10.6(B) | Amendment Number One to the Economic Development Agreement between the State of Texas and Rackspace US, Inc. (7) | |
10.7 | Ground Lease Agreement, dated August 2, 2007, between Windcrest Economic Development Corporation and Rackspace US, Inc., as amended on April 24, 2008 (1) | |
10.8 | City Economic Development Grant Agreement between the City of Windcrest, Texas and Rackspace US, Inc., dated August 2, 2007 (1) | |
10.9 | County Economic Development Grant Agreement between Bexar County, Texas and Rackspace US, Inc., dated August 2, 2007 (1) | |
10.10 | Developer Economic Development Grant Agreement among the City of Windcrest, Texas, the Windcrest Economic Development Corporation, and Windcrest Economic Development Company, LLC, dated August 2, 2007 (1) | |
10.11 | Walzem Road Redevelopment Project Master Economic Incentives Agreement among the City of Windcrest, Texas, the City of San Antonio, Texas, the County of Bexar, Texas, the Windcrest Economic Development Corporation, the Windcrest Economic Development Company, LLC, and Rackspace US, Inc., dated August 2, 2007 (1) | |
10.12(A) | Consent to Assignment and Other Agreements, dated November 30, 2006, by and among CLPF Heritage Four L.P., Macro Holding, Inc., Qwest Communications Corporation, and Rackspace DAL1DC, Ltd. (1) | |
10.12(B) | Assignment of Lease, effective December 1, 2006, between Qwest Communications Corporation and Rackspace DAL1DC Management, LLC with attached Lease dated January 26, 2000 between CSI Industrial Development L.P. and Qwest Communication Corporation, as amended January 23, 2001 (1) | |
10.12(C) | Third Amendment to Lease Agreement, dated January 8, 2008, between CLPF-Heritage Four, L.P. and Rackspace DAL1DC Management LLC (1) | |
10.13 | Agreement for Lease, dated April 2, 2007, between Slough Trading Estate Limited and Rackspace Managed Hosting Limited (1) | |
10.14 | Form of Indemnification Agreement for directors and officers (2) | |
10.15 | Rackspace US, Inc. Deferred Compensation Plan (3) | |
10.16 | Form of Share Option Agreement (U.K.) (4) | |
- 90 -
Exhibits | Description | |
10.17 | Rackspace Standard Form of Employment Agreement (5) | |
10.18 | Non-employee Director Compensation Schedule, Approved November 2011 (18) | |
10.19(A)† | Lease Agreement by and between Grizzly Ventures LLC and Rackspace US, Inc., dated February 5, 2009 (6) | |
10.19(B) | First Amendment to Lease Agreement by and between Grizzly Ventures LLC and Rackspace US, Inc., dated October 1, 2009 (9) | |
10.20(A)† | Lease Agreement by and between Tarantula Ventures LLC and Rackspace US, Inc., dated July 31, 2009 (8) | |
10.20(B)† | First Amendment to Lease Agreement by and between Tarantula Ventures LLC and Rackspace US, Inc., dated May 4, 2010 (11) | |
10.20(C)† | Second Amendment to Lease Agreement by and between Tarantula Ventures LLC and Rackspace US, Inc., dated February 24, 2011 (14) | |
10.20(D)† | Fourth Amendment to Lease Agreement by and between Tarantula Ventures LLC and Rackspace US, Inc., dated August 19, 2011 (15) | |
10.20(E) | Fifth Amendment to Lease Agreement by and between Tarantula Ventures LLC and Rackspace US, Inc., dated January 6, 2012 (16) | |
10.21† | Agreement for Lease between Digital Realty (St. Denis SARL) and Rackspace Limited, dated January 11, 2013 (21) | |
10.22 | Property Lease by and among Rackspace Limited, Hyde Park GP Limited and Hyde Park Nominee Limited, dated August 18, 2010 (13) | |
10.23† | Lease Agreement by and between Collins Technology Park Partners, LLC, and Rackspace US, Inc., dated December 29, 2011 (16) | |
10.24 | Employment Offer Letter for Joe Saporito, dated January 16, 2012 (18) | |
10.25 | Compensation Agreement between Rackspace US, Inc. and Karl Pichler, dated January 27, 2012 (16) | |
10.26 | Lease Agreement by and between Fox Properties LLC and Rackspace US, Inc., dated April 26, 2012 (19) | |
10.27 | Cash Bonus Plan (20) | |
10.28 | 2008 Employee Stock Purchase Plan and form of agreement thereunder (2) | |
10.29 | 2008 Employee Stock Purchase Plan- Share Incentive Sub-Plan (22) | |
10.30(A) | Employment Agreement between Rackspace US, Inc. and William Taylor Rhodes, dated January 13, 2014 (24) | |
10.30(B) | Amended and Restated Employment Agreement between Rackspace US, Inc. and William Taylor Rhodes, dated September 16, 2014 (25) | |
10.31 | Separation Agreement and Release between Rackspace US, Inc., Rackspace Hosting Inc., and A. Lanham Napier, dated February 5, 2014 (24) | |
10.32 | Inducement Equity Incentive Plan, effective February 24, 2014 (24) | |
10.33 | Fixed Dollar Accelerated Share Repurchase Transaction, dated November 12, 2014, between Morgan Stanley & Co. LLC and Rackspace Hosting, Inc. (26) | |
10.34 | Purchase Agreement, dated as of November 17, 2015, by and among Rackspace Hosting, Inc., Rackspace US, Inc., and Morgan Stanley & Co. LLC and Goldman Sachs & Co. as representatives of the several Initial Purchasers listed in Schedule I thereto (27) | |
10.35* | Employment Agreement between Rackspace US, Inc. and Gene DeFelice, dated October 30, 2015 | |
10.36* | Employment Agreement between Rackspace US, Inc. and Mark Roenigk, dated December 7, 2015 | |
10.37* | Revolving Credit Agreement, dated November 25, 2015, by and among Rackspace Hosting, Inc., the lenders from time to time party thereto and JPMorgan Chase Bank, N.A., as Administrative Agent, Morgan Stanley Bank, N.A., Goldman Sachs Bank USA and Wells Fargo Bank, N.A., as co-Syndication Agents, and J.P. Morgan Securities LLC, Morgan Stanley Senior Funding Inc., Goldman Sachs Bank USA and Wells Fargo Securities, LLC, as Joint Bookrunners and co-Lead Arrangers. | |
10.38* | Indenture Agreement, dated November 25, 2015, by and between Rackspace Hosting, Inc. and Wells Fargo Bank, National Association, relating to the 6.500% Senior Notes due 2024. | |
10.39* | Office Lease, by and between Rand Building, LTD. and Open Cloud Academy, LLC, dated May 27, 2015 | |
21.1 | List of Subsidiaries of the Registrant (23) | |
- 91 -
Exhibits | Description | |
23.1* | Consent of KPMG LLP, Independent Registered Public Accounting Firm | |
31.1* | Certification of Chief Executive Officer Pursuant to Section 302 of the Sarbanes-Oxley Act of 2002 | |
31.2* | Certification of Chief Financial Officer Pursuant to Section 302 of the Sarbanes-Oxley Act of 2002 | |
32.1** | Certification of Chief Executive Officer Pursuant to Section 906 of the Sarbanes-Oxley Act of 2002 | |
32.2** | Certification of Chief Financial Officer Pursuant to Section 906 of the Sarbanes-Oxley Act of 2002 | |
101.INS* | XBRL Instance Document | |
101.SCH* | XBRL Taxonomy Extension Schema | |
101.CAL* | XBRL Taxonomy Extension Calculation Linkbase | |
101.DEF* | XBRL Taxonomy Extension Definition Linkbase | |
101.LAB* | XBRL Taxonomy Extension Label Linkbase | |
101.PRE* | XBRL Taxonomy Extension Presentation Linkbase | |
- 92 -
* | Filed herewith. |
** | Furnished herewith. |
† | Confidential treatment has been requested for portions of these exhibits. These portions have been omitted from this Annual Report on Form 10-K and submitted separately to the Securities and Exchange Commission. |
(1) | Incorporated by reference to the Company's Registration Statement on Form S-1 (File No. 333-150469), filed April 25, 2008. |
(2) | Incorporated by reference to the Company's Amendment No. 1 to the Registration Statement on Form S-1 (File No. 333-150469), filed June 18, 2008. |
(3) | Incorporated by reference to the Company's Amendment No. 2 to the Registration Statement on Form S-1 (File No. 333-150469), filed July 15, 2008. |
(4) | Incorporated by reference to the Company's Amendment No. 1 to the Registration Statement on Form S-8 (File No. 333-153009), filed February 4, 2009. |
(5) | Incorporated by reference to the Company's Annual Report on Form 10-K for the Year ended December 31, 2008 (File No. 001-34143), filed March 2, 2009. |
(6) | Incorporated by reference to the Company's Quarterly Report on Form 10-Q for the Quarter ended March 31, 2009 (File No. 001-34143), filed May 12, 2009. |
(7) | Incorporated by reference to the Company's Current Report on Form 8-K (File No. 001-34143), filed July 30, 2009. |
(8) | Incorporated by reference to the Company's Quarterly Report on Form 10-Q for the Quarter ended June 30, 2009 (File No. 001-34143), filed August 13, 2009. |
(9) | Incorporated by reference to the Company's Quarterly Report on Form 10-Q for the Quarter ended September 30, 2009 (File No. 001-34143), filed November 12, 2009. |
(10) | Incorporated by reference to the Company's Quarterly Report on Form 10-Q for the Quarter ended March 31, 2010 (File No. 001-34143), filed May 6, 2010. |
(11) | Incorporated by reference to the Company's Quarterly Report on Form 10-Q for the Quarter ended June 30, 2010 (File No. 001-34143), filed August 9, 2010. |
(12) | Incorporated by reference to the Company's Current Report on Form 8-K (File No. 001-34143), filed August 27, 2010. |
(13) | Incorporated by reference to the Company's Quarterly Report on Form 10-Q for the Quarter ended September 30, 2010 (File No. 001-34143), filed November 9, 2010. |
(14) | Incorporated by reference to the Company's Quarterly Report on Form 10-Q for the Quarter ended March 31, 2011 (File No. 001-34143), filed May 10, 2011. |
(15) | Incorporated by reference to the Company's Quarterly Report on Form 10-Q for the Quarter ended September 30, 2011 (File No. 001-34143), filed November 8, 2011. |
(16) | Incorporated by reference to the Company's Annual Report on Form 10-K for the Year ended December 31, 2011 (File No. 001-34143), filed February 17, 2012. |
(17) | Incorporated by reference to the Company's Current Report on Form 8-K (File No. 001-34143), filed March 21, 2012. |
(18) | Incorporated by reference to the Company's Quarterly Report on Form 10-Q for the Quarter ended March 31, 2012 (File No. 001-34143), filed May 9, 2012. |
(19) | Incorporated by reference to the Company's Quarterly Report on Form 10-Q for the Quarter ended June 30, 2012 (File No. 001-34143), filed August 9, 2012. |
(20) | Incorporated by reference to the Company's Annual Report on Form 10-K for the Year ended December 31, 2012 (File No. 001-34143), filed March 1, 2013. |
(21) | Incorporated by reference to the Company's Quarterly Report on Form 10-Q/A for the Quarter ended March 31, 2013 (File No. 001-34143), filed December 31, 2013. |
(22) | Incorporated by reference to the Company's Quarterly Report on Form 10-Q for the Quarter ended June 30, 2013 (File No. 001-34143), filed August 9, 2013. |
(23) | Incorporated by reference to the Company's Annual Report on Form 10-K for the Year ended December 31, 2013 (File No. 001-34143), filed March 3, 2014. |
(24) | Incorporated by reference to the Company's Quarterly Report on Form 10-Q for the Quarter ended March 31, 2014 (File No. 001-34143), filed May 12, 2014. |
(25) | Incorporated by reference to the Company's Quarterly Report on Form 10-Q for the Quarter ended September 30, 2014 (File No. 001-34143), filed November 10, 2014. |
(26) | Incorporated by reference to the Company's Annual Report on Form 10-K for the Year ended December 31, 2014 (File No. 001-34143), filed March 2, 2015. |
(27) | Incorporated by reference to the Company's Current Report on Form 8-K (File No. 001-34143), filed on November 19, 2015. |
- 93 -