Attached files
Table of Contents
UNITED STATES
SECURITIES AND EXCHANGE COMMISSION
Washington, D.C. 20549
FORM 10-K
(Mark one)
| þ | ANNUAL REPORT PURSUANT TO SECTION 13 OR 15(d) OF THE SECURITIES EXCHANGE ACT OF 1934 |
For the fiscal year ended December 31, 2009.
| ¨ | TRANSITION REPORT PURSUANT TO SECTION 13 OR 15(d) OF THE SECURITIES EXCHANGE ACT OF 1934 (No Fee Required) |
For the transition period from to .
Commission file number 001-34143
RACKSPACE HOSTING, INC.
(Exact Name of Registrant as Specified in its Charter)
| Delaware | 74-3016523 | |
| (State or Other Jurisdiction of Incorporation or Organization) |
(IRS Employer Identification No.) |
5000 Walzem Rd.
San Antonio, Texas 78218
(Address of principal executive offices, including Zip Code)
(210) 312-4000
(Registrant’s Telephone Number, Including Area Code)
Securities registered pursuant to Section 12(b) of the Act:
| Title of each class |
Name of each exchange of which registered | |
| Common Stock, par value $0.001 per share | New York Stock Exchange |
Securities registered pursuant to Section 12(g) of the Act:
None
(Title of Class)
Indicate by check mark whether the registrant is a well-known seasoned issuer, as defined in Rule 405 of the Securities Act. Yes ¨ No þ
Indicate by check mark if the registrant is not required to file reports pursuant to Section 13 or Section 15(d) of the Act. Yes ¨ No þ
Indicate by check mark whether the registrant (1) has filed all reports required to be filed by Section 13 or 15(d) of the Securities Exchange Act of 1934 during the preceding 12 months (or for such shorter period that the registrant was required to file such reports), and (2) has been subject to such filing requirements for the past 90 days. Yes þ No ¨
Indicate by check mark whether the registrant has submitted electronically and posted on its corporate Web site, if any, every Interactive Data File required to be submitted and posted pursuant to Rule 405 of Regulation S-T (§ 232.405 of this chapter) during the preceding 12 months (or for such shorter period that the registrant was required to submit and post such files). Yes ¨ No ¨
Indicate by check mark if disclosure of delinquent filers pursuant to Item 405 of Regulation S-K is not contained herein, and will not be contained, to the best of registrant’s knowledge, in definitive proxy or information statements incorporated by reference in Part III of this Form 10-K or any amendment to this Form 10-K. ¨
Indicate by check mark whether the registrant is a large accelerated filer, an accelerated filer, a non-accelerated filer or a smaller reporting company. See definition of “accelerated filer, large accelerated filer and a smaller reporting company” in Rule 12b-2 of the Exchange Act. (Check one):
Large accelerated filer þ Accelerated filer ¨ Non-accelerated filer ¨ Smaller reporting company ¨
Indicate by check mark whether the registrant is a shell company (as defined in Rule 12b-2 of the Exchange Act). Yes ¨ No þ
As of June 30, 2009, the aggregate market value of shares held by non-affiliates of the registrant (based upon the closing sale price of such shares on the New York Stock Exchange on June 30, 2009) was $1,225,461,450.
On February 19, 2010, 123,837,979 shares of the registrant’s Common Stock, $0.001 par value, were outstanding.
DOCUMENTS INCORPORATED BY REFERENCE
Portions of the Proxy Statement for the Registrant’s 2010 Annual Meeting of Stockholders to be filed within 120 days of the Registrant’s fiscal year ended December 31, 2009 are incorporated by reference into Part III of this Form 10-K.
Table of Contents
TABLE OF CONTENTS
Table of Contents
SPECIAL NOTE REGARDING FORWARD-LOOKING STATEMENTS
We have made forward-looking statements in this Annual Report on Form 10-K that are subject to risks and uncertainties. Forward-looking statements within the meaning of Section 27A of the Securities Act of 1933, as amended, and Section and Section 21E of the Securities Exchange Act of 1934, as amended, are subject to the “safe harbor” created by those sections. The forward-looking statements in this report are based on our management’s beliefs and assumptions and on information currently available to our management. In some cases, you can identify forward-looking statements by terms such as “anticipates,” “aspires,” “believes,” “can,” “continue,” “could,” “estimates,” “expects,” “intends,” “may,” “plans,” “projects,” “seeks,” “should,” “will” or “would” or the negative of these terms and similar expressions intended to identify forward-looking statements. These statements involve known and unknown risks, uncertainties and other factors, which may cause our actual results, performance, time frames or achievements to be materially different from any future results, performance, time frames or achievements expressed or implied by the forward-looking statements. We discuss many of these risks, uncertainties and other factors in this document in greater detail under the heading “Risk Factors.” We believe it is important to communicate our expectations to our investors. However, there may be events in the future that we are not able to predict accurately or over which we have no control. The risks described in “Risk Factors” included in this report, as well as any other cautionary language in this report, provide examples of risks, uncertainties and events that may cause our actual results to differ materially from the expectations we describe in our forward-looking statements. Before you invest in our common stock, you should be aware that the occurrence of the events described in “Risk Factors” and elsewhere in this report could harm our business.
Given these risks, uncertainties and other factors, you should not place undue reliance on these forward-looking statements. Also, these forward-looking statements represent our estimates and assumptions only as of the date of this filing. You should read this document completely and with the understanding that our actual future results may be materially different from what we expect. We hereby qualify our forward-looking statements by these cautionary statements. Except as required by law, we assume no obligation to update these forward-looking statements publicly, or to update the reasons actual results could differ materially from those anticipated in these forward-looking statements, even if new information becomes available in the future.
2
Table of Contents
Rackspace Hosting, Inc. was incorporated in Delaware on March 7, 2000 under the name Rackspace.com, Inc. However, our operations began in 1998 as a limited partnership, which became our subsidiary through a corporate reorganization completed on August 21, 2001. The company’s name was changed to Rackspace Hosting, Inc. on June 5, 2008 through a merger with one of its wholly-owned subsidiaries. Our principal executive offices are located at 5000 Walzem Rd., San Antonio, Texas 78218. Our telephone number is (210) 312-4000. Our website address is www.rackspace.com. References to “we,” “our,” “our company,” “us,” “the company,” “Rackspace Hosting,” or “Rackspace” refer to Rackspace Hosting, Inc. and its consolidated subsidiaries. See “Management’s Discussion and Analysis of Financial Condition and Results of Operations” and the Consolidated Financial Statements and the related Notes for additional information regarding the business and our operating results. Changes to our Business section from prior filings are a reflection of a competitive and changing business environment and our adaptations with respect to our product and services set.
Overview
Rackspace Hosting is the world leader in the hosting and cloud computing industry. Our rapid growth over the last decade has been fueled by our commitment to our unique brand of customer service known as Fanatical Support®.
Hosting is at the center of a multi-year shift that is changing the way businesses buy IT services. New cloud computing technologies, which deliver greater simplicity and more meaningful cost savings to businesses, make hosting even more compelling for a broader market. We are pioneering an emerging category, Hybrid Hosting, which combines the benefits of both traditional dedicated hosting and emerging cloud hosting. Hybrid Hosting provides businesses the best of both worlds, allowing IT departments to lower costs without sacrificing the benefits of dedicated hosting. As businesses move to on-demand IT and Hybrid Hosting, we believe Fanatical Support will be more valuable to them than ever before.
We are a global company. Our corporate headquarters is located in San Antonio, with operations located in the United States, the United Kingdom, the Netherlands, and Hong Kong. Our services are sold to businesses in more than 120 countries. In 2009 we had net revenue of $629.0 million and as of December 31, 2009, we served more than 90,000 business customers and we managed more than 56,000 servers, 1,600,000 email accounts, and 259,000 cloud hosting domains. No single customer accounted for more than 2% of net revenue in each of the past three years.
The Hosting Industry
We are the leader in hosting and cloud computing. Hosting is best described as IT services delivered on demand over the Internet. Hosting providers act as an extension of businesses’ IT departments.
Today, there are three ways that businesses can fulfill their IT requirements. The first is commonly called “do it yourself,” or DIY. DIY is an approach to managing IT services where a business retains complete ownership and responsibility for ongoing maintenance and management of servers, software, networking equipment, etc. Companies may choose to house this equipment in their own facilities, or may rent data center space from a colocation provider. The second approach is outsourcing, where businesses transfer full responsibility for their IT systems, operations, and employees to a third party. Hosting is the third approach, and we believe it delivers better quality and a more cost-competitive solution than do-it-yourself or outsourcing. Our portfolio of services provides customers the flexibility to choose the best combination of dedicated hosting and cloud computing services to meet their unique IT needs.
3
Table of Contents
The hosting industry emerged in the 1990’s to serve a need created by the rapid adoption of the Internet by consumers and businesses worldwide. Early hosting demand was driven by companies setting up simple websites during the “dot com” boom. Many companies did not have the skills or resources to connect their websites to the Internet, so they turned to hosting companies to perform this task. We believe demand for hosting will continue for three reasons:
| 1. | Smaller companies still do not have in-house resources to manage complicated websites, and they do not want to purchase expensive hardware with their available capital. Yet they must have an increasingly robust, reliable online presence in order to succeed in today’s market. |
| 2. | Larger companies that do have specialized, dedicated IT resources would rather deploy these resources to more strategic areas of their business rather than managing servers or running a website. |
| 3. | As companies have experienced the benefits of using hosting providers to manage their web sites, they have become more comfortable with the concept of hosting providers managing additional IT services. |
Today, the hosting market opportunity extends well beyond its roots and includes a broad continuum of services from simple websites to complex, mission-critical IT applications and support. We believe the trend toward on-demand IT services is in its infancy and will drive growth over the coming years.
Cloud Computing and Hosting
Cloud computing is one of the most widely discussed topics in IT today. We believe it is also central to the future of the hosting industry and have made it a key element of our hosting strategy. In simple terms, cloud computing refers to pooled computing resources, delivered on-demand, over the Internet. In the same manner that electricity is delivered on-demand from large scale power plants, cloud computing is delivered from large, centralized data centers to businesses all over the world.
Today, our core offering, managed hosting, requires dedicated servers for each customer deployment. Most of these dedicated resources, which are designed to meet peak processing demands, are underutilized during non-peak hours. Cloud technologies allow hosting providers to effectively provision and manage a pool of computing resources (or a “cloud”) across a larger base of customers. Cloud technologies deliver more computing resources to businesses when they need them. At the same time, cloud computing substantially lowers the cost of IT services. We believe these compelling benefits will continue to drive migration from server rooms and corporate data centers to the cloud.
We believe cloud computing is a paradigm shift in IT and we are investing heavily to take advantage of these new technologies. In addition to three acquisitions (Webmail.us, Slicehost, and Jungle Disk), we have built large teams of experts devoted to research and development around these technologies. We view cloud computing as a natural extension of our core hosting offering. We also believe our ability to provide Hybrid Hosting, backed by Fanatical Support, provides us a competitive advantage in the hosting marketplace.
Our Service Suite
We sell a portfolio of hosting and cloud computing offerings, all backed by Fanatical Support.
| • | Dedicated Hosting. Dedicated hosting delivers a customer-specific, dedicated server, located in our secure, business-class data centers. Our customers have full administrator privileges and are responsible for most administrative functions. We provide a customer management portal and other management tools. |
| • | Managed Hosting—Our core service offering is managed hosting. This service removes the burden of managing the data center, network, hardware devices, and operating system software from the customer. We became an industry leader in the managed hosting category early in our |
4
Table of Contents
| company history, taking standard service expectations in the industry and exceeding them. Customers place high value on the added benefits of managed hosting, and continue to make us their preferred choice for managed hosting. Despite the emergence of cloud computing, we believe managed hosting will remain a key service offering as companies continue to demand dedicated equipment that will meet specific performance or security needs. We remain committed to innovating new products and services and have added several notable services to the core managed hosting offerings. |
| • | Private Cloud. Rackspace offers a Private Cloud service that allows large enterprises to virtualize their dedicated IT environments. Our Private Cloud provides the cost benefits of a virtualized infrastructure combined with the control and security advantages of dedicated hardware. |
| • | Managed Colocation—Managed colocation serves the demands of highly technical customers who require ordering and provisioning support. Managed colocation customers manage most or all of their software and applications. We manage the data centers, networks and some standard hardware devices. Our managed colocation service is often combined with traditional managed hosting, allowing customers the flexibility to specify service levels for each hosting service component. |
| • | Cloud Hosting. Our cloud hosting services allow businesses to run their applications, similar to managed hosting, but using the new technologies of cloud computing. There are multiple varieties of cloud hosting services that are priced on a pay-per-use basis and that can be quickly and easily scaled up or down on-demand. Today we offer Cloud Servers, Cloud Files, and Cloud Sites. Cloud Servers allow customers to purchase “slices” of servers, load their applications onto those virtual servers, and pay only for the capacity they use. Cloud Files allow customers to purchase storage services by the gigabyte. Cloud Sites allow customers to deploy their applications to a cluster of servers that will scale processing on-demand and as required by the application. Although these cloud services are emerging technologies and in the early phases of development, they offer the true promise of cloud computing—auto scaling, no hardware or software management, simple deployment. |
| • | Cloud Applications. This cloud category, often called “software-as-a-service”, delivers applications provisioned and ready for end-customers to use. These services require limited support from the customer’s IT department, and they remove the IT burden and expense of managing and maintaining software and hardware. We currently offer email, collaboration, and file back-up cloud applications. These cloud applications are priced on a pay-per-use basis, can be purchased and used quickly. Our cloud applications have experienced strong growth over the last year. |
| • | Hybrid Hosting. We believe that traditional dedicated hosting and emerging cloud computing services, when combined, are a powerful solution for IT departments. Each service has specific and unique customer benefits. As a result, we offer Hybrid Hosting, a suite of dedicated hosting and cloud computing services that can be easily combined to address the changing and diverse needs of our customers today and in the future. |
Competition
Given the significant market potential of hosting and cloud computing, we operate in a rapidly evolving and highly competitive environment.
Our principal areas of competition include:
Do-it-Yourself Solutions. Businesses may choose to house and maintain their own IT systems, or use a colocation provider to house IT hardware and provide connectivity. Companies that provide colocation services include AT&T, Equinix, SAVVIS, Switch & Data, and other telecommunications companies. We believe that over time it will be hard for the vast majority of businesses to replicate the capabilities or achieve the low costs of service providers making the do-it-yourself option less attractive for many businesses.
5
Table of Contents
IT Outsourcing Providers. Businesses may choose to outsource their entire IT systems and staff to an outsourcing provider. Companies that provide IT outsourcing include CSC, HP, and IBM. Outsourcing has long been an option for only the largest companies due to the cost, complexity and duration of outsourcing contracts. Rarely is this a viable option for small and medium businesses with rapidly changing needs.
Hosting and Cloud Computing Providers. Businesses may choose to use a hosting or cloud computing provider other than us to provide services and support for their IT systems. Competitors include AT&T, British Telecom, SAVVIS, Terremark, The Planet, Verio, and others. We also face competition from large technology companies such as Amazon, Microsoft, Google, IBM and Salesforce.com, who are making investments in cloud computing.
Our Approach and Sources of Competitive Advantage
We are focused on creating sustainable competitive advantage in two key areas. First, our vision is to be recognized as one of the world’s great service companies. Since companies must trust their hosting provider with their mission critical IT assets, service reputation is a key selection criterion. Second, we operate with a financial discipline that keeps costs low, thereby generating returns that exceed our cost of capital. While companies will pay a premium for a high level of service, keeping the commodity elements of our business at a low cost is a critical element of success. These two key principles form the foundation of our business model, which includes the following elements:
Fanatical Support—We believe that excellent customer service creates customer loyalty, which in turn leads to higher profits and growth. We call our unique, industry-leading customer service model “Fanatical Support,” because our entire company is focused on going above and beyond expectations in order to delight the customer. Fanatical Support builds loyalty, which in turn delivers three key benefits:
| 1. | Loyal customers buy more. Customer loyalty increases the tenure of customers and the longer they stay the more they tend to buy from us, leading to higher revenue and a higher revenue per customer ratio. |
| 2. | Loyal customers stay with us longer, which means that loyal customers are more profitable. Further, loyal customers refer other customers. Both help in saving customer acquisition costs and reduce the amount of sales and marketing costs that we need to spend to generate revenue growth. |
| 3. | Loyal customers can be served more cost effectively. After initial provisioning, the average cost of serving a customer is reduced, leading to higher average profits and profit margins over time. |
As a measure of customer satisfaction, we use the Net Promoter Score® (NPS), developed by Bain & Company, Inc., Fred Reichheld, and Satmetrix Systems, Inc. to track the likelihood that customers will refer us to friends or colleagues. Surveys are conducted on an ongoing basis with results summarized monthly and analyzed to determine areas for improvement. We work with our customers to understand what they consider “must haves,” and what they would like to see in terms of incremental improvements to our service offerings.
Fanatical Support is a result of our unique culture. Employees are called Rackers, and are rewarded for going above and beyond to serve customers. The highest form of recognition is the Straightjacket Award, which is given to the employee who best demonstrates Fanatical Support in action. We are also very selective in our hiring process. Our philosophy is that technical and functional literacy can be taught, but personality is ingrained. We strive to hire employees with the personality traits which fit well within our culture and our teams. Periodically, we conduct employee engagement surveys as a measure of cultural health, and reward those managers that create an engaging and high-performance environment. In 2008 and 2009, Fortune magazine ranked us in the top 50 of its list of “100 Best Companies to Work For.” We firmly believe that our unique culture is a point of sustained differentiation, because corporate culture cannot be easily or quickly replicated by competitors.
6
Table of Contents
Hosting and Cloud Computing Specialist—We are focused exclusively on providing computing power using dedicated and shared technologies. Modern computing infrastructure is complex and ever-changing, so this specialist focus has allowed the company to build a productized set of services that are repeatable, efficient, high-quality and valuable to customers. Our employees, systems, management practices and organizational processes are tuned to continuously improve our high-volume hosting and cloud computing offerings. Many of our competitors have to balance their hosting and cloud computing lines of business with other areas of focus. These other products and services compete internally for the resources and talent needed to make hosting successful. Our exclusive focus on hosting enables us to more rapidly and accurately deploy, upgrade and scale our systems and services. This focus has generated industry-leading revenue growth, profitability and customer satisfaction.
Portfolio of Services—Our Hybrid Hosting model allows customers the flexibility to combine both traditional and emerging services for a solution that best addresses their unique IT requirements.
Many hosting providers offer a limited set of services, or rely on third party reselling relationships to complete their hosting portfolio. Our portfolio of services allows us to deliver the right offering at the right budget for the customer. Additionally, customers who host their entire environment with us benefit from the simplicity of working with one hosting specialist, rather than managing multiple providers.
Research and Development
For the years ended December 31, 2007, 2008, and 2009, we recognized $8.6 million, $10.8 million, and $12.6 million of research and development expense, respectively. Our research and development efforts are focused on developing new services including:
| • | Deployment of new technologies to address emerging trends, such as cloud computing; |
| • | Development and enhancement of proprietary tools; |
| • | Development and enhancement of processes for sales and support; and |
| • | Development and enhancement of data center operations. |
Intellectual Property Rights
We rely on a combination of patent, copyright, trademark, service mark and trade secret laws in the U.S., the European Union, and various countries in Asia, South America, and elsewhere, and contractual restrictions to establish and protect certain proprietary rights in our data, applications, and services. We also currently have one patent and no patent applications in the U.S. We have trademarks registered or pending in the U.S., the European Union, and various countries in Asia, South America, and elsewhere for our name and certain words and phrases that we use in our business. We rely on copyright laws to protect software and certain other elements of our proprietary technologies, although to date we have not registered for copyright protection. We also enter into confidentiality and invention assignment agreements with our employees and consultants and confidentiality agreements with other third parties, and we actively monitor access to our proprietary technologies.
In addition, we license third-party software and other technologies that are used in the provision of or incorporated into some elements of our services.
Employees
As of December 31, 2009, we employed 2,774 Rackers, a net increase of 163, or 6.2%, compared to December 31, 2008. None of our employees are represented by a collective bargaining agreement, nor have we experienced any work stoppages. We believe that our relations with our employees are good.
7
Table of Contents
Sales and Marketing
Our service suite is sold via direct sales teams, through third-party channel partners and via online ordering. Our direct sales model is based on centralized sales teams with leads generated primarily from customer referrals and corporate marketing efforts. This model also includes a centralized enterprise field sales force, which targets select businesses in that segment. Our channel partners include management and technical consultancies, technology integrators, software application providers, and web developers. Online sales occur for managed hosting, Cloud hosting and Cloud Applications via online stores located in the relevant sections of our website.
Our marketing efforts generate interest and market demand by communicating the advantages of our services and unique support model. Our marketing activities include web-based paid and natural search, participation in technology trade shows, conferences and customer events, advertisements in traditional and electronic (web- and email-based) media, and targeted regional public relations activities.
Our Support Team Structure
Our support teams generally consist of 12 to 20 Rackers, including an account manager who is a customer’s single point of contact and advocate within Rackspace Hosting. Each support team also includes technical specialists to meet ongoing customer needs.
Financial Information About Geographic Areas
Total net revenue from U.S. operations was $260.7 million, $383.5 million, and $467.9 million for 2007, 2008, and 2009, respectively. Net revenue from operations outside the U.S., substantially all of which was derived from sales by our U.K. operations, was $101.3 million, $148.4 million, and $161.1 million for 2007, 2008, and 2009, respectively. For information regarding certain risks relating to our foreign operations, please see the risk titled, “Our ability to operate and expand our business is susceptible to risks associated with international sales and operations” in the Risk Factor section.
Available Information
You can obtain copies of our Annual Report on Form 10-K, Quarterly Reports on Form 10-Q, Current Reports on Form 8-K, and other filings with the Securities and Exchange Commission (SEC), and all amendments to these filings, free of charge from our website at www.rackspace.com as soon as reasonably practicable following our filing of any of these reports with the SEC. You can also obtain copies free of charge by contacting our Investor Relations department at our corporate headquarters.
You can also read and copy any materials we file with the SEC at the SEC’s Public Reference Room at 100 F Street, N.E., Washington, DC 20549. You can obtain additional information about the operation of the Public Reference Room by calling the SEC at 1-800-SEC-0330. In addition, the SEC maintains a website (http://www.sec.gov) that contains reports, proxy and information statements, and other information regarding issuers that file electronically with the SEC, including us.
8
Table of Contents
Risks Related to Our Business and Industry
Our physical infrastructure is concentrated in a few facilities and any failure in our physical infrastructure or services could lead to significant costs and disruptions and could reduce our revenue, harm our business reputation and have a material adverse effect on our financial results.
Our network, power supplies and data centers are subject to various points of failure, problems with our cooling equipment, generators, uninterruptible power supply, or UPS, routers, switches, or other equipment, whether or not within our control, could result in service interruptions for our customers as well as equipment damage. Because our hosting services do not require geographic proximity of our data centers to our customers, our hosting infrastructure is consolidated into a few large facilities. While data backup services and disaster recovery services are available as a part of our hosting services offerings, the majority of our customers do not elect to pay the additional fees required to have disaster recovery services store their backup data offsite in a separate facility, which could substantially mitigate the adverse effect to a customer from a single data center failure. Accordingly, any failure or downtime in one of our data center facilities could affect a significant percentage of our customers. The total destruction or severe impairment of any of our data center facilities could result in significant downtime of our services and the loss of customer data. Since our ability to attract and retain customers depends on our ability to provide customers with highly reliable service, even minor interruptions in our service could harm our reputation. The services we provide are subject to failure resulting from numerous factors, including:
| • | Power loss; |
| • | Equipment failure; |
| • | Human error or accidents; |
| • | Sabotage and vandalism; |
| • | Failure by us or our vendors to provide adequate service or maintenance to our equipment; |
| • | Network connectivity downtime; |
| • | Improper building maintenance by the landlords of the buildings in which our facilities are located; |
| • | Physical or electronic security breaches; |
| • | Fire, earthquake, hurricane, tornado, flood, and other natural disasters; |
| • | Water damage; and |
| • | Terrorism. |
Additionally, in connection with the expansion or consolidation of our existing data center facilities from time to time, there is an increased risk that service interruptions may occur as a result of server relocation or other unforeseen construction-related issues.
We have experienced interruptions in service in the past, due to such things as power outages, power equipment failures, cooling equipment failures, routing problems, hard drive failures, database corruption, system failures, software failures, and other computer failures. While we have not experienced a material increase in customer attrition following these events, the extent to which our reputation suffers is difficult to assess. We have taken and continue to take steps to improve our infrastructure to prevent service interruptions, including upgrading our electrical and mechanical infrastructure. However, service interruptions continue to be a significant risk for us and could materially impact our business.
Any future service interruptions could:
| • | Cause our customers to seek damages for losses incurred; |
| • | Require us to replace existing equipment or add redundant facilities; |
9
Table of Contents
| • | Affect our reputation as a reliable provider of hosting services; |
| • | Cause existing customers to cancel or elect to not renew their contracts; or |
| • | Make it more difficult for us to attract new customers. |
Any of these events could materially increase our expenses or reduce our revenue, which would have a material adverse effect on our operating results.
Customers with mission-critical applications could potentially expose us to lawsuits for their lost profits or damages, which could impair our financial condition.
Because our hosting services are critical to many of our customers’ businesses, any significant disruption in our services could result in lost profits or other indirect or consequential damages to our customers. Although we require our customers to sign agreements that contain provisions attempting to limit our liability for service outages, we cannot assure you that a court would enforce any contractual limitations on our liability in the event that one of our customers brings a lawsuit against us as the result of a service interruption or other Internet site or application problems that they may ascribe to us. The outcome of any such lawsuit would depend on the specific facts of the case and any legal and policy considerations that we may not be able to mitigate. In such cases, we could be liable for substantial damage awards that may exceed our liability insurance coverage by unknown but significant amounts, which could materially impair our financial condition.
We provide service level commitments to our customers, which could require us to issue credits for future services if the stated service levels are not met for a given period and could significantly decrease our revenue and harm our reputation.
Our customer agreements provide that we maintain certain service level commitments to our customers relating primarily to network uptime, critical infrastructure availability, and hardware replacement. If we are unable to meet the stated service level commitments, we may be contractually obligated to provide these customers with credits for future services. As a result, a failure to deliver services for a relatively short duration could cause us to issue these credits to a large number of affected customers. In addition, we cannot be assured that our customers will accept these credits in lieu of other legal remedies that may be available to them. Our failure to meet our commitments could also result in substantial customer dissatisfaction or loss. Because of the loss of future revenue through these credits, potential customer loss and other potential liabilities, our revenue could be significantly impacted if we cannot meet our service level commitments to our customers.
If we do not prevent security breaches, we may be exposed to lawsuits, lose customers, suffer harm to our reputation, and incur additional costs.
The services we offer involve the transmission of large amounts of sensitive and proprietary information over public communications networks, as well as the processing and storage of confidential customer information. Unauthorized access, computer viruses, accidents, employee error or malfeasance, fraudulent service plan orders, intentional misconduct by computer “hackers”, and other disruptions can occur that could compromise the security of our infrastructure, thereby exposing such information to unauthorized access by third parties and leading to interruptions, delays or cessation of service to our customers. Techniques used to obtain unauthorized access to, or to sabotage systems, change frequently and generally are not recognized until launched against a target. We may be unable to implement security measures in a timely manner or, if and when implemented, these measures could be circumvented as a result of accidental or intentional actions by parties within or outside of our organization. Any breaches that occur could expose us to increased risk of lawsuits, loss of existing or potential customers, harm to our reputation and increases in our security costs. Although we typically require our customers to sign agreements that contain provisions attempting to limit our liability for security breaches, we cannot assure you that a court would enforce any contractual limitations on our liability in the event that one of our customers brings a lawsuit against us as the result of a security breach that they may
10
Table of Contents
ascribe to us. The outcome of any such lawsuit would depend on the specific facts of the case and legal and policy considerations that we may not be able to mitigate. In such cases, we could be liable for substantial damage awards that may significantly exceed our liability insurance coverage by unknown but significant amounts, which could seriously impair our financial condition.
If we fail to hire and retain qualified employees and management personnel, our growth strategy and our operating results could be harmed.
Our growth strategy depends on our ability to identify, hire, train, and retain executives, IT professionals, technical engineers, operations employees, and sales and senior management personnel who maintain relationships with our customers and who can provide the technical, strategic, and marketing skills required for our company to grow. There is a shortage of qualified personnel in these fields, specifically in the San Antonio, Texas area, where we are headquartered and a majority of our employees are located. We compete with other companies for this limited pool of potential employees. There is no assurance that we will be able to recruit or retain qualified personnel, and this failure could cause our operations and financial results to be negatively impacted.
Our success and future growth also depends to a significant degree on the skills and continued services of our management team, especially Graham Weston, our Chairman, and A. Lanham Napier, our Chief Executive Officer and President. We do not have long-term employment agreements with any members of our management team, including Messrs. Weston and Napier. Mr. Napier is the only member of our management team on whom we maintain key man insurance.
If we are unable to maintain a high level of customer service, customer satisfaction and demand for our services could suffer.
We believe that our success depends on our ability to provide customers with quality service that not only meets our stated commitments, but meets and then exceeds customer service expectations. If we are unable to provide customers with quality customer support in a variety of areas, we could face customer dissatisfaction, decreased overall demand for our services, and loss of revenue. In addition, our inability to meet customer service expectations may damage our reputation and could consequently limit our ability to retain existing customers and attract new customers, which would adversely affect our ability to generate revenue and negatively impact our operating results.
Our existing customers could elect to reduce or terminate the services they purchase from us because we do not have long-term contracts with our customers, which could adversely affect our operating results.
Customer contracts for our managed hosting services typically have initial terms of one to two years which, unless terminated, may be renewed or automatically extended on a month-to-month basis. Our customers have no obligation to renew their services after their initial contract periods expire. Moreover, our customers could cancel their managed hosting service agreements before they expire. In addition, most of our other services, such as our cloud computing services, are provided on a month to month basis and do not have an extended initial term at all. Our costs associated with maintaining revenue from existing customers are generally much lower than costs associated with generating revenue from new customers. Therefore, a reduction in revenue from our existing customers, even if offset by an increase in revenue from new customers, could reduce our operating margins. Any failure by us to continue to retain our existing customers could have a material adverse effect on our operating results.
Our corporate culture has contributed to our success, and if we cannot maintain this culture, we could lose the innovation, creativity, and teamwork fostered by our culture, and our operating results may be harmed.
We believe that a critical contributor to our success has been our corporate culture, which we believe fosters innovation, creativity, and teamwork. If we implement more complex organizational management structures
11
Table of Contents
because of growth or other structural changes, we may find it increasingly difficult to maintain the beneficial aspects of our corporate culture. This could negatively impact our future operating results. In addition, being a publicly traded company may create disparities in personal wealth among our employees, which may adversely impact our corporate culture and employee relations.
If we are unable to manage our growth effectively, our financial results could suffer.
The growth of our business and our service offerings has strained our operating and financial resources. Further, we intend to continue expanding our overall business, customer base, headcount, and operations. Creating a global organization and managing a geographically dispersed workforce requires substantial management effort and significant additional investment in our operating and financial system capabilities and controls. If our information systems are unable to support the demands placed on them by our growth, we may be forced to implement new systems which would be disruptive to our business. We may be unable to manage our expenses effectively in the future due to the expenses associated with these expansions, which may negatively impact our gross margins or operating expenses. If we fail to improve our operational systems or to expand our customer service capabilities to keep pace with the growth of our business, we could experience customer dissatisfaction, cost inefficiencies, and lost revenue opportunities, which may materially and adversely affect our operating results.
If we are unable to adapt to evolving technologies and customer demands in a timely and cost-effective manner, our ability to sustain and grow our business may suffer.
Our market is characterized by rapidly changing technology, evolving industry standards, and frequent new product announcements, all of which impact the way hosting services are marketed and delivered. These characteristics are magnified by the continued rapid growth of the Internet and the intense competition in our industry. The acceptance and growth of cloud computing illustrates these characteristics and the impact that they can have on our market.
To be successful, we must adapt to our rapidly changing market by continually improving the performance, features, and reliability of our services and modifying our business strategies accordingly. We could also incur substantial costs if we need to modify our services or infrastructure in order to adapt to these changes. For example, our data center infrastructure could require improvements due to (i) the development of new systems to deliver power to or eliminate heat from the servers we house, (ii) the development of new server technologies that require levels of critical load and heat removal that our facilities are not designed to provide, or (iii) a fundamental change in the way in which we deliver services. We may not be able to timely adapt to changing technologies, if at all. Our ability to sustain and grow our business would suffer if we fail to respond to these changes in a timely and cost-effective manner.
New technologies or industry standards have the potential to replace or provide lower cost alternatives to our hosting services. The adoption of such new technologies or industry standards could render some or all of our services obsolete or unmarketable. We cannot guarantee that we will be able to identify the emergence of all of these new service alternatives successfully, modify our services accordingly, or develop and bring new products and services to market in a timely and cost-effective manner to address these changes. If and when we do identify the emergence of new service alternatives and bring new products and services to market, those new products and services may need to be made available at lower price points than our then-current services.
Our failure to provide services to compete with new technologies or the obsolescence of our services could lead us to lose current and potential customers or could cause us to incur substantial costs, which would harm our operating results and financial condition. Our introduction of new service alternative products and services that have lower price points than current offerings may result in our existing customers switching to the lower cost products, which could reduce our revenue and have a material, adverse effect of our operating results. For example, the emergence of cloud computing products that provide reasonable alternatives to our managed
12
Table of Contents
hosting solutions could cause a Rackspace managed hosting customer to take their business to an outside cloud computing provider or to transfer their solution to a Rackspace cloud product or service that is available at a lower price point.
We may not be able to continue to add new customers and increase sales to our existing customers, which could adversely affect our operating results.
Our growth is dependent on our ability to continue to attract new customers while retaining and expanding our service offerings to existing customers. Growth in the demand for our services may be inhibited and we may be unable to sustain growth in our customer base for a number of reasons, such as:
| • | A reduction in the demand for our services due to the economic recession; |
| • | Our inability to market our services in a cost-effective manner to new customers; |
| • | The inability of our customers to differentiate our services from those of our competitors or our inability to effectively communicate such distinctions; |
| • | Our inability to successfully communicate the benefits of hosting to businesses; |
| • | The decision of businesses to host their Internet sites and web infrastructure internally or in colocation facilities as an alternative to the use of our hosting services; |
| • | Our inability to penetrate international markets; |
| • | Our inability to expand our sales to existing customers; |
| • | Our inability to strengthen awareness of our brand; and |
| • | Reliability, quality or compatibility problems with our services. |
A substantial amount of our past revenue growth was derived from purchases of service upgrades by existing customers. Our costs associated with increasing revenue from existing customers are generally lower than costs associated with generating revenue from new customers. Therefore, a reduction in the rate of revenue increase or a rate of revenue decrease from our existing customers, even if offset by an increase in revenue from new customers, could reduce our operating margins. Any failure by us to continue attracting new customers or grow our revenue from existing customers for a prolonged period of time could have a material adverse effect on our operating results.
We may not be able to compete successfully against current and future competitors.
The market for hosting and cloud computing services is highly competitive. We expect to face additional competition from our existing competitors as well as new market entrants in the future.
Our current and potential competitors vary by size, service offerings and geographic region. These competitors may elect to partner with each other or with focused companies like us to grow their businesses. They include:
| • | Do-it-yourself solutions with a colocation partner such as AT&T, Equinix, SAVVIS, Switch & Data, and other telecommunications companies; |
| • | IT outsourcing providers such as CSC, HP, and IBM; |
| • | Hosting providers such as AT&T, British Telecom, SAVVIS, Terremark, The Planet, and Verio; and |
| • | Large technology companies such as Amazon, Microsoft, Google, IBM and Salesforce.com, who are making investments in cloud computing. |
13
Table of Contents
The primary competitive factors in our market are: customer service and technical expertise; security reliability and functionality; reputation and brand recognition; financial strength; breadth of services offered; and price.
Many of our current and potential competitors have substantially greater financial, technical and marketing resources, larger customer bases, longer operating histories, greater brand recognition, and more established relationships in the industry than we do. As a result, some of these competitors may be able to:
| • | Develop superior products or services, gain greater market acceptance, and expand their service offerings more efficiently or more rapidly; |
| • | Adapt to new or emerging technologies and changes in customer requirements more quickly; |
| • | Bundle hosting services with other services they provide at reduced prices; |
| • | Take advantage of acquisition and other opportunities more readily; |
| • | Adopt more aggressive pricing policies and devote greater resources to the promotion, marketing, and sales of their services; and |
| • | Devote greater resources to the research and development of their products and services. |
Our operating results may be further adversely impacted by the current recession, worldwide political and economic uncertainties and specific conditions in the markets we address.
Recently, general worldwide economic conditions have experienced a deterioration due to among other things, credit conditions resulting from the financial crisis affecting the banking system and financial markets including: slower economic activity, concerns about inflation and deflation, volatility in energy costs, decreased consumer confidence, reduced corporate profits and capital spending, the ongoing effects of the war in Iraq and Afghanistan, recent international conflicts, terrorist and military activity, and the impact of natural disasters and public health emergencies. These conditions make it extremely difficult for both us and our customers to accurately forecast and plan future business activities. Additionally, they could cause U.S. and foreign businesses to slow spending on our services, which could delay and lengthen our new customer sales cycle and cause existing customers to do one or more of the following:
| • | Cancel or reduce planned expenditures for our services; |
| • | Seek to lower their costs by renegotiating their contracts with us; |
| • | Move their hosting services in-house; or |
| • | Switch to lower-priced solutions provided by us or our competitors. |
Customer collections are our primary source of cash. We have historically grown through a combination of an increase in new customers and revenue growth from our existing customers. We have experienced a decrease in our installed base growth and if the economic recession were to continue or deteriorate further, we may experience additional reductions in our installed base growth, increases in churn and/or longer new customer sales cycles. If these events were to occur, we could experience a decrease in revenue and a reduction in operating margins. Further, during challenging economic times, our customers may have difficulty gaining timely access to sufficient credit, which could result in an impairment of their ability to make timely payments to us. We have experienced an increase in our allowance for doubtful accounts when the economic conditions were difficult, and if our customers’ ability to pay were to further erode, we may be required to increase our allowance for doubtful accounts. We cannot predict the timing, strength or duration of any economic slowdown or subsequent economic recovery. If the economy or markets in which we operate do not improve, we may record additional charges related to the impairment of goodwill and other long-lived assets, and our business, financial condition and results of operations could be materially and adversely affected.
14
Table of Contents
Finally, like many other companies, our stock price decreased during the onset of the recent economic downturn. Although our stock price has since recovered, if investors have concerns that our business, financial condition and results of operations will be negatively impacted by a continued or worsened worldwide economic downturn, our stock price could decrease again.
If we overestimate or underestimate our data center capacity requirements, our operating margins and profitability could be adversely affected.
The costs of construction, leasing, and maintenance of our data centers constitute a significant portion of our capital and operating expenses. In order to manage growth and ensure adequate capacity for new and existing customers while minimizing unnecessary excess capacity costs, we continuously evaluate our short and long-term data center capacity requirements. Due to the lead time in expanding existing data centers or building new data centers, we are required to estimate demand for our services as far as two years into the future. We currently plan to increase our infrastructure as required through the addition and expansion of data centers in the U.S. and internationally. In contrast to our data centers that we have established to date, several of which were acquired relatively inexpensively as distressed assets of third parties, our current expansion plans may require us to pay full market rates for new data center facilities. If we overestimate the demand for our services and therefore overbuild our data center capacity or commit to long term facility leases, our operating margins could be materially reduced, which would materially impair our profitability.
If we underestimate our data center capacity requirements, we may not be able to service the expanding needs of our existing customers. Additionally, we may be required to limit new customer acquisition while we work to increase data center capacity to satisfy demand, either of which may materially impair our revenue growth.
We rely on a number of third-party providers for data center space, equipment, maintenance and other services, and the loss of, or problems with, one or more of these providers may impede our growth or cause us to lose customers.
We rely on third-party providers to supply data center space, equipment and maintenance. For example, we lease data center space from third party landlords, lease or purchase equipment from equipment providers, and source equipment maintenance through third parties. While we have entered into various agreements for these products and services, any failure to obtain additional capacity or space, equipment, or maintenance, if required, would impede the growth of our business and cause our financial results to suffer. For example, if a data center landlord does not adequately maintain its facilities, or provide services for which it is responsible, we may not be able to deliver services to our customers according to our standards or at all. Further, the equipment that we purchase could be deficient in some way, thereby affecting our products and services. If, for any reason, these providers fail to provide the required services, fail to deliver their equipment, or suffer other failures, we may incur financial losses and our customers may lose confidence in our company, and we may not be able to retain these customers.
We may not be able to renew the leases on our existing facilities on terms acceptable to us, if at all, which could adversely affect our operating results.
We do not own the facilities occupied by our current data centers, but occupy them pursuant to commercial leasing arrangements. The initial terms of our main existing data center leases expire over a period ranging from 2012 to 2027, with each having at least one renewal period of no less than three years. Upon the expiration or termination of our data center facility leases, we may not be able to renew these leases on terms acceptable to us, if at all. If we fail to renew any data center lease and are required to move the data center to a new facility, we would face significant challenges due to the technical complexity, risk, and high costs of relocating the equipment. For example, if we are required to migrate customer servers to a new facility, such migration could result in significant downtime for our affected customers. This could damage our reputation and lead us to lose current and potential customers, which would harm our operating results and financial condition.
15
Table of Contents
Even if we are able to renew the leases on our existing data centers, we expect that rental rates, which will be determined based on then-prevailing market rates with respect to the renewal option periods and which will be determined by negotiation with the landlord after the renewal option periods, will be higher than rates we currently pay under our existing lease agreements. If we fail to increase revenue in our existing data centers by amounts sufficient to offset any increases in rental rates for these facilities, our operating results may be materially and adversely affected.
We rely on third-party hardware that may be difficult to replace or could cause errors or failures of our service, which could adversely affect our operating results or harm our reputation.
We rely on hardware acquired from third parties in order to offer our services. This hardware may not continue to be available on commercially reasonable terms in quantities sufficient to meet our business needs, which could adversely affect our ability to generate revenue. Any errors or defects in third-party hardware could result in errors or a failure of our service, which could harm our reputation and operating results. Indemnification from hardware providers, if any, would likely be insufficient to cover any damage to our business or our customers resulting from such hardware failure.
We rely on third-party software that may be difficult to replace or which could cause errors or failures of our service that could lead to lost customers or harm to our reputation.
We rely on software licensed from third parties to offer our services. This software may not continue to be available to us on commercially reasonable terms, or at all. Any loss of the right to use any of this software could result in delays in the provisioning of our services until equivalent technology is either developed by us, or, if available, is identified, obtained, and integrated, which could harm our business. Any errors or defects in third-party software or inadequate or delayed support by the third party could result in errors or a failure of our service which could harm our operating results by adversely affecting our revenue or operating costs.
We engage and rely on third-party consultants who may fail to provide effective guidance or solutions which could result in increased costs and loss of business opportunity.
We engage third-party consultants who provide us with guidance and solutions relating to everything from overall corporate strategy to data center design to employee engagement. We engage these parties based on our perception of their expertise and ability to provide valuable insight or solutions in the areas that we believe need to be addressed in our business. However, these consultants may fail to provide us with effective guidance or solutions, which could result in a loss of resources, operational failures or a loss of critical business opportunities.
Increased energy costs, power outages, and limited availability of electrical resources may adversely affect our operating results.
Our data centers are susceptible to increased regional, national or international costs of power and to electrical power outages. Our customer contracts do not allow us to pass on any increased costs of energy to our customers, which could affect our operating margins. Further, power requirements at our data centers are increasing as a result of the increasing power demands of today’s servers. Increases in our power costs could impact our operating results and financial condition. Since we rely on third parties to provide our data centers with power sufficient to meet our needs, our data centers could have a limited or inadequate amount of electrical resources necessary to meet our customer requirements. We attempt to limit exposure to system downtime due to power outages by using backup generators and power supplies. However, these protections may not limit our exposure to power shortages or outages entirely. Any system downtime resulting from insufficient power resources or power outages could damage our reputation and lead us to lose current and potential customers, which would harm our operating results and financial condition.
16
Table of Contents
Increased Internet bandwidth costs and network failures may adversely affect our operating results.
Our success depends in part upon the capacity, reliability, and performance of our network infrastructure, including the capacity leased from our Internet bandwidth suppliers. We depend on these companies to provide uninterrupted and error-free service through their telecommunications networks. Some of these providers are also our competitors. We exercise little control over these providers, which increases our vulnerability to problems with the services they provide. We have experienced and expect to continue to experience interruptions or delays in network service. Any failure on our part or the part of our third-party suppliers to achieve or maintain high data transmission capacity, reliability or performance could significantly reduce customer demand for our services and damage our business.
As our customer base grows and their usage of telecommunications capacity increases, we will be required to make additional investments in our capacity to maintain adequate data transmission speeds, the availability of which may be limited or the cost of which may be on terms unacceptable to us. If adequate capacity is not available to us as our customers’ usage increases, our network may be unable to achieve or maintain sufficiently high data transmission capacity, reliability or performance. In addition, our business would suffer if our network suppliers increased the prices for their services and we were unable to pass along the increased costs to our customers.
Our operating results may fluctuate significantly, which could make our future results difficult to predict and could cause our operating results to fall below investor or analyst expectations.
Our operating results may fluctuate due to a variety of factors, including many of the risks described in this section, which are outside of our control. As a result, comparing our operating results on a period-to-period basis may not be meaningful. You should not rely on our operating results for any prior periods as an indication of our future operating performance. Fluctuations in our revenue can lead to even greater fluctuations in our operating results. Our budgeted expense levels depend in part on our expectations of long-term future revenue. Given relatively fixed operating costs related to our personnel and facilities, any substantial adjustment to our expenses to account for lower than expected levels of revenue will be difficult and time consuming. Consequently, if our revenue does not meet projected levels, our operating expenses would be high relative to our revenue, which would negatively affect our operating performance.
If our revenue or operating results do not meet or exceed the expectations of investors or securities analysts, the price of our common stock may decline.
We could be required to repay substantial amounts of money to certain state and local governments if we lose tax exemptions or grants previously awarded to us, which could adversely affect our operating results.
In August 2007, we entered into an agreement with the State of Texas (Texas Enterprise Fund Grant) under which we may receive up to $22.0 million in state enterprise fund grants on the condition that we meet certain employment levels in the State of Texas paying an average compensation of at least $56,000 per year (subject to increases). To the extent we fail to meet these requirements, we may be required to repay all or a portion of the grants plus interest. In September 2007, we received the initial installment of $5.0 million from the State of Texas, which was recorded as a non-current liability.
On July 27, 2009, the Texas Enterprise Fund Grant agreement was amended to modify the job creation requirements. Under the amendment, the grant has been divided into four separate tranches. The first tranche, called “Basic Fund” in the amendment, is $8.5 million with a Job Target of 1,225 new jobs by December 2012 (in addition to the 1,436 jobs in place as of August 1, 2007 for a total of 2,661 jobs in Texas). We already have drawn $5.0 million of this grant. We can draw an additional $3.5 million when we reach 1,225 new jobs. If we do not create 1,225 new jobs in Texas by 2012, we will be required to repay the grant at a rate of $1,263 per job missed per year (clawback). As of December 31, 2009, we had created 617 new jobs. The maximum clawback
17
Table of Contents
would be the amounts we draw plus 3.4% interest on such amounts per year. The remaining three tranches are at our option. We can draw an additional $13.5 million, based on the following amounts and milestones: $5.5 million if we create a total of 2,100 new jobs in Texas; another $5.25 million if we create a total of 3,000 new jobs in Texas; and $2.75 million more if we create a total of 4,000 new jobs in Texas. We are responsible for maintaining the jobs through January 2022. If we eliminate jobs for which we have drawn funds, the clawback is triggered.
In October 2008, we received a grant in partnership with the State of Texas and Alamo Community College District, which will provide us the opportunity to be reimbursed for up to $4.7 million for certain training expenses conducted through Alamo Community College over the next three years. In order to fulfill our requirements, we must meet the employment requirements defined in the original Texas Enterprise Fund Grant agreement, which is unlikely. Although we have not received any reimbursements, we are in the process of evaluating this grant and the need to renegotiate its terms.
On August 3, 2007, we entered into a lease for approximately 67 acres of land and a 1.2 million square foot facility in Windcrest, Texas, which is in the San Antonio, Texas area, to house our corporate headquarters and potentially a future data center operation. In connection with this lease, we also entered into a Master Economic Incentives Agreement (“MEIA”) with the Cities of Windcrest and San Antonio, Texas, Bexar County, and certain other parties, pursuant to which we agreed to locate existing and future employees at the new facility location. The agreement requires that we meet certain employment levels each year, with an ultimate job requirement of 4,500 jobs by December 31, 2012, provided that if the job requirement in any grant agreement with the State of Texas is lower, then the job requirement under the MEIA is automatically adjusted downward. Consequently, because the Texas Enterprise Fund Grant agreement has been amended to reduce the state job requirement, we believe the job requirement under the MEIA has been reduced to 1,774. In addition, the MEIA requires that the median compensation of those employees be no less than $51,000 per year. In exchange for meeting these employment obligations, the parties agreed to enter into the lease structure, pursuant to which, as a lessee of the Windcrest Economic Development Corporation, we will not be subject to most of the property taxes associated with the property for a 14 year period. If we fail to meet these job creation requirements, we could lose a portion or all of the tax benefit being provided during the 14 year period by having to make payments in lieu of taxes (PILOT) to the City of Windcrest. The amount of the PILOT payment would be calculated based on the amount of taxes that would have been owed for that period if the property were not exempt, and then such amount would be adjusted pursuant to certain factors, such as the percentage of employment achieved compared to the stated requirements.
We have significant debt obligations that include restrictive covenants limiting our flexibility to manage our business; failure to comply with these covenants could trigger an acceleration of our outstanding indebtedness and adversely affect our financial position and operating results.
As of December 31, 2009, outstanding indebtedness under our credit facility totaled $50.0 million, with an outstanding letter of credit of $0.7 million. Our credit facility requires that we maintain specific financial ratios and comply with covenants, including financial covenants, which contain numerous restrictions on our ability to incur additional debt, pay dividends or make other restricted payments, sell assets, enter into affiliate transactions and take other actions. Our existing credit facility is, and any future financing arrangements may be, secured by all of our assets. If we are unable to meet the terms of the financial covenants or if we breach any of these covenants, a default could result under one or more of these agreements, which may require us to repay all amounts owed under our credit facility.
If we are unable to generate sufficient cash to repay our debt obligations when they become due and payable, either when they mature or in the event of a default, we may not be able to obtain additional debt or equity financing on favorable terms, if at all, which may negatively impact our ability to continue as a going concern.
18
Table of Contents
We also have substantial equipment lease obligations, the principal balance of which totaled approximately $109.7 million as of December 31, 2009. The payment obligations under these equipment leases are secured by a significant portion of the hardware used in our data centers. If we are unable to generate sufficient cash flow from our operations or cash from other sources in order to meet the payment obligations under these equipment leases, we may lose the right to possess and operate the equipment used in our data centers, which would substantially impair our ability to provide our services, which could have a material adverse effect on our liquidity or results of operations.
We may require additional capital and may not be able to secure additional financing on favorable terms to meet our future capital needs, which could adversely affect our financial position and result in stockholder dilution.
In order to fund future growth, we will be dependent on significant capital expenditures. We may need to raise additional funds through equity or debt financings in the future in order to meet our operating and capital needs. We may not be able to secure additional debt or equity financing on favorable terms, or at all, at the time when we need such funding. If we are unable to raise additional funds, we may not be able to pursue our growth strategy and our business could suffer. If we raise additional funds through further issuances of equity or convertible debt securities, our existing stockholders could suffer significant dilution in their percentage ownership of our company, and any new equity securities we issue could have rights, preferences, and privileges senior to those of holders of our common stock. In addition, any debt financing that we may obtain in the future could have restrictive covenants relating to our capital raising activities and other financial and operational matters, which may make it more difficult for us to obtain additional capital and to pursue business opportunities, including potential acquisitions.
We are exposed to commodity and market price risks that have the potential to substantially influence our profitability and liquidity.
We are a large consumer of power. During 2009, we expensed approximately $17.5 million to utility companies to power our data centers. We anticipate an increase in our consumption of power in the future as our sales grow. Power costs vary by locality and are subject to substantial seasonal fluctuations and changes in energy prices. Our largest exposure to energy prices currently exists at our Grapevine, Texas facility in the Dallas-Fort Worth area, where the energy market is deregulated. Power costs have historically tracked the general costs of energy, and continued increases in electricity costs may negatively impact our gross margins or operating expenses. We periodically evaluate the advisability of entering into fixed price utilities contracts. If we choose not to enter into a fixed price contract, we expose our cost structure to this commodity price risk.
Our main credit facility is a revolving line of credit with a base rate determined by the London Interbank Offered Rate, or LIBOR. This market rate of interest is fluctuating and exposes our interest expense to risk. Our credit agreement obligates us to hedge part of that interest rate risk with appropriate instruments, such as interest rate swaps or interest rate options. On December 10, 2007, we entered into an at-the-market fixed-payer interest rate swap with a notional amount of $50.0 million at an annual rate of 4.135%. This swap essentially fixes the rate we pay on the first $50.0 million outstanding on our revolving credit facility. As we borrow more, we may enter into additional swaps to continuously control our interest rate risk. Generally, we do not hedge our complete exposure. As a result, we may be exposed to interest rate risk on the un-hedged portion of our borrowings. For example, a 100 basis point increase in LIBOR would increase the interest expense on $10 million of borrowings that are not hedged by $0.1 million annually. As of December 31, 2009 we did not have exposure to interest rate risk as we only had $50.0 million outstanding on our revolving credit facility.
The majority of our customers are invoiced, and substantially all of our expenses are paid, by us or our subsidiaries in the functional currency of our company or our subsidiaries, respectively. However, some of our customers are currently invoiced in currencies other than the applicable functional currency. As a result, we may incur foreign currency losses based on changes in exchange rates between the date of the invoice and the date of
19
Table of Contents
collection. In addition, large changes in foreign exchange rates relative to our functional currencies could increase the costs of our services to non-U.S. customers relative to local competitors, thereby causing us to lose existing or potential customers to these local competitors. Thus, our results of operations and cash flows are subject to fluctuations due to changes in foreign currency exchange rates. Further, as we grow our international operations, our exposure to foreign currency risk could become more significant. To date, we have not entered into any foreign currency hedging contracts, although we may do so in the future.
We may be accused of infringing the proprietary rights of others, which could subject us to costly and time-consuming litigation and require us to discontinue services that infringe the rights of others.
There may be intellectual property rights held by others, including issued or pending patents, trademarks, and service marks that cover significant aspects of our technologies, branding or business methods, including technologies and intellectual property we have licensed from third parties. Companies in the technology industry, and other patent and trademark holders seeking to profit from royalties in connection with grants of licenses, own large numbers of patents, copyrights, trademarks, service marks, and trade secrets and frequently enter into litigation based on allegations of infringement or other violations of intellectual property rights. These or other parties could claim that we have misappropriated or misused intellectual property rights and any such intellectual property claim against us, regardless of merit, could be time consuming and expensive to settle or litigate and could divert the attention of our technical and management personnel. An adverse determination also could prevent us from offering our services to our customers and may require that we procure or develop substitute services that do not infringe. For any intellectual property rights claim against us or our customers, we may have to pay damages, indemnify our customers against damages or stop using technology or intellectual property found to be in violation of a third party’s rights. We may be unable to replace those technologies with technologies that have the same features or functionality and that are of equal quality and performance standards on commercially reasonable terms or at all. Licensing replacement technologies and intellectual property may significantly increase our operating expenses or may require us to restrict our business activities in one or more respects. We may also be required to develop alternative non-infringing technology and intellectual property, which could require significant effort, time, and expense.
Our use of open source software could impose limitations on our ability to provide our services, which could adversely affect our financial condition and operating results.
We utilize open source software, including Linux-based software, in providing a substantial portion of our services. The terms of many open source licenses have not been interpreted by U.S. courts, and there is a risk that such licenses could be construed in a manner that could impose unanticipated conditions or restrictions on our ability to offer our services. Additionally, the use and distribution of open source software can lead to greater risks than the use of third-party commercial software, as open source software does not come with warranties or other contractual protections regarding infringement claims or the quality of the code. From time to time parties have asserted claims against companies that distribute or use open source software in their products and services, asserting that open source software infringes their intellectual property rights. We could be subject to suits by parties claiming infringement of intellectual property rights with respect to what we believe to be open source software. In such event, we could be required to seek licenses from third parties in order to continue using such software or offering certain of our services or to discontinue the use of such software or the sale of our affected services in the event we could not obtain such licenses, any of which could adversely affect our business, operating results and financial condition. In addition, if we combine our proprietary software with open source software in a certain manner, we could, under some of the open source licenses, be required to release the source code of our proprietary software.
We may not be successful in protecting and enforcing our intellectual property rights, which could adversely affect our financial condition and operating results.
We rely primarily on copyright, trademark, service mark, and trade secret laws, as well as confidentiality procedures and contractual restrictions, to establish and protect our proprietary rights, all of which provide only
20
Table of Contents
limited protection. We rely on copyright laws to protect software and certain other elements of our proprietary technologies, although to date we have not registered for copyright protection. We cannot assure you that any future copyright, trademark or service mark registrations will be issued for pending or future applications or that any registered or unregistered copyrights, trademarks or service marks will be enforceable or provide adequate protection of our proprietary rights. We currently have one patent in the U.S. Our patent may be contested, circumvented, found unenforceable or invalidated.
We endeavor to enter into agreements with our employees and contractors and agreements with parties with whom we do business to limit access to and disclosure of our proprietary information. The steps we have taken, however, may not prevent unauthorized use or the reverse engineering of our technology. Moreover, others may independently develop technologies that are substantially equivalent, superior to, or otherwise competitive to the technologies we employ in our services or that infringe our intellectual property. We may be unable to prevent competitors from acquiring trademarks or service marks and other proprietary rights that are similar to, infringe upon, or diminish the value of our trademarks and service marks and our other proprietary rights. Enforcement of our intellectual property rights also depends on successful legal actions against infringers and parties who misappropriate our proprietary information and trade secrets, but these actions may not be successful, even when our rights have been infringed.
In addition, the laws of some foreign countries do not protect our proprietary rights to the same extent as the laws of the U.S. Despite the measures taken by us, it may be possible for a third party to copy or otherwise obtain and use our technology and information without authorization. Policing unauthorized use of our proprietary technologies and other intellectual property and our services is difficult, and litigation could become necessary in the future to enforce our intellectual property rights. Any litigation could be time consuming and expensive to prosecute or resolve, result in substantial diversion of management attention and resources, and harm our business, financial condition, and results of operations.
We may be liable for the material that content providers distribute over our network and we may have to terminate customers that provide content that is determined to be illegal, which could adversely affect our operating results.
The law relating to the liability of private network operators for information carried on, stored on, or disseminated through their networks is still unsettled in many jurisdictions. We have been and expect to continue to be subject to legal claims relating to the content disseminated on our network, including claims under the Digital Millennium Copyright Act, other similar legislation and common law. In addition, there are other potential customer activities, such as online gambling and pornography, where we, in our role as a hosting provider, may be held liable as an aider or abettor of our customers. If we need to take costly measures to reduce our exposure to these risks, terminate customer relationships and the associated revenue or defend ourselves against such claims, our financial results could be negatively affected.
Government regulation of data networks is largely unsettled, and depending on its evolution, may adversely affect our operating results.
We are subject to varying degrees of regulation in each of the jurisdictions in which we provide services. Local laws and regulations, and their interpretation and enforcement, differ significantly among those jurisdictions. These laws can be costly to comply with, can be a significant diversion to management’s time and effort, and can subject us to claims or other remedies, as well as negative publicity. Many of these laws were adopted prior to the advent of the internet and related technologies and, as a result, do not contemplate or address the unique issues that the internet and related technologies produce. Some of the laws that do reference the internet and related technologies have been and continue to be interpreted by the courts, but their applicability and scope remain largely uncertain.
In addition, future regulatory, judicial, and legislative changes may have a material adverse effect on our ability to deliver services within various jurisdictions. National regulatory frameworks that are consistent with
21
Table of Contents
the policies and requirements of the World Trade Organization have only recently been, or are still being, put in place in many countries. Accordingly, many countries are still in the early stages of providing for and adapting to a liberalized telecommunications market. As a result, in these markets we may encounter more protracted and difficult procedures to obtain any necessary licenses or negotiate interconnection agreements, which could negatively impact our ability to expand in these markets or increase our operating costs in these markets.
Privacy concerns relating to our technology could damage our reputation and deter current and potential users from using our products and services.
Since our products and services are web based, we store substantial amounts of data for our customers on our servers (including personal information). Any systems failure or compromise of our security that results in the release of our customers’ data could (i) subject us to substantial damage claims from our customers, (ii) expose us to costly regulatory remediation and (iii) harm our reputation and brand. We may also need to expend significant resources to protect against security breaches. The risk that these types of events could seriously harm our business is likely to increase as we expand our hosting footprint.
Regulatory authorities around the world are considering a number of legislative proposals concerning data protection. In addition, the interpretation and application of data protection laws in Europe and elsewhere are still uncertain and in flux. It is possible that these laws may be interpreted and applied in a manner that is inconsistent with our data practices. If so, in addition to the possibility of fines, this could result in an order requiring that we change our data practices, which could have an adverse effect on our business. Complying with these various laws could cause us to incur substantial costs or require us to change our business practices in a manner adverse to our business.
Our ability to operate and expand our business is susceptible to risks associated with international sales and operations.
We anticipate that, for the foreseeable future, a significant portion of our revenue will continue to be derived from sources outside of the U.S. A key element of our growth strategy is to further expand our customer base internationally and successfully operate data centers in foreign markets. We have limited experience operating in foreign jurisdictions other than the U.K. and expect to continue to grow our international operations. Managing a global organization is difficult, time consuming, and expensive. Our inexperience in operating our business globally increases the risk that international expansion efforts that we may undertake will not be successful. In addition, conducting international operations subjects us to new risks that we have not generally faced. These risks include:
| • | Localization of our services, including translation into foreign languages and adaptation for local practices and regulatory requirements; |
| • | Lack of familiarity with and unexpected changes in foreign regulatory requirements; |
| • | Longer accounts receivable payment cycles and difficulties in collecting accounts receivable; |
| • | Difficulties in managing and staffing international operations; |
| • | Fluctuations in currency exchange rates; |
| • | Potentially adverse tax consequences, including the complexities of transfer pricing, foreign value added tax systems, and restrictions on the repatriation of earnings; |
| • | Dependence on certain third parties, including channel partners with whom we do not have extensive experience; |
| • | The burdens of complying with a wide variety of foreign laws and legal standards; |
| • | Increased financial accounting and reporting burdens and complexities; |
22
Table of Contents
| • | Political, social, and economic instability abroad, terrorist attacks and security concerns in general; and |
| • | Reduced or varied protection for intellectual property rights in some countries. |
Operating in international markets also requires significant management attention and financial resources. The investment and additional resources required to establish operations and manage growth in other countries may not produce desired levels of revenue or profitability.
We rely on our Partner Network Program members for a significant portion of our revenues, and we benefit from our association with them. The loss of these members could adversely affect our business.
Our Partner Network Program drives a significant amount of revenue to our hosting services business. Most of our member partners offer services that are complementary to our hosting services. Some of the participants in our network, however, may actually compete with us in one or more of product or service offering. These network partners may decide in the future to terminate their agreements with us and to use a competitor’s or their own services, which would likely cause our revenue to decline.
Also, we derive tangible and intangible benefits from our association with some of our network partners, particularly high profile partners that reach a large number of companies through the internet. If a substantial number of these relationships terminate their relationship with us, our business could be adversely affected.
Our acquisitions may divert our management’s attention, result in dilution to our stockholders and consume resources that are necessary to sustain our business.
We have made acquisitions and, if appropriate opportunities present themselves, we may make additional acquisitions or investments or enter into joint ventures or strategic alliances with other companies. Risks commonly encountered in such transactions include:
| • | The difficulty of assimilating the operations and personnel of the combined companies; |
| • | The risk that we may not be able to integrate the acquired services or technologies with our current services, products, and technologies; |
| • | The potential disruption of our ongoing business; |
| • | The diversion of management attention from our existing business; |
| • | The inability of management to maximize our financial and strategic position through the successful integration of the acquired businesses; |
| • | Difficulty in maintaining controls, procedures, and policies; |
| • | The impairment of relationships with employees, suppliers, and customers as a result of any integration; |
| • | The loss of an acquired base of customers and accompanying revenue; and |
| • | The assumption of leased facilities, other long-term commitments or liabilities that could have a material adverse impact on our profitability and cash flow. |
As a result of these potential problems and risks, businesses that we may acquire or invest in may not produce the revenue, earnings, or business synergies that we anticipated. In addition, there can be no assurance that any potential transaction will be successfully identified and completed or that, if completed, the acquired business or investment will generate sufficient revenue to offset the associated costs or other potential harmful effects on our business.
23
Table of Contents
Concerns about greenhouse gas emissions and the global climate change may result in environmental taxes, charges, assessments or penalties.
The effects of human activity on the global climate change have attracted considerable public and scientific attention, as well as the attention of the United States government. Efforts are being made to reduce greenhouse emissions, particularly those from coal combustion by power plants, some of which we may rely upon for power. The added cost of any environmental taxes, charges, assessments or penalties levied on these power plants could be passed on to us, increasing the cost to run our data centers. Additionally, environmental taxes, charges, assessments or penalties could be levied directly on us in proportion to our carbon footprint. Any enactment of laws or passage of regulations regarding greenhouse gas emissions by the United States, or any domestic or foreign jurisdiction we perform business in, could adversely affect our operations and financial results.
Terrorist activity throughout the world and military action to counter terrorism could adversely impact our operating results.
Terrorist attacks and other acts of violence, as well as governments’ responses to such activities, may have an adverse effect on business, financial, and general economic conditions internationally. Terrorist activities may disrupt our ability to provide our services or may increase our costs due to the need to provide enhanced security, which would have a material adverse effect on our business and results of operations. These circumstances may also adversely affect our ability to attract and retain customers, our ability to raise capital, and the operation and maintenance of our facilities. We may not have adequate property and liability insurance to cover catastrophic events or attacks brought on by terrorist attacks and other acts of violence. In addition, we depend heavily on the physical infrastructure, particularly as it relates to power, that exists in the markets in which we operate. Any damage to such infrastructure in these markets where we operate may materially and adversely affect our operating results.
We have and will continue to incur significant increased costs as a result of operating as a public company, and our management will be required to devote substantial time to new compliance initiatives.
As a public company, we have and will continue to incur significant legal, accounting, and other expenses that we did not incur as a private company. In addition, the Sarbanes-Oxley Act of 2002 as well as rules subsequently implemented by the Securities and Exchange Commission, and the New York Stock Exchange, have imposed various requirements on public companies, including requiring changes in corporate governance practices. Our management and other personnel have and will need to continue to devote a substantial amount of time to these new compliance initiatives. Moreover, these rules and regulations have and are expected to continue to increase our legal and financial compliance costs, making some activities more time-consuming and costly. For example, these new rules and regulations make it more difficult and more expensive for us to obtain director and officer liability insurance, and we may be required to accept reduced policy limits and coverage or incur substantial costs to maintain the same or similar coverage. These rules and regulations could also make it more difficult for us to attract and retain qualified persons to serve on our board of directors, our board committees or as executive officers.
In order to respond to additional regulations applicable to public companies, such as Section 404 of the Sarbanes-Oxley Act, we have hired a number of finance and accounting personnel. In the future, we may be required to hire additional full-time accounting employees to fill these and other related finance and accounting positions. Some of these positions require candidates with public company experience, and we may be unable to locate and hire such individuals as quickly as needed, if at all. In addition, new employees will require time and training to learn our business and operating processes and procedures. If our finance and accounting organization is unable for any reason to respond adequately to the increased demands resulting from being a public company, the quality and timeliness of our financial reporting may suffer and we could experience internal control weaknesses. Any consequences resulting from inaccuracies or delays in our reported financial statements could have an adverse effect on the trading price of our common stock as well as an adverse effect on our business, operating results, and financial condition.
24
Table of Contents
Risks Related to the Ownership of Our Common Stock
The trading price of our common stock may be volatile.
The market price of our common stock has been highly volatile and could be subject to wide fluctuations in response to, among other things, the risk factors described in this periodic report, and other factors beyond our control, such as stock market volatility and fluctuations in the valuation of companies perceived by investors to be comparable to us.
Further, the stock markets have experienced price and volume fluctuations that have affected and continue to affect our stock price and the market prices of equity securities of many other companies. These fluctuations often have been unrelated or disproportionate to the operating performance of those companies. These broad market and industry fluctuations, as well as general economic, political, and market conditions, such as recessions, interest rate changes or international currency fluctuations, may negatively affect the market price of our common stock. We may experience additional volatility as a result of the limited number of our shares available for trading in the market.
In the past, many companies that have experienced volatility in the market price of their stock have been subject to securities class action litigation. We may be the target of this type of litigation in the future. Securities litigation against us could result in substantial costs and divert our management’s attention from other business concerns, which could seriously harm our business.
Our common stock has only been publicly traded since our initial public offering on August 7, 2008 and the price of our common stock has fluctuated substantially since then and may fluctuate substantially in the future.
Our common stock has only been publicly traded since our initial public offering on August 7, 2008. The trading price of our common stock has fluctuated significantly since then. For example, between December 31, 2008 and December 31, 2009, the closing trading price of our common stock was very volatile, ranging between $4.38 and $23.06 per share, including single-day increases of up to 12.9% and declines up to 11.7%. Our trading price could fluctuate substantially in the future due to the factors discussed in this Risk Factors section and elsewhere in this annual report on Form 10-K.
Contractual lock-up restrictions on the sale of approximately 99 million shares held by certain stockholders expired on February 3, 2009 and to the extent a stockholder is not an affiliate, its shares are now eligible for sale without restriction. Affiliate sales are subject to the volume, manner of sale and other restrictions of Rule 144 of the Securities Exchange Act of 1933 which allow the holder to sell up to the greater of 1% of our outstanding common stock or our average weekly trading volume during any three-month period. Shares beneficially held by Graham Weston, Wells Fargo and Company and certain other parties will be subject to such requirements to the extent they are deemed to be our “affiliates” as that term is defined in Rule 144. Additionally, Weston, Wells Fargo and Company and other holders possess registration rights with respect to some of the shares of our common stock that they hold. If they choose to exercise such rights, their sale of the shares that are registered would not be subject to the Rule 144 limitations. If a significant amount of the shares that become eligible for resale enter the public trading markets in a short period of time, the market price of our common stock may decline.
Additionally, certain of our large stockholders are entities that may from time to time distribute the shares of our stock held by them to their beneficial owners in order to provide them with liquidity with respect to their investment in our stock. The distributed shares may be eligible for immediate resale, in which case all or a significant portion of these shares may be sold by these beneficial owners in the public markets during a short period of time following their receipt of these shares, which may cause the market price for our stock to decline.
25
Table of Contents
The issuance of additional stock in connection with acquisitions, our stock option plans, or otherwise will dilute all other stockholdings.
We have a large number of shares of common stock authorized but unissued and not reserved for issuance under our stock option plans or otherwise. We may issue all of these shares without any action or approval by our stockholders. We intend to continue to actively pursue strategic acquisitions. We may pay for such acquisitions, partly or in full, through the issuance of additional equity. In addition, our Amended and Restated 2007 Stock Plan contains an evergreen provision, which annually increases the number of shares issuable under the plan. Any issuance of shares in connection with our acquisitions, the exercise of stock options or otherwise would dilute the percentage ownership held by our then existing stockholders.
Your ability to influence corporate matters may be limited because a small number of stockholders beneficially own a substantial amount of our common stock.
Our directors and executive officers and their affiliates beneficially own a significant portion of our outstanding common stock. As a result, these stockholders will be able to exercise significant influence over all matters requiring stockholder approval, including the election of directors and approval of significant corporate transactions, such as a merger or other sale of our company or its assets. Although our directors and executive officers are not currently party to any agreements or understandings to act together on matters submitted for stockholder approval, this concentration of ownership could limit your ability to influence corporate matters and may have the effect of delaying or preventing a third party from acquiring control over us.
Anti-takeover provisions in our organizational documents and Delaware law may discourage or prevent a change of control, even if an acquisition would be beneficial to our stockholders, which could affect our stock price adversely and prevent attempts by our stockholders to replace or remove our current management.
Our restated certificate of incorporation and amended and restated bylaws contain provisions that could delay or prevent a change of control of our company or changes in our board of directors deemed undesirable by our board of directors that our stockholders might consider favorable. Some of these provisions:
| • | Authorize the issuance of blank check preferred stock which can be created and issued by our board of directors without prior stockholder approval, with voting, liquidation, dividend, and other rights senior to those of our common stock; |
| • | Provide for a classified board of directors, with each director serving a staggered three-year term; |
| • | Prohibit our stockholders from filling board vacancies or increasing the size of our board, calling special stockholder meetings or taking action by written consent; |
| • | Provide for the removal of a director only with cause and by the affirmative vote of the holders of a majority of the shares then entitled to vote at an election of our directors; and |
| • | Require advance written notice of stockholder proposals and director nominations. |
In addition, we are subject to the provisions of Section 203 of the Delaware General Corporation Law, which may prohibit certain business combinations with stockholders owning 15% or more of our outstanding voting stock. These and other provisions in our restated certificate of incorporation, amended and restated bylaws and Delaware law could make it more difficult for stockholders or potential acquirers to obtain control of our board of directors or initiate actions that are opposed by our then current board of directors, including a merger, tender offer or proxy contest involving our company. Any delay or prevention of a change of control transaction or changes in our board of directors could cause the market price of our common stock to decline.
26
Table of Contents
ITEM IB—UNRESOLVED STAFF COMMENTS
None.
Office Space
Our corporate headquarter facility is located in San Antonio, Texas and consists of a 1.2 million square foot facility located on approximately 67 acres of land. We have remodeled and are currently using approximately 230,000 square feet of office space and will continue to remodel the formerly vacant facility as needed to facilitate our future growth and office requirements. Besides our corporate headquarters, we have additional U.S. office locations in Texas, Virginia, Missouri, Illinois and Georgia and additional office space located in the U.K., the Netherlands, and Hong Kong. As of December 31, 2009, we utilized approximately 568,000 square feet of our leased office space and used it for customer service, operations, sales, corporate and administrative functions.
Data Centers
As of December 31, 2009, we leased eight main data centers located in the U.S., the U.K., and in Hong Kong with approximately 220,000 available technical square feet, of which 162,800 were utilized. The six data centers in the U.S are located in Texas, Virginia and Illinois.
We believe that our existing office space and data center facilities are adequate for our current needs and that suitable additional or alternative space will be available in the future to meet our anticipated needs.
We are party to various legal proceedings which we consider routine and incidental to our business. On October 22, 2008, Benjamin E. Rodriguez D/B/A Management and Business Advisors vs. Rackspace Hosting, Inc. and Graham Weston, was filed in the 37th District Court in Bexar County Texas by a former consultant to the company, Benjamin E. Rodriguez. The suit alleges breach of an oral agreement to issue Mr. Rodriguez a 1% interest in our stock in the form of options or warrants for compensation for services he was engaged to perform for us. We believe that the plaintiff’s position is without merit and intend to vigorously defend this lawsuit. We do not expect the results of this claim or any other current proceeding to have a material adverse effect on our business, results of operations or financial condition.
ITEM 4—SUBMISSION OF MATTERS TO A VOTE OF SECURITY HOLDERS
No matters were submitted to a vote of security holders during the fourth quarter of fiscal year 2009.
27
Table of Contents
ITEM 5—MARKET FOR REGISTRANT’S COMMON EQUITY, RELATED STOCKHOLDER MATTERS AND ISSUER PURCHASES OF EQUITY SECURITIES
Market Information for Common Stock
Our common stock began trading on the New York Stock Exchange under the symbol “RAX” beginning on August 8, 2008. Prior to that time, there was no public market for our common stock.
The following table sets forth for the indicated periods the high and low closing prices for our common stock for the periods indicated, as reported by the New York Stock Exchange.
| High | Low | |||||
| Fiscal Year 2009 Quarters: | ||||||
| First Quarter |
$ | 7.81 | $ | 4.38 | ||
| Second Quarter |
14.50 | 7.37 | ||||
| Third Quarter |
18.33 | 12.24 | ||||
| Fourth Quarter |
23.06 | 16.75 | ||||
| Fiscal Year 2008 Quarters: | ||||||
| Third Quarter (from August 8, 2008) |
$ | 11.71 | $ | 8.24 | ||
| Fourth Quarter |
8.33 | 4.79 | ||||
The last reported sale price for our common stock on the New York Stock Exchange was $19.81 per share on February 19, 2010.
Dividend Policy
We have never paid any cash dividends on our common stock. Our board of directors currently intends to retain any future earnings to support operations and to finance the growth and development of our business and does not intend to pay cash dividends on our common stock for the foreseeable future. Any future determination related to our dividend policy will be made at the discretion of our board.
Stockholders
As of February 19, 2010, there were 226 registered stockholders of record of our common stock. Because many of our shares of common stock are held by brokers and other institutions on behalf of stockholders, we are unable to estimate the total number of stockholders represented by these stockholders of record.
Securities Authorized For Issuance Under Equity Compensation Plans
For information regarding securities authorized for issuance under equity compensation plans, see Part III “Item 12—Security Ownership of Certain Beneficial Owners and Management and Related Stockholder Matters.”
28
Table of Contents
Stock Performance Graph
The graph set forth below compares the cumulative total stockholder return on our common stock between August 7, 2008 (the date of our initial public offering, or IPO) and December 31, 2009, with the cumulative total return of (i) the Russell 2000 Index and (ii) the Nasdaq Internet Total Return Index, over the same period. This graph assumes the investment of $100 on August 7, 2008 in our common stock at our IPO offering price of $12.50 per share, the Russell 2000 Index and the Nasdaq Internet Total Return Index, and assumes the reinvestment of dividends, if any. We are currently included in the Russell 2000 Index. The Nasdaq Internet Total Return Index consists of U.S. listed companies engaged in internet-related businesses.
The comparisons shown in the graph below are based upon historical data. We caution that the stock price performance shown in the graph below is not necessarily indicative of, nor is it intended to forecast, the potential future performance of our common stock.
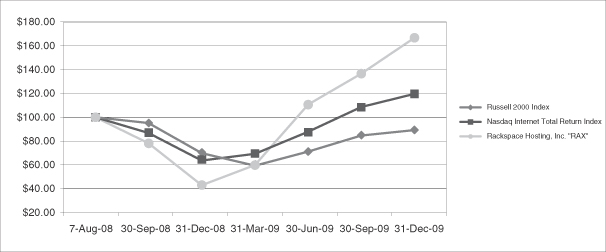
Recent Sales of Unregistered Securities
None
29
Table of Contents
ITEM 6—SELECTED FINANCIAL DATA
The following selected consolidated financial data should be read in conjunction with the financial statements and the notes to those statements and “Management’s Discussion and Analysis of Financial Condition and Results of Operations” and our consolidated financial statements included elsewhere in this document. The selected consolidated financial data in this section are not intended to replace the financial statements and are qualified in their entirety by the consolidated financial statements and related notes thereto included elsewhere in this document.
The statements of income and cash flow data for the fiscal years ended December 31, 2007, 2008 and 2009 and the balance sheet data as of December 31, 2008 and 2009 have been derived from our audited consolidated financial statements, which have been audited by KPMG, LLP, independent registered public accounting firm, and included elsewhere in this document. The statements of income data for the years ended December 31, 2005 and 2006 and the balance sheet data as of December 31, 2005, 2006 and 2007 have been derived from our audited consolidated financial statements, which have been audited by KPMG, LLP, independent registered public accounting firm, but are not included in this document. Historical results are not necessarily indicative of future results. See note 3 to the financial statements for an explanation of the method used to determine the number of shares used in computing basic and diluted net income per common share.
| Year Ended December 31, | ||||||||||||||||||||
| (In thousands, except per share data) | 2005 | 2006 | 2007 | 2008 | 2009 | |||||||||||||||
| Net revenue |
$ | 138,768 | $ | 223,966 | $ | 362,017 | $ | 531,933 | $ | 628,987 | ||||||||||
| Costs and expenses: |
||||||||||||||||||||
| Cost of revenue |
40,987 | 64,889 | 118,225 | 172,583 | 200,943 | |||||||||||||||
| Sales and marketing |
21,837 | 35,667 | 53,930 | 80,323 | 79,458 | |||||||||||||||
| General and administrative |
38,968 | 59,832 | 102,777 | 148,706 | 168,116 | |||||||||||||||
| Depreciation and amortization |
20,193 | 32,335 | 56,476 | 90,172 | 125,229 | |||||||||||||||
| Total costs and expenses |
121,985 | 192,723 | 331,408 | 491,784 | 573,746 | |||||||||||||||
| Income from operations |
16,783 | 31,243 | 30,609 | 40,149 | 55,241 | |||||||||||||||
| Other income (expense): |
||||||||||||||||||||
| Interest expense |
(808 | ) | (1,095 | ) | (3,643 | ) | (8,229 | ) | (8,950 | ) | ||||||||||
| Interest and other income |
633 | 572 | 828 | 768 | 255 | |||||||||||||||
| Total other income (expense) |
(175 | ) | (523 | ) | (2,815 | ) | (7,461 | ) | (8,695 | ) | ||||||||||
| Income before income taxes |
16,608 | 30,720 | 27,794 | 32,688 | 46,546 | |||||||||||||||
| Income taxes |
5,836 | 10,900 | 9,965 | 10,985 | 16,328 | |||||||||||||||
| Net income |
$ | 10,772 | $ | 19,820 | $ | 17,829 | $ | 21,703 | $ | 30,218 | ||||||||||
| Net income per share |
||||||||||||||||||||
| Basic |
$ | 0.12 | $ | 0.20 | $ | 0.18 | $ | 0.20 | $ | 0.25 | ||||||||||
| Diluted |
$ | 0.11 | $ | 0.19 | $ | 0.17 | $ | 0.19 | $ | 0.24 | ||||||||||
| Balance sheet data |
||||||||||||||||||||
| Cash and cash equivalents |
$ | 8,022 | $ | 8,374 | $ | 24,937 | $ | 238,407 | $ | 125,425 | ||||||||||
| Total assets |
83,645 | 132,983 | 301,813 | 685,261 | 668,645 | |||||||||||||||
| Long term obligations |
8,417 | 16,391 | 96,213 | 283,053 | 161,024 | |||||||||||||||
| Total stockholders’ equity |
46,713 | 70,490 | 96,873 | 269,684 | 349,427 | |||||||||||||||
30
Table of Contents
ITEM 7—MANAGEMENT’S DISCUSSION AND ANALYSIS OF
FINANCIAL CONDITION AND RESULTS OF OPERATIONS
The following discussion should be read in conjunction with our consolidated financial statements and the related notes contained elsewhere in this document.
Overview of our Business
Rackspace Hosting, Inc. is the world leader in the hosting and cloud computing industry. Our growth is the result of our commitment to serving our customers, known as Fanatical Support®, and our exclusive focus on hosting and cloud computing. We have been successful in attracting and retaining thousands of customers and in growing our business. We are a pioneer in an emerging category, hybrid hosting, which combines the benefits of both traditional dedicated hosting and cloud computing. We are committed to maintaining our service-centric focus and will follow our vision to be considered one of the world’s greatest service companies.
Rackspace offers a portfolio of hosting services, including managed hosting, cloud hosting, and cloud application hosting. The equipment required (servers, routers, switches, firewalls, load balancers, cabinets, software, wiring, etc.) to deliver services is typically purchased and managed by us.
We sell our services to small and medium-sized businesses as well as large enterprises. During 2009, 25.6% of our net revenue was generated by our operations outside of the U.S., mainly from the U.K. Additionally, late in 2008, we began operating a Hong Kong data center and a sales office, which generated minimal revenue in 2008 and 2009. Our growth strategy includes, among other strategies, targeting international customers as we plan to expand our activities in continental Europe and Asia.
As we grow our business, we believe our operations are exposed to certain risks and uncertainties, which could negatively impact our operating results and financial condition. See the section entitled “Risk Factors” for further discussion of these risks.
How We Earn Revenue and Measure Growth
Our subscription-based business model generates almost all of our revenue on a recurring basis. Our customers pay us a recurring fee based on the size and complexity of the IT systems we manage and the level of service intensity we provide, pursuant to service agreements that typically provide for monthly payments. Our cloud business offers pay-as-you go services that are earned and recognized as the services are provided. Revenue is reduced by credits issued to customers, primarily for service interruptions, and also includes revenue related to customers who have cancelled their service. Net revenue for the years ended December 31, 2007, 2008 and 2009 was $362.0 million, $531.9 million, and $629.0 million, respectively, representing year-over-year increases of 46.9% in 2008 and 18.3% in 2009.
Our revenue growth is primarily due to increased volume of services provided, both due to an increasing number of new customers and incremental services rendered to existing customers, as well as a broader suite of hosting services acquired through acquisitions and research and development activities. “Growth in installed base” is a metric we use to measure the growth of revenue derived only from our existing customer base.
The growth in installed base metric consists of “net upgrades” minus defection “churn”. Net upgrades measure the incremental monthly recurring revenue from customer upgrades less downgrades as a percentage of total monthly recurring revenue. Churn measures the reduction of monthly revenue as a percentage of total monthly recurring revenue due to customer terminations. Terminations typically result from customers who (i) no longer need hosting services, (ii) are unable to pay for hosting services, (iii) decide to provide their services in-house, or (iv) switch to another hosting provider. For the year ended December 31, 2009, our average monthly growth in installed base was 0.2%.
31
Table of Contents
We measure net upgrades at the time a customer upgrades or downgrades services with us and we measure churn in the month we stop providing services to the customer. Net upgrades and churn are expressed as percentage increases (decreases) in the contractual monthly recurring fee associated with a service agreement for a given customer.
Our net revenue is denominated in U.S. dollars as well as other foreign currencies including the pound sterling, the euro, and Hong Kong dollars. Changes in related currency exchange rates may affect our net revenue. The decrease in net revenue, due to foreign currency fluctuations, was approximately $28 million, or 5% in 2009.
Nature of Our Operating Expenses
Our operating expense categories include cost of revenue, sales and marketing, general and administrative, and depreciation and amortization.
Employee related costs have historically been the primary driver of our operating expenses and we expect this trend to continue. Employee related costs include items such as wages, commissions, variable compensation, vacation, benefits, and share-based compensation. Employee variable compensation is dependent upon the financial results of the company, thus favorable changes in the financial results are partially offset by additional variable compensation expense and vice versa. We had 2,611 and 2,774 employees as of December 31, 2008 and 2009, respectively. The year-over-year increases were primarily attributable to increases in our customer and data center support teams. To maintain our service focus, our support teams have continued to grow with the growth of our business. Our headcount is expected to increase in 2010 as we continue to grow our business.
Cost of revenue primarily consists of employee related costs of our customer support teams and data center employees, as well as the costs to operate our data centers. The majority of our data center costs vary with the volume of services sold and include: power, bandwidth, and rent; costs associated with licenses; and costs related to maintenance and the replacement of IT equipment components. Our contracts with network operators for bandwidth capacity generally commit us to pay a monthly fee based on usage. Our data centers rely on local and regional utility companies as their primary source of power. We entered into a fixed-price power arrangement with the electricity provider of our Grapevine, Texas data center which expires in September 2011. We also entered into a fixed price contract for our Slough U.K. data center, which expires in May 2011. We enter into contracts with software providers that allow us to provide licenses to our customers. Our arrangements with these software vendors are typically one to three years in length and we generally pay a fixed fee per license.
Sales and marketing activities are directed toward both the acquisition of new customers and increasing our business with existing customers. We pay commissions to our sales representatives generally upon execution of a service agreement. Sales and marketing expense also includes compensation to our channel partners. Marketing expenditures are intended to communicate the advantages of our services and to generate customer demand. The majority of our marketing expenditures relate to lead generation through pay-per-click placements on major Internet search engines.
General and administrative activities are comprised of employee related costs, professional fees, general corporate costs and overhead. In 2008, we invested in our administrative infrastructure and personnel to support our continued growth and expenses related to becoming a publicly traded company, including increased audit and legal fees, costs of compliance with securities and other regulations, implementation costs for Sarbanes-Oxley certification and compliance with Section 404, investor relations expense, and higher insurance premiums. In late 2008 and continuing into 2009, we began to scale our administrative costs with a focus on operational excellence projects, process improvement initiatives and decreased discretionary spending.
Depreciation and amortization expense includes amortization of leasehold improvements associated with our data centers and corporate facilities, as well as depreciation of our data center infrastructure and equipment.
32
Table of Contents
Amortization expense is also comprised of the amortization of our customer based intangible assets related to acquisitions, internally developed technology, and software licenses purchased from third-party vendors.
Our operating expenses are denominated in U.S. dollars as well as other foreign currencies including the pound sterling, the euro, and Hong Kong dollar. Changes in related currency exchange rates may affect our operating results. The decrease in operating expenses, due to foreign currency fluctuations, was approximately $22 million, or 4%, in 2009.
Capital Expenditures
Our capital expenditures primarily relate to customer gear, data center infrastructure, corporate office build-outs, and internally developed software and other projects. Each category is defined below:
Customer gear—Includes servers, firewalls, load balancers, cabinets, switches, backup libraries, storage arrays and drives and network cabling.
Data center infrastructure—Includes generators, uninterruptible power supplies or UPS, power distribution units, mechanical and electrical plants, chillers, raised floor and other building improvements.
Corporate office build-outs—Includes demolition, raised floor, chillers, furniture and general building improvements.
Internally developed software and other—Includes salaries and payroll-related costs of employees and consultants who devote time to the development of certain internal-use software projects, and other projects that meet the criteria for capitalization.
In 2009, we expended cash or entered into lease arrangements for the purchase of customer gear of $108.8 million, data center infrastructure costs of $37.2 million, corporate office build-outs of $14.7 million and $25.0 million related to internally developed software and other capitalized projects. In 2010, we expect to have capital expenditures between $185 million and $235 million in the aggregate consisting of $140 million to $160 million for customer gear, $10 million to $20 million for data center infrastructure costs, $10 million to $20 million for office build-outs, and $25 million to $35 million for capitalized software and other projects.
Our data center infrastructure is built to accommodate future revenue growth. While we try to minimize the amount of excess capacity, we consider appropriate lead times for these build outs, which requires us to build capacity ahead of actual revenue growth. We also strive to align our investment in data center infrastructure with our revenue growth to keep utilization rates high. We measure our utilization rate as the power being consumed by all electrical equipment relative to the total available capacity in our data centers excluding portions of the data center that have not been placed on line. We pursue a modular build out strategy within our data centers that expands the operational footprint when needed. From time to time, we will be required to make significant investments in new data centers or enter into long-term facility leases to support expected growth beyond our ability to build out additional modules in existing facilities.
While many factors may influence our margins, in periods when we make large investments, margins may decrease. Such investments may be made in connection with data center and office expansion, as well as significant product and market development initiatives.
In February 2009 and July 2009, we entered into operating lease agreements with subsidiaries of DuPont Fabros Technology to lease approximately 11,000 and 36,700 square feet of technical square feet in a data center facility in the Northern Virginia area and the Chicago area, respectively. This current strategy of entering into operating lease agreements for data center space reduces the capital investments required to increase our data center square footage.
33
Table of Contents
Disciplined Use of Capital and Management of Profitability
We have achieved net income profitability since the first quarter of 2004 through focused management of capital and profitability. We use the Economic Value Added model (EVA®), which was developed by Stern Stewart & Co., as a tool to help ensure our growth and capital investments create stockholder value. Virtually all capital expenditures are evaluated against this metric using a standard cost of capital. EVA is calculated for our product offerings to evaluate our profitability.
We are also very careful with our facility and data center expansion practices. Currently, we sell to businesses in more than 120 countries. Unlike a colocation provider, we do not need to be located near our customers, allowing us to build or lease centralized, cost-optimized facilities with teams of highly-trained staff. We strive to locate our regional facilities and data centers in lower-cost locations, which reduces rent, power and labor costs. We also focus on either leasing or building sections of data centers in increments so that capital expenditures are more closely matched to revenue growth.
We have made significant investments in cloud computing. Over the last 3 years, we have made three acquisitions that have expanded our product set into cloud computing (cloud hosting and cloud applications). We will continue to identify and pursue strategic investments that have the potential to generate savings, enhance our competitive advantage, and increase our capabilities to serve customers.
Economies of Scale—We have achieved a critical mass that generates long term cost advantages. Like any service that moves from distributed to centralized production, scale is a factor in ensuring costs are low enough to drive mass adoption. We are able to generate significant cost advantages based on our large installed customer base and growth profile. We purchase large quantities of computing and data center assets, which allows us to negotiate higher volume pricing savings. We are also able to make larger R&D investments than many of our smaller competitors due to our ability to spread these costs across a larger base of revenue.
34
Table of Contents
Key Metrics
We carefully track several financial and operational metrics to monitor and control our growth, financial performance, and capacity. Our key metrics are structured around growth, profitability, capital efficiency, infrastructure capacity, and utilization. The following data should be read in conjunction with the consolidated financial statements, the notes to the financial statements and other financial information included in this Annual Report on Form 10-K.
| Year Ended | ||||||||||||
| (Dollar amounts in thousands, except annualized net revenue per average technical square foot) |
December 31, 2007 |
December 31, 2008 |
December 31, 2009 |
|||||||||
| Growth |
||||||||||||
| Managed hosting customers at period end |
15,454 | 18,480 | 19,304 | |||||||||
| Cloud customers at period end ** |
13,739 | 34,820 | 71,621 | |||||||||
| Number of customers at period end |
29,193 | 53,300 | 90,925 | |||||||||
| Managed hosting, net revenue |
$ | 356,519 | $ | 506,855 | $ | 572,606 | ||||||
| Cloud, net revenue |
$ | 5,498 | $ | 25,078 | $ | 56,381 | ||||||
| Net revenue |
$ | 362,017 | $ | 531,933 | $ | 628,987 | ||||||
| Revenue growth (year over year) |
61.6 | % | 46.9 | % | 18.2 | % | ||||||
| Net upgrades (monthly average) |
2.5 | % | 1.8 | % | 1.2 | % | ||||||
| Churn (monthly average) |
-0.9 | % | -1.2 | % | -1.0 | % | ||||||
| Growth in installed base (monthly average) * |
1.6 | % | 0.6 | % | 0.2 | % | ||||||
| Number of employees (Rackers) at period end |
2,021 | 2,611 | 2,774 | |||||||||
| Number of servers deployed at period end |
36,692 | 47,518 | 56,671 | |||||||||
| Profitability |
||||||||||||
| Income from operations |
$ | 30,609 | $ | 40,149 | $ | 55,241 | ||||||
| Depreciation and amortization |
$ | 56,476 | $ | 90,172 | $ | 125,229 | ||||||
| Share-based compensation expense |
||||||||||||
| Cost of revenue |
$ | 433 | $ | 2,465 | $ | 2,850 | ||||||
| Sales and marketing |
$ | 598 | $ | 2,141 | $ | 2,884 | ||||||
| General and administrative |
$ | 3,221 | $ | 10,411 | $ | 14,390 | ||||||
| Total share-based compensation expense |
$ | 4,252 | $ | 15,017 | $ | 20,124 | ||||||
| Adjusted EBITDA (1) |
$ | 91,337 | $ | 145,338 | $ | 200,594 | ||||||
| Adjusted EBITDA margin |
25.2 | % | 27.3 | % | 31.9 | % | ||||||
| Operating income margin |
8.5 | % | 7.5 | % | 8.8 | % | ||||||
| Income from operations |
$ | 30,609 | $ | 40,149 | $ | 55,241 | ||||||
| Effective tax rate |
35.9 | % | 33.6 | % | 35.1 | % | ||||||
| Net operating profit after tax (NOPAT) (1) |
$ | 19,620 | $ | 26,659 | $ | 35,851 | ||||||
| NOPAT margin |
5.4 | % | 5.0 | % | 5.7 | % | ||||||
| Capital efficiency and returns |
||||||||||||
| Interest bearing debt |
$ | 111,451 | $ | 300,413 | $ | 167,386 | ||||||
| Stockholders’ equity |
$ | 96,873 | $ | 269,684 | $ | 349,427 | ||||||
| Less: Excess cash |
$ | — | $ | (200,620 | ) | $ | (105,083 | ) | ||||
| Capital base |
$ | 208,324 | $ | 369,477 | $ | 411,730 | ||||||
| Average capital base |
$ | 144,783 | $ | 292,238 | $ | 390,472 | ||||||
| Capital turnover (annualized) |
2.50 | 1.82 | 1.61 | |||||||||
| Return on capital (annualized) (1) |
13.6 | % | 9.1 | % | 9.2 | % | ||||||
| Capital expenditures |
||||||||||||
| Purchases of property and equipment, net |
$ | 140,383 | $ | 165,396 | $ | 117,292 | ||||||
| Vendor financed equipment purchases |
$ | 44,149 | $ | 85,490 | $ | 68,382 | ||||||
| Total capital expenditures |
$ | 184,532 | $ | 250,886 | $ | 185,674 | ||||||
| Customer gear |
$ | 85,162 | $ | 105,606 | $ | 108,829 | ||||||
| Data center build outs |
$ | 38,239 | $ | 79,820 | $ | 37,208 | ||||||
| Office build outs |
$ | 35,383 | $ | 41,214 | $ | 14,672 | ||||||
| Capitalized software and other projects |
$ | 25,748 | $ | 24,246 | $ | 24,965 | ||||||
| Total capital expenditures |
$ | 184,532 | $ | 250,886 | $ | 185,674 | ||||||
| Infrastructure capacity and utilization |
||||||||||||
| Technical square feet of data center space at period end |
114,749 | 134,923 | 162,848 | |||||||||
| Annualized net revenue per average technical square foot |
$ | 3,604 | $ | 4,189 | $ | 3,929 | ||||||
| Utilization rate at period end |
60.9 | % | 70.4 | % | 65.3 | % | ||||||
| * | Due to rounding, totals may not equal the sum of the line items in the table above. |
| ** | Beginning in 2009, amounts include SaaS customers for Jungle Disk using a Rackspace storage solution. Jungle Disk customers using a third party storage solution are excluded. |
| (1) | See discussion and reconciliation of our Non-GAAP financial measures to the most comparable GAAP measures. |
35
Table of Contents
Executive Overview
To aid in understanding our operating results for the periods covered by this report, we have provided an executive overview and a summary of the significant events that affected the most recent fiscal year. These sections should be read in conjunction with the more detailed discussion and analysis of our financial condition and results of operations in Item 7, our “Risk Factors” section included in Item 1A of Part I, and our audited consolidated financial statements and notes included in Item 8 of Part II of this report.
We have focused on three areas in 2009, which include the continued growth of our business (albeit at lower rates than in the past primarily due to the recent economic conditions), scaling our profits and returns, and focusing on the minimal use of cash to achieve our growth.
Growth of Our Business. Our business has grown in 2009 with net revenue year over year growth of $97.1 million, or 18.3%, to $629.0 million compared to $531.9 million in 2008. Our increase in net revenue was primarily due to increased volume of services provided, due to both an increasing number of new customers and incremental services rendered to existing customers. Year-over-year revenue increases were 13.0% for our managed hosting service and 124.8% for our cloud computing service. Partially offsetting the revenue increase was the negative impact of a stronger U.S. dollar relative to the pound sterling. Net revenue in 2009 would have been approximately $28 million higher had the U.S. dollar to the pound sterling exchange rate remained constant from the prior year.
Our 2009 performance was the result of a combination of continued market demand for our hosting services as well as our focused execution on our growth strategy. As of December 31, 2009, we served over 90,000 customers running on over 56,600 servers within our data centers in the U.S., the U.K., and Hong Kong, which represented incremental increases in each category as compared to 2008. The recent economic downturn caused many of our customers to respond with reductions in their IT spending. As a result, we experienced fewer upgrades from our installed base customers that resulted in slower revenue growth when compared to previous years. However, during 2009, we experienced a monthly average churn rate of 1.0%, which slightly decreased from 1.2% for 2008. Overall, our installed base continued to provide a portion of our growth in 2009, growing at an average rate of 0.2% in 2009, compared to 0.6% in 2008 and 1.6% in 2007, respectively. In the fourth quarter of 2009, our churn rate was 0.8% and installed base growth was 0.4%.
Despite the current challenging economic environment, we believe there are fundamental aspects of our business that will allow us to differentiate from our competitors. Our hosting services provide customers with a mission critical service and world class support and we believe this provides us with substantial growth opportunities, even in a more constrained spending environment. We also believe that the investments in our portfolio of services and our ability to deliver a superior service outcome to our customers will lead to an increase in market share once the economy begins to recover.
Our revenue growth has moved us into a new competitive landscape where our direct competitors are much larger and stronger financially. We will be competing more directly with Amazon, Microsoft, IBM and Google as hosting services become increasingly more virtualized. Accordingly, we anticipate increased infrastructure investments to complement and leverage Fanatical Support®, our principal differentiation from our competitors across our multiple service lines.
Scaling Profits and Returns. During 2008 and continuing into 2009, we implemented a series of operational excellence initiatives and began to experience the benefit in 2009 with a reduction in each cost category on a percentage of revenue basis as compared to the previous year resulting in improved margins. Our initiatives focused on scaling expenses, and redirecting our spend to areas that would provide more value, particularly in the area of sales and marketing. In addition, initiatives were put into place to more efficiently deploy our capital.
Income from operations increased $15.1 million, or 37.7%, to $55.2 million in 2009, compared to $40.1 million in 2008. Operating income margin was 8.8% in 2009 as compared to 7.5% in 2008. Adjusted EBITDA
36
Table of Contents
increased $55.3 million, or 38.1%, to $200.6 million in 2009, compared to $145.3 million in 2008. In addition, Adjusted EBITDA as a percentage of revenue was 31.9% in 2009 compared to 27.3% in 2008. See the following section on non-GAAP financial measures for a discussion of Adjusted EBITDA. Net income was $30.2 million or $0.24 per share on a diluted basis in 2009, compared to net income of $21.7 million, or $0.19 per share on a diluted basis in 2008. Net income margin was 4.8% in 2009 as compared to 4.1% in 2008.
Use of Cash. For the year ended December 31, 2009, we generated adjusted free cash flow of $13.8 million. See below for our discussion of Non-GAAP Financial Measures.
During 2009, except for $150 million of repayments of our line of credit, we were able to maintain a consistent level of cash and cash equivalents while growing our business by maintaining our disciplined use of capital. Our capital expenditures for 2009 were $185.7 million of which $68.4 million was vendor financed, while our cash provided by operating activities was $196.9 million. In 2009, we deployed an additional 9,153 servers, bringing our total servers to 56,671, an increase of 19.3%. We also completed the build out of our Grapevine, Texas and data center and the second phase of our Slough, U.K. data center, in the first half of the year. As of December 31, 2009, we had $64.7 million in cash deposits and $60.7 million in money market funds.
We will continue to focus on these three areas in 2010. We expect to grow our business by broadening our portfolio of offerings in dedicated hosting and cloud computing, and we will continue to look at growth opportunities through acquisitions. We will continue our focus on expense management while improving our resource allocation to fund investment in strategic initiatives related to our data center expansion efforts and further growth in our portfolio of services, while striving to minimize our use of cash.
Company Highlights and Developments
Cloud Computing Offerings
We continue to invest in our cloud computing business and believe it is a critical part of our future success. Cloud computing, which consists of Cloud Hosting and Cloud Applications, continues to emerge as a new technology, with high adoption rates and investment, which is reflected in its high revenue growth rate. The primary benefit of cloud computing is the value proposition that it provides for businesses. It enables businesses to match costs directly to revenue to scale up and down on a real time basis as necessary. We do not believe that cloud computing will replace traditional dedicated hosting offerings, but rather complement them, allowing customers to choose from a portfolio of offerings to meet need their business needs.
During 2009, we released the specifications for our Cloud Servers and Cloud Files APIs under the Creative Commons 3.0 Attribution open source license and we launched Cloud Tools, which is an online service for sharing tools, applications and services built by our strategic partners and independent developers for The Rackspace Cloud, and Rackspace Archiving, which enables our hosted email customers to automatically keep a long-term backup of incoming and outgoing email.
In May 2009, we launched a new release of our business-class email hosting service. Rackspace hosts over 1.6 million mailboxes across its hosted email offerings, Rackspace Email and Microsoft Exchange.
In February 2010, we launched a beta version of Cloud Servers for Windows. This offering combines Microsoft technology with utility pricing and on-demand service, which will allow Windows users to deploy servers in minutes and pay only for what they use. This offering expands the number of potential customers for our Cloud offering.
Data Center Infrastructure and Growth
During 2009, we continued to add to our existing data center footprint both in the U.S. and internationally to support our growth. We added an approximate net 27,900 technical square feet of data center space.
In June 2009 and December 2009, we experienced service interruptions in a portion of our data center operations in Grapevine, Texas. As a result, certain customers experienced downtime and in the second and
37
Table of Contents
fourth quarters we extended approximately $2.4 million and $1.3 million, respectively, in service credits to them. We have been working to reduce the likelihood of further incidents at this data center and our other data centers throughout the world. While we have not experienced larger than normal customer attrition following these interruptions, the extent of any damage to our reputation is difficult to access.
Results of Operations
The following tables set forth our results of operations for the specified periods and as a percentage of our revenue for those periods. The period-to-period comparison of financial results is not necessarily indicative of future results.
Consolidated Statements of Income:
| Year Ended December 31, | ||||||||||||
| (In thousands) | 2007 | 2008 | 2009 | |||||||||
| Net revenue |
$ | 362,017 | $ | 531,933 | $ | 628,987 | ||||||
| Costs and expenses: |
||||||||||||
| Cost of revenue |
118,225 | 172,583 | 200,943 | |||||||||
| Sales and marketing |
53,930 | 80,323 | 79,458 | |||||||||
| General and administrative |
102,777 | 148,706 | 168,116 | |||||||||
| Depreciation and amortization |
56,476 | 90,172 | 125,229 | |||||||||
| Total costs and expenses |
331,408 | 491,784 | 573,746 | |||||||||
| Income from operations |
30,609 | 40,149 | 55,241 | |||||||||
| Other income (expense): |
||||||||||||
| Interest expense |
(3,643 | ) | (8,229 | ) | (8,950 | ) | ||||||
| Interest and other income (expense) |
828 | 768 | 255 | |||||||||
| Total other income (expense) |
(2,815 | ) | (7,461 | ) | (8,695 | ) | ||||||
| Income before income taxes |
27,794 | 32,688 | 46,546 | |||||||||
| Income taxes |
9,965 | 10,985 | 16,328 | |||||||||
| Net income |
$ | 17,829 | $ | 21,703 | $ | 30,218 | ||||||
Consolidated Statements of Income, as a Percentage of Net Revenue:
| Year Ended December 31, | |||||||||
| (Percent of net revenue) | 2007 | 2008 | 2009 | ||||||
| Net revenue |
100.0 | % | 100.0 | % | 100.0 | % | |||
| Costs and expenses: |
|||||||||
| Cost of revenue |
32.7 | % | 32.4 | % | 31.9 | % | |||
| Sales and marketing |
14.9 | % | 15.1 | % | 12.6 | % | |||
| General and administrative |
28.4 | % | 28.0 | % | 26.7 | % | |||
| Depreciation and amortization |
15.6 | % | 17.0 | % | 19.9 | % | |||
| Total costs and expenses |
91.5 | % | 92.5 | % | 91.2 | % | |||
| Income from operations |
8.5 | % | 7.5 | % | 8.8 | % | |||
| Other income (expense): |
|||||||||
| Interest expense |
-1.0 | % | -1.5 | % | -1.4 | % | |||
| Interest and other income (expense) |
0.2 | % | 0.1 | % | 0.0 | % | |||
| Total other income (expense) |
-0.8 | % | -1.4 | % | -1.4 | % | |||
| Income before income taxes |
7.7 | % | 6.1 | % | 7.4 | % | |||
| Income taxes |
2.8 | % | 2.1 | % | 2.6 | % | |||
| Net income |
4.9 | % | 4.1 | % | 4.8 | % | |||
Due to rounding, totals may not equal the sum of the line items in the table above.
38
Table of Contents
Years ended December 31, 2008 and December 31, 2009
Net Revenue
Our net revenue was $531.9 million during 2008 and $629.0 million during 2009, an increase of $97.1 million, or 18.3%. The increase in net revenue was primarily due to increased volume of services provided, due to both an increasing number of new customers and incremental services rendered to existing customers. Partially offsetting the revenue increase was the negative impact of a stronger U.S. dollar relative to the pound sterling in 2009 compared to 2008. Net revenue for 2009 would have been approximately $28 million higher had the U.S. dollar to the pound sterling exchange rate remained constant from the prior year with a minimal impact to our margins as the majority of these customers are invoiced, and substantially all of our expenses associated with these customers are paid, by us or our subsidiaries in the functional currency of our company or our subsidiaries, respectively.
Cost of Revenue
Our cost of revenue was $172.6 million during 2008 and $200.9 million during 2009, an increase of $28.3 million, or 16.4%. Of this increase, $12.8 million was attributable to an increase in salaries, benefits, and share-based compensation expense. Total compensation increased as a result of the hiring of data center and support personnel to support our growth. The cost increase was further attributable to an increase in data center costs of $6.8 million related to bandwidth, power and rent, and an increase in license costs of approximately $8.9 million. Included in the $6.8 million increase in bandwidth, power and rent is an increase of $2.3 million in rent expense primarily related to the data center operating leases entered into in Northern Virginia and the Chicago area. Impacting the $8.9 million increase in license costs was a $2.1 million decrease related to the reversal of a previously recorded obligation relating to an unresolved contractual issue with a vendor. During the fourth quarter of 2009, we concluded that the obligation was no longer probable, and accordingly, we reversed the liability, which reduced cost of revenue.
Sales and Marketing Expenses
Our sales and marketing expenses were $80.3 million during 2008 and $79.5 million during 2009, a decrease of $0.8 million, or 1.0%. The decrease was primarily attributable to a $7.1 million decrease to advertising and Internet-related marketing expenditures as a result of a concentrated effort to decrease marketing spend, with a focus on areas that generate more efficient growth opportunities. Partially offsetting the decrease was a $6.2 million increase in salaries, commissions, benefits, and share-based compensation expense. Total compensation increased as a result of the hiring of additional sales and marketing personnel and the impact of commissions associated with increased sales.
General and Administrative Expenses
Our general and administrative expenses were $148.7 million during 2008 and $168.1 million during 2009, an increase of $19.4 million, or 13.0%. Of this increase, $12.0 million was attributable to an increase in salaries and benefits, of which share-based compensation expense increased by $4.0 million in 2009 as a result of stock option and restricted stock unit grants to employees in previous years. Bad debt expense increased $3.4 million primarily due to customers generally extending payment terms or not being able to pay as a result of the recent economic conditions. Also contributing to the increase in bad debt expense was a larger accounts receivable balance in conjunction with the 18.3% increase in revenue from 2008 to 2009.
Depreciation and Amortization Expense
Our depreciation and amortization expense was $90.2 million during 2008 and $125.2 million during 2009, an increase of $35.0 million, or 38.8%. This increase in depreciation and amortization expense was a direct result of an increase in property and equipment related to depreciable assets including increases in data center equipment and
39
Table of Contents
leasehold improvements due to data center build outs (primarily the expansion of our data center in Grapevine, Texas and the opening, as well as expansion, of the data center in Slough, U.K.) and internally developed and purchased software, as well as intangible assets acquired through acquisitions.
Other Income (Expense)
Our interest expense was $8.2 million during 2008 and $9.0 million during 2009, an increase of $0.8 million or 9.8%. This increase was primarily due to the increased level of indebtedness (including capital leases), which was mostly offset by decreased borrowing rates. Interest expense was partially offset by capitalized interest of $2.7 million during 2008 and $0.8 million during 2009.
Interest and other income (expense) was $0.8 million during 2008 and $0.3 million during 2009. In 2008, we recognized $1.4 million in interest income, partially offset by foreign currency losses of $0.6 million. In 2009, we recognized $0.4 million of interest and other income, partially offset by foreign currency losses of $0.2 million.
Income Taxes
Our effective tax rate increased from 33.6% for 2008 to 35.1% for 2009. The increase in the overall tax rate from 2008 to 2009 was primarily the result of a larger benefit recognized in 2008 with respect to the Research and Development credit. The differences between our effective tax rate and the U.S. federal statutory rate of 35% principally result from our geographical distribution of taxable income, research and development credits, and permanent differences between the book and tax treatment of certain items. Our foreign earnings are generally taxed at lower rates than in the United States.
For a full reconciliation of our effective tax rate to the U.S. federal statutory rate of 35% and further explanation of our provision for taxes, see Item 8 of Part II, “Financial Statements and Supplementary Data— Note 18—Income Taxes.”
Years ended December 31, 2007 and December 31, 2008
Net Revenue
Our net revenue was $362.0 million during 2007 and $531.9 million during 2008, an increase of $169.9 million, or 46.9%. The increase in net revenue was primarily due to increased volume of services provided, due to both an increasing number of customers and incremental services rendered to existing customers. Revenue from our acquisitions was not significant.
Cost of Revenue
Our cost of revenue was $118.2 million during 2007 and $172.6 million during 2008, an increase of $54.4 million, or 46.0%. Of this increase, $26.7 million was attributable to an increase in salaries, benefits, and share-based compensation expense. The cost increase was further attributable to an increase in license costs of approximately $12.8 million, an increase in data center costs of $9.6 million related to bandwidth, power, and rent, as well as maintenance and the replacement of IT equipment parts in the amount of $5.2 million.
Sales and Marketing Expenses
Our sales and marketing expenses were $53.9 million during 2007 and $80.3 million during 2008, an increase of $26.4 million, or 49.0%. Of this increase, $13.9 million was primarily attributable to an increase in salaries, commissions, benefits, and share-based compensation expense. Total compensation increased as a result of the hiring of additional sales and marketing personnel and the impact of commissions associated with
40
Table of Contents
increased sales. An additional $12.5 million of this increase was primarily attributable to advertising, Internet-related marketing expenditures and partnership programs to support revenue growth for new and existing customer accounts.
General and Administrative Expenses
Our general and administrative expenses were $102.8 million during 2007 and $148.7 million during 2008, an increase of $45.9 million, or 44.6%. Of this increase, $33.1 million was attributable to an increase in salaries and benefits, of which share-based compensation expense increased from $3.2 million 2007 to $10.4 million in 2008 as a result of broad based stock option grants to employees in 2008. Our general overhead expenses increased approximately $4.0 million as a result of higher general corporate costs due to additional headcount. In addition, we experienced an increase in professional fees of $2.2 million and credit card fees of $1.4 million, as well as costs related to our overall growth, including property taxes, insurance and increased office rents of $5.2 million.
Depreciation and Amortization Expense
Our depreciation and amortization expense was $56.5 million during 2007 and $90.2 million during 2008, an increase of $33.7 million, or 59.6%. This increase in depreciation and amortization expense was a direct result of an increase in property and equipment related to depreciable assets, as well as intangible assets acquired in an acquisition.
Other Income (Expense)
Our interest expense was $3.6 million during 2007 and $8.2 million during 2008, an increase of $4.6 million or 127.8%. This relative increase was primarily due to the increased level of indebtedness partially offset by an increase in capitalized interest. We capitalized interest of $1.0 million during 2007 and $2.7 million during 2008, an increase of $1.7 million primarily due to data center and office build outs.
Interest and other income (expense) was $0.8 million during 2007 and $0.8 million during 2008. In 2008, we recognized $1.4 million in interest income, partially offset with foreign currency losses of $0.6 million due to the appreciation of the U.S. dollar against the pound sterling. In 2007, we recognized $0.8 million of interest income and minimal foreign currency gains or losses.
Income Taxes
Our effective tax rate decreased from 35.9% during 2007 to 33.6% during 2008, primarily a result of earnings in 2008 being realized in countries where we have lower statutory rates than in the previous year and research and development credits utilized by our U.S. subsidiaries in 2008. The differences between our effective tax rate and the U.S. federal statutory rate of 35% principally result from our geographical distribution of taxable income, the research and development credits, and permanent differences between the book and tax treatment of certain items. Our foreign earnings are generally taxed at lower rates than in the United States.
Quarterly Key Metrics and Results of Operations
The following tables set forth our unaudited quarterly key metrics and condensed consolidated statement of operations data in dollars and as a percentage of revenue for each of our most recent five quarters as of the period ended December 31, 2009. The quarterly data presented below has been prepared on a basis consistent with the audited consolidated financial statements included elsewhere in this document, and in the opinion of management reflect all adjustments, consisting only of normal recurring adjustments, necessary for a fair presentation of this information. You should read this information together with our consolidated financial statements and related notes included elsewhere in this document. Our quarterly results of operations may
41
Table of Contents
fluctuate in the future due to a variety of factors. As a result, comparing our operating results on a period-to-period basis may not be meaningful. Our results for these quarterly periods are not necessarily indicative of the results of operations for a full year or any period.
| Three Months Ended | ||||||||||||||||||||
| (Unaudited) | ||||||||||||||||||||
| (Dollar amounts in thousands, except annualized net revenue per average technical square foot) |
December 31, 2008 |
March 31, 2009 |
June 30, 2009 |
September 30, 2009 |
December 31, 2009 |
|||||||||||||||
| Growth |
||||||||||||||||||||
| Managed hosting customers at period end |
18,480 | 19,048 | 19,363 | 19,328 | 19,304 | |||||||||||||||
| Cloud customers at period end ** |
34,820 | 43,030 | 51,440 | 61,616 | 71,621 | |||||||||||||||
| Number of customers at period end |
53,300 | 62,078 | 70,803 | 80,944 | 90,925 | |||||||||||||||
| Managed hosting, net revenue |
$ | 134,275 | $ | 134,204 | $ | 138,943 | $ | 147,065 | $ | 152,394 | ||||||||||
| Cloud, net revenue |
$ | 8,862 | $ | 10,873 | $ | 13,052 | $ | 15,334 | $ | 17,122 | ||||||||||
| Net revenue |
$ | 143,137 | $ | 145,077 | $ | 151,995 | $ | 162,399 | $ | 169,516 | ||||||||||
| Revenue growth (year over year) |
34.2 | % | 21.3 | % | 16.2 | % | 17.4 | % | 18.4 | % | ||||||||||
| Net upgrades (monthly average) |
1.4 | % | 0.9 | % | 1.2 | % | 1.2 | % | 1.3 | % | ||||||||||
| Churn (monthly average) |
-1.3 | % | -1.1 | % | -1.0 | % | -1.1 | % | -0.8 | % | ||||||||||
| Growth in installed base (monthly average) * |
0.1 | % | -0.2 | % | 0.2 | % | 0.1 | % | 0.4 | % | ||||||||||
| Number of employees (Rackers) at period end |
2,611 | 2,661 | 2,648 | 2,730 | 2,774 | |||||||||||||||
| Number of servers deployed at period end |
47,518 | 50,038 | 52,269 | 54,655 | 56,671 | |||||||||||||||
| Profitability |
||||||||||||||||||||
| Income from operations |
$ | 12,125 | $ | 13,021 | $ | 13,403 | $ | 13,128 | $ | 15,689 | ||||||||||
| Depreciation and amortization |
$ | 26,310 | $ | 27,804 | $ | 29,711 | $ | 32,696 | $ | 35,018 | ||||||||||
| Share-based compensation expense |
||||||||||||||||||||
| Cost of revenue |
$ | 678 | $ | 629 | $ | 675 | $ | 778 | $ | 768 | ||||||||||
| Sales and marketing |
$ | 595 | $ | 698 | $ | 721 | $ | 826 | $ | 639 | ||||||||||
| General and administrative |
$ | 2,871 | $ | 2,910 | $ | 3,621 | $ | 4,008 | $ | 3,851 | ||||||||||
| Total share-based compensation expense |
$ | 4,144 | $ | 4,237 | $ | 5,017 | $ | 5,612 | $ | 5,258 | ||||||||||
| Adjusted EBITDA (1) |
$ | 42,579 | $ | 45,062 | $ | 48,131 | $ | 51,436 | $ | 55,965 | ||||||||||
| Adjusted EBITDA margin |
29.7 | % | 31.1 | % | 31.7 | % | 31.7 | % | 33.0 | % | ||||||||||
| Operating income margin |
8.5 | % | 9.0 | % | 8.8 | % | 8.1 | % | 9.3 | % | ||||||||||
| Income from operations |
$ | 12,125 | $ | 13,021 | $ | 13,403 | $ | 13,128 | $ | 15,689 | ||||||||||
| Effective tax rate |
27.7 | % | 36.6 | % | 36.2 | % | 33.9 | % | 34.0 | % | ||||||||||
| Net operating profit after tax (NOPAT) (1) |
$ | 8,766 | $ | 8,255 | $ | 8,551 | $ | 8,678 | $ | 10,355 | ||||||||||
| NOPAT margin |
6.1 | % | 5.7 | % | 5.6 | % | 5.3 | % | 6.1 | % | ||||||||||
| Capital efficiency and returns |
||||||||||||||||||||
| Interest bearing debt |
$ | 300,413 | $ | 201,507 | $ | 210,284 | $ | 167,976 | $ | 167,386 | ||||||||||
| Stockholders’ equity |
$ | 269,684 | $ | 282,880 | $ | 308,823 | $ | 330,392 | $ | 349,427 | ||||||||||
| Less: Excess cash |
$ | (200,620 | ) | $ | (117,611 | ) | $ | (129,638 | ) | $ | (83,462 | ) | $ | (105,083 | ) | |||||
| Capital base |
$ | 369,477 | $ | 366,776 | $ | 389,469 | $ | 414,906 | $ | 411,730 | ||||||||||
| Average capital base |
$ | 350,499 | $ | 368,127 | $ | 378,123 | $ | 402,188 | $ | 413,318 | ||||||||||
| Capital turnover (annualized) |
1.63 | 1.58 | 1.61 | 1.62 | 1.64 | |||||||||||||||
| Return on capital (annualized) (1) |
10.0 | % | 9.0 | % | 9.0 | % | 8.6 | % | 10.0 | % | ||||||||||
| Capital expenditures |
||||||||||||||||||||
| Purchases of property and equipment, net |
$ | 32,547 | $ | 25,589 | $ | 31,027 | $ | 26,024 | $ | 34,652 | ||||||||||
| Vendor financed equipment purchases |
$ | 14,848 | $ | 11,683 | $ | 23,637 | $ | 20,664 | $ | 12,398 | ||||||||||
| Total capital expenditures |
$ | 47,395 | $ | 37,272 | $ | 54,664 | $ | 46,688 | $ | 47,050 | ||||||||||
| Customer gear |
$ | 23,073 | $ | 19,255 | $ | 32,448 | $ | 28,705 | $ | 28,421 | ||||||||||
| Data center build outs |
$ | 14,240 | $ | 11,386 | $ | 13,914 | $ | 4,028 | $ | 7,880 | ||||||||||
| Office build outs |
$ | 8,340 | $ | 2,239 | $ | 1,651 | $ | 5,432 | $ | 5,350 | ||||||||||
| Capitalized software and other projects |
$ | 1,742 | $ | 4,392 | $ | 6,651 | $ | 8,523 | $ | 5,399 | ||||||||||
| Total capital expenditures |
$ | 47,395 | $ | 37,272 | $ | 54,664 | $ | 46,688 | $ | 47,050 | ||||||||||
| Infrastructure capacity and utilization |
||||||||||||||||||||
| Technical square feet of data center space at period end *** |
134,923 | 157,523 | 177,371 | 167,821 | 162,848 | |||||||||||||||
| Annualized net revenue per average technical square foot |
$ | 4,212 | $ | 3,969 | $ | 3,631 | $ | 3,764 | $ | 4,101 | ||||||||||
| Utilization rate at period end |
70.4 | % | 64.6 | % | 59.8 | % | 62.3 | % | 65.3 | % | ||||||||||
| * | Due to rounding, totals may not equal the sum of the line items in the table above. |
| ** | Beginning March 31, 2009, amounts include SaaS customers for Jungle Disk using a Rackspace storage solution. Jungle Disk customers using a third party storage solution are excluded. |
| *** | The technical square feet in the second half of 2009 was impacted by the decommissioning of operations at U.K. data centers that were migrated to the Slough data center. |
| (1) | See discussion and reconciliation of our Non-GAAP financial measures to the most comparable GAAP measures. |
42
Table of Contents
Consolidated Statements of Income by Quarter:
| Three Months Ended | ||||||||||||||||||||
| (In thousands) | December 31, 2008 |
March 31, 2009 |
June 30, 2009 |
September 30, 2009 |
December 31, 2009 |
|||||||||||||||
| Unaudited | ||||||||||||||||||||
| Net revenue |
$ | 143,137 | $ | 145,077 | $ | 151,995 | $ | 162,399 | $ | 169,516 | ||||||||||
| Costs and expenses: |
||||||||||||||||||||
| Cost of revenue |
45,019 | 46,210 | 48,235 | 53,093 | 53,405 | |||||||||||||||
| Sales and marketing |
21,447 | 20,502 | 19,080 | 19,860 | 20,016 | |||||||||||||||
| General and administrative |
38,236 | 37,540 | 41,566 | 43,622 | 45,388 | |||||||||||||||
| Depreciation and amortization |
26,310 | 27,804 | 29,711 | 32,696 | 35,018 | |||||||||||||||
| Total costs and expenses |
131,012 | 132,056 | 138,592 | 149,271 | 153,827 | |||||||||||||||
| Income from operations |
12,125 | 13,021 | 13,403 | 13,128 | 15,689 | |||||||||||||||
| Other income (expense): |
||||||||||||||||||||
| Interest expense |
(3,153 | ) | (2,535 | ) | (2,172 | ) | (2,147 | ) | (2,096 | ) | ||||||||||
| Interest and other income (expense) |
492 | (91 | ) | (267 | ) | 523 | 90 | |||||||||||||
| Total other income (expense) |
(2,661 | ) | (2,626 | ) | (2,439 | ) | (1,624 | ) | (2,006 | ) | ||||||||||
| Income before income taxes |
9,464 | 10,395 | 10,964 | 11,504 | 13,683 | |||||||||||||||
| Income taxes |
2,620 | 3,807 | 3,973 | 3,900 | 4,648 | |||||||||||||||
| Net income |
$ | 6,844 | $ | 6,588 | $ | 6,991 | $ | 7,604 | $ | 9,035 | ||||||||||
Consolidated Statements of Income by Quarter, as a Percentage of Net Revenue:
| Three Months Ended | |||||||||||||||
| (Percent of net revenue) | December 31, 2008 |
March 31, 2009 |
June 30, 2009 |
September 30, 2009 |
December 31, 2009 |
||||||||||
| Unaudited | |||||||||||||||
| Net revenue |
100.0 | % | 100.0 | % | 100.0 | % | 100.0 | % | 100.0 | % | |||||
| Costs and expenses: |
|||||||||||||||
| Cost of revenue |
31.5 | % | 31.9 | % | 31.7 | % | 32.7 | % | 31.5 | % | |||||
| Sales and marketing |
15.0 | % | 14.1 | % | 12.6 | % | 12.2 | % | 11.8 | % | |||||
| General and administrative |
26.7 | % | 25.9 | % | 27.3 | % | 26.9 | % | 26.8 | % | |||||
| Depreciation and amortization |
18.4 | % | 19.2 | % | 19.5 | % | 20.1 | % | 20.7 | % | |||||
| Total costs and expenses |
91.5 | % | 91.0 | % | 91.2 | % | 91.9 | % | 90.7 | % | |||||
| Income from operations |
8.5 | % | 9.0 | % | 8.8 | % | 8.1 | % | 9.3 | % | |||||
| Other income (expense): |
|||||||||||||||
| Interest expense |
-2.2 | % | -1.7 | % | -1.4 | % | -1.3 | % | -1.2 | % | |||||
| Interest and other income (expense) |
0.3 | % | -0.1 | % | -0.2 | % | 0.3 | % | 0.1 | % | |||||
| Total other income (expense) |
-1.9 | % | -1.8 | % | -1.6 | % | -1.0 | % | -1.2 | % | |||||
| Income before income taxes |
6.6 | % | 7.2 | % | 7.2 | % | 7.1 | % | 8.1 | % | |||||
| Income taxes |
1.8 | % | 2.6 | % | 2.6 | % | 2.4 | % | 2.7 | % | |||||
| Net income |
4.8 | % | 4.5 | % | 4.6 | % | 4.7 | % | 5.3 | % | |||||
Due to rounding, totals may not equal the sum of the line items in the table above.
43
Table of Contents
Fourth Quarter 2009 Overview
Revenue increased sequentially in each of the quarters presented due to increased sales of our services to new and existing customers. Net revenue for the three-month period ended December 31, 2009 was $169.5 million, up 18.4% from $143.1 million in the three-month period ended December 31, 2008. Throughout 2009, the growth rate was negatively impacted by the economic conditions and decreased IT spending by our customers. In the three months ended March 31, 2009 and December 31, 2009, the growth rate was negatively impacted by the strengthening U.S. dollar versus the pound sterling. For the three months ended June 30, 2009 and September 30, 2009 we experienced a favorable impact by a weakening U.S. dollar versus the pound sterling. For the twelve month period ended December 31, 2009, our average monthly growth in installed base was 0.2% per month.
Because of the growth of our revenue, total operating expenses increased sequentially in each of the quarters presented; however, most operating expense categories were relatively flat as a percentage of revenue. During the second half of 2008 and continuing into 2009 we focused on scaling our expenditures, which is evidenced in the reduction in sales and marketing expenses as a percentage of revenue. Sales and marketing continued to scale through 2009 as we identified more efficient use of our sales resources. These reductions were partially offset by increasing depreciation and amortization expense resulting from equipment expenditures and facility additions to support our customer growth. Rackspace completed strategic build outs during this time period including the completion of the third phase of our Grapevine, Texas data center in January 2009, the second phase of our Slough U.K. data center in June 2009, and the addition of new data centers in Northern Virginia and the Chicago area, as well as capital expenditures related to the build out of the corporate facility.
During the fourth quarter of 2009, we recognized an increase in income from operations as compared to the previous quarter. Our operating income margin increased from 8.1% in third quarter 2009, to 9.3% in the fourth quarter 2009 and increased sequentially in each of the quarters presented. This change was, in a large part, due to the growth in revenue and decrease in operating expenses as a percentage of revenue, which was attributable to our efforts to better manage expenses. In addition, we previously recorded a $2.1 million charge to cost of revenue related to an unresolved contractual issue with a vendor. During 2009, we concluded that the obligation was no longer probable, and accordingly, during the fourth quarter of 2009 we reversed the liability, which reduced cost of revenue. Due to the lapsing of the associated contractual period, we believe the contingency has been resolved.
Also during the fourth quarter of 2009, our churn was 0.8%, which is our lowest level of churn since the fourth quarter of 2007. Installed base growth was 0.4% and bad debt expense was $436 thousand, a decrease of $1.8 million from the previous quarter.
Liquidity and Capital Resources
At December 31, 2009, we held $125.4 million in cash and cash equivalents. We use our cash and cash equivalents, cash flow from operations, capital leases, and existing amounts available under our revolving credit facility as our primary sources of liquidity. We believe that internally generated cash flows, along with cash and cash equivalents currently available to us are generally sufficient to support business operations, capital expenditures, and management’s strategic initiatives.
In June 2009, we amended our revolving credit facility agreement to provide us the ability to borrow from our credit facility in pounds sterling and euros, rather than restricting borrowings to U.S. dollars. We are limited to borrowings of $75 million in alternate currencies. The option to borrow in other foreign currencies provides some protection against fluctuations in currencies in the countries in which we do business. The credit facility also has financial covenants that include a minimum fixed charge coverage ratio of at least 1.25 to 1.00 until the three months ended December 31, 2009 and 1.50 to 1.00 for every quarter thereafter and a maximum funded debt to EBITDA of not greater than 3.00 to 1.00. Also, our foreign cash balance is limited to a balance of $25 million. As of December 31, 2009, we were in compliance with all of the covenants under our facility.
44
Table of Contents
We maintain debt levels that we establish through consideration of a number of factors, including cash flow expectations, cash requirements for operations, investment plans (including acquisitions), and our overall cost of capital. Outstanding debt under our line of credit decreased from $200.0 million as of December 31, 2008 to $50.0 million at December 31, 2009. The decrease in amounts outstanding under our line of credit was due to the repayment of $150.0 million in 2009. As of December 31, 2009, we had an additional $194.3 million available for future borrowings. Our credit facility expires in August 2012.
We have vendor finance arrangements in the form of leases and notes payable with our major vendors that permit us to finance our purchases of data center equipment. As of December 31, 2008 and 2009 we had $100.4 million and $117.4 million outstanding with respect to these arrangements. We believe our borrowings from these arrangements will continue to be available, and as long as they are competitive, we most likely will continue to finance purchases through these arrangements.
Capital Expenditure Requirements
In 2010, we expect to have capital expenditures between $185 million and $235 million in the aggregate consisting of $140 million to $160 million for customer gear, $10 million to $20 million for data center infrastructure costs, $10 million to $20 million for office build-outs, and $25 million to $35 million for capitalized software and other projects.
Our available cash and cash equivalents are held in bank deposits, overnight sweep accounts, and money market funds. Our money market mutual funds invest exclusively in high-quality, short-term securities that are issued or guaranteed by the U.S. government or by U.S. government agencies. We actively monitor the third-party depository institutions that hold our cash and cash equivalents. Our emphasis is primarily on safety of principal while secondarily maximizing yield on those funds. The balances may exceed the Federal Deposit Insurance Corporation or “FDIC” insurance limits or are not insured by the FDIC. While we monitor the balances in our accounts and adjust the balances as appropriate, these balances could be impacted if the underlying depository institutions fail or could be subject to other adverse conditions in the financial markets. To date, we have experienced no loss or lack of access to our invested cash and cash equivalents; however, we can provide no assurances that access to our funds will not be impacted by adverse conditions in the financial markets.
We currently believe that current cash and cash equivalents, cash generated by operations, as well as available borrowings through vendor financing arrangements and our credit facility will be sufficient to meet our operating and capital needs in the foreseeable future. Our long-term future capital requirements will depend on many factors, most importantly our growth of revenue, and our investments in new technologies and services. Our ability to generate cash depends on our financial performance, general economic conditions, technology trends and developments, and other factors. We could be required, or could elect, to seek additional funding in the form of debt or equity.
The following table sets forth a summary of our cash flows for the periods indicated:
| Years Ended December 31, | ||||||||||||
| (In thousands) | 2007 | 2008 | 2009 | |||||||||
| Cash provided by operating activities |
$ | 104,935 | $ | 136,582 | $ | 196,868 | ||||||
| Cash used in investing activities |
$ | (140,721 | ) | $ | (175,135 | ) | $ | (124,114 | ) | |||
| Cash provided by (used in) financing activities |
$ | 52,379 | $ | 255,413 | $ | (187,287 | ) | |||||
| Acquisition of property and equipment by capital leases and equipment notes payable |
$ | 44,149 | $ | 85,490 | $ | 68,382 | ||||||
45
Table of Contents
Operating Activities
Net cash provided by operating activities is primarily a function of our profitability, the amount of non-cash charges included in our profitability, and our working capital management. Net cash provided by operating activities was $136.6 million in 2008 compared to $196.9 million in 2009, an increase of $60.3 million, or 44.1%. Net income increased from $21.7 million in 2008 to $30.2 million in 2009. A summary of the significant changes in non-cash adjustments affecting net income and changes in assets and liabilities impacting operating cash flows is as follows:
| • | Depreciation and amortization expense was $90.2 million in 2008 compared to $125.2 million in 2009. The increase in depreciation and amortization was due to the purchases of servers, networking gear and computer software (internally developed technology), electrical equipment, and leasehold improvements primarily for data center expansion, as well as amortization of intangibles related to acquisitions. |
| • | Our provision for bad debts and customer credits increased from $4.1 million in 2008 to $10.3 million in 2009 primarily due to certain customers’ inability to pay as a result of the economic conditions throughout 2009 and increased service credits. |
| • | Share-based compensation expense was $15.0 million in 2008 compared to $20.1 million in 2009. The increase in expense was due to stock options and restricted stock units granted in 2008 and 2009. |
| • | The change in accounts receivable was a cash outflow of $12.2 million in 2008 compared to a cash outflow of $17.1 million in 2009. Our accounts receivable balance has increased during 2009 as a result of increased sales and slower customer payment patterns that are being influenced by the economic conditions throughout 2009. |
| • | The change in income taxes receivable was a cash outflow of $12.3 million in 2008 compared to a cash inflow of $4.8 million in 2009. As we anticipated a net loss on a tax basis in 2008, the December 31, 2008 balance sheet included an income tax receivable for a carryback claim for our loss. We received federal income tax refunds totaling $10.1 million in 2009, related to the 2008 tax period. |
| • | The change in accounts payable and accrued expenses was a cash inflow of $13.4 million in 2008 compared to a cash inflow of $14.6 million in 2009. The change resulted from the timing of payments for trade payables. |
| • | The change in deferred revenue was a cash inflow of $1.9 million in 2008 compared to a cash outflow of $1.2 million in 2009. The change is primarily due to the company billing fewer customers for setup fees as well as fewer customers prepaying for their services. |
Net cash provided by operating activities was $104.9 million in 2007 compared to $136.6 million in 2008, an increase of $31.7 million or 30.2%. Net income increased from $17.8 million in 2007 to $21.7 million in 2008.
During 2007 and 2008, we incurred depreciation and amortization charges in the amount of $56.5 million and $90.2 million, respectively. The increase in depreciation and amortization was due to the acquisition of servers, networking gear and computer software. We further incurred non-cash compensation expense in the amount of $4.4 million and $15.3 million in 2007 and 2008, respectively. The increase was mainly due to share-based compensation from stock option grants to certain strategic hires and employees, and increased fair values for granted stock options.
Our changes in certain assets and liabilities in 2008 compared to 2007 primarily consisted of the recognition of a $12.3 million income tax receivable in 2008 resulting from accelerated tax depreciation and research and development credits and cash inflows from accounts payable and accrued expenses. Cash inflows from accounts payable and accrued expenses were $39.2 million in 2007 compared to $13.4 million in 2008. The increases in accounts payable and accrued expenses are a direct result of the growth of our business, increases in headcount and timing of payments.
46
Table of Contents
Investing Activities
Net cash used in investing activities was primarily expenditures to meet the demands of our growing customer base. Historically our main investing activities have consisted of purchases of IT equipment for our data center infrastructure, furniture, equipment and leasehold improvements to support our operations.
Our net cash used in investing activities was $175.1 million during 2008 compared to $124.1 million during 2009, a decrease of $51.0 million, or 29.1%. This decrease in net cash used in investing activities comes from a decrease in the purchase of property and equipment of $48.1 million, and a $2.9 million decrease related to acquisitions. Cash outflows from earnout payments in 2009 relate to acquisitions that occurred in 2008.
The combined total of capital expenditures for property and equipment, net decreased from $250.9 million during 2008 to $185.7 million in 2009. Of the 2009 amount, $108.8 million was used to purchase dedicated customer equipment, $37.2 million for data center build outs, $14.7 million related to build out of office space and $25.0 million was invested in capitalized software, including internally developed software that is focused on improving our service offerings, and other purchases. Of the dedicated customer equipment, $68.4 million was vendor financed by capital leases and notes payable in 2009 compared to $85.5 million in 2008.
The decrease in capital expenditures from 2008 to 2009 was primarily comprised of decreases in spending on data center build outs and build outs of office space. The decrease in data center build outs was the result of capital expenditures made in 2008 for the completion of the last phase of the Grapevine, Texas data center that was completed in January 2009. Additionally, in 2009 we entered into leases for approximately 47,700 technical square feet in data center facilities in Northern Virginia and the Chicago area. The decrease in build outs of office space was the result of lower spending on our headquarters facility in 2009 as compared to 2008.
Our net cash used in investing activities was $140.7 million during 2007 compared to $175.1 million during 2008, an increase of $34.4 million, or 24.5%. This increase in net cash used in investing activities comes from an increase in the purchase of property and equipment of $25.0 million. The remaining increase of $9.4 million was related to the acquisition of Jungle Disk and Slicehost.
The combined total of capital expenditures for property and equipment, net increased from $184.5 million during 2007 to $250.9 million in 2008 to support our growth including an increase in customer gear of $20.4 million and data center build outs of $41.6 million. Of the 2008 amount, $105.6 million was used to purchase dedicated customer equipment, $79.8 million for data center build outs, $41.2 million related to build out of office space and $24.2 million was invested in capitalized software, including internally developed software that is focused on improving our service offerings, and other purchases. Of the dedicated customer equipment, $85.5 million was vendor financed by capital leases and notes payable in 2008 compared to $44.1 million during 2007.
Financing Activities
Net cash provided by (used in) financing activities was $255.4 million during 2008 compared to $(187.3) million during 2009, a change of $442.7 million. This change was due primarily to $144.6 million of funds received from the completion of our initial public offering in August 2008 plus net advances from our revolving line of credit of $142.7 million during 2008 compared to net payments of $150.0 million to our revolving line of credit during 2009. Our net leverage as of December 31, 2009 was 0.21 times. See below for our discussion of Non-GAAP Financial Measures.
Net cash provided by financing activities was $52.4 million during 2007 compared to $255.4 million during 2008, an increase of $203.0 million or 387.4%. This increase was due primarily to $144.6 million of funds received from the completion of our initial public offering plus net advances from our revolving line of credit of $142.7 million 2008 compared to net advances of $56.1 million from our revolving line of credit during 2007. Partially offsetting the cash inflows were principal payments related to capital leases and notes payable in the amounts of $17.8 million during 2007 and $39.2 million during 2008.
47
Table of Contents
Contractual Obligations, Commitments and Contingencies
The following table summarizes our contractual obligations as of December 31, 2009:
| (In thousands) | Total | 2010 | 2011-2012 | 2013-2014 | 2015 and Beyond | ||||||||||
| (Unaudited) | |||||||||||||||
| Capital leases (1) |
$ | 117,142 | $ | 52,698 | $ | 61,949 | $ | 2,495 | $ | — | |||||
| Operating leases |
235,358 | 16,585 | 38,387 | 35,245 | 145,141 | ||||||||||
| Purchase commitments |
14,794 | 13,519 | 1,275 | — | — | ||||||||||
| Revolving credit facility (2) |
50,000 | — | 50,000 | — | — | ||||||||||
| Software and equipment notes (2) |
7,684 | 4,893 | 2,791 | — | — | ||||||||||
| Total contractual obligations |
$ | 424,978 | $ | 87,695 | $ | 154,402 | $ | 37,740 | $ | 145,141 | |||||
| (1) | Represents principal and interest. |
| (2) | Represents principal only. |
Leases
Capital leases are primarily related to expenditures for IT equipment. Our operating leases are primarily for office space and data center facilities.
In February 2009, Rackspace entered into an agreement to lease 11,000 technical square feet in a data center facility located in Northern Virginia. The lease has a term of 15 years from the commencement date and a total estimated financial obligation of approximately $75 to $80 million over the 15 year term, inclusive of base lease payments, power costs and Rackspace’s pro-rata share of operating expenses. Rackspace has a one-time option to terminate the lease after ten years.
In July 2009, Rackspace entered into an agreement to lease approximately 36,700 square feet of raised floor space and approximately 10,000 square feet of office and storage space in a data center facility located in the Chicago area. The lease has a term of 15 years from the commencement date and a total financial obligation of approximately $140 million to $150 million over the 15 year term, inclusive of base lease payments and Rackspace’s pro-rata share of operating expenses. Upon expiration of the 15 year term, Rackspace has the option to renew the lease for two successive five year periods.
Purchase Commitments
Our purchase commitments are primarily related to costs associated with our data centers including bandwidth and consulting services.
Revolving Credit Facility
We entered into our credit facility in March 2007. In February 2008, we amended the credit facility and increased the committed amount from $200.0 million to $245.0 million. As of December 31, 2009, we had $50.0 million of revolving loans outstanding and a $0.7 million letter of credit outstanding under the credit facility, and $194.3 million available. The credit facility has a variable interest rate, which is generally the London Interbank Offered Rate (LIBOR) margin plus a margin spread. The rate was equal to 1.29% at December 31, 2009.
In December 2007, we entered into an interest rate swap agreement converting a portion of our interest rate exposure from a floating rate basis to a fixed rate of 4.135% per annum. The interest rate swap agreement has a notional amount of $50.0 million and matures in December 2010.
48
Table of Contents
Software and Equipment Notes
We finance certain software and equipment from third-party vendors. The terms of these arrangements are generally one to five years. The interest rates on the arrangements range from 0.0% to 6.0%.
Non-GAAP Financial Measures
Return on Capital (ROC) (Non-GAAP financial measure)
We define Return on Capital (ROC) as follows:
| ROC |
= |
Net Operating Profit After Tax (NOPAT) | ||
| Average Capital Base |
NOPAT = Income from operations x (1 – Effective tax rate)
Average Capital Base = Average of (Interest bearing debt + stockholders’ equity - excess cash) = Average of (Total assets – excess cash - accounts payables and accrued expenses – deferred revenue – other non-current liabilities and deferred income taxes)
Beginning in 2009 we define excess cash as the amount of cash and cash equivalents that exceeds our operating cash requirements, which for these periods is calculated as three percent of our annualized net revenue for the three months prior to the period end. For prior periods, we defined excess cash as our investments in money market funds. As a result of a decrease in capital requirements due to the completion of the last phase of our Grapevine, Texas data center build out and phase 2 of our Slough, U.K. data center, as well as the signing of leases to occupy data centers that have minimal data center build out costs, our operating cash needs have declined. We will periodically review the calculation and adjust it to reflect our projected cash requirements for the upcoming year.
We believe that ROC is an important metric for investors in evaluating our company’s performance. ROC relates to after-tax operating profits with the capital that is placed into service. It is therefore a performance metric that incorporates both the Statement of Income and the Balance Sheet. ROC measures how successfully capital is deployed within a company.
Note that ROC is not a measure of financial performance under GAAP and should not be considered a substitute for return on assets, which we consider to be the most directly comparable GAAP measure. ROC has limitations as an analytical tool, and when assessing our operating performance, you should not consider ROC in isolation, or as a substitute for other financial data prepared in accordance with GAAP. Other companies may calculate ROC differently than we do, limiting its usefulness as a comparative measure.
ROC decreased from 13.6% in 2007 to 9.1% in 2008 and increased to 9.2% in 2009. The overall decrease from 2007 is due to a proportionately larger increase in the average capital base compared to the increase in income from operations over the same time period. Beginning in 2008, the average capital base includes capital expenditures related to our new corporate headquarter facility and data centers that were or are in the process of being built out. Return on assets decreased from 8.5% in 2007 to 4.5% in 2008 and increased to 4.7% in 2009 due to the significant investments over the time periods. In addition, beginning in the second half of 2008 we had higher cash and cash equivalent balances due to our IPO in August 2008, and a draw on our revolving credit facility resulting from the uncertainty in the credit markets.
49
Table of Contents
See our reconciliation of the calculation of annual return on assets to ROC in the following table:
| Year Ended December 31, | ||||||||||||
| (Dollars in thousands) | 2007 | 2008 | 2009 | |||||||||
| Income from operations |
$ | 30,609 | $ | 40,149 | $ | 55,241 | ||||||
| Effective tax rate |
35.9 | % | 33.6 | % | 35.1 | % | ||||||
| Net operating profit after tax (NOPAT) |
$ | 19,620 | $ | 26,659 | $ | 35,851 | ||||||
| Net income |
$ | 17,829 | $ | 21,703 | $ | 30,218 | ||||||
| Total assets at period end |
$ | 301,813 | $ | 685,261 | $ | 668,645 | ||||||
| Less: Excess cash |
— | (200,620 | ) | (105,083 | ) | |||||||
| Less: Accounts payable and accrued expenses |
(76,494 | ) | (71,387 | ) | (89,773 | ) | ||||||
| Less: Deferred revenues (current and non-current) |
(19,762 | ) | (20,167 | ) | (19,444 | ) | ||||||
| Less: Other non-current liabilities and deferred taxes |
(9,624 | ) | (23,610 | ) | (42,615 | ) | ||||||
| Capital base |
$ | 195,933 | $ | 369,477 | $ | 411,730 | ||||||
| Average total assets |
$ | 210,606 | $ | 487,183 | $ | 647,493 | ||||||
| Average capital base |
$ | 144,783 | $ | 292,238 | $ | 390,472 | ||||||
| Return on assets (Net income/Average total assets) |
8.5 | % | 4.5 | % | 4.7 | % | ||||||
| Return on capital (NOPAT/Average capital base) |
13.6 | % | 9.1 | % | 9.2 | % | ||||||
See our reconciliation of the calculation of quarterly return on assets to ROC in the following table:
| Three Months Ended | ||||||||||||||||||||
| (Unaudited) | ||||||||||||||||||||
| (In thousands, except financial metrics) | December 31, 2008 |
March 31, 2009 |
June 30, 2009 |
September 30, 2009 |
December 31, 2009 |
|||||||||||||||
| Income from operations |
$ | 12,125 | $ | 13,021 | $ | 13,403 | $ | 13,128 | $ | 15,689 | ||||||||||
| Effective tax rate |
27.7 | % | 36.6 | % | 36.2 | % | 33.9 | % | 34.0 | % | ||||||||||
| Net operating profit after tax (NOPAT) |
$ | 8,766 | $ | 8,255 | $ | 8,551 | $ | 8,678 | $ | 10,355 | ||||||||||
| Net income |
$ | 6,844 | $ | 6,588 | $ | 6,991 | $ | 7,604 | $ | 9,035 | ||||||||||
| Total assets at period end |
$ | 685,261 | $ | 601,434 | $ | 656,793 | $ | 625,330 | $ | 668,645 | ||||||||||
| Less: Excess cash |
(200,620 | ) | (117,611 | ) | (129,638 | ) | (83,462 | ) | (105,083 | ) | ||||||||||
| Less: Accounts payable and accrued expenses |
(71,387 | ) | (71,211 | ) | (87,316 | ) | (77,108 | ) | (89,773 | ) | ||||||||||
| Less: Deferred revenues (current and non-current) |
(20,167 | ) | (20,374 | ) | (20,011 | ) | (18,222 | ) | (19,444 | ) | ||||||||||
| Less: Other non-current liabilities and deferred taxes |
(23,610 | ) | (25,462 | ) | (30,359 | ) | (31,632 | ) | (42,615 | ) | ||||||||||
| Capital base |
$ | 369,477 | $ | 366,776 | $ | 389,469 | $ | 414,906 | $ | 411,730 | ||||||||||
| Average total as-sets |
$ | 685,236 | $ | 643,348 | $ | 629,114 | $ | 641,062 | $ | 646,988 | ||||||||||
| Average capital base |
$ | 350,499 | $ | 368,127 | $ | 378,123 | $ | 402,188 | $ | 413,318 | ||||||||||
| Return on assets (annualized) |
4.0 | % | 4.1 | % | 4.4 | % | 4.7 | % | 5.6 | % | ||||||||||
| Return on capital (annualized) |
10.0 | % | 9.0 | % | 9.0 | % | 8.6 | % | 10.0 | % | ||||||||||
50
Table of Contents
Adjusted EBITDA (Non-GAAP financial measure)
We use Adjusted EBITDA as a supplemental measure to review and assess our performance. We define Adjusted EBITDA as Net income, plus income taxes, total other income (expense), depreciation and amortization, and non-cash charges for share-based compensation.
Adjusted EBITDA is a metric that is used in our industry by the investment community for comparative and valuation purposes. We disclose this metric in order to support and facilitate the dialogue with research analysts and investors.
Note that Adjusted EBITDA is not a measure of financial performance under accounting principles generally accepted in the United States (GAAP) and should not be considered a substitute for net income, which we consider to be the most directly comparable GAAP measure. Adjusted EBITDA has limitations as an analytical tool, and when assessing our operating performance, you should not consider Adjusted EBITDA in isolation, or as a substitute for net income or other consolidated income statement data prepared in accordance with GAAP. Other companies may calculate Adjusted EBITDA differently than we do, limiting its usefulness as a comparative measure. See our annual Adjusted EBITDA reconciliation below.
| Year Ended December 31, | ||||||||||||
| (Dollars in thousands) | 2007 | 2008 | 2009 | |||||||||
| Net revenue |
$ | 362,017 | $ | 531,933 | $ | 628,987 | ||||||
| Income from operations |
$ | 30,609 | $ | 40,149 | $ | 55,241 | ||||||
| Net income |
$ | 17,829 | $ | 21,703 | $ | 30,218 | ||||||
| Plus: Income taxes |
9,965 | 10,985 | 16,328 | |||||||||
| Plus: Total other (income) expense |
2,815 | 7,461 | 8,695 | |||||||||
| Plus: Depreciation and amortization |
56,476 | 90,172 | 125,229 | |||||||||
| Plus: Share-based compensation expense |
4,252 | 15,017 | 20,124 | |||||||||
| Adjusted EBITDA |
$ | 91,337 | $ | 145,338 | $ | 200,594 | ||||||
| Operating income margin |
8.5 | % | 7.5 | % | 8.8 | % | ||||||
| Adjusted EBITDA margin |
25.2 | % | 27.3 | % | 31.9 | % | ||||||
See our quarterly Adjusted EBITDA reconciliation below.
| Three Months Ended | ||||||||||||||||||||
| (Unaudited) | ||||||||||||||||||||
| (Dollars in thousands) | December 31, 2008 |
March 31, 2009 |
June 30, 2009 |
September 30, 2009 |
December 31, 2009 |
|||||||||||||||
| Net revenue |
$ | 143,137 | $ | 145,077 | $ | 151,995 | $ | 162,399 | $ | 169,516 | ||||||||||
| Income from operations |
$ | 12,125 | $ | 13,021 | $ | 13,403 | $ | 13,128 | $ | 15,689 | ||||||||||
| Net income |
$ | 6,844 | $ | 6,588 | $ | 6,991 | $ | 7,604 | $ | 9,035 | ||||||||||
| Plus: Income taxes |
2,620 | 3,807 | 3,973 | 3,900 | 4,648 | |||||||||||||||
| Plus: Total other (income) expense |
2,661 | 2,626 | 2,439 | 1,624 | 2,006 | |||||||||||||||
| Plus: Depreciation and amortization |
26,310 | 27,804 | 29,711 | 32,696 | 35,018 | |||||||||||||||
| Plus: Share-based compensation expense |
4,144 | 4,237 | 5,017 | 5,612 | 5,258 | |||||||||||||||
| Adjusted EBITDA |
$ | 42,579 | $ | 45,062 | $ | 48,131 | $ | 51,436 | $ | 55,965 | ||||||||||
| Operating income margin |
8.5 | % | 9.0 | % | 8.8 | % | 8.1 | % | 9.3 | % | ||||||||||
| Adjusted EBITDA margin |
29.7 | % | 31.1 | % | 31.7 | % | 31.7 | % | 33.0 | % | ||||||||||
51
Table of Contents
Adjusted Free Cash Flow (Non-GAAP financial measure)
We define Adjusted Free Cash Flow as Adjusted EBITDA plus non-cash deferred rent, less total capital expenditures (including vendor financed equipment purchases), cash payments for interest, net, and cash payments for income taxes, net.
We believe that Adjusted Free Cash Flow is an important metric for investors in evaluating how a company is currently using cash generated, and may indicate its ability to generate cash that can potentially be used by the business for capital investments, acquisitions, reduction of debt, payment of dividends, etc. Note that Adjusted Free Cash Flow is not a measure of financial performance under GAAP and may not be comparable to similarly titled measures reported by other companies.
See our Adjusted Free Cash Flow reconciliation to Adjusted EBITDA below, as well as our reconciliation of Net income to Adjusted EBITDA provided above.
| (In thousands) | Year Ended December 31, 2009 |
|||
| Adjusted EBITDA |
$ | 200,594 | ||
| Non-cash deferred rent |
4,378 | |||
| Total capital expenditures |
(185,674 | ) | ||
| Cash payments for interest, net |
(8,005 | ) | ||
| Cash refunds (payments) for income taxes, net |
2,502 | |||
| Adjusted free cash flow |
$ | 13,795 | ||
Net Leverage (Non-GAAP financial measure)
We define Net Leverage as Net Debt divided by Adjusted EBITDA (trailing twelve months). We believe that Net Leverage is an important metric for investors in evaluating a company’s liquidity. Note that Net Leverage is not a measure of financial performance under GAAP and may not be comparable to similarly titled measures reported by other companies.
See our Net Leverage calculation below.
| (Dollars in thousands) | As of December 31, 2009 |
|||
| Obligations under capital leases |
$ | 109,702 | ||
| Debt |
57,684 | |||
| Total debt |
$ | 167,386 | ||
| Less: Cash and cash equivalents |
(125,425 | ) | ||
| Net debt |
$ | 41,961 | ||
| Adjusted EBITDA (trailing twelve months) |
$ | 200,594 | ||
| Net leverage |
0.21x | |||
Off-Balance Sheet Arrangements
During the periods presented, we did not have any relationships with unconsolidated entities or financial partnerships, such as entities often referred to as structured finance or special purpose entities. These entities are typically established for the purpose of facilitating off-balance sheet arrangements or other contractually narrow or limited purposes.
We have entered into various indemnification arrangements with third parties, including vendors, customers, landlords, our officers and directors, stockholders of acquired companies, and third parties to whom
52
Table of Contents
and from whom we license technology. Generally, these indemnification agreements require us to reimburse losses suffered by third parties due to various events, such as lawsuits arising from patent or copyright infringement or our negligence. Certain of these agreements require us to indemnify the other party against certain claims relating to property damage, personal injury or the acts or omissions by us, our employees, agents or representatives. To date, there have been no claims against us or our customers pertaining to such indemnification provisions and no amounts have been recorded.
These indemnification obligations are considered off-balance sheet arrangements. To date, we have not encountered material costs as a result of such obligations and have not accrued any liabilities related to such indemnification obligations in our financial statements.
Critical Accounting Policies and Estimates
Our consolidated financial statements are prepared in accordance with GAAP. In many cases, the accounting treatment of a particular transaction is specifically dictated by GAAP and does not require management’s judgment in its application, while in other cases, significant judgment is required in making estimates, and selecting among available alternative accounting standards that allow different accounting treatment for similar transactions. These judgments and estimates affect the reported amounts of assets, liabilities, revenue, costs and expenses and related disclosures. We consider these policies requiring significant management judgment and estimates used in the preparation of our financial statements to be critical accounting policies.
We review our estimates and judgments on an ongoing basis, including those related to revenue recognition, service credits, allowance for doubtful accounts, property and equipment, goodwill and intangibles, contingencies, the fair valuation of stock related to share-based compensation, software development, and income taxes.
We base our estimates on historical experience and on various other assumptions that we believe to be reasonable under the circumstances to determine the carrying values of assets and liabilities. In many instances, we could have reasonably used different accounting estimates, and in other instances changes in the accounting estimates are reasonably likely to occur from period-to-period. Accordingly, actual results could differ significantly from the estimates made by our management. To the extent that there are material differences between these estimates and actual results, our future financial statement presentation, financial condition, results of operations and cash flows will be affected.
Critical Accounting Policies
Revenue Recognition
Because we provide our hosting services to our customers and do not sell individual hardware and software products, we recognize revenue when all of the following conditions are met:
| • | There is persuasive evidence that an arrangement exists; |
| • | The service has been provided to the customer; |
| • | The amount of fees to be paid by the customer is fixed or determinable; and |
| • | The collection of the fees is reasonably assured. |
We recognize hosting revenue, including implementation and set-up fees on a monthly basis, beginning on the date the customer commences use of our services. Implementation fees are amortized over the estimated average customer life. If a customer terminates their relationship with us before the expiration of the estimated average customer life, any unamortized installation fees are recognized as revenue at that time. Amounts that
53
Table of Contents
have been invoiced are recorded in accounts receivable and in deferred revenue or revenue, depending on whether the revenue recognition criteria have been met. Therefore, deferred revenue primarily consists of prepaid service fees and set-up fees. Professional services are recognized in the period services are provided.
Our customers generally have the right to cancel their contracts by providing prior written notice to us of their intent to cancel the remainder of the contract term. In the event that a customer cancels their contract, they are not entitled to a refund for services already rendered.
Valuation of Accounts Receivable and Service Credits
Estimates that further impact revenue recognition relate primarily to allowance for doubtful accounts and customer service credits. Both estimates are relatively predictable based on historical experience.
We make judgments as to our ability to collect outstanding receivables and provide allowances when collection becomes doubtful. Judgment is required to assess the likelihood of ultimate realization of recorded accounts receivable. If the financial condition of our customers were to deteriorate, resulting in an impairment of either their ability or willingness to make payments, an increase in the allowance for doubtful accounts would be required. Similarly, a change in the payment behavior of customers generally may require an adjustment in the calculation of the appropriate allowance. Each month, management reviews customer payment patterns, historical data and anticipated customer default rates of the various aging categories of accounts receivables in order to determine the appropriate allowance for doubtful accounts. We write off customer accounts receivable balances to the allowance for doubtful accounts when it becomes likely that we will not collect from the customer.
All of our customer agreements provide that we will achieve certain service levels. To the extent that such service levels are not achieved, we record service credits, which are a reduction to revenue, and a corresponding increase in the allowance for customer credits to provide for estimated adjustments to receivables. We base these provisions on historical experience and evaluate the estimate of service credits on a regular basis, and adjust the amount reserved accordingly.
Property, Equipment and Other Long Lived Assets
We utilize significant amounts of property and equipment in providing services to our customers. We use straight-line depreciation for property, equipment, and leasehold improvements over the estimated useful lives. We use estimated useful lives of three to five years for equipment and software. Changes in technology or changes in the intended use of property and equipment may cause the estimated useful life or the value of these assets to change. We periodically review the appropriateness of the estimated economic useful lives for each category of property and equipment.
Periodically we assess potential impairment of our property and equipment. We perform an impairment review whenever events or changes in circumstances indicate that the carrying value of an asset may not be recoverable. Factors we consider important which could trigger an impairment review include, but are not limited to, significant under-performance relative to historical or projected future operating results, significant changes in the manner of our use of the acquired assets or our overall business strategy, and significant industry or economic trends. When we determine that the carrying value of a long-lived asset may not be recoverable based upon the existence of one or more of the above indicators, we determine the recoverability by comparing the carrying amount of the asset to net future undiscounted cash flows that the asset is expected to generate. We recognize an impairment charge equal to the amount by which the carrying amount exceeds the fair market value of the asset.
Goodwill and Intangible Assets
Goodwill, which consists of the excess of the purchase price over the fair value of identifiable net assets of businesses acquired, is evaluated for impairment on an annual basis on October 1, or whenever events or
54
Table of Contents
circumstances indicate that impairment may have occurred. The goodwill impairment test requires judgment, including the identification of reporting units, assignment of assets and liabilities to reporting units, assignment of goodwill to reporting units, and determination of the fair value of each reporting unit. When evaluating goodwill for impairment we first compare the book value of net assets to the fair value of the related operations. If the fair value is determined to be less than book value, a second step is performed to compute the amount of impairment. We estimate fair value using a discounted cash flow methodology. We allocate goodwill to reporting units based on the reporting unit expected to benefit from the combination. We evaluate our reporting units on an annual basis and, if necessary, reassign goodwill using a relative fair value allocation approach. We did not identify any triggering events in 2009 that would require an update to our annual impairment test. Additionally, upon conclusion of our 2009 annual test we noted that the fair value of each of our reporting units with goodwill was substantially in excess of the respective reporting unit’s carrying value of its net assets.
Intangible assets, including technology, contracts, customer relationships, license agreements, and non-compete agreements arising principally from acquisitions, are recorded at cost less accumulated amortization. Intangible assets deemed to have indefinite useful lives, such as certain tradenames, are not amortized and are subject to annual impairment tests or whenever events or circumstances indicate impairment may have occurred. An impairment exists if the carrying value of the indefinite-lived intangible asset exceeds its fair value. For other intangible assets subject to amortization, impairment is recognized if the carrying amount is not recoverable and the carrying amount exceeds the fair value of the intangible asset.
There are many assumptions and estimates used that directly impact the results of impairment testing, including an estimate of future expected revenue, earnings and cash flows, and discount rates applied to such expected cash flows in order to estimate fair value. Changes in these estimates and assumptions could materially affect the estimated fair value of an asset.
Contingencies
We accrue for contingent obligations, including estimated legal costs, when the obligation is probable and the amount is reasonably estimable. As facts concerning contingencies become known, we reassess our position and make appropriate adjustments to the financial statements. Estimates that are particularly sensitive to future changes include those related to tax, legal, and other regulatory matters, changes in the interpretation and enforcement of international laws, and the impact of local economic conditions and practices, which are all subject to change as events evolve and as additional information becomes available during the administrative and litigation process.
Share-Based Compensation
Prior to January 1, 2006, we recognized compensation cost for share-based awards based on the minimum value taking into account the exercise price of the option and the fair value of our common stock on the date of grant. Effective January 1, 2006, we adopted a new accounting treatment for share-based awards and used the prospective-transition method, as required for nonpublic companies that previously used the minimum value method. As such, we continue to use the minimum value method in future periods to unvested equity awards outstanding at the date of adoption. All share-based payment awards made to employees and directors beginning January 1, 2006 are measured and recognized as compensation expense based on the estimated fair values on the grant date.
We use the Black-Scholes pricing model to determine the fair value of the stock options on the grant dates for share awards made on or after January 1, 2006. The Black-Scholes option valuation model requires the use of highly subjective and complex assumptions to determine the fair value of share-based awards, including the deemed fair value of the underlying common stock on the date of grant and the expected volatility of the stock over the expected term of the related grants. The value of the award is recognized as expense over the requisite service periods on a straight-line basis in our consolidated statements of income, and reduced for estimated forfeitures. Forfeitures are required to be estimated at the time of grant and revised, if necessary, in subsequent periods if actual forfeitures differ from those estimates.
55
Table of Contents
In addition to stock options, we also granted restricted stock units (RSUs) to our chief executive officer and another member of our executive team. The RSUs have either a three-year or five-year performance period and shares are issued at the end of the period if the performance measure is met. The performance measure is based on the company’s total shareholder return (TSR) on its common stock compared to other companies in the Russell 2000 Index. In addition, the company’s TSR must be positive for vesting to occur. We use a Monte Carlo simulation to estimate the fair value of the awards. We have also granted RSUs to certain executives that vest ratably over the requisite service period.
Software Development
We capitalize the salaries and payroll-related costs of employees and consultants who devote time to the development of certain internal-use software projects. If a project constitutes an enhancement to previously developed software, we assess whether the enhancement is significant and creates additional functionality to the software, thus resulting in capitalization. All other software development costs are expensed as incurred. We amortize capitalized software development costs over periods ranging from 12 to 36 months, which represents the estimated useful lives of the software.
Income Taxes
We are subject to income taxes in the U.S. and numerous foreign jurisdictions. Significant judgment is required in evaluating our tax positions and determining our provision for income taxes. During the ordinary course of business, there are many transactions and calculations for which the ultimate tax determination is uncertain. We establish reserves for tax-related uncertainties based on estimates of whether, and the extent to which, additional taxes and interest will be due. These reserves are established when we believe that certain positions are likely to be challenged and may not be sustained on review by tax authorities. We adjust these reserves in light of changing facts and circumstances, such as the closing of a tax audit. The provision for income taxes includes the impact of reserve provisions and changes to reserves that are considered appropriate.
Our effective tax rates have differed from the statutory rate primarily due to the tax impact of foreign operations, research and development tax credits, state taxes, and certain benefits realized related to stock option activity. Our effective tax rate was 35.9%, 33.6% and 35.1% for 2007, 2008 and 2009, respectively. Our future effective tax rates could be adversely affected by earnings being lower than anticipated in countries where we have lower statutory rates and higher than anticipated in countries where we have higher statutory rates, by changes in the valuation of our deferred tax assets or liabilities, or by changes in tax laws, regulations, accounting principles, or interpretations thereof. In addition, we are subject to the continuous examination of our income tax returns by the Internal Revenue Service and other tax authorities. We regularly assess the likelihood of adverse outcomes resulting from these examinations to determine the adequacy of our provision for income taxes.
Recent Accounting Pronouncements
See Item 8 of Part II, “Financial Statements and Supplementary Data—Note 2—Summary of Significant Accounting Policies—Recent Accounting Pronouncements.”
56
Table of Contents
ITEM 7A—QUANTITATIVE AND QUALITATIVE DISCLOSURES ABOUT MARKET RISK
Power Prices. We are a large consumer of power. During 2009, we expensed approximately $17.5 million that was paid to utility companies to power our data centers, representing 2.8% of our net revenue. Because we anticipate further revenue growth for the foreseeable future, we expect to consume more power in the future. Power costs vary by geography, the source of power generation, and seasonal fluctuations and are subject to certain proposed legislation that may increase our exposure to increased power costs. Our largest exposure to energy prices based on consumption currently exists at our Grapevine, Texas data center in the Dallas-Fort Worth area, a deregulated energy market. In August 2008, we entered into a fixed price contract with a provider of electricity for power for our Grapevine data center. The contract allows the company to periodically convert the price to a floating market price during the arrangement. The original term of the contract was 19 months and allowed the provider an option to extend the contract for an additional 19 months. The provider opted to extend the option in January 2010 for an additional 19 months. Also, in June 2009, we entered into a fixed price contract for 12 months for our Slough U.K. data center that has since been extended for an additional 12 months to expire in May 2011.
Interest Rates. Our main credit facility is a revolving line of credit with a base rate determined by the London Interbank Offered Rate, or LIBOR. This market rate of interest is fluctuating and exposes our interest expense to risk. Our credit agreement obligates us to hedge part of that interest rate risk with appropriate instruments, such as interest rate swaps or interest rate options. On December 10, 2007, we entered into an at-the-market fixed-payer interest rate swap with a notional amount of $50.0 million at an annual rate of 4.135%. This swap essentially fixes the rate we pay on the first $50.0 million outstanding on our revolving credit facility. As we borrow more, we may enter into additional swaps to continuously control our interest rate risk. Generally, we do not hedge our complete exposure. As a result, we may be exposed to interest rate risk on the un-hedged portion of our borrowings. For example, a 100 basis point increase in LIBOR would increase the interest expense on $10 million of borrowings that are not hedged by $0.1 million annually. As of December 31, 2009 we did not have exposure to interest rate risk as we only had $50.0 million outstanding on our revolving credit facility.
Leases. The majority of our purchases of customer gear are vendor financed through capital leases with fixed payment terms generally over three to five years, coinciding with the depreciation period of the equipment. As of December 31, 2009, we have a principal liability for these leases of $109.7 million on our consolidated balance sheet, of which $46.4 million is classified as current. Although we believe our borrowings from these arrangements will continue to be available, we have exposure that vendor financing may no longer be available or the borrowing rates, which are fixed rates, may increase.
Foreign Currencies. The majority of our customers are invoiced, and substantially all of our expenses are paid, by us or our subsidiaries in the functional currency of our company or our subsidiaries, respectively. A relatively insignificant amount of customers are invoiced in currencies other than the applicable functional currency. Therefore, our results of operations and cash flows are subject to fluctuations in foreign currency exchange rates. We also have exposure to foreign currency transaction gains and losses as the result of certain receivables due from our foreign subsidiaries, which are denominated in both U.S. dollars and the pound sterling. During 2009, we recognized foreign currency losses of $0.2 million within other income (expense). We have not entered into any currency hedging contracts, although we may do so in the future. We recently amended our revolving credit facility agreement to provide us the ability to borrow from our credit facility in pounds sterling and euros, rather than restricting borrowings to U.S. dollars. We currently do not have borrowings in any alternative currencies from our credit facility. As we grow our international operations, our exposure to foreign currency risk could become more significant.
57
Table of Contents
ITEM 8—FINANCIAL STATEMENT AND SUPPLEMENTARY DATA
REPORT OF INDEPENDENT REGISTERED PUBLIC ACCOUNTING FIRM
The Board of Directors and Stockholders
Rackspace Hosting, Inc.:
We have audited the accompanying consolidated balance sheets of Rackspace Hosting, Inc. and subsidiaries (the Company) as of December 31, 2009 and 2008, and the related consolidated statements of income, stockholders’ equity and comprehensive income, and cash flows for each of the years in the three-year period ended December 31, 2009. In connection with our audits of the consolidated financial statements, we also have audited financial statement schedule II. These consolidated financial statements and financial statement schedule are the responsibility of the Company’s management. Our responsibility is to express an opinion on these consolidated financial statements and financial statement schedule based on our audits.
We conducted our audits in accordance with the standards of the Public Company Accounting Oversight Board (United States). Those standards require that we plan and perform the audit to obtain reasonable assurance about whether the financial statements are free of material misstatement. An audit includes examining, on a test basis, evidence supporting the amounts and disclosures in the financial statements. An audit also includes assessing the accounting principles used and significant estimates made by management, as well as evaluating the overall financial statement presentation. We believe that our audits provide a reasonable basis for our opinion.
In our opinion, the consolidated financial statements referred to above present fairly, in all material respects, the financial position of Rackspace Hosting, Inc. and subsidiaries as of December 31, 2009 and 2008, and the results of their operations and their cash flows for each of the years in the three-year period ended December 31, 2009, in conformity with U.S. generally accepted accounting principles. Also in our opinion, the related financial statement schedule, when considered in relation to the basic consolidated financial statements taken as a whole, presents fairly, in all material respects, the information set forth therein.
We also have audited, in accordance with the standards of the Public Company Accounting Oversight Board (United States), Rackspace Hosting, Inc.’s internal control over financial reporting as of December 31, 2009, based on criteria established in Internal Control—Integrated Framework issued by the Committee of Sponsoring Organizations of the Treadway Commission (COSO), and our report dated February 26, 2010 expressed an unqualified opinion on the effectiveness of the Company’s internal control over financial reporting.
/s/ KPMG LLP
San Antonio, Texas
February 26, 2010
58
Table of Contents
REPORT OF INDEPENDENT REGISTERED ACCOUNTING FIRM
The Board of Directors and Stockholders
Rackspace Hosting, Inc.:
We have audited Rackspace Hosting, Inc.’s internal control over financial reporting as of December 31, 2009, based on criteria established in Internal Control—Integrated Framework issued by the Committee of Sponsoring Organizations of the Treadway Commission (COSO). Rackspace Hosting, Inc.’s management is responsible for maintaining effective internal control over financial reporting and for its assessment of the effectiveness of internal control over financial reporting, included in the accompanying Report of Management on Internal Control over Financial Reporting. Our responsibility is to express an opinion on the Company’s internal control over financial reporting based on our audit.
We conducted our audit in accordance with the standards of the Public Company Accounting Oversight Board (United States). Those standards require that we plan and perform the audit to obtain reasonable assurance about whether effective internal control over financial reporting was maintained in all material respects. Our audit included obtaining an understanding of internal control over financial reporting, assessing the risk that a material weakness exists, and testing and evaluating the design and operating effectiveness of internal control based on the assessed risk. Our audit also included performing such other procedures as we considered necessary in the circumstances. We believe that our audit provides a reasonable basis for our opinion.
A company’s internal control over financial reporting is a process designed to provide reasonable assurance regarding the reliability of financial reporting and the preparation of financial statements for external purposes in accordance with generally accepted accounting principles. A company’s internal control over financial reporting includes those policies and procedures that (1) pertain to the maintenance of records that, in reasonable detail, accurately and fairly reflect the transactions and dispositions of the assets of the company; (2) provide reasonable assurance that transactions are recorded as necessary to permit preparation of financial statements in accordance with generally accepted accounting principles, and that receipts and expenditures of the company are being made only in accordance with authorizations of management and directors of the company; and (3) provide reasonable assurance regarding prevention or timely detection of unauthorized acquisition, use, or disposition of the company’s assets that could have a material effect on the financial statements.
Because of its inherent limitations, internal control over financial reporting may not prevent or detect misstatements. Also, projections of any evaluation of effectiveness to future periods are subject to the risk that controls may become inadequate because of changes in conditions, or that the degree of compliance with the policies or procedures may deteriorate.
In our opinion, Rackspace Hosting, Inc. maintained, in all material respects, effective internal control over financial reporting as of December 31, 2009, based on criteria established in Internal Control—Integrated Framework issued by the Committee of Sponsoring Organizations of the Treadway Commission.
We also have audited, in accordance with the standards of the Public Company Accounting Oversight Board (United States), the consolidated balance sheets of Rackspace Hosting, Inc. and subsidiaries as of December 31, 2009 and 2008, and the related consolidated statements of income, stockholders’ equity and comprehensive income, and cash flows for each of the years in the three-year period ended December 31, 2009, and our report dated February 26, 2010 expressed an unqualified opinion on those consolidated financial statements.
/s/ KPMG LLP
San Antonio, Texas
February 26, 2010
59
Table of Contents
RACKSPACE HOSTING, INC. AND SUBSIDIARIES—
CONSOLIDATED BALANCE SHEETS
| (In thousands, except share and per share data) | December 31, 2008 |
December 31, 2009 |
||||||
| ASSETS |
||||||||
| Current assets: |
||||||||
| Cash and cash equivalents |
$ | 238,407 | $ | 125,425 | ||||
| Accounts receivable, net of allowance for doubtful accounts and customer credits of $3,295 as of December 31, 2008, and $4,298 as of December 31, 2009 |
30,932 | 38,732 | ||||||
| Income taxes receivable |
12,318 | 7,509 | ||||||
| Deferred income taxes |
3,050 | 9,764 | ||||||
| Prepaid expenses and other current assets |
7,788 | 10,239 | ||||||
| Total current assets |
292,495 | 191,669 | ||||||
| Property and equipment, net |
362,042 | 432,971 | ||||||
| Goodwill |
6,942 | 22,329 | ||||||
| Intangible assets, net |
15,101 | 10,790 | ||||||
| Other non-current assets |
8,681 | 10,886 | ||||||
| Total assets |
$ | 685,261 | $ | 668,645 | ||||
| LIABILITIES AND STOCKHOLDERS’ EQUITY |
||||||||
| Current liabilities: |
||||||||
| Accounts payable and accrued expenses |
$ | 71,387 | $ | 89,773 | ||||
| Current portion of deferred revenue |
16,284 | 17,113 | ||||||
| Current portion of obligations under capital leases |
38,909 | 46,415 | ||||||
| Current portion of debt |
5,944 | 4,893 | ||||||
| Total current liabilities |
132,524 | 158,194 | ||||||
| Non-current deferred revenue |
3,883 | 2,331 | ||||||
| Non-current obligations under capital leases |
50,781 | 63,287 | ||||||
| Non-current debt |
204,779 | 52,791 | ||||||
| Non-current deferred income taxes |
13,398 | 30,850 | ||||||
| Other non-current liabilities |
10,212 | 11,765 | ||||||
| Total liabilities |
415,577 | 319,218 | ||||||
| COMMITMENTS AND CONTINGENCIES |
||||||||
| Stockholders’ equity: |
||||||||
| Common stock, $0.001 par value per share: 300,000,000 shares authorized; 117,154,094 shares issued and outstanding as of December 31, 2008, 123,773,977 shares issued and outstanding as of December 31, 2009 |
117 | 124 | ||||||
| Additional paid-in capital |
207,589 | 251,337 | ||||||
| Accumulated other comprehensive loss |
(16,027 | ) | (10,257 | ) | ||||
| Retained earnings |
78,005 | 108,223 | ||||||
| Total stockholders’ equity |
269,684 | 349,427 | ||||||
| Total liabilities and stockholders’ equity |
$ | 685,261 | $ | 668,645 | ||||
See accompanying notes to the consolidated financial statements.
60
Table of Contents
RACKSPACE HOSTING, INC. AND SUBSIDIARIES—
CONSOLIDATED STATEMENTS OF INCOME
| Year Ended December 31, | ||||||||||||
| (In thousands, except per share data) | 2007 | 2008 | 2009 | |||||||||
| Net revenue |
$ | 362,017 | $ | 531,933 | $ | 628,987 | ||||||
| Costs and expenses: |
||||||||||||
| Cost of revenue |
118,225 | 172,583 | 200,943 | |||||||||
| Sales and marketing |
53,930 | 80,323 | 79,458 | |||||||||
| General and administrative |
102,777 | 148,706 | 168,116 | |||||||||
| Depreciation and amortization |
56,476 | 90,172 | 125,229 | |||||||||
| Total costs and expenses |
331,408 | 491,784 | 573,746 | |||||||||
| Income from operations |
30,609 | 40,149 | 55,241 | |||||||||
| Other income (expense): |
||||||||||||
| Interest expense |
(3,643 | ) | (8,229 | ) | (8,950 | ) | ||||||
| Interest and other income |
828 | 768 | 255 | |||||||||
| Total other income (expense) |
(2,815 | ) | (7,461 | ) | (8,695 | ) | ||||||
| Income before income taxes |
27,794 | 32,688 | 46,546 | |||||||||
| Income taxes |
9,965 | 10,985 | 16,328 | |||||||||
| Net income |
$ | 17,829 | $ | 21,703 | $ | 30,218 | ||||||
| Net income per share |
||||||||||||
| Basic |
$ | 0.18 | $ | 0.20 | $ | 0.25 | ||||||
| Diluted |
$ | 0.17 | $ | 0.19 | $ | 0.24 | ||||||
| Weighted average number of shares outstanding |
||||||||||||
| Basic |
101,278 | 108,528 | 120,570 | |||||||||
| Diluted |
106,618 | 115,406 | 127,420 | |||||||||
See accompanying notes to the consolidated financial statements.
61
Table of Contents
RACKSPACE HOSTING, INC. AND SUBSIDIARIES—
CONSOLIDATED STATEMENTS OF CASH FLOWS
| Year Ended December 31, | ||||||||||||
| (In thousands) | 2007 | 2008 | 2009 | |||||||||
| Cash Flows From Operating Activities |
||||||||||||
| Net income |
$ | 17,829 | $ | 21,703 | $ | 30,218 | ||||||
| Adjustments to reconcile net income to net cash provided by operating activities |
||||||||||||
| Depreciation and amortization |
56,476 | 90,172 | 125,229 | |||||||||
| Loss on disposal of equipment, net |
1,895 | 2,888 | 1,027 | |||||||||
| Provision for bad debts and customer credits |
4,094 | 4,149 | 10,347 | |||||||||
| Deferred income taxes |
(3,479 | ) | 12,099 | 9,379 | ||||||||
| Deferred rent |
383 | (211 | ) | 4,378 | ||||||||
| Share-based compensation expense |
4,252 | 15,017 | 20,124 | |||||||||
| Other non-cash compensation expense |
156 | 289 | 565 | |||||||||
| Excess tax benefits from share-based compensation arrangements |
(562 | ) | (3,212 | ) | — | |||||||
| Changes in certain assets and liabilities |
||||||||||||
| Accounts receivable |
(13,357 | ) | (12,202 | ) | (17,075 | ) | ||||||
| Income taxes receivable |
— | (12,318 | ) | 4,809 | ||||||||
| Accounts payable and accrued expenses |
39,192 | 13,398 | 14,603 | |||||||||
| Deferred revenue |
6,578 | 1,931 | (1,163 | ) | ||||||||
| All other operating activities |
(8,522 | ) | 2,879 | (5,573 | ) | |||||||
| Net cash provided by operating activities |
104,935 | 136,582 | 196,868 | |||||||||
| Cash Flows From Investing Activities |
||||||||||||
| Purchases of property and equipment, net |
(140,383 | ) | (165,396 | ) | (117,292 | ) | ||||||
| Acquisitions, net of cash acquired |
(338 | ) | (9,739 | ) | — | |||||||
| Earnout payments for acquisitions |
— | — | (6,822 | ) | ||||||||
| Net cash used in investing activities |
(140,721 | ) | (175,135 | ) | (124,114 | ) | ||||||
| Cash Flows From Financing Activities |
||||||||||||
| Principal payments of capital leases |
(13,877 | ) | (32,376 | ) | (44,680 | ) | ||||||
| Principal payments of notes payable |
(3,901 | ) | (6,851 | ) | (6,729 | ) | ||||||
| Borrowings on line of credit |
61,146 | 200,000 | — | |||||||||
| Payments on line of credit |
(5,000 | ) | (57,301 | ) | (150,000 | ) | ||||||
| Payments for debt issuance costs |
(301 | ) | (158 | ) | (367 | ) | ||||||
| Proceeds from sale leaseback transactions |
8,456 | 1,543 | — | |||||||||
| Receipt of Texas Enterprise Fund Grant |
5,000 | — | — | |||||||||
| Proceeds from issuance of common stock at IPO net of offering expenses of $14,196 |
— | 144,554 | — | |||||||||
| Proceeds from issuance of common stock, net |
— | 548 | — | |||||||||
| Proceeds from exercise of warrants |
— | 278 | — | |||||||||
| Proceeds from employee stock plans |
294 | 1,964 | 14,489 | |||||||||
| Excess tax benefits from share-based compensation arrangements |
562 | 3,212 | — | |||||||||
| Net cash provided by (used in) financing activities |
52,379 | 255,413 | (187,287 | ) | ||||||||
| Effect of exchange rate changes on cash and cash equivalents |
(30 | ) | (3,390 | ) | 1,551 | |||||||
| Increase (decrease) in cash and cash equivalents |
16,563 | 213,470 | (112,982 | ) | ||||||||
| Cash and cash equivalents, beginning of period |
8,374 | 24,937 | 238,407 | |||||||||
| Cash and cash equivalents, end of period |
$ | 24,937 | $ | 238,407 | $ | 125,425 | ||||||
| Supplemental cash flow information: |
||||||||||||
| Acquisition of property and equipment by capital leases |
$ | 37,458 | $ | 73,556 | $ | 64,692 | ||||||
| Acquisition of property and equipment by notes payable |
6,691 | 11,934 | 3,690 | |||||||||
| Vendor financed equipment purchases |
$ | 44,149 | $ | 85,490 | $ | 68,382 | ||||||
| Shares issued in business combinations |
$ | 3,507 | $ | 1,785 | $ | 8,680 | ||||||
| Cash payments for interest, net of amount capitalized |
$ | 3,148 | $ | 9,616 | $ | 8,213 | ||||||
| Cash payments for income taxes |
$ | 13,945 | $ | 6,364 | $ | 8,651 | ||||||
See accompanying notes to the consolidated financial statements.
62
Table of Contents
RACKSPACE HOSTING, INC. AND SUBSIDIARIES—
CONSOLIDATED STATEMENTS OF STOCKHOLDERS’ EQUITY AND COMPREHENSIVE INCOME
| Years Ended December 31, 2007, 2008 and 2009 | |||||||||||||||||||||||||||||||||
| Preferred Stock | Common Stock | Treasury Stock | Additional Paid-In Capital |
Accumulated other comprehensive income (loss) |
Retained Earnings |
Total stockholders’ equity |
|||||||||||||||||||||||||||
| (In thousands except share data) | Shares | Amount | Shares | Amount | Shares | Amount | |||||||||||||||||||||||||||
| Balance at December 31, 2006 |
1,214,837 | $ | 1 | 99,750,483 | $ | 100 | (82,705 | ) | $ | (126 | ) | $ | 31,312 | $ | 730 | $ | 38,473 | $ | 70,490 | ||||||||||||||
| Issuance of common stock |
|||||||||||||||||||||||||||||||||
| Exercise of stock options (including excess tax benefit of $562) |
— | — | 472,760 | — | — | — | 856 | — | — | 856 | |||||||||||||||||||||||
| Issuance of common stock to board of directors |
— | — | 31,580 | — | — | — | 156 | — | — | 156 | |||||||||||||||||||||||
| Issuance of restricted stock to Mailtrust employees |
— | — | 353,805 | — | — | — | — | — | — | — | |||||||||||||||||||||||
| Shares issued in business combination |
— | — | 587,595 | 1 | — | — | 3,419 | — | — | 3,420 | |||||||||||||||||||||||
| Shares issued in Mosso equity acquisition |
— | — | 15,000 | — | — | — | 87 | — | — | 87 | |||||||||||||||||||||||
| Total issuance of common stock |
— | — | 1,460,740 | 1 | — | — | 4,518 | — | — | 4,519 | |||||||||||||||||||||||
| Share-based compensation expense |
— | — | — | — | — | — | 4,252 | — | — | 4,252 | |||||||||||||||||||||||
| Comprehensive income: |
|||||||||||||||||||||||||||||||||
| Net income |
17,829 | 17,829 | |||||||||||||||||||||||||||||||
| Unrealized gain (loss) on derivative instrument, net of tax effect |
(322 | ) | (322 | ) | |||||||||||||||||||||||||||||
| Cumulative translation adjustment |
105 | 105 | |||||||||||||||||||||||||||||||
| Total comprehensive income |
17,612 | ||||||||||||||||||||||||||||||||
| Balance at December 31, 2007 |
1,214,837 | $ | 1 | 101,211,223 | $ | 101 | (82,705 | ) | $ | (126 | ) | $ | 40,082 | $ | 513 | $ | 56,302 | $ | 96,873 | ||||||||||||||
| Issuance of common stock |
|||||||||||||||||||||||||||||||||
| Exercise of stock options (including excess tax benefit of $3,212) |
— | — | 1,427,334 | 2 | — | 5,175 | — | — | 5,177 | ||||||||||||||||||||||||
| Issuance of common stock to board of directors |
— | — | 24,405 | — | — | 289 | — | — | 289 | ||||||||||||||||||||||||
| Issuance of warrants at IPO offering |
— | — | 268,750 | — | — | 278 | — | — | 278 | ||||||||||||||||||||||||
| Proceeds from issuance of common stock net of offering costs of $14,196 |
— | — | 12,700,000 | 13 | — | 144,541 | — | — | 144,554 | ||||||||||||||||||||||||
| Conversion of preferred shares to common stock at IPO offering |
(1,214,837 | ) | (1 | ) | 1,214,837 | 1 | — | — | — | — | — | ||||||||||||||||||||||
| Sale of common stock for cash |
— | — | 60,000 | — | — | 548 | — | — | 548 | ||||||||||||||||||||||||
| Shares issued in business combination |
— | — | 247,545 | — | 82,705 | 126 | 1,659 | — | — | 1,785 | |||||||||||||||||||||||
| Total issuance of common stock |
(1,214,837 | ) | (1 | ) | 15,942,871 | 16 | 82,705 | 126 | 152,490 | — | — | 152,631 | |||||||||||||||||||||
| Share-based compensation expense |
— | — | — | — | — | — | 15,017 | — | — | 15,017 | |||||||||||||||||||||||
| Comprehensive income: |
|||||||||||||||||||||||||||||||||
| Net income |
21,703 | 21,703 | |||||||||||||||||||||||||||||||
| Unrealized gain (loss) on derivative instrument, net of tax effect |
(1,564 | ) | (1,564 | ) | |||||||||||||||||||||||||||||
| Cumulative translation adjustment |
(14,976 | ) | (14,976 | ) | |||||||||||||||||||||||||||||
| Total comprehensive income |
5,163 | ||||||||||||||||||||||||||||||||
| Balance at December 31, 2008 |
— | $ | — | 117,154,094 | $ | 117 | — | $ | — | $ | 207,589 | $ | (16,027 | ) | $ | 78,005 | $ | 269,684 | |||||||||||||||
| Issuance of common stock |
|||||||||||||||||||||||||||||||||
| Exercise of stock options and release of stock awards (including excess tax benefit of $0) |
— | — | 5,723,772 | 6 | — | — | 14,023 | — | — | 14,029 | |||||||||||||||||||||||
| Issuance of common stock to board of directors |
— | — | 50,376 | — | — | — | 462 | — | — | 462 | |||||||||||||||||||||||
| Issuance of common stock (earn out) |
— | — | 818,899 | 1 | — | — | 8,679 | — | — | 8,680 | |||||||||||||||||||||||
| Issuance of shares from Employee Stock Purchase Plan |
— | — | 26,836 | — | — | — | 460 | — | — | 460 | |||||||||||||||||||||||
| Total issuance of common stock |
— | — | 6,619,883 | 7 | — | — | 23,624 | — | — | 23,631 | |||||||||||||||||||||||
| Share-based compensation expense |
— | — | — | — | — | — | 20,124 | — | — | 20,124 | |||||||||||||||||||||||
| Comprehensive income: |
|||||||||||||||||||||||||||||||||
| Net income |
30,218 | 30,218 | |||||||||||||||||||||||||||||||
| Unrealized gain (loss) on derivative instrument, net of tax effect |
704 | 704 | |||||||||||||||||||||||||||||||
| Cumulative translation adjustment |
5,066 | 5,066 | |||||||||||||||||||||||||||||||
| Total comprehensive income |
35,988 | ||||||||||||||||||||||||||||||||
| Balance at December 31, 2009 |
— | $ | — | 123,773,977 | $ | 124 | — | $ | — | $ | 251,337 | $ | (10,257 | ) | $ | 108,223 | $ | 349,427 | |||||||||||||||
See accompanying notes to the consolidated financial statements.
63
Table of Contents
RACKSPACE HOSTING, INC. AND SUBSIDIARIES—
NOTES TO CONSOLIDATED FINANCIAL STATEMENTS
1. Overview and Basis of Presentation
Nature of Operations
As used in this report, the terms “Rackspace”, “Rackspace Hosting”, “we”, “our company”, “the company”, “us,” or “our” refer to Rackspace Hosting, Inc. and its subsidiaries. Rackspace Hosting, Inc., through its operating subsidiaries, is a provider of hosting solutions. We provide IT as a service, managing web-based IT systems for small and medium-sized businesses as well as large enterprises. We focus on providing a service experience for our customers, which we call Fanatical Support®.
Rackspace Hosting, Inc. was incorporated in Delaware on March 7, 2000. However, our operations began in 1998 as a limited partnership which became our subsidiary through a corporate reorganization completed on August 21, 2001.
We operate consolidated subsidiaries which include, among others, Rackspace US, Inc., our domestic operating entity, and Rackspace Limited, our United Kingdom (U.K.) operating entity.
In September 2007, we acquired Webmail.us., Inc., an email hosting business, which we rebranded as Mailtrust. Accordingly, its operating results have been included in our consolidated financial statements since the date of acquisition.
In October 2008, we completed the acquisition of Jungle Disk, Inc., a company specializing in cloud storage. Also in October 2008, we completed the acquisition of Slicehost LLC, a company specializing in cloud hosting. Accordingly, their operating results have been included in our consolidated financial statements since the date of acquisition.
Basis of Consolidation
The consolidated financial statements include the accounts of our wholly owned subsidiaries located in the United States of America (U.S.), the United Kingdom (U.K.), the Netherlands, and Hong Kong. Intercompany transactions and balances have been eliminated in consolidation.
Certain reclassifications have been made to prior year balances in order to conform to the current year’s presentation.
Use of Estimates
The preparation of financial statements in conformity with accounting principles generally accepted in the United States of America requires us to make estimates and assumptions that affect the reported amounts of assets and liabilities, and disclosure of contingent assets and liabilities at the date of the financial statements, and reported amounts of revenue and expenses during the reporting period. Actual results could differ from those estimates. On an ongoing basis, we evaluate our estimates, including those related to accounts receivable and customer credits, property and equipment, fair values of intangible assets and goodwill, useful lives of intangible assets, fair value of stock options, contingencies, and income taxes, among others. We base our estimates on historical experience and on other assumptions that are believed to be reasonable, the results of which form the basis for making judgments about the carrying values of assets and liabilities. We engaged third party valuation consultants to assist management in the purchase price allocation of significant acquisitions. We also engaged third party valuation consultants to assist management in the valuations of our common stock price, which affected transactions recorded in our consolidated financial statements prior to Rackspace becoming a public company.
64
Table of Contents
Initial Public Offering
In August 2008, we completed our initial public offering (IPO), issuing 12.7 million shares of common stock at an IPO price of $12.50 per share. As a result of the offering we received $144.6 million in net proceeds, after deducting underwriting discounts and commissions of $11.1 million and additional offering-related expenses of approximately $3.1 million.
In conjunction with the IPO, all outstanding warrants were exercised, resulting in an issuance of 268,750 shares of common stock, having a weighted average exercise price of $1.034 per share. We received proceeds of $278 thousand from the exercise of these warrants. Also, all shares of our outstanding preferred stock were automatically converted to shares of common stock as a result of the IPO.
2. Summary of Significant Accounting Policies
The accompanying financial statements reflect the application of certain significant accounting policies. There have been no material changes to our significant accounting policies that are disclosed in our audited consolidated financial statements and notes thereof during 2009.
Concentrations of Risk
Our revenue is primarily derived from hosting, the market for which is highly competitive and rapidly changing. Significant changes in this industry or changes in customer buying behavior could adversely impact our operating results. See the Segment Information footnote for information concerning operations located outside of the U.S.
Financial instruments, which potentially subject us to concentrations of credit risk, consist principally of cash and cash equivalents and accounts receivable. We place our cash and cash equivalents in money market accounts with high credit quality financial institutions which may exceed Federal Deposit Insurance Corporation “FDIC” insurance limits, or may not be insured. While we monitor the balances in our accounts and adjust the balances as appropriate, these balances could be impacted if the underlying depository institutions fail or could be subject to other adverse conditions in the financial markets. To date, we have experienced no material loss or lack of access to our invested cash and cash equivalents; however, we can provide no assurances that access to our funds will not be impacted by adverse conditions in the financial markets.
We perform ongoing credit evaluations and collateral is generally not required for trade receivables. At December 31, 2008 and 2009, no customer, reseller or strategic partner comprised more than 5% of total accounts receivable.
We rely on equipment and software purchased from third parties to provide our services. This equipment and software may not continue to be available on commercially reasonable terms, and equipment may not be available in quantities sufficient to meet our business needs. Any errors or defects in third-party equipment and software could result in errors or a failure of our service, which could harm our business. Indemnification from equipment and software providers, if any, would likely be insufficient to cover any damage to our business or our customers resulting from such failures.
Cash and Cash Equivalents
For the purposes of the consolidated financial statements, we consider all highly liquid investments with original maturities of three months or less when acquired to be cash equivalents. Our available cash and cash equivalents are held in bank deposits, overnight sweep accounts, and money market funds. Gains and losses are included in interest and other income in our accompanying consolidated statements of income.
65
Table of Contents
Accounts Receivable, Net
We classify as trade accounts receivable amounts due within twelve months, arising from the provision of services in the normal course of business. We assess collectability based on a number of factors, including customer payment history and creditworthiness. We generally do not request collateral from our customers although in certain cases we may require the customer to prepay for services. When evaluating the adequacy of allowances, we analyze accounts receivable, current economic conditions and trends, historical bad debt write-offs, customer creditworthiness, and changes in customer payment terms. We write off customer accounts receivable balances to the allowance for doubtful accounts when it becomes likely that we will not collect from the customer.
In addition, at the end of a given period, we estimate customer service level credits based on historical data and known credits yet to be issued to our customers. Customer credits reduce revenue and accounts receivable in the period the estimate is recorded.
Prepaid Expenses and Other Assets
Prepaid expenses and other assets consist primarily of software and equipment maintenance contracts, and prepaid operating expenses. Software maintenance contracts are amortized over the agreement period, generally one to three years. Prepaid operating expenses are expensed in the period in which services are received.
Property and Equipment, Net
Property and equipment is stated at cost, net of accumulated depreciation. Property and equipment is depreciated on a straight-line basis over the estimated useful lives of the assets. Replacements and major improvements are capitalized; maintenance and repairs are charged to expense as incurred. Upon retirement or sale, the cost of assets disposed of and related accumulated depreciation are removed from the accounts and any resulting gain or loss is credited or charged to operations.
Business Combinations
We account for business combinations using the purchase method of accounting. We determine the recognition of intangible assets based on the following criteria: (i) the intangible asset arises from contractual or other rights; or (ii) the intangible is separable or divisible from the acquired entity and capable of being sold, transferred, licensed, returned, or exchanged. We allocate the purchase price of business combinations to the tangible assets, liabilities, and intangible assets acquired based on their estimated fair values. The excess purchase price over those fair values is recorded as goodwill.
We must make valuation assumptions that require significant estimates, especially with respect to intangible assets. Critical estimates in valuing certain intangible assets include, but are not limited to, future expected cash flows from customer contracts, customer relationships, non-compete agreements, and discount rates. We estimate fair value based upon assumptions that we believe to be reasonable, but which are inherently uncertain and unpredictable and, as a result, actual results may differ from estimates.
Goodwill and Intangible Assets
Goodwill consists of the excess of the purchase price over the fair value of identifiable net assets of businesses acquired. Goodwill is evaluated for impairment on an annual basis at the beginning of the fourth quarter or whenever events or circumstances indicate that impairment may have occurred.
Intangible assets, including purchased technology, customer contracts and relationships, certain tradenames, license agreements, and non-compete agreements arising principally from acquisitions are recorded at cost less accumulated amortization and the definite-lived intangibles are amortized using a method that reflects the pattern in which the economic benefits of the related intangible asset are consumed or utilized.
66
Table of Contents
Leases
We lease certain property and equipment under capital lease agreements. The assets held under capital lease and related obligations are recorded at the lesser of the present value of aggregate future minimum lease payments, including estimated bargain purchase options, or the fair value of the assets held under capital lease. Such assets and the related leasehold improvements are amortized over the shorter of the terms of the leases, or the estimated useful lives of the assets, which typically range from three to five years for software and equipment, and 30 years for property. For assets for which the lease agreement includes a bargain purchase option or transfer of ownership at the completion of the lease and the lease term is shorter than the estimated useful life of the asset, the asset is amortized over its estimated useful life.
We also lease property and equipment under operating lease agreements. The lease terms typically range from two to five years for equipment and one to twenty years for property, including office space and data center facilities. Rent increases, rent holidays, leasehold incentives or any other unusual provisions or conditions are considered with total rent payments, and are expensed on a straight-line basis over the lease period.
Impairment of Long-Lived Assets
Long-lived assets, including property and equipment and intangible assets, are reviewed for impairment whenever events or changes in circumstances indicate that the carrying amount should be evaluated. Recoverability of assets to be held and used is measured by a comparison of the carrying amount of an asset in conjunction with its asset group compared to the estimated undiscounted future cash flows expected to be generated by the asset group. If the carrying amount of the asset group exceeds its estimated future cash flows, an impairment charge is recognized in the amount by which the carrying amount of the asset group exceeds the fair value of the assets.
Revenue and Deferred Revenue
We provide hosting services to our customers and generally do not sell individual hardware and software products. Our customers pay us for a non-refundable installation fee and a monthly recurring charge based upon the size and complexity of the IT systems we manage and the level of service we provide. We recognize revenue when all of the following conditions are met:
| • | There is persuasive evidence that an arrangement exists; |
| • | The service has been provided to the customer; |
| • | The amount of fees to be paid by the customer is fixed or determinable; and |
| • | The collection of the fees is reasonably assured. |
We recognize hosting revenue, including installation fees on a monthly basis, beginning on the date the customer commences use of our services. Hosting revenue is recognized over the contractual term of the customer contract. Our customers generally continue to utilize our services beyond the initial contract term which typically ranges from several months to three years. As a result, installation fees are recognized ratably over the estimated average life of a customer relationship. Amounts that have been invoiced are recorded in accounts receivable and either deferred revenue or revenue, depending on whether the revenue recognition criteria have been met. Therefore, deferred revenue primarily consists of amounts that have been prepaid or deferred installation fees. As of December 31, 2009, of the total $19.4 million in deferred revenue recorded on our balance sheet, $17.1 million, $2.2 million, and $0.1 million will be amortized to revenue in 2010, 2011 and 2012, respectively. Revenue is recorded net of tax.
Revenue from other professional services is recognized in the period the services are provided when deemed separable from any related hosting services. When other professional services are not separable from any related
67
Table of Contents
hosting services, we recognize the associated revenue over the term of the related hosting arrangement. For revenue arrangements with multiple units of accounting, such as an arrangement that includes hosting services and other professional services, we allocate the total amount the customer will pay to the separate units of accounting based on their relative fair values, as determined by the price of the undelivered items when sold separately.
In determining whether the other professional services can be accounted for separately from hosting revenue, we consider the following factors for each agreement: availability of the services from other vendors, whether objective and reliable evidence for fair value exists for the undelivered elements, the nature of the professional services, the timing of when the services contract was signed in comparison to the subscription service start date, and the contractual dependence of the subscription service on the customer’s satisfaction with the professional services. Revenue related to other professional services was not a significant component of revenue during 2007, 2008 or 2009.
Our hosting arrangements contain service level commitments with our customers. To the extent that such service levels are not achieved, or are otherwise disputed due to third party power or service issues, unfavorable weather, or other service interruptions or conditions, we are required to issue service credits for a portion of the hosting service fees paid by our customers. At each reporting period, we estimate the amount of credits to be issued and record a reduction to revenue. To estimate service credits, we utilize historical data and known credits yet to be issued to our customers.
Cost of Revenue
Cost of revenue consists primarily of expenses related to our data center facilities and personnel costs. These costs typically include uncapitalized infrastructure costs, including software licenses, rental fees, replacement components, bandwidth, and power costs. Personnel expenses include the salaries, share-based compensation and related expenses of our support teams and data center employees.
Installation Costs
Setup and other direct installation activities are performed at the inception of a specific arrangement with each customer to enable us to perform under the terms of the arrangement. These setup or installation costs are expensed as incurred.
Advertising Costs
We charge advertising costs to expense in the period incurred. Advertising expenses for the years ended December 31, 2007, 2008 and 2009 were approximately $19.0 million, $30.7 million and $23.5 million, respectfully.
Research and Development Costs
Our research and development efforts are focused on the deployment of new technologies to address emerging trends, development and evolution of proprietary tools, and enhancement of systems and processes for sales and support. We expense costs related to preliminary project assessment, research and development, re-engineering, training, and application maintenance as incurred in general and administrative expenses or cost of revenue. These costs primarily include compensation costs for employees and consultants dedicated to research and development efforts. Administrative and other infrastructure expenses attributable to research and development are reported in general and administrative expense. For the years ended December 31, 2007, 2008 and 2009, we recognized $8.6 million, $10.8 million and $12.6 million of research and development expense, respectfully.
68
Table of Contents
Internally Developed Software
We capitalize certain costs of computer software developed or obtained for internal use. Capitalized computer software costs consists of purchased software licenses, implementation costs, salaries and related compensation costs of employees and consultants for certain projects that qualify for capitalization. The capitalized software costs are being amortized on a straight-line basis, which is generally over periods ranging from 12 to 60 months.
Share-Based Compensation
Prior to January 1, 2006, we recognized compensation cost for share-based awards based on the minimum value taking into account the exercise price of the option and the fair market value of our common stock on the date of grant. Effective January 1, 2006, we began using the prospective transition method. However, for unvested equity awards outstanding as of the date of January 1, 2006, we continue to amortize those awards using the minimum value method. Beginning January 1, 2006 measurement and recognition of compensation expense for all share-based payment awards made to employees and directors is recognized based on estimated fair values. We use the Black-Scholes pricing model to determine the fair value of the stock options on the grant dates for stock awards made on or after January 1, 2006, and we amortize the fair value of share-based payments on a straight-line basis over the requisite service periods of the award, which is generally the vesting period.
The Black-Scholes valuation model requires us to make assumptions and judgments about the variables used in the calculation. These variables and assumptions include the fair value of our common stock, expected term, the expected volatility, the risk-free interest rate, expected dividends, and the estimated rate of forfeitures of unvested stock options.
We used the following assumptions when determining the fair value of our stock options:
| • | Fair Value of our Common Stock—For valuations prior to our IPO, the fair value of our common stock was determined using both a market and discounted cash flow approach. The aggregate equity valuation was allocated between our various securities using the treasury stock method. Subsequent to the IPO, the end of day market price on the grant date was used to determine fair value. |
| • | Expected Term—The expected term represents the period that our share-based awards are expected to be outstanding. In order to compute the expected term, we have elected to use the simplified method. |
| • | Expected Volatility—Management estimates volatility for option grants by evaluating the average historical volatility of a peer group, as well as the volatility of the company’s stock since the IPO. Management believes historical volatility of the identified peer group (while incorporating the company’s historical volatility) to be the best estimate of future volatility. |
| • | Risk-Free Interest Rate—The risk-free interest rate used in the Black-Scholes valuation model is based on the implied yield currently available on U.S. Treasury zero-coupon issues with an equivalent expected term. |
| • | Expected Dividend—We have not issued dividends to date and do not anticipate issuing dividends. |
| • | Estimated Rate of Forfeitures—We estimate expected forfeitures based on our historical experience. If actual forfeitures differ from our estimates, we will record the difference as an adjustment in the period we revise our estimates. |
We have also granted restricted stock units (RSUs) to our chief executive officer and one other member of our executive team. The RSUs have either a three-year or five-year performance period and shares are issued at the end of the period if the performance measure is met. The performance measure is based on the company’s total shareholder return (TSR) on its common stock compared to other companies in the Russell 2000 Index. In addition, the company’s TSR must be positive for vesting to occur. We use a Monte Carlo simulation to estimate the fair value of the awards. We have also granted RSUs to certain executives that vest ratably over the requisite service period that are expensed straight-line over the vesting period.
69
Table of Contents
Income Taxes
Income taxes are accounted for using the asset and liability method. Deferred income taxes are provided for temporary differences in recognizing certain income, expense, and credit items for financial reporting purposes and tax reporting purposes. Such deferred income taxes primarily relate to the difference between the tax bases of assets and liabilities and their financial reporting amounts. Deferred tax assets and liabilities are measured by applying enacted statutory tax rates applicable to the future years in which deferred tax assets or liabilities are expected to be settled or realized. In assessing the realizability of deferred tax assets, management considers whether it is more likely than not that some portion or all of the deferred tax assets will be realized. The ultimate realization of deferred tax assets is dependent upon the generation of future taxable income during the periods in which those temporary differences become deductible. Management considers the scheduled reversals of deferred tax liabilities, projected future taxable income and tax planning strategies in making this assessment. Based upon projections of future taxable income over the periods in which the deferred tax assets are deductible, management believes it is more likely than not that we will realize the benefits of these deductible differences.
We do not provide for a U.S. income tax liability on undistributed earnings of our foreign subsidiaries. The earnings of non-U.S. subsidiaries, which reflect full provision for non-U.S. income taxes, are currently indefinitely reinvested in non-U.S. operations or will be remitted substantially free of additional tax.
Derivative Financial Instruments
During 2007, we entered into an interest rate swap contract to limit our exposure to interest rate risk. We recognize derivative instruments as either assets or liabilities on the balance sheet at fair value. The effective portion of the gain or loss on a derivative instrument designated and qualifying as a cash flow hedge is initially reported as a component of “other comprehensive income” and is then recorded in income in the period or periods during which the hedged forecasted transaction affects income. The ineffective portion of the gain or loss on the cash flow derivative instrument, if any, is recognized in income as incurred.
Fair Value of Financial Instruments
The fair value of certain financial instruments, including cash and cash equivalents, accounts receivables, accounts payable, and accrued expenses approximate fair value because of the short- term nature of these items. The fair value of our debt approximates the carrying value as of December 31, 2009. The carrying amount of our revolving credit facility approximates its fair value as it is tied to floating market interest rates.
Foreign Currency
We have assessed the functional currency of each of our subsidiaries in Hong Kong, the Netherlands and the U.K. and have designated the local currency to be their respective functional currencies. The financial statements of these foreign subsidiaries are translated into the U.S. dollar. All assets and liabilities are translated to the U.S. dollar at the end-of-period exchange rates. Capital accounts are determined to be of a permanent nature and are therefore translated using historical exchange rates. Revenue and expenses are translated using average exchange rates. Foreign currency translation adjustments arising from differences in exchange rates from period to period are included in the foreign currency translation adjustment account in accumulated comprehensive income (loss) of stockholders’ equity. Transaction gains or losses in currencies other than the functional currency are included as a component of other income (expense) in the consolidated statements of income.
Earnings Per Share
In years with outstanding preferred stock, our convertible preferred stock is considered a participating security as preferred stockholders are entitled to receive dividends when dividends are paid to common stockholders. We include the participating convertible preferred stock in the computation of earnings per share
70
Table of Contents
using the two-class method. Diluted earnings per share for common stock assumes the potential dilution that could result if securities or other contracts to issue common stock were exercised or converted into common stock. Diluted earnings per share assumes the exercise of stock options and warrants using the treasury stock method, and the conversion of our convertible preferred stock using the if-converted method for periods prior to conversion in 2008.
Recent Accounting Pronouncements
In September 2009, the Financial Accounting Standards Board (“FASB”) issued two Accounting Standards Updates (“ASU”): (i) ASU 2009-13 (EITF 08-1), Multiple-Deliverable Revenue Arrangements, and (ii) ASU 2009-14 (EITF 09-3), Certain Revenue Arrangements that Include Software Elements, which will be effective prospectively for revenue arrangements, entered into or materially modified in fiscal years beginning on or after June 15, 2010. ASU 2009-13 amends ASC Subtopic 605-25 to eliminate the requirement that all undelivered elements in a multiple-element revenue arrangement have vendor-specific objective evidence (VSOE) or third-party evidence (TPE) before an entity can recognize the portion of an overall arrangement fee that is attributable to items that already have been delivered. In the absence of VOSE or TPE of the standalone selling price for one or more delivered or undelivered elements in a multiple-element arrangement, entities will be required to estimate the selling prices of those elements. The overall arrangement fee will be allocated to each element (both delivered and undelivered items) based on their relative selling prices, regardless of whether those selling prices are evidenced by VSOE or TPE or are based on the entity’s estimated selling price. Application of the “residual method” of allocating an overall arrangement fee between delivered and undelivered elements will no longer be permitted upon adoption. ASU 2009-14 amends ASC Subtopic 985-605 to exclude from its scope tangible products that contain both software and non-software components that function together to deliver a product’s essential functionality. We do not expect the adoption of ASU 2009-13 or 2009-14 to have a material impact on our consolidated financial statements.
In December 2009, the FASB issued ASU 2009-17, which codifies SFAS 167, Amendments to FASB Interpretation No. 46(R), issued in June 2009. This guidance amends FASB Interpretation No. 46 (revised December 2003) to address the elimination of the concept of a qualifying special purpose entity. ASU 2009-17 also replaces the quantitative-based risks and rewards calculation for determining which enterprise has a controlling financial interest in a variable interest entity with an approach focused on identifying which enterprise has the power to direct the activities of a variable interest entity and the obligation to absorb losses of the entity or the right to receive benefits from the entity. Additionally, ASU 2009-17 provides more timely and useful information about an enterprise’s involvement with a variable interest entity. ASU 2009-17 will become effective in the first annual reporting period that begins after November 15, 2009 and for interim periods within that first annual reporting period. It will become effective for Rackspace in the first quarter of 2010. We do not expect the adoption of ASU 2009-17 to have a material impact on our consolidated financial statements.
71
Table of Contents
3. Earnings Per Share
The following table sets forth the computation of basic and diluted earnings per share:
| Year Ended December 31, | |||||||||
| (In thousands, except per share data) | 2007 | 2008 | 2009 | ||||||
| Basic net income per share: |
|||||||||
| Net income |
$ | 17,829 | $ | 21,703 | $ | 30,218 | |||
| Weighted average shares outstanding: |
|||||||||
| Common stock |
100,063 | 107,798 | 120,570 | ||||||
| Preferred stock |
1,215 | 730 | — | ||||||
| Number of shares used in per share computations |
101,278 | 108,528 | 120,570 | ||||||
| Earnings per share |
$ | 0.18 | $ | 0.20 | $ | 0.25 | |||
| Diluted net income per share: |
|||||||||
| Net income |
$ | 17,829 | $ | 21,703 | $ | 30,218 | |||
| Weighted average shares outstanding: |
|||||||||
| Common stock |
100,063 | 107,798 | 120,570 | ||||||
| Stock options and awards |
5,119 | 6,732 | 6,850 | ||||||
| Preferred stock |
1,215 | 730 | — | ||||||
| Stock warrants |
221 | 146 | — | ||||||
| Number of shares used in per share computations |
106,618 | 115,406 | 127,420 | ||||||
| Earnings per share |
$ | 0.17 | $ | 0.19 | $ | 0.24 | |||
We excluded 5.5 million, 6.0 million and 3.8 million potential common shares from the computation of dilutive earnings per share for the periods ended December 31, 2007, 2008 and 2009, respectively, because the effect would have been anti-dilutive.
As a result of our IPO in August 2008, all outstanding stock warrants were exercised, resulting in an issuance of 268,750 shares of common stock, and all shares of our outstanding preferred stock were automatically converted to shares of common stock; thus subsequent to the IPO, the impact of stock warrants exercised and preferred stock on weighted average shares outstanding was reflected in common stock.
4. Cash and Cash Equivalents
Cash and cash equivalents consisted of:
| (In thousands) | December 31, 2008 |
December 31, 2009 | ||||
| Cash deposits |
$ | 37,787 | $ | 64,716 | ||
| Money market funds |
200,620 | 60,709 | ||||
| Cash and cash equivalents |
$ | 238,407 | $ | 125,425 | ||
Our available cash and cash equivalents are held in bank deposits, overnight sweep accounts, and money market funds. We actively monitor the third-party depository institutions that hold our deposits. Our emphasis is primarily on safety of principal while secondarily maximizing yield on those funds. In March 2009 and July 2009, we repaid $100.0 million and $50.0 million, respectively, on our revolving credit facility with our money market funds.
Our money market mutual funds invest exclusively in high-quality, short-term securities that are issued or guaranteed by the U.S. government or by U.S. government agencies.
72
Table of Contents
5. Fair Value Measurements
Fair value is defined as the price that would be received to sell an asset or paid to transfer a liability in an orderly transaction between market participants at the measurement date. There is a three-tier fair value hierarchy, which prioritizes the inputs used in measuring fair value as follows:
Level 1 – Observable inputs such as quoted prices in active markets for identical assets or liabilities;
Level 2 – Inputs other than Level 1 that are observable, either directly or indirectly, such as quoted prices for similar assets or liabilities, quoted prices in markets that are not active; or other inputs that are observable or can be corroborated by observable market data for substantially the full term of the assets or liabilities; and
Level 3 – Unobservable inputs that are supported by little or no market activity, which require management judgment or estimation.
We measure our financial instruments at fair value. Our money market funds are classified within Level 1 because these funds are valued using quoted market prices. Our interest rate swap is classified within Level 2 as the valuation inputs are based on quoted prices and market observable data of similar instruments.
The carrying values of cash deposits, accounts receivable, prepaid expenses and other assets, accounts payable and accrued expenses are reasonable estimates of their fair values due to the short maturity of these financial instruments and are classified within Level 2.
Assets and liabilities measured at fair value on a recurring basis are summarized by level below. The table does not include assets and liabilities that are measured at historical costs or any other basis other than fair value.
| December 31, 2008 | ||||||||||||
| (In thousands) | Quoted Prices in Active Markets for Identical Assets (Level 1) |
Significant Other Observable Inputs (Level 2) |
Significant Unobservable Inputs (Level 3) |
Total Assets/Liabilities at Fair Value | ||||||||
| Assets: |
||||||||||||
| Money market funds (1) |
$ | 200,620 | $ | — | $ | — | $ | 200,620 | ||||
| Total |
$ | 200,620 | $ | — | $ | — | $ | 200,620 | ||||
| Liabilities: |
||||||||||||
| Interest rate swap agreement (1) |
$ | — | $ | 2,901 | $ | — | $ | 2,901 | ||||
| Deferred compensation (2) |
296 | — | — | 296 | ||||||||
| Total |
$ | 296 | $ | 2,901 | $ | — | $ | 3,197 | ||||
| December 31, 2009 | ||||||||||||
| (In thousands) | Quoted Prices in Active Markets for Identical Assets (Level 1) |
Significant Other Observable Inputs (Level 2) |
Significant Unobservable Inputs (Level 3) |
Total Assets/Liabilities at Fair Value | ||||||||
| Assets: |
||||||||||||
| Money market funds (1) |
$ | 60,709 | $ | — | $ | — | $ | 60,709 | ||||
| Rabbi trust (3) |
576 | — | — | 576 | ||||||||
| Total |
$ | 61,285 | $ | — | $ | — | $ | 61,285 | ||||
| Liabilities: |
||||||||||||
| Interest rate swap agreement (1) |
$ | — | $ | 1,818 | $ | — | $ | 1,818 | ||||
| Deferred compensation (2) |
586 | — | — | 586 | ||||||||
| Total |
$ | 586 | $ | 1,818 | $ | — | $ | 2,404 | ||||
73
Table of Contents
| (1) | Money market funds are classified in cash and cash equivalents. As of December 31, 2008 the interest rate swap agreement was classified in other non-current liabilities, and in accounts payable and accrued expenses as of December 31, 2009. |
| (2) | Obligations to pay benefits under a non-qualified deferred compensation plan that are classified in accounts payable and accrued expenses as of December 31, 2008 and in other non-current liabilities as of December 31, 2009. |
| (3) | Investments in marketable securities held in a Rabbi Trust associated with a non-qualified deferred compensation plan located in other non-current assets. |
Our Rabbi Trust was established in January 2009 and we elected the fair value option, which allows for the recognition of gains and losses to be recorded in the statement of income in the same period as the gains and losses are incurred as part of the non-qualified deferred compensation plan. During 2009, we recognized a net gain of $89 thousand as interest and other income (expense).
6. Prepaid Expenses and Other Current Assets
Prepaid expenses and other current assets consisted of:
| (In thousands) | December 31, 2008 |
December 31, 2009 | ||||
| Prepaid expenses |
$ | 5,481 | $ | 7,505 | ||
| Other current assets |
2,307 | 2,734 | ||||
| Prepaid expenses and other current assets |
$ | 7,788 | $ | 10,239 | ||
7. Property and Equipment, net
Property and equipment consisted of:
| (In thousands) | Estimated Useful Lives |
December 31, 2008 |
December 31, 2009 |
|||||||
| Computers, software and equipment |
1-5 years | $ | 350,697 | $ | 511,279 | |||||
| Furniture and fixtures |
7 years | 12,856 | 22,311 | |||||||
| Buildings and leasehold improvements |
2-30 years | 61,839 | 134,045 | |||||||
| Land |
— | 13,860 | 13,860 | |||||||
| Property and equipment, at cost |
439,252 | 681,495 | ||||||||
| Less accumulated depreciation and amortization |
(188,300 | ) | (298,369 | ) | ||||||
| Work in process |
111,090 | 49,845 | ||||||||
| Property and equipment, net |
$ | 362,042 | $ | 432,971 | ||||||
Depreciation and leasehold amortization expense, not including amortization expense for intangible assets, was $54.7 million, $85.7 million and $118.8 million for the years ended December 31, 2007, 2008 and 2009, respectively.
At December 31, 2008, the work in process balance consisted of build outs of $47.0 million for office facilities, $53.5 million for data centers, and $10.6 million for capitalized software and other projects. At December 31, 2009, the work in process balance consisted of build outs of $35.7 million for office facilities, $8.0 million for data centers and $6.1 million for capitalized software and other projects.
Capitalized interest was $1.0 million, $2.7 million and $0.8 million for the years ended December 31, 2007, 2008 and 2009, respectively.
74
Table of Contents
The unamortized balance of computer software costs on our consolidated balance sheets was $16.2 million and $29.1 million as of December 31, 2008 and December 31, 2009, respectively. Amortization expense for capitalized computer software costs was $5.4 million, $7.3 million and $12.7 million for the years ended December 31, 2007, 2008 and 2009, respectively.
8. Business Combinations and Goodwill
In October 2008, we acquired two companies with a total purchase price of $28.0 million, which we accounted for as business combinations. The initial purchase price of the combined acquisitions was $11.5 million paid in cash and stock, with up to $16.5 million in additional payouts of cash and stock based on certain earn-out provisions. As a result of the acquisitions, we recorded $3.4 million of goodwill, of which $0.7 million of the goodwill was deductible for tax purposes. In 2009, earn-outs totaling $15.5 million were achieved and paid in both cash and stock. If the remaining $1.0 million in additional earn-out is achieved, the payment will be accounted for as additional goodwill. It is possible that this remaining earn-out will be achieved in 2010.
The following table provides a roll forward of our goodwill balance.
| (In thousands) | ||||
| Balance at December 31, 2007 |
$ | 3,574 | ||
| Acquisitions |
3,424 | |||
| Purchase accounting adjustments |
(56 | ) | ||
| Balance at December 31, 2008 |
$ | 6,942 | ||
| Earn-out payments for acquisitions |
15,502 | |||
| Purchase accounting adjustments |
(115 | ) | ||
| Balance at December 31, 2009 |
$ | 22,329 | ||
We test goodwill at the reporting unit level using a fair value approach. Our annual testing did not result in an impairment of goodwill for the year ended December 31, 2009 as the fair value of each reporting unit with goodwill was determined to be in excess of its carrying value. If an event occurs or circumstances change that would more likely than not reduce the fair value of a reporting unit below its carrying value, goodwill will be evaluated for impairment between annual tests. As of December 31, 2009, there were no indicators that our goodwill was impaired.
9. Intangible Assets
The following tables provide information regarding our intangible assets:
| December 31, 2008 | ||||||||||
| Gross carrying amount |
Accumulated amortization |
Net carrying amount | ||||||||
| (in thousands) | ||||||||||
| Intangible assets: |
||||||||||
| Licenses |
$ | 12,738 | $ | (6,897 | ) | $ | 5,841 | |||
| Purchased technologies |
3,398 | (938 | ) | 2,460 | ||||||
| Domain name purchases |
426 | (385 | ) | 41 | ||||||
| Noncompete agreements |
731 | (81 | ) | 650 | ||||||
| Customer relationships |
5,372 | (297 | ) | 5,075 | ||||||
| Trademarks, tradenames and patents |
828 | (227 | ) | 601 | ||||||
| Other |
631 | (198 | ) | 433 | ||||||
| Total |
$ | 24,124 | $ | (9,023 | ) | $ | 15,101 | |||
75
Table of Contents
| December 31, 2009 | ||||||||||
| Gross carrying amount |
Accumulated amortization |
Net carrying amount | ||||||||
| (in thousands) | ||||||||||
| Intangible assets: |
||||||||||
| Licenses |
$ | 11,052 | $ | (6,925 | ) | $ | 4,127 | |||
| Purchased technologies |
3,645 | (2,045 | ) | 1,600 | ||||||
| Domain name purchases |
431 | (418 | ) | 13 | ||||||
| Noncompete agreements |
734 | (227 | ) | 507 | ||||||
| Customer relationships |
5,240 | (1,340 | ) | 3,900 | ||||||
| Trademarks, tradenames and patents |
865 | (442 | ) | 423 | ||||||
| Other |
631 | (411 | ) | 220 | ||||||
| Total |
$ | 22,598 | $ | (11,808 | ) | $ | 10,790 | |||
Amortization expense on intangibles was $1.8 million, $4.5 million and $6.5 million in 2007, 2008 and 2009, respectively. Intangible assets are recorded at cost and are amortized on a straight-line basis over their estimated useful lives, which range from one to five years. As of December 31, 2009, amortization expense on intangible assets for the next five years was expected to be as follows:
| (In thousands) | Amount | ||
| Year ending: |
|||
| 2010 |
$ | 5,816 | |
| 2011 |
2,841 | ||
| 2012 |
1,218 | ||
| 2013 |
900 | ||
| 2014 |
15 | ||
| Total |
$ | 10,790 | |
As of December 31, 2009, there were no indicators that our intangible assets were impaired.
10. Accounts Payable and Accrued Expenses
Accounts payable and accrued expenses consisted of:
| (In thousands) | December 31, 2008 |
December 31, 2009 | ||||
| Trade payables |
$ | 23,459 | $ | 24,597 | ||
| Accrued compensation and benefits |
19,462 | 28,469 | ||||
| Foreign income taxes payable |
324 | 6,340 | ||||
| Vendor accruals |
19,984 | 17,806 | ||||
| Other liabilities |
8,158 | 12,561 | ||||
| Accounts payable and accrued expenses |
$ | 71,387 | $ | 89,773 | ||
Included in vendor accruals as of December 31, 2008 is a $2.1 million liability related to an unresolved contractual issue with a vendor. See note 14 for further information on this issue. Included in Other liabilities as of December 31, 2009 is a $500 thousand accrual related to a contingent obligation.
76
Table of Contents
11. Debt
Debt outstanding consisted of:
| (In thousands) | December 31, 2008 |
December 31, 2009 |
||||||
| Revolving credit facility |
$ | 200,000 | $ | 50,000 | ||||
| Notes payable |
10,723 | 7,684 | ||||||
| Total debt |
210,723 | 57,684 | ||||||
| Less current portion of debt |
(5,944 | ) | (4,893 | ) | ||||
| Total non-current debt |
$ | 204,779 | $ | 52,791 | ||||
Revolving Credit Facility
Our revolving credit facility includes an aggregate commitment of $245.0 million. The facility provides for letters of credit up to $25.0 million. The interest is based on a floating rate, generally the London Interbank Offered Rate (LIBOR) plus a margin spread, which changes ratably from 0.675% to 1.55% dependent on the total funded debt to adjusted earnings before interest, taxes, depreciation, and amortization (EBITDA) ratio. We are required to pay a facility fee of 0.2% per annum on the full amount committed under the facility and a quarterly administrative fee. The facility has a 5-year term and matures in August 2012, and is fully secured by our assets and governed by financial and non-financial covenants. Financial covenants under our facility include a minimum fixed charge coverage ratio and a maximum total funded debt to EBITDA ratio.
In June 2009, we amended the revolving credit facility agreement to provide us with the ability to borrow under our credit facility in Pounds Sterling and euros, rather than only allowing our borrowings in U.S. dollars. We have the ability to borrow up to $75 million in alternate currencies. In addition, the amendment provides for changes in regard to certain other items in the credit agreement, including but not limited to (i) the calculation to determine our “Minimum Fixed Charge Coverage Ratio”, (ii) our banking account maintenance, and (iii) requirements for access to collateral located at our various real property locations. These changes were made in order to provide clarifications that reflected compliance expectations that already existed among the parties. We incurred fees of $367 thousand in connection with the amendment which have been capitalized and are being amortized over the remaining term of the revolver. As of December 31, 2009 we did not have any borrowings on our credit facility in alternate currencies.
As of December 31, 2009, the amount outstanding under the facility was $50.0 million, with an outstanding letter of credit of $0.7 million, and an additional $194.3 million available for future borrowings.
Our average borrowing under the facility was $96.8 million for the year ended December 31, 2009. In the same period, the revolving credit facility accrued interest at an average rate of 1.58%.
The credit facility has financial and non financial covenants. Financial covenants under our facility include a minimum fixed charge coverage ratio of at least 1.25 to 1.00 until the three months ended December 31, 2009 and 1.50 to 1.00 for every quarter thereafter and a maximum funded debt to EBITDA of not greater than 3.00 to 1.00. Also, our foreign cash balance is limited to a balance of $25 million. As of December 31, 2009, we were in compliance with all of the covenants under our facility.
Interest Rate Swap
We use cash flow hedges to limit our exposure that may result from the variability of floating interest rates. Effective December 10, 2007, we entered into an interest rate swap agreement with a notional amount of $50.0 million to hedge a portion of our outstanding floating-rate debt. This swap converts floating rate interest based on the London Interbank Offered Rate, or LIBOR, into fixed-rate interest as part of the arrangement with our primary lender and expires in December 2010.
77
Table of Contents
We are required to pay the counterparty a stream of fixed interest payments at a rate of 4.135%, and in turn, receive variable interest payments based on 1-month LIBOR. The margin spread as of December 31, 2009 was 1.05% resulting in an effective fixed rate of 5.19%. The net receipts or payments from the swap are recorded as interest expense. The swap is designated and qualifies as a cash flow hedge. As such, the swap is accounted for as an asset or a liability in the accompanying consolidated balance sheets at fair value. We are utilizing the dollar offset method to assess the effectiveness of the swap. Under this methodology, the swap was deemed to be highly effective for the period ended December 31, 2007 and the years ended December 31, 2008 and December 31, 2009. There was no hedge ineffectiveness recognized in earnings for the period ended December 31, 2007 or the years ended December 31, 2008 and December 31, 2009. If the hedge becomes ineffective, certain terms of the revolving line of credit change, the revolving line of credit is extinguished, or if the swap is terminated prior to maturity, the fair value of the swap and subsequent changes in fair value may be recognized in the accompanying consolidated statements of income.
The fair value of the swap was estimated based on the yield curve as of December 31, 2008 and December 31, 2009, and represents its carrying value. See Note 5 for further disclosure on the fair value of the interest rate swap and Note 19 for further information on comprehensive income.
As of December 31, 2009, we were in a liability position to the counterparty of the swap and therefore had limited counterparty credit risk.
The following table presents the impact of the interest rate swap on the consolidated balance sheets:
| (In thousands) | December 31, 2008 |
December 31, 2009 |
||||||
| Accounts payable and accrued expenses |
$ | — | $ | 1,818 | ||||
| Other non-current liabilities |
$ | 2,901 | $ | — | ||||
| Accumulated other comprehensive income (loss), net of tax |
$ | (1,886 | ) | $ | (1,182 | ) | ||
| Year Ended December 31, | |||||||||||
| (In thousands) | 2007 | 2008 | 2009 | ||||||||
| Effective gain (loss) recognized in accumulated other comprehensive income, |
$ | (322 | ) | $ | (1,564 | ) | $ | 704 | |||
Notes Payable
We have entered into various financing arrangements with multiple equipment and software vendors. As of December 31, 2009, the total amount financed under these relationships was $7.7 million with various terms extending to June 2012, and stated rates ranging from 0.0% to 6.0%. For arrangements with below market interest rates, we impute an interest charge based on our average borrowing rate. The weighted average effective interest rate of the various arrangements with third party vendors was 4.03% as of December 31, 2009.
The future principal payments on the revolving credit facility and notes payable as of December 31, 2009 was as follows:
| (In thousands) | Amount | ||
| Year ending: |
|||
| 2010 |
$ | 4,893 | |
| 2011 |
1,912 | ||
| 2012 |
50,879 | ||
| 2013 |
— | ||
| 2014 and beyond |
— | ||
| Total debt payments |
$ | 57,684 | |
78
Table of Contents
12. Other Non-Current Liabilities
Other non-current liabilities consisted of:
| (In thousands) | December 31, 2008 |
December 31, 2009 | ||||
| Texas Enterprise Fund Grant |
$ | 5,000 | $ | 5,000 | ||
| Deferred rent |
1,399 | 5,391 | ||||
| Other |
3,813 | 1,374 | ||||
| Other non-current liabilities |
$ | 10,212 | $ | 11,765 | ||
See Note 14 for a description of the liability associated with the Texas Enterprise Fund Grant agreement.
13. Leases
Capital Leases
We have global master lease agreements with three of our primary vendors that supply us with servers and computer equipment. Currently, we finance most equipment purchases through their respective finance companies. The terms vary with each vendor, but typically include a term of two to four years and interest rates ranging from 2.5% to 8.6%. A majority of these agreements allow us to purchase the equipment at the end of the lease for a nominal amount.
In 2007, 2008 and 2009, we financed $8.5 million, $1.5 million and $0, respectively, of certain servers and equipment through sale leaseback transactions with a vendor. We recognize the sale and repurchase of this equipment based on the relative fair value on the date of the transaction. As a result, no gains or losses were recorded in our consolidated statement of income. These sale leaseback transactions are recorded as leased assets and as obligations under capital leases within the consolidated balance sheet.
Amounts in property and equipment under capital leases as of December 31, 2008 and 2009 consisted of:
| (In thousands) | 2008 | 2009 | ||||||
| Computers, software and equipment |
$ | 151,255 | $ | 195,578 | ||||
| Less accumulated depreciation and amortization: |
(55,281 | ) | (73,803 | ) | ||||
| $ | 95,974 | $ | 121,775 | |||||
In August 2007, we executed a 30 year capital lease for our new headquarters facility. We made a lease prepayment to the current owner of $32.7 million, of which $27.7 million has been recorded as a capital asset within property and equipment and $5.0 million has been recorded in other non-current assets as a prepaid expense. As a result, no further payments are required and we have the option to purchase the land and building for a nominal amount anytime during the lease term.
Future capital lease payments under non-cancelable leases as of December 31, 2009 were as follows:
| (In thousands) | Amount | |||
| Year ending: |
||||
| 2010 |
$ | 52,698 | ||
| 2011 |
40,720 | |||
| 2012 |
21,229 | |||
| 2013 |
2,495 | |||
| Total minimum capital lease payments |
117,142 | |||
| Less amount representing interest |
(7,440 | ) | ||
| Present value of net minimum lease payments |
109,702 | |||
| Less current portion of obligations under capital leases portion |
(46,415 | ) | ||
| Non-current obligations under capital leases |
$ | 63,287 | ||
79
Table of Contents
Lease obligations for our foreign subsidiaries are denominated in foreign currencies, which have been converted to U.S. dollars at the exchange rate on December 31, 2009.
Operating Leases
We lease our data center facilities, certain office space and equipment under non-cancelable operating lease agreements. Facility leases generally include renewal options and may require us to pay a portion of the related operating expenses. Certain of these lease agreements have escalating rental payment provisions. We recognize rent expense for such arrangements on a straight-line basis.
Future operating lease payments under non-cancelable leases with an initial term in excess of one year as of December 31, 2009 were as follows:
| (In thousands) | Amount | ||
| Year ending: |
|||
| 2010 |
$ | 16,585 | |
| 2011 |
18,167 | ||
| 2012 |
20,220 | ||
| 2013 |
18,266 | ||
| 2014 |
16,979 | ||
| Thereafter |
145,141 | ||
| Total minimum operating lease payments |
$ | 235,358 | |
Rent expense for the years ended 2007, 2008, and 2009 was $14.6 million, $19.5 million, and $22.1 million, respectively.
14. Commitments and Contingencies
Purchase Commitments
Non-cancelable purchase commitments primarily relate to commitments for certain services and construction contracts at our data centers. The agreements vary from one to three years and provide for either penalties for early termination or may require minimum commitments for the remaining term. The minimum commitments for all of these agreements as of December 31, 2009 approximated $13.5 million, $1.1 million, and $0.1 million for the years ended December 31, 2010, 2011 and 2012, respectively.
We also have purchase orders and construction contracts primarily related to data center equipment and facility build-outs. We generally have the right to cancel these open purchase orders prior to delivery or terminate the contracts without cause.
Legal Proceedings
We are party to various legal proceedings which we consider routine and incidental to our business. On October 22, 2008, Benjamin E. Rodriguez D/B/A Management and Business Advisors vs. Rackspace Hosting, Inc. and Graham Weston, was filed in the 37th District Court in Bexar County Texas by a former consultant to the company, Benjamin E. Rodriguez. The suit alleges breach of an oral agreement to issue Mr. Rodriguez a 1% interest in our stock in the form of options or warrants for compensation for services he was engaged to perform for us. We believe that the plaintiff’s position is without merit and intend to vigorously defend this lawsuit. We do not expect the results of this claim or any other current proceeding to have a material adverse effect on our business, results of operations or financial condition.
80
Table of Contents
Contingent Liability
We previously recorded a $2.1 million charge to cost of revenue related to an unresolved contractual issue with a vendor. During the fourth quarter of 2009, we concluded that the obligation was no longer probable due to the lapsing of the associated contractual period. We believe the contingency has been resolved and thus we reversed the liability and recorded a benefit to cost of revenue.
Guarantees and Indemnifications
We have identified certain guarantees. When evaluating estimated losses for guarantees, we consider such factors as the degree of probability of an unfavorable outcome and the ability to make a reasonable estimate of the amount of loss. To date, we have not encountered material costs as a result of such obligations and have not accrued any liabilities related to such guarantees in our financial statements.
As permitted under Delaware law, we have agreements whereby we indemnify our officers and directors for certain events or occurrences while the officer or director is, or was serving, at our request in such capacity. The term of the indemnification period is for the officer’s or director’s lifetime. The maximum potential amount of future payments we could be required to make under these indemnification agreements is unlimited; however, we have a director and officer insurance policy that limits our exposure and enables us to recover a portion of any future amounts paid. As a result of the insurance policy coverage, we believe the estimated fair value of these indemnification agreements is minimal. We have no significant liabilities recorded for these agreements as of December 31, 2008 or December 31, 2009.
We have service level commitment obligations with most of our customers. As a result, service interruptions or significant equipment damage in our data centers, whether or not within our control, could result in us not achieving service level commitments to these customers resulting in an obligation to pay a service level credit. Our liability insurance does not cover ordinary service interruptions. In addition, any loss of services, equipment damage or inability to meet our service level commitment obligations, could reduce the confidence of our customers and could consequently impair our ability to obtain and retain customers, which would adversely affect both our ability to generate revenue and our operating results. We generally have the ability to determine such service level credits prior to the associated revenue being recognized and record an estimate for potential unrecorded amounts. The balance for credits resulting from our service level agreements within allowances for doubtful accounts and customer credits as of December 31, 2008 and 2009 was $990 thousand and $1.4 million, respectively.
In the normal course of business, we indemnify certain parties, including customers, vendors and lessors, with respect to certain matters. We have agreed to hold certain parties harmless against losses arising from a breach of representations or covenants, or out of intellectual property infringement or other claims made against certain parties. These agreements may limit the time within which an indemnification claim can be made and the amount of the claim. We have no significant liabilities recorded for these agreements as of December 31, 2008 or 2009.
In August 2007, we entered into a lease for our corporate headquarters. In connection with this lease, we also entered into a Master Economic Incentives Agreement with the Cities of Windcrest and San Antonio, Texas; Bexar County; and certain other parties, pursuant to which we agreed to locate existing and future employees at the new facility location. The agreement requires that we meet certain employment levels each year, with an ultimate employee base requirement of 4,500 jobs in Windcrest by December 31, 2012; however, if the job requirement in any grant agreement with the State of Texas is lower, then the job requirement under the MEIA is automatically adjusted downward. Consequently, because the Texas Enterprise Fund Grant agreement discussed below has been amended to reduce the state job requirement, the job requirement under the MEIA has been reduced to 1,774. In addition, the agreement requires that the median payroll of those employees be no less than $51 thousand per year. In exchange for these employment obligations, we will receive a 14 year exemption from
81
Table of Contents
most of the property taxes associated with the property. If we fail to meet these job creation requirements, we could lose a portion or all of the tax exemption provided during the 14 year period and would then be obligated to repay the exemption amount. We have met the requirements for the employment level and median payroll for December 31, 2009, and we believe that it is probable that we will meet the requirements throughout the exemption period. We elected to begin the exemption period in 2009.
Further, we entered into an agreement, with the State of Texas, under which we received $5.0 million in 2007, and may receive up to an additional of $17.0 million from the Texas Enterprise Fund in multiple installments provided that we meet certain new job levels in the State of Texas paying an average of at least $56 thousand per year (subject to a 2.0% per year increase commencing in 2012), beginning December 31, 2008 and sustain these jobs through December 31, 2021. If we fail to meet these job creation requirements, we will be required to repay the grant money with interest at the rate of 3.4% per year. If we fail to meet any of the annual job creation requirements, we may be required to repay cash previously received. As of December 31, 2009, the $5.0 million received was deferred and recorded as other non-current liabilities. Amounts will be recognized into income upon the achievement of the performance criteria and the determination that the cash is no longer refundable to the State of Texas.
On July 27, 2009, the Texas Enterprise Fund Grant agreement was amended to modify the job creation requirements. Under the amendment, the grant has been divided into four separate tranches. The first tranche, called “Basic Fund” in the amendment, is $8.5 million with a Job Target of 1,225 new jobs by December 2012 (in addition to the 1,436 jobs in place as of August 1, 2007 for a total of 2,661 jobs in Texas, two thirds of which must be located in Windcrest, Texas). We already have drawn $5.0 million of this grant. We can draw an additional $3.5 million when we reach 1,225 new jobs. If we do not create 1,225 new jobs in Texas by 2012, we will be required to repay the grant at a rate of $1,263 per job missed per year (clawback). The maximum clawback would be the amounts we draw plus 3.4% interest on such amounts per year. The remaining three tranches are at our option. We can draw an additional $13.5 million, based on the following amounts and milestones: $5.5 million if we create a total of 2,100 new jobs in Texas; another $5.25 million if we create a total of 3,000 new jobs in Texas; and $2.75 million more if we create a total of 4,000 new jobs in Texas. We are responsible for maintaining the jobs through January 2022. If we eliminate jobs for which we have drawn funds, the clawback is triggered.
In October 2008, we received a grant in partnership with the State of Texas and Alamo Community College District. Under the terms of the grant, we are eligible to receive free training courses through Alamo Community College and be reimbursed for certain internal training courses for an amount not to exceed $4.7 million through July 31, 2012. In order to fulfill our requirements, we must meet the employment requirements defined in the original agreement with the State of Texas from the Texas Enterprise Fund.
15. Common Stock
Common Stock
In October 2007, our stockholders approved an amendment to our certificate of incorporation to increase the number of authorized common shares from 30 million to 300 million. At December 31, 2008 and December 31, 2009, we had 117,154,094 and 123,773,977 shares of our common stock legally issued and outstanding, respectively.
We have one class of authorized common stock. The rights and privileges provided to our common stockholders are as follows:
| • | Dividend Rights—Subject to preferences that may apply to shares of preferred stock outstanding at the time, the holders of our common stock are entitled to receive dividends, at the discretion of our board of directors. |
82
Table of Contents
| • | Voting Rights—All holders of common stock are entitled to one vote per share on all matters to be voted on by Rackspace Hosting’s stockholders. |
| • | Right to Receive Liquidation Distributions—Upon liquidation, dissolution or winding-up, the holders of our common stock are entitled to share equally in all of our assets remaining after payment of all liabilities and the liquidation preferences of any outstanding preferred stock. |
Common Stock Issuances
In September 2007, we issued a total of 587,595 shares of common stock as partial consideration for the Mailtrust acquisition. The common stock issued was recorded at a price of $5.82 per share, resulting in an aggregate recorded amount of $3.4 million. In connection with the Mailtrust acquisition, we issued three employees 353,805 additional shares which were subject to a repurchase agreement. As of December 31, 2009, 50% of these shares had become fully vested and were no longer subject to the repurchase agreement. We also issued 15,000 shares of common stock in exchange for the remaining limited partnership interest in Mosso in July 2007, with a fair value of $87 thousand that was recorded to goodwill.
In March 2008, we sold 60,000 shares of our common stock at a price per share of $9.14 for a total purchase price of $548 thousand to a member of our executive team.
In August 2008, we completed our IPO, issuing 12.7 million shares of common stock at an IPO price of $12.50 per share.
In November 2008, per the terms of the merger agreement with Jungle Disk, we issued 247,545 shares of our common stock at a price of $5.405 per share and reissued 82,705 treasury shares at a price of $5.405 per share as partial consideration for the acquisition, resulting in an aggregate recorded amount of $1.8 million.
In 2009, we had two employee stock purchases under the 2008 Employee Stock Purchase Plan (ESPP). We issued a total of 26,836 shares of common stock as part of the purchases processed in 2009. No expense associated with these shares issued was recorded in 2009. The shares are also fully vested and unrestricted as of December 31, 2009.
In 2007, 2008, and 2009, we issued 472,760, 1,427,334 and 5,723,772 shares, respectively, related to employee stock options and stock awards. See Note 17 for additional disclosures related to the share-based compensation.
In 2009, per the terms of the merger agreements with Jungle Disk and Slicehost, and product integration milestones, we issued 140,935 shares of our common stock at a price of $5.428 per share as the first earnout for Jungle Disk in March 2009, resulting in an aggregate recorded amount of $765 thousand. In April 2009, we issued 200,000 shares of our common stock at a price of $5.574 per share as the first earnout for Slicehost, resulting in an aggregate recorded amount of $1.1 million. In August 2009, we issued 477,964 shares of our common stock at a price of $14.227 per share as the second earnout in Slicehost, resulting in an aggregate recorded amount of $6.8 million.
In 2007, 2008 and 2009, each of our non-employee board of directors was compensated with shares of common stock. We granted a total of 31,580, 24,405 and 50,376 shares of common stock as a portion of director’s fees to non-employee members of our board of directors in 2007, 2008 and 2009, respectively. We recorded $156 thousand, $289 thousand and $462 thousand of expense associate with these grants in 2007, 2008 and 2009, respectively. The shares are fully vested and unrestricted as of December 31, 2009. These amounts have been recorded as a component of general and administrative expense.
83
Table of Contents
Treasury Stock
In November 2008, we reissued all of our treasury shares as partial consideration for an acquisition.
Stock Split
On December 13, 2007, our board of directors approved a five-for-one split of our common stock that was effected in the form of a stock dividend to stockholders of record on January 31, 2008. In accordance with the preferred stock agreement, holders of preferred shares received four shares of common stock for every preferred share held as of the date of record.
Warrants
In August of 2008, all warrants outstanding were exercised in conjunction with our IPO.
16. Preferred Stock
Prior to our IPO in August 2008, we had 1,214,837 shares of Series A Convertible Preferred Stock (Preferred Stock), all of which were issued in 2001. These shares were all converted to common stock as part of our IPO. As of December 31, 2008 and 2009, there were 50 million authorized shares of preferred stock of which none was issued or outstanding.
17. Share-Based Compensation
In December 2007, we adopted the 2007 Equity and Incentive Plan, or Amended and Restated 2007 Stock Plan. Under the 2007 Stock Plan, incentive and non-qualified stock options or rights to purchase common stock may be granted to eligible participants. In addition to stock options, we may grant other equity awards such as stock appreciation rights, restricted stock awards, restricted stock units, performance awards, cash-based awards, and dividend equivalents. All awards, excluding incentive stock options, may be granted under the plan to employees, officers, directors, or any other non-employee service provider to the company. Incentive stock options may be granted only to employees of the company or a subsidiary. The exercise price of a stock option granted under the 2007 Stock Plan will be determined by the committee at the time the option is granted, and generally may not be less than 100% of the fair market value of a share of common stock as of the date of grant. The 2007 Stock Plan has an automatic share reserve increase effective the first day of each fiscal year beginning in 2009 with an amount equal to the lesser of (i) 10,000,000 shares, (ii) four percent of the number of shares on the last day of the immediately preceding fiscal year that are (a) outstanding, and (b) issuable pursuant to outstanding awards and award under prior plans, or (iii) such lesser number of shares determined by our board of directors. For fiscal year 2009 and 2010, this resulted in an increase of approximately 5.5 million and 5.7 million shares, respectively, available under our Stock Plans.
We also maintain the 1999 Stock Plan, the 2003 Stock Plan, the 2005 Stock Plan, the 2007 Stock Plan, and plans assumed through acquisitions, collectively referred to as the Stock Plans. Except for options granted in 2008 that were revalued in relation with our IPO, options are priced to be at least 100% of our common stock’s fair market value at the date of grant. Options have been granted for a term of ten years. Options granted under the Stock Plans generally vest either ratably over the requisite service period, at the end of three years, or based on performance milestones. Stock options issued under the 1999 Stock Option Plan have seven year terms and generally vest over three years. Stock options assumed through acquisitions have had seven to ten year terms and vest 25% the first year and ratably over the remaining periods.
As of December 31, 2009, the total number of shares authorized under all of our plans was 42.8 million shares, of which approximately 6.0 million shares were available for future grants.
84
Table of Contents
Outstanding stock awards were as follows:
| December 31, 2008 |
December 31, 2009 | |||
| Restricted stock units |
50,000 | 2,087,500 | ||
| Stock options |
19,255,644 | 16,841,232 | ||
| Total outstanding awards |
19,305,644 | 18,928,732 | ||
The following table summarizes our restricted stock unit activity as of December 31, 2009:
| Number of Units |
Weighted Average Grant Date Fair Value |
Weighted Average Remaining Contractual Life |
Aggregate Intrinsic Value (in thousands) | ||||||||
| Outstanding at December 31, 2008 |
50,000 | $ | 6.69 | 2.36 | $ | 269 | |||||
| Granted |
2,050,000 | $ | 5.45 | ||||||||
| Released |
(12,500 | ) | $ | 6.69 | |||||||
| Cancelled |
— | $ | — | ||||||||
| Outstanding at December 31, 2009 |
2,087,500 | $ | 5.47 | 3.06 | $ | 43,524 | |||||
On February 25, 2009, our board approved grants of restricted stock units (RSUs) to our chief executive officer and another member of the executive team. A total of 2,000,000 RSUs were granted. The vesting of the RSUs is dependent on the company’s total shareholder return (TSR) on its common stock compared to other companies in the Russell 2000 Index. In addition, the company’s TSR must be positive for vesting to occur. Of the total RSUs granted, 1,050,000 have a measurement period at the end of three years, and the remainder at the end of five years. The grant date fair value of these awards was $7.0 million and is being amortized over the awards’ service periods. The fair value was calculated using a Monte Carlo pricing model.
On December 14, 2009, our board approved an additional 50,000 RSU’s to an executive officer. These grants vest 25% at the end of each year over a four-year period. Stock-based compensation expense for service vesting RSUs is measured based on the closing fair market value of the company’s common stock on the date of grant.
The following table summarizes the activity under our stock option plans:
| Number of Shares |
Weighted Average Exercise Price |
Weighted Average Remaining Contractual Life |
Aggregate Intrinsic Value (in thousands) | ||||||||
| Outstanding at December 31, 2008 |
19,255,644 | $ | 4.94 | 7.01 | $ | 34,050 | |||||
| Granted |
4,225,600 | $ | 6.41 | ||||||||
| Exercised |
(5,711,272 | ) | $ | 2.46 | |||||||
| Cancelled |
(928,740 | ) | $ | 7.37 | |||||||
| Outstanding at December 31, 2009 |
16,841,232 | $ | 6.02 | 7.56 | $ | 249,801 | |||||
| Vested and exercisable at December 31, 2009 |
6,268,601 | $ | 3.18 | 6.14 | $ | 110,797 | |||||
| Vested and exercisable at December 31, 2009 and expected to vest thereafter * |
15,450,344 | $ | 5.85 | 7.47 | $ | 231,749 | |||||
| * | Includes reduction of shares outstanding due to estimated forfeitures |
85
Table of Contents
On February 25, 2009, our board approved the grant of 3.7 million stock options for certain employees with an exercise price of $5.09. The shares vest 25% at the end of each year over a four-year period and expire after ten years. The grant date fair value of these stock options was $2.97 per option using the Black-Scholes option pricing model.
The total pre-tax intrinsic value of the stock options exercised during fiscal 2007, 2008 and 2009 was $2.4 million, $12.4 million and $54.2 million, respectively.
The weighted average grant date fair value of stock options issued for the years ended 2007, 2008 and 2009 was $3.77, $7.84 and $3.71, respectively, using the Black-Scholes option pricing model with the following assumptions:
| Years Ended December 31, | ||||||
| 2007 | 2008 | 2009 | ||||
| Expected stock volatility |
65% | 60% - 65% | 57% - 61% | |||
| Expected dividend yield |
0.0% | 0.0% | 0.0% | |||
| Risk-free interest rate |
3.62% - 5.04% | 2.71% - 3.45% | 2.24% - 3.03% | |||
| Expected life |
6.25 years | 6.25 - 6.50 years | 6.25 years | |||
As of December 31, 2009, there was $44.3 million of total unrecognized compensation cost related to non-vested stock options granted under our various plans using the straight line method over a weighted average period of 2.15 years.
In 2008, Rackspace issued 403,000 performance-based stock options with a weighted average exercise price of $7.54 per share to certain employees. The vesting of these options is tied to defined performance criteria based on achievement of revenue and operating income targets. The options vest and are exercisable, in whole or in part, semi-annually over the performance period beginning on the grant date and ending on the five year anniversary of the vesting commencement date. As of December 31, 2009, these options were determined probable to vest and a total of $396 thousand and $884 thousand of share-based compensation expense was recognized for the years ended December 31, 2008 and 2009, respectively.
In the first quarter of 2008, we approved a broad-based option grant and issued stock options to certain employees under the 2007 Plan to purchase 3,793,940 shares of common stock with exercise prices of $9.14 per share and $10.30 per share. These options have a 3-year cliff vesting and expire ten years from the date of the grant.
We use the Black-Scholes option pricing model to value options granted to non-employees. Between 2006 and December 31, 2009, we issued 75,000 options to non-employee consultants with a range of exercise prices from $3.40 to $15.59. These options vest over a 4-year period, and expire after 5 years. We will continue to mark to market these options using the Black-Scholes model (using the variables discussed in the table above), until such time that they are vested. As of December 31, 2009, a total of 37,500 of these options had vested and were exercised. During 2007, 2008 and 2009, we recorded general and administrative expense of $97 thousand, $142 thousand and $528 thousand, respectively, related to these options.
Share-based compensation expense was recognized as follows:
| Year Ended December 31, | ||||||||||||
| (in thousands) | 2007 | 2008 | 2009 | |||||||||
| Cost of revenue |
$ | 433 | $ | 2,465 | $ | 2,850 | ||||||
| Sales and marketing |
598 | 2,141 | 2,884 | |||||||||
| General and administrative |
3,221 | 10,411 | 14,390 | |||||||||
| Pre-tax share-based compensation |
4,252 | 15,017 | 20,124 | |||||||||
| Less: Income tax benefit |
(1,526 | ) | (5,047 | ) | (7,059 | ) | ||||||
| Total share-based compensation expense, net of tax |
$ | 2,726 | $ | 9,970 | $ | 13,065 | ||||||
86
Table of Contents
18. Income Taxes
The provision for income taxes consisted of:
| (In thousands) | 2007 | 2008 | 2009 | |||||||||
| Current: |
||||||||||||
| Federal |
$ | 8,042 | $ | (9,396 | ) | $ | (5,911 | ) | ||||
| Foreign |
4,322 | 6,762 | 10,243 | |||||||||
| State |
1,080 | 1,917 | 2,509 | |||||||||
| Total current |
13,444 | (717 | ) | 6,841 | ||||||||
| Deferred: |
||||||||||||
| Federal |
(2,986 | ) | 13,611 | 10,497 | ||||||||
| Foreign |
(435 | ) | (1,636 | ) | (826 | ) | ||||||
| State |
(58 | ) | (273 | ) | (184 | ) | ||||||
| Total deferred |
(3,479 | ) | 11,702 | 9,487 | ||||||||
| Total provision for income taxes |
$ | 9,965 | $ | 10,985 | $ | 16,328 | ||||||
Income before income taxes included income from foreign operations of approximately $12.2 million, $18.7 million, and $31.2 million for years ended December 31, 2007, 2008, and 2009, respectively.
A reconciliation of the statutory federal tax rate to the effective tax rate is as follows:
| 2007 | 2008 | 2009 | |||||||
| Statutory federal tax rate |
35.0 | % | 35.0 | % | 35.0 | % | |||
| State taxes, net of federal benefit |
2.3 | % | 3.2 | % | 3.3 | % | |||
| Tax rate differentials for international jurisdictions |
-2.1 | % | -2.7 | % | -3.2 | % | |||
| Permanent items, including non deductible stock based compensation and meals & entertainment |
0.5 | % | 0.4 | % | 0.3 | % | |||
| Other, net |
0.2 | % | -2.3 | % | -0.3 | % | |||
| Effective tax rate |
35.9 | % | 33.6 | % | 35.1 | % | |||
87
Table of Contents
Deferred Taxes
Deferred income taxes reflect the net effects of temporary differences between the carrying amounts of assets and liabilities for financial reporting purposes and the amounts used for income tax purposes. Significant components of our deferred tax assets and liabilities are as follows:
| (In thousands) | 2008 | 2009 | ||||||
| Deferred tax assets: |
||||||||
| Share-based compensation |
$ | 6,075 | $ | 9,970 | ||||
| Accounts receivable |
935 | 1,245 | ||||||
| Vacation accruals |
879 | 1,191 | ||||||
| Deferred revenue |
3,407 | 2,855 | ||||||
| Deferred rent |
170 | 1,783 | ||||||
| Accruals not currently deductible |
1,840 | 3,226 | ||||||
| Net operating loss carryforwards |
987 | 5,432 | ||||||
| Research and development credits |
— | 1,103 | ||||||
| Other |
1,290 | 1,095 | ||||||
| Total gross deferred tax assets |
15,583 | 27,900 | ||||||
| Deferred tax liabilities: |
||||||||
| Depreciation |
23,772 | 45,475 | ||||||
| Prepaids |
1,273 | 1,445 | ||||||
| Other |
— | 191 | ||||||
| Total gross deferred tax liabilities |
25,045 | 47,111 | ||||||
| Net deferred tax assets (liabilities) |
$ | (9,462 | ) | $ | (19,211 | ) | ||
Realization of deferred tax assets is dependent upon future earnings, if any, the timing and amount of which are uncertain. A valuation allowance was not established or deemed necessary based upon the determination that future profits are anticipated.
The company has not recognized a deferred tax liability for undistributed earnings of its UK subsidiary because such earnings are considered indefinitely invested in a foreign country. As of December 31, 2009, undistributed earnings of the company’s UK subsidiary considered indefinitely invested were approximately $56.1 million. The unrecognized deferred tax liability is dependent on many factors including withholding taxes under current tax treaties and foreign tax credits and is estimated to be $3.6 million.
We have $25.6 million of federal net operating loss carryforwards and $1.2 million of federal tax credit carryforwards expiring at various dates through 2030. The federal net operating loss carryforwards include approximately $16.6 million of gross windfall tax benefits from stock option exercises that have not been recorded as of December 31, 2009. We have $6.8 million of foreign net operating loss carryforwards that have an indefinite expiration date, as the foreign jurisdictions generating these net operating losses provide carryforward utilization without time limit to offset future profits. These deferred tax assets will be recorded as an increase to additional paid in capital when the related tax benefits are realized.
In 2008, we received notification from the State of Texas that our application for the Texas Enterprise program was approved. Upon achieving the specific requirements of the program, which include job creation requirements, we may receive sales tax reimbursements from the State of Texas not to exceed $3.75 million over a five year period. No refunds were received for the year ended December 31, 2009.
Uncertain Tax Positions
At the end of fiscal year 2007, we began accounting for uncertainty in income taxes recognized in an enterprise’s financial statements using a two-step process to determine the amount of tax benefit to be recognized. First, the tax position must be evaluated to determine the likelihood that it will be sustained upon
88
Table of Contents
external examination. If the tax position is deemed “more-likely-than-not” to be sustained, the tax position is then assessed to determine the amount of benefit to recognize in the financial statements. The amount of the benefit that may be recognized is the largest amount that has a greater than 50% likelihood of being realized upon ultimate settlement. We had no changes to the amount of our income tax payable as a result of implementing this accounting method. Prior to adoption, our policy was to classify accruals for uncertain positions as a current liability unless it was highly probable that there would not be a payment or settlement for such identified risks for a period of at least a year. There is a comprehensive model for the financial statement recognition, measurement, presentation and disclosure of uncertain tax positions taken or expected to be taken in income tax returns. Unrecognized tax benefits represent tax positions for which reserves have been established.
A reconciliation of our unrecognized tax benefits, excluding accrued interest, for 2008 and 2009 is as follows:
| (In thousands) | 2008 | 2009 | ||||
| Balance at beginning of year |
$ | — | $ | 252 | ||
| Additions based on tax positions related to the current year |
143 | 104 | ||||
| Additions for tax positions of prior years |
109 | — | ||||
| Reductions for tax positions of prior years |
— | — | ||||
| Settlements |
— | — | ||||
| Balance at end of year |
$ | 252 | $ | 356 | ||
At December 31, 2009, approximately $356 thousand of these unrecognized tax benefits, if recognized, would favorably affect our effective tax rate in any future period. We do not expect the amount of the unrecognized tax benefits disclosed above to change significantly over the next 12 months.
We are subject to U.S. federal income tax and various state, local, and international income taxes in numerous jurisdictions. Our domestic and international tax liabilities are subject to the allocation of revenue and expenses in different jurisdictions and the timing of recognizing revenue and expenses. Additionally, the amount of income taxes paid is subject to our interpretation of applicable tax laws in the jurisdictions in which we file.
We currently file income tax returns in the U.S., and all foreign jurisdictions in which we have entities, which are periodically under audit by federal, state, and international tax authorities. These audits can involve complex matters that may require an extended period of time for resolution. We remain subject to U.S. federal and state income tax examinations for the tax years 2005 through 2008, to U.K. income tax examinations for the years 2002 through 2008 and to Hong Kong income tax examinations for the tax year 2008. There are no income tax examinations currently in process. Although the outcome of open tax audits is uncertain, in management’s opinion, adequate provisions for income taxes have been made. If actual outcomes differ materially from these estimates, they could have a material impact on our financial condition and results of operations. Differences between actual results and assumptions, or changes in assumptions in future periods are recorded in the period they become known. To the extent additional information becomes available prior to resolution, such accruals are adjusted to reflect probable outcomes. During 2009 we received federal income tax refunds totaling $10.1 million related to the 2008 tax period. We experienced a taxable loss in 2009 primarily as a result of the accelerated depreciation allowed under the 2009 American Recovery and Reinvestment Act passed in February 2009.
Rackspace takes certain non-income tax positions in the jurisdictions in which it operates and may be subject to audit from these jurisdictions. Rackspace is also involved in related non-income tax litigation matters. We believe our positions are supportable and we have accrued for known exposure; however, significant judgment is required in determining the ultimate outcome of such matters. In the normal course of business, our position and conclusion related to these non-income taxes may be challenged and assessments may be made. To
89
Table of Contents
the extent new information is obtained and changes our views on our positions, probable outcome of assessments, or litigation, changes in estimates to accrued liabilities would be recorded in the period the determination is made.
We recognize interest expense and penalties related to income tax matters in interest and penalties expense within other income (expense) on our consolidated statements of income and not as income tax expense. As of December 31, 2008 and 2009, we had no accrued interest and penalties on the consolidated balance sheets. For the years ended 2007, 2008 and 2009, no amount for interest or penalties related to unrecognized tax benefits were recorded in the consolidated statements of income.
19. Comprehensive Income
Total comprehensive income was as follows:
| Year Ended December 31, | |||||||||||
| (In thousands) | 2007 | 2008 | 2009 | ||||||||
| Net income |
$ | 17,829 | $ | 21,703 | $ | 30,218 | |||||
| Derivative instrument, net of deferred taxes of $173, $842 and $(379) for the years ended December 31, 2007, 2008 and 2009 |
(322 | ) | (1,564 | ) | 704 | ||||||
| Foreign currency cumulative translation adjustment, net of taxes of $5, $3,966 and $(1,393) for the years ended December 31, 2007, 2008 and 2009 |
105 | (14,976 | ) | 5,066 | |||||||
| Total other comprehensive income (loss) |
(217 | ) | (16,540 | ) | 5,770 | ||||||
| Total comprehensive income |
$ | 17,612 | $ | 5,163 | $ | 35,988 | |||||
The changes in accumulated other comprehensive income (loss) for the years ended December 31, 2008 and 2009 were as follows:
| (In thousands) | Derivative Instrument |
Translation Adjustment |
Accumulated other comprehensive income (loss) |
|||||||||
| Balance at December 31, 2007 |
$ | (322 | ) | $ | 835 | $ | 513 | |||||
| 2008 changes in fair value |
(1,564 | ) | — | (1,564 | ) | |||||||
| 2008 translation adjustment |
— | (14,976 | ) | (14,976 | ) | |||||||
| Balance at December 31, 2008 |
$ | (1,886 | ) | $ | (14,141 | ) | $ | (16,027 | ) | |||
| 2009 changes in fair value |
704 | — | 704 | |||||||||
| 2009 translation adjustment |
— | 5,066 | 5,066 | |||||||||
| Balance at December 31, 2009 |
$ | (1,182 | ) | $ | (9,075 | ) | $ | (10,257 | ) | |||
20. Segment Information
Operating segments are defined as components of an enterprise for which separate financial information is available and evaluated regularly by the chief operating decision-maker, or decision-making group, in deciding how to allocate resources and in assessing performance. Our chief operating decision-maker is our chief executive officer. Our chief executive officer reviews financial information presented on a consolidated basis, accompanied by information by reporting unit and geographic region for purposes of evaluating financial performance and allocating resources. We are organized as, and operate three operating segments based around our products and services. The company’s service offerings all provide computing power to similar types of
90
Table of Contents
customers. Furthermore, the service offerings have similar production processes, deliver their services in a similar manner and use the same data centers and similar technologies. As a result of our evaluation of the criteria for aggregation by products and services, we determined we have one reportable segment, which we describe as Hosting.
Revenue is attributed by geographic location based on the Rackspace Hosting operating location that enters into the contractual relationship with the customer, either the U.S. or outside the U.S., primarily the U.K. Total net revenue by geographic region was as follows:
| Year Ended December 31, | |||||||||
| (In thousands) | 2007 | 2008 | 2009 | ||||||
| United States |
$ | 260,747 | $ | 383,524 | $ | 467,901 | |||
| Outside United States |
101,270 | 148,409 | 161,086 | ||||||
| Total net revenue |
$ | 362,017 | $ | 531,933 | $ | 628,987 | |||
Our primary long-lived assets are primarily located in the U.S. and the U.K., and to a lesser extent Hong Kong. Property and equipment, net was as follows:
| (In thousands) | December 31, 2008 |
December 31, 2009 | ||||
| United States |
$ | 294,585 | $ | 344,353 | ||
| Outside United States |
67,457 | 88,618 | ||||
| Total property and equipment, net |
$ | 362,042 | $ | 432,971 | ||
21. Employee Benefit Plans
We sponsor a defined contribution retirement plan which has been determined by the IRS to be qualified as a 401(k) plan, or the Plan. The Plan covers substantially all employees. The Plan provides for voluntary tax deferred contributions of up to 100% of gross compensation, subject to certain IRS limitations. Based on approval by the board of directors, we may make matching contributions to the Plan. No matching contributions have been made as of December 31, 2009.
We also sponsor a non-mandatory defined contribution plan for our employees located in the U.K. Pursuant to this plan, we contribute on a monthly basis a certain percentage of the employee’s salary. The plan is non-contributory, thus the employee is not obligated to make any contribution to the plan and contributions vest immediately. During 2007, 2008 and 2009, expense recognized was $616 thousand, $1.0 million and $1.2 million, respectively.
22. Risks and Uncertainties
Our future results of operations involve a number of risks and uncertainties. Factors that could affect our future operating results and cause actual results to vary materially from expectations include, but are not limited to: current depressed economic conditions; uncertainty in the potential market for our services; increasing competition; dependence on our existing management and key personnel; and protection of our intellectual property rights.
23. Related Party Transactions
We lease some facilities from a partnership controlled by our chairman of the board of directors. For these leases, we recognized $441 thousand, $620 thousand and $726 thousand of rent expense on our consolidated statements of income for the years ended December 31, 2007, 2008 and 2009, respectively.
91
Table of Contents
24. Subsequent Events
We have evaluated subsequent events and transactions for potential recognition or disclosure in the financial statements through February 26, 2010, the day the consolidated financial statements were issued.
92
Table of Contents
SUPPLEMENTARY FINANCIAL DATA
| Quarters Ended (In thousands, except per share amounts) |
March 31, 2008 |
June 30, 2008 |
September 30, 2008 |
December 31, 2008 | ||||||||
| (Unaudited) | ||||||||||||
| Net revenue |
$ | 119,613 | $ | 130,829 | $ | 138,354 | $ | 143,137 | ||||
| Cost of revenue |
$ | 39,223 | $ | 42,842 | $ | 45,499 | $ | 45,019 | ||||
| Gross margin |
$ | 80,390 | $ | 87,987 | $ | 92,855 | $ | 98,118 | ||||
| Net income |
$ | 5,442 | $ | 4,182 | $ | 5,235 | $ | 6,844 | ||||
| Earnings per share—basic |
$ | 0.05 | $ | 0.04 | $ | 0.05 | $ | 0.06 | ||||
| Earnings per share—diluted |
$ | 0.05 | $ | 0.04 | $ | 0.04 | $ | 0.06 | ||||
| Cash and cash equivalents |
$ | 27,497 | $ | 35,094 | $ | 260,318 | $ | 238,407 | ||||
| March 31, 2009 |
June 30, 2009 |
September 30, 2009 |
December 31, 2009 | |||||||||
| (Unaudited) | ||||||||||||
| Net revenue |
$ | 145,077 | $ | 151,995 | $ | 162,399 | $ | 169,516 | ||||
| Cost of revenue |
$ | 46,210 | $ | 48,235 | $ | 53,093 | $ | 53,405 | ||||
| Gross margin |
$ | 98,867 | $ | 103,760 | $ | 109,306 | $ | 116,111 | ||||
| Net income |
$ | 6,588 | $ | 6,991 | $ | 7,604 | $ | 9,035 | ||||
| Earnings per share—basic |
$ | 0.06 | $ | 0.06 | $ | 0.06 | $ | 0.07 | ||||
| Earnings per share—diluted |
$ | 0.05 | $ | 0.06 | $ | 0.06 | $ | 0.07 | ||||
| Cash and cash equivalents |
$ | 135,020 | $ | 147,877 | $ | 102,950 | $ | 125,425 | ||||
93
Table of Contents
ITEM 9—CHANGES IN AND DISAGREEMENTS WITH ACCOUNTANTS ON ACCOUNTING AND FINANCIAL DISCLOSURE
None.
ITEM 9A—CONTROLS AND PROCEDURES
Evaluation of disclosure controls and procedures
Under the supervision and with the participation of our senior management, including our chief executive officer and chief financial officer, we conducted an evaluation of the effectiveness of the design and operation of our disclosure controls and procedures, as defined in Rules 13a-15(e) and 15d-15(e) under the Securities Exchange Act of 1934, as amended, as of the end of the period covered by this annual report (the “Evaluation Date”). Based on this evaluation, our chief executive officer and chief financial officer concluded as of the Evaluation Date that our disclosure controls and procedures were effective such that the information relating to the company, including our consolidated subsidiaries, required to be disclosed in our SEC reports (i) is recorded, processed, summarized and reported within the time periods specified in SEC rules and forms, and (ii) is accumulated and communicated to our management, including our chief executive officer and chief financial officer, as appropriate to allow timely decisions regarding required disclosure.
Changes in internal control over financial reporting
We regularly review our system of internal control over financial reporting and make changes to our processes and systems to improve controls and increase efficiency, while ensuring that we maintain an effective internal control environment. Changes may include such activities as implementing new, more efficient systems, consolidating activities, and migrating processes.
There were no changes in our internal control over financial reporting that occurred during 2009 that have materially affected, or are reasonably likely to materially affect, our internal control over financial reporting.
Inherent Limitations of Internal Controls
Our management, including our chief executive officer and chief financial officer, does not expect that our disclosure controls and procedures or our internal controls will prevent all error and all fraud. A control system, no matter how well conceived and operated, can provide only reasonable, not absolute, assurance that the objectives of the control system are met. Because of the inherent limitations in all control systems, no evaluation of controls can provide absolute assurance that all control issues and instances of fraud, if any, within the company have been detected. These inherent limitations include the realities that judgments in decision-making can be faulty, and that breakdowns can occur because of a simple error or mistake. Additionally, controls can be circumvented by the individual acts of some persons, by collusion of two or more people, or by management override of the control. The design of any system of controls also is based in part upon certain assumptions about the likelihood of future events, and there can be no assurance that any design will succeed in achieving its stated goals under all potential future conditions. Over time, controls may become inadequate because of changes in conditions, or the degree of compliance with the policies or procedures may deteriorate. Because of the inherent limitations in a cost-effective control system, misstatements due to error or fraud may occur and not be detected.
Report of Management on Internal Control over Financial Reporting
Our management is responsible for establishing and maintaining adequate internal control over financial reporting, as defined in Exchange Act Rule 13a-15(f). Management conducted an evaluation of the effectiveness of our internal control over financial reporting based on the framework in Internal Control – Integrated
94
Table of Contents
Framework issued by the Committee of Sponsoring Organizations of the Treadway Commission. Based on this evaluation, management concluded that our internal control over financial reporting was effective as of December 31, 2009. Management reviewed the results of its assessment with our Audit Committee. The effectiveness of our internal control over financial reporting as of December 31, 2009 has been audited by KPMG LLP, an independent registered public accounting firm, as stated in its attestation report, which is included in Item 8 of this Annual Report on Form 10-K.
None.
95
Table of Contents
ITEM 10—DIRECTORS, EXECUTIVE OFFICERS AND CORPORATE GOVERNANCE
The information required by this item is incorporated by reference to Rackspace Hosting’s Proxy Statement for its 2010 Annual Meeting of Stockholders to be filed with the SEC within 120 days after the end of the fiscal year ended December 31, 2009.
We have adopted the Rackspace Hosting, Inc. Code of Business Conduct and Ethics (the “code of conduct”) that applies to all of our employees, officers and directors, including without limitation, our Chief Executive Officer, Chief Financial Officer, and Corporate Controller, and other finance organization employees. The code of conduct, as well as any waiver of a provision of the code of conduct granted to any senior officer or director or material amendment to the code of conduct, if any, may be found in the “Investors” section of our website at www.rackspace.com.
ITEM 11—EXECUTIVE COMPENSATION
The information required by this item is incorporated by reference to Rackspace Hosting’s Proxy Statement for its 2010 Annual Meeting of Stockholders to be filed with the SEC within 120 days after the end of the fiscal year ended December 31, 2009.
ITEM 12—SECURITY OWNERSHIP OF CERTAIN BENEFICIAL OWNERS AND MANAGEMENT AND RELATED PARTY STOCKHOLDER MATTERS
The information required by this item is incorporated by reference to Rackspace Hosting’s Proxy Statement for its 2010 Annual Meeting of Stockholders to be filed with the SEC within 120 days after the end of the fiscal year ended December 31, 2009.
ITEM 13—CERTAIN RELATIONSHIPS AND RELATED TRANSACTIONS, AND DIRECTOR INDEPENDENCE
The information required by this item is incorporated by reference to Rackspace Hosting’s Proxy Statement for its 2010 Annual Meeting of Stockholders to be filed with the SEC within 120 days after the end of the fiscal year ended December 31, 2009.
ITEM 14—PRINCIPAL ACCOUNTANT FEES AND SERVICES
The information required by this item is incorporated by reference to Rackspace Hosting’s Proxy Statement for its 2010 Annual Meeting of Stockholders to be filed with the SEC within 120 days after the end of the fiscal year ended December 31, 2009.
ITEM 15—EXHIBITS AND FINANCIAL STATEMENT SCHEDULES
| (a) | Financial Statements |
| (1) | The financial statements filed as part of this report are listed on the index to financial statements on page 2. |
| (2) | Any financial statement schedules required to be filed as part of this report are set forth in section (c) below. |
96
Table of Contents
| (b) | Exhibits—See Index to Exhibits at the end of this report, which is incorporated by reference. |
| (c) | Financial Statement Schedules |
| The following financial statement schedule is filed as a part of this Annual Report: |
| Schedule II—Valuation and Qualifying Accounts |
All other schedules are omitted because they are not required or the required information is shown in the financial statements or notes thereto.
| Beginning Balance |
Additions Charged to Net Revenues, and Costs and Expenses |
Write-offs | Ending Balance | ||||||||||
| Allowance for doubtful accounts and customer credits for the years ending December 31: |
|||||||||||||
| 2007 |
$ | 2,037 | $ | 9,794 | $ | (8,990 | ) | $ | 2,841 | ||||
| 2008 |
$ | 2,841 | $ | 6,465 | $ | (6,011 | ) | $ | 3,295 | ||||
| 2009 |
$ | 3,295 | $ | 13,364 | $ | (12,361 | ) | $ | 4,298 | ||||
97
Table of Contents
Pursuant to the requirements of Section 13 or 15(d) of the Securities Exchange Act of 1934, the Registrant has duly caused this Annual Report on Form 10-K to be signed on its behalf by the undersigned, thereunto duly authorized, on February 26, 2010.
| Rackspace Hosting, Inc. | ||||||
| Date: | February 26, 2010 | By: | /s/ A. LANHAM NAPIER | |||
| A. Lanham Napier | ||||||
| President, Chief Executive Officer, and Director | ||||||
| (Principal Executive Officer) | ||||||
Pursuant to the requirements of the Securities Exchange Act of 1934, this report has been signed below by the following persons on behalf of the Registrant and in the capacities and on the dates indicated.
| Name |
Title |
Date | ||
| /S/ A. LANHAM NAPIER A. Lanham Napier |
President, Chief Executive Officer, and Director (Principal Executive Officer) |
February 26, 2010 | ||
| /S/ BRUCE R. KNOOIHUIZEN Bruce R. Knooihuizen |
Senior Vice President, Chief Financial Officer, and Treasurer (Principal Financial and Accounting Officer) |
February 26, 2010 | ||
| /S/ GRAHAM WESTON Graham Weston |
Chairman |
February 26, 2010 | ||
| /S/ S. JAMES BISHKIN S. James Bishkin |
Director |
February 26, 2010 | ||
| /S/ MARK P. MELLIN Mark P. Mellin |
Director |
February 26, 2010 | ||
| /S/ PALMER L. MOE Palmer L. Moe |
Director |
February 26, 2010 | ||
| /S/ FRED REICHHELD Fred Reichheld |
Director |
February 26, 2010 | ||
| /S/ GEORGE J. STILL, JR. George J. Still, Jr. |
Director |
February 26, 2010 | ||
98
Table of Contents
INDEX TO EXHIBITS
| Exhibits |
Description | |
| 3.1 | Certificate of Incorporation of the Registrant (2) | |
| 3.3 | Amended and Restated Bylaws of the Registrant (3) | |
| 4.1 | Form of Common Stock Certificate of the Registrant (3) | |
| 4.2 | Founder’s Registration Rights Agreement dated October 1, 2002 among the Registrant and certain stockholders (1) | |
| 4.3 | Investor’s Registration Rights Agreement dated October 1, 2002 among the Registrant and certain stockholders (1) | |
| 10.1 | Form of Indemnification Agreement for directors and officers (2) | |
| 10.2 | 1999 Assumed Stock Option Plan and form of agreement thereunder (1) | |
| 10.3 | 2003 Stock Option Plan and form of agreement thereunder (1) | |
| 10.4 | 2005 Non-Qualified Stock Option Plan and form of agreement thereunder (1) | |
| 10.5 | Form of Share Option Agreement (U.K.) (4) | |
| 10.6 (A) | Amended and Restated 2007 Long-Term Incentive Plan and form of agreement thereunder (2) | |
| 10.6 (B) | Certificate of Amendment to Amended and Restated 2007 Long-Term Incentive Plan (2) | |
| 10.6 (C) | Form of RSU Agreement Under 2007 Long Term Incentive Plan (Time Based) | |
| 10.6 (D) | Form of RSU Agreement Under 2007 Long Term Incentive Plan (Performance Based) | |
| 10.7 | Webmail.us, Inc. 2004 Stock Incentive Plan, as amended in 2006 (1) | |
| 10.8 | 2008 Employee Stock Purchase Plan and form of agreement thereunder (2) | |
| 10.9 | Rackspace US, Inc. Deferred Compensation Plan (3) | |
| 10.10 | Office Building Lease dated March 16, 2004 between Data Rose Limited Partnership and Rackspace Headquarters, LLC, as amended on April 26, 2004, June 1, 2006, and April 17, 2008 (1) | |
| 10.11 | Ground Lease Agreement dated August 2, 2007, between Windcrest Economic Development Corporation and Rackspace US, Inc., as amended on April 24, 2008 (1) | |
| 10.12 | Walzem Road Redevelopment Project Master Economic Incentives Agreement among the City of Windcrest, Texas, the City of San Antonio, Texas, the County of Bexar, Texas, the Windcrest Economic Development Corporation, the Windcrest Economic Development Company, LLC, and Rackspace US, Inc. dated August 2, 2007 (1) | |
| 10.13 | City Economic Development Grant Agreement between the City of Windcrest, Texas and Rackspace US, Inc. dated August 2, 2007 (1) | |
| 10.14 | County Economic Development Grant Agreement between Bexar County, Texas and Rackspace US, Inc. dated August 2, 2007 (1) | |
| 10.15 | Developer Economic Development Grant Agreement among the City of Windcrest, Texas, the Windcrest Economic Development Corporation, and Windcrest Economic Development Company, LLC dated August 2, 2007 (1) | |
| 10.16 | Economic Development Agreement between the State of Texas and Rackspace US, Inc. dated August 1, 2007 (1) | |
| 10.17 | Office Building Lease Agreement dated February 22, 2000 between Santa Clara Land Company, Ltd. and the Registrant, as amended on March 30, 2000, December 9, 2004, and March 1, 2007 (1) | |
Table of Contents
| Exhibits |
Description | |
| 10.18 | Storage Lease effective March 1, 2004 between Santa Clara Land Company, Ltd. and the Registrant (2) | |
| 10.19 (A) | Lease Agreement dated January 28, 2008 between Santa Clara Land Company, Ltd. and Rackspace US, Inc. (1) | |
| 10.19 (B) | First Amendment to Office Building Lease Agreement between Santa Clara Land Company, Ltd. and Rackspace US, Inc., dated July 10, 2008 (3) | |
| 10.20 | Agreement of Lease dated as of April 24, 2002 between Level 3 Communications LLC and Rackspace SATDC, Ltd., as amended April 16, 2004 (1) | |
| 10.21 | Assignment of Lease effective December 1, 2006 between Qwest Communications Corporation and Rackspace DAL1DC Management, LLC with attached Lease dated January 26, 2000 between CSI Industrial Development L.P. and Qwest Communication Corporation, as amended January 23, 2001 (1) | |
| 10.22 | Third Amendment to Lease Agreement dated January 8, 208 between CLPF-Heritage Four, L.P. and Rackspace DAL1DC Management LLC (1) | |
| 10.23 | Consent to Assignment and Other Agreements dated November 30, 2006 by and among CLPF Heritage Four L.P., Macro Holding, Inc., Qwest Communications Corporation, and Rackspace DAL1DC, Ltd. (1) | |
| 10.24 | Deed of Lease dated January 16, 2003 between Williams Communications, LLC and Rackspace IAD1DC, Ltd. (1) | |
| 10.25 | Agreement for Lease dated April 2, 2007 between Slough Trading Estate Limited and Rackspace Managed Hosting Limited (1) | |
| 10.26 | Amended and Restated Revolving Credit Agreement dated August 31, 2007 between Comerica Bank and Rackspace US, Inc., as amended October 11, 2007, December 7, 2007, February 25, 2008, and April 23, 2008 (1) | |
| 10.27 | ISDA Master Agreement and Schedule between Comerica Bank and Rackspace US, Inc. dated September 26, 2007 (1) | |
| 10.28 | Offer letter from the Registrant to Klee Kleber dated February 5, 2007 (2) | |
| 10.29 | Global Amendment to the Registrant’s 1999 Assumed Stock Option Plan, 2003 Stock Option Plan, 2005 Non-Qualified Stock Option Plan, Webmail.us, Inc. 2004 Stock Incentive Plan and Amended and Restated 2007 Long-Term Incentive Plan (2) | |
| 10.30 | Compromise Agreement between Rackspace Limited and Doug Loewe dated June 26, 2008 (3) | |
| 10.31 | Lease agreement between Rackspace Asia Limited and PCCW Powerhouse Data Center Services (HK) Ltd. dated July 3, 2008 (3) | |
| 10.32 | Offer letter from the Registrant to Bruce Knooihuizen, dated December 19, 2007 (11) | |
| 10.33 | Severance and Release Agreement between the Registrant and David Belle-Isle, dated October 31, 2008 (11) | |
| 10.34 | Offer letter from the Registrant to John Lionato, dated April 3, 2008 (11) | |
| 10.35 | Option Exercise Extension Agreement between the Registrant and Glenn Reinus, dated December 31, 2008 (11) | |
| 10.36 | Non-Employee Director Compensation Schedule (11) | |
| 10.37 | Offer letter from the Registrant to James Lewandowski, dated September 9, 2008 (11) | |
| 10.38 | Rackspace Standard Form of Employment Agreement (11) | |
Table of Contents
| Exhibits |
Description | |
| 10.39 | Lease Agreement by and between Grizzly Ventures LLC and Rackspace US, Inc. (5) | |
| 10.40 | Amendment to Offer Letter, dated May 14, 2009, by and between Rackspace US, Inc. and John Lionato (6) | |
| 10.41 | Fifth Amendment to Amended and Restated Revolving Credit Agreement (7) | |
| 10.42 | Amendment Number One to the Economic Development Agreement between the State of Texas and Rackspace US, Inc. (8) | |
| 10.43 | Lease Agreement by and between Tarantula Ventures LLC and Rackspace US, Inc. (9) | |
| 10.44 | Service Order and Statement of Works between Equinix (UK) LTD and Rackspace LIMI (9) | |
| 10.45 | First Amendment to Lease Agreement by and between Grizzly Ventures LLC and Rackspace US, Inc. (10) | |
| 10.46 | Employment Agreement between Rackspace US, Inc. and Mark Roenigk, dated December 14, 2009 | |
| 21.1 | List of subsidiaries of the Registrant (11) | |
| 23.1 | Consent of KPMG LLP, Independent Registered Public Accounting Firm. | |
| 31.1 | Certification of Chief Executive Officer Pursuant to Section 302 of the Sarbanes-Oxley Act of 2002 | |
| 31.2 | Certification of Chief Financial Officer Pursuant to Section 302 of the Sarbanes-Oxley Act of 2002 | |
| 32.1 | Certification of Chief Executive Officer Pursuant to Section 906 of the Sarbanes-Oxley Act of 2002 | |
| 32.2 | Certification of Chief Financial Officer Pursuant to Section 906 of the Sarbanes-Oxley Act of 2002 | |
| (1) | Previously filed as an Exhibit to the Company’s Registration Statement on Form S-1 (File No. 333-150469), filed April 25, 2008. |
| (2) | Previously filed as an Exhibit to the Company’s Amendment No. 1 to the Registration Statement on Form S-1 (File No. 333-150469), filed June 18, 2008. |
| (3) | Previously filed as an Exhibit to the Company’s Amendment No. 2 to the Registration Statement on Form S-1 (File No. 333-150469), filed July 15, 2008. |
| (4) | Previously filed as an Exhibit to the Company’s Amendment No. 1 to the Registration Statement on Form S-8 (File No. 333-153009), filed February 4, 2009. |
| (5) | Previously filed as an Exhibit to the Company’s Quarterly Report on Form 10-Q for the Quarter ended March 31, 2009 (File No. 001-34143), filed May 12, 2009. |
| (6) | Previously filed as an Exhibit to the Company’s Current Report on Form 8-K (File No. 001-34143), filed May 20, 2009. |
| (7) | Previously filed as an Exhibit to the Company’s Current Report on Form 8-K (File No. 001-34143), filed June 23, 2009. |
| (8) | Previously filed as an Exhibit to the Company’s Current Report on Form 8-K (File No. 001-34143), filed July 30, 2009. |
| (9) | Previously filed as an Exhibit to the Company’s Quarterly Report on Form 10-Q for the Quarter ended June 30, 2009 (File No. 001-34143), filed August 13, 2009. |
| (10) | Previously filed as an Exhibit to the Company’s Quarterly Report on Form 10-Q for the Quarter ended September 30, 2009 (File No. 001-34143), filed November 12, 2009. |
| (11) | Previously filed as an Exhibit to the Company’s Annual Report on Form 10-K for the Year ended December 31, 2008 (File No. 001-34143), filed March 2, 2009. |