Attached files
| file | filename |
|---|---|
| EX-99.3 - EX-99.3 - Evolve Transition Infrastructure LP | a16-19536_1ex99d3.htm |
| EX-99.2 - EX-99.2 - Evolve Transition Infrastructure LP | a16-19536_1ex99d2.htm |
| EX-2.3 - EX-2.3 - Evolve Transition Infrastructure LP | a16-19536_1ex2d3.htm |
| EX-2.2 - EX-2.2 - Evolve Transition Infrastructure LP | a16-19536_1ex2d2.htm |
| EX-2.1 - EX-2.1 - Evolve Transition Infrastructure LP | a16-19536_1ex2d1.htm |
| 8-K - 8-K - Evolve Transition Infrastructure LP | a16-19536_18k.htm |
Exhibit 99.1
Company Overview October 2016
2 Legal Disclaimers Forward-Looking Statements. This presentation contains, and the officers and representatives of the Partnership and its general partner may from time to time make, “forward–looking statements” within the meaning of the Private Securities Litigation Reform Act of 1995 that are subject to a number of risks and uncertainties, many of which are beyond our control. These statements may include discussions about our: business strategy; acquisition strategy; financing strategy; ability to make, maintain and grow distributions; the ability of our customers to meet their drilling and development plans on a timely basis or at all and perform under gathering and processing agreements; future operating results; our targeted financial metrics, including our forecast of Adjusted EBITDA; future capital expenditures; SPP’s well-positioned assets in the Eagle Ford Shale; the ability of SPP’s long-term contracts with Sanchez Energy Corporation (“SN”) to provide stable and predictable cash flows; SPP’s significant growth opportunities, including potential acquisitions of midstream and production assets from SN and third parties; SPP’s strategic relationship with SN and Sanchez Oil & Gas Corporation; SPP’s increased throughput on the Western Catarina Midstream System due to the increased drilling plan of SN and production activity of SN in the Catarina lease and in other areas of the Catarina lease; and plans, objectives, expectations, forecasts, outlook and intentions. All of these types of statements, other than statements of historical fact included in this presentation, are forward-looking statements. In some cases, forward-looking statements can be identified by terminology such as “may,” “could,” “should,” “expect,” “plan,” “project,” “intend,” “anticipate,” “believe,” “estimate,” “predict,” “potential,” “pursue,” “target,” “future opportunity,” “continue,” the negative of such terms or other comparable terminology. The forward-looking statements contained in this presentation are largely based on our expectations, which reflect estimates and assumptions made by our management. These estimates and assumptions reflect our best judgment based on currently known market conditions and other factors. Although we believe such estimates and assumptions to be reasonable, they are inherently uncertain and involve a number of risks and uncertainties that are beyond our control. In addition, management’s assumptions about future events may prove to be inaccurate. Management cautions all readers that the forward looking statements contained in this presentation are not guarantees of future performance, and we cannot assure any reader that such statements will be realized or the forward-looking events and circumstances will occur. Actual results may differ materially from those anticipated or implied in the forward looking statements due to important factors listed in the “Cautionary Note Regarding Forward-Looking Statements” and “Risk Factors” sections in our filings with the U.S. Securities and Exchange Commission (“SEC”) and elsewhere in those filings. The forward-looking statements speak only as of the date made, and other than as required by law, we do not intend to (and expressly disclaim any obligation to) publicly update or revise any forward-looking statements as a result of new information, future events or otherwise. These cautionary statements qualify all forward-looking statements attributable to us or persons acting on our behalf.
3 Legal Disclaimers Non-GAAP Financial Measures. Adjusted EBITDA is a non-GAAP supplemental financial measure. We define Adjusted EBITDA as net income (loss) adjusted by: (i) interest (income) expense, net which includes interest expense, interest expense net (gain) loss on interest rate derivative contracts, and interest (income); (ii) income tax expense (benefit); (iii) depreciation, depletion and amortization, (iv) asset impairments, (v) accretion expense, (vi) (gain) loss on sale of assets, (vii) (gain) loss from equity investment, (viii) unit-based compensation programs, (ix) unit-based management fees, (x) (gain) loss on mark-to-market activities and (xi) gain (loss) on embedded derivatives. Adjusted EBITDA is also used as a quantitative standard by our management and by external users of our financial statements such as investors, research analysts, our lenders and others to assess the financial performance of our assets without regard to financing methods, capital structure or historical cost basis; the ability of our assets to generate cash sufficient to pay interest costs and support our indebtedness; and our operating performance and return on capital as compared to those of other companies in our industry, without regard to financing or capital structure. Adjusted EBITDA is not intended to represent cash flows for the period, nor are they presented as a substitute for net income, operating income, cash flows from operating activities or any other measure of financial performance or liquidity presented in accordance with GAAP We are unable to reconcile our forecasted Adjusted EBITDA to forecasted GAAP net income (loss) or net cash flow provided by operating activities because it would take unreasonable efforts to predict the future impact of adjustments to (i) net income (loss) for unit based compensation and asset management fees, (gains) losses from mark-to-market activities and equity investments or asset impairments due to the difficulty of doing so, or (ii) net cash flow provided by operating activities because this metric includes the impact of changes in operating assets and liabilities related to the timing of cash receipts and disbursements that may not relate to the period in which the operating activities occurred. Additionally, we are unable to address the probable significance of the unavailable reconciliation, in significant part due to ranges in our forecast impacted by changes in oil and natural gas prices and reserves which affect certain reconciliation items.
4 Sanchez Relationship Well-Sponsored Partnership Capital Optimization Focus Catarina Growth Drives Midstream Asset Growth Midstream Overview SN’s Development of the Catarina Asset Stacked Pay in the Catarina Asset SN’s Economics Favor Continued Development SN’s Catarina Development Drives SPP’s Growth SN’s Catarina Development Drives Volumes Assets, Expansion and Opportunities Midstream Overview Build Out Existing Midstream Assets Current Midstream Expansion Future Midstream Development Opportunities Topics Topics
Sanchez Relationship
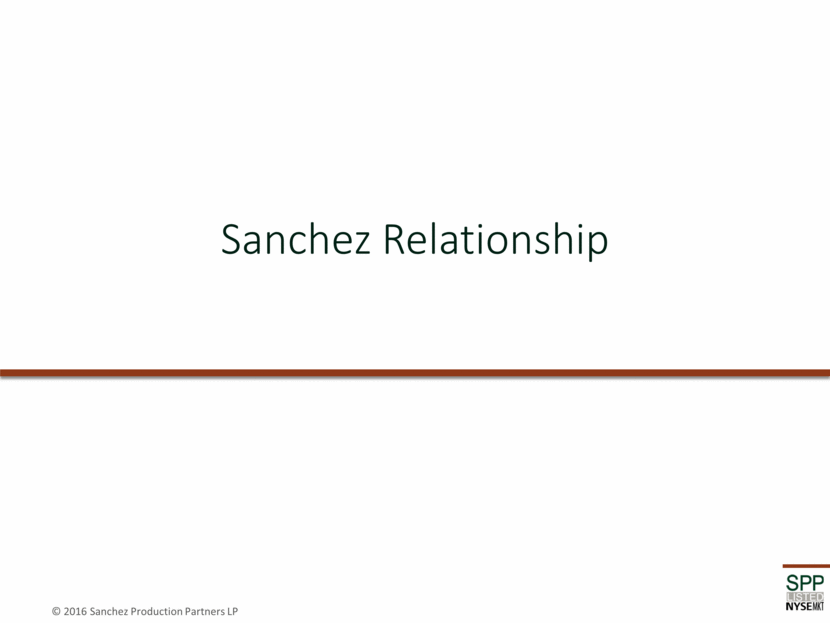
6 Well-Sponsored Partnership Sanchez Oil & Gas Corporation (“SOG”) 1972 Private operating platform with ~ 200 employees Experienced management Technical and operational expertise Active business development Shared Services and Business Development Relationships (1) Sanchez Energy Corporation (2) (NYSE: SN) Structure: Public C-Corp Enterprise Value: ~ $2.2 billion Asset Focus: Oil resource focus Eagle Ford Shale Tuscaloosa Marine Shale 1P Reserves: 128 MMBOE (at 12/31/15) Production: ~55,900 BOE/D (16Q2 Average) Net Acres: >200,000 Acquired $1.1 billion in assets since IPO Credit Rating (Sr. Unsecured): B- / Caa2 Sanchez Production Partners (NYSE MKT: SPP) Structure: Publicly-traded limited partnership Asset Focus: Stable cash producing assets Gathering and processing midstream assets Escalating working interests Integrated approach to visible growth Initial quarterly distribution of $0.40 per unit paid in November 2015 3 consecutive quarterly 1.5% increases in distribution, 6.1% annualized Development / Growth Yield / Distributions Operations and Technical Support Covers operational and technical support and business development activities; includes allocation of G&A Source: SN Corporate Presentation – August 2016; SN market data as of 9/1/16 Right of First Offer
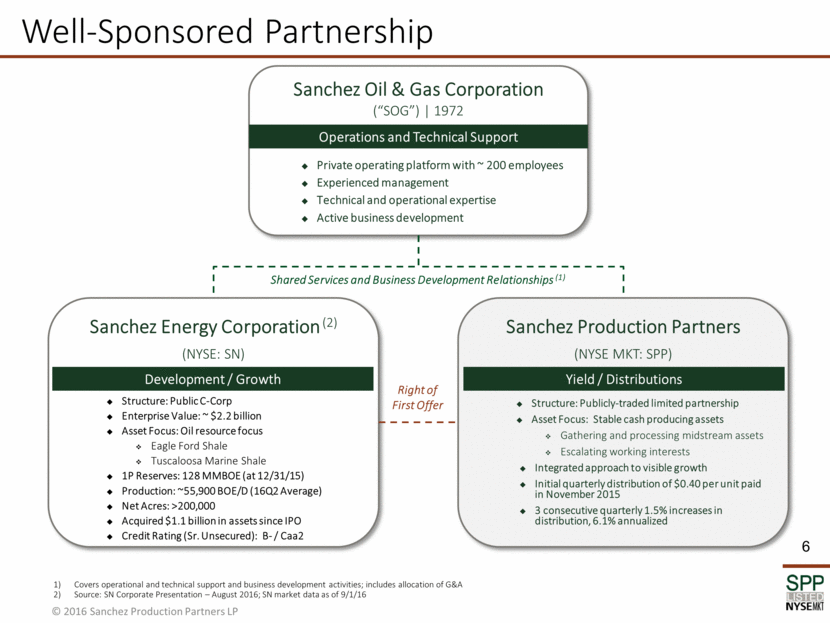
7 Capital Optimization Focus Growth at SPP generates currency for SN’s future growth SN invests capital in development drilling and acquisitions Produces growth in production, infrastructure and cash flow Assets sold to SPP Large inventory of mature cash producing assets fit best in the MLP model Cash flows at SPP valued on yield Ability to pay market price to SN while capturing economic uplift for SPP Ability to show accretion 4 1 2 3 Perpetuates Growth Platform Capital Deployed Assets Divested Accelerates Cash Proceeds to SN Transaction Value Exchanged Provides Stable Cash Flows To SPP Optimizes Cost of Capital Initial Cash Flow to SN Development/Growth Yield/Distributions Improves Credit Metrics
Catarina Growth Drives Midstream Asset Growth
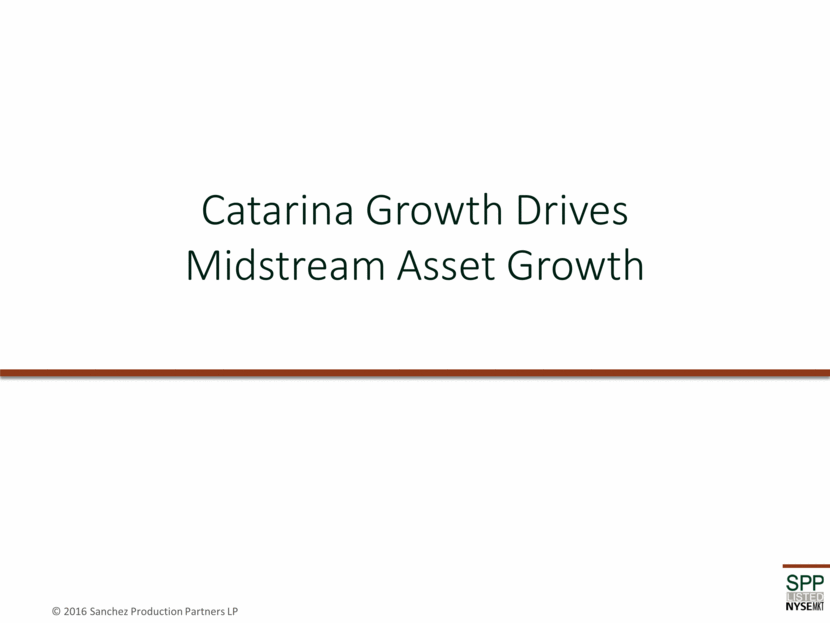
9 Midstream Overview Catarina Volumes Underpin Both Current Midstream Assets and Future Growth Dry Gas Ethane Wet Gas Liquids
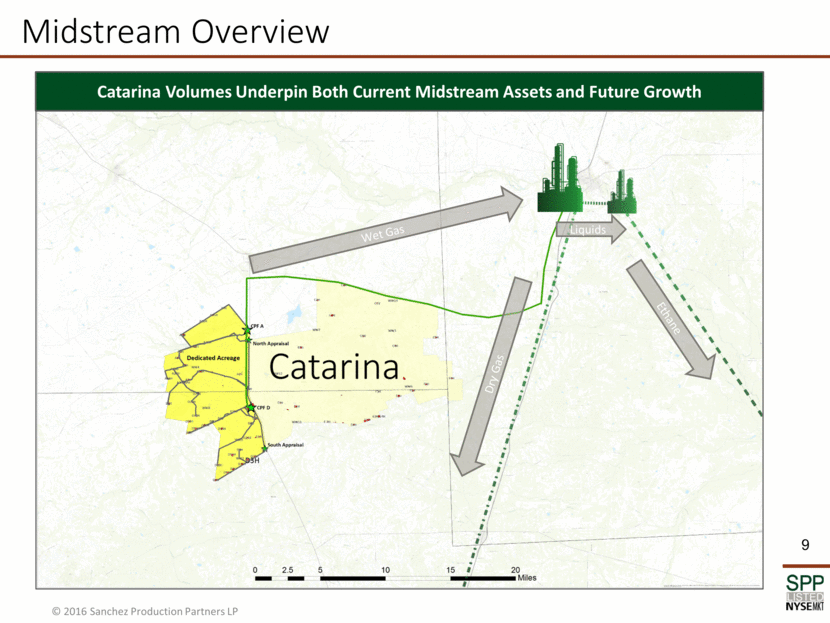
10 SN’s Development of the Catarina Asset At Acquisition Current Development Plan 28 Years of Drilling Inventory at 50 Wells Per Year Catarina Development Total Drilling Locations EUR (Per Well) Average Breakeven Price At Acquisition* <200 ~450 MBOE ~$75 Current 1,300 – 1,600 ~750 – 1,200 MBOE <$40 *”At Acquisition” Price Deck: Oil($/bbl) / Gas($/Mcf): 2014: $98.00/$4.75; 2015: $89.00/$4.25; 2016+: $80.00/$4.00; Assumes NGL Pricing @ 30% of WTI Source: SN Analyst Day – January 2016 VALUE EXPLORATION
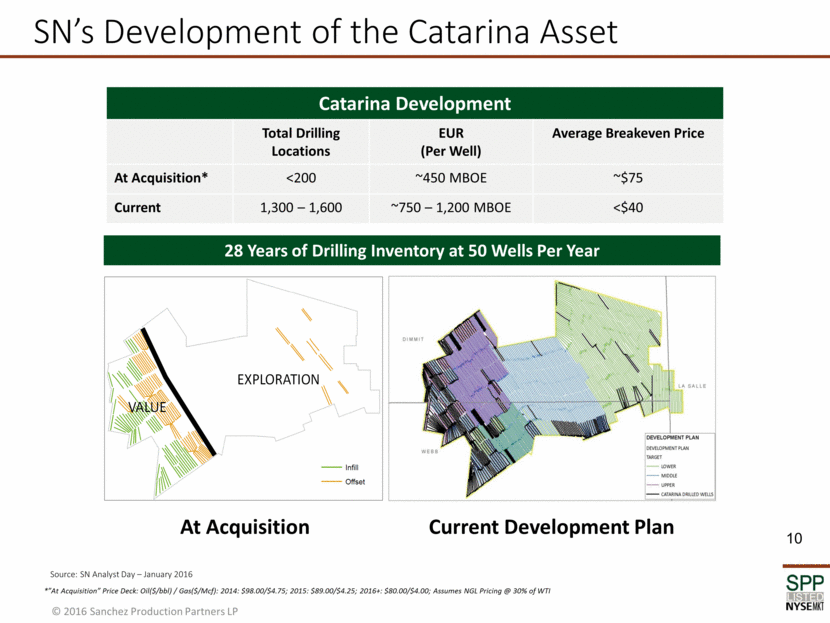
11 Stacked Pay in the Catarina Asset Upper Eagle Ford 150+ Potential Locations 7 wells in stacked pilots drilled to date High oil yields of 250 Bbl/MMcf 500+ potential Locations Large Stacked Pay Application South-Central Catarina Outperforming ~1,100 MBoe EUR Type Curve Middle Eagle Ford 700+ Potential Locations 600-1,100 MBoe EUR Extension into South Central Lower Eagle Ford Source: SN Corporate Presentation – August 2016
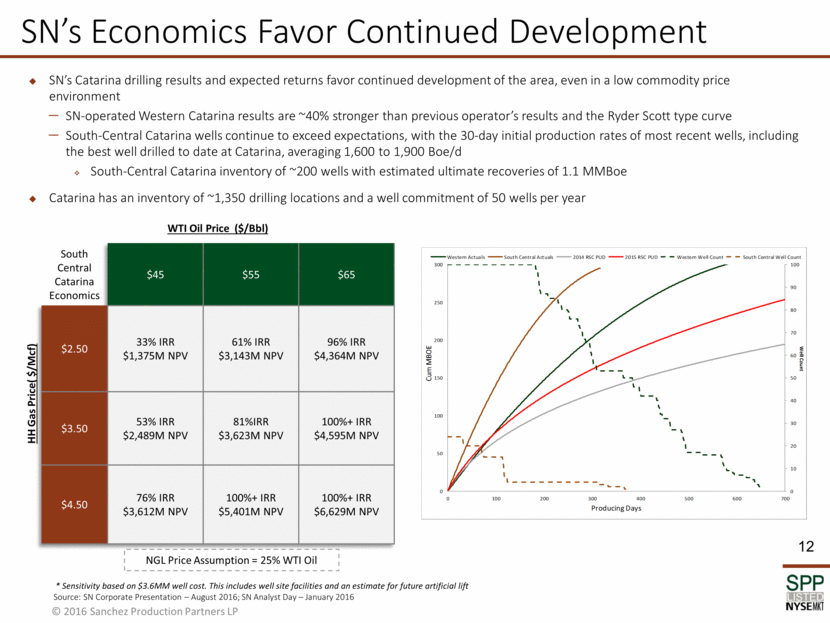
12 SN’s Economics Favor Continued Development SN’s Catarina drilling results and expected returns favor continued development of the area, even in a low commodity price environment SN-operated Western Catarina results are ~40% stronger than previous operator’s results and the Ryder Scott type curve South-Central Catarina wells continue to exceed expectations, with the 30-day initial production rates of most recent wells, including the best well drilled to date at Catarina, averaging 1,600 to 1,900 Boe/d South-Central Catarina inventory of ~200 wells with estimated ultimate recoveries of 1.1 MMBoe Catarina has an inventory of ~1,350 drilling locations and a well commitment of 50 wells per year * Sensitivity based on $3.6MM well cost. This includes well site facilities and an estimate for future artificial lift Source: SN Corporate Presentation – August 2016; SN Analyst Day – January 2016 WTI Oil Price ($/Bbl) HH Gas Price( $/Mcf) South Central Catarina Economics $45 $55 $65 $2.50 33% IRR $1,375M NPV 61% IRR $3,143M NPV 96% IRR $4,364M NPV $3.50 53% IRR $2,489M NPV 81%IRR $3,623M NPV 100%+ IRR $4,595M NPV $4.50 76% IRR $3,612M NPV 100%+ IRR $5,401M NPV 100%+ IRR $6,629M NPV NGL Price Assumption = 25% WTI Oil 0 10 20 30 40 50 60 70 80 90 100 0 50 100 150 200 250 300 0 100 200 300 400 500 600 700 Well Count Cum MBOE Producing Days Western Actuals South Central Actuals 2014 RSC PUD 2015 RSC PUD Western Well Count South Central Well Count
13 SN’s Catarina Development Drives SPP’s Growth At Acquisition 2015: Year-End 2016E/Current Catarina Production ~20,000 Boe/d ~35,000 Boe/d ~43,000 Boe/d Producing Wells ~176 ~287 ~360 Avg. Cost Per Well $7.5 million $3.5 million ~$3.0 million IRR Range 35% - 50% 33% - 80% 33% - 80%+ Inventory of Drilling Locations <200 1,300-1,600 1,300 – 1,600 Annual Capex and Wells Drilled ~$210 million ~31 wells $395 million ~80 wells $155 million ~50 wells 75% 63% 53% Decrease 625% Source: Sanchez Oil & Gas Corporation; SN public filings 23% 25% 14% Decrease Catarina’s growth has lead to numerous midstream expansion opportunities within the entire ranch Production has more than doubled since the time of the acquisition with a 625% increase in de-risked locations
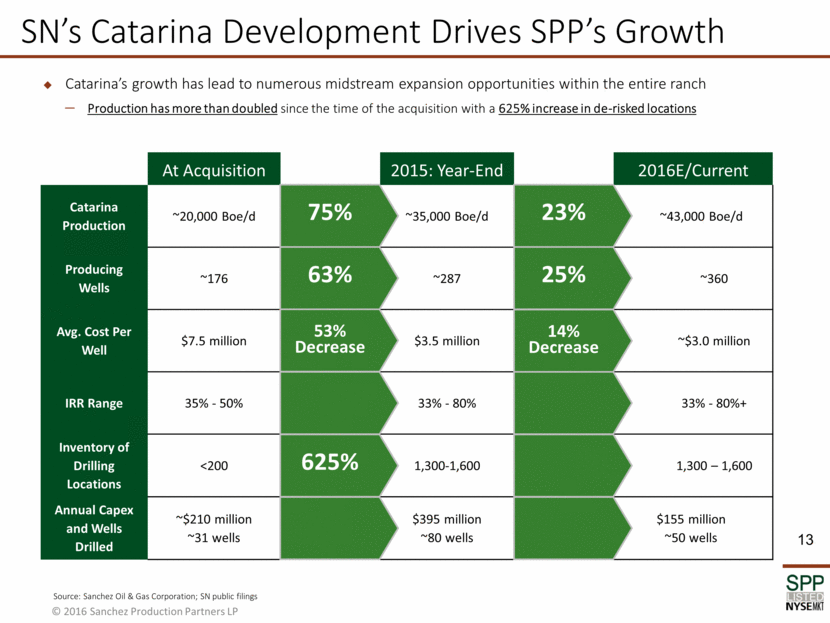
SN’s Catarina Development Drives Volumes SN’s development focus remains on Catarina In August 2016, SN announced a $50 million increase in its 2016 capital spending plan Planned spending of $150 - $160 million in 2016 at Catarina (56% of SN’s 2016 capital spending plan) Projected 50 MMcf/d increase in April 2021 for assets downstream of Western Catarina Midstream Source: Sanchez Oil & Gas Corporation; SN public filings 14 100,000 125,000 150,000 175,000 200,000 225,000 Q1 2015 Q2 2015 Q3 2015 Q4 2015 Q1 2016 Q2 2016 Gross Gas Production (Mcf/d) Catarina Gross Gas Gas MVC
Assets, Expansion and Opportunities
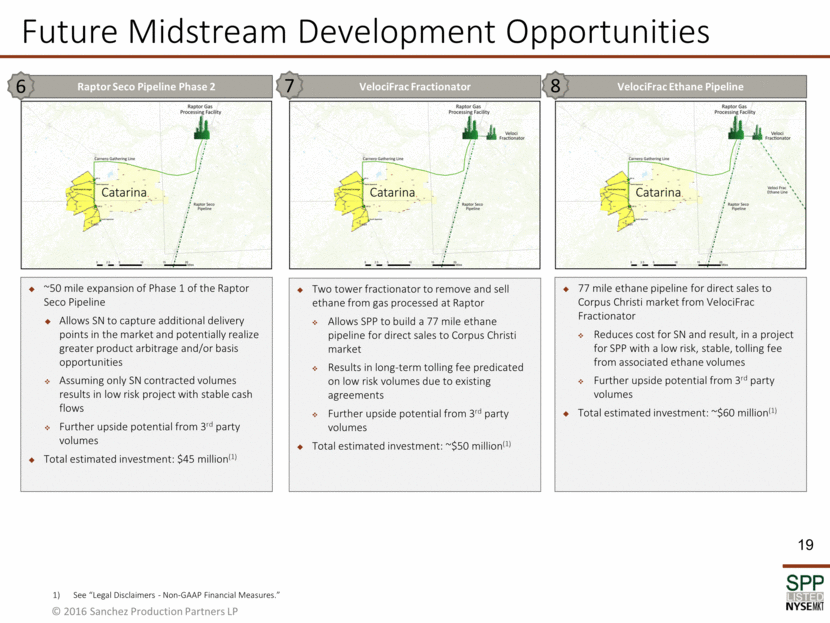
16 Midstream Overview Build Out Catarina Volumes Underpin Both Current Midstream Assets and Growth Opportunities Raptor Gas Processing Facility Processes Dedicated Catarina Wet Gas into Liquids and Dry Gas Pending: 50/50 Investment with Targa 3 VelociFrac Fractionator Further separates Catarina Liquids (Ethane and Propane) Proposed: 100% SPP Developed 7 VelociFrac Ethane Line Carries Catarina Ethane from Veloci Fractionator to Corpus, Christi, TX Proposed: 100% SPP Developed 8 Raptor Seco Pipeline Phase 1 Transports Catarina Dry Gas from Raptor to multiple markets Proposed: 100% SPP Developed 4 Carnero Gathering Line Transports Dedicated Catarina Wet Gas to Raptor Facility 50/50 Investment with Targa Projected 50 MMcf/d increase in 4/2021 2 Western Catarina Midstream >200 MMcf/d - Gas Capacity 142 MMcf/d - Gas MVC Q2 2016 >35% above NG MVC 100% Owned by SPP 1 Costa Azul Terminal Marine Crude Terminal in Point Comfort, TX SN Marquis field dedication Potential: 50/50 Investment with 3rd Party 5 Wet Gas Dry Gas Ethane Raptor Seco Pipeline Phase 2 Further transport of Catarina Dry Gas volumes adding markets Proposed: 100% SPP Developed 6 Wet Gas Liquids
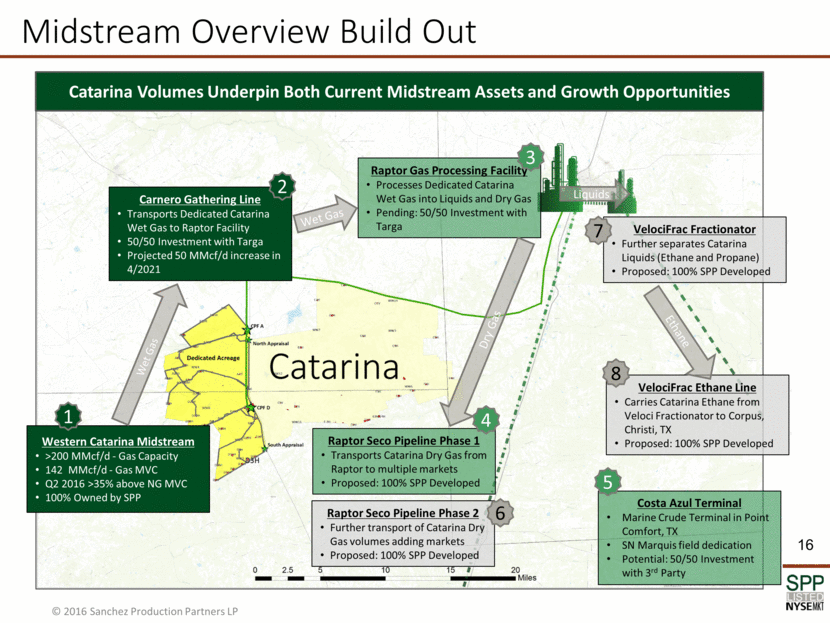
17 Existing Midstream Assets Gathering and processing assets constructed by Shell as part of the original infrastructure of the Catarina Field (“Catarina”) 35,000 net dedicated acres 150 miles of gathering lines (ranging in diameter from 4” to 12”) 4 main processing and gathering facilities with numerous oil and natural gas interconnections Condensate capacity of 40,000 Bbl/d Natural gas capacity of 200 MMcf/d Pipeline capacity can be easily expanded through small compression projects at nominal cost 15-year gathering and processing agreement with SN 5-year minimum volume commitment (currently at 138% of MVC) Equalized rates across all Catarina acreage 2017 Estimated Adj. EBITDA: ~$42.0 million(1) 50% interest acquired from SN in July 2016 50% owned and operated by Targa Resources Corp. (NYSE: TRGP) (“Targa”) Development of a 45 mile natural gas pipeline for long-term transportation from the Catarina Field to the Raptor processing plant (expected plant completion - Spring 2017) Gathering line currently in service Capacity of 200 MMcf/d; readily expandable to 260 MMcf/d without compression 15-year gathering agreement with SN provides stable, fee-based cash flows and Catarina acreage dedication 5-year minimum commitment of 125 MMcf/d SN average production greater than 180 MMcf/d in 2016 from the dedicated acreage 2017 Estimated Adj. EBITDA: ~$7.0 million(1) Western Catarina Midstream Carnero Gathering Line 1 2 See “Legal Disclaimers - Non-GAAP Financial Measures.”
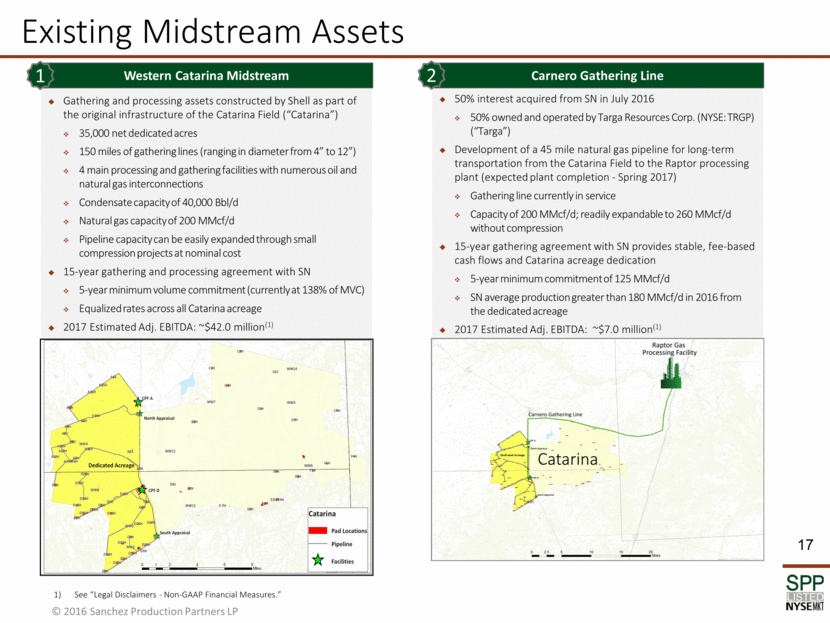
18 Current Midstream Expansion JV for a marine crude storage terminal located in Point Comfort, TX (“Costa Azul Terminal”) Results in realization of higher netbacks for crude oil produced from SN’s Marquis asset Stable cash flows generated from terminaling fee on 3rd party volumes Estimated completion April 2017 Total estimated SPP investment: ~$15 million Costa Azul Terminal Raptor Gas Processing Facility Acquisition of SN’s 50% interest in the Raptor Gas Processing Facility (“Raptor”) Strategic asset that allows SPP to capture more of the value chain in Catarina Carnero Gathering Line will deliver all of the Catarina volumes to Raptor Further upside from 3rd party volumes Potential to expand plant to 260 MMcf/d to accommodate anticipated contracted 3rd party volumes Other 50% owner (Targa) currently building plant – Estimated completion April 2017 Stable, fee-based cash flow with 5-year MVC Total estimated SPP investment: ~$80 million Raptor Seco Pipeline Phase 1 Pipeline off the tail of the Raptor gas processing facility that will transport processed dry gas to additional markets Assuming only SN contracted volumes, the project provides low risk with stable cash flows Additional upside from potential product arbitrage and/or basis opportunities Further upside from 3rd party volumes Estimated completion April 2017 Total estimated investment: ~$35 million 3 4 5 Costa Azul Terminal See “Legal Disclaimers - Non-GAAP Financial Measures.”
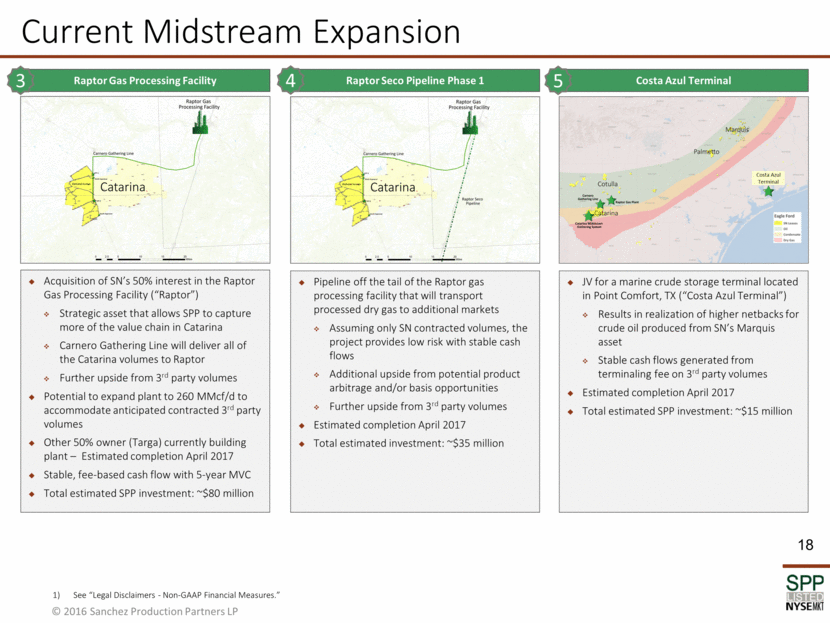
19 Future Midstream Development Opportunities VelociFrac Ethane Pipeline 77 mile ethane pipeline for direct sales to Corpus Christi market from VelociFrac Fractionator Reduces cost for SN and result, in a project for SPP with a low risk, stable, tolling fee from associated ethane volumes Further upside potential from 3rd party volumes Total estimated investment: ~$60 million(1) Raptor Seco Pipeline Phase 2 ~50 mile expansion of Phase 1 of the Raptor Seco Pipeline Allows SN to capture additional delivery points in the market and potentially realize greater product arbitrage and/or basis opportunities Assuming only SN contracted volumes results in low risk project with stable cash flows Further upside potential from 3rd party volumes Total estimated investment: $45 million(1) VelociFrac Fractionator Two tower fractionator to remove and sell ethane from gas processed at Raptor Allows SPP to build a 77 mile ethane pipeline for direct sales to Corpus Christi market Results in long-term tolling fee predicated on low risk volumes due to existing agreements Further upside potential from 3rd party volumes Total estimated investment: ~$50 million(1) 7 8 6 See “Legal Disclaimers - Non-GAAP Financial Measures.”
Appendix A Additional Project Details
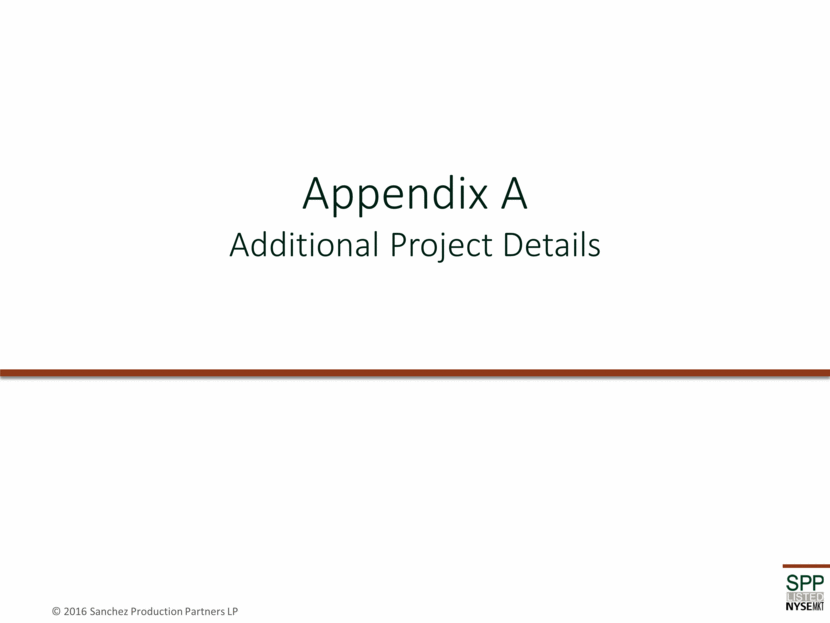
21 Identified Acquisition: Raptor Gas Processing Facility Acquisition of SN’s ~50% equity interest in the LLC which owns the Raptor Gas Processing Facility Strategic asset allows SPP to capture more of the midstream value chain associated with Catarina production volumes through ownership of additional product offtake and processing assets SN entered into JV with Targa to build the cryogenic gas processing plant in October 2015 – Estimated completion April 2017 SN has signed a 15-year processing agreement committing to a minimum of 125 MMcfd for five years and dedication of all Catarina acreage for the term of the agreement Potential to expand plant to 260 MMcf/d to accommodate either future SN volumes or 3rd party volumes from nearby producers Total estimated SPP investment of $80 million Project provides a low-risk stable cash flow due to processing agreements and acreage dedication from Catarina Project Summary & Context Strategic Geographic Positioning
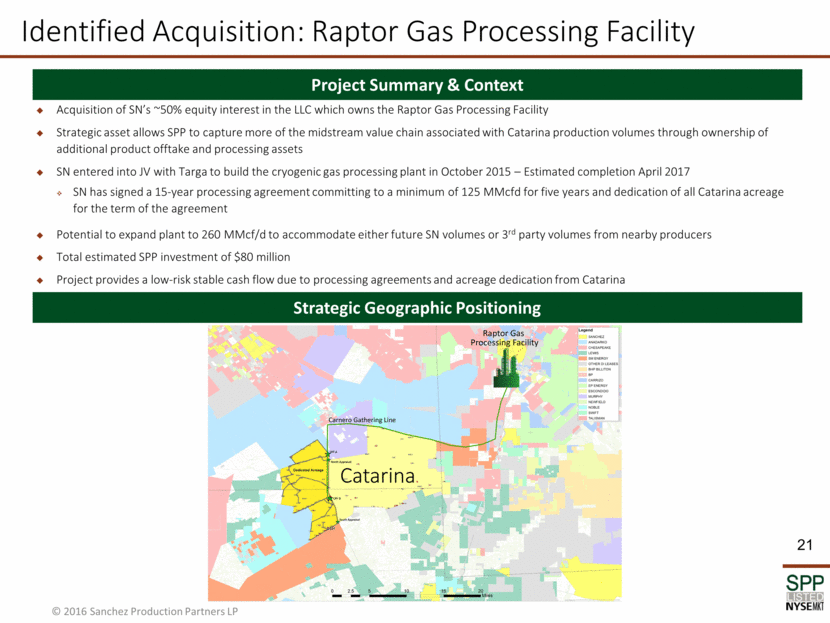
22 Identified Capital Projects: Raptor Seco Pipeline Phase 1 & 2 Phase 1 pipeline would transport processed dry gas to provide SN access to multiple markets Phase 2 pipeline could ultimately deliver processed dry gas to the Nueva Era pipeline system, creating potential for premium or differentiated pricing Phase 1: Total estimated SPP investment of $35 million Phase 2: Total estimated SPP investment of $45 million Project Summary & Context Resulting Advantages With only SN forecasted volumes, projects provide low-risk stable cash flows for SPP Future opportunity to build out Phase 2 could allow SN to capture additional markets and delivery points Both projects provides SN potential arbitrage and/or basis opportunities Strategic Geographic Positioning
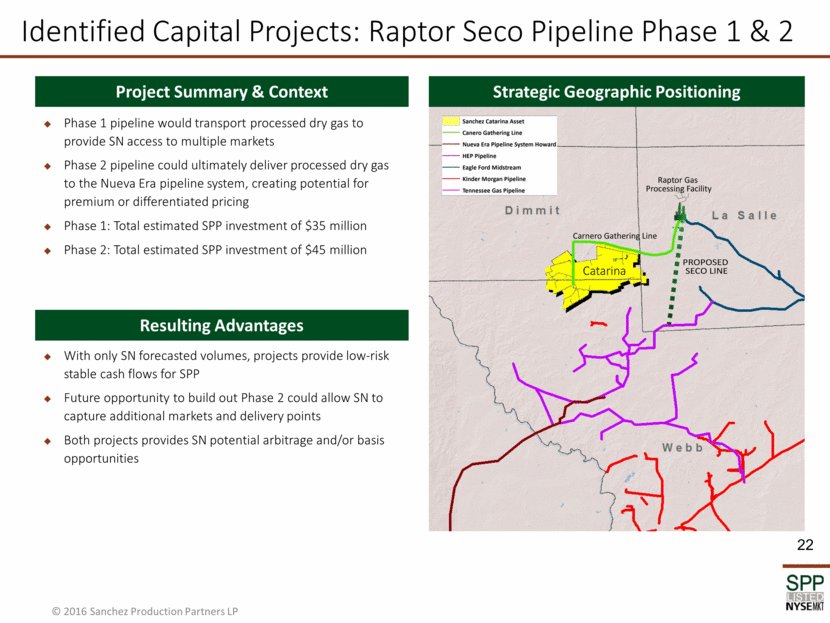
23 Identified Acquisition: Costa Azul Terminal Project provides a low-risk stable cash flow for SPP through terminaling fees of both minimum volume commitments and walk-up 3rd party volumes Provides producers the opportunity to capitalize on potential hydrocarbon blending through charging a fee to provide increased uplift in pricing Results in realization of higher netbacks for crude oil produced from SN’s Marquis asset JV with partner for a marine crude storage terminal located in Point Comfort, TX (“Costa Azul” Port) Estimated completion in April 2017 Total estimated SPP investment of $15 million Project Summary & Context Resulting Advantages Strategic Geographic Positioning
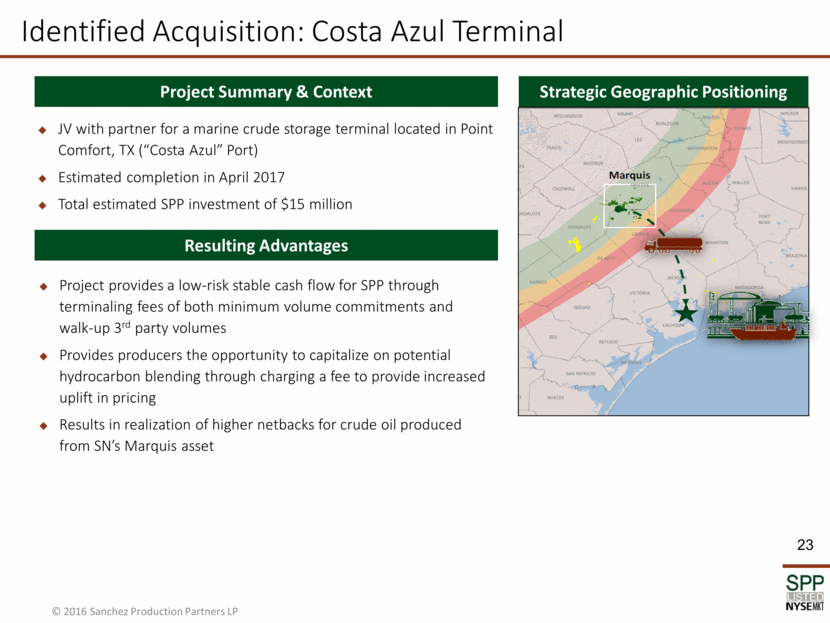
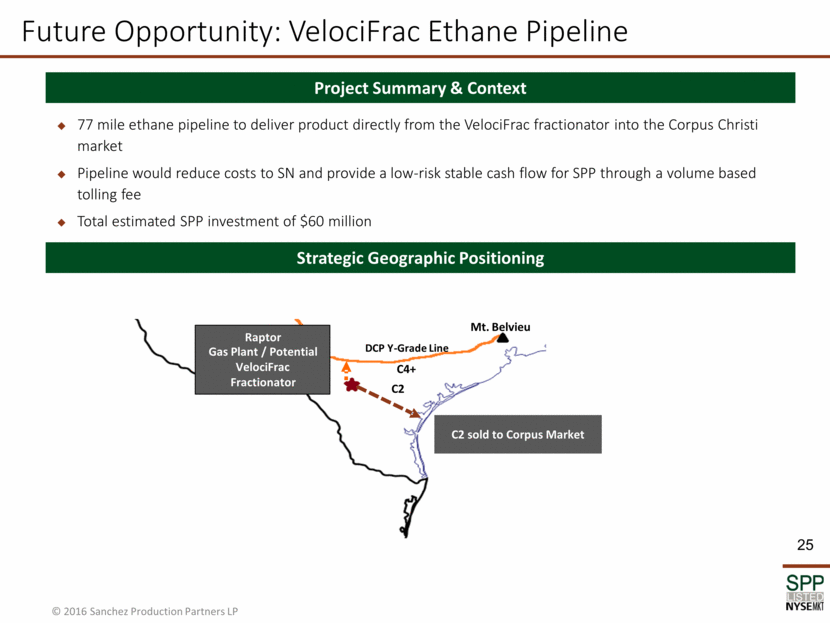
24 Future Opportunity: VelociFrac Fractionator Two tower fractionator to remove propane and ethane from Raptor NGLs Fractionator would allow SPP to capture fee revenue in lieu of SN contracting NGLs through 3rd party transportation arrangements to Mt. Belvieu Total estimated SPP investment of $50 million Project Summary & Context Resulting Advantages Long-term tolling fee predicated on low-risk volumes Additional synergies with associated ethane line upon completion of fractionator Potential upside from 3rd party volumes through Raptor Strategic Geographic Positioning Raptor Gas Plant / Potential VelociFrac Fractionator Mt. Belvieu C3 C2/C4+ DCP Y - Grade Line C3 sold to Pemex by Truck
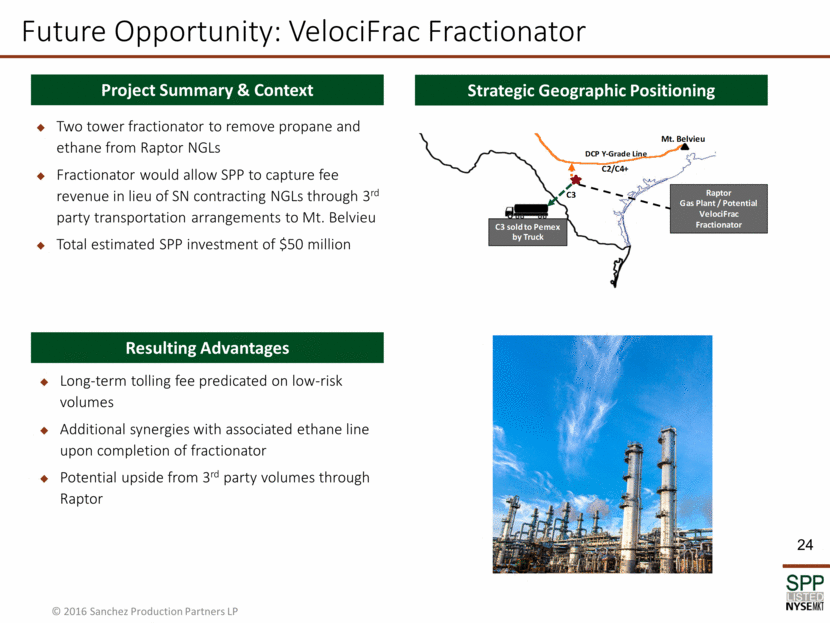
25 Future Opportunity: VelociFrac Ethane Pipeline 77 mile ethane pipeline to deliver product directly from the VelociFrac fractionator into the Corpus Christi market Pipeline would reduce costs to SN and provide a low-risk stable cash flow for SPP through a volume based tolling fee Total estimated SPP investment of $60 million Project Summary & Context Strategic Geographic Positioning Raptor Gas Plant / Potential VelociFrac Fractionator Mt. Belvieu C4+ DCP Y - Grade Line C2 sold to Corpus Market C2
Appendix B Additional Partnership Details
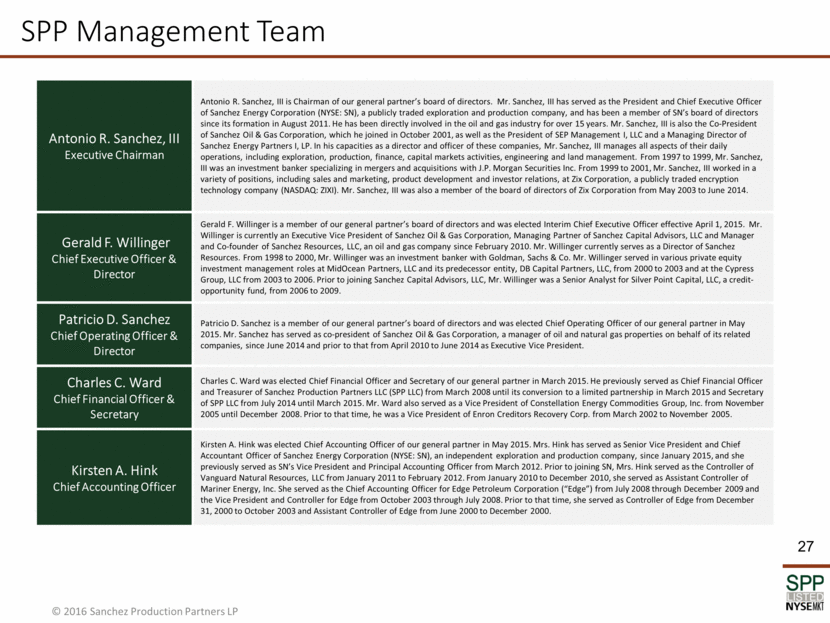
27 SPP Management Team Antonio R. Sanchez, III Executive Chairman Antonio R. Sanchez, III is Chairman of our general partner’s board of directors. Mr. Sanchez, III has served as the President and Chief Executive Officer of Sanchez Energy Corporation (NYSE: SN), a publicly traded exploration and production company, and has been a member of SN’s board of directors since its formation in August 2011. He has been directly involved in the oil and gas industry for over 15 years. Mr. Sanchez, III is also the Co-President of Sanchez Oil & Gas Corporation, which he joined in October 2001, as well as the President of SEP Management I, LLC and a Managing Director of Sanchez Energy Partners I, LP. In his capacities as a director and officer of these companies, Mr. Sanchez, III manages all aspects of their daily operations, including exploration, production, finance, capital markets activities, engineering and land management. From 1997 to 1999, Mr. Sanchez, III was an investment banker specializing in mergers and acquisitions with J.P. Morgan Securities Inc. From 1999 to 2001, Mr. Sanchez, III worked in a variety of positions, including sales and marketing, product development and investor relations, at Zix Corporation, a publicly traded encryption technology company (NASDAQ: ZIXI). Mr. Sanchez, III was also a member of the board of directors of Zix Corporation from May 2003 to June 2014. Gerald F. Willinger Chief Executive Officer & Director Gerald F. Willinger is a member of our general partner’s board of directors and was elected Interim Chief Executive Officer effective April 1, 2015. Mr. Willinger is currently an Executive Vice President of Sanchez Oil & Gas Corporation, Managing Partner of Sanchez Capital Advisors, LLC and Manager and Co-founder of Sanchez Resources, LLC, an oil and gas company since February 2010. Mr. Willinger currently serves as a Director of Sanchez Resources. From 1998 to 2000, Mr. Willinger was an investment banker with Goldman, Sachs & Co. Mr. Willinger served in various private equity investment management roles at MidOcean Partners, LLC and its predecessor entity, DB Capital Partners, LLC, from 2000 to 2003 and at the Cypress Group, LLC from 2003 to 2006. Prior to joining Sanchez Capital Advisors, LLC, Mr. Willinger was a Senior Analyst for Silver Point Capital, LLC, a credit-opportunity fund, from 2006 to 2009. Patricio D. Sanchez Chief Operating Officer & Director Patricio D. Sanchez is a member of our general partner’s board of directors and was elected Chief Operating Officer of our general partner in May 2015. Mr. Sanchez has served as co-president of Sanchez Oil & Gas Corporation, a manager of oil and natural gas properties on behalf of its related companies, since June 2014 and prior to that from April 2010 to June 2014 as Executive Vice President. Charles C. Ward Chief Financial Officer & Secretary Charles C. Ward was elected Chief Financial Officer and Secretary of our general partner in March 2015. He previously served as Chief Financial Officer and Treasurer of Sanchez Production Partners LLC (SPP LLC) from March 2008 until its conversion to a limited partnership in March 2015 and Secretary of SPP LLC from July 2014 until March 2015. Mr. Ward also served as a Vice President of Constellation Energy Commodities Group, Inc. from November 2005 until December 2008. Prior to that time, he was a Vice President of Enron Creditors Recovery Corp. from March 2002 to November 2005. Kirsten A. Hink Chief Accounting Officer Kirsten A. Hink was elected Chief Accounting Officer of our general partner in May 2015. Mrs. Hink has served as Senior Vice President and Chief Accountant Officer of Sanchez Energy Corporation (NYSE: SN), an independent exploration and production company, since January 2015, and she previously served as SN’s Vice President and Principal Accounting Officer from March 2012. Prior to joining SN, Mrs. Hink served as the Controller of Vanguard Natural Resources, LLC from January 2011 to February 2012. From January 2010 to December 2010, she served as Assistant Controller of Mariner Energy, Inc. She served as the Chief Accounting Officer for Edge Petroleum Corporation (“Edge”) from July 2008 through December 2009 and the Vice President and Controller for Edge from October 2003 through July 2008. Prior to that time, she served as Controller of Edge from December 31, 2000 to October 2003 and Assistant Controller of Edge from June 2000 to December 2000.
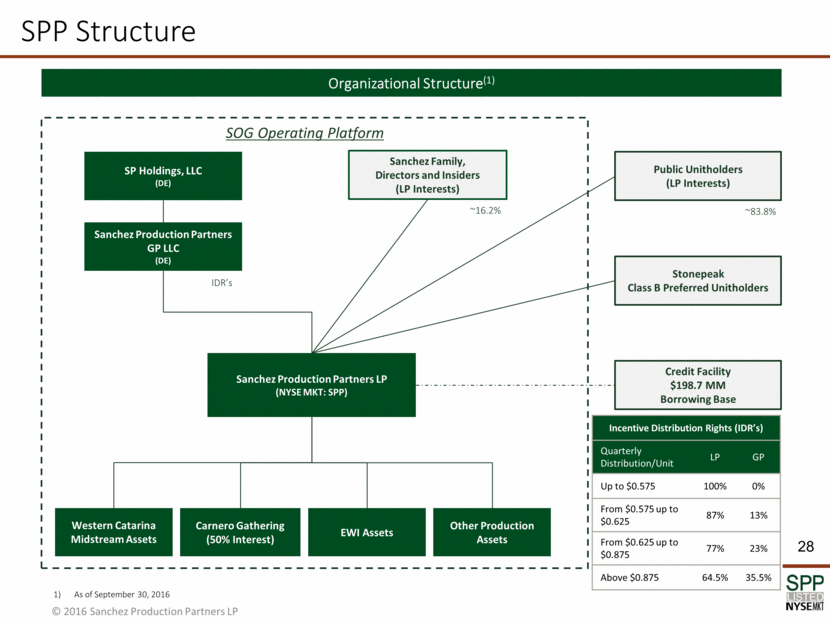
28 SPP Structure Organizational Structure(1) Incentive Distribution Rights (IDR’s) Quarterly Distribution/Unit LP GP Up to $0.575 100% 0% From $0.575 up to $0.625 87% 13% From $0.625 up to $0.875 77% 23% Above $0.875 64.5% 35.5% SP Holdings, LLC (DE) Sanchez Production Partners LP (NYSE MKT: SPP) Sanchez Production Partners GP LLC (DE) Carnero Gathering (50% Interest) Public Unitholders (LP Interests) SOG Operating Platform Credit Facility $198.7 MM Borrowing Base EWI Assets Sanchez Family, Directors and Insiders (LP Interests) ~16.2% ~83.8% Stonepeak Class B Preferred Unitholders Western Catarina Midstream Assets Other Production Assets IDR’s As of September 30, 2016
Appendix C Catarina Development
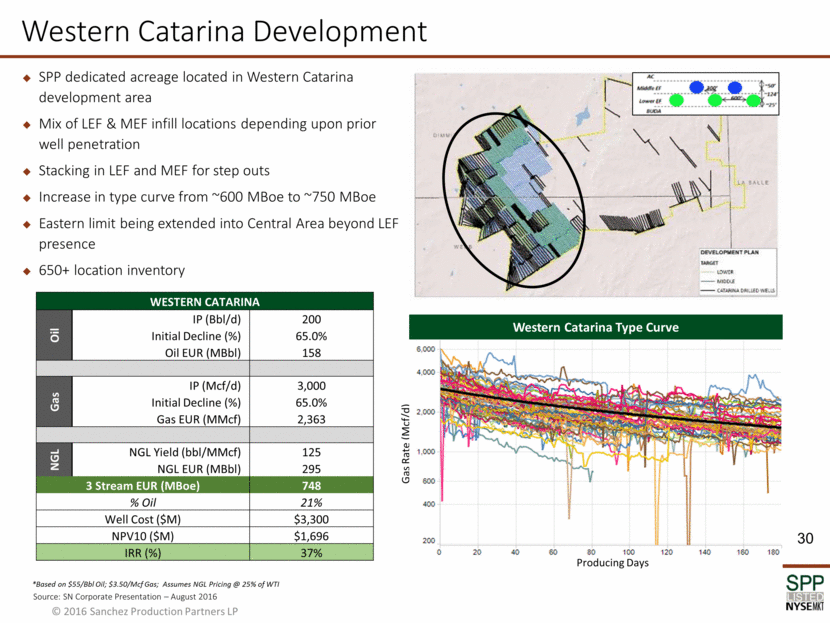
30 Western Catarina Development SPP dedicated acreage located in Western Catarina development area Mix of LEF & MEF infill locations depending upon prior well penetration Stacking in LEF and MEF for step outs Increase in type curve from ~600 MBoe to ~750 MBoe Eastern limit being extended into Central Area beyond LEF presence 650+ location inventory Gas Rate (Mcf/d) *Based on $55/Bbl Oil; $3.50/Mcf Gas; Assumes NGL Pricing @ 25% of WTI Western Catarina Type Curve WESTERN CATARINA Oil IP (Bbl/d) 200 Initial Decline (%) 65.0% Oil EUR (MBbl) 158 Gas IP (Mcf/d) 3,000 Initial Decline (%) 65.0% Gas EUR (MMcf) 2,363 NGL NGL Yield (bbl/MMcf) 125 NGL EUR (MBbl) 295 3 Stream EUR (MBoe) 748 % Oil 21% Well Cost ($M) $3,300 NPV10 ($M) $1,696 IRR (%) 37% Producing Days Source: SN Corporate Presentation – August 2016
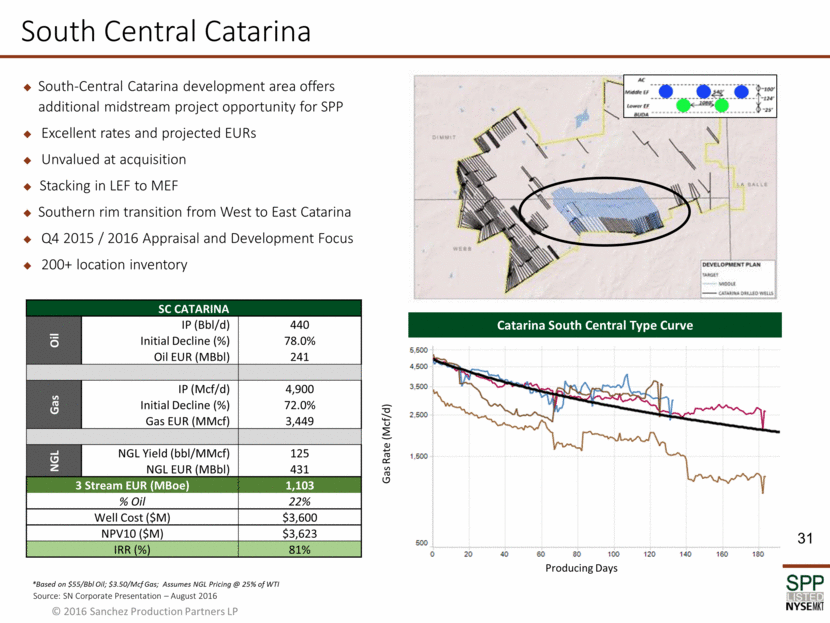
31 South Central Catarina Catarina South Central Type Curve SC CATARINA Oil IP (Bbl/d) 440 Initial Decline (%) 78.0% Oil EUR (MBbl) 241 Gas IP (Mcf/d) 4,900 Initial Decline (%) 72.0% Gas EUR (MMcf) 3,449 NGL NGL Yield (bbl/MMcf) 125 NGL EUR (MBbl) 431 3 Stream EUR (MBoe) 1,103 % Oil 22% Well Cost ($M) $3,600 NPV10 ($M) $3,623 IRR (%) 81% South-Central Catarina development area offers additional midstream project opportunity for SPP Excellent rates and projected EURs Unvalued at acquisition Stacking in LEF to MEF Southern rim transition from West to East Catarina Q4 2015 / 2016 Appraisal and Development Focus 200+ location inventory Gas Rate (Mcf/d) Producing Days *Based on $55/Bbl Oil; $3.50/Mcf Gas; Assumes NGL Pricing @ 25% of WTI Source: SN Corporate Presentation – August 2016
Appendix D Existing Asset Overview
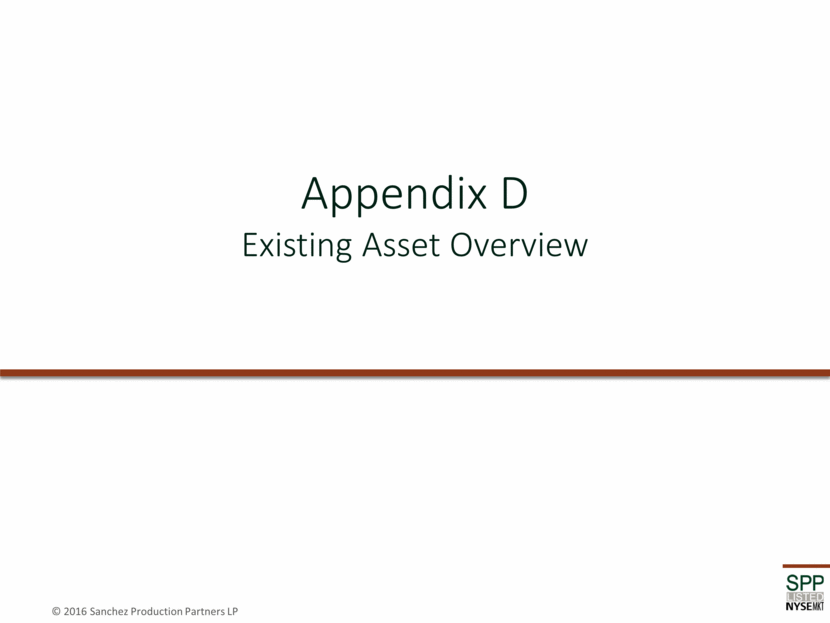
Gathering and processing assets originally constructed by Royal Dutch Shell as part of the infrastructure for the development of the Catarina Field Development and construction of the assets were promulgated under rights embedded in the lease agreement Pipeline capacity can be easily expanded through small compression projects at nominal costs (~$1 MM/year in growth capital planned) 15 Year gathering and processing agreement with SN 5 Year minimum volume commitment Equalized rates across all Catarina acreage 2017 Estimated Adj. EBITDA: ~$42 million(2) 33 Western Catarina Midstream Asset Asset Details Asset Overview Western Catarina Dedicated Acreage Covers ~ 85,000 net effective development acres See “Legal Disclaimers - Non-GAAP Financial Measures.” Dedicated Acreage ~ 35,000 acres (1) Pipeline Assets ~ 150 miles of gathering lines (ranging in diameter from 4” to 12”) Facilities Four main gathering and processing facilities, which include: Eight stabilizers (5,000 Bbl/d) ~ 25,000 Bbl storage capacity NGL pressurized storage ~ 18,000hp compression ~ 300 MMcf/d dehydration capacity Interconnections Crude oil: Plains All American Pipeline header system delivered to Gardendale Terminal Connectivity to all four takeaway pipelines to Corpus Christi Natural gas: Southcross Energy Kinder Morgan Energy Transfer Enterprise Products Targa Resources Interconnections located at each of the four main processing facilities Capacity Condensate: 40,000 Bbl/d Natural Gas: 200 MMcf/d
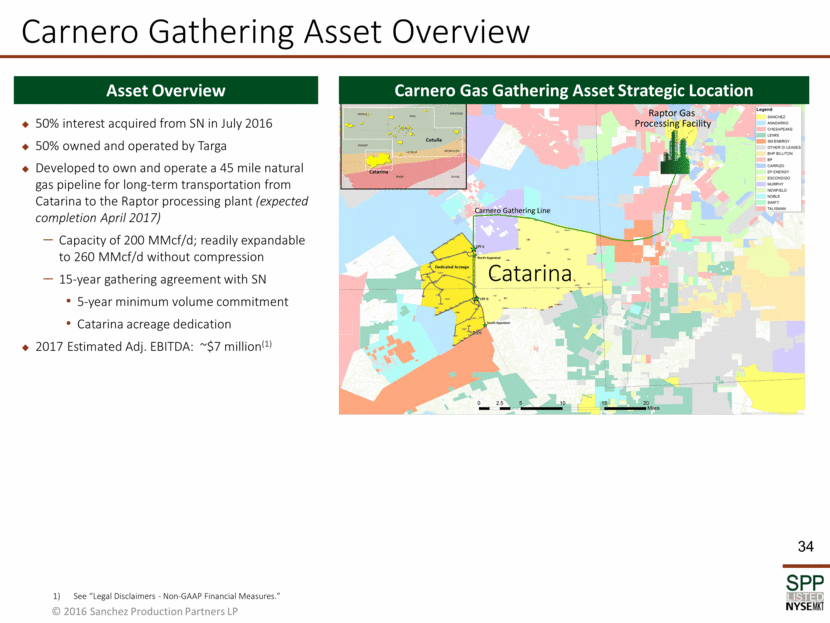
34 Carnero Gathering Asset Overview 50% interest acquired from SN in July 2016 50% owned and operated by Targa Developed to own and operate a 45 mile natural gas pipeline for long-term transportation from Catarina to the Raptor processing plant (expected completion April 2017) Capacity of 200 MMcf/d; readily expandable to 260 MMcf/d without compression 15-year gathering agreement with SN 5-year minimum volume commitment Catarina acreage dedication 2017 Estimated Adj. EBITDA: ~$7 million(1) Carnero Gas Gathering Asset Strategic Location Asset Overview See “Legal Disclaimers - Non-GAAP Financial Measures.”
