Attached files
Table of Contents
UNITED STATES
SECURITIES AND EXCHANGE COMMISSION
Washington, D.C. 20549
Form 10-K
(Mark One)
| þ | ANNUAL REPORT PURSUANT TO SECTION 13 OR 15(d) OF |
THE SECURITIES EXCHANGE ACT OF 1934
For the fiscal year ended December 31, 2009
OR
| ¨ | TRANSITION REPORT PURSUANT TO SECTION 13 OR 15(d) OF |
THE SECURITIES EXCHANGE ACT OF 1934
For the transition period from to .
Commission File Number 001-33147
Constellation Energy Partners LLC
(Exact Name of Registrant as Specified in Its Charter)
| Delaware | 11-3742489 | |
| (State of organization) | (I.R.S. Employer Identification No.) |
| 1801 Main Street, Suite 1300 | ||
| Houston, Texas | 77002 | |
| (Address of Principal Executive Offices) | (Zip Code) |
Telephone Number: (832) 308-3700
Securities registered pursuant to Section 12(b) of the Act:
| Title of each class |
Name of each exchange on which registered | |||
| Common Units representing Class B Limited Liability Company Interests |
} | NYSE Arca, Inc. |
Securities registered pursuant to Section 12(g) of the Act: None
Indicate by check mark if the registrant is a well-known seasoned issuer, as defined in Rule 405 of the Securities Act. Yes ¨ No þ
Indicate by check mark if the registrant is not required to file reports pursuant to Section 13 or Section 15(d) of the Act. Yes ¨ No þ
Indicate by check mark whether the registrant (1) has filed all reports required to be filed by Section 13 or 15(d) of the Securities Exchange Act of 1934 during the preceding 12 months (or for such shorter period that the registrant was required to file such reports), and (2) has been subject to such filing requirements for the past 90 days. Yes þ No ¨
Indicate by check mark whether the registrant has submitted electronically and posted on its corporate Web site, if any, every Interactive Data File required to be submitted and posted pursuant to Rule 405 of Regulation S-T during the preceding 12 months (or for such shorter period that the registrant was required to submit and post such files). Yes ¨ No ¨
Indicate by check mark if disclosure of delinquent filers pursuant to Item 405 of Regulation S-K is not contained herein, and will not be contained, to the best of registrant’s knowledge, in definitive proxy or information statements incorporated by reference in Part III of this Form 10-K or any amendment to this Form 10-K. ¨
Indicate by check mark whether the registrant is a large accelerated filer, an accelerated filer, a non-accelerated filer, or a smaller reporting company. See the definitions of “large accelerated filer,” “accelerated filer” and “smaller reporting company” in Rule 12b-2 of the Exchange Act. (Check one):
| Large accelerated filer ¨ |
Accelerated filer ¨ | |
| Non-accelerated filer þ |
Smaller reporting company ¨ | |
(Do not check if a smaller reporting company)
Indicate by check mark whether the registrant is a shell company (as defined in Rule 12b-2 of the Exchange Act) Yes ¨ No þ
Aggregate market value of Constellation Energy Partners LLC Common Stock, without par value, held by non-affiliates as of June 30, 2009 was approximately $39,010,506 based upon New York Stock Exchange composite transaction closing price.
Indicate the number of shares outstanding of each of the registrant’s classes of common stock, as of the latest practicable date.
Common Units outstanding on February 24, 2010: 23,316,478 units.
Documents Incorporated by Reference: None
Table of Contents
i
Table of Contents
PART I
Overview
We are a limited liability company that was formed by Constellation Energy Group, Inc. (“Constellation”) in 2005 to acquire oil and natural gas reserves. We are focused on the acquisition, development and production of oil and natural gas properties as well as related midstream assets. Our primary business objective is to create long-term value and to generate stable cash flows allowing us to resume making quarterly cash distributions to our unitholders. All of our proved reserves are located in the Black Warrior Basin in Alabama, the Cherokee Basin in Kansas and Oklahoma, and the Woodford Shale in the Arkoma Basin in Oklahoma. Our total estimated proved reserves at December 31, 2009 were approximately 131.2 Bcfe, approximately 85% of which were classified as proved developed, and 99% of which are natural gas. At December 31, 2009, we own approximately 2,760 net producing wells. Our total average proved reserve-to-production ratio is approximately 8.5 years and our portfolio decline rate is 13 to 15 percent based on our estimated proved reserves at December 31, 2009 and production for the month ended December 31, 2009.
We completed our initial public offering on November 20, 2006 and our common units, representing Class B limited liability company interests, are listed on the NYSE Arca, Inc. under the symbol “CEP.”
Since our formation in 2005, we have expanded our operations by entering into five separate definitive purchase agreements to acquire certain oil and natural gas properties located in the Black Warrior Basin in Alabama, the Cherokee Basin in Kansas and Oklahoma and the Woodford Shale in the Arkoma Basin in Oklahoma. These acquisitions provide us the opportunity to organically grow our business by drilling unproved locations acquired primarily in Osage County, Oklahoma.
Unless the context requires otherwise, any reference in this Annual Report on Form 10-K to “Constellation Energy Partners,” “we,” “our,” “us,” “CEP,” the “successor company” or the “Company” means Constellation Energy Partners LLC and its subsidiaries. References in this Annual Report on Form 10-K to “CCG” and to “CEPM” are to Constellation Energy Commodities Group, Inc., and Constellation Energy Partners Management, LLC, respectively, each wholly-owned subsidiaries of Constellation.
Business Strategies
Our primary business objective is to create long-term value and to generate stable cash flows allowing us to resume making quarterly cash distributions to our unitholders. In the long term, we are focused on increasing the amount of our future quarterly distributions over time. We plan to achieve our objective by executing our business strategy, which is to:
| • | organically grow our business by increasing reserves and production through what we believe to be low-risk development drilling that focuses on capital efficient production growth; |
| • | reduce the volatility in our revenues resulting from changes in oil and natural gas commodity prices through efficient hedging programs; |
| • | make accretive acquisitions of oil and natural gas properties characterized by a high percentage of proved developed reserves with long-lived, stable production and low-risk drilling opportunities, which may include associated midstream assets such as gathering systems, compression, dehydrating and treating facilities and other similar facilities; and |
| • | realize value by opportunistically forming partnerships, participating in farm-out arrangements, joint operating agreements or other capital-efficient ventures to take advantage of our significant undeveloped acreage positions in the Cherokee Basin. |
1
Table of Contents
Black Warrior Basin
The Black Warrior Basin is one of the oldest and most prolific coalbed methane basins in the country. The multi-seam vertical wells in the basin range from 500 to 3,700 feet deep, with coal seams averaging a total of 25 to 30 feet of net pay per well. Coalbed methane wells are generally shallower and produce less gas than conventional natural gas wells, require pumping units to remove the water from the wells, which we refer to as dewatering, and require fracturing to enhance production. These wells also tend to start producing gas and water immediately upon completion, with production usually increasing as the well is dewatered. However, production rates from newly drilled and completed wells in the Black Warrior Basin do not always increase as the formation dewaters. Once dewatered, coalbed methane wells often demonstrate fairly constant production rates for up to five years and then production rates start declining. Wells in the area usually cost approximately $450,000 to drill and complete. Typical wells produce over a period of 20 to over 50 years and on average have less favorable economic characteristics than conventional gas wells. We generally own a 100% working interest (an approximate 75% average net revenue interest, calculated before the Torch Royalty NPI, or NPI, described in Item 1. “Business—Operations—Torch Royalty NPI”) in the Black Warrior Basin, which had 493 producing natural gas wells as of December 31, 2009.
Our properties in the Black Warrior Basin were first drilled in the early 1990s by Torch Energy Corporation (“Torch Energy”) and its affiliates to take advantage of certain tax credits. Therefore, most of our wells were drilled before 1992. The properties in the Black Warrior Basin were owned and operated by Torch Energy until January 2003, when they were acquired by Everlast Energy LLC (“Everlast”), a company formed by a former Torch Energy executive. We acquired our initial properties in the Black Warrior Basin from Everlast in June 2005.
The Black Warrior Basin is located in western Tuscaloosa County and Pickens County, Alabama and encompasses a gross surface area of approximately 109 square miles. The field has been primarily developed on 80-acre spacing. The State of Alabama has approved either 40-acre or 80-acre spacing field-wide. We are currently developing our properties in the field on both 40- and 80-acre spacing.
The field has seven compressor stations with 800-1,200 horsepower compressors, approximately 170 miles of gas gathering lines (wells to header) and approximately 25 miles of transportation lines (header to compressor). In addition, there are approximately 152 miles of water gathering pipes and 28 miles of water transportation pipes.
One of our typical well sites consists of a single gas well and associated gas/water separators connected via subsurface piping. Gas flows from the wellhead to compressor facilities, where over 85% of the gas is routed to a natural gas pipeline operated by Southern Natural Gas Company (“SONAT”). The remaining natural gas is routed to the Enterprise Alabama Intrastate L.L.C. pipeline (“Enterprise Alabama”) from the Maxwell Crossing Module. Water produced from our wells is transferred via a facility pipeline to one of three wastewater treatment facilities, where particulates are removed by settling and the water is then discharged into the Black Warrior River in accordance with effluent standards established by the Alabama Department of Environmental Management (“ADEM”) and our National Pollutant Discharge Elimination System (“NPDES”) permits. In addition, there are three saltwater disposal wells that are not currently in use.
Our estimated proved reserves in the Black Warrior Basin at December 31, 2009 were approximately 87.9 Bcfe, approximately 78% of which were classified as proved developed.
Cherokee Basin
The Cherokee Basin is located in the Mid-Continent region in southern Kansas, northern Oklahoma, and western Missouri. It is the eighth largest coalbed methane basin in the United States and covers approximately 26,500 square miles. Production of coalbed methane gas has been ongoing in the basin since the late 1980s. The predominant production is natural gas produced from coals and shales. When commodity prices increased, the attraction to these shallow long-lived unconventional resources increased.
2
Table of Contents
There are multiple producing coal zones in the Cherokee Basin including the Rowe, Riverton, Weir-Pitt, and Dawson zones. The carbonaceous shale zone known as the Mulky/Iron Post has been a favored recompletion target for many operators because its presence in a majority of the wells is shallower than most main objective pay zones, and most of the time adds moderate cash flow. In addition, there are other productive shale zones, as well as conventional sandstone and limestone potential that can add gas production.
The individual producing zones are generally 1 to 4 feet thick and appear sometimes as thicker coal and shale intervals. When vertical wells are drilled, these zones need to be hydraulically fractured to stimulate production. The coals in the basin are believed to be near complete saturation such that some gas production is almost immediate. However, as in the Black Warrior Basin, a period of dewatering is required to relieve the pressure on the coals to allow them to produce at their maximum rate. For this reason, pumping units are placed on each well. These units will periodically pump off the water which has accumulated in the well so that the coals can continue to produce while the water is injected into a nearby injection well.
Producing coalbed methane zones get deeper moving from east to west across the Cherokee Basin. Portions of Nowata County, Oklahoma produce from depths that range from about 700 feet to about 1,300 feet in depth. Wells in this area usually cost less than $170,000 to drill and complete. This is in contrast to coalbed methane producing zones in Osage County, Oklahoma that range from about 900 feet to about 2,700 feet in depth. Wells in this area usually vary in cost from $300,000 to in excess of $450,000 to drill and complete. Offsetting the lower drilling costs are the relatively low reserves and low daily production rates per well. Typical wells produce over a period of 20 to over 50 years and on average have less favorable economic characteristics than conventional gas wells.
At December 31, 2009, we own approximately 2,257 net producing wells in the Cherokee Basin. The gas coming from our producing wells is low pressure due to the shallow producing formations. Therefore, compression is needed to move the gas to point of sale. We operate in excess of 20 booster compressors and stations to get our natural gas to sales points owned by ONEOK Gas Transportation L.L.C., Scissortail Energy LLC, Enogex Gas Gathering LLC, Enogex LLC, and Southern Star Central Gas Pipeline, Inc. We operate a substantial portion of our production in the Cherokee Basin. We also own a 50% working interest in wells operated by Bullseye Operating L.L.C. Bullseye operates approximately 500 gross wells in Washington and Nowata Counties in Oklahoma and sells its production through the Cotton Valley producers cooperative, Cotton Valley Compression, L.L.C. Our average gross working interest in our Cherokee Basin properties is approximately 70%, with our average gross working interest in our operated properties being approximately 80% and our average gross working interest in our non-operated Cherokee Basin properties being approximately 50%.
Because minimizing costs is important in coalbed methane development, our typical producing location consists of a small pumping unit, gas/water separator and a meter. Both gas and water are gathered via underground piping to a central gathering area where the gas is treated and compressed for sale and the water is injected or held for hauling.
Our estimated proved reserves in the Cherokee Basin at December 31, 2009 were approximately 40.2 Bcfe, all of which were classified as proved developed.
Woodford Shale
The Woodford Shale is located in the Arkoma Basin in southern Oklahoma. We own 83 well bores, or approximately 10 net producing wells, located in Coal and Hughes counties. This area is gas-rich and is characterized by multiple productive zones. The production of natural gas in the Woodford Shale comes from shale rock that has been stimulated through fracturing jobs after a horizontal well has been drilled. Woodford Shale wells are typically 6,000 to 11,000 feet deep and cost approximately $3.3 million on average to drill and complete with multiple fracs required. The gas-bearing shale section ranges from 120 to 200 feet thick. As of December 31, 2009, our 83 wells have an average gross working interest of 11.4% and an average net revenue
3
Table of Contents
interest per well of 9.2%. Approximately 90% of the wells are operated by affiliates of Devon Energy Corporation (“Devon”) and Newfield Exploration Mid-Continent, Inc. (“Newfield”), with the remaining wells operated by three additional companies. We do not have any additional drilling or leasehold rights associated with our Woodford Shale properties and expect declining production rates and limited future capital expenditures for these wells.
Our estimated proved reserves in the Woodford Shale at December 31, 2009 were approximately 3.1 Bcfe, all of which were classified as proved developed.
Proved Oil and Natural Gas Reserves
The following table reflects our estimates of proved oil and natural gas reserves based on the Securities and Exchange Commission (“SEC”) definitions that were used to prepare our financial statements for the periods presented. The Standardized Measure values shown in the table are not intended to represent the current market values of our estimated proved natural gas reserves.
| As of December 31, | ||||||||||||
| Reserve data: |
2009 | 2008 | 2007 | |||||||||
| Estimated proved reserves: |
||||||||||||
| Oil (BBbl) |
0.3 | 0.3 | 0.2 | |||||||||
| Natural gas (Bcfe) |
129.4 | 230.7 | 301.6 | |||||||||
| Oil and natural gas (Bcfe) |
131.2 | 232.4 | 302.8 | |||||||||
| Proved developed reserves (Bcfe) |
112.1 | 159.0 | 186.7 | |||||||||
| Proved undeveloped reserves (Bcfe) |
19.1 | 73.4 | 116.1 | |||||||||
| Proved developed reserves as a percent of total reserves |
85 | % | 68 | % | 62 | % | ||||||
| Standardized Measure (in millions)(a) |
$ | 97.2 | $ | 228.9 | $ | 480.4 | ||||||
| (a) | Standardized Measure is the present value of estimated future net revenues to be generated from the production of proved reserves, determined in accordance with the rules and regulations of the SEC (using SEC-required prices and costs in effect as of the time of estimation) without giving effect to non-property related expenses such as general and administrative expenses and debt service or to depreciation, depletion and amortization, and discounted using an annual discount rate of 10%. Our Standardized Measure does not include future income taxes because we are not subject to income taxes. Standardized Measure does not give effect to derivative transactions and excludes reserves attributable to the NPI. In 2009 the SEC adopted new reserve reporting rules requiring that the Standardized Measure be calculated using an average 12-month price for 2009 instead of a year-end price which was required to be used for 2008 and 2007. |
Proved developed reserves are reserves that can be expected to be recovered through existing wells with existing equipment and operating methods. Proved undeveloped reserves are proved reserves that are expected to be recovered from new wells drilled to known reservoirs on undrilled acreage for which the existence and recoverability of such reserves can be estimated with reasonable certainty, or from existing wells on which a relatively major expenditure is required to establish production. The SEC provides a complete definition of proved reserves, proved developed reserves and proved undeveloped reserves in Rule 4-10(a) of Regulation S-X. These reserve estimates were prepared using the new SEC rules effective for the fiscal year ended December 31, 2009, which we further discuss on page 76.
At December 31, 2009, 2008, and 2007, Netherland, Sewell & Associates, Inc. (“NSAI”), an independent petroleum engineering firm, prepared an estimate of all our proved reserves. We used NSAI’s estimates of our 2009 and 2008 proved reserves to prepare our financial statements. We used internal estimates of our proved reserves to prepare our financial statements for 2007. NSAI’s estimates of our 2007 proved reserves are materially consistent with our internal estimate. Our reserve reports are reviewed by our audit committee and approved by our board of managers. NSAI maintains a degreed staff of highly competent technical personnel. The average experience level of their technical staff of engineers, geoscientists, and petrophysicists exceeds 20 years, including 5 to 15 years with a major oil company. The average experience level of our internal degreed staff of engineers and geoscientists exceeds 27 years.
4
Table of Contents
We have a successful track record of developing our proved undeveloped reserves in both the Cherokee Basin and in the Black Warrior Basin. We do not rely on any proprietary technology to drill our development wells. Since our formation in 2005, we have drilled 313 development wells on our proved undeveloped locations and intend to continue this pattern of development drilling. Based on our structure as a limited liability company and our current business plans, our forecasted cash flow is expected to be sufficient to fund this type of development drilling program on our proved undeveloped locations. Using the new SEC rules for estimating proved reserves at December 31, 2009, we only recorded proved undeveloped locations that are scheduled to be drilled within the next 5 years. Any locations that are identified to be drilled beyond 5 years are classified as probable or possible reserves. We record our proved undeveloped locations typically at one offset location but we can also record proved undeveloped locations on one section surrounding existing production subject to available infrastructure. We have the right to develop locations under our concession agreement with the Osage Nation in Osage County, Oklahoma, subject to its terms, until 2020 and we have leasehold availability for our other proved undeveloped locations. Because of the decrease in the SEC-required price utilized to determine our 2009 proved reserves, our 2009 reserve report only has proved undeveloped reserves recorded in the Black Warrior Basin. The following table summarizes our inventory of proved undeveloped locations:
| Year PUD Originally Booked |
Year PUD Is Scheduled To Be Developed | ||||||||||||||||
| 2010 | 2011 | 2012 | 2013 | 2014 | |||||||||||||
| Total PUD Booked In 2006 Reserve Report |
Number of Locations |
10 | 14 | 14 | 14 | 15 | |||||||||||
| Equivalents-MMcfe |
2,854 | 3,996 | 3,996 | 3,996 | 4,281 | ||||||||||||
| Capital Estimate-$000’s |
$ | 5,355 | $ | 6,105 | $ | 5,295 | $ | 6,145 | $ | 6,165 | |||||||
The data in all of the above tables represents estimates only. Oil and natural gas reserve engineering is an inherently subjective process of estimating underground accumulations of oil and natural gas that cannot be measured exactly. The accuracy of any reserve estimate is a function of the quality of available data and engineering, geological interpretation and judgment. Accordingly, reserve estimates may vary from the quantities of oil and natural gas that are ultimately produced. No reserve data has been filed or included with reports to any governmental agency other than the SEC.
Future prices received for production and costs may vary, perhaps significantly, from the prices and costs assumed for purposes of these estimates. The Standardized Measure shown should not be considered the current market value of our reserves. The 10% discount factor used to calculate present value, which is required, is not necessarily the most appropriate discount rate. The present value, no matter what discount rate is used, is materially affected by assumptions as to timing of future production, which may prove to be inaccurate.
5
Table of Contents
Oil and Natural Gas Prices
We have generally sold our natural gas production based upon an index price reported in Inside FERC’s Gas Market Report (“Inside FERC”) or at spot market prices applicable to the location of our natural gas production. Our realized pricing is primarily driven by the Inside FERC price for Southern Natural Gas Company (Louisiana) (“SONAT Inside FERC price”) with respect to our properties in the Black Warrior Basin, the Inside FERC prices for CenterPoint Energy Gas Transmission (East), Natural Gas Pipeline Company of America (Midcontinent), ONEOK Gas Transportation (Oklahoma), Panhandle Eastern Pipeline (Texas, Oklahoma) and Southern Star Central Gas Pipeline (Texas, Oklahoma, Kansas) with respect to our properties in the Cherokee Basin, and the Inside FERC price for CenterPoint Energy Gas Transmission (East) with respect to our properties in the Woodford Shale. The following table summarizes year-end closing prices for the major indexes applicable to our businesses:
| Prices on January 1, | |||||||||
| Market Prices: |
2010 | 2009 | 2008 | ||||||
| Natural gas price—NYMEX (Henry Hub) |
$ | 5.82 | $ | 6.16 | $ | 7.13 | |||
| Natural gas price—CenterPoint Energy Gas Transmission (East) |
$ | 5.67 | $ | 4.46 | $ | 6.19 | |||
| Natural gas price—Natural Gas Pipeline Company of America (Midcontinent) |
$ | 5.77 | $ | 4.66 | $ | 6.17 | |||
| Natural gas price—ONEOK Gas Transportation (Oklahoma) |
$ | 5.79 | $ | 4.61 | $ | 6.36 | |||
| Natural gas price—Panhandle Eastern Pipeline (Texas, Oklahoma) |
$ | 5.73 | $ | 4.57 | $ | 6.21 | |||
| Natural gas price—Southern Natural Gas Company (Louisiana) |
$ | 5.87 | $ | 6.21 | $ | 7.26 | |||
| Natural gas price—Southern Star Central Gas Pipeline (Texas, Oklahoma, Kansas) |
$ | 5.79 | $ | 4.74 | $ | 6.20 | |||
| Oil price—West Texas Intermediate—Cushing |
$ | 79.39 | $ | 44.60 | $ | 95.95 | |||
We enter into derivative transactions in the form of hedging arrangements to reduce the impact of natural gas price volatility on our cash flow from operations. Currently, we use fixed price swaps and from time to time options to hedge New York Mercantile Exchange, or “NYMEX”, natural gas prices. We also use basis swaps to limit our exposure to differences between the NYMEX natural gas price and the price at the location where we sell our gas. By removing the price volatility from a significant portion of our natural gas production, we have mitigated, but not eliminated, the potential effects of fluctuating natural gas prices on our cash flow from operations for those periods. All of our derivative positions are outlined starting on page 69.
6
Table of Contents
Production and Price History
The following table sets forth information regarding net production of natural gas and certain price and cost information for each of the periods indicated:
| For the year ended December 31, 2009 |
For the year ended December 31, 2008 |
For the year ended December 31, 2007 | |||||||
| Net Production: |
|||||||||
| Total production (MMcfe) |
17,061 | 17,384 | 10,393 | ||||||
| Average daily production (Mcfe/d) |
46,742 | 47,497 | 28,474 | ||||||
| Average Sales Prices: |
|||||||||
| Price per Mcfe including hedges(a) |
$ | 8.35 | $ | 9.39 | $ | 7.30 | |||
| Price per Mcfe excluding hedges |
$ | 3.75 | $ | 8.13 | $ | 6.51 | |||
| Average Unit Costs Per Mcfe: |
|||||||||
| Field operating expenses(b) |
$ | 2.15 | $ | 2.57 | $ | 2.00 | |||
| Lease operating expenses |
$ | 1.97 | $ | 2.09 | $ | 1.65 | |||
| Production taxes |
$ | 0.18 | $ | 0.48 | $ | 0.35 | |||
| General and administrative expenses |
$ | 1.08 | $ | 0.81 | $ | 0.85 | |||
| Depreciation, depletion and amortization(c) |
$ | 4.47 | $ | 4.48 | $ | 2.23 | |||
| (a) | Price per Mcfe including hedges includes realized and unrealized mark-to-market losses on derivative transactions that did not qualify for hedge accounting treatment. |
| (b) | Field operating expenses include lease operating expenses and production taxes. |
| (c) | Depreciation, depletion and amortization includes non-cash impairments of oil and natural gas assets. Excluding impairments, the 2009 and 2008 cost per Mcfe was $4.16 and $3.01, respectively. |
The following table sets forth information regarding net production of natural gas and selected price and cost information by geographic region for each of the periods indicated:
| Black Warrior Basin | Cherokee Basin | Woodford Shale | ||||||||||||||||||||||||
| 2009 | 2008 | 2007 | 2009 | 2008 | 2007 | 2009 | 2008 | 2007 | ||||||||||||||||||
| Volumes (MMcfe) |
4,887 | 5,052 | 5,087 | 11,401 | 11,391 | 5,306 | 773 | 941 | — | |||||||||||||||||
| Sales Price per Mcfe, without hedges |
$ | 4.07 | $ | 9.18 | $ | 7.00 | $ | 3.60 | $ | 7.61 | $ | 4.32 | $ | 3.60 | $ | 5.89 | — | |||||||||
| Lease Operating Expense per Mcfe |
$ | 1.47 | $ | 1.45 | $ | 1.38 | $ | 2.19 | $ | 2.42 | $ | 1.53 | $ | 1.86 | $ | 1.36 | — | |||||||||
Productive Wells
The following table sets forth information at December 31, 2009 relating to the productive wells in which we owned a working interest as of that date. Productive wells consist of producing wells and wells capable of production, including natural gas wells awaiting pipeline connections to commence deliveries. Gross wells are the total number of producing wells in which we have an interest, and net wells are the sum of our fractional working interests owned in gross wells.
| Natural Gas | Oil | |||||||
| December 31, 2009 |
December 31, 2009 | |||||||
| Gross | Net | Gross | Net | |||||
| Operated |
2,341 | 2,284 | 134 | 134 | ||||
| Non-operated |
797 | 330 | 23 | 12 | ||||
| Total |
3,138 | 2,614 | 157 | 146 | ||||
7
Table of Contents
Drilling Activity
The following table sets forth information with respect to natural gas wells drilled and completed by us during the years ended December 31, 2009, 2008 and 2007. The information should not be considered indicative of future performance, nor should it be assumed that there is necessarily any correlation between the number of productive wells drilled, quantities of reserves found or economic value. Productive wells are those that produce commercial quantities of oil or natural gas, regardless of whether they produce a reasonable rate of return. No exploratory wells were drilled during the years ended December 31, 2009, 2008 or 2007.
| Year Ended December 31, |
Wells in Progress as of December 31, 2009 | |||||||
| 2009 | 2008 | 2007 | ||||||
| Gross: |
||||||||
| Development |
||||||||
| Productive |
60 | 130 | 102 | 1 | ||||
| Dry |
1 | — | — | — | ||||
| Recompletions |
17 | 47 | 24 | — | ||||
| Total |
78 | 177 | 126 | 1 | ||||
| Net: |
||||||||
| Development |
||||||||
| Productive |
60 | 115 | 89 | 1 | ||||
| Dry |
1 | — | — | — | ||||
| Recompletions |
17 | 43 | 21 | — | ||||
| Total |
78 | 158 | 110 | 1 | ||||
Developed and Undeveloped Acreage
The following table sets forth information as of December 31, 2009 relating to our leasehold acreage.
| Developed Acreage(a) |
Undeveloped Acreage(b) | |||||||
| Gross(c) | Net(d) | Gross(c) | Net(d) | |||||
| Total |
253,267 | 242,285 | 60,083 | 54,396 | ||||
| (a) | Developed acres are acres pooled within or assigned to productive wells/units. |
| (b) | Undeveloped acres are acres on which wells have not been drilled or acres that have not been pooled into a productive unit. |
| (c) | A gross acre is an acre in which a working interest is either fully or partially leased. The number of gross acres may include minerals not under lease as a result of leasing some but not all joint mineral owners under any given tract. |
| (d) | A net acre is deemed to exist when the sum of the fractional ownership working interests in gross acres equals one. The number of net acres is the sum of the fractional working interests owned in gross acres expressed as whole numbers and fractions thereof. |
This acreage includes areas leased under a concession agreement that we have with the Osage Nation in Osage County, Oklahoma, which provides us the exclusive right to lease up to approximately 560,000 acres within the Osage Nation. Our concession agreement with the Osage Nation is in four phases as follows: (i) Phase I (four year term of January 1, 2005 through December 31, 2008) wherein not less than 440 production wells shall be drilled and completed; (ii) Phase II (four year term of January 1, 2009 through December 31, 2012) wherein a cumulative of not less than 680 production wells shall be drilled and completed; (iii) Phase III (four year term of January 1, 2013 through December 31, 2016) wherein a cumulative of not less than 920 production wells shall be drilled and completed; and (iv) Phase IV (four year term of January 1, 2017 through December 21, 2020) wherein a cumulative of not less than 1,160 production wells shall be drilled and completed, such that not less than a total of 1,160 production wells shall be drilled in Phases I through IV. Generally, in addition to the
8
Table of Contents
drilling and completion of a producing well counting as a “production well,” the drilling of two dry holes are counted as one “production well,” a recompletion of an existing wellbore is counted as one “production well,” a horizontal well is counted as two “production wells” and a salt water disposal well is counted as one “production well” under the concession agreement (hereinafter “production well credits”). As of December 31, 2008, the end of Phase I, we believe we have earned approximately 702 production well credits. As of December 31, 2009, we believe we have earned approximately 757 production well credits and our leased acreage totaled approximately 49,880 acres. Generally, we have the right each year to elect to license up to a certain acreage for that year for a specified license payment, and a license must be obtained before we lease acreage. During the term of the concession agreement, however, we have the exclusive right to lease the acreage covered thereunder unless we notify the Osage Nation in writing that we have no intention to lease any particular acreage. If the drilling requirement for a particular phase is not met, we have the option to make a payment equal to the shortfall of wells required to be drilled multiplied by $50,000 per well in order to be deemed to have complied with the requirement for that phase. If the drilling requirement of a particular phase were not met (either through drilling of production wells or payment as described above), the Osage Nation’s sole remedy shall be the termination of the concession agreement at the expiration of the then current phase, provided that such termination shall have no effect upon our wells already drilled and the leases that we have acquired that are producing in paying quantities.
Leases
Our leases are concentrated in Oklahoma (79%), Alabama (15%), and Kansas (6%). We have approximately 945 leases in the Black Warrior Basin on over 43,770 net acres. The typical oil and gas lease agreement covering our Black Warrior Basin properties provides for the payment of royalties to the mineral owner for all oil and natural gas produced from any wells drilled on or pooled with the leased property. There are other burdens affecting certain of the leases in the form of overriding royalty interests and the NPI. On our properties in the Black Warrior Basin, we own a 100% working interest, or an approximate 75% net revenue interest, in substantially all our developed acreage. Depending on the location of a particular well, the total lease burden is generally 25%, generally corresponding to a 75% lease net revenue interest to us calculated before the NPI. In some instances, our lease net revenue interest may be as high as 83%. We have approximately 1,736 leases in the Cherokee Basin on approximately 252,911 net acres. Our concession agreement with the Osage Nation in Osage County, Oklahoma provides us the exclusive right to lease approximately 560,000 net acres within the Osage Nation until its expiration in 2020 or any earlier termination according to its terms. We will earn new acreage within the concession as we drill additional wells. The typical oil and gas lease agreement covering our other Cherokee Basin properties provides for the payment of royalties to the mineral owner for all oil and natural gas produced from any wells drilled on or pooled with the leased property. In the Cherokee Basin, depending on the location of a particular well, the total lease burden on our operated properties is generally 20%, generally corresponding to a 80% net revenue interest to us, and on our non-operated properties is generally a 40% net revenue interest. We have no leasehold rights in the Woodford Shale.
Under the oil and gas lease agreements covering our productive wells, such leases have generally been perpetuated beyond their stated lease term and generally will not expire unless and until associated production ceases. Such leases are said to be “held by production” and do not require us to make lease payments beyond the royalty amount stipulated by each lease. The area held by production from a particular well is typically held by lease or applied to a pooled unit for such well or as specified under state law. Barring establishment of commercial production, most of our leases not currently held by production will expire. Approximately 12%, 12% and 4% of our total net undeveloped acreage of 54,396 acres is held under leases that have remaining primary terms expiring in 2010, 2011 and 2012, respectively. Of these expiration amounts in 2010, 2011, and 2012, approximately 77%, 90%, and 80%, respectively, apply to our concession agreement with the Osage Nation. If these leases do expire, we have the exclusive right to acquire a new lease on any expired acreage under our concession agreement with the Osage Nation until its expiration in 2020 or any earlier termination according to its terms. Substantially all of the remaining expiring acreage in all three years is primarily located in Kansas and Oklahoma.
9
Table of Contents
Operations
General
We are the operator of approximately 88% of the 2,760 net wells in which we own an interest. During a portion of 2009, certain of our operations were managed by CEPM under the management services agreement that is described in Item 13. “Certain Relationships and Related Transactions, and Manager Independence.” Through the agreement, CEPM provided us with certain services to help operate our business, including the management of our field employees, contract professional services firms, and other third party vendors who handle our operations and drilling functions. Constellation, our former sponsor, terminated the management services agreement on December 15, 2009. The administration and operation of our properties may now be divided into the following functions:
Executive Management
Our executive management team develops and approves our business plans. They report directly to our board of managers, which is composed of three independent managers and two managers appointed by Constellation, one of whom is our chief executive officer. Beginning in January 2009, our chief executive officer, chief operating officer, and president, our chief financial officer and treasurer, and our chief accounting officer and controller were transitioned from being provided by CEPM through the management services agreement to direct employees of one of our subsidiaries. We also appointed a General Counsel in January 2009. For additional information, please refer to “Transition of the Executive Management Team to CEP” on page 89.
We have the responsibility for the overall operations of our fields and developing our drilling programs and other production enhancement opportunities. Field operations and the related technical support services including geology, engineering, land administration, and accounting are conducted by employees of one of our subsidiaries. Our employees and contractors approve the design and the development, maintenance, recompletion and workover for all of the wells in our fields. Our drilling programs are designed by us and implemented by various contractors. We do not own drilling rigs or other oil field services equipment used for drilling wells on our properties.
Field Operations
Our day-to-day operations in the Black Warrior Basin are conducted by field employees of one of our subsidiaries under the supervision of our management team. The field operations team has extensive experience in the Black Warrior Basin and has been operating the Black Warrior Basin since the early 1990s. This group is responsible for the operation of the existing production wells, pipelines, compressors and water handling facilities, as well as interaction with Alabama regulatory authorities with regard to permitting and compliance matters. In addition, they assist with the execution of the drilling and maintenance program and the management of the contractors responsible for the drilling and completion of these wells. We have a field office located in Buhl, Alabama.
When we drill new wells in the Black Warrior Basin, the drilling rigs are provided by and the wells are drilled by Pense Brothers Drilling Company, an established Black Warrior Basin drilling contractor. Cementing is conducted by Halliburton; Well Service, LLC provides well logging services; and Halliburton provides the design for, and executes upon, the well stimulation program. We evaluate our service providers in the basin from time to time.
Our day-to-day operations in the Cherokee Basin are conducted by field employees of one of our subsidiaries under the supervision of our management team. The majority of the field operations team is composed of employees that were transitioned to us as a result of the acquisitions we made in the basin. This group is responsible for the operation of the existing production wells, pipelines, compressors and water handling facilities, as well as interaction with regulatory authorities with regard to permitting and compliance matters. In
10
Table of Contents
addition, they assist with the execution of the drilling and maintenance programs and the management of the contractors responsible for the drilling and completion of these wells. We have field offices located in Coffeyville, Kansas, Dewey, Oklahoma and Skiatook, Oklahoma.
When we drill new wells in the Cherokee Basin, our construction and roustabout services are provided by Falcon Field Services, Inc. and HS Field Services, Inc. The drilling rigs are provided by and our vertical wells are drilled by Pense Brothers Drilling Company and our directional drilling is done by Scientific Drilling International. Cementing and stimulation services are conducted by Consolidated Oil Well Services, LLC and Maverick Stimulation Company. Rick’s Tank Truck Service is our primary water hauling service. We evaluate our service providers in the basin from time to time.
For our 83 well bores located in the Woodford Shale, the operators of the properties – primarily Devon and Newfield – conduct all operations on our behalf.
Geology and Engineering
Our technical team for our assets is located in our technical office in Tulsa, Oklahoma, and at our corporate headquarters in Houston, Texas. We have retained engineers, geologists and consultants who have experience in drilling and producing coalbed methane reserves. As a result, our project management team has the ability to draw from a base of experienced and capable talent to select drilling locations and completion approaches to improve productivity and generate and test new ideas to improve production and reserves from existing wells through the use of recompletions, optimizing compression and gathering systems. Netherland, Sewell & Associates, Inc., an independent petroleum engineering firm, has been retained to prepare the estimates of our proved reserves.
Land Administration
Our lease positions and our concession with the Osage Nation are managed by our employees with assistance from contract landmen. These landmen provide assistance with management of our current lease positions, acquisitions of new leases, permitting for drilling and laying pipelines as well as negotiating agreements with landowners for the use of their property. We have land staff in our field offices in both Alabama and Oklahoma, with our land administration function in Houston, Texas.
Revenue Accounting
Our revenue accounting function for our Black Warrior Basin and Woodford Shale properties has been outsourced to Petroleum Financial, Inc., a Texas-based revenue accounting firm. It manages the cash flow associated with our interest in our oil and natural gas properties, including the payment of invoices, calculation and payment of royalties, calculation and payment of the NPI, receiving the revenues from gas sales and providing accounting information used to generate financial statements.
Our revenue accounting function for our Cherokee Basin properties has been outsourced to Schlumberger, ePrime Services, a Texas-based revenue accounting firm that is a subsidiary of Schlumberger LTD, a supplier of technology, project management, and information solutions to the oil and gas industry. It manages the cash flow associated with our interest in the oil and natural gas properties, including the payment of invoices, calculation and payment of royalties, receiving the revenues from gas sales and providing accounting information used to generate financial statements.
Marketing and Major Customers
We manage our oil and natural gas marketing efforts and actively monitor our credit exposure to our major customers. We currently sell our natural gas produced in the Black Warrior Basin to J.P. Morgan Ventures Energy Corporation and to Enterprise Alabama Intrastate, L.L.C. We currently sell our natural gas produced in
11
Table of Contents
the Cherokee Basin to Macquarie Energy LLC, Scissortail Energy LLC, Cotton Valley Compression, L.L.C., and ONEOK Energy Services Company, L.P. Our oil production is primarily purchased by Sunoco Partners Marketing and Terminals L.P. Our natural gas production in the Woodford Shale is marketed by the operators of our properties.
Hedging Activity
Our hedging activities are managed by our employees. Their activities are monitored by our risk committee composed of internal employees and quarterly risk reports are given to our board of managers and to the audit committee of our board of managers. We have entered into derivative transactions with banks who participate in our reserve-based credit facility. The derivative transactions are done to reduce our exposure to short-term fluctuations in natural gas prices and interest rates and to achieve more predictable cash flows. None of our derivatives require cash collateral and we do not enter into speculative or proprietary trading activities. For a more detailed discussion of our derivative activities, please read Item 7. “Management’s Discussion and Analysis of Financial Condition and Results of Operations” and Item 7A. “Quantitative and Qualitative Disclosures about Market Risk” in this Annual Report on Form 10-K.
Markets and Competition
We operate in a competitive environment for acquiring properties, marketing oil and natural gas and retaining trained personnel. Many of our competitors possess and employ financial, technical and personnel resources substantially greater than ours, which can be particularly important in the areas in which we operate. As a result, our competitors may be able to pay more for productive oil and natural gas properties and exploratory prospects and to evaluate, bid for and purchase properties and prospects than our financial or personnel resources permit. Our ability to acquire additional prospects and to find and develop reserves in the future will depend on our ability to evaluate and select suitable properties and to consummate transactions in a competitive environment with limited access to capital. There is substantial competition for the limited capital available for investment in the oil and natural gas industry. Neither Constellation nor any of its affiliates is restricted from competing with us. Constellation or its affiliates may acquire, invest in or dispose of E&P properties or other assets without any obligation to offer us the opportunity to purchase or own interests in those assets.
We are also affected by competition for drilling rigs, completion rigs and the availability of related equipment. In the past, the oil and natural gas industry has experienced shortages of drilling and completion rigs, equipment, pipe and personnel, which has delayed development drilling activities and has caused significant increases in the prices for this equipment and personnel. We are unable to predict when, or if, such shortages may occur or how they would affect our development and drilling program. To date, however, we have not experienced the effects of such shortages. In addition, over the past several years, our field employees have been working with a team of drilling and completion contractors and have developed relationships that should enable us to mitigate the risks associated with equipment availability.
Title to Properties
At the time we acquired our interests in our oil and natural gas properties, we obtained a title opinion or had performed a review on the most significant leases in the fields. As a result, title opinions or reviews have been obtained on a significant portion of our properties.
In some instances, and as is customary in the oil and natural gas industry, we conducted only a cursory review of the title to certain properties on which we do not have proved reserves. To the extent title opinions or other investigations reflect title requirements on those properties, we are typically responsible for curing any material title matters at our expense. We generally will not commence drilling operations on a property until we have cured or waived any such title matters or deemed the title risk sufficiently mitigated to justify proceeding with operations on such property.
12
Table of Contents
We believe that we have satisfactory title to all of our material assets. Although title to these properties is subject to encumbrances in some cases, such as customary interests generally retained in connection with acquisition of real property, customary royalty interests and contract terms and restrictions, liens under operating agreements, liens related to environmental liabilities associated with historical operations, liens for current taxes and other burdens, easements, restrictions and minor encumbrances customary in the oil and natural gas industry, we believe that none of these liens, restrictions, easements, burdens and encumbrances will materially detract from the value of these properties or from our interest in these properties or will materially interfere with our use in the operation of our business. The Trust Wells in the Robinson’s Bend Field in Alabama are subject to the NPI. For a more detailed discussion of the NPI, please read Item 1. “Business—Torch Royalty NPI”. In addition, we believe that we have obtained sufficient rights-of-way grants and permits from public authorities and private parties to operate our business in all material respects as described in this Annual Report on Form 10-K.
Environmental Matters and Regulation
General
Our operations are subject to stringent and complex federal, state and local laws and regulations governing environmental protection as well as the discharge of materials into the environment. These laws and regulations may, among other things:
| • | require the acquisition of various permits before drilling commences; |
| • | restrict the types, quantities and concentrations of various substances that can be released into the environment in connection with oil and natural gas drilling, production and transportation activities; |
| • | limit or prohibit drilling activities on lands lying within wilderness, wetlands and other protected areas; and |
| • | require remedial measures to mitigate pollution from former and ongoing operations, such as requirements to close pits and plug abandoned wells. |
These laws, rules and regulations may also restrict the rate of oil and natural gas production below the rate that would otherwise be possible in the absence of such regulations. The regulatory burden on the oil and natural gas industry increases the cost of doing business in the industry and consequently affects profitability. Additionally, Congress and federal and state agencies frequently revise environmental laws and regulations, and any changes that result in more stringent and costly waste handling, disposal and cleanup requirements for the oil and natural gas industry could have a significant impact on our operating costs.
Environmental laws and regulations that could have a material impact on the oil and natural gas industry include the following:
Waste Handling
The Resource Conservation and Recovery Act (“RCRA”) and comparable state statutes, regulate the generation, transportation, treatment, storage, disposal and cleanup of hazardous wastes and non-hazardous wastes. Under the auspices of the federal Environmental Protection Agency (“EPA”), the individual states administer some or all of the provisions of RCRA, sometimes in conjunction with their own, more stringent requirements. Drilling fluids, produced waters and most other wastes associated with the exploration, development and production of oil and natural gas are currently regulated under RCRA’s non-hazardous waste provisions. Certain of our operations are known to bring to the surface naturally occurring radioactive material (“NORM”) which is accumulated at certain of our facilities in the Black Warrior Basin and is subject to permitting and controls for storage, as well as requirements for proper disposal. We believe our operations are in substantial compliance with the radioactive materials license issued by the State of Alabama Department of Public Health to cover activities associated with NORM. Although we do not believe the current costs of
13
Table of Contents
managing any of our wastes are material under presently applicable laws, any future reclassification of natural gas exploration and production wastes as hazardous wastes, or more stringent regulation of NORM wastes, could increase our costs to manage and dispose of wastes.
Comprehensive Environmental Response, Compensation and Liability Act
The Comprehensive Environmental Response, Compensation and Liability Act (“CERCLA”), also known as the Superfund law, imposes joint and several liability, without regard to fault or legality of conduct, on classes of persons who are considered to be responsible for the release of a hazardous substance into the environment. These persons include the owner or operator of the site where the release occurred, and anyone who disposed of, or arranged for the disposal of a hazardous substance released at the site. Under CERCLA, such persons may be subject to joint and several liability for the costs of cleaning up the hazardous substances that have been released into the environment, for damages to natural resources and for the costs of certain health studies. In addition, it is not uncommon for neighboring landowners and other third parties to file claims for personal injury and property damage allegedly caused by the hazardous substances released into the environment.
We currently own, lease or operate numerous properties that have been used for coalbed methane exploration and production for a number of years. Although we believe operating and waste disposal practices utilized in the past with respect to these properties were typical for the industry at the time, hazardous substances, wastes or hydrocarbons may have been released on or under the properties owned or leased by us, or on or under other locations, including off-site locations, where such substances have been taken for disposal. In addition, these properties have been operated by third parties or by previous owners or operators whose treatment and disposal of hazardous substances, wastes or hydrocarbons was not under our control. These properties and the substances disposed or released on them may be subject to CERCLA, RCRA and analogous state laws. Under such laws, we could be required to remove previously disposed substances and wastes, remediate contaminated property or perform remedial plugging or pit closure operations to prevent future contamination.
Water Discharges
The Federal Water Pollution Control Act (the “Clean Water Act”) and analogous state laws, impose restrictions and strict controls with respect to the discharge of pollutants, including spills and leaks of produced water and other oil and natural gas wastes, into waters of the United States. The discharge of pollutants into regulated waters is prohibited, except in accordance with the terms of a permit issued by the EPA or an analogous state agency. Federal and state regulatory agencies can impose administrative, civil and criminal penalties for non-compliance with discharge permits or other requirements of the Clean Water Act and analogous state laws and regulations. In the Cherokee Basin, water is pumped from producing wells, collected, and injected into approved salt water disposal wells in the deeper Arbuckle formation. In the Black Warrior Basin, we maintain permits issued pursuant to the Clean Water Act that authorize the discharge of produced waters and similar wastewaters generated as a result of our operations, in accordance with effluent standards established by the Alabama Department of Environmental Management (“ADEM”). While we believe we are in substantial compliance with these permits and all other requirements of the Clean Water Act, we have several ponds used for the treatment and storage of wastewaters that were found to have leaked into the subsurface beneath the ponds at some time in the past in the Black Warrior Basin. ADEM is aware of these leaks. We have replaced certain of the liners beneath these treatment ponds and, under the supervision of ADEM, are monitoring for the presence of chlorides in the subsurface to better determine what cleanup measures, if any, may be required by the ADEM. Based on present information, we do not believe we will incur material costs or penalties in connection with this matter, but there can be no assurance that significant costs will not be incurred if future data reveals elevated levels of chlorides beneath the ponds.
Air Emissions
The Clean Air Act, and comparable state laws, regulate emissions of various air pollutants through air emissions permitting programs and the imposition of other requirements. In addition, the EPA, ADEM, the
14
Table of Contents
Oklahoma Department of Environmental Quality and the Kansas Department of Health and Environment, have developed, and continue to develop, stringent regulations governing emissions of toxic air pollutants at specified sources. We believe our operations are in substantial compliance with federal and state air emission standards. Federal and state regulatory agencies can impose administrative, civil and criminal penalties for non-compliance with air permits or other requirements of the federal Clean Air Act and associated state laws and regulations.
OSHA and Other Laws and Regulation
We are subject to the requirements of the federal Occupational Safety and Health Act (“OSHA”) and comparable state statutes. The OSHA hazard communications standard, the EPA community right-to-know regulations under the Title III of CERCLA and similar state statutes require that we organize and/or disclose information about hazardous materials used or produced in our operations. We believe that we are in substantial compliance with these applicable requirements and with other OSHA and comparable requirements.
The Kyoto Protocol to the United Nations Framework Convention on Climate Change became effective in February 2005. Under the Protocol, participating nations are required to implement programs to reduce emissions of certain gases, generally referred to as greenhouse gases, that are suspected of contributing to global warming. The United States is not currently a participant in the Protocol. The United States Congress has not passed legislation directed at reducing greenhouse gas emissions. In December 2009, the EPA finalized its endangerment finding for greenhouse gas emissions which determines that the EPA has authority to regulate greenhouse gas emissions under the Clean Air Act. The EPA is requiring the mandatory reporting of greenhouse gases from large sources of greenhouse gas emissions, with the first annual reports due by March 31, 2011. We believe that it is not likely that we will have reporting requirements of greenhouse gases under the new rule in its current form. The EPA has also signaled that it will revise and develop new standards for greenhouse gas emissions that may impose additional limits on the greenhouse gas emissions that a new or modified facility may emit. There may be additional legislation that requires the reporting of greenhouse gas emission, the reduction of greenhouse gas emissions or increased taxes on greenhouse gas emissions. Some states have already adopted legislation addressing greenhouse gas emissions from various sources, primarily power plants. The oil and natural gas industry is a direct source of certain greenhouse gas emissions, namely carbon dioxide and methane, and future restrictions on such emissions could impact our future operations. Our operations have not yet been impacted by these current state and local climate change initiatives and, at this time, it is not possible to accurately estimate how potential future laws or regulations addressing greenhouse gas emissions or increased taxes on greenhouse gas emissions would impact our business.
Our operations in the Black Warrior Basin in Alabama are subject to the rules and regulations of the State Oil and Gas Board of Alabama Governing Coalbed Methane Gas Operations and these rules and regulations are found in the State Oil and Gas Board of Alabama Administrative Code. Our operations in the Cherokee Basin and in the Woodford Shale in Oklahoma are subject to the rules and regulations of the Oklahoma Corporation Commission, Oil & Gas Conservation Division. Our operations in the Cherokee Basin in Kansas are subject to the rules and regulations of the Kansas Corporation Commission, Oil & Gas Conservation Division. We believe we are in substantial compliance with these rules and regulations.
We believe that we are in substantial compliance with existing environmental laws and regulations applicable to our current operations and that our continued compliance with existing requirements should not have a material adverse impact on our financial condition and results of operations. We have approximately $0.2 million accrued in our financial statements for our estimated exposure for environmental-related matters. We are not aware of any additional environmental issues or claims that will require material capital expenditures or that will otherwise have a material impact on our financial position or results of operations. However, we cannot predict how future environmental laws and regulations may impact our operations, and therefore cannot provide assurance that the passage of more stringent laws or regulations in the future will not have a negative impact on our financial condition, results of operations or ability to make distributions to our unitholders.
15
Table of Contents
Employees
As of December 31, 2009, our subsidiary, CEP Services Company, Inc., had 136 employees. None of these employees are subject to a collective bargaining agreement.
Offices
We are headquartered in Houston, Texas. We also maintain a technical office in Tulsa, Oklahoma, and we have field offices located in Buhl, Alabama, Coffeyville, Kansas, Dewey, Oklahoma, and Skiatook, Oklahoma. We own the land and field office buildings in Alabama, Kansas, and Oklahoma.
Torch Royalty NPI
The NPI
The majority of our properties in the Robinson’s Bend Field in the Black Warrior Basin are subject to a non-operating net profits interest (“NPI”) held by Torch Energy Royalty Trust (the “Trust”). The NPI is a non-operating net revenue interest upon specified natural gas sales revenues from specified wells in the Black Warrior Basin (the “Trust Wells”) reduced by specified associated expenditures. The units of the Trust are listed for trading on the New York Stock Exchange (the “NYSE”). An affiliate of Torch Energy conveyed the NPI to the Trust in November 1993, together with net profits interests on three other properties. We acquired our properties in the Robinson’s Bend Field from Everlast subject to the NPI. The NPI conveyance gives the Trust an ownership interest in specified properties in the Robinson’s Bend Field.
Not all of our wells within the Robinson’s Bend Field are subject to the NPI. As of December 31, 2009, we owned a working interest in 493 producing wells in the Robinson’s Bend Field, of which 424 were subject to the NPI as follows:
| • | with respect to 393 wells, the lesser of (i) 95% of the net proceeds from such wells for the quarter and (ii) the net proceeds from the sale of 912.5 MMcfe of natural gas for the quarter; and |
| • | with respect to the remaining 31 wells that are subject to the NPI as of December 31, 2009, and all wells drilled thereafter on leases subject to the NPI other than wells drilled to replace damaged or destroyed wells, 20% of the net proceeds from such wells for the quarter. Net proceeds is defined under the NPI as gross revenue from the sale of production attributable to the NPI less specified development, operating and other costs and taxes, in each case as calculated under the NPI documentation. After January 1, 2004, lease operating expenses and capital expenditures have also been deducted in calculating net proceeds under the NPI on the Black Warrior Basin production. If permitted deductions exceed the gross revenue from the sale of production attributable to the NPI, the Trust is not entitled to a payment in respect of the NPI, and such excess, plus interest on such excess, is deducted from gross revenue attributable to future production in respect of the NPI. Payment of the net proceeds, if any, attributable to the NPI is made quarterly. No payments were made to the trust in 2009, 2008 or 2007. In 2006, $0.2 million in payments to the trust were made. |
The Gas Purchase Contract
A gas purchase contract was executed in connection with the formation of the Trust in 1993, which established a minimum price for the purchase of the gas from the Trust Wells as well as a sharing arrangement when the applicable index price for gas increased over a specified sharing price. Torch Energy Marketing, Inc., an affiliate of the original sponsor of the Trust (“TEMI”) as buyer, and another affiliate of TEMI, as seller, entered into the gas purchase contract pursuant to which the parties were obligated to purchase and sell, as the case may be, all net production attributable to the properties subject to the NPI, including the Trust Wells, for an amount equal to the greater of (a) the minimum price of $1.70 per MMBtu, adjusted for inflation, and (b) 97% of a specified index price for natural gas, less certain specified permitted deductions for gathering, treating and
16
Table of Contents
transportation that are calculated monthly. The index price for Black Warrior Basin production equals the SONAT Inside FERC price. In addition, if 97% of the index price exceeds the sharing price specified in the gas purchase contract as adjusted for inflation, which we refer to as the sharing price, the purchase price for the gas is equal to the sharing price plus 50% of the difference between 97% of the index price and the sharing price. As a result, the purchaser is entitled to retain 50% of that difference between 97% of the index price and sharing price. The sharing price was $2.40, $2.30, $2.26, $2.22, and $2.18 per MMBtu in 2009, 2008, 2007, 2006, and 2005, respectively. Despite increases in recent years in spot prices for natural gas, the sharing arrangement under the gas purchase contract has had the effect of keeping the payments to the Trust significantly lower than if the NPI were calculated using the prevailing market price for production from the Trust Wells.
In connection with the acquisition of our initial properties in the Black Warrior Basin from Everlast, our subsidiary, Robinson’s Bend Marketing II, LLC, assumed TEMI’s obligations under the gas purchase contract and our subsidiary, Robinson’s Bend Production II, LLC, assumed the TEMI affiliate’s obligations under the gas purchase contract, in each case in respect of the Black Warrior Basin for production from and after June 13, 2005. As a result, we were obligated to sell and to purchase all production from the Trust Wells on the terms and conditions set forth in the gas purchase contract until termination of the gas purchase contract on January 29, 2008.
Termination of the Trust and Gas Purchase Contract
On January 29, 2008, the unitholders of the Trust voted to terminate the Trust and the trust agreement and authorized the Trustee to wind up, liquidate and distribute the assets held by the Trust under the terms of the trust agreement. The gas purchase contract, by its terms, was also terminated on January 29, 2008 as a result of the termination of the Trust. With the gas purchase contract terminated, we are no longer obligated to sell gas produced from our interest in the Black Warrior Basin pursuant to the gas purchase contract. Notwithstanding the termination of the gas purchase contract, the NPI will continue to burden the Trust Wells, and it should continue to be calculated as if the gas purchase contract were still in effect, regardless of what proceeds may actually be received by us as the seller of the gas. As a result of the termination of the Trust, certain water gathering, separation and disposal costs, which are a component of the NPI calculation, increased from $0.53 per barrel to $1.00 per barrel pursuant to the Water Gathering and Disposal Agreement dated August 9, 1990, as amended; the amounts of the water gathering, separation and disposal costs are set forth in such agreement.
Litigation Related to Trust Termination
On January 25, 2008, Torch Royalty Company, Torch E&P Company, and CEP (collectively, the “Claimants”) commenced an arbitration proceeding before Judicial Arbitration and Mediation Services against Wilmington Trust Company, as Trustee (“Trustee”) for the Trust, and to Capital One, NA, as successor to Hibernia National Bank, as trustee for Torch Energy Louisiana Royalty Trust, pursuant to the operative dispute resolution provisions of the agreement governing the Trust, the NPI and the Conveyances (as defined below). The Claimants were working interest owners in certain oil and gas fields located in Texas, Louisiana and Alabama. The working interests owned by the other Claimants were similarly subject to net profit interests (the “Other NPIs”) that were also based on the gas purchase contract. The Claimants sought a declaratory judgment that the NPI payments as well as the payments owed in respect of the Other NPIs will continue to be calculated using the sharing arrangement under the gas purchase contract even though the Trust and the gas purchase contract were terminated. The Trustee took the position that the sharing arrangement under the gas purchase contract terminated upon the termination of the gas purchase contract. Trust Venture Company, LLC (“Trust Venture”) was permitted to intervene in the proceeding under an agreement whereby Trust Venture and its affiliates agreed to be bound by the formal award in the proceeding. On July 18, 2008, the arbitration panel issued its final award which, among other things, found and concluded that the sharing arrangement and other pricing terms of the gas purchase contract will continue to control the amount owed to the holder of the NPI, and on December 10, 2008, the District Court of Harris County, Texas, 152nd Judicial District, dismissed the appeal of the final award filed by the Trustee and Trust Venture and confirmed the final award.
17
Table of Contents
On January 8, 2009, we were served by Trust Venture, on behalf of the Trust, with a purported derivative action filed in Alabama state court demanding an audited statement of revenues and expenses associated with the NPI, alleging a breach of contract under the conveyance associated with the NPI and the agreement establishing the Trust and asserting that above market rates for services were paid, reducing the amounts paid to the Trust in connection with the NPI. The lawsuit seeks unspecified damages and an accounting of the NPI. The Alabama court has made the Trust a nominal party to the Alabama litigation and ruled that the Trust is subject to regular discovery in the litigation. On August 18, 2009, Trust Venture filed an application for preliminary injunction requesting that the Alabama court enter an injunction requiring the Company to deposit into an escrow account all fees, less expenses, that it receives from water disposal under the Water Gathering and Disposal Agreement pending judgment in the lawsuit and asserting damages of approximately $11.6 million from June 2005 to May 2009. These alleged damages appear to be calculated based on a water gathering, separation and disposal fee of $0.05 per barrel notwithstanding the provisions of the Water Gathering and Disposal Agreement. After hearing, the Alabama court denied Trust Venture’s application. Trust Venture has also recently filed a motion for partial summary judgment seeking a determination regarding the applicability of a provision in the Conveyance related to the calculation of water handling charges. That motion is set for hearing at the end of March 2009. No trial date has been set in the litigation. We intend to defend ourselves vigorously with respect to the alleged claims. There can be no assurance as to the outcome or result of the lawsuit or the arbitration proceeding. We intend our forward-looking statements relating to the action to speak only as of the time of such statements and do not plan to update or revise them except to the extent that material information becomes available.
Impact of Class D Interests
In order to address, to a limited extent, the risks of the potential adverse impact on our operating results from early termination, without the prior consent of our board of managers, of the sharing arrangement in respect of the calculation of amounts payable to the Trust for the NPI, Constellation Holdings, Inc. (“CHI”) contributed to us at the closing of our initial public offering $8.0 million for all of our Class D interests. This contribution will be returned to CHI in 24 special quarterly distributions over a period of approximately six years if the sharing arrangement remains in effect during that period. In connection with the initiation of the arbitration proceeding mentioned above and continuing with the initiation of the lawsuit mentioned above, all quarterly cash contributions with respect to the Class D interests were suspended beginning with the special quarterly cash distributions for the three months ending March 31, 2008. This suspension did not affect the special quarterly cash distribution paid to CHI, as holder of the Class D interests, on February 14, 2008 for the three months ended December 31, 2007. After the payment of the special quarterly distribution for the quarter ended December, 31, 2007, the remaining undistributed amount of the Class D interests is $6.7 million. If the amounts payable by us to the Trust are not calculated based on continued applicability of the sharing arrangement through December 31, 2012, unless such change is approved in advance by our board of managers and our conflicts committee, the following will occur: the Class D interest holder will cease receiving the special quarterly cash distributions; and the Class D interest holder will only receive the remaining undistributed amount of the original $8.0 million contribution under certain circumstances upon our liquidation. The effect of our retention and use of the unreturned amount is to provide us with cash that will mitigate, but may not eliminate, the adverse impact of our reduced revenues from the termination of the sharing arrangement. Based upon our estimated production as reflected in our reserve report and our SONAT Gas Daily price curve on January 29, 2010, we estimate that, if the sharing arrangement in respect of the Trust was terminated and certain water disposal costs applicable to the Trust Wells increase from $0.53 per barrel to $1.00 per barrel, the remaining $6.7 million contributed to us for the Class D interests would offset the resulting revenue shortfall only through the third quarter 2016, if production and prices were to remain constant throughout such period.
Available Information
Our internet address is http://www.constellationenergypartners.com. We make our website content available for informational purposes only. It should not be relied upon for investment purposes, nor is it incorporated by reference in this Form 10-K. We make available free of charge on or through our website our Annual Reports on Form 10-K, Quarterly Reports on Form 10-Q, Current Reports on Form 8-K and any amendments to these reports filed or furnished pursuant to Section 13(a) or 15(d) of the Securities Exchange Act of 1934, as amended
18
Table of Contents
(the Exchange Act), as soon as reasonably practicable after we electronically file such material with, or furnish it to the SEC. The SEC maintains an internet website that contains these reports at http://www.sec.gov. The public may read and copy any materials that we file with the SEC at the SEC’s Public Reference Room at 100 F Street, NE, Washington, DC 20549. Information concerning the operation of the Public Reference Room may be obtained by calling the SEC at (800) 723-0330.
Risks Related to Our Business
Drilling for and producing oil and natural gas are high risk activities with many uncertainties that could adversely affect our financial condition or results of operations and, as a result, our ability to pay distributions to our unitholders.
Our drilling activities are subject to many risks, including the risk that we will not discover commercially productive reservoirs. Drilling for oil and natural gas can be uneconomic, not only from dry holes, but also from productive wells that do not produce sufficient revenues to be commercially viable. In addition, our drilling and producing operations may be curtailed, delayed or cancelled as a result of other factors, including: the high cost, shortages or delivery delays of drilling rigs, equipment, labor and other services; unexpected operational events and drilling conditions; decreases in oil and natural gas prices; limitations in the market for oil and natural gas; adverse weather conditions; facility or equipment malfunctions; accidents; title problems; piping, casing or cement failures; compliance with environmental and other governmental requirements; unusual or unexpected geological formations; loss or damage to oilfield drilling and service tools; loss of drilling fluid circulation; formations with abnormal pressures; environmental hazards, such as gas leaks, oil spills, pipeline ruptures and discharges of toxic gases; fires; accidents or natural disasters; blowouts, craterings and explosions; and uncontrollable flows of natural gas or well fluids.
Any of these events can cause substantial losses, including personal injury or loss of life, damage to or destruction of property, natural resources and equipment, pollution, environmental contamination, loss of wells and regulatory penalties.
We ordinarily maintain insurance against various losses and liabilities arising from our operations; however, insurance against all operational risks is not available to us. Additionally, we may elect not to obtain insurance if we believe that the cost of available insurance is excessive relative to the perceived risks presented. Losses could therefore occur for uninsurable or uninsured risks or in amounts in excess of existing insurance coverage or the insurance companies from which we obtain insurance could become credit impaired and unable to pay our claims. The occurrence of an event that is not fully covered by insurance could adversely affect our business activities, financial condition, results of operations and our ability to make cash distributions to our unitholders.
Our identified drilling location inventories are scheduled out over several years, making them susceptible to uncertainties that could materially alter the occurrence or timing of their drilling, resulting in temporarily lower cash from operations, which may impact our ability to pay distributions.
We have identified and scheduled drilling locations for our future multi-year drilling activities on our existing acreage. These identified drilling locations represent a significant part of our future development drilling program. Our ability to drill and develop these locations depends on a number of factors, including the availability of capital, seasonal conditions, regulatory approvals, oil and natural gas prices, costs and drilling results. In addition, no proved reserves are assigned to any of the potential drilling locations we have identified and therefore, there may be greater uncertainty with respect to the likelihood of drilling and completing successful commercial wells at these potential drilling locations. Our final determination of whether to drill any of these drilling locations will be dependent upon the factors described above as well as, to some degree, the results of our drilling activities with respect to our proved drilling locations. Because of these uncertainties, we do not know if the numerous drilling locations we have identified will be drilled within our expected timeframe
19
Table of Contents
or will ever be drilled or if we will be able to produce oil or natural gas from these or any other potential drilling locations. In addition, unless production is established within the spacing units covering the undeveloped acres on which some of the locations are identified, the leases for such acreage will expire. As such, our actual drilling activities may materially differ from those presently identified, which could have a significant adverse effect on our financial condition and results of operations and ability to pay distributions.
We must make sufficient maintenance capital expenditures to maintain our asset base. Unless we replace the reserves that we produce, our existing reserves and production will decline, which would adversely affect our cash from operations and our ability to make cash distributions to our unitholders.
Producing natural gas reservoirs generally are characterized by declining production rates that vary depending upon reservoir characteristics and other factors. In the Cherokee Basin and in the Woodford Shale, coalbed methane production generally declines at a shallow rate after initial increases in production as a consequence of the dewatering process. However, production rates from newly drilled and completed wells in the Black Warrior Basin do not typically increase as the formation dewaters.
Our production from our existing reserves will decline over time. To offset this decline, we must spend maintenance capital expenditures. During 2009, we spent less than our estimated 2009 maintenance capital expenditures of $30.5 million and our 2009 production decreased slightly from 2008. We expect to spend between $10.0 million and $12.0 million in total capital expenditures in 2010, which is lower than our 2010 estimated maintenance capital expenditures of $25.3 million. Because we have spent less than our estimated maintenance capital expenditures in 2009 and expect to spend an even lower amount in 2010, we would expect our production rates to further decline in 2010.
Additionally, the rate of decline of our reserves and production reflected in our reserve reports will change if production from our existing wells declines in a different manner than we have estimated and can change when we drill additional wells, make acquisitions and under other circumstances. The rate of decline may also be greater than we have estimated due to decreased capital spending or lack of available capital to maintain our maintenance capital expenditures. Thus, our future oil and natural gas reserves and production and, therefore, our cash flow and income are highly dependent on our success in efficiently developing and exploiting our current reserves and economically finding or acquiring additional recoverable reserves. We may not be able to develop, find or acquire additional reserves to replace our current and future production at acceptable costs, which would adversely affect our business, financial condition and results of operations and ability to pay distributions.
Our estimated reserves are based on many assumptions that may prove to be inaccurate. Any material inaccuracies in these reserve estimates or underlying assumptions will materially affect the quantities and present value of our reserves.
No one can measure underground accumulations of oil and natural gas in an exact way. Oil and natural gas reserve engineering requires subjective estimates of underground accumulations of oil and natural gas and assumptions concerning future oil and natural gas prices, production levels and operating and development costs. In addition, in the early stages of a coalbed methane project, it is difficult to predict the production curve of a coalbed methane field. As a result, estimated quantities of proved reserves, projections of future production rates and the timing of development expenditures may prove to be inaccurate. For 2009 and 2008, an independent petroleum engineering firm prepared the estimates of proved oil and natural gas reserves included in our SEC filings. For 2007 and 2006, we prepared the estimates of proved oil and natural gas reserves included in our SEC filings, and such estimates are different from the estimates that may be determined by an independent petroleum engineering firm. Over time, our engineers may make material changes to reserve estimates taking into account the results of actual drilling and production. Some of our reserve estimates are made without the benefit of a lengthy production history, which are less reliable than estimates based on a lengthy production history. Also, certain assumptions are made regarding future oil and natural gas prices, production levels and operating and development costs that may prove incorrect. Any significant variance from these assumptions by actual figures
20
Table of Contents
could greatly affect our estimates of reserves, the economically recoverable quantities of oil and natural gas attributable to any particular group of properties, the classifications of reserves based on risk of recovery and estimates of the future net cash flows. For example, if average natural gas prices were to increase by $1.00 per Mcfe, then the Standardized Measure of our proved reserves as of December 31, 2009 would increase from approximately $97.2 million to approximately $126.4 million. Our Standardized Measure is calculated using unhedged oil and natural gas prices and is determined in accordance with the rules and regulations of the SEC (except for the impact of income taxes as we are not a taxable entity). Numerous changes over time to the assumptions on which our reserve estimates are based, as described above, often result in the actual quantities of oil and natural gas we ultimately recover being different from our reserve estimates.
The present value of future net cash flows from our proved reserves is not necessarily the same as the current market value of our estimated oil and natural gas reserves.
We base the estimated discounted future net cash flows from our proved reserves based on SEC rules. These rules require specific prices and costs to be used when we make an estimate of proved reserves. However, actual future net cash flows from our oil and natural gas properties also will be affected by factors such as:
| • | the supply of and demand for oil and natural gas; |
| • | the actual prices we receive for oil and natural gas; |
| • | our actual operating costs in producing oil and natural gas; |
| • | the amount and timing of our capital expenditures; |
| • | the amount and timing of actual production; and |
| • | changes in governmental regulations or taxation. |
The timing of both our production and our incurrence of expenses in connection with the development and production of oil and natural gas properties will affect the timing of actual future net cash flows from proved reserves, and thus their actual present value. In addition, the 10% discount factor used when calculating our discounted future net cash flows may not be the most appropriate discount factor based on interest rates in effect from time to time and risks associated with us or the oil and natural gas industry in general. Any material inaccuracies in these reserve estimates or underlying assumptions will materially affect the quantities and present value of our reserves, which could adversely affect our business, results of operations, financial condition and our ability to make cash distributions.
Continued declines in oil and natural gas prices may result in additional write-downs of our asset carrying values.
Lower oil and natural gas prices may not only decrease our revenues, profitability and cash flows, but also may reduce the amount of oil and natural gas that we can produce economically. This may result in our having to make additional substantial downward adjustments to our estimated proved reserves or a write-down in the carrying value of our assets. Substantial decreases in oil and natural gas prices would render a significant number of our potential or planned projects uneconomic, particularly in the Cherokee Basin and the in the Woodford Shale. If this occurs, or if our estimates of development costs increase, production data factors change or drilling results deteriorate, accounting rules may require us to write down, as a non-cash charge to earnings, the carrying value of our oil and natural gas properties for impairments. We are required to perform impairment tests on our assets periodically and whenever events or changes in circumstances warrant a review of our assets. To the extent such tests indicate a reduction of the estimated useful life or estimated future cash flows of our assets, the carrying value may not be recoverable and may, therefore, require a writedown of such carrying value, particularly in the Cherokee Basin and in the Woodford Shale. We may incur additional impairment charges in the future, which could result in a material reduction in our results of operations in the period taken and materially limit our ability to borrow funds under our reserve-based credit facility and our ability to make cash distributions to our unitholders.
21
Table of Contents
Due to our lack of asset and geographic diversification, adverse developments in our core operating areas would reduce our ability to make distributions to our unitholders.
We rely exclusively on sales of the oil and natural gas that we produce. Furthermore, all of our assets are located in Alabama, Kansas, and Oklahoma. Due to our lack of diversification in asset type and location, an adverse development in the oil and gas business or these geographic areas, would have a significantly greater impact on the price which we receive for our oil and natural gas, our results of operations, and cash available for distribution to our unitholders than if we maintained more diverse assets and locations.
Seasonal weather conditions adversely affect our ability to conduct exploration and production activities.
Natural gas operations in Alabama, Kansas, and Oklahoma are often adversely affected by seasonal weather conditions, primarily during hurricane season, periods of severe weather or rainfall, and during periods of extreme cold. We face the risk that power outages and other damages resulting from hurricanes, tornados, ice storms, flooding, and other strong storms will prevent us from operating our wells in an optimal manner.
Certain of our undeveloped leasehold acreage is subject to leases that may expire in the near future.
Some of the natural gas leases that we hold are still within their original lease term and are not currently held by production. Unless we establish commercial production on the properties subject to these leases, these leases will expire. If our leases expire, we will lose our right to develop the related properties, which would lower the amount of any future cash flows available to make cash distributions to our unitholders.
Shortages of drilling rigs, supplies, oilfield services, equipment and crews could delay our operations and reduce our cash available for distribution.
Higher oil and natural gas prices generally increase the demand for drilling rigs, supplies, services, equipment and crews, and can lead to shortages of, and increasing costs for, drilling equipment, services and personnel. In recent years, we and other oil and natural gas companies have experienced higher drilling and operating costs. Even as commodity prices have decreased, the costs for oilfield services have not declined as rapidly as commodity prices. Shortages of, or increasing costs for, experienced drilling crews and equipment and services could restrict our ability to drill the wells and conduct the operations that we currently have planned. Any delay in the drilling of new wells or significant increase in drilling costs could reduce our revenues and cash available for distribution.
Locations that we decide to drill may not yield oil and natural gas in commercially viable quantities.
The cost of drilling, completing and operating a well is often uncertain, and cost factors can adversely affect the economics of a well. Our efforts will be uneconomical if we drill dry holes or wells that are productive but do not produce enough to be commercially viable after drilling, operating and other costs. If we drill future wells that we identify as dry holes, our drilling success rate would decline, and may materially harm our business.
We may be unable to compete effectively with larger companies, which may adversely affect our ability to generate sufficient revenue to allow us to pay distributions to our unitholders.
The oil and natural gas industry is intensely competitive, and we compete with other companies that have greater resources. Our ability to acquire additional properties and to discover reserves in the future will be dependent upon our willingness and ability to evaluate, select and finance the acquisition of suitable properties and our ability to consummate transactions in a highly competitive environment. Many of our larger competitors not only drill for and produce oil and natural gas, but also carry on refining operations and market petroleum and other products on a regional, national or worldwide basis. These companies may be able to pay more for oil and natural gas properties and evaluate, bid for and purchase a greater number of properties than our financial or human resources permit. In addition, these companies may have a greater ability to continue drilling activities
22
Table of Contents
during periods of low oil and natural gas prices and to absorb the burden of present and future federal, state, local and other laws and regulations. Our inability to compete effectively with larger companies could have a material adverse impact on our business activities, financial condition and results of operations, which could reduce the amount of cash we have available to pay distributions.
Our acquisition activities will subject us to certain risks.
We have expanded our operations by executing four separate acquisitions. Any acquisition involves potential risks, including, among other things: the validity of our assumptions about reserves, future production, revenues and costs, including synergies; an inability to integrate successfully the businesses we acquire; a decrease in our liquidity by using a significant portion of our available cash or borrowing capacity to finance acquisitions; a significant increase in our interest expense or financial leverage if we incur additional debt to finance acquisitions; the assumption of unknown liabilities, losses or costs for which we are not indemnified or for which our indemnity is inadequate; the diversion of management’s attention to other business concerns; an inability to hire, train or retain qualified personnel to manage and operate our growing business and assets; the incurrence of other significant charges, such as impairment of other intangible assets, asset devaluation or restructuring charges; unforeseen difficulties encountered in operating in new geographic areas; an increase in our costs or a decrease in our revenues associated with any potential royalty owner or landowner claims or disputes; and key customer or key employee losses at the acquired businesses.
Our decision to acquire a property will depend in part on the evaluation of data obtained from production reports and engineering studies, geophysical and geological analyses and seismic and other information, the results of which are often inconclusive and subject to various interpretations. Also, our reviews of acquired properties are inherently incomplete because it generally is not feasible to perform an in-depth review of the individual properties involved in each acquisition. Even a detailed review of records and properties may not necessarily reveal existing or potential problems, nor will it permit us to become sufficiently familiar with the properties to assess fully their deficiencies and potential. Inspections may not always be performed on every well, and environmental problems, such as ground water contamination, are not necessarily observable even when an inspection is undertaken.
If any of our prior acquisitions or any of our future acquisitions do not generate increases in available cash per unit, our ability to make cash distributions to our unitholders could materially decrease.
Risks Related to Financing and Credit Environment
Our reserve-based credit facility has substantial restrictions and financial covenants and requires periodic borrowing base redeterminations. Additionally, borrowings under our reserve-based credit facility become a current liability at November 13, 2011 and mature at November 13, 2012. We may have difficulty maintaining our compliance with the financial covenants, which include our required ratio of current assets to current liabilities of not less than 1.0 to 1.0, our required ratio of quarterly adjusted EBITDA to cash interest expense of not less than 2.5 to 1.0, and our required ratio of total net debt to annual adjusted EBITDA of not greater than 3.75 to 1.0 through September 30, 2010 and 3.5 to 1.0 thereafter, maintaining our total borrowing base at the current level of $205 million at future redeterminations, renewing or replacing our existing reserve-based credit facility before it matures or maintaining or obtaining additional credit at similar terms, which could adversely affect our operations and our ability to pay distributions to our unitholders.
We depend on our reserve-based credit facility for future capital needs and to fund a portion of any cash distribution to unitholders if we have sufficient borrowing base availability under our reserve-based credit facility. The reserve-based credit facility restricts our ability to obtain additional financing, make investments, lease equipment, sell assets and engage in business combinations. We are also required to comply with certain financial covenants and ratios. Our ability to comply with these restrictions and covenants in the future is uncertain and will be affected by the levels of cash flow from our operations and events or circumstances beyond
23
Table of Contents
our control, including events and circumstances that may stem from the condition of financial markets and commodity price levels. Our failure to comply with any of the restrictions and covenants under our reserve-based credit facility could result in a default, which could cause all of our existing indebtedness to become immediately due and payable. Each of the following is an event of default:
| • | failure to pay any principal when due or any interest, fees or other amount prior to the expiration of certain grace periods; |
| • | a representation or warranty made under the loan documents or in any report or other instrument furnished thereunder is incorrect when made; |
| • | failure to perform or otherwise comply with the covenants in the reserve-based credit facility or other loan documents, subject, in certain instances, to certain grace periods; |
| • | any event occurs that permits or causes the acceleration of the indebtedness; |
| • | bankruptcy or insolvency events involving us or our subsidiaries; |
| • | certain changes in control as specified in the covenants to the reserve-based credit facility; |
| • | the entry of, and failure to pay, one or more adverse judgments in excess of $1.0 million or one or more non-monetary judgments that could reasonably be expected to have a material adverse effect and for which enforcement proceedings are brought or that are not stayed pending appeal; and |
| • | specified events relating to our employee benefit plans that could reasonably be expected to result in liabilities in excess of $1.0 million in any year. |
Our reserve-based credit facility matures in November 2012 and, as a result, amounts due under the facility are scheduled to become a current liability in November 2011. We may not be able to renew or replace the facility at similar borrowing costs, terms, covenants, restrictions, or borrowing base, or with similar debt issue costs.
The reserve-based credit facility limits the amounts we can borrow to a borrowing base amount, determined by the lenders in their sole discretion. Our borrowing base will be redetermined semi-annually, and may be redetermined at our request more frequently and by the lenders in their sole discretion based on reserve reports prepared by reserve engineers, together with, among other things, the oil and natural gas prices existing at the time. The lenders can unilaterally adjust our borrowing base and the borrowings permitted to be outstanding under the reserve-based credit facility. Any increase in our borrowing base requires the consent of all the lenders. Outstanding borrowings in excess of our borrowing base must be repaid immediately, or we must pledge other oil and natural gas properties as additional collateral. We do not currently have any substantial unpledged properties, and we may not have the financial resources in the future to make any mandatory principal prepayments required under the reserve-based credit facility.
The reserve-based credit facility contains a condition to borrowing and a representation that no material adverse effect (“MAE”) has occurred, which includes, among other things, a material adverse change in, or material adverse effect on the business, operations, property, liabilities (actual or contingent) or condition (financial or otherwise) of us and our subsidiaries who are guarantors taken as a whole. If a MAE were to occur, we would be prohibited from borrowing under the facility and we would be in default under the facility, which could cause all of our existing indebtedness to become immediately due and payable.
Our reserve-based credit facility may restrict us from borrowing to pay distributions on our outstanding units.
We have the ability to borrow under our reserve-based credit facility to pay distributions to unitholders as long as no event of default exists and provided that no distribution to unitholders may be made if the borrowings outstanding, net of available cash, under our reserve-based credit facility exceed 90% of the borrowing base, after giving effect to the proposed distribution. Our available cash any excludes cash reserves as established by
24
Table of Contents
our board of managers for the proper conduct of our business and the payment of fees and expenses. At February 24, 2010, our borrowings outstanding were greater than 90% of the total borrowing base under the reserve-based credit facility. We anticipate that, at the time any future distribution is declared by our board of managers, our ability to pay distributions to our unitholders in any such quarter will be solely dependent on our ability to generate sufficient cash from our operations.
Economic conditions and instability in the financial markets could negatively impact our business.
Our operations are affected by local, national and worldwide economic conditions. The consequences of the current economic and credit environment include a lower level of economic activity and increased volatility in energy prices. A lower level of economic activity might result in a decline in energy consumption and lower market prices for oil and natural gas, which may adversely affect our financial results and our ability to fund maintenance capital expenditures or to reinstate, maintain or increase our distribution rate.
Instability in the financial markets may affect the cost of capital, our ability to raise capital, and reduce the amount of cash available to fund our operations. We rely on our cash flow from operations and our reserve-based credit facility to fund our drilling programs, to fund additional acquisitions, and to meet our financial commitments and other short-term liquidity needs. Disruptions in the capital and credit markets as a result of uncertainty or failures of significant financial institutions could adversely affect our access to liquidity needed for our business. Any disruption could require us to take measures to conserve cash until the markets stabilize or until alternative credit arrangements or other funding for our business needs can be arranged. Such measures could include reducing our drilling programs, reducing maintenance capital expenditures, reducing our operations to lower expenses, reducing other discretionary uses of cash, and continuing to suspend future distributions payments to our unitholders.
The disruptions in capital and credit markets may also result in higher LIBOR interest rates on our reserve-based credit facility, which may increase our interest expense and adversely affect our financial results. Additionally, lower market prices for oil and natural gas may result in a decrease in our borrowing base under our reserve-based credit facility at the time of a borrowing base redetermination. The lenders in our reserve-based credit facility may be unable to fund our borrowing requests, which would negatively impact our ability to operate our business.
We will be required to make substantial investment or expansion capital expenditures to increase our asset base. If we are unable to obtain needed capital or financing on satisfactory terms, our ability to make cash distributions may be diminished or our financial leverage could increase.
In order to expand our asset base, we will need to make investment or expansion capital expenditures. If we do not make sufficient or effective expansion capital expenditures, we will be unable to expand our business operations, and may be unable to reinstate, maintain or increase our cash distributions. To fund our expansion capital expenditures and investment capital expenditures, we will be required to use cash from our operations or incur borrowings or sell additional common units or other securities. Such uses of cash from operations will reduce cash available for distribution to our unitholders. Our ability to obtain bank financing or to access the capital markets for future equity or debt offerings may be limited by our financial condition at the time of any such financing or offering and the covenants in our existing debt agreement, as well as by general economic conditions, world-wide credit market conditions, and contingencies and uncertainties that are beyond our control. Even if we are successful in obtaining the necessary funds, the terms of such financings could limit our ability to pay distributions to our unitholders. In addition, incurring additional debt may significantly increase our interest expense and financial leverage, and issuing additional limited liability company interests may result in significant unitholder dilution and would increase the aggregate amount of cash required to maintain the then-current distribution rate, which could materially decrease our ability to pay distributions at the then-current distribution rate.
25
Table of Contents
Furthermore, if our revenues or the borrowing base under our reserve-based credit facility decreases as a result of lower oil or natural gas prices, operating difficulties, declines in reserves or for any other reason, we may have limited ability to obtain the capital necessary to increase or sustain our asset base. Our reserve-based credit facility restricts our ability to obtain new financing. If additional capital is needed, we may not be able to obtain debt or equity financing on terms favorable to us, or at all. If cash generated by operations or available under our reserve-based credit facility is not sufficient to meet our capital requirements, the failure to obtain additional financing could result in a curtailment of our operations relating to development of our prospects, which in turn could lead to a possible decline in our oil and natural gas reserves, and could have a material adverse impact on our results of operations, financial condition and our ability to make cash distributions to our unitholders.
We are exposed to credit risk in the ordinary course of our business activities.
We are exposed to risks of loss in the event of nonperformance by our customers and by the counterparties to our hedging arrangements. Some of our customers and counterparties may be highly leveraged and subject to their own operating and regulatory risks. Even if our credit review and analysis mechanisms work properly, we may experience financial losses in our dealings with other parties. Any increase in the nonpayment or nonperformance by our customers and/or counterparties could reduce our ability to make distributions to our unitholders.
We depend on certain key customers for sales of our oil and natural gas. To the extent these and other customers reduce the volumes of natural gas they purchase from us and are not replaced by new customers, our revenues and cash available for distribution could decline.
We currently sell our natural gas produced in the Black Warrior basin to J.P. Morgan Ventures Energy Corporation and to Enterprise Alabama Intrastate, L.L.C. We currently sell our natural gas produced in the Cherokee Basin to Macquarie Energy LLC, Scissortail Energy LLC, Cotton Valley Compression, L.L.C., and ONEOK Energy Services Company, L.P. Our oil production is primarily purchased by Sunoco Partners Marketing and Terminals, L.P. Our natural gas production in the Woodford Shale is marketed by the operators of our well bores. To the extent these or other customers reduce the volumes of oil and natural gas that they purchase from us and are not replaced by new customers, our revenues and cash available for distribution could decline.
Our future debt levels may limit our flexibility to obtain additional financing and pursue other business opportunities.
We may incur substantial additional indebtedness in the future under our reserve-based credit facility or otherwise. Our future indebtedness could have important consequences to us, including:
| • | our ability to obtain additional financing, if necessary, for working capital, maintenance and investment capital expenditures, acquisitions or other purposes may be impaired or such financing may not be available on favorable terms; |
| • | covenants contained in our existing and future credit and debt instruments will require us to meet financial tests that may affect our flexibility in planning for and reacting to changes in our business, including possible acquisition opportunities; |
| • | we will need a substantial portion of our cash flow to make principal and interest payments on our indebtedness, reducing the funds that would otherwise be available for operations, future business opportunities and distributions to unitholders; and |
| • | our debt level will make us more vulnerable than our competitors with less debt to competitive pressures or a downturn in our business or the economy generally. |
26
Table of Contents
Our ability to service our indebtedness will depend upon, among other things, our future financial and operating performance, which will be affected by prevailing economic conditions and financial, business, regulatory and other factors, some of which are beyond our control. If our operating results are not sufficient to service our current or future indebtedness, we will be forced to take actions such as reducing any distributions, reducing or delaying business activities, acquisitions, investments and/or capital expenditures, selling assets, restructuring or refinancing our indebtedness, or seeking additional equity capital or bankruptcy protection. We may not be able to affect any of these remedies on satisfactory terms or at all.
We may incur substantial additional debt in the future to enable us to pursue our business plan and to pay distributions to our unitholders.
Our business requires a significant amount of capital expenditures to maintain and grow production levels. Commodity prices have historically been volatile and we cannot predict the prices we will be able to realize for our production in the future. As a result, we may need to borrow significant amounts under our reserve-based credit facility in the future to enable us to pay any quarterly distributions. Significant declines in our production or significant declines in realized oil and natural gas prices for prolonged periods and resulting decreases in our borrowing base may force us to continue to suspend any distributions to our unitholders.
When we borrow to pay distributions, we are distributing more cash than we are generating from our operations on a current basis. This means that we are using a portion of our borrowing capacity under our reserve-based credit facility to pay distributions rather than to maintain or expand our operations. If we use borrowings under our reserve-based credit facility to pay distributions for an extended period of time rather than toward funding maintenance capital expenditures and other matters relating to our operations, we may be unable to support or grow our business. Such a curtailment of our business activities, combined with our payment of principal and interest on indebtedness incurred to pay any distributions, will reduce our cash available for distribution on our units. If we borrow to pay any distributions during periods of low commodity prices and commodity prices remain low, we may have to reduce our distribution in order to avoid excessive leverage.
Increases in inflation, or expectations of increases in inflation or stagflation, could increase our costs and adversely affect our business and operating results.
During periods of increased inflation or stagflation, our costs of doing business could increase, including increases in the variable interest rates we pay on amounts we borrow under our reserve-based credit facility. In addition, as we have hedged a large percentage of our future expected production volumes, the cash flow generated by that future hedged production will be capped. If any of our operating, administrative or capital costs were to increase as a result of an increase in inflation or stagflation, such a cap could have a material adverse effect on our business, results of operations, financial condition, the ability to make cash distributions to unitholders, and the market price of our common units.
An increase in interest rates may cause the market price of our common units to decline and increase our borrowing costs.
Like all equity investments, an investment in our common units is subject to certain risks. In exchange for accepting these risks, investors may expect to receive a higher rate of return than would otherwise be obtainable from lower-risk investments. Accordingly, as interest rates rise, the ability of investors to obtain higher risk-adjusted rates of return by purchasing government-backed debt securities may cause a corresponding decline in demand for riskier investments generally, including yield-based equity investments such as publicly-traded limited liability company interests. Reduced demand for our common units resulting from investors seeking other more favorable investment opportunities may cause the trading price of our common units to decline.
Higher interests rates may also increase the borrowing costs associated with our reserve-based credit facility. If our borrowing costs were to increase, our interest payments on our debt may increase which would reduce the amount of cash available for distribution to unitholders.
27
Table of Contents
Risks Related to Our Distribution to Unitholders
We may not have sufficient available cash from operations to resume our quarterly cash distributions to unitholders following the reduction of outstanding debt balances and the establishment of cash reserves and the payment of fees and expenses.
Our quarterly distribution rate has been suspended in order to remain in compliance with the covenants associated with our reserve-based credit facility. Before we can resume our quarterly cash distributions, we must reduce our outstanding debt balances, net of available cash, to less than 90% of our borrowing base as determined by our lenders, after giving effect to the proposed distribution. Our available cash excludes any cash reserves as established by our board of managers for the proper conduct of our business and the payment of fees and expenses. We are subject to additional future borrowing base redeterminations before our reserve-based credit facility matures in November 2012 and cannot forecast at what level our lenders will set our future borrowing base. If our lenders further reduce our borrowing base because of any of the numerous factors generally described in this caption “Risk Factors,” our outstanding debt balances, net of available cash, may remain at more than 90% of our borrowing base as determined by our lenders and we may be unable to resume our quarterly cash distributions or may again have to suspend our quarterly cash distributions. If we do not achieve our expected operational results and do not continue to reduce our outstanding debt levels, we may not be able to resume quarterly cash distributions, in which event the market price of our common units may decline substantially.
In addition, we may not have sufficient available cash or future cash flow from operations each quarter to pay cash distributions to our unitholders following establishment of cash reserves by our board of managers for the proper conduct of our business and the payment of fees and expenses. The amount of available cash from which we may pay distributions is defined in both our reserve-based credit facility and our limited liability company agreement. The amount of available cash we distribute is subject to the definition of operating surplus in our limited liability company agreement and is impacted by the amount of cash reserves established by our board of managers for the proper conduct of our business and the payment of fees and expenses. Ultimately, the amount of available cash that we may distribute to our unitholders principally depends upon the amount of cash we generate from our operations, which will fluctuate from quarter to quarter based on numerous factors generally described in this caption “Risk Factors,” including, among other things: the amount of oil and natural gas we produce; the demand for and the price at which we are able to sell our oil and natural gas production; the results of our hedging activity; the level of our operating costs; the costs we incur to acquire oil and natural gas properties; whether we are able to continue our development activities at economically attractive costs; the level of our interest expense, which depends on the amount of our indebtedness and the interest payable thereon; the amount of working capital required to operate our business; and the level of our maintenance capital expenditures.
The amount of available cash that we will have to distribute to our unitholders also depends on other factors, some of which are beyond our control, including: the borrowing base under our reserve-based credit facility; our ability to make working capital borrowings under our reserve-based credit facility to pay distributions; our debt service requirements and covenants and restrictions on distributions contained in our reserve-based credit facility; fluctuations in our working capital needs; the timing and collectability of receivables; prevailing economic conditions; the amount of our estimated maintenance capital expenditures; and the amount of cash reserves established by our board of managers for the proper conduct of our business, including the maintenance of our asset base and the payment of future cash distributions on our Class A and common units, any management incentive interests and Class D interests. As a result of these factors, we may not have sufficient available cash to resume, maintain or increase our quarterly distributions. Even if we were able to resume a quarterly cash distribution because we have reduced our outstanding debt balances to a level that complies with our debt covenants, the amount of available cash that we could distribute from our operating surplus in any quarter to our unitholders may fluctuate significantly from quarter to quarter and may be significantly less than the quarterly distribution amount of $0.13 per unit that we paid for the first quarter 2009. If we do not have sufficient available cash or future cash flow from operations to resume, maintain or increase quarterly cash distributions, the market price of our common units may decline substantially.
28
Table of Contents
The amount of cash that we have available for distribution to our unitholders depends primarily upon our cash flow and not our profitability.
The amount of cash that we have available for distribution depends primarily on our cash flow, including cash from reserves and working capital or other borrowings, and not solely on our profitability, which is affected by non-cash items. As a result, we may be unable to pay distributions even when we record net income, and we may pay distributions during periods when we incur net losses.
Oil and natural gas prices are very volatile, and if commodity prices decline significantly for a temporary or prolonged period, our cash from operations will decline and we may have to lower any quarterly distribution or may not be able to pay distributions at all.
Our revenue, profitability and cash flow depend upon the prices and demand for oil and natural gas and a drop in prices can significantly affect our financial results and impede our growth. Changes in oil and natural gas prices have a significant impact on the value of our reserves and on our cash flow. In particular, declines in commodity prices will reduce the value of our reserves, our cash flow, our ability to borrow money or raise capital and our ability to pay distributions. Prices for oil and natural gas may fluctuate widely in response to relatively minor changes in the supply of and demand for oil and natural gas, market uncertainty and a variety of additional factors that are beyond our control, such as: the domestic and foreign supply of and demand for oil and natural gas; the price and level of foreign imports of oil and natural gas; the level of consumer product demand; weather conditions; overall domestic and global economic conditions; political and economic conditions in oil and natural gas producing countries, including those in West Africa, Middle East and South America; the ability of members of the Organization of Petroleum Exporting Countries to agree to and maintain oil price and production controls; the impact of U.S. dollar exchange rates on oil and natural gas prices; technological advances affecting energy consumption; domestic and foreign governmental regulations and taxation; the impact of energy conservation efforts; the costs, proximity and capacity of oil and natural gas pipelines and other transportation facilities; the price and availability of alternative fuels; and the increase in the supply of natural gas due to the development of new natural gas fields in the Barnett shale, Haynesville shale, Marcellus shale, and other shale plays.
In the past, the prices of oil and natural gas have been extremely volatile, and we expect this volatility to continue. If we raise our cash distribution level in response to increased cash flow during periods of relatively high commodity prices, we may not be able to sustain those distribution levels during periods of sustained lower commodity prices.
Our operations require substantial capital expenditures, which will reduce our cash available for distribution.
We will need to make substantial capital expenditures to maintain our asset base over the long term. These maintenance capital expenditures may include capital expenditures associated with drilling and completion of additional wells to offset the production decline from our producing properties or additions to our inventory of unproved properties or our proved reserves to the extent such additions maintain our asset base. These expenditures could increase as a result of:
| • | changes in our reserves; |
| • | changes in oil and natural gas prices; |
| • | changes in labor and drilling costs; |
| • | our ability to acquire, locate and produce reserves; |
| • | changes in leasehold acquisition costs; and |
| • | government regulations relating to safety and the environment. |
29
Table of Contents
Our significant maintenance capital expenditures will reduce the amount of cash we have available for distribution to our unitholders. In addition, our actual maintenance capital expenditures will vary from quarter to quarter. If we fail to make sufficient maintenance capital expenditures, our future production levels will decline which will materially adversely affect our future revenues and the amount of cash available for distribution to our unitholders.
Each quarter we are required to deduct estimated maintenance capital expenditures from operating surplus, which may result in less cash available for distribution to unitholders than if actual maintenance capital expenditures were deducted.
Our limited liability company agreement requires us to deduct estimated, rather than actual, maintenance capital expenditures from operating surplus. The amount of estimated maintenance capital expenditures deducted from operating surplus will be subject to review and change by our conflicts committee at least once a year. In years when our estimated maintenance capital expenditures are higher than actual maintenance capital expenditures, the amount of cash available for distribution to unitholders will be lower than if actual maintenance capital expenditures were deducted from operating surplus. If we underestimate the appropriate level of estimated maintenance capital expenditures, we may have less cash available for distribution in future periods when actual capital expenditures begin to exceed our previous estimates. Over time, if we do not set aside sufficient cash reserves or have available sufficient sources of financing and make sufficient expenditures to maintain our asset base, we will be unable to pay distributions at the anticipated level and could be required to reduce our distributions.
Our hedging activities could result in financial losses or could reduce our income, which may adversely affect our ability to pay distributions to our unitholders.
To achieve more predictable cash flow and to reduce our exposure to adverse fluctuations in the prices of natural gas, our current practice is to hedge, subject to the terms of our reserve-based credit facility, a significant portion of our expected production volumes for up to five years. As a result, we will continue to have direct commodity price exposure on the unhedged portion of our production volumes. The extent of our commodity price exposure is related largely to the effectiveness and scope of our hedging activities. For example, the derivative instruments we utilize are generally based on posted market prices, which may differ significantly from the actual oil and natural gas prices we realize in our operations.
Our actual future production may be significantly higher or lower than we estimated at the time we entered into hedging transactions for such period. If the actual amount is higher than we estimate, we will have greater commodity price exposure than we intended. If the actual amount is lower than the nominal amount that is subject to our derivative financial instruments, we might be forced to satisfy all or a portion of our derivative transactions without the benefit of the cash flow from our sale or purchase of the underlying physical commodity, resulting in a substantial diminution of our liquidity. As a result of these factors, our hedging activities may not be as effective as we intend in reducing the volatility of our cash flows, and in certain circumstances may actually increase the volatility of our cash flows. In addition, our hedging activities are subject to the following risks:
| • | a counterparty may not perform its obligation under the applicable derivative instrument; |
| • | there may be a change in the expected differential between the underlying commodity price in the derivative instrument and the actual price received; and |
| • | the steps we take to monitor our derivative financial instruments may not detect and prevent violations of our risk management policies and procedures. |
30
Table of Contents
If we do not make acquisitions on economically acceptable terms, our future growth and the ability to reinstate, maintain or increase our cash distributions may be limited.
Our ability to grow and to reinstate, maintain or increase distributions to unitholders is partially dependent on our ability to make acquisitions that result in an increase in available cash per unit. We may be unable to make such acquisitions because we are:
| • | unable to identify attractive acquisition candidates or negotiate acceptable purchase contracts with them; |
| • | unable to obtain financing for these acquisitions on economically acceptable terms; or |
| • | outbid by competitors. |
In any of these cases, our future growth and ability to reinstate, maintain, or increase our cash distributions will be limited. Furthermore, even if we do make acquisitions that we believe will increase available cash per unit, these acquisitions may nevertheless result in a decrease in available cash per unit.
Risks Related to Our Structure and Our Relationship with Constellation
Constellation and its affiliates own an interest in us through their ownership of our Class A and common units. CEPH may sell common units in the future, which could reduce the market price of our outstanding common units.
Constellation indirectly owns approximately 25% of the outstanding common units and 100% of the outstanding Class A units as of February 24, 2010. The percentages reflect common units that have been issued under our unit-based compensation programs. CEPM, as the holder of all our Class A units, has the exclusive right to elect two members of our board of managers. As of February 24, 2010, CEPH controlled an aggregate of 5,918,894 common units. These units have been registered for resale at the request of CEPH. Constellation has previously announced that it has impaired its value of its investment in CEP for various reasons, including the possible sale of its investment. If CEPH were to sell some or a substantial portion of its common units, it could reduce the market price of our outstanding common units.
Constellation’s interests in us may be transferred to a third party without common unitholder consent.
Constellation’s affiliates may transfer their Class A units, common units, management incentive interests and Class D interests to a third party in a merger or in a sale of all or substantially all of their respective assets without the consent of our common unitholders. Furthermore, there is no restriction in our limited liability company agreement on the ability of Constellation to cause a transfer to a third party of its affiliates’ equity interests in CEPM, CEPH, or CHI.
Members of our board of managers, our executive officers and Constellation and its affiliates, including CEPH and CEPM, may have conflicts of interest with us. Our limited liability company agreement limits the remedies available to our unitholders in the event they have a claim relating to conflicts of interest or the resolution of such a conflict of interest.
Two members of our board of managers are appointed by CEPM, the holder of our Class A units. As of February 24, 2010, one of the members appointed by CEPM is an officer of and is employed by Constellation. The other member appointed by CEPM is our chief executive officer, chief operating officer, and president. Conflicts of interest may arise between us and our unitholders and members of our board of managers or our executive officers and Constellation and its affiliates, including CEPH and CEPM. These potential conflicts may relate to the divergent interests of these parties. Situations in which the interests of members of our board of
31
Table of Contents
managers or our executive officers and Constellation and its affiliates, including CEPH and CEPM, may differ from interests of owners of common units include, among others, the following situations:
| • | our limited liability company agreement gives our board of managers broad discretion in establishing cash reserves for the proper conduct of our business, which will affect the amount of cash available for distribution. For example, our board of managers will use its reasonable discretion to establish and maintain cash reserves sufficient to maintain our asset base; |
| • | none of our limited liability company agreement, management services agreement, which was terminated December 15, 2009, nor any other agreement requires Constellation, CEPM or any of their affiliates to pursue a business strategy that favors us. Directors and officers of Constellation, CEPM and their subsidiaries (other than us) have a fiduciary duty while acting in the capacity as such a director or officer of Constellation, CEPM or such subsidiary to make decisions in the best interests of the Constellation stockholders, which may be contrary to our best interests; |
| • | neither Constellation nor CEPM has any obligation to provide us with any opportunities to acquire additional oil and natural gas properties; |
| • | in some instances our board of managers may cause us to borrow funds in order to permit us to pay cash distributions to our unitholders, even if the purpose or effect of the borrowing is to make management incentive distributions; |
| • | one of our managers is not being compensated by us; instead, he is being compensated by Constellation for serving as an officer and employee of Constellation; |
| • | none of our executive officers or the members of our board of managers or Constellation and its affiliates, including CEPH and CEPM, are prohibited from investing or engaging in other businesses or activities that compete with us; and |
| • | our board of managers is allowed to take into account the interests of parties other than us, such as Constellation or CEPM, in resolving conflicts of interest, which has the effect of limiting its fiduciary duty to our unitholders. |
If in resolving conflicts of interest that exist or arise in the future our board of managers or officers, as the case may be, satisfy the applicable standards set forth in our limited liability company agreement for resolving conflicts of interest, a unitholder will not be able to assert that such resolution constituted a breach of fiduciary duty owed to us or to our unitholders by our board of managers and officers.
If the holders of our common units vote to eliminate the special voting rights of the holders of our Class A units, our Class A units will convert into common units on a one-for-one basis and CEPM will have the option of converting the management incentive interests into common units at their fair market value, which may be dilutive to the common unitholders.
The holders of our Class A units have the right, voting as a separate class, to elect two of the five members of our board of managers, and any replacement of either of such members. This right can be eliminated upon a vote of the holders of not less than a 66 2/3% of our outstanding common units. If such elimination is so approved and Constellation and its affiliates do not vote their common units in favor of such elimination, the Class A units will be converted into common units on a one-for-one basis and CEPM will have the right to convert its management incentive interests into common units based on the then fair market value of such interests, which may be dilutive to the common unitholders.
Our limited liability company agreement prohibits a unitholder (other than CEPM, CEPH and their affiliates) who acquires 15% or more of our common units without the approval of our board of managers from engaging in a business combination with us for three years. This provision could discourage a change of control that our unitholders may favor, which could negatively affect the price of our common units.
Our limited liability company agreement effectively adopts Section 203 of the Delaware General Corporation Law (the “DGCL”). Section 203 of the DGCL as it applies to us prevents an interested unitholder,
32
Table of Contents
defined as a person who owns 15% or more of our outstanding common units, from engaging in business combinations with us for three years following the time such person becomes an interested unitholder. Section 203 broadly defines “business combination” to encompass a wide variety of transactions with or caused by an interested unitholder, including mergers, asset sales and other transactions in which the interested unitholder receives a benefit on other than a pro rata basis with other unitholders. This provision of our limited liability company agreement could have an anti-takeover effect with respect to transactions not approved in advance by our board of managers, including discouraging takeover attempts that might result in a premium over the market price for our common units.
Our limited liability agreement restricts the voting rights of unitholders owning 20% or more of our common units.
Our limited liability agreement restricts the voting rights of common unitholders by providing that any units held by a person that owns 20% or more of any class of units then outstanding, other than Constellation, CEPM, their affiliates or transferees and persons who acquire such units with the prior approval of the board of managers, cannot vote on any matter. Our limited liability agreement also contains provisions limiting the ability of common unitholders to call meetings or to acquire information about our operations, as well as other provisions limiting common unitholders’ ability to influence the manner or direction of management.
Our limited liability company agreement provides for a limited call right that may require unitholders to sell their common units at an undesirable time or price.
If, at any time, any person owns more than 80% of the common units then outstanding, such person has the right, but not the obligation, which it may assign to any of its affiliates or to us, to acquire all, but not less than all, of the remaining common units then outstanding at a price not less than the then-current market price of the common units. As a result, unitholders may be required to sell their common units at an undesirable time or price and therefore may receive a lower or no return on their investment. Unitholders may also incur tax liability upon a sale of their common units.
We may issue additional units without unitholder approval, which would dilute existing unitholders’ ownership interests.
We may issue an unlimited number of limited liability company interests of any type, including common units and units with rights to cash distributions or in liquidation that are senior in order of priority to common units, without the approval of our unitholders.
The issuance of additional units or other equity securities may have the following effects:
| • | the common unitholders’ proportionate ownership interest in us may decrease; |
| • | the amount of cash distributed on each common unit may decrease; |
| • | the relative voting strength of each previously outstanding common unit may be diminished; |
| • | the market price of the common units may decline; and |
| • | the ratio of taxable income to distributions may increase. |
Our limited liability company agreement limits and modifies our managers’ and officers’ fiduciary duties.
Our limited liability company agreement contains provisions that modify and limit our managers’ and officers’ fiduciary duties to us and our unitholders. For example, our limited liability company agreement provides that:
| • | our managers and officers will not have any liability to us or our unitholders for decisions made in good faith, which is defined so as to require that they believed the decision was in our best interests; and |
33
Table of Contents
| • | our managers and officers will not be liable for monetary damages to us or our unitholders for any acts or omissions unless there has been a final and non-appealable judgment entered by a court of competent jurisdiction determining that the managers or officers acted in bad faith or engaged in fraud or willful misconduct or, in the case of a criminal matter, acted with knowledge that such conduct was unlawful. |
Because we are a limited liability company, unitholders may have liability to repay distributions.
Under certain circumstances, unitholders may have to repay amounts wrongfully returned or distributed to them. Under Section 18-607 of the Delaware Revised Limited Liability Company Act (the Delaware Act), we may not make a distribution to unitholders if the distribution would cause our liabilities to exceed the fair value of our assets. Delaware law provides that for a period of three years from the date of an impermissible distribution, members or unitholders who received the distribution and who knew at the time of the distribution that it violated Delaware law will be liable to the limited liability company for the distribution amount. A purchaser of common units who becomes a member or unitholder is liable for the obligations of the transferring member to make contributions to the limited liability company that are known to such purchaser of units at the time it became a member and for unknown obligations if the liabilities could be determined from our limited liability company agreement.
The market price of our common units could be volatile due to a number of factors, many of which are beyond our control.
The market price of our common units could be subject to wide fluctuations in response to a number of factors, most of which we cannot control, including:
| • | changes in securities analysts’ recommendations and their estimates of our financial performance; |
| • | the public’s reaction to our press releases, announcements and our filings with the SEC; |
| • | fluctuations in broader securities market prices and volumes, particularly among securities of oil and natural gas companies and securities of publicly traded limited partnerships and limited liability companies; |
| • | the sale of our units by significant unitholders or other market liquidity issues; |
| • | changes in market valuations of similar companies; |
| • | departures of key personnel; |
| • | commencement of or involvement in litigation; |
| • | variations in our quarterly results of operations or those of other oil and natural gas companies; |
| • | variations in the amount of our quarterly cash distributions; |
| • | future interest rates and expectations of inflation; |
| • | future issuances and sales of our common units; |
| • | the borrowing base of our reserve-based credit facility as determined by our lenders in their sole discretion; |
| • | changes in general conditions in the U.S. economy, financial markets or the oil and natural gas industry; and |
| • | lack of or changes in any sponsor. |
In recent years, the securities markets have experienced extreme price and volume fluctuations. This volatility has had a significant effect on the market price of securities issued by many companies for reasons unrelated to the operating performance of these companies. Future market fluctuations may result in a lower price of our common units.
34
Table of Contents
Tax Risks to Unitholders
Unitholders may be required to pay taxes on income from us even if they do not receive any cash distributions from us.
Unitholders are required to pay federal income taxes and, in some cases, state and local income taxes, on their share of our taxable income, whether or not they receive cash distributions from us. Generally, should we generate taxable income for a particular tax year and not pay any cash distributions, our unitholders will be required to pay the actual tax liability that results from their share of such taxable income even though they received no cash distributions from us.
On May 15, 2009, we paid a cash distribution of $0.13 on each common unit (or Class B) and Class A unit. If we generate taxable income for the 2009 tax year, our unitholders who received that cash distribution and any unitholders who purchase or purchased common units after the record date for such distribution may not receive cash distributions from us during 2009 sufficient to pay the actual tax liability that results from their share of such 2009 taxable income. Additionally, based on our 2010 business plan and forecast, we do not currently anticipate resuming a cash distribution in 2010 and we anticipate making limited maintenance capital expenditures. If we generate taxable income for the 2010 tax year, our unitholders may not receive cash distributions from us during 2010 in an amount sufficient to pay the actual tax liability that results from their share of such 2010 taxable income.
Our tax treatment depends on our status as a partnership for federal income tax purposes, as well as our not being subject to entity-level taxation by individual states. If the IRS were to treat us as a corporation for federal income tax purposes or we were to become subject to entity-level taxation for state tax purposes, taxes paid, if any, would reduce the amount of cash available for distribution.
The anticipated after-tax economic benefit of an investment in our common units depends largely on our being treated as a partnership for federal income tax purposes. We have not requested, and do not plan to request, a ruling from the IRS on this or any other tax matter that affects us.
If we were treated as a corporation for federal income tax purposes, we would pay federal income tax on our taxable income at the corporate income tax rates, currently at a maximum rate of 35%, and would likely pay state income tax at varying rates. Distributions to unitholders would generally be taxed as corporate distributions, and no income, gain, loss, deduction or credit would flow through to the unitholders. Because a tax may be imposed on us as a corporation, our cash available for distribution to our unitholders could be reduced. Therefore, treatment of us as a corporation could result in a material reduction in the anticipated cash flow and after-tax return to our unitholders resulting in a substantial reduction in the value of our common units.
Current law or our business may change so as to cause us to be treated as a corporation for federal income tax purposes or otherwise subject us to entity-level taxation. For example, at the federal level, legislation has been proposed that would eliminate partnership tax treatment for certain publicly traded partnerships. Although such legislation would not apply to us as currently proposed, it could be amended prior to enactment in a manner that does apply to us. In addition, because of widespread state budget deficits, several states are evaluating ways to subject partnerships and limited liability companies to entity-level taxation through the imposition of state income, franchise or other forms of taxation. If any state were to impose a tax upon us as an entity, the cash available for distribution to unitholders would be reduced. Our limited liability company agreement provides that if a law is enacted or existing law is modified or interpreted in a manner that subjects us to taxation as a corporation or otherwise subjects us to entity-level taxation for federal, state or local income tax purposes, the initial quarterly distribution amount and the Target Distribution amount (as defined in our limited liability company agreement) will be adjusted to reflect the impact of that law on us.
35
Table of Contents
The tax treatment of publicly traded partnerships or an investment in our common units could be subject to potential legislative, judicial or administrative changes and differing interpretations, possibly on a retroactive basis.
The present federal income tax treatment of publicly traded partnerships, including us, or an investment in our common units may be modified by administrative, legislative or judicial interpretation at any time. For example, members of Congress are considering substantive changes to the existing federal income tax laws that affect certain publicly traded partnerships. Any modification to the federal income tax laws and interpretations thereof may or may not be applied retroactively. Any such changes could negatively impact the value of an investment in our common units.
We will be considered to have terminated for tax purposes due to a sale or exchange of 50% or more of our interests within a twelve-month period.
We will be considered to have terminated for tax purposes if there is a sale or exchange of 50% or more of the total interests in our capital and profits within a twelve-month period. A constructive termination results in the closing of our taxable year for all unitholders and in the case of a unitholder reporting on a taxable year other than a fiscal year ending December 31, may result in more than 12 months of our taxable income or loss being includable in his taxable income for the year of termination. During 2009, we terminated for tax purposes and this will result in us filing two tax returns for one calendar year and the cost of the preparation of these returns will be borne by our unitholders.
A successful IRS contest of the federal income tax positions we take may adversely affect the market for our common units, and the costs of any contest will reduce cash available for distribution.
We have not requested a ruling from the IRS with respect to our treatment as a partnership for federal income tax purposes or any other matter that affects us. The IRS may adopt positions that differ from the positions we take. It may be necessary to resort to administrative or court proceedings to sustain some or all of the positions we take and a court may disagree with some or all of those positions. Any contest with the IRS may materially and adversely impact the market for our common units and the price at which they trade. In addition, our costs of any contest with the IRS will result in a reduction in cash available for distribution to our unitholders and thus will be borne indirectly by our unitholders.
Tax-exempt entities and foreign persons face unique tax issues from owning common units that may result in adverse tax consequences to them.
Investment in units by tax-exempt entities, including employee benefit plans and individual retirement accounts (known as IRAs), and non-U.S. persons raises issues unique to them. For example, virtually all of our income allocated to organizations exempt from federal income tax, including individual retirement accounts and other retirement plans, will be unrelated business taxable income and will be taxable to such a unitholder. Distributions to non-U.S. persons will be reduced by withholding taxes imposed at the highest effective applicable tax rate, and non-U.S. persons will be required to file United States federal income tax returns and pay tax on their share of our taxable income.
We will treat each purchaser of our common units as having the same tax benefits without regard to the common units purchased. The IRS may challenge this treatment, which could adversely affect the value of the common units.
Because we cannot match transferors and transferees of common units, we will adopt depreciation and amortization positions that may not conform with all aspects of existing U.S. Treasury regulations. A successful IRS challenge to those positions could adversely affect the amount of tax benefits available to our unitholders. It also could affect the timing of these tax benefits or the amount of gain on the sale of common units and could have a negative impact on the value of our common units or result in audits of and adjustments to our unitholders’ tax returns.
36
Table of Contents
Tax gain or loss on the disposition of our common units could be more or less than expected because prior distributions in excess of allocations of income will decrease a unitholder’s tax basis in his common units.
If a unitholder sells any of his common units, he will recognize gain or loss equal to the difference between the amount realized and the tax basis in those common units. Prior distributions to a unitholder in excess of the total net taxable income allocated for a common unit, which decreased the tax basis in that common unit, will, in effect, become taxable income to the unitholder if the common unit is sold at a price greater than the tax basis in that common unit, even if the price received is less than the original cost. A substantial portion of the amount realized, whether or not representing gain, may be ordinary income to the unitholder. In addition, if the unitholder sells his units, he may incur a tax liability in excess of the amount of cash received from the sale.
Unitholders may be subject to state and local taxes and return filing requirements.
In addition to federal income taxes, unitholders will likely be subject to other taxes, including state and local taxes, unincorporated business taxes and estate, inheritance or intangible taxes that are imposed by the various jurisdictions in which we do business or own property now or in the future, even if the unitholder does not reside in any of those jurisdictions. Unitholders will likely be required to file foreign, state and local income tax returns and pay state and local income taxes in some or all of these jurisdictions. Further, unitholders may be subject to penalties for failure to comply with those requirements. We currently do business and own assets in Alabama, Kansas, and Oklahoma. We are registered to do business in Texas. As we make acquisitions or expand our business, we may do business or own assets in other states in the future. It is the responsibility of each unitholder to file all United States federal, foreign, state and local tax returns that may be required of such unitholder. In addition, if the unitholder sells his units, he may incur a tax liability in excess of the amount of cash received from the sale.
We have adopted certain valuation methodologies that may result in a shift of income, gain, loss and deduction between the holder’s of management incentive interests and the common unitholders. The IRS may challenge this treatment, which could adversely affect the value of our common units.
When we issue additional units or engage in certain other transactions, we determine the fair market value of our assets and allocate any unrealized gain or loss attributable to our assets to the capital accounts of our unitholders, including holders of our management incentive interests. Our methodology may be viewed as understating the value of our assets. In that case, there may be a shift of income, gain, loss and deduction between certain common unitholders and the holders of our management incentive interests, which may be unfavorable to such common unitholders. Moreover, under our current valuation methods, subsequent purchasers of common units may have a greater portion of their Internal Revenue Code Section 743(b) adjustment allocated to our tangible assets and a lesser portion allocated to our intangible assets. The IRS may challenge our valuation methods, or our allocation of the Section 743(b) adjustment attributable to our tangible and intangible assets, and allocations of income, gain, loss and deduction between the holders of our management incentive interests and certain of our common unitholders.
A successful IRS challenge to these methods or allocations could adversely affect the amount of taxable income or loss being allocated to our common unitholders. It also could affect the amount of gain from our unitholders’ sale of common units and could have a negative impact on the value of the common units or result in audit adjustments to our unitholders’ tax returns without the benefit of additional deductions.
We prorate our items of income, gain, loss and deduction between transferors and transferees of common units each month based upon the ownership of the common units on the first day of each month, instead of on the basis of the date a particular common unit is transferred. The IRS may challenge this treatment, which could change the allocation of income, gain, loss and deduction among the unitholders.
We prorate our items of income, gain, loss and deduction between transferors and transferees of common units each month based upon the ownership of the common units on the first day of each month, instead of on the
37
Table of Contents
basis of the date a particular common unit is transferred. The use of this proration method may not be permitted under existing Treasury regulations, and accordingly, our counsel is unable to opine as to the validity of this method. If the IRS were to challenge this method or new Treasury regulations were issued, we may be required to change the allocation of items of income, gain, loss and deduction amount our unitholders.
A unitholder whose common units are loaned to a “short seller” to cover a short sale of common units may be considered as having disposed of those common units. If so, he would no longer be treated for tax purposes as a partner with respect to those common units during the period of the loan and may recognize gain or loss from the disposition.
Because a common unitholder whose common units are loaned to a “short seller” to cover a short sale of common units may be considered as having disposed of the loaned units, he may no longer be treated for tax purposes as a partner with respect to those common units during the period of the loan to the short seller and he may recognize gain or loss from such disposition. Moreover, during the period of the loan to the short seller, any of our income, gain, loss or deduction with respect to those common units may not be reportable by the unitholder and any cash distributions received by the unitholder as to those common units could be fully taxable as ordinary income. Our counsel has not rendered an opinion regarding the treatment of a unitholder whose common units are loaned to a short seller to cover a short sale of common units; therefore, unitholders desiring to assure their status as partners and avoid the risk of gain recognition from a loan to a short seller are urged to modify any applicable brokerage account agreements to prohibit their brokers from borrowing their common units.
Risks Related to Environmental Issues and Compliance
Potential regulatory actions could increase our operating or capital costs and delay our operations or otherwise alter the way we conduct our business.
Exploration and development activities and the production and sale of oil and natural gas are subject to extensive federal, state, local and Native American tribal regulations. Changes to existing regulations or new regulations may unfavorably impact us, our suppliers or our customers. In the United States, legislation that directly impacts the oil and gas industry has been recently proposed covering areas such as emission reporting and reductions, hydraulic fracturing of wells, the repeal of certain oil and natural gas tax incentives and tax deductions, the treatment and disposal of produced water, and the regulation of commodity derivatives. Additionally, the EPA has also officially ruled that carbon dioxide, methane and other greenhouse gases endanger human health and the environment. This allows the EPA to adopt and implement regulations restricting greenhouse gases under existing provisions of the Federal Clean Air Act. These and other potential regulations could increase our costs, reduce our liquidity, impact our ability to hedge our future oil and natural gas sales, delay our operations or otherwise alter the way we conduct our business, negatively impacting our financial condition, results of operations and cash flows.
We are subject to complex federal, state, local and other laws and regulations that could adversely affect the cost, manner or feasibility of conducting our operations.
Our oil and natural gas exploration, production and transportation operations are subject to complex and stringent laws and regulations. In order to conduct our operations in compliance with these laws and regulations, we must obtain and maintain numerous permits, approvals and certificates from various federal, state and local governmental authorities and Native American tribal authorities. For example, we have a concession agreement from the Osage Nation for a substantial portion of our leases in the Cherokee Basin. Failure or delay in obtaining regulatory approvals or drilling permits could have a material adverse effect on our ability to develop our properties, and receipt of drilling permits with onerous conditions could increase our compliance costs. In addition, regulations regarding conservation practices and the protection of correlative rights affect our operations by limiting the quantity of oil and natural gas we may produce and sell.
38
Table of Contents
We are subject to federal, state, local, and Native American tribal laws and regulations as interpreted and enforced by governmental and Native American tribal authorities possessing jurisdiction over various aspects of the exploration, production and transportation of oil and natural gas. The possibility exists that these new laws, regulations or enforcement policies could be more stringent and significantly increase our compliance costs. If we are not able to recover the resulting costs through insurance or increased revenues, our ability to make distributions to our unitholders could be adversely affected. Furthermore, we may be put at a competitive disadvantage to larger companies in our industry that can spread these additional costs over a greater number of wells and larger operating staff. Please read Item 1. “Business-Operations-Environmental Matters and Regulation” for more information on the laws and regulations that affect us.
Because we handle oil, natural gas, and other petroleum products in our business, we may incur significant costs and liabilities in the future resulting from a failure to comply with new or existing environmental regulations.
The operations of our wells, gathering systems, pipelines and other facilities are subject to complex and stringent federal, state and local environmental laws and regulations. These include, for example:
| • | the federal Clean Air Act, related federal regulations and comparable state laws and regulations that impose obligations related to air emissions; |
| • | the federal Clean Water Act, related federal regulations and comparable state laws and regulations that impose obligations related to discharges of pollutants into regulated waters; |
| • | the federal RCRA related federal regulations and comparable state laws and regulations that impose requirements for the handling and disposal of waste from our facilities; and |
| • | the CERCLA, also known as “the Superfund law,” and comparable state laws that regulate the cleanup of hazardous substances that may have been released at properties currently or previously owned or operated by us or at locations to which we have sent waste for disposal. |
Moreover, the possibility exists that stricter laws, regulations or enforcement policies could significantly increase our compliance costs and the cost of any remediation that may become necessary. We may not be able to recover these costs from insurance or through increased revenues.
Failure to comply with these laws and regulations may trigger a variety of administrative, civil and criminal enforcement measures, including the assessment of monetary penalties, the imposition of remedial requirements and the issuance of orders enjoining future operations. Certain environmental statutes, including RCRA, CERCLA, the federal Oil Pollution Act and analogous state laws and regulations, impose strict, joint and several liability for costs required to clean up and restore sites where hazardous substances have been disposed of or otherwise released into the environment.
We may incur significant costs and liabilities in the future resulting from an accidental release of hazardous substances into the environment.
There is an inherent risk that we may incur environmental costs and liabilities due to the nature of our business and the substances we handle. For example:
| • | there is the potential for an accidental release from one of our wells or gathering pipelines; |
| • | certain of our operations are known to bring to the surface NORM that is accumulated at our facilities and is subject to permitting and controls for storage, as well as requirements for proper disposal; and |
| • | several treatment ponds associated with the treatment and storage of produced waters and similar wastewaters have leaked into the subsurface and we have replaced certain of the liners beneath these treatment ponds in the Black Warrior Basin and, under the supervision of the ADEM, are monitoring for the presence of contaminants in the subsurface to better determine what cleanup, if any, may be required. |
39
Table of Contents
If a problem occurs with respect to any one of these, it could subject us to substantial liabilities arising from environmental cleanup and restoration costs, claims made by neighboring landowners and other third parties for personal injury and property damage, and fines or penalties for related violations of environmental laws or regulations.
Our operations expose us to significant costs and liabilities with respect to environmental and operational safety matters.
We may incur significant costs and liabilities as a result of environmental and safety requirements applicable to our oil and natural gas exploration, production and transportation operations. These costs and liabilities could arise under a wide range of federal, state and local environmental and safety laws and regulations, including enforcement policies which have tended to become increasingly strict over time. There is an inherent risk that we may incur environmental costs and liabilities due to the nature of our business and the substances that we handle. For instance, we must maintain permits and adhere to certain controls related to the storage and proper disposal of NORM that is produced periodically in connection with our natural gas drilling operations in the Black Warrior Basin. In addition, as a result of leaks from ponds used for the treatment and storage of produced waters and similar wastewaters from our operations, we have replaced certain of the pond liners and are also conducting subsurface monitoring for chlorides under the supervision of ADEM. We may incur additional expenses, which could be material, in the future if our monitoring activities reveal that any contaminants exist in the subsurface beneath the ponds, and the agency requires cleanup of any such contaminants.
Failure to comply with environmental laws and regulations could result in the assessment of administrative, civil and criminal penalties, imposition of cleanup and site restoration costs and liens, and to a lesser extent, issuance of orders to limit or cease certain operations. In addition, certain environmental laws impose strict, joint and several liability, which could cause us to become liable for the conduct of others or for consequences of our own actions that were in compliance with all applicable laws at the time those actions were taken. Moreover, it is not uncommon for neighboring landowners and other third parties to file claims for damages as a result of environmental and other impacts.
The coalbeds from which we produce natural gas frequently contain water that may hamper our ability to produce natural gas in commercial quantities or adversely affect our profitability.
Unlike conventional natural gas production, coalbeds frequently contain water that must be removed in order for the gas to desorb from the coal and flow to the wellbore. Our ability to remove and dispose of sufficient quantities of water from the coal seam will determine whether or not we can produce natural gas in commercial quantities. In addition, the cost of water disposal may be significant and may reduce our profitability.
We may face unanticipated water disposal costs.
Where water produced from our projects fails to meet the quality requirements of applicable regulatory agencies or our wells produce water in excess of the applicable volumetric permit limit, we may have to shut in wells, reduce drilling activities, or upgrade facilities for water handling or treatment. The costs to dispose of this produced water may increase if any of the following occur:
| • | we cannot obtain future permits from applicable regulatory agencies; |
| • | water of lesser quality or requiring additional treatment is produced; |
| • | our wells produce excess water; or |
| • | new laws and regulations require water to be disposed of or treated in a different manner. |
40
Table of Contents
Risks Related to the NPI
Since the Trust was terminated in January 2008, the gas purchase contract with the Trust also terminated. If it were determined that the payment by us to the Trust in respect of the NPI has ceased to be calculated under the sharing arrangement, or that the previous calculations of the NPI payments were incorrect, our royalty obligations under the NPI could increase, which could adversely affect our results of operations and our ability to pay cash distributions.
The gas purchase contract with TEMI, including the portion assigned to us, was terminated in January 2008 upon the termination of the Trust. The royalty payment owed by us under the NPI is calculated based in part on gross proceeds as that term is defined in the gas purchase contract. There is a sharing arrangement under the gas purchase contract that permits us, as gas purchaser, to retain any excess of the market price we receive for production from the Trust Wells over the price under the sharing arrangement. This price under the sharing arrangement is equal to the sum of the sharing price set forth in the gas purchase contract, plus 50% of the amount by which 97% of the applicable spot index price exceeds the sharing price. Despite increases in recent years in the spot price for natural gas, this sharing arrangement has had the effect of keeping the royalty payments to the Trust in respect of the NPI significantly lower than the prevailing market price. Notwithstanding the termination of the gas purchase contract, the NPI will continue to burden the Trust Wells, and it should continue to be calculated as if the gas purchase contract were still in effect, regardless of what proceeds may actually be received by us as the seller of the gas.
In our first arbitration proceeding with the Trust, the arbitration panel issued a final award which found and concluded that the sharing arrangement and other pricing terms of the gas purchase contract will continue to control the amount owed to the holder of the NPI notwithstanding the termination of the gas purchase contract. Nevertheless, we have now been sued in Alabama state court as to the prior calculations of the NPI, including the water disposal fees applicable to the Trust Wells historically, and in the future, and the results of that proceeding could adversely affect our results of operations and our ability to pay cash distributions.
Based upon our estimated production as reflected in our reserve report and our SONAT Gas Daily price curve on January 29, 2010, we estimate that, if the sharing arrangement in respect of the Trust was terminated and certain water disposal costs applicable to the Trust Wells increase from $0.53 per barrel to $1.00 per barrel, the remaining $6.7 million contributed to us for the Class D interests would offset the resulting revenue shortfall only through the third quarter 2016, if production and prices were to remain constant throughout such period.
The formula in the gas purchase contract on which the NPI is based contains a minimum price arrangement, which could have the effect of requiring a higher royalty payment in respect of the NPI than would be the case if the gas purchase contract did not have the minimum price arrangement. If the applicable index price falls below the minimum price, it could adversely affect our financial condition and results of operations and, as a result, our ability to pay cash distributions.
Pursuant to the formula in the terminated gas purchase contract on which the NPI is based, we are required to pay at least $1.70 (adjusted for inflation annually) per MMBtu, which we refer to as the minimum price, for production sold in respect of the Trust Wells. If the applicable index price is less than the minimum price in any month, amounts payable for production sold in respect of the Trust Wells could be higher than the gross proceeds we would receive for the gas at market prices. As a result, the royalty obligation payable by us in respect of the NPI could exceed the gross proceeds we have received for the gas produced in respect of the NPI. If we have to pay a royalty under the NPI based upon the minimum price that exceeds the actual revenue received by us for the sale of such gas, based upon market prices, it could adversely affect our financial condition and results of operations and, as a result, our ability to pay cash distributions. The index price for the Trust Wells is the price reported in Inside FERC’s Gas Market Report for the Southern Natural Gas Co., Louisiana Hub, which we refer to as the SONAT Inside FERC price.
41
Table of Contents
The formula in gas purchase contract on which the NPI is based contains a sharing arrangement in the event the applicable spot index price for natural gas exceeds the sharing price, as calculated under the gas purchase contract. If the applicable spot index price for natural gas falls below the sharing price, it would have the effect of reducing the revenue we retain upon sale of the gas produced from the Trust Wells and could adversely affect our financial condition and results of operations and, as a result, our ability to pay cash distributions.
The formula in the terminated gas purchase contract on which the NPI is based provides for a sharing arrangement in the event the index price in any month exceeds a price of $2.10 (adjusted for inflation annually, or $2.40 for 2009, $2.30 for 2008, $2.26 for 2007, and $2.22 for 2006) per MMBtu, which we refer to as the sharing price. If 97% of the applicable spot index price is equal to or less than the sharing price, the royalty obligation payable by us in respect of the NPI is calculated at the greater of (i) 97% of the index price per MMBtu and (ii) the minimum price described in the immediately preceding risk factor. If the index price exceeds the sharing price in any month, however, the royalty obligation payable by us in respect of the NPI is calculated at the sharing price plus 50% of the excess of 97% of the applicable spot index price over the sharing price per MMBtu. In that case, the calculation of gross proceeds in the NPI calculation could be substantially less than the gross proceeds at market prices, as a result of which the royalty obligation payable by us in respect of the NPI could be substantially less than the gross proceeds we have received for the produced gas. If the index price is equal to or less than the sharing price, it could adversely affect our financial condition and results of operations and, as a result, our ability to pay cash distributions.
Forward-Looking Statements
This Annual Report on Form 10-K contains “forward-looking statements” as defined by the SEC that are subject to a number of risks and uncertainties, many of which are beyond our control, which may include statements about:
| • | the volatility of realized oil and natural gas prices; |
| • | the conditions of the capital markets, inflation, interest rates, availability of credit facilities to support business requirements, liquidity, and general economic conditions; |
| • | the discovery, estimation, development and replacement of oil and natural gas reserves; |
| • | our business, financial, and operational strategy; |
| • | our drilling locations; |
| • | technology; |
| • | our cash flow, liquidity and financial position; |
| • | the ability to extend or refinance our reserve-based credit facility; |
| • | the level of our borrowing base under our reserve-based credit facility; |
| • | the resumption or amount of our cash distribution; |
| • | the impact from any termination of the NPI sharing arrangement or any change in the calculation of the NPI; |
| • | our hedging program and our derivative positions; |
| • | our production volumes; |
| • | our lease operating expenses, general and administrative costs and finding and development costs; |
| • | the availability of drilling and production equipment, labor and other services; |
| • | our future operating results; |
| • | our prospect development and property acquisitions; |
42
Table of Contents
| • | the marketing of oil and natural gas; |
| • | competition in the oil and natural gas industry; |
| • | the impact of the current global credit and economic environment; |
| • | the impact of weather and the occurrence of natural disasters such as fires, floods, hurricanes, tornados, earthquakes, snow and ice storms and other catastrophic events and natural disasters; |
| • | governmental regulation, including environmental regulation, and taxation of the oil and natural gas industry; |
| • | developments in oil-producing and natural gas producing countries; |
| • | support from our former sponsor or a change in any sponsor; and |
| • | our strategic plans, objectives, expectations, forecasts, budgets, estimates and intentions for future operations. |
All of these types of statements, other than statements of historical fact included in this Annual Report on Form 10-K, are forward-looking statements. These forward-looking statements may be found in Item 1. “Business;” Item 1A. “Risk Factors;” Item 7. “Management’s Discussion and Analysis of Financial Condition and Results of Operations” and other items within this Annual Report on Form 10-K. In some cases, forward-looking statements can be identified by terminology such as “may,” “could,” “should,” “expect,” “plan,” “project,” “intend,” “anticipate,” “believe,” “estimate,” “predict,” “potential,” “pursue,” “target,” “continue,” the negative of such terms or other comparable terminology.
The forward-looking statements contained in this Annual Report on Form 10-K are largely based on our expectations, which reflect estimates and assumptions made by our management. These estimates and assumptions reflect our best judgment based on currently known market conditions and other factors. Although we believe such estimates and assumptions to be reasonable, they are inherently uncertain and involve a number of risks and uncertainties that are beyond our control. In addition, management’s assumptions about future events may prove to be inaccurate. Management cautions all readers that the forward-looking statements contained in this Annual Report on Form 10-K are not guarantees of future performance, and we cannot assure any reader that such statements will be realized or the forward-looking events and circumstances will occur. Actual results may differ materially from those anticipated or implied in the forward-looking statements due to factors listed in the “Risk Factors” section and elsewhere in this Annual Report on Form 10-K. We do not intend to publicly update or revise any forward-looking statements as a result of new information, future events or otherwise. These cautionary statements qualify all forward-looking statements attributable to us or persons acting on our behalf.
Item 1B. Unresolved Staff Comments
None.
A description of our properties is included in Item 1. “Business,” and is incorporated herein by reference.
Our obligations under our reserve-based credit facility are secured by mortgages on our oil and natural gas properties, as well as a pledge of all ownership interests in our subsidiaries. See Item 7. “Management’s Discussion and Analysis of Financial Condition and Results of Operations—Financing Activities—Reserve-Based Credit Facility”, in this Annual Report on Form 10-K for additional information concerning our reserve-based credit facility.
43
Table of Contents
Termination of the Trust and Related Litigation
On January 29, 2008, the unitholders of the Torch Energy Royalty Trust voted to terminate the Trust and authorized the Trustee to wind up, liquidate, and distribute the assets held by the Trust under the terms of the trust agreement. As discussed in Item 1. “Business” on page 1 and Item 1A. “Risk Factors” on page 19, we are involved in litigation related to the calculation of the NPI held by the Trust in the Robinson’s Bend Field in Alabama.
Although we may, from time to time, be involved in litigation and claims arising out of our operations in the normal course of business, we are not currently a party to any other material legal proceedings. In addition, we are not aware of any legal or governmental proceedings against us, or contemplated to be brought against us, under various environmental protection statutes or other regulations to which we are subject.
Item 4. Submission of Matters to a Vote of Security Holders
Our annual meeting of common unitholders was held December 1, 2009. At the meeting, the following matters were voted upon:
Class B managers nominated and reelected to serve for a term to expire in 2010 and until their successors are duly elected and qualified as follows:
| Common Units Votes For |
Common Units Withheld | |||
| Richard H. Bachmann |
16,007,930 | 847,622 | ||
| Richard S. Langdon |
15,999,630 | 855,922 | ||
| John N. Seitz |
16,016,520 | 839,032 |
The ratification of PricewaterhouseCoopers LLP as independent registered public accounting firm for 2009 was approved. With respect to common unitholders and our Class A unitholder, the number of affirmative votes cast was 16,822,123, the number of votes cast against was 389,339, and the number of abstentions was 98,491.
The proposal to approve the terms of the 2009 Omnibus Incentive Compensation Plan was approved. With respect to common unitholders and our Class A unitholder, the number of affirmative votes cast was 8,207,910, the number of votes cast against was 1,146,898, the number of abstentions was 103,708, and the number of broker non-votes was 7,397,036.
Class A managers John R. Collins and Steven R. Brunner were nominated and reelected with 454,401 Class A unit votes to serve for a term to expire in 2010.
44
Table of Contents
PART II
| Item 5. | Market for Registrant’s Common Equity, Related Unitholder Matters and Issuer Purchases of Equity Securities |
Our common units are listed on the NYSE Arca under the symbol “CEP.” Our units began trading on November 15, 2006, in connection with our initial public offering. On February 24, 2010, there were 23,316,478 common units outstanding and approximately 6,250 unitholders. On February 24, 2010, the market price for our common units was $3.91 per unit, resulting in an aggregate market value of units held by non-affiliates of approximately $62.5 million. The following table presents the high and low sales price for our common units during the periods indicated.
| Common Stock | ||||||
| High | Low | |||||
| 2009 | ||||||
| First Quarter |
$ | 4.51 | $ | 1.52 | ||
| Second Quarter |
$ | 4.37 | $ | 1.52 | ||
| Third Quarter |
$ | 4.12 | $ | 2.13 | ||
| Fourth Quarter |
$ | 4.34 | $ | 3.23 | ||
| 2008 | ||||||
| First Quarter |
$ | 31.60 | $ | 15.84 | ||
| Second Quarter |
$ | 23.07 | $ | 17.20 | ||
| Third Quarter |
$ | 20.59 | $ | 8.70 | ||
| Fourth Quarter |
$ | 10.71 | $ | 2.46 | ||
| 2007 | ||||||
| First Quarter |
$ | 35.93 | $ | 23.90 | ||
| Second Quarter |
$ | 41.25 | $ | 30.90 | ||
| Third Quarter |
$ | 50.74 | $ | 33.00 | ||
| Fourth Quarter |
$ | 42.73 | $ | 30.77 | ||
| 2006 | ||||||
| Fourth Quarter |
$ | 25.90 | $ | 21.00 | ||
The following table shows the amount per unit, record date and payment date of the quarterly cash distributions we paid on each of our common units for each period presented.
| Cash Distributions | |||||||
| Per unit | Record date | Payment date | |||||
| 2009(a) | |||||||
| First Quarter |
$ | 0.1300 | May 8, 2009 | May 15, 2009 | |||
| 2008 | |||||||
| First Quarter |
$ | 0.5625 | May 8, 2008 | May 15, 2008 | |||
| Second Quarter |
$ | 0.5625 | August 7, 2008 | August 14, 2008 | |||
| Third Quarter |
$ | 0.5625 | November 7, 2008 | November 14, 2008 | |||
| Fourth Quarter |
$ | 0.1300 | February 7, 2009 | February 13, 2009 | |||
| 2007 | |||||||
| First Quarter |
$ | 0.4625 | May 8, 2007 | May 15, 2007 | |||
| Second Quarter |
$ | 0.4625 | August 7, 2007 | August 14, 2007 | |||
| Third Quarter |
$ | 0.5625 | November 7, 2007 | November 14, 2007 | |||
| Fourth Quarter |
$ | 0.5625 | February 7, 2008 | February 14, 2008 | |||
| 2006 | |||||||
| Fourth Quarter |
$ | 0.2111 | February 7, 2007 | February 14, 2007 | |||
| (a) | Quarterly cash distributions on our common units were suspended for the second, third and fourth quarters of 2009. |
45
Table of Contents
Subject to the terms of our reserve-based credit facility, which is discussed further on page 66, our limited liability company agreement requires that, within 45 days after the end of each quarter, beginning with the quarter ended December 31, 2006, we distribute all of our available cash to unitholders of record on the applicable record date. Available cash generally means, for any quarter ending prior to liquidation:
(a) the sum of:
| (i) | all cash and cash equivalents that we and our subsidiaries (or our proportionate share of cash and cash equivalents in the case of subsidiaries that are not wholly-owned) have on hand at the end of that quarter; and |
| (ii) | all additional cash and cash equivalents that we and our subsidiaries (or our proportionate share of cash and cash equivalents in the case of subsidiaries that are not wholly-owned) have on hand on the date of determination of available cash for that quarter resulting from working capital borrowings made subsequent to the end of such quarter, |
(b) less the amount of any cash reserves established by the board of managers (or our proportionate share of cash reserves in the case of subsidiaries that are not wholly-owned) to:
| (i) | provide for the proper conduct of the business of us and our subsidiaries (including reserves for future capital expenditures including drilling and acquisitions and for anticipated future credit needs) subsequent to such quarter, |
| (ii) | comply with applicable law or any loan agreement, security agreement, mortgage, debt instrument or other agreement or obligation to which we or any of our subsidiaries are a party or by which we are bound or our assets are subject; or |
| (iii) | provide funds for distributions (1) to our unitholders or (2) in respect of our Class D interests or management incentive interests with respect to any one or more of the next four quarters; |
provided, however, that the board of managers may not establish cash reserves pursuant to (iii) above if the effect of such reserves would be that we are unable to distribute the quarterly distribution on all Common Units and Class A Units with respect to such quarter; and provided further, that disbursements made by us or any of our subsidiaries or cash reserves established, increased or reduced after the end of that quarter, but on or before the date of determination of available cash for that quarter, shall be deemed to have been made, established, increased or reduced, for purposes of determining available cash, within that quarter if the board of managers so determines.
Private Placements
There were no private placement transactions in 2009 and 2008.
Transactions in 2007
In September 2007, we sold 2,470,592 common units representing Class B limited liability company interests in a private placement which generated proceeds of approximately $105 million. On October 12, 2007, a special meeting of our common unitholders was held. At this meeting, the common unitholders approved the conversion of all outstanding Class F units into common units. As a result of the approval, all 3,371,219 of our outstanding Class F units have been cancelled and the same number of common units has been issued to the former holders of the Class F units. To facilitate the conversion, the common unitholders approved both a change in the terms of our Class F units to provide that each Class F unit is convertible into our common units, and the issuance of additional common units upon the conversion of the Class F units.
In July 2007, we sold 3,371,219 Class F units representing limited liability company interests and 2,664,998 common units representing Class B limited liability company interests in a private placement which generated proceeds of approximately $210 million.
46
Table of Contents
In April 2007, we sold 90,376 Class E units representing limited liability company interests and 2,207,684 common units representing Class B limited liability company interests in a private placement for an aggregate purchase price of approximately $60 million. On June 26, 2007, a special meeting of our common unitholders was held. At this meeting, the common unitholders approved the conversion of all outstanding Class E units into common units. As a result of the approval, all 90,376 of our outstanding Class E units have been cancelled and the same number of common units have been issued to the former holders of the Class E units. To facilitate the conversion, the common unitholders approved both a change in the terms of our Class E units to provide that each Class E unit is convertible into our common units, and the issuance of additional common units upon the conversion of the Class E units.
The units in each private placement described above were sold to certain unaffiliated third party investors. The offerings were exempt from registration under Section 4(2) of the Securities Act because the transactions did not involve a public offering.
47
Table of Contents
Common Unit Performance Graphs
The graph below compares the cumulative 3-year total return of holders of Constellation Energy Partners LLC’s common units with the cumulative total returns of the Russell 2000 index, the Dow Jones US Exploration & Production index, the Alerian MLP Index and a customized peer group of eight companies that includes: Breitburn Energy Partners Limited Partnership, Encore Energy Partners Limited Partnership, EV Energy Partners Limited Partnership, Legacy Reserves Limited Partnership, Linn Energy Limited Liability Company, Pioneer Southwest Energy Partners LP, Quest Energy Partners Limited Partnership and Vanguard Natural Resources LLC. The graph tracks the performance of a $100 investment in our common units, in each index and in the peer group (with the reinvestment of all dividends) from November 15, 2006 to December 31, 2009.
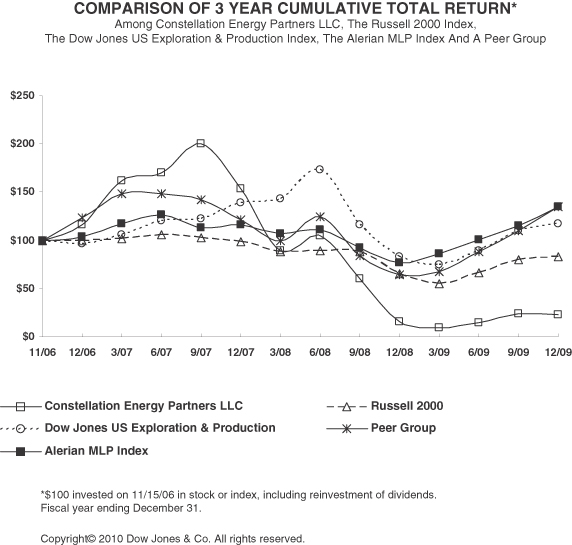
The stock price performance included in this graph is not necessarily indicative of future stock price performance.
48
Table of Contents
Item 6. Selected Financial Data
Set forth below is our selected historical consolidated financial data for the periods indicated for Constellation Energy Partners LLC. All of this historical financial data has been derived from our audited financial statements.
We were formed in February 2005 and had no principal operations prior to the completion of a $161.1 million acquisition of natural gas reserves and equipment from Everlast on June 13, 2005. The historical financial data for the period from January 1, 2005 through June 12, 2005 has been derived from Everlast’s audited historical financial statements. Initially, our only operations were in the Black Warrior Basin, as were Everlast’s. Our acquisition from Everlast resulted in a new basis for our properties in the Black Warrior Basin for accounting purposes. In addition, new management, operating and accounting policies and estimates were put into place after our acquisition from Everlast. Though the financial statements reflect the operation of the same properties in the Black Warrior Basin, due to these differences, the financial statements for the periods prior to and after our purchase of our properties in the Black Warrior Basin are not comparable. For that purpose, a black line has been placed between our and Everlast’s financial statements. Our historical results of operations and period-to-period comparisons of results and certain financial data prior to and after our acquisition of our properties in the Black Warrior Basin from Everlast may not be indicative of future results.
You should read the following selected financial data in conjunction with Item 7. “Management’s Discussion and Analysis of Financial Condition and Results of Operations” and our financial statements and related notes appearing elsewhere in this Annual Report on Form 10-K.
49
Table of Contents
The following table presents a non-GAAP financial measure, Adjusted EBITDA, which we use in our business. This measure is not calculated or presented in accordance with generally accepted accounting principles (“GAAP”). We explain this measure and reconcile it to net income, the most directly comparable financial measure calculated and presented in accordance with GAAP in “—Non-GAAP Financial Measure—Adjusted EBITDA” below.
| Successor | Predecessor | ||||||||||||||||||||||||
| Constellation Energy Partners LLC | Everlast | ||||||||||||||||||||||||
| For the year ended December 31, 2009 |
For the year ended December 31, 2008 |
For the year ended December 31, 2007 |
For the year ended December 31, 2006 |
For the period from February 7, 2005 (inception) to December 31, 2005 |
For the period from January 1, 2005 to June 12, 2005 |
||||||||||||||||||||
| (in 000’s) | |||||||||||||||||||||||||
| Statement of Operations Data: |
|||||||||||||||||||||||||
| Revenues: |
|||||||||||||||||||||||||
| Oil and gas sales |
$ | 123,126 | $ | 141,863 | $ | 82,725 | $ | 36,917 | $ | 25,957 | $ | 12,882 | |||||||||||||
| Gain/(loss) from mark-to-market activities |
19,410 | 21,376 | (6,856 | ) | — | — | (15,313 | ) | |||||||||||||||||
| Total revenues |
142,536 | 163,239 | 75,869 | 36,917 | 25,957 | (2,431 | ) | ||||||||||||||||||
| Operating expenses: |
|||||||||||||||||||||||||
| Lease operating expenses |
33,535 | 36,257 | 17,141 | 7,234 | 4,175 | 2,769 | |||||||||||||||||||
| Cost of sales |
2,638 | 7,261 | 1,788 | — | — | — | |||||||||||||||||||
| Production taxes |
3,153 | 8,398 | 3,646 | 1,783 | 1,400 | 676 | |||||||||||||||||||
| General and administrative |
18,506 | 13,998 | 8,789 | 4,263 | 4,143 | 594 | |||||||||||||||||||
| Exploration costs |
855 | 414 | 320 | 310 | 41 | — | |||||||||||||||||||
| Depreciation, depletion and amortization |
76,286 | 77,919 | 23,190 | 7,444 | 4,176 | 1,683 | |||||||||||||||||||
| Accretion expense |
406 | 411 | 312 | 141 | 78 | 46 | |||||||||||||||||||
| (Gain)/loss on asset sale |
— | (301 | ) | 86 | — | — | — | ||||||||||||||||||
| Total operating expenses |
135,379 | 144,357 | 55,272 | 21,175 | 14,013 | 5,768 | |||||||||||||||||||
| Other expenses/(income): |
|||||||||||||||||||||||||
| Interest expense |
16,305 | 12,167 | 6,930 | 221 | 3 | 2,437 | |||||||||||||||||||
| Interest income |
(2 | ) | (350 | ) | (465 | ) | (468 | ) | — | — | |||||||||||||||
| Other (income) expense |
(123 | ) | (203 | ) | (109 | ) | — | — | — | ||||||||||||||||
| Total other expenses/(income) |
16,180 | 11,614 | 6,356 | (247 | ) | 3 | 2,437 | ||||||||||||||||||
| Total expenses |
151,559 | 155,971 | 61,628 | 20,928 | 14,016 | 8,205 | |||||||||||||||||||
| Net income(loss) |
$ | (9,023 | ) | $ | 7,268 | $ | 14,241 | $ | 15,989 | $ | 11,941 | $ | (10,636 | ) | |||||||||||
| Earnings (loss) per unit |
|||||||||||||||||||||||||
| Basic |
$ | (0.40 | ) | $ | 0.32 | $ | 0.87 | $ | 1.41 | $ | 1.05 | $ | — | ||||||||||||
| Diluted |
$ | (0.40 | ) | $ | 0.32 | $ | 0.87 | $ | 1.41 | $ | 1.05 | $ | — | ||||||||||||
| Distributions declared and paid per unit |
$ | 0.26 | $ | 2.25 | $ | 1.6986 | $ | — | $ | — | $ | — | |||||||||||||
| Other Financial Information (unaudited): |
|||||||||||||||||||||||||
| Adjusted EBITDA |
$ | 66,992 | $ | 75,285 | $ | 52,840 | $ | 23,335 | $ | 16,239 | $ | 8,795 | |||||||||||||
50
Table of Contents
| Successor | Predecessor | |||||||||||||||||||||||||
| Constellation Energy Partners LLC | Everlast | |||||||||||||||||||||||||
| For the year ended December 31, 2009 |
For the year ended December 31, 2008 |
For the year ended December 31, 2007 |
For the year ended December 31, 2006 |
For the period from February 7, 2005 (inception) to December 31, 2005 |
For the period from January 1, 2005 to June 12, 2005 |
|||||||||||||||||||||
| (in 000’s) | ||||||||||||||||||||||||||
| Balance Sheet Data: |
||||||||||||||||||||||||||
| Cash and cash equivalents |
$ | 11,337 | $ | 6,255 | $ | 18,689 | $ | 7,485 | $ | 14,831 | ||||||||||||||||
| Other current assets |
33,928 | 45,976 | 27,184 | 18,602 | 6,097 | |||||||||||||||||||||
| Oil and natural gas properties, net of accumulated depreciation, depletion and amortization |
612,625 | 662,519 | 643,653 | 171,639 | 165,211 | |||||||||||||||||||||
| Other assets |
50,427 | 44,099 | 17,129 | 5,971 | — | |||||||||||||||||||||
| Total assets |
$ | 708,317 | $ | 758,849 | $ | 706,655 | $ | 203,697 | $ | 186,139 | ||||||||||||||||
| Current liabilities |
$ | 16,484 | $ | 19,506 | $ | 20,551 | $ | 9,007 | $ | 13,895 | ||||||||||||||||
| Debt |
195,000 | 212,500 | 153,000 | 22,000 | 63 | |||||||||||||||||||||
| Other long-term liabilities |
12,129 | 6,754 | 16,702 | 2,730 | 3,014 | |||||||||||||||||||||
| Class D interests |
6,667 | 6,667 | 7,000 | 8,000 | — | |||||||||||||||||||||
| Members equity: |
||||||||||||||||||||||||||
| Common members equity |
449,670 | 463,295 | 505,178 | 148,847 | 169,167 | |||||||||||||||||||||
| Accumulated other comprehensive income |
28,367 | 50,127 | 4,224 | 13,113 | — | |||||||||||||||||||||
| Total members’ equity |
478,037 | 513,422 | 509,402 | 161,960 | 169,167 | |||||||||||||||||||||
| Total liabilities and members’ equity |
$ | 708,317 | $ | 758,849 | $ | 706,655 | $ | 203,697 | $ | 186,139 | ||||||||||||||||
| Cash Flow Data: |
||||||||||||||||||||||||||
| Net cash provided by operating activities |
$ | 56,087 | $ | 75,632 | $ | 42,499 | $ | 14,067 | $ | 23,313 | $ | 6,639 | ||||||||||||||
| Net cash used in investing activities |
(22,571 | ) | (95,008 | ) | (502,533 | ) | (25,429 | ) | (147,237 | ) | (4,203 | ) | ||||||||||||||
| Net cash provided by (used in) financing activities |
(28,434 | ) | 6,942 | 471,238 | 4,016 | 138,755 | (2,500 | ) | ||||||||||||||||||
| Development of natural gas properties |
(22,913 | ) | (47,897 | ) | (23,645 | ) | (13,224 | ) | (8,286 | ) | (4,000 | ) | ||||||||||||||
51
Table of Contents
Non-GAAP Financial Measure—Adjusted EBITDA
We define Adjusted EBITDA as net income (loss) adjusted by:
| • | interest (income) expense; |
| • | depreciation, depletion and amortization; |
| • | write-off of deferred financing fees; |
| • | impairment of long-lived assets; |
| • | (gain) loss on sale of assets; |
| • | exploration costs; |
| • | (gain) loss from equity investment; |
| • | unit based compensation programs; |
| • | accretion of asset retirement obligation; |
| • | unrealized (gain) loss on natural gas derivatives; and |
| • | realized loss (gain) on cancelled natural gas derivatives. |
Adjusted EBITDA is a significant performance metric used by our management to indicate (prior to the establishment of any cash reserves by our board of managers) the cash distributions we expect to pay to our unitholders. Specifically, this financial measure indicates to investors whether or not we are generating cash flow at a level that can sustain or support a quarterly distribution or an increase in our quarterly distribution rates. Adjusted EBITDA is also used as a quantitative standard by our management and by external users of our financial statements such as investors, research analysts and others to assess:
| • | the financial performance of our assets without regard to financing methods, capital structure or historical cost basis; |
| • | the ability of our assets to generate cash sufficient to pay interest costs and support our indebtedness; and |
| • | our operating performance and return on capital as compared to those of other companies in our industry, without regard to financing or capital structure. |
Our Adjusted EBITDA should not be considered as a substitute for net income, operating income, cash flows from operating activities or any other measure of financial performance or liquidity presented in accordance with GAAP. Our Adjusted EBITDA excludes some, but not all, items that affect net income and operating income and these measures may vary among other companies. Therefore, our Adjusted EBITDA may not be comparable to similarly titled measures of other companies.
52
Table of Contents
The following table presents a reconciliation of net income (loss) to Adjusted EBITDA, our most directly comparable GAAP performance measure, for each of the periods presented:
| Successor Constellation Energy Partners LLC |
Predecessor Everlast Energy LLC |
|||||||||||||||||||||||
| For the year ended December 31, 2009 |
For the year ended December 31, 2008 |
For the year ended December 31, 2007 |
For the year ended December 31, 2006 |
For the period from February 7, 2005 (inception) to December 31, 2005 |
For the Period from January 1, 2005 to June 12, 2005 |
|||||||||||||||||||
| (In 000’s) | ||||||||||||||||||||||||
| Reconciliation of Net Income (loss) to Adjusted EBITDA: |
||||||||||||||||||||||||
| Net income (loss) |
$ | (9,023 | ) | $ | 7,268 | $ | 14,241 | $ | 15,989 | $ | 11,941 | $ | (10,636 | ) | ||||||||||
| Adjusted by: |
||||||||||||||||||||||||
| Interest expense/(income), net |
16,303 | 11,817 | 6,465 | (247 | ) | 3 | 2,437 | |||||||||||||||||
| Depreciation, depletion and amortization |
76,286 | 77,919 | 23,190 | 7,444 | 4,176 | 1,683 | ||||||||||||||||||
| Accretion of asset retirement obligation |
406 | 411 | 312 | 141 | 78 | 46 | ||||||||||||||||||
| (Gain)/loss on sale of asset |
— | (301 | ) | 86 | — | — | — | |||||||||||||||||
| Exploration costs |
855 | 414 | 320 | 310 | 41 | — | ||||||||||||||||||
| (Gain)/loss on mark-to-market activities |
(19,410 | ) | (21,376 | ) | 6,856 | — | — | — | ||||||||||||||||
| Unit-based compensation programs |
1,308 | 322 | 145 | — | — | — | ||||||||||||||||||
| Unrealized loss/(gain) on natural gas derivatives/hedge ineffectiveness |
267 | (1,189 | ) | 1,225 | (302 | ) | — | 15,265 | ||||||||||||||||
| Adjusted EBITDA |
$ | 66,992 | $ | 75,285 | $ | 52,840 | $ | 23,335 | $ | 16,239 | $ | 8,795 | ||||||||||||
53
Table of Contents
Item 7. Management’s Discussion and Analysis of Financial Condition and Results of Operation
The following discussion and analysis should be read in conjunction with the Item 6. “Selected Financial Data” and the accompanying financial statements and related notes included elsewhere in this Annual Report on Form 10-K. The following discussion contains forward-looking statements that reflect our future plans, estimates, forecasts, guidance, beliefs and expected performance. The forward-looking statements are dependent upon events, risks and uncertainties that may be outside our control. Our actual results could differ materially from those discussed in these forward-looking statements. Factors that could cause or contribute to such differences include, but are not limited to, market prices for oil and natural gas, production volumes, estimates of proved reserves, capital expenditures, operating costs, lack of a sponsor, economic and competitive conditions, regulatory changes and other uncertainties, as well as those factors discussed below and elsewhere in this Annual Report on Form 10-K, particularly in Item 1A. “Risk Factors” and “Forward-Looking Statements,” all of which are difficult to predict. In light of these risks, uncertainties and assumptions, the forward-looking events discussed may not occur.
Overview
We are a limited liability company formed by Constellation Energy Group, Inc. (“Constellation”) on February 7, 2005 to acquire oil and natural gas properties as well as related midstream assets. At December 31, 2009, our oil and natural gas reserves were located in the Black Warrior Basin of Alabama, in the Cherokee Basin of Kansas and Oklahoma, and in the Woodford Shale in Oklahoma. Our primary business objective is to create long-term value and to generate stable cash flows allowing us to resume making quarterly cash distributions to our unitholders and over time to increase the amount of our future quarterly distributions. Our strategies for achieving this objective are to:
| • | organically grow our business by increasing reserves and production through what we believe to be low-risk development drilling that focuses on capital efficient production growth; |
| • | reduce the volatility in our revenues resulting from changes in oil and natural gas commodity prices through efficient hedging programs; |
| • | make accretive acquisitions of oil and natural gas properties characterized by a high percentage of proved developed reserves with long-lived, stable production and low-risk drilling opportunities, which may include associated midstream assets such as gathering systems, compression, dehydrating and treating facilities and other similar facilities; and |
| • | realize value by opportunistically forming partnerships, participating in farm-out arrangements, joint operating agreements or other capital-efficient ventures to take advantage of our significant undeveloped acreage positions in the Cherokee Basin. |
Our future oil and natural gas reserves and production and, therefore, our cash flow and income are highly dependent on our success in efficiently developing our current reserves and economically finding, developing and acquiring additional recoverable reserves. We may not be able to find, develop or acquire additional reserves to replace our current and future production at acceptable costs, which could materially adversely affect our business, financial condition and results of operations and our ability to pay quarterly cash distributions to our unitholders.
We also face the challenge of natural gas production declines. As a given well’s initial reservoir pressures are depleted, natural gas production decreases. We attempt to overcome this natural decline in production by drilling additional wells on our proven undeveloped, probable and possible locations on our existing properties and by acquiring additional reserves when opportunities arise. We will continue to focus on adding reserves through drilling, well recompletions and acquisitions, as well as the corresponding costs necessary to produce such reserves. Our ability to add reserves through drilling is dependent on our capital resources and can be limited by many factors, including our ability to timely obtain drilling permits and regulatory approvals. In
54
Table of Contents
accordance with our business plan, we intend to invest the capital necessary to maintain our production and our asset base over the long term. We will seek to maintain or grow our production and our asset base by pursuing both organic growth opportunities and acquisitions of producing reserves that are suitable for us.
We completed our initial public offering on November 20, 2006, and our common units, representing Class B limited liability company interests, are listed on the NYSE Arca, Inc. under the symbol “CEP.”
We have expanded our operations by completing the following acquisitions that we have included in our results of operations and cash flows beginning with the period of acquisition:
| • | In March 2008, we completed an acquisition of 83 non-operated producing wells located in the Woodford Shale in Oklahoma (the “CoLa Assets” or “CoLa Acquisition”). |
| • | In September 2007, we completed the acquisition of additional oil and natural gas properties in the Cherokee Basin of Oklahoma (the “Newfield Assets” or “Newfield Acquisition”). |
| • | In July 2007, we completed an acquisition of additional oil and natural gas properties located in the Cherokee Basin in Oklahoma (the “Amvest Acquisition”). |
| • | In April 2007, we completed an acquisition of oil and natural gas properties located in the Cherokee Basin in Kansas and Oklahoma (the “EnergyQuest Assets” or “EnergyQuest Acquisition”). |
These acquisitions have provided us with the option to pursue organic growth by drilling on proved undeveloped and unproved locations primarily in Osage County, Oklahoma.
Unless the context requires otherwise, any reference in this Annual Report on Form 10-K to “Constellation Energy Partners,” “we,” “our,” “us,” “CEP,” the “successor company” or the “Company” means Constellation Energy Partners LLC and its subsidiaries. References in this Annual Report on Form 10-K to “Constellation,” “CCG” and “CEPM” are to Constellation Energy Group, Inc., Constellation Energy Commodities Group, Inc. and Constellation Energy Partners Management, LLC, respectively.
Significant Operational Factors
| • | Realized Prices. Our average realized price for the twelve months ended December 31, 2009, including hedges, was $8.35 per Mcfe. This realized price includes the impact of $19.4 million of unrealized gains on mark-to-market derivatives. Excluding the impact of the unrealized mark-to-market gains, the average realized price for the twelve months ended December 31, 2009 was $7.22 per Mcfe. Further deducting the cost of sales associated with third party gathering, average realized prices were $7.06 per Mcfe including hedges and $3.59 per Mcfe excluding hedges. |
| • | Production. Our production during 2009 was approximately 17.1 Bcfe, or an average of 46,742 Mcfe per day. This level of production was approximately level with our 2008 production of 17.4 Bcfe. |
| • | Capital Expenditures and Drilling Results. During 2009, we spent approximately $22.9 million in cash capital expenditures primarily for development activities in the Cherokee Basin. This level of spending was below our 2009 maintenance capital budget of approximately $30.5 million. This maintenance capital budget is intended to maintain our production rates, reserves, and asset base. Because we spent less than our maintenance capital budget in 2009, we would expect our production to decline in 2010. |
In the Black Warrior Basin, we have stopped drilling activities due to low natural gas prices and the current costs to drill and complete wells in the basin. We have completed 10 drilling locations at a total cost of approximately $1.2 million. These locations should be available to drill when it becomes economically favorable to do so.
In the Cherokee Basin, we drilled and completed 60 net wells and performed 17 net recompletions. We drilled 1 horizontal development dry hole. As of December 31, 2009, we have 1 additional net well which requires completion.
55
Table of Contents
We continue to focus on horizontal drilling opportunities in Kansas and Oklahoma. In other coalbed methane basins, horizontal drilling technology has been successfully used to increase production and to increase economic returns. As the costs for horizontal drilling have declined and techniques have improved, we believe this type of drilling technology may be suitable in the Cherokee Basin. We expect that the costs for the horizontal wells will be marginally higher than our traditional vertical wells with higher production rates and reserves recoveries. During the past two years, we drilled and completed 17 net horizontal wells in the Cherokee Basin. Average initial production flow rates for these recently drilled horizontal wells have met or exceeded the flow rates of our recently drilled traditional vertical wells. We expect to drill additional horizontal wells in the Cherokee Basin when we begin our 2010 drilling program in March 2010. We will continue to evaluate the total costs, and the timing of such costs associated with our horizontal drilling program, in light of our liquidity position, current oil and natural gas prices, and service costs in the Cherokee Basin.
| • | Oil and Natural Gas Reserves. Our total year end 2009 proved reserves were 131.2 Bcfe which is 101.2 Bcfe lower than our year end 2008 proved reserves of 232.4 Bcfe. Our 2009 estimates of proved reserves were prepared in accordance with the new SEC guidelines for oil and natural gas reserve reporting that require our proved reserves to be calculated using an average of the NYMEX spot prices for the sales of oil and natural gas on the first calendar day of each month of the year, adjusted for basis differentials. Our 2009 estimates of proved reserves decreased from 2008 primarily due to reserve revisions as a result of a lower SEC-required 12-month average price for natural gas compared to 2008 year-end pricing. This price decline resulted in the removal of all our proved undeveloped reserves that existed at January 1, 2009, of approximately 47.1 Bcfe in the Cherokee Basin because they became uneconomic at the low price. We also removed approximately 23.9 Bcfe in proven undeveloped locations in the Black Warrior Basin because of the new SEC requirement to only record locations that are scheduled to be drilled within the next 5 years. Any of our locations that are scheduled to be drilled after 5 years are classified as probable or possible reserves. These declines were partially offset by additional proved undeveloped reserve additions in the Black Warrior Basin because of a state ruling allowing 40-acre spacing throughout the Robinson’s Bend Field. Our reserves are 99% natural gas and are sensitive to lower SEC-required prices for natural gas and basis differentials in the Mid-Continent region. The 12-month average price for natural gas price used to prepare our reserve report was $3.92 for NYMEX and $3.11 in the Cherokee Basin. Although we utilize swaps and basis swaps to mitigate commodity price risk and basis differentials, these derivatives are not used when preparing our reserve report based on SEC rules. We do not use the SEC-required 12-month average price to make investment or drilling decisions. Instead, we use estimates of expected future observable market prices for oil and natural gas. |
| • | Debt. Through February 24, 2010, we have successfully reduced our outstanding debt level from $220.0 million to $190.0 million. During 2010, we intend to continue to dedicate our excess operating cash flows to continue to reduce our outstanding debt. Our reserve-based credit facility has a current borrowing base of $205.0 million, which currently leaves us with $15.0 million of funds available for borrowing. |
| • | Hedging and mark-to-market Activities. As of December 31, 2009, all of our swaps and basis swaps are accounted for as mark-to-market derivatives. For the year ended December 31, 2009, the unrealized non-cash mark-to-market gain was approximately $19.4 million as compared to an unrealized non-cash mark-to-market gain of $21.4 million for the same period in 2008. |
We experience earnings volatility as a result of using the mark-to-market accounting method for all of our commodity derivatives used to hedge our exposure to changes in natural gas prices or basis differentials. This accounting treatment can cause earnings volatility as the positions for future natural gas production are marked-to-market. These non-cash unrealized gains or losses are included in our current Statement of Operations until the derivatives are cash settled as the commodities are produced and sold. We do not enter into speculative trading positions and we only use derivatives to lock in the future sales price for a portion of our expected natural gas production. Increases in the market price of natural gas relative to the fixed future sales price for our hedges result in unrealized, non-cash
56
Table of Contents
mark-to-market losses on those derivatives and lower reported net income. Decreases in the market price of natural gas relative to the fixed future sales price for our hedges result in unrealized, non-cash mark-to-market gains on those derivatives and higher reported net income. Although these gains and losses are required to be reported immediately in earnings as market prices change, the fair value of the related future physical natural gas sale is not marked-to-market and therefore is not reflected as Oil and Gas Sales or as an Accounts Receivable in our financial statements. This mismatch impacts our reported Results of Operations and our reported working capital position until the commodity derivatives are cash settled and the natural gas is produced and sold. Upon cash settlement of the derivatives, the sale of the physical commodity at then-current market prices offsets the previously reported mark-to-market gains or losses such that the cumulative net cash realized results in a net sale of the physical natural gas production at the fixed future sales price for our hedge. When our derivative positions are cash settled as the related commodities are produced and sold, the realized gains and losses of those derivative positions are included in our Statement of Operations as Oil and Gas Sales. Further detail of our commodity derivative positions and their accounting treatment is outlined starting on page 69.
Significant Market Factors
| • | Relationship with our Former Sponsor. Constellation still owns all of our outstanding Class A units, approximately 5.9 million Class B Common Units, all of our Class D interests, and all of the Management Incentive Interests. Constellation terminated the management services agreement with us on December 15, 2009. As a result, we submitted a plan to our lenders for managing our business after Constellation’s termination of the agreement that was required under the terms of our previous reserve-based credit facilities. The plan received the requisite required approval and substantially all the services that Constellation used to perform have now been transitioned to CEP. This termination effectively ended Constellation’s tenure as our sponsor and we do not expect Constellation to provide us with any significant services, support, financing, or acquisition opportunities in the future. |
Constellation previously announced that it had impaired the fair value of its investment in CEP due to various factors, including the possible sale of its investment in CEP. We are not aware of any efforts that Constellation has undertaken to sell its investment in us and to date Constellation has not announced any plan or transaction.
57
Table of Contents
Results of Operations
The following table sets forth the selected financial and operating data for the periods indicated (in thousands except net production and average sales and costs):
| For the year ended December 31, 2009 |
For the year ended December 31, 2008 |
2009 Vs 2008 Variance |
For the year ended December 31, 2007 |
2008 Vs 2007 Variance |
||||||||||||||||||||||
| $ | % | $ | % | |||||||||||||||||||||||
| Revenues: |
||||||||||||||||||||||||||
| Oil and gas sales |
$ | 123,126 | $ | 141,863 | (18,737 | ) | (13.2 | )% | $ | 82,725 | $ | 59,138 | 71.5 | % | ||||||||||||
| Gain (Loss) from mark-to- market activities |
19,410 | 21,376 | (1,966 | ) | (9.2 | )% | (6,856 | ) | 28,232 | (411.8 | )% | |||||||||||||||
| Total revenues |
142,536 | 163,239 | (20,703 | ) | (12.7 | )% | 75,869 | 87,370 | 115.2 | % | ||||||||||||||||
| Operating expenses: |
||||||||||||||||||||||||||
| Lease operating expenses |
33,535 | 36,257 | (2,722 | ) | (7.5 | )% | 17,141 | 19,116 | 111.5 | % | ||||||||||||||||
| Cost of sales |
2,638 | 7,261 | (4,623 | ) | (63.7 | )% | 1,788 | 5,473 | 306.1 | % | ||||||||||||||||
| Production taxes |
3,153 | 8,398 | (5,245 | ) | (62.5 | )% | 3,646 | 4,752 | 130.3 | % | ||||||||||||||||
| General and administrative expenses |
18,506 | 13,998 | 4,508 | 32.2 | % | 8,789 | 5,209 | 59.3 | % | |||||||||||||||||
| Exploration costs |
855 | 414 | 441 | 106.5 | % | 320 | 94 | 29.4 | % | |||||||||||||||||
| (Gain) loss on sale of asset |
— | (301 | ) | 301 | (100.0 | )% | 86 | (387 | ) | (450.0 | )% | |||||||||||||||
| Depreciation, depletion and amortization |
76,286 | 77,919 | (1,633 | ) | (2.1 | )% | 23,190 | 54,729 | 236.0 | % | ||||||||||||||||
| Accretion expenses |
406 | 411 | (5 | ) | (1.2 | )% | 312 | 99 | 31.7 | % | ||||||||||||||||
| Total operating expenses |
135,379 | 144,357 | (8,978 | ) | (6.2 | )% | 55,272 | 89,085 | 161.2 | % | ||||||||||||||||
| Other expenses (income): |
||||||||||||||||||||||||||
| Interest expense |
16,305 | 12,167 | 4,138 | 34.0 | % | 6,930 | 5,237 | 75.6 | % | |||||||||||||||||
| Interest income |
(2 | ) | (350 | ) | 348 | (99.4 | )% | (465 | ) | 115 | (24.7 | )% | ||||||||||||||
| Other (income) expense |
(123 | ) | (203 | ) | 80 | (39.4 | )% | (109 | ) | (94 | ) | 86.2 | % | |||||||||||||
| Total other expenses (income) |
16,180 | 11,614 | 4,566 | 39.3 | % | 6,356 | 5,258 | 82.7 | % | |||||||||||||||||
| Total expenses |
151,559 | 155,971 | (4,412 | ) | (2.8 | )% | 61,628 | 94,343 | 153.1 | % | ||||||||||||||||
| Net income (loss) |
$ | (9,023 | ) | $ | 7,268 | $ | (16,291 | ) | (224.1 | )% | $ | 14,241 | $ | (6,973 | ) | (49.0 | )% | |||||||||
| Net production: |
||||||||||||||||||||||||||
| Total production (MMcfe) |
17,061 | 17,384 | (323 | ) | (1.9 | )% | 10,393 | 6,991 | 67.3 | % | ||||||||||||||||
| Average daily production (Mcfe/d) |
46,742 | 47,497 | (755 | ) | (1.6 | )% | 28,474 | 19,023 | 66.8 | % | ||||||||||||||||
| Average sales prices: |
||||||||||||||||||||||||||
| Price per Mcfe including hedges(a) |
$ | 8.35 | $ | 9.39 | $ | (1.04 | ) | (11.0 | )% | $ | 7.30 | $ | 2.09 | 28.6 | % | |||||||||||
| Price per Mcfe excluding hedges |
$ | 3.75 | $ | 8.13 | $ | (4.38 | ) | (53.9 | )% | $ | 6.51 | $ | 1.62 | 24.9 | % | |||||||||||
| Average unit costs per Mcfe: |
||||||||||||||||||||||||||
| Field operating expenses(b) |
$ | 2.15 | $ | 2.57 | $ | (0.42 | ) | (16.3 | )% | $ | 2.00 | $ | 0.57 | 28.5 | % | |||||||||||
| Lease operating expenses |
$ | 1.97 | $ | 2.09 | $ | (0.12 | ) | (5.8 | )% | $ | 1.65 | $ | 0.44 | 26.7 | % | |||||||||||
| Production taxes |
$ | 0.18 | $ | 0.48 | $ | (0.30 | ) | (61.7 | )% | $ | 0.35 | $ | 0.13 | 37.1 | % | |||||||||||
| General and administrative expenses |
$ | 1.08 | $ | 0.81 | $ | 0.27 | 33.3 | % | $ | 0.85 | $ | (0.04 | ) | (4.7 | )% | |||||||||||
| Depreciation, depletion and amortization(c) |
$ | 4.47 | $ | 4.48 | $ | (0.01 | ) | (0.02 | )% | $ | 2.23 | $ | 2.25 | 100.9 | % | |||||||||||
| (a) | Price per Mcfe including hedges includes realized and unrealized mark-to-market losses on derivative transactions that did not qualify for hedge accounting treatment. |
| (b) | Field operating expenses include lease operating expenses and production taxes. |
| (c) | Depreciation, depletion and amortization includes non-cash impairments of oil and natural gas assets. Excluding impairments, the 2009 cost per Mcfe was $4.16 and the 2008 cost per Mcfe was $3.01. |
58
Table of Contents
Year Ended December 31, 2009 Compared to Year Ended December 31, 2008
Oil and natural gas sales. Oil and natural gas sales decreased $18.7 million, or 13.2%, to $123.2 million for the year ended December 31, 2009 as compared to $141.9 million for the same period in 2008. Of this decrease, $2.6 million was attributable to decreased production volumes and $74.8 million was attributable to lower market prices for oil and natural gas, offset by a $58.7 million increase attributable to our hedge program. Production for the year ended December 31, 2009 was 17.1 Bcfe, which was 0.3 Bcfe lower than the same period in 2008. Our production was essentially level in the Cherokee Basin due to the success of our 2009 drilling and recompletion program offsetting the natural decline rate associated with our existing wells in the basin. We did not drill any new wells in the Black Warrior Basin during 2009 and the lack of maintenance capital spending in the Black Warrior Basin resulted in a decline of 0.2 Bcfe in production in the basin. This decline would have been higher had we not conducted a workover program in the Black Warrior Basin in early 2009. Our production in the Woodford Shale also declined 0.2 Bcfe during 2009. This is a result of natural declines in the field and the operators drilling additional wells in which we do not participate surrounding our 83 well bores. We hedged approximately 81% of our actual production during 2009 and approximately 89% of our actual production during 2008.
As discussed below, the gain from our unrealized non-cash mark-to-market activities decreased $2.0 million for the year ended December 31, 2009, as compared to the same period in 2008. Our realized prices before our hedging program decreased significantly from $8.13 per Mcfe in 2008 to $3.75 per Mcfe in 2009 primarily due to lower market demand for oil and natural gas as a result of the economic recession. This decline was partially offset by our hedging program and the mark-to-market gains discussed below.
Hedging and mark-to-market activities. As of December 31, 2009, all of our swaps and basis swaps are accounted for as mark-to-market derivatives. For the year ended December 31, 2009, the unrealized non-cash mark-to-market gain was approximately $19.4 million as compared to an unrealized non-cash $21.4 million mark-to-market gain for the same period in 2008. This 2009 non-cash gain represents approximately $22.2 million from the impact of lower expected future natural gas prices on these derivative transactions that are being accounted for as mark-to-market activities and less than $0.1 million loss for non-performance risk related to our counterparties, offset by approximately $2.8 million in losses associated with 2011 and 2012 natural production where we do not expect future volumes to exceed the hedged volumes that had been accounted for previously as cash flow hedges.
For the year ended December 31, 2009, we recognized a loss of approximately $0.3 million related to hedge ineffectiveness primarily related to our hedges of production in the Cherokee Basin that we used to account for as cash flow hedges. We will not experience any hedge ineffectiveness for 2010, as all our hedges are now accounted for as mark-to-market activities. For the year ended December 31, 2008, we recognized a gain of approximately $1.2 million related to hedge ineffectiveness.
Cash hedge settlements received and hedge premium amortizations paid for our commodity derivatives were approximately $59.5 million for the year ended December 31, 2009. Cash hedge settlements paid for our commodity derivatives were $0.7 million for the year ended December 31, 2008. This difference is primarily due to significantly lower market prices for natural gas during 2009. In 2008, we liquidated our swaption position for cash proceeds of approximately $2.1 million. The original premium paid for the swaption was approximately $1.9 million in 2007.
Field operating expenses. Our field operating expenses generally consist of lease operating expenses, labor, vehicle, supervision, transportation, minor maintenance, tools and supplies expenses, as well as production and ad valorem taxes.
For the year ended December 31, 2009, lease operating expenses decreased $2.7 million, or 7.5%, to $33.5 million, compared to expenses of $36.2 million for the same period in 2008. Of the $2.7 million decrease in lease operating expenses, $2.1 million is related to our Cherokee Basin properties, $0.3 million is related to our
59
Table of Contents
Woodford Shale well bores and $0.3 million is related to our Black Warrior properties. By category, our lease operating expenses were lower in 2009 as compared to 2008, because of a $1.5 million decrease in well servicing costs, $0.8 million decrease in field reorganization expenses in Tulsa, $0.3 million decrease in contract labor, and $0.2 million decrease in incremental expenses associated with the Dewey office fire that occurred in 2008, offset by a $0.1 million increase in facilities expenses.
For the year ended December 31, 2009, per unit lease operating expenses were $1.97 per Mcfe compared to $2.09 per Mcfe for the same period in 2008. We have worked to lower our per unit operating costs during 2009. Our decrease in per unit costs is attributable to a decrease in total spending of approximately 7.5% in 2009 as compared the same period in 2008, 0.3 Bcfe in lower production in 2009 as compared to the same period in 2008, and fewer weather-related and specific field office events that occurred in the Cherokee Basin in 2008.
For the year ended December 31, 2009, production taxes decreased $5.2 million, or 62.5%, to $3.2 million, compared to expenses of $8.4 million for the same period in 2008. This decrease was primarily the result of significantly lower market prices for oil and natural gas in 2009 and the impact of production tax credits of approximately $0.3 million.
Cost of sales. For the year ended December 31, 2009, cost of sales decreased by $4.7 million, or 63.7%, to $2.6 million, compared to $7.3 million for the same period in 2008. This represents the cost of purchased natural gas in the Cherokee Basin and was impacted by lower natural gas prices as these costs are tied to natural gas prices in the Mid-continent region.
General and administrative expenses. General and administrative expenses include the costs of our employees, related benefits, field office expenses, professional fees, costs billed by CEPM under our management services agreement which was terminated on December 15, 2009, and other costs not directly associated with field operations.
General and administrative expenses increased $4.5 million, or 32.2%, to $18.5 million for the year ended December 31, 2009, as compared to $14.0 million for the same period in 2008. This increase was primarily due to costs associated with transitioning services under the management services agreement from CEPM to CEP. Our general and administrative expenses were higher in 2009 as compared to 2008 because of $5.9 million in higher labor, bonus, and benefits, $1.0 million in non-cash unit-based compensation, $0.2 million in insurance, $0.1 million in rent expense, offset by $1.5 million in lower charges from CEPM, $0.7 million in lower legal fees, and $0.5 million in lower audit and tax fees. For the year ended December 31, 2009 and 2008, CEPM allocated $1.4 million and $2.9 million, respectively, in expenses to us for labor and other charges through the management services agreement.
Our per unit costs were $1.08 per Mcfe for the year ended December 31, 2009 compared to $0.81 per Mcfe for the same period in 2008. This increase is attributable to an increase in total spending of $4.5 million and a 0.3 Bcfe decline in total production volumes. During 2009, total spending increased as services were transitioned from being provided by CEPM under the management services agreement to CEP.
Exploration Costs. Exploration costs increased $0.5 million, or 106.5% to $0.9 million for the year ended December 31, 2009, as compared to $0.4 for the same period in 2008. These costs represent abandonments of drilling locations, dry hole costs, delay rentals, geological and geophysical costs, and the impairment, amortization, and abandonment associated with leases on our unproved properties. The increase in 2009 is primarily as the result of lease abandonments in Kansas.
Gain/loss on sale of asset. Our gain/loss on the sale of assets decreased $0.3 million, or 100.0%, to nothing for the year ended December 31, 2009, as compared to a gain of $0.3 million for the same period in 2008. During 2009, the proceeds from the assets that we sold equaled their book value. In 2008, a fire damaged our field office located in Dewey, Oklahoma. A gain of $0.2 million was recorded for the involuntary conversion as the insurance proceeds of $0.4 million exceeded the $0.2 million book value of the building.
60
Table of Contents
Depreciation, depletion and amortization expense. Depreciation, depletion and amortization expenses include the depreciation, depletion and amortization of acquisition costs and equipment costs. Depletion is calculated using units-of-production. Assuming everything else remains unchanged, as natural gas production changes, depletion would change in the same direction.
Our depreciation, depletion and amortization expense for the year ended December 31, 2009 was $76.3 million, or $4.47 per Mcfe, compared to $77.9 million, or $4.48 per Mcfe, for the same period in 2008. The decrease of $1.6 million was driven by lower impairment charges of $20.5 million offset by approximately $18.9 million in higher depletion associated with our oil and natural gas properties. Our 2009 impairment charges were related to $4.8 million for certain of our well bores in the Woodford Shale due to the impact of lower natural gas prices on expected estimated future cash flows associated with our well bores and an $0.3 million impairment of obsolete inventory and other miscellaneous straight-line assets. The remainder of this increase in 2009 depreciation, depletion, and amortization reflects the increased basis as a result of additional capital expenditures for our development drilling programs primarily in the Cherokee Basin and lower natural gas reserve volumes during 2009 as compared to 2008 due to price-related reserve revisions that resulted in us removing our proved undeveloped reserves in the Cherokee Basin from our SEC reserve report. We calculate depletion using units-of-production under the successful efforts method of accounting. Our other assets are depreciated using the straight line basis. Consistent with our prior practice, we use our 2009 reserve report to calculate our depletion rate during the first three quarters of 2010, we expect our 2010 depletion rate to be approximately $7.08 per Mcfe. We will continue to use our 2010 reserve report to record our depletion in the fourth quarter of 2010.
Interest expense. Interest expense for the year ended December 31, 2009 increased $4.1 million to $16.3 million as compared to approximately $12.2 million in interest expense for the same period in 2008. This increase was primarily due to $4.3 million in non-cash mark-to-market losses on our interest rate swaps that are accounted for as market-to-market activities and higher interest rate swap settlements of $3.3 million. This increase was offset by lower market interest rates of $4.0 million, the accelerated amortization of $0.1 million in debt issue costs as a result of a lender leaving our credit facilities, and lower capitalized interest of $0.5 million during 2009 as compared to the same period in 2008. During 2009, we used our excess operating cash flow to reduce our total debt from a high of $220.0 million to $195.0 million. At December 31, 2009, we had an outstanding balance under our reserve-based credit facility of $195.0 million as compared to $212.5 million at December 31, 2008. The average interest rate on our outstanding debt was approximately 6.4% in 2009 compared to 5.45% in 2008. Our capitalized interest decreased from 2008 to 2009 due to lower capital spending in 2009.
Interest income. Interest income for the year ended December 31, 2009 decreased $0.4 million to nothing as compared to approximately $0.4 million in interest income for same period in 2008. During 2008, we earned interest income by utilizing overnight investments on our excess cash balances. In 2009, we discontinued our overnight investments to participate in a program sponsored by the FDIC’s Transaction Account Guarantee Program to provide unlimited insurance coverage for transaction account balances that do not earn interest. This program was available until December 31, 2009.
Accumulated other comprehensive income. Accumulated other comprehensive income, shown on our consolidated balance sheets, reflects the changes in the fair market value of our previously designated cash-flow hedge positions. At December 31, 2009, the balance was an unrealized gain of $28.4 million compared to an unrealized gain of $50.1 million at December 31, 2008. This decrease reflects the settlements during 2009 related to amounts previously included in locked accumulated other comprehensive income associated with our hedging positions previously accounted for as cash flow hedges. All of our derivative positions are now accounted for as mark-to-market activities and the remaining balance in accumulated other comprehensive income will be amortized to earnings as the positions settle in the future.
The change in Accumulated other comprehensive income (loss) is shown in our consolidated statements of operations and comprehensive income (loss) as an unrealized loss of $21.8 million for the year ended December 31, 2009, and as an unrealized gain of $45.9 million for the same period in 2008. This change is
61
Table of Contents
primarily due to the impact of the amortization of locked accumulated other comprehensive income as we realize an offsetting gain upon the physical sale of natural gas production for which 2009 hedges have fixed the future sales price, $2.8 million associated with 2011 and 2012 natural production where we do not expect future volumes to exceed the hedged volumes that had been accounted for previously as cash flow hedges, and $2.9 million associated with 2010 interest rate swaps where the underlying debt on our reserve-based credit facilities was repaid.
Year Ended December 31, 2008 Compared to Year Ended December 31, 2007
Oil and natural gas sales. Oil and natural gas sales increased $59.1 million, or 71.5%, to $141.8 million for the year ended December 31, 2008 as compared to $82.7 million for the same period in 2007. Of this increase, $45.4 million was attributable to increased production volumes and $28.2 million was attributable to higher market prices for oil and natural gas, offset by a $14.6 million decrease attributable to our hedge program. Production for the year ended December 31, 2008 was 17.4 Bcfe, which was 7.0 Bcfe higher than the same period in 2007, as a result of the acquisition of our properties in the Cherokee Basin and in the Woodford Shale and our maintenance drilling program substantially offsetting the natural decline rate of production associated with our existing wells. Our production in the Black Warrior Basin remained essentially level. We hedged approximately 89% of our actual production during 2008 and approximately 90% of our actual production during 2007.
As discussed below, the gain from our unrealized non-cash mark-to-market activities increased $28.2 million for the year ended December 31, 2008, as compared to the same period in 2007. Our realized prices before our hedging program increased from 2007 to 2008 primarily due to higher market prices for oil and natural gas. This was offset by our hedging program and the mark-to-market gains discussed below.
Hedging and mark-to-market activities. We had certain swaps, basis swaps and other derivatives that were accounted for as mark-to-market derivatives. For the year ended December 31, 2008, the unrealized non-cash mark-to-market gain was approximately $21.4 million as compared to an unrealized non-cash $6.9 million loss for the same period in 2007. This 2008 non-cash gain represents approximately $20.8 million from the impact of lower expected future natural gas prices on these derivative transactions that are being accounted for as mark-to-market activities, $0.4 million loss for non-performance risk related to our counterparties, and approximately $1.0 million from the termination of hedge accounting on swaps for natural gas production between 2008 and 2013 for volumes associated with our CoLa acquisition as we expect future actual production to be lower than anticipated due to a higher than anticipated production decline rate for the reserves.
We entered into cash flow hedges in an effort to reduce our exposure to short-term fluctuations in natural gas prices. For the year ended December 31, 2008, we recognized a gain of approximately $1.2 million related to hedge ineffectiveness primarily related to our hedges of production in the Cherokee Basin. For the year ended December 31, 2007, we recognized a loss of approximately $1.2 million related to hedge ineffectiveness.
Cash hedge settlements paid for our commodity derivatives were approximately $0.7 million for the year ended December 31, 2008. Cash hedge settlements received for our commodity derivatives were $16.3 million for the year ended December 31, 2007. This difference is primarily due to higher market prices for natural gas during mid-2008. In 2008, we also liquidated a swaption position for cash proceeds of approximately $2.1 million. The original premium paid for the swaption was approximately $1.9 million in 2007.
Field operating expenses. Our field operating expenses generally consist of lease operating expenses, labor, vehicle, supervision, transportation, minor maintenance, tools and supplies expenses, as well as production and ad valorem taxes.
For the year ended December 31, 2008, lease operating expenses increased $19.1 million, or 111.5%, to $36.2 million, compared to expenses of $19.1 million for the same period in 2007. Of the $19.1 million increase
62
Table of Contents
in lease operating expenses, $17.0 million is related to our Cherokee Basin properties, $1.8 million is related to our Woodford Shale acquisition, and $0.3 million is related to the Black Warrior Basin properties. The majority of the increase was the result of the full year costs of operating the properties acquired in the EnergyQuest, Amvest, and Newfield Acquisitions. By category, our lease operating expenses were higher in 2008 as compared to 2007, because of an increase of $7.0 million in compression, treating, salt water disposal and transportation charges, $3.1 million in well servicing costs, $2.6 million in labor and benefits, $1.5 million in repairs and maintenance, $1.5 million in insurance expenses, $1.3 million in power and fuel charges, $0.9 million in non-operated lease operating expenses, $0.7 million in vehicle expenses, $0.6 million in field reorganization expenses, $0.2 million in ad valorem taxes, and $0.2 million in incremental expenses associated with the Dewey office fire, offset by $0.6 million in lower equipment rentals.
For the year ended December 31, 2008, per unit lease operating expenses were $2.09 per Mcfe compared to $1.65 per Mcfe for the same period in 2007. Our per unit operating costs in 2008 in the Black Warrior Basin have remained essentially level with our operating costs in 2007. Certain weather-related and specific field office events described below, which are not expected to be ongoing, contributed to the per unit increase in operating expenses experienced in the Cherokee Basin compared to 2007. During 2008, our lease operating expenses in the Cherokee Basin were impacted by $0.5 million in repair costs to restore production after a significant winter ice storm in Oklahoma, $0.8 million of field reorganization expenses in Tulsa, $0.3 million in costs associated with the final Newfield settlement under the transition services agreement, and $0.7 million in incremental expenses associated with the Dewey office fire, surface damages, shut-in payments, and environmental costs. We have worked to lower our per unit operating costs during 2008. Our per unit lease operating expenses for the year ended December 31, 2008 were $2.09 per Mcfe, which has decreased from $2.24 per Mcfe for the three months ended March 31, 2008.
For the year ended December 31, 2008, production taxes increased $4.8 million, or 130.3%, to $8.4 million, compared to expenses of $3.6 million for the same period in 2007. This increase was primarily the result of the additional taxes resulting from oil and natural gas production in Oklahoma and Kansas as a result of the EnergyQuest, Amvest, Newfield, and CoLa Acquisitions and higher market prices for oil and natural gas in mid-2008.
Cost of sales. For the year ended December 31, 2008, cost of sales increased by $5.5 million, or 306.1%, to $7.3 million, compared to $1.8 million for the same period in 2007. This represents the cost of purchased natural gas in the Cherokee Basin and was impacted by higher natural gas prices and a full year of operations for our Cherokee Basin properties.
General and administrative expenses. General and administrative expenses include the costs of our employees, related benefits, field office expenses, professional fees, costs billed by CEPM under our management services agreement and other costs not directly associated with field operations.
General and administrative expenses increased $5.2 million, or 59.3%, to $14.0 million for the year ended December 31, 2008, as compared to $8.8 million for the same period in 2007. This increase was primarily due to our acquisitions in the Cherokee Basin increasing our administrative overhead burdens. Our general and administrative expenses were higher in 2008 as compared to 2007 because of $1.3 million in administrative costs in Tulsa, $1.2 million in legal fees primarily associated with the Torch arbitration, $0.9 million in CEPM charges for labor, $0.9 million in professional services costs primarily associated with providing outsourced accounting services for our properties in the Cherokee Basin, $0.4 million in audit and tax fees, $0.3 million associated with the retention of a strategic advisor, and $0.2 million in non-cash expenses associated with restricted unit grants under our long-term incentive program. For the year ended December 31, 2008 and 2007, CEPM allocated $2.9 million and $1.4 million, respectively, in expenses to us for labor and other charges through the management services agreement.
63
Table of Contents
Our per unit costs were $0.81 per Mcfe for the year ended December 31, 2008 compared to $0.85 per Mcfe for the same period in 2007. This decrease is attributable to increased production volumes as a result of our acquisitions in the Cherokee Basin and the Woodford Shale, as well as the economies of scale associated with spreading fixed administrative expenses over a larger base of properties.
Exploration Costs. Exploration costs increased $0.1 million, or 29.4% to $0.4 million for the year ended December 31, 2008, as compared to $0.3 for the same period in 2007. These costs represent abandonments of drilling locations, dry hole costs, delay rentals, geological and geophysical costs, and the impairment, amortization, and abandonment associated with leases on our unproved properties. The increase in 2009 is primarily as the result increased amortization for leases in the Cherokee Basin.
Gain/loss on sale of asset. Our gain/loss on the sale of assets increased $0.4 million, or 450.0%, to a gain of $0.3 million for the year ended December 31, 2008, as compared to a loss of $0.1 million for the same period in 2007. In 2008, a fire damaged our field office located in Dewey, Oklahoma. A gain of $0.2 million was recorded for the involuntary conversion as the insurance proceeds of $0.4 million exceeded the $0.2 million book value of the building. In February 2007, we sold a surplus compressor for $0.2 million and recorded a $0.1 million loss on the sale.
Depreciation, depletion and amortization expense. Depreciation, depletion and amortization expenses include the depreciation, depletion and amortization of acquisition costs and equipment costs. Depletion is calculated using units-of-production. Assuming everything else remains unchanged, as natural gas production changes, depletion would change in the same direction.
Our depreciation, depletion and amortization expense for the year ended December 31, 2008 was $77.9 million, or $4.48 per Mcfe, compared to $23.2 million, or $2.23 per Mcfe, for the same period in 2007. Approximately one half of this increase was driven by an impairment charge of $25.7 million related to our Woodford Shale properties. This impairment was primarily caused by reserve revisions caused by the impact of lower production volumes than originally estimated, a higher initial production decline rate, and lower future expected prices for natural gas. The remainder of this increase in 2008 depreciation, depletion, and amortization reflects the increased basis in our assets resulting from the cost of our asset acquisitions in the Cherokee Basin, additional capital expenditures for our development drilling programs, and a 7.0 Bcfe increase in production volumes during 2008 as compared to 2007. We calculate depletion using units-of-production under the successful efforts method of accounting except for our other assets which are depreciated using the straight line basis.
Interest expense. Interest expense for the year ended December 31, 2008 increased $5.3 million to $12.2 million as compared to approximately $6.9 million in interest expense for same period in 2007. This increase was due to increased borrowings under our reserve-based credit facilities to finance the acquisition of our Woodford Shale properties, investment capital expenditures and the accelerated amortization of $0.1 million in debt issue costs as a result of amending our reserve-based credit facility. At December 31, 2008, we had an outstanding balance under our credit facilities of $212.5 million as compared to $153.0 million at December 31, 2007. The average interest rate on our outstanding debt was 5.45% in 2008 compared to 7.27% in 2007.
Interest income. Interest income for the year ended December 31, 2008 decreased $0.1 million to $0.4 million as compared to approximately $0.5 million in interest expense for same period in 2007. During 2008 and 2007, we earned interest income by utilizing overnight investments on our excess cash balances. Throughout 2008 interest rates on overnight investment balances significantly declined as a result of the credit crisis and global recession. In March 2008, we received $0.1 million in interest on payment balances from receivables related to the sales of natural gas included in the Torch NPI escrow account. Effective with the termination of the Trust, the escrow account arrangement also terminated and all payments for natural gas sales are directly received by us.
64
Table of Contents
Accumulated other comprehensive income. Accumulated other comprehensive income, shown on our consolidated balance sheets, reflects the changes in the fair market value of our open hedge positions. At December 31, 2008, the balance was an unrealized gain of $50.1 million compared to an unrealized gain of $4.2 million at December 31, 2007. This increase primarily reflects the decrease in the market prices for natural gas.
The change in Accumulated other comprehensive income (loss) is shown in our consolidated statements of operations and comprehensive income (loss) as an unrealized gain of $45.9 million for the year ended December 31, 2008, and as an unrealized loss of $8.9 million for the same period in 2007. This change is primarily due to the impact of the decrease in expected future market prices for natural gas on our outstanding commodity derivatives accounted for as cash flow hedges. This impact was offset by the impact of decrease in expected future LIBOR interest rates on our outstanding interest rate swaps accounted for as cash flow hedges and a $0.5 million adjustment for non-performance risk related to our counterparties. Notwithstanding these unrealized gains on our commodity derivatives for natural gas, as these positions cash settle in the future, we expect to realize an offsetting loss upon the physical sale of natural gas production for which these hedges have fixed the future sales price.
Liquidity and Capital Resources
During 2009, we utilized our cash flow from operations as our primary source of capital. Our primary use of capital during 2009 was for the development of existing oil and natural gas properties in the Cherokee Basin and the retirement of outstanding debt. As we pursue our business plans, we will be monitoring the capital resources available to us to meet our future financial obligations and planned capital expenditures. Our future success in growing reserves and production will be highly dependent on the capital resources available to us and our success in drilling for or acquiring additional reserves and managing the costs associated with our operations. Our results will not be fully impacted by significant increases or decreases in natural gas prices because of our hedging program, which is further discussed on page 69. Based upon our current business plan for 2010, we expect to continue to generate operating cash flows in excess of our working capital needs. We expect to make limited maintenance capital expenditures beginning in March 2010. During 2010, we intend for our excess cash flow to be used primarily to further reduce our debt levels.
Our reserve-based credit facility currently provides a limited availability to finance future maintenance capital expenditures and other working capital needs. As of February 24, 2010, our total borrowing base under our reserve-based credit facility was $205.0 million. At February 24, 2010, we had $190.0 million of debt outstanding under the reserve-based credit facility and $15.0 million in unused borrowing capacity. Since our outstanding debt balance, net of available cash, under our reserve-based credit facility exceeded 90% of our borrowing base at December 31, 2009, we were restricted from making cash distributions to our unitholders. Our reserve-based credit facility matures in November 2012. In the first quarter of 2008, we filed a shelf registration statement with the SEC to register up to $1.0 billion of debt or equity securities to fund future expansion capital expenditures. This registration statement expires January 30, 2011. There is no guarantee that securities can or will be issued under the registration statement. Based on current financial market conditions and market prices for oil and natural gas, we expect capital markets to remain constrained which will make issuing additional debt or equity securities difficult or not possible at all. Our current reserve-based credit facility is also subject to future borrowing base redeterminations and will have to be renewed or replaced before its maturity in November 2012.
During 2010 and 2011, we expect to fund our working capital needs and any maintenance capital expenditures with cash flow from operations. Our current expectation is that we will manage our business to operate within the cash flows that are generated. During 2010, we intend to use any available surplus cash to further reduce our debt levels. In response to low natural gas prices, we have stopped all drilling activities in the Black Warrior Basin and have reduced our drilling activities in the Cherokee Basin. We do not expect to begin our 2010 drilling activities in the Cherokee Basin until March 2010. We expect that the suspension of our quarterly distribution and the reduction in our total planned capital expenditures will provide additional liquidity to fund our operations and to pay down debt. Through February 24, 2010, we have successfully reduced our
65
Table of Contents
outstanding debt balances from $220.0 million to $190.0 million. Any future quarterly distribution to unitholders cannot be made when our outstanding debt balance, net of available cash, is more than 90% of our borrowing base as determined by our lenders, after giving effect to the proposed distribution. Our available cash excludes any cash reserves as established by our board of managers for the proper conduct of our business and the payment of fees and expenses. We are subject to additional future borrowing base redeterminations and cannot forecast at what level our lenders will set our future borrowing base. However, after our outstanding debt balance, net of available cash, is less than 90% of our borrowing base as determined by our lenders and at such time we are able to resume maintenance capital expenditures, we will evaluate the resumption of our quarterly distribution to unitholders. Given our focus on debt reduction, we anticipate that our distribution will remain suspended through the fourth quarter of 2010 and we currently expect to resume capital spending at maintenance levels in 2011. Any future quarterly distributions must be approved by our board of managers.
Reserve-Based Credit Facility
On November 13, 2009, we entered into an amended and restated $350.0 million credit agreement with The Royal Bank of Scotland plc as administrative agent and a syndicate of lenders. The reserve-based credit facility amends, extends, and consolidates our previous reserve-based credit facilities and matures on November 13, 2012. Borrowings under the reserve-based credit facility are secured by various mortgages of oil and natural gas properties that we and certain of our subsidiaries own as well as various security and pledge agreements among us and certain of our subsidiaries and the administrative agent. The current lenders and their percentage commitments in the reserve-based credit facility are: The Royal Bank of Scotland plc (26.83%), BNP Paribas (21.95%), The Bank of Nova Scotia (21.95%), Wells Fargo Bank, N.A. (14.63%), and Societe Generale (14.63%).
The amount available for borrowing at any one time under the reserve-based credit facility is limited to the borrowing base for our oil and natural properties in Alabama, Kansas, and Oklahoma. As of February 24, 2010, our borrowing base was $205.0 million. The borrowing base is redetermined semi-annually, and may be redetermined at our request more frequently and by the lenders, in their sole discretion, based on reserve reports as prepared by petroleum engineers, together with, among other things, the oil and natural gas prices prevailing at such time. Outstanding borrowings in excess of our borrowing base must be repaid or we must pledge other oil and natural gas properties as additional collateral. We may elect to pay any borrowing base deficiency in three equal monthly installments such that the deficiency is eliminated in a period of three months. Any increase in our borrowing base must be approved by all of the lenders.
Borrowings under the reserve-based credit facility are available for acquisition, exploration, operation and maintenance of oil and natural gas properties, payment of expenses incurred in connection with the reserve-based credit facility, working capital and general limited liability company purposes. The reserve-based credit facility has a sub-limit of $20.0 million which may be used for the issuance of letters of credit. As of December 31, 2009, no letters of credit are outstanding.
At our election, interest for borrowings are determined by reference to (i) the London interbank rate, or LIBOR, plus an applicable margin between 2.50% and 3.50% per annum based on utilization or (ii) a domestic bank rate (“ABR”) plus an applicable margin between 1.50% and 2.50% per annum based on utilization plus (iii) a commitment fee of 0.50% per annum based on the unutilized borrowing base. Interest on the borrowings for ABR loans and the commitment fee are generally payable quarterly. Interest on the borrowings for LIBOR loans are generally payable at the applicable maturity date.
The reserve-based credit facility contains various covenants that limit, among other things, our ability and certain of our subsidiaries’ ability to incur certain indebtedness, grant certain liens, merge or consolidate, sell all or substantially all of our assets, make certain loans, acquisitions, capital expenditures and investments, and make distributions to unitholders.
66
Table of Contents
In addition, we required to maintain (i) a ratio of Total Net Debt (defined as Debt (generally indebtedness permitted to be incurred by us under the reserve-based credit facility) less Available Cash (generally, cash, cash equivalents, and cash reserves of the Company) to Adjusted EBITDA (defined as, for any period, the sum of consolidated net income for such period plus (minus) the following expenses or charges to the extent deducted from consolidated net income in such period: interest expense, depreciation, depletion, amortization, write-off of deferred financing fees, impairment of long-lived assets, (gain) loss on sale of assets, (gain) loss from equity investment, accretion of asset retirement obligation, unrealized (gain) loss on natural gas derivatives and realized (gain) loss on cancelled natural gas derivatives, and other similar charges) of not more than 3.75 to 1.00 through September 30, 2010 and 3.50 to 1.00 thereafter; (ii) Adjusted EBITDA to cash interest expense of not less than 2.5 to 1.0; and (iii) consolidated current assets, including the unused amount of the total commitments but excluding current non-cash assets, to consolidated current liabilities, excluding non-cash liabilities and current maturities of debt (to the extent such payments are not past due), of not less than 1.0 to 1.0, all calculated pursuant to the requirements under SFAS 133 and SFAS 143 (including the current liabilities in respect of the termination of natural gas and interest rate swaps). All financial covenants are calculated using our consolidated financial information.
The reserve-based credit facility also includes customary events of default, including events of default relating to non-payment of principal, interest or fees, inaccuracy of representations and warranties in any material respect when made or when deemed made, violation of covenants, cross-defaults, bankruptcy and insolvency events, certain unsatisfied judgments, guaranties not being valid under the reserve-based credit facility and a change of control. If an event of default occurs, the lenders will be able to accelerate the maturity of the reserve-based credit facility and exercise other rights and remedies. The reserve-based credit facility contains a condition to borrowing and a representation that no material adverse effect (“MAE”) has occurred, which includes, among other things, a material adverse change in, or material adverse effect on the business, operations, property, liabilities (actual or contingent) or condition (financial or otherwise) of us and our subsidiaries who are guarantors taken as a whole. If a MAE were to occur, we would be prohibited from borrowing under the reserve-based credit facility and would be in default, which could cause all of our existing indebtedness to become immediately due and payable.
We have the ability to pay distributions to unitholders from available cash, including cash from borrowings under the reserve-based credit facility, as long as no event of default exists and provided that no distributions to unitholders may be made if the borrowings outstanding, net of available cash, under the reserve-based credit facility exceed 90% of the borrowing base, after giving effect to the proposed distribution. Our available cash excludes any cash reserves as established by our board of managers for the proper conduct of our business and the payment of fees and expenses. As of February 24, 2010, we are restricted from paying distributions to unitholders as the borrowings outstanding, net of available cash, under the reserve-based credit facility exceed 90% of the borrowing base.
The reserve-based credit facility permits us to hedge our projected monthly production, provided that (a) for the immediately ensuing twelve month period, the volumes of production hedged in any month may not exceed our reasonable business judgment of the production for such month consistent with the application of petroleum engineering methodologies for estimating proved developed producing reserves based on the then strip pricing (provided that such projection shall not be more than 115% of the proved developed producing reserves forecast for the same period derived from the most recent reserve report of our petroleum engineers using the then strip pricing), and (b) for the period beyond twelve months, the volumes of production hedged in any month may not exceed the reasonably anticipated projected production from proved developed producing reserves estimated by our petroleum engineers. The reserve-based credit facility also permits us to hedge the interest rate on up to 90% of the then-outstanding principal amounts of our indebtedness for borrowed money.
The reserve-based credit facility contains no covenants related to our relationship with Constellation or Constellation’s right to appoint all of the Class A managers of our board of managers.
67
Table of Contents
At December 31, 2009, we believe that we were in compliance with the debt covenants contained in our reserve-based credit facility. We monitor compliance on an ongoing basis. As of December 31, 2009, our actual total net debt to annual adjusted EBITDA ratio was 2.7 to 1.0 as compared with a required ratio of not greater than 3.75 to 1.0, our actual ratio of current assets to current liabilities was 1.91 to 1.0 as compared with a required ratio of not less than 1.0 to 1.0, and our actual quarterly adjusted EBITDA to cash interest expense ratio was 16.5 to 1.0 as compared with a required ratio of not less than 2.5 to 1.0.
If we are unable to remain in compliance with the debt covenants associated with our reserve-based credit facility or maintain the required ratios discussed above, we could request waivers from the lenders in our bank group. Although the lenders may not provide a waiver, we could take additional steps in the event of not meeting the required ratios or in the event of a reduction in the borrowing base below its current level of $205.0 million at one of the future redeterminations by the lenders. If it becomes necessary to pay debt down beyond operating cash flows, we could further reduce capital expenditures, continue to suspend our quarterly distributions to unitholders, sell oil and natural gas properties, liquidate in the money derivative positions, further reduce operating and administrative costs, or take additional steps to increase liquidity. If we were unable to obtain a waiver and were unsuccessful at reducing our debt to the necessary level, our debt could become due and payable upon acceleration by the lenders. To the extent that we do not enter into an agreement to refinance or extend the due date on the reserve-based credit facility, the outstanding debt balance at November 13, 2011, will become a current liability.
We enter into hedging arrangements to reduce the impact of changes in the LIBOR interest rate on our interest payments for our reserve-based credit facility. These positions are outlined on page 80.
Cash Flow from Operations
Our net cash flow provided by operating activities for the year ended December 31, 2009 was $56.1 million, compared to net cash flow provided by operating activities of $75.6 million for the same period in 2008. This decrease in operating cash flow was primarily attributable to lower oil and natural gas sales of $18.7 million as the result of significantly lower market prices for natural gas on our unhedged production volumes. For 2009, our operating cash flows were reduced by $74.8 million due to lower oil and natural gas prices and $2.6 million in lower volumes, offset by $59.8 million related to our cash hedge settlements received for our natural gas commodity and $4.8 paid for our interest rate derivatives. Our change in working capital from 2008 to 2009 was impacted by lower accounts receivable of $1.0 million and an increase in accrued liabilities of $2.2 million partially offset by lower accounts payable of $1.7 million, higher prepaid expenses and lower affiliate payables of $0.9 million. Our receivables balance decreased due to increased collections and lower current period prices for our current estimated natural gas sales prices in the Cherokee Basin. Our accounts payable decreased due to lower lease operating expenses and timing of invoice payments. The decrease in affiliate payables of $0.9 million primarily resulted from the timing of the payment for expenses incurred under the management services agreement with CEPM which was terminated December 15, 2009. Our accrued liabilities increased as a result of compensation expenses related to transitioning employees and services from CEPM to CEP.
Our net cash flow provided by operating activities for the year ended December 31, 2008 was $75.6 million, compared to net cash flow provided by operating activities of $42.5 million for the same period in 2007. This increase in operating cash flow was primarily attributable to the increase in sales of oil and natural gas as a result of our acquisitions in the Cherokee Basin.
Our cash flow from operations is subject to many variables, the most significant of which are the volatility of oil and natural gas prices and our level of production of oil and natural gas. Oil and natural gas prices are determined primarily by prevailing market conditions, which are dependent on regional and worldwide economic activity, weather and other factors beyond our control. Our future cash flow from operations will depend on our ability to maintain and increase production through our development programs or completing acquisitions, as well as the market prices of oil and natural gas and our hedging program. For additional information on our business plan, refer to Outlook on page 73.
68
Table of Contents
We enter into hedging arrangements to reduce the impact of natural gas price volatility on our operations. By removing the price volatility from a significant portion of our natural gas production, we have mitigated, but not eliminated, the potential effects of changing prices on our cash flow from operations for those periods. While mitigating negative effects of falling commodity prices, these derivative contracts also limit the benefits we would receive from increases in commodity prices. These derivative contracts also limit our ability to have additional cash flows to recoup higher severance taxes, which are usually based on market prices for natural gas. Our operating cash flows are also impacted by the cost of oilfield services. In the event of inflation increasing service costs or administrative expenses, our hedging program will limit our ability to have increased operating cash flows to recoup these higher costs. Increases in the market prices for natural gas will also increase our need for working capital as our commodity hedging contracts cash settle prior to our receipt of cash from our sales of the related commodities to third parties.
It is our policy to enter into derivative contracts only with counterparties that are creditworthy financial institutions deemed by management as competent and competitive market makers. Each of the counterparties to our derivative contracts is a lender in our reserve-based credit facility. We do not post collateral under any of these agreements as they are secured under our reserve-based credit facility. This is significant since we are able to lock in attractive sales prices on a substantial amount of our expected future production without posting cash collateral based on price changes prior to the hedges being cash settled.
The following tables summarize, for the periods indicated, our hedges currently in place through December 31, 2014. All of these derivatives are accounted for as mark-to-market activities.
MTM Fixed Price Swaps—NYMEX
| For the quarter ended (in MMBtu) | |||||||||||||||||||||||||
| March 31, | June 30, | Sept 30, | Dec 31, | Total | |||||||||||||||||||||
| Volume | Average Price |
Volume | Average Price |
Volume | Average Price |
Volume | Average Price |
Volume | Average Price | ||||||||||||||||
| 2010 |
2,950,000 | $ | 8.31 | 2,875,000 | $ | 8.23 | 2,670,000 | $ | 8.13 | 2,700,000 | $ | 8.15 | 11,195,000 | $ | 8.21 | ||||||||||
| 2011 |
2,400,000 | $ | 8.56 | 2,425,000 | $ | 8.55 | 2,220,000 | $ | 8.46 | 2,220,000 | $ | 8.45 | 9,265,000 | $ | 8.51 | ||||||||||
| 2012 |
2,227,500 | $ | 8.34 | 2,227,500 | $ | 8.34 | 2,250,000 | $ | 8.34 | 2,250,000 | $ | 8.34 | 8,955,000 | $ | 8.34 | ||||||||||
| 2013 |
2,025,000 | $ | 7.33 | 2,079,500 | $ | 7.32 | 2,070,000 | $ | 7.33 | 2,038,000 | $ | 7.34 | 8,212,500 | $ | 7.33 | ||||||||||
| 2014 |
1,575,000 | $ | 7.03 | 1,592,500 | $ | 7.03 | 1,610,000 | $ | 7.03 | 1,610,000 | $ | 7.03 | 6,387,500 | $ | 7.03 | ||||||||||
| 44,015,000 | |||||||||||||||||||||||||
MTM Fixed Price Swaps—CenterPoint Energy Gas Transmission (East)
| For the quarter ended (in MMBtu) | |||||||||||||||||||||||||
| March 31, | June 30, | Sept 30, | Dec 31, | Total | |||||||||||||||||||||
| Volume | Average Price |
Volume | Average Price |
Volume | Average Price |
Volume | Average Price |
Volume | Average Price | ||||||||||||||||
| 2010 |
180,000 | $ | 7.91 | 180,000 | $ | 7.91 | 180,000 | $ | 7.91 | 180,000 | $ | 7.91 | 720,000 | $ | 7.91 | ||||||||||
| 2011 |
180,000 | $ | 7.93 | 180,000 | $ | 7.93 | 180,000 | $ | 7.93 | 180,000 | $ | 7.93 | 720,000 | $ | 7.93 | ||||||||||
| 1,440,000 | |||||||||||||||||||||||||
69
Table of Contents
MTM Fixed Price Basis Swaps—CenterPoint Energy Gas Transmission (East), Natural Gas Pipeline Co. of America (Midcontinent), ONEOK Gas Transportation (Oklahoma), Panhandle Eastern Pipeline (Texas, Oklahoma), or Southern Star Central Gas Pipeline (Texas, Oklahoma, and Kansas)
| For the quarter ended (in MMBtu) | |||||||||||||||||||||||||
| March 31, | June 30, | Sept 30, | Dec 31, | Total | |||||||||||||||||||||
| Volume | Average Price |
Volume | Average Price |
Volume | Average Price |
Volume | Average Price |
Volume | Average Price | ||||||||||||||||
| 2010 |
2,397,000 | $ | 0.76 | 2,249,500 | $ | 0.77 | 2,114,000 | $ | 0.74 | 1,995,000 | $ | 0.73 | 8,755,500 | $ | 0.75 | ||||||||||
| 2011 |
1,335,000 | $ | 0.77 | 1,347,500 | $ | 0.77 | 1,130,000 | $ | 0.77 | 1,130,000 | $ | 0.77 | 4,942,500 | $ | 0.77 | ||||||||||
| 2012 |
1,150,000 | $ | 0.65 | 1,150,000 | $ | 0.65 | 1,160,000 | $ | 0.65 | 1,160,000 | $ | 0.65 | 4,620,000 | $ | 0.65 | ||||||||||
| 18,318,000 | |||||||||||||||||||||||||
Investing Activities—Acquisitions and Capital Expenditures
Cash used in investing activities was $22.6 million for the year ended December 31, 2009, compared to $95.0 million for the same period in 2008. Our cash capital expenditures were $22.9 million in 2009, which primarily related to drilling and development of oil and natural gas properties in the Cherokee Basin. Through 2009, we drilled and completed 60 net wells and 17 net recompletions in the Cherokee Basin. We also prepared 10 drilling locations in the Black Warrior Basin. We also settled post-closing adjustments on our CoLa and Newfield Acquisitions of $0.2 million. The uses of cash were offset by the $0.1 million in proceeds from the sale of obsolete inventory and straight-line assets and $0.5 million in distributions received from an equity investment.
Cash used in investing activities was $95.0 million for the year ended December 31, 2008, compared to $502.5 million for the same period in 2007. Our capital expenditures were $95.9 million in 2008, which primarily related to $47.9 million for drilling and development of oil and natural gas properties and $50.3 million for the CoLa Acquisition offset by $2.2 million in post-closing adjustments related to our 2007 acquisitions in the Cherokee Basin. These post-closing adjustments were primarily related to the receipt of revenues between the effective date of the transaction and the closing date and the receipt of $1.0 million in funds related to the Amvest Acquisition. In 2008, we drilled and completed 15 net wells in the Black Warrior Basin and 100 net wells and 43 net recompletions in the Cherokee Basin. In 2007, we drilled and completed 20 net wells in the Black Warrior Basin, drilled 69 net wells and 21 net recompletions in the Cherokee Basin, and we completed the EnergyQuest, Amvest, and Newfield Acquisitions for $479.4 million, which is net of cash acquired.
We currently anticipate our total capital budget will be between $10.0 million and $12.0 million for the twelve months ending December 31, 2010. This capital budget primarily consists of capital for drilling and also includes amounts for infrastructure projects, equipment, and inventory. The 2010 budget is set below our 2010 estimated maintenance capital level of $25.3 million. Our capital spending in 2010 has been reduced from our 2009 spending level of $22.9 million and our 2008 spending level of $47.9 million. We expect to spend substantially the entire capital budget in the Cherokee Basin beginning in March 2010 and have not planned for any investment capital expenditures. Because we have reduced capital spending in 2009 below a maintenance level, we anticipate lower production in 2010 which will reduce our operating cash flows. We currently expect that we will resume capital spending at a level to maintain our production in 2011.
The amount and timing of our capital expenditures is largely discretionary and within our control. If natural gas prices decline to levels below acceptable levels, the total borrowing base under our reserve-based credit facility is further reduced, or drilling costs escalate, we could choose to defer a portion of these planned capital expenditures until later periods. We routinely monitor and adjust our capital expenditures in response to changes in oil and natural gas prices, drilling and acquisition costs, industry conditions, availability of funds under our reserve-based credit facility, and internally generated cash flow. Matters outside our control that could affect the timing of our capital expenditures include obtaining required permits and approvals in a timely manner and the
70
Table of Contents
availability of rigs and crews. Based upon current natural gas price expectations and expected production levels, we anticipate that our cash flow from operations and available borrowing capacity under our reserve-based credit facility will meet our planned capital expenditures and other cash requirements for the twelve months ending December 31, 2010. In 2010, we expect that our excess operating cash flows will be used to reduce our outstanding debt levels. However, future cash flows are subject to a number of variables, including the level of natural gas production and prices. There can be no assurance that operations and other capital resources will provide cash in sufficient amounts to maintain planned levels of capital expenditures. Our capital expenditures are also impacted by drilling and service costs. In the event of inflation increasing drilling and service costs, our hedging program will limit our ability to have increased revenues recoup the higher costs, which could further impact our planned capital spending.
Financing Activities
Our net cash used by financing activities was $28.4 million for the year ended December 31, 2009, compared to $6.9 million provided by financing activities for the same period in 2008. During 2009, we used $17.5 million in operating cash flows to reduce our outstanding debt level. Through February 24, 2010 we reduced our outstanding debt levels by an additional $5.0 million which has reduced our outstanding debt from $220.0 million to $190.0 million or by 14%. We also entered into a new reserve-based credit facility that matures in November 2012 and incurred approximately $5.0 million in debt issue costs.
We also paid distributions of $5.8 million to our common and Class A unitholders in 2009. We have suspended $2.3 million in quarterly distributions on the Class D interests associated with each of the quarterly periods since March 31, 2008. We expect that these quarterly distributions on the Class D interests, and all future quarterly distributions on the Class D interests, will remain suspended until the litigation surrounding the Torch NPI is finally resolved and such distributions are permitted under our credit and limited liability company agreements. For the year ended December 31, 2009, our distributions to unitholders have been less than our distributable cash flow such that our distribution coverage ratio is greater than 1.0. This coverage ratio compares our distribution rate to our distributable cash flow. Our distributable cash flow reflects Adjusted EBITDA reduced by estimated maintenance capital expenditures and cash interest expense. Our maintenance capital is the amount of capital spending required to maintain our production rates, reserves, and asset base. We have suspended our quarterly distributions to unitholders since the quarter ended June 30, 2009, to remain in compliance with the covenants associated with our reserve-based credit facility. Given our focus on debt reduction, we anticipate that our distribution will remain suspended through the fourth quarter of 2010. Assuming that the quarterly distribution rate would have remained at $0.13 per unit for each quarter in 2010, this suspension of the quarterly distribution would provide approximately $12.4 million in cash flow during 2010 that could be used to reduce our outstanding debt balance under our reserve-based credit facility. For additional information, refer to Outlook on page 73.
Our net cash provided by financing activities was $6.9 million for the year ended December 31, 2008, compared to $471.2 million provided by financing activities for the same period in 2007. In 2008, we borrowed a net of $59.5 million to fund the CoLa Acquisition, to fund debt issue costs, to finance capital expenditures, and for working capital needs. We also paid distributions of $50.7 million to our common and Class A unitholders and on the Class D interests in 2008 and incurred $0.3 million in costs associated with our shelf registration statement. During 2008, we suspended $1.3 million in quarterly distributions on the Class D interests associated with each of the quarterly periods since March 31, 2008. For the year ended December 31, 2008, our distributions to unitholders exceeded our distributable cash flow such that our distribution coverage ratio was less than 1.0. This coverage ratio compares our distribution rate to our distributable cash flow. Our distributable cash flow reflects Adjusted EBITDA reduced by estimated maintenance capital expenditures and cash interest expense. Our maintenance capital is the amount of capital spending required to maintain our production rates, reserves, and asset base. We reduced our quarterly distribution rate for the quarter ended December 31, 2008, to $0.13 per unit in order to improve our expected coverage ratio and to provide additional liquidity.
71
Table of Contents
For the year ended December, 2007, we borrowed $131.0 million from our reserve-based credit facility in order to fund the EnergyQuest, Amvest, and Newfield Acquisitions. We also paid distributions of $28.6 million to our common and Class A unitholders and on the Class D interests in 2007.
Contractual Obligations
At December 31, 2009, we had the following contractual obligations or commercial commitments:
| Payments Due By Year(1)(2) | |||||||||||||||||||||
| 2010 | 2011 | 2012 | 2013 | 2014 | Thereafter | Total | |||||||||||||||
| (In thousands) | |||||||||||||||||||||
| Reserve-Based Credit Facility |
— | — | 195,000 | — | — | — | 195,000 | ||||||||||||||
| Support Services Agreement |
1,265 | — | — | — | — | — | 1,265 | ||||||||||||||
| Offices Leases |
414 | 416 | 424 | 408 | 422 | 752 | 2,836 | ||||||||||||||
| Purchase Obligation |
— | — | — | — | — | — | — | ||||||||||||||
| Total |
$ | 1,679 | $ | 416 | $ | 195,424 | $ | 408 | $ | 422 | $ | 752 | $ | 199,101 | |||||||
| (1) | This table does not include any liability associated with derivatives. |
| (2) | This table does not include interest as interest rates are variable. The average interest rate on our outstanding debt was approximately 6.4% at December 31, 2009. |
At December 31, 2009, our asset retirement obligation was approximately $12.1 million.
Off-Balance Sheet Arrangements
We have no off-balance sheet arrangements with third parties, and we maintain no debt obligations that contain provisions requiring accelerated payment of the related obligations in the event of specified levels of declines in credit ratings.
Credit Markets and Counterparty Risk
We actively monitor the credit exposure and risks associated with our counterparties. Additionally, we continue to monitor the recent adverse developments in the global credit markets to limit our potential exposure to credit risk where possible. Our primary credit exposures result from the sale of oil and natural gas and our use of derivatives. Through February 24, 2010, we have not suffered any losses with our counterparties as a result of nonperformance in the current economic and credit crisis.
Certain key counterparty relationships are described below:
CCG
Until March 31, 2009, Constellation Energy Commodities Group, Inc. (“CCG”) purchased a portion of our natural gas production in Oklahoma and Kansas. As of February 24, 2010, we have no receivables from CCG.
Macquarie Energy LLC
Macquarie Energy LLC (“Macquarie”), a subsidiary of Sydney, Australia-based Macquarie Group, Ltd. purchases a portion of our natural gas production in the Cherokee Basin for May 2009 through March 2010. We have received a guarantee from Macquarie Bank Limited for up to $8 million in purchases through December 31, 2011. As of February 24, 2010, we have no past due receivables from Macquarie.
Scissortail Energy, LLC
Scissortail Energy, LLC (“Scissortail”), a subsidiary of Copano Energy, L.L.C., purchases a portion of our natural gas production in Oklahoma and Kansas. As of February 24, 2010, we have no past due receivables from Scissortail.
72
Table of Contents
ONEOK Energy Services Company, L.P.
ONEOK Energy Services Company, L.P. (“ONEOK”), a subsidiary of ONEOK, Inc., purchases a portion of our natural gas production in Oklahoma and Kansas. As of February 24, 2010, we have no past due receivables from ONEOK.
J.P. Morgan Ventures Energy Corporation
J.P. Morgan Ventures Energy Corporation purchases the majority of our natural gas production in Alabama. The payment for the purchases is guaranteed by JP Morgan Chase & Company though October 2010. As of February 24, 2010, we have no past due receivables from J.P. Morgan Ventures Energy Corporation.
Derivative Counterparties
As of February 24, 2010, all of our derivatives are with BNP Paribas, The Royal Bank of Scotland, Societe Generale, Calyon, Wells Fargo and Bank of Nova Scotia. These banks, except Calyon, are lenders who participate in our reserve-based credit facility. Calyon was a former lender. All of our derivatives are collateralized by the assets securing our reserve-based credit facility and therefore do not require the posting of cash collateral. As of February 24, 2010, each of these financial institutions has an investment grade credit rating.
Reserve-Based Credit Facility
As of February 24, 2010, the banks and their percentage commitments in our reserve-based credit facility are: The Royal Bank of Scotland plc (26.83%), BNP Paribas (21.95%), The Bank of Nova Scotia (21.95%), Wells Fargo Bank, N.A. (14.63%), and Societe Generale (14.63%). As of February 24, 2010, each of these financial institutions has an investment grade credit rating.
Outlook
During 2010, we expect that our business will continue to be affected by the factors described in Part II, Item 1A. “Risk Factors,” as well as the following key industry and economic trends. Our expectation is based upon key assumptions and information currently available to us. To the extent that our underlying assumptions about or interpretations of available information prove to be incorrect, our actual results may vary materially from our expected results.
Full Year 2010 Expected Results
Our 2010 business plan and forecast is focused on reducing our outstanding debt level and promoting financial flexibility by further enhancing our liquidity position. This plan will result in limited maintenance capital expenditures and the continued suspension of our quarterly distribution through the fourth quarter of 2010. Our current goal is to sustain the company through the current business cycle and to further reduce debt levels so that we can resume maintenance capital expenditures. Ultimately we intend to position our operations to create long-term value. We expect to resume full maintenance capital expenditures as part of our 2011 business plan. We also intend to evaluate the possibility of a resumption of a limited quarterly distribution for the first quarter of 2011. We expect our full year 2010 results to be impacted by declining production of natural gas, further commodity price volatility, continued limited ability to access our reserve-based credit facility, and the economic recession muting the demand and prices for oil and natural gas in our market areas.
We currently anticipate:
| • | Our production to be between 14.5 Bcfe and 15.5 Bcfe. |
| • | Our operating expenses to be relatively flat with our 2009 operating expenses, resulting in a range of $52.0 million to $56.0 million. |
73
Table of Contents
| • | Our total capital expenditures to be between $10.0 million and $12.0 million, which assumes a decline rate of 15 percent and a dollar per flowing Mcfe range of $4,400 to $4,700. This capital budget has reduced to a level below our estimated maintenance level of capital expenditures of approximately $25.3 million. We expect to drill and complete between 15 to 25 net wells, primarily in the Cherokee Basin. We will review our drilling and recompletion opportunities and anticipate allocating capital to the highest value-added projects across all of our available opportunities. |
| • | We anticipate that any possible future distribution levels in 2011 will be set at a sustainable rate based on our operating results, the market prices for oil and natural gas and our projected business plan being achieved. All future quarterly distributions must be approved by our board of managers. |
Impact of 2010 Plan
We currently prepare a five-year plan to manage our business. Our goal is to maintain production rates and operating cash flows at a steady level by developing our proved undeveloped reserve locations each year. The focus of our 2010 business plan is to further reduce our outstanding debt by reducing maintenance capital expenditures and continuing to suspend our quarterly distribution to unitholders. We expect that this will position us to resume maintenance capital expenditures in 2011 through 2014. We expect that this plan will likely result in lower production levels in 2010. If we resume maintenance capital expenditures in 2011 as we anticipate, it will likely result in production levels at our 2010 production run rates in 2011 through 2014. This plan is expected to reduce our leverage, improve our liquidity position, and reduce future cash interest expenses on our outstanding unhedged debt.
Critical Accounting Policies and Estimates
The discussion and analysis of our financial condition and results of operations are based upon our consolidated financial statements, which have been prepared in accordance with accounting principles generally accepted in the United States of America. The preparation of these financial statements requires us to make estimates and assumptions that affect the reported amounts of assets, liabilities, revenues and expenses, and related disclosure of contingent assets and liabilities. Certain accounting policies involve judgments and uncertainties to such an extent that there is reasonable likelihood that materially different amounts could have been reported under different conditions, or if different assumptions had been used. We evaluate our estimates and assumptions on a regular basis. We base our estimates on historical experience and various other assumptions that are believed to be reasonable under the circumstances, the results of which form the basis for making judgments about the carrying values of assets and liabilities that are not readily apparent from other sources. Actual results may differ from these estimates and assumptions used in the preparation of our financial statements. Below, we have provided an expanded discussion of our more critical accounting policies, estimates and judgments. We believe these accounting policies reflect our more significant estimates and assumptions used in the preparation of the Consolidated Financial Statements. Please read Note 1 to the consolidated financial statements for a discussion of additional accounting policies and estimates made by management.
Natural Gas Properties
We follow the successful efforts method of accounting for our natural gas exploration, development and production activities. Leasehold acquisition costs are capitalized. If proved reserves are found on an undeveloped property, leasehold cost is transferred to proved properties. Under this method of accounting, costs relating to the development of proved areas are capitalized when incurred.
Depreciation and depletion of producing oil and natural gas properties is recorded based on the units-of-production method. Unit rates are computed for unamortized drilling and development costs using proved developed reserves and for unamortized leasehold costs using all proved reserves. The acquisition costs of proved properties are amortized on the basis of all proved reserves, developed and undeveloped, and
74
Table of Contents
capitalized development costs (including wells and related equipment and facilities) are amortized on the basis of proved developed reserves. As more fully described in Note 15 to the consolidated financial statements, proved reserves estimates are subject to future revisions when additional information becomes available.
Estimated asset retirement costs are recognized when the asset is acquired or placed in service, and are amortized over proved reserves using the units-of-production method. Asset retirement costs are estimated by our engineers using existing regulatory requirements and anticipated future inflation rates.
Geological, geophysical and dry hole costs on oil and natural gas properties relating to unsuccessful exploratory wells are charged to expense as incurred.
Natural gas properties are reviewed for impairment when facts and circumstances indicate that their carrying value may not be recoverable. We assess impairment of capitalized costs of proved natural gas properties by comparing net capitalized costs to estimated undiscounted future net cash flows using expected prices. If net capitalized costs exceed estimated undiscounted future net cash flows, the measurement of impairment is based on estimated fair value, which would consider estimated future discounted cash flows. Cash flow estimates for the impairment testing are based on third party reserve reports and exclude derivative instruments. Refer to Note 5 to the consolidated financial statements for additional information.
Unproven properties that are individually significant are assessed for impairment and if considered impaired are charged to expense when such impairment is deemed to have occurred. Impairment is deemed to have occurred if a lease is going to expire prior to any planned drilling on the leased property. Valuation allowances based on average lease lives are maintained for the value of unproved properties in Alabama, Kansas, and Oklahoma. For our concession in Osage County, Oklahoma, we assess it for impairment on a quarterly basis, and if it is considered impaired, a charge to expense is made when such impaired is deemed to have occurred.
Property acquisition costs are capitalized when incurred.
Oil and Natural Gas Reserve Quantities
Our estimate of proved reserves is based on the quantities of natural gas that engineering and geological analyses demonstrate with reasonable certainty to be recoverable from established reservoirs in the future under current operating and economic parameters. Management estimates the proved reserves attributable to our ownership based on various factors, including consideration of reserve reports prepared by NSAI, an independent reserve engineer. On an annual basis, our proved reserve estimates and the reserve report prepared by NSAI are reviewed by our audit committee of the board of managers. Our 2009 and 2008 financial statements were prepared using NSAI’s estimates of our proved reserves while our 2007 and 2006 financial statements were prepared using our internal estimates of our proved reserves.
Reserves and their relation to estimated future net cash flows impact our depletion and impairment calculations. As a result, adjustments to depletion and impairment are made concurrently with changes to reserve estimates. We prepared our reserve estimates, and the projected cash flows derived from these reserve estimates, in accordance with SEC guidelines. The accuracy of our reserve estimates is a function of many factors including the following: the quality and quantity of available data, the interpretation of that data, the accuracy of various mandated economic assumptions and the judgments of the individuals preparing the estimates.
Our proved reserve estimates are a function of many assumptions, all of which could deviate significantly from actual results. As such, reserve estimates may materially vary from the actual quantities of oil and natural gas eventually recovered.
Net Profits Interest
A significant portion of our wells in the Robinson’s Bend Field in the Black Warrior Basin are subject to the NPI. The NPI represents an interest in production created from the working interest and is based on a contractual
75
Table of Contents
revenue calculation. We account for the NPI as an overriding royalty interest. This is consistent with our accounting for the NPI for reserve estimate purposes. Similar to royalty payments, our revenue excludes any payments made to the NPI holder.
Revenue Recognition
Sales of natural gas are recognized when natural gas has been delivered to a custody transfer point, persuasive evidence of a sales arrangement exists, the rights and responsibility of ownership pass to the purchaser upon delivery, collection of revenue from the sale is reasonably assured and the sales price is fixed or determinable. Natural gas is generally sold on a monthly basis. Most of the contracts’ pricing provisions are tied to a market index, with certain adjustments based on, among other factors, whether a well delivers to a gathering or transmission line, quality of natural gas, and prevailing supply and demand conditions, so that the price of the natural gas fluctuates to remain competitive with other available natural gas supplies. As a result, revenues from the sale of natural gas will suffer if market prices decline and benefit if they increase. We believe that the pricing provisions of our natural gas contracts are customary in the industry.
Gas imbalances occur when sales are more or less than the entitled ownership percentage of total gas production. Any amount received in excess is treated as a liability. If less than the entitled share of the production is received, the excess is recorded as a receivable. There were no gas imbalance positions at December 31, 2009, 2008 and 2007.
Hedging Activities
We have implemented a hedging policy to hedge a portion of our expected natural gas production for a period of up to five years, as we deem appropriate. We account for all our open commodity derivatives as mark-to-market activities.
We use interest rate swaps to mitigate the impact of volatility of changes in the LIBOR interest rate on our interest payments for our debt. We account for these hedging activities as mark-to-market activities.
All of our derivatives are not accounted for as cash flow hedges but are effective as economic hedges of our commodity price exposure. These contracts are accounted for using the mark-to-market accounting method. Using this method, the contracts are carried at their fair value on our consolidated balance sheet under the captions “Risk management assets” and “Risk management liabilities.” We recognize all unrealized and realized gains and losses related to these contracts on our consolidated statement of income under the caption “Gain/(loss) from mark-to-market activities”, which is a component of our total revenues.
If we ever accounted for our derivatives as cash flow hedges, we would record changes in the fair value of derivatives designated as hedges that are effective in offsetting the variability in cash flows of forecasted transactions in other comprehensive income until the forecasted transactions occur. At the time the forecasted transactions occur, we will reclassify the amounts recorded in other comprehensive income into earnings. We record the ineffective portion of changes in the fair value of derivatives used as hedges immediately in earnings. When amounts for hedging activities are reclassified from “Accumulated other comprehensive income (loss)” on the balance sheet to the income statement, we record settled natural gas derivatives as “Oil and gas sales” and settled interest rate swaps as “Interest expense (income).”
Accounting Standards Adopted Through February 25, 2010
In December 2009, the FASB issued its final oil and gas accounting rules to align the oil and gas reserve estimation and disclosure requirements of Accounting Standards Update (ASU) 2010-03, Extractive Industries—Oil and Gas (Topic 932) with the requirements in the SEC’s final rule, Modernization of the Oil and Gas Reporting Requirements, which was issued on December 31, 2008 and is effective for the year ended December 31, 2009. The adoption of the new oil and gas reserve estimation and disclosure requirements
76
Table of Contents
impacted the estimated reserve quantities in our 2009 independent third-party reserve report. One of the primary impacts was the use of an average 12-month price instead of a year-end price. The average 12-month price was significantly lower than the year-end price that was used under the old rules. Under the old rules, our NYMEX price would have been $5.79 and the price in the Cherokee Basin would have been $5.73 instead of a NYMEX price of $3.92 and a price in the Cherokee Basin of $3.11. Had these old SEC prices been used, our total proved reserves would have been 218.9 Bcfe instead of 131.2 Bcfe, our total proved undeveloped reserves would have been 55.1 Bcfe instead of 19.1 Bcfe, and our standardized measure would have been $283.2 million instead of $97.2 million. The other impact was that we historically recorded proved undeveloped locations for greater than 5 years and now we record proved undeveloped locations only for the next 5 years. These locations beyond a 5 year drilling schedule are now classified as probable reserves. Because of this change, we reclassified approximately 23.9 Bcfe of reserves in the Black Warrior Basin as probable reserves. We also used to record only one offset location to each our proved undeveloped locations but now we are able record any offsets on one section surrounding existing production subject to available infrastructure. This had a limited impact in 2009 because of the low SEC-required price for natural gas which made all of our proved undeveloped locations on our Osage concession uneconomic at the low price. Additionally, it has been our historical practice to use our year-end reserve report to adjust our depreciation, depletion, and amortization expense for the fourth quarter. We continued this practice in 2009. The impact of the adoption of the FASB and SEC final rule on our financial statements is not practicable to estimate due to the operational and technical challenges associated with calculating a cumulative effect of adoption by preparing reserve reports under both the old and new rules. However, had we calculated our 2009 reserves using year-end pricing instead of the average 12-month price, the impact would have been a decrease of at least $14.5 million in depletion in our fourth quarter 2009 financial statements.
In June 2009, the FASB released the final version of its new Accounting Standards Codification (the “Codification”) as the single authoritative source for U.S. GAAP. The Codification replaces all previous U.S. GAAP accounting standards as described in ASC 105 (SFAS 168, The FASB Accounting Standards Codification and the Hierarchy of Generally Accepted Accounting Principles). While not intended to change U.S. GAAP, the Codification significantly changes the way in which the accounting literature is organized. It is structured by accounting topic to help accountants and auditors more quickly identify the guidance that applies to a specific accounting issue. However, because the Codification completely replaces existing standards, it will affect the way U.S. GAAP is referenced by companies in their financial statements and accounting policies. The Codification is effective for financial statements that cover interim and annual periods ending after September 15, 2009. The adoption of the Codification did not have a material impact on our financial statements.
In May 2009, the FASB established general standards of accounting for and the disclosures of events that occur after the balance sheet date but before financial statements are issued or are available to be issued. Although there is new terminology, the standard is based on the same principles as those that currently exist in the auditing standards. The standard, which includes a new required disclosure of the date through which an entity has evaluated subsequent events, is effective for interim or annual periods ending after June 15, 2009. We perform an evaluation of subsequent events until the issuance date of our document with the SEC so the adoption of the new requirements had no impact on our financial statements.
In June 2008, the FASB addressed whether instruments granted in unit-based payment transactions are participating securities prior to vesting and, therefore, need to be included in the earnings allocation in computing earnings per unit under the two-class method. This affects entities that accrue or pay nonforfeitable cash distributions on unit-based payment awards during the awards’ service period. Effective for fiscal years beginning after December 15, 2008, and interim periods within those fiscal years, a retrospective adjustment to all prior period earnings per unit calculations was required. We adopted the guidance on January 1, 2009, and began including all unvested LTIP restricted common units that earn distributions in earnings per unit calculations for all periods presented. The adoption of this guidance did not have a material impact on our earnings per unit calculations.
77
Table of Contents
In March 2008, the Emerging Issues Task Force reached a consensus on how current period earnings should be allocated between limited partners and a general partner when the partnership agreement contains incentive distribution rights. Beginning after December 15, 2008, and interim periods within those fiscal years, this guidance is to be applied retrospectively for all financial statements presented. Earlier application is not permitted. The adoption of this guidance did not have a material impact on our financial statements.
In March 2008, the FASB issued guidance that was effective beginning January 1, 2009 and required entities to provide expanded disclosures about derivative instruments and hedging activities including (1) the ways in which an entity uses derivatives, (2) the accounting for derivatives and hedging activities, and (3) the impact that derivatives have (or could have) on an entity’s financial position, financial performance, and cash flows. This guidance only required expanded disclosures and did not change the accounting for derivatives. The adoption of this guidance did not have a material impact on our financial statements.
New Accounting Pronouncements Issued But Not Yet Adopted
As of December 31, 2009, there were a number of accounting standards and interpretations that had been issued, but not yet adopted by us. We are currently reviewing the recently issued standards and interpretations but none are expected to have a material impact on our financial statements.
Item 7A. Quantitative and Qualitative Disclosures about Market Risk
The primary objective of the following information is to provide forward-looking quantitative and qualitative information about our potential exposure to market risks. The term “market risk” refers to the risk of loss arising from adverse changes in natural gas prices and interest rates. The disclosures are not meant to be precise indicators of expected future losses, but rather indicators of reasonably possible losses. This forward-looking information provides indicators of how we view and manage our ongoing market risk exposures. All of our market risk sensitive instruments were entered into for purposes other than speculative trading.
Global Financial and Energy Markets
During 2009 and 2008, there has been unprecedented volatility in the global financial and energy markets. The failures of financial institutions have effectively restricted liquidity within global financial markets. The economic recession has reduced the demand for oil and natural gas, which has lowered the current market prices for these products. Despite world-wide governmental efforts to provide liquidity to the financial sector, capital and credit markets remain constrained and the economic activity remains reduced.
We expect that our ability to issue debt and equity may be limited over the next year, that the borrowing base of our reserve-based credit facility could potentially be reduced if future expected market prices for natural gas decline further, and that the cost of capital may increase during this time. We also may have difficulty in accessing credit should we have the need to. Additionally, equity valuations for energy-related companies, and E&P master limited partnerships in particular, have declined. In response to the credit crisis and the decline in the market prices for oil and natural gas, we have suspended our cash distribution, lowered our capital spending in 2009 and lowered our maintenance capital expenditure budget for 2010. We expect that if market prices for oil and natural gas remain depressed, our future cash flows from operations will be reduced for our unhedged production. We continue to monitor the financial and energy markets to determine if we should further revise the timing and scope of our future drilling programs, financing activities, acquisition activities, or resume cash distributions to our unitholders.
Commodity Price Risk
Our major market risk exposure is in the pricing applicable to our natural gas production. Realized pricing is primarily driven by the Inside FERC prices for Southern Natural Gas Company (Louisiana) with respect to our properties in the Black Warrior Basin and the Inside FERC prices for CenterPoint Energy Gas Transmission
78
Table of Contents
(East), Natural Gas Pipeline Company of America (Midcontinent), the CenterPoint Energy Gas Transmission (East), ONEOK Gas Transportation (Oklahoma), Panhandle Eastern Pipeline (Texas, Oklahoma) and Southern Star Central Gas Pipeline (Texas, Oklahoma, Kansas) with respect to our properties in the Cherokee Basin, and the Inside FERC price for the CenterPoint Energy Gas Transmission (East) for our properties in the Woodford Shale, and the spot market prices applicable to all of our natural gas production. Historically, pricing for natural gas production has been volatile and unpredictable and we expect this volatility to continue in the future. We are currently operating in an environment characterized by low natural gas prices which will lower our revenues that we realize on our unhedged natural gas production and limit the amount of operating cash flows available for maintenance capital expenditures, distributions to unitholders, or to reduce our outstanding debt level. The prices we receive for production depend on many factors outside our control, including weather, economic conditions, and the total supply of oil and natural gas for sale in the market.
We have entered into hedging arrangements with respect to a portion of our projected natural gas production through various derivatives that hedge the future prices received. These hedging activities are intended to support natural gas prices at targeted levels and to manage our exposure to natural gas price fluctuations. We do not hold or issue derivative instruments for speculative trading purposes. The use of hedging transactions also involves the risk that the counterparties will be unable to meet the financial terms of the transactions. We attempt to minimize this risk by entering into our derivative transactions with counterparties that are lenders in our reserve-based credit facility. The table below presents the hypothetical changes in fair values arising from potential changes in the quoted market prices of the commodity underlying the derivative instruments used to mitigate these market risks. Any gain or loss on these derivative commodity instruments would be substantially offset by a corresponding gain or loss on the sale of the hedged natural gas production, which are not included in the table. These derivatives do not hedge all of our commodity price risk related to our forecasted sales of natural gas production and as a result, we are subject to commodity price risks on our remaining unhedged natural gas production.
| Fair Value | 10 Percent Increase | 10 Percent Decrease | ||||||||||||||
| Fair Value | (Decrease) | Fair Value | Increase | |||||||||||||
| (in 000’s) | ||||||||||||||||
| Impact of changes in commodity prices on derivative commodity instruments December 31, 2009 |
$ | 62,686 | $ | 36,286 | $ | (26,400 | ) | $ | 89,086 | $ | 26,400 | |||||
Interest Rate Risk
At December 31, 2009, we had debt outstanding of $195.0 million. This entire amount incurred interest at a rate of a one-month LIBOR rate plus an applicable margin of 2.00% based on utilization. At December 31, 2009, the one-month LIBOR rate was 0.231% and the three-month LIBOR rate was 0.251%, and our applicable margin was 2.00%. At December 31, 2009, the ABR rate was 3.25%, and our applicable margin was 1.00%. We had no debt outstanding at the three-month LIBOR rate or at the ABR rate. At December 31, 2009, the carrying value and fair value of our debt is $195.0 million.
The table below presents the hypothetical changes in fair values arising from potential changes in the quoted interest rate underlying the derivative instruments used to mitigate these market risks.
| Fair Value | 10 Percent Increase | 10 Percent Decrease | ||||||||||||||||||
| Fair Value | Increase | Fair Value | (Decrease) | |||||||||||||||||
| (in 000’s) | ||||||||||||||||||||
| Impact of changes in LIBOR on derivative interest rate instruments December 31, 2009 |
$ | (4,727 | ) | $ | (4,308 | ) | $ | (419 | ) | $ | (5,146 | ) | $ | (419 | ) | |||||
79
Table of Contents
We enter into hedging arrangements to reduce the impact of volatility of changes in the LIBOR interest rate on our interest payments for our debt. At January 15, 2010, we have the following outstanding interest rate swaps that fix our LIBOR rate:
| Maturity Date |
Total Debt Hedged | LIBOR Fixed Rate | ||||
| (in 000’s) | ||||||
| February 20, 2010 |
$ | 16,500 | 4.74 | % | ||
| August 20, 2012 |
$ | 11,000 | 2.75 | % | ||
| August 21, 2010 |
$ | 28,500 | 2.74 | % | ||
| September 21, 2010 |
$ | 11,000 | 2.66 | % | ||
| October 22, 2010 |
$ | 19,000 | 2.91 | % | ||
| September 20, 2012 |
$ | 45,000 | 3.03 | % | ||
| October 19, 2012 |
$ | 29,500 | 3.21 | % | ||
| October 22, 2012 |
$ | 7,500 | 3.06 | % | ||
Item 8. Financial Statements and Supplementary Data
The Report of Independent Registered Public Accounting Firm, Consolidated Financial Statements and supplementary financial data required to be filed under this item are presented on pages 113 through 155 of this Annual Report on Form 10-K, and are incorporated herein by reference.
Item 9. Changes in and Disagreements With Accountants on Accounting and Financial Disclosure
None.
Item 9A. Controls and Procedures
Evaluation of Disclosure Controls and Procedures
The principal executive officer and principal financial officer of Constellation Energy Partners have evaluated the effectiveness of the disclosure controls and procedures (as such term is defined in Rules 13a-15(e) and 15d-15(e) under the Securities Exchange Act of 1934, as amended (the “Exchange Act”)) as of December 31, 2009 (the “Evaluation Date”). Based on such evaluation, such officers have concluded that, as of the Evaluation Date, Constellation Energy Partners’ disclosure controls and procedures are effective.
Changes in Internal Control
During the quarter ended December 31, 2009, there has been no change in our internal control over financial reporting (as such term is defined in Rules 13a-15(f) and 15d-15(f) under the Exchange Act) that has materially affected, or is reasonably likely to materially affect, our internal control over financial reporting.
Report of Management
Financial Statements
The management of Constellation Energy Partners LLC (“our”, the “Company” or “CEP”) is responsible for the information and representations in our financial statements. We prepare the financial statements in accordance with accounting principles generally accepted in the United States of America based upon available facts and circumstances and management’s best estimates and judgments of known conditions.
PricewaterhouseCoopers LLP, an independent registered public accounting firm, has audited the financial statements and expressed their opinion on the financial statements. They performed their audit in accordance with the standards of the Public Company Accounting Oversight Board (United States).
80
Table of Contents
The audit committee of the board of managers, which consists of three independent managers, meets periodically with management, internal auditors, and PricewaterhouseCoopers LLP to review the activities of each in discharging their responsibilities. The internal audit staff and PricewaterhouseCoopers LLP have free access to the audit committee.
Management’s Report on Internal Control Over Financial Reporting
Our management, under the direction of our principal executive officer and principal financial officer, is responsible for establishing and maintaining adequate internal control over financial reporting as defined in Exchange Act Rule 13a-15(f).
Our system of internal control over financial reporting is designed to provide reasonable assurance to our management and board of managers regarding the reliability of financial reporting and the preparation of financial statements for external purposes in accordance with generally accepted accounting principles in the United States of America.
Our management conducted an evaluation of the effectiveness of our internal control over financial reporting using the framework in Internal Control—Integrated Framework issued by the Committee of Sponsoring Organizations of the Treadway Commission (COSO). As noted in the COSO framework, an internal control system, no matter how well conceived and operated, can provide only reasonable-not absolute-assurance to management and the board of managers regarding achievement of an entity’s financial reporting objectives. Based upon the evaluation under this framework, management concluded that CEP’s internal control over financial reporting was effective as of December 31, 2009.
PricewaterhouseCoopers LLP, an independent registered public accounting firm, has audited the effectiveness of CEP’s internal control over financial reporting at December 31, 2009, as stated in their report on page 114.
None.
81
Table of Contents
PART III
Item 10. Managers, Executive Officers and Corporate Governance
The following table shows information for members of our board of managers and our executive officers as of December 31, 2009. Members of our board of managers are elected for one–year terms, and our executive officers will hold office at the discretion of, and may be removed by, our board of managers in its discretion.
| Name |
Age | Position with Constellation Energy Partners LLC | ||
| John R. Collins |
52 | Chairman of the Board | ||
| Stephen R. Brunner |
51 | Manager, Chief Executive Officer, Chief Operating Officer and President | ||
| Richard H. Bachmann |
56 | Independent manager | ||
| Richard S. Langdon |
59 | Independent manager | ||
| John N. Seitz |
57 | Independent manager | ||
| Charles C. Ward |
49 | Chief Financial Officer and Treasurer | ||
| Michael B. Hiney |
41 | Chief Accounting Officer | ||
| Lisa J. Mellencamp |
54 | General Counsel and Secretary |
John R. Collins has been a member of our board of managers since November 2006. Mr. Collins also serves as Senior Vice President of Constellation Energy Group, Inc., or Constellation, a position that he has held since October 2008. Prior to serving in his current position, Mr. Collins was the Chief Financial Officer from May 2007 to October 2008, and a member of Constellation’s Executive Committee, a Senior Vice President of Constellation from January 2004 to July 2007 and Constellation’s Chief Risk Officer from December 2001 until January 2008. Mr. Collins was also Managing Director—Finance and Treasurer of Constellation Power Source Holdings, Inc. from January 2000 to December 2001. From February 1997 to December 2001, Mr. Collins served as the senior financial officer of CCG. Mr. Collins is the former Chairman of the Board of the Committee of Chief Risk Officers, an energy industry association of risk management professionals.
Stephen R. Brunner has been a member of our board of managers since March 2008 and also serves as our Chief Executive Officer, Chief Operating Officer, and President. He was appointed President and Chief Executive Officer of Constellation Energy Partners in March 2008 and became an employee of the company in January 2009. He continues to serve in the role of Chief Operating Officer of the company, a role he assumed in February 2008. Mr. Brunner has more than 25 years of experience operating oil and gas properties both domestically and internationally. Prior to joining Constellation Energy Partners, Mr. Brunner also served as a Vice President for CCG, where he provided support for Constellation Energy Partners in various operational activities. Prior to joining CCG in February 2008, Mr. Brunner served as the Executive Vice President of Operations for Pogo Producing Company, where he was responsible for all aspects of exploration, production, acquisition and divestiture activity for seven business units in the United States, Canada, New Zealand and Vietnam. During his 13-year tenure at Pogo, Mr. Brunner also served as Vice President of Operations, overseeing both domestic and international operations. He served as the Resident Manager of Thaipo Limited, a subsidiary of Pogo, as well as Offshore Operations Manager. Prior to his career with Pogo, he held various positions with Zilkha Energy Company, Chevron Corporation and Tenneco Oil Company.
Richard H. Bachmann has been an independent member of our board of managers and our audit, compensation, conflicts, and nominating and governance committees and chairs our conflicts committee since November 2006. Mr. Bachmann joined EPCO Inc., a privately held energy company, in 1999 as Executive Vice President, Chief Legal Officer and Secretary. Prior to joining EPCO Inc., Mr. Bachmann served as a partner in the law firms of Snell & Smith P.C. from 1993 to 1998 and Butler & Binion from 1988 to 1993. Mr. Bachmann currently serves as a director and as Executive Vice President, Chief Legal Officer and Secretary of various affiliates of EPCO Inc., including Enterprise Products GP, LLC, the general partner of Enterprise Products Partners L.P., a publicly traded midstream energy company, and EPE Holdings LLC, the general partner of Enterprise GP Holdings L.P., a publicly traded midstream energy holding company. Mr. Bachmann also serves as a Director and as President and Chief Executive Officer of the general partner of Duncan Energy Partners L.P., a publicly traded midstream energy company and also an affiliate of EPCO Inc.
82
Table of Contents
Richard S. Langdon has been an independent member of our board of managers and our audit, compensation, conflicts, and nominating and governance committees and chairs our audit committee since November 2006. Mr. Langdon currently is the President and Chief Executive Officer of Matris Exploration Company and Sigma Energy Ventures, LLC, each of which is a privately held exploration and production company. From 1997 until 2002, Mr. Langdon served as Executive Vice President and Chief Financial Officer of EEX Corporation, a publicly traded exploration and production company that merged with Newfield Exploration Company in 2002. Prior to that, Mr. Langdon held various positions with the Pennzoil Companies from 1991 to 1996, including Executive Vice President—International Marketing—Pennzoil Products Company; Senior Vice President—Business Development—Pennzoil Company; and Senior Vice President—Commercial & Control—Pennzoil Exploration & Production Company. Langdon also serves as a director of Gasco Energy, Inc., a publicly traded exploration and production company.
John N. Seitz has been an independent member of our board of managers and our audit, compensation, conflicts, and nominating and governance committees and chairs our compensation and nominating and governance committees since November 2006. Mr. Seitz is also currently Vice Chairman of the Board of Endeavour International Corporation, a publicly traded oil and gas exploration and production company, and a director for ION Geophysical Corporation, f/k/a Input Output, Inc., a publicly traded provider of seismic products and services. In February 2004, Mr. Seitz co-founded Endeavour International Corporation and served as its co-Chief Executive Officer until September 2006. Prior to founding Endeavour International Corporation, Mr. Seitz served as Chief Executive Officer, President and Chief Operating Officer of Anadarko Petroleum Corporation from January 2002 to March 2003, and prior to being named Chief Executive Officer, President and Chief Operating Officer, Mr. Seitz was the Chief Operating Officer and President of Anadarko Petroleum Corporation beginning in 1999. Mr. Seitz also served as Anadarko Petroleum Corporation’s Executive Vice President, Exploration and Production and as a member of its board of directors from 1997 to 1999.
Charles C. Ward was appointed chief financial officer and treasurer of Constellation Energy Partners in March 2008 and became an employee of the company in January 2009. Mr. Ward has over 15 years of finance and energy industry experience. Prior to joining Constellation Energy Partners, Mr. Ward also served as a vice president for CCG from November 2005 to December 2008 where he provided support for Constellation Energy Partners in various finance activities and helped to lead the company through its initial public offering in November 2006. Prior to joining Constellation Energy in November 2005, Mr. Ward was a Vice President of Enron North America Corp. from March 2002 to November 2005. Prior to that time, Mr. Ward also held various positions at Enron North America Corp., El Paso Corporation, and Tenneco Oil Company.
Michael B. Hiney has served as our Chief Accounting Officer since March 2008 and became an employee of the company in January 2009. Mr. Hiney has over 20 years of energy industry and energy related accounting experience. He served as a Vice President of CCG from July 2006 until December 2008 where he served as Controller for Constellation Energy Partners. During the 16 years prior to that time, he held various positions at El Paso Exploration and Production Company, including Director and Assistant Controller from January 2004 to June 2006.
Lisa J. Mellencamp has served as our General Counsel and Secretary since January 2009. Ms. Mellencamp has over 25 years of legal experience with an extensive energy background. She served as Associate General Counsel for Constellation Energy Resources from March 2008 until December 2008 and as Senior Counsel of CCG from March 2005 to February 2008. Prior to that time she was Associate General Counsel at Duke Energy Americas from July 2003 to March 2005. Earlier in her career, she was Assistant General Counsel at Enron North America Corporation and served as a partner in the law firm of Gardere Wynne Sewell LLP from 1998 to 1999 and Hutcheson & Grundy L.L.P. from 1988 to 1998.
Independence of Board of Managers
Each of Messrs. Bachmann, Langdon and Seitz is independent under the NYSE Arca listing standards. In addition, the audit, compensation and nominating and corporate governance committees are composed entirely of independent managers under NYSE Arca listing standards, SEC requirements and other applicable laws, rules
83
Table of Contents
and regulations. Other than as set forth below, there are no transactions, relationships or other arrangements between us and our independent managers that need to be considered under the NYSE Arca listing standards in determining that such managers are independent.
We sold natural gas from the Black Warrior Basin to an affiliate of EPCO Inc. in each of 2009, 2008, 2007 and 2006. Mr. Bachman is an executive officer of EPCO Inc. The sales did not exceed 2% of EPCO Inc.’s consolidated gross revenues in any of the years.
Qualifications of Board of Managers
At the time of our initial public offering in November 2006, managers were selected to serve on our board of managers. Some of the key criteria for serving on our board of managers include:
| • | Independence—Constellation is our largest unitholder and our former sponsor. Our board of managers has been structured to ensure that two Class A seats are held by representatives of Constellation and three Class B seats are held by individuals that are independent of Constellation. Messrs. Bachmann, Langdon, and Seitz are independent of Constellation. |
| • | E&P Experience—Our primary business is the acquisition, development and production of oil and natural gas properties as well as related midstream assets. We intend for those who serve on our board of managers to have prior experience in the oil and natural gas industry. Messrs. Brunner, Langdon, and Seitz have all either served as chief executive officers or as a chief operations officer of oil and natural gas companies or are the founder and owner of privately held oil and natural gas companies. Each of Messrs. Brunner, Langdon, and Seitz also have specialized technical, operational, and managerial experience in the energy industry. |
| • | Familiarity with Master Limited Partnerships—As CEP is a limited liability company, we intend for those who serve on our board of managers to have representative management or executive experience with publicly traded partnerships. Mr. Bachmann has extensive experience with publicly traded partnerships and is a chief executive officer of a publicly traded partnership involved in the midstream business. |
| • | Corporate Governance, Financial and Other Management Experience—We intend for those who serve on our board of managers to have relevant business experience, including prior public company board experience. Each of Messrs. Bachmann, Langdon, and Seitz have served on prior company boards, have chaired audit or compensation committees, or have specialized legal, business, or financial experience that is relevant to our company. |
| • | Class A Managers—Constellation has appointed Messrs. Brunner and Collins to represent its interests on our board of managers. |
Since our initial public offering, all of our Class B managers have since been reelected by our unitholders. Constellation appoints its Class A managers concurrent with our annual meeting.
Committees of the Board of Managers
Audit Committee
As described in the audit committee charter, the audit committee is directly responsible for the appointment, compensation, retention and oversight of the work of the independent public accountants to audit our financial statements, including assessing the independent auditor’s qualifications and independence, and establishes the scope of, and oversee, the annual audit. The committee also approves any other services provided by public accounting firms. The audit committee provides assistance to the board in fulfilling its oversight responsibility to the unitholders, the investment community and others relating to the integrity of our financial statements, our
84
Table of Contents
compliance with legal and regulatory requirements, the independent auditor’s qualifications and independence and the performance of our internal audit function. The audit committee oversees our system of disclosure controls and procedures and system of internal controls regarding financial, accounting, legal compliance and ethics that management and our board of managers established. In doing so, it will be the responsibility of the audit committee to maintain free and open communication between the committee and our independent auditors, the internal accounting function and management of our company.
The board of managers has determined that the chairman of the audit committee is an “audit committee financial expert” as that term is defined in the applicable rules of the SEC. Mr. Langdon is Chairman, and Messrs. Seitz and Bachmann are members.
Compensation Committee
As described in the compensation committee charter, the compensation committee establishes and reviews general policies related to our compensation and benefits. The compensation committee determines and approves, or makes recommendations to the board of managers with respect to, the compensation and benefits of our board of managers and our executive officers and employees. The role of the compensation committee is further discussed in Compensation Discussion and Analysis.
Mr. Seitz is Chairman, and Messrs. Bachmann and Langdon are members.
Conflicts Committee
Our board of managers has established a conflicts committee to review specific matters that the board believes may involve conflicts of interest, including transactions with related persons such as Constellation or its affiliates or our managers and executive officers. The conflicts committee determines if the resolution of the conflict of interest is fair and reasonable to our company. Our limited liability company agreement provides that members of the conflicts committee may not be officers or employees of our company, or directors, officers or employees of any of our affiliates, and must meet the independence standards for service on an audit committee of a board of directors as established by NYSE Arca and SEC rules. Any matters approved by the conflicts committee will be conclusively deemed to be fair and reasonable to our company and approved by all of our unitholders. However, the board is not required by the terms of our limited liability company agreement to submit the resolution of a potential conflict of interest to the conflicts committee, and may itself resolve such conflict of interest if the board determines that (i) the terms of the related person transaction are no less favorable to us than those generally being provided to or available from unrelated third parties or (ii) the transaction is fair and reasonable to us, taking into account the totality of the relationships between the parties involved. Any matters approved by the board in this manner will be deemed approved by all of our unitholders.
Mr. Bachmann is Chairman, and Messrs. Seitz and Langdon are members.
Nominating and Governance Committee
As described in the nominating and governance committee charter, the nominating and governance committee nominates candidates to serve on our board of managers. The nominating and governance committee is also responsible for monitoring a process to review manager, board and committee effectiveness, developing and implementing our corporate governance guidelines, committee members and committee chairpersons and otherwise taking a leadership role in shaping the corporate governance of our company.
Mr. Seitz is Chairman, and Messrs. Bachmann and Langdon are members.
We maintain on our website, www.constellationenergypartners.com, copies of the charters of each of the committees of the board of managers (except the conflicts committee which does not have a charter), as well as copies of our Corporate Governance Guidelines, Code of Ethics for Chief Executive Officer, Chief Financial
85
Table of Contents
Officer and Principal Accounting Officer, and Code of Business Conduct and Ethics. Copies of these documents are also available in print upon request of our Corporate Secretary. The Code of Business Conduct and Ethics provides guidance on a wide range of conduct, conflicts of interest and legal compliance issues for all of our managers, officers and employees, including the chief executive officer, chief financial officer and chief accounting officer. We will post any amendments to, or waivers of, the Code of Business Conduct and Ethics applicable to our Chief Executive Officer, Chief Financial Officer or Principal Accounting Officer on our website.
Nominations for Manager
The board of managers seeks diverse candidates who possess the background, skills and expertise to make a significant contribution to the board of managers, us and our unitholders. Annually, the nominating and corporate governance committee reviews the qualifications and backgrounds of the managers, as well as the overall composition of the board of managers, and recommends to the full board of managers the slate of Class B manager candidates to be nominated for election at the next annual meeting of unitholders. The board of managers has adopted a policy whereby the nominating and corporate governance committee shall consider the recommendations of unitholders with respect to candidates for election to the board of managers and the process and criteria for such candidates shall be the same as those currently used by us for manager candidates recommended by the board of managers or management.
Section 16(a) Beneficial Ownership Reporting Compliance
Section 16(a) of the Exchange Act requires our directors and executive officers, and persons who own more than 10% of a registered class of our equity securities, to file initial reports of ownership of our equity securities and reports of changes in ownership of our equity securities with the SEC. Such persons are also required by SEC regulation to furnish us with copies of all Section 16(a) forms they file. Based solely on our review of the copies of such forms furnished to us and written representations from our executive officers and directors, we believe that during 2009 all Section 16(a) reporting persons complied with all applicable filing requirements in a timely manner except for the Form 4 filed by our external counsel on behalf of Stephen R. Brunner on November 23, 2009, which was filed one business day late.
Certifications
The NYSE Arca requires the Chief Executive Officer of each listed company to certify annually that he is not aware of any violation by the company of the NYSE Arca’s corporate governance listing standards, qualifying the certification to the extent necessary. In accordance with the rules of the NYSE Arca, we provided such a certification within 30 days after our 2009 annual meeting. The certifications of our Chief Executive Officer and Chief Financial officer required by Sections 302 and 906 of the Sarbanes-Oxley Act have been included as exhibits to this Annual Report on Form 10-K.
Item 11. Executive Compensation
Constellation terminated the master services agreement with us effective December 15, 2009. This ended Constellation’s role as our sponsor. During 2009, we transitioned our executive officers, certain employees, and services from being provided by CEPM to CEP. The transition of our executive management team is further described below. Through December 31, 2008, all of our executive officers were employees of Constellation or its affiliates, and they received no additional compensation from us. During this time, CEPM managed our operations, activities, and employees through the management services agreement under the direction of our board of managers and executive officers. As discussed in Item 13, “Certain Relationships and Related Transactions, and Manager Independence—“Distributions and Payments to CCG, CEPH, CHI and CEPM—Payments to CEPM”, we reimbursed CEPM for direct and indirect general and administrative expenses incurred on our behalf, including the compensation of our executive officers. Each quarter, CEPM charged us an amount for services provided. This amount was agreed to annually and included a portion of the compensation paid by
86
Table of Contents
CEPM and its affiliates to personnel who spend time on our business and affairs. The allocation of compensation expense for the chief executive officer, chief financial officer and chief accounting officer was fixed at $150,000 each by agreement between the parties for 2008 and 2007. The allocation of compensation expense for other personnel of CEPM and its affiliates was determined based on the percentage of time spent by such personnel on our business and affairs. The conflicts committee of our board of managers reviewed at least annually the services that were provided by CEPM and the costs charged to us under the management services agreement and reviewed the cost allocation quarterly. The conflicts committee also determined that the amounts to be paid by us for the services performed were fair to and in our best interests. During the year, the cost allocation was adjusted upwards to reflect additional services provided by CEPM and its affiliates or downwards to reflect the reduction of services provided by CEPM and its affiliates and the transition of services to CEP employees.
The following table sets forth the compensation of our named executive officers for 2009 and the compensation of our named executive officers for 2008 and 2007 for which we paid or reimbursed CEPM:
| Name and Principal Position |
Year | Salary | Cash Bonus(a) |
Unit Grants(b) |
All Other Compensation(c) |
Total | |||||||||||
| Stephen R. Brunner |
2009 | $ | 300,000 | $ | 300,000 | $ | 1,563,672 | $ | 18,492 | $ | 2,182,164 | ||||||
| Chief Executive Officer, Chief |
2008 | $ | 120,000 | $ | — | $ | — | $ | — | $ | 120,000 | ||||||
| Operating Officer, and |
2007 | $ | — | $ | — | $ | — | $ | — | $ | — | ||||||
| President(d) (e) |
|||||||||||||||||
| Michael B. Hiney |
2009 | $ | 175,000 | $ | 70,000 | $ | 253,429 | $ | 10,726 | $ | 509,155 | ||||||
| Chief Accounting Officer and |
2008 | $ | 150,000 | $ | — | $ | — | $ | — | $ | 150,000 | ||||||
| Controller(d) (e) |
2007 | $ | 150,000 | $ | — | $ | — | $ | — | $ | 150,000 | ||||||
| Lisa J. Mellencamp |
2009 | $ | 200,000 | $ | 130,000 | $ | 463,309 | $ | 12,538 | $ | 805,847 | ||||||
| General Counsel and Secretary |
2008 | $ | — | $ | — | $ | — | $ | — | $ | — | ||||||
| 2007 | $ | — | $ | — | $ | — | $ | — | $ | — | |||||||
| Charles C. Ward |
2009 | $ | 225,000 | $ | 168,750 | $ | 651,531 | $ | 12,988 | $ | 1,058,269 | ||||||
| Chief Financial Officer and |
2008 | $ | 120,000 | $ | — | $ | — | $ | — | $ | 120,000 | ||||||
| Treasurer (d) (e) |
2007 | $ | — | $ | — | $ | — | $ | — | $ | — | ||||||
| (a) | The amount in this column for 2009 reflects each named employee’s annual cash incentive bonus earned for 2009 performance. The annual cash incentive bonuses were determined by our compensation committee based on assessments of both company and individual performance. The amount for each of Messrs. Brunner, Hiney, and Ward and Ms. Mellencamp was awarded in recognition of the achievement of overall performance at a target level. |
| (b) | The amount in this column reflects the grant date (May 1, 2009) fair value of all unit awards in 2009 and the grant date (May 14, 2009) fair value of the distribution credits associated with the 2009 unit awards calculated in accordance with FASB ASC Topic 718. These unit awards vest between 2010 and 2014. |
| (c) | The amount in this column reflects the amount of matching contributions made to each employee under our 401k plan and the cost of life insurance equal to the executive officer’s salary. These benefits are available to all employees of CEP. |
| (d) | The amounts for our executive officers in 2008 and 2007 represent the fixed amount that we agreed to pay for the services of these named executive officers under the management services agreement and excludes the amount of any bonus, benefits, and cash and non-cash incentive awards to such officers paid by CCG, which amounts we were not required to reimburse. Messrs. Brunner and Ward became executive officers March 14, 2008 and their fixed base salaries were reimbursed through the management services agreement. Mr. Hiney’s fixed base salary was reimbursed through the management services agreement for 2008 and 2007. |
| (e) | During 2008 and 2007, our executive officers may have participated in the benefit plans of Constellation and its affiliates. During 2008 and 2007, there were no CEP benefits plans in which such officers participated. |
87
Table of Contents
The following table sets forth the grants of plan-based awards to our named executive officers for 2009:
Grants of Plan-Based Awards for 2009
| Name |
Grant date |
Compensation Committee approval date |
Estimated possible payouts under non-equity incentive plan awards |
All other unit awards: number of units |
Grant date fair value of units awarded | ||||||||||||||
| Threshold | Target | Maximum | |||||||||||||||||
| Stephen R. Brunner |
(a) | 1/1/2009 | 4/28/2009 | — | $ | 300,000 | $ | 600,000 | |||||||||||
| (b) | 5/1/2009 | 4/28/2009 | 55,828 | $ | 173,743 | ||||||||||||||
| (c) | 5/1/2009 | 4/28/2009 | 446,619 | $ | 1,389,929 | ||||||||||||||
| 502,447 | $ | 1,563,672 | |||||||||||||||||
| Michael B. Hiney |
(a) | 1/1/2009 | 4/28/2009 | — | $ | 70,000 | $ | 140,000 | |||||||||||
| (b) | 5/1/2009 | 4/28/2009 | 32,566 | $ | 101,349 | ||||||||||||||
| (c) | 5/1/2009 | 4/28/2009 | 48,867 | $ | 152,080 | ||||||||||||||
| 81,433 | $ | 253,429 | |||||||||||||||||
| Lisa J. Mellencamp |
(a) | 1/1/2009 | 4/28/2009 | — | $ | 130,000 | $ | 260,000 | |||||||||||
| (b) | 5/1/2009 | 4/28/2009 | 37,218 | $ | 115,826 | ||||||||||||||
| (c) | 5/1/2009 | 4/28/2009 | 111,655 | $ | 347,483 | ||||||||||||||
| 148,873 | $ | 463,309 | |||||||||||||||||
| Charles C. Ward |
(a) | 1/1/2009 | 4/28/2009 | — | $ | 168,750 | $ | 337,500 | |||||||||||
| (b) | 5/1/2009 | 4/28/2009 | 41,871 | $ | 130,307 | ||||||||||||||
| (c) | 5/1/2009 | 4/28/2009 | 167,483 | $ | 521,224 | ||||||||||||||
| 209,354 | $ | 651,531 | |||||||||||||||||
| (a) | Potential bonus payments under each named executive officer’s respective employment agreement. Actual payouts are based on individual performance and awarded at the discretion of the compensation committee after the end of the fiscal year. See “—Compensation Discussion and Analysis—Elements of Compensation—Performance-Based Bonus Awards.” |
| (b) | Issued as a one-time, inducement sign-on bonus. See “—Compensation Discussion and Analysis—Elements of Compensation—One-time, Inducement Sign-on Bonuses.” |
| (c) | Issued pursuant to the 2009 Omnibus Incentive Compensation Plan. “See “—Compensation Discussion and Analysis—Elements of Compensation—Unit-Based Compensation—2009 Omnibus Incentive Compensation Plan.” |
The following table sets forth the outstanding equity awards and their market value using the closing price of our common units at December 31, 2009 for our named executive officers:
| Outstanding Equity Awards at December 31, 2009 | |||||||
| Name |
Number of Units Not Vested |
Market Value of Units Not Vested |
Vesting Dates | ||||
| Stephen R. Brunner |
55,828 | $ | 213,821 | 50% in 1/1/2010 and 1/1/2011 | |||
| 446,619 | $ | 1,710,551 | 20% over 5 years beginning 1/1/2010 | ||||
| 502,447 | $ | 1,924,372 | |||||
| Michael B. Hiney |
32,566 | $ | 124,728 | 50% in 1/1/2010 and 1/1/2011 | |||
| 48,867 | $ | 187,161 | 20% over 5 years beginning 1/1/2010 | ||||
| 81,433 | $ | 311,889 | |||||
| Lisa J. Mellencamp |
37,218 | $ | 142,545 | 50% in 1/1/2010 and 1/1/2011 | |||
| 111,655 | $ | 427,639 | 20% over 5 years beginning 1/1/2010 | ||||
| 148,873 | $ | 570,184 | |||||
| Charles C. Ward |
41,871 | $ | 160,366 | 50% in 1/1/2010 and 1/1/2011 | |||
| 167,483 | $ | 641,460 | 20% over 5 years beginning 1/1/2010 | ||||
| 209,354 | $ | 801,826 | |||||
88
Table of Contents
Transition of the Executive Management Team to CEP
During 2009, our chief executive officer, chief operating officer, and president; chief financial officer and treasurer; and chief accounting officer and controller were transitioned from being provided by CEPM under the management services agreement to direct employees of a subsidiary of CEP. In addition, a general counsel was appointed and transitioned from being an employee of CCG. This transition was done to better align our management team with the interests of our unitholders and to increase their focus on our business operations.
As part of this transition, the compensation committee of the board of managers retained Hewitt Associates LLC (“Hewitt”) to develop and review proposed compensation structures for the named executive officers. Hewitt benchmarked compensation of the named executive officers relative to comparable positions among a peer group of 11 exploration and production companies intended to generally reflect the market in which we compete for executive talent. The primary considerations used in the selection of the peer group companies included financial, valuation and operational criteria. The peer group used to benchmark 2009 compensation for our named executive officers consisted of the following companies:
| • | Callon Petroleum Company, Carrizo Oil & Gas Inc., Delta Petroleum Corp., Edge Petroleum Corp., Goodrich Petroleum Corp., Legacy Reserves LP, McMoRan Exploration Company, Petroquest Energy, Inc., Rosetta Resources, Inc., Venoco, Inc., and Vanguard Natural Resources, LLC. |
Based on the benchmarking data, Hewitt proposed a compensation mix that included a base salary, performance-based bonus awards, long-term incentives consisting of unit-based compensation, and one-time, inducement sign-on bonuses. It also proposed that total direct compensation for the named executive officers approximate competitive market median levels with a compensation mix for 2009 heavily weighted to time based compensation, including restricted common units of CEP. The total direct compensation, as approved by the compensation committee, includes a base salary and bonus award payouts based on future performance on selected performance measures. The performance awards are intended to be correlated to the creation of value for our unitholders and should balance growth, profitability, and efficient utilization of capital resources. The 2009 performance measures corresponded to our 2009 business plan and included measures that are commonly used at other comparable E&P companies. The payout against the performance award opportunities will be made at the discretion of the compensation committee and is intended to include a threshold level of minimum acceptable performance, a target level of performance, and a maximum level of performance that reflects the achievement of superior performance. The time based compensation is intended to retain the management team and align it with the interests of the unitholders. The compensation committee did not require specific unit ownership targets for the executive officers. An explanation of our 2009 compensation actions and plans for 2010 is discussed below in the Compensation Discussion and Analysis. The overall compensation structure and plan design used in 2009 and in 2010 should promote alignment with our business strategy.
The following is a description of our formal employment agreements with our executive officers and a summary of our 2009 compensation actions related to the transition:
Employment Agreements
On May 4, 2009, we announced in a press release that we and our wholly-owned subsidiary, CEP Services Company, Inc., entered into definitive employment agreements on May 1, 2009 with:
| • | Stephen R. Brunner, the company’s President, Chief Executive Officer and Chief Operating Officer; |
| • | Charles C. Ward, the company’s Chief Financial Officer and Treasurer; |
| • | Lisa J. Mellencamp, the company’s General Counsel and Secretary; and |
| • | Michael B. Hiney, the company’s Chief Accounting Officer and Controller. |
The employment agreements supersede and terminate the employment letter agreements entered into by us with each of Messrs. Brunner, Ward and Hiney and Ms. Mellencamp on December 31, 2008.
89
Table of Contents
Pursuant to the terms of his employment agreement, Mr. Brunner will receive:
| • | a $300,000 annual base salary; |
| • | the right to participate in the 2009 Omnibus Incentive Compensation Plan, including a 2009 annual performance award under the plan that will be determined by the compensation committee of our board of managers, and that may pay up to 200% of Mr. Brunner’s base salary for 2009 for superior performance (100% for target-level performance); |
| • | a grant pursuant to a grant agreement (a “Grant Agreement”) of 431,655 notional units under the 2009 Omnibus Incentive Compensation Plan with a grant-date value of approximately $1,333,814 based on the closing price per unit on May 1, 2009, vested based on time in five equal annual installments on January 1, 2010, 2011, 2012, 2013 and 2014; and |
| • | an inducement bonus (an “Inducement Bonus”) of $450,000 cash and 53,957 restricted common units of the company with an aggregate grant-date value of approximately $166,727 based on the closing price per unit on May 1, 2009, with 50% of the total value of the Inducement Bonus vesting and becoming payable on each of January 1, 2010 and 2011. |
Pursuant to the terms of his employment agreement, Mr. Ward will receive:
| • | a $225,000 annual base salary; |
| • | the right to participate in the 2009 Omnibus Incentive Compensation Plan, including a 2009 annual performance award under the plan that will be determined by the compensation committee, and that may pay up to 150% of Mr. Ward’s base salary for 2009 for superior performance (75% for target-level performance); |
| • | a grant pursuant to a Grant Agreement of 161,871 notional units under the 2009 Omnibus Incentive Compensation Plan with a grant-date value of approximately $500,181 based on the closing price per unit on May 1, 2009, vested based on time in five equal annual installments on January 1, 2010, 2011, 2012, 2013 and 2014; and |
| • | an Inducement Bonus of $337,500 cash and 40,468 restricted common units with an aggregate grant-date value of approximately $125,046 based on the closing price per unit on May 1, 2009, with 50% of the total value of the Inducement Bonus vesting and becoming payable on each of January 1, 2010 and 2011. |
Pursuant to the terms of her employment agreement, Ms. Mellencamp will receive:
| • | a $200,000 annual base salary; |
| • | the right to participate in the 2009 Omnibus Incentive Compensation Plan, including a 2009 annual performance award under the plan that will be determined by the compensation committee, and that may pay up to 130% of Ms. Mellencamp’s base salary for 2009 for superior performance (65% for target-level performance); |
| • | a grant pursuant to a Grant Agreement of 107,914 notional units under the 2009 Omnibus Incentive Compensation Plan with a grant-date value of approximately $333,454 based on the closing price per unit on May 1, 2009, vested based on time in five equal annual installments on January 1, 2010, 2011, 2012, 2013 and 2014; and |
| • | an Inducement Bonus of $300,000 cash and 35,971 restricted common units with an aggregate grant-date value of approximately $111,150 based on the closing price per unit on May 1, 2009, with 50% of the total value of the Inducement Bonus vesting and becoming payable on each of January 1, 2010 and 2011. |
90
Table of Contents
Pursuant to the terms of his employment agreement, Mr. Hiney will receive:
| • | a $175,000 annual base salary; |
| • | the right to participate in the 2009 Omnibus Incentive Compensation Plan, including a 2009 annual performance award under the plan that will be determined by the compensation committee, and that may pay up to 80% of Mr. Hiney’s base salary for 2009 for superior performance (40% for target-level performance); |
| • | a grant pursuant to a Grant Agreement of 47,230 notional units under the 2009 Omnibus Incentive Compensation Plan with a grant-date value of approximately $145,940 based on the closing price per unit on May 1, 2009, vested based on time in five equal annual installments on January 1, 2010, 2011, 2012, 2013 and 2014; and |
| • | an Inducement Bonus of $262,500 cash and 31,475 restricted common units with an aggregate grant-date value of approximately $97,258 based on the closing price per unit on May 1, 2009, with 50% of the total value of the Inducement Bonus vesting and becoming payable on each of January 1, 2010 and 2011. |
Termination of Employment
Each executive’s employment may be terminated at any time and for any reason by either or both of the company and the executive. Except as described below, if the executive terminates his or her employment, all unvested or unearned awards (including the awards made under the Grant Agreements and the Inducement Bonus) will be forfeited.
If the executive’s employment is terminated in connection with an “Involuntary Termination” at any time prior to a change of control of the company or after two years have elapsed following a change of control, the company will, pursuant to the terms of the employment agreements, make payments and take actions as follows (such payments and actions, the “Severance Amount”):
| • | make a cash payment of (i) one and one-half times the executive’s then-current annual compensation, which includes (A) the target-level bonus plus (B) the greater of the annual base salary in effect on the date of the Involuntary Termination or the annual base salary in effect 180 days prior to the Involuntary Termination, plus (ii) any part of the Inducement Bonus not already paid; |
| • | cause any unvested awards granted under the Plan or pursuant to the Inducement Award Agreement to become immediately vested and cause any and all nonqualified deferred compensation to become immediately nonforfeitable; and |
| • | cause a continuation of medical and dental benefits for one year following the Involuntary Termination. |
If the executive’s employment is terminated (i) by the executive through the exercise of the Special Termination Option (described below) or (ii) in connection with an Involuntary Termination during the two-year period following a change of control of the company, the company will, pursuant to the terms of his or her Employment Agreement, make payments and take actions as follows (such payments and actions, the “Enhanced Severance Amount”);
| • | make a cash payment of (i) two times the executive’s then-current annual compensation, which includes (A) the target level bonus plus (B) the greater of the annual base salary in effect on the date of the Involuntary Termination, the annual base salary in effect 180 days prior to the Involuntary Termination, or the annual base salary in effect immediately prior to the change of control, plus (ii) any part of the Inducement Bonus not already paid, plus (iii) the performance award and target-based grants payable under the Plan for the then-current year, paid as if the target-level performance was achieved for the entire year, prorated based on the number of whole or partial months completed at the time of the Involuntary Termination; |
91
Table of Contents
| • | cause any unvested awards granted under the 2009 Omnibus Incentive Compensation Plan or pursuant to the Inducement Award Agreement to become immediately vested and cause any and all nonqualified deferred compensation to become immediately nonforfeitable; |
| • | cause a continuation of medical and dental benefits for one year following the change of control; and |
| • | provide for a full tax gross-up in connection with any excise tax levied on the items described in the preceding three bullets. |
The “Special Termination Option” permits each executive to terminate his or her employment at any time within the one-year period following the acquisition by Constellation or its affiliates of at least 49% of our outstanding common units.
The Severance Amount and Enhanced Severance Amount are contingent on the execution of a release of any claims the terminated executive may have against us and our affiliates. In addition, any such amounts must be repaid if a final and non-appealable judgment is entered by a court of competent jurisdiction finding that the executive’s conduct in performance of his or her duties under the employment agreement constituted willful misconduct.
The initial term of the employment agreements will expire on the third anniversary of each employment agreement unless sooner terminated in accordance with the employment agreement. If the agreements have not otherwise been terminated prior to the expiration of the initial term, the employment agreements will automatically be extended for an additional one-year period unless either party to such employment agreement delivers written notice 180 days prior to the expiration of the initial term. We guaranteed the obligations of CEP Services Company, Inc. under the employment agreements.
Grant Agreements Related to Notional Units to Executive Officers
Grants Made Under the 2009 Omnibus Incentive Compensation Plan
To further align the interests of the management team with unitholders, notional unit grants were made under the 2009 Omnibus Incentive Compensation Plan pursuant to Grant Agreements, dated May 1, 2009, by and between the company and each of Messrs. Brunner, Ward and Hiney and Ms. Mellencamp. The 2009 Omnibus Incentive Compensation Plan was adopted and approved by our board of managers on April 28, 2009, subject to approval by the company’s common unitholders. Upon approval of the plan by the common unitholders on December 1, 2009, the notional units granted to Messrs. Brunner, Ward and Hiney and Ms. Mellencamp automatically converted into the same number of restricted common units.
Distribution Equivalent Rights
Each notional unit and restricted common unit granted under the Grant Agreements carries the right to receive distribution credits when any distributions are made by us on our common units. Any distribution credits will accrue under the Grant Agreement and be settled in cash or common units in the discretion of the compensation committee on the vesting date for the underlying notional unit or restricted common unit, as applicable. Upon approval of the 2009 Omnibus Incentive Compensation Plan by the common unitholders, the accrued distribution credits on the notional units increased the number of restricted common units that are issued upon conversion of the notional units as described above.
Vesting; Forfeiture; Change of Control
The notional units and any restricted common units under the Grant Agreements will vest ratably on January 1, 2010 and the next four anniversaries of that date. The terms of the employment agreements will govern the forfeiture or accelerated vesting of the notional units and any restricted common units.
92
Table of Contents
Inducement Award Agreements With Executive Officers
The Inducement Bonuses were granted pursuant to Inducement Award Agreements entered into on May 1, 2009 by and between the company and each of Messrs. Brunner, Ward and Hiney and Ms. Mellencamp, without unitholder approval in reliance on the exemption provided in NYSE Arca rule 5.3(d)(5)(A).
Each restricted common unit granted in the Inducement Bonuses carries the right to receive distribution credits when any distributions are made on our common units. Any distribution credits will accrue under the Grant Agreement and be settled in cash or common units in the discretion of the compensation committee on the vesting date for the underlying restricted common unit. The terms of the employment agreements will govern the forfeiture or accelerated vesting of the Inducement Bonuses.
Potential Payments Upon Voluntary Termination, Involuntary Termination or Change In Control
As of December 31, 2009, we have employment agreements or contracts in place that provide for payments to the named executive officers in connection with certain voluntary or involuntary terminations of the individual or a change in control of CEP. These change of control provisions were approved by our compensation committee and were based on market data and input from Hewitt. See “Item 11. Executive Compensation—Transition of the Executive Management Team to CEP—Termination of Employment” beginning on page 91 for additional information.
The following table summarizes the value of these provisions of these employment agreements if the named executive officer is entitled to a severance amount because of an involuntary termination (including a resignation by the officer for an event of good reason thereunder) other than during a change of control as of December 31, 2009:
| Severance Amount | ||||||||||||
| Name |
Cash Value of Salary and Bonus |
Market Value of Units To Be Vested |
All Other Compensation(a) |
Total Severance | ||||||||
| Stephen R. Brunner |
$ | 1,200,000 | $ | 1,924,372 | $ | 465,713 | $ | 3,590,085 | ||||
| Michael B. Hiney |
$ | 437,500 | $ | 311,888 | $ | 269,118 | $ | 1,018,506 | ||||
| Lisa J. Mellencamp |
$ | 625,000 | $ | 570,184 | $ | 300,000 | $ | 1,495,184 | ||||
| Charles C. Ward |
$ | 759,375 | $ | 801,826 | $ | 353,213 | $ | 1,914,414 | ||||
| (a) | All Other Compensation represents the cash value of the one-time cash inducement bonus that vests 50% on January 1, 2010, and 50% on January 1, 2011, as well as, the value of medical and dental insurance for one year. |
The following table summarizes the value of these provisions of these employment agreements if the named executive officer is entitled to an enhanced severance amount because of an involuntary termination (including a resignation by the officer for an event of good reason thereunder) during a change of control period or the named executive terminates his or her employment within a one year period following the acquisition by Constellation or its affiliates of at least 49% of our outstanding common units as of December 31, 2009:
| Enhanced Severance Amount | ||||||||||||||
| Name |
Cash Value of Salary and Bonus |
Market Value of Units To Be Vested |
All Other Compensation(a) |
Excise Tax(b) | Total Enhanced Severance | |||||||||
| Stephen R. Brunner |
$ | 1,500,000 | $ | 1,924,372 | $ | 465,713 | 802,074 | $ | 4,692,159 | |||||
| Michael B. Hiney |
$ | 560,000 | $ | 311,888 | $ | 269,118 | 223,044 | $ | 1,364,050 | |||||
| Lisa J. Mellencamp |
$ | 790,000 | $ | 570,184 | $ | 300,000 | 348,314 | $ | 2,008,498 | |||||
| Charles C. Ward |
$ | 956,250 | $ | 801,826 | $ | 353,213 | 448,310 | $ | 2,559,599 | |||||
| (a) | All Other Compensation represents the cash value of the one-time inducement cash bonus that vests 50% on January 1, 2010, and 50% on January 1, 2011, as well as, the value of medical and dental insurance for one year. |
| (b) | Excise tax is calculated in accordance with IRS Regulation 1.280G-1 and using 2009 Form W-2 income from CEP Services Company, Inc. |
93
Table of Contents
Compensation Discussion and Analysis
Overview
During 2008 and 2007, we did not directly employ any of the persons responsible for managing our business. Our named executive officers were compensated by CCG under the compensation policies of Constellation. We reimbursed CEPM for a portion of the compensation paid to our executive officers by CCG pursuant to the management services agreement. Beginning January 1, 2009, we transitioned from Constellation to us the employment of those executive officers and certain other employees who provided services to our company, and we began compensating our executive officers and other employees directly.
We have a compensation committee that consists of three managers who are all independent under the independence standards established by NYSE Arca and SEC rules. The compensation committee establishes and reviews general policies related to our compensation and benefits. The compensation committee determines and approves the compensation and benefits of our Chief Executive Officer and our other executive officers. The compensation committee is authorized to retain compensation consultants at company expense and obtain any compensation surveys or reports regarding the design and implementation of compensation programs that it may find necessary in designing, implementing or administering compensation programs. The compensation committee retained Hewitt in 2010 and 2009 to assist with the compensation of our named executive officers. The amount paid to Hewitt in 2009 was less than $120,000.
Compensation Philosophy
Our compensation philosophy is founded on the guiding principles that the company’s compensation programs will be:
| • | aligned with the long-term interest of the company’s unitholders; |
| • | performance-based to motivate strong company and individual performance and reward management for achieving results; |
| • | competitive with market practices to enable the company to attract and retain management and technical talent; |
| • | flexible to optimize the value and efficiency of compensation programs; and |
| • | transparent, straightforward, and well-communicated to facilitate a strong understanding by all stakeholders, both internally and externally. |
In developing our compensation program for 2009, we also considered: 1) the necessity of transitioning and inducing our management from being employees of an affiliate of our former sponsor to being employees of our company, 2) the positioning of our company in its early life cycle to ensure that we have the necessary leadership, experience and technical skills to operate our company, and 3) the current competitive environment for oilfield executive and managerial talent.
Our compensation policies are also intended to focus the efforts of our named executive officers and our employees on the achievement of our 2009 business plan which included both operational and financial targets. We believe our compensation programs do not encourage our employees to take excessive risks to achieve larger performance-based bonus awards or additional unit-based compensation above their individual targets. We have a policy that does not allow speculative or proprietary trading of derivatives that create incentives to engage in risky activities that fall outside of our annual business plan. Actual compensation awarded to individuals is generally based on the company’s achievement of its annual business plan that was reviewed and approved by our board of managers as well as such individual’s contribution towards meeting the plan.
In setting the compensation of our named executive officers for 2009, our compensation committee analyzed the market compensation practices of a peer group of 11 exploration and production companies for each
94
Table of Contents
executive position and considered such information when setting total compensation. The peer group is intended to generally reflect the market in which we compete for executive talent. The primary considerations used in the selection of the peer group companies included financial, valuation and operational criteria. The peer group used to benchmark 2009 compensation for the named executive officers consisted of the following companies: Callon Petroleum Company; Carrizo Oil & Gas Inc.; Delta Petroleum Corp.; Edge Petroleum Corp.; Goodrich Petroleum Corp.; Legacy Reserves LP; McMoRan Exploration Company; Petroquest Energy, Inc.; Rosetta Resources, Inc.; Venoco, Inc.; and Vanguard Natural Resources, LLC. Compensation for each executive was set giving a heavy weighting to time-based compensation in the form of restricted units of our company and notional units which automatically converted to restricted units of our company when our 2009 Omnibus Incentive Compensation Plan was approved by our unitholders so as to align the management team with the interests of our unitholders. Although the compensation committee did not establish any particular benchmark as a percentile of the industry median for the particular elements of our named executives’ compensation, the committee did desire that our named executives’ total compensation be approximately in the median of the peer group. For 2009, our compensation committee set total compensation consisting of base salary, performance-based cash bonus awards (assuming a target performance bonus award), and long-term incentives consisting of unit-based compensation at approximately 10% to 20% below the peer group median based on the benchmarking data developed for each of the named executive officers. As a one-time incentive to induce the named executive officers to become our employees and to provide a retention incentive, the compensation committee also awarded each named executive a one-time inducement sign-on bonus, vesting 50% on each of January 1, 2010 and 2011. With the addition of the inducement bonus, the total compensation of the named executive officers for 2009 is generally just above the median of the peer group.
Elements of Compensation
With the help of our compensation consultant, we have developed a compensation mix that includes a base salary, performance-based cash bonus awards, long-term incentives consisting of unit-based compensation, and one-time, inducement sign-on bonuses. Our compensation committee annually reviews and approves the compensation paid to our non-employee managers, executive officers, and employees. The committee approves our annual salary budgets, including increases to base pay, and approves our annual performance-based bonus award pool and long-term incentive equity award pool for all employees. The base salaries, performance-based bonus awards and long-term incentive equity awards for the executive officers, other than the chief executive officer, are proposed to the compensation committee by our chief executive officer; the compensation recommendations for the chief executive officer are developed by the compensation committee. The compensation committee, in its discretion, makes the final determination about the amount of each executive officer’s compensation using comparative market data, the level of achievement of our annual business plans, our performance against our peer group, individual executive officer performance, scope of job responsibilities, and the individual’s industry experience, technical skills and tenure.
The following is a discussion of the major components of our compensation program:
Base Salary
Our base salaries are intended to provide an assured base level of sufficient cash compensation to motivate our executives and employees. Base salaries are reviewed annually with adjustments made based on market conditions, individual performance, and internal equity considerations. The increase in the base salary pool for 2009 approved by the compensation committee for our employees was approximately 5% above our base salary pool for 2008, excluding our named executive officers and any other new employees hired by us in 2009. This increase in the base salary pool for 2009 was lower than comparable market data suggested was the industry median for an increase from 2008 to 2009. The actual base salary increases that were awarded were based on individual performance and contribution to the achievement of our annual business plans. For our new non-management employees hired by us in 2009, base salaries were set at market levels. With respect to our named executive officers, in January 2009, we executed employment agreements with them and our compensation committee set their base salaries after considering Hewitt’s input and market data based on our
95
Table of Contents
exploration and production industry peers. See “—Transition of the Executive Management Team to CEP—Employment Agreements” above. The primary considerations used to select the peer group companies included financial, valuation and operational criteria. For our executive officers, the actual base salaries set for 2009 generally were set below the 25th percentile with respect to Mr. Brunner and Ms. Mellencamp, just above the 25th percentile for Mr. Ward, and between the 25th and 50th percentiles for Mr. Hiney of the peer group industry median according to the Hewitt survey.
For 2010, in light of market conditions and our desire to minimize expenses to provide for additional funds to reduce our outstanding debt level, the compensation committee determined it would be appropriate to freeze base salaries at the 2009 levels for our named executive officers and all employees except for salary increases related to promotions.
Performance-Based Bonus Awards
We maintain a performance-based annual bonus award program covering all of our employees, including our named executive officers. The goal of our performance-based bonus award program is to motivate and reward both financial and operational contributions to the achievement of our annual business plan. Our annual business plans are reviewed and approved by our board of managers. Our compensation committee establishes the annual performance-based bonus award pool at the end of the year after reviewing the company’s performance during the year. Each employee’s bonus opportunity is generally specified as percentage of his or her base salary. The annual bonus opportunity for our named executive officers is included in their employment agreements. Any cash performance-based awards are paid in March of the following year after the compensation committee has reviewed our company performance against our annual business plan and after the committee has approved the recommended level of performance-based awards.
The compensation committee specifically reviews and approves the bonus awards for our named executive officers. The compensation committee believes that cash-based performance awards motivate and reward for achievement of performance objectives, and also support a total compensation program that is competitive within our industry. The target and maximum bonus opportunities for our named executive officers are included in their employment agreements and were based on Hewitt’s input and market data. See “—Transition of the Executive Management Team to CEP—Employment Agreements” above. The target bonus opportunities (as a percentage of base salary) were generally set at the median of the respective peer group benchmarks. The compensation committee has complete discretion about the amount of performance-based bonus awards that is paid to each of our named executive officers, subject to the maximums contained in their respective employment agreements.
The compensation committee reviewed and approved our performance-based annual bonus awards for our employees generally at their respective 2009 target levels, subject to individual performance measures, which we plan to pay in March 2010. In recognition of 2009 performance, the compensation committee approved the performance-based awards for our named executive officers at the target levels specified in their employment agreements, which are 100% of base salary (or $300,000) for Mr. Brunner, 75% of base salary (or $168,750) for Mr. Ward, 65% of base salary (or $130,000) for Ms. Mellencamp, and 40% of base salary (or $70,000) for Mr. Hiney. These payouts are based, in the compensation committee’s discretion and business judgment, upon satisfactory achievement of our 2009 business plan goals, including those relating to production, operating expenses, drilling capital efficiency, debt reduction, and transitioning employees and services from being provided by CEPM under the management services agreement to CEP. In addition, the compensation committee considered the individual performance of the named executive officers toward achievement of our 2009 business plan in establishing the amount of their performance-based awards. For Mr. Brunner, the compensation committee considered his implementation of our company strategy, his implementation of reduced support by the company from Constellation to become a stand-alone entity, and his ability to stabilize and improve operations execution, risk management and financial performance; for Mr. Ward, the compensation committee considered his ability to transition all investor relations functions from Constellation to the company and his ability to manage borrowing base redeterminations and diversify the bank syndicate under our reserve-based credit facility,
96
Table of Contents
as well as his implementation of a risk management plan for us; for Ms. Mellencamp, the committee considered her support in organizing company records and separating them from Constellation, her additional responsibilities of supervising environmental, health and safety matters, her completion and distribution of safety manuals to employees, and her continuing education of management about SEC disclosure changes, trends and best practices; and for Mr. Hiney, the compensation committee considered his transition of accounting and tax management services functions from Constellation to the company and his management of costs for administrative functions, as well as his development and motivation of accounting and treasury staff.
For 2010, we expect that the compensation committee will continue to set the performance-based bonus award opportunities for our named executive officers and other employees, as specified as a percentage of his or her base salary, at the same levels as 2009. On February 16, 2010, our board of managers approved our 2010 business plan, which is further discussed in Outlook on page 73. Consistent with prior practice, the compensation committee will exercise its discretion and measure any 2010 performance-based bonus awards to be paid in March 2011 against this business plan, including those related to production, operating expense, drilling capital efficiency, debt reduction and net asset value, as well as individual performance of the named executive officers in carrying out our business plan during 2010.
Unit-Based Compensation
We maintain unit-based compensation programs to encourage our non-employee managers, named executive officers, key employees, and consultants to focus on our long-term performance and to provide an opportunity for these individuals to increase their stake in the company through awards, including unit and unit-based grants, that typically vest over a three-year to five-year time period for employees and over a one-year period for our non-employee managers. These long-term unit-based compensation programs provide incentive awards for such individuals to exert maximum efforts for our success. They benefit the company by enhancing the link between the creation of unitholder value and long-term executive incentive compensation, by providing an opportunity for increased equity ownership, which fosters retention, and assisting in maintaining competitive levels of total compensation. We believe that the recipients develop a sense of ownership and personal involvement in the development and financial success of our business and that unit-based compensation encourages them to remain with and devote their best interests to the business of the company, and in doing so, advance the interests of the company and our unitholders. Perhaps most importantly, any awards made to our non-employee managers, officers, employees and consultants under the unit-based compensation plans may be structured so as to be settled in common units as opposed to cash in an effort to conserve the amount of available cash or future cash flow from operations to fund our ongoing operations and to pay cash distributions to our unitholders.
In April 2009, our board of managers adopted the 2009 Omnibus Incentive Compensation Plan containing 1,650,000 common units; our unitholders approved the plan in December 2009. This plan is intended to provide an incentive to our non-employee managers, named executive officers, key employees, and consultants. Pursuant to the terms of their respective employment agreements, the compensation committee awarded 431,655, 161,871, 47,320 and 107,914 units under this plan to Messrs. Brunner, Ward and Hiney and Ms. Mellencamp, respectively, which vest over a five-year time period. These unit awards were awarded to our named executive officers in the compensation committee’s discretion to heavily weight their compensation package to unit-based compensation to align the executives with the long-term interest of the company’s unitholders, to provide a retention incentive for these officers, and to provide a more competitive total compensation package when combined with the base salaries and cash bonus performance awards to be paid to the officers. Of the total base salary, target performance-based bonus award, and unit-based compensation for each named executive officer for 2009, approximately 80% of the total is time-based over a five-year time period to provide a retention incentive for the officers, provide a substantial portion of their compensation in units instead of cash, and provide alignment with our unitholders.
For 2010, we expect to grant the units remaining under our Long-Term Incentive Plan and our 2009 Omnibus Incentive Compensation Plan to our non-employee managers, named executive officers, and employees, vesting over a three-year to five-year time period for employees and over a one-year period for our
97
Table of Contents
non-employee managers. Grants of unit-based compensation have not yet been determined by our compensation committee for our named executive officers in 2010, provided that we expect that such officers will not be granted units of a value greater than the value granted to them in 2009 at the time of such grants, vesting over a five-year time period.
Below is a summary of our unit-based compensation programs:
Long-Term Incentive Program
At our initial public offering, we adopted a Long-Term Incentive Plan. This plan is intended to provide an incentive to our named non-employee managers, executive officers, key employees, and consultants. We intend for this plan to align the interests of those receiving grants with the interests of our unitholders. This incentive program is expected to promote the growth of our business through the efficient development drilling of wells on our proved undeveloped and unproved locations and improved operational performance. We expect that these grants will retain key field employees that came to CEP in four separate acquisitions, to build loyalty, and to encourage alignment of individual performance with our annual business plan. During 2009, 2008 and 2007, grants of restricted common units were made to certain key field employees of our company. All of these grants vest ratably over a three-year period. During 2008 and 2007, grants of restricted common units were also made to our non-employee managers. All of these grants vested over a one-year period. The Long-Term Incentive Plan contains 450,000 common units, of which 199,401 units have been granted and 250,599 remain available for future grants. We expect to make additional grants to our non-employee managers, named executive officers, and other employees in March 2010 which will use the remaining available units under this plan.
2009 Omnibus Incentive Compensation Plan
The 2009 Omnibus Incentive Compensation Plan containing 1,650,000 common units was adopted and approved by our board of managers on April 28, 2009, and approved by our common unitholders on December 1, 2009. This plan is intended to provide an incentive to our non-employee managers, executive officers, key employees, and consultants. We intend for this plan to align the interests of those receiving grants with the interests of our unitholders. We expect that any grants made under this program will align the interests of our named executive officers, any key former CCG employees transitioned to CEP or any new employees required to replace resources previously provided under the management services agreement with the interests of our unitholders. The 2009 Omnibus Incentive Compensation Plan contains 1,650,000 common units, of which 1,110,488 units and distribution credits potentially settled in restricted common units have been granted and 539,512 remain available for future grants. We expect to make additional grants non-employee managers, named executive officers, and other employees in March 2010 which will use the remaining available units under this plan.
One-time, Inducement Sign-on Bonuses
In order to encourage CCG employees to transition to CEP, we adopted a one-time, inducement sign-on bonus program that was paid to our executives in a combination of approximately 75% in cash and approximately 25% in unit-based compensation, as well as to certain other key employees in cash. The inducement bonuses vest 50% on the first anniversary of employment and 50% on the second anniversary of employment. In the event of a voluntary termination prior to the vesting dates, the unvested portion of the award is forfeited provided that the named executives’ employment agreement governs this event. These inducement bonuses are intended to encourage retention and to provide a bridge from CCG’s compensation policies to those of CEP and were a key part of the effort to transition the remaining employees and services being provided by CEPM under the management services agreement to us. For our named executive officers, the inducement bonus was also intended to bring their total compensation to just above the 50th percentile of the peer group industry median according to the Hewitt survey for each of 2009 and 2010. Without the inducement awards, their total compensation, assuming a target performance bonus award, would have been from approximately 10% to 20% below the peer group industry median according to the Hewitt survey. The unit-based component of the inducement bonuses for our named executive officers was also intended to align management with the interest of
98
Table of Contents
our unitholders. Messrs. Brunner, Ward and Hiney and Ms. Mellencamp received cash and unit inducement awards in an aggregate amount of $616,727, $462,546, $359,758, and $411,150, respectively (based on the grant date fair value of the unit awards). The amount of the awards was based on the committee’s discretion of an appropriate amount and represented approximately 200% of their annual base salary.
Below is a summary of our Executive Inducement Bonus Program:
Executive Inducement Bonus Program
An Executive Inducement Bonus Program was adopted and approved by our board of managers on April 28, 2009. The plan was created without unitholder approval in reliance on the exemption provided in NYSE Arca rule 5.3(d)(5)(A). On May 7, 2009, we filed a registration statement with the SEC on Form S-8 for 300,000 common units associated with grants under this program made to our executives. After initial grants were made, the only additional common units that can be issued under this program are for distribution rights in connection with distribution credits. The Executive Inducement Bonus Program contains 300,000 common units, of which 167,783 units and distribution credits potentially settled in restricted common units have been granted and 132,517 remain available for future grants. These units are the unit-based component of the one-time inducement bonuses for our named executive officers described above. We do not expect to issue any additional units or distribution credits under this program, and after the vesting that occurs on January 1, 2011, we intend to cancel any of the 132,517 remaining units or any units forfeited under this program.
Other Compensation Policies
Clawback Provisions
The employment contracts with four of our named executive officers contain clawback provisions. In the event of a restatement of our financial statements that are filed with the SEC, our executives must refund the amounts actually paid by us for the performance-based bonus award for the two years immediately prior to such restatement that exceed the amounts that the committee determines, in its discretion, should have been paid for those two years based on the financial results reflected in the restated financial statements. In the event there has been a final and non-appealable judgment entered by a court of competent jurisdiction that found willful misconduct by an executive in the performance of their duties prior to the termination of their employment, all payments made in the event of a voluntary or involuntary termination must be refunded.
Perquisites
The compensation committee has not approved any perquisites for our named executive officers.
Company Benefits
Our named executive officers are eligible to participate in company benefit plans such as medical, dental, life, and disability insurance, 401k and flexible spending accounts.
Unit Ownership Requirements
The compensation committee did not require specific unit ownership targets for our named executive officers.
Compensation of Managers
Officers or employees of Constellation and its affiliates who also serve as members of our board of managers do not receive additional compensation for serving as our managers. Each manager will be indemnified by us for actions associated with being a manager to the full extent permitted under Delaware law.
99
Table of Contents
In 2007, our compensation committee retained Towers Perrin to benchmark our independent managers’ mix of compensation and amount of each element of compensation to the outside director compensation of various peer groups. Towers Perrin performed the benchmark study using the following benchmark groups:
| • | a peer group of 10 exploration and production companies, consisting of the following: Clayton Williams Energy Inc., Edge Petroleum Corp., Exploration Company of Delaware Inc., Gasco Energy Inc., GMX Resources Inc., Harvest Natural Resources Inc., McMoRan Exploration Co., Panhandle Oil and Gas Inc., Petroquest Energy Inc. and VAALCO Energy Inc.; |
| • | a general industry group of 326 publicly-traded companies with market capitalizations between $350 million and $1 billion; and |
| • | a peer group of 5 limited partnerships, consisting of the following: Atlas Energy Resources LLC, Copano Energy LLC, Crosstex Energy LP, Linn Energy LLC and Regency Energy Partners LP. Towers Perrin noted in its report that the companies in this peer group varied significantly in size. |
Towers Perrin reported the results of its benchmarking study to the chairman of the committee, who shared the results with the other committee members.
Our board of managers, based on recommendations from our compensation committee and the Towers Perrin report, has approved the following non-employee manager unit-based compensation program:
| • | Each non-employee manager will receive an annual restricted common unit award with a value of $75,000, to be granted as follows: |
| • | for the year 2007, granted as of September 14, 2007, such award vested on March 1, 2008; and |
| • | for every year after 2007, to be granted as of March 1 of each year, such award to have a one-year vesting period and to be forfeited on a pro-rata basis if service as a manager terminates prior to the one-year vesting period. |
The number of restricted common units granted to each non-employee manager is computed based on the date of the grant as determined by the compensation committee, rounded to the nearest unit. Distributions on the restricted common units are made at the time such distributions are made to other holders of common units.
Our board of managers, based on recommendations from our compensation committee and the Towers Perrin report, has approved the following individual non-employee manager annual cash compensation program:
| • | $40,000 annual retainer; |
| • | the chairman of the audit committee will receive a $10,000 annual retainer; |
| • | $2,500 fee for each meeting of the board of managers and each committee meeting attended that occurs on a day when there is no board meeting; and |
| • | reasonable travel expenses to attend meetings. |
The following table sets forth a summary of the 2009 manager compensation, as determined by our board of managers:
| Manager Compensation | ||||||||||||
| Name |
Fees Earned or Paid in Cash |
Units Awards(1) |
All Other Compensation(2) |
Total | ||||||||
| Richard H. Bachmann |
$ | 80,000 | $ | 86,871 | $ | 477 | $ | 167,348 | ||||
| Richard S. Langdon |
$ | 90,000 | $ | 86,871 | $ | 477 | $ | 177,348 | ||||
| John N. Seitz |
$ | 80,000 | $ | 86,871 | $ | 477 | $ | 167,348 | ||||
| (1) | Represents the grant date (May 1, 2009) fair value of each manager’s unit-based compensation award and the grant date (May 14, 2009) fair value of the distribution credits associated with the 2009 award calculated in accordance with FASB ASC Topic 718. At December 31, 2009, each of Messrs. Bachmann, Langdon, and Seitz had 27,914 outstanding unvested restricted common units. These awards vest in March 2010. |
| (2) | All other compensation represents distributions received on unvested restricted common units. |
100
Table of Contents
In 2010, the independent managers have received the same compensation package except that each of their $75,000 incentive unit awards is expected to be a restricted common unit grant made under the 2009 Omnibus Incentive Compensation Plan as of March 1, 2010, with the grant amount being computed based on the average of the closing price of our common units on the NYSE Arca for the 20 trading days prior to the date of grant, rounded to the nearest unit.
Compensation Committee Interlocks and Insider Participation
During 2009, 2008 and 2007, none of our executive officers serves as a member of the board of directors or compensation committee of any entity that has one or more of its executive officers serving as a member of our board of managers or compensation committee.
Compensation Committee Report
The compensation committee of the board of managers has reviewed and discussed the Compensation Discussion and Analysis beginning on page 94 with management. Based on such review and discussions, the compensation committee recommended to the board of managers that the Compensation Discussion and Analysis be included in this Annual Report on Form 10-K.
John N. Seitz, Chairman
Richard H. Bachmann
Richard S. Langdon
| Item 12. | Security Ownership of Certain Beneficial Owners and Management and Related Unitholder Matters |
The following table sets forth the beneficial ownership of our units held by:
| • | each unitholder who is a beneficial owner of more than 5% of our outstanding units; |
| • | each of our managers and named executive officers; and |
| • | our managers and executive officers as a group. |
The amounts and percentage of common units and Class A units beneficially owned are reported on the basis of the SEC rules governing the determination of beneficial ownership of securities. Under the SEC rules, a person is deemed to be a “beneficial owner” of a security if that person has or shares “voting power,” which includes the power to vote or to direct the voting of such security, and/or “investment power,” which includes the power to dispose of or to direct the disposition of such security. A person is also deemed to be a beneficial owner of any securities of which that person has a right to acquire beneficial ownership within 60 days. Under these rules, more than one person may be deemed a beneficial owner of the same securities and a person may be deemed a beneficial owner of securities as to which he has no economic interest.
101
Table of Contents
Percentage of total units beneficially owned is based on 23,316,478 common units and 475,846 Class A units outstanding. Except as indicated by footnote, to our knowledge the persons named in the table below have sole voting and investment power with respect to all units shown as beneficially owned by them, subject to community property laws where applicable. The address of all of our managers and executive officers is c/o Constellation Energy Partners LLC, 1801 Main Street, Houston, Texas 77002. Ownership amounts are as of February 24, 2010.
| Common Units Beneficially Owned |
Class A Units Beneficially Owned |
Percentage of Total Units Beneficially Owned |
|||||||||||
| Name of Beneficial Owner |
Number | Percentage | Number | Percentage | Percentage | ||||||||
| Constellation Energy Group, Inc.(1) |
5,918,894 | 25.3 | % | 475,846 | 100 | % | 26.9 | % | |||||
| Constellation Energy Partners Holdings, LLC(2) |
5,918,894 | 25.3 | % | 475,846 | 100 | % | 26.9 | % | |||||
| Constellation Energy Partners Management, LLC(3) |
— | — | 475,846 | 100 | % | 2.0 | % | ||||||
| Morgan Stanley(4) |
1,283,886 | 5.5 | % | — | — | 5.4 | % | ||||||
| Richard H. Bachmann(5) |
36,428 | * | — | — | * | ||||||||
| Stephen R. Brunner |
506,305 | 2.2 | % | — | — | 2.1 | % | ||||||
| John R. Collins |
— | — | — | — | — | ||||||||
| Michael B. Hiney |
72,193 | * | * | ||||||||||
| Richard S. Langdon |
32,428 | * | — | — | * | ||||||||
| Lisa J. Mellencamp |
133,652 | * | * | ||||||||||
| John N. Seitz |
32,428 | * | — | — | * | ||||||||
| Charles C. Ward |
221,233 | * | — | — | * | ||||||||
| All managers and executive officers as a group (8 persons) |
1,034,667 | 4.4 | % | — | — | 4.3 | % | ||||||
| * | Less than 1% |
| (1) | Constellation Energy Group, Inc., through its direct and indirect ownership of Constellation Enterprises, Inc., Constellation Holdings, Inc. and Constellation Power Source Holdings, Inc., is the ultimate parent company of Constellation Energy Partners Holdings, LLC and Constellation Energy Partners Management, LLC and may, therefore, be deemed to beneficially own the Common Units held by Constellation Energy Partners Holdings, LLC and the Class A units held by Constellation Energy Partners Management, LLC. The address of Constellation Energy Group, Inc. is 100 Constellation Way, Baltimore, MD 21202. |
| (2) | Constellation Energy Partners Holdings, LLC is the parent company of Constellation Energy Partners Management, LLC and may, therefore, be deemed to beneficially own the Class A units held by Constellation Energy Partners Management, LLC. The address of Constellation Energy Partners Holdings, LLC is 100 Constellation Way, Baltimore, MD 21202. |
| (3) | The address of Constellation Energy Partners Management, LLC is 100 Constellation Way, Baltimore, MD 21202. |
| (4) | Ownership data as reported on Schedule 13G/A filed on February 12, 2010, by Morgan Stanley and Morgan Stanley Strategic Investments, Inc. The address of Morgan Stanley is 1585 Broadway, New York, New York, 10036. The filing lists sole voting power of 1,253,290 common units and shared voting power of 20,350 common units for a total sole dispositive power of 1,283,886 common units. |
| (5) | Ownership data as reported on Form 4/A filed February 24, 2010. |
102
Table of Contents
Equity Compensation Plan Information
Equity Compensation Plan Information
The following table reflects our equity compensation plan information for our Long-Term Incentive Plan, our 2009 Omnibus Incentive Compensation Plan, and our Executive Inducement Bonus Program as of December 31, 2009:
| Number of securities to be issued upon exercise of outstanding options, warrants, and rights |
Weighted-average exercise price of outstanding options, warrants, and rights |
Number of securities remaining available for future issuance under equity compensation plans |
||||||
| Plan Category |
||||||||
| Equity compensation plans approved by security holders |
— | $ | — | 790,110 | (1) | |||
| Equity compensation plans not approved by security holders |
— | $ | — | 132,517 | ||||
| Total |
— | $ | — | 922,627 | ||||
| (1) | As of February 24, 2010, the number of securities remaining available for future issuance under our Long-Term Incentive Plan as was 250,599, and the number of securities remaining available for future issuance under our 2009 Omnibus Incentive Plan was 539,512. |
Each of these unit-based compensation programs are further discussed in Compensation Discussion and Analysis.
Item 13. Certain Relationships and Related Transactions, and Manager Independence
Constellation owns a significant number of our units. As of February 24, 2010, CEPM owns all 476,950 of our Class A units, and all of the management incentive interests; Constellation Energy Partners Holdings, LLC, or CEPH, owns 5,918,894 common units; and Constellation Holdings, Inc., or CHI, owns all of our Class D interests. Each of CEPM, CEPH and CHI is a wholly owned subsidiary of Constellation. As discussed in “Committees of the Board of Managers—Conflicts Committee”, either our board of managers or the board’s conflicts committee reviews all related person transactions.
Our board of managers has established a conflicts committee to review specific matters that the board believes may involve conflicts of interest, including transactions with related persons such as Constellation or its affiliates. The conflicts committee determines if the resolution of the conflict of interest is fair and reasonable to our company. Our limited liability company agreement provides that members of the conflicts committee may not be officers or employees of our company, or directors, officers or employees of any of our affiliates, and must meet the independence standards for service on an audit committee of a board of directors as established by NYSE Arca and SEC rules. Any matters approved by the conflicts committee will be conclusively deemed to be fair and reasonable to our company and approved by all of our unitholders. For 2009, all related party transactions with Constellation or its affiliates were reviewed by the conflicts committee. However, the board is not required by the terms of our limited liability company agreement to submit the resolution of a potential conflict of interest to the conflicts committee, and may itself resolve such conflict of interest if the board determines that (i) the terms of the related person transaction are no less favorable to us that those generally being provided to or available from unrelated third parties or (ii) the transaction is fair and reasonable to us, taking into account the totality of the relationships between the parties involved. Any matters approved by the board in this manner will be deemed approved by all of our unitholders.
103
Table of Contents
Distributions and Payments to Constellation Entities
The following summarizes the distributions and payments made or to be made by us to Constellation and its subsidiaries, including CCG, CEPH, CHI and CEPM in connection with our ongoing operation and any liquidation of us.
Distributions of available cash to CEPM and CEPH
We generally make cash distributions 98% to common unitholders, including CEPH, and 2% to CEPM in respect of its Class A units. In addition, if distributions exceed the Target Distribution (as defined in our limited liability company agreement) and certain other requirements are met, CEPM will be entitled in respect of its management incentive interests to 15% of distributions above the Target Distribution. For year ended December 31, 2009, none of these applicable requirements have been met, and, as a result, CEPM was not entitled to receive any management incentive interest distributions. During 2009, CEPM received distributions of approximately $0.1 million on its Class A units and CEPH received a distribution of approximately $1.5 million on its common units.
Distributions to CHI
For each full calendar quarter during the period commencing January 1, 2007 and ending on December 31, 2012 that the sharing arrangement in respect of the calculation of amounts payable to Torch Energy Royalty Trust for the non-operating net profits interest remains in effect, we will distribute to CHI, in respect of its Class D interests, approximately $0.3 million, as a partial return of the $8.0 million capital contribution made for the Class D interests, which payment will be made concurrently with the quarterly cash distribution to our common and Class A unitholders for that quarter. Unless the special distribution right has been terminated earlier, the Class D interests will be cancelled upon the payment of the final distribution of approximately $0.3 million to CHI for the quarter ending December 31, 2012. If the amounts payable by us to the Trust are not calculated based on the sharing arrangement through December 31, 2012, unless such change is approved in advance by our board of managers and our conflicts committee, the special distribution right for future quarters will terminate. In the case of such early termination, CHI will only have the right under specific circumstances upon our liquidation to receive the unpaid portion of the $8.0 million capital contribution that has not then been distributed to CHI in such special distributions. If the special distribution right is terminated during a quarter, the special distribution in respect of the Class D interests will be prorated for that quarter based upon the ratio of the number of days in such quarter prior to the effective date of such termination to 90.
In connection with the initiation of certain legal proceedings involving the Trust, during 2009 and 2008 the special quarterly cash distributions with respect to the Class D interests totaling approximately $2.3 million were suspended for the three month periods ended September 30, June 30, March 31, 2009, and December 31, September 30, June 30, and March 31, 2008. Since our initial public offering, distributions of approximately $1.3 million have been paid to CHI, as holder of the Class D interests.
Payments to CEPM
Each quarter until the management services agreement was terminated on December 15, 2009, CEPM charged us an amount for services provided to us. This amount was agreed to annually and included a portion of the compensation paid by CEPM and its affiliates to personnel who spend time on our business and affairs. Prior to January 1, 2009, the allocation of compensation expense for our chief executive officer, chief financial officer and chief accounting officer was fixed by agreement between the parties. Until December 15, 2009, the allocation of compensation expense for other personnel of CEPM and its affiliates was determined based on the percentage of time spent by such personnel on our business and affairs. The conflicts committee of our board of managers reviewed at least annually the services provided by CEPM and the costs charged to us under the management services agreement and reviewed the cost allocation quarterly. The conflicts committee also
104
Table of Contents
determined if the amounts to be paid by us for the services performed were fair to and in our best interests. During the year, the cost allocation were adjusted upwards to reflect additional services provided by CEPM and its affiliates or downwards to reflect the transition of services to our employees. The costs charged to us under the management services agreement may have been be greater or less than the actual costs we would have incurred if the services were performed by an unaffiliated third party. For the year ended December 31, 2009, 2008, and 2007, approximately $1.4 million, $2.9 million and $1.4 million in costs were incurred under this agreement, respectively.
Conversion of Class A units and management incentive interests
Generally, if the common unitholders vote to eliminate the special voting rights of the holder of our Class A units, the Class A units will be converted into common units on a one-for-one basis and CEPM will have the right to elect to convert its management incentive interests into common units at fair market value. Should CEPM’s Class A units and its management incentive interests convert into common units, CEPM will receive cash distributions on its common units.
Liquidation
Upon our liquidation, the unitholders, including CEPH, as a common unitholder, CEPM, as the holder of the Class A units and CHI, as the holder of our Class D interests that are then outstanding, will be entitled to receive liquidating distributions according to their respective capital account balances.
Omnibus Agreement
At the closing of our initial public offering in November 2006, we entered into an omnibus agreement with CCG. Under the omnibus agreement, CCG indemnified us against certain liabilities relating to:
| • | for a period of six years and 30 days after our initial public offering, any of our income tax liabilities, or any income tax liability attributable to our operation of our properties, in each case relating to periods prior to the closing of our initial public offering; |
| • | legal actions pending against Constellation or us at the time of our initial public offering; |
| • | events and conditions associated with the ownership by Constellation or its affiliates of the undivided mineral interest in certain of our properties in the Robinson’s Bend Field for depths generally below 100 feet below the base of the lowest producing coal seam; and |
| • | for a period of one year after our initial public offering, any miscalculation in the amount payable to the Trust in respect of the NPI for any period prior to the initial public offering, provided (i) that such miscalculation relates to amount(s) payable no more than four years prior to our initial public offering and (ii) the aggregate amount payable by CCG pursuant to this bullet point does not exceed $0.5 million. |
We have made a claim under the Omnibus Agreement to CCG as a result of the litigation with respect to the Torch NPI calculation for periods prior to our initial public offering. See “Torch Royalty NPI” beginning on page 16 for additional information.
105
Table of Contents
Management Services Agreement
In connection with our initial public offering, we entered into a management services agreement with CEPM. This agreement has been terminated effective December 15, 2009. Under this management services agreement, we could request that CEPM or its designee provide legal, accounting, audit, tax, financial and risk management services. Upon our request, CEPM could also provide us with engineering, geological, geophysical, property management and project management services. CEPM could also provide us with acquisition services upon our request, but was not obligated to do so. As a result, CEPM had no commitment to offer us any particular assets, whether from CEPM or its other affiliates or a third party. We do not expect CEPM or any of its affiliates to provide us with any services or support in the future.
Reimbursement of Costs
Subject to the arrangements relating to acquisition services described above and as discussed further in Distributions and Payments to CCG, CEPH, CHI and CEPM—Payments to CEPM, CEPM was entitled to be reimbursed on a quarterly basis for all supervisory and management costs incurred by it in performing services for us. These costs and expenses were deducted from cash available for distribution to our unitholders. For 2009, 2008 and 2007, these costs were approximately $1.4 million, $2.9 million and $1.4 million, respectively.
Review by Our Board of Managers
Our board of managers regularly evaluated CEPM’s performance under the management services agreement during the time it was in effect.
Competition
None of CEPM, Constellation, CCG or any of their affiliates are restricted from competing with us. CEPM, Constellation, CCG and any of their affiliates may acquire or dispose of any assets, including, among other things, oil and natural gas exploration and production properties or its investment in CEP, in the future without any obligation to offer us the opportunity to purchase those assets.
Trademark License
In connection with our initial public offering, Constellation granted a limited license to us for the use of certain trademarks in connection with our business. The license will terminate upon the elimination of the right of the holder or holders of our Class A units to elect the Class A managers pursuant to our limited liability company agreement. Constellation will indemnify us from any third-party claims alleging trademark infringement that may arise out of our use of the Constellation trademarks under the license.
Credit Support Fee Agreements
In connection with certain of our acquisitions, Constellation entered into credit support agreements with us to provide guarantees to three banks that required credit support for certain financial derivatives. These guarantees were obtained because we did not own the assets at the time the derivatives were entered into and we could not use our existing reserve-based credit facility to provide collateral for the derivative transactions.
| • | In February 2008, in connection with the CoLa Acquisition, we entered into a credit support fee agreement with Constellation under which Constellation guaranteed credit support up to $8.5 million for certain financial derivatives that we entered into with BNP Paribas (“BNP”) and Societe Generale (“SocGen”). These guarantees have been released. |
| • | In August 2007, in connection with the Newfield acquisition, we entered into a credit support fee agreement with Constellation under which Constellation guaranteed credit support up to $10.0 million for certain financial derivatives that we entered into with BNP. This guarantee has been released. |
106
Table of Contents
| • | In July 2007, in connection with the Amvest acquisition, we entered into a credit support fee agreement with Constellation under which Constellation guaranteed credit support up to $15.0 million for certain financial derivatives that we entered into with BNP. This guarantee has been released. |
| • | In March 2007, in connection with the EnergyQuest acquisition, we entered into a credit support fee agreement with Constellation under which Constellation guaranteed credit support up to $11.5 million for certain financial derivatives that we entered into with BNP. This guarantee has been released. |
| • | In March 2007, in connection with the EnergyQuest acquisition, we entered into a credit support fee agreement with Constellation under which Constellation guaranteed credit support up to $25 million for certain financial derivatives that we entered into with The Royal Bank of Scotland plc (“RBS”). This guarantee has been released. |
We paid Constellation $0.8 million for the credit support described above. We do not expect Constellation to provide us with any future credit support.
Board Independence
Refer to “Item 10. Managers, Executive Officers and Corporate Governance” for a discussion of our board of managers.
Item 14. Principal Accountant Fees and Services
We engaged our principal accountant, PricewaterhouseCoopers LLP to audit our financial statements and perform other professional services for the fiscal years ended December 31, 2009 and 2008.
Audit Fees. The aggregate fees billed for the financial statement audit or services provided in connection with statutory or regulatory filings for the years ending 2009 and 2008 were $932,484 and $1,009,500, respectively.
Audit-Related Fees. The aggregate audit-related fees billed by PricewaterhouseCoopers for the years ending 2009 and 2008 were $11,100 and $0, respectively. These fees related to consents for registration statements.
Tax Fees. The aggregate fees related to the preparation of K-1 statements for the years ending 2009 and 2008 were $466,147 and $467,017, respectively.
All Other Fees. There were no other fees billed by our principal accountant for the years ending 2009 and 2008 for services other than those described above.
Audit Committee Pre-Approval Policies and Practices
Our audit committee must pre-approve any audit and permissible non-audit services performed by our independent registered public accounting firm. Additionally, the audit committee has oversight responsibility to ensure the independent registered public accounting firm is not engaged to perform certain enumerated non-audit services, including but not limited to bookkeeping, financial information system design and implementation, appraisal or valuation services, internal audit outsourcing services and legal services. The audit committee has adopted an audit and non-audit services pre-approval policy, which sets forth the procedures and the conditions pursuant to which services proposed to be performed by the independent registered public accounting firm must be approved. Pursuant to the policy, all services must be reviewed and approved and the chairman of the audit committee has been delegated the authority to specifically pre-approve services, which pre-approval is subsequently reviewed with the committee.
107
Table of Contents
PART IV
Item 15. Exhibits and Financial Statement Schedules
(a) The following documents are filed as a part of this Annual Report on Form 10-K:
1. Financial Statements:
Reports of Independent Registered Public Accounting Firm dated February 24, 2010 of PricewaterhouseCoopers LLP
Consolidated Statements of Operations and Comprehensive Income (Loss)—Constellation Energy Partners LLC for the three years ended December 31, 2009
Consolidated Balance Sheets—Constellation Energy Partners LLC at December 31, 2009 and December 31, 2008
Consolidated Statements of Cash Flows—Constellation Energy Partners LLC for the three years ended December 31, 2009
Consolidated Statements of Changes in Members’ Equity—Constellation Energy Partners LLC for the three years ended December 31, 2009
Notes to Consolidated Financial Statements
2. Financial Statement Schedules:
Schedule II—Valuation and Qualifying Accounts
Schedules other than Schedule II are omitted as not applicable or not required
3. Exhibits Required by Item 601 of Regulation S-K.
| Exhibit |
Description | |
| 2.1 | —Purchase and Sale Agreement, dated as of March 8, 2007, between EnergyQuest Resources, L.P., Oklahoma Processing EQR, LLC and Constellation Energy Partners, LLC (incorporated herein by reference to Exhibit 2.1 to the Current Report on Form 8-K filed by Constellation Energy Partners LLC on April 24, 2007, File No. 001-33147). | |
| 2.2 | —Purchaseand Sale Agreement, dated as of March 8, 2007, between EnergyQuest Resources, L.P., Oklahoma Processing EQR, LLC, Kansas Production EQR, LLC and Kansas Processing EQR, LLC and Constellation Energy Partners LLC (incorporated herein by reference to Exhibit 2.2 to the Current Report on Form 8-K filed by Constellation Energy Partners LLC on April 24, 2007, File No. 001-33147). | |
| 2.3 | —Agreementof Merger, dated as of July 12, 2007, among AMVEST Osage, Inc., AMVEST Oil & Gas, Inc. and CEP Mid-Continent LLC, f/k/a CEP Cherokee Basin LLC (incorporated herein by reference to Exhibit 2.1 to the Current Report on Form 8-K filed by Constellation Energy Partners LLC on July 26, 2007, File No. 001-33147). | |
| 2.4 | —Purchaseand Sale Agreement, dated as of August 2, 2007, between Newfield Exploration Mid-Continent Inc. and Constellation Energy Partners LLC (incorporated herein by reference to Exhibit 2.1 to the Current Report on Form 8-K filed by Constellation Energy Partners LLC on September 26, 2007, File No. 001-33147). | |
| 2.5 | —NomineeAgreement, dated as of September 21, 2007, by and between Newfield Exploration Mid-Continent Inc. and CEP Mid-Continent LLC (incorporated herein by reference to Exhibit 2.2 to the Current Report on Form 8-K filed by Constellation Energy Partners LLC on September 26, 2007). | |
108
Table of Contents
| Exhibit |
Description | |
| 2.6 | —AssetPurchase and Sale Agreement, dated as of May 12, 2005, by and among Everlast Energy LLC, RB Marketing Company LLC, Robinson’s Bend Operating Company LLC and CBM Equity IV, LLC (incorporated herein by reference to Exhibit 10.9 to Amendment No. 2 to the Registration Statement on Form S-1 (File No. 333-134995) filed by Constellation Energy Partners LLC on September 29, 2006 (“Amendment No. 2”))). | |
| 2.7 | —Agreementfor Purchase and Sale, dated as of February 19, 2008, among CoLa Resources LLC and CEP Mid-Continent LLC (incorporated herein by reference to Exhibit 2.1 to the Current Report on Form 8-K filed by Constellation Energy Partners LLC on April 3, 2008, File No. 001-33147). | |
| 2.8 | —FirstAmendment to Agreement for Purchase and Sale, dated as of March 31, 2008, between CoLa Resources LLC and CEP Mid-Continent LLC (incorporated herein by reference to Exhibit 2.2 to the Current Report on Form 8-K filed by Constellation Energy Partners LLC on April 3, 2008, File No. 001-33147). | |
| 3.1 | —Certificateof Formation of Constellation Energy Partners LLC, as amended (incorporated herein by reference to Exhibit 3.1 to the Annual Report on Form 10-K filed by Constellation Energy Partners LLC on March 12, 2007, File No. 001-33147). | |
| 3.2 | —SecondAmended and Restated Operating Agreement of Constellation Energy Partners LLC (incorporated herein by reference to Exhibit 3.1 to the Current Report on Form 8-K filed by Constellation Energy Partners LLC on November 28, 2006, File No. 001-33147). | |
| 3.3 | —AmendmentNo. 1 to Second Amended and Restated Operating Agreement of Constellation Energy Partners LLC, dated April 23, 2007 (incorporated herein by reference to Exhibit 3.1 to the Current Report on Form 8-K filed by Constellation Energy Partners LLC on April 24, 2007, File No. 001-33147). | |
| 3.4 | —AmendmentNo. 2 to Second Amended and Restated Operating Agreement of Constellation Energy Partners LLC, dated July 25, 2007. (incorporated herein by reference to Exhibit 3.1 to the Current Report on Form 8-K filed by Constellation Energy Partners LLC on July 26, 2007, File No. 001-33147). | |
| 3.5 | —AmendmentNo. 3 to Second Amended and Restated Operating Agreement of Constellation Energy Partners LLC, dated September 21, 2007 (incorporated herein by reference to Exhibit 3.1 to the Current Report on Form 8-K filed by Constellation Energy Partners LLC on September 26, 2007, File No. 001-33147). | |
| 3.6 | —AmendmentNo. 4 to Second Amended and Restated Operating Agreement of Constellation Energy Partners LLC, dated December 28, 2007 (incorporated herein by reference to Exhibit 3.1 to the Current Report on Form 8-K filed by Constellation Energy Partners LLC on December 28, 2007, File No. 001-33147). | |
| 10.1 | —ManagementServices Agreement, dated as of November 20, 2006, by and among Constellation Energy Partners LLC and Constellation Energy Partners Management, LLC (incorporated herein by reference to Exhibit 10.2 to the Current Report on Form 8-K filed by Constellation Energy Partners LLC on November 28, 2006, File No. 001-33147). | |
| 10.2 | —OmnibusAgreement, dated as of November 20, 2006, among Constellation Energy Partners LLC, Constellation Energy Commodities Group, Inc., Robinson’s Bend Production II, LLC, Robinson’s Bend Operating II, LLC and Robinson’s Bend Marketing II, LLC (incorporated herein by reference to Exhibit 10.1 to the Current Report on Form 8-K filed by Constellation Energy Partners LLC on November 28, 2006, File No. 001-33147). | |
109
Table of Contents
| Exhibit |
Description | |
| 10.3 | —NetOverriding Royalty Conveyance, dated as of November 22, 1993, but effective as of October 1, 1993, pursuant to Part I thereof, from Velasco Gas Company, Ltd. to Torch Energy Advisors Incorporated herein, and pursuant to Part II thereof, from Torch Energy Advisors Incorporated herein to the Torch Energy Royalty Trust (incorporated herein by reference to Exhibit 10.4 to Amendment No. 2). | |
| 10.4 | —Oiland Gas Purchase Agreement, dated as of October 1, 1993, by and between Torch Energy Marketing, Inc., Torch Royalty Company and Velasco Gas Company Ltd. (incorporated herein by reference to Exhibit 10.5 to Amendment No. 2). | |
| 10.5 | —Letteragreement, dated as of June 13, 2005, by and between Robinson’s Bend Marketing II, LLC and Torch Energy TM, Inc. (incorporated herein by reference to Exhibit 10.6 to Amendment No. 2). | |
| 10.6 | —$350,000,000Amended and Restated Credit Agreement, dated as of November 13, 2009, among Constellation Energy Partners LLC, as borrower, The Royal Bank of Scotland plc, as administrative agent, RBS Securities Inc., as joint lead arranger and sole book runner, The Bank of Nova Scotia, as joint lead arranger and co-syndication agent, and BNP Paribas, as joint lead arranger and co-syndication agent, and the lenders party hereto (incorporated herein by reference to Exhibit 10.1 to the Current Report on Form 8-K filed by Constellation Energy Partners LLC on November 16, 2009, File No. 001-33147). | |
| 10.7* | —FirstAmendment to Amended and Restated Credit Agreement, dated as of February 11, 2010, by and among Constellation Energy Partners LLC and the lenders signatory thereto. | |
| 10.8 | —TrademarkLicense Agreement, dated as of November 20, 2006, by and between Constellation Energy Group, Inc. and Constellation Energy Partners LLC (incorporated herein by reference to Exhibit 10.3 to the Current Report on Form 8-K filed by Constellation Energy Partners LLC on November 28, 2006, File No. 001-33147). | |
| 10.9 | —WaterGathering and Disposal Agreement, dated August 9, 1990, by and between Torch Energy Associates Ltd. and Velasco Gas Company Ltd. (incorporated herein by reference to Exhibit 10.17 to the Annual Report on Form 10-K filed by Constellation Energy Partners LLC on March 4, 2008, File No. 001-33147). | |
| 10.10 | —FirstAmendment to Water Gathering and Disposal Agreement, dated October 1, 1993, by and between Torch Energy Associates Ltd. and Velasco Gas Company Ltd. (incorporated herein by reference to Exhibit 10.18 to the Annual Report on Form 10-K filed by Constellation Energy Partners LLC on March 4, 2008, File No. 001-33147). | |
| 10.11 | —SecondAmendment to Water Gathering and Disposal Agreement, , dated November 30, 2004, by and between Robinson’s Bend Operating Company, LLC, successor in interest to Torch Energy Associates Ltd., and Everlast Energy LLC, successor in interest to Velasco Gas Company Ltd. (incorporated herein by reference to Exhibit 10.19 to the Annual Report on Form 10-K filed by Constellation Energy Partners LLC on March 4, 2008, File No. 001-33147). | |
| 10.12 | —Explorationand Development Agreement, dated July 25, 2005, by and between The Osage Nation and AMVEST Osage, Inc. (incorporated herein by reference to Exhibit 10.23 to the Annual Report on Form 10-K filed by Constellation Energy Partners LLC on February 27, 2009, File No. 001-33147). | |
| 10.13 | —Substitutedand Replaced First Amendment to the Exploration and Development Agreement, dated October 18, 2006, by and between The Osage Nation and AMVEST Osage, Inc. (incorporated herein by reference to Exhibit 10.24 to the Annual Report on Form 10-K filed by Constellation Energy Partners LLC on February 27, 2009, File No. 001-33147). | |
110
Table of Contents
| Exhibit |
Description | |
| 10.14 | —Assignment,Assumption and Ratification Agreement, dated July 25, 2007, by and between AMVEST Osage, Inc. and CEP Mid-Continent LLC (incorporated herein by reference to Exhibit 10.25 to the Annual Report on Form 10-K filed by Constellation Energy Partners LLC on February 27, 2009, File No. 001-33147). | |
| +10.15 | —LetterAgreement, dated December 31, 2008, between Constellation Energy Partners LLC and Stephen R. Brunner (incorporated herein by reference to Exhibit 10.1 to the Current Report on Form 8-K filed by Constellation Energy Partners LLC on January 7, 2009, File No. 001-33147). | |
| +10.16 | —LetterAgreement, dated December 31, 2008, between Constellation Energy Partners LLC and Charles C. Ward (incorporated herein by reference to Exhibit 10.2 to the Current Report on Form 8-K filed by Constellation Energy Partners LLC on January 7, 2009, File No. 001-33147). | |
| +10.17 | —LetterAgreement, dated December 31, 2008, between Constellation Energy Partners LLC and Lisa J. Mellencamp (incorporated herein by reference to Exhibit 10.22 to the Annual Report on Form 10-K filed by Constellation Energy Partners LLC on February 27, 2009, File No. 001-33147). | |
| +10.18 | —EmploymentAgreement, dated May 1, 2009, by and between CEP Services Company, Inc. and Stephen R. Brunner (incorporated herein by reference to Exhibit 10.1 to the Current Report on Form 8-K/A filed by Constellation Energy Partners LLC on May 5, 2009, File No. 001-33147, File No. 001-33147). | |
| +10.19 | —EmploymentAgreement, dated May 1, 2009, by and between CEP Services Company, Inc. and Charles C. Ward (incorporated herein by reference to Exhibit 10.2 to the Quarterly Report on Form 10-Q filed by Constellation Energy Partners LLC on November 6, 2009, File No. 001-33147, File No. 001-33147). | |
| +10.20 | —EmploymentAgreement, dated May 1, 2009, by and between CEP Services Company, Inc. and Lisa J. Mellencamp (incorporated herein by reference to Exhibit 10.3 to the Quarterly Report on Form 10-Q filed by Constellation Energy Partners LLC on November 6, 2009, File No. 001-33147, File No. 001-33147). | |
| +10.21 | —EmploymentAgreement, dated May 1, 2009, by and between CEP Services Company, Inc. and Michael B. Hiney (incorporated herein by reference to Exhibit 10.4 to the Quarterly Report on Form 10-Q filed by Constellation Energy Partners LLC on November 6, 2009, File No. 001-33147, File No. 001-33147). | |
| +10.22 | —InducementAward Agreement, dated May 1, 2009, by and between Constellation Energy Partners LLC and Stephen R. Brunner (incorporated herein by reference to Exhibit 10.5 to the Current Report on Form 8-K/A filed by Constellation Energy Partners LLC on May 5, 2009, File No. 001-33147). | |
| +10.23 | —InducementAward Agreement, dated May 1, 2009, by and between Constellation Energy Partners LLC and Charles C. Ward (incorporated herein by reference to Exhibit 10.6 to the Current Report on Form 8-K/A filed by Constellation Energy Partners LLC on May 5, 2009, File No. 001-33147, File No. 001-33147). | |
| +10.24 | —InducementAward Agreement, dated May 1, 2009, by and between Constellation Energy Partners LLC and Lisa J. Mellencamp (incorporated herein by reference to Exhibit 10.7 to the Current Report on Form 8-K/A filed by Constellation Energy Partners LLC on May 5, 2009, File No. 001-33147, File No. 001-33147). | |
| +10.25 | —InducementAward Agreement, dated May 1, 2009, by and between Constellation Energy Partners LLC and Michael B. Hiney (incorporated herein by reference to Exhibit 10.8 to the Current Report on Form 8-K/A filed by Constellation Energy Partners LLC on May 5, 2009, File No. 001-33147, File No. 001-33147). | |
111
Table of Contents
| Exhibit |
Description | |
| +10.26 | —ConstellationEnergy Partners LLC Long-Term Incentive Plan (incorporated herein by reference to Exhibit 10.1 to the Current Report on Form 8-K filed by Constellation Energy Partners LLC on November 20, 2006, File No. 001-33147). | |
| +10.27 | —ConstellationEnergy Partners LLC 2009 Omnibus Incentive Compensation Plan (incorporated herein by reference to Exhibit A to the Proxy Statement filed by Constellation Energy Partners LLC on October 22, 2009, File No. 001-33147). | |
| +10.28 | —Formof Grant Agreement Relating to Notional Units with DERs—Executives (under the 2009 Omnibus Incentive Compensation Plan) (incorporated herein by reference to Exhibit 10.9 to the Current Report on Form 8-K filed by Constellation Energy Partners LLC on May 4, 2009, File No. 001-33147, File No. 001-33147). | |
| +10.29 | —Formof Grant Agreement Relating to Notional Units with DERs—Independent Managers (under the 2009 Omnibus Incentive Compensation Plan) (incorporated herein by reference to Exhibit 10.10 to the Current Report on Form 8-K filed by Constellation Energy Partners LLC on May 4, 2009, File No. 001-33147, File No. 001-33147). | |
| *+10.30 | —Formof Grant Agreement Relating to Restricted Units—Independent Managers (under the 2009 Omnibus Incentive Compensation Plan) | |
| *12.1 | —Computationof Ratio of Earnings to Fixed Charges. | |
| *21.1 | —Listof subsidiaries of Constellation Energy Partners LLC. | |
| *23.1 | —Consentof PricewaterhouseCoopers LLP. | |
| *23.2 | —Consentof Netherland, Sewell & Associates, Inc. | |
| *31.1 | —Certificationof Chief Executive Officer, Chief Operating Officer, and President of Constellation Energy Partners LLC pursuant to Section 302 of the Sarbanes-Oxley Act of 2002. | |
| *31.2 | —Certificationof Chief Financial Officer and Treasurer of Constellation Energy Partners LLC pursuant to Section 302 of the Sarbanes-Oxley Act of 2002. | |
| *32.1 | —Certificationof Chief Executive Officer, Chief Operating Officer, and President of Constellation Energy Partners LLC pursuant to 18 U.S.C. Section 1350, as adopted pursuant to Section 906 of the Sarbanes-Oxley Act of 2002. | |
| *32.2 | —Certificationof Chief Financial Officer and Treasurer of Constellation Energy Partners LLC pursuant to 18 U.S.C. Section 1350, as adopted pursuant to Section 906 of the Sarbanes-Oxley Act of 2002. | |
| *99.1 | —Reportof Netherland, Sewell & Associates, Inc. | |
| * | Filed herewith |
| + | Management contract or compensatory plan or arrangement. |
112
Table of Contents
| Page | ||
| Constellation Energy Partners LLC and Subsidiaries: |
||
| 114 | ||
| Consolidated Statements of Operations and Comprehensive Income (Loss) |
116 | |
| 117 | ||
| 118 | ||
| 119 | ||
| 120 | ||
| 156 | ||
113
Table of Contents
REPORTS OF INDEPENDENT REGISTERED PUBLIC ACCOUNTING FIRM
To the Unitholders and Board of Managers of Constellation Energy Partners LLC:
In our opinion, the accompanying consolidated balance sheets and the related consolidated statements of operations and comprehensive income (loss), of cash flows, and of changes in members’ equity present fairly, in all material respects, the financial position of Constellation Energy Partners LLC (the “Company”) and its subsidiaries at December 31, 2009 and 2008, and the results of their operations and their cash flows for each of the three years in the period ended December 31, 2009 in conformity with accounting principles generally accepted in the United States of America. In addition, in our opinion, the financial statement schedule listed in the index appearing under Item 15(a)(2) presents fairly, in all material respects, the information set forth therein when read in conjunction with the related consolidated financial statements. Also in our opinion, the Company maintained, in all material respects, effective internal control over financial reporting as of December 31, 2009, based on criteria established in Internal Control—Integrated Framework issued by the Committee of Sponsoring Organizations of the Treadway Commission (COSO). The Company’s management is responsible for these financial statements and financial statement schedule, for maintaining effective internal control over financial reporting and for its assessment of the effectiveness of internal control over financial reporting, included in Management’s Report on Internal Control Over Financial Reporting appearing under Item 9A. Our responsibility is to express opinions on these financial statements, on the financial statement schedule, and on the Company’s internal control over financial reporting based on our integrated audits. We conducted our audits in accordance with the standards of the Public Company Accounting Oversight Board (United States). Those standards require that we plan and perform the audits to obtain reasonable assurance about whether the financial statements are free of material misstatement and whether effective internal control over financial reporting was maintained in all material respects. Our audits of the financial statements included examining, on a test basis, evidence supporting the amounts and disclosures in the financial statements, assessing the accounting principles used and significant estimates made by management, and evaluating the overall financial statement presentation. Our audit of internal control over financial reporting included obtaining an understanding of internal control over financial reporting, assessing the risk that a material weakness exists, and testing and evaluating the design and operating effectiveness of internal control based on the assessed risk. Our audits also included performing such other procedures as we considered necessary in the circumstances. We believe that our audits provide a reasonable basis for our opinions.
As discussed in Note 1 to the consolidated financial statements, the Company changed the manner in which it estimates the quantities of proved oil and natural gas reserves in 2009. As discussed in Notes 7 and 17 to the consolidated financial statements, the Company has entered into significant transactions with Constellation Energy Group and its affiliates, a related party.
A company’s internal control over financial reporting is a process designed to provide reasonable assurance regarding the reliability of financial reporting and the preparation of financial statements for external purposes in accordance with generally accepted accounting principles. A company’s internal control over financial reporting includes those policies and procedures that (i) pertain to the maintenance of records that, in reasonable detail, accurately and fairly reflect the transactions and dispositions of the assets of the company; (ii) provide reasonable assurance that transactions are recorded as necessary to permit preparation of financial statements in accordance with generally accepted accounting principles, and that receipts and expenditures of the company are being made only in accordance with authorizations of management and managers of the company; and (iii) provide reasonable assurance regarding prevention or timely detection of unauthorized acquisition, use, or disposition of the company’s assets that could have a material effect on the financial statements.
114
Table of Contents
Because of its inherent limitations, internal control over financial reporting may not prevent or detect misstatements. Also, projections of any evaluation of effectiveness to future periods are subject to the risk that controls may become inadequate because of changes in conditions, or that the degree of compliance with the policies or procedures may deteriorate.
| /s/ PricewaterhouseCoopers LLP |
| PricewaterhouseCoopers LLP |
| Houston, Texas |
| February 25, 2010 |
115
Table of Contents
CONSTELLATION ENERGY PARTNERS LLC and SUBSIDIARIES
Consolidated Statements of Operations and Comprehensive Income (Loss)
| For the year ended December 31, 2009 |
For the year ended December 31, 2008 |
For the year ended December 31, 2007 |
||||||||||
| (In 000’s except unit data) | ||||||||||||
| Revenues |
||||||||||||
| Oil and gas sales |
$ | 123,126 | $ | 141,863 | $ | 82,725 | ||||||
| Gain / (loss) from mark-to-market activities (see Note 3) |
19,410 | 21,376 | (6,856 | ) | ||||||||
| Total revenues |
142,536 | 163,239 | 75,869 | |||||||||
| Expenses: |
||||||||||||
| Operating expenses: |
||||||||||||
| Lease operating expenses |
33,535 | 36,257 | 17,141 | |||||||||
| Cost of sales |
2,638 | 7,261 | 1,788 | |||||||||
| Production taxes |
3,153 | 8,398 | 3,646 | |||||||||
| General and administrative |
18,506 | 13,998 | 8,789 | |||||||||
| Exploration costs |
855 | 414 | 320 | |||||||||
| (Gain) / Loss on sale of asset |
— | (301 | ) | 86 | ||||||||
| Depreciation, depletion and amortization |
76,286 | 77,919 | 23,190 | |||||||||
| Accretion expense |
406 | 411 | 312 | |||||||||
| Total operating expenses |
135,379 | 144,357 | 55,272 | |||||||||
| Other expense / (income) |
||||||||||||
| Interest expense |
16,305 | 12,167 | 6,930 | |||||||||
| Interest (income) |
(2 | ) | (350 | ) | (465 | ) | ||||||
| Other expense (income) |
(123 | ) | (203 | ) | (109 | ) | ||||||
| Total other expenses / (income) |
16,180 | 11,614 | 6,356 | |||||||||
| Total expenses |
151,559 | 155,971 | 61,628 | |||||||||
| Net income (loss) |
$ | (9,023 | ) | $ | 7,268 | $ | 14,241 | |||||
| Other comprehensive income (loss) |
(21,760 | ) | 45,903 | (8,889 | ) | |||||||
| Comprehensive income (loss) |
$ | (30,783 | ) | $ | 53,171 | $ | 5,352 | |||||
| Earnings per unit (see Note 1) |
||||||||||||
| Earnings (loss) per unit—Basic |
$ | (0.40 | ) | $ | 0.32 | $ | 0.87 | |||||
| Units outstanding—Basic |
22,664,895 | 22,370,426 | 16,321,841 | |||||||||
| Earnings (loss) per unit—Diluted |
$ | (0.40 | ) | $ | 0.32 | $ | 0.87 | |||||
| Units outstanding—Diluted |
22,664,895 | 22,370,426 | 16,321,841 | |||||||||
| Distributions declared and paid per unit |
$ | 0.26 | $ | 2.25 | $ | 1.6986 | ||||||
See accompanying notes to consolidated financial statements.
116
Table of Contents
CONSTELLATION ENERGY PARTNERS LLC and SUBSIDIARIES
Consolidated Balance Sheets
| December 31, 2009 | December 31, 2008 | |||||||
| (In 000’s) | ||||||||
| ASSETS | ||||||||
| Current assets |
||||||||
| Cash and cash equivalents |
$ | 11,337 | $ | 6,255 | ||||
| Accounts receivable |
8,379 | 9,363 | ||||||
| Prepaid expenses |
1,298 | 1,026 | ||||||
| Risk management assets (see Note 3) |
24,251 | 35,587 | ||||||
| Total current assets |
45,265 | 52,231 | ||||||
| Oil and natural gas properties (See Note 5) |
||||||||
| Oil and natural gas properties, equipment and facilities |
794,520 | 769,103 | ||||||
| Material and supplies |
4,312 | 4,587 | ||||||
| Less accumulated depreciation, depletion and amortization |
(186,207 | ) | (111,171 | ) | ||||
| Net oil and natural gas properties |
612,625 | 662,519 | ||||||
| Other assets |
||||||||
| Debt issue costs (net of accumulated amortization of $2,924 at December 31, 2009 and $1,495 at December 31, 2008) |
5,590 | 1,963 | ||||||
| Risk management assets (see Note 3) |
33,916 | 29,746 | ||||||
| Other non-current assets |
10,921 | 12,390 | ||||||
| Total assets |
$ | 708,317 | $ | 758,849 | ||||
| LIABILITIES AND MEMBERS’ EQUITY | ||||||||
| Liabilities |
||||||||
| Current liabilities |
||||||||
| Accounts payable |
$ | 1,102 | $ | 2,809 | ||||
| Payable to affiliate |
201 | 1,043 | ||||||
| Accrued liabilities |
10,033 | 10,088 | ||||||
| Environmental liabilities |
193 | 441 | ||||||
| Royalty payable |
4,747 | 5,125 | ||||||
| Risk management liabilities (see Note 3) |
208 | — | ||||||
| Total current liabilities |
16,484 | 19,506 | ||||||
| Other liabilities |
||||||||
| Asset retirement obligation |
12,129 | 6,754 | ||||||
| Debt |
195,000 | 212,500 | ||||||
| Total other liabilities |
207,129 | 219,254 | ||||||
| Total liabilities |
223,613 | 238,760 | ||||||
| Commitments and contingencies (See Note 8) |
||||||||
| Class D Interests |
6,667 | 6,667 | ||||||
| Members’ equity |
||||||||
| Class A units, 476,950 and 447,721 shares authorized, issued and outstanding, respectively |
8,993 | 9,266 | ||||||
| Class B units, 24,298,763 and 22,348,763 shares authorized, respectively, and 23,376,136 and 21,938,342 issued and outstanding, respectively |
440,677 | 454,029 | ||||||
| Accumulated other comprehensive income |
28,367 | 50,127 | ||||||
| Total members’ equity |
478,037 | 513,422 | ||||||
| Total liabilities and members’ equity |
$ | 708,317 | $ | 758,849 | ||||
See accompanying notes to consolidated financial statements.
117
Table of Contents
CONSTELLATION ENERGY PARTNERS LLC and SUBSIDIARIES
Consolidated Statements of Cash Flows
| For the year ended December 31, 2009 |
For the year ended December 31, 2008 |
For the year ended December 31, 2007 |
||||||||||
| (In 000’s) | ||||||||||||
| Cash flows from operating activities: |
||||||||||||
| Net income |
$ | (9,023 | ) | $ | 7,268 | $ | 14,241 | |||||
| Adjustments to reconcile net income (loss) to cash provided by operating activities: |
||||||||||||
| Depreciation, depletion and amortization |
76,286 | 77,919 | 23,190 | |||||||||
| Amortization of debt issuance costs |
1,429 | 1,052 | 424 | |||||||||
| Accretion of asset retirement obligation |
406 | 411 | 312 | |||||||||
| Equity earnings (losses) in affiliate |
(125 | ) | (203 | ) | (109 | ) | ||||||
| (Gain) Loss from disposition of property and equipment |
— | (301 | ) | 86 | ||||||||
| Dryhole costs |
173 | — | 209 | |||||||||
| Hedge ineffectiveness |
267 | (1,189 | ) | 1,225 | ||||||||
| (Gain) Loss from mark-to-market activities |
(15,072 | ) | (21,376 | ) | 6,856 | |||||||
| Unit-based compensation programs |
1,308 | 322 | 145 | |||||||||
| Changes in Assets and Liabilities: |
||||||||||||
| Change in net risk management assets and liabilities |
420 | 2,518 | (2,935 | ) | ||||||||
| (Increase) decrease in accounts receivable |
984 | 9,130 | (5,560 | ) | ||||||||
| (Increase) decrease in prepaid expenses |
(275 | ) | 714 | (89 | ) | |||||||
| (Increase) decrease in other assets |
33 | 241 | (380 | ) | ||||||||
| Increase (decrease) in accounts payable |
(1,707 | ) | 875 | 821 | ||||||||
| Increase (decrease) in payable to affiliate |
(842 | ) | (1,770 | ) | (23 | ) | ||||||
| Increase (decrease) in accrued liabilities |
2,203 | (2,160 | ) | 4,789 | ||||||||
| Increase (decrease) in royalty payable |
(378 | ) | 2,181 | (703 | ) | |||||||
| Net cash (used in) provided by operating activities |
56,087 | 75,632 | 42,499 | |||||||||
| Cash flows from investing activities: |
||||||||||||
| Cash paid for acquisitions, net of cash required |
(291 | ) | (48,063 | ) | (479,391 | ) | ||||||
| Development of natural gas properties |
(22,913 | ) | (47,897 | ) | (23,645 | ) | ||||||
| Proceeds from sale of equipment |
130 | 599 | 188 | |||||||||
| Distributions from equity affiliate |
503 | 353 | 315 | |||||||||
| Net cash used in investing activities |
(22,571 | ) | (95,008 | ) | (502,533 | ) | ||||||
| Cash flows from financing activities: |
||||||||||||
| Members’ distributions |
(5,820 | ) | (50,656 | ) | (28,604 | ) | ||||||
| Proceeds from issuance of debt |
37,500 | 237,000 | 137,000 | |||||||||
| Repayment of debt |
(55,000 | ) | (177,500 | ) | (6,000 | ) | ||||||
| Costs for shelf registration statement |
— | (340 | ) | — | ||||||||
| Units tendered by employees for tax withholdings |
(6 | ) | — | — | ||||||||
| Proceeds from equity issuance |
— | — | 369,549 | |||||||||
| Equity issue costs |
(82 | ) | — | — | ||||||||
| Debt issue costs |
(5,026 | ) | (1,562 | ) | (707 | ) | ||||||
| Net cash (used in) provided by financing activities |
(28,434 | ) | 6,942 | 471,238 | ||||||||
| Net (decrease) increase in cash |
5,082 | (12,434 | ) | 11,204 | ||||||||
| Cash and cash equivalents, beginning of period |
6,255 | 18,689 | 7,485 | |||||||||
| Cash and cash equivalents, end of period |
$ | 11,337 | $ | 6,255 | $ | 18,689 | ||||||
| Supplemental disclosures of cash flow information: |
||||||||||||
| Change in accrued capital expenditures |
$ | (2,760 | ) | $ | (124 | ) | $ | 3,680 | ||||
| Cash received during the period for interest |
$ | 2 | $ | 372 | $ | 443 | ||||||
| Cash paid during the period for interest |
$ | (6,225 | ) | $ | 10,545 | $ | 5,935 | |||||
| Cash paid during the period for income taxes |
$ | (2 | ) | $ | — | $ | — | |||||
See accompanying notes to consolidated financial statements.
118
Table of Contents
CONSTELLATION ENERGY PARTNERS LLC and SUBSIDIARIES
Consolidated Statements of Changes in Members’ Equity
| Class A | Class B | Accumulated Other Comprehensive Income |
Total Members’ Equity |
|||||||||||||||||
| Units | Amount | Units | Amount | |||||||||||||||||
| ( In 000’s, except unit data) | ||||||||||||||||||||
| Balance, December 31, 2006 |
226,406 | $ | 2,977 | 11,093,894 | $ | 145,870 | $ | 13,113 | $ | 161,960 | ||||||||||
| Distributions |
— | (552 | ) | — | (27,052 | ) | — | (27,604 | ) | |||||||||||
| Issuance of common units, net of issue costs of $5,465 |
220,616 | 7,392 | 10,810,212 | 362,157 | — | 369,549 | ||||||||||||||
| Unit-based compensation programs |
— | 3 | — | 142 | — | 145 | ||||||||||||||
| Change in fair value of commodity hedges |
— | — | — | — | 7,372 | 7,372 | ||||||||||||||
| Cash gains on settlement of commodity hedges |
— | — | — | — | (13,458 | ) | (13,458 | ) | ||||||||||||
| Change in fair value of interest rate hedges |
— | — | — | — | (2,803 | ) | (2,803 | ) | ||||||||||||
| Net income |
— | 284 | — | 13,957 | — | 14,241 | ||||||||||||||
| Balance, December 31, 2007 |
447,022 | $ | 10,104 | 21,904,106 | $ | 495,074 | $ | 4,224 | $ | 509,402 | ||||||||||
| Distributions |
— | (1,008 | ) | — | (49,315 | ) | — | (50,323 | ) | |||||||||||
| Change in fair value of commodity hedges |
— | — | — | — | 48,966 | 48,966 | ||||||||||||||
| Cash settlement of commodity hedges |
— | — | — | — | 1,929 | 1,929 | ||||||||||||||
| Change in fair value of interest rate hedges |
— | — | — | — | (4,992 | ) | (4,992 | ) | ||||||||||||
| Unit-based compensation programs |
699 | 7 | 34,236 | 315 | — | 322 | ||||||||||||||
| Contributions |
— | 17 | — | 833 | — | 850 | ||||||||||||||
| Net income |
— | 145 | — | 7,123 | — | 7,268 | ||||||||||||||
| Balance, December 31, 2008 |
447,721 | $ | 9,265 | 21,938,342 | $ | 454,030 | $ | 50,127 | $ | 513,422 | ||||||||||
| Distributions |
— | (116 | ) | — | (5,704 | ) | — | (5,820 | ) | |||||||||||
| Equity Issuance Cost |
— | (2 | ) | — | (82 | ) | — | (84 | ) | |||||||||||
| Units tendered by employees for tax withholding |
— | — | — | (6 | ) | — | (6 | ) | ||||||||||||
| Change in fair value of commodity hedges |
— | — | — | — | 17,694 | 17,694 | ||||||||||||||
| Cash settlement of commodity hedges |
— | — | — | — | (46,730 | ) | (46,730 | ) | ||||||||||||
| Change in fair value of interest rate hedges |
— | — | — | — | 7,276 | 7,276 | ||||||||||||||
| Unit-based compensation programs |
29,229 | 26 | 1,437,794 | 1,282 | — | 1,308 | ||||||||||||||
| Net income (loss) |
— | (180 | ) | — | (8,843 | ) | — | (9,023 | ) | |||||||||||
| Balance, December 31, 2009 |
476,950 | $ | 8,993 | 23,376,136 | $ | 440,677 | $ | 28,367 | $ | 478,037 | ||||||||||
See accompanying notes to consolidated financial statements.
119
Table of Contents
CONSTELLATION ENERGY PARTNERS LLC AND SUBSIDIARIES
NOTES TO CONSOLIDATED FINANCIAL STATEMENTS
DECEMBER 31, 2009, 2008 and 2007
1. SUMMARY OF SIGNIFICANT ACCOUNTING POLICIES
Organization and Basis of Presentation
CBM Equity IV Holdings, LLC was organized as a limited liability company on February 7, 2005, under the laws of the State of Delaware and had no principal operations prior to the acquisition of our properties in the Black Warrior Basin on June 13, 2005. On May 10, 2006, CBM Equity IV Holdings, LLC changed its name to Constellation Energy Resources LLC. On July 18, 2006, Constellation Energy Resources LLC changed its name to Constellation Energy Partners LLC (“CEP”, “we”, “us”, “our” or the “Company”). We completed our initial public offering on November 20, 2006, and trade on the NYSE Arca under the symbol “CEP”. We are partially-owned by Constellation Energy Commodities Group, Inc. (“CCG”), which is owned by Constellation Energy Group, Inc. (NYSE: CEG) (“Constellation” or “CEG”). As of December 31, 2009, affiliates of Constellation own all of our Class A units, all of the management incentive interests, approximately 25% of our common units and all of our Class D interests.
We are currently focused on the development and acquisition of natural gas properties in the Black Warrior Basin in Alabama, the Cherokee Basin in Kansas and Oklahoma, and the Woodford Shale in Oklahoma. CEP acquired its interests in the Black Warrior Basin in 2005, its interests in the Cherokee Basin in 2007 and its interests in the Woodford Shale in 2008.
Accounting policies used by us conform to accounting principles generally accepted in the United States of America. The accompanying financial statements include the accounts of us and our wholly-owned subsidiaries. All significant intercompany accounts and transactions have been eliminated in consolidation. We operate our oil and natural gas properties as one business segment: the exploration, development and production of natural gas. Our management evaluates performance based on one business segment as there are not different economic environments within the operation of our oil and natural gas properties. Certain reclassifications have been made to prior years’ reported amounts in order to conform to the current year presentation. In 2009, in the Statement of Consolidated Operations, we separately identified Exploration costs which had been previously included in General and administrative expenses. These reclassifications did not impact net income, members’ equity or cash flows.
Cash and Cash Equivalents
All highly liquid investments with original maturities of three months or less are considered cash equivalents. Checks-in-transit were $0.9 million in 2009 and $2.7 million in 2008 and are included in accounts payable in our consolidated balance sheets.
Concentration of Credit Risk and Accounts Receivable
Financial instruments that potentially subject us to a concentration of credit risk consist of cash and cash equivalents, accounts receivable and derivative financial instruments. We place our cash with high credit quality financial institutions. We place our derivative financial instruments with financial institutions and other firms that our management believes have high credit ratings and participate in our reserve-based credit facility. Substantially all of our accounts receivables are due from purchasers of oil and natural gas. These sales are generally unsecured. As we generally have fewer than 10 large customers for our oil and natural gas sales, we routinely assess the financial strength of our customers. Bad debt expense is recognized on an account-by-account review and when recovery is not probable. There has been no bad debt expense for any of the periods presented herein. We have no off-balance-sheet credit exposure related to our operations or customers.
120
Table of Contents
CONSTELLATION ENERGY PARTNERS LLC AND SUBSIDIARIES
NOTES TO CONSOLIDATED FINANCIAL STATEMENTS—(Continued)
For the year ended December 31, 2009, five customers accounted for approximately 31%, 10%, 10%, 9% and 6%, respectively, of our sales revenues. For the year ended December 31, 2008, five customers accounted for approximately 27%, 19%, 15%, 13% and 9%, respectively, of our sales revenues. For the year ended December 31, 2007, five customers accounted for approximately 16%, 14%, 14%, 13% and 8%, respectively, of our sales revenues.
Oil and Natural Gas Properties
Oil and Natural Gas Properties
We follow the successful efforts method of accounting for our oil and natural gas exploration, development and production activities. Leasehold acquisition costs are capitalized. If proved reserves are found on an undeveloped property, leasehold cost is transferred to proved properties. Under this method of accounting, costs relating to the development of proved areas are capitalized when incurred.
Effective for fiscal years ending on or after December 31, 2009, new accounting rules require that we price our future oil and natural gas production at the twelve-month average of the first-day-of-the-month reference prices as adjusted for location and quality differentials. Prior to the new rules, we were required to price our future oil and natural gas production at an SEC-required price which is based on the oil and natural gas prices in effect at the end of each fiscal quarter. Such SEC-required prices are utilized except where different prices are fixed and determinable from applicable contracts for the remaining term of those contracts. Our proved reserve estimates exclude the effect of any derivatives we have in place.
Depreciation and depletion of producing oil and natural gas properties is recorded at the field level, based on the units-of-production method. Unit rates are computed for unamortized drilling and development costs using proved developed reserves and for unamortized leasehold costs using all proved reserves. Acquisition costs of proved properties are amortized on the basis of all proved reserves, developed and undeveloped, and capitalized development costs (including wells and related equipment and facilities) are amortized on the basis of proved developed reserves. It has been our historical practice to use our year-end reserve report to adjust our depreciation, depletion, and amortization expense for the fourth quarter. Prior to the fourth quarter 2009, depreciation, depletion, and amortization expense was calculated using year-end reserve reports based on year-end pricing, however for the fourth quarter 2009 the SEC-required price was used to calculate depreciation, depletion, and amortization expense. As more fully described in Note 15, proved reserves estimates are subject to future revisions when additional information becomes available.
As described in Note 9, estimated asset retirement costs are recognized when the asset is acquired or placed in service, and are amortized over proved developed reserves using the units-of-production method. Asset retirement costs are estimated by our engineers using existing regulatory requirements and anticipated future inflation rates.
Geological, geophysical and dry hole costs on oil and natural gas properties relating to unsuccessful exploratory wells are charged to expense as incurred.
Oil and natural gas properties are reviewed for impairment when facts and circumstances indicate that their carrying value may not be recoverable. We assess impairment of capitalized costs of proved oil and natural gas properties by comparing net capitalized costs to estimated undiscounted future net cash flows using expected prices. If net capitalized costs exceed estimated undiscounted future net cash flows, the measurement of impairment is based on estimated fair value, which would consider estimated future discounted cash flows. The cash flow estimates are based upon third party reserve reports using future expected oil and natural gas prices adjusted for basis differentials. Cash flow estimates for the impairment testing exclude derivative instruments. Refer to Note 5 for additional information.
121
Table of Contents
CONSTELLATION ENERGY PARTNERS LLC AND SUBSIDIARIES
NOTES TO CONSOLIDATED FINANCIAL STATEMENTS—(Continued)
Unproven properties that are individually significant are assessed for impairment and if considered impaired are charged to expense when such impairment is deemed to have occurred. Impairment is deemed to have occurred if a lease is going to expire prior to any planned drilling on the leased property.
Property acquisition costs are capitalized when incurred.
Support Equipment and Facilities
Support equipment and facilities consist of certain of our water treatment facilities, gathering lines, roads, pipelines, and other various support equipment. Items are capitalized when acquired and depreciated using the straight-line method over the useful life of the assets.
Materials and Supplies
Materials and supplies consist of well equipment, parts and supplies. They are valued at the lower of cost or market, using either the specific identification or first-in first-out method, depending on the inventory type. Materials and supplies are capitalized as used in the development or support of our oil and natural gas properties.
Depreciation, depletion and amortization of oil and natural gas properties was computed using the units-of-production method based on estimated proved gas reserves.
Oil and Natural Gas Reserve Quantities
Our estimate of proved reserves was based on the quantities of natural gas that engineering and geological analyses demonstrate, with reasonable certainty, to be recoverable from established reservoirs in the future under current operating and economic parameters. Proved reserves were calculated based on various factors, including consideration of an independent reserve engineers’ report on proved reserves and an economic evaluation of all of our properties on a well-by-well basis. The process used to complete the estimates of proved reserves at December 31, 2009, 2008 and 2007 is described in detail in Note 15.
Reserves and their relation to estimated future net cash flows impact depletion and impairment calculations. As a result, adjustments to depletion and impairment are made concurrently with changes to reserve estimates. The accuracy of reserve estimates is a function of many factors including the following: the quality and quantity of available data, the interpretation of that data, the accuracy of various mandated economic assumptions and the judgments of the individuals preparing the estimates.
Proved reserve estimates were a function of many assumptions, all of which could deviate significantly from actual results. As such, reserve estimates may materially vary from the ultimate quantities of oil, natural gas, and natural gas liquids eventually recovered.
Derivatives and Hedging Activities
We use derivative financial instruments to achieve a more predictable cash flow from our natural gas production by reducing our exposure to price fluctuations. Additionally, we use derivative financial instruments in the form of interest rate swaps to mitigate its interest rate exposure.
All derivative instruments are recorded in the consolidated balance sheet as either an asset or a liability measured at fair value with changes in fair value recognized in earnings unless specific hedge accounting criteria are met. Most of our derivatives have not been designated cash flow hedges under hedge accounting but are
122
Table of Contents
CONSTELLATION ENERGY PARTNERS LLC AND SUBSIDIARIES
NOTES TO CONSOLIDATED FINANCIAL STATEMENTS—(Continued)
effective as economic hedges of our commodity price exposure. These contracts are accounted for using the mark-to-market accounting method. Using this method, the contracts are carried at their fair value on our consolidated balance sheet under the captions “Risk management assets” and “Risk management liabilities.” We recognize all unrealized and realized gains and losses related to these contracts on our consolidated statement of income under the caption “Gain (loss) from mark-to-market activities”, which is a component of our total revenues. We may elect to designate these contracts as cash-flow hedges for accounting purposes but we usually do not do so. The fair value of these derivative contracts is recorded on our balance sheet as “Risk management assets” and “Accumulated other comprehensive income.” Changes in the fair value of the cash flow hedges are reflected on the consolidated statements of operations and comprehensive income (loss) as other comprehensive income. When amounts for hedging activities are reclassified from “Accumulated other comprehensive income (loss)” on the balance sheet to the income statement, we record settled natural gas swaps as “Gas sales” and settled interest rate swaps as “Interest expense.”
Net Profits Interest
Certain of our properties in the Robinson’s Bend Field are subject to a net profits interest (“NPI”). The NPI represents an interest in production created from the working interest and is based on a contracted revenue calculation (see Note 10). The NPI is accounted for as an overriding royalty interest. This is consistent with how we account for the NPI for reserves purposes. Any payments made to the NPI holder are reflected as a reduction in revenue.
Revenue Recognition
Sales of oil and natural gas are recognized when oil or natural gas has been delivered to a custody transfer point, persuasive evidence of a sales arrangement exists, the rights and responsibility of ownership pass to the purchaser upon delivery, collection of revenue from the sale are reasonably assured and the sales price is fixed or determinable. Oil and natural gas is sold on a monthly basis. Most of our sales contracts’ pricing provisions are tied to a market index, with certain adjustments based on, among other factors, whether a well delivers to a gathering or transmission line, quality of oil or natural gas, and prevailing supply and demand conditions, so that the price of the oil or natural gas fluctuates to remain competitive with other available energy supplies. As a result, revenues from the sale of oil and natural gas will suffer if market prices decline and benefit if they increase. We believe that the pricing provisions of our oil and natural gas contracts are customary in the industry.
Gas imbalances occur when sales are more or less than the entitled ownership percentage of total gas production. We use the entitlements method when accounting for gas imbalances. Any amount received in excess is treated as a liability. If less than the entitled share of the production is received, the excess is recorded as a receivable. There were no gas imbalance positions at December 31, 2009, 2008, or 2007.
Income Taxes
CEP and each of its wholly-owned subsidiary LLCs are treated as partnerships for federal and state income tax purposes. Essentially all of our taxable income or loss, which may differ considerably from net income or loss reported for financial reporting purposes, is passed through to the federal income tax returns of its members. As such, no federal income tax for these entities has been provided for in the accompanying financial statements. CEP is subject to franchise tax obligations in Kansas and Texas and state tax obligations in Alabama and Oklahoma. CEP also has informational filing requirements in Georgia, Indiana, Maine, Missouri, New Jersey, New York, Oregon, Pennsylvania, and West Virginia because we have resident unitholders in these states.
123
Table of Contents
CONSTELLATION ENERGY PARTNERS LLC AND SUBSIDIARIES
NOTES TO CONSOLIDATED FINANCIAL STATEMENTS—(Continued)
Our wholly-owned subsidiary, CEP Services Company, Inc. is a taxable entity. For 2009, the current federal and state tax liability for the entity was less than $0.01 million. This amount was paid to the IRS or the applicable states in quarterly installments. The entity had no deferred tax assets or liabilities.
Use of Estimates
Estimates and assumptions are made when preparing financial statements under accounting principles generally accepted in the United States of America. These estimates and assumptions affect various matters, including:
| • | reported amounts of revenue and expenses in the Consolidated Statement of Operations and Other Comprehensive Income (Loss) during the reported periods, |
| • | reported amounts of assets and liabilities in the Consolidated Balance Sheets at the dates of the financial statements, |
| • | disclosure of quantities of reserves and use of those reserve quantities for depreciation, depletion and amortization, and |
| • | disclosure of contingent assets and liabilities at the date of the financial statements. |
These estimates involve judgments with respect to numerous factors that are difficult to predict and are beyond management’s control. As a result, actual amounts could materially differ from these estimates.
Earnings per Unit
The following table presents earnings per common unit amounts:
| Income | Unit | Per Unit Amount |
||||||||
| (In 000’s except unit data) | ||||||||||
| Year ended December 31, 2009 |
||||||||||
| Basic EPS: |
||||||||||
| Income allocable to unitholders |
$ | (9,023 | ) | 22,664,895 | $ | (0.40 | ) | |||
| Effect of dilutive securities: |
||||||||||
| Restricted common units that earn distributions |
— | — | — | |||||||
| Diluted EPS: |
||||||||||
| Income allocable to common unitholders |
$ | (9,023 | ) | 22,664,895 | $ | (0.40 | ) | |||
No restricted common units are included in diluted EPS for the twelve months ended December 31, 2009, as we reported a net loss.
| Income | Unit | Per Unit Amount | ||||||
| (In 000’s except unit data) | ||||||||
| Year ended December 31, 2008 |
||||||||
| Basic EPS: |
||||||||
| Income allocable to unitholders |
$ | 7,268 | 22,370,426 | $ | 0.32 | |||
| Effect of dilutive securities: |
||||||||
| Restricted common units that earn distributions |
— | — | — | |||||
| Diluted EPS: |
||||||||
| Income allocable to common unitholders |
$ | 7,268 | 22,370,426 | $ | 0.32 | |||
124
Table of Contents
CONSTELLATION ENERGY PARTNERS LLC AND SUBSIDIARIES
NOTES TO CONSOLIDATED FINANCIAL STATEMENTS—(Continued)
| Income | Unit | Per Unit Amount | ||||||
| (In 000’s except unit data) | ||||||||
| Year ended December 31, 2007 |
||||||||
| Basic EPS: |
||||||||
| Income allocable to unitholders |
$ | 14,241 | 16,321,841 | $ | 0.87 | |||
| Effect of dilutive securities: |
||||||||
| Restricted common units that earn distributions |
— | — | — | |||||
| Diluted EPS: |
||||||||
| Income allocable to common unitholders |
$ | 14,241 | 16,321,841 | $ | 0.87 | |||
Comprehensive Income (Loss)
Comprehensive income (loss) includes net earnings (loss) as well as unrealized gains and losses on derivative instruments.
Class D Interests
Due to their contingently redeemable feature, the Class D interests are treated as preferred units subject to contingent redemption.
Environmental Cost
We record environmental liabilities at their undiscounted amounts on our balance sheet in other current and long-term liabilities when our environmental assessments indicate that remediation efforts are probable and the costs can be reasonably estimated. Estimates of our environmental liabilities are based on currently available facts, existing technology and presently enacted laws and regulations taking into consideration the likely effects of other societal and economic factors, and include estimates of associated legal costs. These amounts also consider prior experience in remediating contaminated sites, other companies’ clean-up experience and data released by the Federal Environmental Protection Agency (“EPA”) or other organizations. Our estimates are subject to revision in future periods based on actual costs or new circumstances. We capitalize costs that benefit future periods and we recognize a current period charge in operation and maintenance expense when clean-up efforts do not benefit future periods.
Unit-Based Compensation
We record compensation expense for all equity grants issued under the Long-Term Incentive Program, the 2009 Omnibus Incentive Compensation Plan, and the Executive Inducement Bonus Program based on the fair value at the grant date, recognized over the vesting period.
Other Contingencies
We recognize liabilities for other contingencies when we have an exposure that, when fully analyzed, indicates it is both probable that an asset has been impaired or that a liability has been incurred and the amount of impairment or loss can be reasonably estimated. Funds spent to remedy these contingencies are charged against the associated reserve, if one exists, or expensed. When a range of probable loss can be estimated, we accrue the most likely amount or at least the minimum of the range of probable loss.
Accounting Standards Adopted Through February 25, 2010
In September 2009, the FASB issued its proposed updates to oil and gas accounting rules to align the oil and gas reserve estimation and disclosure requirements of Accounting Standards Update (ASU) 2010-03, Extractive
125
Table of Contents
CONSTELLATION ENERGY PARTNERS LLC AND SUBSIDIARIES
NOTES TO CONSOLIDATED FINANCIAL STATEMENTS—(Continued)
Industries—Oil and Gas (Topic 932) with the requirements in the SEC’s final rule, Modernization of the Oil and Gas Reporting Requirements, which was issued on December 31, 2008 and is effective for the year ended December 31, 2009. The final rule adopts revisions to the SEC’s oil and gas reporting disclosure requirements. The revisions are intended to provide investors with a more meaningful and comprehensive understanding of oil and natural gas reserves to help investors evaluate their investments in oil and gas companies. The amendments are also designed to modernize the oil and natural gas disclosure requirements to align them with current practices and technological advances. Revised requirements in the final rule include, but are not limited to:
| • | Oil and natural gas reserves must be reported using a 12-month average of the closing prices on the first day of each of such months, rather than a single day year-end price; |
| • | Companies will be allowed to report, on a voluntary basis, probable and possible reserves, previously prohibited by SEC rules; and |
| • | Easing the standard for the inclusion of proved undeveloped reserves (PUDs) and requiring disclosure of information indicating any progress toward the development of PUDs. |
We began complying with the disclosure requirements in our annual report on Form 10-K for the year ended December 31, 2009. Under the SEC rules, our year-end 2009 reserve report uses the new rules as a change in accounting principle that is inseparable form a change in estimates. Under the SEC’s final rule, prior period reserves were not restated. The impact of the adoption of the SEC final rule on our financial statements is not practicable to estimate due to the operational and technical challenges associated with calculating a cumulative effect of adoption by preparing reserve reports under both the old and new rules. In June 2009, the Financial Accounting Standards Board (“FASB”) released the final version of its new Accounting Standards Codification (the “Codification”) as the single authoritative source for U.S. GAAP. The Codification replaces all previous U.S. GAAP accounting standards as described in ASC 105 (SFAS 168, The FASB Accounting Standards Codification and the Hierarchy of Generally Accepted Accounting Principles). While not intended to change U.S. GAAP, the Codification significantly changes the way in which the accounting literature is organized. It is structured by accounting topic to help accountants and auditors more quickly identify the guidance that applies to a specific accounting issue. However, because the Codification completely replaces existing standards, it will affect the way U.S. GAAP is referenced by companies in their financial statements and accounting policies. The Codification is effective for financial statements that cover interim and annual periods ending after September 15, 2009. The adoption of the Codification did not have a material impact on our financial statements.
In May 2009, the FASB established general standards of accounting for and the disclosures of events that occur after the balance sheet date but before financial statements are issued or are available to be issued. Although there is new terminology, the standard is based on the same principles as those that currently exist in the auditing standards. The standard, which includes a new required disclosure of the date through which an entity has evaluated subsequent events, is effective for interim or annual periods ending after June 15, 2009. We perform an evaluation of subsequent events until the issuance date of our document with the SEC so the adoption of the new requirements had no impact on our financial statements. See Note 17 for additional information.
In June 2008, the FASB addressed whether instruments granted in unit-based payment transactions are participating securities prior to vesting and, therefore, need to be included in the earnings allocation in computing earnings per unit under the two-class method. This affects entities that accrue or pay nonforfeitable cash distributions on unit-based payment awards during the awards’ service period. Effective for fiscal years beginning after December 15, 2008, and interim periods within those fiscal years, a retrospective adjustment to all prior period earnings per unit calculations was required. We adopted the guidance on January 1, 2009, and began including all unvested restricted common units that earn distributions in earnings per unit calculations for all periods presented. The adoption of this guidance did not have a material impact on our earnings per unit calculations.
126
Table of Contents
CONSTELLATION ENERGY PARTNERS LLC AND SUBSIDIARIES
NOTES TO CONSOLIDATED FINANCIAL STATEMENTS—(Continued)
In March 2008, the Emerging Issues Task Force reached a consensus on how current period earnings should be allocated between limited partners and a general partner when the partnership agreement contains incentive distribution rights. Beginning after December 15, 2008, and interim periods within those fiscal years, this guidance was to be applied retrospectively for all financial statements presented. Earlier application was not permitted. The adoption of this guidance did not have a material impact on our financial statements.
In March 2008, the FASB issued guidance that was effective beginning January 1, 2009 and required entities to provide expanded disclosures about derivative instruments and hedging activities including (1) the ways in which an entity uses derivatives, (2) the accounting for derivatives and hedging activities, and (3) the impact that derivatives have (or could have) on an entity’s financial position, financial performance, and cash flows. This guidance only required expanded disclosures and did not change the accounting for derivatives. The adoption of this guidance did not have a material impact on our financial statements. See Note 3 for additional information.
New Accounting Pronouncements Issued But Not Yet Adopted
As of December 31, 2009, there were a number of accounting standards and interpretations that had been issued, but not yet adopted by us. We are currently reviewing the recently issued standards and interpretations but none are expected to have a material impact on our financial statements.
2. ACQUISITIONS
Cola Acquisition
On March 31, 2008, we acquired 83 non-operated producing natural gas wells in the Woodford Shale in the Arkoma Basin in Oklahoma from CoLa Resources LLC (“CoLa”) for $50.2 million, including purchase price adjustments (“CoLa Acquisition”). CoLa is an affiliate of CEG, our former sponsor. The transaction was reviewed and approved by our conflicts committee. In its review, our conflicts committee considered various economic factors (including historical and estimated future production, estimated proved reserves, future pricing estimates and operating cost estimates) regarding the transaction, and determined that the acquisition was fair and in the best interests of the Company. The 83 wells, located in Coal and Hughes Counties, Oklahoma, have an average gross working interest per well of 11.4% and an average net revenue interest per well of 9.2%. The acquired natural gas reserves associated with the wells are 100% proved developed producing. Our results of operations include the results of the CoLa wells after the date of acquisition.
To fund the purchase of CoLa, we borrowed $53.0 million under our previous reserve-based credit facilities.
Upon the announcement of the acquisition, we entered into derivative transactions to hedge a portion of the future expected production associated with these wells.
The total consideration paid was $50.1 million, which consisted of $50.2 million in cash and transaction costs and assumed liabilities of approximately $0.1 million, primarily associated with asset retirement obligations on the properties. The following table summarizes the allocation of the purchase price to the assets acquired and liabilities assumed at the date of acquisition.
| Acquired March 31, 2008 | (in millions) | |||
| Oil and Natural Gas Properties |
$ | 50.2 | ||
| Total assets acquired |
50.2 | |||
| Asset retirement obligations |
(0.1 | ) | ||
| Net assets acquired |
$ | 50.1 | ||
127
Table of Contents
CONSTELLATION ENERGY PARTNERS LLC AND SUBSIDIARIES
NOTES TO CONSOLIDATED FINANCIAL STATEMENTS—(Continued)
The purchase price allocation is based on evaluations of proved oil and natural gas reserves, discounted cash flows, quoted market prices, and other estimates by management.
In July 2009, we received approximately $0.2 million from Cola for post-closing and title adjustments related to the CoLa acquisition. Under the purchase agreement, we had the right to assert, and CoLa had the right to attempt to cure, any title defects to the acquired wells until July 31, 2009. CoLa’s post-closing payment obligations with respect to title defects and indemnities under the purchase agreement was secured, in part, by a guaranty from CCG delivered at closing. The maximum amount of the CCG guaranty was limited to (i) 20% of the purchase price, with respect to indemnity obligations, and (ii) with respect to title defect obligations, the amount of such title defects, such amount to be calculated as provided in the purchase agreement. The amount of CCG’s guaranty with respect to title defect obligations has decreased as title curative were received and as CoLa received proceeds of production from the wells as to which payments of production proceeds had not commenced as of the closing date and which were attributable to periods prior to the effective time of the purchase agreement. No further title adjustments are expected and a guarantee no longer exists with respect to title defect obligations.
Newfield Acquisition
On September 21, 2007, we acquired certain oil and natural gas properties in the Cherokee Basin from Newfield Exploration Mid-Continent Inc. (“Newfield”). The acquisition included approximately 600 net producing wells on approximately 80,000 net acres as well as support equipment and facilities, including a pipeline gathering system. The results of operations include the results of Newfield since the date of acquisition.
In conjunction with the acquisition, we issued in a private placement 2,470,592 common units at an average price of $42.50 per unit for aggregate proceeds of approximately $105.0 million. Subsequent to this offering, we registered for resale all of these common units with the Securities and Exchange Commission. The proceeds from this equity placement, together with borrowings under our existing reserve-based credit facility, fully funded the purchase price of the acquisition.
Upon closing of the acquisition, we entered into derivative transactions to hedge a portion of the future expected production associated with these properties (see Note 3).
The total consideration paid was $127.5 million which consisted of $128.6 million in cash and assumed liabilities of $1.1 million, primarily associated with asset retirement obligations on the properties. The following table summarizes the allocation of the purchase price to the assets acquired and liabilities assumed at the date of acquisition.
| Acquired September 21, 2007 | (in millions) | |||
| Oil and Natural Gas Properties |
$ | 109.4 | ||
| Unproved Properties |
2.6 | |||
| Pipelines |
10.0 | |||
| Other PP&E |
1.0 | |||
| Intangible Third Party Gas Contracts |
5.0 | |||
| Inventory |
0.6 | |||
| Total assets acquired |
128.6 | |||
| Asset retirement obligations |
(1.1 | ) | ||
| Net assets acquired |
$ | 127.5 | ||
The purchase price allocation is based on internal appraisals, evaluations of proved oil and natural gas reserves, discounted cash flows, quoted market prices, and other estimates by management.
128
Table of Contents
CONSTELLATION ENERGY PARTNERS LLC AND SUBSIDIARIES
NOTES TO CONSOLIDATED FINANCIAL STATEMENTS—(Continued)
Amvest Acquisition
On July 25, 2007, we acquired certain oil and natural gas properties in the Cherokee Basin through an Agreement of Merger with Amvest Osage, Inc. (“Amvest”). At the closing of the merger, Amvest became a wholly-owned subsidiary of CEP. The acquisition included a 13 year exclusive concession for coalbed methane and shale rights on approximately 560,000 net acres in Osage County, Oklahoma. Also included were producing wells, support equipment and facilities and certain pipeline gathering systems. The results of operations include the results of Amvest since the date of acquisition.
In conjunction with the acquisition, we issued in a private placement 2,664,998 common units and 3,371,219 newly-created Class F units at an average price of $34.79 per unit for aggregate proceeds of approximately $210.0 million. Subsequent to the offering, all of the Class F units were converted into common units. We have registered for resale all of the common units associated with the offering and the conversion of Class F units with the Securities and Exchange Commission. The proceeds from this equity placement, together with borrowings under our existing reserve-based credit facility, fully funded the purchase price of the acquisition.
Upon closing the transaction, we entered into derivative transactions to hedge a portion of the future expected production associated with this acquisition.
The total consideration paid was $234.3 million which consisted of $232.8 million in cash, net working capital of $2.3 million, and assumed liabilities of $0.8 million, primarily associated with asset retirement obligations on the properties. An amount of $8.5 million which was placed in a drilling escrow fund was returned to us for use in drilling programs on proved undeveloped locations after the close of the transaction. The following table summarizes the allocation of the purchase price to the assets acquired and liabilities assumed at the date of acquisition.
| Acquired July 25, 2007 | (in millions) | |||
| Oil and Natural Gas Properties |
$ | 183.0 | ||
| Unproved Properties |
38.4 | |||
| Pipelines |
5.0 | |||
| Other PP&E |
1.4 | |||
| Intangible Third Party Gas Contracts |
5.0 | |||
| Total assets acquired |
232.8 | |||
| Asset Retirement Obligation |
(0.8 | ) | ||
| Net Working Capital |
2.3 | |||
| Total |
$ | 234.3 | ||
The purchase price allocation is based on internal appraisals, evaluations of proved oil and natural gas reserves, discounted cash flows, quoted market prices, other estimates by management, and a valuation report.
EnergyQuest Acquisition
On April 23, 2007, we completed the acquisition of certain coalbed methane properties in the Cherokee Basin of Oklahoma and Kansas and interests in certain limited liability companies which own coalbed methane properties in the Cherokee Basin (the “EnergyQuest Assets”). In conjunction with the acquisition, we issued in a private placement 2,207,684 common units at a price of $26.12 per unit and 90,376 newly-created Class E units at a price of $25.84 per unit for aggregate proceeds of approximately $60.0 million. Subsequent to the offering,
129
Table of Contents
CONSTELLATION ENERGY PARTNERS LLC AND SUBSIDIARIES
NOTES TO CONSOLIDATED FINANCIAL STATEMENTS—(Continued)
all of the Class E units were converted into common units. We have registered for resale all of the common units associated with the offering and the conversion of the Class E units with the Securities and Exchange Commission. The proceeds from this equity placement, together with borrowings under our existing reserve-based credit facility, fully funded the purchase price of the acquisition. The results of operations include the results of EnergyQuest since the date of acquisition.
Upon closing of the acquisition, we entered into derivative transactions to hedge a portion of the future expected production associated with this acquisition.
The total consideration paid for EnergyQuest was $115.8 million which consisted of $117.0 million in cash and assumed liabilities of $1.2 million, primarily associated with asset retirement obligations on the properties. We also assumed an estimated asset retirement obligation of $1.1 million and other miscellaneous liabilities of $0.1 million. The following table summarizes the allocation of the purchase price to the assets acquired and liabilities assumed at the date of acquisition.
| Acquired April 23, 2007 | (in millions) | |||
| Oil and Natural Gas Properties |
$ | 105.1 | ||
| Pipelines |
5.7 | |||
| Investment in Unconsolidated Affiliates |
4.0 | |||
| Unproved Properties |
1.6 | |||
| Other Property, Plant and Equipment |
0.5 | |||
| Land |
0.1 | |||
| Total assets acquired |
117.0 | |||
| Asset retirement obligations |
(1.1 | ) | ||
| Other liabilities |
(0.1 | ) | ||
| Net assets acquired |
$ | 115.8 | ||
The purchase price allocation is based on internal appraisals, evaluations of proved oil and natural gas reserves, discounted cash flows, quoted market prices and other estimates by management.
Pro Forma Results
The unaudited pro forma results presented below have been prepared to give effect to the EnergyQuest, Amvest, Newfield, and CoLa acquisitions described above on our results of operations as if they had been consummated at the beginning of the period presented. The unaudited pro forma results do not purport to represent what our results of operations actually would have been if these acquisitions had been completed on such date or to project our results of operations for any future date or period.
| December 31, 2008 |
December 31, 2007 | |||||
| (In 000’s) | ||||||
| Pro forma: |
||||||
| Revenue |
$ | 166,573 | $ | 122,061 | ||
| Net income |
$ | 7,268 | $ | 14,381 | ||
| Basic earnings per share |
$ | 0.32 | $ | 0.64 | ||
| Diluted earnings per share |
$ | 0.32 | $ | 0.64 | ||
130
Table of Contents
CONSTELLATION ENERGY PARTNERS LLC AND SUBSIDIARIES
NOTES TO CONSOLIDATED FINANCIAL STATEMENTS—(Continued)
3. DERIVATIVE AND FINANCIAL INSTRUMENTS
Mark-to-Market Activities
We have hedged a portion of our expected natural gas sales from currently producing wells through December 2014. All of our swaps and basis swaps were accounted for as mark-to-market activities as of December 31, 2009.
At December 31, 2009, and December 31 2008, we had debt outstanding of $195.0 million and $212.5 million, respectively, under our reserve-based credit facility. We have entered into hedging arrangements in the form of interest rate swaps to reduce the impact of volatility stemming from changes in the London interbank offered rate (“LIBOR”) on $168.0 million of the outstanding debt through November 2012. All of our interest rate swaps are accounted for as mark-to-market activities as of December 31, 2009. Prior to February 2009, they were accounted for as cash flow hedges.
For 2009 and 2008, we recognized mark-to-market gains of approximately $19.4 million and $21.4 million, respectively, in connection with its commodity derivatives. At December 31, 2009 and December 31, 2008, the fair value of the derivatives accounted for as mark-to-market activities amounted to a net asset of approximately $58.0 million and a net asset of approximately $20.9 million, respectively.
Accumulated Other Comprehensive Income
Prior to the first quarter of 2009, we accounted for certain our commodity and interest rate derivatives as hedging activities. The value of the cash flow hedges included in Accumulated other comprehensive income (loss) on the Consolidated Balance Sheets was an unrecognized gain of approximately $28.4 million and an unrecognized gain of $50.1 million at December 31, 2009 and December 31, 2008, respectively. We expect that the unrecognized gain will be reclassified from Accumulated other comprehensive income (loss) to the income statement in the following periods due to the settlement of the hedged transaction:
| For the Quarter Ended |
Commodity Derivatives |
Interest Rate Derivatives |
Non- performance Risk |
Total AOCI | ||||||||||
| (In 000’s) | ||||||||||||||
| March 31, 2010 |
5,728 | (389 | ) | (52 | ) | 5,287 | ||||||||
| June 30, 2010 |
4,319 | — | (51 | ) | 4,268 | |||||||||
| September 30, 2010 |
3,726 | — | (54 | ) | 3,672 | |||||||||
| December 31, 2010 |
3,568 | — | (62 | ) | 3,506 | |||||||||
| March 31, 2011 |
922 | — | (28 | ) | 894 | |||||||||
| June 30, 2011 |
2,147 | — | (78 | ) | 2,069 | |||||||||
| September 30, 2011 |
1,921 | — | (78 | ) | 1,843 | |||||||||
| December 31, 2011 |
1,456 | — | (65 | ) | 1,391 | |||||||||
| March 31, 2012 |
718 | — | (22 | ) | 696 | |||||||||
| June 30, 2012 |
1,928 | — | (66 | ) | 1,862 | |||||||||
| September 30, 2012 |
1,721 | — | (63 | ) | 1,658 | |||||||||
| December 31, 2012 |
1,271 | — | (50 | ) | 1,221 | |||||||||
| Total |
$ | 29,425 | $ | (389 | ) | $ | (669 | ) | $ | 28,367 | ||||
131
Table of Contents
CONSTELLATION ENERGY PARTNERS LLC AND SUBSIDIARIES
NOTES TO CONSOLIDATED FINANCIAL STATEMENTS—(Continued)
Fair Value Measurements
We measure fair value of our financial and non-financial assets and liabilities on a recurring basis. Accounting standards define fair value, establish a framework for measuring fair value and require certain disclosures about fair value measurements for assets and liabilities measured on a recurring basis. All our derivative instruments are recorded at fair value in our financial statements. Fair value is the exit price that we would receive to sell an asset or pay to transfer a liability in an orderly transaction between market participants at the measurement date.
This following hierarchy prioritizes the inputs used to measure fair value. The three levels of the fair value hierarchy are as follows:
| • | Level 1 – Quoted prices available in active markets for identical assets or liabilities as of the reporting date. |
| • | Level 2 – Pricing inputs other than quoted prices in active markets included in Level 1 which are either directly or indirectly observable as of the reporting date. Level 2 consists primarily of non-exchange traded commodity derivatives. |
| • | Level 3 – Pricing inputs include significant inputs that are generally less observable from objective sources. |
We classify assets and liabilities within the fair value hierarchy based on the lowest level of input that is significant to the fair value measurement of each individual asset and liability taken as a whole. Certain of our derivatives are classified as Level 3 because observable market data is not available for all of the time periods for which we have derivative instruments. As observable market data becomes available for all of the time periods, these derivative positions will be reclassified as Level 2. The income valuation approach, which involves discounting estimated cash flows, is primarily used to determine recurring fair value measurements of our derivative instruments classified as Level 2 or Level 3. We prioritize the use of the highest level inputs available in determining fair value.
Our assessment of the significance of a particular input to the fair value measurement requires judgment and may affect the classification of assets and liabilities within the fair value hierarchy. Because of the long-term nature of certain assets and liabilities measured at fair value as well as differences in the availability of market prices and market liquidity over their terms, inputs for some assets and liabilities may fall into any one of the three levels in the fair value hierarchy. While we are required to classify these assets and liabilities in the lowest level in the hierarchy for which inputs are significant to the fair value measurement, a portion of that measurement may be determined using inputs from a higher level in the hierarchy.
The following tables sets forth by level within the fair value hierarchy our assets and liabilities that were measured at fair value on a recurring basis as of December 31, 2009, and December 31, 2008.
| At December 31, 2009 |
Level 1 | Level 2 | Level 3 | Netting and Cash Collateral* |
Total Fair Value |
|||||||||||||
| (In 000’s) | ||||||||||||||||||
| Risk management assets |
$ | — | $ | 62,894 | $ | (4,727 | ) | $ | — | $ | 58,167 | |||||||
| Risk management liabilities |
$ | — | $ | (208 | ) | $ | — | $ | — | $ | (208 | ) | ||||||
| Total |
$ | — | $ | 62,686 | $ | (4,727 | ) | $ | — | $ | 57,959 | |||||||
| * | All of our derivative instruments are secured by our reserve-based credit facility. |
132
Table of Contents
CONSTELLATION ENERGY PARTNERS LLC AND SUBSIDIARIES
NOTES TO CONSOLIDATED FINANCIAL STATEMENTS—(Continued)
| At December 31, 2008 |
Level 1 | Level 2 | Level 3 | Netting and Cash Collateral* |
Total Fair Value | ||||||||||
| (In 000’s) | |||||||||||||||
| Risk management assets |
$ | — | $ | 58,581 | $ | 6,752 | $ | — | $ | 65,333 | |||||
| Risk management liabilities |
$ | — | $ | — | $ | — | $ | — | $ | — | |||||
| Total |
$ | — | $ | 58,581 | $ | 6,752 | $ | — | $ | 65,333 | |||||
| * | All of our derivative instruments are secured by our reserve-based credit facilities. |
Risk management assets and liabilities in the table above represent the current fair value of all open derivative positions. We classify all of our derivative instruments as “Risk management assets” or “Risk management liabilities” in our Consolidated Balance Sheets.
We use observable market data or information derived from observable market data in order to determine the fair value amounts presented above. Prior to September 30, 2009, the valuation of our derivatives was performed by Constellation under a management services agreement (see Note 8). In order to determine the fair value amounts presented above, Constellation utilized various factors, including market data and assumptions that market participants would use in pricing assets or liabilities as well as assumptions about the risks inherent in the inputs to the valuation technique. These factors included not only the credit standing of the counterparties involved and the impact of credit enhancements (such as cash deposits, letters of credit and parental guarantees), but also the impact of our nonperformance risk on our liabilities. We currently use our reserve-based credit facility to provide credit support for our derivative transactions. Historically, in connection with certain of our acquisitions, we have used guarantees from Constellation to provide credit support for our derivative transactions associated with the acquisition volumes. As a result, we do not post cash collateral with our counterparties, nor make any adjustments for non-performance credit risk on our liabilities with counterparties. We utilize observable market data for credit default swaps to assess the impact of non-performance credit risk when evaluating our assets from counterparties. At December 31, 2009, the impact of non-performance credit risk on the valuation of our assets from counterparties was $0.6 million, of which $0.1 million was reflected as an increase to our non-cash market-to-market gain and $0.7 million was reflected as a reduction to our accumulated other comprehensive income. At December 31, 2008, the impact of non-performance credit risk on the valuation of our assets from counterparties was $0.9 million, of which $0.4 million was reflected as a reduction to our non-cash market-to-market gain and $0.5 million was reflected as a reduction to our accumulated other comprehensive income.
We use observable market data or information derived from observable market data to measure the fair value of our derivative instruments. Prior to September 30, 2009, in certain instances, Constellation may have utilized internal models to measure the fair value of our derivative instruments. Generally, Constellation used similar models to value similar instruments. Valuation models utilized various inputs which included quoted prices for similar assets or liabilities in active markets, quoted prices for identical or similar assets or liabilities in markets that were not active, other observable inputs for the assets or liabilities, and market-corroborated inputs, which were inputs derived principally from or corroborated by observable market data by correlation or other means.
133
Table of Contents
CONSTELLATION ENERGY PARTNERS LLC AND SUBSIDIARIES
NOTES TO CONSOLIDATED FINANCIAL STATEMENTS—(Continued)
The following table sets forth a reconciliation of changes in the fair value of risk management assets and liabilities classified as Level 3 in the fair value hierarchy:
| Three Months Ended December 31, 2009 (In 000’s) |
Twelve Months Ended December 31, 2009 (In 000’s) |
|||||||
| Balance at beginning of period |
$ | (6,168 | ) | $ | 6,752 | |||
| Realized and unrealized gains: |
||||||||
| Included in earnings |
(3,084 | ) | (12,923 | ) | ||||
| Included in other comprehensive income |
2,941 | 1,630 | ||||||
| Settlements |
1,584 | 5,349 | ||||||
| Transfers into and out of Level 3(a) |
— | (5,535 | ) | |||||
| Balance as of December 31, 2009 |
$ | (4,727 | ) | $ | (4,727 | ) | ||
| Change in unrealized gains relating to derivatives still held as of December 31, 2009 |
$ | (143 | ) | $ | 1,872 | |||
| (a) | Reflects transfers of derivatives from Level 3 to Level 2 because observable market data is available for all time periods for which we have derivative instruments. |
| Three Months Ended December 31, 2008 (In 000’s) |
Twelve Months Ended December 31, 2008 (In 000’s) |
|||||||
| Balance at beginning of period |
$ | (1,137 | ) | $ | (3,591 | ) | ||
| Realized and unrealized gains: |
||||||||
| Included in earnings |
8,228 | 10,464 | ||||||
| Included in other comprehensive income |
14,533 | 16,654 | ||||||
| Settlements |
(3,981 | ) | (5,884 | ) | ||||
| Transfers into and out of Level 3(a) |
(10,891 | ) | (10,891 | ) | ||||
| Balance as of December 31, 2008 |
$ | 6,752 | $ | 6,752 | ) | |||
| Change in unrealized gains (losses) relating to derivatives still held as of December 31, 2008 |
$ | 19,032 | $ | 20,404 | ||||
| (a) | Reflects transfers of derivatives from Level 3 to Level 2 because observable market data is available for all time periods for which we have derivative instruments. |
Fair Value of Financial Instruments
At December 31, 2009, the carrying values of cash and cash equivalents, accounts receivable, other current assets and current liabilities on the Consolidated Balance Sheets approximate fair value because of their short term nature. We believe the carrying value of long-term debt approximates its fair value because the interest rates on the debt approximate market interest rates for debt with similar terms, which represents the amount at which the instrument could be valued in an exchange during a current transaction between willing parties.
134
Table of Contents
CONSTELLATION ENERGY PARTNERS LLC AND SUBSIDIARIES
NOTES TO CONSOLIDATED FINANCIAL STATEMENTS—(Continued)
The following fair value disclosures are applicable to our financial statements as of December 31, 2009, and 2008:
| Fair Value of Asset/ (Liability) on Balance Sheet (in 000’s) |
||||||||||
| Derivative Type |
Location of Asset/ (Liability) on Balance Sheet |
Year Ended December 31, 2009 |
Year Ended December 31, 2008 |
|||||||
| Commodity-MTM |
Risk management assets | $ | 77,577 | $ | 26,934 | |||||
| Commodity-MTM |
Risk management assets | (14,683 | ) | (5,987 | ) | |||||
| Commodity-MTM |
Risk management liabilities | (208 | ) | — | ||||||
| Interest Rate-MTM |
Risk management assets | (4,727 | ) | — | ||||||
| Total MTM Derivatives | $ | 57,959 | $ | 20,947 | ||||||
| Commodity-Cash Flow |
Risk management assets | $ | — | $ | 52,232 | |||||
| Commodity-Cash Flow |
Risk management assets | — | (182 | ) | ||||||
| Interest Rate-Cash Flow |
Risk management assets | — | (7,665 | ) | ||||||
| Total Cash Flow Derivatives | $ | — | $ | 44,385 | ||||||
| Total Derivatives | $ | 57,959 | $ | 65,332 | ||||||
| Amount of Gain/(Loss) in Income (in 000’s) |
||||||||||
| Derivative Type |
Location of Gain/(Loss) in Income |
Quarter Ended December 31, 2009 |
Quarter Ended December 31, 2008 |
|||||||
| Commodity-MTM |
Gain/(Loss) from mark-to-market activities |
$ | 15,743 | $ | 17,389 | |||||
| Commodity-MTM |
Oil and gas sales | $ | 1,217 | $ | (742 | ) | ||||
| Interest Rate-MTM |
Interest expense | (143 | ) | — | ||||||
| Total MTM Derivatives | $ | 16,817 | $ | 16,647 | ||||||
| Amount of Gain/(Loss) in Income (in 000’s) |
||||||||||
| Derivative Type |
Location of Gain/(Loss) in Income |
Year Ended December 31, 2009 |
Year Ended December 31, 2008 |
|||||||
| Commodity-MTM |
Gain/(Loss) from mark-to-market activities |
$ | 16,572 | $ | 21,376 | |||||
| Commodity-MTM |
Oil and gas sales | $ | 13,141 | $ | (2,158 | ) | ||||
| Interest Rate-MTM |
Interest expense | (1,873 | ) | — | ||||||
| Total MTM Derivatives | $ | 27,840 | $ | 19,218 | ||||||
135
Table of Contents
CONSTELLATION ENERGY PARTNERS LLC AND SUBSIDIARIES
NOTES TO CONSOLIDATED FINANCIAL STATEMENTS—(Continued)
| Amount of Gain/ (Loss) Reclassified |
Amount of Gain/(Loss) | ||||||||||||||||
| from AOCI into Income—Effective (in 000’s) |
in Income—Ineffective (in 000’s) |
||||||||||||||||
| Derivative Type |
Location of Gain/(Loss) for Effective and Ineffective Portion of Derivative in Income |
Quarter Ended December 31, 2009 |
Quarter Ended December 31, 2008 |
Quarter Ended December 31, 2009 |
Quarter Ended December 31, 2008 |
||||||||||||
| Commodity-Cash Flow |
Gain/(Loss) from mark-to-market activities |
$ | 2,838 | $ | — | $ | — | $ | — | ||||||||
| Commodity-Cash Flow |
Oil and gas sales | $ | 9,920 | $ | 11,826 | $ | — | $ | (446 | ) | |||||||
| Interest Rate-Cash Flow |
Interest expense | (4,163 | ) | (516 | ) | — | — | ||||||||||
| Total Cash Flow | $ | 8,595 | $ | 11,310 | $ | — | $ | (446 | ) | ||||||||
| Amount of Gain/ (Loss) Reclassified |
Amount of Gain/(Loss) | ||||||||||||||||
| from AOCI into Income—Effective (in 000’s) |
in Income—Ineffective (in 000’s) |
||||||||||||||||
| Derivative Type |
Location of Gain/(Loss) for Effective and Ineffective Portion of Derivative in Income |
Year Ended December 31, 2009 |
Year Ended December 31, 2008 |
Year Ended December 31, 2009 |
Year Ended December 31, 2008 |
||||||||||||
| Commodity-Cash Flow |
Gain/(Loss) from mark-to-market activities |
$ | 2,838 | $ | — | $ | — | $ | — | ||||||||
| Commodity-Cash Flow |
Oil and gas sales | $ | 46,730 | $ | 1,929 | $ | 267 | $ | 1,189 | ||||||||
| Interest Rate-Cash Flow |
Interest expense | (7,276 | ) | (1,512 | ) | — | — | ||||||||||
| Total Cash Flow | $ | 42,292 | $ | 417 | $ | 267 | $ | 1,189 | |||||||||
As of December 31, 2009, we have interest rate swaps on $168.0 million of our outstanding debt through October 2012, various commodity swaps for 44,015,000 MMbtu of natural gas production through December 2014, and various basis swaps for 19,758,000 MMbtu of natural gas production in the Cherokee Basin through December 2012.
Credit Support Fee Agreements
In connection with our acquisitions during 2008 and 2007, Constellation entered into credit support agreements with us to provide guarantees to three banks that required credit support for certain financial derivatives. These guarantees were obtained because we did not own the assets at the time the derivatives were entered into and we could not use our existing reserve-based credit facilities to provide collateral for the derivative transactions. All of these guarantees have expired. For the period ended December 31, 2008, Constellation charged us $0.8 million for this credit support.
4. DEBT
Reserve-Based Credit Facility
On November 13, 2009, we entered into an amended and restated $350.0 million credit agreement with The Royal Bank of Scotland plc as administrative agent and a syndicate of lenders. The reserve-based credit facility amends, extends, and consolidates our previous reserve-based credit facilities and matures on November 13, 2012. Borrowings under the reserve-based credit facility are secured by various mortgages of oil and natural gas properties that we and certain of our subsidiaries own as well as various security and pledge agreements among
136
Table of Contents
CONSTELLATION ENERGY PARTNERS LLC AND SUBSIDIARIES
NOTES TO CONSOLIDATED FINANCIAL STATEMENTS—(Continued)
us and certain of our subsidiaries and the administrative agent. The current lenders and their percentage commitments in the reserve-based credit facility are: The Royal Bank of Scotland plc (26.83%), BNP Paribas (21.95%), The Bank of Nova Scotia (21.95%), Wells Fargo Bank, N.A. (14.63%), and Societe Generale (14.63%).
The amount available for borrowing at any one time under the reserve-based credit facility is limited to the borrowing base for our oil and natural properties in Alabama, Kansas, and Oklahoma. As of December 31, 2009, our borrowing base was $205.0 million. The borrowing base is redetermined semi-annually, and may be redetermined at our request more frequently and by the lenders, in their sole discretion, based on reserve reports as prepared by petroleum engineers, together with, among other things, the oil and natural gas prices prevailing at such time. Outstanding borrowings in excess of our borrowing base must be repaid or we must pledge other oil and natural gas properties as additional collateral. We may elect to pay any borrowing base deficiency in three equal monthly installments such that the deficiency is eliminated in a period of three months. Any increase in our borrowing base must be approved by all of the lenders.
Borrowings under the reserve-based credit facility are available for acquisition, exploration, operation and maintenance of oil and natural gas properties, payment of expenses incurred in connection with the reserve-based credit facility, working capital and general limited liability company purposes. The reserve-based credit facility has a sub-limit of $20.0 million which may be used for the issuance of letters of credit. As of December 31, 2009, no letters of credit are outstanding.
At our election, interest for borrowings are determined by reference to (i) the London interbank rate, or LIBOR, plus an applicable margin between 2.50% and 3.50% per annum based on utilization or (ii) a domestic bank rate (“ABR”) plus an applicable margin between 1.50% and 2.50% per annum based on utilization plus (iii) a commitment fee of 0.50% per annum based on the unutilized borrowing base. Interest on the borrowings for ABR loans and the commitment fee are generally payable quarterly. Interest on the borrowings for LIBOR loans are generally payable at the applicable maturity date.
The reserve-based credit facility contains various covenants that limit, among other things, our ability and certain of our subsidiaries’ ability to incur certain indebtedness, grant certain liens, merge or consolidate, sell all or substantially all of our assets, make certain loans, acquisitions, capital expenditures and investments, and make distributions to unitholders.
In addition, we required to maintain (i) a ratio of Total Net Debt (defined as Debt (generally indebtedness permitted to be incurred by us under the reserve-based credit facility) less Available Cash (generally, cash, cash equivalents, and cash reserves of the Company) to Adjusted EBITDA (defined as, for any period, the sum of consolidated net income for such period plus (minus) the following expenses or charges to the extent deducted from consolidated net income in such period: interest expense, depreciation, depletion, amortization, write-off of deferred financing fees, impairment of long-lived assets, (gain) loss on sale of assets, (gain) loss from equity investment, accretion of asset retirement obligation, unrealized (gain) loss on natural gas derivatives and realized (gain) loss on cancelled natural gas derivatives, and other similar charges) of not more than 3.75 to 1.00 through September 30, 2010 and 3.50 to 1.00 thereafter; (ii) Adjusted EBITDA to cash interest expense of not less than 2.5 to 1.0; and (iii) consolidated current assets, including the unused amount of the total commitments but excluding current non-cash assets, to consolidated current liabilities, excluding non-cash liabilities and current maturities of debt (to the extent such payments are not past due), of not less than 1.0 to 1.0, all calculated pursuant to the requirements under SFAS 133 and SFAS 143 (including the current liabilities in respect of the termination of natural gas and interest rate swaps). All financial covenants are calculated using our consolidated financial information.
137
Table of Contents
CONSTELLATION ENERGY PARTNERS LLC AND SUBSIDIARIES
NOTES TO CONSOLIDATED FINANCIAL STATEMENTS—(Continued)
The reserve-based credit facility also includes customary events of default, including events of default relating to non-payment of principal, interest or fees, inaccuracy of representations and warranties in any material respect when made or when deemed made, violation of covenants, cross-defaults, bankruptcy and insolvency events, certain unsatisfied judgments, guaranties not being valid under the reserve-based credit facility and a change of control. If an event of default occurs, the lenders will be able to accelerate the maturity of the reserve-based credit facility and exercise other rights and remedies. The reserve-based credit facility contains a condition to borrowing and a representation that no material adverse effect (“MAE”) has occurred, which includes, among other things, a material adverse change in, or material adverse effect on the business, operations, property, liabilities (actual or contingent) or condition (financial or otherwise) of us and our subsidiaries who are guarantors taken as a whole. If a MAE were to occur, we would be prohibited from borrowing under the reserve-based credit facility and would be in default, which could cause all of our existing indebtedness to become immediately due and payable.
We have the ability to pay distributions to unitholders from available cash, including cash from borrowings under the reserve-based credit facility, as long as no event of default exists and provided that no distributions to unitholders may be made if the borrowings outstanding, net of available cash, under the reserve-based credit facility exceed 90% of the borrowing base, after giving effect to the proposed distribution. Our available cash excludes any cash reserves as established by our board of managers for the proper conduct of our business and the payment of fees and expenses. As of December 31, 2009, we are restricted from paying distributions to unitholders as the borrowings outstanding, net of available cash, under the reserve-based credit facility exceed 90% of the borrowing base.
The reserve-based credit facility permits us to hedge our projected monthly production, provided that (a) for the immediately ensuing twelve month period, the volumes of production hedged in any month may not exceed our reasonable business judgment of the production for such month consistent with the application of petroleum engineering methodologies for estimating proved developed producing reserves based on the then strip pricing (provided that such projection shall not be more than 115% of the proved developed producing reserves forecast for the same period derived from the most recent reserve report of our petroleum engineers using the then strip pricing), and (b) for the period beyond twelve months, the volumes of production hedged in any month may not exceed the reasonably anticipated projected production from proved developed producing reserves estimated by our petroleum engineers. The reserve-based credit facility also permits us to hedge the interest rate on up to 90% of the then-outstanding principal amounts of our indebtedness for borrowed money.
The reserve-based credit facility contains no covenants related to our relationship with Constellation or Constellation’s right to appoint all of the Class A managers of our board of managers.
Debt Issue Costs
Total debt issue costs incurred through December 31, 2009, were approximately $5.0 million. These costs are being amortized over the life of the reserve-based credit facility.
Funds Available for Borrowing
As of December 31, 2009, we had $195.0 million in outstanding debt under our reserve-based credit facility and $10.0 million in remaining borrowing capacity. As of December 31, 2008, we had $212.5 million in outstanding debt under our reserve-based credit facilities. See Note 17 for additional information.
138
Table of Contents
CONSTELLATION ENERGY PARTNERS LLC AND SUBSIDIARIES
NOTES TO CONSOLIDATED FINANCIAL STATEMENTS—(Continued)
Compliance with Financial Covenants
At December 31, 2009, we believe that we were in compliance with the financial covenant ratios contained in our reserve-based credit facility. We monitor compliance on an ongoing basis. As of December 31, 2009, our actual total net debt to annual adjusted EBITDA ratio was 2.7 to 1.0 as compared with a required ratio of not greater than 3.75 to 1.0, our actual ratio of current assets to current liabilities was 1.91 to 1.0 as compared with a required ratio of not less than 1.0 to 1.0, and our actual quarterly adjusted EBITDA to cash interest expense ratio was 16.5 to 1.0 as compared with a required ratio of not less than 2.5 to 1.0.
If we are unable to remain in compliance with the financial covenants associated with our reserve-based credit facility or maintain the required ratios discussed above, we could request waivers from the lenders in our bank group. Although the lenders may not provide a waiver, we could take additional steps in the event of not meeting the required ratios or in the event of a reduction in the borrowing base below its current level of $205.0 million at one of the future redeterminations by the lenders. If it becomes necessary to pay debt down beyond operating cash flows, we could further reduce capital expenditures, continue to suspend our quarterly distributions to unitholders, sell oil and natural gas properties, liquidate in the money derivative positions, further reduce operating and administrative costs, or take additional steps to increase liquidity. If we were unable to obtain a waiver and were unsuccessful at reducing our debt to the then necessary level, our debt could become due and payable upon acceleration by the lenders. To the extent that we do not enter into an agreement to refinance or extend the due date on the reserve-based credit facility, the outstanding debt balance at November 13, 2011, will become a current liability.
5. OIL AND NATURAL GAS PROPERTIES
Natural gas properties consist of the following:
| December 31, 2009 |
December 31, 2008 |
December 31, 2007 |
||||||||||
| (In 000’s) | ||||||||||||
| Oil and natural gas properties and related equipment (successful efforts method) |
||||||||||||
| Property (acreage) costs |
||||||||||||
| Proved property |
$ | 756,461 | $ | 729,898 | $ | 635,224 | ||||||
| Unproved property |
37,147 | 38,293 | 39,018 | |||||||||
| Total property costs |
793,608 | 768,191 | 674,242 | |||||||||
| Materials and supplies |
4,312 | 4,587 | 2,880 | |||||||||
| Land |
912 | 912 | 902 | |||||||||
| Total |
798,832 | 773,690 | 678,024 | |||||||||
| Less: Accumulated depreciation, depletion and amortization |
(186,207 | ) | (111,171 | ) | (34,371 | ) | ||||||
| Natural gas properties and equipment, net |
$ | 612,625 | $ | 662,519 | $ | 643,653 | ||||||
Impairment of Oil and Natural Gas Properties
In 2009, we recorded a charge of approximately $4.8 million to impair the value of certain of our wells located in the Woodford Shale in Oklahoma and approximately $0.3 million to impair the value of certain obsolete inventory and straight-line assets. This charge is included in depreciation, depletion and amortization in the Consolidated Statement of Operations. This impairment was recorded because the carrying value of certain of the wells exceeded the fair value of the wells as measured by estimated cash flows reported in a third party reserve report that was based upon future expected oil and natural gas prices, which are based on observable inputs adjusted for basis differentials, which are level two inputs. The impairment is primarily caused by the impact of lower future expected natural gas prices. Cash flow estimates for the impairment testing exclude
139
Table of Contents
CONSTELLATION ENERGY PARTNERS LLC AND SUBSIDIARIES
NOTES TO CONSOLIDATED FINANCIAL STATEMENTS—(Continued)
derivative instruments. As of December 31, 2009, we reviewed our other properties for impairment and the estimated undiscounted future cash flows exceeded the net capitalized costs, thus no impairment was required to be recognized. If expected future oil and natural gas prices continue to decline during 2010, the estimated undiscounted future cash flows for our proved oil and natural gas properties may not exceed the net capitalized costs for our properties in the Cherokee Basin or in the Woodford Shale and a non-cash impairment charge may be required to be recognized in future periods.
In 2008, we recorded a charge of $25.7 million to impair the value of our 83 well bores located in the Woodford Shale in Oklahoma. This charge is included in depreciation, depletion and amortization in the Consolidated Statement of Operations. This impairment was recorded because the carrying value of the asset exceeded the fair value of the asset as measured by estimated cash flows reported in a third party reserve report that was based upon future expected oil and natural gas prices, which are based on observable inputs adjusted for basis differentials, which are level two inputs. The impairment is primarily caused by the impact of lower production volumes than originally estimated, a higher initial production decline rate, and lower future expected natural gas prices. Cash flow estimates for the impairment testing exclude derivative instruments. As of December 31, 2008, we reviewed our other properties for impairment and the estimated undiscounted future cash flows exceeded the net capitalized costs, thus no impairment was required to be recognized. As of December 31, 2007 and 2006, the estimated undiscounted future cash flows for all of our proved oil and natural gas properties exceeded the net capitalized costs, thus no impairment was required to be recognized.
Asset Sales
In 2009, we sold two tractors, casing, a ditch witch, and other miscellaneous equipment for approximately $0.1 million and recorded a loss of approximately $0.03 million on the sales.
In 2008, we sold an international pulling unit, a trencher, and other miscellaneous equipment for approximately $0.2 million and recorded a gain of approximately $0.1 million on the sales.
In 2007, we sold a surplus compressor for $0.2 million and recorded a $0.1 million loss on the sale.
Involuntary Conversion
In 2008, a fire damaged our field office located in Dewey, Oklahoma. The net book value of the building was $0.2 million. A gain of $0.2 million was recorded for the involuntary conversion as the insurance proceeds of $0.4 million exceeded the book value of the building.
Useful Lives
Our furniture, fixtures, and equipment are depreciated over a life of one to five years, buildings are depreciated over a life of twenty years, and pipeline and gathering systems are depreciated over a life of twenty-five to forty years.
Exploration and Dry Hole Costs
Our exploration and dry hole costs were $0.9 million, $0.4 million, and $0.3 million in 2009, 2008, and 2007, respectively. These costs represent abandonments of drilling locations, dry hole costs, delay rentals, geological and geophysical costs, and the impairment, amortization, and abandonment associated with leases on our unproved properties.
140
Table of Contents
CONSTELLATION ENERGY PARTNERS LLC AND SUBSIDIARIES
NOTES TO CONSOLIDATED FINANCIAL STATEMENTS—(Continued)
6. BENEFIT PLANS
Eligible employees of CEP participate in an employment savings plan. Matching contributions made by us were approximately $0.6 million and $0.1 million for the years ended December 31, 2009, and 2008, respectively.
7. RELATED PARTY TRANSACTIONS
Management Services Agreement
In November 2006, we entered into a management services agreement with Constellation Energy Partners Management, LLC (“CEPM”), a subsidiary of Constellation, to provide certain management, technical and administrative services. In June 2009, CEPM notified us that it would terminate the management services agreement effective December 15, 2009. As a result, we submitted a plan to our lenders for managing our business after the termination of the agreement as required under the terms of our existing reserve-based credit facilities. The plan has received the requisite approval that was required.
The services provided under the agreement included legal, accounting and finance, engineering and technical, risk management, information technology and tax services, as well as acquisition services related to opportunities to acquire oil and natural gas reserves and related midstream assets. CEPM and its affiliates did not have any obligation to provide acquisition services or other services under the management services agreement. Each quarter, CEPM charged us an amount for services provided to us. This amount was agreed to annually and includes a portion of the compensation paid by CEPM and its affiliates to personnel who spend time on our business and affairs. The allocation of compensation expense for the chief executive officer, chief financial officer and chief accounting officer was fixed by agreement between the parties for 2008 and 2007. The allocation of compensation expense for other personnel of CEPM and its affiliates was determined based on the percentage of time spent by such personnel on our business and affairs. The conflicts committee board of managers reviewed at least annually the services that were provided by CEPM and the costs that were charged to us under the management services agreement and reviewed the cost allocation quarterly. The conflicts committee also determined if the amounts to be paid by us for the services to be performed were fair to and in the best interests of the Company. During the year, the cost allocation may have been adjusted upwards to reflect additional services provided by CEPM and its affiliates or downwards to reflect the transition of services to CEP employees. These costs totaled approximately $1.4 million, $2.9, and $1.4 million for the year ended December 31, 2009, 2008 and 2007, respectively. The costs charged to us under the management services agreement may be greater or less than the actual costs we would have incurred if the services were performed by an unaffiliated third party.
We had payables to Constellation of $0.2 million and $1.0 million as of December 31, 2009 and 2008, respectively. This payable balance is included in current liabilities in the accompanying balance sheets.
Credit Support Fee Agreements
As described further in Note 3, we entered into credit support fee agreement with CEG under which CEG guaranteed credit support for certain financial derivatives with three financial institutions. These credit support fee agreement have expired. CEG charged us $0.8 million for the credit support during 2008 and 2007.
Natural Gas Purchases
Through March 31, 2009, CCG purchased natural gas from us in the Cherokee Basin. The arrangement was reviewed by the conflicts committee of our board of managers. The committee found that the arrangement was
141
Table of Contents
CONSTELLATION ENERGY PARTNERS LLC AND SUBSIDIARIES
NOTES TO CONSOLIDATED FINANCIAL STATEMENTS—(Continued)
fair to and in the best interests of the Company. For the twelve months ended December 31, 2009, and December 31, 2008, CCG paid us $5.7 million and $24.1 million for natural gas purchases, respectively. During 2007, the marketing arrangement for the CCG purchases was administered by Newfield under a transition services agreement.
Management Incentive Interests
CEPM holds the management incentive interests in CEP. These management incentive interests represent the right to receive 15% of quarterly distributions of available cash from operating surplus after the Target Distribution (as defined in our limited liability company agreement) has been achieved and certain other tests have been met. For the twelve months ended December 31, 2009, none of these applicable tests have been met, and, as a result, CEPM was not entitled to receive any management incentive interest distributions. For the third quarter 2007, we increased our distribution rate to $0.5625 per unit. This increase in the distribution rate commenced a management incentive interest vesting period under our operating agreement. Through December 31, 2008, a cash reserve of $0.7 million had been established to fund future distributions on the management incentive interests. In February 2009, we reduced our distribution rate to $0.13 per unit. This decrease in the distribution rate terminated the initial management incentive interest vesting period. After the February 13, 2009 distribution was paid, the reserve was reduced to zero.
CoLa Acquisition
As further described in Note 2, on March 31, 2008, we acquired 83 non-operated producing oil and natural gas wells in the Woodford Shale in the Arkoma Basin in Oklahoma from CoLa for approximately $50.2 million, including purchase price adjustments through December 31, 2008. CoLa is an affiliate of CEG, our former sponsor. The transaction was reviewed and approved by our conflicts committee. In its review, our conflicts committee considered various economic factors (including historical and estimated future production, estimated proved reserves, future pricing estimates and operating cost estimates) regarding the transaction, and determined that the transaction was fair to and in the best interests of the Company.
At December 31, 2009 we had a payable to CCG of $0.4 million for revenues and tax credits received for time periods when CCG owned the 83 well bores. This payable balance is included in current liabilities in the accompanying balance sheets.
Equity Contributions
During the year ended December 31, 2008, CEPM agreed to waive payment in cash of its third quarter 2008 fees to be billed to us in an amount equal to one-half of our incurred fees and expenses in connection with the Torch arbitration, up to a maximum of $0.6 million. CEPM has also agreed to waive payment in cash of its third quarter 2008 fees of $0.25 million for costs associated with the retention of a strategic advisor.
8. COMMITMENTS AND CONTINGENCIES
In the course of its normal business affairs, we are subject to possible loss contingencies arising from federal, state and local environmental, health and safety laws and regulations and third-party litigation. As of December 31, 2009 and December 31, 2008, other than the matters discussed below, there were no matters which, in the opinion of management, would have a material adverse effect on the financial position, results of operations or cash flows of CEP, and its subsidiaries, taken as a whole.
142
Table of Contents
CONSTELLATION ENERGY PARTNERS LLC AND SUBSIDIARIES
NOTES TO CONSOLIDATED FINANCIAL STATEMENTS—(Continued)
Certain of our wells in the Robinson’s Bend Field are subject to a net profits interest (“NPI”) held by Torch Energy Royalty Trust (the “Trust”) (See Note 10). The royalty payment to the Trust is calculated using a sharing arrangement with a pricing formula that has had the effect of keeping our payments to the Trust lower than if such payments had been calculated based on prevailing market prices. We are uncertain of the financial impact of the NPI over the life of the Robinson’s Bend Field as it has volumetric and price risk variables. However, in order to address a portion of the risk of the potential adverse impact on our operating results from a termination of the sharing arrangement, Constellation Holdings, Inc. (“CHI”) contributed $8.0 million to us in exchange for all of our Class D interests at the closing of its initial public offering in November 2006 for the purpose of partially protecting the distributions to the common unit holders in the event the sharing arrangement is terminated. This contribution will be returned to CHI in 24 special quarterly distributions as long as the sharing agreement remains in effect for the distribution period. As a result of the initiation of the legal proceedings discussed in Note 10 and Note 17, the Class D interest special quarterly distributions have been suspended for all quarters commencing on or after January 1, 2008. This suspension includes approximately $2.3 million which represents the distributions that were suspended for the quarterly periods ended September 30, 2009, June 30, 2009, March, 31, 2009, and December 31, September 30, June 30, and March 31, 2008. The remaining undistributed amount of the Class D interests is $6.7 million. See Note 17 for additional information.
9. ASSET RETIREMENT OBLIGATION
We recognize the fair value of a liability for an asset retirement obligation (“ARO”) in the period in which it is incurred if a reasonable estimate of fair value can be made. Each period, we accrete the ARO to its then present value. The associated asset retirement cost (“ARC”) is capitalized as part of the carrying amount of our natural gas properties equipment and facilities. Subsequently, the ARC is depreciated using a systematic and rational method over the asset’s useful life. The ARO’s recorded by us relate to the plugging and abandonment of natural gas wells, and decommissioning of the gas gathering and processing facilities.
Inherent in the fair value calculation of ARO are numerous assumptions and judgments including the ultimate settlement amounts, inflation factors, credit adjusted discount rates, timing of settlement and changes in the legal, regulatory, environmental and political environments. To the extent future revisions to these assumptions result in adjustments to the recorded fair value of the existing ARO, a corresponding adjustment is made to the ARC capitalized as part of the oil and natural gas property balance.
The following table is a reconciliation of the ARO:
| December 31, 2009 |
December 31, 2008 |
December 31, 2007 | |||||||
| (In 000’s) | |||||||||
| Asset retirement obligation, beginning balance |
$ | 6,754 | $ | 6,163 | $ | 2,730 | |||
| Liabilities incurred from acquisition of the properties (Note 2) |
— | 56 | 3,056 | ||||||
| Liabilities incurred |
3,861 | 124 | 65 | ||||||
| Revisions to prior estimates |
1,108 | — | — | ||||||
| Accretion expense |
406 | 411 | 312 | ||||||
| Asset retirement obligation, ending balance |
$ | 12,129 | $ | 6,754 | $ | 6,163 | |||
Additional retirement obligations increase the liability associated with new oil and natural gas wells and other facilities as these obligations are incurred. Actual expenditures for abandonments of oil and natural gas wells and other facilities reduce the liability for asset retirement obligation. In 2009, 2008, and 2007, there were no material expenditures for abandonments and there were no assets legally restricted for purposes of settling existing asset retirement obligations.
143
Table of Contents
CONSTELLATION ENERGY PARTNERS LLC AND SUBSIDIARIES
NOTES TO CONSOLIDATED FINANCIAL STATEMENTS—(Continued)
10. NET PROFITS INTEREST
Certain of our wells in the Robinson’s Bend Field are subject to a non-operating NPI. The holder of the NPI, the Trust, does not have the right to receive production from the applicable wells in the Robinson’s Bend Field. Instead, the Trust only has the right to receive a specified portion of the future natural gas sales revenues from specified wells as defined by the Net Overriding Royalty Conveyance Agreement. We record the NPI as an overriding royalty interest net in revenue in the Consolidated Statements of Operations.
Amounts due to the Trust with respect to NPI are comprised of the sum of the Net Proceeds and the Infill Net Proceeds, which are described below.
The Net Proceeds equal the lesser of (i) 95% of the net proceeds from 393 producing wells in the Robinson’s Bend Field and (ii) the net proceeds from the sale of 912.5 MMcf of natural gas for the quarter. Net proceeds equal gross proceeds, currently calculated by reference to the gas purchase contract, less specified costs attributable to the Robinson’s Bend Assets. The specified costs deducted for purposes of calculating net proceeds for purposes of clause (i) of the first sentence of this paragraph (the NPI Net Proceeds Calculation) include: (a) delay rentals, shut-in royalties and similar payments, (b) property, production, severance and similar taxes and related audit charges, (c) specified refunds, interest or penalties paid to purchasers of hydrocarbons or governmental agencies, (d) certain liabilities for environmental damage, personal injury and property damage, (e) certain litigation costs, (f) costs of environmental compliance, (g) specified operating costs incurred to produce hydrocarbons, (h) specified development costs (including costs to increase recoverable reserves or the timing of recovery of such reserves), (i) costs of specified lease renewals and extensions and unitization costs and (j) the unrecovered portion, if any, of the foregoing costs for preceding time periods plus interest on such unrecovered portion at a rate equal to the base rate (compounded quarterly) as announced from time to time by Citibank, N.A. The specified costs deducted for purposes of calculating net proceeds for purposes of clause (ii) of the first sentence of this paragraph include: (a) property, production, severance and similar taxes, (b) specified refunds, interest or penalties paid to purchasers of hydrocarbons or governmental agencies and (c) the unrecovered portion, if any, of the foregoing costs for preceding time periods plus interest on such unrecovered portion at a rate equal to the base rate (compounded quarterly) as announced from time to time by Citibank, N.A. Net proceeds are calculated quarterly and any negative balance (expenses in excess of revenues) within the “net proceeds” calculation accumulates and is charged interest as described above.
The cumulative “Net NPI Proceeds” balance must be greater than $0 before any payments are made to the Trust. The cumulative Net Proceeds was a deficit for the 2009 and 2008. As a result, no payments were made to the Trust with respect to the NPI for the 2009 and 2008.
The calculation of the Infill Net Proceeds uses the same methodology as the NPI Net Proceeds Calculation described above except that the proceeds and costs are attributable not to the NPI Net Proceeds Wells, but to the remaining wells in the Robinson’s Bend Field that are subject to the NPI and that have been drilled since the Trust was formed and wells that will be drilled (other than wells drilled to replace damaged or destroyed wells), in each case on leases subject to the NPI. The NPI in the Infill Wells entitles the Trust to receive 20% of the Infill Net Proceeds. There has never been a payout on the Infill Net Proceeds.
Termination of the Trust and Gas Purchase Contract
On January 29, 2008, the unitholders of the Trust voted to terminate the Trust and the trust agreement and authorized the Trustee to wind up, liquidate and distribute the assets held by the Trust under the terms of the trust agreement. The gas purchase contract, by its terms, was also terminated on January 29, 2008 as a result of the termination of the Trust. With the gas purchase contract terminated, we are no longer obligated to sell gas
144
Table of Contents
CONSTELLATION ENERGY PARTNERS LLC AND SUBSIDIARIES
NOTES TO CONSOLIDATED FINANCIAL STATEMENTS—(Continued)
produced from our interest in the Black Warrior Basin pursuant to the gas purchase contract. Notwithstanding the termination of the gas purchase contract, the NPI will continue to burden the Trust Wells, and it should continue to be calculated as if the gas purchase contract were still in effect, regardless of what proceeds may actually be received by us as the seller of the gas. As a result of the termination of the Trust, certain water gathering, separation and disposal costs, which are a component of the NPI calculation, increased from $0.53 per barrel to $1.00 per barrel pursuant to the Water Gathering and Disposal Agreement dated August 9, 1990, as amended; the amounts of the water gathering, separation and disposal costs are set forth in such agreement.
Litigation Related to Trust Termination
On January 25, 2008, Torch Royalty Company, Torch E&P Company, and CEP (collectively, the “Claimants”) commenced an arbitration proceeding before Judicial Arbitration and Mediation Services against Wilmington Trust Company, as Trustee (“Trustee”) for the Trust, and to Capital One, NA, as successor to Hibernia National Bank, as trustee for Torch Energy Louisiana Royalty Trust, pursuant to the operative dispute resolution provisions of the agreement governing the Trust, the NPI and the Conveyances (as defined below). The Claimants were working interest owners in certain oil and gas fields located in Texas, Louisiana and Alabama. The working interests owned by the other Claimants were similarly subject to net profit interests (the “Other NPIs”) that were also based on the gas purchase contract. The Claimants sought a declaratory judgment that the NPI payments as well as the payments owed in respect of the Other NPIs will continue to be calculated using the sharing arrangement under the gas purchase contract even though the Trust and the gas purchase contract were terminated. The Trustee took the position that the sharing arrangement under the gas purchase contract terminated upon the termination of the gas purchase contract. Trust Venture Company, LLC (“Trust Venture”) was permitted to intervene in the proceeding under an agreement whereby Trust Venture and its affiliates agreed to be bound by the formal award in the proceeding. On July 18, 2008, the arbitration panel issued its final award which, among other things, found and concluded that the sharing arrangement and other pricing terms of the gas purchase contract will continue to control the amount owed to the holder of the NPI, and on December 10, 2008, the District Court of Harris County, Texas, 152nd Judicial District, dismissed the appeal of the final award filed by the Trustee and Trust Venture and confirmed the final award.
On January 8, 2009, we were served by Trust Venture, on behalf of the Trust, with a purported derivative action filed in Alabama state court demanding an audited statement of revenues and expenses associated with the NPI, alleging a breach of contract under the conveyance associated with the NPI and the agreement establishing the Trust and asserting that above market rates for services were paid, reducing the amounts paid to the Trust in connection with the NPI. The lawsuit seeks unspecified damages and an accounting of the NPI. The Alabama court has made the Trust a nominal party to the Alabama litigation and ruled that the Trust is subject to regular discovery in the litigation. On August 18, 2009, Trust Venture filed an application for preliminary injunction requesting that the Alabama court enter an injunction requiring the Company to deposit into an escrow account all fees, less expenses, that it receives from water disposal under the Water Gathering and Disposal Agreement pending judgment in the lawsuit and asserting damages of approximately $11.6 million from June 2005 to May 2009. These alleged damages appear to be calculated based on a water gathering, separation and disposal fee of $0.05 per barrel notwithstanding the provisions of the Water Gathering and Disposal Agreement. After hearing, the Alabama court denied Trust Venture’s application. Trust Venture has also recently filed a motion for partial summary judgment seeking a determination regarding the applicability of a provision in the Conveyance related to the calculation of water handling charges. That motion is set for hearing at the end of March 2009. No trial date has been set in the litigation. We intend to defend ourselves vigorously with respect to the alleged claims. There can be no assurance as to the outcome or result of the lawsuit or the arbitration proceeding. We intend our forward-looking statements relating to the action to speak only as of the time of such statements and do not plan to update or revise them except to the extent that material information becomes available.
145
Table of Contents
CONSTELLATION ENERGY PARTNERS LLC AND SUBSIDIARIES
NOTES TO CONSOLIDATED FINANCIAL STATEMENTS—(Continued)
11. ENVIRONMENTAL LIABILITY
We are subject to costs resulting from federal, state and local laws and regulations designed to protect human health and the environment. These laws and regulations can result in increased capital, operating and other costs as a result of compliance, remediation, containment and monitoring obligations. As of December 31, 2009 and 2008, accrued environmental obligations were $0.2 million and $0.4 million, respectively. These obligations were classified as current liabilities on our Consolidated Balance Sheets.
12. UNIT-BASED COMPENSATION
We recognized approximately $1.3 million and $0.3 million of non-cash unit-based compensation expense related to grants made under its Long-term Incentive Plan, the Executive Inducement Bonus Program, and the 2009 Omnibus Incentive Compensation Plan in 2009, and 2008, respectively.
Adoption of the Executive Inducement Bonus Program
An Executive Inducement Bonus Program was adopted and approved by our board of managers on April 28, 2009. The plan was created without unitholder approval in reliance on the exemption provided in the NYSE Arca rules. On May 7, 2009, we filed a registration statement with the SEC on Form S-8 for 300,000 common units associated with grants under this program made to our executives described below. After the initial grants have been made, the only additional common units that can be issued under this program are for distribution rights in connection with distribution credits as described below.
Adoption of the 2009 Omnibus Incentive Compensation Plan
A 2009 Omnibus Incentive Compensation Plan containing 1,650,000 common units was adopted and approved by our board of managers on April 28, 2009, subject to approval by our common unitholders. The plan was approved by the common unitholders on December 1, 2009, and all outstanding grants at that time were automatically converted into the same number of restricted common units which are settled in common units and not cash.
2009 Grants
Grants under the 2009 Omnibus Incentive Compensation Plan
We granted approximately 959,914 notional unit awards to certain employees in Texas and 80,937 notional unit awards to our three independent managers under the 2009 Omnibus Incentive Compensation Plan prior to the plan’s approval by our common unitholders. Upon the plan’s approval on December 1, 2009, these notional units were converted into restricted common units. These units had a total fair market value of approximately $3,518,076 based on the closing price of our common units on NYSE Arca on December 1, 2009. Additionally, in December 2009 we granted approximately 36,170 restricted common units to certain employees in Texas. These units had a total fair market value of approximately $127,327 based on the closing price of our common units on NYSE Arca on their grant dates. All of these service-based restricted units will vest on a five year ratable schedule beginning in 2010 expect those granted to our three independent managers which vest in full in March 2010.
Prior to vesting, these restricted common units do not have the right to receive cash distributions paid by us on our common units. Instead, each such unvested restricted common unit carries the right to receive distribution credits when any distributions are made by us on our common units. Any distribution credits will accrue and be
146
Table of Contents
CONSTELLATION ENERGY PARTNERS LLC AND SUBSIDIARIES
NOTES TO CONSOLIDATED FINANCIAL STATEMENTS—(Continued)
settled in cash or common units, in the discretion of the compensation committee, upon the vesting of the underlying restricted common unit. As of December 31, 2009, a total of 33,467 notional units have been issued as distribution credits.
Until the notional units granted under 2009 Omnibus Incentive Compensation Plan were converted into restricted common units upon unitholder approval, the notional units were accounted for using the variable plan accounting method. Under the variable method, compensation costs were measured using the quoted market price of our common units on each measurement date and multiplying the compensation cost by the percentage of the vesting period served through the measurement date. Increases or decreases in the quoted market price of the common units between the date of the grant and each measurement date resulted in a change in the compensation expense recognized for the notional units.
Grants under the Executive Inducement Bonus Program
On May 1, 2009, we made grants of an aggregate of 161,871 restricted common units under the Executive Inducement Bonus Program to induce four executives to become employed by us, with an approximate aggregate grant-date value of $500,181 based on the closing price per unit on May 1, 2009. The units will vest 50% on January 1, 2010, and 50% on January 1, 2011.
Prior to vesting, these restricted common units do not have the right to receive cash distributions paid by us on our common units. Instead, each such unvested restricted common unit carries the right to receive distribution credits when any distributions are made by us on our common units. Any distribution credits will accrue and be settled in cash or common units, in the discretion of the compensation committee, upon the vesting of the underlying restricted common unit. As of December 31, 2009, a total of 5,612 restricted units have been issued as distribution credits.
2009 Grants
Grants under the Long-Term Incentive Program
We granted approximately 163,340 restricted common unit awards under the Long-Term Incentive Plan on August 1, 2009, to certain field employees in Alabama, Kansas, and Oklahoma. These units had a total fair market value of approximately $529,222 based on the average of the high and low trading price of our common units on NYSE Arca on August 3, 2009. These service-based restricted units will vest on a three year ratable schedule beginning on August 1, 2010.
2008 Grants
Grants under the Long-Term Incentive Program
We granted 23,232 restricted common unit awards under the LTIP on August 1, 2008, to certain field employees in Alabama and Oklahoma. These units had a total fair market value of approximately $425,000 based on the average of the high and low trading price of our common units on NYSE Arca on the grant date. These service-based restricted units will vest on a three year ratable schedule beginning on August 1, 2009.
We granted 11,004 restricted common unit awards under the LTIP on March 1, 2008, to the independent, non-employee members of the board of managers. These units had a total fair market value of approximately $225,000 at the grant date. These service-based restricted units vested in full on March 1, 2009.
147
Table of Contents
CONSTELLATION ENERGY PARTNERS LLC AND SUBSIDIARIES
NOTES TO CONSOLIDATED FINANCIAL STATEMENTS—(Continued)
2007 Grants
Grants under the Long-Term Incentive Program
We granted 5,343 restricted common unit awards under the LTIP on September 14, 2007, to the independent, non-employee members of the board of managers. These units had a total fair market value of approximately $225,000 at the grant date. This amount was recognized over the vesting period. These restricted common units vested in full on March 1, 2008.
13. DISTRIBUTIONS TO UNITHOLDERS
Distributions through December 31, 2009
We have suspended our quarterly distributions to unitholders for the quarters ended September 30, 2009, and June 30, 2009, to remain in compliance with the covenants associated with our reserve-based credit facility. The distribution must remain suspended until the outstanding debt balance, net of available cash, under our reserve-based credit facility is less than 90% of our borrowing base as determined by its lenders, after giving effect to the proposed distribution. Our available cash excludes any cash reserves as established by our board of managers for the proper conduct of our business and the payment of fees and expenses. See Note 17 for additional information.
On May 15, 2009, we paid a distribution for the first quarter of 2009 to the unitholders of record at May 8, 2009. The distribution was paid to holders of common units and Class A units at a rate of $0.13 per unit.
On February 13, 2009, we paid a distribution for the fourth quarter of 2008 to the unitholders of record at February 6, 2009. The distribution was paid to holders of common units and Class A units at a rate of $0.13 per unit.
Distributions through December 31, 2008
On November 14, 2008, we paid a distribution for the third quarter of 2008 to the unitholders of record at November 7, 2008. The distribution was paid to holders of common units and Class A units at a rate of $0.5625 per unit.
On August 14, 2008, we paid a distribution for the second quarter 2008 to the unitholders of record at August 7, 2008. The distribution was paid to holders of common units and Class A units at a rate of $0.5625 per unit.
On May 15, 2008, we paid a distribution for the first quarter of 2008 to the unitholders of record at May 8, 2008. The distribution was paid to holders of common units and Class A units at a rate of $0.5625 per unit.
On February 14, 2008, we paid a distribution for the fourth quarter of 2007 to the unitholders of record at February 7, 2008. The distribution was paid to holders of common units and Class A units at a rate of $0.5625 per unit. A distribution of $0.3 million was paid to the holder of the Company’s Class D interests on February 14, 2008.
Distributions through December 31, 2007
On October 24, 2007, we declared a distribution for the third quarter of 2007 to the unitholders of record at November 7, 2007. The distribution was paid to holders of common units and Class A units at a rate of $0.5625 per unit on November 14, 2007. The increase in the distribution rate commenced a management incentive interest
148
Table of Contents
CONSTELLATION ENERGY PARTNERS LLC AND SUBSIDIARIES
NOTES TO CONSOLIDATED FINANCIAL STATEMENTS—(Continued)
vesting period under our operating agreement. An initial cash reserve of $0.1 million was established to fund future distributions on the management incentive interests. A distribution of $0.3 million was paid to the holder of our Class D interests on November 14, 2007.
On August 14, 2007, we paid a distribution for the second quarter 2007 to the unitholders of record at August 7, 2007. The distribution was paid to holders of common units and Class A units at a rate of $0.4625 per unit. The distribution was not paid to holders of Class F units or to the holders of common units issued in connection with the Amvest acquisition. See Note 2 for a discussion of the Amvest acquisition. A distribution of $0.3 million was paid to the holder of our Class D interests on August 14, 2007.
On May 15, 2007, we paid a distribution for the first quarter of 2007 to the unitholders of record at May 8, 2007. The distribution was paid to holders of common units, Class A units and Class E units at a rate of $0.4625 per unit. A distribution of $0.3 million was paid to the holder of our Class D interests on May 15, 2007.
On February 14, 2007, we paid a distribution for the fourth quarter of 2006 to the unitholders of record at February 7, 2007, prorated from the date of our initial public offering on November 20, 2006. The distribution was paid to holders of common units and Class A units at a rate of $0.2111 per unit.
14. MEMBERS’ EQUITY
2009 Equity
At December 31, 2009, we had 476,950 Class A units and 23,376,136 Class B units outstanding, which included 177,674 unvested restricted common units issued under our Long-Term Incentive Plan, 167,484 unvested restricted common units issued under our Executive Inducement Bonus Program, and 1,110,488 unvested restricted common units under our 2009 Omnibus Incentive Compensation Plan.
At December 31, 2009, we had granted 199,401 common units of the 450,000 common units available under our Long-term Incentive Plan. Of these grants, 21,727 have vested.
At December 31, 2009, we had granted 167,484 common units of the 300,000 common units available under our Executive Inducement Bonus Program. Of these grants, none have vested.
At December 31, 2009, we had granted 1,110,488 common units of the 1,650,000 common units available under our 2009 Omnibus Incentive Compensation Plan. Of these grants, none have vested.
2008 Equity
At December 31, 2008, we had 447,721 Class A units and 21,938,342 Class B units outstanding, which included 34,236 restricted unvested common units. We have authorized 447,721 Class A units and 23,348,763 Class B units.
At December 31, 2008, we had granted 39,579 units of the 450,000 units available under our Long-Term Incentive Plan. Of these grants, 5,343 have vested and 34,236 are unvested.
2007 Equity
At December 31, 2007, we had 447,022 Class A units and 21,904,106 Class B units outstanding, which included 5,343 restricted unvested common units. We have authorized 447,022 Class A units and 23,348,763 Class B units.
149
Table of Contents
CONSTELLATION ENERGY PARTNERS LLC AND SUBSIDIARIES
NOTES TO CONSOLIDATED FINANCIAL STATEMENTS—(Continued)
At December 31, 2007, we had granted 5,343 units of the 450,000 units available under our Long-Term Incentive Plan. Of these grants, 5,343 are unvested.
2007 Issuances
During 2007, we issued 11,030,828 units for proceeds of $369.5 million, net of issuance costs of $5.5 million.
In September 2007, we sold 2,470,592 common units representing Class B limited liability company interests in a private placement which generated proceeds of approximately $105 million.
In July 2007, we sold 3,371,219 Class F units representing limited liability company interests and 2,664,998 common units representing Class B limited liability company interests in a private placement which generated proceeds of approximately $210 million. On October 12, 2007, a special meeting of our common unitholders was held. At this meeting, the common unitholders approved the conversion of all outstanding Class F units into common units. As a result of the approval, all 3,371,219 of our outstanding Class F units were cancelled and the same number of common units were issued to the former holders of the Class F units. To facilitate the conversion, the common unitholders approved both a change in the terms of our Class F units to provide that each Class F unit is convertible into our common units, and the issuance of additional common units upon the conversion of the Class F units.
In April 2007, we sold 90,376 Class E units representing limited liability company interests and 2,207,684 common units representing Class B limited liability company interests in a private placement for an aggregate purchase price of approximately $60 million. On June 26, 2007, a special meeting of our common unitholders was held. At this meeting, the common unitholders approved the conversion of all outstanding Class E units into common units. As a result of the approval, all 90,376 of our outstanding Class E units were cancelled and the same number of common units were issued to the former holders of the Class E units. To facilitate the conversion, the common unitholders approved both a change in the terms of our Class E units to provide that each Class E unit is convertible into our common units, and the issuance of additional common units upon the conversion of the Class E units.
| 15. | SUPPLEMENTAL INFORMATION ON OIL AND NATURAL GAS PRODUCING ACTIVITIES (UNAUDITED) |
The Supplementary Information on Oil and Natural Gas Producing Activities is presented as required by the appropriate authoritative guidance. The supplemental information includes capitalized costs related to oil and natural gas producing activities; costs incurred for the acquisition of oil and natural gas producing activities, exploration and development activities and the results of operations from oil and natural gas producing activities.
Supplemental information is also provided for per unit production costs; oil and natural gas production and average sales prices; the estimated quantities of proved oil and natural gas reserves; the standardized measure of discounted future net cash flows associated with proved reserves and a summary of the changes in the standardized measure of discounted future net cash flows associated with proved reserves.
150
Table of Contents
CONSTELLATION ENERGY PARTNERS LLC AND SUBSIDIARIES
NOTES TO CONSOLIDATED FINANCIAL STATEMENTS—(Continued)
Costs
The following table sets forth capitalized costs for the years ended December 31, 2009, 2008, and 2007:
| December 31, 2009 |
December 31, 2008 |
December 31, 2007 |
||||||||||
| (In 000’s) | ||||||||||||
| Capitalized costs at the end of the period:(a) |
||||||||||||
| Oil and natural gas properties and related equipment (successful efforts method) |
||||||||||||
| Property (acreage) costs |
||||||||||||
| Proved property |
$ | 756,461 | $ | 729,898 | $ | 635,224 | ||||||
| Unproved property |
37,147 | 38,293 | 39,018 | |||||||||
| Total property costs |
793,608 | 768,191 | 674,242 | |||||||||
| Materials and supplies |
4,312 | 4,587 | 2,880 | |||||||||
| Land |
912 | 912 | 902 | |||||||||
| Total |
798,832 | 773,690 | 678,024 | |||||||||
| Less: Accumulated depreciation, depletion and amortization |
(186,207 | ) | (111,171 | ) | (34,371 | ) | ||||||
| Net capitalized cost |
$ | 612,625 | $ | 662,519 | $ | 643,653 | ||||||
| (a) | Capitalized costs include the cost of equipment and facilities for our oil and natural gas producing activities. Proved property costs include capitalized costs for leaseholds holding proved reserves; development wells and related equipment and facilities (including uncompleted development well costs); and support equipment. Unproved property costs include capitalized costs for oil and natural gas leaseholds where proved reserves do not exist. |
The following table sets forth costs incurred for oil and natural gas producing activities for the years ended December 31, 2009, 2008, and 2007:
| For the year ended December 31, 2009 |
For the year ended December 31, 2008 |
For the year ended December 31, 2007 | |||||||
| (In 000’s) | |||||||||
| Costs incurred for the period: |
|||||||||
| Acquisition of properties |
|||||||||
| Proved |
$ | 170 | $ | 47,665 | $ | 436,847 | |||
| Unproved |
121 | 398 | 42,544 | ||||||
| Development costs |
22,913 | 47,897 | 23,645 | ||||||
| Total costs incurred |
$ | 23,204 | $ | 95,960 | $ | 503,036 | |||
The development costs for the years ended December 31, 2009, 2008, and 2007 primarily represent costs to develop our proved undeveloped reserves. We estimate that we will spend $5.4 million, $6.1 million, and $5.3 million to develop our proved undeveloped reserves in 2010, 2011, and 2012, respectively.
Our exploration and dry hole costs were $0.9 million, $0.4 million, and $0.3 million in 2009, 2008, and 2007, respectively.
151
Table of Contents
CONSTELLATION ENERGY PARTNERS LLC AND SUBSIDIARIES
NOTES TO CONSOLIDATED FINANCIAL STATEMENTS—(Continued)
Results of Operations
The revenues and expenses associated directly with oil and natural gas producing activities are reflected in the Consolidated Statements of Operations. All of our operations are oil and natural gas producing activities located in the United States.
Net Proved Oil and Natural Gas Reserves
The following table sets forth information with respect to changes in proved developed and undeveloped reserves. This information excludes reserves related to royalty and net profit interests. All of our reserves are located in the United States.
| For the year ended December 31, 2009 |
For the year ended December 31, 2008 |
For the year ended December 31, 2007 |
|||||||
| (In MMcfe) | |||||||||
| Beginning Balance |
232,414 | 302,787 | 120,336 | ||||||
| Extensions and discoveries |
1,103 | 5,628 | 12,300 | ||||||
| Purchases of reserves in place |
— | 12,738 | 158,012 | ||||||
| Sales of reserves in place |
— | — | — | ||||||
| Revisions of previous estimates |
(85,276 | ) | (71,355 | ) | 22,532 | ||||
| Production |
(17,061 | ) | (17,384 | ) | (10,393 | ) | |||
| Ending Balance |
131,180 | 232,414 | 302,787 | ||||||
| Total proved developed reserves |
112,059 | 159,027 | 186,693 | ||||||
Reserves and Related Estimates
Our estimate of proved reserves is based on the quantities of oil and natural gas that engineering and geological analyses demonstrate, with reasonable certainty, to be recoverable from established reservoirs in the future under current operating and economic parameters. Our 2009 reserve estimates were prepared in accordance with the new FASB and SEC rules for oil and gas reporting effective at December 31, 2009 using the SEC-required price. Our 2008 and 2007 reserve estimates were prepared using year-end pricing for the respective period.
Our 2009, 2008 and 2007 proved reserve estimates were 131.2 Bcfe, 232.4 Bcfe and 302.8 Bcfe. For these years, NSAI, an independent petroleum engineering firm, prepared an estimate of our proved reserves. NSAI’s estimates of our 2009 and 2008 proved reserves were used to prepare our financial statements. NSAI’s estimates of our 2007 proved reserves were materially consistent with our internally estimated report.
Our 2009 estimates of proved reserves decreased 101.2 Bcfe from 2008 primarily due to reserve revisions due to a significantly lower SEC-required price for natural gas. Our reserves are 99% natural gas and are sensitive to lower prices for natural gas and basis differentials in the Mid-Continent region. The natural gas price used to prepare our reserve report was $3.92 for NYMEX and $3.11 in the Cherokee Basin. Although we utilize swaps and basis swaps to mitigate commodity price risk and basis differentials, these derivatives are not used when preparing our reserve report based on SEC rules. This low SEC-required price makes all of our proved undeveloped locations uneconomic in the Cherokee Basin. These locations are now classified as probable reserves. We also removed approximately 23.9 Bcfe in proven undeveloped locations in the Black Warrior Basin because of the new SEC requirement to only record locations that are scheduled to be drilled within the next 5 years. Any of our locations that are scheduled to be drilled after 5 years are classified as probable or possible reserves to the extent they are economic. These declines were partially offset by additional proved undeveloped reserve additions in the Black Warrior Basin because of a state ruling allowing 40-acre spacing throughout the Robinson’s Bend Field. No reserves were attributed to the Torch NPI in 2009.
152
Table of Contents
CONSTELLATION ENERGY PARTNERS LLC AND SUBSIDIARIES
NOTES TO CONSOLIDATED FINANCIAL STATEMENTS—(Continued)
Our 2008 estimates of proved reserves decreased 70.4 Bcfe from 2007 primarily due to reserve revisions due to a lower year-end price for natural gas and slightly higher estimates of oilfield service and drilling costs offset by our acquisition of reserves in the Woodford Shale and additions from our development programs in the Cherokee Basin. Our reserves are 99% natural gas and are sensitive to lower year end prices for natural gas and basis differentials in the Mid-Continent region. The year-end natural gas price used to prepare our reserve report was $6.14 for NYMEX and $4.59 in the Cherokee Basin. Although we utilize swaps, options and basis swaps to mitigate commodity price risk and basis differentials, these derivatives are not used when preparing our reserve report based on SEC rules. This low year end SEC price makes many of our proved undeveloped locations uneconomic in the Cherokee Basin and dramatically reduced the SEC value of our Woodford Shale reserves. No reserves were attributed to the Torch NPI in 2008.
Standardized Measure of Discounted Future Net Cash Flows Relating to Proved Gas Reserves, Including a Reconciliation of Changes Therein
The following table sets forth the standardized measure of the discounted future net cash flows attributable to our proved oil and natural gas reserves. Certain information concerning the assumptions used in computing the valuation of proved reserves and their inherent limitations are discussed below.
Future cash inflows are calculated by applying the SEC-required prices of oil and natural gas, relating to the proved reserves, to the year-end quantities of those reserves. Future cash inflows exclude the impact of our hedging program. Future development and production costs represent the estimated future expenditures (based on year-end costs) to be incurred in developing and producing the proved reserves, assuming continuation of existing economic conditions. In addition, asset retirement obligations are included within future production and development costs. There are no future income tax expenses because CEP is a non-taxable entity.
The assumptions used to compute estimated future cash inflows do not necessarily reflect expectations of actual revenues or costs or their present value. In addition, variations from expected production rates could result directly or indirectly from factors outside of our control, such as unexpected delays in development, changes in prices or regulatory or environmental policies. The reserve valuation further assumes that all reserves will be disposed of by production; however, if reserves are sold in place, additional economic considerations could also affect the amount of cash eventually realized.
The following table summarizes the standardized measure of estimated discounted future cash flows from the oil and natural gas properties:
| For the year ended December 31, 2009 |
For the year ended December 31, 2008 |
For the year ended December 31, 2007 |
||||||||||
| (In 000’s) | ||||||||||||
| Future cash inflows |
$ | 522,145 | $ | 1,201,327 | $ | 1,965,708 | ||||||
| Future production costs |
(277,881 | ) | (500,184 | ) | (749,166 | ) | ||||||
| Future estimated development costs |
(33,055 | ) | (161,146 | ) | (207,286 | ) | ||||||
| Future net cash flows |
211,209 | 539,997 | 1,009,256 | |||||||||
| 10% annual discount for estimated timing of cash flows |
(114,009 | ) | (311,083 | ) | (528,825 | ) | ||||||
| Standardized measure of discounted estimated future net cash flows related to proved gas reserves |
$ | 97,200 | $ | 228,914 | $ | 480,431 | ||||||
153
Table of Contents
CONSTELLATION ENERGY PARTNERS LLC AND SUBSIDIARIES
NOTES TO CONSOLIDATED FINANCIAL STATEMENTS—(Continued)
The following table summarizes the principal sources of change in the standardized measure of estimated discounted future net cash flows:
| For the year Ended December 31, 2009 |
For the year Ended December 31, 2008 |
For the year Ended December 31, 2007 |
||||||||||
| (In 000’s) | ||||||||||||
| Beginning of the period |
$ | 228,914 | $ | 480,431 | $ | 120,187 | ||||||
| Sales and transfers of natural gas, net of production costs |
(48,396 | ) | (81,179 | ) | (41,257 | ) | ||||||
| Net changes in prices and production costs related to future production |
(98,905 | ) | (130,792 | ) | 91,935 | |||||||
| Development costs incurred during the period |
26,004 | 46,194 | 26,115 | |||||||||
| Changes in extensions and discoveries |
1,022 | 9,502 | 14,447 | |||||||||
| Revisions of previous quantity estimates |
(72,767 | ) | (112,789 | ) | 20,848 | |||||||
| Purchase of reserves in place |
— | 50,248 | 228,279 | |||||||||
| Accretion discount |
22,891 | 48,043 | 19,877 | |||||||||
| Other |
38,437 | (80,744 | ) | — | ||||||||
| Standardized measure of discounted future net cash flows related to proved gas reserves |
$ | 97,200 | $ | 228,914 | $ | 480,431 | ||||||
16. SUPPLEMENTAL QUARTERLY FINANCIAL DATA (Unaudited)
| 2009 Quarters Ended(a) | |||||||||||||||
| March 31, | June 30, | September 30, | December 31, | ||||||||||||
| (In 000’s) | |||||||||||||||
| Total revenue |
$ | 52,193 | $ | 18,564 | $ | 24,295 | $ | 47,484 | |||||||
| Operating expenses |
25,140 | 27,709 | 25,034 | 38,135 | |||||||||||
| General and administrative expenses |
5,233 | 4,208 | 4,568 | 4,497 | |||||||||||
| Net income (loss) |
$ | 18,933 | $ | (16,744 | ) | $ | (9,101 | ) | $ | (2,111 | ) | ||||
| Earnings per unit—Basic |
$ | 0.85 | $ | (0.74 | ) | $ | (0.40 | ) | $ | (0.11 | ) | ||||
| Earnings per unit—Diluted |
$ | 0.85 | $ | (0.74 | ) | $ | (0.40 | ) | $ | (0.11 | ) | ||||
| 2008 Quarters Ended(a) | ||||||||||||||
| March 31, | June 30, | September 30, | December 31, | |||||||||||
| (In 000’s) | ||||||||||||||
| Total revenue |
$ | 28,469 | $ | 23,961 | $ | 59,650 | $ | 51,159 | ||||||
| Operating expenses |
21,300 | 25,923 | 25,640 | 57,082 | ||||||||||
| General and administrative expenses |
3,266 | 3,718 | 3,696 | 3,318 | ||||||||||
| Net income (loss) |
$ | 1,501 | $ | (8,790 | ) | $ | 26,939 | $ | (12,382 | ) | ||||
| Earnings per unit—Basic |
$ | 0.07 | $ | (0.39 | ) | $ | 1.20 | $ | (0.56 | ) | ||||
| Earnings per unit—Diluted |
$ | 0.07 | $ | (0.39 | ) | $ | 1.20 | $ | (0.56 | ) | ||||
154
Table of Contents
CONSTELLATION ENERGY PARTNERS LLC AND SUBSIDIARIES
NOTES TO CONSOLIDATED FINANCIAL STATEMENTS—(Continued)
17. SUBSEQUENT EVENTS
The following subsequent events have occurred between January 1, 2010, and February 25, 2010:
Debt
Funds Available for Borrowing
As of February 24, 2010, we reduced the outstanding debt under our reserve-based credit facility from $195.0 million to $190.0 million and have $15.0 million in remaining borrowing capacity.
Distribution
Our board of managers has suspended the quarterly distribution to our unitholders for the quarter ended December 31, 2009, which continues the temporary suspension we first announced in June 2009.
Class D Interests
In connection with litigation related to the Torch NPI, we have suspended all quarterly cash contributions with respect to our Class D interests. This suspension, approved by our board of managers in February 2010, includes the $0.3 million quarterly cash distribution for the three months ended December 31, 2009 and $2.3 million which represents the distributions that were suspended for the quarterly periods ended September 30, June 30, and March, 31, 2009, and December 31, September 30, June 30, and March 31, 2008. The remaining undistributed amount of the Class D interests is $6.7 million.
155
Table of Contents
CONSTELLATION ENERGY PARTNERS LLC
VALUATION AND QUALIFYING ACCOUNTS
Years Ended December 31, 2009, 2008 and 2007
(In 000’s)
| Description |
Balance at Beginning of Period |
Charged to Costs and Expenses |
Deductions | Charged to Other Accounts |
Balance at End of Period | |||||||||
| 2009 |
||||||||||||||
| Environmental reserves |
$ | 441 | $ | (248 | ) | — | — | $ | 193 | |||||
| 2008 |
||||||||||||||
| Environmental reserves |
$ | 546 | $ | (105 | ) | — | — | $ | 441 | |||||
| 2007 |
||||||||||||||
| Environmental reserves |
$ | 721 | (175 | ) | — | — | $ | 546 | ||||||
156
Table of Contents
Pursuant to the requirements of Section 13 or 15(d) of the Securities Exchange Act of 1934, Constellation Energy Partners LLC, the Registrant, has duly caused this Report to be signed on its behalf by the undersigned, thereunto duly authorized.
| CONSTELLATION ENERGY PARTNERS LLC (REGISTRANT) | ||||||
| Date: February 24, 2010 | By | /S/ STEPHEN R. BRUNNER | ||||
| Stephen R. Brunner Chief Executive Officer, Chief Operating Officer and President | ||||||
Pursuant to the requirements of the Securities Exchange Act of 1934, this Report has been signed below by the following persons on behalf of Constellation Energy Partners LLC, the Registrant, and in the capacities and on the dates indicated.
| Signature |
Title |
Date | ||||
| Principal executive officer and manager: | ||||||
| By | /S/ STEPHEN R. BRUNNER Stephen R. Brunner |
Chief Executive Officer, Chief Operating Officer and President |
February 24, 2010 | |||
| Principal financial officer and treasurer: | ||||||
| By | /S/ CHARLES C. WARD Charles C. Ward |
Chief Financial Officer and Treasurer |
February 24, 2010 | |||
| Managers: | ||||||
| /S/ STEPHEN R. BRUNNER Stephen R. Brunner |
Manager | February 24, 2010 | ||||
| /S/ RICHARD H. BACHMANN Richard H. Bachmann |
Manager | February 24, 2010 | ||||
| /S/ JOHN R. COLLINS John R. Collins |
Manager | February 24, 2010 | ||||
| /S/ RICHARD S. LANGDON Richard S. Langdon |
Manager | February 24, 2010 | ||||
| /S/ JOHN N. SEITZ John N. Seitz |
Manager | February 24, 2010 | ||||
157
Table of Contents
EXHIBIT INDEX
| Exhibit |
Description | |
| 2.1 | —Purchase and Sale Agreement, dated as of March 8, 2007, between EnergyQuest Resources, L.P., Oklahoma Processing EQR, LLC and Constellation Energy Partners, LLC (incorporated herein by reference to Exhibit 2.1 to the Current Report on Form 8-K filed by Constellation Energy Partners LLC on April 24, 2007, File No. 001-33147). | |
| 2.2 | —Purchase and Sale Agreement, dated as of March 8, 2007, between EnergyQuest Resources, L.P., Oklahoma Processing EQR, LLC, Kansas Production EQR, LLC and Kansas Processing EQR, LLC and Constellation Energy Partners LLC (incorporated herein by reference to Exhibit 2.2 to the Current Report on Form 8-K filed by Constellation Energy Partners LLC on April 24, 2007, File No. 001-33147). | |
| 2.3 | —Agreement of Merger, dated as of July 12, 2007, among AMVEST Osage, Inc., AMVEST Oil & Gas, Inc. and CEP Mid-Continent LLC, f/k/a CEP Cherokee Basin LLC (incorporated herein by reference to Exhibit 2.1 to the Current Report on Form 8-K filed by Constellation Energy Partners LLC on July 26, 2007, File No. 001-33147). | |
| 2.4 | —Purchase and Sale Agreement, dated as of August 2, 2007, between Newfield Exploration Mid-Continent Inc. and Constellation Energy Partners LLC (incorporated herein by reference to Exhibit 2.1 to the Current Report on Form 8-K filed by Constellation Energy Partners LLC on September 26, 2007, File No. 001-33147). | |
| 2.5 | —Nominee Agreement, dated as of September 21, 2007, by and between Newfield Exploration Mid-Continent Inc. and CEP Mid-Continent LLC (incorporated herein by reference to Exhibit 2.2 to the Current Report on Form 8-K filed by Constellation Energy Partners LLC on September 26, 2007). | |
| 2.6 | —Asset Purchase and Sale Agreement, dated as of May 12, 2005, by and among Everlast Energy LLC, RB Marketing Company LLC, Robinson’s Bend Operating Company LLC and CBM Equity IV, LLC (incorporated herein by reference to Exhibit 10.9 to Amendment No. 2 to the Registration Statement on Form S-1 (File No. 333-134995) filed by Constellation Energy Partners LLC on September 29, 2006 (“Amendment No. 2”))). | |
| 2.7 | —Agreement for Purchase and Sale, dated as of February 19, 2008, among CoLa Resources LLC and CEP Mid-Continent LLC (incorporated herein by reference to Exhibit 2.1 to the Current Report on Form 8-K filed by Constellation Energy Partners LLC on April 3, 2008, File No. 001-33147). | |
| 2.8 | —First Amendment to Agreement for Purchase and Sale, dated as of March 31, 2008, between CoLa Resources LLC and CEP Mid-Continent LLC (incorporated herein by reference to Exhibit 2.2 to the Current Report on Form 8-K filed by Constellation Energy Partners LLC on April 3, 2008, File No. 001-33147). | |
| 3.1 | —Certificate of Formation of Constellation Energy Partners LLC, as amended (incorporated herein by reference to Exhibit 3.1 to the Annual Report on Form 10-K filed by Constellation Energy Partners LLC on March 12, 2007, File No. 001-33147). | |
| 3.2 | —Second Amended and Restated Operating Agreement of Constellation Energy Partners LLC (incorporated herein by reference to Exhibit 3.1 to the Current Report on Form 8-K filed by Constellation Energy Partners LLC on November 28, 2006, File No. 001-33147). | |
| 3.3 | —Amendment No. 1 to Second Amended and Restated Operating Agreement of Constellation Energy Partners LLC, dated April 23, 2007 (incorporated herein by reference to Exhibit 3.1 to the Current Report on Form 8-K filed by Constellation Energy Partners LLC on April 24, 2007, File No. 001-33147). | |
158
Table of Contents
| Exhibit |
Description | |
| 3.4 | —Amendment No. 2 to Second Amended and Restated Operating Agreement of Constellation Energy Partners LLC, dated July 25, 2007. (incorporated herein by reference to Exhibit 3.1 to the Current Report on Form 8-K filed by Constellation Energy Partners LLC on July 26, 2007, File No. 001-33147). | |
| 3.5 | —Amendment No. 3 to Second Amended and Restated Operating Agreement of Constellation Energy Partners LLC, dated September 21, 2007 (incorporated herein by reference to Exhibit 3.1 to the Current Report on Form 8-K filed by Constellation Energy Partners LLC on September 26, 2007, File No. 001-33147). | |
| 3.6 | —Amendment No. 4 to Second Amended and Restated Operating Agreement of Constellation Energy Partners LLC, dated December 28, 2007 (incorporated herein by reference to Exhibit 3.1 to the Current Report on Form 8-K filed by Constellation Energy Partners LLC on December 28, 2007, File No. 001-33147). | |
| 10.1 | —Management Services Agreement, dated as of November 20, 2006, by and among Constellation Energy Partners LLC and Constellation Energy Partners Management, LLC (incorporated herein by reference to Exhibit 10.2 to the Current Report on Form 8-K filed by Constellation Energy Partners LLC on November 28, 2006, File No. 001-33147). | |
| 10.2 | —Omnibus Agreement, dated as of November 20, 2006, among Constellation Energy Partners LLC, Constellation Energy Commodities Group, Inc., Robinson’s Bend Production II, LLC, Robinson’s Bend Operating II, LLC and Robinson’s Bend Marketing II, LLC (incorporated herein by reference to Exhibit 10.1 to the Current Report on Form 8-K filed by Constellation Energy Partners LLC on November 28, 2006, File No. 001-33147). | |
| 10.3 | —Net Overriding Royalty Conveyance, dated as of November 22, 1993, but effective as of October 1, 1993, pursuant to Part I thereof, from Velasco Gas Company, Ltd. to Torch Energy Advisors Incorporated herein, and pursuant to Part II thereof, from Torch Energy Advisors Incorporated herein to the Torch Energy Royalty Trust (incorporated herein by reference to Exhibit 10.4 to Amendment No. 2). | |
| 10.4 | —Oil and Gas Purchase Agreement, dated as of October 1, 1993, by and between Torch Energy Marketing, Inc., Torch Royalty Company and Velasco Gas Company Ltd. (incorporated herein by reference to Exhibit 10.5 to Amendment No. 2). | |
| 10.5 | —Letter agreement, dated as of June 13, 2005, by and between Robinson’s Bend Marketing II, LLC and Torch Energy TM, Inc. (incorporated herein by reference to Exhibit 10.6 to Amendment No. 2). | |
| 10.6 | —$350,000,000 Amended and Restated Credit Agreement, dated as of November 13, 2009, among Constellation Energy Partners LLC, as borrower, The Royal Bank of Scotland plc, as administrative agent, RBS Securities Inc., as joint lead arranger and sole book runner, The Bank of Nova Scotia, as joint lead arranger and co-syndication agent, and BNP Paribas, as joint lead arranger and co-syndication agent, and the lenders party hereto (incorporated herein by reference to Exhibit 10.1 to the Current Report on Form 8-K filed by Constellation Energy Partners LLC on November 16, 2009, File No. 001-33147). | |
| 10.7* | —First Amendment to Amended and Restated Credit Agreement, dated as of February 11, 2010, by and among Constellation Energy Partners LLC and the lenders signatory thereto. | |
| 10.8 | —Trademark License Agreement, dated as of November 20, 2006, by and between Constellation Energy Group, Inc. and Constellation Energy Partners LLC (incorporated herein by reference to Exhibit 10.3 to the Current Report on Form 8-K filed by Constellation Energy Partners LLC on November 28, 2006, File No. 001-33147). | |
159
Table of Contents
| Exhibit |
Description | |
| 10.9 | —Water Gathering and Disposal Agreement, dated August 9, 1990, by and between Torch Energy Associates Ltd. and Velasco Gas Company Ltd. (incorporated herein by reference to Exhibit 10.17 to the Annual Report on Form 10-K filed by Constellation Energy Partners LLC on March 4, 2008, File No. 001-33147). | |
| 10.10 | —First Amendment to Water Gathering and Disposal Agreement, dated October 1, 1993, by and between Torch Energy Associates Ltd. and Velasco Gas Company Ltd. (incorporated herein by reference to Exhibit 10.18 to the Annual Report on Form 10-K filed by Constellation Energy Partners LLC on March 4, 2008, File No. 001-33147). | |
| 10.11 | —Second Amendment to Water Gathering and Disposal Agreement, , dated November 30, 2004, by and between Robinson’s Bend Operating Company, LLC, successor in interest to Torch Energy Associates Ltd., and Everlast Energy LLC, successor in interest to Velasco Gas Company Ltd. (incorporated herein by reference to Exhibit 10.19 to the Annual Report on Form 10-K filed by Constellation Energy Partners LLC on March 4, 2008, File No. 001-33147). | |
| 10.12 | —Exploration and Development Agreement, dated July 25, 2005, by and between The Osage Nation and AMVEST Osage, Inc. (incorporated herein by reference to Exhibit 10.23 to the Annual Report on Form 10-K filed by Constellation Energy Partners LLC on February 27, 2009, File No. 001-33147). | |
| 10.13 | —Substituted and Replaced First Amendment to the Exploration and Development Agreement, dated October 18, 2006, by and between The Osage Nation and AMVEST Osage, Inc. (incorporated herein by reference to Exhibit 10.24 to the Annual Report on Form 10-K filed by Constellation Energy Partners LLC on February 27, 2009, File No. 001-33147). | |
| 10.14 | —Assignment, Assumption and Ratification Agreement, dated July 25, 2007, by and between AMVEST Osage, Inc. and CEP Mid-Continent LLC (incorporated herein by reference to Exhibit 10.25 to the Annual Report on Form 10-K filed by Constellation Energy Partners LLC on February 27, 2009, File No. 001-33147). | |
| +10.15 | —Letter Agreement, dated December 31, 2008, between Constellation Energy Partners LLC and Stephen R. Brunner (incorporated herein by reference to Exhibit 10.1 to the Current Report on Form 8-K filed by Constellation Energy Partners LLC on January 7, 2009, File No. 001-33147). | |
| +10.16 | —Letter Agreement, dated December 31, 2008, between Constellation Energy Partners LLC and Charles C. Ward (incorporated herein by reference to Exhibit 10.2 to the Current Report on Form 8-K filed by Constellation Energy Partners LLC on January 7, 2009, File No. 001-33147). | |
| +10.17 | —Letter Agreement, dated December 31, 2008, between Constellation Energy Partners LLC and Lisa J. Mellencamp (incorporated herein by reference to Exhibit 10.22 to the Annual Report on Form 10-K filed by Constellation Energy Partners LLC on February 27, 2009, File No. 001-33147). | |
| +10.18 | —Employment Agreement, dated May 1, 2009, by and between CEP Services Company, Inc. and Stephen R. Brunner (incorporated herein by reference to Exhibit 10.1 to the Current Report on Form 8-K/A filed by Constellation Energy Partners LLC on May 5, 2009, File No. 001-33147, File No. 001-33147). | |
| +10.19 | —Employment Agreement, dated May 1, 2009, by and between CEP Services Company, Inc. and Charles C. Ward (incorporated herein by reference to Exhibit 10.2 to the Quarterly Report on Form 10-Q filed by Constellation Energy Partners LLC on November 6, 2009, File No. 001-33147, File No. 001-33147). | |
| +10.20 | —Employment Agreement, dated May 1, 2009, by and between CEP Services Company, Inc. and Lisa J. Mellencamp (incorporated herein by reference to Exhibit 10.3 to the Quarterly Report on Form 10-Q filed by Constellation Energy Partners LLC on November 6, 2009, File No. 001-33147, File No. 001-33147). | |
160
Table of Contents
| Exhibit |
Description | |
| +10.21 | —Employment Agreement, dated May 1, 2009, by and between CEP Services Company, Inc. and Michael B. Hiney (incorporated herein by reference to Exhibit 10.4 to the Quarterly Report on Form 10-Q filed by Constellation Energy Partners LLC on November 6, 2009, File No. 001-33147, File No. 001-33147). | |
| +10.22 | —Inducement Award Agreement, dated May 1, 2009, by and between Constellation Energy Partners LLC and Stephen R. Brunner (incorporated herein by reference to Exhibit 10.5 to the Current Report on Form 8-K/A filed by Constellation Energy Partners LLC on May 5, 2009, File No. 001-33147). | |
| +10.23 | —Inducement Award Agreement, dated May 1, 2009, by and between Constellation Energy Partners LLC and Charles C. Ward (incorporated herein by reference to Exhibit 10.6 to the Current Report on Form 8-K/A filed by Constellation Energy Partners LLC on May 5, 2009, File No. 001-33147, File No. 001-33147). | |
| +10.24 | —Inducement Award Agreement, dated May 1, 2009, by and between Constellation Energy Partners LLC and Lisa J. Mellencamp (incorporated herein by reference to Exhibit 10.7 to the Current Report on Form 8-K/A filed by Constellation Energy Partners LLC on May 5, 2009, File No. 001-33147, File No. 001-33147). | |
| +10.25 | —Inducement Award Agreement, dated May 1, 2009, by and between Constellation Energy Partners LLC and Michael B. Hiney (incorporated herein by reference to Exhibit 10.8 to the Current Report on Form 8-K/A filed by Constellation Energy Partners LLC on May 5, 2009, File No. 001-33147, File No. 001-33147). | |
| +10.26 | —Constellation Energy Partners LLC Long-Term Incentive Plan (incorporated herein by reference to Exhibit 10.1 to the Current Report on Form 8-K filed by Constellation Energy Partners LLC on November 20, 2006, File No. 001-33147). | |
| +10.27 | —Constellation Energy Partners LLC 2009 Omnibus Incentive Compensation Plan (incorporated herein by reference to Exhibit A to the Proxy Statement filed by Constellation Energy Partners LLC on October 22, 2009, File No. 001-33147). | |
| +10.28 | —Form of Grant Agreement Relating to Notional Units with DERs—Executives (under the 2009 Omnibus Incentive Compensation Plan) (incorporated herein by reference to Exhibit 10.9 to the Current Report on Form 8-K filed by Constellation Energy Partners LLC on May 4, 2009, File No. 001-33147, File No. 001-33147). | |
| +10.29 | —Form of Grant Agreement Relating to Notional Units with DERs—Independent Managers (under the 2009 Omnibus Incentive Compensation Plan) (incorporated herein by reference to Exhibit 10.10 to the Current Report on Form 8-K filed by Constellation Energy Partners LLC on May 4, 2009, File No. 001-33147, File No. 001-33147). | |
| *+10.30 | —Form of Grant Agreement Relating to Restricted Units—Independent Managers (under the 2009 Omnibus Incentive Compensation Plan) | |
| *12.1 | —Computation of Ratio of Earnings to Fixed Charges. | |
| *21.1 | —List of subsidiaries of Constellation Energy Partners LLC. | |
| *23.1 | —Consent of PricewaterhouseCoopers LLP. | |
| *23.2 | —Consent of Netherland, Sewell & Associates, Inc. | |
161
Table of Contents
| Exhibit |
Description | |
| *31.1 | —Certification of Chief Executive Officer, Chief Operating Officer, and President of Constellation Energy Partners LLC pursuant to Section 302 of the Sarbanes-Oxley Act of 2002. | |
| *31.2 | —Certification of Chief Financial Officer and Treasurer of Constellation Energy Partners LLC pursuant to Section 302 of the Sarbanes-Oxley Act of 2002. | |
| *32.1 | —Certification of Chief Executive Officer, Chief Operating Officer, and President of Constellation Energy Partners LLC pursuant to 18 U.S.C. Section 1350, as adopted pursuant to Section 906 of the Sarbanes-Oxley Act of 2002. | |
| *32.2 | —Certification of Chief Financial Officer and Treasurer of Constellation Energy Partners LLC pursuant to 18 U.S.C. Section 1350, as adopted pursuant to Section 906 of the Sarbanes-Oxley Act of 2002. | |
| *99.1 | —Report of Netherland, Sewell & Associates, Inc. | |
| * | Filed herewith |
| + | Management contract or compensatory plan or arrangement. |
162