Attached files
| file | filename |
|---|---|
| 8-K - 8-K - EAGLE FINANCIAL SERVICES INC | d260110d8k.htm |

Investor Presentation September 2016 EXHIBIT 99.1
The Company makes forward-looking statements that are subject to risks and uncertainties. These forward-looking statements include statements regarding profitability, liquidity, adequacy of capital, the allowance for loan losses, interest rate sensitivity, market risk, growth strategy, and financial and other goals. The words, “believes,” “expects,” “may,” “will,” “should,” “projects,” “contemplates,” “anticipates,” “forecasts,” “intends,” or other similar words or terms are intended to identify forward-looking statements. These forward-looking statements are subject to significant uncertainties. Because of these uncertainties, actual future results may be materially different from the results indicated by these forward-looking statements. In addition, past results of operations do not necessarily indicate future results. The following presentation should be read in conjunction with the consolidated financial statements and related notes and risk factors included in the Company’s Form 10-K for the year ended December 31, 2015 and other reports filed with the Securities and Exchange Commission. Forward Looking Statements
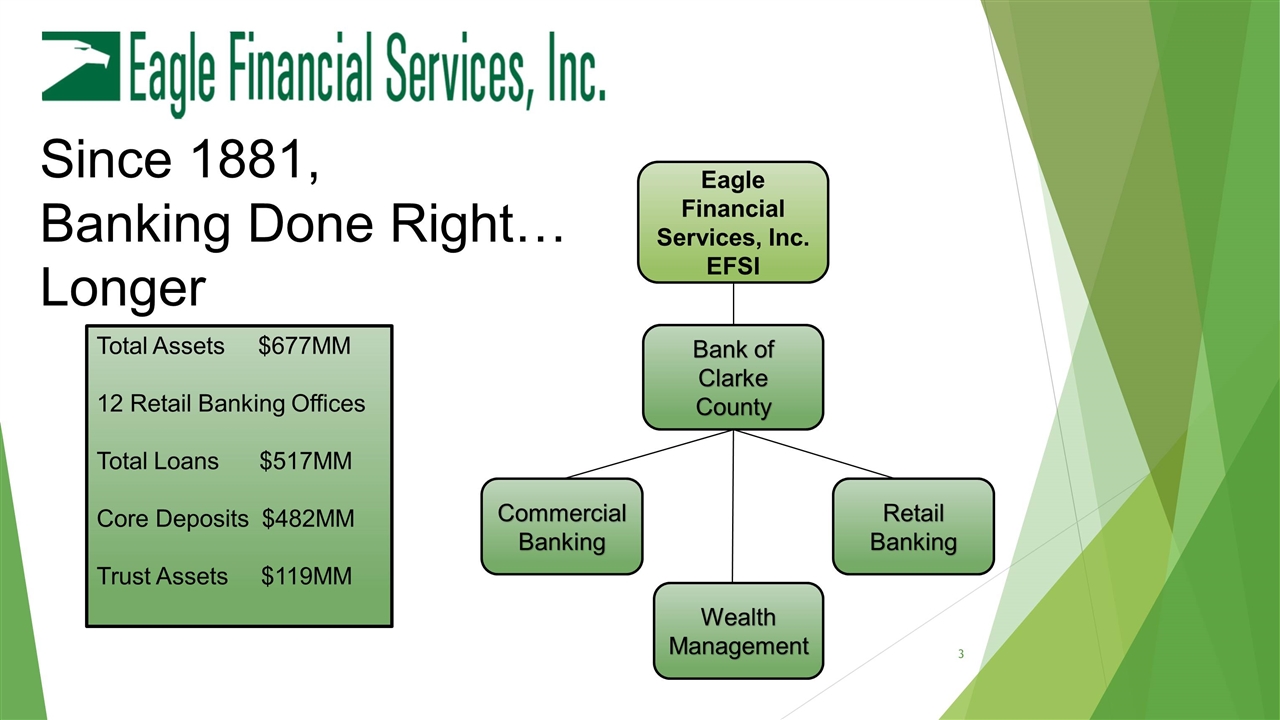
Since 1881, Banking Done Right… Longer Total Assets $677MM 12 Retail Banking Offices Total Loans $517MM Core Deposits $482MM Trust Assets $119MM Eagle Financial Services, Inc. EFSI Bank of Clarke County Commercial Banking Wealth Management Retail Banking
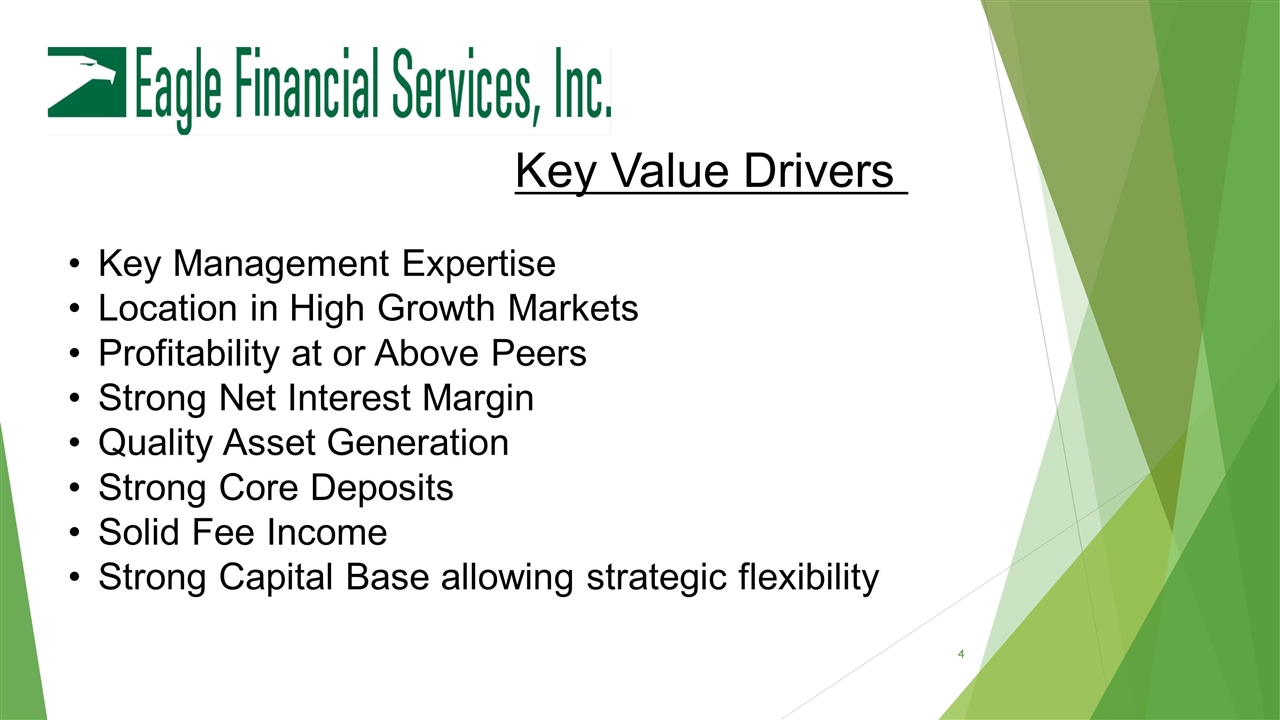
Key Value Drivers Key Management Expertise Location in High Growth Markets Profitability at or Above Peers Strong Net Interest Margin Quality Asset Generation Strong Core Deposits Solid Fee Income Strong Capital Base allowing strategic flexibility
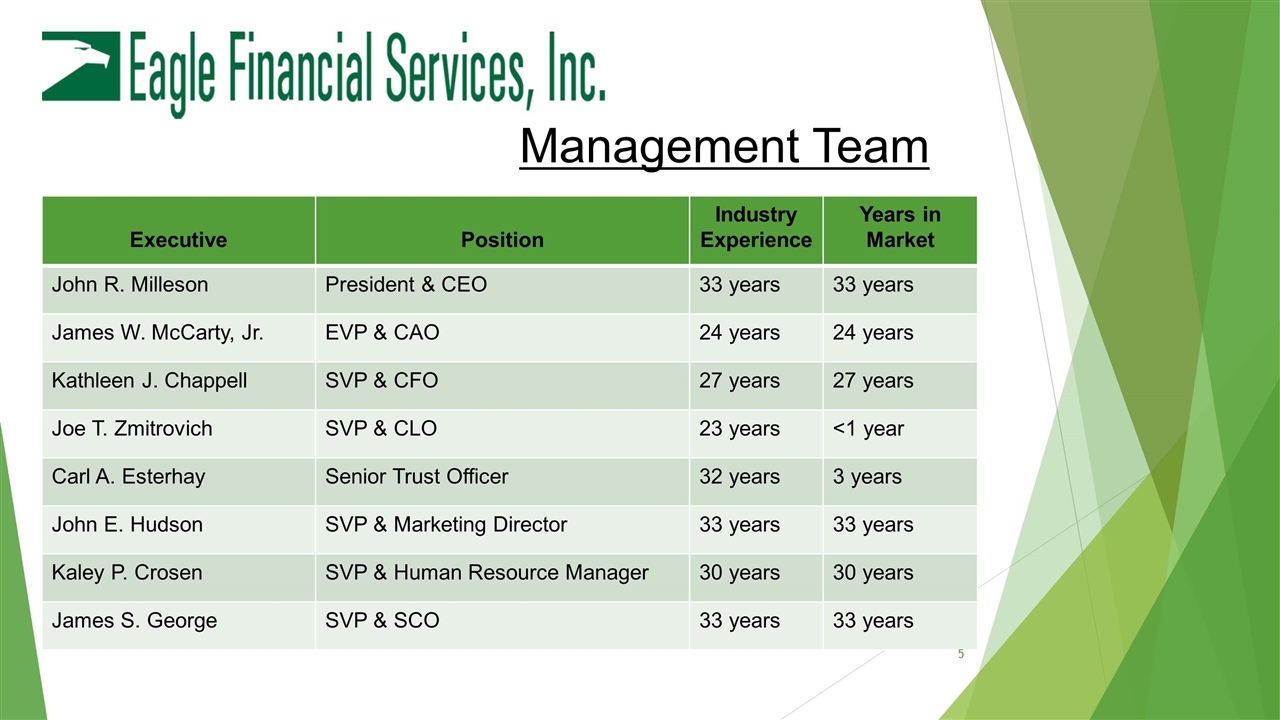
Management Team Executive Position Industry Experience Years in Market John R. Milleson President & CEO 33 years 33 years James W. McCarty, Jr. EVP & CAO 24 years 24 years Kathleen J. Chappell SVP & CFO 27 years 27 years Joe T. Zmitrovich SVP & CLO 23 years <1 year Carl A. Esterhay Senior Trust Officer 32 years 3 years John E. Hudson SVP & Marketing Director 33 years 33 years Kaley P. Crosen SVP & Human Resource Manager 30 years 30 years James S. George SVP & SCO 33 years 33 years
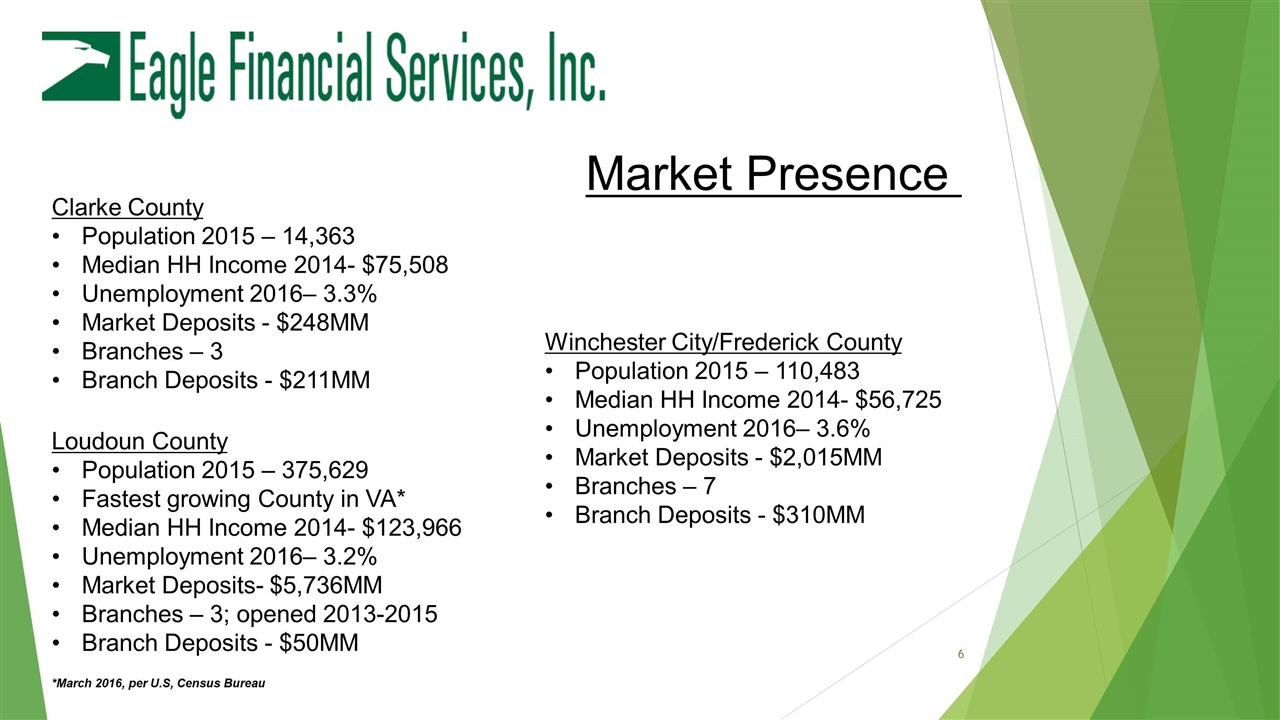
Market Presence Clarke County Population 2015 – 14,363 Median HH Income 2014- $75,508 Unemployment 2016– 3.3% Market Deposits - $248MM Branches – 3 Branch Deposits - $211MM Winchester City/Frederick County Population 2015 – 110,483 Median HH Income 2014- $56,725 Unemployment 2016– 3.6% Market Deposits - $2,015MM Branches – 7 Branch Deposits - $310MM Loudoun County Population 2015 – 375,629 Fastest growing County in VA* Median HH Income 2014- $123,966 Unemployment 2016– 3.2% Market Deposits- $5,736MM Branches – 3; opened 2013-2015 Branch Deposits - $50MM *March 2016, per U.S, Census Bureau
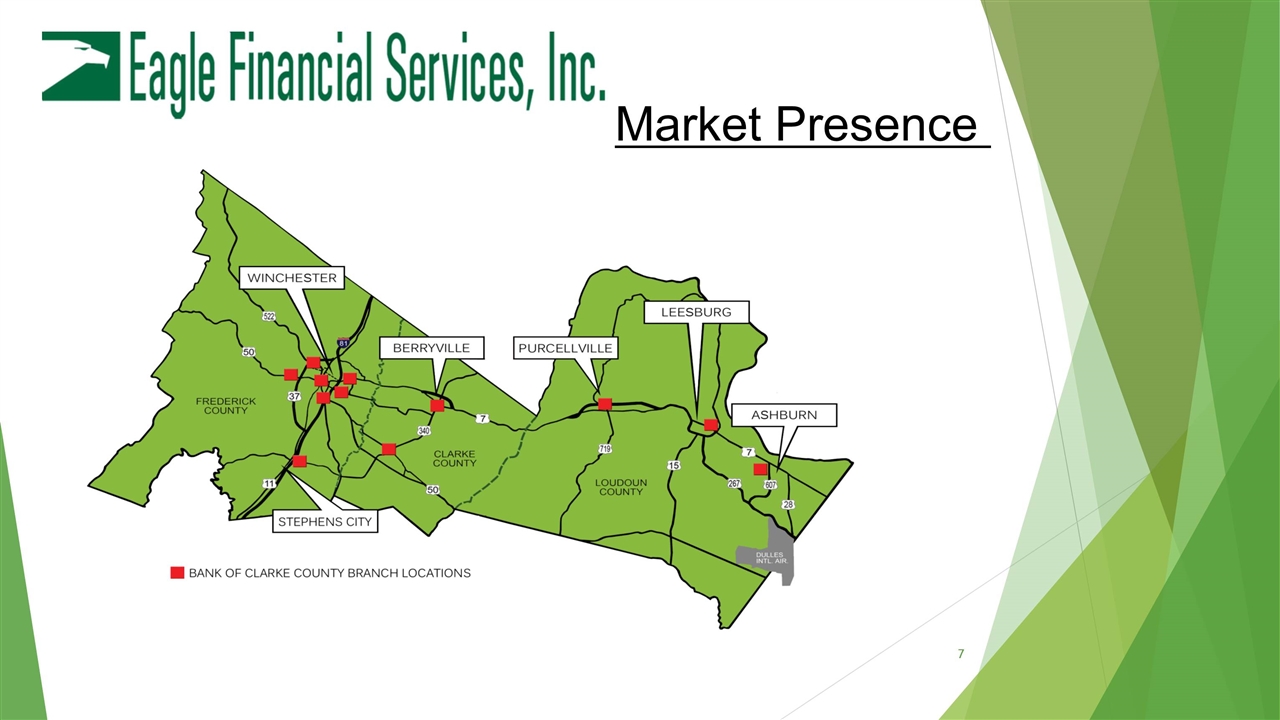
Market Presence
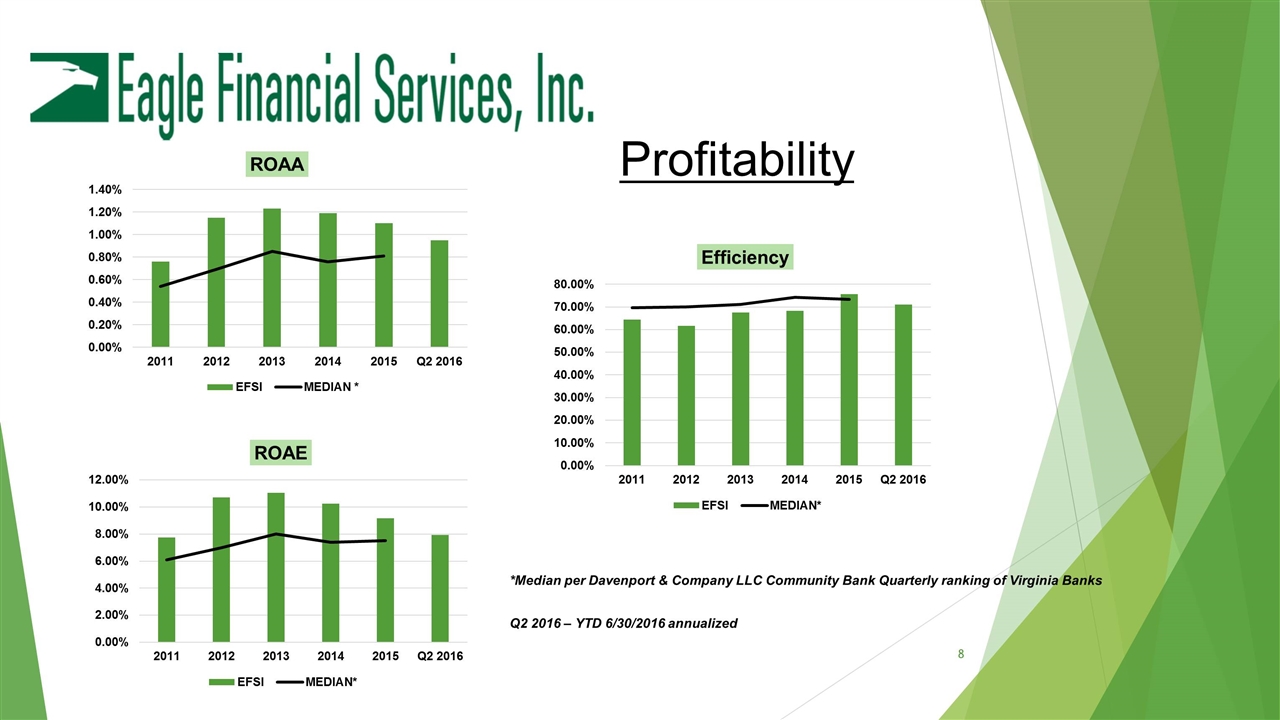
Profitability *Median per Davenport & Company LLC Community Bank Quarterly ranking of Virginia Banks Q2 2016 – YTD 6/30/2016 annualized
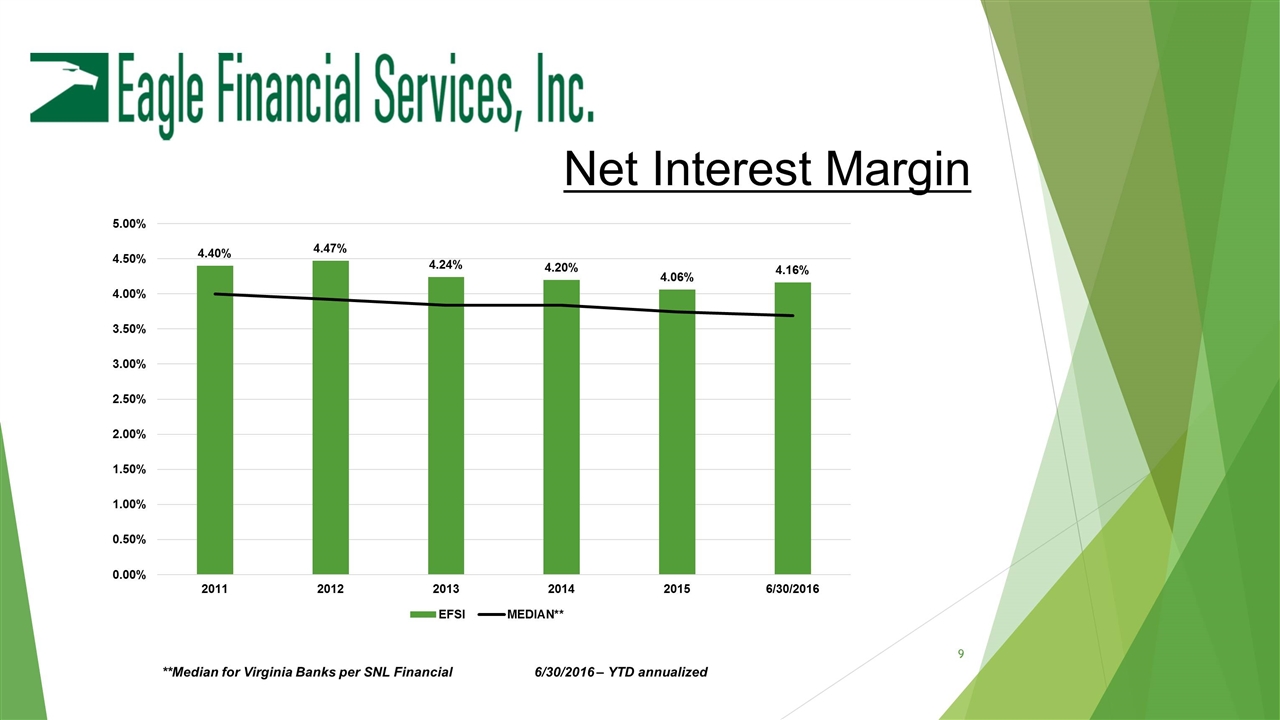
Net Interest Margin **Median for Virginia Banks per SNL Financial 6/30/2016 – YTD annualized
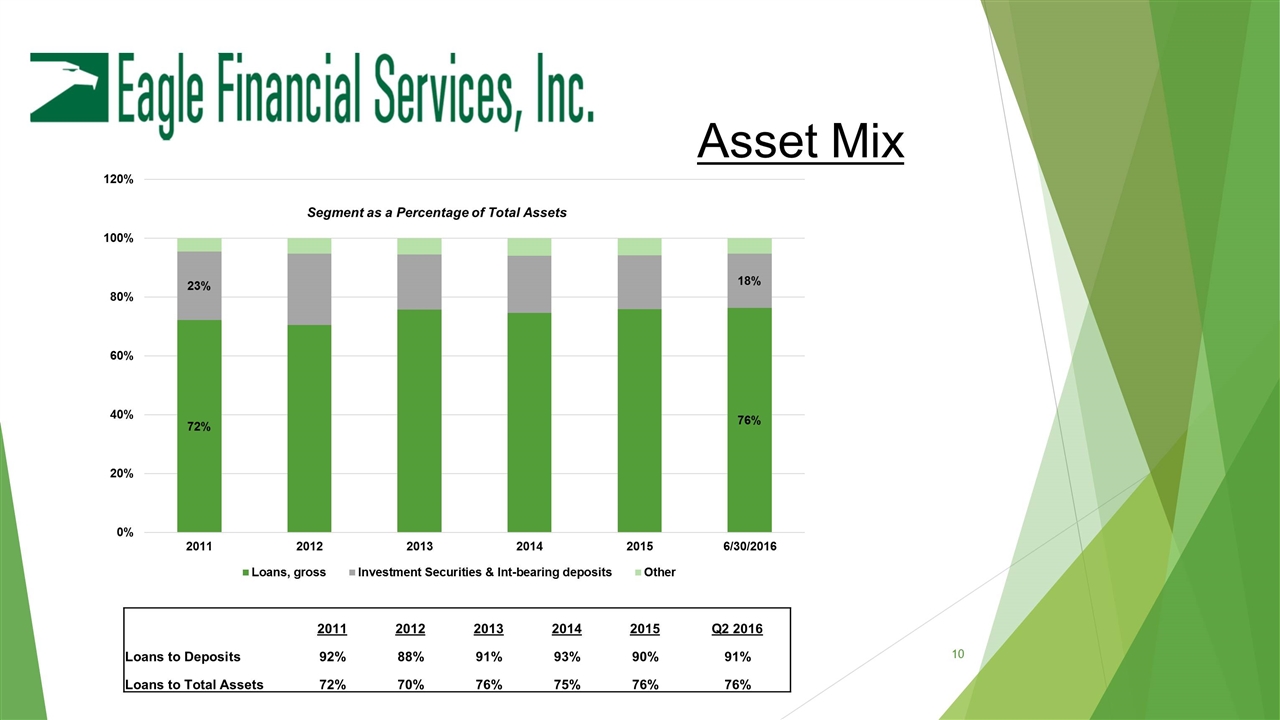
Asset Mix Segment as a Percentage of Total Assets 2011 2012 2013 2014 2015 Q2 2016 Loans to Deposits 92% 88% 91% 93% 90% 91% Loans to Total Assets 72% 70% 76% 75% 76% 76%
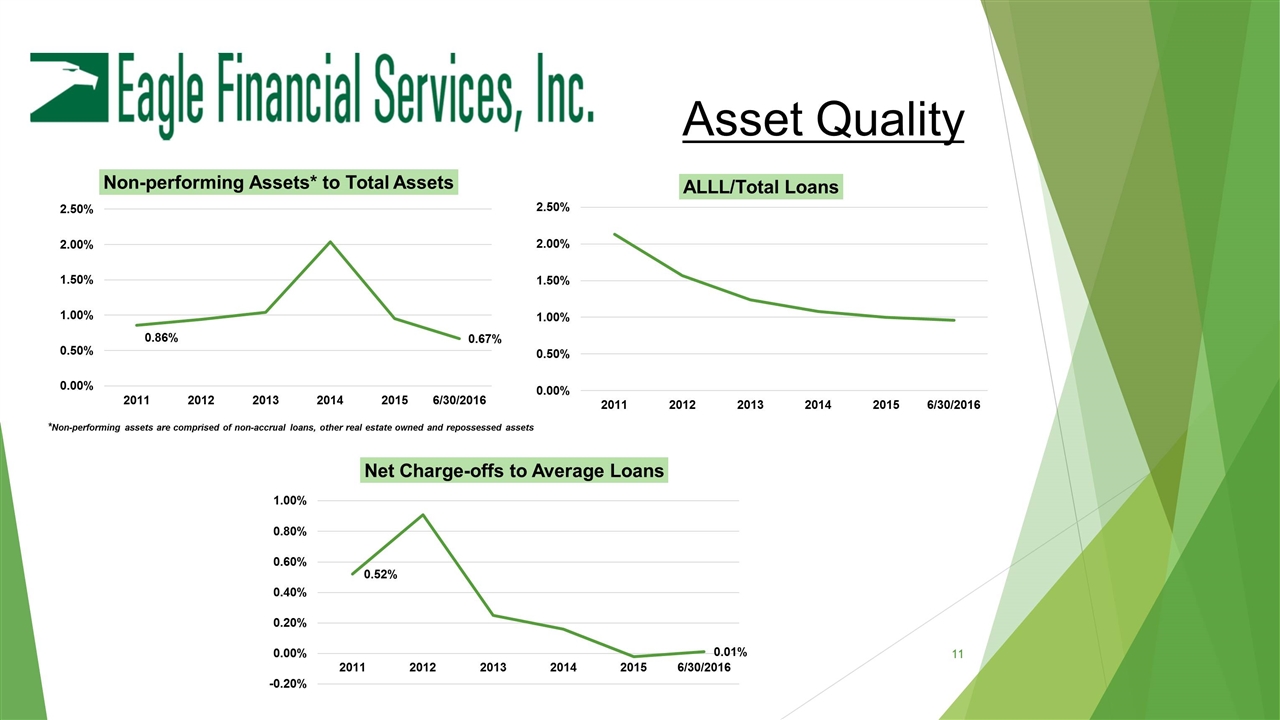
Asset Quality *Non-performing assets are comprised of non-accrual loans, other real estate owned and repossessed assets
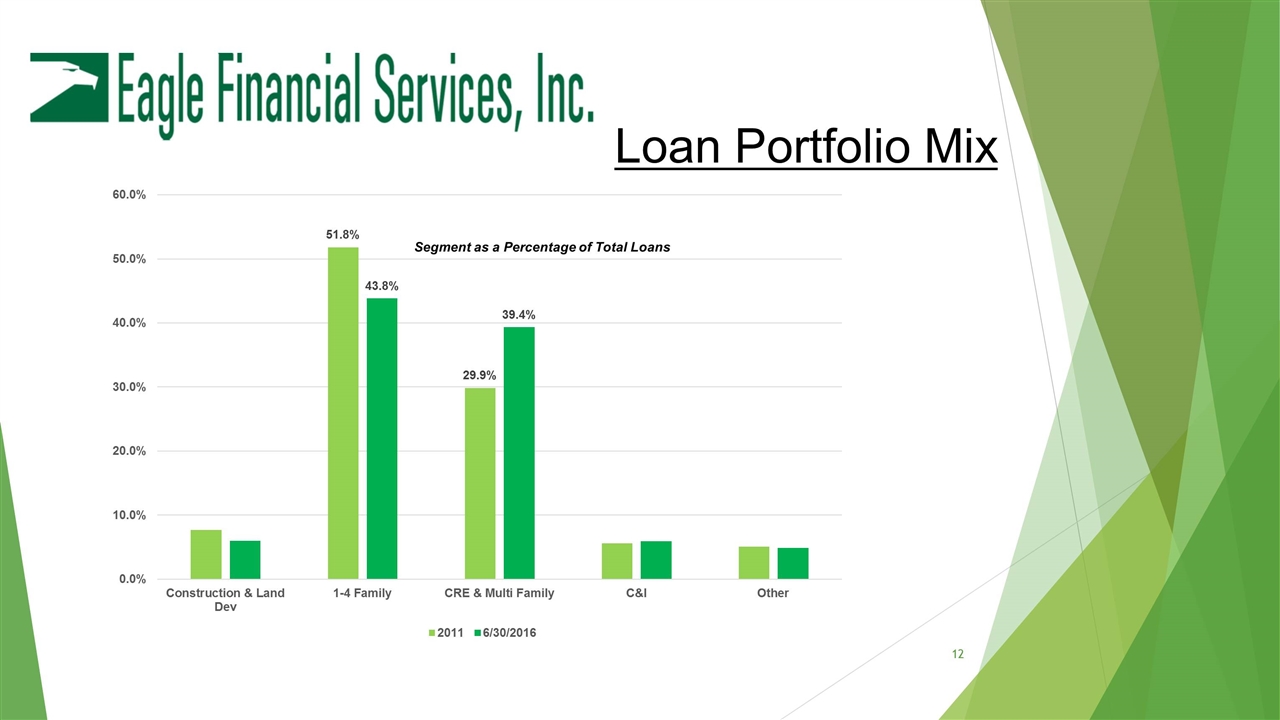
Loan Portfolio Mix Segment as a Percentage of Total Loans
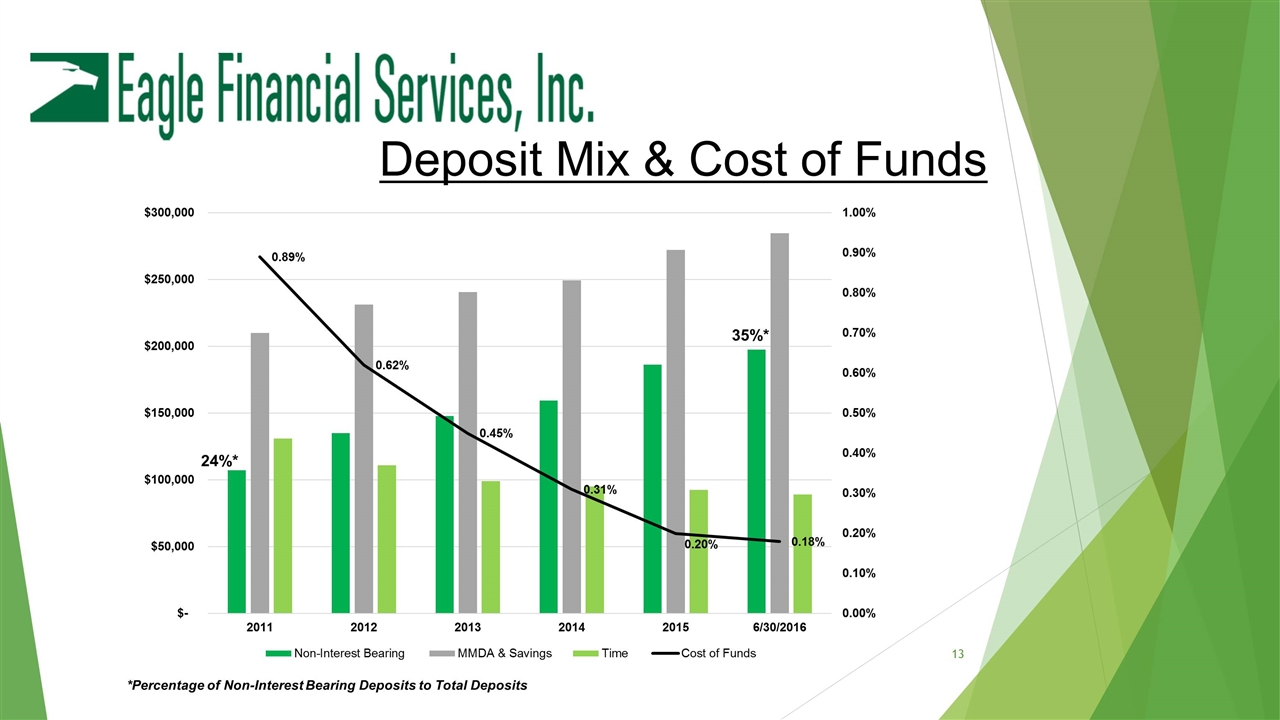
Deposit Mix & Cost of Funds 24%* 35%* *Percentage of Non-Interest Bearing Deposits to Total Deposits
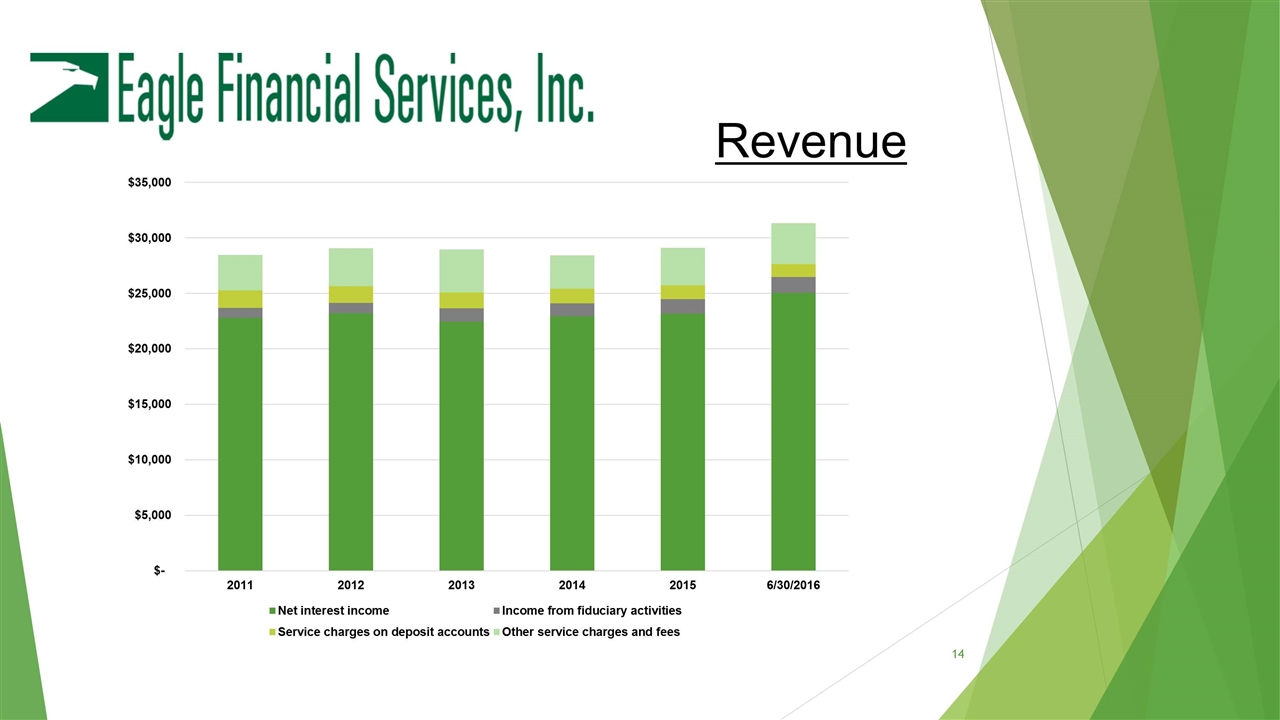
Revenue
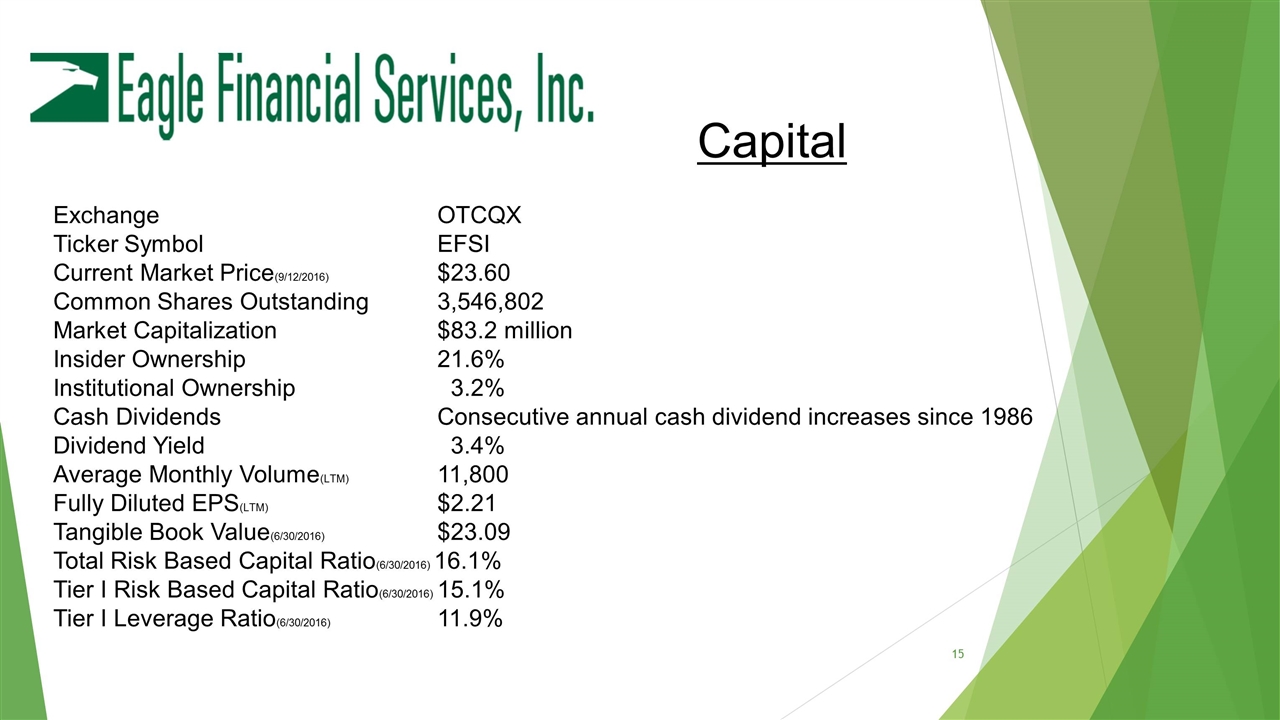
Exchange OTCQX Ticker SymbolEFSI Current Market Price(9/12/2016) $23.60 Common Shares Outstanding3,546,802 Market Capitalization$83.2 million Insider Ownership21.6% Institutional Ownership 3.2% Cash DividendsConsecutive annual cash dividend increases since 1986 Dividend Yield 3.4% Average Monthly Volume(LTM)11,800 Fully Diluted EPS(LTM)$2.21 Tangible Book Value(6/30/2016)$23.09 Total Risk Based Capital Ratio(6/30/2016) 16.1% Tier I Risk Based Capital Ratio(6/30/2016)15.1% Tier I Leverage Ratio(6/30/2016) 11.9% Capital
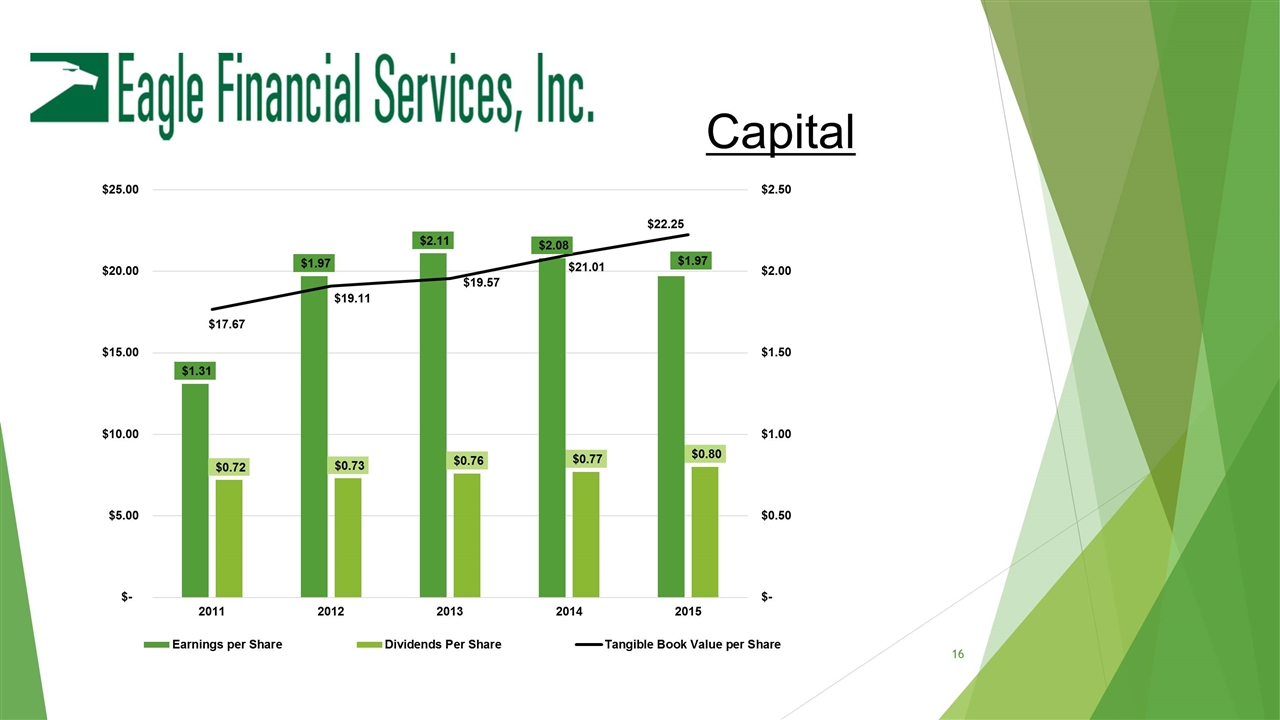
Capital

Contacts John R. Milleson President & CEO jmilleson@bankofclarke.com 540-955-5247 Jim McCarty EVP & CAO jmccarty@bankofclarke.com 540-955-5237 Kate J. Chappell SVP & CFO kchappell@bankofclarke.com 540-955-5226
