Attached files
| file | filename |
|---|---|
| 8-K - 8-K - RACKSPACE HOSTING, INC. | rax8k_8816xearningsreleasesl.htm |

Q2 2016
Earnings Slides
August 8, 2016

2
Forward Looking Statements, Non-GAAP Financial Measures,
and Trademarks and Service Marks
Forward-Looking Statements
We have made forward-looking statements in this presentation that are subject to risks and uncertainties. Forward-looking statements within the meaning of Section 27A of
the Securities Act of 1933, as amended, and Section 21E of the Securities Exchange Act of 1934, as amended, are subject to the “safe harbor” created by those sections.
The forward-looking statements in this presentation are based on our management’s beliefs and assumptions and on information currently available to our management.
In some cases, you can identify forward-looking statements by terms such as “anticipates,” “aspires,” “believes,” “can,” “continue,” “could,” “estimates,” “expects,”
“intends,” “may,” “plans,” “projects,” “seeks,” “should,” “will” or “would” or the negative of these terms and similar expressions intended to identify forward-looking
statements. These statements involve known and unknown risks, uncertainties and other factors, which may cause our actual results, performance, time frames or
achievements to be materially different from any future results, performance, time frames or achievements expressed or implied by the forward-looking statements. We
discuss many of these risks, uncertainties and other factors in greater detail under the heading “Risk Factors” in our Form 10-K/A for the year ended December 31, 2015
and may add additional risks in our future filings with the Securities and Exchange Commission, including in our Form 10-Q for the quarter ended June 30, 2016. We
believe it is important to communicate our expectations to our investors. However, there may be events in the future that we are not able to predict accurately or over which
we have no control.
Given these risks, uncertainties and other factors, you should not place undue reliance on these forward-looking statements. Also, these forward-looking statements
represent our estimates and assumptions only as of August 8, 2016 (the date on which we publicly presented this presentation). You should read this document completely
along with our earnings press release and the Form 10-Q for the period ended June 30, 2016, which will be filed with the Securities and Exchange Commission no later
than August 9, 2016, and with the understanding that our actual future results may be materially different from what we expect. We hereby qualify our forward-looking
statements by these cautionary statements. Except as required by law, we assume no obligation to update these forward-looking statements publicly, or to update the
reasons actual results could differ materially from those anticipated in these forward-looking statements, even if new information becomes available in the future.
Non-GAAP Financial Measures
This presentation includes certain non-GAAP financial measures, including Adjusted EBITDA, Non-GAAP EPS, Free Cash Flow, Return on Capital, and revenue growth
adjusted for foreign currency and asset divestiture. We believe that those metrics may be useful to investors as a measure of comparative operating performance between
time periods and among companies, however these measures should be considered only as a supplement to, and not as a substitute for or as a superior measure to,
financial measures prepared in accordance with GAAP, nor should they be considered in isolation or as an alternative to such GAAP measures. In addition, we note that
other companies may calculate similar non-GAAP measures differently, limiting their usefulness as a comparative measure. This presentation contains reconciliations of
the non-GAAP financial measures used to the most directly comparable GAAP financial measures. With respect to our third quarter of 2016 and full year 2016
expectations, reconciliations of revenue growth adjusted for foreign currency and asset divestiture to net revenue are included within this presentation. A reconciliation of
Adjusted EBITDA margin to net income margin cannot be provided without unreasonable efforts due to high variability in net non-operating foreign currency exchange gains
or losses and the inability to predict future acquisitions, dispositions, and certain other items that arise from time to time, the impact of which is excluded from Adjusted
EBITDA margin. The Company is unable to address the probable significance of the unavailable information.
Trademarks and Service Marks
Rackspace®, and Fanatical Support® are service marks of Rackspace US, Inc. registered in the United States and other countries. OpenStack® is either a registered
trademark or trademark of OpenStack, LLC in the United States and/or other countries. Other trademarks and tradenames appearing in this report are the property of their
respective holders. We do not intend our use or display of other companies’ tradenames, trademarks, or service marks to imply a relationship with, or endorsement or
sponsorship of us by, these other companies.

3
Continued Growth, Consistent Profitability, Decreasing CapEx
Intensity, and Increasing Cash Generation
$441
$489
$524
Q2 2014 Q2 2015 Q2 2016
Quarterly Revenue ($M)
$141
$160
$187
Q2 2014 Q2 2015 Q2 2016
Adjusted EBITDA1 ($M)
25.5%
31.0%
15.7%
Q2 2014 Q2 2015 Q2 2016
Capital Expenditures (%
of Revenue)
$24
$37
$98
Q2 2014 Q2 2015 Q2 2016
Free Cash Flow (FCF1)
($M)
1. Reference the Appendix for reconciliation of non-GAAP financial measures
$22
$28
$36
Q2 2014 Q2 2015 Q2 2016
Net Income ($M)
$125 $123
$165
Q2 2014 Q2 2015 Q2 2016
Cash Flow from Ops (CFO)
($M)

4
$489
$524
Q2 2015 Q2 2016
$530
$3 Jungle
Disk
Contribution
32.8%
35.8%
5.8% 6.8%
Q2 2015 Q2 2016
Adj. EBITDA Margin
Net Income Margin
Summary Q2 Financials
• GAAP Revenue of $524M
• Growth of 7.0% YoY
• Normalized growth1 of 8.9% YoY
• Net income margin of 6.8%
• Adjusted EBITDA margin2 of 35.8%
• GAAP/Non-GAAP2 EPS of $0.28/$0.38
• 40.0%/31.0% higher YoY
• CapEx as % of revenue 15.7%
• CFO/Free Cash Flow2 of $165M/$98M
Revenue ($M)
1. Normalized growth excludes the impact of asset divestiture and FX
headwinds. Reference the Appendix for reconciliation of non-GAAP
financial measures
2. Reference the Appendix for reconciliation of non-GAAP financial
measures
$6 FX
headwind
1
Adjusted EBITDA and Net Income
Margin2

5
Sales and Marketing Update - Good progress, more work to be done
• Improvements made in 1H 2016
– Strengthened sales leadership ranks
– Improved go-to market approach for Sales teams
– Enhanced training and certification programs
Pipeline has improved 2 quarters in a row
New enterprise/mid-market logos signed in 1H 2016 almost doubled YoY
• Priorities for 2H 2016
– Cross-sell high-growth offerings to current customers
– Grow partner network and expand channel sales
– Increase brand awareness and help customers understand our value add

6
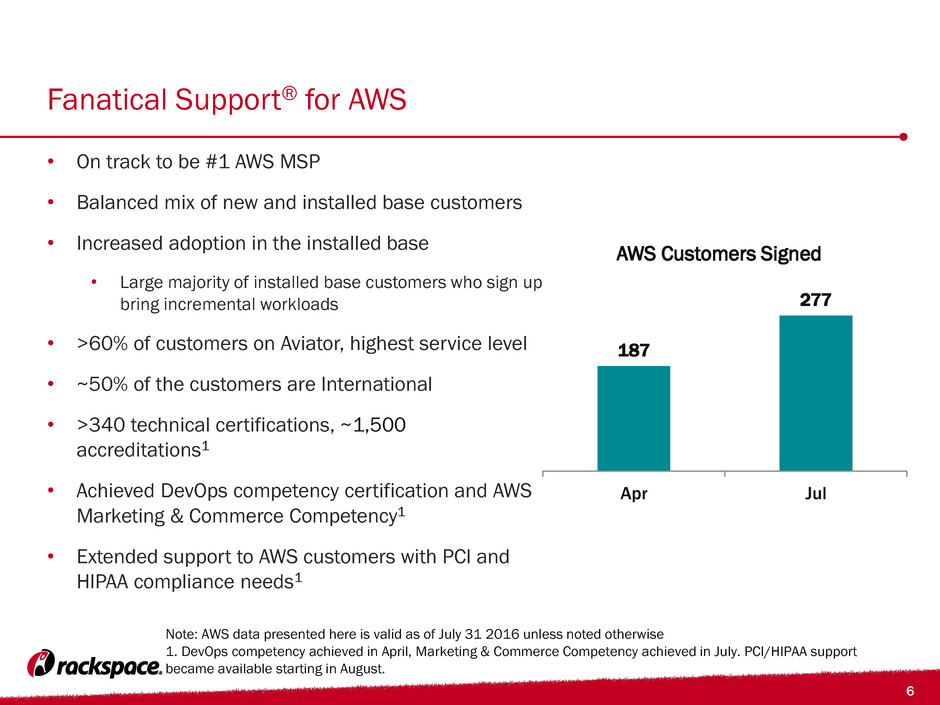
Fanatical Support® for AWS
• On track to be #1 AWS MSP
• Balanced mix of new and installed base customers
• Increased adoption in the installed base
• Large majority of installed base customers who sign up
bring incremental workloads
• >60% of customers on Aviator, highest service level
• ~50% of the customers are International
• >340 technical certifications, ~1,500
accreditations1
• Achieved DevOps competency certification and AWS
Marketing & Commerce Competency1
• Extended support to AWS customers with PCI and
HIPAA compliance needs1
Note: AWS data presented here is valid as of July 31 2016 unless noted otherwise
1. DevOps competency achieved in April, Marketing & Commerce Competency achieved in July. PCI/HIPAA support
became available starting in August.
187
277
Apr Jul
AWS Customers Signed

7
Microsoft Cloud
178
211
Apr Jul
Microsoft Customers Signed
Note: Microsoft Cloud data presented here is valid as of July 31 2016 unless noted otherwise
• Signed 211 Microsoft Cloud customers since
launch
• Microsoft Private Cloud demand is driven by mid-
market and large enterprises
• Increased traction for Microsoft Azure since
offering refresh in May
• Broadened channel reach with Fanatical Support
for Microsoft Azure and Office 365 Reseller and
Referral Program
• One of less than 10 hosting providers globally
enabled for 2-Tier distribution across entire
Microsoft suite

8
OpenStack Private Cloud
• Focus is on larger, multi-cloud
customers
• Complex enterprise deployments are
leading to longer time to deployment
• Major wins:
• One of the world’s largest industrial
conglomerates
• One of the world’s largest auto
manufacturers

9
2016 Key Focus Areas
• Optimizing mature parts of our business and increasing cost savings
• Investing in high growth areas and expanding our position as the #1 managed
cloud provider
• Increasing cash generation
– Almost $100M of FCF generated this quarter
• Completed $500M share buyback commitment
– Incremental buyback capacity of up to $500M authorized till August 2017

10
Financial and Operational
Information

11
Summary Financial Results
Q 2 2 01 6 Q 2 2 01 5 Q 1 2 01 6
A C T U A L S G U I D A N C E 1 A C T U A L S A C T U A L S
R E V E N U E $524M $519M-$524M $489M $518M
YoY Growth 7.0% 6%-7% 11.0% 7.9%
YoY Growth (Normalized) 2 8.9% 8%-9% 13.7% 9.9%
QoQ Growth 1.1% N/A 1.9% -0.9%
QoQ Growth (Normalized) 2 0.9% 0.2%-1.2% 1.8% 0.7%
Net Income Margin 6.8% N/A 5.8% 9.4%
Adjusted EBITDA Margin2 35.8% 33.0% - 35.0% 32.8% 34.5%
GAAP Diluted EPS $0.28 N/A $0.20 $0.37
Non-GAAP Diluted EPS2 $0.38 N/A $0.29 $0.34
Capital Expenditure as % of Revenue 15.7% N/A 31.0% 15.2%
Cash Flow from Operations $165M N/A $123M $156M
FCF2 $98M N/A $37M $89M
Return on Assets 7.1% N/A 6.4% 9.7%
Return On Capital2 16.4% N/A 11.8% 14.4%
1. Q2 16 guidance provided on 9 May. 2016
2. Reference the Appendix for reconciliation of non-GAAP financial measures

12
Updated Free Cash Flow methodology1
Free Cash Flow (New methodology)
Net cash provided by operating activities
Less: Cash purchases of property and
equipment
Plus: Excess tax benefits from share-
based compensation arrangements
____________________________________
Free cash flow
Adjusted EBITDA
Plus: Non-cash deferred rent
Less: Total capital expenditures
Less: Cash payments for interest, net of
interest received
Less: Cash payments for income taxes,
net of refunds
______________________________________
Adjusted free cash flow
Adjusted Free Cash Flow (Old methodology)
1. The company has stopped using “Adjusted Free Cash Flow” and is now using “Free Cash Flow” in order
to be in line with updated SEC guidelines.

13
Brexit Update
Current impact
• 20-25% of revenue exposed to UK/Europe
• Muted margin impact due to local cost structure
• Minimal impact in Q2 2016 due to late June timing of Brexit
2H16 impact
• Gartner forecasting significant slowdown in 2016 UK IT spending
• Seeing signs of elevated, but contained, churn
• YoY FX headwinds of ~250 bps/~$50M affecting 2016 GAAP revenue growth

14
Leverage and Buyback Update
LEVERAGE CALCULATION
Credit facility $0M
Senior Notes $500M
Capital Leases $1M
LTM Adj. EBITDA1 (Q2 16) $724M
Gross Leverage 0.69x
Equity Raised/Returned in $M
Since 2008 IPO
Raised (IPO & Employee
Stock Purchases)
$345M
Returned to Shareholders
through share repurchases
$700M
• Current Leverage
• 0.69x Last twelve months (LTM) Adj. EBITDA1
excluding off-balance sheet liabilities, close to
target leverage of 0.75x2
• Buyback
• $500M commitment completed (through open
market & 10b5-1 plan purchases)
• Incremental capacity under our authorized share
repurchase plan to buy back additional $500M of
shares by August 2017
1. Reference the Appendix for reconciliation of non-GAAP financial measures
2. 0.75x target leverage is equivalent to the ~1.5x target leverage including off balance sheet leases.

15
Server Consolidation Update
• Continued server decommissioning
• ~2,900 servers decommissioned due to
legacy public cloud migration to
OpenStack public cloud
– Majority of servers used for >3 years
– Expect continued migration and improved
server utilization over 2016 and early 2017
• ~500 servers decommissioned as a part
of Cloud Sites server consolidation
• GAAP average revenue per server up
2.8% QoQ
• Normalized average revenue per server
up 2.6% QoQ
$1,472 $1,510
Q1 2016 Q2 2016
Normalized Average Revenue per
Server1
$3 FX QoQ
tailwind
$1 Jungle
Disk
impact
$1,513
1. Reference the Appendix for reconciliation of non-GAAP financial measures

16
Guidance for Q3 16
Q3 16 Guidance
Revenue (GAAP, $M) $510 - $515
GAAP growth YoY 0.2% - 1.2%
Normalized growth YoY (a) 4.9% - 5.9%
GAAP growth QoQ (2.6)% - (1.6)%
Normalized growth QoQ (a) (0.2)% - 0.7%
Adj. EBITDA Margin 33% - 35%
Notes:
(a) Excludes ~470/240 bps of negative YoY/QoQ impact from currency movements (370 bps YoY/
180 bps QoQ) and asset divestiture (100 bps YoY/60 bps QoQ)

17
Guidance for 2016
2016 Guidance
Revenue (GAAP, $M) $2,060 - $2,080
GAAP growth YoY 3% - 4%
Normalized growth YoY (a) 6.5% -7.5%
Adj. EBITDA Margin (b) 33% - 35%
Effective tax rate 35%
Capital expenditure as % of Revenue 16% - 18%
Notes:
(a) Excludes ~350 bps ($70M) of negative impact from currency movements (~250 bps, ~$50M)
and asset divestiture (~100 bps, ~$20M)
(b) Excludes future asset divestiture-related gain and one-time impacts

18
Appendix
(Reconciliation of Non-GAAP Financial
Measures)

19
Reconciliation of Non-GAAP Financial Measures
Revenue Growth Adjusted for FX and Asset Divestiture
(In millions) Net Revenue
Foreign
Currency
Translation
Asset
Divestiture
Adjustment
Revenue Growth Adjusted
for Foreign Currency and
Asset Divestiture
June 30, 2016 $523.6 $6.1 $ - $529.7
June 30, 2015 489.4 - (3.0) 486.4
Dollar Change $34.2 $43.3
Percent Change 7.0 % 8.9 %
June 30, 2016 $523.6 $(1.1) $ - $522.5
March 31, 2016 518.1 - (0.2) 517.9
Dollar Change 5.5 4.6
Percent Change 1.1 % 0.9 %
June 30, 2015 $489.4 $12.1 - $501.5
June 30, 2014 441.2 - - 441.2
Dollar Change 48.2 60.3
Percent Change 11.0 % 13.7 %

20
Reconciliation of Non-GAAP Financial Measures
Revenue Growth Adjusted for FX and Asset Divestiture
(In millions) Net Revenue
Foreign
Currency
Translation
Asset
Divestiture
Adjustment
Revenue Growth Adjusted
for Foreign Currency and
Asset Divestiture
June 30, 2015 $489.4 $(0.7) - $488.7
March 31, 2015 480.2 - - 480.2
Dollar Change $9.2 $8.5
Percent Change 1.9 % 1.8 %
March 31, 2016 $518.1 $6.4 $(0.2) $524.3
March 31, 2015 480.2 - (3.0) 477.2
Dollar Change 37.9 47.1
Percent Change 7.9 % 9.9 %
March 31, 2016 $518.1 $5.7 $(0.2) $523.6
December 31, 2015 522.8 - (2.9) 519.9
Dollar Change (4.7) 3.7
Percent Change (0.9) % 0.7 %

21
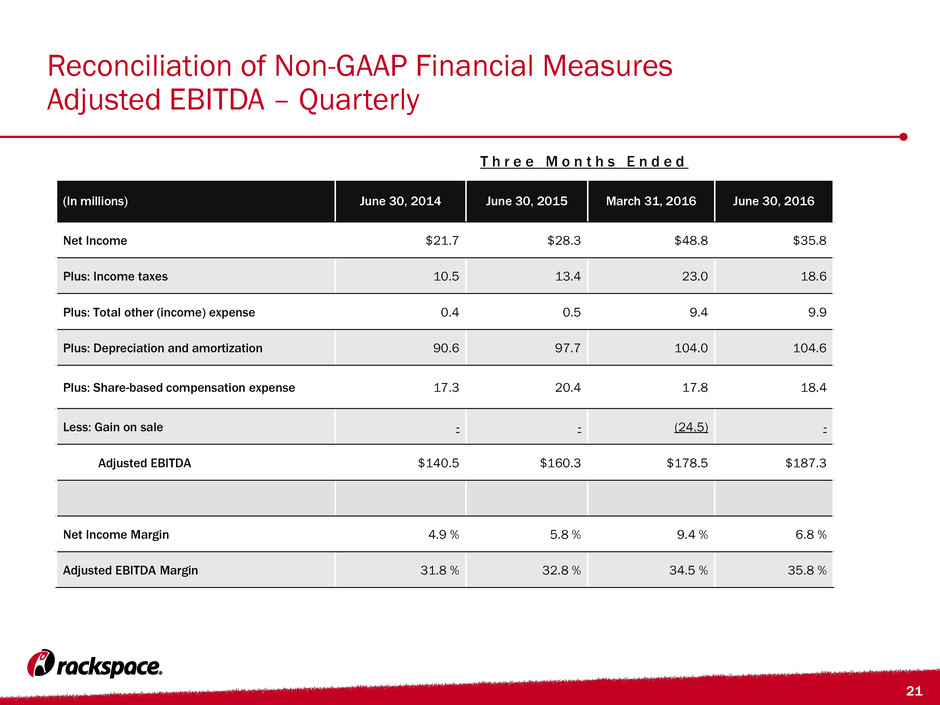
Reconciliation of Non-GAAP Financial Measures
Adjusted EBITDA – Quarterly
T h r e e M o n t h s E n d e d
(In millions) June 30, 2014 June 30, 2015 March 31, 2016 June 30, 2016
Net Income $21.7 $28.3 $48.8 $35.8
Plus: Income taxes 10.5 13.4 23.0 18.6
Plus: Total other (income) expense 0.4 0.5 9.4 9.9
Plus: Depreciation and amortization 90.6 97.7 104.0 104.6
Plus: Share-based compensation expense 17.3 20.4 17.8 18.4
Less: Gain on sale - - (24.5) -
Adjusted EBITDA $140.5 $160.3 $178.5 $187.3
Net Income Margin 4.9 % 5.8 % 9.4 % 6.8 %
Adjusted EBITDA Margin 31.8 % 32.8 % 34.5 % 35.8 %

22
Reconciliation of Non-GAAP Financial Measures
Adjusted EBITDA LTM
T h r e e M o n t h s E n d e d
(In millions)
September 30,
2015
December
31, 2015
March 31, 2016 June 30, 2016 LTM
Net Income $35.5 $31.1 $48.8 $35.8 $151.2
Plus: Income taxes 15.6 23.1 23.0 18.6 80.3
Plus: Total other (income) expense 3.9 5.7 9.4 9.9 28.9
Plus: Depreciation and amortization 101.3 104.0 104.0 104.6 413.9
Plus: Share-based compensation
expense
19.6 18.1 17.8 18.4 73.9
Less: Gain on sale - - (24.5) - (24.5)
Adjusted EBITDA $175.9 $182.0 $178.5 $187.3 $723.7

23
Reconciliation of Non-GAAP Financial Measures
Free Cash Flow
T h r e e M o n t h s E n d e d
(In millions) June 30, 2014 June 30, 2015 March 31, 2016 June 30, 2016
Net cash provided by operating activities $124.5 $122.9 $156.2 $164.9
Less: Cash purchases of property and equipment (114.0) (104.7) (82.9) (76.7)
Plus: Excess tax benefits from share-based
compensation arrangements
13.2 18.6 15.8 10.2
Free cash flow $23.7 $36.8 $89.1 $98.4

24
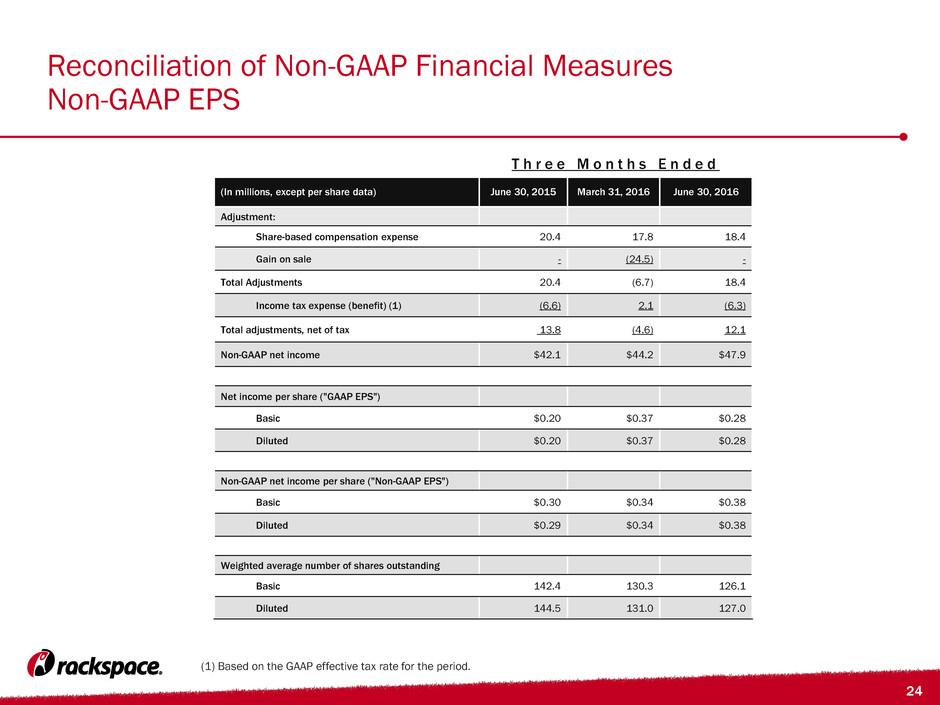
Reconciliation of Non-GAAP Financial Measures
Non-GAAP EPS
(1) Based on the GAAP effective tax rate for the period.
T h r e e M o n t h s E n d e d
(In millions, except per share data) June 30, 2015 March 31, 2016 June 30, 2016
Adjustment:
Share-based compensation expense 20.4 17.8 18.4
Gain on sale - (24.5) -
Total Adjustments 20.4 (6.7) 18.4
Income tax expense (benefit) (1) (6.6) 2.1 (6.3)
Total adjustments, net of tax 13.8 (4.6) 12.1
Non-GAAP net income $42.1 $44.2 $47.9
Net income per share ("GAAP EPS")
Basic $0.20 $0.37 $0.28
Diluted $0.20 $0.37 $0.28
Non-GAAP net income per share ("Non-GAAP EPS")
Basic $0.30 $0.34 $0.38
Diluted $0.29 $0.34 $0.38
Weighted average number of shares outstanding
Basic 142.4 130.3 126.1
Diluted 144.5 131.0 127.0

25
Reconciliation of Non-GAAP Financial Measures
Return on Capital
T h r e e M o n t h s E n d e d
(In millions) June 30, 2015 March 31, 2016 June 30, 2016
Income from operations $42.2 $81.2 $64.3
Adjustment for gain on sale - (24.5) -
Adjustment for build-to-suit lease impact (1) (0.4) (2.2) (2.6)
Income from operations, adjusted $41.8 $54.5 $61.7
Effective tax rate 32.2 % 32.1 % 34.0 %
Net operating profit after tax (NOPAT) $28.4 $37.0 $40.7
Total assets at period end $1,826.6 $2,025.4 $1,996.8
Add: Unamortized debt issuance costs (2) - 7.4 7.2
Less: Excess cash (3) (258.4) (472.0) (481.5)
Less: Accounts payable and accrued expenses, accrued
compensation and benefits, and income and other taxes
payable
(256.4) (213.0) (219.1)
Less: Deferred revenue (current and non-current) (29.7) (29.0) (30.2)
Less: Other non-current liabilities, deferred income taxes,
deferred rent, and finance lease obligations for build-to-
suit leases
(299.7)
(313.6)
(296.4)
Capital base $982.4 $1,005.2 $976.8
Average total assets $1,756.0 $2,019.8 $2,011.1
Average capital base $961.2 $1,026.6 $991.0
Return on assets (annualized) 6.4 % 9.7 % 7.1 %
Return on capital (annualized) 11.8 % 14.4 % 16.4 %
(1) Reflects additional expense we would have
expected to record if our build-to-suit lease
arrangements had been deemed operating leases
instead of finance lease obligations for build-to-suit
leases. Calculated as the excess of estimated
straight-line rent expense over actual depreciation
expense for completed real estate projects under
build-to-suit lease arrangements.
(2) Amount recorded as a direct deduction from the
carrying value of the long-term debt liability in the
consolidated balance sheets.
(3) Defined as the amount of cash and cash
equivalents that exceeds our operating cash
requirements, which is calculated as three percent of
our annualized net revenue for the three months
prior to the period end.

26
Reconciliation of Non-GAAP Financial Measures
Average Revenue per Server
Three Months Ended
(In millions, except server count
and avg revenue per server)
March 31,
2016
June 30,
2016
Net Revenue $518.1 $523.6
Foreign currency translation - (1.1)
Asset Divestiture adjustment (0.2) -
Net Revenue in Constant
Currency, adjusted for Asset
Divestiture
$517.9 $522.5
Beginning of quarter server
count
118,177 116,507
End of quarter server count 116,507 114,231
Average server count 117,342 115,369
Average monthly net revenue
per average server
$1,472 $1,513
Average monthly net revenue
in Constant Currency, adjusted
for Asset Divestiture, per
average server
$1,471 $1,510

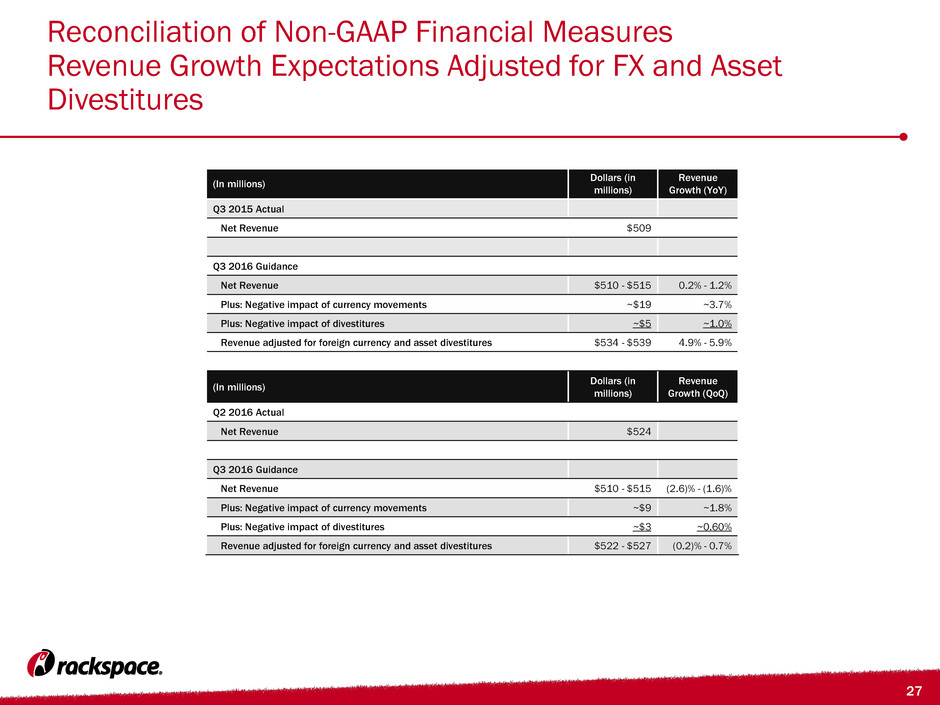
27
Reconciliation of Non-GAAP Financial Measures
Revenue Growth Expectations Adjusted for FX and Asset
Divestitures
(In millions)
Dollars (in
millions)
Revenue
Growth (YoY)
Q3 2015 Actual
Net Revenue $509
Q3 2016 Guidance
Net Revenue $510 - $515 0.2% - 1.2%
Plus: Negative impact of currency movements ~$19 ~3.7%
Plus: Negative impact of divestitures ~$5 ~1.0%
Revenue adjusted for foreign currency and asset divestitures $534 - $539 4.9% - 5.9%
(In millions)
Dollars (in
millions)
Revenue
Growth (QoQ)
Q2 2016 Actual
Net Revenue $524
Q3 2016 Guidance
Net Revenue $510 - $515 (2.6)% - (1.6)%
Plus: Negative impact of currency movements ~$9 ~1.8%
Plus: Negative impact of divestitures ~$3 ~0.60%
Revenue adjusted for foreign currency and asset divestitures $522 - $527 (0.2)% - 0.7%

28
Reconciliation of Non-GAAP Financial Measures
Revenue Growth Expectations Adjusted for FX and Asset
Divestitures
(In millions) Dollars (in millions)
Revenue
Growth
(YoY)
2015 Actual
Net Revenue $2,001
2016 Guidance
Net Revenue $2,060 - $2,080 3.0% - 4.0%
Plus: Negative impact of currency movements ~$50 ~2.5%
Plus: Negative impact of divestitures ~$20 ~1.0%
Revenue adjusted for foreign currency and asset divestitures $2,130 - $2,150 6.5% - 7.5%
