Attached files
| file | filename |
|---|---|
| EX-99.1 - EXHIBIT 99.1 - HMS HOLDINGS CORP | exh_991.htm |
| 8-K - FORM 8-K - HMS HOLDINGS CORP | f8k_080516.htm |
EXHIBIT 99.2

August 5, 2016 Q2 2016 Investor Presentation
Disclaimers FORWARD-LOOKINGSTATEMENTSThispresentationcontains"forward-lookingstatements"withinthemeaningoftheU.S.PrivateSecuritiesLitigationReformActof1995.Such statements giveourprojectionsorforecastsoffutureeventsandarebasedonourcurrentexpectations andassumptions regardingourbusiness,theeconomyandotherfuture conditions; they do not relate strictly to historical or current facts. Forward-looking statements can be identified by words such as “aims,” “anticipates,” “believes,” “estimates,” “expects,”“forecasts,”“intends,”“likely,” “may,”“plans,”“projects,”“seeks,”“targets,”“will,”“would,”“could,”“should,”andsimilarexpressionsandreferencestoguidance,although someforward-lookingstatements maybeexpressed differently.Inparticular,theseincludestatements relatingtofutureactions,businessplans,objectivesandprospects, future operatingorfinancialperformance,andspecificallyincludetheinformationunder“SummaryofProjectedFinancialMetricsfor2016”and“KeyThemesfor2016.”Factorsorevents thatcouldcauseactualresultstodiffermayemergefromtimetotimeanditisnotpossibleforustopredictallofthem.Shouldknownorunknownrisksoruncertaintiesmaterialize, orshouldunderlyingassumptionsproveinaccurate,actualresultscoulddiffermateriallyfrompastresultsandthoseanticipated,estimatedorprojected.Wecautionyoutherefore againstrelyingonanyoftheseforward-lookingstatements.Factorsthatcouldcauseorcontributetosuchdifferences,include,butarenotlimitedto:changesintheU.S.healthcare environmentorhealthcarefinancingsystem;negativeorreduced growthrateofspendingonMedicaid/Medicare;ourabilitytoretaincustomers orthelossofoneormoremajor customers; the unexpected reduction in scope or termination of a significant contract; customer dissatisfaction or our non-compliance with contractual provisions or regulatory requirements;ourfailuretomeetperformancestandardstriggeringsignificantcostsorliabilitiesunderourcontracts;emergenceofnewcompetitorsorcompetitors’introductionof neworsuperiorproductsorservices;intellectualpropertyrights,confidentialandproprietaryinformation;thecancellationordelayofprocurementsorcontractimplementationdueto protests orchallenges togovernment awards;regulatory, budgetary orpoliticalactions that affect procurement practices;ourabilitytocontinue tosecure contracts orfavorable contract terms through the competitive bidding process; our ability to execute our business plans or growth strategy; variations in our results of operations; development and implementation ofnewproduct solutions ornewprocessimprovements;theriskthat guidancemaynotbeachieved;ourabilitytomaintaineffective information andtechnology systemsandnetworks,andtoprotectthemfromdamage,interruptionorbreach,includingcyber-securitybreachesandotherdisruptions;ourfailuretocomplywithapplicablelaws andregulationsgoverningtheconductofcertainelectronichealthtransactionsandtheconfidentialityofindividuallyidentifiablehealthinformationortoprotectsuchinformationfrom theftandmisuse;thenatureofinvestmentandacquisitionopportunitieswearepursuing,andthesuccessfulexecutionorintegrationofsuchinvestmentsandacquisitions;thefailure torealizethefullvalueofgoodwillorintangibleassetsfromacquisitions;negativeresultsofgovernment orcustomerreviews,auditsorinvestigations;stateorfederallimitations related tothe outsourcing ofcertain government programs orfunctions;ourreliance onsubcontractors, vendors orother thirdparty providers andsources toperform services; pendingorthreatenedlitigation;unfavorableoutcomesinlegalproceedings;restrictionsonbiddingorperformingcertainworkduetoperceivedconflictsofinterests;ourabilityto attractandretainqualifiedemployeesandkeypersonnelandtomanageleadershiptransitionseffectively;ourcashflowsfromoperations, availablecashandabilitytogenerate sufficient cash to cover our interest and principal payments under our credit facility or to borrow or use credit; unanticipated changes in our effective tax rates; unanticipated increasesinthenumberoramountofclaimsforwhichweareself-insured;themarketpriceofourcommonstockandlackofdividendpayments;risksrelatedtointernalcontrolover financialreporting;anti-takeoverprovisionsinourcorporategovernancedocuments;andotherfactors,risksanduncertaintiesdescribedinourmostrecentAnnualReportonForm 10-KandsubsequentfilingswiththeSecuritiesandExchangeCommission.Anyforward-lookingstatementsaremadeasofthedateofthispresentation.Exceptasmayberequired bylaw,wedisclaimanyobligationtopubliclyupdateforward-lookingstatements,whetherasaresultofnewinformation,futureeventsorotherwise. NON-GAAPFINANCIALINFORMATION.Thispresentationcontainscertainnon-GAAPmeasures.Thesenon-GAAPmeasures,ascalculatedbytheCompany,arenotnecessarily comparable tosimilarlytitledmeasuresreported byother companies.Additionally, these non-GAAPmeasures arenotmeasurements offinancialperformance orliquidityunder GAAPandshouldnotbeconsidered alternatives totheCompany's otherfinancialinformation determined underGAAP.Seeslide9fordefinitions andreconciliations ofcertain non-GAAPmeasures. MARKETANDINDUSTRYDATA.Thispresentationcontainsmarketandindustrydataandforecaststhathavebeenobtainedfrompubliclyavailableinformation,variousindustry publications,otherpublishedindustrysourcesandourinternaldataandestimates.Wehavenotindependentlyverifiedtheinformationandcannotmakeanyrepresentationastothe accuracyorcompletenessofsuchinformation.Noneofthereportsandothermaterialsofthirdpartysourcesreferredtointhispresentationwerepreparedforusein,orinconnection with,thispresentation.Ourinternaldataandestimatesarebaseduponinformationobtainedfromourcustomers,ourpartners,tradeandbusinessorganizations,publiclyavailable informationandothercontacts inthemarketsinwhichweoperateandourmanagement’s understanding ofindustry conditions.Estimates aredifficulttodevelopandinherently uncertain andwecannot assure youthat theyareaccurate.Ourestimates involve risksanduncertainties andaresubject tochange based onvarious factors, including those discussedabove. HMSY Q2 2016 Investor Presentation / August 5, 2016

Presentation Outline HMSY Q2 2016 Investor Presentation / August 5, 2016 Q2 Financial Results ▪ Financial Performance Highlights ▪ Quarterly Financial Information ▪ QuarterlyMarketand Product Revenue 1-3 Commercial Health Plan Business ▪ 2014-2016 Quarterly Revenue ▪ Q2’16 Sales 4-5 State Government Business ▪MedicaidEnrollment Growth 6 Outlook for 2016 ▪ ProjectedFinancial Metrics ▪ Strategic Focus 7-8 Adjusted EPS Reconciliation to GAAP 9

HMSY Q2 2016 Investor Presentation / August 5, 2016 / 1 Financial Performance Highlights ▪ GAAP EPS of $.10 per diluted share and adjustedEPSof$0.18perdilutedshare 1 inQ2 ▪ Revenueof$123.6millionwas5.7%higheryear- over-year. Revenue for the first six months of 2016increased7.0%comparedto1H’15 ▪ Quarterlycommercialhealthplanrevenueincreased 12.0%year-over-year ▪ Commercial health plan revenue for the first six monthsof2016increased20.2%comparedto1H’15 ▪ State government revenue increased 0.7% year- over-year. For the first six months of 2016, State governmentrevenuedeclined7.4%asexpected 2 ▪ Payment Integrity revenue, excluding Medicare RAC, increased 4.2% compared to the first quarterof2016.Forthefirstsixmonthsof2016, PIrevenueincreasedby6.8% ▪ Theeffectivetaxratewas40.1%forthequarter Q2 Financial Results 1 AdjustedEPSisanon-GAAPmeasure(seereconciliationonslide9). 2 Declinewasduetothenon-recurringspilloverbenefitofseveralmilliondollarsreceivedinQ1’15asaresultof the2014MedicaidexpansionpursuanttotheAffordableCareAct

HMSY Q2 2016 Investor Presentation / August 5, 2016 / 2 Q2 Financial Results Quarterly Financial Information (Unaudited, $ in thousands, except per share amounts) Q2'15 Q3'15 Q4'15 Revenue $ 116,934 $ 118,444 $ 128,514 $ 119,763 $ 123,550 Cost of services: Compensation 43,883 43,628 46,694 46,401 47,343 Data processing 10,438 10,023 10,409 9,624 9,104 Occupancy 3,806 4,188 3,765 3,627 3,631 Direct project costs 13,572 12,702 14,776 14,483 11,473 Other operating costs 7,153 6,551 8,453 5,776 6,407 Amortization of acquisition related software and intangible assets 7,047 7,041 7,012 7,013 7,013 Total cost of services 85,899 84,133 91,109 86,924 84,971 Selling, general & administrative expenses 19,283 21,295 22,582 22,930 22,227 Total operating expenses 105,182 105,428 113,691 109,854 107,198 Operating income 11,752 13,016 14,823 9,909 16,352 Interest expense (1,940) (1,948) (1,970) (2,091) (2,100) Interest income 12 11 15 47 60 Income before income taxes 9,824 11,079 12,868 7,865 14,312 Income taxes 4,406 4,217 4,143 3,305 5,746 Net income $ 5,418 $ 6,862 $ 8,725 $ 4,560 $ 8,566 Net income per diluted share $ 0.06 $ 0.08 $ 0.10 $ 0.05 $ 0.10 Weighted average common shares, diluted 88,908 87,792 87,110 84,479 84,528 Diluted adjusted EPS $ 0.13 $ 0.15 $ 0.19 $ 0.14 $ 0.18 Q2'16Q1'16
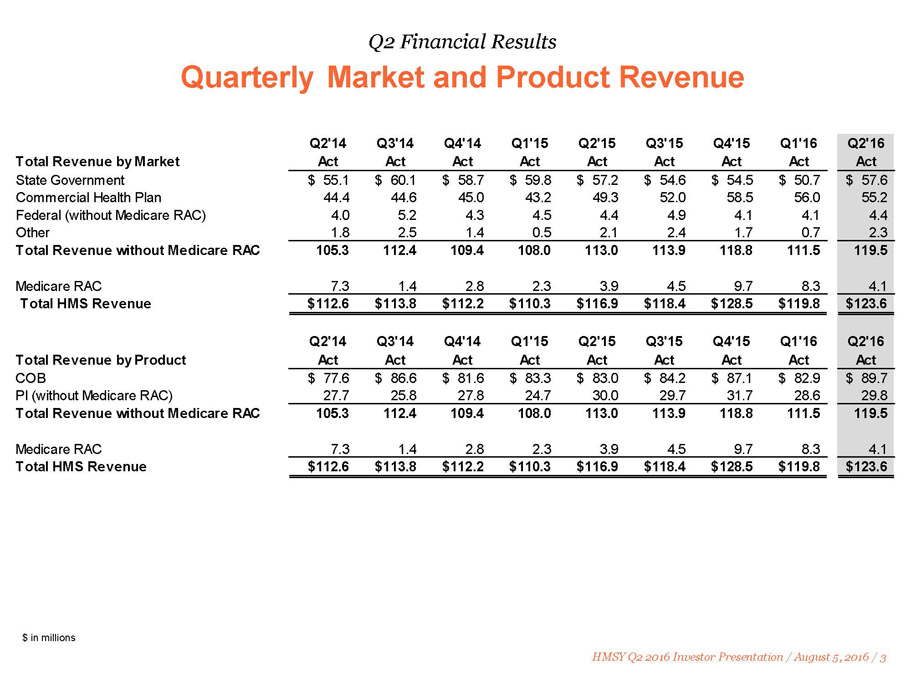
HMSY Q2 2016 Investor Presentation / August 5, 2016 / 3 Q2 Financial Results QuarterlyMarket and Product Revenue $ in millions Q2'14 Q3'14 Q4'14 Q1'15 Q2'15 Q3'15 Q4'15 Q1'16 Q2'16 Total Revenue by Market Act Act Act Act Act Act Act Act Act State Government 55.1$ 60.1$ 58.7$ 59.8$ 57.2$ 54.6$ 54.5$ 50.7$ 57.6$ Commercial Health Plan 44.4 44.6 45.0 43.2 49.3 52.0 58.5 56.0 55.2 Federal (without Medicare RAC) 4.0 5.2 4.3 4.5 4.4 4.9 4.1 4.1 4.4 Other 1.8 2.5 1.4 0.5 2.1 2.4 1.7 0.7 2.3 Total Revenue without Medicare RAC 105.3 112.4 109.4 108.0 113.0 113.9 118.8 111.5 119.5 Medicare RAC 7.3 1.4 2.8 2.3 3.9 4.5 9.7 8.3 4.1 Total HMS Revenue 112.6$ 113.8$ 112.2$ 110.3$ 116.9$ 118.4$ 128.5$ 119.8$ 123.6$ Q2'14 Q3'14 Q4'14 Q1'15 Q2'15 Q3'15 Q4'15 Q1'16 Q2'16 Total Revenue by Product Act Act Act Act Act Act Act Act Act COB 77.6$ 86.6$ 81.6$ 83.3$ 83.0$ 84.2$ 87.1$ 82.9$ 89.7$ PI (without Medicare RAC) 27.7 25.8 27.8 24.7 30.0 29.7 31.7 28.6 29.8 Total Revenue without Medicare RAC 105.3 112.4 109.4 108.0 113.0 113.9 118.8 111.5 119.5 Medicare RAC 7.3 1.4 2.8 2.3 3.9 4.5 9.7 8.3 4.1 Total HMS Revenue 112.6$ 113.8$ 112.2$ 110.3$ 116.9$ 118.4$ 128.5$ 119.8$ 123.6$

HMSY Q2 2016 Investor Presentation / August 5, 2016 / 4 Commercial Health Plan Growth Commercial Health Plan Revenue 2014-2016 Projected Annual Revenue Growth of 18-20% for 2016 ($ in thousands) ▪ YTD Growth of 20.2% Compared to Comparable Period in 2015

HMSY Q2 2016 Investor Presentation / August 5, 2016 / 5 ▪ New commercial health plan customer sales covering approximately 15.0 million lives ▪ Additional products sold to current commercial health plan customers covering approximately 3.1 million lives 1 Commercial Health Plan Growth Q2 Commercial Health Plan Sales 1 In some instances both COB and PI products were sold to the same customer life, but such sales are only counted once for purposes of this calculation 2 Percentage of additional products sold to current customers based on projected revenue Note: Data as of June 30, 2016 2 2

State Government Business New Medicaid Enrollment Through May 2016 1 CMS Medicaid & CHIP: July 2016 Monthly Applications, Eligibility Determinations and Enrollment Report, July 28, 2016. This analysis compares Medicaid enrollment of ~15.1 million lives reported through 5/31/16 to enrollment as of 10/1/13, which was the beginning of Marketplace open enrollment and the CMS baseline for measuring expansion ~13.2M of ~15.1M new CMS-reported 1 Medicaid lives are in HMS customer eligibility files 250,000 or more (20) 100,000 –249,000 (6) 30,000 –99,999 (10) 1 –29,999 (10+DC) No growth (3) No data reported (2) CA NV OR WA ID MT ND SD NE KS OK TX HI AK AZ UT WY CO NM MO IA MN WI MI AR LA MS AL GA FL SC TN NC KY IL IN OH PA NY WV VA ME MD DE NJ CT RI MA VT NH DC HMSY Q2 2016 Investor Presentation / August 5, 2016 / 6

Outlook for Full Year 2016 Financial Performance* * Initially provided on Q4’15 earnings call on 2/26/16. State Government and Medicare RAC revenue updatedon Q2’16 earnings call on 8/5/16 1 Summary of Projected Financial Metrics for 2016 ▪ Year-over-year commercial health plan revenue growth of 18-20% ▪ State government revenue in 2H’16 of ~110 million including New Jersey 1 ▪ Medicare RAC revenue of ~$13 million through 3Q’16 1 ▪ Federal and other revenue unchanged at ~$24.5 million for the full year ▪ Flat operating costs (excluding non-recurring legal expense), while continuing to invest in commercial growth and innovation ▪ Full year projected effective tax rate of approximately 40% ▪ Full year operating cash flow of $80 -100 million ▪ Full year capital expenses of ~$20 million, primarily for IT infrastructure, product enhancements and new product development 1 Total state revenue for 2013, the year before Medicaid expansion pursuant to the Affordable Care Act, was $207.5 million. Trending that forward at 2% per year –consistent with our long-term view that the HMS State TPL business is a low single-digit grower –corrects for what was effectively a one-time state revenue benefit during 2014 and early 2015 caused by the ACA expansion. Doing so produces a total of roughly $220 million for 2016 or a quarterly run rate of approximately $55 million, which is consistent with our expectation for state revenue over the second half of 2016. Medicare RAC revenue was $12.4 million through June 30, 2016. With the expiration of the current contract on July 31, 2016 and the new ADR limits which became effective on January 1, 2016, Medicare RAC revenue in the third quarter is expected to be less than $1 million. HMSY Q2 2016 Investor Presentation / August 5, 2016 / 7
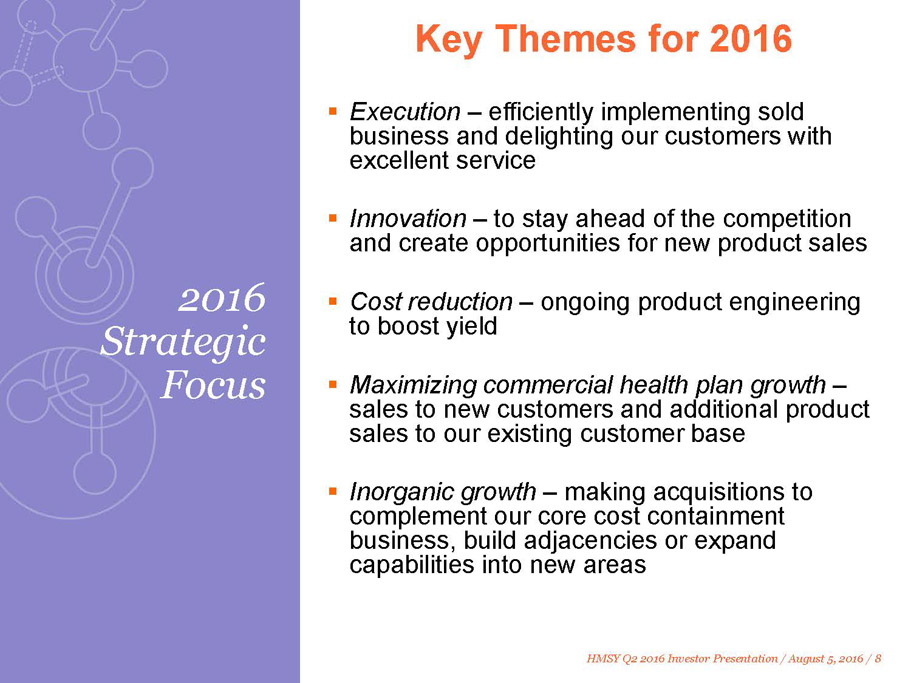
HMSY Q2 2016 Investor Presentation / August 5, 2016 / 8 Key Themes for 2016 ▪Execution–efficiently implementing sold business and delighting our customers with excellent service ▪Innovation–to stay ahead of the competition and create opportunities for new product sales ▪Cost reduction–ongoing product engineering to boost yield ▪Maximizing commercial health plan growth– sales to new customers and additional product sales to our existing customer base ▪Inorganic growth–making acquisitions to complement our core cost containment business, build adjacencies or expand capabilities into new areas 2016 Strategic Focus

Reconciliation of Net Income to GAAP EPS and Adjusted EPS HMSY Q2 2016 Investor Presentation / August 5, 2016 / 9 Note: The Company believes that the non-GAAP financial measure above provides useful information to the Company's management,investorsandotherinterestedpartiesabouttheCompany'soperatingperformancebecauseitallowsthemto understand and comparethe Company's operating results during the current periods to the prior year periods in a more consistentmanner.Thenon-GAAPmeasurepresentedinthisslidemaynotbecomparabletosimilarlytitledmeasuresused byothercompanies. 1 Inperiodspriorto2016,legalfeesrelatedtodisputesinvolvingPCGwereincludedinoperationsbecauseitwasconsidered partofnormaloperations. (Unaudited,$inthousands,exceptpersharedata) As summarized in the following table, diluted earnings per share adjusted for stock-based compensationexpense,non-recurringlegalexpense,amortizationofacquisitionrelatedsoftwareand intangibleassetsandrelatedtaxes(adjustedEPS)was$0.18forthesecondquarterof2016. 2 Taxeffectofadjustmentsiscomputedasthepre-taxeffectoftheadjustmentsmultipliedbythe applicablestatutoryrates Legal fees related to disputes involving PCG $ 524 $ 943 $ 1,351 Income taxes on legal fees (2) (224) (343) (451) Sub-total $ 300 $ 600 $ 900 Diluted Adjusted EPS $ 0.00 $ 0.01 $ 0.01 Q2'15 Q3'15 Q4'15 Net income $ 5,418 $ 6,862 $ 8,725 $ 4,560 $ 8,566 Stock-based compensation 3,823 3,140 4,089 4,240 4,405 Non-recurring legal fees (1) - - - 1,248 315 Amortization of acquisition related software and intangible assets 7,047 7,041 7,013 7,013 7,013 (4,875) (3,711) (3,350) (5,253) (4,704) Sub-total $ 11,413 $ 13,332 $ 16,477 11,808 15,595 Weighted average common shares, diluted 88,908 87,792 87,110 84,479 84,528 Diluted GAAP EPS 0.06$ 0.08$ 0.10$ $ 0.05 $ 0.10 Diluted Adjusted EPS 0.13$ 0.15$ 0.19$ $ 0.14 $ 0.18 Q2'16 Income tax related adjustments Q1'16Q2'15 Q3'15 Q4'15

Enterprising healthcare