Attached files
| file | filename |
|---|---|
| EX-99.1 - EX-99.1 - BLACKSTONE MORTGAGE TRUST, INC. | d231512dex991.htm |
| 8-K - 8-K - BLACKSTONE MORTGAGE TRUST, INC. | d231512d8k.htm |
 Blackstone Mortgage Trust, Inc. July 26, 2016 Second Quarter 2016 Results Exhibit 99.2 |
 Second Quarter 2016 Highlights
Information included in this presentation is as of or for the period ended June
30, 2016, unless otherwise indicated. See Appendix for definitions of Core Earnings and Gross Return on Investment (“Gross ROI”), as well as certain per share calculations that are referenced throughout this presentation. Discussion of loan portfolio and portfolio metrics included in this presentation includes $1.1 billion of non-consolidated senior interests, which are senior interests in loans we originated and
syndicated to third-parties. These non-recourse loan
participations also constitute additional financing capacity for our
portfolio. (a)
See Appendix for a reconciliation to GAAP net income.
(b) Total liquidity includes $182 million of cash and $430 million of available borrowings. Potential loan originations assumes 4.0x
asset-level leverage on total liquidity, net of $144 million of
minimum liquidity requirements under applicable debt covenants.
Blackstone Mortgage Trust
1 GAAP net income of $63 million during 2Q; book value of $26.54 per share. Core Earnings of $0.67 per share during 2Q, (a) the fourth consecutive quarter of 105%+ coverage of the $0.62 dividend. Loan originations of $859 million were 100% comprised of senior, floating rate mortgage loans. Fundings totaled $848 million, with loan repayments of $966 million. Weighted average risk rating of 2.3 with no “4” or “5” rated loans in the portfolio. Closed an additional $1.8 billion of financing capacity, including $1.3 billion of additional capacity under existing revolving credit facilities and extended $1.1 billion of facility maturities. Potential loan origination capacity of $2.3 billion (b) based on quarter-end liquidity of $612 million. (b) |
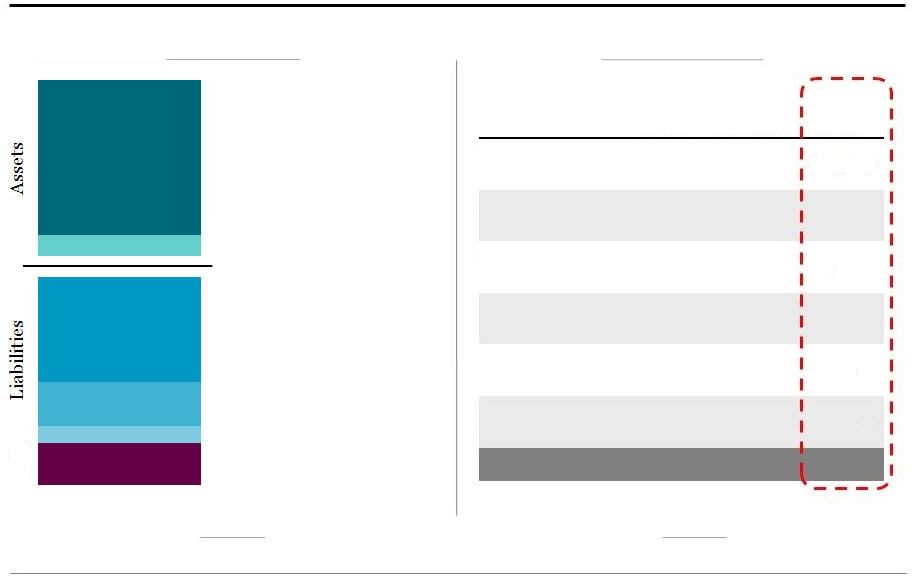 Operating Results Balance Sheet Second Quarter 2016 Balance Sheet and Operating Results (a) (a) See Appendix pages 10-13 for Second Quarter 2016 Balance Sheet, Net Income, Core Earnings, and per share calculations. See Appendix
page 14 for a definition of Core Earnings.
(b) Includes $182 million of cash and cash equivalents, $476,000 of restricted cash, $3 million of equity investments in unconsolidated
subsidiaries, and $212 million of other assets, net of
$193 million of other liabilities.
$0.67
Core Earnings per share (a) $26.54 Book Value per share (a) Loans receivable, net Secured debt agreements Loan participations sold Convertible notes, net Total equity $9,091 $6,198 $423 $2,509 (Dollars in Millions) $165 $204 Blackstone Mortgage Trust 2 GAAP Net Income Adjustments Core Earnings (a) Interest Income 130.2 $ (1.2) $ 129.0 $ Interest Expense (49.1) 0.4 (48.7) Management and Incentive Fees (15.8) — (15.8) G&A / Other (1.2) (0.1) (1.3) Non-Cash Compensation (4.8) 4.8 — CT Legacy Portfolio, net 3.8 (3.8) — Total 63.1 $ - $ 63.1 $ Other assets/liabilities, net (b) |
 Loan Portfolio Overview
Closed
four
new
loans
and
modified
three
loans
totaling
$859
million
of
new
originations
and
funded
$848
million,
including
$117
million
of
follow-on
fundings
of
previously
originated
loans.
Loan
repayments
of
$966
million.
Gross
ROI
(a)(b)
of
14.7%
and
LTV
of
62%.
Loan Portfolio Statistics
(a) See Appendix page 14 for a definition of Gross Return on Investment (“Gross ROI”).
(b) Assumes applicable floating benchmark rates for weighted-average calculation.
(c) Maximum maturity assumes all extension options are exercised, however floating rate loans generally may be repaid prior to their final
maturity without penalty. 2Q
Originations 100% floating rate loans
100% senior loans
Average all-in yield of L+4.67%
and Gross ROI
(a)
of L+13.56%
Average loan size of $161 million
Average origination LTV of 57%
Blackstone Mortgage Trust
3
(Dollars in Millions)
Floating Fixed Total Number of loans 89 27 116 Principal Balance $7,989 $2,196 $10,185 Wtd. avg. origination LTV 61% 66% 62% Wtd. avg. cash coupon (b) L + 4.02% 5.11% 4.66% Wtd. avg. all-in yield (b) L + 4.43% 5.50% 5.07% Wtd. avg. Gross ROI (a) L + 13.2% 18.2% 14.7% Wtd. avg. maximum maturity (c) 3.3 yrs. 2.9 yrs. 3.2 yrs. |
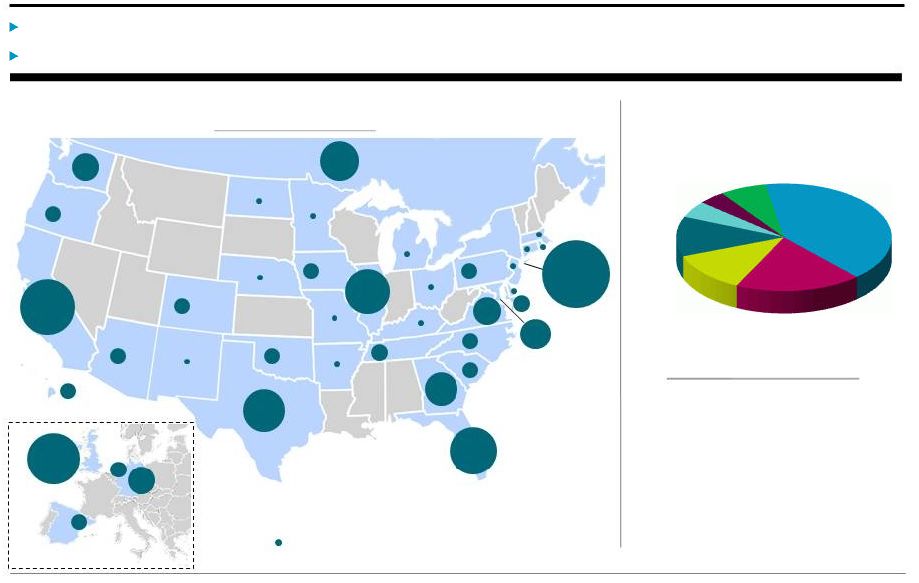 Portfolio Diversification
BXMT’s
portfolio
is
diversified
by
collateral
property
type
and
geographic
location.
Loans
secured
by
London
properties
represent
3%
of
the
total
portfolio,
with
a
wtd.
avg.
origination
LTV
of
54%.
Collateral Diversification
(Principal Balance, % of Total)
Office
Multifamily
Hotel
Condo 3%
Other
Retail
Manufactured
Housing (MHC)
Geographic Diversification
(Principal Balance, % of Total)
States that comprise less than 1% of total loan portfolio
(a) Excludes acquired GE portfolio loans. AZ 1% CO 1% HI 1% IA 1% MD 1% NC 1% OK 1% OR 1% PA 1% SC 1% TN, 1% ES 1% NL 1% DC 3% GA 4% VA 2% WA 2% DEU 3% CAN 5% FL 9% TX 6% UK 13% CA 14% NY 19% Average Loan Size (a) (Direct Originations Only) $120 million IL 7% Blackstone Mortgage Trust 4 41% 19% 12% 12% 6% 7% |
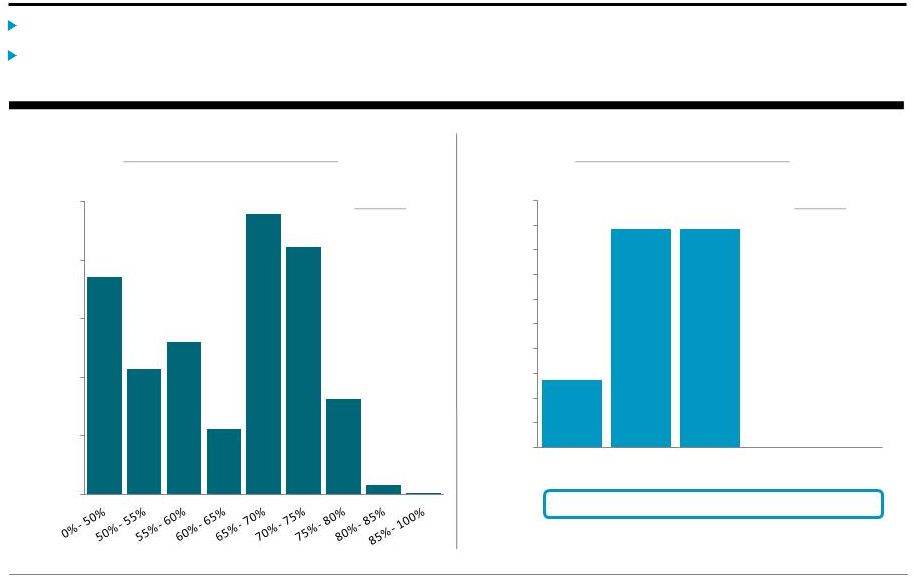 Portfolio Credit Quality
BXMT’s
senior
loan
portfolio
is
100%
performing,
with
no
defaulted
or
impaired
loans.
Upgraded
the
only
"4"
rated
loan
after
it
was
reduced
to
$11
million
by
a
$43
million
repayment
that
delevered
the
position.
Risk Rating Distribution
(b)
(Principal Balance, Dollars in Millions)
15
63 38
0 0 Loan Count: Origination Loan-to-Value (a) (Principal Balance, Dollars in Millions) 2.3 Weighted Average 62% Weighted Average Blackstone Mortgage Trust 5 (a) Reflects LTV as of the date loans were originated or acquired by BXMT. (b) Risk rating is assigned based on a variety of factors, including, without limitation, LTV, debt yield, property type, geographic and
local market dynamics, physical condition, cash flow volatility,
leasing and tenant profile, loan structure and exit plan, and project sponsorship. Based on a 5-point scale, our loans are rated “1” through “5,” from less risk to greater risk, which ratings are defined as follows: 1 – very low risk, 2 – low risk, 3 – medium risk, 4 –
high risk/potential for loss, 5 – impaired/loss likely. $0 $500 $1,000 $1,500 $2,000 $2,500 $3,000 $3,500 $4,000 $4,500 $5,000 1 2 3 4 5 $0 $500 $1,000 $1,500 $2,000 $2,500 |
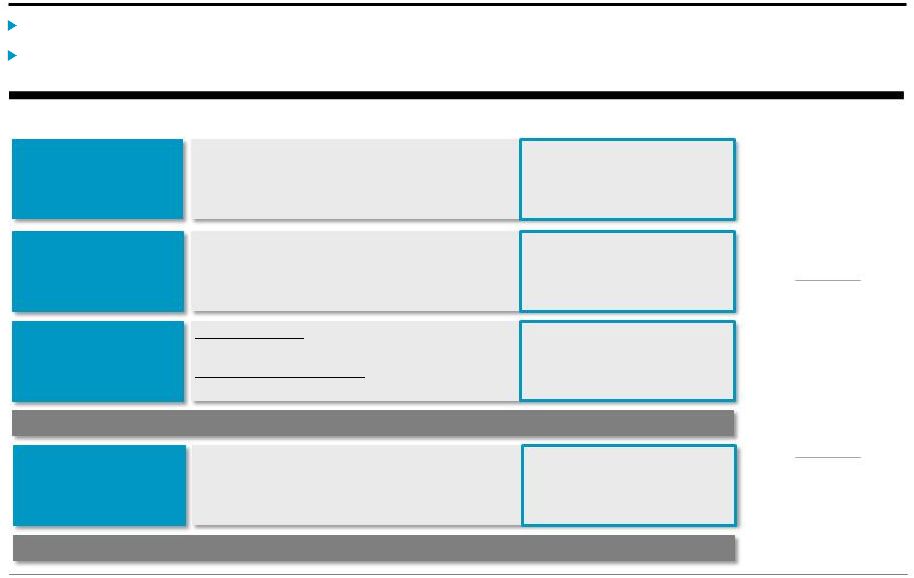 Financing Capacity Closed $1.8 billion of new financing capacity, and extended maturities on $1.1 billion of facilities. Total liquidity of $612 million (a) at quarter-end, providing for $2.3 billion (a) of potential loan originations and fundings. (a) Total liquidity includes $182 million of cash and $430 million of available borrowings. Potential loan originations assumes 4.0x
asset-level leverage on total liquidity, net of $144 million
of minimum liquidity requirements under applicable debt covenants.
(b) Includes $1.2 billion of capacity and $1.1 billion of non-consolidated senior interests, which result from non-recourse sales of
senior loan interests in loans BXMT originates. BXMT’s net
investments in these loans are reflected in the form of mezzanine or other subordinate loans on BXMT’s balance sheet. (c) Ratio of (i) total debt outstanding, less cash to (ii) stockholders’ equity. Excludes structural leverage provided by loan
participations sold and non-consolidated senior interests.
(d) Ratio of (i) total debt outstanding, loan participations sold, and non-consolidated senior interests, less cash to (ii)
stockholders’ equity. 2.5x
Debt-to-Equity
Ratio (c) 3.1x Total Leverage (d) Revolving Credit Facilities All-in cost of L+2.04% Asset-Specific Financings Primarily GE portfolio financing at an all-in cost of
L+1.86%
Corporate Debt
Convertible
Notes:
Unsecured
debt
with
an
all-in
cost
of 5.87%
Revolving
Credit
Agreement:
Secured
corporate
facility with a coupon of L+2.75%
Total Debt
Senior Loan
Participations
(b)
Pricing directly related to underlying collateral
assets
Total Financing
$5.5
$3.1
$3.5
$3.1
$0.3
$0.2
$9.3
$6.4
$1.6
$1.5
$10.9
$7.9
Capacity
Outstanding
(Dollars in Billions)
Blackstone Mortgage Trust
6 |
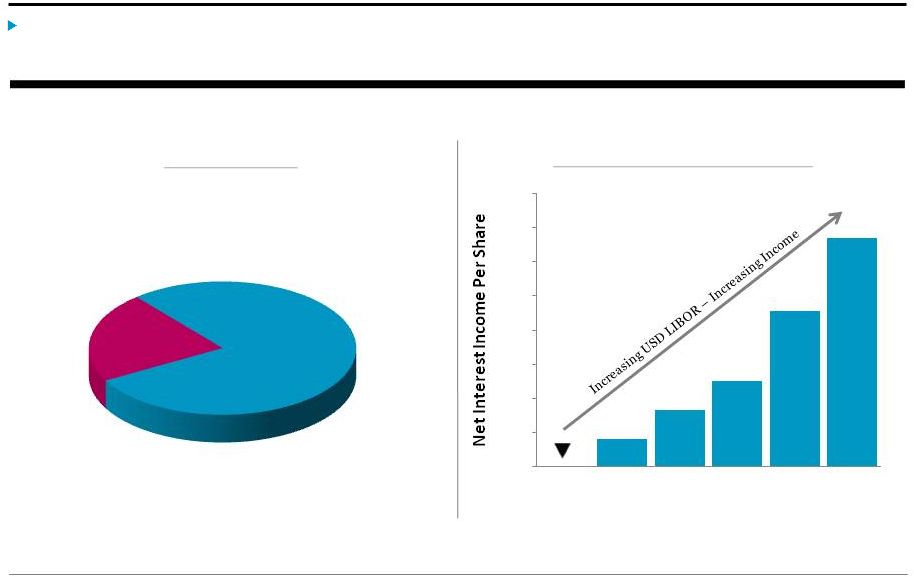 Interest Rates Core Earnings are positively correlated to changes in USD and GBP LIBOR, the benchmark indices for 76% of BXMT’s total loan exposure and related secured financings. (a) (a) Core Earnings are inversely correlated to EURIBOR and CDOR such that an increase of 50bps in either would decrease Core Earnings per
share by $0.01 per year. (b)
As of June 30, 2016, $146 million of floating rate loans earned interest based
on floors that were above the applicable index, with an average floor of 1.80%, based on loan principal balance. Portfolio Income Sensitivity to USD LIBOR (Annual Dollars of Net Interest Income Per Share) Portfolio Fixed vs. Floating (% of Principal Balance) Floating (b) Fixed Blackstone Mortgage Trust 7 78% 22% $0.00 $0.05 $0.10 $0.15 $0.20 $0.25 $0.30 $0.35 $0.40 0.47% 0.97% 1.47% 1.97% 2.47% 2.97% USD LIBOR |
 Appendix |
 Loan Portfolio Details
(Dollars in Millions)
Blackstone Mortgage Trust
9
Loan Type Origination Date (a) Total Loan (b) Principal Balance (b) Net Book Value Cash Coupon All-In Yield Maximum Maturity (c) Location Property Type Loan Per SQFT / Unit / Key Origination LTV (a) Loan 1 Senior loan (b) 8/6/2015 495 $ 495 $ 89 $ 4.48% 5.91% 10/29/2022 Diversified - EUR Other n/a 72% Loan 2 Senior loan 4/18/2016 457 457 452 L+4.20% L+4.48% 12/31/2019 Diversified - UK Hotel 123,636 / key 59% Loan 3 Senior loan (b) 5/15/2015 590 450 76 L+4.25% L+4.81% 5/15/2020 Miami Retail 565 / sqft 36% Loan 4 Senior loan 6/11/2015 336 336 337 4.90% (d) 4.94% (d) 4/30/2019 Diversified - US MHC 25,824 / unit 78% Loan 5 Senior loan (b) 6/30/2015 330 303 60 L+4.75% L+5.15% 7/9/2020 San Francisco Condo 902 / sqft 66% Loan 6 Senior loan 6/23/2015 302 302 303 5.30% (d) 5.46% (d) 8/31/2016 Diversified - US MHC 15,804 / unit 60% Loan 7 Senior loan 5/1/2015 320 295 293 L+3.45% L+3.83% 5/1/2020 New York Office 374 / sqft 68% Loan 8 Senior loan 1/7/2015 315 280 279 L+3.50% L+3.87% 1/9/2020 New York Office 240 / sqft 53% Loan 9 Senior loan 6/4/2015 267 267 270 5.53% (d) 5.48% (d) 2/17/2019 Diversified - CAN Hotel 34,957 / key 54% Loan 10 Senior loan 4/27/2016 208 208 206 L+4.35% L+4.88% 5/9/2021 Chicago Office 219 / sqft 72% Loan 11 Senior loan 6/23/2015 207 207 206 5.38% 5.44% 1/18/2017 Diversified - GER Retail 62 / sqft 53% Loan 12 Senior loan 6/23/2015 224 205 204 L+3.65% L+3.79% 10/1/2020 Washington DC Office 253 / sqft 72% Loan 13 Senior loan 6/11/2015 204 204 204 4.79% (d) 4.95% (d) 8/31/2016 Diversified - US MHC 18,947 / unit 65% Loan 14 Senior loan 7/31/2014 215 179 178 L+3.50% L+3.57% 8/9/2019 Chicago Office 238 / sqft 65% Loan 15 Senior loan 4/15/2016 200 173 172 L+4.25% L+4.86% 5/9/2021 New York Office 160 / sqft 47% Loan 16-116 Various Various 6,583 5,824 5,762 4.63% 5.03% (c) Various Various Various Various 63% Total/Wtd. Avg. 11,253 $ 10,185 $ 9,091 $ 4.66% 5.07% 3.2 years 62% (a) Date loan was originated or acquired by BXMT, and the LTV as of such date. (b) In certain instances, we finance our loans through the non-recourse sale of a senior loan interest that is not included in our
consolidated financial statements. As of June 30, 2016, four
loans in our portfolio have been financed with an aggregate $1.1 billion of non-consolidated senior interest, which are included in the table above.
(c)
Maximum maturity assumes all extension options are exercised, however floating
rate loans generally may be repaid prior to their final maturity without penalty. (d) Consists of both floating and fixed rates. Coupon and all-in yield assume applicable floating benchmark rates for
weighted-average calculation. |
 Consolidated Balance Sheets
(Dollars in Thousands, Except per Share Data)
Blackstone Mortgage Trust
10
June 30, 2016 December 31, 2015 Assets Cash and cash equivalents 181,796 $
96,450 $
Restricted cash
476 9,556 Loans receivable, net 9,090,934 9,077,007 Equity investments in unconsolidated subsidiaries 2,806 9,441 Other assets 212,449 184,119 Total assets 9,488,461 $
9,376,573 $
Liabilities and equity
Secured debt agreements
6,198,093 $
6,116,105 $
Loan participations sold
422,585 497,032 Convertible notes, net 165,373 164,026 Other liabilities 193,316 93,679 Total liabilities 6,979,367 6,870,842 Commitments and contingencies — — Equity Class A common stock, $0.01 par value 939 937 Additional paid-in capital 3,079,903 3,070,200 Accumulated other comprehensive loss (42,143) (32,758) Accumulated deficit (542,282) (545,791) Total Blackstone Mortgage Trust, Inc. stockholders’ equity 2,496,417 2,492,588 Non-controlling interests 12,677 13,143 Total equity 2,509,094 2,505,731 Total liabilities and equity 9,488,461 $
9,376,573 $ |
 Consolidated Statements of Operations
(Dollars in Thousands, Except per Share Data)
Blackstone Mortgage Trust
11
Three Months Ended June 30,
Six Months Ended June 30,
2016 2015 2016 2015 Income from loans and other investments Interest and related income 130,471 $ 80,481 $ 253,496 $ 143,889 $ Less: Interest and related expenses 49,065 30,634 94,446 54,796 Income from loans and other investments, net 81,406 49,847 159,050 89,093 Other expenses Management and incentive fees 15,847 8,051 29,460 14,721 General and administrative expenses 6,781 15,698 13,576 23,359 Total other expenses 22,628 23,749 43,036 38,080 Gain on investments at fair value 10,524 4,714 10,589 22,190 (Loss) income from equity investments in unconsolidated subsidiaries (6) 1,710 133 5,659 Income before income taxes 69,296 32,522 126,736 78,862 Income tax (benefit) provision (154) 105 87 350 Net income 69,450 $ 32,417 $ 126,649 $ 78,512 $ Net income attributable to non-controlling interests (6,369) (3,133) (6,521) (13,833) Net income attributable to Blackstone Mortgage Trust, Inc. 63,081 $ 29,284 $ 120,128 $ 64,679 $ Per share information (basic and diluted) Weighted-average shares of common stock outstanding 94,064,423 80,940,535 94,066,096 69,820,061 Net income per share of common stock 0.67 $
0.36 $
1.28 $
0.93 $ |
 Per Share Calculations
(Amounts in Thousands, Except per Share Data)
Core Earnings
Reconciliation
Book Value
per Share
Earnings
per Share
(a) Represents net income attributable to Blackstone Mortgage Trust. (b) Adjustment in respect of the deferral in Core Earnings of the accretion of a total $9.1 million of purchase discount attributable to a
certain pool of GE portfolio loans pending the repayment of those
loans. Three Months Ended
June 30, 2016 March 31, 2016 Net income (a) 63,081 $
57,047 $
Weighted-average shares outstanding, basic and
diluted 94,064
94,068 Earnings per share, basic and diluted
0.67 $
0.61
$
Blackstone Mortgage Trust 12 Three Months Ended June 30, 2016 March 31, 2016 Net income (a) 63,081 $
57,047 $
CT Legacy Portfolio net (income) loss
(3,825) 183 Non-cash compensation expense 4,836 4,687 GE purchase discount accretion adjustment (b) (1,247) (1,166) Other items 278 418 Core Earnings 63,123 $
61,169 $
Weighted-average shares outstanding, basic and
diluted 94,064
94,068 Core Earnings per share, basic and diluted 0.67 $
0.65
$
June 30, 2016 March 31, 2016 Stockholders’ equity 2,496,417 $
2,495,417 $
Shares Class A common stock 93,913 93,912 Deferred stock units 155 149 Total outstanding 94,068 94,061 Book value per share 26.54 $
26.53
$
|
 Reconciliation of Net Income to Core Earnings
(a) and G&A Expenses Included in Core Earnings (a) Beginning in the third quarter of 2015, Core Earnings is net of incentive fee expenses. Prior period Core Earnings have also been
presented above net of incentive fees to allow for
comparability. (b)
Represents net income attributable to Blackstone Mortgage Trust.
(c) Adjustment in respect of the deferral in Core Earnings of the accretion of a total $9.1 million of purchase discount attributable to a
certain pool of GE portfolio loans pending the repayment of those
loans. (d)
Includes expenses related to the GE portfolio acquisition of $9.0 million,
$370,000, and $40,000 in 2Q 2015, 3Q 2015, and 4Q 2015, respectively.
(Amounts in Thousands, Except per Share Data)
Net Income
Reconciliation
G&A
Reconciliation
Three Months Ended
June 30, 2015 September 30, 2015 December 31, 2015 March 31, 2016 June 30, 2016 Net income (b) 29,284 $
66,888 $
65,264 $
57,047 $
63,081 $
CT Legacy Portfolio net (income) loss
(1,857) (401) (3,408) 183 (3,825) Non-cash compensation expense
3,396 3,188 3,460 4,687 4,836 GE purchase discount accretion adjustment
(c) (459) (2,008) (1,542) (1,166) (1,247) Other items 416 (119) 310 418 278 Core Earnings
30,780 $
67,548 $
64,084 $
61,169 $
63,123 $
Weighted-average shares outstanding, basic and diluted
80,941 93,358 93,574 94,068 94,064 Net income per share, basic and diluted
0.36 $
0.72 $
0.70 $
0.61 $
0.67 $
Core Earnings per share, basic and diluted
0.38 $
0.72 $
0.68 $
0.65 $
0.67 $
Blackstone Mortgage Trust
13
Three Months Ended
(d) June 30, 2015 September 30, 2015 December 31, 2015 March 31, 2016 June 30, 2016 General and administrative expenses (GAAP) 15,698 $
5,295 $
8,053 $
6,795 $
6,781 $
CT Legacy Portfolio expenses
(1,957) (167) (2,849) (349) (668) Non-cash compensation expense (3,396) (3,188) (3,460) (4,687) (4,836) General and administrative expenses (Core Earnings) 10,345 $
1,940 $
1,744 $
1,759 $
1,277 $ |
 Definitions Core Earnings: Blackstone Mortgage Trust, Inc. (“BXMT”) discloses Core Earnings, a financial measure that is calculated and presented on the basis of methodologies other than in accordance with generally accepted accounting principles in the United States of America (“GAAP”) in this presentation. Core Earnings is an adjusted measure that helps BXMT evaluate its performance excluding the effects of certain transactions and GAAP adjustments that it believes are not necessarily indicative of its current loan origination portfolio and operations. Although according to its management agreement BXMT calculates the incentive and base management fees due to its Manager using Core Earnings before incentive fees expense, beginning with the third quarter of 2015, BXMT will report Core Earnings after incentive fees expense, as BXMT believes this is a more meaningful presentation of the economic performance of its class A common stock. Core Earnings is defined as GAAP net income (loss), including realized gains and losses not otherwise included in GAAP net income (loss), and excluding (i) net income (loss) attributable to the CT Legacy Portfolio, (ii) non-cash equity compensation expense, (iii) depreciation and amortization, (iv) unrealized gains (losses), and (v) certain non-cash items. Core Earnings may also be adjusted from time to time to exclude one-time events pursuant to changes in GAAP and certain other non-cash charges as determined by BXMT’s manager, subject to approval by a majority of its independent directors. Core Earnings does not represent net income or cash generated from operating activities and should not be considered as an alternative to GAAP net income, or an indication of BXMT’s GAAP cash flows from operations, a measure of BXMT’s liquidity, or an indication of funds available for its cash needs. In addition, BXMT’s methodology for calculating Core Earnings may differ from the methodologies employed by other companies to calculate the same or similar supplemental performance measures, and accordingly, its reported Core Earnings may not be comparable to the Core Earnings reported by other companies. Weighted average gross return on investment (“Gross ROI”): Investment return based on each asset’s all-in yield, assuming no early repayments or defaults and the all-in cost of related asset-level secured debt, assuming maximum available leverage in place or in negotiation for each investment, notwithstanding the amount actually borrowed. Gross ROI excludes the impact of un-deployed capital and liquidity, the impact of the corporate-level revolving credit agreement and convertible notes, and management fees and other corporate-level expenses. Gross ROI is presented solely for informational purposes and is not representative of net income recognized in prior or future periods. Blackstone Mortgage Trust 14 |
 Forward-Looking Statements
This presentation may contain forward-looking statements within the meaning of Section 27A of the Securities Act of 1933, as amended, and Section 21E of the Securities Exchange Act of 1934, as amended, which reflect Blackstone Mortgage Trust’s (“BXMT”) current views with respect to, among other things, BXMT’s operations and financial performance, including performance of the loan portfolio acquired from GE Capital. You can identify these forward-looking statements by the use of words such as “outlook,” “indicator,” “believes,” “expects,” “potential,” “continues,” “may,” “will,” “should,” “seeks,” “approximately,” “predicts,” “intends,” “plans,” “estimates,” “anticipates” or the negative version of these words or other comparable words. Such forward-looking statements are subject to various risks and uncertainties. Accordingly, there are or will be important factors that could cause actual outcomes or results to differ materially from those indicated in these statements. BXMT believes these factors include but are not limited to those described under the section entitled “Risk Factors” in its Annual Report on Form 10-K for the fiscal year ended December 31, 2015 and Quarterly Report on Form 10-Q for the fiscal quarter ended June 30, 2016, as such factors may be updated from time to time in its periodic filings with the Securities and Exchange Commission (“SEC”) which are accessible on the SEC’s website at www.sec.gov. These factors should not be construed as exhaustive and should be read in conjunction with the other cautionary statements that are included in this presentation and in the filings. BXMT assumes no obligation to update or supplement forward-looking statements that become untrue because of subsequent events or circumstances. Blackstone Mortgage Trust 15 |