Attached files
| file | filename |
|---|---|
| EX-99.1 - PRESS RELEASE - Simulations Plus, Inc. | simulations_8k-ex9901.htm |
| 8-K - CURRENT REPORT - Simulations Plus, Inc. | simulations_8k.htm |
Exhibit 99.2

( NASDAQ:SLP ) LD Micro Investor Conference June 7, 2016 Walt Woltosz, Chairman and CEO
2 With the exception of historical information, the matters discussed in this presentation are forward - looking statements that involve a number of risks and uncertainties . The actual results of the Company could differ significantly from those statements . Factors that could cause or contribute to such differences include, but are not limited to : continuing demand for the Company’s products, competitive factors, the Company’s ability to finance future growth, the Company’s ability to produce and market new products in a timely fashion, the Company’s ability to continue to attract and retain skilled personnel, and the Company’s ability to sustain or improve current levels of productivity . Further information on the Company’s risk factors is contained in the Company’s quarterly and annual reports and filed with the Securities and Exchange Commission . Safe Harbor Statement

3 Overview of Products and Services N H O OH O CH 3 CH 3 CH 3 ADMET Predictor™ GastroPlus ™ MedChem Studio™ MedChem Designer™ DDDPlus ™ MembranePlus™ Consulting Services and Collaborations Discovery Preclinical C linical COMING SOON: PKPlus™ KIWI™

4 • Software renewal rates: 85% (accounts); 91%(fees) • 20 new software client sites added • Product development • Announced development of PKPlus ™ • Working on Version 9.5 of GastroPlus ™ • Working on version 8.0 of ADMET Predictor ™ • Finalized version 5.0 of DDDPlus ™ • Consulting services continued to grow during 2QFY16 • 3QFY16 consulting services decreased • 3 rd quarter announcement of $4.7MM/5 - year contract 2 QFY16 Highlights
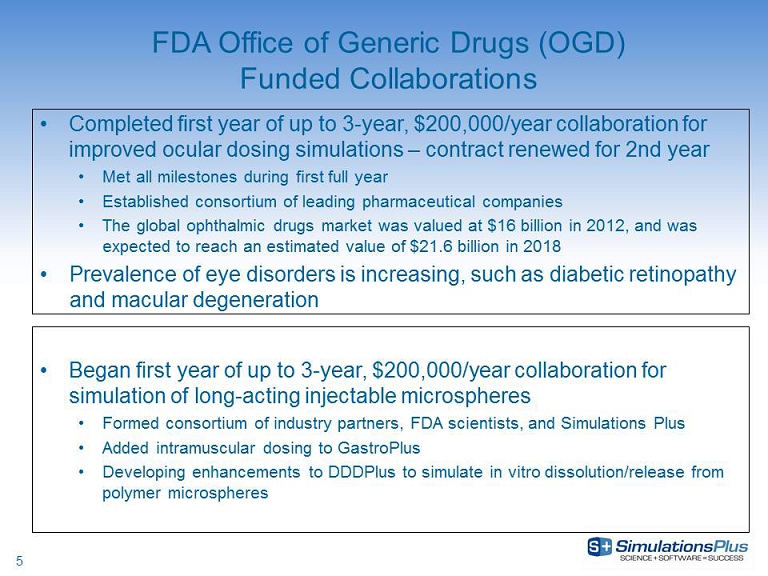
5 • Completed first year of up to 3 - year, $200,000/year collaboration for improved ocular dosing simulations – contract renewed for 2nd year • Met all milestones during first full year • Established consortium of leading pharmaceutical companies • The global ophthalmic drugs market was valued at $16 billion in 2012, and was expected to reach an estimated value of $21.6 billion in 2018 • Prevalence of eye disorders is increasing, such as diabetic retinopathy and macular degeneration FDA Office of Generic Drugs (OGD) Funded Collaborations • Began first year of up to 3 - year, $200,000/year collaboration for simulation of long - acting injectable microspheres • Formed consortium of industry partners, FDA scientists, and Simulations Plus • Added intramuscular dosing to GastroPlus • Developing enhancements to DDDPlus to simulate in vitro dissolution/release from polymer microspheres

6 • 2 - year, $250,000/year proposal submitted May 16 in response to RFA • Population physiologically based pharmacokinetics (PopPBPK) • Combines expertise of Lancaster and Buffalo divisions • Calls for clinical trial data analysis tool combining statistical methods with detailed PBPK modeling • Up to two contracts to be awarded FDA Office of Generic Drugs (OGD) New Proposals • 2 - year, $250,000/year proposal submitted June 3 in response to RFA • Calls for extending current PBPK software tools to deal with supersaturation/precipitation in the gastrointestinal tract • Requires implementation of classical nucleation theory (GastroPlus already has) • If awarded, will extend GastroPlus capabilities for simulating supersaturating drug delivery systems (SDDS) • Up to two contracts to be awarded

7 • AEROModeler™ • Application of our artificial neural network ensemble (ANNE) technology to: • Predict aerodynamic force coefficients for missiles • Classify missiles from radar tracking data • Discriminate between warheads and decoys from sensor data • Exploring several government and industry contacts with interest expressed at each meeting to date • Put on temporary hold to allow development team to focus on PKPlus • MRIModeler™ • Application of our ANNE technology to analysis of magnetic resonance imaging (MRI) data to classify patients as healthy or likely to experience various disease states • Put on temporary hold to allow development team to focus on PKPlus Exploring Business Opportunities Outside of Pharmaceutical Industry

8 • Major provider of software and consulting services for pharma R&D • Earliest drug discovery – when a chemist first draws a molecule • Preclinical development (lab and animals) through first - in - human trials • Phase 2 and 3 clinical trials • Beyond patent life to supporting generic companies • Enhancing every existing software product • Finalizing PKPlus – exciting new product • Developing new applications in aerospace and general healthcare based on our machine - learning technologies (on temporary hold) • 2 QFY16 revenues were up by $590,000 (12.9%) to $5.16 million • 2QFY16 net income was up by $175,000 (18.0%) to $1.15 million • 2QFY16 diluted EPS up 16.9% to $ 0.066 (7¢) per share compared to $0.057 (6¢) in 2QFY15. • 6moFY16 revenues were up by $1.34 Million(15.5%) to $10.0 Million • 6mo FY16 net income was up by $ 753,000 ( 50.2%) to $2.25 million • 6moFY16 diluted EPS up 49.0% to $ 0.131 (13¢) per share compared to $ 0.088 (9¢) in 2QFY15. Overview

9 • Continued Growth • Eight - year - plus profitable trend • Successful strategic acquisition • Customer base increased: • 20 new software customers in 2QFY16 • 91 percent renewal rate (fees) • Expecting continued compounded growth • 2nd Quarter earnings per share increased 17% • Strong cash position; returning cash to shareholders • Company has continued to pay dividend of $0.05 per quarter • Over $15 million in cash dividends distributed since 2012, yet cash remained at $8.8 million as of April 13, 2016 ($7.3 million as of May 31, 2016, after distributing approximately $851,000 in dividends on May 9, 2016, and paying $750,000 to TSRL in April) Summary
10 Financial Overview

11 Income Statement 2 QFY16 Compared to 2QFY15 (in millions) Lancaster Buffalo 2QFY16 2QFY15 Diff % chg Net sales $ 3.648 $ 1.516 $ 5.164 $ 4.574 $ 0.590 12.9% Gross profit 3.058 0.842 3.900 3.443 0.457 13.3% Gross profit margin 83.83% 55.54% 75.52% 75.27% 0.25% 0.3% SG&A 1.146 0.577 1.723 1.607 0.116 7.2% R&D 0.442 0.020 0.462 0.361 0.101 28.0% Total operating expenses 1.588 0.596 2.184 1.968 0.216 11.0% Income from operations 1.470 0.246 1.716 1.475 0.241 16.3% Other income (expense) ( 0.024) - (0.024) (0.030) 0.006 - 20.0% Income from operations before income taxes 1.446 0.246 1.692 1.445 0.247 17.1% Net income $ 0.994 $ 0.152 $ 1.146 $ 0.970 0.176 18.% Diluted earnings per share (in dollars) $ 0.066 $ 0.057 $ 0.010 16.9% EBITDA 1.841 0.336 2.177 1.966 0.211 10.7%

12 Income Statement 6moFY16 Compared to 6moFY15 (in millions) Lancaster Buffalo 2QFY16 2QFY15 Diff % chg Net sales $ 7.058 $ 2.944 $ 10.002 $ 8.660 $ 1.342 15.5% Gross profit 5.911 1.744 7.655 $ 6.485 1.17 18.0% Gross profit margin 83.75% 59.24% 76.53% 74.88% 1.65% 2.2% SG&A 2.245 1.154 3.399 $ 3.627 - 0.228 - 6.3% R&D 0.772 0.041 0.813 $ 0.633 0.18 28.4% Total operating expenses 3.017 1.195 4.212 $ 4.260 - 0.048 - 1.1% Income from operations 2.894 0.549 3.443 2.224 1.219 54.8% Other income (expense) ( 0.035) - (0.035) (0.033) - 0.002 6.1% Income from operations before income taxes 2.860 0.549 3.409 2.191 1.218 55.6% Net income $ 1.912 $ 0.339 $ 2.251 $ 1.499 0.752 50.2% Diluted earnings per share (in dollars) $ 0.131 $ 0.088 $ 0.043 49.0% EBITDA 3.649 0.731 4.38 2.804 1.576 56.2%

13 Consolidated Revenues, by Fiscal Quarter and YTD (pro forma prior to 2012; in millions) 4.01 4.57 5.94 3.71 4.84 5.16 5.96 $0 $1 $2 $3 $4 $5 $6 $7 Q1 Q2 Q3 Q4 2009 2010 2011 2012 2013 2014 2015 2016 Preliminary
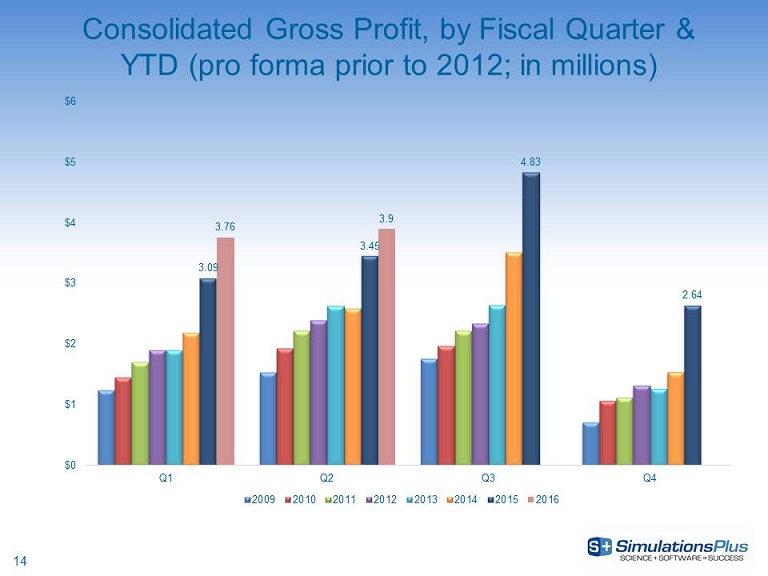
14 Consolidated Gross Profit, by Fiscal Quarter & YTD (pro forma prior to 2012; in millions) 3.09 3.45 4.83 2.64 3.76 3.9 $0 $1 $2 $3 $4 $5 $6 Q1 Q2 Q3 Q4 2009 2010 2011 2012 2013 2014 2015 2016

15 Consolidated Net Income, by Fiscal Quarter and YTD (pro forma prior to 2012; in millions) $0.53 $0.97 $1.85 $0.49 $1.11 $1.15 $- $0.50 $1.00 $1.50 $2.00 Q1 Q2 Q3 Q4 2009 2010 2011 2012 2013 2014 2015 2016
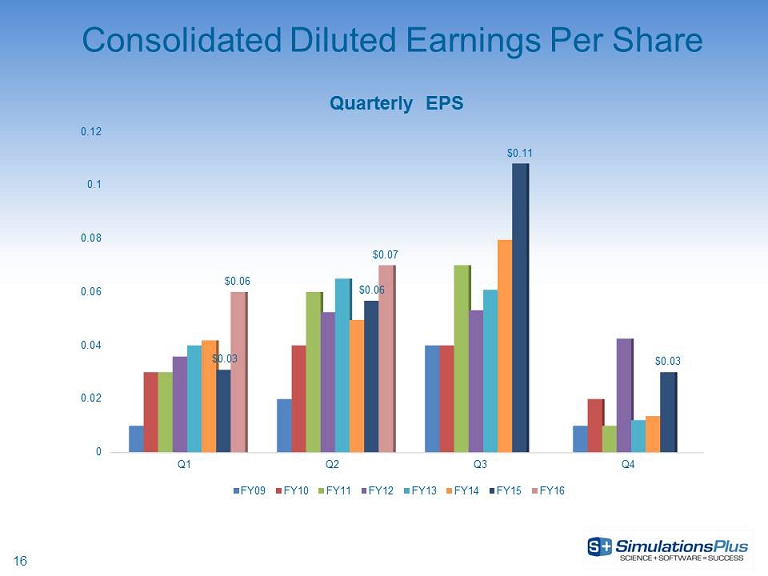
16 Consolidated Diluted Earnings Per Share 0 0.02 0.04 0.06 0.08 0.1 0.12 Q1 Q2 Q3 Q4 $0.03 $0.06 $0.11 $0.03 $0.06 $0.07 Quarterly EPS FY09 FY10 FY11 FY12 FY13 FY14 FY15 FY16
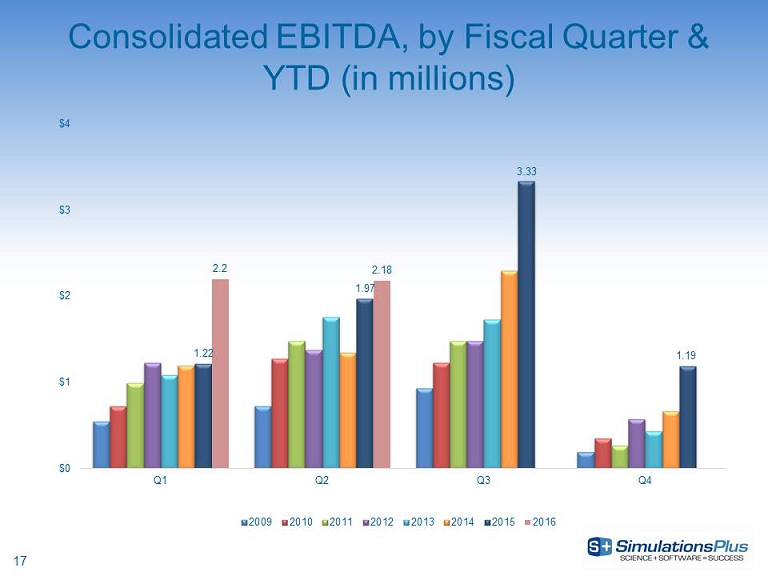
17 Consolidated EBITDA, by Fiscal Quarter & YTD (in millions) 1.22 1.97 3.33 1.19 2.2 2.18 $0 $1 $2 $3 $4 Q1 Q2 Q3 Q4 2009 2010 2011 2012 2013 2014 2015 2016

18 Returning Cash to Shareholders (in millions) 1.6 0.8 0.8 2.2 0 0.5 0.5 0.6 0.81 0.81 0.81 0.84 0.84 0.84 0.85 0.85 0.85 0.85 13.2 12.9 12.7 11.4 9.3 9.8 10 10.1 10.6 11 7.8 8.6 5.8 6.1 6.4 8.6 7.2 7.1 7.3 $0 $1 $1 $2 $2 $3 $0 $2 $4 $6 $8 $10 $12 $14 12.1 12.2 12.3 12.4 13.1 13.2 13.3 13.4 14.1 14.2 14.3 14.4 15.1 15.2 15.3 15.4 16.1 16.2 16.3 Dividend Paid Cash on Hand Cash paid $2.5M TSRL Cash paid $2.1M for Cognigen

19 Selected Balance Sheet Items (in millions, except where indicated) February 29, 2016 August 31, 2015 Cash and cash equivalents $ 7.155* $ 8.551 Cash per share ( in Dollars ) $ 0.42 $ 0.50 Total current assets 12.514 11.533 Total assets 27.903 27.344 Total current liabilities 3.537 3.613 Total liabilities 7.591 7.812 Current ratio 3.54x 3.19x Shareholders’ equity 20.311 19.532 Total liabilities and shareholders’ equity 27.903 27.344 Shareholders’ equity per diluted share( in Dollars ) $1.18 $1.15 * Cash as of May 31, 2016 was ~$7.3 million

20 • Version 9.5 scheduled for Q4FY16 ‒ Intramuscular dosing model – optional add - on model ‒ Antibody - drug conjugate (ADC) models for biologics • Version 8.0 scheduled for Q4FY16 ‒ Major redesign and rewrite ‒ Significant refresh of the graphical user interface ‒ New ‘MedChem Studio™’ module – optional add - on incorporating items from MedChem Studio • Version 4 .0 still licensed by clients ‒ Many features merged into ADMET Predictor 8.0 as optional add - on to consolidate under one GUI Software Product News • Version 5.0 released in April 2016 ‒ Integration of models from ADMET Predictor™ – optional add - on ‒ New dosage form options for immediate & controlled release formulations • Version 1.5 scheduled for 2016 ‒ Ability to model multiple compounds to optimize in vitro drug - drug interaction parameters • New product: v ersion 1.0 release expected Q4FY16 ‒ Validated software for noncompartmental (NCA) & compartmental PK modeling ‒ Reports in user - customized formats for regulatory submission ‒ Large potential market

21 2 QFY16 Sales Review • Highlights: – Software revenue +15% – C onsulting +9% – 85% renewal rate (accounts) – 91% renewal rate (fees) – 16% increase in license units – 12 new commercial clients – 8 new nonprofit groups 54% 14% 32% 0% Consolidated Sales Breakdown Renewal New Consulting Training 0 50 100 150 200 250 1st Quarter 2nd Quarter 3rd Quarter 4th Quarter Software License Units – per Quarter FY13 FY14 FY15 FY16

22 6moFY16 Sales Review • Highlights: – Software revenue +14% – C onsulting +20% – 87% renewal rate (accounts) – 92% renewal rate (fees) – 25% increase in license units – 20 new commercial clients – 19 new nonprofit groups – Significant expansion of licenses at US and China FDA 53% 13% 33% 1% Consolidated Sales Breakdown Renewal New Consulting Training 0 50 100 150 200 250 1st Quarter 2nd Quarter 3rd Quarter 4th Quarter Software License Units – per Quarter FY13 FY14 FY15 FY16
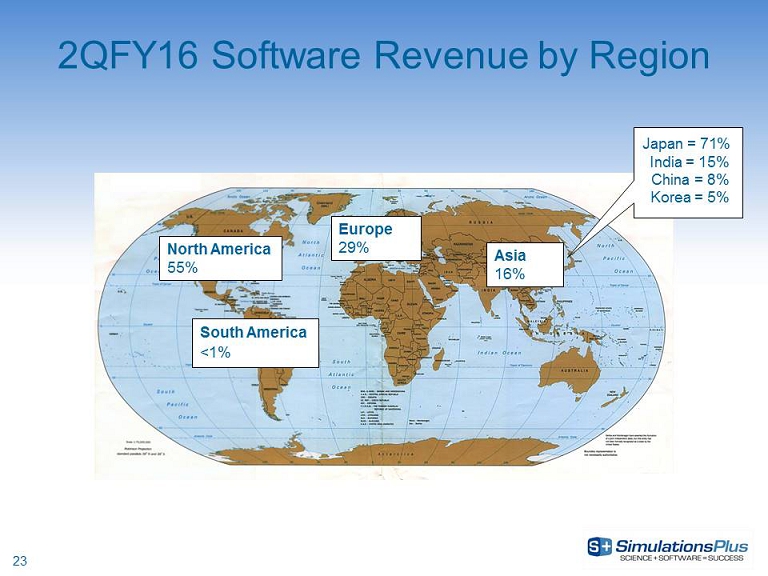
23 2 QFY16 Software Revenue by Region Europe 29% North America 55% Asia 16% South America <1% Japan = 71% India = 15% China = 8 % Korea = 5%

24 Marketing Activities – 2QFY16 • Website redesign – Kicked off website redesign project in February; live launch in July • Conferences and scientific meetings – 4 scientific meetings attended; co - authors on 2 presentations • Trainings and workshops – Hosted first GastroPlus workshop in India – overflow crowd – W orkshops scheduled for US, Europe, China, Korea, and Japan in calendar 2016 • Strategic digital marketing initiatives – Hosted 3 webinars on our software updates and applications – Active updates: LinkedIn, Twitter, YouTube, and Facebook accounts – Continued web - based advertising for all programs – 28 peer - reviewed publications citing use of software

25 Consulting Services • Strategic and synergistic benefits of the Buffalo (Cognigen) acquisition are being realized • Strong collaborations between Buffalo and Lancaster scientists have identified new and innovative ways of using modeling and simulation to bring value to our clients • Consulting projects help shape management and regulatory decision - making process • Successful projects help drive additional consulting and software sales

26 Status Report - Consulting • In FY2016 working with 22 companies on 43 drugs, 72 projects of which 2 projects started FY16Q2 • Expanded scope of projects with 5 companies • 32 outstanding proposals • Worked with 7 new companies over the past year; continuing to build relationships • Most common therapeutic area is oncology, followed by neurology and immunology – ~25% of projects result directly in regulatory interaction. • First - time presentation of ADMET Predictor™ at clinical pharmacology meeting opened up conversations with new community of users.

27 KIWI™ – A Software Platform for Accessing Simulations Plus’ Validated Cloud Processing Capabilities

28 • Signed a $4.7 million contract with a major foundation to implement a KIWI platform for global teams engaged in model - based drug development; 5 - year term contingent on satisfactory completion of milestones • KIWI will become an integral driver of the foundation’s efforts to accelerate the eradication of underserved diseases • Provides much - needed support in terms of computer processing power and organizational and communication tools for complex modeling and simulation projects • The goal is to reduce the risks and cost of drug development and speed the delivery of new life - saving medicines KIWI Update

29 • 2QFY16 revenues were up by 12.9% • 2QFY16 net income was up by 18.0% • Diluted EPS for 2QFY16 up 16.9% to $0.07 from $0.06 in 2QFY15 • 3QFY16 preliminary revenues set new record against tough odds • 6moFY16 revenues were up by 15.5% • 6moFY16 net income was up by 50.0% • Diluted EPS for 6moFY16 up 49.0% to $0.13 from $0.09 in 6moFY15 • 9moFY16 preliminary revenues $15.97MM, up from $14.60MM • California and Buffalo divisions working well together • Software sales continue strong growth trend • Two FDA contracts ($200,000/ yr X 3 years each) in progress • Two proposals submitted to FDA ($250,000/ yr X 2 years each) • $4.7 MM/5 yr consulting contract with foundation largest in company history Summary