Attached files
| file | filename |
|---|---|
| 8-K - 8-K - McEwen Mining Inc. | a16-12579_18k.htm |
Exhibit 99.1
Christina McCarthy, Director, Corporate Development, 1.866.441.0690 • cd@mcewenmining.com ASSET RICH LEVERAGE TO GOLD, SILVER & COPPER DEBT FREE Presentation to Share Owners AGM May 31, 2016
Cautionary Statement 2 This presentation contains certain forward-looking statements and information, including "forward-looking statements" within the meaning of the Private Securities Litigation Reform Act of 1995. The forward-looking statements and information expressed, as at the date of this presentation, McEwen Mining Inc.'s (the "Company") estimates, forecasts, projections, expectations or beliefs as to future events and results. Forward-looking statements and information are necessarily based upon a number of estimates and assumptions that, while considered reasonable by management, are inherently subject to significant business, economic and competitive uncertainties, risks and contingencies, and there can be no assurance that such statements and information will prove to be accurate. Therefore, actual results and future events could differ materially from those anticipated in such statements and information. Risks and uncertainties that could cause results or future events to differ materially from current expectations expressed or implied by the forward-looking statements and information include, but are not limited to, factors associated with fluctuations in the market price of precious metals, mining industry risks, political, economic, social and security risks associated with foreign operations, the ability of the corporation to receive or receive in a timely manner permits or other approvals required in connection with operations, risks associated with the construction of mining operations and commencement of production and the projected costs thereof, risks related to litigation, the state of the capital markets, environmental risks and hazards, uncertainty as to calculation of mineral resources and reserves, risk of delisting from a public exchange, and other risks. The Company's dividend policy will be reviewed periodically by the Board of Directors and is subject to change based on certain factors such as the capital needs of the Company and its future operating results. Readers should not place undue reliance on forward-looking statements or information included herein, which speak only as of the date hereof. The Company undertakes no obligation to reissue or update forward-looking statements or information as a result of new information or events after the date hereof except as may be required by law. See McEwen Mining's Annual Report on Form 10-K for the fiscal year ended December 31, 2015 and Quarterly Report on Form 10-Q for the quarter ended March 31, 2016, and other filings with the Securities and Exchange Commission, under the caption "Risk Factors", for additional information on risks, uncertainties and other factors relating to the forward-looking statements and information regarding the Company. All forward-looking statements and information made in this presentation are qualified by this cautionary statement. All currency information quoted in U.S. dollars. To see end notes, technical disclosure and cautionary guidance, and cautionary note regarding NON-GAAP measures, go to www.mcewenmining.com/files/presentation_disclosure.pdf
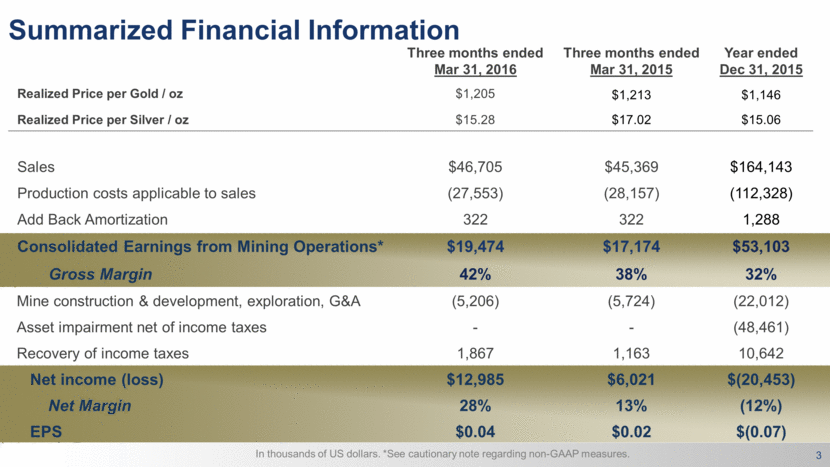
Summarized Financial Information Three months ended Mar 31, 2016 Three months ended Mar 31, 2015 Year ended Dec 31, 2015 Realized Price per Gold / oz $1,205 $1,213 $1,146 Realized Price per Silver / oz $15.28 $17.02 $15.06 Sales $46,705 $45,369 $164,143 Production costs applicable to sales (27,553) (28,157) (112,328) Add Back Amortization 322 322 1,288 Consolidated Earnings from Mining Operations* $19,474 $17,174 $53,103 Gross Margin 42% 38% 32% Mine construction & development, exploration, G&A (5,206) (5,724) (22,012) Asset impairment net of income taxes - - (48,461) Recovery of income taxes 1,867 1,163 10,642 Net income (loss) $12,985 $6,021 $(20,453) Net Margin 28% 13% (12%) EPS $0.04 $0.02 $(0.07) In thousands of US dollars. *See cautionary note regarding non-GAAP measures. 3
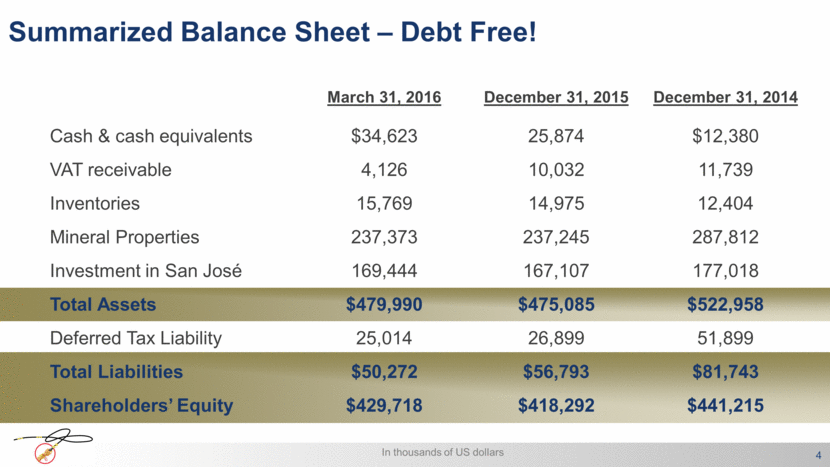
Summarized Balance Sheet – Debt Free! March 31, 2016 December 31, 2015 December 31, 2014 Cash & cash equivalents $34,623 25,874 $12,380 VAT receivable 4,126 10,032 11,739 Inventories 15,769 14,975 12,404 Mineral Properties 237,373 237,245 287,812 Investment in San José 169,444 167,107 177,018 Total Assets $479,990 $475,085 $522,958 Deferred Tax Liability 25,014 26,899 51,899 Total Liabilities $50,272 $56,793 $81,743 Shareholders’ Equity $429,718 $418,292 $441,215 In thousands of US dollars 4
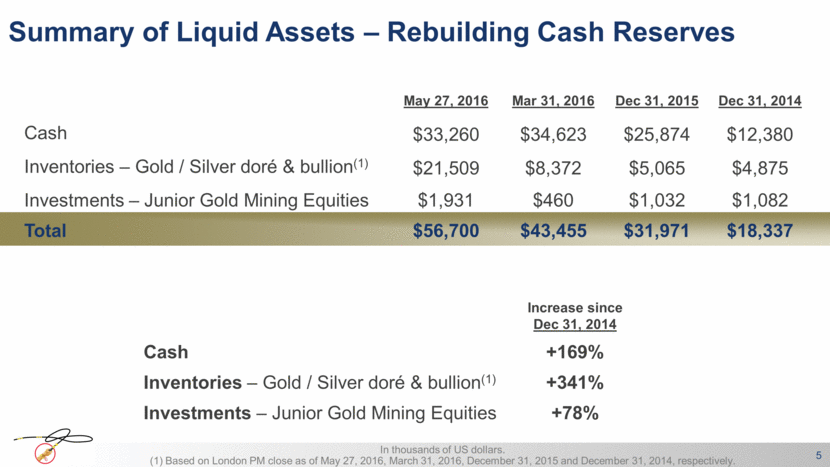
Summary of Liquid Assets – Rebuilding Cash Reserves May 27, 2016 Mar 31, 2016 Dec 31, 2015 Dec 31, 2014 Cash $33,260 $34,623 $25,874 $12,380 Inventories – Gold / Silver doré & bullion(1) $21,509 $8,372 $5,065 $4,875 Investments – Junior Gold Mining Equities $1,931 $460 $1,032 $1,082 Total $56,700 $43,455 $31,971 $18,337 In thousands of US dollars. (1) Based on London PM close as of May 27, 2016, March 31, 2016, December 31, 2015 and December 31, 2014, respectively. 5 Increase since Dec 31, 2014 Cash +169% Inventories – Gold / Silver doré & bullion(1) +341% Investments – Junior Gold Mining Equities +78%
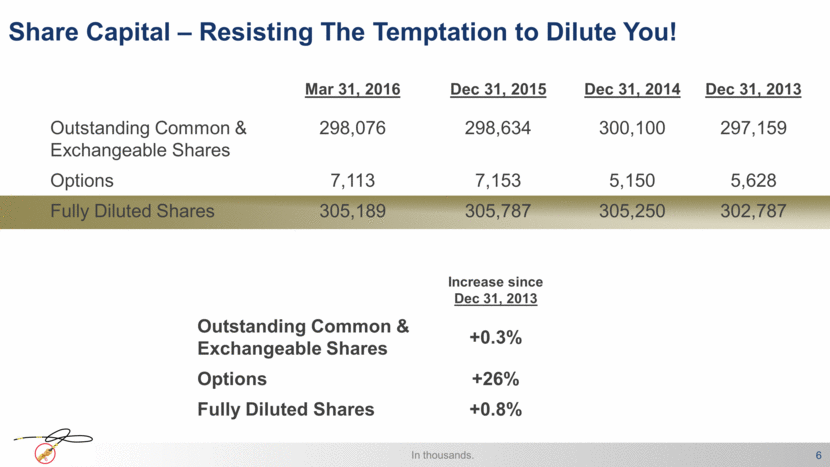
Mar 31, 2016 Dec 31, 2015 Dec 31, 2014 Dec 31, 2013 Outstanding Common & Exchangeable Shares 298,076 298,634 300,100 297,159 Options 7,113 7,153 5,150 5,628 Fully Diluted Shares 305,189 305,787 305,250 302,787 Share Capital – Resisting The Temptation to Dilute You! In thousands. 6 Increase since Dec 31, 2013 Outstanding Common & Exchangeable Shares +0.3% Options +26% Fully Diluted Shares +0.8%
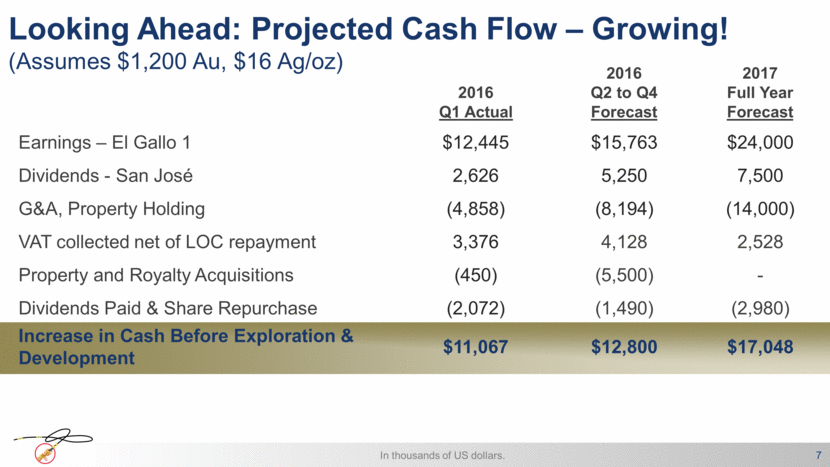
Looking Ahead: Projected Cash Flow – Growing! (Assumes $1,200 Au, $16 Ag/oz) 2016 Q1 Actual 2016 Q2 to Q4 Forecast 2017 Full Year Forecast Earnings – El Gallo 1 $12,445 $15,763 $24,000 Dividends - San José 2,626 5,250 7,500 G&A, Property Holding (4,858) (8,194) (14,000) VAT collected net of LOC repayment 3,376 4,128 2,528 Property and Royalty Acquisitions (450) (5,500) - Dividends Paid & Share Repurchase (2,072) (1,490) (2,980) Increase in Cash Before Exploration & Development $11,067 $12,800 $17,048 In thousands of US dollars. 7
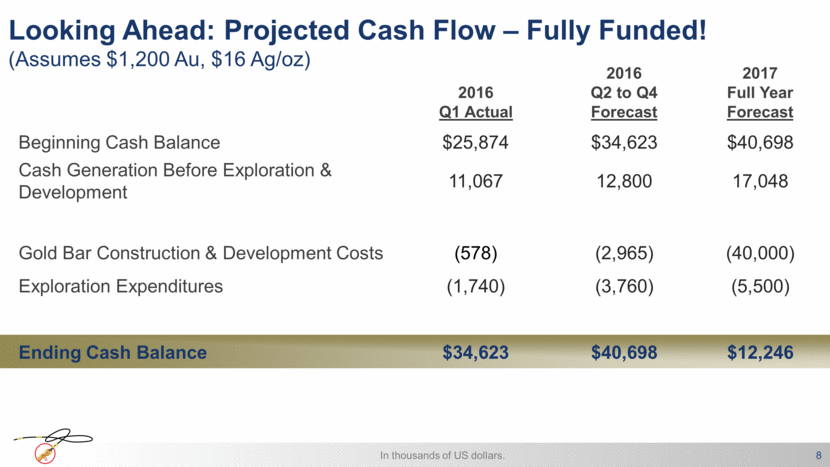
Looking Ahead: Projected Cash Flow – Fully Funded! (Assumes $1,200 Au, $16 Ag/oz) 2016 Q1 Actual 2016 Q2 to Q4 Forecast 2017 Full Year Forecast Beginning Cash Balance $25,874 $34,623 $40,698 Cash Generation Before Exploration & Development 11,067 12,800 17,048 Gold Bar Construction & Development Costs (578) (2,965) (40,000) Exploration Expenditures (1,740) (3,760) (5,500) Ending Cash Balance $34,623 $40,698 $12,246 In thousands of US dollars. 8
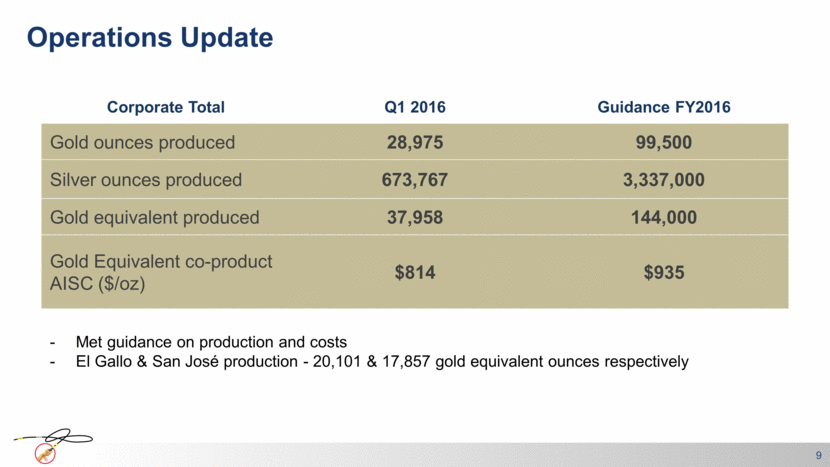
Operations Update Corporate Total Q1 2016 Guidance FY2016 Gold ounces produced 28,975 99,500 Silver ounces produced 673,767 3,337,000 Gold equivalent produced 37,958 144,000 Gold Equivalent co-product AISC ($/oz) $814 $935 9 Met guidance on production and costs El Gallo & San José production - 20,101 & 17,857 gold equivalent ounces respectively
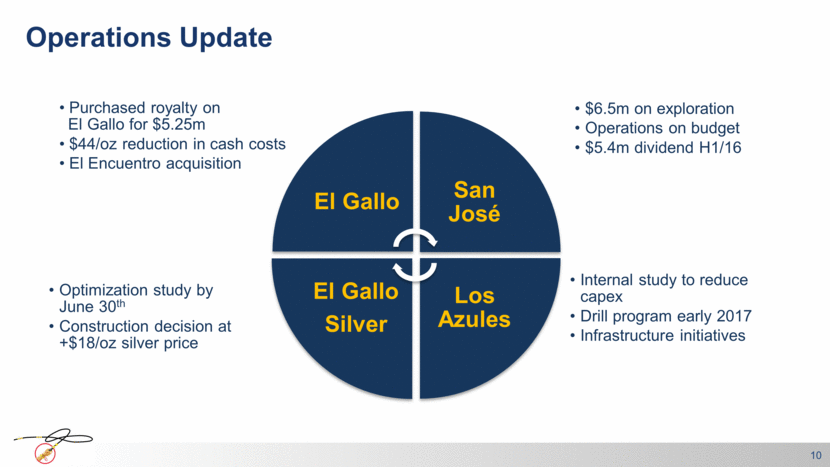
Operations Update 10 Internal study to reduce capex Drill program early 2017 Infrastructure initiatives Optimization study by June 30th Construction decision at +$18/oz silver price $6.5m on exploration Operations on budget $5.4m dividend H1/16 Purchased royalty on El Gallo for $5.25m $44/oz reduction in cash costs El Encuentro acquisition El Gallo San José Los Azules El Gallo Silver
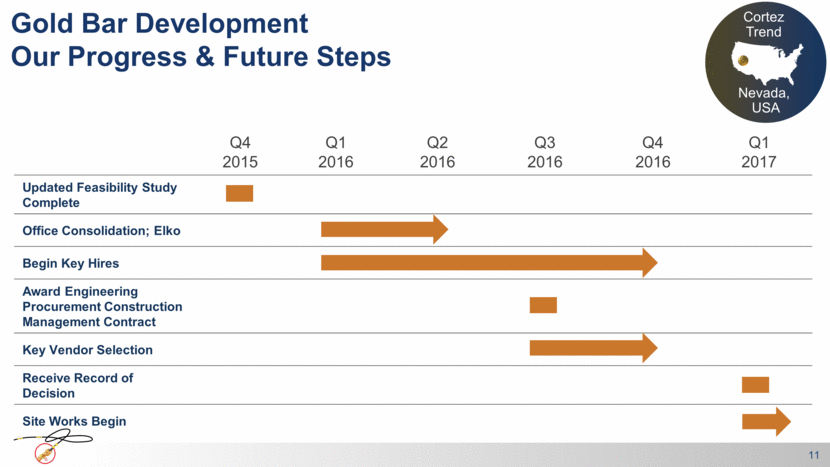
Q4 2015 Q1 2016 Q2 2016 Q3 2016 Q4 2016 Q1 2017 Updated Feasibility Study Complete Office Consolidation; Elko Begin Key Hires Award Engineering Procurement Construction Management Contract Key Vendor Selection Receive Record of Decision Site Works Begin Gold Bar Development Our Progress & Future Steps 11 Cortez Trend Nevada, USA
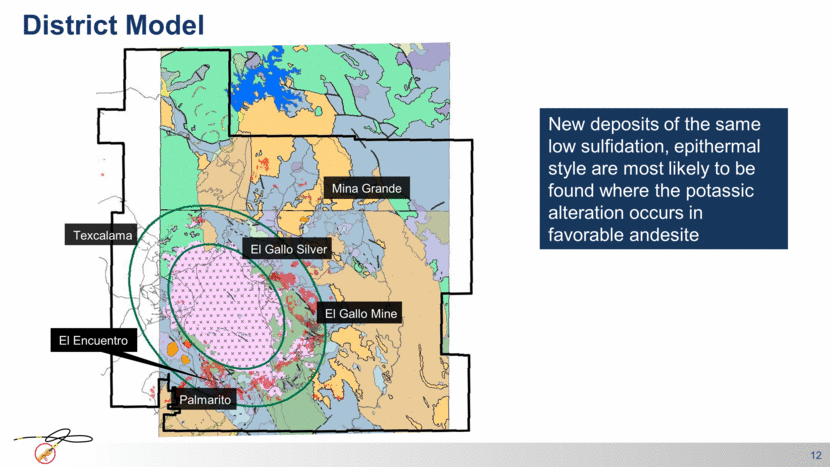
12 New deposits of the same low sulfidation, epithermal style are most likely to be found where the potassic alteration occurs in favorable andesite Mina Grande El Gallo Silver Palmarito El Gallo Mine District Model El Encuentro Texcalama
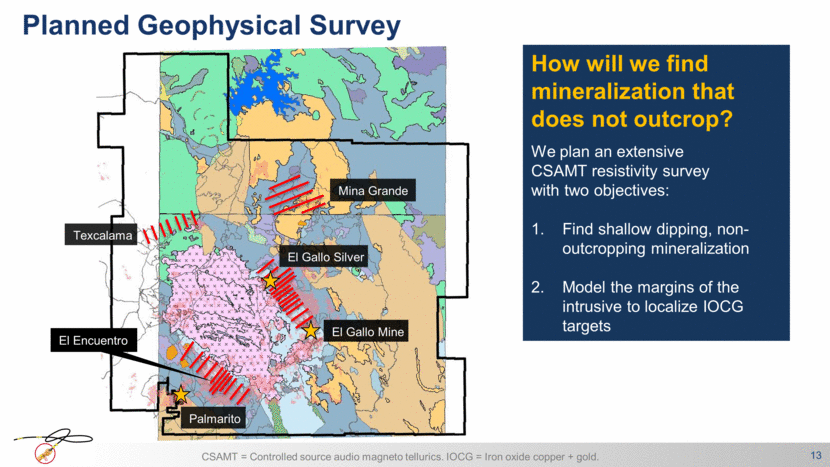
How will we find mineralization that does not outcrop? We plan an extensive CSAMT resistivity survey with two objectives: Find shallow dipping, non-outcropping mineralization Model the margins of the intrusive to localize IOCG targets 13 CSAMT = Controlled source audio magneto tellurics. IOCG = Iron oxide copper + gold. Mina Grande El Gallo Silver Palmarito El Gallo Mine El Encuentro Texcalama Planned Geophysical Survey
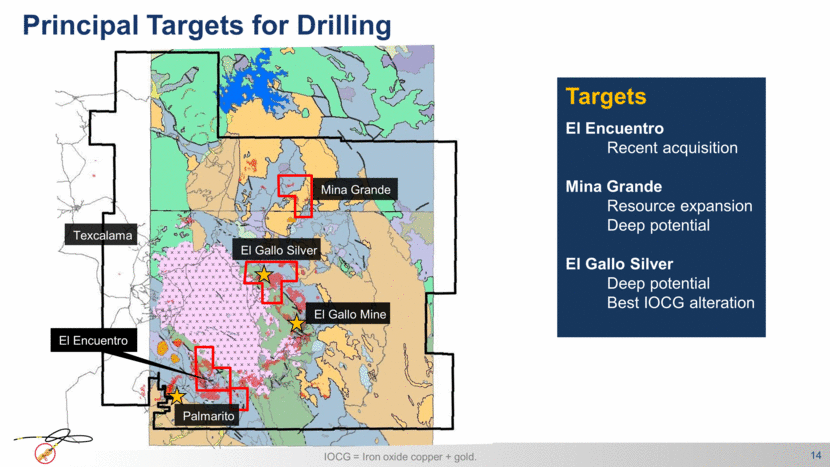
Targets 14 El Encuentro Recent acquisition Mina Grande Resource expansion Deep potential El Gallo Silver Deep potential Best IOCG alteration Mina Grande El Gallo Silver El Gallo Mine IOCG = Iron oxide copper + gold. El Encuentro Palmarito Principal Targets for Drilling Texcalama
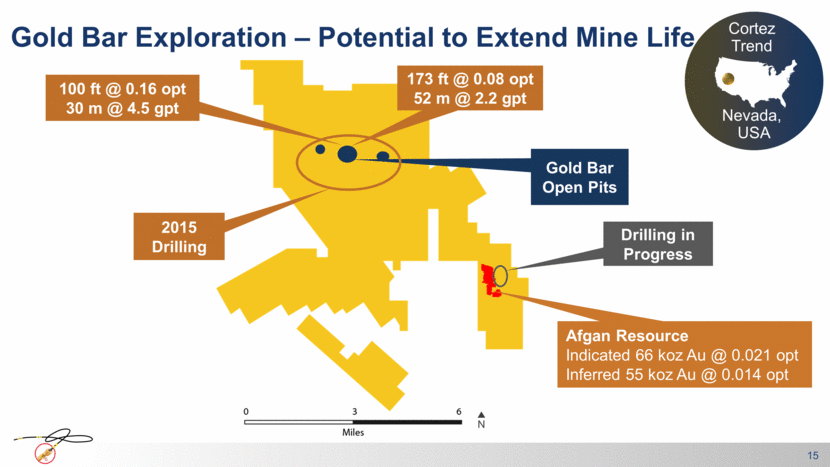
Gold Bar Exploration – Potential to Extend Mine Life 15 Gold Bar Open Pits 2015 Drilling Drilling in Progress Afgan Resource Indicated 66 koz Au @ 0.021 opt Inferred 55 koz Au @ 0.014 opt N Cortez Trend Nevada, USA 100 ft @ 0.16 opt 30 m @ 4.5 gpt 173 ft @ 0.08 opt 52 m @ 2.2 gpt
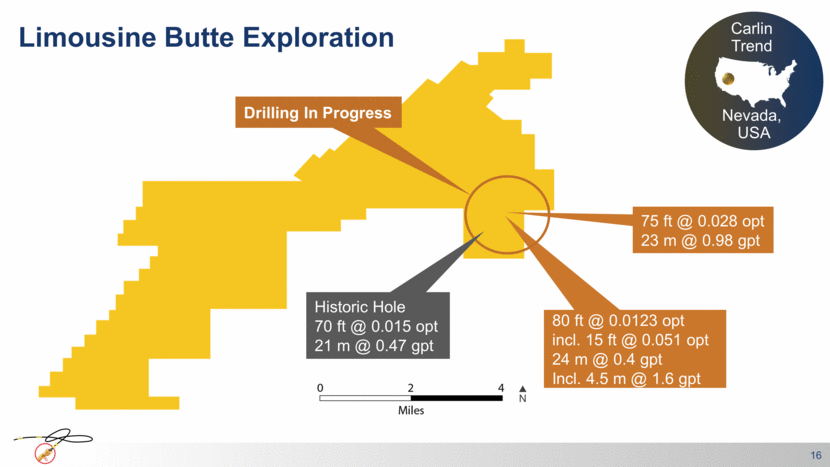
Limousine Butte Exploration 16 Carlin Trend Nevada, USA 80 ft @ 0.0123 opt incl. 15 ft @ 0.051 opt 24 m @ 0.4 gpt Incl. 4.5 m @ 1.6 gpt 75 ft @ 0.028 opt 23 m @ 0.98 gpt N Drilling In Progress Historic Hole 70 ft @ 0.015 opt 21 m @ 0.47 gpt
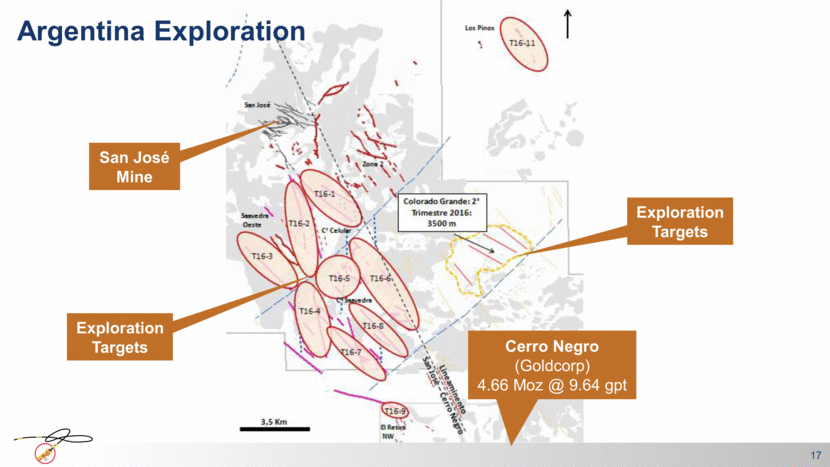
Argentina Exploration 17 San José Mine Exploration Targets Exploration Targets Cerro Negro (Goldcorp) 4.66 Moz @ 9.64 gpt
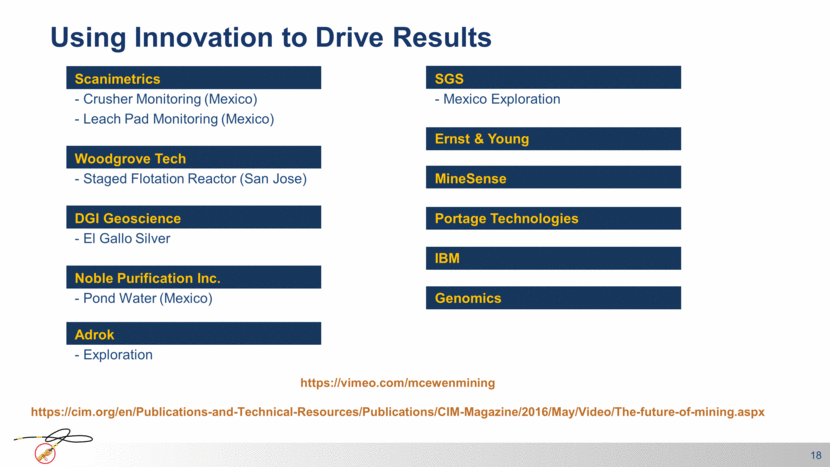
Using Innovation to Drive Results 18 SGS - Mexico Exploration Ernst & Young MineSense Portage Technologies IBM Genomics https://vimeo.com/mcewenmining https://cim.org/en/Publications-and-Technical-Resources/Publications/CIM-Magazine/2016/May/Video/The-future-of-mining.aspx Scanimetrics - Crusher Monitoring (Mexico) - Leach Pad Monitoring (Mexico) Woodgrove Tech - Staged Flotation Reactor (San Jose) DGI Geoscience - El Gallo Silver Noble Purification Inc. - Pond Water (Mexico) Adrok - Exploration
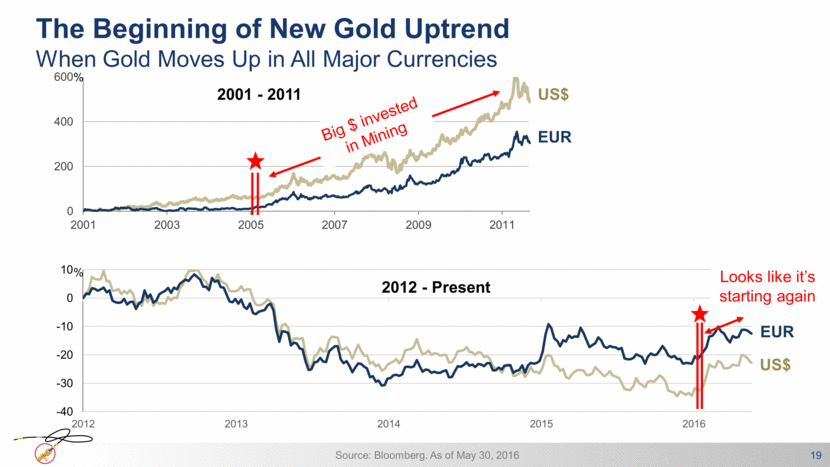
19 The Beginning of New Gold Uptrend When Gold Moves Up in All Major Currencies US$ EUR Source: Bloomberg. As of May 30, 2016 % US$ EUR % 2001 - 2011 2012 - Present Big $ invested in Mining Looks like it’s starting again -40 -30 -20 -10 0 10 2012 2013 2014 2015 2016 0 200 400 600 2001 2003 2005 2007 2009 2011
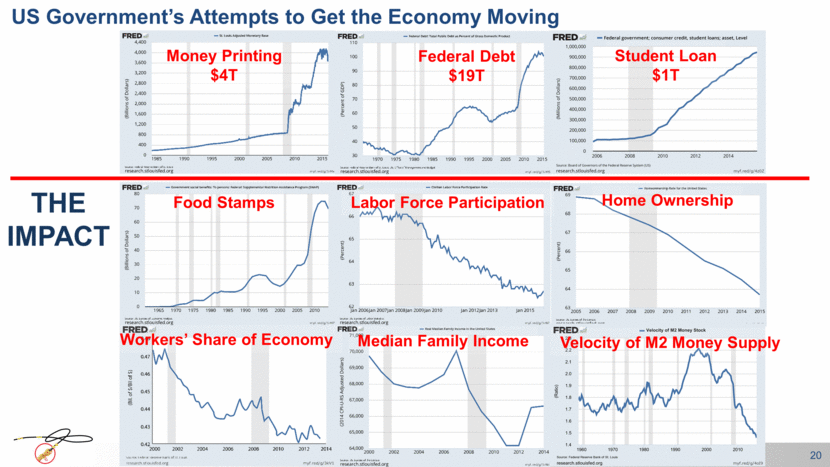
20 Student Loan $1T Labor Force Participation Food Stamps Federal Debt $19T Money Printing $4T Median Family Income Home Ownership Workers’ Share of Economy Velocity of M2 Money Supply US Government’s Attempts to Get the Economy Moving THE IMPACT
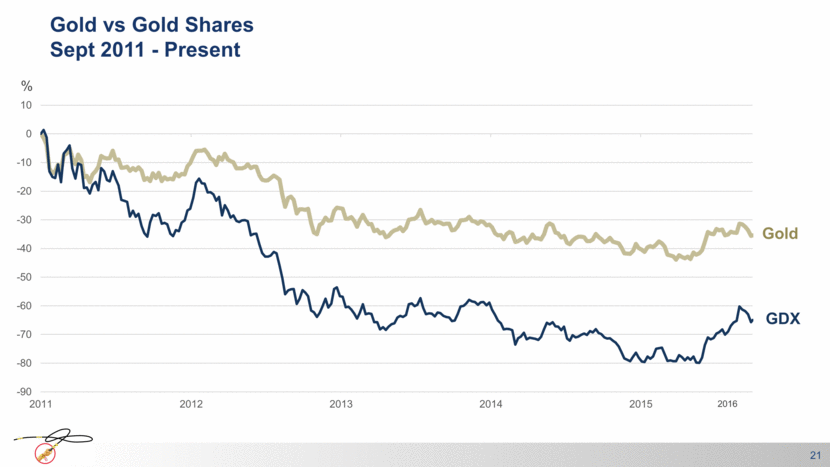
Gold vs Gold Shares Sept 2011 - Present 21 % Gold GDX 2016
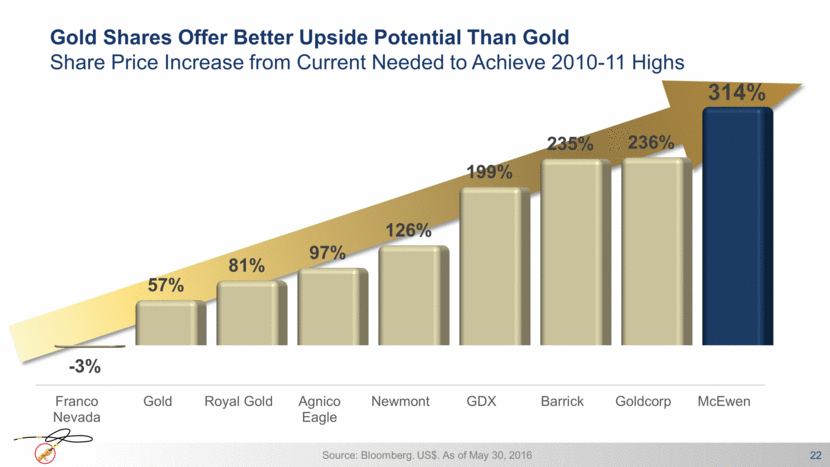
Gold Shares Offer Better Upside Potential Than Gold Share Price Increase from Current Needed to Achieve 2010-11 Highs 22 Source: Bloomberg. US$. As of May 30, 2016 Franco Nevada Gold Royal Gold Agnico Eagle Newmont GDX Barrick Goldcorp McEwen - 3% 57% 81% 97% 126% 199% 235% 236% 314%
23 5 Reasons To Own

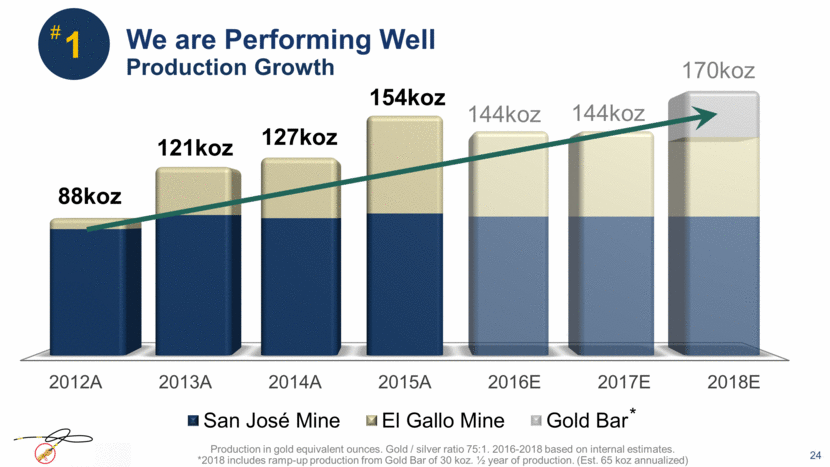
We are Performing Well 24 154koz 127koz 121koz 88koz Production in gold equivalent ounces. Gold / silver ratio 75:1. 2016-2018 based on internal estimates. *2018 includes ramp-up production from Gold Bar of 30 koz. ½ year of production. (Est. 65 koz annualized) 1 144koz # Production Growth 144koz 170koz *
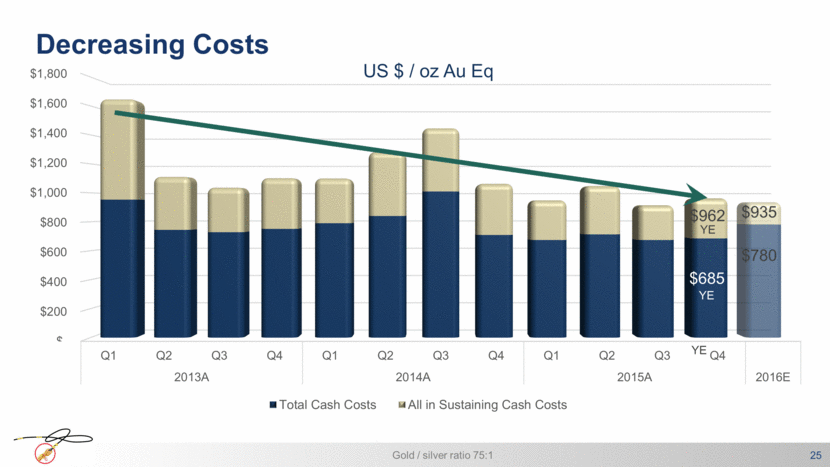
Decreasing Costs 25 $685 $962 US $ / oz Au Eq Gold / silver ratio 75:1 YE YE YE $935 $780 $- $200 $400 $600 $800 $1,000 $1,200 $1,400 $1,600 $1,800 Q1 Q2 Q3 Q4 Q1 Q2 Q3 Q4 Q1 Q2 Q3 Q4 2013A 2014A 2015A 2016E Total Cash Costs All in Sustaining Cash Costs
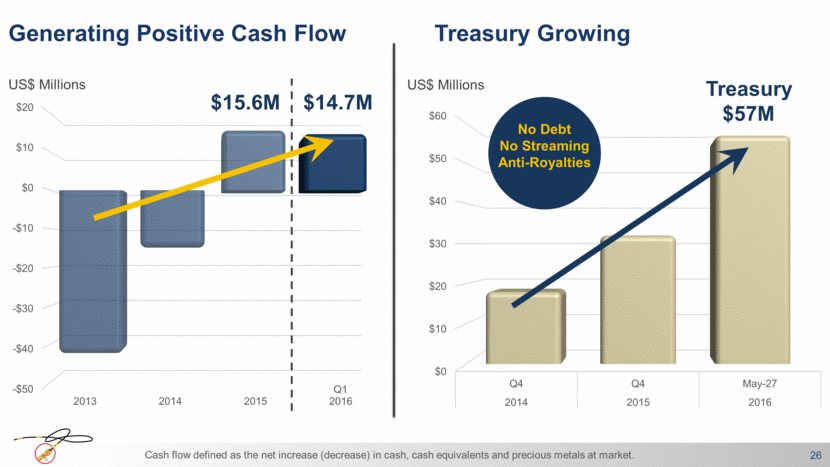
Generating Positive Cash Flow 26 Cash flow defined as the net increase (decrease) in cash, cash equivalents and precious metals at market. US$ Millions US$ Millions Treasury Growing No Debt No Streaming Anti-Royalties Treasury $57M $14.7M Q1 $15.6M $0 $10 $20 $30 $40 $50 $60 Q4 Q4 May-27 2014 2015 2016 -$50 -$40 -$30 -$20 -$10 $0 $10 $20 2013 2014 2015 2016
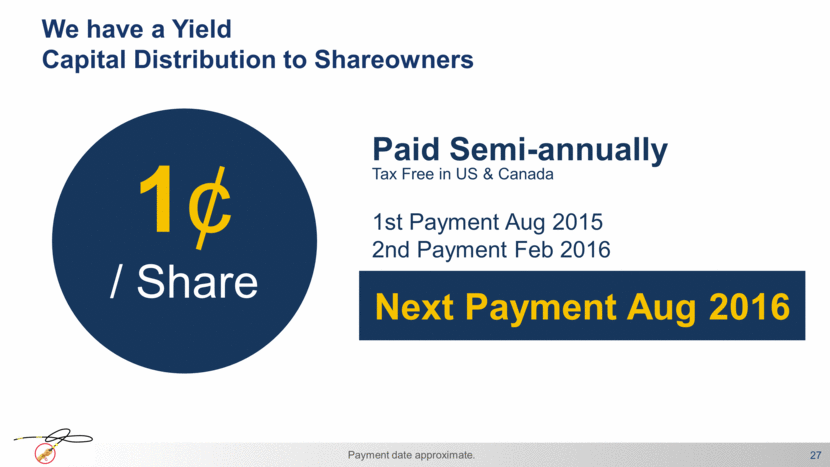
Next Payment Aug 2016 We have a Yield Capital Distribution to Shareowners 27 1¢ / Share Paid Semi-annually 1st Payment Aug 2015 2nd Payment Feb 2016 Tax Free in US & Canada Payment date approximate.
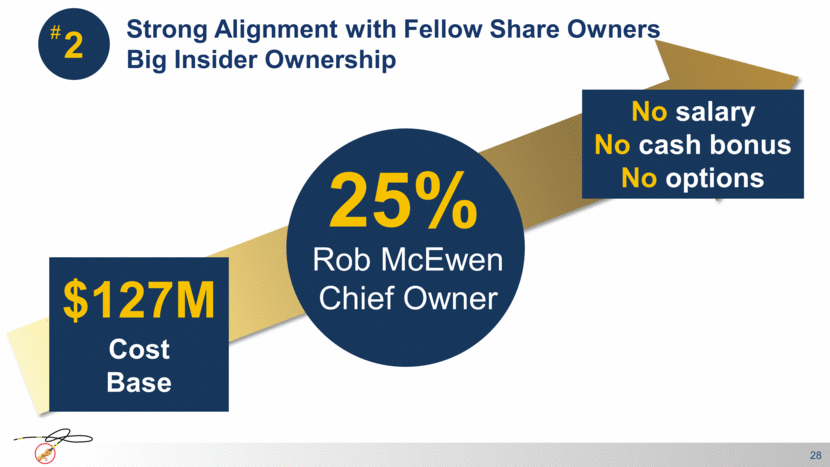
No salary No cash bonus No options Cost Base $127M Strong Alignment with Fellow Share Owners Big Insider Ownership 28 2 Rob McEwen Chief Owner 25% #
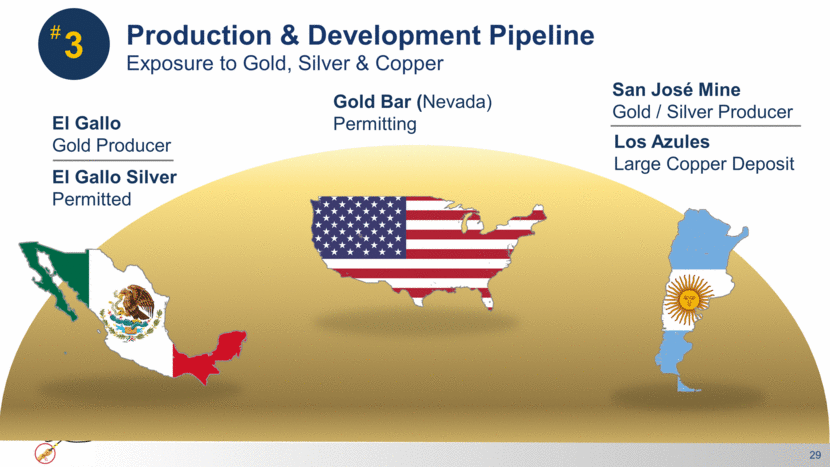
Production & Development Pipeline 29 Gold Bar (Nevada) Permitting El Gallo Gold Producer Los Azules Large Copper Deposit El Gallo Silver Permitted 3 # San José Mine Gold / Silver Producer Exposure to Gold, Silver & Copper
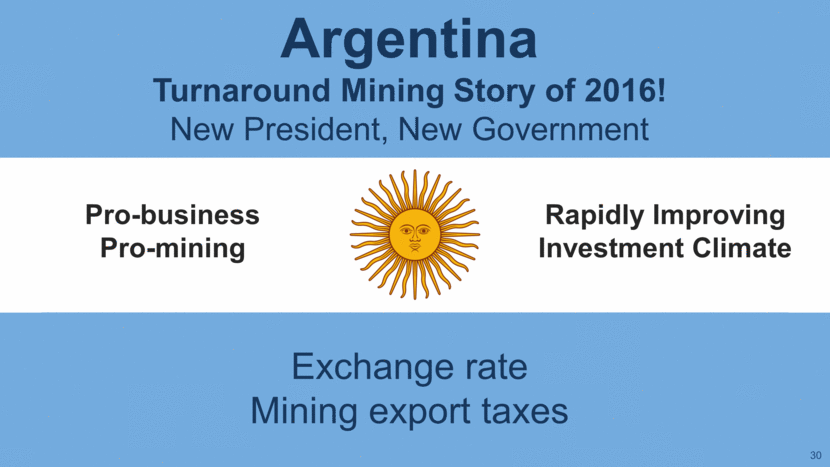
30 Argentina Turnaround Mining Story of 2016! New President, New Government Rapidly Improving Investment Climate Exchange rate Mining export taxes Pro-business Pro-mining
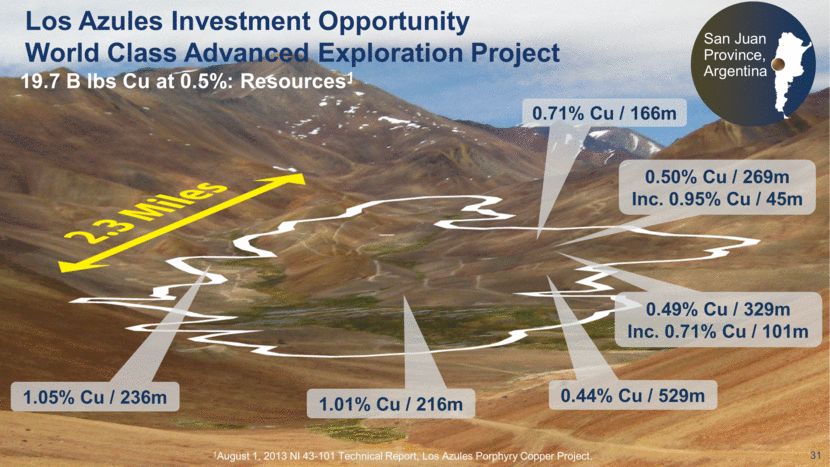
31 San Juan Province, Argentina Los Azules Investment Opportunity World Class Advanced Exploration Project 0.71% Cu / 166m 0.50% Cu / 269m Inc. 0.95% Cu / 45m 0.49% Cu / 329m Inc. 0.71% Cu / 101m 0.44% Cu / 529m 1.01% Cu / 216m 1.05% Cu / 236m 19.7 B lbs Cu at 0.5%: Resources1 1August 1, 2013 NI 43-101 Technical Report, Los Azules Porphyry Copper Project.
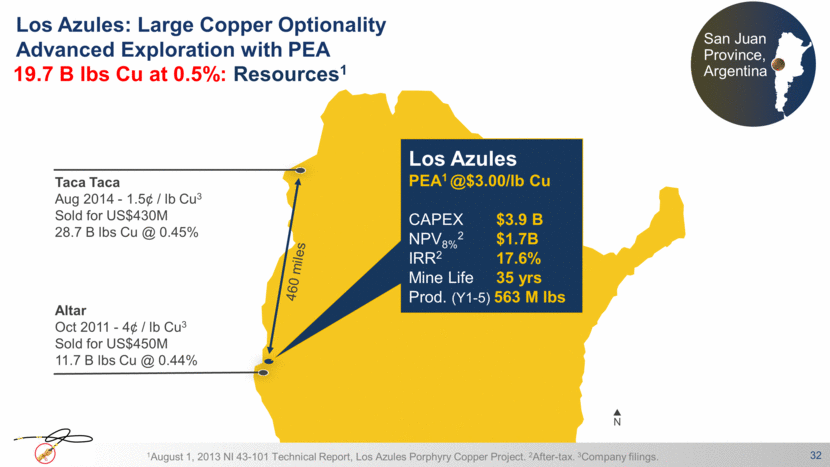
Los Azules: Large Copper Optionality Advanced Exploration with PEA 19.7 B lbs Cu at 0.5%: Resources1 San Juan Province, Argentina 32 1August 1, 2013 NI 43-101 Technical Report, Los Azules Porphyry Copper Project. 2After-tax. 3Company filings. Taca Taca Aug 2014 - 1.5¢ / lb Cu3 Sold for US$430M 28.7 B lbs Cu @ 0.45% Altar Oct 2011 - 4¢ / lb Cu3 Sold for US$450M 11.7 B lbs Cu @ 0.44% Los Azules PEA1 @$3.00/lb Cu CAPEX $3.9 B NPV8%2 $1.7B IRR2 17.6% Mine Life 35 yrs Prod. (Y1-5) 563 M lbs 460 miles N
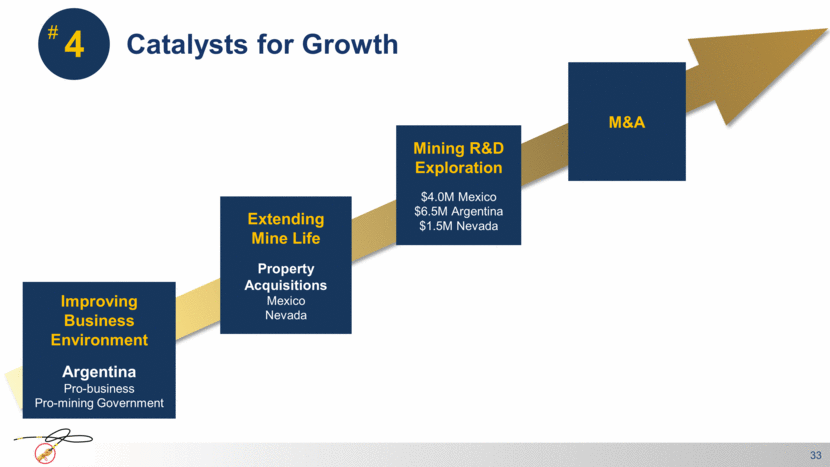
Catalysts for Growth 33 # 4 Improving Business Environment Argentina Pro-business Pro-mining Government Extending Mine Life Property Acquisitions Mexico Nevada Mining R&D Exploration $4.0M Mexico $6.5M Argentina $1.5M Nevada M&A
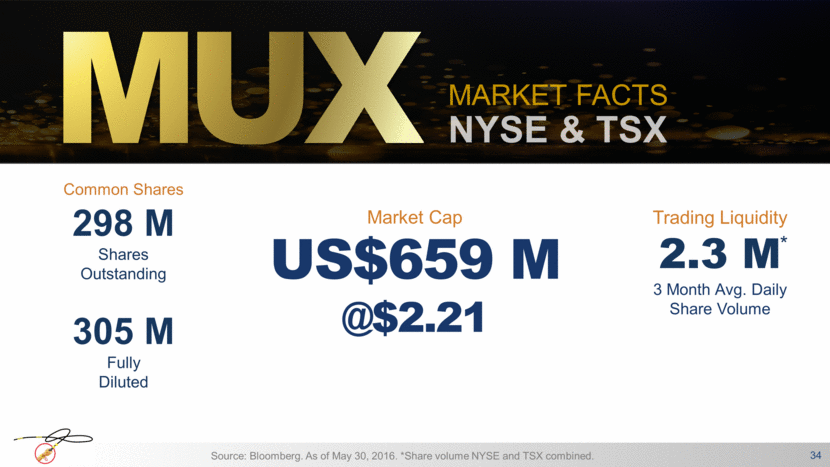
2.3 M US$659 M @$2.21 Market Cap 305 M Fully Diluted 298 M Shares Outstanding Common Shares 34 Source: Bloomberg. As of May 30, 2016. *Share volume NYSE and TSX combined. 3 Month Avg. Daily Share Volume * Trading Liquidity NYSE & TSX MARKET FACTS
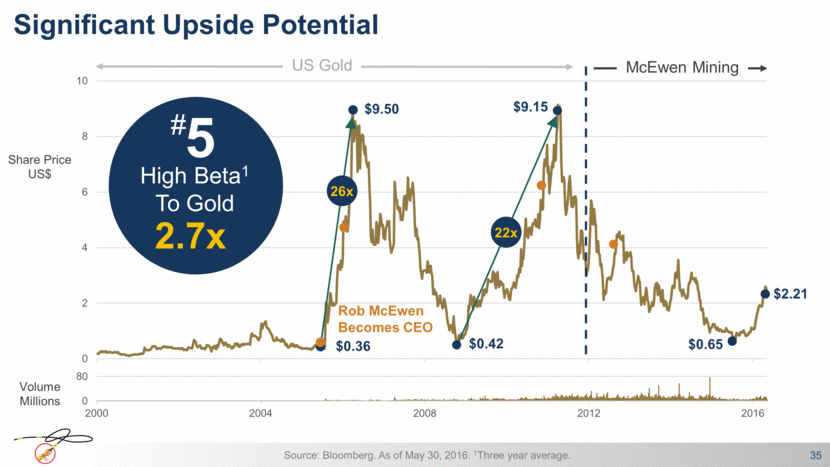
35 Source: Bloomberg. As of May 30, 2016. 1Three year average. High Beta1 To Gold 2.7x 5 # Significant Upside Potential $9.50 $9.15 $0.42 $0.36 $2.21 26x 22x $0.65 Rob McEwen Becomes CEO US Gold McEwen Mining Share Price US$ Volume Millions 0 2 4 6 8 10 2000 2004 2008 2012 2016 0 80 2000 2004 2008 2012 2016
