Attached files
| file | filename |
|---|---|
| 8-K - 8-K - NORFOLK SOUTHERN CORP | ns8k051716.htm |
| EX-99.2 - NON-GAAP FINANCIALS - NORFOLK SOUTHERN CORP | nsnongaap051716.htm |

1 2016 Transportation Conference Bank of America Merrill Lynch May 17, 2016 Alan H. Shaw Executive Vice President and Chief Marketing Officer
Forward-Looking Statements Certain statements in this presentation are forward-looking statements within the meaning of the safe harbor provision of the Private Securities Litigation Reform Act of 1995, as amended. These statements relate to future events or Norfolk Southern Corporation’s (NYSE: NSC) (“Norfolk Southern,” “NS” or the “Company”) future financial performance and involve known and unknown risks, uncertainties and other factors that may cause the actual results, levels of activity, performance or achievements of the Company or its industry to be materially different from those expressed or implied by any forward-looking statements. In some cases, forward-looking statements may be identified by the use of words like “believe,” “expect,” “anticipate,” “estimate,” “plan,” “consider,” “project,” and similar references to the future. The Company has based these forward-looking statements on management’s current expectations, assumptions, estimates, beliefs and projections. While the Company believes these expectations, assumptions, estimates, and projections are reasonable, such forward-looking statements are only predictions and involve known and unknown risks and uncertainties, many of which involve factors or circumstances that are beyond the Company’s control. These and other important factors, including those discussed under “Risk Factors” in the Annual Report on Form 10- K for the year ended December 31, 2015, filed with the Securities and Exchange Commission (the “SEC”) on February 8, 2016, as well as the Company’s subsequent filings with the SEC, may cause our actual results, performance or achievements to differ materially from those expressed or implied by these forward-looking statements. Forward-looking statements are not, and should not be relied upon as, a guarantee of future performance or results, nor will they necessarily prove to be accurate indications of the times at or by which any such performance or results will be achieved. As a result, actual outcomes and results may differ materially from those expressed in forward-looking statements. We undertake no obligation to update or revise forward-looking statements, whether as a result of new information, the occurrence of certain events or otherwise, unless otherwise required by applicable securities law. 2
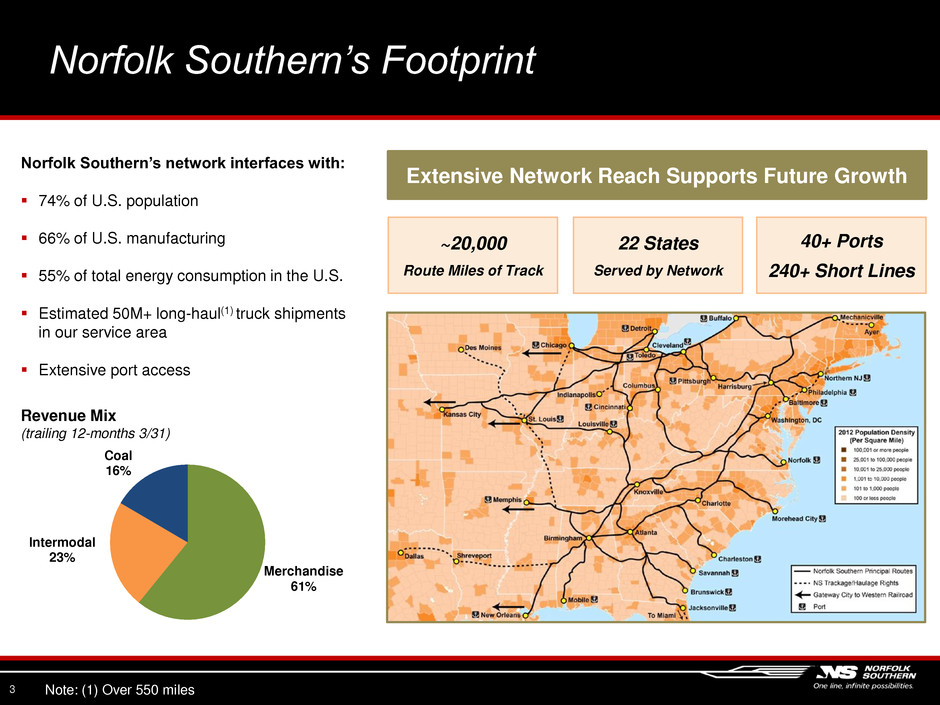
Norfolk Southern’s Footprint 3 Extensive Network Reach Supports Future Growth ~20,000 Route Miles of Track 22 States Served by Network 40+ Ports 240+ Short Lines Norfolk Southern’s network interfaces with: 74% of U.S. population 66% of U.S. manufacturing 55% of total energy consumption in the U.S. Estimated 50M+ long-haul(1) truck shipments in our service area Extensive port access Revenue Mix (trailing 12-months 3/31) Merchandise 61% Intermodal 23% Coal 16% Note: (1) Over 550 miles
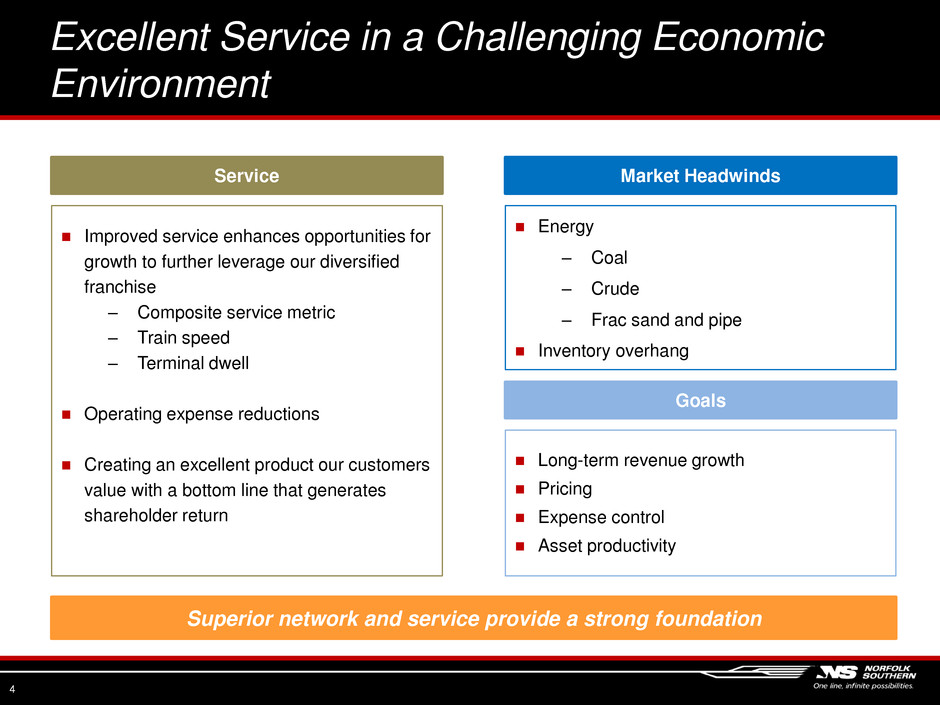
Excellent Service in a Challenging Economic Environment 4 Service Market Headwinds Improved service enhances opportunities for growth to further leverage our diversified franchise ‒ Composite service metric ‒ Train speed ‒ Terminal dwell Operating expense reductions Creating an excellent product our customers value with a bottom line that generates shareholder return Energy ‒ Coal ‒ Crude ‒ Frac sand and pipe Inventory overhang Goals Long-term revenue growth Pricing Expense control Asset productivity Superior network and service provide a strong foundation

Steady Improvement in Composite Service Performance 5 50% 55% 60% 65% 70% 75% 80% 85% 1Q14 2Q14 3Q14 4Q14 1Q15 2Q15 3Q15 4Q15 1Q16 2Q16* * 2Q16 through 05/13/16

Train Speed & Terminal Dwell Drive Progress 6 Speed Dwell Better ( ) Better ( ) 15 17 19 21 23 25 27 M P H 15 17 19 21 23 25 27 29 31 Ho u rs * 2Q16 through 05/13/16
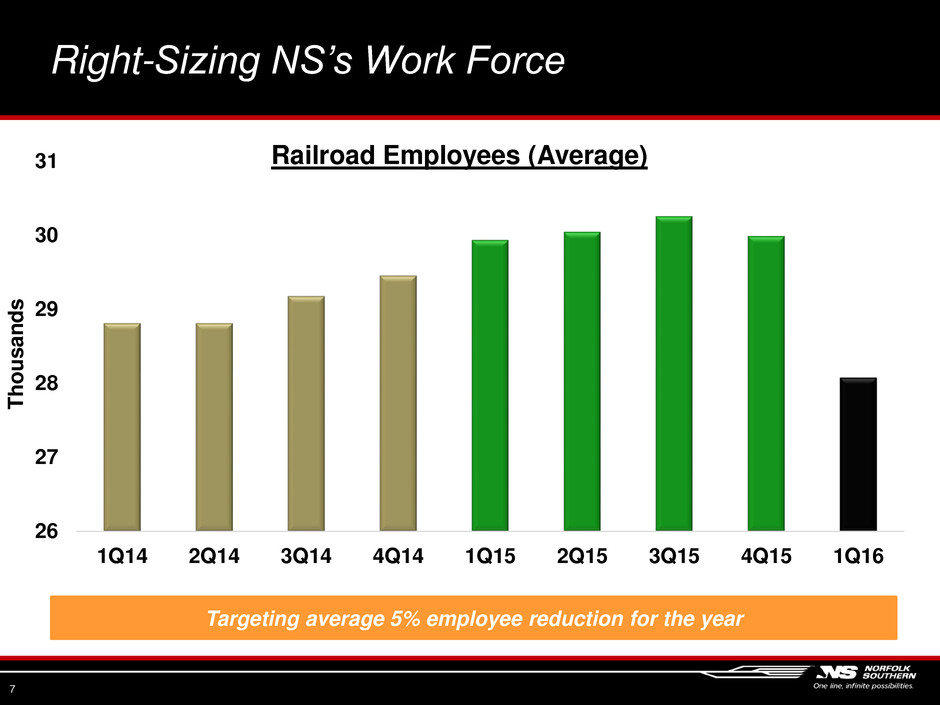
Right-Sizing NS’s Work Force 7 26 27 28 29 30 31 1Q14 2Q14 3Q14 4Q14 1Q15 2Q15 3Q15 4Q15 1Q16 T h o u sa n d s Railroad Employees (Average) Targeting average 5% employee reduction for the year
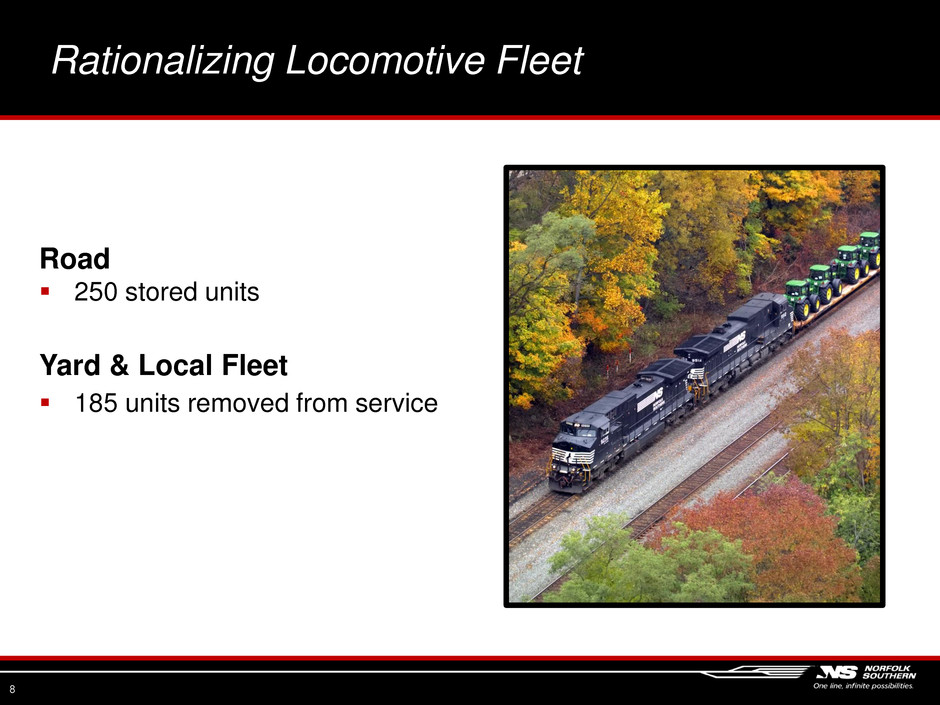
Rationalizing Locomotive Fleet 8 Road 250 stored units Yard & Local Fleet 185 units removed from service

Aggressive cost control initiatives ‒ Materials cost savings were front-end loaded • Will moderate going forward ‒ Headcount to increase sequentially • Year-end average down 1,500 Incentive compensation higher versus prior year Expense Control and Outlook 9

Changing Economic Projections 10 Indicator 2016 Projection as of: Oct 2015 Feb 2016 April 2016 GDP (IHS) +2.9% +2.4% +2.1% GDP (Wells Fargo) +2.6% +1.8% +1.7% Housing Starts (millions) 1.30 1.22 1.20 N.A. Vehicle Production (millions) 18.3 17.9 18.2 Industrial Production +2.0% -0.4% -0.8% Real Consumer Spending +3.3% +2.9% +2.6% TL Dry Van Rates (rev/mile) without FSC +3.3% +4.2% +1.7% Unemployment 5.0% 4.8% 4.8% WTI Crude Oil Price ($/barrel) $50.91 $34.04 $40.34 Henry Hub Nat Gas Price ($/mmBtu) $3.05 $2.64 $2.18 USD Exchange Rate With Major Trading Partners (year-over-year % change) +0.7% +6.7% +2.4% Positive for NS Revenue Negative for NS Revenue Source: IHS; Wells Fargo; WardsAuto Forecast; EIA; FTR

Inventory Levels Provide Headwinds for Volume Growth 11 Source: Census Bureau; EVA 1.10 1.15 1.20 1.25 1.30 1.35 1.40 1.45 1.50 J a n-0 8 J u n-0 8 N o v -0 8 A pr -0 9 S e p -0 9 F e b-1 0 J u l- 1 0 D e c -1 0 M a y -1 1 O ct -1 1 M ar -1 2 A u g -1 2 J a n-1 3 J u n-1 3 N o v -1 3 A pr -1 4 S e p -1 4 F e b-1 5 J u l- 1 5 D e c -1 5 Total Business Inventory Sales Ratio 0 10 20 30 40 50 60 70 80 90 100 J a n -1 3 M ar -1 3 M a y -1 3 Ju l- 1 3 S e p -1 3 N o v -1 3 J a n -1 4 M ar -1 4 M a y -1 4 Ju l- 1 4 S e p -1 4 N o v -1 4 J a n-1 5 M ar -1 5 M a y -1 5 Ju l- 1 5 S e p -1 5 N o v -1 5 J a n-1 6 M ar -1 6 Utility Coal Stockpiles (days supply) Total - Days of Burn

85% 90% 95% 100% Capacity Utilization (%) 12 (6%) (4%) (2%) 0% 2% 4% 6% 8% YoY Change in Dry Van Rates (seasonally adjusted, rev/mi, without fuel) Source: FTR Truck Price Competition Due to Increased Capacity

Automotive Volume Will Face Tougher Comps Going Forward 3,000 3,200 3,400 3,600 3,800 4,000 4,200 4,400 4,600 4,800 Th o u s a nd s of Un it s North American Vehicle Production 13 Source: WardsAuto

Current Railway Volume Second Quarter through Week 19 (ended May 14, 2016) 14 Total Units (000’s)(9%) Decline in Units 2QTD 2016 vs. 2015 1,313; 3% 141; 0% (3,186); (9%) (5,746); (8%) (8,041); (12%) (24,815); (5%) (43,501); (32%) Paper Agriculture Chemicals Intermodal Coal Automotive MetCon 905.0 821.1 870.8 812.6 2015 2016 2015 2016 (9%) (7%) Including TCS Excluding TCS

125,000 130,000 135,000 140,000 145,000 1 2 3 4 5 6 7 8 9 10 11 12 13 14 15 16 17 18 19 Week W e e k ly V olum e 15 Peak at week 9: 144,293 units 2016 Weekly Volume Declines Volume declined in mid-March and has not returned

Mix Changes Should Follow 1Q Trends 16 $1,559 $542 $2,458 $1,607 $519 $2,518 Coal Intermodal Merchandise 1Q15 1Q16 +3% (4%) +2% Revenue per Unit Excluding Fuel & y-o-y Percent Change1 Overall RPU impacted by mix Mix Impacts Coal: Larger decreases in utility will increase RPU Intermodal: Flat with 1Q YOY impacted by TCS restructure and increased International Merchandise: Flat with 1Q 1. Please see reconciliation to GAAP posted on our website.

2016 Outlook 17 Volume Pricing Diversified franchise mitigates impact of commodity price volatility ‒ Low commodity prices will continue to limit crude oil, frac sand, steel, and utility and export coal volumes Weather impact on Coal will continue across the industry through 4Q 2016 ‒ Estimated 13-14M utility tons in 2Q; 13-15M tons in 3Q Consumer-driven growth opportunities − Housing and construction-related commodities − Domestic and International Intermodal Aggressive focus on right-sizing our business operations while maintaining flexibility Focus on Pricing − 2015 strength carried to 2016 − Value in service product − Domestic truck rates lower Long term pricing plan on multiyear contracts Expense Control Actively manage costs without impacting service 2016 productivity savings of $200 million

18 Thank You
