Attached files
| file | filename |
|---|---|
| 8-K - 8-K - STEWART INFORMATION SERVICES CORP | v438989_8k.htm |
Exhibit 99.1

Stewart Information Services Corporation Investor Presentation Summer 2016

2 Forward-looking Statements Certain statements in this news release are “forward-looking statements” within the meaning of the Private Securities Litigation Reform Act of 1995. Such forward-looking statements relate to future, not past, events and often address our expected future business and financial performance. These statements often contain words such as “expect,” “anticipate,” “intend,” “plan,” “believe,” “seek,” “will,” “foresee” or other similar words. Forward-looking statements by their nature are subject to various risks and uncertainties that could cause our actual results to be materially different than those expressed in the forward-looking statements. These risks and uncertainties include, among other things, the tenuous economic conditions; adverse changes in the level of real estate activity; changes in mortgage interest rates, existing and new home sales, and availability of mortgage financing; our ability to respond to and implement technology changes, including the completion of the implementation of our enterprise systems; the impact of unanticipated title losses on the need to strengthen our policy loss reserves; any effect of title losses on our cash flows and financial condition; the impact of vetting our agency operations for quality and profitability; changes to the participants in the secondary mortgage market and the rate of refinancings that affect the demand for title insurance products; regulatory non-compliance, fraud or defalcations by our title insurance agencies or employees; our ability to timely and cost-effectively respond to significant industry changes and introduce new products and services; the outcome of pending litigation; the impact of changes in governmental and insurance regulations, including any future reductions in the pricing of title insurance products and services; our dependence on our operating subsidiaries as a source of cash flow; the continued realization of expense savings from our continual focus on aligning our operations to quickly adapt our costs to transaction volumes and market conditions; our ability to access the equity and debt financing markets when and if needed; our ability to grow our international operations; and our ability to respond to the actions of our competitors. These risks and uncertainties, as well as others, are discussed in more detail in our documents filed with the Securities and Exchange Commission, including our Annual Report on Form 10-K for the year ended December 31, 2015, our quarterly reports on Form 10-Q, and our Current Reports on Form 8-K. We expressly disclaim any obligation to update any forward-looking statements contained in this news release to reflect events or circumstances that may arise after the date hereof, except as may be required by applicable law.
3 Non-GAAP Disclosures This presentation may contain certain financial measures that are not presented in accordance with generally accepted accounting principles (GAAP), including but not limited to, losses and litigation expenses arising from non-predictable title losses and adjusted pretax title margin, which is adjusted to exclude net realized investment gains or losses and reserve adjustments. Although these exclusions represent actual gains, losses or expenses to the Company, they may mask the periodic income and financial and operating trends associated with the Company’s business. The Company is presenting these non-GAAP financial measures because they provide the Company’s management and investors with additional insight into the operational performance of the Company relative to earlier periods and relative to the Company’s competitors. The Company does not intend for these non-GAAP financial measures to be a substitute for any GAAP financial information. In this presentation these non-GAAP financial measures have been presented with, and reconciled to, the most directly comparable GAAP financial measures. Investors should use these non-GAAP financial measures only in conjunction with the comparable GAAP financial measures.

Title Insurance • Leading provider of title insurance and settlement services • 12.2% domestic market share as of 4Q15, according to the American Land Title Association®, with #3 market share in direct channel (12.7%) and #4 market share in agency channel (11.8%) • #3 provider of commercial title insurance • International provider of title insurance with #2 market share in Canada and additional operations in the United Kingdom, Central Europe, Latin America and Australia • Provider of ancillary real estate services including valuation, government, and loan file review and audit Financials • Revenues of $1.9 billion in 2015 • Direct title revenues 48% of total in 2015, up from 38% in 2010 • $500+ million in statutory surplus • Liquidity ratio of 103% as of December 31, 2015 • A- ratings by Fitch® and A.M. Best® 4 Company Overview

Improved Margins and Profitability • Achieved plan to eliminate $100+ million in annual operating expenses following the financial crisis • Announced additional initiative in first quarter 2014 to eliminate $25 million of costs in 2014 and 2015; increased to $30 million of annualized savings later in 2014 and completed in 2015 • Continue to execute initiatives around centralization, optimization, offshoring and technology rationalization • Goal of achieving 10% pretax margin in normalized origination market Focused Strategies for Above Market Growth • Enterprise sales plan with specific growth targets for each line of business • Plans to open new direct offices in select MSAs and states with low independent agent remittance rates • Leverage balance sheet and ratings to drive continued growth in higher margin commercial business • Independent agency growth in higher remittance rate states Capital Return • $70 million capital return program announced in February 2014 and completed in December 2015 • Annual dividend increased from $0.10 to $1.00 in February 2015 and from $1.00 to $1.20 in November 2015 • Board of Directors has authorized a new share repurchase program of up to $50 million over the next three years 5 Increasing Shareholder Value
Reductions in Cost Structure • Post-crisis, Stewart changed its operating model and reduced operating costs by $100+ million to reflect the new market environment (origination volume has been between $1-2 trillion since 2008, dropping from $2-4 trillion from 2001 to 2007) °°Created a centralized, shared services technology environment, reducing the need to support multiple, independent installations °°Consolidated legal entity structure (centralized accounting, human resources, marketing and other support operations to reduce overlapping spending) °°Eliminated presence in smaller markets that are less cost effective °°Centralizing back office operations and technology has also increased Stewart’s ability to scale to a cyclical origination environment and has reduced the personnel required to enter or exit markets °°Increased revenue per agency by shedding less attractive agents while remaining revenue neutral °°Shed unprofitable businesses where company lacked a significant presence (e.g., flood insurance) Going Forward • Continue to focus on centralization, optimization, offshoring and technology rationalization to further reduce operating expenses and achieve the company’s goal of a pretax margin of 10% in a normalized originations market, although current market projections are for sub-normal conditions in the next several years. 6 Improving Efficiency
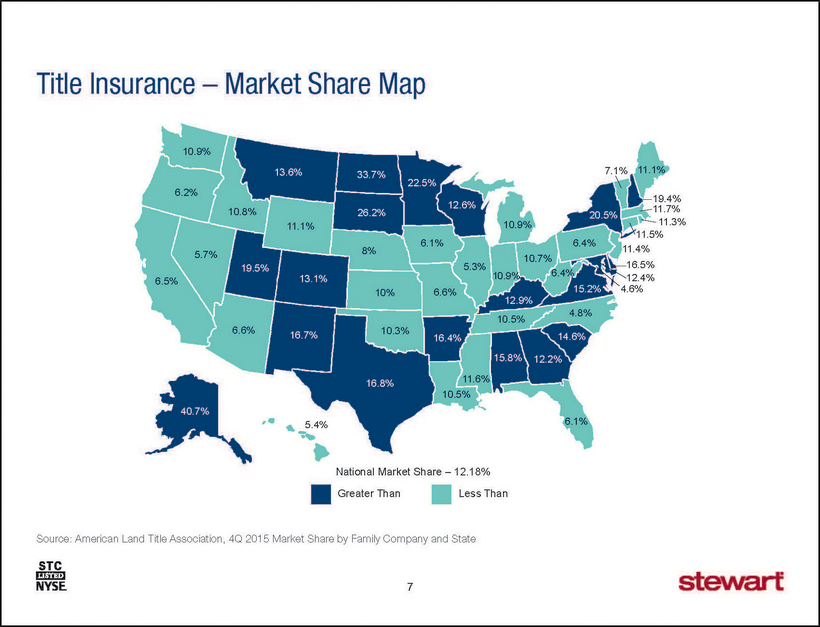
Source: American Land Title Association, 4Q 2015 Market Share by Family Company and State 7 Title Insurance – Market Share Map 40.7% 33.7% 16.4% 13.1% 26.2% 20.5% 19.5% 15.8% 11.5% 16.5% 10.9% 6.1% 10.5% 11.1% 16.7% 6.2% 14.6% 16.8% 15.2% 12.6% 11.1% 6.6% 6.5% 4.6% 6.1% 12.2% 5.3% 10% 12.9% 12.4% 11.7% 10.9% 22.5% 11.6% 13.6% 5.7% 8% 19.4% 11.4% 10.7% 10.3% 6.4% 11.3% 10.5% 7.1% 10.9% 6.4% 5.4% 10.8% 6.6% 4.8% National Market Share – 12.18% Greater Than Less Than

Growth Strategy • Stewart has targeted growth in commercial business for higher margin profile and cyclical diversity from residential real estate trends • Aligned sales teams to customer channels to increase capture rate of larger-liability and higher-margin transactions • Leveraged higher financial ratings and statutory surplus to increase share of large deals °°Several states only allow retaining risk on policies up to a particular level of surplus • Increased statutory surplus to $502mm in 2015 from $369mm in 2010 °°Commercial customers are more ratings sensitive • Financial strength rating of A- by A.M. Best and Fitch • The Company is well positioned to benefit from projected increase in commercial refinance transactions over the next several years Commercial Title Premiums * Restated to include all international premiums, not just from Canada 8 Commercial Title $ 73.9 $ 92.7 $ 103.0 $ 121.4 $ 137.5 $ 170.7 $ 186.5 2009 2010 2011 2012 2013 2014* 2015*
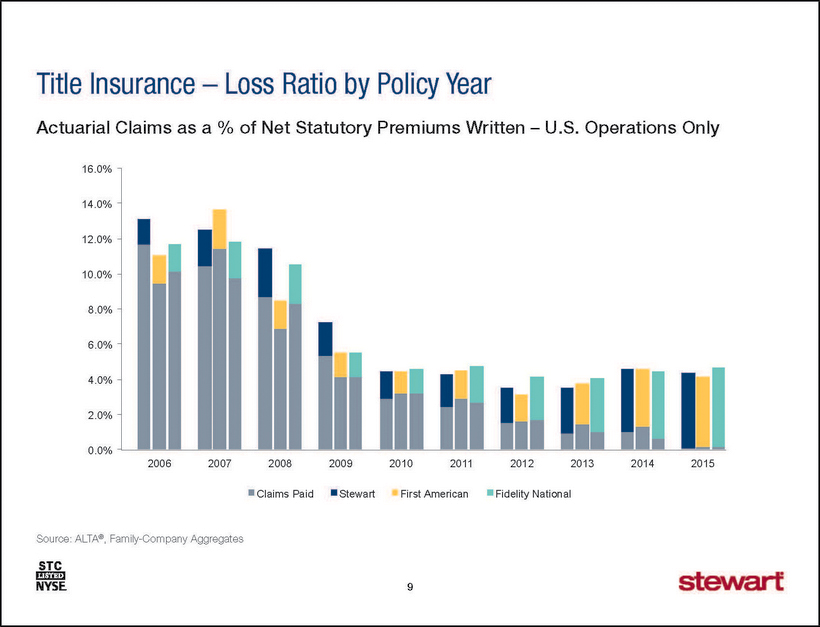
Actuarial Claims as a % of Net Statutory Premiums Written – U.S. Operations Only Source: ALTA®, Family-Company Aggregates 9 Title Insurance – Loss Ratio by Policy Year 0.0% 2.0% 4.0% 6.0% 8.0% 10.0% 12.0% 14.0% 16.0% 2006 2007 2008 2009 2010 2011 2012 2013 2014 2015 Claims Paid Stewart First American Fidelity National

Quarterly Title Loss Provision as a % of Revenues – Includes Prior Year True-ups Source: Company press releases and SEC filings 10 Title Insurance – GAAP Loss Provision Ratios 0% 5% 10% 15% 20% 25% 30% 2007 2008 2009 2010 2011 2012 2013 2014 2015 2016 Fidelity National First American Stewart

Trailing 12 Months – $ Millions Note: Number of independent agencies based on number of contractual relationships rather than number of physical locations of agencies. 11 Agency Network – Revenues Net of Retention 0 1,000 2,000 3,000 4,000 5,000 6,000 7,000 $0 $50 $100 $150 $200 $250 2008 2009 2010 2011 2012 2013 2014 2015 2016 Net Revenue Number of Independent Agents Net Agency Revenues Independent Agents

Underwriter • Continue to strengthen balance sheet by growing $500+ million in statutory surplus consistent with pace of industry growth and in anticipation of increased commercial deal size • Maintain statutory liquidity ratio (liquid assets-to-liabilities) of at least 100% Business Model • Look to increase presence of direct residential and commercial title operations in top 30 MSAs where Stewart’s market share is below its national market average • Accretive acquisition opportunities to drive scale in our core business Other • $70 million capital return program announced in February 2014 and completed in December 2015 • Annual dividend per share increased to $1.00 from $0.10 in February 2015 and from $1.00 to $1.20 in November 2015 • Up to $50 million share repurchase authorization announced in November 2015 • Will continue to assess methods by which capital is allocated; including increasing the annual dividend and accretive acquisitions • Internal debt-to-capital limit of 20% (16% as of 1Q16) 12 Capital Priorities
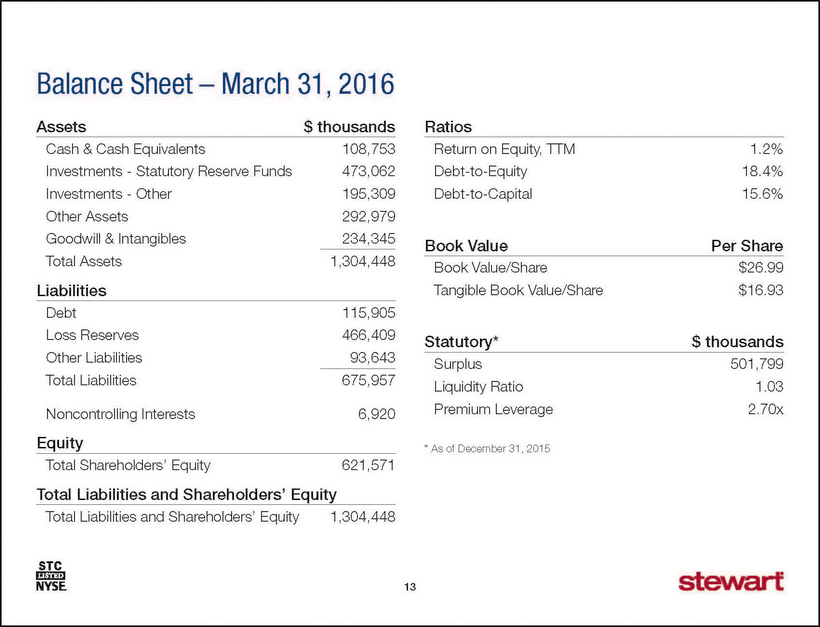
Assets $ thousands Cash & Cash Equivalents 108,753 Investments - Statutory Reserve Funds 473,062 Investments - Other 195,309 Other Assets 292,979 Goodwill & Intangibles 234,345 Total Assets 1,304,448 Liabilities Debt 115,905 Loss Reserves 466,409 Other Liabilities 93,643 Total Liabilities 675,957 Noncontrolling Interests 6,920 Equity Total Shareholders’ Equity 621,571 Total Liabilities and Shareholders’ Equity Total Liabilities and Shareholders’ Equity 1,304,448 Ratios Return on Equity, TTM 1.2% Debt-to-Equity 18.4% Debt-to-Capital 15.6% Book Value Per Share Book Value/Share $26.99 Tangible Book Value/Share $16.93 Statutory* $ thousands Surplus 501,799 Liquidity Ratio 1.03 Premium Leverage 2.70x * As of December 31, 2015 13 Balance Sheet – March 31, 2016

14 Matt Morris CEO Allen Berryman CFO Nat Otis SVP, Finance and Director of Investor Relations nat.otis@stewart.com (713) 625-8360 direct (800) 729-1900, ext. 8360 toll free

Stewart Information Services Corporation Appendix

Market • Interest rates remain at low levels even as the Federal Reserve has started to gradually tighten the supply of money • Home prices continue to increase – 5% increase in home prices equates to an approximate 3.5%+ increase in revenue per transaction • Commercial real estate market remains solid with expectations for increased refinancings over the next couple of years • Market returning to greater seasonality • Housing inventory declining in many markets and remains below historical norms • Heightened regulatory oversight given Dodd-Frank and CFPB 16 Market Conditions

Stewart Family 2015 Title Industry 2015 Source: Form 9 filings (Schedule T) as compiled by ALTA 17 Title Revenues by Regulatory Oversight File and Wait 1% File and Use 37% Foreign 2% Rating Bureau 23% Promulgated 25% No Filing Required 12% File and Wait 1% File and Use 32% Foreign Rating Bureau 7% 25% Promulgated 25% No Filing Required 10%
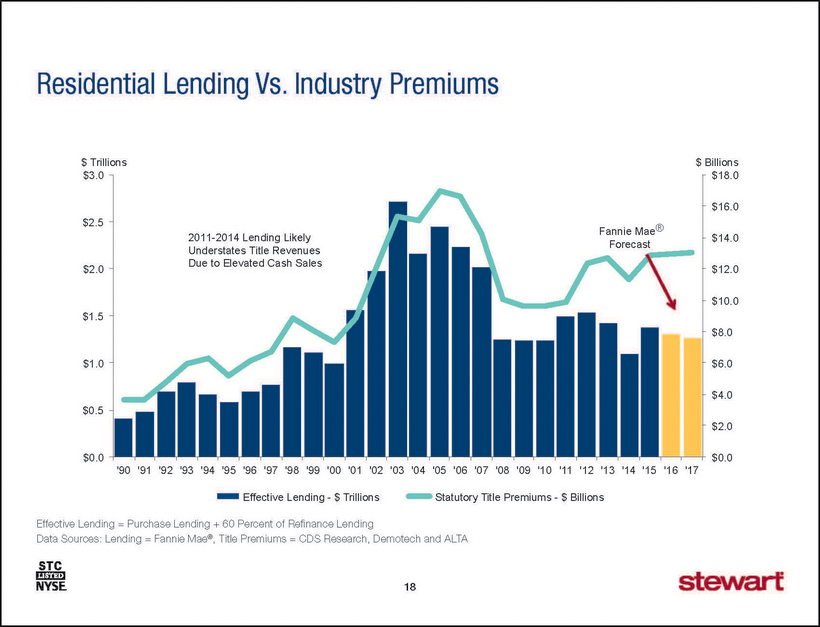
Effective Lending = Purchase Lending + 60 Percent of Refinance Lending Data Sources: Lending = Fannie Mae®, Title Premiums = CDS Research, Demotech and ALTA 18 Residential Lending Vs. Industry Premiums $0.0 $2.0 $4.0 $6.0 $8.0 $10.0 $12.0 $14.0 $16.0 $18.0 $0.0 $0.5 $1.0 $1.5 $2.0 $2.5 $3.0 '90 '91 '92 '93 '94 '95 '96 '97 '98 '99 '00 '01 '02 '03 '04 '05 '06 '07 '08 '09 '10 '11 '12 '13 '14 '15 '16 '17 $ Trillions $ Billions Effective Lending - $ Trillions Statutory Title Premiums - $ Billions 2011-2014 Lending Likely Understates Title Revenues Due to Elevated Cash Sales Fannie Mae® Forecast

19 SISCO Organizational Structure SISCO STG STIC STL (UK) STG STC Mexico SLS Other Non-Title Title Offices
 Market
Conditions • Nine member Board of Directors is annually elected • Majority vote standard • Separate CEO and Chairman
of the Board • Seven of nine members of the Board are independent • Shareholders can call special meetings • Declawed
preferred stock • No supermajority requirements • Directors can be removed without cause • Dual class ownership
structure eliminated as of April 2016 20 Corporate Governance
Market
Conditions • Nine member Board of Directors is annually elected • Majority vote standard • Separate CEO and Chairman
of the Board • Seven of nine members of the Board are independent • Shareholders can call special meetings • Declawed
preferred stock • No supermajority requirements • Directors can be removed without cause • Dual class ownership
structure eliminated as of April 2016 20 Corporate Governance