Attached files
| file | filename |
|---|---|
| EX-32.2 - EX-32.2 - STEWART INFORMATION SERVICES CORP | h79965exv32w2.htm |
| EX-23.1 - EX-23.1 - STEWART INFORMATION SERVICES CORP | h79965exv23w1.htm |
| EX-21.1 - EX-21.1 - STEWART INFORMATION SERVICES CORP | h79965exv21w1.htm |
| EX-32.1 - EX-32.1 - STEWART INFORMATION SERVICES CORP | h79965exv32w1.htm |
| EX-31.3 - EX-31.3 - STEWART INFORMATION SERVICES CORP | h79965exv31w3.htm |
| EX-31.2 - EX-31.2 - STEWART INFORMATION SERVICES CORP | h79965exv31w2.htm |
| EX-32.3 - EX-32.3 - STEWART INFORMATION SERVICES CORP | h79965exv32w3.htm |
| EX-31.1 - EX-31.1 - STEWART INFORMATION SERVICES CORP | h79965exv31w1.htm |
Table of Contents
UNITED STATES
SECURITIES AND EXCHANGE COMMISSION
SECURITIES AND EXCHANGE COMMISSION
Washington, D.C. 20549
FORM 10-K
(Mark One)
| þ | ANNUAL REPORT PURSUANT TO SECTION 13 OR 15(d) OF THE SECURITIES EXCHANGE ACT OF 1934 |
For the fiscal year ended December 31, 2010
or
| o | TRANSITION REPORT PURSUANT TO SECTION 13 OR 15(d) OF THE SECURITIES EXCHANGE ACT OF 1934 |
For the transition period from __________ to __________
Commission file number 001-02658
STEWART INFORMATION SERVICES CORPORATION
(Exact name of registrant as specified in its charter)
| Delaware | 74-1677330 | |
| (State or other jurisdiction of | (I.R.S. Employer Identification No.) | |
| incorporation or organization) |
| 1980 Post Oak Blvd., Houston TX | 77056 | |
| (Address of principal executive offices) | (Zip Code) |
Registrant’s telephone number, including area code: (713) 625-8100
Securities registered pursuant to Section 12(b) of the Act:
| Common Stock, $1 par value | New York Stock Exchange | |
| (Title of each class of stock) | (Name of each exchange on which registered) |
Securities registered pursuant to Section 12(g) of the Act: None
Indicate by check mark if the registrant is a well-known seasoned issuer, as defined in Rule 405 of
the Securities Act. Yes o No þ
Indicate by check mark if the registrant is not required to file reports pursuant to Section 13 or
Section 15(d) of the Act. Yes o No þ
Indicate by check mark whether the registrant (1) has filed all reports required to be filed by
Section 13 or 15(d) of the Securities Exchange Act of 1934 during the preceding 12 months (or for
such shorter period that the registrant was required to file such reports), and (2) has been
subject to such filing requirements for the past 90 days. Yes þ No o
Indicate by check mark whether the registrant has submitted electronically and posted on its
corporate Web site, if any, every Interactive Data File required to be submitted and posted
pursuant to Rule 405 of Regulation S-T (§232.405 of this chapter) during the preceding 12 months
(or for such shorter period that the registrant was required to submit and post such files). Yes
o No o
Indicate by check mark if disclosure of delinquent filers pursuant to Item 405 of Regulation S-K is
not contained herein, and will not be contained, to the best of registrant’s knowledge, in
definitive proxy or information statements incorporated by reference in Part III of this Form 10-K
or any amendment to this Form 10-K. þ
Indicate by check mark whether the registrant is a large accelerated filer, an accelerated filer, a
non-accelerated filer, or a smaller reporting company. See the definitions of “large accelerated
filer,” “accelerated filer” and “smaller reporting company” in Rule 12b-2 of the Exchange Act.
(Check one):
Large accelerated filer o
|
Accelerated filer þ | Non-accelerated filer o | Smaller reporting company o | |||
| (Do not check if a smaller reporting company) |
Indicate by check mark whether the registrant is a shell company (as defined in Rule 12b-2 of the
Act). Yes o No þ
The aggregate market value of the Common Stock (based upon the closing sales price of the Common
Stock of Stewart Information Services Corporation, as reported by the NYSE on June 30, 2010) held
by non-affiliates of the Registrant was approximately $156,200,000.
At
March 3, 2011, the following shares of each of the registrant’s classes of stock were
outstanding:
Common, $1 par value |
17,986,026 | |||
Class B Common, $1 par value |
1,050,012 |
Documents Incorporated by Reference
Portions of the definitive proxy statement (the Proxy Statement), relating to the annual meeting of
the registrant’s stockholders to be held April 29, 2011, are incorporated by reference in Part III
of this document.
FORM 10-K ANNUAL REPORT
YEAR ENDED DECEMBER 31, 2010
TABLE OF CONTENTS
| Item | Page | |||||||
| 1 | ||||||||
| 6 | ||||||||
| 9 | ||||||||
| 10 | ||||||||
| 10 | ||||||||
| 12 | ||||||||
| 13 | ||||||||
| 15 | ||||||||
| 16 | ||||||||
| 31 | ||||||||
| 31 | ||||||||
| 32 | ||||||||
| 32 | ||||||||
| 32 | ||||||||
| 33 | ||||||||
| 33 | ||||||||
| 33 | ||||||||
| 34 | ||||||||
| 34 | ||||||||
| 35 | ||||||||
| 36 | ||||||||
| EX-21.1 | ||||||||
| EX-23.1 | ||||||||
| EX-31.1 | ||||||||
| EX-31.2 | ||||||||
| EX-31.3 | ||||||||
| EX-32.1 | ||||||||
| EX-32.2 | ||||||||
| EX-32.3 | ||||||||
As used in this report, “we,” “us,” “our,” the “Company” and “Stewart” mean Stewart
Information Services Corporation and our subsidiaries, unless the context indicates otherwise.
Table of Contents
PART I
Item 1. Business
We are a Delaware corporation formed in 1970. We and our predecessors have been engaged in the
title business since 1893.
Stewart is a customer-driven, technology-enabled, strategically competitive, real estate
information, title insurance and transaction management company. We provide title insurance and
related information services required for settlement by the real estate and mortgage industries
throughout the United States and in international markets. We also provide lender services, title
technology, foreign and domestic government services, mapping, title information, Internal Revenue
Code Section 1031 tax-deferred property exchanges, pre-employment services, online filing and
transaction management.
Our international division delivers products and services protecting and promoting private land
ownership worldwide. Currently, our primary international operations are in Canada, the United
Kingdom, Central Europe, Mexico, Central America and Australia.
Our two main operating segments of business are title insurance and related services and real
estate information (REI). These segments are closely related due to the nature of their operations
and common customers. The financial information related to these segments is discussed in Item 7
— Management’s Discussion and Analysis of Financial Condition and Results of Operations and Note
21 to our audited consolidated financial statements.
Title Insurance Services
Title insurance and related services (title segment) include the functions of searching, examining,
closing and insuring the condition of the title to real property.
Examination and closing. The purpose of a title examination is to ascertain the ownership
of the property being transferred, debts that are owed on it and the scope of the title policy
coverage. This involves searching for and examining documents such as deeds, mortgages, wills,
divorce decrees, court judgments, liens, paving assessments and tax records.
At the closing or “settlement” of a sale transaction, the seller executes and delivers a deed to
the new owner. The buyer typically signs new mortgage documents. Closing funds are then disbursed
to the seller, the prior lender, real estate brokers, the title company and others. The documents
are then recorded in the public records. A title insurance policy is generally issued to both the
new lender and the owner.
Title insurance policies. Lenders in the United States generally require title insurance
as a condition to making a loan on real estate, including securitized lending. This is to assure
lenders of the priority of their lien position. The purchasers of the property want insurance to
protect against claims that may arise against the title to the property. The face amount of the
policy is normally the purchase price or the amount of the related loan.
1
Table of Contents
Title insurance is substantially different from other types of insurance. Fire, auto, health and
life insurance protect against future losses and events. In contrast, title insurance insures
against losses from past events and seeks to protect the public by eliminating covered risks
through the examination and settlement process. Most other forms of insurance provide protection
for a limited period of time and, hence the policy must be periodically renewed. Title insurance,
however, is issued for a one-time premium and the policy provides protection for as long as the
owner owns the property or has liability in connection with the property. Also, a title insurance
policy does not have a finite contract term, whereas most other lines of insurance have a definite
beginning and ending date for coverage. Although a title insurance policy provides protection as
long as the owner owns the property being covered, the title insurance company generally does not
have information about which policies are still effective. Most other lines of insurance receive
periodic premium payments and policy renewals thereby allowing the insurance company to know which
policies are effective.
Investments in debt securities. Our title insurance underwriters maintain investments in
accordance with certain statutory requirements for the funding of statutory premium reserves and
state deposits. We have established policies and procedures to minimize our exposure to changes in
the fair values of our investments. These policies include retaining an investment advisory firm,
emphasizing credit quality, managing portfolio duration, maintaining or increasing investment
income and actively monitoring profile and security mix based upon market conditions. All of our
investments are classified as available-for-sale except for investments — pledged, which were
classified as trading securities.
Losses. Losses on policies occur when a title defect is not discovered during the
examination and settlement process. Reasons for losses include forgeries, misrepresentations,
unrecorded liens, the failure to pay off existing liens, mortgage lending fraud, mishandling or
defalcation of settlement funds, issuance by title agencies of unauthorized coverage and defending
insureds when covered claims are filed against their interest in the property.
Some claimants seek damages in excess of policy limits. Those claims are based on various legal
theories. We vigorously defend against spurious claims and provide protection for covered claims
up to policy limits. We have from time-to-time incurred losses in excess of policy limits.
Experience shows that most policy claims and claim payments are made in the first six years after
the policy has been issued, although claims are also incurred and paid many years later. By their
nature, claims are often complex, vary greatly in dollar amounts and are affected by economic and
market conditions and the legal environment existing at the time claims are processed.
Our liability for estimated title losses comprises both known claims and our estimate of claims
that may be reported in the future. The amount of our loss reserve represents the aggregate future
payments (net of recoveries) that we expect to incur on policy and escrow losses and in costs to
settle claims. In accordance with industry practice, these amounts have not been discounted to
their present values.
Estimating future title loss payments is difficult because of the complex nature of title claims,
the length of time over which claims are paid, the significantly varying dollar amounts of
individual claims and other factors. Estimated provisions for current year policy losses are
charged to income in the same year the related premium revenues are recognized. The amounts
provided for policy losses are based on reported claims, historical loss payment experience, title
industry averages and the current legal and economic environment. Actual loss payment experience
relating to policies issued in the current or previous years, including the impact of large losses,
is the primary reason for increases or decreases in our loss provision.
Amounts shown as our estimated liability for future loss payments are continually reviewed by us
for reasonableness and adjusted as appropriate. We have consistently followed the same basic
method of estimating and recording our loss reserves for more than 10 years. As part of our
process, we also obtain input from third-party actuaries regarding our methodology and resulting
reserve calculations. While we are responsible for determining our loss reserves, we utilize this
actuarial input to assess the overall reasonableness of our reserve estimation.
2
Table of Contents
Factors affecting revenues. Title insurance revenues are closely related to the level of
activity in the real estate markets we serve and the prices at which real estate sales are made.
Real estate sales are directly affected by the availability and cost of money to finance purchases.
Other factors include consumer confidence and demand by buyers. These factors may override the
seasonal nature of the title business. Generally, our first quarter is the least active and our
third and fourth quarters are the most active in terms of title insurance revenues.
Selected information from the U.S. Department of Housing and Urban Development and National
Association of Realtors® for the U.S. real estate industry follows (2010 figures are
preliminary and subject to revision):
| 2010 | 2009 | 2008 | ||||||||||
New home sales — in millions |
0.32 | 0.38 | 0.49 | |||||||||
Existing home sales — in millions |
4.91 | 5.16 | 4.91 | |||||||||
Existing home sales — median sales price in $ thousands |
172.9 | 172.5 | 198.1 | |||||||||
Customers. The primary sources of title insurance business are attorneys, builders,
developers, home buyers and home sellers, lenders and real estate brokers. No one customer was
responsible for as much as 10% or more of our consolidated revenues in any of the last three years.
Titles insured include residential and commercial properties, undeveloped acreage, farms, ranches
and water rights.
Service, location, financial strength, size and related factors affect customer acceptance.
Increasing market share is accomplished primarily by providing superior service. The parties to a
closing are concerned with personal schedules and the interest and other costs associated with any
delays in the settlement. The rates charged to customers are regulated, to varying degrees, in
many states.
The financial strength and stability of the title underwriter are important factors in maintaining
and increasing our agency network. We are rated as investment grade by the title industry’s
leading rating companies. Our principal underwriter, Stewart Title Guaranty Company (Guaranty) is
currently rated A” by Demotech, Inc., BBB+ by Fitch, B++ by A. M. Best and B- by Kroll Bond Rating
Agency (formerly LACE Financial).
Market share. Title insurance statistics are compiled quarterly by the title industry’s
national trade association. Based on 2010 unconsolidated statutory net premiums written through
September 30, 2010, Guaranty is one of the leading title insurers in the United States.
Our principal competitors are Fidelity National Financial, Inc., which includes Fidelity National
Title Insurance Company, Chicago Title Insurance Company and Commonwealth Land Title Insurance
Company, and The First American Corporation, which includes First American Title Insurance Company.
Like most title insurers, we also compete with abstractors, attorneys who issue title opinions and
attorney-owned title insurance funds. A number of homebuilders, financial institutions, real
estate brokers and others own or control title insurance agencies, some of which issue policies
underwritten by Guaranty. Although these controlled businesses may issue policies underwritten by
Guaranty, they also compete with our offices. We also compete with issuers of alternatives to
title insurance products, which typically provide no title reviews, limited insurance coverage and
less service on the transaction while charging a smaller fee.
3
Table of Contents
Title insurance revenues by geographic location. The approximate amounts and percentages
of our consolidated title operating revenues were:
| Amounts ($ millions) | Percentages | |||||||||||||||||||||||
| 2010 | 2009 | 2008 | 2010 | 2009 | 2008 | |||||||||||||||||||
Texas |
243 | 257 | 269 | 16 | 16 | 18 | ||||||||||||||||||
California |
201 | 181 | 141 | 13 | 11 | 9 | ||||||||||||||||||
New York |
136 | 122 | 134 | 9 | 8 | 9 | ||||||||||||||||||
International |
98 | 89 | 110 | 6 | 6 | 8 | ||||||||||||||||||
Florida |
71 | 73 | 81 | 5 | 5 | 5 | ||||||||||||||||||
All others |
802 | 900 | 775 | 51 | 54 | 51 | ||||||||||||||||||
| 1,551 | 1,622 | 1,510 | 100 | 100 | 100 | |||||||||||||||||||
Regulations. Title insurance companies are subject to comprehensive state regulations
covering premium rates, agency licensing, policy forms, trade practices, reserve requirements,
investments and the transfer of funds between an insurer and its parent or its subsidiaries and any
similar related party transactions. Kickbacks and similar practices are prohibited by most state
and federal laws.
Real Estate Information
Our real estate information (REI) segment includes a diverse group of products and services
provided to multiple markets. REI consists primarily of lender services, title technology, foreign
and domestic government services, mapping, title information, Internal Revenue Code Section 1031
tax-deferred property exchanges, pre-employment services, online filing and transaction management.
Stewart Lender Services (SLS) offers origination, loss mitigation, default, and post-closing
services to residential mortgage lenders, servicers and investors. Products include loan
modification, loan default and REO asset recovery services. Furthermore, SLS offers post-closing
outsourcing and servicing support for lenders.
The continual introduction of automation tools for affiliates and independent title agencies is an
important part of the current businesses and future growth of our REI companies.
PropertyInfo® Corporation, whose website is www.PropertyInfo.com, offers substantially
all technology that a title business requires through the use of web-based products and services.
PropertyInfo offers a production system, AIM+™, along with web-based search tools designed to
increase the processing speed of title examinations by connecting all aspects of the title
examination process to proprietary title information databases and to public land and court record
information sources. PropertyInfo offers title technology through web-based services by accessing
www.TitleWorkPlace.com, where a title officer can access the aforementioned products as well as
utilize Advanced Title Search and TitleSearch® Pro for the search, examination and
production of title reports, thus eliminating many steps and inefficiencies associated with
traditional courthouse searches.
Stewart Government Services offers indexing, imaging, eRecording and web access services to U.S.
courthouses, which increase efficiency while reducing costs to the public and businesses. Stewart
Global Solutions offers a land registry system, landfolio®, which automates integrated
land title registration, cadastre and property tax systems for foreign governments, along with
consulting on convergence process and title assurance.
Factors affecting revenues. As in the title segment, REI revenues, particularly those
generated by lender services and tax-deferred exchanges, are closely related to the level of
activity in the real estate market. Revenues related to many services are generated on a project
basis. Contracts for automating government recording and registration systems and mapping projects
are often awarded following competitive bidding processes or after responding to formal requests
for proposals.
4
Table of Contents
Companies that compete with our REI companies vary across a wide range of industries. In the
mortgage-related products and services area, competitors include the major title insurance
underwriters mentioned under “Title — Market share.” In some cases the competitor may be the
customer itself. For example, certain services offered by SLS can be, or historically have been,
performed by internal departments of large mortgage lenders.
Another important factor affecting our REI revenues is the advancement of technology, which permits
customers to order and receive timely status reports and final products and services through
dedicated interfaces with the customer’s production systems or over the Internet. The use of our
websites, including www.stewart.com and www.PropertyInfo.com, allows customers to
have easy access to solutions designed for their specific industry.
Customers. Customers for our REI products and services include mortgage lenders and
servicers, mortgage brokers, mortgage investors, government entities, commercial and residential
real estate agents, land developers, builders, title insurance agencies, and others interested in
obtaining property information (including data, images and aerial maps) that assist with the
purchase, sale and closing of real estate transactions and mortgage loans. Other customers include
accountants, attorneys, investors and others seeking services for their respective clients in need
of qualified intermediary (Section 1031) services and employers seeking information about
prospective employees. No one customer was responsible for as much as 10% or more of our
consolidated revenues in any of the last three years.
Many of the services and products offered by our REI segment are used by professionals and
intermediaries who have been retained to assist consumers with the sale, purchase, mortgage,
transfer, recording and servicing of real estate-related transactions. To that end, timely and
accurate services are critical to our customers since these factors directly affect the service
they provide to their customers. Financial strength, marketplace presence and reputation as a
technology innovator are important factors in attracting new business.
General
Internal Technology. Our production technology, collectively referred to as the Production
Engine, is increasing productivity in our core title business, while reducing the time involved in
the real estate closing process for lenders, real estate professionals and consumers. The
Production Engine includes four integrated technologies consisting of the following: the document
preparation system, AIM+; online file system, SureClose®; automated analysis system,
Automated Title Search (ATS); and ordering system, Stewart Orders. During the past two years, we
have substantially migrated production to our Regional Production Centers (RPC), where an order is
received electronically, the prior file is viewed, the history and documents are examined, a
commitment is prepared and a completed title insurance product is delivered. All of the above steps
reduce labor costs by improving accuracy and speeding delivery to customers.
SureClose, our transaction management platform, is the online file system which is used in
production and gives customers and consumers online access to their closing file for more
transparency of the transaction during the closing process. SureClose has allowed us to
substantially convert from paper to digital title files. SureClose also gives lenders, real estate
professionals and settlement service providers the ability to monitor the progress of the
transaction; view, print, exchange and download documents and information; and receive email and
automatic event notifications. Enhancing the seamless flow of the title order, SureClose is also
integrated with our AIM+ title production system. The final title and closing files are also
archived on SureClose to complete the paperless office process.
Our platform for electronic real estate closings, eClosingRoomTM, is the
industry’s first e-closing system and is integrated with SureClose.
We have substantially completed implementation of our enterprise resource planning system, which
has allowed us to consolidate our back-office operations into a centralized and shared services
environment,
aligning people, processes and technology for the purpose of providing better customer interaction
and reducing our cost structure.
5
Table of Contents
Trademarks. We have developed numerous automation products and processes that are crucial
to both our title and REI segments. These systems automate most facets of the real estate
transaction. Among these trademarked products and processes are AIM+™, E-Title®,
PropertyInfo®, SureClose®, TitleSearch®,
eClosingRoomTM and Virtual Underwriter®. We consider these
trademarks, which are perpetual in duration, to be important to our business.
Employees. As of December 31, 2010, we employed approximately 5,700 people. We consider
our relationship with our employees to be good.
Available information. We file annual, quarterly and other reports and information with
the Securities and Exchange Commission (SEC) under the Securities Exchange Act of 1934 (Exchange
Act). You may read and copy any material that we file with the SEC at the SEC’s Public Reference
Room at 100 F Street, NE, Washington, DC 20549. You may obtain additional information about the
Public Reference Room by calling the SEC at (800) SEC-0330. In addition, the SEC maintains an
Internet site (www.sec.gov) that contains reports, proxy and other information statements, and
other information regarding issuers that file electronically with the SEC.
We also make available upon written request, free of charge, or through our Internet site
(www.stewart.com), our annual reports on Form 10-K, quarterly reports on Form 10-Q, current reports
on Form 8-K, Code of Ethics and, if applicable, amendments to those reports filed or furnished
pursuant to Section 13(a) or 15(d) of the Exchange Act, as soon as reasonably practicable after we
electronically file such material with, or furnish it to, the SEC.
Transfer agent. Our transfer agent is BNY Mellon Shareowner Services, which is located at
480 Washington Blvd., Jersey City, NJ, 07310. Its phone number is (888) 478-2392 and website is
www.melloninvestor.com.
CEO and CFO Certifications. The CEO and CFO certifications required under Section 302 of
the Sarbanes-Oxley Act are filed as exhibits to our 2010 Form 10-K. Stewart Information Services
Corporation submitted a Section 12(a) CEO Certification to the New York Stock Exchange in 2010.
Item 1A. Risk Factors
You should consider the following risk factors, as well as the other information presented in this
report and our other filings with the SEC, in evaluating our business and any investment in
Stewart. These risks could materially and adversely affect our business, financial condition and
results of operations. In that event, the trading price of our Common Stock could decline
materially.
Adverse changes in the levels of real estate activity reduce our revenues.
Our financial condition and results of operations are affected by changes in economic conditions,
particularly mortgage interest rates, credit availability, real estate prices and consumer
confidence. Our revenues and earnings have fluctuated in the past and we expect them to fluctuate
in the future.
The demand for our title insurance-related and real estate information services depends in large
part on the volume of residential and commercial real estate transactions. The volume of these
transactions historically has been influenced by such factors as mortgage interest rates,
availability of financing and the overall state of the economy. Typically, when interest rates are
increasing or when the economy is experiencing a downturn, real estate activity declines. As a
result, the title insurance industry tends to experience decreased revenues and earnings.
Increases in interest rates also may have an adverse impact on our bond portfolio and the amount of
interest we pay on our floating-rate bank debt.
6
Table of Contents
Our revenues and results of operations have been and could continue to be adversely affected as a
result of the decline in home prices, real estate activity and the availability of financing
alternatives. In addition, continued weakness or further adverse changes in the level of real
estate activity could have a material adverse effect on our consolidated financial condition or
results of operations.
Our claims experience may require us to increase our provision for title losses or to record
additional reserves, either of which would adversely affect our earnings.
Estimating future loss payments is difficult, and our assumptions about future losses may prove
inaccurate. Provisions for policy losses on policies written within a given year are charged to
income in the same year the related premium revenues are recognized. The amounts provided are
based on reported claims, historical loss payment experience, title industry averages and the
current legal and economic environment. Losses that are higher than anticipated are an indication
that total losses for a given policy year may be higher than originally calculated. Changes in the
total estimated future loss for prior policy years are recorded in the period in which the estimate
changes. Claims are often complex and involve uncertainties as to the dollar amount and timing of
individual payments. Claims are often paid many years after a policy is issued. From
time-to-time, we experience large losses, including losses from independent agency defalcations,
from title policies that have been issued or worsening loss payment experience, any of which may
require us to increase our title loss reserves. These events are unpredictable and adversely
affect our earnings. Title loss reserves in 2010 increased due to $4.8 million in provisions for
strengthening policy loss reserves for policies issued in 2007 and 2008. Title loss reserves in
2009 increased $32.7 million from provisions for strengthening policy loss reserves for policies
issued in 2005, 2006 and 2007. The increases in title loss reserves in 2010 and 2009 were related
to higher than expected loss payments and incurred loss experience for their respective policy
years. The total strengthening charges for policy years 2007 through 2010 aggregated $77.0
million.
Competition in the title insurance industry affects our revenues.
Competition in the title insurance industry is intense, particularly with respect to price, service
and expertise. Larger commercial customers and mortgage originators also look to the size and
financial strength of the title insurer. Although we are one of the leading title insurance
underwriters based on market share, Fidelity National Financial, Inc. and The First American
Corporation each has substantially greater revenues than we do. Their holding companies have
significantly greater capital than we do. Although we are not aware of any current initiatives to
reduce regulatory barriers to entering our industry, any such reduction could result in new
competitors, including financial institutions, entering the title insurance business. Competition
among the major title insurance companies and any new entrants could lower our premium and fee
revenues. From time-to-time, new entrants enter the marketplace with alternative products to
traditional title insurance, although many of these alternative products have been disallowed by
title insurance regulators. These alternative products, if permitted by regulators, could
adversely affect our revenues and earnings.
Availability of credit may reduce our liquidity and negatively impact our ability to fund operating
losses or initiatives.
As a result of our recent operating losses and the current conditions in credit markets, we may not
be able to obtain, on acceptable terms, the financing necessary to fund our operations or
initiatives. However, we expect that cash flows from operations and cash available from our
underwriters, subject to regulatory restrictions, will be sufficient to fund our operations, pay
our claims and fund initiatives. To the extent that these funds are not sufficient, we may be
required to borrow funds on less favorable terms or seek funding from the equity market, which may
be on terms that are dilutive to existing shareholders.
7
Table of Contents
A downgrade of our underwriters by rating agencies may reduce our revenues.
Ratings are a significant component in determining the competitiveness of insurance companies. Our
principal insurance underwriting subsidiary, Guaranty, is currently rated by Demotech, Inc. (A”),
Fitch (BBB+), A. M. Best (B++) and Kroll Bond Rating Agency (formerly LACE Financial) (B-).
Guaranty has historically been highly rated by the rating agencies that cover us. These ratings
are not credit ratings. Instead, the ratings are based on quantitative, and in some cases
qualitative, information and reflect the conclusions of the rating agencies with respect to our
financial strength, results of operations and ability to pay policyholder claims. Our ratings are
subject to continual review by the rating agencies and we cannot be assured that our current
ratings will be maintained. If our ratings are downgraded from current levels by the rating
agencies, our ability to retain existing customers and develop new customer relationships may be
negatively impacted, which could result in an adverse impact on our results of operations.
Our insurance subsidiaries must comply with extensive government regulations. These regulations
could adversely affect our ability to increase our revenues and operating results.
Governmental authorities regulate our insurance subsidiaries in the various states and
international jurisdictions in which we do business. These regulations generally are intended for
the protection of policyholders rather than stockholders. The nature and extent of these
regulations vary from jurisdiction to jurisdiction, but typically involve:
| • | approving or setting of insurance premium rates; | ||
| • | standards of solvency and minimum amounts of statutory capital and surplus that must be maintained; | ||
| • | limitations on types and amounts of investments; | ||
| • | establishing reserves, including statutory premium reserves, for losses and loss adjustment expenses; | ||
| • | regulating underwriting and marketing practices; | ||
| • | regulating dividend payments and other transactions among affiliates; | ||
| • | prior approval for the acquisition and control of an insurance company or of any company controlling an insurance company; | ||
| • | licensing of insurers, agencies and, in certain states, escrow officers; | ||
| • | regulation of reinsurance; | ||
| • | restrictions on the size of risks that may be insured by a single company; | ||
| • | deposits of securities for the benefit of policyholders; | ||
| • | approval of policy forms; | ||
| • | methods of accounting; and | ||
| • | filing of annual and other reports with respect to financial condition and other matters. |
These regulations may impede or impose burdensome conditions on rate increases or other actions
that we might want to take to enhance our operating results. Changes in these regulations may also
adversely affect us. In addition, state regulators perform periodic examinations of insurance
companies, which could result in increased compliance or litigation expenses.
Rapid technological changes in our industry require timely and cost-effective responses. Our
earnings may be adversely affected if we are unable to effectively use technology to increase
productivity.
Technological advances occur rapidly in the title insurance industry as industry standards evolve
and title insurers introduce new products and services. We believe that our future success depends
on our ability to anticipate technological changes and to offer products and services that meet
evolving standards on a timely and cost-effective basis. Successful implementation and customer
acceptance of our technology-based services will be crucial to our future profitability. There is
a risk that the introduction of new products and services, or advances in technology, could reduce
the usefulness of our products and render them obsolete.
8
Table of Contents
We rely on dividends from our insurance underwriting subsidiaries.
We are a holding company and our principal assets are our insurance underwriting subsidiaries.
Consequently, we may depend on receiving sufficient dividends from our insurance subsidiaries to
meet our debt service obligations and to pay our operating expenses and dividends to our
stockholders. The insurance statutes and regulations of some states require us to maintain a
minimum amount of statutory capital and restrict the amount of dividends that our insurance
subsidiaries may pay to us. Guaranty is a wholly owned subsidiary of Stewart and the principal
source of our cash flow. In this regard, the ability of Guaranty to pay dividends to us is
dependent on the approval of the Texas Insurance Commissioner. As of December 31, 2010, under Texas
insurance law, Guaranty could pay dividends or make distributions of up to $73.9 million in 2010
after approval of the Texas Insurance Commissioner. However, Guaranty voluntarily restricts
dividends to us so that it can grow its statutory surplus, maintain liquidity at competitive levels
and maintain its high ratings. A title insurer’s ability to pay claims can significantly affect
the decision of lenders and other customers when buying a title insurance policy.
Litigation risks include claims by large classes of claimants.
We are periodically involved in litigation arising in the ordinary course of business. In
addition, we are currently, and have been in the past, subject to claims and litigation from large
classes of claimants seeking substantial damages not arising in the ordinary course of business.
Material pending legal proceedings, if any, not in the ordinary course of business, are disclosed
in Item 3 — Legal Proceedings included elsewhere in this report. To date, the impact of the
outcome of these proceedings has not been material to our consolidated financial condition or
results of operations. However, an unfavorable outcome in any litigation, claim or investigation
against us could have an adverse effect on our consolidated financial condition or results of
operations.
Anti-takeover provisions in our certificate of incorporation and by-laws may make a takeover of us
difficult. This may reduce the opportunity for our stockholders to obtain a takeover premium for
their shares of our Common Stock.
Our certificate of incorporation and by-laws, as well as Delaware corporation law and the insurance
laws of various states, all contain provisions that could have the effect of discouraging a
prospective acquirer from making a tender offer for our shares, or that may otherwise delay, defer
or prevent a change in control of Stewart.
The holders of our Class B Common Stock have the right to elect four of our nine directors.
Pursuant to our by-laws, the vote of six directors is required to constitute an act by the Board of
Directors. Accordingly, the affirmative vote of at least one of the directors elected by the
holders of the Class B Common Stock is required for any action to be taken by the Board of
Directors. The foregoing provision of our by-laws may not be amended or repealed without the
affirmative vote of at least a majority of the outstanding shares of each class of our capital
stock, voting as separate classes.
The voting rights of the holders of our Class B Common Stock may have the effect of rendering more
difficult or discouraging unsolicited tender offers, merger proposals, proxy contests or other
takeover proposals to acquire control of Stewart.
Item 1B. Unresolved Staff Comments
None.
9
Table of Contents
Item 2. Properties
We lease under a non-cancelable lease expiring in 2016 approximately 258,000 square feet in an
office building in Houston, Texas, which is used for our corporate offices and for offices of
several of our subsidiaries. In addition, we lease offices at approximately 420 additional
locations that are used for branch offices and technology centers. These additional locations
include significant leased facilities in Dallas, Denver, Los Angeles, New York, San Diego and
Toronto.
Our leases expire from 2011 through 2018 and have an average term of four years, although our
typical lease term ranges from three to five years. We believe we will not have any difficulty
obtaining renewals of leases as they expire or, alternatively, leasing comparable properties. The
aggregate annual rent expense under all leases was approximately $45.2 million in 2010.
We also own several office buildings located in Arizona, Colorado, New York and Texas. These owned
properties are not material to our consolidated financial condition. We consider all buildings and
equipment that we own or lease to be well maintained, adequately insured and generally sufficient
for our purposes.
Item 3. Legal Proceedings
Stewart Title Guaranty Company (STGC) and Stewart Title Guaranty
de Mexico, S.A. de C.V. (STGM) are defendants in a lawsuit pending in
the State District Court of Harris County, Texas, Citigroup Global Markets Realty Corp. v. Stewart Title Guaranty Company. The
lawsuit was filed in 2008 and concerns 16 owners’ and 16 lenders’ title insurance policies on 16
parcels of land in Mexico issued by Stewart Title Guaranty de Mexico, S.A. de C.V. (STGM) and
reinsurance agreements by STGC. Citigroup Global Markets Realty Corp. asserted claims against STGC
under reinsurance of the lenders’ policies. Thereafter, K.R. Playa VI, S de R.L. de C.V., the
owner of the parcels, asserted claims against STGC and under the
owners’ policies. In the second quarter of 2010, the State
District Court ruled that it had jurisdiction over STGM and denied STGM’s plea in
abatement
requesting a stay of the lawsuit in Harris County pending a determination of the Mexican courts.
The lawsuit alleges breach of contract, deceptive trade practices, bad faith,
and violations of the
Texas Insurance Code, against which both STGC and STGM are vigorously
defending.
Additionly, we believe that certain of the allegations are
controlled by Mexican law, which differs substantially from the law of
the State of Texas. A jury
trial began February 15, 2011. Due to the complex factual and
legal issues, including those
involving Mexican law, it is not possible to reasonably estimate the ultimate outcome of this
litigation or determine whether that outcome would materially affect our consolidated financial
condition or results of operations.
10
Table of Contents
In January 2009, an action was filed by individuals against Stewart Title Guaranty Company, Stewart
Title of California, Inc., Cuesta Title Company and others in the Superior Court of California for
the County of San Luis Obispo alleging that the plaintiffs have suffered damages relating to loans
they made through Hurst Financial Corporation to an individual named Kelly Gearhart and entities
controlled by Gearhart. Thereafter, several other lawsuits making similar allegations, including a
lawsuit filed by several hundred individuals, were filed in San Luis Obispo Superior Court, and one
such lawsuit was removed to the United States District Court for the Central District of
California. The defendants vary from case to case but Stewart Information Services Corporation,
Stewart Title Company and Stewart Title Insurance Company have also been sued in at least one of
the cases. Each of the complaints alleges some combination of the following purported causes of
action: breach of contract, negligence, fraud, aiding and abetting fraud, constructive fraud,
breach of fiduciary duty, breach of implied covenant of good faith and fair dealing, financial
elder abuse, violation of California Business and Professions Code Section 17200, negligent
misrepresentation, conversion, conspiracy, alter ego, specific performance and declaratory relief.
We have demurred to or moved to dismiss the complaints in the actions where responses to the
complaints have been due. Although the San Luis Obispo Superior Court has sustained demurrers to
certain causes of action and certain individuals and entities and dismissed us from one case
without leave to amend, the Court has overruled the demurrers as to other causes of action. The
United States District Court for the Central District of California granted our motion to dismiss
the First Amended Complaint as to the claim for violation of the Racketeer Influenced and Corrupt
Organizations Act, with prejudice, and remanded the remainder of the case to the San Luis Obispo
Superior Court. Discovery has commenced. Several of the cases were
the subject of a court-ordered mediation on February 21-22, 2011. The
mediation was adjourned without reaching a settlement, but the
mediation process remains open, at the suggestion of the mediator,
and may be resumed. No trial dates have been set. We intend to vigorously defend ourselves
against the allegations and do not believe that the outcome of these matters will materially affect
our consolidated financial condition or results of operations.
In February 2008, an antitrust class action was filed in the United States District Court for the
Eastern District of New York against Stewart Title Insurance Company, Monroe Title Insurance
Corporation, Stewart Information Services Corporation, several other unaffiliated title insurance
companies and the Title Insurance Rate Service Association, Inc. (TIRSA). The complaint alleges
that the defendants violated Section 1 of the Sherman Antitrust Act by collectively filing proposed
rates for title insurance in New York through TIRSA, a state-authorized and licensed rate service
organization.
Complaints were subsequently filed in the United States District Courts for the Eastern and
Southern Districts of New York and in the United States District Courts in Pennsylvania, New
Jersey, Ohio, Florida, Massachusetts, Arkansas, California, Washington, West Virginia, Texas and
Delaware. All of the complaints make similar class action allegations, except that certain of the
complaints also allege violations of the Real Estate Settlement Procedures Act (RESPA) and various
state antitrust and consumer protection laws. The complaints generally request treble damages in
unspecified amounts, declaratory and injunctive relief and attorneys’ fees. To date, 78 such
complaints have been filed, each of which names us and/or one or more of our affiliates as a
defendant (and have been consolidated in the aforementioned states), of which seven have been
voluntarily dismissed.
As of February 3, 2011, we have obtained dismissals of the claims in Arkansas, California,
Delaware, Florida, Massachusetts, New Jersey, New York, Ohio, Pennsylvania (where the court
dismissed the damages claims and granted defendants summary judgment on the injunctive claims),
Texas and Washington. We filed a motion to dismiss in West Virginia (where all proceedings have
been stayed and the docket closed). The plaintiffs have appealed the dismissal in Ohio to the
United States Court of Appeals for the Sixth Circuit and the dismissals in Delaware, New Jersey and
Pennsylvania to the United States Court of Appeals for the Third Circuit. The dismissals in New
York and Texas have been affirmed by the United States Courts of Appeals for the Second and Fifth
Circuits, respectively, and on October 4, 2010, the United States Supreme Court denied the
plaintiffs’ petitions for review of those decisions. The plaintiffs have appealed to the Second
Circuit the dismissal of the RESPA claims by the court in New York. Although we cannot predict the
outcome of these actions, we intend to vigorously defend ourselves against the allegations and do
not believe that the outcome will materially affect our consolidated financial condition or results
of operations.
11
Table of Contents
We are also subject to other claims and lawsuits arising in the ordinary course of our business,
most of which involve disputed policy claims. In some of these lawsuits, the plaintiff seeks
exemplary or treble damages in excess of policy limits. We do not expect that any of these
proceedings will have a material adverse effect on our consolidated financial condition or results
of operations. Along with the other major title insurance companies, we are party to a number of
class action lawsuits concerning the title insurance industry. We believe that we have adequate
reserves for the various litigation matters and contingencies discussed above and that the likely
resolution of these matters will not materially affect our consolidated financial condition or
results of operations.
We are subject to administrative actions and litigation relating to the basis on which premium
taxes are paid in certain states. Additionally, we have received various other inquiries from
governmental regulators concerning practices in the insurance industry. Many of these practices do
not concern title insurance. We believe that we have adequately reserved for these matters and do
not anticipate that the outcome of these inquiries will materially affect our consolidated
financial condition or results of operations.
We are also subject to various other administrative actions and inquiries into our business conduct
in certain of the states in which we operate. While we cannot predict the outcome of the various
regulatory and administrative matters, we believe that we have adequately reserved for these
matters and do not anticipate that the outcome of any of these matters will materially affect our
consolidated financial condition or results of operations.
Item 4. Submission of Matters to a Vote of Security Holders
None.
12
Table of Contents
PART II
| Item 5. | Market for Registrant’s Common Equity, Related Stockholder Matters and Issue Purchases of Equity Securities |
Our Common Stock is listed on the New York Stock Exchange (NYSE) under the symbol “STC”. The
following table sets forth the high and low sales prices of our Common Stock for each fiscal period
indicated, as reported by the NYSE.
| High | Low | |||||||
2010: |
||||||||
First quarter |
$ | 14.46 | $ | 10.26 | ||||
Second quarter |
14.93 | 8.88 | ||||||
Third quarter |
11.44 | 7.80 | ||||||
Fourth quarter |
12.12 | 10.18 | ||||||
2009: |
||||||||
First quarter |
$ | 23.75 | $ | 11.47 | ||||
Second quarter |
23.31 | 13.45 | ||||||
Third quarter |
16.65 | 11.87 | ||||||
Fourth quarter |
12.60 | 8.45 | ||||||
As of February 25, 2011, the number of stockholders of record was approximately 6,400 and the
price of one share of our Common Stock was $11.10.
The Board of Directors declared an annual cash dividend of $0.05 and $0.05 per share payable
December 29, 2010 and December 23, 2009, respectively, to Common stockholders of record on December
16, 2010 and December 24, 2009, respectively. Our certificate of incorporation provides that no
cash dividends may be paid on our Class B Common Stock.
We had a book value per share of $24.40 and $25.34 at December 31, 2010 and 2009, respectively.
As of December 31, 2010, book value per share was based on approximately $448.3 million in
stockholders’ equity and 18,375,058 shares of Common and Class B Common Stock outstanding. As of
December 31, 2009, book value per share was based on approximately $462.1 million in stockholders’
equity and 18,231,781 shares of Common and Class B Common Stock outstanding, excluding the effects
of possible conversion of senior convertible notes into common shares.
13
Table of Contents
Performance graph
The following graph compares the yearly percentage change in our cumulative total stockholder
return on Common Stock with the cumulative total return of the Russell 2000 Index and the Russell
2000 Financial Services Sector Index for the five years ended December 31, 2010. The graph assumes
that the value of the investment in our Common Stock and each index was $100 at December 31, 2005
and that all dividends were reinvested.
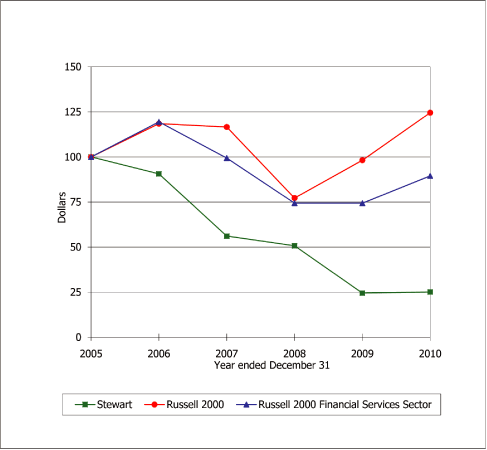
| 2005 | 2006 | 2007 | 2008 | 2009 | 2010 | |||||||||||||||||||||||||||
Stewart |
100.00 | 90.63 | 56.10 | 50.73 | 24.47 | 25.12 | ||||||||||||||||||||||||||
Russell 2000 |
100.00 | 118.44 | 116.60 | 77.20 | 98.18 | 124.54 | ||||||||||||||||||||||||||
Russell 2000 Financial Services Sector |
100.00 | 119.45 | 99.38 | 74.42 | 74.36 | 89.50 | ||||||||||||||||||||||||||
The performance graph above and the related information shall not be deemed “soliciting material”
or to be “filed” with the SEC, nor shall such information be incorporated by reference into any
future filing under the Securities Act of 1933 or the Securities Exchange Act of 1934, except to
the extent that the Company specifically incorporates it by reference into such filing.
14
Table of Contents
Item 6. Selected Financial Data
The following table sets forth selected consolidated financial data, which were derived from our
consolidated financial statements and should be read in conjunction with our audited consolidated
financial statements, including the Notes thereto, beginning on page F-1 of this Report. See also
Item 7 — Management’s Discussion and Analysis of Financial Condition and Results of Operations.
| 2010 | 2009 | 2008 | 2007 | 2006 | 2005 | 2004 | 2003 | 2002 | 2001 | |||||||||||||||||||||||||||||||
| ($ millions, except share and per share data) | ||||||||||||||||||||||||||||||||||||||||
Total revenues |
1,672.4 | 1,707.3 | 1,555.3 | 2,106.7 | 2,471.5 | 2,430.6 | 2,176.3 | 2,239.0 | 1,777.9 | 1,271.6 | ||||||||||||||||||||||||||||||
Title segment: |
||||||||||||||||||||||||||||||||||||||||
Operating revenues |
1,551.0 | 1,622.2 | 1,509.9 | 1,988.1 | 2,350.7 | 2,314.0 | 2,081.8 | 2,138.2 | 1,683.1 | 1,187.5 | ||||||||||||||||||||||||||||||
Investment income |
18.4 | 20.8 | 29.1 | 36.1 | 34.9 | 29.1 | 22.5 | 19.8 | 20.7 | 19.9 | ||||||||||||||||||||||||||||||
Investment gains (losses) |
21.8 | 7.4 | (28.2 | ) | 13.3 | 4.7 | 5.0 | 3.1 | 2.3 | 3.0 | 0.4 | |||||||||||||||||||||||||||||
Total revenues |
1,591.2 | 1,650.4 | 1,510.8 | 2,037.5 | 2,390.3 | 2,348.1 | 2,107.4 | 2,160.3 | 1,706.8 | 1,207.8 | ||||||||||||||||||||||||||||||
Pretax (loss) earnings(1) |
(29.9 | ) | (73.3 | ) | (222.3 | ) | (57.2 | ) | 83.2 | 154.4 | 143.1 | 200.7 | 153.8 | 82.5 | ||||||||||||||||||||||||||
REI segment: |
||||||||||||||||||||||||||||||||||||||||
Revenues |
81.2 | 56.9 | 44.5 | 69.2 | 81.2 | 82.5 | 68.9 | 78.7 | 71.1 | 63.8 | ||||||||||||||||||||||||||||||
Pretax earnings (loss)(1) |
32.8 | 11.1 | (15.2 | ) | 5.3 | 1.3 | 10.6 | 3.6 | 12.3 | 9.0 | 5.5 | |||||||||||||||||||||||||||||
Title loss provisions |
148.4 | 182.8 | 169.4 | 168.5 | 141.6 | 128.1 | 100.8 | 94.8 | 75.9 | 51.5 | ||||||||||||||||||||||||||||||
% title operating revenues |
9.6 | 11.3 | 11.2 | 8.5 | 6.0 | 5.5 | 4.8 | 4.4 | 4.5 | 4.3 | ||||||||||||||||||||||||||||||
Pretax earnings (loss)(1) |
2.9 | (62.2 | ) | (237.5 | ) | (51.9 | ) | 84.5 | 165.0 | 146.7 | 213.0 | 162.8 | 88.0 | |||||||||||||||||||||||||||
Net (loss) earnings attributable to Stewart |
(12.6 | ) | (51.0 | ) | (247.5 | ) | (40.2 | ) | 43.3 | 88.8 | 82.5 | 123.8 | 94.5 | 48.7 | ||||||||||||||||||||||||||
Cash provided (used) by operations |
41.2 | (17.0 | ) | (104.8 | ) | 4.6 | 105.1 | 174.4 | 170.4 | 190.1 | 162.6 | 108.2 | ||||||||||||||||||||||||||||
Total assets |
1,141.2 | 1,369.2 | 1,448.4 | 1,442.0 | 1,458.2 | 1,361.2 | 1,193.4 | 1,031.9 | 844.0 | 677.9 | ||||||||||||||||||||||||||||||
Long-term debt |
71.2 | 67.8 | 71.3 | 82.4 | 92.5 | 70.4 | 39.9 | 17.3 | 7.4 | 7.0 | ||||||||||||||||||||||||||||||
Stockholders’ equity |
448.3 | 462.1 | 501.2 | 769.8 | 819.5 | 785.0 | 711.8 | 634.6 | 504.5 | 403.8 | ||||||||||||||||||||||||||||||
Per share data: |
||||||||||||||||||||||||||||||||||||||||
Average shares — dilutive (millions) |
18.3 | 18.2 | 18.1 | 18.2 | 18.3 | 18.2 | 18.2 | 18.0 | 17.8 | 16.3 | ||||||||||||||||||||||||||||||
Basic (loss) earnings attributable to Stewart |
(0.69 | ) | (2.80 | ) | (13.68 | ) | (2.21 | ) | 2.37 | 4.89 | 4.56 | 6.93 | 5.33 | 3.01 | ||||||||||||||||||||||||||
Diluted (loss) earnings attributable to Stewart |
(0.69 | ) | (2.80 | ) | (13.68 | ) | (2.21 | ) | 2.36 | 4.86 | 4.53 | 6.88 | 5.30 | 2.98 | ||||||||||||||||||||||||||
Cash dividends |
0.05 | 0.05 | 0.10 | 0.75 | 0.75 | 0.75 | 0.46 | 0.46 | — | — | ||||||||||||||||||||||||||||||
Stockholders’ equity |
24.40 | 25.34 | 27.63 | 42.69 | 44.95 | 43.24 | 39.28 | 35.21 | 28.98 | 22.83 | ||||||||||||||||||||||||||||||
Market price: |
||||||||||||||||||||||||||||||||||||||||
High |
14.93 | 23.75 | 36.42 | 45.05 | 54.85 | 53.01 | 47.60 | 41.45 | 22.50 | 22.25 | ||||||||||||||||||||||||||||||
Low |
7.80 | 8.45 | 5.67 | 24.61 | 32.87 | 34.70 | 31.14 | 20.76 | 15.05 | 15.80 | ||||||||||||||||||||||||||||||
Year end |
11.53 | 11.28 | 23.49 | 26.09 | 43.36 | 48.67 | 41.65 | 40.55 | 21.39 | 19.75 | ||||||||||||||||||||||||||||||
| (1) | Pretax figures are before noncontrolling interests |
15
Table of Contents
| Item 7. | Management’s Discussion and Analysis of Financial Condition and Results of Operations |
MANAGEMENT’S OVERVIEW
We reported a net loss attributable to Stewart of $12.6 million for the year ended December 31,
2010 compared to a net loss attributable to Stewart of $51.0 million for 2009. On a basic and
diluted per share basis, our net loss attributable to Stewart was $0.69 for the year ended December
31, 2010 compared to a net loss attributable to Stewart of $2.80 for 2009.
Earnings before taxes and noncontrolling interests were $2.9 million for 2010 compared to a loss
before taxes and noncontrolling interests of $62.2 million in 2009, which is an increase of $65.1
million, or 104.7%. Cash flow from operations for 2010 improved by $58.1 million compared to 2009.
Our
combined direct and REI operations posted a pretax profit for the full year. In the REI segment, we
focused on increasing revenues from existing major product offerings (such as loan loss mitigation
solutions, distressed borrower contact services and loan servicing support) and also from expanding
services into short sale support and REO (Real Estate Owned) solutions, county government support
services and international land record enhancement. With the goal of driving additional revenues
and supporting the evolving lending and real estate markets, we continue to develop innovative new
services in the REI segment to drive additional revenues to these high margin operations.
Revenues from direct operations declined 6.0% for the year 2010 compared to 2009. As long term
rates began to rise and refinance transactions declined, closed title orders declined 18.1% for
2010 compared to 2009. Agency revenues decreased 3.3% in 2010 compared to 2009. Revenue per
closed order for the year increased 14.9% from the previous year as our business mix shifted to
include more commercial and sale transactions and fewer refinance transactions. Agency revenues
represented 59.0% of total title revenues for the year. Declines in our revenues from direct
operations were somewhat offset by growth in our international and commercial businesses, which
were up 20.2% and 25.3%, respectively, for the year 2010 compared to 2009.
Our Regional Production Centers now account for 65% of all affiliated title searches and
commitments for our direct title business, up from 47% in December 2009. In addition to reducing
costs, we expect the improved utilization of our most skilled people in these centers to reduce
claims related to the search and examination process.
Losses from title policy claims decreased 18.8% for the year 2010 compared to 2009. We recorded a
$4.8 million reserve strengthening charge in 2010 relating primarily to policy years 2007 and 2008
due to continuing adverse claims development for those policy years. This adverse experience also
resulted in an increase in the loss provision related to revenues recognized on policies issued in
2010, and, accordingly, a $2.6 million catch-up adjustment was recorded in 2010. For the years
2010 and 2009, title losses as a percentage of title revenues were 9.6% and 11.3%, respectively.
Charges related to reserve strengthening, including large losses and defalcations, fell 71%, from
$52.6 million in 2009 to $15.3 million in 2010. We had no agency defalcation losses exceeding $1.0
million in the fourth quarter 2010 and only five such claims reported (averaging less than $1.5
million each) in the previous six quarters. Excluding the impact of the reserve strengthening
charges, large losses, and defalcations (net of recoveries) in both years, title losses were 8.6%
of title revenues in 2010 and 8.0% in 2009.
Cash claims payments remained elevated for the year 2010, and consequently, we have maintained a
relatively high provisioning rate for title losses. Nonetheless, we believe we are on track to
return to a normal loss ratio by the end of 2012. Losses incurred on known claims in 2010
decreased 15.7% compared to 2009. The loss ratio on known claims from the independent agencies
cancelled in recent years was 9.2% in 2010 while the loss ratio on the current independent agency
network was 2.9%. More than 70% of independent agency claim payments were for agencies cancelled
in recent years.
16
Table of Contents
CRITICAL ACCOUNTING ESTIMATES
Actual results can differ from our accounting estimates.
While we do not anticipate significant changes in our estimates, there is a risk that such changes
could have a material impact on our consolidated financial condition or results of operations for
future periods.
Title loss reserves
Our most critical accounting estimate is providing for title loss reserves. Our liability for
estimated title losses as of December 31, 2010 comprises both known claims ($144.2 million) and our
estimate of claims that may be reported in the future ($351.6 million). The amount of the reserve
represents the aggregate future payments (net of recoveries) that we expect to incur on policy and
escrow losses and in costs to settle claims.
Provisions for title losses, as a percentage of title operating revenues, were 9.6%, 11.3% and
11.2% for the years ended December 31, 2010, 2009 and 2008, respectively. Actual loss payment
experience, including the impact of large losses, is the primary reason for increases or decreases
in our loss provision. A change of 100 basis points in this percentage, a reasonably likely
scenario based on our historical loss experience, would have increased or decreased our provision
for title losses and pretax operating results approximately $15.5 million for the year ended
December 31, 2010.
Our method for recording the reserves for title losses on both an interim and annual basis begins
with the calculation of our current loss provision rate, which is applied to our current premiums
resulting in a title loss expense for the period. This loss provision rate is set to provide for
losses on current year policies and is determined using moving average ratios of recent actual
policy loss payment experience (net of recoveries) to premium revenues.
At each quarter end, our recorded reserve for title losses begins with the prior period’s reserve
balance for claim losses, adds the current period provision to that balance and subtracts actual
paid claims, resulting in an amount that our management compares to its actuarially-based
calculation of the ending reserve balance to provide for future title losses. The
actuarially-based calculation is a paid loss development calculation where loss development factors
are selected based on company data and input from our third-party actuaries. We also obtain input
from third-party actuaries in the form of a reserve analysis utilizing generally accepted actuarial
methods. While we are responsible for determining our loss reserves, we utilize this actuarial
input to assess the overall reasonableness of our reserve estimation. If our recorded reserve
amount is within a reasonable range (+/- 3.0%) of our actuarially-based reserve calculation and the
actuary’s point estimate, but not at the point estimate, our management assesses the major factors
contributing to the different reserve estimates in order to determine the overall reasonableness of
our recorded reserve, as well as the position of the recorded reserves relative to the point
estimate and the estimated range of reserves. The major factors considered can change from period
to period and include items such as current trends in the real estate industry (which management
can assess although there is a time lag in the development of this data for use by the actuary),
the size and types of claims reported and changes in our claims management process. If the
recorded amount is not within a reasonable range of our third-party actuary’s point estimate, we
will adjust the recorded reserves in the current period and reassess the provision rate on a
prospective basis. Once our reserve for title losses is recorded, it is reduced in future periods
as a result of claims payments and may be increased or reduced by revisions to our estimate of the
overall level of required reserves.
17
Table of Contents
Large claims (those exceeding $1.0 million on a single claim), including large title losses due to
independent agency defalcations, are analyzed and reserved for separately due to the higher dollar
amount of loss, lower volume of claims reported and sporadic reporting of such claims. Large title
losses due to independent agency defalcations typically occur when the independent agency
misappropriates funds from escrow accounts under its control. Such losses are usually discovered
when the independent agency fails to pay off an outstanding mortgage loan at closing (or
immediately thereafter) from the proceeds of the new loan. Once the previous lender determines
that its loan has not been paid off timely, it will file a claim against the title insurer. It is
at this point that the title insurance underwriter is alerted to the potential theft and begins its
investigation. As is industry practice, these claims are considered a claim on the newly issued
title insurance policy since such policy insures the holder (in this case, the new lender) that all
previous liens on the property have been satisfied. Accordingly, these claim payments are charged
to policy loss expense. These incurred losses are typically more severe in terms of dollar value
compared with traditional title policy claims since the independent agency is often able, over
time, to conceal misappropriation of escrow funds relating to more than one transaction through the
constant volume of funds moving through its escrow accounts. As long as new funds continue to flow
into escrow accounts, an independent agency can mask one or more defalcations. In declining real
estate markets, lower transaction volumes result in a lower incoming volume of funds, making it
more difficult to cover up the misappropriation with incoming funds. Thus, when the defalcation is
discovered, it often relates to several transactions. In addition, the overall decline in an
independent agency’s revenues, profits and cash flows increases the agency’s incentive to
improperly utilize the escrow funds from real estate transactions.
Internal controls relating to independent agencies include, but are not limited to, pre-signing and
periodic audits, site visits and reconciliations of policy inventories and premiums. The audits
and site visits cover examination of the escrow account bank reconciliations and an examination of
a sample of closed transactions. In some instances, we are limited in our scope by attorney
agencies who cite client confidentiality. Certain states have mandated a requirement for annual
reviews of all agencies by their underwriter. We also determine whether our independent agencies
have appropriate internal controls as defined by the American Land Title Association and us.
However, even with adequate internal controls in place, their effectiveness can be circumvented by
collusion or improper management override at the independent agencies. To aid in the selection of
independent agencies to review, we have developed an agency risk model that aggregates data from
different areas to identify possible problems. This is not a guarantee that all independent
agencies with deficiencies will be identified. In addition, we are typically not the only
underwriter for which an independent agency issues policies, and independent agencies may not
always provide complete financial records for our review.
Due to the inherent uncertainty in predicting future title policy losses, significant judgment is
required by both our management and our third party actuaries in estimating reserves. As a
consequence, our ultimate liability may be materially greater or less than current reserves and/or
our third party actuary’s calculated estimate.
Agency revenues
We recognize revenues on title insurance policies written by independent agencies (agencies) when
the policies are reported to us. In addition, where reasonable estimates can be made, we accrue
for revenues on policies issued but not reported until after period end. We believe that
reasonable estimates can be made when recent and consistent policy issuance information is
available. Our estimates are based on historical reporting patterns and other information about
our agencies. We also consider current trends in our direct operations and in the title industry.
In this accrual, we are not estimating future transactions. We are estimating revenues on policies
that have already been issued by agencies but not yet reported to or received by us. We have
consistently followed the same basic method of estimating unreported policy revenues for more than
10 years.
18
Table of Contents
Our accruals for revenues on unreported policies from agencies were not material to our
consolidated assets or stockholders’ equity as of December 31, 2010 and 2009. The differences
between the amounts our agencies have subsequently reported to us compared to our estimated
accruals are substantially offset by any differences arising from prior years’ accruals and have
been immaterial to consolidated assets and stockholders’ equity during each of the three prior
years. We believe our process provides the most reliable estimate of the unreported revenues on
policies and appropriately reflects the trends in agency policy activity.
Goodwill and other long-lived assets
Our evaluation of goodwill is normally completed annually in the third quarter using June 30
balances, but an evaluation may also be made whenever events may indicate impairment. This
evaluation is based on a combination of a discounted cash flow analysis (DCF) and market approaches
that incorporate market multiples of comparable companies and our own market capitalization. The
DCF model utilizes historical and projected operating results and cash flows, initially driven by
estimates of changes in future revenue levels, and risk-adjusted discount rates. Our projected
operating results are primarily driven by anticipated mortgage originations, which we obtain from
projections by industry experts. Fluctuations in revenues, followed by our ability to
appropriately adjust our employee count and other operating expenses, are the primary reasons for
increases or decreases in our projected operating results. Our market-based valuation
methodologies utilize (i) market multiples of earnings and/or other operating metrics of comparable
companies and (ii) our market capitalization and a control premium based on market data and factors
specific to our ownership and corporate governance structure (such as our Class B Common Stock).
To the extent that our future operating results are below our projections, or in the event of
continued adverse market conditions, an interim review for impairment may be required, which may
result in an impairment of goodwill.
We evaluate goodwill based on two reporting units (Title and REI). Goodwill is assigned to these
reporting units at the time the goodwill is initially recorded. Once assigned to a reporting unit,
the goodwill is pooled and no longer attributable to a specific acquisition. All activities within
a reporting unit are available to support the carrying value of the goodwill.
We also evaluate the carrying values of title plants and other long-lived assets when events occur
that may indicate impairment. The process of determining impairment for our goodwill and other
long-lived assets relies on projections of future cash flows, operating results, discount rates and
overall market conditions, including our market capitalization. Uncertainties exist in these
projections and they are subject to changes relating to factors such as interest rates and overall
real estate and financial market conditions, our market capitalization and overall stock market
performance. Actual market conditions and operating results may vary materially from our
projections.
Based on this evaluation, we estimate and expense to current operations any loss in value of these
assets. As part of our process, we obtain input from third-party appraisers regarding the fair
value of our reporting units. While we are responsible for assessing whether an impairment of
goodwill exists, we utilize the input from third-party appraisers to assess the overall
reasonableness of our conclusions. There were no impairment charges for goodwill or material
impairment charges for other long-lived assets during 2010 or 2009. In June 2008, the Company’s
REI segment incurred an impairment charge of $6.0 million, which is included in depreciation and
amortization in our consolidated statement of operations, related to internally developed software
that we subsequently determined will not be deployed into production.
Operations. Our business has two main operating segments: title insurance-related services and
real estate information (REI). These segments are closely related due to the nature of their
operations and common customers.
19
Table of Contents
Our primary business is title insurance and settlement-related services. We close transactions and
issue title policies on homes and commercial and other real properties located in all 50 states,
the District of Columbia and international markets through policy-issuing offices and agencies. We
also provide electronic delivery of data, products and services related to real estate and mortgage
services, loss mitigation, default services, post-closing services, automated county clerk land
records, property ownership mapping, geographic information systems, property information reports,
document preparation, background checks and expertise in Internal Revenue Code Section 1031
tax-deferred property exchanges.
Factors affecting revenues. The principal factors that contribute to changes in operating revenues
for our title and REI segments include:
| • | mortgage interest rates; | ||
| • | ratio of purchase transactions compared with refinance transactions; | ||
| • | ratio of closed orders to open orders; | ||
| • | home prices; | ||
| • | volume of distressed property transactions; | ||
| • | consumer confidence; | ||
| • | demand by buyers; | ||
| • | number of households; | ||
| • | availability of loans for borrowers; | ||
| • | premium rates; | ||
| • | market share; | ||
| • | opening of new offices and acquisitions; | ||
| • | number of commercial transactions, which typically yield higher premiums; and | ||
| • | government or regulatory initiatives, including tax incentives. |
To the extent inflation causes increases in the prices of homes and other real estate, premium
revenues are also increased. Conversely, falling home prices cause premium revenues to decline.
Premiums are determined in part by the insured values of the transactions we handle. These factors
may override the seasonal nature of the title insurance business. Historically, our first quarter
is the least active and our third and fourth quarters are the most active in terms of title
insurance revenues.
Industry data. Published mortgage interest rates and other selected residential data for the years
ended December 31, 2010, 2009 and 2008 follow (amounts shown for 2010 are preliminary and subject
to revision). The amounts below may not relate directly to or provide accurate data for
forecasting our operating revenues or order counts.
Our statements on home sales, mortgage interest rates and loan activity are based on published
industry data from sources including Fannie Mae, the National Association of Realtors®,
the Mortgage Bankers Association and Freddie Mac.
| 2010 | 2009 | 2008 | ||||||||||
Mortgage interest rates (30-year, fixed-rate) — % |
||||||||||||
Averages for the year |
4.69 | 5.04 | 6.04 | |||||||||
First quarter |
5.00 | 5.06 | 5.88 | |||||||||
Second quarter |
4.91 | 5.03 | 6.09 | |||||||||
Third quarter |
4.45 | 5.16 | 6.32 | |||||||||
Fourth quarter |
4.41 | 4.92 | 5.87 | |||||||||
Mortgage originations — in $ billions |
1,530 | 1,917 | 1,580 | |||||||||
Refinancings — % of originations |
65.4 | 69.2 | 51.6 | |||||||||
New home sales — in millions |
0.32 | 0.38 | 0.49 | |||||||||
Existing home sales — in millions |
4.91 | 5.16 | 4.91 | |||||||||
Existing
home sales — median sales price in $ thousands |
172.9 | 172.5 | 198.1 | |||||||||
20
Table of Contents
The real estate market has not seen a consistent recovery, although several economic
indicators have shown improvements, such as improving consumer confidence and easing lending
standards for business and consumer loans. The easing of lending standards has not extended to the
real estate market where commercial and residential lending volume has decreased. Most industry
experts project mortgage interest rates to increase and refinancing mortgage originations to
decrease in 2011. They also expect the total number of mortgage originations to decrease in 2011
despite modest improvements in home sales in 2011.
Trends and order counts. For the three years ended December 31, 2010, mortgage interest rates
(30-year, fixed-rate) have fluctuated from a monthly high of 6.5% in August 2008 to a monthly low
of 4.2% in October 2010. In 2010, total mortgage originations and refinancing mortgage
originations decreased 20.2% and 24.6%, respectively, even though interest rates remained
relatively low throughout 2010. During 2009, sales of new homes decreased 22.4%, while sales of
existing homes increased 5.1%. In 2010, sales of new homes and existing homes decreased 15.8% and
4.8%, respectively.
As a result of the above trends, our direct order levels were relatively unchanged from 2008 to
2009 and decreased from 2009 to 2010, which is consistent with the U.S. real estate market during
those same periods.
The number of direct title orders opened follows:
| 2010 | 2009 | 2008 | ||||||||||
| (in thousands) | ||||||||||||
First quarter |
97 | 141 | 151 | |||||||||
Second quarter |
106 | 143 | 130 | |||||||||
Third quarter |
117 | 110 | 110 | |||||||||
Fourth quarter |
95 | 103 | 101 | |||||||||
| 415 | 497 | 492 | ||||||||||
The number of direct title orders closed follows:
| 2010 | 2009 | 2008 | ||||||||||
| (in thousands) | ||||||||||||
First quarter |
61 | 84 | 90 | |||||||||
Second quarter |
77 | 104 | 93 | |||||||||
Third quarter |
75 | 89 | 79 | |||||||||
Fourth quarter |
80 | 81 | 66 | |||||||||
| 293 | 358 | 328 | ||||||||||
RESULTS OF OPERATIONS
A comparison of our results of operations for 2010 with 2009 and 2009 with 2008 follows. Factors
contributing to fluctuations in results of operations are presented in the order of their monetary
significance and we have quantified, when necessary, significant changes. Results from our REI
segment are included in year-to-year discussions. When relevant, we have discussed our REI
segment’s results separately.
21
Table of Contents
Title revenues. Revenues from direct title operations decreased $40.3 million, or 6.0%, in 2010
and $29.9 million, or 4.2%, in 2009. The largest revenue decreases in 2010 were in Texas,
California and Utah, partially offset by increases in Canada. The largest revenue decreases in
2009 were in foreign operations (excluding Canada), Texas, Canada, New York, and California,
partially offset by increases in Arizona. Revenues from commercial and large transactions
increased $18.7 million to $92.7 million in 2010 and decreased $43.0 million to $74.0 million in
2009.
Direct operating revenues, excluding large commercial policies, decreased 9.7% in 2010 compared to
2009, primarily due to fewer direct orders closed, although the average revenue per closing,
excluding large commercial policies, increased 10.2% in 2010 compared to 2009. Direct orders
closed, including large commercial policies, decreased 18.1% in 2010 compared to 2009, although the
average revenue per closing, including large commercial policies, increased 14.9% during the same
period. Our decrease in direct orders closed and increase in average revenue per closing are
driven by a different mix of closings, with 2010 experiencing more large commercial closings and
fewer residential refinancing closings than in 2009. On average, refinance premium rates are 60%
of the title premium revenue of a similarly priced sale transaction.
Revenues from independent agencies decreased $30.9 million, or 3.3%, in 2010 and increased $142.3
million, or 17.7%, in 2009. The decrease in 2010 was primarily related to a decline in refinancing
closings in 2010, resulting in decreases in revenues from agencies in many states including
Pennsylvania, Ohio and Virginia. The decreases were partially offset by significant increases in
California, New York and Texas, primarily related to the increase in commercial closings. The
increase in 2009 was largely due to the addition of new higher-remitting, lower-risk agencies, as
well as significant increases in revenues from existing agencies, which experienced an increase in
transaction volumes. In 2009, the largest increases in revenues from agencies were in California,
Pennsylvania, Michigan and New Jersey, partially offset by decreases in Florida and Texas.
Since the beginning of the current downturn in real estate markets across the country, the median
selling price of homes has fallen 29.2% from August 2007 to January 2011, which has resulted in
lower premium revenue per resale closing. As a consequence, in 2009 we began a review of our
premium rates in all states. Where possible, we are seeking to raise rates or to modify agency
splits (the percent of premium remitted to the underwriter compared to the amount retained by the
agency) to levels necessary to improve profitability from our agency operations. To date, we have
increased title premium rates in 22 states and have increased remittance rates with our independent
agencies in 38 states. As these efforts were ongoing during most of 2010, we have not yet realized
a full year of increased remittances.
Title revenues by geographic location. The approximate amounts and percentages of consolidated
title operating revenues for the last three years were as follows:
| Amounts ($ millions) | Percentages | |||||||||||||||||||||||
| 2010 | 2009 | 2008 | 2010 | 2009 | 2008 | |||||||||||||||||||
Texas |
243 | 257 | 269 | 16 | 16 | 18 | ||||||||||||||||||
California |
201 | 181 | 141 | 13 | 11 | 9 | ||||||||||||||||||
New York |
136 | 122 | 134 | 9 | 8 | 9 | ||||||||||||||||||
International |
98 | 89 | 110 | 6 | 6 | 8 | ||||||||||||||||||
Florida |
71 | 73 | 81 | 5 | 5 | 5 | ||||||||||||||||||
All others |
802 | 900 | 775 | 51 | 54 | 51 | ||||||||||||||||||
| 1,551 | 1,622 | 1,510 | 100 | 100 | 100 | |||||||||||||||||||
22
Table of Contents
REI revenues. Real estate information services operating revenues increased $24.3 million, or
42.7%, and $12.4 million, or 27.9%, in 2010 and 2009, respectively. The increase in 2010 was
primarily due to a significant rise in demand for our loan modification services. The increase in
2009 was also due to a significant rise in our loan modification services, partially offset by a
reduction of revenues due to a decrease in demand for post-closing lender services activity, a
reduction in the number of Section 1031 tax-deferred property exchanges caused by the continued
decline in the real estate market and the sale of subsidiaries in 2008.
Investment income. Investment income decreased $2.4 million, or 11.6%, and $8.3 million, or 28.5%,
in 2010 and 2009, respectively. The decrease in 2010 was primarily due to decreases in yield. The
decreases were partially offset by a one-time royalty payment of $1.2 million received in June
2010. The decrease in 2009 was also primarily due to decreases in the average invested balances
and, to a lesser extent, decreases in yield.
In 2010, investment and other gains (losses) — net included realized gains of $11.8 million from
the sale of debt and investments available-for-sale, $6.3 million primarily from a transfer of the
rights to internally developed software, $1.2 million from the sale of interests in subsidiaries,
$3.0 million from the sale of real estate, $0.8 million as a result of a reduction in accruals for
office closure costs and $0.5 million from the change in fair value of the cash settlement option
related to the convertible senior notes. The realized gains were partially offset by realized
losses of $0.6 million for the impairment of cost-basis investments and $0.5 million from the sale
of debt investments available-for-sale.
In 2009, investment and other gains (losses) — net included realized gains of $16.3 million from
the sale of debt and equity investments available-for-sale, $5.6 million from the sales of
cost-basis investments and $1.0 million due to the change in estimates in office closure costs.
The realized gains were partially offset by realized losses of $10.7 million for the impairment of
equity method and cost-basis investments, $2.8 million for office closure costs, $1.3 million for
the impairment of equity securities available-for-sale and $0.8 million for the impairment and sale
of real estate.
In 2008, investment and other gains (losses) — net included realized losses of $13.8 million from
the sale of debt and equity investments available-for-sale, $12.4 million for the impairment of
equity method and cost-basis investments, $8.7 million for office closure costs, $4.7 million for
the impairment of equity securities available-for-sale and $3.4 million due to sale or impairment
of other fixed assets, title plants and real estate. The realized losses were partially offset by
realized gains of $13.6 million from the sale of debt and equity investments available-for-sale,
$1.0 million for the sale of subsidiaries and $0.8 million for sales of title plants and real
estate.
Retention by agencies. Amounts retained by title agencies are based on agreements between agencies
and our title underwriters. This retention percentage may vary from year-to-year due to the
geographical mix of agency operations, the volume of title revenues and, in some states, laws or
regulations. On average, amounts retained by independent agencies, as a percentage of revenues
generated by them, were 82.4%, 82.9% and 81.9% in the years 2010, 2009 and 2008, respectively. We
actively increased remittance rates with many of our independent agencies, increasing the amount of
premiums remitted by our independent agencies to our underwriters in 2010. As these efforts were
ongoing during most of the year, we have not yet realized a full year of increased remittances.
The fluctuations in 2010 and 2009 are also affected by the uneven recovery of real estate markets
across the nation; those states with higher agency retention percentages had experienced a
disproportionate increase in transaction activity in 2009. As real estate markets continue to
stabilize nationally, we expect the mix of agency business to normalize, resulting in lower average
retention percentages in the aggregate.
23
Table of Contents
Selected cost ratios (by segment). The following table shows employee costs and other operating
expenses as a percentage of related title insurance and REI operating revenues.
| Employee costs (%) | Other operating (%) | |||||||||||||||||||||||
| 2010 | 2009 | 2008 | 2010 | 2009 | 2008 | |||||||||||||||||||
Title |
27.4 | 27.4 | 34.3 | 16.2 | 16.7 | 23.0 | ||||||||||||||||||
REI |
38.7 | 51.2 | 78.1 | 19.5 | 26.0 | 39.7 | ||||||||||||||||||
These two categories of expenses are discussed below in terms of year-to-year monetary changes.
Employee costs. Our employee costs and certain other operating expenses are sensitive to
inflation. Employee costs for the combined business segments decreased $14.0 million, or 2.9%, in
2010 and $72.3 million, or 13.1%, in 2009. The number of persons we employed at December 31, 2010,
2009 and 2008 was approximately 5,700, 6,100 and 6,300, respectively.
In 2010, we reduced our employee headcount company-wide by 130, or 2.2%, excluding the effects of
divestitures. In 2010, employee costs were reduced primarily due to the sale and deconsolidation
of several subsidiaries, partially offset by increases in state unemployment tax rates in certain
states.
In 2009, we reduced our employee headcount company-wide approximately 200, or 3.2%, excluding the
effects of acquisitions and divestitures. During this period, employee costs were reduced through
ongoing cost savings initiatives to better align our operating costs with revenues, partially
offset by increases in bonuses due to the improved results of our direct operations.
In our REI segment, total employee costs increased $2.2 million, or 7.9%, in 2010, primarily due to
increases in staffing driven by increased demand for our loan modification services. In 2009,
total employee costs decreased $5.7 million, or 16.5%, primarily in our lender services and
property information businesses due to staffing reductions related to lower transaction volumes,
which were partially offset by increases in staffing relating to our loan modification services.
Other operating expenses. Other operating expenses include costs that are fixed in nature, costs
that follow, to varying degrees, changes in transaction volumes and revenues and costs that
fluctuate independently of revenues. Costs that are fixed in nature include attorney fees,
equipment rental, insurance, professional fees, rent and other occupancy expenses, repairs and
maintenance, technology costs, telephone and title plant rent. Costs that follow, to varying
degrees, changes in transaction volumes and revenues include fee attorney splits, bad debt
expenses, certain REI expenses, copy supplies, delivery fees, outside search fees, postage, premium
taxes and title plant expenses. Costs that fluctuate independently of revenues include auto
expenses, general supplies, litigation defense and settlement costs, promotion costs and travel.
In 2010, other operating expenses for the combined business segments decreased $16.4 million, or
5.7%. Costs fixed in nature decreased $5.6 million, or 4.5%, in 2010, primarily due to decreases
in rent and other occupancy expenses related to office closures in prior years and other cost
reduction efforts. Costs that follow, to varying degrees, changes in transaction volumes and
revenues decreased $12.9 million, or 11.2%, in 2010, excluding a $3.0 million credit due to a
reversal of an accrual for a legal matter related to premium taxes resolved in our favor in 2009.
This decrease was primarily related to the decline in transaction volume in our direct operations.
Costs that fluctuate independently of revenues were relatively flat in 2010, excluding reductions
in estimates for a legal matter of $2.3 million and $2.9 million in 2010 and 2009, respectively.
24
Table of Contents
In 2009, other operating expenses for the combined business segments decreased $75.1 million, or
20.6%. Costs fixed in nature decreased $25.5 million, or 16.1%, in 2009, primarily due to
decreases in rent and other occupancy expenses, insurance and technology costs. Costs that follow,
to varying degrees, changes in transaction volumes and revenues decreased $12.7 million, or 9.9%,
in 2009, excluding a $3.0 million credit due to a reversal of an accrual for a legal matter related
to premium taxes resolved in our favor in 2009. This decrease was primarily related to the decline
in transaction volume in our direct operations. Costs that fluctuate independently of revenues
decreased $31.0 million, or 39.7%, in 2009, excluding reductions in estimates for a legal matter of
$2.9 million in 2009. This decrease was primarily due to decreases in promotional costs,
litigation defense and settlement costs and travel.
Title losses. Provisions for title losses, as a percentage of title operating revenues, were 9.6%,
11.3% and 11.2% in 2010, 2009 and 2008, respectively. The year ended December 31, 2010 included a
reserve strengthening adjustment of $4.8 million (0.03% of title revenues) relating to policy years
2007 and 2008 due to higher than expected loss payments and incurred loss experience for these
policy years. This brings the total strengthening charges for these policy years to $77.0 million,
substantially all of which was recorded in 2008 and 2009. We do not currently anticipate future
reserve strengthening for these policy years. Reserve strengthening adjustments are to provide for
future losses that may be incurred on prior policy years, and are based on current loss experience
for those policy years. Current losses that are higher than anticipated are an indication that
total losses for a given policy year may be higher than originally calculated. Changes in the
total estimated future loss for prior policy years are recorded in the period in which the estimate
changes, and thus negatively impact the provision for title loss ratios. The increase in loss
payment experience for recent policy years resulted in an increase in the loss ratio related to
revenues recognized on policies issued in 2010, and, accordingly, a $2.6 million catch-up
adjustment was recorded to title losses in the fourth quarter 2010.
Provisions for title losses in 2010 also include charges of $13.3 million (0.09% of title revenues)
resulting from changes in the estimated legal costs for several existing large title claims. These
charges were partially offset by insurance recoveries of $2.8 million (0.01% of title revenues) on
previously recognized title losses. We had no agency defalcation losses exceeding $1.0 million
during 2010 and only five such claims reported (averaging less than $1.5 million each) in the
previous six quarters.
Losses incurred on known claims for the year 2010 decreased 15.7% compared to the year 2009. The
loss ratio on known claims from the independent agencies cancelled in recent years was 9.2% in 2010
while the loss ratio on the current independent agency network was 2.9%. More than 70% of
independent agency claim payments were for agencies cancelled in recent years.
The year ended December 31, 2009 included reserve strengthening adjustments of $32.7 million (2.0%
of title revenues) relating to policy years 2005, 2006 and 2007 due to higher than expected loss
payments and incurred loss experience for these policy years. The increase in loss payment
experience for recent policy years resulted in an increase in the loss ratio related to revenues
recognized on policies issued in 2009, and, accordingly, a $3.8 million catch-up adjustment was
recorded to title losses in the third quarter of 2009. Provisions for title losses in 2009 also
include charges of $31.8 million (2.0% of title revenues) relating to large title claims including
several independent agency defalcations and mechanic lien claims. These charges were partially
offset by insurance recoveries of $11.9 million (0.7% of title revenues) on previously recognized
title losses.
In 2008, an increase in loss payment experience for recent policy years resulted in an increase in
our loss ratios. Title loss reserves in 2008 increased due to a $32.0 million provision for
strengthening policy loss reserves for policy years 2005, 2006 and 2007 related to higher than
expected loss payment and incurred loss experience for these policy years. Our policy loss
reserves in 2008 also reflect charges of $41.7 million relating to large title losses primarily
attributable to independent agency defalcations and fraud, as well as mechanic lien claims. These
charges were partially offset by insurance recoveries of $11.6 million received during the year.
25
Table of Contents
Excluding the impact of the reserve strengthening charges, large losses, and defalcations (net of
recoveries), title losses as a percent of title revenues were 8.6%, 8.0% and 7.1% in 2010, 2009 and
2008, respectively. Cash claims payments remained elevated in 2010, and consequently, we
maintained a relatively high provisioning rate for title losses. Nonetheless, we believe we are on
track to return to a normal loss ratio by the end of 2012.
Income taxes. Our effective tax rates, based on earnings before taxes and after deducting
noncontrolling interests (a loss of $4.5 million, $70.7 million and $242.7 million in 2010, 2009
and 2008, respectively), were (179.2%), 27.9% and (1.9%) for 2010, 2009 and 2008, respectively.
Our effective income tax rate in 2010 was driven by foreign and state taxes and income taxes
associated with subsidiaries not included in our consolidated federal tax return, net of tax
benefits from certain tax credits, and by a $1.1 million decrease in the valuation allowance
against our deferred tax assets. As of December 31, 2010, our valuation allowance against deferred
tax assets was $91.9 million, which will be evaluated for reversal as we return to profitability.
Our effective tax rate in 2009 was significantly impacted by a benefit of $29.8 million due to the
change in tax law in the fourth quarter 2009, which allowed us to carry back net operating losses
to prior years.
Contractual obligations. Our material contractual obligations at December 31, 2010 were:
| Payments due by period ($ millions) | ||||||||||||||||||||
| Less than | 1-3 | 3-5 | More than | |||||||||||||||||
| 1 year | years | years | 5 years | Total | ||||||||||||||||
Notes payable |
2.6 | 2.9 | 3.3 | — | 8.8 | |||||||||||||||
Convertible senior notes |
— | — | 65.0 | — | 65.0 | |||||||||||||||
Operating leases |
36.4 | 49.3 | 26.4 | 8.8 | 120.9 | |||||||||||||||
Estimated title losses |
138.8 | 178.5 | 71.9 | 106.6 | 495.8 | |||||||||||||||
| 177.8 | 230.7 | 166.6 | 115.4 | 690.5 | ||||||||||||||||
Material contractual obligations consist primarily of notes payable, convertible senior notes,
operating leases and estimated title losses. The timing above for payments of notes payable is
based upon contractually stated payment terms of each debt agreement. The convertible senior notes
will mature in 2014 unless converted earlier.
Operating leases are primarily for office space and expire over the next 10 years. The timing
shown above for the payments of estimated title losses is not set by contract. Rather, it is
projected based on historical payment patterns. The actual timing of estimated title loss payments
may vary materially from the above projection since claims, by their nature, are complex and paid
over long periods of time. Title losses paid were $158.3 million, $149.3 million and $136.8
million in 2010, 2009 and 2008, respectively.
LIQUIDITY AND CAPITAL RESOURCES
Our liquidity and capital resources represent our ability to generate cash flow to meet our
obligations to our shareholders, customers (payments to satisfy claims on title policies), vendors,
employees, lenders and others. As of December 31, 2010, our cash and investments, including
amounts reserved pursuant to statutory requirements, aggregated $638.3 million.
26
Table of Contents
A substantial majority of our consolidated cash and investments as of December 31, 2010 was held by
Stewart Title Guaranty Company (Guaranty) and its subsidiaries. The use and investment of these
funds, dividends to the holding company, and cash transfers between Guaranty and its subsidiaries
and the holding company are subject to certain legal and regulatory restrictions. In general,
Guaranty may use its cash and investments in excess of its legally-mandated statutory premium
reserve (established in accordance with requirements under Texas law) to fund its insurance
operations, including claims payments. Guaranty may also, subject to certain limitations and upon
regulatory approval, pay dividends to the holding company and/or provide funds to its subsidiaries
(whose operations consist principally of field title offices) for their operating and debt service
needs.
A summary of our net consolidated cash flows for the years ended December 31 follows:
| 2010 | 2009 | 2008 | ||||||||||
| ($ millions) | ||||||||||||
Net cash provided (used) by operating activities |
41.2 | (17.0 | ) | (104.8 | ) | |||||||
Net cash provided (used) by investing activities |
235.2 | 130.2 | (159.2 | ) | ||||||||
Net cash (used) provided by financing activities |
(238.8 | ) | (88.6 | ) | 252.2 | |||||||
Operating activities
Our principal sources of cash from operations are premiums on title policies, title service-related
transactions and loan modification services. Our independent agencies remit cash to us net of
their contractual retention. Our principal cash expenditures for operations are employee costs,
operating costs and title claims payments.
Our improved cash flow from operations for 2010 compared to 2009 was primarily due to the receipt
of a $50.9 million income tax refund, which was reflected as a receivable at December 31, 2009, and
cash receipts from loan modification services in 2010.
Our business continues to be labor intensive, although we have made significant progress in
automating our services. We have centralized order processing into Regional Production Centers,
which allows us to more easily adjust staffing levels as order volumes fluctuate. We reduced our
number of employees by approximately 130 and 200 during 2010 and 2009, respectively, excluding the
effects of divestitures.
Cash payments on title claims in 2010, 2009 and 2008 were $158.3 million, $149.3 million and $136.8
million, respectively. Claims payments remain elevated compared to historical norms as payments
are made on previously accrued title losses. Claim payments made, net of insurance recoveries,
during 2010, 2009, and 2008 include $32.8 million, $17.5 million and $21.4 million, respectively,
on large title claims. Also, more than 70% and 60% of the amount of total claim payments relating
to independent agencies made in 2010 and 2009, respectively, were for losses arising from
independent agencies cancelled in recent years. As the losses from those agencies are paid and
newly reported prior policy year claims begin to decline, we expect the overall amount of cash paid
on title claims to decline significantly. The increase in claims payments since 2008 is also
consistent with our historical experience that title claims are filed more quickly and there is a
higher incidence of agency defalcations in declining real estate markets. The insurance regulators
of the states in which our underwriters are domiciled require our statutory premium reserves to be
fully funded, segregated and invested in high-quality securities and short-term investments. As of
December 31, 2010, cash and investments funding the statutory premium reserve aggregated $406.2
million and our estimate of claims that may be reported in the future totaled $351.6 million. In
addition to this restricted cash and investments, we had unrestricted cash and investments
(excluding cost-basis and equity method investments) of $124.8 million, which are available for
underwriter operations, including claims payments.
27
Table of Contents
Investing activities
Cash from investing activities was generated principally by proceeds from investments matured and
sold in the amounts of $328.5 million, $477.1 million and $668.5 million in 2010, 2009 and 2008,
respectively. We used cash for the purchases of investments in the amounts of $303.5 million,
$369.4 million and $570.3 million in 2010, 2009 and 2008, respectively. The cash from sales and
maturities not reinvested was used principally to fund operations.
Capital expenditures were $16.3 million, $11.0 million, and $18.0 million in 2010, 2009, and 2008,
respectively. We have limited capital expenditures for new offices and other capital projects for
the last three years due to the poor economic conditions. We expect that capital expenditures will
continue to be near the 2010 level as we continue to aggressively manage cash flow. We have no
material commitments for capital expenditures.
During the years ended 2009 and 2008, acquisitions resulted in additions to goodwill of $1.9
million and $2.1 million, respectively. We made no acquisitions in 2010.
On September 30, 2008, we entered into a $241.5 million line of credit agreement with a bank from
which we had acquired auction rate securities. The line of credit was a demand loan in an amount
equal to the full par value of the auction rate securities that secured the loan. On June 30,
2010, we exercised our ability to relinquish and transfer all rights to the auction rate securities
to the bank, at par value in accordance with the line of credit agreement, at which time the bank
extinguished the outstanding balance of the line of credit. There was no net impact to our
consolidated financial statements as of and for the year ended December 31, 2010 as a result of the
exercise of our rights under this agreement.
Financing activities and capital resources
We repaid $16.3 million and $54.8 million of debt in accordance with the underlying terms of the
debt instruments for 2010 and 2009, respectively. We also have available a $10.0 million bank line
of credit, which expires in June 2011, under which no borrowings were outstanding at December 31,
2010.
On October 15, 2009, we issued $65.0 million aggregate principal amount of 6.0% Convertible Senior
Notes due 2014 (Notes). The $61.7 million in net proceeds were used to retire bank debt on which
repayment could have been demanded at any time, thereby extending our maturities for this debt to
October 2014 if not converted into shares of Common Stock before or at maturity. The Notes pay
interest semiannually at a rate of 6.0% per annum beginning on April 15, 2010. The Notes are
convertible into shares of our Common Stock at a conversion rate of 77.6398 shares per $1,000
principal amount of Notes (equal to a conversion price of $12.88 per share), which will be adjusted
for certain antidilutive provisions such as a dividend or distribution of shares of Common Stock,
split or combination of shares of Common Stock; the issuance of rights or warrants entitling all or
substantially all holders of Common Stock to subscribe for or purchase shares of Common Stock at a
price per share less than the average of the Last Reported Sale Prices of Common Stock (as defined
in the Indenture); the distribution of shares of any class of capital stock of the Company,
evidences of its indebtedness, other assets or property of the Company or rights or warrants to
acquire the Company’s capital stock or other securities to all or substantially all holders of its
Common Stock; or any cash dividend or distribution made to all or substantially all holders of
Common Stock during any annual fiscal period that exceeds $0.10 per share of Common Stock.
We paid $0.9 million, $0.9 million and $1.7 million in cash dividends to our shareholders
representing $0.05, $0.05 and $0.10 per common share outstanding in 2010, 2009 and 2008,
respectively. Our dividend remained relatively low in 2010, 2009 and 2008 due to our operating
performance and our desire to conserve cash. The declaration of any future dividend is at the
discretion of our Board of Directors.
28
Table of Contents
On January 14, 2011, we filed a registration statement, which became effective January 18, 2011,
with the Securities Exchange Commission registering the resale of up to 660,000 shares (Settlement
Shares) of our Common Stock. The issuance of the shares to the claims administrator was used to
settle four “wage and hour” class action lawsuits filed in California state and federal courts
against our subsidiary, Stewart Title of California, Inc. These lawsuits generally claimed, among
other things, that (i) the plaintiffs were misclassified as exempt employees and were not paid
overtime, (ii) the overtime payments made to non-exempt employees were miscalculated and (iii) the
plaintiffs worked overtime hours but were not paid. The plaintiffs sought compensatory damages,
statutory compensation, penalties and restitution, exemplary and punitive damages, declaratory
relief, interest and attorneys’ fees. A settlement agreement of $7.6 million with respect to the
“wage and hour” class action lawsuits was approved by the courts on October 27, 2010. We did not
receive any of the proceeds from the sale of the Settlement Shares by the Claims Administrator.
Effect of changes in foreign currency rates
The effect of changes in foreign currency rates on the consolidated statements of cash flows was a
net increase in cash and cash equivalents of $0.8 million and $5.2 million in 2010 and 2009,
respectively, as compared to a net decrease of $11.2 million in 2008. Our principal foreign
operating unit is in Canada, and the value of the U.S. dollar relative to the Canadian dollar
increased during 2010.
***********
Throughout 2009 and 2010, we have worked to increase title premium rates charged and premium
remittance rates to our underwriters. As of December 31, 2010, we have increased title premium
rates in 22 states and have increased remittance rates with our independent agencies in 38 states.
In addition, we have reduced our employee count and other operating costs in each of the last three
years. We anticipate improved operating results, and thus cash flow, in 2011 from the impact of
these actions and will continue to seek rate increases or modify agency splits where appropriate,
as well as aggressively seek opportunities to lower operating costs.
We believe we have sufficient liquidity and capital resources to meet the cash needs of our ongoing
operations. However, if we determine that supplemental debt, including additional convertible
debentures, or equity funding is warranted to provide additional liquidity for unforeseen
circumstances or strategic acquisitions, we may pursue those sources of cash. Other than scheduled
maturities of debt, operating lease payments and anticipated claims payments, we have no material
commitments. We expect that cash flows from operations and cash available from our underwriters,
subject to regulatory restrictions, will be sufficient to fund our operations, including claims
payments. However, to the extent that these funds are not sufficient, we may be required to borrow
funds on terms less favorable than we currently have, or seek funding from the equity market, which
may not be successful or may be on terms that are dilutive to existing shareholders.
Other-than-temporary impairments of investments. We recorded an other-than-temporary impairment of
$1.3 million and $4.7 million in 2009 and 2008, respectively, relating to equity securities held
for investment.
Other comprehensive earnings (loss). Unrealized gains and losses on investments and changes in
foreign currency exchange rates are reported net of deferred taxes in accumulated other
comprehensive earnings, a component of stockholders’ equity, until realized. In 2010, net
unrealized investment gains of $0.3 million, which increased our comprehensive income, were
primarily related to temporary increases in market values of government bond investments, partially
offset by decreases in municipal bond investments. Foreign currency exchange rates, primarily
related to our Canadian operations, increased comprehensive income by $3.5 million, net of taxes,
in 2010. Other comprehensive earnings included a $1.1 million provision for Canadian income taxes
related to unrealized gains in 2010.
29
Table of Contents
In 2009, net unrealized investment losses of $0.9 million, which increased our comprehensive loss
attributable to Stewart, were related to temporary decreases in market values of government bond
investments, partially offset by increases in corporate and municipal bond investments and equity
investments. Changes in foreign currency exchange rates, primarily related to our Canadian
operations, decreased comprehensive loss by $11.6 million, net of taxes, in 2009.
The 2008 net unrealized investment losses of $1.0 million, which increased our comprehensive loss,
were related to temporary declines in market values of equity, municipal bond and corporate bond
investments and partially offset by increases in the government bond investments. Changes in
foreign currency exchange rates, primarily related to our Canadian operations, increased
comprehensive loss by $18.5 million, net of taxes, in 2008.
Off-balance sheet arrangements. We do not have any material source of liquidity or financing that
involves off-balance sheet arrangements, other than our contractual obligations under operating
leases. We also routinely hold funds in segregated escrow accounts pending the closing of real
estate transactions and have qualified intermediaries in tax-deferred property exchanges for
customers pursuant to Section 1031 of the Internal Revenue Code. The Company holds the proceeds
from these transactions until a qualifying exchange can occur. See Note 18 to our accompanying
consolidated financial statements.
Forward-looking statements. Certain statements in this report are “forward-looking statements”
within the meaning of the Private Securities Litigation Reform Act of 1995. Such forward-looking
statements relate to future, not past, events and often address our expected future business and
financial performance. These statements often contain words such as “expect,” “anticipate,”
“intend,” “plan,” “believe,” “seek,” “will” or other similar words. Forward-looking statements by
their nature are subject to various risks and uncertainties that could cause our actual results to
be materially different than those expressed in the forward-looking statements. These risks and
uncertainties include, among other things, the severity and duration of current financial and
economic conditions; continued weakness or further adverse changes in the level of real estate
activity; changes in mortgage interest rates and availability of mortgage financing; our ability to
respond to and implement technology changes, including the completion of the implementation of our
enterprise systems; the impact of unanticipated title losses on the need to further strengthen our
policy loss reserves; any effect of title losses on our cash flows and financial condition; the
impact of our increased diligence and inspections in our agency operations; changes to the
participants in the secondary mortgage market and the rate of refinancings that affect the demand
for title insurance products; our ability to successfully consummate acquisitions, and our ability
to successfully integrate and manage acquired businesses should opportunities arise; regulatory
non-compliance, fraud or defalcations by our title insurance agencies or employees; our ability to
timely and cost-effectively respond to significant industry changes and introduce new products and
services; the outcome of litigation claims by large classes of claimants; the ultimate outcome of
the Citigroup case discussed herein; the impact of changes in governmental and insurance
regulations, including any future reductions in the pricing of title insurance products and
services; our dependence on our operating subsidiaries and underwriters as a source of cash flow;
the continued realization of expected expense savings resulting from our expense reduction steps
taken since 2008; our ability to access the equity and debt financing markets when and if needed;
our ability to grow our international operations; our ability to respond to the actions of our
competitors; failure to comply with financial covenants contained in our debt instruments; and
inability to make scheduled payments on or refinance our indebtedness. We expressly disclaim any
obligation to update any forward-looking statements contained in this report to reflect events or
circumstances that may arise after the date hereof, except as may be required by applicable law.
30
Table of Contents
Item 7A. Quantitative and Qualitative Disclosures About Market Risk
The discussion below about our risk management strategies includes forward-looking statements that
are subject to risks and uncertainties. Management’s projections of hypothetical net losses in the
fair values of our market rate-sensitive financial instruments, should certain potential changes in
market rates occur, are presented below. While we believe that the potential market rate changes
are possible, actual rate changes could differ from our projections.
Our only material market risk in investments in financial instruments is our debt securities
portfolio. We invest primarily in municipal, corporate and utilities, foreign and U.S. Government
debt securities. We do not invest in financial instruments of a derivative or hedging nature.
We have established policies and procedures to minimize our exposure to changes in the fair values
of our investments. These policies include retaining an investment advisory firm, an emphasis upon
credit quality, management of portfolio duration, maintaining or increasing investment income
through high coupon rates and actively managing our profile and security mix depending upon market
conditions. We have classified all of our investments as available-for-sale (except for
Investments — pledged, which are discussed in Note 10 of our consolidated financial statements).
Investments in debt securities at December 31, 2010 mature, according to their contractual terms,
as follows (actual maturities may differ because of call or prepayment rights):
| Amortized | ||||||||
| costs | Fair values | |||||||
| ($ thousands) | ||||||||
In one year or less |
34,545 | 34,765 | ||||||
After one year through two years |
48,374 | 48,860 | ||||||
After two years through three years |
52,494 | 53,584 | ||||||
After three years through four years |
39,775 | 40,157 | ||||||
After four years through five years |
49,413 | 49,656 | ||||||
After five years |
220,027 | 223,302 | ||||||
| 444,628 | 450,324 | |||||||
We believe our investment portfolio is diversified and do not expect any material loss to result
from the failure to perform by issuers of the debt securities we hold. Our investments are not
collateralized. Foreign debt securities primarily include Canadian government bonds, which
aggregated $130.8 million and $114.9 million as of December 31, 2010 and 2009, respectively, and
United Kingdom treasury bonds.
Based on our debt securities portfolio and interest rates at December 31, 2010, a 100 basis-point
increase (decrease) in interest rates would result in a decrease (increase) of approximately $23.7
million, or 5.3%, in the fair value of our portfolio. Changes in interest rates may affect the
fair value of the debt securities portfolio and may result in unrealized gains or losses. Gains or
losses would only be realized upon the sale of the investments. Any other-than-temporary declines
in fair values of securities are charged to earnings.
Item 8. Financial Statements and Supplementary Data
The information required to be provided in this item is included in our audited Consolidated
Financial Statements, including the Notes thereto, attached hereto as
pages F-1 to F-30, and such
information is incorporated in this report by reference.
31
Table of Contents
| Item 9. | Changes in and Disagreements With Accountants on Accounting and Financial Disclosure |
None.
Item 9A. Controls and Procedures
Our principal executive officers and principal financial officer are responsible for establishing
and maintaining disclosure controls and procedures. They evaluated the effectiveness of our
disclosure controls and procedures (as defined in Exchange Act Rules 13a-15(e) and 15d-15(e)) as of
December 31, 2010, and have concluded that, as of such date, our disclosure controls and procedures
are adequate and effective to ensure that information we are required to disclose in the reports
that we file or submit under the Exchange Act is (i) recorded, processed, summarized and reported
within the time periods specified in the SEC’s rules and forms, and (ii) accumulated and
communicated to our management, including our principal executive officers and principal financial
officer, as appropriate to allow timely decisions regarding required disclosure.
Our management is responsible for establishing and maintaining adequate internal control over
financial reporting (as defined in Exchange Act Rule 13a-15(f)). Our internal control over
financial reporting is a process, under the supervision of our principal executive officers and
principal financial officer, designed to provide reasonable assurance regarding the reliability of
financial reporting and the preparation of financial statements for external purposes in accordance
with generally accepted accounting principles. Our management, with the participation of our
principal executive officers and principal financial officer, assessed the effectiveness of our
internal control over financial reporting as of December 31, 2010. In making this assessment, our
management used the criteria set forth by the Committee of Sponsoring Organizations of the Treadway
Commission (COSO) in Internal Control — Integrated Framework. Based on this assessment,
management believes that, as of December 31, 2010, our internal control over financial reporting is
effective based on those criteria.
All internal control systems, no matter how well designed, have inherent limitations. Therefore,
even those systems determined to be effective can provide only reasonable assurance with respect to
financial statement preparation and presentation. Internal control over financial reporting is a
process that involves human diligence and compliance and is subject to lapses in judgment and
breakdowns resulting from human failures. Internal control over financial reporting also can be
circumvented by collusion or improper management override. Due to such limitations, there is a
risk that material misstatements may not be prevented or detected on a timely basis by internal
control over financial reporting. However, these inherent limitations are known features of the
financial reporting process. Therefore, it is possible to design into the process safeguards to
reduce, though not eliminate, this risk.
See page F-2 for the Report of Independent Registered Public Accounting Firm on our effectiveness
of internal control over financial reporting.
There has been no change in our internal control over financial reporting during the quarter ended
December 31, 2010 that has materially affected, or is reasonably likely to materially affect, our
internal control over financial reporting. As a result, no corrective actions were required or
undertaken.
Item 9B. Other Information
None.
32
Table of Contents
PART III
Item 10. Directors, Executive Officers and Corporate Governance
Information regarding our directors and executive officers will be included in our proxy statement
for our 2011 Annual Meeting of Stockholders (Proxy Statement), to be filed within 120 days after
December 31, 2010, and is incorporated in this report by reference.
Our Board
of Directors and Executive Officers as of March 3, 2011 are:
Board of Directors: |
||
Catherine A. Allen
|
Chairman and CEO, The Santa Fe Group | |
Thomas G. Apel
|
President, Intrepid Ideas, Inc. | |
Robert L. Clarke
|
Senior Partner, Bracewell & Giuliani, L.L.P. | |
Paul W. Hobby
|
Managing Partner, Genesis Park, L.P. | |
Dr. E. Douglas Hodo
|
President Emeritus, Houston Baptist University | |
Laurie C. Moore
|
Chief Executive Officer, The Institute for Luxury Home Marketing | |
Malcolm S. Morris
|
Chairman of the Board and Co-Chief Executive Officer | |
Stewart Morris, Jr.
|
President and Co-Chief Executive Officer | |
Dr. W. Arthur Porter
|
Professor Emeritus, University of Oklahoma | |
Executive Officers: |
||
Malcolm S. Morris
|
Chairman of the Board and Co-Chief Executive Officer | |
Stewart Morris, Jr.
|
President and Co-Chief Executive Officer | |
Matthew W. Morris
|
Senior Executive Vice President | |
J. Allen Berryman
|
Chief Financial Officer, Secretary, Treasurer, and Principal Financial Officer | |
E. Ashley Smith
|
Executive Vice President — Chief Legal Officer | |
Michael B. Skalka
|
President — Stewart Title Guaranty Company |
The Board of Directors has adopted the Stewart Code of Business Conduct and Ethics and Guidelines
on Corporate Governance, as well as the Code of Ethics for Chief Executive Officers, Principal
Financial Officer and Principal Accounting Officer. Each of these documents can be found at our
website, www.stewart.com.
Item 11. Executive Compensation
Information regarding compensation for our executive officers will be included in the Proxy
Statement and is incorporated in this report by reference. The Compensation Committee has reviewed
and discussed the Compensation Discussion and Analysis with management and based on that review and
discussion, the Compensation Committee recommended to the Board of Directors that the Compensation
Discussion and Analysis be included in the Proxy Statement.
| Item 12. | Security Ownership of Certain Beneficial Owners and Management and Related Stockholder Matters |
Information regarding security ownership of certain beneficial owners and management and related
stockholder matters will be included in the Proxy Statement and is incorporated in this report by
reference.
33
Table of Contents
Item 13. Certain Relationships and Related Transactions, and Director Independence
Information regarding certain relationships and related transactions and director independence will
be included in the Proxy Statement and is incorporated in this report by reference.
Item 14. Principal Accounting Fees and Services
Information regarding fees paid to and services provided by our independent registered public
accounting firm will be included in the Proxy Statement and is incorporated in this report by
reference.
34
Table of Contents
PART IV
Item 15. Exhibits, Financial Statement Schedules
| (a) | Financial Statements and Financial Statement Schedules |
| The financial statements and financial statement schedules filed as part of this report are listed in the Index to Consolidated Financial Statements and Financial Statement Schedules on Page F-1 of this document. All other schedules are omitted, as the required information is inapplicable or the information is presented in the consolidated financial statements or related notes. |
| (b) | Exhibits |
| Those exhibits required to be filed by Item 601 of Regulation S-K are listed in the Index to Exhibits immediately preceding the exhibits filed herewith and such listing is incorporated herein by reference. |
35
Table of Contents
SIGNATURES
Pursuant to the requirements of Section 13 or 15(d) of the Securities Exchange Act of 1934, we have
duly caused this report to be signed on our behalf by the undersigned, thereunto duly authorized.
STEWART INFORMATION SERVICES CORPORATION
(Registrant)
(Registrant)
By:
|
/s/ Malcolm S. Morris
|
|||
| Chairman of the Board of Directors | ||||
By:
|
/s/ Stewart Morris, Jr.
|
|||
| President and Director | ||||
By:
|
/s/ J. Allen Berryman
|
|||
| Chief Financial Officer, Secretary, Treasurer and | ||||
| Principal Financial Officer | ||||
By:
|
/s/ Brian K. Glaze
|
|||
| Principal Accounting Officer |
Date:
March 3, 2011
Pursuant to the requirements of the Securities Exchange Act of 1934, this report has been signed on
our behalf on March 3, 2011 by the following Directors:
| /s/ Paul Hobby | /s/ Malcolm S. Morris | |||
|
|
||||
(Catherine Allen)
|
(Paul Hobby) | (Malcolm S. Morris) | ||
| /s/ E. Douglas Hodo | /s/ Stewart Morris, Jr. | |||
(Thomas G. Apel)
|
(E. Douglas Hodo) | (Stewart Morris, Jr.) | ||
/s/ Robert L. Clarke
|
/s/ Laurie C. Moore | |||
(Robert L. Clarke)
|
(Laurie C. Moore) | (W. Arthur Porter) |
36
Table of Contents
INDEX TO CONSOLIDATED FINANCIAL STATEMENTS
AND FINANCIAL STATEMENT SCHEDULES
AND FINANCIAL STATEMENT SCHEDULES
Stewart Information Services Corporation and Subsidiaries’ Consolidated Financial Statements:
| F-2 | ||||
| F-4 | ||||
| F-5 | ||||
| F-6 | ||||
| F-8 | ||||
Financial Statement Schedules: |
||||
| S-1 | ||||
| S-5 |
F-1
Table of Contents
Report of Independent Registered Public Accounting Firm
The Board of Directors and Stockholders
Stewart Information Services Corporation:
Stewart Information Services Corporation:
We have audited Stewart Information Services Corporation’s internal control over financial
reporting as of December 31, 2010, based on criteria established in Internal Control — Integrated
Framework issued by the Committee of Sponsoring Organizations of the Treadway Commission (COSO).
Stewart Information Services Corporation’s management is responsible for maintaining effective
internal control over financial reporting and for its assessment of the effectiveness of internal
control over financial reporting, included in the accompanying Item 9A. Controls and Procedures.
Our responsibility is to express an opinion on the Company’s internal control over financial
reporting based on our audit.
We conducted our audit in accordance with the standards of the Public Company Accounting Oversight
Board (United States). Those standards require that we plan and perform the audit to obtain
reasonable assurance about whether effective internal control over financial reporting was
maintained in all material respects. Our audit included obtaining an understanding of internal
control over financial reporting, assessing the risk that a material weakness exists, and testing
and evaluating the design and operating effectiveness of internal control based on the assessed
risk. Our audit also included performing such other procedures as we considered necessary in the
circumstances. We believe that our audit provides a reasonable basis for our opinion.
A company’s internal control over financial reporting is a process designed to provide reasonable
assurance regarding the reliability of financial reporting and the preparation of financial
statements for external purposes in accordance with generally accepted accounting principles. A
company’s internal control over financial reporting includes those policies and procedures that (1)
pertain to the maintenance of records that, in reasonable detail, accurately and fairly reflect the
transactions and dispositions of the assets of the company; (2) provide reasonable assurance that
transactions are recorded as necessary to permit preparation of financial statements in accordance
with generally accepted accounting principles, and that receipts and expenditures of the company
are being made only in accordance with authorizations of management and directors of the company;
and (3) provide reasonable assurance regarding prevention or timely detection of unauthorized
acquisition, use, or disposition of the company’s assets that could have a material effect on the
financial statements.
Because of its inherent limitations, internal control over financial reporting may not prevent or
detect misstatements. Also, projections of any evaluation of effectiveness to future periods are
subject to the risk that controls may become inadequate because of changes in conditions, or that
the degree of compliance with the policies or procedures may deteriorate.
In our opinion, Stewart Information Services Corporation maintained, in all material respects,
effective internal control over financial reporting as of December 31, 2010, based on criteria
established in Internal Control — Integrated Framework issued by the Committee of Sponsoring
Organizations of the Treadway Commission.
We also have audited, in accordance with the standards of the Public Company Accounting Oversight
Board (United States), the consolidated balance sheets of Stewart Information Services Corporation
and subsidiaries as of December 31, 2010 and 2009, and the related consolidated statements of
operations, retained earnings and comprehensive earnings, and cash flows for each of the years in
the three-year period ended December 31, 2010, and the financial statement schedules as listed in
the accompanying index, and our report dated March 3, 2011 expressed an unqualified opinion on
those consolidated financial statements.
/s/ KPMG
LLP
Houston, Texas
March 3, 2011
Houston, Texas
March 3, 2011
F-2
Table of Contents
Report of Independent Registered Public Accounting Firm
The Board of Directors and Stockholders
Stewart Information Services Corporation:
Stewart Information Services Corporation:
We have audited the accompanying consolidated balance sheets of Stewart Information Services
Corporation and subsidiaries as of December 31, 2010 and 2009, and the related consolidated
statements of operations, retained earnings and comprehensive earnings, and cash flows for each of
the years in the three-year period ended December 31, 2010. In connection with our audits of the
consolidated financial statements, we also have audited the financial statement schedules as listed
in the accompanying index. These consolidated financial statements and financial statement
schedules are the responsibility of the Company’s management. Our responsibility is to express an
opinion on these consolidated financial statements and financial statement schedules based on our
audits.
We conducted our audits in accordance with the standards of the Public Company Accounting Oversight
Board (United States). Those standards require that we plan and perform the audit to obtain
reasonable assurance about whether the financial statements are free of material misstatement. An
audit includes examining, on a test basis, evidence supporting the amounts and disclosures in the
financial statements. An audit also includes assessing the accounting principles used and
significant estimates made by management, as well as evaluating the overall financial statement
presentation. We believe that our audits provide a reasonable basis for our opinion.
In our opinion, the consolidated financial statements referred to above present fairly, in all
material respects, the financial position of Stewart Information Services Corporation and
subsidiaries as of December 31, 2010 and 2009, and the results of their operations and their cash
flows for each of the years in the three-year period ended December 31, 2010, in conformity with
U.S. generally accepted accounting principles. Also in our opinion, the related financial
statement schedules, when considered in relation to the basic consolidated financial statements
taken as a whole, present fairly, in all material respects, the information set forth therein.
We also have audited, in accordance with the standards of the Public Company Accounting Oversight
Board (United States), Stewart Information Services Corporation’s internal control over financial
reporting as of December 31, 2010, based on criteria established in Internal Control — Integrated
Framework issued by the Committee of Sponsoring Organizations of the Treadway Commission (COSO),
and our report dated March 3, 2011 expressed an unqualified opinion on the effectiveness of the
Company’s internal control over financial reporting.
/s/ KPMG LLP
Houston, Texas
March 3, 2011
March 3, 2011
F-3
Table of Contents
CONSOLIDATED STATEMENTS OF OPERATIONS, RETAINED EARNINGS AND COMPREHENSIVE EARNINGS
| For the Years Ended December 31, | ||||||||||||
| 2010 | 2009 | 2008 | ||||||||||
| ($000 omitted, except per share) | ||||||||||||
Revenues |
||||||||||||
Title insurance: |
||||||||||||
Direct operations |
636,454 | 676,756 | 706,745 | |||||||||
Agency operations |
914,581 | 945,481 | 803,189 | |||||||||
Real estate information |
81,176 | 56,895 | 44,473 | |||||||||
Investment income |
18,397 | 20,804 | 29,134 | |||||||||
Investment and other gains (losses) — net |
21,782 | 7,366 | (28,247 | ) | ||||||||
| 1,672,390 | 1,707,302 | 1,555,294 | ||||||||||
Expenses |
||||||||||||
Amounts retained by agencies |
753,438 | 783,406 | 657,771 | |||||||||
Employee costs |
467,491 | 481,535 | 553,792 | |||||||||
Other operating expenses |
273,253 | 289,648 | 364,727 | |||||||||
Title losses and related claims |
148,438 | 182,781 | 169,381 | |||||||||
Depreciation and amortization |
21,422 | 28,064 | 41,125 | |||||||||
Interest |
5,423 | 4,056 | 5,995 | |||||||||
| 1,669,465 | 1,769,490 | 1,792,791 | ||||||||||
Earnings (loss) before taxes and noncontrolling interests |
2,925 | (62,188 | ) | (237,497 | ) | |||||||
Income tax expense (benefit) |
8,075 | (19,757 | ) | 4,732 | ||||||||
Net loss |
(5,150 | ) | (42,431 | ) | (242,229 | ) | ||||||
Less net earnings attributable to noncontrolling interests |
7,432 | 8,544 | 5,226 | |||||||||
Net loss attributable to Stewart |
(12,582 | ) | (50,975 | ) | (247,455 | ) | ||||||
Retained earnings at beginning of year |
296,116 | 347,952 | 597,118 | |||||||||
Cash dividends on common stock ($.05, $.05 and $.10 per share in 2010,
2009 and 2008, respectively) |
(868 | ) | (861 | ) | (1,711 | ) | ||||||
Retained earnings at end of year |
282,666 | 296,116 | 347,952 | |||||||||
Comprehensive loss: |
||||||||||||
Net loss |
(5,150 | ) | (42,431 | ) | (242,229 | ) | ||||||
Other comprehensive earnings (loss), net of taxes of $3,148, $3,439
and ($5,843) |
2,650 | 10,667 | (19,549 | ) | ||||||||
Comprehensive loss |
(2,500 | ) | (31,764 | ) | (261,778 | ) | ||||||
Less comprehensive earnings attributable to noncontrolling interests |
7,432 | 8,544 | 5,226 | |||||||||
Comprehensive loss attributable to Stewart |
(9,932 | ) | (40,308 | ) | (267,004 | ) | ||||||
Basic and dilutive average shares outstanding (000) |
18,313 | 18,182 | 18,092 | |||||||||
Basic and diluted loss per share attributable to Stewart |
(0.69 | ) | (2.80 | ) | (13.68 | ) | ||||||
See notes to consolidated financial statements.
F-4
Table of Contents
CONSOLIDATED BALANCE SHEETS
| As of December 31, | ||||||||
| 2010 | 2009 | |||||||
| ($000 omitted) | ||||||||
Assets |
||||||||
Cash and cash equivalents |
144,564 | 97,971 | ||||||
Cash and cash equivalents — statutory reserve funds |
9,926 | 18,129 | ||||||
| 154,490 | 116,100 | |||||||
Short-term investments |
33,457 | 24,194 | ||||||
Investments in debt and equity securities available-for-sale, at fair value: |
||||||||
Statutory reserve funds |
396,317 | 386,235 | ||||||
Other |
54,007 | 79,969 | ||||||
| 450,324 | 466,204 | |||||||
Receivables: |
||||||||
Notes |
10,747 | 10,437 | ||||||
Premiums from agencies |
45,399 | 42,630 | ||||||
Income taxes |
651 | 46,228 | ||||||
Other |
41,323 | 46,488 | ||||||
Allowance for uncollectible amounts |
(19,438 | ) | (20,501 | ) | ||||
| 78,682 | 125,282 | |||||||
Property and equipment, at cost: |
||||||||
Land |
6,445 | 8,468 | ||||||
Buildings |
23,769 | 23,326 | ||||||
Furniture and equipment |
250,355 | 271,234 | ||||||
Accumulated depreciation |
(219,000 | ) | (232,395 | ) | ||||
| 61,569 | 70,633 | |||||||
Title plants, at cost |
77,397 | 78,421 | ||||||
Real estate, at lower of cost or net realizable value |
3,266 | 3,578 | ||||||
Investments in investees, on an equity method basis |
17,608 | 12,233 | ||||||
Goodwill |
206,861 | 212,763 | ||||||
Intangible assets, net of amortization |
8,228 | 6,406 | ||||||
Other assets |
49,324 | 51,339 | ||||||
Investments — pledged, at fair value |
— | 202,007 | ||||||
| 1,141,206 | 1,369,160 | |||||||
Liabilities |
||||||||
Notes payable |
8,784 | 19,620 | ||||||
Convertible senior notes |
64,338 | 64,163 | ||||||
Line of credit, at fair value |
— | 202,007 | ||||||
Accounts payable and accrued liabilities |
95,666 | 101,881 | ||||||
Estimated title losses |
495,849 | 503,475 | ||||||
Deferred income taxes |
28,236 | 15,948 | ||||||
| 692,873 | 907,094 | |||||||
Contingent liabilities and commitments |
||||||||
Stockholders’ equity |
||||||||
Common Stock — $1 par, authorized 50,000,000; issued 17,801,273 and 17,685,976;
outstanding 17,325,046 and 17,209,749 |
17,801 | 17,658 | ||||||
Class B Common Stock — $1 par, authorized 1,500,000; issued and outstanding 1,050,012 |
1,050 | 1,050 | ||||||
Additional paid-in capital |
124,413 | 126,822 | ||||||
Retained earnings |
282,666 | 296,116 | ||||||
Accumulated other comprehensive earnings: |
||||||||
Foreign currency translation adjustments |
11,093 | 7,563 | ||||||
Unrealized investment gains |
2,517 | 3,397 | ||||||
Treasury stock — 476,227 common shares, at cost |
(4,330 | ) | (4,330 | ) | ||||
Total stockholders’ equity attributable to Stewart |
435,210 | 448,276 | ||||||
Noncontrolling interests |
13,123 | 13,790 | ||||||
Total stockholders’ equity |
448,333 | 462,066 | ||||||
| 1,141,206 | 1,369,160 | |||||||
See notes to consolidated financial statements.
F-5
Table of Contents
CONSOLIDATED STATEMENTS OF CASH FLOWS
| For the Years Ended December 31, | ||||||||||||
| 2010 | 2009 | 2008 | ||||||||||
| ($000 omitted) | ||||||||||||
Reconciliation of net loss to cash provided (used) by operating activities: |
||||||||||||
Net loss |
(5,150 | ) | (42,431 | ) | (242,229 | ) | ||||||
Add (deduct): |
||||||||||||
Depreciation and amortization |
21,422 | 28,064 | 41,125 | |||||||||
Provision for bad debt |
4,186 | 6,526 | 9,116 | |||||||||
Investment and other (gains) losses — net |
(21,782 | ) | (7,002 | ) | 28,247 | |||||||
Provisions for title losses (less than) in excess of payments |
(14,694 | ) | 31,276 | 21,030 | ||||||||
Insurance recoveries of title losses |
8,260 | 2,174 | 11,600 | |||||||||
Decrease (increase) in receivables — net |
46,642 | (24,833 | ) | 10,790 | ||||||||
Decrease in other assets — net |
308 | 540 | 11,207 | |||||||||
Decrease in payables and accrued liabilities — net |
(11,871 | ) | (13,203 | ) | (5,731 | ) | ||||||
Increase (decrease) in net deferred income taxes |
10,544 | (1,230 | ) | 6,459 | ||||||||
Net earnings from equity investees |
(2,427 | ) | (3,134 | ) | (1,188 | ) | ||||||
Dividends received from equity investees |
2,996 | 2,916 | 2,850 | |||||||||
Other — net |
2,760 | 3,385 | 1,926 | |||||||||
Cash provided (used) by operating activities |
41,194 | (16,952 | ) | (104,798 | ) | |||||||
Investing activities: |
||||||||||||
Proceeds from investments available-for-sale matured and sold |
328,460 | 477,089 | 668,531 | |||||||||
Purchases of investments available-for-sale |
(303,517 | ) | (369,366 | ) | (570,257 | ) | ||||||
Proceeds from redemptions of investments — pledged |
217,225 | 24,300 | — | |||||||||
Purchases of property and equipment, title plants and real estate — net |
(16,339 | ) | (11,032 | ) | (18,234 | ) | ||||||
Proceeds from the sale of land and buildings |
6,425 | — | — | |||||||||
Increases in notes receivable |
(1,109 | ) | (1,214 | ) | (1,339 | ) | ||||||
Collections on notes receivable |
1,001 | 654 | 5,061 | |||||||||
Purchases of investments — pledged |
— | — | (241,525 | ) | ||||||||
Change in cash and cash equivalents due to sale and deconsolidation of
subsidiaries (see below) |
(1,873 | ) | — | — | ||||||||
Cash received for other assets, cost-basis investments, equity
investees and other — net |
4,887 | 9,759 | (1,413 | ) | ||||||||
Cash provided (used) by investing activities |
235,160 | 130,190 | (159,176 | ) | ||||||||
Financing activities: |
||||||||||||
Payments on notes payable |
(16,294 | ) | (117,190 | ) | (27,978 | ) | ||||||
Proceeds from notes payable |
5,834 | 433 | 47,242 | |||||||||
Payments on line of credit |
(216,141 | ) | (24,962 | ) | — | |||||||
Proceeds from line of credit |
— | — | 241,525 | |||||||||
Proceeds from issuance of convertible senior notes |
— | 65,000 | — | |||||||||
Payments for debt issuance costs related to convertible senior notes |
— | (3,299 | ) | — | ||||||||
Cash dividends paid |
(868 | ) | (861 | ) | (1,711 | ) | ||||||
Distributions to noncontrolling interests |
(7,122 | ) | (7,775 | ) | (7,465 | ) | ||||||
Purchase of remaining interest of consolidated subsidiary |
(4,199 | ) | — | — | ||||||||
Proceeds from exercise of stock options and grants |
— | 57 | 569 | |||||||||
Cash (used) provided by financing activities |
(238,790 | ) | (88,597 | ) | 252,182 | |||||||
Effect of changes in foreign currency exchange rates |
826 | 5,213 | (11,201 | ) | ||||||||
Increase (decrease) in cash and cash equivalents |
38,390 | 29,854 | (22,993 | ) | ||||||||
Cash and cash equivalents at beginning of year |
116,100 | 86,246 | 109,239 | |||||||||
Cash and cash equivalents at end of year |
154,490 | 116,100 | 86,246 | |||||||||
See notes to consolidated financial statements.
F-6
Table of Contents
CONSOLIDATED STATEMENTS OF CASH FLOWS
| For the Years Ended December 31, | ||||||||||||
| 2010 | 2009 | 2008 | ||||||||||
| ($000 omitted) | ||||||||||||
Supplemental information: |
||||||||||||
Changes in financial statement amounts due to sale and
deconsolidation of subsidiaries: |
||||||||||||
Note receivable |
2,433 | — | — | |||||||||
Investments in investees, on an equity method basis |
5,315 | — | — | |||||||||
Goodwill |
(5,902 | ) | — | — | ||||||||
Title plants |
(1,048 | ) | — | — | ||||||||
Property and equipment, net of accumulated depreciation |
(1,564 | ) | — | — | ||||||||
Intangible asset, net of amortization |
2,928 | — | — | |||||||||
Other — net |
(814 | ) | — | — | ||||||||
Liabilities |
1,390 | — | — | |||||||||
Noncontrolling interests |
336 | — | — | |||||||||
Investment and other (gains) losses — net |
(1,201 | ) | — | — | ||||||||
Change in cash and cash equivalents due to sale and deconsolidation of
subsidiaries |
1,873 | — | — | |||||||||
Income taxes — net refunded |
(41,528 | ) | (16,831 | ) | (1,708 | ) | ||||||
Interest paid |
4,775 | 2,576 | 5,705 | |||||||||
See notes to consolidated financial statements.
F-7
Table of Contents
NOTES TO CONSOLIDATED FINANCIAL STATEMENTS
(Three Years Ended December 31, 2010)
(Three Years Ended December 31, 2010)
NOTE 1
General. Stewart Information Services Corporation, through its subsidiaries (collectively, the
Company), is primarily engaged in the business of providing title insurance and related services.
The Company also provides real estate information services. The Company operates through a network
of policy-issuing offices and agencies in the United States and international markets.
Approximately 49% of consolidated title revenues for the year ended December 31, 2010 were
generated in Texas, California, New York, international operations and Florida.
A. Management’s responsibility. The accompanying consolidated financial statements were prepared
by management, which is responsible for their integrity and objectivity. The financial statements
have been prepared in conformity with U.S. generally accepted accounting principles (GAAP),
including management’s best judgments and estimates. Actual results could differ from those
estimates.
B. Reclassifications. Certain prior year amounts in these consolidated financial statements have
been reclassified for comparative purposes. Net loss attributable to Stewart and stockholders’
equity, as previously reported, were not affected.
C. Consolidation. The condensed consolidated financial statements include all subsidiaries in
which the Company owns more than 50% voting rights in electing directors and variable interest
entities when required by FASB Accounting Standards Codification (ASC) 810-10-05. All significant
intercompany amounts and transactions have been eliminated and provisions have been made for
noncontrolling interests. Unconsolidated investees, in which the Company typically owns 20%
through 50% of the equity, are accounted for by the equity method.
D. Statutory accounting. Stewart Title Guaranty Company (Guaranty) and other title insurance
underwriters owned by the Company prepare financial statements in accordance with statutory
accounting practices prescribed or permitted by regulatory authorities. See Notes 2 and 3 to the
accompanying consolidated financial statements.
In conforming the statutory financial statements to GAAP, the statutory premium reserve and the
reserve for reported title losses are eliminated and, in substitution, amounts are established for
estimated title losses (Note 1F). The net effect, after providing for income taxes, is included in
consolidated statement of operations.
E. Revenue recognition. Operating revenues from direct title operations are considered earned at
the time of the closing of the related real estate transaction. The Company recognizes premium
revenues on title insurance policies written by independent agencies (agencies) when the policies
are reported to the Company. In addition, where reasonable estimates can be made, the Company
accrues for policies issued but not reported until after period end. The Company believes that
reasonable estimates can be made when recent and consistent policy issuance information is
available. Estimates are based on historical reporting patterns and other information obtained
about agencies, as well as current trends in direct operations and in the title industry. In this
accrual, future transactions are not being estimated. The Company is estimating revenues on
policies that have already been issued by agencies but not yet reported to or received by the
Company. The Company has consistently followed the same basic method of estimating unreported
policy revenues for more than 10 years.
Revenues from real estate information services are generally considered earned at the time the
service is performed or the product is delivered to the customer.
F-8
Table of Contents
F. Title losses and related claims. The Company’s method for recording the reserves for title
losses on both an interim and annual basis begins with the calculation of its current loss
provision rate, which is applied to the Company’s current premiums resulting in a title loss
expense for the period. This loss provision rate is set to provide for losses on current year
policies and is determined using moving average ratios of recent actual policy loss payment
experience (net of recoveries) to premium revenues.
At each quarter end, the Company’s recorded reserve for title losses begins with the prior period’s
reserve balance for claim losses, adds the current period provision to that balance and subtracts
actual paid claims, resulting in an amount that management compares to its actuarially-based
calculation of the ending reserve balance to provide for future reported title losses. The
actuarially-based calculation is a paid loss development calculation where loss development factors
are selected based on company data and input from the Company’s third-party actuaries. The Company
also obtains input from third-party actuaries in the form of a reserve analysis utilizing generally
accepted actuarial methods. While the Company is responsible for determining its loss reserves, it
utilizes this actuarial input to assess the overall reasonableness of its reserve estimation. If
the Company’s recorded reserve amount is within a reasonable range (+/- 3.0%) of its
actuarially-based reserve calculation and the actuary’s point estimate, but not at the point
estimate, the Company’s management assesses the major factors contributing to the different reserve
estimates in order to determine the overall reasonableness of its recorded reserve, as well as the
position of the recorded reserves relative to the point estimate and the estimated range of
reserves. The major factors considered can change from period to period and include items such as
current trends in the real estate industry (which management can assess although there is a time
lag in the development of this data for use by the actuary), the size and types of claims reported
and changes in the Company’s claims management process. If the recorded amount is not within a
reasonable range of the Company’s third-party actuary’s point estimate, it will adjust the recorded
reserves in the current period and reassess the provision rate on a prospective basis. Once the
Company’s reserve for title losses is recorded, it is reduced in future periods as a result of
claims payments and may be increased or reduced by revisions to the Company’s estimate of the
overall level of required reserves.
Due to the inherent uncertainty in predicting future title policy losses, significant judgment is
required by both the Company’s management and its third party actuaries in estimating reserves. As
a consequence, the Company’s ultimate liability may be materially greater or less than its current
reserves and/or its third party actuary’s calculated estimate.
G. Cash equivalents. Cash equivalents are highly liquid investments with insignificant interest
rate risks and maturities of three months or less at the time of acquisition.
H. Short-term investments. Short-term investments comprise time deposits with banks, federal
government obligations and other investments maturing in less than one year.
I. Investments in debt and equity securities. The investment portfolio is classified as
available-for-sale, except for investments — pledged, which were classified as trading. Realized
gains and losses on sales of investments are determined using the specific identification method.
Net unrealized gains and losses on investments available-for-sale, net of applicable deferred
taxes, are included as a component of accumulated other comprehensive earnings within stockholders’
equity. At the time unrealized gains and losses become realized, they are reclassified from
accumulated other comprehensive earnings using the specific identification method. Any
other-than-temporary declines in fair values of investments available-for-sale are charged to
earnings.
J. Property and equipment. Depreciation is principally computed using the straight-line method at
the following rates: buildings — 30 to 40 years and furniture and equipment — 3 to 10 years.
Maintenance and repairs are expensed as incurred while improvements are capitalized. Gains and
losses are recognized at disposal.
F-9
Table of Contents
K. Title plants. Title plants include compilations of a county’s official land records, prior
examination files, copies of prior title policies, maps and related materials that are
geographically indexed to a specific property. The costs of acquiring existing title plants and
creating new ones, prior to the time such plants are placed in operation, are capitalized. Title
plants are not amortized since there is no indication of any loss of value over time but are
subject to review for impairment. The costs of maintaining and operating title plants are expensed
as incurred. Gains and losses on sales of copies of title plants or interests in title plants are
recognized at the time of sale.
L. Goodwill. Goodwill is the excess of the purchase price over the fair value of net assets
acquired. Goodwill is not amortized but is reviewed annually and upon the occurrence of an event
indicating an impairment may have occurred. If determined to be impaired, the impaired portion is
expensed to current operations. The process of determining impairment relies on projections of
future cash flows, operating results and market conditions. Uncertainties exist in these
projections and are subject to changes relating to factors such as interest rates and overall real
estate market conditions. There were no impairment write-offs of goodwill during the years ended
December 31, 2010, 2009 and 2008. However, to the extent that the Company’s future operating
results are below management’s projections, or in the event of continued adverse market conditions,
a future review for impairment may be required, which may result in an impairment of goodwill.
M. Acquired intangibles. Intangible assets are mainly comprised of non-compete and underwriting
agreements and are amortized on a straight-line basis over their estimated lives, which are
primarily 3 to 10 years.
N. Other long-lived assets. The Company reviews the carrying values of title plants and other
long-lived assets if certain events occur that may indicate impairment. An impairment of these
long-lived assets is indicated when projected undiscounted cash flows over the estimated lives of
the assets are less than carrying values. If impairment is determined by management, the recorded
amounts are written down to fair values. There were no impairment write-offs of long-lived assets
during the years ended December 31, 2010 and 2009. In June 2008, the Company’s REI segment
incurred an impairment charge of $6.0 million relating to its internally developed software that
the Company subsequently determined will not be deployed into production.
The Company had investments accounted for using the cost-basis aggregating $12.2 million and $12.6
million at December 31, 2010 and 2009, respectively. Cost-basis investments are included in other
assets on the Company’s consolidated balance sheets and are evaluated periodically for impairment.
The Company incurred impairment charges of $0.6 million, $9.6 million and $1.7 million for
cost-basis investments during the years ended December 31, 2010, 2009 and 2008, respectively.
O. Fair values. The fair values of financial instruments, including cash and cash equivalents,
short-term investments, notes receivable, notes payable and accounts payable, are determined by the
exchange price that would be received for an asset or paid to transfer a liability (an exit price)
in the principal, or most advantageous, market for the asset or liability in an orderly transaction
between market participants at the measurement date. The fair values of these financial
instruments approximate their carrying values. Investments in debt and equity securities and
certain financial instruments are carried at their fair values (Notes 4 and 5).
P. Derivatives and hedging. The Company does not invest in financial instruments of a derivative
or hedging nature, but at December 31, 2009, the Company had an embedded derivative in its
convertible senior notes accounted for in accordance with FAS ASC 815-15, Derivatives and Hedging
— Embedded Derivatives, and FAS ASC 815-40, Derivatives and Hedging — Contracts in Entity’s Own
Equity (Note 10). As of December 31, 2010, the embedded derivative in the convertible senior notes
was derecognized since it no longer met the requirements for separate accounting treatment
according to FAS ASC 815-15 referenced above.
Q. Leases. The Company recognizes rent expense under non-cancelable operating leases, which
generally expire over the next 10 years, on the straight-line basis over the terms of the leases,
including provisions for any free rent periods or escalating lease payments.
F-10
Table of Contents
R. Income taxes. Deferred tax assets and liabilities are recognized for future tax consequences
attributable to differences between the tax basis and the book carrying values of certain assets
and liabilities. To the extent that the Company does not believe its deferred tax assets meet the
more likely than not criteria, it establishes a valuation allowance. When it establishes a
valuation allowance, or increases (decreases) the allowance during the year, it records a tax
expense (benefit) in its consolidated statement of operations. Enacted tax rates are used in
calculating amounts.
The Company also specifies the accounting for uncertainties in income taxes by prescribing a
recognition threshold and measurement attribute for the financial statement recognition and
measurement of a tax position taken or expected to be taken in a tax return.
S. Stock option plan. The Company accounts for its stock option plan, which authorizes the
granting of up to 900,000 options for shares of its Common Stock, in accordance with the
Compensation — Stock Compensation Topic of the FASB ASC, and uses the modified prospective method
under which share-based compensation expense is recognized for new share-based awards granted, and
any outstanding awards that are modified, repurchased or cancelled subsequent to January 1, 2006.
At the date of grant, the fair value of the options, which is estimated using the Black-Scholes
Model, is used to record compensation expense. All options expire 10 years from the date of grant
and are granted with an exercise price equal to the closing market price of the Company’s Common
Stock on the date of grant. There are no unvested awards since all options are immediately
exercisable.
T. Subsequent Event. On January 14, 2011, the Company filed a registration statement, which became
effective January 18, 2011, with the Securities Exchange Commission registering the resale of up to
660,000 shares of the Company’s Common Stock. The issuance of the shares were used to settle four
“wage and hour” class action lawsuits filed in California state and federal courts against the
Company’s subsidiary, Stewart Title of California, Inc. No proceeds were received by the Company.
The settlement agreement was approved by the courts on October 27, 2010.
NOTE 2
Restrictions on cash and investments. Statutory reserve funds of $396.3 million and $386.2 million
and cash and cash equivalents of $9.9 million and $18.1 million at December 31, 2010 and 2009,
respectively, were maintained to comply with legal requirements for statutory premium reserves and
state deposits. These funds are not available for any other purpose. In the event that the
insurance regulators adjust the determination of the statutory premium reserves of the Company’s
title insurers, this could increase or decrease the restricted funds and statutory surplus.
A substantial majority of consolidated investments and cash at each year end was held by the
Company’s title insurance subsidiaries. Generally, the types of investments a title insurer can
make are subject to legal restrictions. Furthermore, the transfer of funds by a title insurer to
its parent or subsidiary operations, as well as other related party transactions, is restricted by
law and generally requires the approval of state insurance authorities.
NOTE 3
Dividend restrictions. Substantially all of the consolidated retained earnings at each year end
were represented by Guaranty, which owns directly or indirectly substantially all of the
subsidiaries included in the consolidation.
Guaranty cannot pay a dividend in excess of certain limits without the approval of the Texas
Insurance Commissioner. The maximum dividend to its parent that can be paid after such approval in
2011 is $73.9 million. Guaranty did not declare a dividend in 2010, 2009 or 2008.
F-11
Table of Contents
Dividends from Guaranty are also voluntarily restricted primarily to maintain statutory surplus and
liquidity at competitive levels and to demonstrate significant claims payment ability. The ability
of a title insurer to pay claims can significantly affect the decision of lenders and other
customers when buying a policy from a particular insurer.
Surplus as regards policyholders for Guaranty was $369.5 million and $380.5 million at December 31,
2010 and 2009, respectively. Statutory net loss for Guaranty was $2.0 million, $85.1 million and
$8.8 million in 2010, 2009 and 2008, respectively.
NOTE 4
Investments in debt and equity securities. The amortized costs and fair values at December 31
follow:
| 2010 | 2009 | |||||||||||||||
| Amortized | Fair | Amortized | Fair | |||||||||||||
| costs | values | costs | values | |||||||||||||
| ($000 omitted) | ||||||||||||||||
Debt securities: |
||||||||||||||||
Municipal |
39,589 | 40,185 | 55,788 | 58,222 | ||||||||||||
Corporate and utilities |
228,270 | 229,972 | 235,283 | 237,101 | ||||||||||||
Foreign |
155,977 | 157,745 | 141,376 | 140,993 | ||||||||||||
U.S. Government |
20,792 | 22,422 | 28,406 | 29,765 | ||||||||||||
Mortgage-backed |
— | — | 112 | 86 | ||||||||||||
Equity securities |
— | — | 12 | 37 | ||||||||||||
| 444,628 | 450,324 | 460,977 | 466,204 | |||||||||||||
Gross unrealized gains and losses at December 31 were:
| 2010 | 2009 | |||||||||||||||
| Gains | Losses | Gains | Losses | |||||||||||||
| ($000 omitted) | ||||||||||||||||
Debt securities: |
||||||||||||||||
Municipal |
1,235 | 639 | 2,441 | 7 | ||||||||||||
Corporate and utilities |
4,574 | 2,872 | 4,056 | 2,238 | ||||||||||||
Foreign |
1,861 | 93 | 1,040 | 1,423 | ||||||||||||
U.S. Government |
1,634 | 4 | 1,419 | 60 | ||||||||||||
Mortgage-backed |
— | — | — | 26 | ||||||||||||
Equity securities |
— | — | 25 | — | ||||||||||||
| 9,304 | 3,608 | 8,981 | 3,754 | |||||||||||||
F-12
Table of Contents
Debt securities at December 31, 2010 mature, according to their contractual terms, as follows
(actual maturities may differ due to call or prepayment rights):
| Amortized | Fair | |||||||
| costs | values | |||||||
| ($000 omitted) | ||||||||
In one year or less |
34,545 | 34,765 | ||||||
After one year through five years |
190,056 | 192,257 | ||||||
After five years through ten years |
163,814 | 165,307 | ||||||
After ten years |
56,213 | 57,995 | ||||||
| 444,628 | 450,324 | |||||||
Gross unrealized losses on investments and the fair values of the related securities, aggregated by
investment category and length of time that individual securities have been in a continuous
unrealized loss position at December 31, 2010, were:
| Less than 12 months | More than 12 months | Total | ||||||||||||||||||||||
| Losses | Fair values | Losses | Fair values | Losses | Fair values | |||||||||||||||||||
| ($000 omitted) | ||||||||||||||||||||||||
Debt securities: |
||||||||||||||||||||||||
Municipal |
638 | 14,391 | 1 | 25 | 639 | 14,416 | ||||||||||||||||||
Corporate and utilities |
2,868 | 95,354 | 4 | 235 | 2,872 | 95,589 | ||||||||||||||||||
Foreign |
93 | 55,773 | — | — | 93 | 55,773 | ||||||||||||||||||
U.S. Government |
4 | 3,711 | — | — | 4 | 3,711 | ||||||||||||||||||
| 3,603 | 169,229 | 5 | 260 | 3,608 | 169,489 | |||||||||||||||||||
The unrealized loss positions were primarily caused by interest rate fluctuations. The number of
investments in an unrealized loss position as of December 31, 2010 was 72. Since the Company does
not intend to sell and will more likely than not maintain each debt security until its anticipated
recovery, and no significant credit risk is deemed to exist, these investments are not considered
other-than-temporarily impaired.
Gross unrealized losses on investments and the fair values of the related securities, aggregated by
investment category and length of time that individual securities have been in a continuous
unrealized loss position at December 31, 2009, were:
| Less than 12 months | More than 12 months | Total | ||||||||||||||||||||||
| Losses | Fair values | Losses | Fair values | Losses | Fair values | |||||||||||||||||||
| ($000 omitted) | ||||||||||||||||||||||||
Debt securities: |
||||||||||||||||||||||||
Municipal |
— | — | 7 | 353 | 7 | 353 | ||||||||||||||||||
Corporate and utilities |
2,010 | 121,398 | 228 | 11,860 | 2,238 | 133,258 | ||||||||||||||||||
Foreign |
1,423 | 13,911 | — | — | 1,423 | 13,911 | ||||||||||||||||||
U.S. Government |
60 | 9,086 | — | — | 60 | 9,086 | ||||||||||||||||||
Mortgage-backed |
— | — | 26 | 86 | 26 | 86 | ||||||||||||||||||
| 3,493 | 144,395 | 261 | 12,299 | 3,754 | 156,694 | |||||||||||||||||||
F-13
Table of Contents
The Company believes its investment portfolio is diversified and expects no material loss to result
from the failure to perform by issuers of the debt securities it holds. Investments made by the
Company are not collateralized. Foreign debt securities primarily include Canadian government
bonds, which aggregated $130.8 million and $114.9 million as of December 31, 2010 and 2009,
respectively, and United Kingdom treasury bonds. The mortgage-backed securities were issued by
U.S. Government-sponsored entities.
NOTE 5
Fair value measurements. The Fair Value Measurements and Disclosures Topic of the FASB ASC defines
fair value as the exchange price that would be received for an asset or paid to transfer a
liability (an exit price) in the principal, or most advantageous, market for the asset or liability
in an orderly transaction between market participants at the measurement date. The Fair Values
Measurements Topic establishes a three-level fair value hierarchy that prioritizes the inputs used
to measure fair value. This hierarchy requires entities to maximize the use of observable inputs
when possible. The three levels of inputs used to measure fair value are as follows:
| • | Level 1 — quoted prices in active markets for identical assets or liabilities; |
| • | Level 2 — observable inputs other than quoted prices included in Level 1, such as quoted prices for similar assets and liabilities in active markets; quoted prices for identical or similar assets and liabilities in markets that are not active; or other inputs that are observable or can be corroborated by observable market data; and |
| • | Level 3 — unobservable inputs that are supported by little or no market activity and that are significant to the fair values of the assets or liabilities, including certain pricing models, discounted cash flow methodologies and similar techniques that use significant unobservable inputs. |
At December 31, 2010, financial instruments measured at fair value on a recurring basis are
summarized below:
| Fair value | ||||||||||||||||
| Level 1 | Level 2 | Level 3 | measurements | |||||||||||||
| ($000 omitted) | ||||||||||||||||
Short-term investments |
33,457 | — | — | 33,457 | ||||||||||||
Investments available-for-sale: |
||||||||||||||||
Debt securities: |
||||||||||||||||
Municipal |
— | 40,185 | — | 40,185 | ||||||||||||
Corporate and utilities |
— | 229,972 | — | 229,972 | ||||||||||||
Foreign |
157,745 | — | — | 157,745 | ||||||||||||
U.S. Government |
22,422 | — | — | 22,422 | ||||||||||||
| 213,624 | 270,157 | — | 483,781 | |||||||||||||
F-14
Table of Contents
At December 31, 2009, financial instruments measured at fair value on a recurring basis are
summarized below:
| Fair value | ||||||||||||||||
| Level 1 | Level 2 | Level 3 | measurements | |||||||||||||
| ($000 omitted) | ||||||||||||||||
Short-term investments |
24,194 | — | — | 24,194 | ||||||||||||
Investments available-for-sale: |
||||||||||||||||
Debt securities: |
||||||||||||||||
Municipal |
— | 58,222 | — | 58,222 | ||||||||||||
Corporate and utilities |
— | 237,101 | — | 237,101 | ||||||||||||
Foreign |
140,993 | — | — | 140,993 | ||||||||||||
U.S. Government |
29,765 | — | — | 29,765 | ||||||||||||
Mortgage-backed |
86 | — | — | 86 | ||||||||||||
Equity securities |
37 | — | — | 37 | ||||||||||||
Investments — pledged |
— | — | 202,007 | 202,007 | ||||||||||||
Line of credit |
— | — | (202,007 | ) | (202,007 | ) | ||||||||||
Cash settlement option |
— | — | (510 | ) | (510 | ) | ||||||||||
| 195,075 | 295,323 | (510 | ) | 489,888 | ||||||||||||
At December 31, 2010, Level 1 financial instruments consist of short-term investments, U.S. and
foreign government bonds. Level 2 financial instruments consist of municipal, corporate and
utilities bonds. In accordance with the Company’s policies and guidelines, the Company’s third
party, registered investment manager invests only in securities rated as investment grade or higher
by the major rating services, where observable valuation inputs are significant. All municipal
bonds are valued using a third-party pricing service, and the corporate bonds are valued using the
market approach, which includes three to ten inputs from relevant market sources, including FINRA’s
Trade Reporting and Compliance Engine (TRACE) and independent broker/dealer quotes, bids and
offerings, as well as other relevant market data, such as securities with similar characteristics
(i.e. sector, rating, maturity, etc.). Broker/dealer quotes, bids and offerings mentioned above
are gathered (typically three to ten) and a consensus risk premium spread (credit spread) over
risk-free Treasury yields is developed from the inputs obtained, which is then used to calculate
the resulting fair value.
Level 3 financial instruments are summarized below:
| Cash settlement | ||||||||||||||||
| option of | ||||||||||||||||
| Investments – | convertible | |||||||||||||||
| Equity securities | pledged | Line of credit | senior notes | |||||||||||||
| ($000 omitted) | ||||||||||||||||
December 31, 2008 |
14,875 | 222,684 | (222,684 | ) | — | |||||||||||
Sold/redeemed |
(15,232 | ) | (24,963 | ) | 24,963 | — | ||||||||||
Issued |
— | — | — | (872 | ) | |||||||||||
Realized gains |
357 | 4,286 | (4,286 | ) | 362 | |||||||||||
December 31, 2009 |
— | 202,007 | (202,007 | ) | (510 | ) | ||||||||||
Sold/redeemed |
— | (216,141 | ) | 216,141 | — | |||||||||||
Realized gains |
— | 14,134 | (14,134 | ) | 510 | |||||||||||
December 31, 2010 |
— | — | — | — | ||||||||||||
F-15
Table of Contents
Effective January 1, 2008, the Company adopted the Financial Instruments Topic of the FASB ASC,
which provides entities the option to measure many financial instruments and certain other items at
fair value. Entities that choose the fair value option will recognize in earnings, at each
subsequent reporting date, any unrealized gains and losses on items for which the fair value option
was elected. The Company elected the fair value option for the line of credit.
As of December 31, 2010, assets measured at fair value on a nonrecurring basis are summarized
below:
| Impairment loss | ||||||||
| Level 3 | recorded | |||||||
| ($000 omitted) | ||||||||
Cost-basis investments |
1,646 | 494 | ||||||
The carrying amount of certain cost-basis investments exceeded their fair value and an impairment
charge of $0.5 million was recorded in investment and other gains (losses) — net in 2010. The
valuations were based on the values of the underlying assets of the investee.
As of December 31, 2009, assets measured at fair value on a nonrecurring basis are summarized
below:
| Impairment loss | ||||||||
| Level 3 | recorded | |||||||
| ($000 omitted) | ||||||||
Cost-basis investments |
5,117 | 5,853 | ||||||
The carrying amount of certain cost-basis investments exceeded their fair value and an impairment
charge of $5.9 million was recorded in investment and other gains (losses) — net in 2009. The
valuations were based on the values of the underlying assets of the investee.
NOTE 6
Investment income. Income from investments and gross realized investment and other gains and
losses follow:
| 2010 | 2009 | 2008 | ||||||||||
| ($000 omitted) | ||||||||||||
Investment income: |
||||||||||||
Debt securities |
15,014 | 18,639 | 22,272 | |||||||||
Short-term investments, cash equivalents and other |
3,383 | 2,165 | 6,862 | |||||||||
| 18,397 | 20,804 | 29,134 | ||||||||||
Investment and other gains (losses): |
||||||||||||
Realized gains |
24,055 | 23,881 | 15,499 | |||||||||
Realized losses |
(2,273 | ) | (16,515 | ) | (43,746 | ) | ||||||
| 21,782 | 7,366 | (28,247 | ) | |||||||||
Proceeds from the sales of investments available-for-sale were $280.9 million, $400.7 million and
$419.1 million as of December 31, 2010, 2009 and 2008, respectively. Expenses assignable to
investment income were insignificant. There were no significant investments at December 31, 2010
that did not produce income during the year.
F-16
Table of Contents
In 2010, investment and other gains (losses) — net included realized gains of $11.8 million from
the sale of debt and investments available-for-sale, $6.3 million primarily from a transfer of the
rights to internally developed software, $1.2 million from the sale of interests in subsidiaries,
$3.0 million from the sale of real estate, $0.8 million as a result of a reduction in accruals for
office closure costs and $0.5 million from the change in fair value of the cash settlement option
related to the convertible senior notes. The realized gains were partially offset by realized
losses of $0.6 million for the impairment of cost-basis investments and $0.5 million from the sale
of debt investments available-for-sale.
In 2009, investment and other gains (losses) — net included realized gains of $16.3 million from
the sale of debt and equity investments available-for-sale, $5.6 million from the sales of
cost-basis investments and $1.0 million due to the change in estimates in office closure costs.
The realized gains were partially offset by realized losses of $10.7 million from the impairment of
equity method and cost-basis investments, $2.8 million from office closure costs, $1.3 million from
the impairment of equity securities available-for-sale and $0.8 million from the impairment and
sale of real estate.
In 2008, investment and other gains (losses) — net included realized losses of $13.8 million from
the sale of debt and equity investments available-for-sale, $12.4 million from the impairment of
equity method and cost-basis investments, $8.7 million from office closure costs, $4.7 million from
the impairment of equity securities available-for-sale and $3.4 million due to sale or impairment
of other fixed assets, title plants and real estate. The realized losses were partially offset by
realized gains of $13.6 million from the sale of debt and equity investments available-for-sale,
$1.0 million for the sale of subsidiaries and $0.8 million from sales of title plants and real
estate.
NOTE 7
Income taxes. The income tax provision consists of the following:
| 2010 | 2009 | 2008 | ||||||||||
| ($000 omitted) | ||||||||||||
Current: |
||||||||||||
Federal |
(4,305 | ) | (24,968 | ) | (17,329 | ) | ||||||
State |
1,188 | (272 | ) | 1,728 | ||||||||
Foreign |
337 | 6,661 | 7,225 | |||||||||
Deferred: |
||||||||||||
Federal |
(1,197 | ) | 215 | 16,016 | ||||||||
State |
— | (1,393 | ) | (2,908 | ) | |||||||
Foreign |
12,052 | — | — | |||||||||
Income tax expense (benefit) |
8,075 | (19,757 | ) | 4,732 | ||||||||
F-17
Table of Contents
The following reconciles federal income taxes computed at the statutory rate with income taxes as
reported.
| 2010 | 2009 | 2008 | ||||||||||
| ($000 omitted) | ||||||||||||
Expected income tax benefit at 35% (1) |
(1,577 | ) | (24,756 | ) | (84,953 | ) | ||||||
Foreign tax rate differential |
613 | 767 | 107 | |||||||||
Non-taxable
income (non-consolidated subsidiaries for tax) |
832 | 657 | 52 | |||||||||
Intercompany
dividends |
738 | — | — | |||||||||
Research and
development credit |
(1,223 | ) | (616 | ) | — | |||||||
State income tax benefit — net of federal tax benefits |
(178 | ) | (1,665 | ) | (1,180 | ) | ||||||
Tax-exempt interest |
(561 | ) | (1,075 | ) | (3,301 | ) | ||||||
Non-deductible expenses |
2,261 | 1,765 | 2,851 | |||||||||
Adjustments
to deferred tax liabilities |
8,716 | 1,251 | 2,576 | |||||||||
Dividends received deductions on investments |
(656 | ) | (530 | ) | (1,052 | ) | ||||||
Valuation allowance |
(1,146 | ) | 4,297 | 89,454 | ||||||||
Other — net |
256 | 148 | 178 | |||||||||
Income tax expense (benefit) |
8,075 | (19,757 | ) | 4,732 | ||||||||
Effective income tax rates (%) (1) |
(179.2 | ) | 27.9 | (1.9 | ) | |||||||
| (1) | Calculated using loss before taxes and after noncontrolling interests. |
Deferred income taxes at December 31, 2010 and 2009 were as follows:
| 2010 | 2009 | |||||||
| ($000 omitted) | ||||||||
Deferred tax assets: |
||||||||
Accrued expenses |
17,810 | 19,571 | ||||||
Allowance for uncollectible amounts |
5,956 | 6,197 | ||||||
Fixed assets |
11,506 | 14,560 | ||||||
Investments |
7,989 | 4,823 | ||||||
Net operating loss carryforwards |
33,388 | 31,038 | ||||||
Tax credit carryforwards |
14,420 | 15,460 | ||||||
Title loss provisions |
9,416 | 7,392 | ||||||
Other |
3,978 | 2,174 | ||||||
| 104,463 | 101,215 | |||||||
Valuation allowance |
(91,934 | ) | (93,080 | ) | ||||
| 12,529 | 8,135 | |||||||
Deferred tax liabilities: |
||||||||
Amortization — goodwill and other intangibles |
(14,273 | ) | (10,716 | ) | ||||
Unrealized gains on investments |
(2,079 | ) | (1,829 | ) | ||||
Cash surrender value of insurance policies |
(4,710 | ) | (4,608 | ) | ||||
Foreign currency translation adjustments |
(5,626 | ) | (3,913 | ) | ||||
Title plants acquired |
(469 | ) | (461 | ) | ||||
Accrued expenses |
(11,534 | ) | — | |||||
Fixed assets |
(139 | ) | — | |||||
Other |
(1,935 | ) | (2,556 | ) | ||||
| (40,765 | ) | (24,083 | ) | |||||
Net deferred income taxes |
(28,236 | ) | (15,948 | ) | ||||
F-18
Table of Contents
The Company has recorded valuation allowances against U.S. deferred tax assets, net of
definite-lived deferred tax liabilities, for which realization cannot be assured based on a
more-likely-than-not standard. A valuation allowance was initially established in 2008 due to the
Company’s then cumulative three-year operating loss history. The Company routinely evaluates the
extent to which the valuation allowance may be reversed. The Company has approximately $82.1
million of U.S. federal net operating losses and $57.7 million of state net operating loss
carryforwards. The federal net operating loss will begin to expire in 2030, and state net
operating losses will expire between 2014 and 2030. The Company’s effective income tax rate in
2009 was significantly impacted by a benefit of $24.8 million due to the change in tax law in the
fourth quarter 2009, which allowed the Company to carry back net operating losses to prior years.
The Company is routinely subject to income tax examinations by U.S. federal, international and
state and local tax authorities. The Company is currently under a limited examination by the
Internal Revenue Service for calendar year 2005 and by other state and local tax jurisdictions for
calendar years 2006 and 2007. The Company expects no material adjustment from any examination.
NOTE 8
Goodwill and acquired intangibles. A summary of goodwill follows:
| Title | REI | Total | ||||||||||
| ($000 omitted) | ||||||||||||
Balances at December 31, 2008 |
196,710 | 14,191 | 210,901 | |||||||||
Acquisitions |
1,862 | — | 1,862 | |||||||||
Balances at December 31, 2009 |
198,572 | 14,191 | 212,763 | |||||||||
Sale of interests in subsidiaries |
(3,639 | ) | — | (3,639 | ) | |||||||
Deconsolidation of subsidiaries |
(2,263 | ) | — | (2,263 | ) | |||||||
Balances at December 31, 2010 |
192,670 | 14,191 | 206,861 | |||||||||
Amortization expense for acquired intangibles was $1.1 million, $1.8 million and $4.3 million in
2010, 2009 and 2008, respectively. Accumulated amortization of intangibles was $24.3 million and
$23.2 million at December 31, 2010 and 2009, respectively. In each of the years 2011 through 2015,
amortization expense is expected to be less than $1.0 million.
NOTE 9
Equity investees. Certain summarized aggregate financial information for equity investees (in
which the Company typically owns 20% through 50% of the equity) follows:
| 2010 | 2009 | 2008 | ||||||||||
| ($000 omitted) | ||||||||||||
For the year: |
||||||||||||
Revenues |
73,450 | 47,865 | 57,543 | |||||||||
Net earnings |
6,976 | 8,902 | 2,171 | |||||||||
At December 31: |
||||||||||||
Total assets |
31,767 | 24,705 | 27,023 | |||||||||
Notes payable |
1,119 | 521 | 3,877 | |||||||||
Stockholders’ equity |
16,027 | 12,653 | 12,283 | |||||||||
F-19
Table of Contents
Net premium revenues from policies issued by equity investees were approximately $6.9 million, $3.4
million and $5.4 million in 2010, 2009 and 2008, respectively. Earnings related to equity
investees were $2.4 million, $3.1 million and $1.2 million in 2010, 2009 and 2008, respectively.
These amounts are included in title insurance — direct operations in the consolidated statements
of operations, retained earnings and comprehensive earnings.
Goodwill related to equity investees was $11.8 million and $7.9 million at December 31, 2010 and
2009, respectively, and these balances are included in investments in investees in the consolidated
balance sheets. Equity investments, including the related goodwill balances, are reviewed for
impairment.
NOTE 10
Notes payable, convertible senior notes and line of credit.
| 2010 | 2009 | |||||||
| ($000 omitted) | ||||||||
Banks — primarily unsecured, varying payments and rates(1) |
3,096 | 14,194 | ||||||
Other than banks |
5,688 | 5,426 | ||||||
| 8,784 | 19,620 | |||||||
| (1) | Average interest rates were 5.09% and 2.53% at December 31, 2010 and 2009, respectively. |
Principal payments on the notes, based upon the contractual maturities, are due in the amounts of
$2.6 million in 2011, $2.1 million in 2012, $0.8 million in 2013, $0.8 million in 2014 and $2.5
million in 2015.
In 2005, the Company executed an agreement with a bank for loans of $31.2 million bearing interest
at a fixed interest rate of 5.97% per annum. In 2010, the Company repaid the outstanding balance
of the loan.
On October 8, 2009, the Company entered into an agreement providing for the sale of $60.0 million
aggregate principal amount of 6.0% Convertible Senior Notes due 2014 (Notes) to an initial
purchaser for resale to certain qualified institutional buyers in compliance with Rule 144A under
the Securities Act of 1933, as amended. The Company also granted the initial purchaser an option
to purchase up to an additional $5.0 million aggregate principal amount of the Notes to cover
over-allotments, which option was exercised in full on October 9, 2009. The closing of the sale of
the $65.0 million aggregate principal amount of Notes occurred on October 15, 2009. The Notes will
mature in 2014 unless converted earlier and are guaranteed by certain wholly-owned domestic
subsidiaries of the Company.
According to FAS ASC 815-15, Derivatives and Hedging — Embedded Derivatives, and FAS ASC 815-40,
Derivatives and Hedging — Contracts in Entity’s Own Equity, the Company determined that the Notes
contained an embedded derivative related to a cash settlement option. The cash settlement option
was effective until April 30, 2010, when the shareholders approved conversion of the Notes into
Common Stock without restriction or without payment by the Company of cash. The Notes are
currently convertible into shares of the Company’s Common Stock at a conversion rate of 77.6398
shares per $1,000 principal amount of Notes (equal to a conversion price of $12.88 per share),
which will be adjusted for certain antidilutive provisions such as a dividend or distribution of
shares of Common Stock, split or combination of shares of Common Stock; the issuance of rights or
warrants entitling all or substantially all holders of Common Stock to subscribe for or purchase
shares of Common Stock at a price per share less than the average of the Last Reported Sale Prices
of Common Stock (as defined in the Indenture); the distribution of shares of any class of capital
stock of the Company, evidences of its indebtedness, other assets or property of the Company or
rights or warrants to acquire the Company’s capital stock or other securities to all or
substantially all holders of its Common Stock; or any cash dividend or distribution made to all or
substantially all holders of Common Stock during any annual fiscal period that exceeds $0.10 per
share of Common Stock.
F-20
Table of Contents
The Company incurred $3.3 million of debt issuance costs related to the Notes. The issuance costs
were primarily related to discounts, commissions and offering expenses payable by the Company. The
Company recorded the issuance costs in other assets and is amortizing them over the term of the
Notes using the effective interest method. The amortization of the debt issuance costs was $0.5
million and $0.1 million and interest expense on the Notes was $4.2 million and $0.9 million in
2010 and 2009, respectively.
On September 30, 2008, the Company entered into a $241.5 million line of credit agreement with a
bank from which it had acquired auction rate securities (reported as Investments — pledged on the
consolidated balance sheet). The line of credit was a demand loan in an amount equal to the full
par value of the auction rate securities that secured the loan. On June 30, 2010, the Company
exercised its ability to relinquish and transfer all rights to the auction rate securities to the
bank, at par value in accordance with the line of credit agreement, at which time the bank
extinguished the outstanding balance of the line of credit. There was no net impact to the
Company’s 2010 consolidated financial statements as a result of the exercise of its rights under
this agreement.
As of December 31, 2010, the Company also had available a $10.0 million bank line of credit, which
expires in June 2011, under which no borrowings were outstanding.
NOTE 11
Estimated title losses.
| 2010 | 2009 | 2008 | ||||||||||
| ($000 omitted) | ||||||||||||
Balances at January 1 |
503,475 | 463,084 | 441,324 | |||||||||
Provisions: |
||||||||||||
Current year |
97,559 | 109,709 | 107,292 | |||||||||
Previous policy years |
50,879 | 73,072 | 62,089 | |||||||||
Total provisions |
148,438 | 182,781 | 169,381 | |||||||||
Payments: |
||||||||||||
Current year |
(24,118 | ) | (21,801 | ) | (23,608 | ) | ||||||
Previous policy years |
(134,191 | ) | (127,530 | ) | (113,143 | ) | ||||||
Total payments |
(158,309 | ) | (149,331 | ) | (136,751 | ) | ||||||
Effects of changes in foreign currency exchange rates |
2,245 | 6,941 | (10,870 | ) | ||||||||
Balances at December 31 |
495,849 | 503,475 | 463,084 | |||||||||
Provisions for title losses, as a percentage of title operating revenues, were 9.6%, 11.3% and
11.2% in 2010, 2009 and 2008, respectively. The total provisions included charges above the annual provisioning rate of $13.3 million, $31.8 million and
$41.7 million for large title claims, including defalcations, in 2010, 2009 and 2008, respectively. The totals were reduced by insurance recoveries
received of $2.8 million, $11.9 million and $11.6 million in 2010, 2009 and 2008, respectively.
The previous policy years’ title loss
provision amounts in the
year 2010, 2009 and 2008 included reserve strengthening adjustments of $4.8 million, $32.7 million and $32.0 million,
respectively, related to higher than expected loss payment experience for policy years 2005 through 2008; $26.7 million, $26.0 million
and $7.1 million, respectively, related to maintaining a high provisioning rate for title losses due to continued elevated claims
payment experience; and $19.2 million, $13.9 million and $22.1 million, respectively, related to large title losses.
F-21
Table of Contents
For the years ended December 31, 2010 and 2009, the increase in payments relating to previous years
was consistent with the rise in title claims resulting from the real estate market decline.
Typically, the Company experiences a higher frequency of losses, including agency defalcations,
which are reported sooner after policy issuance, in real estate markets
where transaction volumes and prices are decreasing.
NOTE 12
Common Stock and Class B Common Stock. Holders of Common and Class B Common Stock have the same
rights except no cash dividends may be paid on Class B Common Stock. The two classes of stock vote
separately when electing directors and on any amendment to the Company’s certificate of
incorporation that affects the two classes unequally.
A provision of the by-laws requires an affirmative vote of at least two-thirds of the directors to
elect officers or to approve any proposal that may come before the directors. This provision
cannot be changed without a majority vote of each class of stock.
Holders of Class B Common Stock may, with no cumulative voting rights, elect four of nine directors
if 1,050,000 or more shares of Class B Common Stock are outstanding; three directors if between
600,000 and 1,050,000 shares are outstanding; and none if less than 600,000 shares of Class B
Common Stock are outstanding. Holders of Common Stock, with cumulative voting rights, elect the
balance of the nine directors.
Class B Common Stock may be converted by its stockholders into Common Stock on a share-for-share
basis, although the holders of Class B Common Stock have agreed among themselves not to convert
their stock. The agreement may be extended or terminated by them at any time. Such conversion is
mandatory on any transfer to a person who is not a lineal descendant (or spouse or trustee of such
descendant) of William H. Stewart.
At December 31, 2010 and 2009, there were 145,820 shares of Common Stock held by a subsidiary of
the Company. These shares are considered treasury shares but may be issued from time-to-time in
lieu of new shares.
F-22
Table of Contents
NOTE 13
Changes in stockholders’ equity.
| Common | Accumulated | |||||||||||||||||||
| and Class B | Additional paid- | other | ||||||||||||||||||
| Common Stock | in | comprehensive | Treasury | Noncontrolling | ||||||||||||||||
| ($1 par value) | capital | earnings | stock | interests | ||||||||||||||||
| ($000 omitted) | ||||||||||||||||||||
Balances at December 31, 2007 |
18,508 | 122,921 | 19,842 | (4,330 | ) | 15,710 | ||||||||||||||
Stock bonuses and other |
81 | 1,965 | — | — | — | |||||||||||||||
Exercise of stock options and grants |
29 | 540 | — | — | — | |||||||||||||||
Net change in unrealized gains and losses |
— | — | 1,278 | — | — | |||||||||||||||
Net realized gain reclassification |
— | — | (2,300 | ) | — | — | ||||||||||||||
Foreign currency translation |
— | — | (18,527 | ) | — | — | ||||||||||||||
Net earnings attributable to noncontrolling
interests |
— | — | — | — | 5,226 | |||||||||||||||
Subsidiary dividends paid to noncontrolling
interests |
— | — | — | — | (7,660 | ) | ||||||||||||||
Net effect of changes in ownership and other |
— | — | — | — | (49 | ) | ||||||||||||||
Balances at December 31, 2008 |
18,618 | 125,426 | 293 | (4,330 | ) | 13,227 | ||||||||||||||
Stock bonuses and other |
87 | 1,342 | — | — | — | |||||||||||||||
Exercise of stock options and grants |
3 | 54 | — | — | — | |||||||||||||||
Net change in unrealized gains and losses |
— | — | 3,666 | — | — | |||||||||||||||
Net realized gain reclassification |
— | — | (4,547 | ) | — | — | ||||||||||||||
Foreign currency translation |
— | — | 11,548 | — | — | |||||||||||||||
Net earnings attributable to noncontrolling
interests |
— | — | — | — | 8,544 | |||||||||||||||
Subsidiary dividends paid to noncontrolling
interests |
— | — | — | — | (7,579 | ) | ||||||||||||||
Net effect of changes in ownership and other |
— | — | — | — | (402 | ) | ||||||||||||||
Balances at December 31, 2009 |
18,708 | 126,822 | 10,960 | (4,330 | ) | 13,790 | ||||||||||||||
Stock bonuses and other |
143 | 1,284 | — | — | — | |||||||||||||||
Purchase of remaining interest of
consolidated subsidiary |
— | (3,693 | ) | — | — | (506 | ) | |||||||||||||
Provision for Canadian taxes |
— | — | (1,185 | ) | — | — | ||||||||||||||
Net change in unrealized gains and losses |
— | — | 1,448 | — | — | |||||||||||||||
Net realized gain reclassification |
— | — | (1,142 | ) | — | — | ||||||||||||||
Foreign currency translation |
— | — | 3,529 | — | — | |||||||||||||||
Net earnings attributable to noncontrolling
interests |
— | — | — | — | 7,432 | |||||||||||||||
Subsidiary dividends paid to noncontrolling
interests |
— | — | — | — | (7,122 | ) | ||||||||||||||
Net effect of changes in ownership and other |
— | — | — | — | (471 | ) | ||||||||||||||
Balances at December 31, 2010 |
18,851 | 124,413 | 13,610 | (4,330 | ) | 13,123 | ||||||||||||||
F-23
Table of Contents
NOTE 14
Share-based incentives. Stock options activity is summarized as follows:
| Weighted- | ||||||||
| average exercise | ||||||||
| Options | prices ($) | |||||||
December 31, 2008 |
264,400 | 23.37 | ||||||
Exercised |
(2,800 | ) | 20.22 | |||||
Forfeited |
(44,800 | ) | 26.33 | |||||
December 31, 2009 |
216,800 | 22.80 | ||||||
Forfeited |
(33,100 | ) | 17.28 | |||||
December 31, 2010 |
183,700 | 23.80 | ||||||
At December 31, 2010, the weighted-average remaining contractual lives of options outstanding were
2.3 years and there was no intrinsic value of dilutive options. The intrinsic values and tax
benefits of options exercised in 2009 were not material.
In March 2010, the Company granted 51,000 shares of fully vested, unrestricted Common Stock with a
fair value of $0.7 million, which was recorded as compensation expense. Also in March 2010, the
Company granted 37,000 shares of restricted Common Stock with a fair value of $0.5 million. The
restricted Common Stock awards will vest 20% each year over five years beginning after March 10,
2010. Compensation expense associated with restricted stock awards will be recognized over this
vesting period.
The Company granted 42,000 restricted shares for each year during 2009 and 2008. The restricted
shares vested December 31, 2009 and 2008, respectively, to certain executive officers and,
accordingly, the Company recorded compensation expense of approximately $0.7 million and $1.0
million during the years ended December 31, 2009 and 2008, respectively.
In May 2009, the Company approved the Strategic Incentive Pool Plan (SIPP), which is a 34-month
cash incentive plan tied to three quantifiable strategic targets. The total amount of the SIPP
available for distribution will be the cash equivalent of the fair market value of 50,000 shares of
the Company’s Common Stock as of the last trading day of 2010. Subject to certain conditions, and
to the extent each of the three equally weighted, independent targets set out under the plan are
achieved, the cash award would be made in equal amounts to each of the Co-Chief Executive Officers.
At least half of the after-tax cash received by each Co-Chief Executive Officer must be invested
in the Company’s Common Stock within 90 days of the award. The Company accrues compensation
expense in the period in which achievement of targets becomes probable. The Company accrued $0.2
million in compensation expense relating to the SIPP in each of the years ended December 31, 2010
and 2009.
NOTE 15
Earnings per share. The Company’s basic earnings per share is calculated by dividing net earnings
by the weighted-average number of shares of Common Stock and Class B Common Stock outstanding
during the reporting period.
To calculate diluted earnings per share, net income and number of shares are adjusted for the
effects of any dilutive shares. Using the if-converted method, net income is adjusted for interest
expense, net of any tax effects, applicable to the convertible senior notes discussed in Note 10.
The number of shares is adjusted by adding the number of dilutive shares, assuming they are issued,
during the same reporting period. The treasury stock method is used to calculate the dilutive
number of shares related to the Company’s stock option plan.
F-24
Table of Contents
Since the Company reported a net loss for each of the years ended December 31, 2010, 2009 and 2008,
there were no calculations of diluted earnings per share under the treasury stock method.
Also, since the Company reported a net loss after adjustments related to the if-converted method
mentioned above for the years ended December 31, 2010 and 2009, there were no calculations of
diluted per share amounts.
NOTE 16
Reinsurance. As is industry practice, the Company cedes risks to other title insurance
underwriters and reinsurers on certain transactions. However, the Company remains liable if the
reinsurer should fail to meet its obligations. The Company also assumes risks from other
underwriters. Payments and recoveries on reinsured losses were insignificant during the three
years ended December 31, 2010. The total amount of premiums for assumed and ceded risks was less
than 1% of consolidated title revenues in each of the last three years.
NOTE 17
Leases. Lease expense was $45.2 million, $51.1 million and $61.9 million in 2010, 2009 and 2008,
respectively. The future minimum lease payments are summarized as follows (in thousands of
dollars):
2011 |
36,411 | |||
2012 |
28,555 | |||
2013 |
20,726 | |||
2014 |
14,246 | |||
2015 |
12,195 | |||
2016 and after |
8,803 | |||
| 120,936 | ||||
NOTE 18
Contingent liabilities and commitments. The Company routinely holds third-party funds in
segregated escrow accounts pending the closing of real estate transactions. This resulted in a
contingent liability to the Company of approximately $623.3 million at December 31, 2010. In
addition, the Company is contingently liable for disbursements of escrow funds held by agencies in
those cases where specific insured closing guarantees have been issued.
The Company owns a qualified intermediary in tax-deferred property exchanges for customers pursuant
to Section 1031 of the Internal Revenue Code. The Company holds the proceeds from these
transactions until a qualifying exchange can occur. This resulted in a contingent liability to the
Company of approximately $167.9 million at December 31, 2010. As is industry practice, these
escrow and Section 1031 exchanger fund accounts are not included in the consolidated balance
sheets.
As of December 31, 2010, the Company was contingently liable for guarantees of indebtedness owed
primarily to banks and others by certain third parties. The guarantees relate primarily to
business expansion and expire no later than 2019. As of December 31, 2010, the maximum potential
future payments on the guarantees amounted to $5.5 million. Management believes that the related
underlying assets and available collateral, primarily corporate stock and title plants, would
enable the Company to recover amounts paid under the guarantees. The Company believes no reserve
is needed since no loss is expected on these guarantees.
F-25
Table of Contents
In the ordinary course of business, the Company guarantees the third-party indebtedness of certain
of its consolidated subsidiaries. As of December 31, 2010, the maximum potential future payments
on the guarantees are not more than the related notes payable recorded in the consolidated balance
sheets (Note 10). The Company also guarantees the indebtedness related to lease obligations of
certain of its consolidated subsidiaries. The maximum future obligations arising from these
lease-related guarantees are not more than the Company’s future minimum lease payments (Note 17).
In addition, as of December 31, 2010 the Company had unused
letters of credit amounting to $3.2
million, primarily related to workers’ compensation coverage.
The Notes are guaranteed by certain wholly-owned domestic subsidiaries of the Company (Note 10).
NOTE 19
Regulatory and legal developments.
Stewart Title Guaranty Company (STGC) and Stewart Title Guaranty de
Mexico, S.A. de C.V. (STGM) are defendants in a lawsuit pending in
the State District Court of Harris County, Texas, Citigroup Global
Markets Realty Corp. v. Stewart Title Guaranty Company. The
lawsuit was filed in 2008 and concerns 16 owners’ and 16 lenders’
title insurance policies on 16 parcels of land in Mexico issued by
STGM and reinsurance agreements by STGC. Citigroup Global Markets
Realty Corp. asserted claims against STGC under reinsurance of the
lenders’ policies. Thereafter, K.R. Playa VI, S de R.L. de C.V., the
owner of the parcels, asserted claims against STGC and under the
owner’s policies. In the second quarter of 2010, the State District
Court ruled that it had jurisdiction over STGM and denied STGM’s plea
in abatement requesting a stay of the lawsuit in Harris County
pending the determination of the Mexican courts.
The lawsuit alleges breach of contract, deceptive trade practices, bad faith, and violations of the
Texas Insurance Code, against which both STGC and STGM are vigorously
defending. Additionally, the Company believes that certain of the allegations
are controlled by Mexican law, which differs substantially from the
law of the State of Texas. A jury trial began February 15, 2011. Due
to the complex factual and legal issues, including those involving
Mexican law, it is not possible to reasonably estimate the ultimate
outcome of this litigation or determine whether that outcome would
materially affect the Company’s consolidated financial condition or results of
operations.
F-26
Table of Contents
In January 2009, an action was filed by individuals against Stewart Title Guaranty Company, Stewart
Title of California, Inc., Cuesta Title Company and others in the Superior Court of California for
the County of San Luis Obispo alleging that the plaintiffs have suffered damages relating to loans
they made through Hurst Financial Corporation to an individual named Kelly Gearhart and entities
controlled by Gearhart. Thereafter, several other lawsuits making similar allegations, including a
lawsuit filed by several hundred individuals, were filed in San Luis Obispo Superior Court, and one
such lawsuit was removed to the United States District Court for the Central District of
California. The defendants vary from case to case, but Stewart Information Services Corporation,
Stewart Title Company and Stewart Title Insurance Company have also each been sued in at least one
of the cases. Each of the complaints alleges some combination of the following purported causes of
action: breach of contract, negligence, fraud, aiding and abetting fraud, constructive fraud,
breach of fiduciary duty, breach of implied covenant of good faith and fair dealing, financial
elder abuse, violation of California Business and Professions Code Section 17200, negligent
misrepresentation, conversion, conspiracy, alter ego, specific performance and declaratory relief.
The Company has demurred to or moved to dismiss the complaints in the actions where responses to
the complaints have been due. Although the San Luis Obispo Superior Court has sustained demurrers
to certain causes of action and certain individuals and entities and dismissed Stewart Information
Services Corporation from one case without leave to amend, the Court has overruled the demurrers as
to other causes of action. The United States District Court for the Central District of California
granted the Company’s motion to dismiss the First Amended Complaint as to the claim for violation
of the Racketeer Influenced and Corrupt Organizations Act, with prejudice, and remanded the
remainder of the case to the San Luis Obispo Superior Court. Discovery has commenced. Several of the cases were the subject of a court-ordered mediation on February 21-22, 2011. The mediation was adjourned without reaching a settlement, but the mediation process remains open, at the suggestion of the mediator, and may be resumed. No trial dates have been set. The
Company intends to vigorously defend itself against the allegations and does not believe that the
outcome of these matters will materially affect its consolidated financial condition or results of
operations.
In February 2008, an antitrust class action was filed in the United States District Court for the
Eastern District of New York against Stewart Title Insurance Company, Monroe Title Insurance
Corporation, Stewart Information Services Corporation, several other unaffiliated title insurance
companies and the Title Insurance Rate Service Association, Inc. (TIRSA). The complaint alleges
that the defendants violated Section 1 of the Sherman Antitrust Act by collectively filing proposed
rates for title insurance in New York through TIRSA, a state-authorized and licensed rate service
organization.
Complaints were subsequently filed in the United States District Courts for the Eastern and
Southern Districts of New York and in the United States District Courts in Pennsylvania, New
Jersey, Ohio, Florida, Massachusetts, Arkansas, California, Washington, West Virginia, Texas and
Delaware. All of the complaints make similar class action allegations, except that certain of the
complaints also allege violations of the Real Estate Settlement Procedures Act (RESPA) and various
state antitrust and consumer protection laws. The complaints generally request treble damages in
unspecified amounts, declaratory and injunctive relief and attorneys’ fees. To date, 78 such
complaints have been filed, each of which names the Company and/or one or more of its affiliates as
a defendant (and have been consolidated in the aforementioned states), of which seven have been
voluntarily dismissed.
As of February 3, 2011, the Company has obtained dismissals of the claims in Arkansas, California,
Delaware, Florida, Massachusetts, New Jersey, New York, Ohio, Pennsylvania (where the court
dismissed the damages claims and granted defendants summary judgment on the injunctive claims),
Texas and Washington. The Company filed a motion to dismiss in West Virginia (where all
proceedings have been stayed and the docket closed). The plaintiffs have appealed the dismissal in
Ohio to the United States Court of Appeals for the Sixth Circuit and the dismissals in Delaware,
New Jersey and Pennsylvania to the United States Court of Appeals for the Third Circuit. The
dismissals in New York and Texas have been affirmed by the United States Courts of Appeals for the
Second and Fifth Circuits, respectively, and on October 4, 2010, the United States Supreme Court
denied the plaintiffs’ petitions for review of those decisions. The plaintiffs have appealed to
the Second Circuit the dismissal of the RESPA claims by the court in New York. Although the
Company cannot predict the outcome of these actions, it intends to vigorously defend itself against
the allegations and does not believe that the outcome will materially affect its consolidated
financial condition or results of operations.
F-27
Table of Contents
The Company is also subject to other claims and lawsuits arising in the ordinary course of its
business, most of which involve disputed policy claims. In some of these lawsuits, the plaintiff
seeks exemplary or treble damages in excess of policy limits. The Company does not expect that any
of these proceedings will have a material adverse effect on its consolidated financial condition or
results of operations. Along with the other major title insurance companies, the Company is party
to a number of class action lawsuits concerning the title insurance industry. The Company believes
that it has adequate reserves for the various litigation matters and contingencies discussed above
and that the likely resolution of these matters will not materially affect its consolidated
financial condition or results of operations.
The Company is subject to administrative actions and litigation relating to the basis on which
premium taxes are paid in certain states. Additionally, the Company has received various other
inquiries from governmental regulators concerning practices in the insurance industry. Many of
these practices do not concern title insurance. The Company believes that it has adequately
reserved for these matters and does not anticipate that the outcome of these inquiries will
materially affect its consolidated financial condition or results of operations.
The Company is also subject to various other administrative actions and inquiries into its business
conduct in certain of the states in which it operates. While the Company cannot predict the
outcome of the various regulatory and administrative matters, it believes that it has adequately
reserved for these matters and does not anticipate that the outcome of any of these matters will
materially affect its consolidated financial condition or results of operations.
NOTE 20
Variable interest entities. The Company, in the ordinary course of business, enters into joint
ventures and partnerships related to its title operations. These entities have been immaterial to
the Company’s consolidated financial condition and results of operations individually and in the
aggregate. As of December 31, 2010, the Company has no variable interest entities to which it is a
party.
NOTE 21
Segment information. The Company’s two reportable operating segments are title insurance-related
services (title), which includes all corporate-level costs, including interest related to
convertible senior notes, and real estate information (REI). Both segments serve each other and
the real estate and mortgage industries.
The title segment provides services needed to transfer the title in a real estate transaction.
These services include searching, examining, closing and insuring the condition of the title to
real property.
The REI segment includes a diverse group of products and services serving multiple markets. REI
consists primarily of lender services, title technology, foreign and domestic government services,
mapping, title information, Internal Revenue Code Section 1031 tax-deferred property exchanges,
pre-employment services, online filing and transaction management. The single largest customer of
the REI segment accounted for 70.4% of REI revenues in 2010.
F-28
Table of Contents
Under the Company’s internal reporting system, most general corporate expenses are incurred by and
charged to the title segment. Technology operating costs are also charged to the title segment,
except for direct expenditures incurred by the REI segment. All investment income is included in
the title segment as it is primarily generated by the investments of the title underwriters’
operations.
| Title | REI | Total | ||||||||||
| ($000 omitted) | ||||||||||||
2010: |
||||||||||||
Revenues |
1,591,214 | 81,176 | 1,672,390 | |||||||||
Intersegment revenues |
247 | 2,631 | 2,878 | |||||||||
Depreciation and amortization |
18,925 | 2,497 | 21,422 | |||||||||
(Loss) earnings before taxes and
noncontrolling interests |
(29,921 | ) | 32,846 | 2,925 | ||||||||
Identifiable assets |
1,082,083 | 59,123 | 1,141,206 | |||||||||
2009: |
||||||||||||
Revenues |
1,650,407 | 56,895 | 1,707,302 | |||||||||
Intersegment revenues |
266 | 3,167 | 3,433 | |||||||||
Depreciation and amortization |
25,510 | 2,554 | 28,064 | |||||||||
(Loss) earnings before taxes and
noncontrolling interests |
(73,263 | ) | 11,075 | (62,188 | ) | |||||||
Identifiable assets |
1,314,787 | 54,373 | 1,369,160 | |||||||||
2008: |
||||||||||||
Revenues |
1,510,821 | 44,473 | 1,555,294 | |||||||||
Intersegment revenues |
320 | 2,883 | 3,203 | |||||||||
Depreciation and amortization |
32,576 | 8,549 | (1) | 41,125 | ||||||||
Loss before taxes and noncontrolling interests |
(222,332 | ) | (15,165 | )(1) | (237,497 | ) | ||||||
Identifiable assets |
1,381,883 | 66,490 | 1,448,373 | |||||||||
| (1) | Includes a pretax charge of $6.0 million relating to the impairment of internally developed software that the Company subsequently determined will not be deployed into production. |
Revenues for the years ended December 31 in the United States and all international operations
follow:
| 2010 | 2009 | 2008 | ||||||||||
| ($000 omitted) | ||||||||||||
United States |
1,564,057 | 1,610,832 | 1,441,069 | |||||||||
International |
108,333 | 96,470 | 114,225 | |||||||||
| 1,672,390 | 1,707,302 | 1,555,294 | ||||||||||
F-29
Table of Contents
NOTE 22
Quarterly financial information (unaudited).
| Mar 31 | June 30 | Sept 30 | Dec 31 | Total | ||||||||||||||||
| ($000 omitted, except per share) | ||||||||||||||||||||
Revenues: |
||||||||||||||||||||
2010 |
351,313 | 441,541 | 430,065 | 449,472 | 1,672,390 | |||||||||||||||
2009 |
313,459 | 430,763 | 459,991 | 503,089 | 1,707,302 | |||||||||||||||
Net (loss) earnings
attributable to Stewart: |
||||||||||||||||||||
2010 |
(28,963 | ) | 9,428 | (3,028 | ) | 9,981 | (12,582 | ) | ||||||||||||
2009 |
(37,605 | ) | (20,641 | ) | (23,696 | ) | 30,967 | (50,975 | ) | |||||||||||
Diluted (loss) earnings per
share attributable to
Stewart(1): |
||||||||||||||||||||
2010 |
(1.59 | ) | 0.45 | (2) | (0.17 | ) | 0.46 | (2) | (0.69 | ) | ||||||||||
2009 |
(2.07 | ) | (1.14 | ) | (1.30 | ) | 1.49 | (2) | (2.80 | ) | ||||||||||
| (1) | Quarterly per share data may not sum to annual totals due to rounding or effects of dilution in particular quarters but not in annual totals. | |
| (2) | The diluted earnings per share attributable to Stewart was due to dilutive effects of the Convertible Senior Notes (Note 10) using the if-converted method (Note 15). |
F-30
Table of Contents
SCHEDULE I
STEWART INFORMATION SERVICES CORPORATION
(Parent Company)
(Parent Company)
STATEMENTS OF OPERATIONS AND RETAINED EARNINGS
| For the Years Ended December 31, | ||||||||||||
| 2010 | 2009 | 2008 | ||||||||||
| ($000 omitted) | ||||||||||||
Revenues |
||||||||||||
Investment income, including
$22, $169 and $30 from affiliates |
86 | 190 | 1,063 | |||||||||
Other gains |
3,109 | 370 | — | |||||||||
Other income |
68 | 83 | 20 | |||||||||
| 3,263 | 643 | 1,083 | ||||||||||
Expenses |
||||||||||||
Employee costs |
1,388 | 2,774 | (2,918 | ) | ||||||||
Other operating expenses, including
$144, $144 and $144 to affiliates |
5,796 | 3,245 | 14,322 | |||||||||
Depreciation and amortization |
862 | 325 | 750 | |||||||||
Interest |
4,658 | 1,273 | 380 | |||||||||
| 12,704 | 7,617 | 12,534 | ||||||||||
Loss before tax benefit and loss from subsidiaries |
(9,441 | ) | (6,974 | ) | (11,451 | ) | ||||||
Income tax benefit |
(277 | ) | (192 | ) | (3,863 | ) | ||||||
Less loss from subsidiaries |
3,418 | 44,193 | 239,867 | |||||||||
Net loss |
(12,582 | ) | (50,975 | ) | (247,455 | ) | ||||||
Retained earnings at beginning of year |
296,116 | 347,952 | 597,118 | |||||||||
Cash dividends on Common Stock ($0.05, $0.05 and
$0.10 per share in 2010, 2009 and 2008,
respectively) |
(868 | ) | (861 | ) | (1,711 | ) | ||||||
Retained earnings at end of year |
282,666 | 296,116 | 347,952 | |||||||||
See accompanying note to financial statement information.
S-1
Table of Contents
STEWART INFORMATION SERVICES CORPORATION
(Parent Company)
(Parent Company)
BALANCE SHEETS
| As of December 31, | ||||||||
| 2010 | 2009 | |||||||
| ($000 omitted) | ||||||||
Assets |
||||||||
Cash and cash equivalents |
7,591 | 1,046 | ||||||
Short-term investments |
— | 90 | ||||||
| 7,591 | 1,136 | |||||||
Receivables: |
||||||||
Notes, including $12,713 from affiliates in 2009 |
82 | 13,386 | ||||||
Other, including $220 and $1,654 from affiliates |
260 | 1,681 | ||||||
Allowance for uncollectible amounts |
(77 | ) | (635 | ) | ||||
| 265 | 14,432 | |||||||
Property and equipment, at cost: |
||||||||
Land |
— | 2,857 | ||||||
Buildings |
2,287 | 2,771 | ||||||
Furniture and equipment |
3,234 | 3,469 | ||||||
Accumulated depreciation |
(2,094 | ) | (2,058 | ) | ||||
| 3,427 | 7,039 | |||||||
Title plant, at cost |
48 | 48 | ||||||
Investments in subsidiaries, on an equity method basis |
488,053 | 495,716 | ||||||
Goodwill |
8,470 | 8,470 | ||||||
Other assets |
19,546 | 16,920 | ||||||
| 527,400 | 543,761 | |||||||
Liabilities |
||||||||
Convertible senior notes |
64,338 | 64,163 | ||||||
Accounts payable and accrued liabilities, including $14 and $1,956 from affiliates |
27,852 | 31,322 | ||||||
| 92,190 | 95,485 | |||||||
Contingent liabilities and commitments |
||||||||
Stockholders’ equity |
||||||||
Common Stock — $1 par, authorized 50,000,000; issued 17,801,273 and 17,685,976;
outstanding 17,325,046 and 17,209,749 |
17,801 | 17,658 | ||||||
Class B Common Stock— $1 par, authorized 1,500,000; issued and outstanding |
||||||||
1,050,012 |
1,050 | 1,050 | ||||||
Additional paid-in capital |
124,413 | 126,822 | ||||||
Retained earnings(1) |
282,666 | 296,116 | ||||||
Accumulated other comprehensive earnings: |
||||||||
Foreign currency translation adjustments |
11,093 | 7,563 | ||||||
Unrealized investment gains |
2,517 | 3,397 | ||||||
Treasury stock — 476,227 common shares, at cost |
(4,330 | ) | (4,330 | ) | ||||
Total stockholders’ equity |
435,210 | 448,276 | ||||||
| 527,400 | 543,761 | |||||||
| (1) | Includes undistributed earnings of subsidiaries of $331,254 in 2010 and $335,540 in 2009. |
See accompanying note to financial statement information.
S-2
Table of Contents
STEWART INFORMATION SERVICES CORPORATION
(Parent Company)
(Parent Company)
STATEMENTS OF CASH FLOWS
| For the Years Ended December 31, | ||||||||||||
| 2010 | 2009 | 2008 | ||||||||||
| ($000 omitted) | ||||||||||||
Reconciliation of net loss to cash (used) provided by
operating activities: |
||||||||||||
Net loss |
(12,582 | ) | (50,975 | ) | (247,455 | ) | ||||||
Add (deduct): |
||||||||||||
Depreciation and amortization |
862 | 325 | 750 | |||||||||
Provision for bad debt |
(96 | ) | 118 | 462 | ||||||||
Other gains |
(3,109 | ) | (370 | ) | — | |||||||
Decrease in receivables — net |
1,173 | 740 | 915 | |||||||||
(Increase) decrease in other assets — net |
(130 | ) | (498 | ) | 2,634 | |||||||
(Decrease) increase in payables and accrued
liabilities — net |
(1,007 | ) | 6,364 | 1,586 | ||||||||
Net loss from subsidiaries |
3,418 | 44,193 | 239,867 | |||||||||
Other — net |
2,735 | 3,125 | 612 | |||||||||
Cash (used) provided by operating activities |
(8,736 | ) | 3,022 | (629 | ) | |||||||
Investing activities: |
||||||||||||
Collections on notes receivables |
12,842 | 13,691 | 456 | |||||||||
Proceeds from the sale of land and buildings |
6,323 | — | — | |||||||||
Purchases of property and equipment — net |
(3,016 | ) | (2,631 | ) | (22 | ) | ||||||
Increases in notes receivables |
— | (21,522 | ) | (5,162 | ) | |||||||
Proceeds from investments available-for-sale
matured and sold |
— | 11,910 | 19,807 | |||||||||
Purchases of investments available-for-sale |
— | (9 | ) | (9,913 | ) | |||||||
Contributions to subsidiaries |
— | (67,755 | ) | (644 | ) | |||||||
Cash provided (used) by investing activities |
16,149 | (66,316 | ) | 4,522 | ||||||||
Financing activities: |
||||||||||||
Dividends paid |
(868 | ) | (861 | ) | (1,711 | ) | ||||||
Proceeds from issuance of convertible senior notes |
— | 65,000 | — | |||||||||
Payments for debt issuance costs related to
convertible senior notes |
— | (3,299 | ) | — | ||||||||
Proceeds from exercise of stock options |
— | 57 | 569 | |||||||||
Cash (used) provided by financing activities |
(868 | ) | 60,897 | (1,142 | ) | |||||||
Increase (decrease) in cash and cash equivalents |
6,545 | (2,397 | ) | 2,751 | ||||||||
Cash and cash equivalents at beginning of year |
1,046 | 3,443 | 692 | |||||||||
Cash and cash equivalents at end of year |
7,591 | 1,046 | 3,443 | |||||||||
Supplemental information: |
||||||||||||
Income taxes paid |
— | — | 50 | |||||||||
Interest paid |
3,900 | — | — | |||||||||
See accompanying note to financial statement information.
S-3
Table of Contents
STEWART INFORMATION SERVICES CORPORATION
(Parent Company)
(Parent Company)
NOTE TO FINANCIAL STATEMENT INFORMATION
The Parent Company operates as a holding company, transacting substantially all of its business
through its subsidiaries. Its consolidated financial statements are included in Part II, Item 8 of
Form 10-K. The Parent Company financial statements should be read in conjunction with the
aforementioned consolidated financial statements and notes thereto and financial statement
schedules.
Certain prior year amounts in the Parent Company financial statements have been reclassified for
comparative purposes. Net earnings and stockholders’ equity, as previously reported, were not
affected.
Guaranty did not declare a dividend in 2010, 2009 or 2008.
S-4
Table of Contents
SCHEDULE II
STEWART INFORMATION SERVICES CORPORATION AND SUBSIDIARIES
VALUATION AND QUALIFYING ACCOUNTS
December 31, 2010
| Col. C | Col. D | |||||||||||||||||||
| Col. A | Col. B | Additions | Deductions | Col. E | ||||||||||||||||
| Balance | Charged to | Charged to | Balance | |||||||||||||||||
| at | costs | other | At | |||||||||||||||||
| beginning | and | accounts | end | |||||||||||||||||
| Description | of period | expenses | (describe) | (Describe) | of period | |||||||||||||||
| ($000 omitted) | ||||||||||||||||||||
Stewart Information Services Corporation and subsidiaries: |
||||||||||||||||||||
Year ended December 31, 2008: |
||||||||||||||||||||
Estimated title losses |
441,324 | 169,381 | — | 147,621 | (A) | 463,084 | ||||||||||||||
Valuation allowance for deferred tax assets |
414 | 89,615 | — | — | 90,029 | |||||||||||||||
Allowance for uncollectible amounts |
11,613 | 9,116 | — | 3,225 | (B) | 17,504 | ||||||||||||||
Year ended December 31, 2009: |
||||||||||||||||||||
Estimated title losses |
463,084 | 182,781 | — | 142,390 | (A) | 503,475 | ||||||||||||||
Valuation allowance for deferred tax assets |
90,029 | 37,682 | — | 34,631 | (C) | 93,080 | ||||||||||||||
Allowance for uncollectible amounts |
17,504 | 6,526 | — | 3,529 | (B) | 20,501 | ||||||||||||||
Year ended December 31, 2010: |
||||||||||||||||||||
Estimated title losses |
503,475 | 148,438 | — | 156,064 | (A) | 495,849 | ||||||||||||||
Valuation allowance for deferred tax assets |
93,080 | (1,146 | ) | — | — | 91,934 | ||||||||||||||
Allowance for uncollectible amounts |
20,501 | 4,186 | — | 5,249 | (B) | 19,438 | ||||||||||||||
Stewart Information Services Corporation — Parent Company: |
||||||||||||||||||||
Year ended December 31, 2008: |
||||||||||||||||||||
Allowance for uncollectible amounts |
19 | 462 | — | — | 481 | |||||||||||||||
Year ended December 31, 2009: |
||||||||||||||||||||
Allowance for uncollectible amounts |
481 | 154 | — | — | 635 | |||||||||||||||
Year ended December 31, 2010: |
||||||||||||||||||||
Allowance for uncollectible amounts |
635 | (96 | ) | — | 462 | (B) | 77 | |||||||||||||
| (A) | Represents primarily payments of policy and escrow losses and loss adjustment expenses. | |
| (B) | Represents uncollectible accounts written off. | |
| (C) | Represents primarily the carry back net operating losses to prior years. |
S-5
Table of Contents
INDEX TO EXHIBITS
| Exhibit | ||||||
| 3.1 | -
|
Amended and Restated Certificate of Incorporation of the Registrant, dated May 1, 2009 (incorporated by reference in this report from Exhibit 3.1 of the Current Report on Form 8-K filed May 5, 2009) | ||||
| 3.2 | -
|
Certificate of Amendment to Amended and Restated Certificate of Incorporation of the Registrant, dated April 30, 2010 (incorporated by reference in this report from Exhibit 3.2 of the Quarterly Report on Form 10-Q for the quarterly period ended March 31, 2010) | ||||
| 3.3 | -
|
By-Laws of the Registrant, as amended March 13, 2000 (incorporated by reference in this report from Exhibit 3.2 of the Annual Report on Form 10-K for the year ended December 31, 2000) | ||||
| 4.1 | -
|
Rights of Common and Class B Common Stockholders (incorporated by reference to Exhibits 3.1 and 3.2 hereto) | ||||
| 4.2 | -
|
Indenture related to 6.0% Convertible Senior Notes due 2014, dated as of October 15, 2009, by and between the Registrant, the Guarantors party thereto, and Wells Fargo Bank, N.A., as trustee (incorporated by reference from Exhibit 4.1 to the Current Report on Form 8-K filed October 15, 2009) | ||||
| 4.3 | -
|
Form of 6.00% Convertible Senior Note due 2014 (incorporated by reference in this report from Exhibit 4.2 of the Current Report on Form 8-K filed October 15, 2009) | ||||
| 10.1 † | -
|
Deferred Compensation Agreements dated March 10, 1986, amended July 24, 1990 and October 30, 1992, between the Registrant and certain executive officers (incorporated by reference in this report from Exhibit 10.2 of the Annual Report on Form 10-K for the year ended December 31, 1997) | ||||
| 10.2 † | -
|
Stewart Information Services Corporation 1999 Stock Option Plan (incorporated by reference in this report from Exhibit 10.3 of the Annual Report on Form 10-K for the year ended December 31, 1999) | ||||
| 10.3 † | -
|
Stewart Information Services Corporation 2002 Stock Option Plan for Region Managers (incorporated by reference in this report from Exhibit 10.4 of the Quarterly Report on Form 10-Q for the quarter ended March 31, 2002) | ||||
| 10.4 † | -
|
Stewart Information Services Corporation 2005 Long-Term Incentive Plan, as amended and restated May 1, 2009 (incorporated by reference in this report from Exhibit 10.1 of the Current Report on Form 8-K filed May 5, 2009) | ||||
| 10.5 † | -
|
Stewart Information Services Corporation 2008 Strategic Incentive Pool Plan (incorporated by reference in this report from Exhibit 10.1 of the Current Report on Form 8-K dated May 9, 2008) | ||||
| 14.1 | -
|
Code of Ethics for Chief Executive Officers, Principal Financial Officer and Principal Accounting Officer (incorporated by reference in this report from Exhibit 14.1 of the Annual Report on Form 10-K for the year ended December 31, 2004) | ||||
| 21.1 * | -
|
Subsidiaries of the Registrant | ||||
Table of Contents
| Exhibit | ||||||
| 23.1 * | -
|
Consent of KPMG LLP, including consent to incorporation by reference of their reports into previously filed Securities Act registration statements | ||||
| 31.1 * | -
|
Certification of Co-Chief Executive Officer pursuant to Section 302 of the Sarbanes-Oxley Act of 2002 | ||||
| 31.2 * | -
|
Certification of Co-Chief Executive Officer pursuant to Section 302 of the Sarbanes-Oxley Act of 2002 | ||||
| 31.3 * | -
|
Certification of Chief Financial Officer pursuant to Section 302 of the Sarbanes-Oxley Act of 2002 | ||||
| 32.1 * | -
|
Certification of Co-Chief Executive Officer pursuant to Section 906 of the Sarbanes-Oxley Act of 2002 | ||||
| 32.2 * | -
|
Certification of Co-Chief Executive Officer pursuant to Section 906 of the Sarbanes-Oxley Act of 2002 | ||||
| 32.3 * | -
|
Certification of Chief Financial Officer pursuant to Section 906 of the Sarbanes-Oxley Act of 2002 | ||||
| * | Filed herewith | |
| † | Management contract or compensatory plan |