Attached files
| file | filename |
|---|---|
| EX-32.2 - EXHIBIT 32.2 - STEWART INFORMATION SERVICES CORP | ex3222016.htm |
| EX-32.1 - EXHIBIT 32.1 - STEWART INFORMATION SERVICES CORP | ex3212016.htm |
| EX-31.2 - EXHIBIT 31.2 - STEWART INFORMATION SERVICES CORP | ex3122016.htm |
| EX-31.1 - EXHIBIT 31.1 - STEWART INFORMATION SERVICES CORP | ex3112016.htm |
| EX-23.1 - EXHIBIT 23.1 - STEWART INFORMATION SERVICES CORP | ex231kpmgconsent2016.htm |
| EX-21.1 - EXHIBIT 21.1 - STEWART INFORMATION SERVICES CORP | ex211subsidiaries2016.htm |
UNITED STATES
SECURITIES AND EXCHANGE COMMISSION
Washington, D.C. 20549
FORM 10-K
(Mark One)
ý | ANNUAL REPORT PURSUANT TO SECTION 13 OR 15(d) OF THE SECURITIES EXCHANGE ACT OF 1934 |
For the fiscal year ended December 31, 2016
or
¨ | TRANSITION REPORT PURSUANT TO SECTION 13 OR 15(d) OF THE SECURITIES EXCHANGE ACT OF 1934 |
For the transition period from to
Commission file number 001-02658
STEWART INFORMATION SERVICES CORPORATION
(Exact name of registrant as specified in its charter)
Delaware | 74-1677330 | |
(State or other jurisdiction of incorporation or organization) | (I.R.S. Employer Identification No.) | |
1980 Post Oak Blvd., Houston TX | 77056 | |
(Address of principal executive offices) | (Zip Code) | |
Registrant’s telephone number, including area code: (713) 625-8100
Securities registered pursuant to Section 12(b) of the Act:
Common Stock, $1 par value | New York Stock Exchange | |
(Title of each class of stock) | (Name of each exchange on which registered) | |
Securities registered pursuant to Section 12(g) of the Act: None
Indicate by check mark if the registrant is a well-known seasoned issuer, as defined in Rule 405 of the Securities Act. Yes þ No ¨
Indicate by check mark if the registrant is not required to file reports pursuant to Section 13 or Section 15(d) of the Act. Yes ¨ No þ
Indicate by check mark whether the registrant (1) has filed all reports required to be filed by Section 13 or 15(d) of the Securities Exchange Act of 1934 during the preceding 12 months (or for such shorter period that the registrant was required to file such reports), and (2) has been subject to such filing requirements for the past 90 days. Yes þ No ¨
Indicate by check mark whether the registrant has submitted electronically and posted on its corporate Web site, if any, every Interactive Data File required to be submitted and posted pursuant to Rule 405 of Regulation S-T (§232.405 of this chapter) during the preceding 12 months (or for such shorter period that the registrant was required to submit and post such files). Yes þ No ¨
Indicate by check mark if disclosure of delinquent filers pursuant to Item 405 of Regulation S-K is not contained herein, and will not be contained, to the best of registrant’s knowledge, in definitive proxy or information statements incorporated by reference in Part III of this Form 10-K or any amendment to this Form 10-K. þ
Indicate by check mark whether the registrant is a large accelerated filer, an accelerated filer, a non-accelerated filer, or a smaller reporting company. See the definitions of “large accelerated filer,” “accelerated filer” and “smaller reporting company” in Rule 12b-2 of the Exchange Act.
Large accelerated filer | þ | Accelerated filer | ¨ | ||
Non-accelerated filer | ¨ (Do not check if a smaller reporting company) | Smaller reporting company | ¨ | ||
Indicate by check mark whether the registrant is a shell company (as defined in Rule 12b-2 of the Act). Yes ¨ No þ
The aggregate market value of the Common Stock (based upon the closing sales price of the Common Stock of Stewart Information Services Corporation, as reported by the NYSE on June 30, 2016) held by non-affiliates of the Registrant was approximately $937,340,000.
At February 23, 2017, there were 23,431,279 outstanding shares of the issuer's Common Stock, $1 par value per share.
Documents Incorporated by Reference
Portions of the definitive proxy statement (the Proxy Statement) are incorporated herein by reference in Part III of this document.
FORM 10-K ANNUAL REPORT
YEAR ENDED DECEMBER 31, 2016
TABLE OF CONTENTS
Item | Page | |
1 | ||
1A. | ||
1B. | ||
2 | ||
3 | ||
4 | ||
5 | ||
6 | ||
7 | ||
7A. | ||
8 | ||
9 | ||
9A. | ||
9B. | ||
10 | ||
11 | ||
12 | ||
13 | ||
14 | ||
15 | ||
As used in this report, “we,” “us,” “our,” the “Company” and “Stewart” mean Stewart Information Services Corporation and our subsidiaries, unless the context indicates otherwise.
PART I
Item 1. Business
We are a Delaware corporation formed in 1970. We and our predecessors have been engaged in the title business since 1893.
Stewart Information Services Corporation (NYSE-STC) is a global real estate services company, offering products and services through our direct operations, network of Stewart Trusted Providers™ and family of companies. From residential and commercial title insurance and closing and settlement services to specialized offerings for the mortgage industry, we offer the comprehensive service, deep expertise and solutions our customers need for any real estate transaction. At Stewart, we believe in building strong relationships - and these partnerships are the cornerstone of every closing, every transaction and every deal.
Our international division delivers products and services protecting and promoting private land ownership worldwide. Currently, our primary international operations are in Canada, the United Kingdom, Australia and Central Europe.
We currently report our business in two segments: title insurance and related services (title) and ancillary services and corporate. Prior to 2016, we reported three operating segments: title, mortgage services and corporate. Refer to Note 19 to our audited consolidated financial statements and Item 7 – Management’s Discussion and Analysis of Financial Condition and Results of Operations for details regarding our change in reporting operating segments and financial information related to the title and ancillary services and corporate segments.
Title Segment
Title insurance and related services include the functions of searching, examining, closing and insuring the condition of the title to real property. The title segment also includes centralized title services (which include title and closing services, post-closing services, default and REO-related title services), home and personal insurance services and Internal Revenue Code Section 1031 tax-deferred exchanges.
Examination and closing. The purpose of a title examination is to ascertain the ownership of the property being transferred, debts that are owed on it and the scope of the title policy coverage. This involves searching for and examining documents such as deeds, mortgages, wills, divorce decrees, court judgments, liens, paving assessments and tax records.
At the closing or “settlement” of a sale transaction, the seller executes and delivers a deed to the new owner. The buyer typically signs new mortgage documents. Closing funds are then disbursed to the seller, the prior lender, real estate brokers, the title company and others. The documents are then recorded in the public records. A title insurance policy is generally issued to both the new lender and the owner.
Title insurance policies. Lenders in the United States generally require title insurance as a condition to making a loan on real estate, including securitized lending. This is to assure lenders of the priority of their lien position. The purchasers of the property want insurance to protect against claims that may arise against the title to the property. The face amount of the policy is normally the purchase price or the amount of the related loan.
Title insurance is substantially different from other types of insurance. Fire, auto, health and life insurance protect against future losses and events. In contrast, title insurance insures against losses from past events and seeks to protect the public by eliminating covered risks through the examination and settlement process. In essence, subject to its exceptions and exclusions, a title insurance policy provides a warranty to the policyholder that the title to the property is free from defects that might impair ownership rights, or in the case of a lender's policy, that there is priority of lien position. Most other forms of insurance provide protection for a limited period of time and, hence the policy must be periodically renewed. Title insurance, however, is issued for a one-time premium and the policy provides protection for as long as the owner owns the property or has liability in connection with the property. Also, a title insurance policy does not have a finite contract term, whereas most other lines of insurance have a definite beginning and ending date for coverage. Although a title insurance policy provides protection as long as the owner owns the property being covered, the title insurance company generally does not have information about which policies are still effective. Most other lines of insurance receive periodic premium payments and policy renewals thereby allowing the insurance company to know which policies are effective.
1
Losses. Losses on policies occur when a title defect is not discovered during the examination and settlement process. Reasons for losses include forgeries, misrepresentations, unrecorded or undiscovered liens, the failure to pay off existing liens, mortgage lending fraud, mishandling or defalcation of settlement funds, issuance by title agencies of unauthorized coverage and defending policyholders when covered claims are filed against their interest in the property.
Some claimants seek damages in excess of policy limits. Those claims are based on various legal theories. We vigorously defend against spurious claims and provide protection for covered claims up to the limits set forth in the policy. We have from time-to-time incurred losses in excess of policy limits.
Experience shows that most policy claims and claim payments are made in the first six years after the policy has been issued, although claims can also be incurred and paid many years later. By their nature, claims are often complex, vary greatly in dollar amounts and are affected by economic and market conditions and the legal environment existing at the time claims are processed.
Our liability for estimated title losses comprises both known claims and our estimate of claims that may be reported in the future. The amount of our loss reserve represents the aggregate future payments (net of recoveries) that we expect to incur on policy losses and in costs to settle claims. In accordance with industry practice, these amounts have not been discounted to their present values.
Estimating future title loss payments is difficult due to the complex nature of title claims, the length of time over which claims are paid, the significant variance in dollar amounts of individual claims and other factors. The amounts provided for policy losses are based on reported claims, historical loss payment experience, title industry averages and the current legal and economic environment. Estimated provisions for current year policy losses are charged to income in the same year the related premium revenues are recognized. Annual provisions for policy losses also include changes in the estimated aggregate liability on policies issued in prior years. Actual loss payment experience relating to policies issued in previous years, including the impact of large losses, is the primary reason for increases or decreases in our annual loss provision.
Amounts shown as our estimated liability for future loss payments are continually reviewed by us for reasonableness and adjusted as appropriate. We have consistently followed the same basic method of estimating and recording our loss reserves for more than 10 years. As part of our process, we also obtain input from third-party actuaries regarding our methodology and resulting reserve calculations. While we are responsible for determining our loss reserves, we utilize this actuarial input to assess the overall reasonableness of our reserve estimation.
See “Critical Accounting Estimates - Title Loss Reserves” for information on current year policy losses and consolidated balance sheet reserves.
Factors affecting revenues. Title insurance revenues are closely related to the level of activity in the real estate markets we serve and the prices at which real estate sales are made. Real estate sales are directly affected by the availability and cost of money to finance purchases. Other factors include consumer confidence and demand by buyers. In periods of low interest rates, loan refinancing transactions are also an important contributor to revenues. These factors may override the seasonal nature of the title business. Generally, our first quarter is the least active and our second and third quarters are the most active in terms of title insurance revenues.
Selected information from the U.S. Department of Housing and Urban Development and National Association of Realtors® for the U.S. real estate industry follows (2016 figures are preliminary and subject to revision):
2016 | 2015 | 2014 | |||||||
New home sales – in millions | 0.56 | 0.50 | 0.44 | ||||||
Existing home sales – in millions | 5.45 | 5.25 | 4.94 | ||||||
Existing home sales – median sales price in $ thousands | 233.9 | 222.4 | 208.3 | ||||||
2
Customers. The primary sources of title insurance business are attorneys, builders, developers, home buyers and home sellers, lenders, mortgage brokers, and real estate brokers and agents. No individual customer was responsible for as much as 10% or more of our consolidated revenues in any of the last three years. Titles insured include residential and commercial properties, undeveloped acreage, farms, ranches, wind and solar power installations and other energy-related projects.
Service, location, financial strength, company size and related factors affect customer acceptance. Increasing market share is accomplished primarily by providing superior service. The parties to a closing are concerned with accuracy, timeliness and cost. The rates charged to customers are regulated, to varying degrees, in most states.
The financial strength and stability of the title underwriter are important factors in maintaining and increasing our business, particularly commercial business. We are rated as investment grade by the title industry’s leading rating companies. Our principal underwriter, Stewart Title Guaranty Company (Guaranty), is currently rated “A” by Demotech Inc., "A-" by Fitch Ratings Ltd., "A-" by A.M. Best and "B+" by Kroll Bond Rating Agency Inc.
Market share. Title insurance statistics are compiled quarterly by the title industry’s national trade association. Based on 2016 unconsolidated statutory net premiums written through September 30, 2016, Guaranty is one of the leading title insurers in the United States.
Our principal competitors are Fidelity National Financial, Inc. (which includes Fidelity National Title Insurance Company, Chicago Title Insurance Company and Commonwealth Land Title Insurance Company), First American Financial Corporation (which includes First American Title Insurance Company) and Old Republic Title Insurance Group (which includes Old Republic National Title Insurance Company). We also compete with other independent title insurer companies, as well as abstractors, attorneys who issue title opinions and attorney-owned title insurance funds. A number of homebuilders, financial institutions, real estate brokers and others own or control title insurance agencies, some of which issue policies underwritten by Guaranty.
Title insurance revenues by geographic location. The approximate amounts and percentages of our consolidated title operating revenues were:
Amounts ($ millions) | Percentages | |||||||||||||||||
2016 | 2015 | 2014 | 2016 | 2015 | 2014 | |||||||||||||
Texas | 362 | 341 | 338 | 19 | 18 | 20 | ||||||||||||
New York | 226 | 250 | 238 | 12 | 13 | 14 | ||||||||||||
California | 125 | 142 | 123 | 7 | 8 | 7 | ||||||||||||
International | 116 | 107 | 118 | 6 | 6 | 7 | ||||||||||||
Florida | 87 | 88 | 73 | 5 | 5 | 4 | ||||||||||||
All others | 988 | 960 | 824 | 51 | 50 | 48 | ||||||||||||
1,904 | 1,888 | 1,714 | 100 | 100 | 100 | |||||||||||||
Regulations. Title insurance companies are subject to comprehensive state regulations covering premium rates, agency licensing, policy forms, trade practices, reserve requirements, investments and the transfer of funds between an insurer and its parent or its subsidiaries and any similar related party transactions. Kickbacks and similar practices are prohibited by most state and federal laws. (See Item 1A, Risk Factors - Our Insurance Subsidiaries Must Comply With Extensive Government Regulations.)
Ancillary Services and Corporate Segment
The segment is comprised of the parent holding company, our centralized administrative services departments and our ancillary services operations. Our ancillary services operations primarily provide appraisal and valuation services to the mortgage industry through Stewart Lender Services (SLS).
Factors affecting ancillary services revenues. As in the title segment, ancillary services revenues, particularly those generated by lender services, are closely related to the level of activity in the real estate market, including the volume of originations (new or refinancing), foreclosures or other distressed property activity. Revenues related to some services are generated on a project basis or through longer term contracts.
3
Companies that compete with our ancillary services businesses vary across a wide range of industries and include the major title insurance underwriters mentioned under “Title Segment - Market share” as well as other real estate technology and business process outsourcing providers.
Customers. Customers for our ancillary services products and services primarily include mortgage lenders and servicers, mortgage brokers and mortgage investors.
Many of the services and products offered by our ancillary services business are used by professionals and intermediaries who have been retained to assist consumers with the sale, purchase, mortgage, transfer, recording and servicing of real estate transactions. To that end, timely, accurate and compliant services are critical to our customers since these factors directly affect the service they provide to their customers. Financial strength, scale, robust processes to ensure legal and regulatory compliance, marketplace presence and reputation as a reliable, compliant solution are important factors in attracting new business.
General
Investment policies. Our investment portfolios reside in two domestic and two international regulated insurance underwriters. These underwriters maintain investments in accordance with certain statutory requirements for the funding of premium reserves and deposits, or, in the case of our international operations, for the maintenance of certain capital ratios required by regulators. The activities of the portfolios are overseen by investment committees comprised of certain senior executives. Their oversight includes such activities as policy setting, determining appropriate asset classes with different and distinct risk/return profiles so as to prudently diversify the portfolio, and to approve all service vendors (managers and custodians). We also utilize the expertise of third-party investment advisors to maximize returns while managing risk. Our investment policies are designed to comply with regulatory requirements as applicable law imposes restrictions upon the types and amounts of investments that may be made by the regulated insurance subsidiaries.
Our investment policies further provide that investments are to be managed with a view to balancing profitability, liquidity, and risk (interest rate risk, credit risk and liquidity risk) while mindful of negatively impacting earnings per share and income taxes.
As of December 31, 2016, approximately 94% of our combined debt and equity investment portfolios consisted of fixed income securities. As of that date, approximately 86% of the fixed income investments are held in securities that are A-rated or higher, and substantially all of the fixed income portfolios are rated investment grade or higher. Percentages are based on the market value of the securities. Credit ratings are based on Standard & Poor’s Rating Services and Moody’s Investor Services, Inc. published ratings. If a security was rated differently by both ratings agencies, the lower of the two ratings was selected.
In addition to our debt and equity investment securities portfolios, we maintain certain money-market and other short-term investments.
Trademarks. We have developed and acquired numerous automated products and processes that are crucial to both our title and ancillary services segments. These systems automate most facets of the real estate transaction. Among these trademarked products and processes are AIM+®, AgencySecure®, TitleWorkPlace™, LenderExpressQuote®, Stewart Online™, Property Profiles™, Stewart Select™, PropertyInfo®, SureClose®, TitleSearch®, Virtual Underwriter® and Stewart Access®. We consider these trademarks, which are perpetual in duration, to be important to our business.
Employees. As of December 31, 2016, we employed approximately 6,350 people. We consider our relationship with our employees to be good.
Available information. We file annual, quarterly and other reports and information with the Securities and Exchange Commission (SEC) under the Securities Exchange Act of 1934, as amended (Exchange Act). You may read and copy any material that we file with the SEC at the SEC’s Public Reference Room at 100 F Street, NE, Washington, DC 20549. You may obtain additional information about the Public Reference Room by calling the SEC at (800) SEC-0330. In addition, the SEC maintains an Internet site (www.sec.gov) that contains reports, proxy and other information statements, and other information regarding issuers that file electronically with the SEC.
4
We also make available upon written request, free of charge, or through our Internet site (www.stewart.com), our annual reports on Form 10-K, quarterly reports on Form 10-Q, current reports on Form 8-K, Code of Ethics and, if applicable, amendments to those reports filed or furnished pursuant to Section 13(a) or 15(d) of the Exchange Act, as soon as reasonably practicable after we electronically file such material with, or furnish it to, the SEC.
Transfer agent. Our transfer agent is Computershare, which is located at P.O. Box 30170, College Station, TX, 77842-3170. Its phone number is (888) 478-2392 and website is (www.computershare.com/investor).
CEO and CFO certifications. The CEO and CFO certifications required under Section 302 of the Sarbanes-Oxley Act are filed as exhibits to our 2016 Form 10-K. Stewart Information Services Corporation submitted in 2016 its annual CEO Certification under a Section 303A.12(a) of the New York Stock Exchange Listed Company Manual.
Item 1A. Risk Factors
You should consider the following risk factors, as well as the other information presented in this report and our other filings with the SEC, in evaluating our business and any investment in Stewart. These risks could materially and adversely affect our business, financial condition and results of operations. In that event, the trading price of our Common Stock could decline materially.
Adverse changes in economic conditions, especially those affecting the levels of real estate and mortgage activity, may reduce our revenues.
Our financial condition and results of operations are affected by changes in economic conditions, particularly mortgage interest rates, credit availability, real estate prices and consumer confidence. Our revenues and earnings have fluctuated in the past due to the cyclical nature of the housing industry and we expect them to fluctuate in the future.
The demand for our title insurance-related and mortgage services offerings is dependent primarily on the volume of residential and commercial real estate transactions. The volume of these transactions historically has been influenced by such factors as mortgage interest rates, availability of financing and the overall state of the economy. Typically, when interest rates are increasing or when the economy is experiencing a downturn, real estate activity declines. As a result, the title insurance industry tends to experience decreased revenues and earnings. Increases in interest rates may also have an adverse impact on our bond portfolio and the amount of interest we pay on our floating-rate bank debt.
Our revenues and results of operations have been and may in the future be adversely affected by a decline in home prices, real estate activity and the availability of financing alternatives. In addition, weakness or adverse changes in the level of real estate activity could have a material adverse effect on our consolidated financial condition or results of operations.
Our claims experience may require us to increase our provision for title losses or to record additional reserves, either of which would adversely affect our earnings.
We estimate our future loss payments and our assumptions about future losses may prove inaccurate. Provisions for policy losses on policies written within a given year are charged to income in the same year the related premium revenues are recognized. The amounts provided are based on reported claims, historical loss payment experience, title industry averages and the current legal and economic environment. Losses that are higher than anticipated are an indication that total losses for a given policy year may be higher than originally calculated. Changes in the total estimated future loss for prior policy years are recorded in the period in which the estimate changes. Claims are often complex and involve uncertainties as to the dollar amount and timing of individual payments. Claims are often paid many years after a policy is issued. From time-to-time, we experience large losses, including losses from independent agency defalcations, from title policies that have been issued or worsening loss payment experience, any of which may require us to increase our title loss reserves. These events are unpredictable and may have a material adverse effect on our earnings.
5
Competition in the title insurance industry may affect our revenues.
Competition in the title insurance industry is intense, particularly with respect to price, service and expertise. Larger commercial customers and mortgage originators also look to the size and financial strength of a title insurer. Although we are one of the leading title insurance underwriters based on market share, Fidelity National Financial, Inc., Old Republic Title Insurance Group and First American Financial Corporation each has substantially greater revenues than we do and their holding companies have significantly greater capital. Further, the other independent title insurance companies collectively hold a relatively small but considerable share of the market. Although we are not aware of any current initiatives to reduce regulatory barriers to entering our industry, any such reduction could result in new competitors, including financial institutions, entering the title insurance business. Competition among the title insurance companies and any new entrants could lower our premium and fee revenues. From time-to-time, new entrants enter the marketplace with alternative products to traditional title insurance, although many of these alternative products have been disallowed by title insurance regulators. Further, advances in technologies such as Blockchain could, over time, significantly disrupt the traditional business model of financial services companies, including title insurance. These alternative products or disruptive technologies, if permitted by regulators, could have a material adverse effect on our revenues and earnings.
Availability of credit may reduce our liquidity and negatively impact our ability to fund operations.
We expect that cash flows from operations and cash available from our underwriters, subject to regulatory restrictions, will be sufficient to fund our operations, pay our claims and fund operational initiatives. To the extent that these funds are not sufficient, we may be required to borrow funds on less than favorable terms or seek funding from the equity market, which may be on terms that are dilutive to existing shareholders.
A downgrade of our underwriters by rating agencies may reduce our revenues.
Ratings are a significant component in determining the competitiveness of insurance companies with respect to commercial title policies. Our principal underwriter, Guaranty, is currently rated “A” by Demotech, Inc., "A-" by Fitch, "A-" by A. M. Best and "B+" by Kroll Bond Rating Agency. Guaranty has historically been highly rated by the rating agencies that cover us. These ratings are not credit ratings. Instead, the ratings are based on quantitative, and in some cases qualitative, information and reflect the conclusions of the rating agencies with respect to our financial strength, results of operations and ability to pay policyholder claims. Our ratings are subject to continual review by the rating agencies and we cannot be assured that our current ratings will be maintained. If our ratings are downgraded from current levels by the rating agencies, our ability to retain existing customers and develop new customer relationships may be negatively impacted, which could result in a material adverse impact on our consolidated financial condition or results of operations.
Our insurance subsidiaries must comply with extensive government regulations. These regulations could adversely affect our ability to increase our revenues and operating results.
The Consumer Financial Protection Bureau (CFPB) is charged with protecting consumers by enforcing Federal consumer protection laws and regulations. The CFPB is an independent agency and funded by the United States Federal Reserve System. Its jurisdiction includes banks, credit unions, securities firms, payday lenders, mortgage servicing operations, foreclosure relief services, debt collectors and other financial companies. The nature and extent of these regulations include, but are not limited to:
• | conducting rule-making, supervision, and enforcement of Federal consumer protection laws; |
• | restricting unfair, deceptive, or abusive acts or practices; |
• | taking consumer complaints; |
• | promoting financial education; |
• | researching consumer behavior; |
• | monitoring financial markets for new risks to consumers; and |
• | enforcing laws that outlaw discrimination and other unfair treatment in consumer finance. |
Effective on October 3, 2015, the CFPB’s integrated disclosure rule for mortgage loan applications, known as "Know Before You Owe", imposed new requirements for us and other mortgage industry participants regarding required mortgage disclosures and forms. Compliance with the integrated disclosure also altered related business processes and interactions with customers.
6
Governmental authorities regulate our insurance subsidiaries in the various states and international jurisdictions in which we do business. These regulations generally are intended for the protection of policyholders rather than stockholders. The nature and extent of these regulations vary from jurisdiction to jurisdiction, but typically involve:
• | approving or setting of insurance premium rates; |
• | standards of solvency and minimum amounts of statutory capital and surplus that must be maintained; |
• | limitations on types and amounts of investments; |
• | establishing reserves, including statutory premium reserves, for losses and loss adjustment expenses; |
• | regulating underwriting and marketing practices; |
• | regulating dividend payments and other transactions among affiliates; |
• | prior approval for the acquisition and control of an insurance company or of any company controlling an insurance company; |
• | licensing of insurers, agencies and, in certain states, escrow officers; |
• | regulation of reinsurance; |
• | restrictions on the size of risks that may be insured by a single company; |
• | deposits of securities for the benefit of policyholders; |
• | approval of policy forms; |
• | methods of accounting; and |
• | filing of annual and other reports with respect to financial condition and other matters. |
These regulations may impede or impose burdensome conditions on rate increases or other actions that we might want to take to enhance our operating results.
We may also be subject to additional state or federal regulations prescribed by legislation such as the Dodd-Frank Act or by regulations issued by the CFPB, Department of Labor, Office of the Comptroller of the Currency or other agencies. Changes in regulations may have a material adverse effect on our business. In addition, state regulators perform periodic examinations of insurance companies, which could result in increased compliance or litigation expenses.
Rapid changes in our industry require secure, timely and cost-effective technological responses. Our earnings may be adversely affected if we are unable to effectively use technology to address regulatory changes and increase productivity.
We believe that our future success depends on our ability to anticipate changes in the industry and to offer products and services that meet evolving standards on a timely and cost-effective basis. To do so requires a flexible technology architecture which can continuously comply with changing regulations, improve productivity, lower costs, reduce risk and enhance the customer experience. Any unanticipated downtime in our technology may have a material adverse effect on our earnings.
We rely on dividends from our insurance underwriting subsidiaries.
We are a holding company and our principal assets are our insurance underwriting subsidiaries. Consequently, we depend on receiving sufficient dividends from our insurance subsidiaries to meet our debt service obligations and to pay our parent company's operating expenses and dividends to our stockholders. The insurance statutes and regulations of some states require us to maintain a minimum amount of statutory capital and restrict the amount of dividends that our insurance subsidiaries may pay to us. Guaranty is a wholly owned subsidiary of Stewart and the principal source of our cash flow. In this regard, the ability of Guaranty to pay dividends to us is dependent on the approval of the Texas Insurance Commissioner.
Claims by large classes of claimants may impact our financial condition or results of operations.
We are periodically involved in litigation arising in the ordinary course of business. In addition, we are currently, and have been in the past, subject to claims and litigation from large classes of claimants seeking substantial damages not arising in the ordinary course of business. Material pending legal proceedings, if any, not in the ordinary course of business, are disclosed in Item 3—Legal Proceedings included elsewhere in this report. To date, the impact of the outcome of these proceedings has not been material to our consolidated financial condition or results of operations. However, an unfavorable outcome in any litigation, claim or investigation against us could have a material adverse effect on our consolidated financial condition or results of operations.
7
Information technology systems present potential targets for cyber security attacks.
Our operations are reliant on technology. These systems are used to store and process sensitive information regarding our operations, financial position and any information pertaining to our customers and vendors. While we take the utmost precautions, we cannot guarantee safety from all cyber threats and attacks to our systems. Any successful breach of security could result in the spread of inaccurate or confidential information, disruption of operations, endangerment of employees, damage to our assets and increased costs to respond. Although we maintain cyber liability insurance to protect us financially, there is no assurance that the instances noted above would not have a negative impact on cash flows, litigation status and/or our reputation, which could have a material adverse effect on our business, financial condition and results of operations.
Unfavorable economic or other business conditions could cause us to record an impairment of all or a portion of our goodwill and other intangible assets.
We annually perform an impairment test of the carrying value of goodwill and other indefinite-lived intangible assets in the third quarter using June 30 balances. However, an evaluation may be made whenever events may indicate an impairment has occurred. In assessing whether an impairment has occurred, we consider whether the performance of our reporting units may be below projections, unexpected declines in our market capitalization, negative macroeconomic trends or negative industry and company-specific trends. If we conclude that the carrying values of these assets exceed the fair value, we may be required to record an impairment of these assets. As of December 31, 2016, the balances of our goodwill and other intangible assets were $217.1 million and $10.9 million, respectively. Any substantial impairment that may be required in the future could have a material adverse effect on our results of operations or financial condition.
Failures at financial institutions at which we deposit funds could adversely affect us.
We deposit substantial operating and fiduciary funds, which are third-party funds, in many financial institutions in excess of insured deposit limits. In the event that one or more of these financial institutions fail, there is no guarantee that we could recover the deposited funds in excess of federal deposit insurance, and, as such, we could be held liable for the funds owned by third parties. Under these circumstances, our liability could have a material adverse effect on our results of operations or financial condition.
Our investment portfolio is subject to interest rate and other risks and could experience losses.
We maintain a substantial investment portfolio, primarily consisting of fixed income debt securities and, to a lesser extent, equity securities. Our portfolio holdings are subject to certain economic and financial market risks, including credit and interest rate risk and/or liquidity risk. Instability in credit markets and economic conditions can increase the risk of loss in our portfolio. Periodically, we measure the fair value of the investments against the carrying value. If the carrying value of the investments exceeds the fair value, and we conclude the decline is other-than-temporary, we are required to record an impairment of the investments. The impairment could have a material adverse effect on our results of operations or financial condition.
8
Our business could be disrupted as a result of a threatened proxy contest and other actions of activist stockholders.
We have been, and may be, the subject of actions taken by activist stockholders. In 2016, we entered into settlement agreements with two of our shareholders, Starboard Value LP and Foundation Asset Management, LP, the terms of which are more specifically set forth in those agreements which were filed pursuant to a Form 8-K filing on or about October 17, 2016.
Should activist activities occur, then our business could be adversely affected because we may have difficulty attracting and retaining customers, agents, mortgage lenders, servicers, employees and board members due to perceived uncertainties as to our future direction and negative public statements about our business; such activities may materially harm our relationships with current and potential customers, investors, lenders, and others; may otherwise materially harm our business, may adversely affect our operating results and financial condition; responding to proxy contests and other similar actions by stockholders is likely to result in our incurring substantial additional costs, including, but not limited to, legal fees, fees for financial advisors, fees for investor relations advisors, and proxy solicitation fees; significantly divert the attention of management, our Board of Directors and our employees; and changes in the composition of our Board of Directors due to future activist campaigns may affect the Company's current strategic plan.
We cannot predict, and no assurances can be given as to, the outcome or timing of any matters relating to actions by activist stockholders or the ultimate impact on our business, liquidity, financial condition or results of operations.
Item 1B. Unresolved Staff Comments
None.
Item 2. Properties
We lease under a non-cancelable operating lease expiring in 2019 approximately 187,000 square feet in an office building in Houston, Texas, which is used for our corporate offices and for offices of several of our subsidiaries. In addition, we lease offices at approximately 570 additional locations for title office operations, production, administrative and technology centers. These additional locations include significant leased facilities in Houston, Texas; Glendale, California; Dallas, Texas; New York, New York; Wilmington, Delaware; Tampa, Florida; St. Louis, Missouri; San Diego, California; and Toronto, Canada.
Our leases expire from 2017 through 2026 and have an average term of 4.6 years, although our typical lease term ranges from three to five years. We believe we will not have any difficulty obtaining renewals of leases as they expire or, alternatively, leasing comparable properties. The aggregate annual rent expense under all leases was approximately $41.3 million in 2016.
We also own office buildings in Arizona, Texas, New York, New Mexico, Colorado and the United Kingdom. These owned properties are not material to our consolidated financial condition. We consider all buildings and equipment that we own or lease to be well maintained, adequately insured and generally sufficient for our purposes.
Item 3. Legal Proceedings
See discussion of legal proceedings in Note 18 to the audited consolidated financial statements included in Item 15 of Part IV of this report, which is incorporated by reference into this Part I, Item 3 of this report on Form 10-K for the year ended December 31, 2016.
Item 4. Mine Safety Disclosures
None.
9
PART II
Item 5. Market for Registrant’s Common Equity, Related Stockholder Matters and Issuer Purchases of Equity Securities
Market, Holders and Dividends Information
Our Common Stock is listed on the New York Stock Exchange (NYSE) under the symbol “STC”. The following table sets forth the high and low sales prices of our Common Stock for each fiscal period indicated, as reported by the NYSE.
High | Low | |||||||
2016: | ||||||||
First quarter | $ | 36.99 | $ | 30.34 | ||||
Second quarter | 41.78 | 33.33 | ||||||
Third quarter | 48.60 | 41.06 | ||||||
Fourth quarter | 48.17 | 41.62 | ||||||
2015: | ||||||||
First quarter | $ | 41.83 | $ | 35.12 | ||||
Second quarter | 41.15 | 35.57 | ||||||
Third quarter | 41.74 | 37.25 | ||||||
Fourth quarter | 44.01 | 36.27 | ||||||
As of February 23, 2017, the number of stockholders of record was approximately 5,772 and the price of one share of our Common Stock was $45.32.
During 2016, the Company declared and paid quarterly dividends of $0.30 per share, or a total of $1.20 per share for the year. During 2015, the Company declared and paid dividends of $0.25 per share in the second and third quarters and $0.30 per share in the fourth quarter. Additionally, during 2016, the Company paid $12.0 million in cash to the holders of the Class B Common Stock pursuant to an agreement involving the exchange and subsequent retirement of the Class B Common Stock. Such payment was treated as a dividend for calculating earnings per share (refer to Note 14 to our audited consolidated financial statements).
Book value per share was $27.69 and $27.30 at December 31, 2016 and 2015, respectively. As of December 31, 2016, book value per share was based on approximately $648.8 million in stockholders’ equity and 23,431,279 shares of Common Stock outstanding. As of December 31, 2015, book value per share was based on approximately $637.1 million in stockholders’ equity and 23,341,106 shares of Common Stock and Class B Common Stock outstanding.
Stock Performance Graph
The following graph compares the yearly percentage change in our cumulative total stockholder return on Common Stock with the cumulative total return of the Russell 2000 Index and the Russell 2000 Financial Services Sector Index for the five years ended December 31, 2016. The graph assumes that the value of the investment in our Common Stock and each index was $100 at December 31, 2011 and that all dividends were reinvested.
10
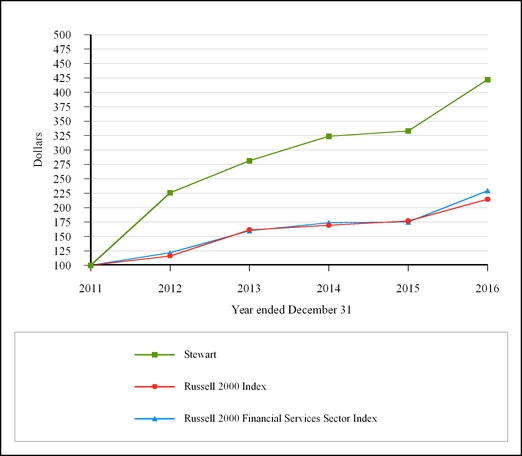
2011 | 2012 | 2013 | 2014 | 2015 | 2016 | |||||||||||||
Stewart | 100.00 | 225.97 | 281.34 | 323.80 | 333.04 | 422.08 | ||||||||||||
Russell 2000 Index | 100.00 | 116.30 | 161.46 | 169.35 | 176.82 | 214.45 | ||||||||||||
Russell 2000 Financial Services Sector Index | 100.00 | 121.65 | 159.85 | 174.01 | 175.05 | 229.41 | ||||||||||||
The performance graph above and the related information shall not be deemed “soliciting material” or to be “filed” with the SEC, nor shall such information be incorporated by reference into any future filing under the Securities Act of 1933, as amended, or the Exchange Act, as amended, except to the extent that the Company specifically incorporates it by reference into such filing.
Stock Repurchases
In November 2015, we announced a stock repurchase program which may return up to $50.0 million to stockholders over a three-year period starting in 2016. Under the stock repurchase program, we have the ability to purchase shares of our outstanding Common Stock in both open market and privately negotiated transactions as we deem appropriate. The timing, form and amount of share repurchases under the program will depend on a variety of factors including: market conditions, share price, our capital and liquidity position relative to internal and rating agency targets, legal requirements (including approval of the release of cash from Guaranty by the insurance regulators) and corporate and other considerations. There were no stock repurchases during 2016, except for repurchases of approximately 22,800 shares (aggregate purchase price of approximately $1.1 million) related to statutory income tax withholding on the vesting of restricted share grants to executives and senior management. The repurchases related to statutory tax withholding on vesting of shares are not included in the above stock repurchase program.
11
Item 6. Selected Financial Data
The following table sets forth selected consolidated financial data, which were derived from our consolidated financial statements and should be read in conjunction with our audited consolidated financial statements, including the Notes thereto, beginning on page F-1 of this report. See also Item 7 – Management’s Discussion and Analysis of Financial Condition and Results of Operations.
2016 | 2015 | 2014 | 2013 | 2012 | |||||||||||
($ millions, except share and per share data) | |||||||||||||||
Total revenues | 2,006.6 | 2,033.9 | 1,870.8 | 1,928.0 | 1,910.4 | ||||||||||
Title operating revenues | 1,904.1 | 1,888.4 | 1,714.4 | 1,810.0 | 1,745.5 | ||||||||||
Ancillary services revenues | 84.3 | 130.0 | 132.9 | 103.5 | 143.5 | ||||||||||
Investment income | 18.9 | 16.9 | 16.8 | 15.5 | 13.8 | ||||||||||
Investment and other (losses) gains | (0.7 | ) | (1.4 | ) | 6.7 | (1.1 | ) | 7.6 | |||||||
Title loss provisions | 91.1 | 106.3 | 81.3 | 106.3 | 140.0 | ||||||||||
% title operating revenues | 4.8 | 5.6 | 4.7 | 5.9 | 8.1 | ||||||||||
Pretax income(1) | 88.0 | 9.7 | 51.8 | 101.1 | 89.3 | ||||||||||
Net income (loss) attributable to Stewart | 55.5 | (6.2 | ) | 29.8 | 63.0 | 109.2 | |||||||||
Cash provided by operations | 123.0 | 80.5 | 64.0 | 87.1 | 120.5 | ||||||||||
Total assets | 1,341.7 | 1,321.6 | 1,392.5 | 1,326.1 | 1,291.2 | ||||||||||
Notes payable and convertible senior notes | 106.8 | 102.4 | 71.2 | 39.5 | 71.2 | ||||||||||
Stockholders’ equity | 648.8 | 637.1 | 700.5 | 663.1 | 580.4 | ||||||||||
Per share data: | |||||||||||||||
Average shares – dilutive (millions) | 23.5 | 23.5 | 24.7 | 24.7 | 24.4 | ||||||||||
Basic earnings (loss) attributable to Stewart | 1.86 | (0.26 | ) | 1.31 | 2.85 | 5.66 | |||||||||
Diluted earnings (loss) attributable to Stewart | 1.85 | (0.26 | ) | 1.24 | 2.60 | 4.61 | |||||||||
Cash dividends | 1.20 | 0.80 | 0.10 | 0.10 | 0.10 | ||||||||||
Stockholders’ equity | 27.69 | 27.30 | 29.18 | 29.47 | 29.91 | ||||||||||
Market price: | |||||||||||||||
High | 48.60 | 44.01 | 37.87 | 34.39 | 28.35 | ||||||||||
Low | 30.34 | 35.12 | 27.02 | 22.74 | 11.54 | ||||||||||
Year end | 46.08 | 37.33 | 37.04 | 32.27 | 26.00 | ||||||||||
(1) Pretax income figures are before noncontrolling interests.
12
Item 7. Management’s Discussion and Analysis of Financial Condition and Results of Operations
MANAGEMENT’S OVERVIEW
We reported net income attributable to Stewart of $16.7 million ($0.71 per diluted share) for the fourth quarter 2016 compared to net income attributable to Stewart of $2.6 million ($0.11 per diluted share) for the fourth quarter 2015. Pretax income before noncontrolling interests for the fourth quarter 2016 was $23.0 million compared to pretax income before noncontrolling interests of $3.1 million for the fourth quarter 2015.
Fourth quarter 2016 results were influenced by:
• | $5.4 million of net realized losses, $4.9 million of which were in the ancillary services and corporate segment and $0.5 million in the title segment, and |
• | $2.4 million of income tax benefits related to previously unrecognized tax credits. |
Fourth quarter 2015 results were influenced by:
• | $2.1 million of net realized losses, $1.4 million of which were in the title segment and $0.7 million in the ancillary services and corporate segment, |
• | $2.7 million of depreciation, severance and goodwill impairment charges related to the exit of the delinquent loan servicing operations and $1.7 million of cost management program charges recorded in the ancillary services and corporate segment, |
• | $0.8 million of severance charges recorded in the title segment, and |
• | $2.2 million of income tax benefits, primarily from utilization of state tax loss carryforwards. |
Our title segment revenues, which include revenues from our centralized title services, were $511.6 million for the fourth quarter 2016, an increase of 8.2% from the fourth quarter 2015 and a decline of 3.4% from the third quarter 2016. In the fourth quarter 2016, the title segment generated pretax income of $38.1 million, a 7.4% margin, compared to the fourth quarter 2015 pretax income of $23.1 million, a 4.9% margin, and the third quarter 2016 pretax income of $50.3 million, a 9.5% margin. As mentioned above, the segment’s fourth quarter 2016 pretax income included $0.5 million of net realized losses, composed primarily of $1.7 million additional contingent consideration expense related to a prior successful acquisition, offset by net gains on sale of investments in securities available-for-sale and other assets. The fourth quarter 2015 segment results included $1.4 million of net realized losses (composed primarily of $3.7 million of asset impairment charges, offset by net gains on sale of investments in securities available-for-sale and other assets) and $0.8 million of severance costs.
Non-commercial domestic revenue includes revenues from purchase transactions and centralized title operations. Revenues from purchase transactions increased 6.9%, while centralized revenues declined 14.9% due primarily to decreased default-related title transactions, partially offset by higher refinancing transactions. Total international revenues increased 8.8% in the fourth quarter 2016 compared to the prior year quarter due to volume growth on a local currency basis, primarily from our Canada operations, partially offset by the weakening of the British pound against the U.S. dollar. Revenues from independent agency operations in the fourth quarter 2016 increased 11.3% compared to the fourth quarter 2015, but declined 1.7% sequentially compared to the third quarter 2016. The independent agency remittance rate was 18.2% in the fourth quarter 2016 compared to 19.0% and 18.0% in the fourth quarter 2015 and the third quarter 2016, respectively. As a result, revenues from independent agencies, net of retention, increased 6.3% from the prior year quarter, and declined approximately 1% sequentially from the third quarter 2016. The average independent agency remittance rate for the full year 2016 was 18.2%, essentially unchanged from 18.3% in 2015.
Operating revenues generated by our ancillary services and corporate segment declined to $19.1 million in the fourth quarter 2016 from $25.2 million in the fourth quarter 2015, primarily due to our exit of the delinquent loan servicing operations completed in the first quarter 2016. Sequentially, operating revenues decreased from $22.2 million in the third quarter 2016, primarily due to revenue declines in our search and valuation services operations. The segment reported a pretax loss of $15.1 million in the fourth quarter 2016 as compared with pretax losses of $19.9 million and $11.5 million in the fourth quarter 2015 and third quarter 2016, respectively.
13
As mentioned above, the fourth quarter 2016 segment pretax loss included $4.9 million of net realized losses, composed primarily of $3.3 million of realized losses on the sale of assets related to the loan file review and audit and government services lines of business and $1.6 million of early lease termination costs. Fourth quarter 2015 segment results included $0.7 million of net realized losses (primarily resulting from $1.0 million of early lease termination charges), $2.7 million of depreciation, severance and goodwill impairment charges related to the exit of the delinquent loan servicing operations and $1.7 million of cost management program charges. The third quarter 2016 pretax loss for the segment included $1.2 million of costs relating to shareholder activism offset by a $1.2 million realized gain on a cost-basis investment transaction.
CRITICAL ACCOUNTING ESTIMATES
Actual results can differ from our accounting estimates. While we do not anticipate significant changes in our estimates, there is a risk that such changes could have a material impact on our consolidated financial condition or results of operations for future periods.
Title loss reserves
Our most critical accounting estimate is providing for title loss reserves.
Provisions for title losses, as a percentage of title operating revenues, were 4.8%, 5.6% and 4.7% for the years ended December 31, 2016, 2015 and 2014, respectively. Actual loss payment experience, including the impact of large losses, is the primary reason for increases or decreases in our loss provision. A change of 100 basis points in the loss provisioning percentage, a reasonably likely scenario based on our historical loss experience, would have increased or decreased our provision for title losses and pretax operating results by approximately $19.0 million for the year ended December 31, 2016.
2016 | 2015 | 2014 | |||||||
($ in millions) | |||||||||
Provisions – Known Claims: | |||||||||
Current year | 20.6 | 14.1 | 18.4 | ||||||
Prior policy years | 64.8 | 81.0 | 48.3 | ||||||
85.4 | 95.1 | 66.7 | |||||||
Provisions – IBNR | |||||||||
Current year | 52.0 | 54.0 | 46.2 | ||||||
Prior policy years-bulk reserves | — | — | 10.7 | ||||||
Prior policy years | 18.5 | 38.2 | 6.0 | ||||||
70.5 | 92.2 | 62.9 | |||||||
Transferred IBNR to Known Claims | (64.8 | ) | (81.0 | ) | (48.3 | ) | |||
Total provisions | 91.1 | 106.3 | 81.3 | ||||||
Provisions for known claims relate primarily to prior policy years as claims are not typically reported until several years after policies are issued. Provisions - Incurred But Not Reported (IBNR) are estimates of claims expected to be incurred over the next 20 years and are subject to considerable judgment in their determination; therefore, it is not unusual or unexpected to experience adjustments to the provisions for both current and prior policy years as additional loss experience on policy years is obtained subsequent to the year of issuance. This loss experience may result in changes to our estimate of total ultimate losses expected (i.e., the IBNR policy loss reserve). Current year provisions - IBNR are recorded on policies issued in the current year as a percentage of premiums realized (provisioning rate). As claims become known, provisions are reclassified from IBNR to known claims. Adjustments relating to large claims (those individually in excess of $1.0 million) may impact provisions either for known claims or for IBNR.
14
In 2016, total known claims provisions decreased to $85.4 million from $95.1 million in 2015, primarily as a result of relatively lower dollar amount of claims reported to us during the year relating to policies issued in previous years. Current year provisions - IBNR decreased in 2016 by $2.0 million to $52.0 million compared to 2015, and increased in 2015 by $7.8 million to $54.0 million compared to 2014 principally due to the decrease and increase, respectively, of our provisioning rate for those years. As a percentage of title operating revenues, provisions - IBNR (current year) was 2.7%, 2.9% and 2.7% in 2016, 2015 and 2014, respectively. Provisions - IBNR relating to prior policy years decreased in 2016 as compared to 2015 mainly due to the losses experienced in 2015 relating to certain older policy years with higher than normal claims. In 2016, changes in the estimated aggregate loss associated with large claims resulted in a decrease to expense of $3.1 million compared with a $22.1 million increase in 2015 and an $8.0 million decrease in 2014.
In addition to title policy claims, we incur losses in our direct operations from escrow, closing and disbursement functions. These escrow losses typically relate to errors or other miscalculations of amounts to be paid at closing, including timing or amount of a mortgage payoff, payment of property or other taxes and payment of homeowners’ association fees. Escrow losses also arise in cases of mortgage fraud, and in those cases the title insurer incurs the loss under its obligation to ensure that an unencumbered title is conveyed. Escrow losses are recognized as expense when discovered or when contingencies associated with them (such as litigation) are resolved and are typically paid less than 12 months after the loss is recognized. For the years ended December 31, 2016 and 2015, we accrued approximately $3.3 million and $1.0 million, respectively, for policy loss reserves relating to legacy escrow losses arising principally from mortgage fraud.
We consider our actual claims payments and incurred loss experience, including consideration of the frequency and severity of claims compared to our actuarial estimates of claims payments and incurred losses in determining whether our overall loss experience has improved or worsened compared to prior periods. We also consider the impact of economic or market factors on particular policy years to determine whether the results of those policy years are indicative of future expectations. In addition, we evaluate the frequency and severity of large losses in determining whether our experience has improved or worsened. Our method for recording the reserves for title losses on both an interim and annual basis begins with the calculation of our current loss provision rate which is applied to our current premium revenues, resulting in a title loss expense for the period. This loss provision rate is set to provide for losses on current year policies and is determined using moving average ratios of recent actual policy loss payment experience (net of recoveries) to premium revenues.
At each quarter end, our recorded reserve for title losses begins with the prior period’s reserve balance for claim losses, adds the current period provision to that balance and subtracts actual paid claims, resulting in an amount that our management compares to its actuarially-based calculation of the ending reserve balance necessary to provide for future title losses. The actuarially-based calculation is a paid loss experience calculation where loss experience factors are selected based on company data and input from our third-party actuaries. We also obtain input from third-party actuaries in the form of a reserve analysis utilizing generally accepted actuarial methods. While we are responsible for determining our loss reserves, we utilize this actuarial input to assess the overall reasonableness of our reserve estimation. If our recorded reserve amount is not at the actuary’s point estimate but is within a reasonable range (+5.0%/-4.0%) of our actuarially-based reserve calculation and the actuary’s point estimate, our management assesses the major factors contributing to the different reserve estimates in order to determine the overall reasonableness of our recorded reserve, as well as the position of the recorded reserves relative to the point estimate and the estimated range of reserves. The major factors considered can change from period to period and include items such as current trends in the real estate industry (which management can assess although there is a time lag in the development of this data for use by the actuary), the size and types of claims reported and changes in our claims management process. If the recorded amount is not within a reasonable range of our third-party actuary’s point estimate, we will adjust the recorded reserves in the current period and reassess the provision rate on a prospective basis. Once our reserve for title losses is recorded, it is reduced in future periods as a result of claims payments and may be increased or reduced by revisions to our estimate of the overall level of required reserves.
15
Large claims, including large title losses due to independent agency defalcations, are analyzed and reserved for separately due to the potential higher dollar amount of loss, lower volume of claims reported and sporadic reporting of such claims. Large title losses due to independent agency defalcations typically occur when the independent agency misappropriates funds from escrow accounts under its control. Such losses are usually discovered when the independent agency fails to pay off an outstanding mortgage loan at closing (or immediately thereafter) from the proceeds of the new loan. Once the previous lender determines that its loan has not been paid off timely, it will file a claim against the title insurer. It is at this point that the title insurance underwriter is alerted to the potential theft and begins its investigation. As an industry practice, these claims are considered a claim on the newly issued title insurance policy since such policy insures the holder (in this case, the new lender) that all previous liens on the property have been satisfied. Accordingly, these claim payments are charged to policy loss expense. These incurred losses are typically more severe in terms of dollar value compared with traditional title policy claims since the independent agency is often able, over time, to conceal misappropriation of escrow funds relating to more than one transaction through the constant volume of funds moving through its escrow accounts. As long as new funds continue to flow into escrow accounts, an independent agency can mask one or more defalcations. In declining real estate markets, lower transaction volumes result in a lower incoming volume of funds, making it more difficult to cover up the misappropriation with incoming funds. Thus, when the defalcation is discovered, it often relates to several transactions. In addition, the overall decline in an independent agency’s revenues, profits and cash flows increases the agency’s incentive to improperly utilize the escrow funds from real estate transactions.
Internal controls relating to independent agencies include, but are not limited to, periodic audits, site visits and reconciliations of policy inventories and premiums. The audits and site visits cover examination of the escrow account bank reconciliations and an examination of a sample of closed transactions. In some instances, the scope of our review is limited by attorney agencies that cite client confidentiality. Certain states have mandated annual reviews of all agencies by their underwriter. We also determine whether our independent agencies have appropriate internal controls as defined by the American Land Title Association's best practices and us. However, even with adequate internal controls in place, their effectiveness can be circumvented by collusion or improper override of the controls by management at the independent agencies. To aid in the selection of independent agencies to review, we have developed an agency risk model that aggregates data from different areas to identify possible problems. This is not a guarantee that all independent agencies with deficiencies will be identified. In addition, we are typically not the only underwriter for which an independent agency issues policies, and independent agencies may not always provide complete financial records for our review. Due to improved agency internal controls as well as better overall economic conditions, we did not experience any significant agency defalcation losses during the three years ended December 31, 2016.
Due to the inherent uncertainty in predicting future title policy losses, significant judgment is required by both our management and our third party actuaries in estimating reserves. As a consequence, our ultimate liability may be materially greater or less than current reserves and/or our third party actuary’s calculated estimate.
Agency revenues
We recognize revenues on title insurance policies written by independent agencies (agencies) when the policies are reported to us. In addition, where reasonable estimates can be made, we accrue for revenues on policies issued but not reported until after period end. We believe that reasonable estimates can be made when recent and consistent policy issuance information is available. Our estimates are based on historical reporting patterns and other information about our agencies. We also consider current trends in our direct operations and in the title industry. In this accrual, we are not estimating future transactions; we are estimating revenues on policies that have already been issued by agencies but not yet reported to or received by us. We have consistently followed the same basic method of estimating unreported policy revenues for more than 10 years.
Our accruals for revenues on unreported policies from agencies were not material to our consolidated assets or stockholders’ equity as of December 31, 2016 and 2015. The differences between the amounts our agencies have subsequently reported to us compared to our estimated accruals are substantially offset by any differences arising from prior years’ accruals and have been immaterial to consolidated assets and stockholders’ equity during each of the three prior years. We believe our process provides the most reliable estimate of the unreported revenues on policies and appropriately reflects the trends in agency policy activity.
16
Goodwill and other long-lived assets
Goodwill is not amortized, but is reviewed annually during the third quarter using June 30 balances, or whenever occurrences of events indicate a potential impairment at the reporting unit level. We have an option to assess qualitative factors to determine whether it is more-likely-than-not that the fair value of a reporting unit is less than its carrying amount. If we decide not to use a qualitative assessment or if the reporting unit fails the qualitative assessment, then we perform a two-step quantitative analysis.
The step one analysis is performed, using a combination of the income approach (discounted cash flow (DCF) technique) and the market approach (guideline company and precedent transaction analyses), to determine if the carrying value of the goodwill exceeds its fair value, which would indicate a potential impairment. The DCF model utilizes historical and projected operating results and cash flows, initially driven by estimates of changes in future revenue levels, and risk-adjusted discount rates. Our projected operating results are primarily driven by anticipated mortgage originations, which we obtain from projections by industry experts, for our title reporting units and forecasted contractual revenues for our ancillary services reporting unit. Fluctuations in revenues, followed by our ability to appropriately adjust our employee count and other operating expenses, or large and unanticipated adjustments to title loss reserves, are the primary reasons for increases or decreases in our projected operating results. Our market-based valuation methodologies utilize (i) market multiples of earnings and/or other operating metrics of comparable companies and (ii) our market capitalization and a control premium based on market data and factors specific to our ownership and corporate governance structure. If we determine that the carrying value of the reporting unit's goodwill is greater than its fair value, we then perform the step two analysis to determine the implied fair value of the goodwill and calculate the amount of impairment.
In performing the step two analysis, the implied fair value of goodwill is determined in the same manner as the amount of goodwill recognized in a business combination. In this method, the estimated fair value of the reporting unit is allocated to all the assets and liabilities of that reporting unit (including any unrecognized intangible assets) as if the reporting unit had been acquired in a business combination and the estimated fair value is the purchase price paid. Any impairment of goodwill is treated as the difference between the implied fair value and the carrying amount of the goodwill and is charged to current operations.
While we are responsible for assessing whether an impairment of goodwill exists, we utilize inputs from third-party appraisers in performing the quantitative analysis for our impairment review. We evaluate goodwill based on four reporting units with goodwill balances (direct operations, agency operations, international operations and ancillary services). Goodwill is assigned to these reporting units at the time the goodwill is initially recorded. Once assigned to a reporting unit, the goodwill is pooled and no longer attributable to a specific acquisition. All activities within a reporting unit are available to support the carrying value of the goodwill. When a business component within a reporting unit is disposed, goodwill is allocated to the component based on the ratio of the component's fair value over the total fair value of the reporting unit.
In 2016, we performed a quantitative assessment for each of our reporting units to determine whether it was more likely than not that the fair value of each reporting unit was less than its carrying amount, including goodwill. Based on our analysis, management concluded that the goodwill related to each reporting unit was not impaired.
In 2015, we utilized the qualitative assessment option for the title reporting units and concluded that the goodwill related to the title reporting units was not impaired. Further, in 2015, based on our decision to exit the delinquent loan servicing activities included within the ancillary services reporting unit, we performed a two-step quantitative assessment of ancillary services' goodwill. Based on the impairment analysis, we recorded a $35.7 million impairment of goodwill for 2015, which was presented as impairment of goodwill in the 2015 consolidated statement of operations and comprehensive income (loss). As a result of realigning our reportable segments in 2016, we reclassified $1.6 million of the total goodwill impairment to the title segment (refer to Notes 8 and 19 for details).
17
We also evaluate the carrying values of title plants, other intangible assets and other long-lived assets when events occur that may indicate impairment. The process of determining impairment for such assets involves determining whether the carrying amount of the asset is recoverable using the undiscounted cash flows expected from the use and eventual disposition of the asset. If the carrying amount is determined not to be recoverable, we estimate the fair value of the asset using projections of future cash flows, operating results, discount rates and overall market conditions. Any excess of the carrying amount over the fair value is considered as an impairment of the asset. Uncertainties exist in these projections and they are subject to changes relating to factors such as interest rates and overall real estate and financial market conditions, our market capitalization and overall stock market performance. Actual market conditions and operating results may vary materially from our projections. In 2015 and 2014, as a result of our impairment analysis on our other intangible assets, we recorded impairment charges of $1.8 million and $1.7 million, respectively. No impairment loss was recognized during 2016.
Operations. As discussed in Note 19 to the audited consolidated financial statements, we changed our reportable operating segments to title insurance and related services (title) and ancillary services and corporate effective in the first quarter 2016. Our primary business is title insurance and settlement-related services. We close transactions and issue title policies on homes, commercial and other real properties located in all 50 states, the District of Columbia and international markets through policy-issuing offices, agencies and centralized title services centers. Our ancillary services and corporate segment includes our parent holding company expenses and certain enterprise-wide overhead costs, along with our remaining ancillary services operations, principally appraisal and valuation services.
Factors affecting revenues. The principal factors that contribute to changes in operating revenues for our title and ancillary services and corporate segments include:
• | mortgage interest rates; |
• | availability of mortgage loans; |
• | number and average value of mortgage loan originations; |
• | ability of potential purchasers to qualify for loans; |
• | inventory of existing homes available for sale; |
• | ratio of purchase transactions compared with refinance transactions; |
• | ratio of closed orders to open orders; |
• | home prices; |
• | consumer confidence, including employment trends; |
• | demand by buyers; |
• | number of households; |
• | premium rates; |
• | foreign currency exchange rates; |
• | market share; |
• | ability to attract and retain highly productive sales associates; |
• | independent agency remittance rates; |
• | opening of new offices and acquisitions; |
• | number of commercial transactions, which typically yield higher premiums; |
• | government or regulatory initiatives, including tax incentives and the implementation of the new integrated disclosure requirements; |
• | acquisitions or divestitures of businesses; |
• | volume of distressed property transactions; and |
• | seasonality and/or weather. |
Premiums are determined in part by the values of the transactions we handle. To the extent inflation or market conditions cause increases in the prices of homes and other real estate, premium revenues are also increased. Conversely, falling home prices cause premium revenues to decline. As an overall guideline, a 5% increase in median home prices results in an approximate 3.5% increase in title premiums. Home price changes may override the seasonal nature of the title insurance business. Historically, our first quarter is the least active in terms of title insurance revenues as home buying is generally depressed during winter months. Our second and third quarters are the most active as the summer is the traditional home buying season, and while commercial transaction closings are skewed to the end of the year, individually large commercial transactions can occur any time of year.
18
Industry data. Published mortgage interest rates and other selected residential housing data for the years ended December 31, 2016, 2015 and 2014 follow (amounts shown for 2016 are preliminary and subject to revision). The amounts below may not relate directly to or provide accurate data for forecasting our operating revenues or order counts.
Our statements on home sales, mortgage interest rates and loan activity are based on published industry data from sources including Fannie Mae, the National Association of Realtors®, the Mortgage Bankers Association and Freddie Mac.
2016 | 2015 | 2014 | |||||||
Mortgage interest rates (30-year, fixed-rate) – % | |||||||||
Averages for the year | 3.65 | 3.85 | 4.17 | ||||||
First quarter | 3.74 | 3.73 | 4.36 | ||||||
Second quarter | 3.59 | 3.83 | 4.23 | ||||||
Third quarter | 3.45 | 3.95 | 4.14 | ||||||
Fourth quarter | 3.81 | 3.90 | 3.97 | ||||||
Mortgage originations – $ billions | 1,940 | 1,730 | 1,301 | ||||||
Refinancings – % of originations | 47.5 | 46.7 | 39.8 | ||||||
New home sales – in $ millions | 0.56 | 0.50 | 0.44 | ||||||
Existing home sales – in $ millions | 5.45 | 5.25 | 4.94 | ||||||
Existing home sales – median sales price in $ thousands | 233.9 | 222.4 | 208.3 | ||||||
The real estate market remained strong in 2016 and mortgage rates remained lower than the prior years, although Fannie Mae is forecasting the 30-year rate to increase to approximately 4.2% by the end of 2017. Further, Fannie Mae expects total home sales to grow modestly by approximately 2.2% in 2017. It is expected the rising share of new home sales will lead to an increase in single-family construction of about 8.2%, or 849,000 units.
For the three years ended December 31, 2016, average monthly mortgage interest rates (30-year, fixed-rate) have fluctuated from a low of 3.44% in July 2016 to a high of 4.43% in January 2014. In 2016, total mortgage originations and refinancing mortgage originations increased 12.1% and 14.1%, respectively, from 2015. During 2016, sales of new and existing homes increased 13.1% and 3.3%, respectively, from 2015. In 2015, as compared to 2014, total mortgage originations and refinancing mortgage originations increased 33.0% and 56.0%, respectively; while sales of new and existing homes increased 14.6% and decreased 6.3%, respectively.
19
Order counts. Open and closed order information for the years 2016, 2015 and 2014 are as follows:
2016 Opened Orders | 2016 Closed Orders | ||||||||||||||||||||
Q1 | Q2 | Q3 | Q4 | Total | Q1 | Q2 | Q3 | Q4 | Total | ||||||||||||
Commercial | 11,331 | 12,137 | 11,866 | 11,219 | 46,553 | 7,618 | 8,577 | 8,149 | 7,890 | 32,234 | |||||||||||
Purchase | 59,081 | 71,429 | 63,115 | 52,072 | 245,697 | 38,709 | 54,183 | 52,937 | 46,474 | 192,303 | |||||||||||
Refi | 33,467 | 37,501 | 42,851 | 33,386 | 147,205 | 24,531 | 25,412 | 28,361 | 28,492 | 106,796 | |||||||||||
Other | 3,447 | 3,162 | 3,423 | 2,616 | 12,648 | 3,785 | 4,665 | 4,086 | 4,058 | 16,594 | |||||||||||
Total | 107,326 | 124,229 | 121,255 | 99,293 | 452,103 | 74,643 | 92,837 | 93,533 | 86,914 | 347,927 | |||||||||||
2015 Opened Orders | 2015 Closed Orders | ||||||||||||||||||||
Q1 | Q2 | Q3 | Q4 | Total | Q1 | Q2 | Q3 | Q4 | Total | ||||||||||||
Commercial | 14,610 | 12,545 | 11,766 | 11,073 | 49,994 | 10,014 | 8,562 | 8,173 | 8,317 | 35,066 | |||||||||||
Purchase | 60,092 | 70,970 | 63,836 | 50,271 | 245,169 | 38,506 | 54,419 | 53,532 | 44,314 | 190,771 | |||||||||||
Refi | 54,944 | 44,923 | 40,542 | 36,663 | 177,072 | 32,301 | 33,160 | 28,849 | 26,517 | 120,827 | |||||||||||
Other | 6,220 | 5,762 | 5,380 | 3,771 | 21,133 | 4,919 | 5,438 | 4,669 | 3,530 | 18,556 | |||||||||||
Total | 135,866 | 134,200 | 121,524 | 101,778 | 493,368 | 85,740 | 101,579 | 95,223 | 82,678 | 365,220 | |||||||||||
2014 Opened Orders | 2014 Closed Orders | ||||||||||||||||||||
Q1 | Q2 | Q3 | Q4 | Total | Q1 | Q2 | Q3 | Q4 | Total | ||||||||||||
Commercial | 11,662 | 13,598 | 14,217 | 12,541 | 52,018 | 8,003 | 8,917 | 8,916 | 8,195 | 34,031 | |||||||||||
Purchase | 52,431 | 65,073 | 63,874 | 54,466 | 235,844 | 33,247 | 46,518 | 49,027 | 45,504 | 174,296 | |||||||||||
Refi | 18,164 | 22,560 | 39,443 | 38,161 | 118,328 | 11,716 | 14,022 | 20,885 | 25,245 | 71,868 | |||||||||||
Other | 3,409 | 3,170 | 8,223 | 6,139 | 20,941 | 2,297 | 2,451 | 6,358 | 4,985 | 16,091 | |||||||||||
Total | 85,666 | 104,401 | 125,757 | 111,307 | 427,131 | 55,263 | 71,908 | 85,186 | 83,929 | 296,286 | |||||||||||
RESULTS OF OPERATIONS
A comparison of our consolidated results of operations for 2016 to 2015 and 2015 to 2014 follows. Factors contributing to fluctuations in results of operations are presented in the order of their monetary significance, and we have quantified, when necessary, significant changes. Results from our ancillary services and corporate segment are included in year-to-year discussions and, when relevant, are discussed separately. Our employee costs and certain other operating expenses are sensitive to inflation.
Title revenues.
Direct title revenue information is presented below:
Year Ended December 31 | % Change | |||||||||||||
2016 | 2015 | 2014 | 2016 vs. 2015 | 2015 vs. 2014 | ||||||||||
($ in millions) | ||||||||||||||
Commercial: | ||||||||||||||
Domestic | 176.4 | 178.1 | 157.4 | (1.0 | )% | 13.2 | % | |||||||
International | 19.0 | 19.7 | 25.4 | (3.6 | )% | (22.4 | )% | |||||||
195.4 | 197.8 | 182.8 | (1.2 | )% | 8.2 | % | ||||||||
Non-commercial | ||||||||||||||
Domestic | 600.4 | 611.0 | 534.3 | (1.7 | )% | 14.4 | % | |||||||
International | 98.5 | 88.3 | 91.2 | 11.6 | % | (3.2 | )% | |||||||
698.9 | 699.3 | 625.5 | (0.1 | )% | 11.8 | % | ||||||||
Total direct title revenues | 894.3 | 897.1 | 808.3 | (0.3 | )% | 11.0 | % | |||||||
20
Revenues from direct title operations in 2016 decreased $2.8 million (or 0.3%) compared to 2015 primarily due to the 4.7% decline in closed orders, mainly in commercial and refinancing orders, partially offset by an improvement in international revenues. Revenues in 2015 increased $88.8 million, or 11.0%, compared to 2014, primarily due to higher refinancing and residential resale (purchase) closed orders, as the result of the rise in new and existing home sales, and contribution from our centralized title operations acquired in mid-2014. International revenues (including foreign-sourced commercial revenues of $19.0 million and $19.7 million for 2016 and 2015, respectively) increased $9.5 million, or 8.8%, in 2016 compared to 2015 and decreased $8.6 million, or 7.4%, in 2015 compared to 2014. International revenues grew in 2016 mainly on a local currency basis (reflecting increased unit volume), primarily from our Canadian operations, partially offset by the weakening of the British pound and Canadian dollar against the U.S. dollar; while the international revenues decrease in 2015 resulted mainly from the weakening of the Canadian dollar against the U.S. dollar, slightly offset by increased revenues from our Canada operations on a local currency basis. Total commercial revenues in 2016 decreased $2.4 million, or 1.2%, compared to 2015 and increased $15.0 million, or 8.2%, in 2015 compared to 2014 consistent with the trend of our commercial orders closed. While year-to-year results for commercial business can fluctuate considerably due to timing of when large transactions close, our commercial operations continued to be stable in the marketplace.
Revenues from independent agencies increased $18.5 million, or 1.9%, in 2016 compared to 2015 and increased $85.3 million, or 9.4%, in 2015 compared to 2014. Revenues from independent agencies fluctuate based on the same general factors that influence revenues from direct title operations, although we do not specifically know our agents’ order composition. The 2016 gross agency revenue increase was driven by increased revenues primarily from Texas, Michigan, Washington and Florida, offset by declines in New York, California and New Jersey. The 2015 gross agency revenue increase resulted from increases primarily in Utah, Georgia, California, Florida and Minnesota, offset by declines in Texas and New York. We continue to focus on increasing profit margins in every state, increasing premium revenue in states where remittance rates are above 20%, and maintaining the quality of our agency network, which we believe to be the industry’s best, in order to mitigate claims risk and drive consistent future performance.
Title revenues by geographic location. The approximate amounts and percentages of consolidated title operating revenues for the last three years were as follows:
Amounts ($ millions) | Percentages | |||||||||||||||||
2016 | 2015 | 2014 | 2016 | 2015 | 2014 | |||||||||||||
Texas | 362 | 341 | 338 | 19 | 18 | 20 | ||||||||||||
New York | 226 | 250 | 238 | 12 | 13 | 14 | ||||||||||||
California | 125 | 142 | 123 | 7 | 8 | 7 | ||||||||||||
International | 116 | 107 | 118 | 6 | 6 | 7 | ||||||||||||
Florida | 87 | 88 | 73 | 5 | 5 | 4 | ||||||||||||
All others | 988 | 960 | 824 | 51 | 50 | 48 | ||||||||||||
1,904 | 1,888 | 1,714 | 100 | 100 | 100 | |||||||||||||
Ancillary services revenues. Ancillary services revenues decreased $45.7 million, or 35.2%, in 2016 compared to 2015 and decreased $2.9 million, or 2.2%, in 2015 compared to 2014. The revenue reduction in both years was primarily due to decreased demand and lower pricing within our delinquent loan servicing activities. The relatively higher revenue decline in 2016 was due to our exit of the delinquent loan servicing activities in the first quarter 2016. The delinquent loan servicing product generated substantially all of the revenues of the former mortgage services segment from 2010 through 2014 which were highly profitable over that time frame. However, as the industry-wide inventory of defaulted and distressed loans declined due to the housing market recovery, revenues declined and these activities turned unprofitable during the second half of 2015, resulting in our decision to exit them in mid-2015, a process we completed in the first quarter 2016.
Investment income. Investment income increased $2.1 million, or 12.3%, in 2016 compared to 2015 due to increased income from our debt securities, short-term investments, cash equivalents and equity securities as a result of higher invested balances in 2016. Investment income in 2015 was comparable to 2014 due to the slightly higher income from debt securities being offset by reduced income from short-term investments, cash equivalents and equity securities as a result of lower average balances of short term and cash equivalent investments.
21
Investment and other (losses) gains - net. In 2016, investment and other losses - net included $3.4 million of office closure and early lease termination costs and $3.3 million of realized losses from the sale of certain businesses within ancillary services operations, partially offset by $4.0 million of net realized gains from the sale of investments available-for-sale, $1.2 million of realized gain on a cost-basis investment transaction and $0.4 million of realized gain from the sale of certain title offices.
In 2015, investment and other losses – net included realized losses of $2.7 million relating to other-than-temporary impairment of investment in equity securities available-for-sale, $1.8 million impairment of other intangible assets and $1.4 million relating to office closure costs, partially offset by realized gains of $2.4 million from the sale of debt and equity investments available-for-sale and $1.5 million from the sale of office buildings.
In 2014, investment and other gains – net included realized gains of $5.6 million from the reduction in the fair value of a contingent consideration liability, $3.8 million from the sale of a business and $1.1 million from the sale of debt and equity investments available-for-sale, partially offset by charges of $1.9 million relating to office closure costs, $1.7 million impairment of an other intangible asset and $1.0 million relating to the impairment of a cost-basis investment.
Expenses. An analysis of expenses is shown below:
Year Ended December 31 | % Change | |||||||||||||
2016 | 2015 | 2014 | 2016 vs. 2015 | 2015 vs. 2014 | ||||||||||
($ in millions) | ||||||||||||||
Amounts retained by agencies | 826.0 | 809.6 | 738.6 | 2.0 | % | 9.6 | % | |||||||
As a % of agency revenues | 81.8 | % | 81.7 | % | 81.5 | % | ||||||||
Employee costs | 604.4 | 658.3 | 624.3 | (8.2 | )% | 5.4 | % | |||||||
As a % of operating revenues | 30.4 | % | 32.6 | % | 33.8 | % | ||||||||
Other operating expenses | 364.0 | 382.0 | 347.3 | (4.7 | )% | 10.0 | % | |||||||
As a % of operating revenues | 18.3 | % | 18.9 | % | 18.8 | % | ||||||||
Title losses and related claims | 91.1 | 106.3 | 81.3 | (14.3 | )% | 30.8 | % | |||||||
As a % of title revenues | 4.8 | % | 5.6 | % | 4.7 | % | ||||||||
Overall employee costs and other operating expenses in 2016 declined from 2015 at a faster rate (6.9%) than the decline (1.5%) in operating revenues. This is compared to the 7.1% increase in overall employee costs and other operating expenses on a 9.3% increase in operating revenues in 2015 from 2014.
22
Expense comparisons for the three years ended December 31, 2016 are influenced by the following charges:
2016 | 2015 | 2014 | ||||
($000 omitted) | ||||||
Ancillary services and corporate segment: | ||||||
Litigation-related accruals | 3,599 | — | — | |||
Class B Common Stock exchange expenses | 2,193 | — | — | |||
Shareholder activism and settlement charges | 1,186 | 3,542 | 1,841 | |||
Depreciation related to the exit of delinquent loan servicing activities | 1,089 | 1,452 | — | |||
Cost management program and severance expenses | 442 | 21,344 | 4,869 | |||
Impairment of goodwill | — | 35,749 | — | |||
Expenses related to subsidiary acquisitions | — | — | 7,077 | |||
Total ancillary services and corporate segment | 8,509 | 62,087 | 13,787 | |||
Title segment: | ||||||
Prior policy reserve adjustments, net | (5,400 | ) | 4,527 | (21,342 | ) | |
Litigation-related accruals | — | 5,959 | 18,252 | |||
Severance expenses | — | 810 | — | |||
Total title segment | (5,400 | ) | 11,296 | (3,090 | ) | |
Total | 3,109 | 73,383 | 10,697 | |||
Retention by agencies. Amounts retained by title agencies are based on agreements between the agencies and our title underwriters. On average, amounts retained by independent agencies, as a percentage of revenues generated by them, were 81.8%, 81.7% and 81.5% in the years 2016, 2015 and 2014, respectively. The average retention percentage may vary from year-to-year due to the geographical mix of agency operations, the volume of title revenues and, in some states, laws or regulations. Due to the variety of such laws or regulations, as well as competitive factors, the average retention rate can differ significantly from state to state. In addition, a high proportion of our independent agencies are in states with retention rates greater than 80%. Consequently, we expect our average annual retention percentage to remain in the 81% - 82% range over the near to medium term.
Selected cost ratios (by segment). The following table shows employee costs and other operating expenses as a percentage of related segment operating revenues.
Employee costs (%) | Other operating (%) | |||||||||||||||||
2016 | 2015 | 2014 | 2016 | 2015 | 2014 | |||||||||||||
Title | 28.3 | 28.0 | 28.6 | 16.1 | 17.0 | 18.3 | ||||||||||||
Ancillary services and corporate | 77.5 | 99.0 | 100.2 | 67.9 | 47.3 | 25.3 | ||||||||||||
Employee costs. Employee costs for the combined business segments decreased $53.9 million, or 8.2%, in 2016 compared to 2015 as a result of the cost management program we completed at the end of 2015, as well as reductions in employee counts tied to volume declines. Employee costs increased $33.9 million, or 5.4%, in 2015 compared to 2014 due to higher revenues in 2015 and the effect of acquisitions made mid-2014 in the ancillary services operations. As a percentage of total operating revenues, employee costs were 30.4%, 32.6% and 33.8% in 2016, 2015 and 2014, respectively. Our total employee count at December 31, 2016, 2015 and 2014 was approximately 6,350, 6,940 and 7,410, respectively.
In 2016 and 2015, total employee count decreased by approximately 590 and 470 employees, or 8.5% and 6.4%, respectively. These decreases were mainly the result of our cost management program as well as reduction in force tied to volume declines, primarily in the ancillary services operations. In 2016 and 2015, ancillary services operations' employee count decreased by about 500 and 200 employees, respectively, primarily as a result of our exit from the delinquent loan servicing activities. Additionally, the 2016 employee count reduction in ancillary services operations was influenced by the sale of the loan file review and audit and government services lines of business at the end of the year. In 2015, we also reduced headcount in the parent holding company and centralized administrative services departments by approximately 270 employees in conjunction with the cost management program.
23
Employee costs in the title segment increased $9.7 million, or 1.8%, and $39.0 million, or 8.0%, in 2016 and 2015, respectively, as the result of increased salaries and commissions and incentive compensation on higher title operating revenues, which increased by approximately 1.0% and 10.2% in 2016 and 2015, respectively. Ancillary services and corporate segment's employee costs decreased $63.6 million, or 49.2%, and $5.1 million, or 3.8%, in 2016 and 2015, respectively, primarily due to the employee count reductions relating to the cost management program and exit from the delinquent loan servicing activities.
Other operating expenses. Other operating expenses include costs that are fixed in nature, costs that follow, to varying degrees, changes in transaction volumes and revenues and costs that fluctuate independently of revenues. Costs that are fixed in nature include attorney and professional fees, third-party-outsourcing provider fees, equipment rental, insurance, rent and other occupancy expenses, repairs and maintenance, technology costs, telephone and title plant expenses. Costs that follow, to varying degrees, changes in transaction volumes and revenues include fee attorney splits, bad debt expenses, ancillary services cost of sales expenses, copy supplies, delivery fees, outside search fees, postage, premium taxes and title plant maintenance expenses. Costs that fluctuate independently of revenues include general supplies, litigation defense, business promotion and marketing and travel.
Other operating expenses for the combined business segments decreased $18.0 million, or 4.7%, in 2016 compared to 2015 and increased $34.7 million, or 10.0%, in 2015 compared to 2014. As a percentage of total operating revenues, other operating costs were 18.3%, 18.9% and 18.8% in 2016, 2015 and 2014, respectively. In 2016, other operating expenses included approximately $3.6 million for litigation-related accruals, $1.2 million of shareholder activism costs and $2.2 million of costs associated with the Class B common stock exchange agreement. In 2015, other operating expenses included approximately $6.0 million for litigation-related accruals and $19.5 million of aggregate costs related to our cost management program (consisting of consulting and third party service provider transition costs), costs associated with a shareholder settlement announced in the first quarter 2015, and CFPB integrated disclosure preparations. Excluding the impact of these non-operating charges, other operating expenses as a percentage of total operating revenues would have been 18.0% and 17.7% in 2016 and 2015, respectively.
In 2016, excluding the costs listed above, costs fixed in nature were comparable to 2015 as increased costs related to third-party outsourcing provider fees were offset by decreases in rent and other occupancy expenses, technology costs, attorney and professional fees and insurance expenses. Costs that follow, to varying degrees, changes in transaction volumes and revenues increased $9.5 million, or 6.0%, mainly due to increases in outside search fees and fee attorney splits driven by higher title revenues. Excluding the non-operating litigation-related costs, costs that fluctuate independently of revenues decreased $9.8 million, or 18.5%, in 2016 compared to 2015, primarily due to reduced business promotion and marketing, travel and general legal expenses.
In 2015, excluding the costs listed above, costs fixed in nature increased $10.1 million, or 7.4%, primarily due to $10.8 million of additional professional and consulting fees and third-party outsourcing provider fees. Costs that follow, to varying degrees, changes in transaction volumes and revenues increased $29.6 million, or 23.3%, primarily due to increases in ancillary services expenses resulting from increased ancillary service revenues during the first through third quarters of 2015 and fee attorney splits driven by increased title revenues. Excluding the non-operating litigation-related costs, costs that fluctuate independently of revenues in 2015 were comparable to 2014.
Title losses. Provisions for title losses, as a percentage of title operating revenues, were 4.8%, 5.6% and 4.7% in 2016, 2015 and 2014, respectively, including adjustments to certain large claims and escrow losses. The title loss ratio in any given year can be significantly influenced by new large claims incurred as well as adjustments to reserves for existing large claims. We continue to manage and resolve large claims prudently and in keeping with our commitments to our policyholders.
For the year ended December 31, 2016, we recorded a $3.1 million decrease to the reserve for existing large losses and a $5.4 million policy loss reserve reduction relating to non-large policy losses as a result of favorable loss development experience. Title losses decreased $15.1 million, or 14.2%, in 2016 compared to the same period in 2015.
24
For the year ended December 31, 2015, we recorded $22.1 million of increases to existing large loss reserves relating to prior policy years, partially offset by a $17.5 million policy loss reserve reduction relating to non-large policy losses as a result of favorable loss development experience. Title losses increased $25.0 million, or 30.7%, in 2015 compared to the same period in 2014.
For the year ended December 31, 2014, we recorded a reduction of $14.8 million to our policy loss provision due to a bond claim which resulted in a partial recovery of a large claim recorded in the prior years. We also recorded a reserve reduction of $6.5 million during 2014 relating to non-large policy losses. In 2014, title losses decreased $25.0 million, or 23.5%, compared to the same period in 2013.
Excluding the impact of the reserve reductions and large losses (net of recoveries), title losses as a percent of title operating revenues were 5.2%, 5.4% and 5.6% in 2016, 2015 and 2014, respectively. Title losses paid were $92.0 million, $123.6 million and $86.7 million in 2016, 2015 and 2014, respectively. The 25.6% decrease in cash claim payments in 2016 compared to 2015 was primarily influenced by the favorable loss experience during the year, as compared with the 42.6% increase in cash claim payments during 2015 resulting from a $22.5 million payment for a large, previously reserved, claim.
Our liability for estimated title losses as of December 31, 2016 and 2015 comprises both known claims and our estimate of claims that may be reported in the future (IBNR). Known claims reserves are reserves related to actual losses reported to us. Our reserve for known claims comprises both claims related to title insurance policies as well as losses arising from escrow closing and funding operations due to fraud or error (which are recognized as expense when discovered). The amount of the reserve represents the aggregate, non-discounted future payments (net of recoveries) that we expect to incur on policy and escrow losses and in costs to settle claims.
Total title policy loss reserve balances:
December 31, 2016 | December 31, 2015 | ||||
($ in millions) | |||||
Known claims | 76.5 | 83.2 | |||
IBNR | 386.1 | 379.4 | |||
Total estimated title losses | 462.6 | 462.6 | |||
Title claims are generally incurred three to five years after policy issuance and the timing of payments on these claims can significantly impact the balance of known claims, since in many cases claims may be open for several years before resolution and payment occur. As a result, the estimate of ultimate amount to be paid on any claim may be modified over that time period.
Due to the inherent uncertainty in predicting future title policy losses, significant judgment is required by our management and our third party actuaries in estimating reserves. As a consequence, our ultimate liability may be materially greater or less than current reserves and/or our third party actuary’s calculated estimates. As of December 31, 2016 and 2015, our reserve balance was above the actuarial midpoint of total estimated policy loss reserves.
Impairment of goodwill. During the year ended December 31, 2015, we recorded a non-cash impairment charge of $35.7 million relating to our goodwill. The impairment charge was triggered by our ancillary services reporting unit's continued losses and reduced revenue and margin outlook, driven primarily by falling demand and contract pricing pressures related to our delinquent loan servicing activities, which were exited at the end of first quarter 2016. Refer to our foregoing discussion of Goodwill and other long-lived assets under Critical Accounting Estimates and Note 8 to the audited consolidated financial statements for details on the 2015 impairment.
Depreciation and amortization. Depreciation and amortization expense in 2016 was comparable to 2015, while it increased $6.1 million, or 25.1%, in 2015 compared to 2014. The increase in 2015 was driven by $1.5 million of accelerated amortization of assets used in the delinquent loan servicing activities that we exited. In addition, approximately $2.7 million of amortization expense relating to 2014 acquired intangible assets in the ancillary services operations and $1.5 million of amortization expense relating to an underwriter production system placed into service in July 2014 contributed to the increase during 2015.
25
Income taxes. Our effective tax rates were 26.1%, (1,019.4)% and 31.2% for 2016, 2015 and 2014, respectively, based on income (loss) before taxes, after deducting noncontrolling interests, of $75.1 million, $(0.6) million and $43.3 million in 2016, 2015 and 2014, respectively. Our 2016 effective tax rate reflected a $4.1 million tax benefit for the 2015 return-to-provision and true-up adjustments and $3.4 million of tax benefit relating to previously unrecognized research and development tax credits. Our 2015 effective tax rate resulted principally from the $35.7 million goodwill impairment recorded during the year 2015, of which $20.3 million was not subject to tax benefits, combined with the effects of minimal pretax earnings for that year.
During 2014, we released $5.0 million of valuation allowance relating to deferred tax assets arising from foreign tax credit carryforwards. During 2016 and 2015, there were no material releases of our valuation allowance. As of December 31, 2016, our remaining valuation allowance relating principally to certain state and foreign net operating loss carryforwards was $2.5 million. The Company believes it is more-likely-than-not it will be able to utilize its net deferred tax assets.
Contractual obligations. Our material contractual obligations at December 31, 2016 were:
Payments due by period ($ millions) | |||||||||||||||
Less than 1 year | 1-3 years | 3-5 years | More than 5 years | Total | |||||||||||
Credit facility | — | 92.9 | — | — | 92.9 | ||||||||||
Other notes payable | 9.7 | 3.5 | 0.7 | — | 13.9 | ||||||||||
Operating leases | 50.3 | 73.4 | 30.1 | 14.4 | 168.2 | ||||||||||
Estimated title losses | 111.0 | 175.8 | 76.3 | 99.5 | 462.6 | ||||||||||
171.0 | 345.6 | 107.1 | 113.9 | 737.6 | |||||||||||
Material contractual obligations consist primarily of amounts drawn on our line of credit facility which expires October 2019, other notes payable, operating leases and estimated title losses. The timing above for payments of notes payable is based upon contractually stated payment terms of each debt agreement. Operating leases are primarily for office space and expire over the next ten years. The timing shown above for the payments of estimated title losses is not set by contract. Rather, it is projected based on historical payment patterns. The actual timing of estimated title loss payments may vary materially from the above projection since claims, by their nature, are complex and paid over long periods of time. Title losses paid were $92.0 million, $123.6 million and $86.7 million in 2016, 2015 and 2014, respectively.
LIQUIDITY AND CAPITAL RESOURCES
Our liquidity and capital resources reflect our ability to generate cash flow to meet our obligations to shareholders, customers (payments to satisfy claims on title policies), vendors, employees, lenders and others. As of December 31, 2016, our cash and investments, including amounts reserved pursuant to statutory requirements, aggregated $839.5 million ($340.2 million, net of statutory reserves on cash and investments). Of our total cash and investments at December 31, 2016, $616.7 million ($257.6 million, net of statutory reserves) was held in the United States and the rest internationally, principally in Canada.
Cash held at the parent company totaled $2.9 million at December 31, 2016. As a holding company, the parent company is funded principally by cash from its subsidiaries in the form of dividends, operating and other administrative expense reimbursements and pursuant to intercompany tax sharing agreements. The expense reimbursements are paid in accordance with management agreements, approved by the Texas Department of Insurance (TDI), among the parent and its subsidiaries. In addition to funding operating expenses, cash held at the parent company is used for dividend payments to common stockholders and for stock repurchases, if any. To the extent such uses exceed cash available, the parent company is dependent on distributions from its regulated title insurance underwriter, Stewart Title Guaranty Company (Guaranty).
26
A substantial majority of our consolidated cash and investments as of December 31, 2016 was held by Guaranty and its subsidiaries. The use and investment of these funds, dividends to the parent company, and cash transfers between Guaranty and its subsidiaries and the parent company are subject to certain legal and regulatory restrictions. In general, Guaranty may use its cash and investments in excess of its legally-mandated statutory premium reserve (established in accordance with requirements under Texas law) to fund its insurance operations, including claims payments. Guaranty may also, subject to certain limitations, provide funds to its subsidiaries (whose operations consist principally of field title offices and ancillary services operations) for their operating and debt service needs.
All of our international operations are conducted by Guaranty or its subsidiaries. Cash and investments held by our international operations are also subject to regulatory minimums, and thus the distribution of those funds to Guaranty is limited.
We maintain investments in accordance with certain statutory requirements in the states of domicile of our underwriters for the funding of statutory premium reserves. Statutory premium reserves, which approximated $485.4 million and $483.3 million at December 31, 2016 and 2015, respectively, are required to be fully funded and invested in high-quality securities and short-term investments. In addition, included within cash and cash equivalents are statutory reserve funds of approximately $13.9 million and $17.2 million at December 31, 2016 and 2015, respectively. Although these cash statutory reserve funds are not restricted or segregated in depository accounts, they are required to be held pursuant to state statutes. If the Company fails to maintain minimum investments or cash and cash equivalents sufficient to meet statutory requirements, the Company may be subject to fines or other penalties, including potential revocation of its business license. As of December 31, 2016, our known claims reserve totaled $76.5 million and our estimate of claims that may be reported in the future totaled $386.1 million. In addition to this, we had cash and investments (excluding equity method investments) of $223.8 million which are available for underwriter operations, including claims payments.
The ability of Guaranty to pay dividends to its parent is governed by Texas insurance law. The TDI must be notified of any dividend declared, and any dividend in excess of the statutory maximum of 20% of surplus (approximately $102.0 million as of December 31, 2016) would be, by regulation, considered extraordinary and subject to pre-approval by the TDI. Also, the Texas Insurance Commissioner may raise an objection to a planned distribution during the notification period. Guaranty’s actual ability or intent to pay dividends to its parent may be constrained by business and regulatory considerations, such as the impact of dividends on surplus and the liquidity ratio, which could affect its ratings and competitive position, the amount of insurance it can write and its ability to pay future dividends. As of December 31, 2016, our statutory liquidity ratio for our principal underwriter was 106%. Our internal objective is to maintain a ratio of at least 100%, as we believe that ratio is crucial to our competitiveness in the market and our credit ratings. On an ongoing basis, this ratio will largely guide our decisions as to frequency and magnitude of dividends from Guaranty to the parent company. Further, depending on business and regulatory conditions, we may in the future need to retain cash in Guaranty or even raise cash in the capital markets to contribute to it in order to maintain its ratings or statutory capital position. Such a requirement could be the result of investment losses, reserve charges, adverse economic environment operating conditions or changes in interpretation of statutory accounting requirements by regulators. During 2016 and 2015, Guaranty paid to its parent dividends of $20.0 million and $15.0 million, respectively.
As the parent company conducts no operations apart from its wholly-owned subsidiaries, the discussion below focuses on consolidated cash flows.
2016 | 2015 | 2014 | |||||||
($ millions) | |||||||||
Net cash provided by operating activities | 123.0 | 80.5 | 64.0 | ||||||
Net cash used by investing activities | (56.8 | ) | (68.8 | ) | (78.6 | ) | |||
Net cash (used) provided by financing activities | (59.3 | ) | (25.6 | ) | 26.0 | ||||
Operating activities
Our principal sources of cash from operations are premiums on title policies, revenue from title service-related transactions and ancillary services and other operations. Our independent agencies remit cash to us net of their contractual retention. Our principal cash expenditures for operations are employee costs, operating costs and title claims payments.
27
Cash provided by operations in 2016 increased by approximately $42.5 million to $123.0 million compared to 2015. This increase was primarily the result of the higher net income and lower payment of claims liabilities in 2016. Cash provided by operations in 2015 was $80.5 million, an increase of $16.5 million from $64.0 million provided by operations in 2014. This increase was primarily the result of the increase in net income when adjusted for non-cash charges compared to 2014, collections on accounts receivable and lower payments of liabilities relative to the prior period.
Although our business is labor intensive, we are focused on a cost-effective, scalable business model which includes utilization of technology, centralized back and middle office functions and business process outsourcing. Our approach allows us to adjust more easily to seasonal and cyclical fluctuations in transaction volumes. We are continuing our focus on cost management, specifically lowering unit costs of production, which will result in improved margins. Our plans to improve margins also include further outsourcing, additional automation of manual processes, and further consolidation of our various systems and production operations. We are currently investing in the technology necessary to accomplish these goals.
Cash payments on title claims in 2016, 2015 and 2014 were $92.0 million, $123.6 million and $86.7 million, respectively. The decrease in cash claims payments in 2016 was primarily due to the $22.5 million payment in 2015 to fully resolve a large prior policy year claim. Claim payments made on large title claims, net of insurance recoveries, during 2016, 2015 and 2014 were $14.6 million, $48.4 million and $5.4 million, respectively.
Investing activities
Cash used by investing activities was primarily driven by purchases of investments, capital expenditures and acquisition of subsidiaries, offset by proceeds from matured and sold available-for-sale investments. Total proceeds from available-for-sale investments matured and sold amounted to $108.2 million, $111.5 million and $106.6 million in 2016, 2015 and 2014, respectively. We used cash for the purchases of available-for-sale investments in the amounts of $166.4 million, $147.7 million and $147.4 million 2016, 2015 and 2014, respectively. Cash generated (used) by net sale (purchases) of short-term investments amounted to $17.5 million, $(14.7) million and $13.3 million in 2016, 2015 and 2014, respectively.
Capital expenditures were $18.2 million, $19.7 million and $19.5 million and cash used for acquisitions of subsidiaries was $0.3 million, $4.0 million and $40.0 million in 2016, 2015 and 2014, respectively. Also in 2016, we received total net cash proceeds of $1.3 million from the sale of the loan file review and quality control services and government services operations. We maintain investment in capital expenditures at a level that enables us to implement technologies for increasing our operational and back-office efficiencies and to pursue growth in key markets.
Financing activities and capital resources
Total debt and stockholders’ equity were $106.8 million and $648.8 million, respectively, as of December 31, 2016. In 2016 and 2015, we borrowed $57.8 million and $52.7 million, respectively, and repaid $60.3 and $22.5 million, respectively, of debt in accordance with the underlying terms of the debt instruments. Our debt-to-equity ratio at December 31, 2016 was approximately 16.5%, below the 20% we have set as our unofficial internal limit on leverage.
In October 2014, we entered into a $125.0 million unsecured line of credit, which expires October 2019. As of December 31, 2016, total outstanding borrowings from this line of credit were $92.9 million; the remaining balance of the line of credit available for use was $29.6 million, net of an unused $2.5 million letter of credit. During 2016 and 2015, we drew $20.0 million and $45.0 million, respectively, from the line of credit and paid down $25.1 million and $7.0 million, respectively. The unsecured line of credit can be used for general corporate purposes, including acquisitions. Refer to Note 10 to the audited consolidated financial statements for details on the unsecured line of credit.
During 2016, we declared and paid aggregate dividends of $1.20, per common share. In comparison, we declared and paid aggregate dividends of $0.80 per common share during 2015. Additionally, in relation to the Class B Exchange Agreement approved by our stockholders during the second quarter 2016, we paid $12.0 million in cash and issued Common Stock shares in exchange for the retirement of the outstanding Class B Common Stock shares (refer to Note 12 to the audited consolidated financial statements for details).
28
In November 2015, we announced a stock repurchase program which may return up to $50.0 million to stockholders over a three-year period starting in 2016. Under the stock repurchase program, we have the ability to purchase shares of our outstanding Common Stock in both open market and privately negotiated transactions as we deem appropriate. The timing, form and amount of share repurchases under the program will depend on a variety of factors including: market conditions, share price, our capital and liquidity position relative to internal and rating agency targets, legal requirements, including approval of the release of cash from our regulated underwriter by the insurance regulators and corporate and other considerations. There were no stock repurchases during the year 2016, except for repurchases of approximately 22,800 shares (aggregate purchase price of approximately $1.1 million) related to the statutory income tax withholding on the vesting of restricted share grants to executives and senior management. The repurchases related to statutory tax withholding on vesting of shares are not included in the above stock repurchase program. During 2015, we acquired approximately 762,000 shares of our Common Stock for an aggregate purchase price of approximately $28.0 million pursuant to a previous stock repurchase program.
Effect of changes in foreign currency rates
The effect of changes in foreign currency rates on the consolidated statements of cash flows was a net decrease in cash and cash equivalents of $0.1 million, $7.7 million and $5.2 million in 2016, 2015 and 2014, respectively. Our principal foreign operating unit is in Canada, and, on average, the value of the Canadian dollar relative to the U.S. dollar appreciated during 2016 and decreased during 2015.
***********
We believe we have sufficient liquidity and capital resources to meet the cash needs of our ongoing operations. However, we may determine that additional debt or equity funding is warranted to provide liquidity for achievement of strategic goals or acquisitions or for unforeseen circumstances. Other than scheduled maturities of debt, operating lease payments and anticipated claims payments, we have no material contractual commitments. We expect that cash flows from operations and cash available from our underwriters, subject to regulatory restrictions, will be sufficient to fund our operations, including claims payments. However, to the extent that these funds are not sufficient, we may be required to borrow funds on terms less favorable than we currently have or seek funding from the equity market, which may not be successful or may be on terms that are dilutive to existing stockholders.
Other-than-temporary impairments of investments. We recorded other-than-temporary impairments on cost-basis investments of approximately $0.6 million and $1.0 million in 2015 and 2014, respectively. Additionally, during 2015, we recognized a $2.7 million other-than-temporary impairment on certain equity securities available-for-sale.
Other comprehensive (loss) income. Unrealized gains and losses on investments and changes in foreign currency exchange rates are reported net of deferred taxes in accumulated other comprehensive (loss) income, a component of stockholders’ equity, until realized. In 2016, net unrealized investment losses of $1.6 million, which increased our other comprehensive loss, were primarily related to temporary decreases in fair values of municipal, corporate and foreign bond investments, partially offset by the increase in fair values of equity securities investments. Changes in foreign currency exchange rates, primarily related to our Canadian operations, increased other comprehensive loss by $3.4 million, net of taxes, in 2016.
In 2015, net unrealized investment losses of $5.4 million, which increased our other comprehensive loss, were primarily related to temporary decreases in fair values of corporate and government bond investments and equity securities, partially offset by the increase in fair values of municipal bond investments. Changes in foreign currency exchange rates, primarily related to our Canadian operations, increased other comprehensive loss by $11.1 million, net of taxes, in 2015.
In 2014, net unrealized investment gains of $9.2 million, which increased our other comprehensive income, were primarily related to increases in fair values of corporate, municipal and government bond investments, partially offset by temporary decreases in fair values of equity securities and deferred taxes. Changes in foreign currency exchange rates, primarily related to our Canadian operations, decreased other comprehensive income by $7.6 million, net of taxes, in 2014.
29
Off-balance sheet arrangements. We do not have any material source of liquidity or financing that involves off-balance sheet arrangements, other than our contractual obligations under operating leases. We also routinely hold funds in segregated escrow accounts pending the closing of real estate transactions and have qualified intermediaries in tax-deferred property exchanges for customers pursuant to Section 1031 of the Internal Revenue Code. The Company holds the proceeds from these transactions until a qualifying exchange can occur. In accordance with industry practice, these segregated accounts are not included on the balance sheet. See Note 17 to our audited consolidated financial statements included in Item 15 of Part IV of this report.
Forward-looking statements. Certain statements in this report are “forward-looking statements” within the meaning of the Private Securities Litigation Reform Act of 1995. Such forward-looking statements relate to future, not past, events and often address our expected future business and financial performance. These statements often contain words such as “expect,” “anticipate,” “intend,” “plan,” “believe,” “seek,” “will,” “foresee” or other similar words. Forward-looking statements by their nature are subject to various risks and uncertainties that could cause our actual results to be materially different than those expressed in the forward-looking statements. These risks and uncertainties include, among other things: economic conditions; adverse changes in the level of real estate activity; changes in mortgage interest rates, existing and new home sales, and availability of mortgage financing; our ability to respond to and implement technology changes, including the completion of the implementation of our enterprise systems; the impact of unanticipated title losses or the need to strengthen our policy loss reserves; any effect of title losses on our cash flows and financial condition; the impact of vetting our agency operations for quality and profitability; changes to the participants in the secondary mortgage market and the rate of refinancing that affects the demand for title insurance products; regulatory non-compliance, fraud or defalcations by our title insurance agencies or employees; our ability to timely and cost-effectively respond to significant industry changes and introduce new products and services; the outcome of pending litigation; the impact of changes in governmental and insurance regulations, including any future reductions in the pricing of title insurance products and services; our dependence on our operating subsidiaries as a source of cash flow; the continued realization of expense savings from our cost management program; our ability to successfully integrate acquired businesses; our ability to access the equity and debt financing markets when and if needed; our ability to grow our international operations; and our ability to respond to the actions of our competitors. We expressly disclaim any obligation to update any forward-looking statements contained in this report to reflect events or circumstances that may arise after the date hereof, except as may be required by applicable law.
Item 7A. Quantitative and Qualitative Disclosures About Market Risk
The discussion below about our risk management strategies includes forward-looking statements that are subject to risks and uncertainties. Management’s projections of hypothetical net losses in the fair values of our market rate-sensitive financial instruments, should certain potential changes in market rates occur, are presented below. While we believe that the potential market rate changes are possible, actual rate changes could differ from our projections.
Our only material market risk in investments in financial instruments is our debt securities portfolio. We invest primarily in municipal, corporate, foreign and U.S. Government debt securities. We do not invest in financial instruments of a derivative or hedging nature.
We have established policies and procedures to minimize our exposure to changes in the fair values of our investments. These policies include retaining an investment advisory firm, an emphasis upon credit quality, management of portfolio duration, maintaining or increasing investment income through high coupon rates and actively managing our risk profile and security mix depending upon market conditions. We have classified all of our investments as available-for-sale.
30
Investments in debt securities at December 31, 2016 mature, according to their contractual terms, as follows (actual maturities may differ because of call or prepayment rights):
Amortized costs | Fair values | |||||
($ thousands) | ||||||
In one year or less | 53,313 | 53,644 | ||||
After one year through two years | 32,894 | 33,472 | ||||
After two years through three years | 45,816 | 46,416 | ||||
After three years through four years | 70,691 | 72,160 | ||||
After four years through five years | 78,476 | 80,546 | ||||
After five years | 307,989 | 308,881 | ||||
589,179 | 595,119 | |||||
We believe our investment portfolio is diversified and do not expect any material loss to result from the failure to perform by issuers of the debt securities we hold. Our investments are not collateralized. Foreign debt securities primarily include Canadian government and corporate bonds with aggregate fair values of $139.6 million and $125.2 million as of December 31, 2016 and 2015, respectively. Also included in foreign debt securities are United Kingdom treasury bonds at fair values of $22.6 million and $23.1 million as of December 31, 2016 and 2015, respectively.
Based on our foreign debt securities portfolio and foreign currency exchange rates at December 31, 2016, a 100 basis-point increase (decrease) in foreign currency exchange rates would result in an increase (decrease) of approximately $1.6 million, or 1.0%, in the fair value of our foreign debt securities portfolio. We do not currently employ hedging strategies with respect to foreign currency risk as we do not consider this risk as material to the Company. In addition, our international businesses conduct substantially all of their operations in their respective local currencies. Changes in foreign currency exchange rates may affect the fair value of the debt securities portfolio and may result in unrealized gains or losses. Gains or losses would only be realized upon the sale of the investments. Any other-than-temporary declines in fair values of securities are charged to operations.
Based on our debt securities portfolio and interest rates at December 31, 2016, a 100 basis-point increase (decrease) in interest rates would result in a decrease (increase) of approximately $29.7 million, or 5.0%, in the fair value of our portfolio. Changes in interest rates may affect the fair value of the debt securities portfolio and may result in unrealized gains or losses. Gains or losses would only be realized upon the sale of the investments. Any other-than-temporary declines in fair values of securities are charged to operations.
31
Item 8. Financial Statements and Supplementary Data
The information required to be provided in this item is included in our audited consolidated financial statements, including the Notes thereto, attached hereto as pages F-1 to F-29, and such information is incorporated in this report by reference.
Item 9. Changes in and Disagreements With Accountants on Accounting and Financial Disclosure
None.
Item 9A. Controls and Procedures
Our principal executive officer and principal financial officer are responsible for establishing and maintaining disclosure controls and procedures. They evaluated the effectiveness of our disclosure controls and procedures (as defined in Exchange Act Rules 13a-15(e) and 15d-15(e)) as of December 31, 2016 and have concluded that, as of such date, our disclosure controls and procedures are adequate and effective to ensure that information we are required to disclose in the reports that we file or submit under the Exchange Act is (i) recorded, processed, summarized and reported within the time periods specified in the SEC’s rules and forms, and (ii) accumulated and communicated to our management, including our principal executive officer and principal financial officer, as appropriate to allow timely decisions regarding required disclosure.
Our management is responsible for establishing and maintaining adequate internal control over financial reporting (as defined in Exchange Act Rule 13a-15(f) and 15d-15(f)). Our internal control over financial reporting is a process, under the supervision of our principal executive officer and principal financial officer, designed to provide reasonable assurance regarding the reliability of financial reporting and the preparation of financial statements for external purposes in accordance with generally accepted accounting principles. Our management, with the participation of our principal executive officer and principal financial officer, assessed the effectiveness of our internal control over financial reporting as of December 31, 2016. In making this assessment, our management used the criteria set forth by the Committee of Sponsoring Organizations of the Treadway Commission (COSO) in Internal Control - Integrated Framework (2013). Based on this assessment, management believes that, as of December 31, 2016, our internal control over financial reporting is effective based on those criteria.
All internal control systems, no matter how well designed, have inherent limitations. Therefore, even those systems determined to be effective can provide only reasonable assurance with respect to financial statement preparation and presentation. Internal control over financial reporting is a process that involves human diligence and compliance and is subject to lapses in judgment and breakdowns resulting from human failures. Internal control over financial reporting also can be circumvented by collusion or improper management override. Due to such limitations, there is a risk that material misstatements may not be prevented or detected on a timely basis by internal control over financial reporting. However, these inherent limitations are known features of the financial reporting process. Therefore, it is possible to design into the process safeguards to reduce, though not eliminate, this risk.
See page F-2 for the Report of Independent Registered Public Accounting Firm on our effectiveness of internal control over financial reporting.
There has been no change in our internal control over financial reporting during the quarter ended December 31, 2016 that has materially affected, or is reasonably likely to materially affect, our internal control over financial reporting. As a result, no corrective actions were required or undertaken.
Item 9B. Other Information
None.
32
PART III
Item 10. Directors, Executive Officers and Corporate Governance
Information regarding our directors and management team will be included in our proxy statement for our 2017 Annual Meeting of Stockholders (Proxy Statement), to be filed within 120 days after December 31, 2016, and is incorporated in this report by reference.
Our Board of Directors and Management Team as of February 27, 2017 are:
Board of Directors: | ||
Thomas G. Apel | Chairman of the Board of the Company and CEO of VLN, Inc. | |
Arnaud Ajdler | Managing Partner of Engine Capital LP | |
Clifford Allen Bradley | Former Chairman of the board and CEO of Amerisafe, Inc. | |
James Chadwick | Director of Ancora Advisors LLC | |
Glenn C. Christenson | Managing Director of Velstand Investments, LLC | |
Robert L. Clarke | Of Counsel, Bracewell LLP | |
Frederick H. Eppinger | Director of Centene Corp. and former President and CEO of The Hanover Insurance Group | |
Matthew W. Morris | Chief Executive Officer of the Company | |
Clifford Press | Partner and Managing Member of Oliver Press Partners, LLC | |
Management Team: | ||
Matthew W. Morris | Chief Executive Officer | |
Timothy Okrie | Chief Operations Officer | |
J. Allen Berryman | Chief Financial Officer, Secretary and Treasurer | |
Jay Milligan | Chief Revenue Officer | |
John L. Killea | Chief Legal Officer | |
Brad Rable | Chief Information Officer | |
Ann Manal | Chief Human Resources Officer | |
David A. Fauth | Group President | |
Patrick Beall | Group President | |
The Board of Directors has adopted the Stewart Code of Business Conduct and Ethics and Guidelines on Corporate Governance, as well as the Code of Ethics for Chief Executive Officers, Principal Financial Officer and Principal Accounting Officer. Each of these documents can be found at our website, www.stewart.com.
Item 11. Executive Compensation
Information regarding compensation for our executive officers will be included in the Proxy Statement and is incorporated in this report by reference. The Compensation Committee has reviewed and discussed the Compensation Discussion and Analysis with management and based on that review and discussion, the Compensation Committee recommended to the Board of Directors that the Compensation Discussion and Analysis be included in the Proxy Statement.
33
Item 12. Security Ownership of Certain Beneficial Owners and Management and Related Stockholder Matters
Information regarding security ownership of certain beneficial owners and management and related stockholder matters will be included in the Proxy Statement and is incorporated in this report by reference.
Item 13. Certain Relationships and Related Transactions, and Director Independence
Information regarding certain relationships and related transactions and director independence will be included in the Proxy Statement and is incorporated in this report by reference.
Item 14. Principal Accounting Fees and Services
Information regarding fees paid to and services provided by our independent registered public accounting firm will be included in the Proxy Statement and is incorporated in this report by reference.
PART IV
Item 15. Exhibits, Financial Statement Schedules
(a) | Financial Statements and Financial Statement Schedules |
The financial statements and financial statement schedules filed as part of this report are listed in the Index to Consolidated Financial Statements and Financial Statement Schedules on Page F-1 of this document. All other schedules are omitted, as the required information is inapplicable or the information is presented in the consolidated financial statements or related notes.
(b) | Exhibits |
Those exhibits required to be filed by Item 601 of Regulation S-K are listed in the Index to Exhibits immediately preceding the exhibits filed herewith and such listing is incorporated herein by reference.
34
SIGNATURES
Pursuant to the requirements of Section 13 or 15(d) of the Securities Exchange Act of 1934, we have duly caused this report to be signed on our behalf by the undersigned, thereunto duly authorized.
STEWART INFORMATION SERVICES CORPORATION
(Registrant)
By: | /s/ Matthew W. Morris |
Matthew W. Morris, Chief Executive Officer | |
By: | /s/ J. Allen Berryman |
J. Allen Berryman, Chief Financial Officer, Secretary and Treasurer | |
By: | /s/ Brian K. Glaze |
Brian K. Glaze, Controller and Principal Accounting Officer | |
Date: February 27, 2017
Pursuant to the requirements of the Securities Exchange Act of 1934, this report has been signed on our behalf on February 27, 2017 by the following Directors:
/s/ Thomas G. Apel | /s/ James Chadwick | /s/ Frederick H. Eppinger | ||
(Thomas G. Apel) | (James Chadwick) | (Frederick H. Eppinger) | ||
/s/ Arnaud Ajdler | /s/ Glenn C. Christenson | /s/ Matthew W. Morris | ||
(Arnaud Ajdler) | (Glenn C. Christenson) | (Matthew W. Morris) | ||
/s/ Clifford Allen Bradley | /s/ Robert L. Clarke | /s/ Clifford Press | ||
(Clifford Allen Bradley) | (Robert L. Clarke) | (Clifford Press) | ||
35
INDEX TO CONSOLIDATED FINANCIAL STATEMENTS
AND FINANCIAL STATEMENT SCHEDULES
Stewart Information Services Corporation and Subsidiaries’ Consolidated Financial Statements: | ||
Financial Statement Schedules: | ||
F - 1
Report of Independent Registered Public Accounting Firm
The Board of Directors and Stockholders
Stewart Information Services Corporation:
We have audited Stewart Information Services Corporation’s internal control over financial reporting as of December 31, 2016, based on criteria established in Internal Control - Integrated Framework (2013) issued by the Committee of Sponsoring Organizations of the Treadway Commission (COSO). Stewart Information Services Corporation’s management is responsible for maintaining effective internal control over financial reporting and for its assessment of the effectiveness of internal control over financial reporting, included in the accompanying Item 9A. Controls and Procedures. Our responsibility is to express an opinion on the Company’s internal control over financial reporting based on our audit.
We conducted our audit in accordance with the standards of the Public Company Accounting Oversight Board (United States). Those standards require that we plan and perform the audit to obtain reasonable assurance about whether effective internal control over financial reporting was maintained in all material respects. Our audit included obtaining an understanding of internal control over financial reporting, assessing the risk that a material weakness exists, and testing and evaluating the design and operating effectiveness of internal control based on the assessed risk. Our audit also included performing such other procedures as we considered necessary in the circumstances. We believe that our audit provides a reasonable basis for our opinion.
A company’s internal control over financial reporting is a process designed to provide reasonable assurance regarding the reliability of financial reporting and the preparation of financial statements for external purposes in accordance with generally accepted accounting principles. A company’s internal control over financial reporting includes those policies and procedures that (1) pertain to the maintenance of records that, in reasonable detail, accurately and fairly reflect the transactions and dispositions of the assets of the company; (2) provide reasonable assurance that transactions are recorded as necessary to permit preparation of financial statements in accordance with generally accepted accounting principles, and that receipts and expenditures of the company are being made only in accordance with authorizations of management and directors of the company; and (3) provide reasonable assurance regarding prevention or timely detection of unauthorized acquisition, use, or disposition of the company’s assets that could have a material effect on the financial statements.
Because of its inherent limitations, internal control over financial reporting may not prevent or detect misstatements. Also, projections of any evaluation of effectiveness to future periods are subject to the risk that controls may become inadequate because of changes in conditions, or that the degree of compliance with the policies or procedures may deteriorate.
In our opinion, Stewart Information Services Corporation maintained, in all material respects, effective internal control over financial reporting as of December 31, 2016, based on criteria established in Internal Control - Integrated Framework (2013) issued by the Committee of Sponsoring Organizations of the Treadway Commission.
We also have audited, in accordance with the standards of the Public Company Accounting Oversight Board (United States), the consolidated balance sheets of Stewart Information Services Corporation and subsidiaries as of December 31, 2016 and 2015, and the related consolidated statements of operations and comprehensive income (loss), cash flows, and equity for each of the years in the three‑year period ended December 31, 2016, and the financial statement schedules as listed in the accompanying index, and our report dated February 27, 2017 expressed an unqualified opinion on those consolidated financial statements.
/s/ KPMG LLP
Houston, Texas
February 27, 2017
F - 2
Report of Independent Registered Public Accounting Firm
The Board of Directors and Stockholders
Stewart Information Services Corporation:
We have audited the accompanying consolidated balance sheets of Stewart Information Services Corporation and subsidiaries (“the Company”) as of December 31, 2016 and 2015, and the related consolidated statements of operations and comprehensive income (loss), cash flows, and equity for each of the years in the three‑year period ended December 31, 2016. In connection with our audits of the consolidated financial statements, we also have audited the financial statement schedules as listed in the accompanying index. These consolidated financial statements and financial statement schedules are the responsibility of the Company’s management. Our responsibility is to express an opinion on these consolidated financial statements and financial statement schedules based on our audits.
We conducted our audits in accordance with the standards of the Public Company Accounting Oversight Board (United States). Those standards require that we plan and perform the audit to obtain reasonable assurance about whether the financial statements are free of material misstatement. An audit includes examining, on a test basis, evidence supporting the amounts and disclosures in the financial statements. An audit also includes assessing the accounting principles used and significant estimates made by management, as well as evaluating the overall financial statement presentation. We believe that our audits provide a reasonable basis for our opinion.
In our opinion, the consolidated financial statements referred to above present fairly, in all material respects, the financial position of Stewart Information Services Corporation and subsidiaries as of December 31, 2016 and 2015, and the results of their operations and their cash flows for each of the years in the three‑year period ended December 31, 2016, in conformity with U.S. generally accepted accounting principles. Also in our opinion, the related financial statement schedules, when considered in relation to the basic consolidated financial statements taken as a whole, present fairly, in all material respects, the information set forth therein.
We also have audited, in accordance with the standards of the Public Company Accounting Oversight Board (United States), Stewart Information Services Corporation’s internal control over financial reporting as of December 31, 2016, based on criteria established in Internal Control - Integrated Framework (2013) issued by the Committee of Sponsoring Organizations of the Treadway Commission (COSO), and our report dated February 27, 2017 expressed an unqualified opinion on the effectiveness of the Company’s internal control over financial reporting.
/s/ KPMG LLP
Houston, Texas
February 27, 2017
F - 3
CONSOLIDATED STATEMENTS OF OPERATIONS AND COMPREHENSIVE INCOME (LOSS)
For the Years Ended December 31, | ||||||||
2016 | 2015 | 2014 | ||||||
($000 omitted, except per share) | ||||||||
Revenues | ||||||||
Title insurance: | ||||||||
Direct operations | 894,313 | 897,118 | 808,327 | |||||
Agency operations | 1,009,797 | 991,332 | 906,062 | |||||
Ancillary services | 84,271 | 129,954 | 132,891 | |||||
Investment income | 18,925 | 16,850 | 16,806 | |||||
Investment and other (losses) gains – net | (666 | ) | (1,369 | ) | 6,744 | |||
2,006,640 | 2,033,885 | 1,870,830 | ||||||
Expenses | ||||||||
Amounts retained by agencies | 826,022 | 809,564 | 738,649 | |||||
Employee costs | 604,353 | 658,266 | 624,326 | |||||
Other operating expenses | 363,986 | 381,954 | 347,276 | |||||
Title losses and related claims | 91,147 | 106,265 | 81,305 | |||||
Impairment of goodwill | — | 35,749 | — | |||||
Depreciation and amortization | 30,044 | 30,298 | 24,226 | |||||
Interest | 3,062 | 2,096 | 3,236 | |||||
1,918,614 | 2,024,192 | 1,819,018 | ||||||
Income before taxes and noncontrolling interests | 88,026 | 9,693 | 51,812 | |||||
Income tax expense | 19,605 | 5,650 | 13,503 | |||||
Net income | 68,421 | 4,043 | 38,309 | |||||
Less net income attributable to noncontrolling interests | 12,943 | 10,247 | 8,556 | |||||
Net income (loss) attributable to Stewart | 55,478 | (6,204 | ) | 29,753 | ||||
Net income | 68,421 | 4,043 | 38,309 | |||||
Other comprehensive (loss) income, net of taxes: | ||||||||
Foreign currency translation adjustments | (3,367 | ) | (11,145 | ) | (7,565 | ) | ||
Change in unrealized net gains on investments | 354 | (3,741 | ) | 9,793 | ||||
Reclassification adjustment for net gains included in net income | (1,911 | ) | (1,626 | ) | (555 | ) | ||
Other comprehensive (loss) income, net of taxes | (4,924 | ) | (16,512 | ) | 1,673 | |||
Comprehensive income (loss) | 63,497 | (12,469 | ) | 39,982 | ||||
Less comprehensive income attributable to noncontrolling interests | 12,943 | 10,247 | 8,556 | |||||
Comprehensive income (loss) attributable to Stewart | 50,554 | (22,716 | ) | 31,426 | ||||
Basic average shares outstanding (000) | 23,364 | 23,544 | 22,778 | |||||
Basic earnings (loss) per share attributable to Stewart | 1.86 | (0.26 | ) | 1.31 | ||||
Diluted average shares outstanding (000) | 23,472 | 23,544 | 24,710 | |||||
Diluted earnings (loss) per share attributable to Stewart | 1.85 | (0.26 | ) | 1.24 | ||||
See notes to consolidated financial statements.
F - 4
CONSOLIDATED BALANCE SHEETS
As of December 31, | |||||
2016 | 2015 | ||||
($000 omitted) | |||||
Assets | |||||
Cash and cash equivalents | 185,772 | 179,067 | |||
Short-term investments | 22,239 | 39,707 | |||
Investments in debt and equity securities available-for-sale, at fair value: | |||||
Statutory reserve funds | 485,409 | 483,312 | |||
Other | 146,094 | 96,537 | |||
631,503 | 579,849 | ||||
Receivables: | |||||
Notes | 3,402 | 3,744 | |||
Premiums from agencies | 31,246 | 36,393 | |||
Income taxes | 4,878 | 1,914 | |||
Trade and other | 41,897 | 49,453 | |||
Allowance for uncollectible amounts | (9,647 | ) | (9,833 | ) | |
71,776 | 81,671 | ||||
Property and equipment, at cost: | |||||
Land | 3,991 | 3,991 | |||
Buildings | 22,529 | 22,898 | |||
Furniture and equipment | 217,105 | 214,350 | |||
Accumulated depreciation | (173,119 | ) | (169,870 | ) | |
70,506 | 71,369 | ||||
Title plants, at cost | 75,313 | 75,743 | |||
Investments in investees, on an equity method basis | 9,796 | 9,628 | |||
Goodwill | 217,094 | 217,722 | |||
Intangible assets, net of amortization | 10,890 | 18,075 | |||
Deferred tax assets, net | 3,860 | 4,949 | |||
Other assets | 42,975 | 43,807 | |||
1,341,724 | 1,321,587 | ||||
Liabilities | |||||
Notes payable | 106,808 | 102,399 | |||
Accounts payable and accrued liabilities | 115,640 | 118,082 | |||
Estimated title losses | 462,572 | 462,622 | |||
Deferred tax liabilities, net | 7,856 | 1,356 | |||
692,876 | 684,459 | ||||
Contingent liabilities and commitments | |||||
Stockholders’ equity | |||||
Common Stock – $1 par, authorized 50,000,000; issued 23,783,440 and 22,643,255; outstanding 23,431,279 and 22,291,094, respectively | 23,783 | 22,643 | |||
Class B Common Stock – $1 par, authorized 1,500,000; issued and outstanding 1,050,012 as of December 31, 2015; retired in 2016 | — | 1,050 | |||
Additional paid-in capital | 157,176 | 156,692 | |||
Retained earnings | 471,788 | 455,519 | |||
Accumulated other comprehensive (loss) income: | |||||
Foreign currency translation adjustments | (16,727 | ) | (13,360 | ) | |
Net unrealized gains on investments available-for-sale | 7,846 | 9,403 | |||
Treasury stock – 352,161 common shares, at cost, for 2016 and 2015 | (2,666 | ) | (2,666 | ) | |
Total stockholders’ equity attributable to Stewart | 641,200 | 629,281 | |||
Noncontrolling interests | 7,648 | 7,847 | |||
Total stockholders’ equity | 648,848 | 637,128 | |||
1,341,724 | 1,321,587 | ||||
See notes to consolidated financial statements.
F - 5
CONSOLIDATED STATEMENTS OF CASH FLOWS
For the Years Ended December 31, | ||||||||
2016 | 2015 | 2014 | ||||||
($000 omitted) | ||||||||
Reconciliation of net income to cash provided by operating activities: | ||||||||
Net income | 68,421 | 4,043 | 38,309 | |||||
Add (deduct): | ||||||||
Depreciation and amortization | 30,044 | 30,298 | 24,226 | |||||
Provision for bad debt | 3,349 | 3,396 | 1,977 | |||||
Investment and other (gains) losses – net | 666 | 1,369 | (6,744 | ) | ||||
Payments for title losses in excess of provisions | (1,056 | ) | (17,154 | ) | (18,803 | ) | ||
Adjustment for insurance recoveries of title losses | (173 | ) | 213 | 17,181 | ||||
Impairment of goodwill | — | 35,749 | — | |||||
Decrease in receivables – net | 7,759 | 12,894 | 8,791 | |||||
Decrease (increase) in other assets – net | 391 | 3,073 | (1,878 | ) | ||||
(Decrease) increase in payables and accrued liabilities – net | (3,888 | ) | 2,088 | (6,854 | ) | |||
Decrease (increase) in net deferred income taxes | 7,446 | (5,800 | ) | 3,176 | ||||
Net income from equity investees | (2,834 | ) | (3,579 | ) | (3,442 | ) | ||
Dividends received from equity investees | 2,640 | 3,811 | 3,582 | |||||
Stock based compensation expense | 2,982 | 4,445 | 4,020 | |||||
Other – net | 7,215 | 5,668 | 448 | |||||
Cash provided by operating activities | 122,962 | 80,514 | 63,989 | |||||
Investing activities: | ||||||||
Proceeds from investments available-for-sale sold | 81,091 | 69,280 | 58,132 | |||||
Proceeds from investments available-for-sale matured | 27,125 | 42,195 | 48,427 | |||||
Purchases of investments available-for-sale | (166,444 | ) | (147,697 | ) | (147,372 | ) | ||
Net sales (purchases) of short-term investments | 17,468 | (14,664 | ) | 13,294 | ||||
Purchases of property and equipment, title plants and real estate | (18,155 | ) | (19,658 | ) | (19,537 | ) | ||
Proceeds from the sale of land, buildings, property and equipment, and real estate | 692 | 4,214 | 3,520 | |||||
Net cash received from disposal (paid for acquisition) of subsidiaries and other assets | 1,268 | (3,958 | ) | (39,990 | ) | |||
Other – net | 181 | 1,497 | 4,969 | |||||
Cash used by investing activities | (56,774 | ) | (68,791 | ) | (78,557 | ) | ||
Financing activities: | ||||||||
Proceeds from notes payable | 57,758 | 52,651 | 120,273 | |||||
Payments on notes payable | (60,339 | ) | (22,494 | ) | (60,838 | ) | ||
Purchase of remaining interest of consolidated subsidiaries | (991 | ) | (209 | ) | (20 | ) | ||
Cash dividends paid | (27,840 | ) | (18,010 | ) | (2,334 | ) | ||
Cash paid on Class B Common Shares conversion | (12,000 | ) | — | — | ||||
Distributions to noncontrolling interests | (12,961 | ) | (9,706 | ) | (8,986 | ) | ||
Repurchases of Common Stock | (1,053 | ) | (27,950 | ) | (22,048 | ) | ||
Payment of contingent consideration related to an acquisition | (2,002 | ) | — | — | ||||
Other—net | 86 | 168 | (21 | ) | ||||
Cash (used) provided by financing activities | (59,342 | ) | (25,550 | ) | 26,026 | |||
Effects of changes in foreign currency exchange rates | (141 | ) | (7,664 | ) | (5,189 | ) | ||
Increase (decrease) in cash and cash equivalents | 6,705 | (21,491 | ) | 6,269 | ||||
Cash and cash equivalents at beginning of year | 179,067 | 200,558 | 194,289 | |||||
Cash and cash equivalents at end of year | 185,772 | 179,067 | 200,558 | |||||
F - 6
CONSOLIDATED STATEMENTS OF CASH FLOWS
For the Years Ended December 31, | |||||||||
2016 | 2015 | 2014 | |||||||
($000 omitted) | |||||||||
Supplemental information: | |||||||||
Retirement of Convertible Senior Notes with issuance of Common Stock | — | — | 27,190 | ||||||
Net changes in financial statement amounts due to disposal and purchase of subsidiaries and other assets: | |||||||||
Goodwill (disposed) acquired | (628 | ) | 7,220 | 21,440 | |||||
Receivables and other assets disposed (acquired) | (1,272 | ) | 38 | 12,620 | |||||
Intangible assets disposed (acquired) | (1,730 | ) | — | 21,110 | |||||
Liabilities recognized or acquired | (499 | ) | (3,300 | ) | (15,180 | ) | |||
Net realized loss on the disposal | 2,861 | — | — | ||||||
Net cash (received from disposal) paid for acquisition of subsidiaries and other assets | (1,268 | ) | 3,958 | 39,990 | |||||
Assets purchased through capital lease obligations | 6,990 | 1,062 | 2,003 | ||||||
Income taxes – net paid (refunded) | 15,265 | 14,982 | (106 | ) | |||||
Interest paid | 3,020 | 1,873 | 2,616 | ||||||
See notes to consolidated financial statements.
F - 7
CONSOLIDATED STATEMENTS OF EQUITY
Common and Class B Common Stock ($1 par value) | Additional paid-in capital | Accumulated other comprehensive income (loss) | Retained Earnings | Treasury stock | Noncontrolling interests | Total | ||||||||||||||
($000 omitted) | ||||||||||||||||||||
Balances at January 1, 2014 | 22,853 | 171,915 | 10,882 | 452,314 | (2,666 | ) | 7,791 | 663,089 | ||||||||||||
Net income attributable to Stewart | — | — | — | 29,753 | — | — | 29,753 | |||||||||||||
Cash dividends on Common Stock ($0.10 per share) | — | — | — | (2,334 | ) | — | — | (2,334 | ) | |||||||||||
Stock bonuses and other (including tax effects) | 77 | 3,839 | — | — | — | — | 3,916 | |||||||||||||
Exercise of stock options | 2 | 56 | — | — | — | — | 58 | |||||||||||||
Stock repurchases | (685 | ) | (21,363 | ) | — | — | — | — | (22,048 | ) | ||||||||||
Conversion of Convertible Senior Notes for Common Stock | 2,111 | 25,079 | — | — | — | — | 27,190 | |||||||||||||
Purchase of remaining interest of consolidated subsidiary | — | (321 | ) | — | — | — | — | (321 | ) | |||||||||||
Net change in unrealized gains and losses on investments (net of tax) | — | — | 9,793 | — | — | — | 9,793 | |||||||||||||
Net realized gain reclassification (net of tax) | — | — | (555 | ) | — | — | — | (555 | ) | |||||||||||
Foreign currency translation (net of tax) | — | — | (7,565 | ) | — | — | — | (7,565 | ) | |||||||||||
Net income attributable to noncontrolling interests | — | — | — | — | — | 8,556 | 8,556 | |||||||||||||
Distributions to noncontrolling interests | — | — | — | — | — | (8,986 | ) | (8,986 | ) | |||||||||||
Net effect of changes in ownership and other | — | — | — | — | — | (93 | ) | (93 | ) | |||||||||||
Balances at December 31, 2014 | 24,358 | 179,205 | 12,555 | 479,733 | (2,666 | ) | 7,268 | 700,453 | ||||||||||||
Net loss attributable to Stewart | — | — | — | (6,204 | ) | — | — | (6,204 | ) | |||||||||||
Cash dividends on Common Stock ($0.80 per share) | — | — | — | (18,010 | ) | — | — | (18,010 | ) | |||||||||||
Stock bonuses and other (including tax effects) | 93 | 4,758 | — | — | — | — | 4,851 | |||||||||||||
Exercise of stock options | 4 | 126 | — | — | — | — | 130 | |||||||||||||
Stock repurchases | (762 | ) | (27,188 | ) | — | — | — | — | (27,950 | ) | ||||||||||
Purchase of remaining interest of consolidated subsidiary | — | (209 | ) | — | — | — | — | (209 | ) | |||||||||||
Net change in unrealized gains and losses on investments (net of tax) | — | — | (3,741 | ) | — | — | — | (3,741 | ) | |||||||||||
Net realized gain reclassification (net of tax) | — | — | (1,626 | ) | — | — | — | (1,626 | ) | |||||||||||
Foreign currency translation (net of tax) | — | — | (11,145 | ) | — | — | — | (11,145 | ) | |||||||||||
Net income attributable to noncontrolling interests | — | — | — | — | — | 10,247 | 10,247 | |||||||||||||
Distributions to noncontrolling interests | — | — | — | — | — | (9,706 | ) | (9,706 | ) | |||||||||||
Net effect of changes in ownership and other | — | — | — | — | — | 38 | 38 | |||||||||||||
Balances at December 31, 2015 | 23,693 | 156,692 | (3,957 | ) | 455,519 | (2,666 | ) | 7,847 | 637,128 | |||||||||||
Cumulative effect adjustment for adoption of new accounting pronouncement | — | (631 | ) | — | 631 | — | — | — | ||||||||||||
Net income attributable to Stewart | — | — | — | 55,478 | — | — | 55,478 | |||||||||||||
Cash dividends on Common Stock ($1.20 per share) | — | — | — | (27,840 | ) | — | — | (27,840 | ) | |||||||||||
Cash paid on Class B Common Shares conversion | — | — | — | (12,000 | ) | — | — | (12,000 | ) | |||||||||||
Stock bonuses and other | 110 | 2,872 | — | — | — | — | 2,982 | |||||||||||||
Exercise of stock options | 3 | 83 | — | — | — | — | 86 | |||||||||||||
Stock repurchases | (23 | ) | (1,030 | ) | — | — | — | — | (1,053 | ) | ||||||||||
Purchase of remaining interest of consolidated subsidiary | — | (810 | ) | — | — | — | (181 | ) | (991 | ) | ||||||||||
Net change in unrealized gains and losses on investments (net of tax) | — | — | 354 | — | — | — | 354 | |||||||||||||
Net realized gain reclassification (net of tax) | — | — | (1,911 | ) | — | — | — | (1,911 | ) | |||||||||||
Foreign currency translation (net of tax) | — | — | (3,367 | ) | — | — | — | (3,367 | ) | |||||||||||
Net income attributable to noncontrolling interests | — | — | — | — | — | 12,943 | 12,943 | |||||||||||||
Distributions to noncontrolling interests | — | — | — | — | — | (12,961 | ) | (12,961 | ) | |||||||||||
Balances at December 31, 2016 | 23,783 | 157,176 | (8,881 | ) | 471,788 | (2,666 | ) | 7,648 | 648,848 | |||||||||||
See notes to consolidated financial statements.
F - 8
NOTES TO CONSOLIDATED FINANCIAL STATEMENTS
Three Years Ended December 31, 2016
NOTE 1
General. Stewart Information Services Corporation, through its subsidiaries (collectively, the Company), is primarily engaged in the business of providing title insurance and real estate transaction related services. The Company operates through a network of production facilities, owned policy-issuing offices and independent agencies in the United States and international markets. Stewart Information Services Corporation is a customer-focused, global title insurance and real estate services company offering products and services through its direct operations, network of approved agencies and other businesses within the Company. The Company provides these services to homebuyers and sellers; residential and commercial real estate professionals; mortgage lenders and servicers; title agencies and real estate attorneys; home builders; and the United States government. The Company also provides services to large mortgage lenders and servicers, mortgage brokers and mortgage investors which are primarily related to appraisal and valuation services (referred to as ancillary services operations). Approximately 48% of consolidated title revenues for the year ended December 31, 2016 were generated in Texas, New York, California, Florida and international markets (principally Canada).
A. Management’s responsibility. The accompanying consolidated financial statements were prepared by management, who is responsible for their integrity and objectivity. The financial statements have been prepared in conformity with U.S. generally accepted accounting principles (GAAP), including management’s best judgments and estimates. Actual results could differ from those estimates.
B. Reclassifications. Certain prior year amounts in these consolidated financial statements have been reclassified for comparative purposes. Net income (loss) attributable to Stewart and stockholders’ equity, as previously reported, were not affected.
C. Consolidation. The consolidated financial statements include all subsidiaries in which the Company owns more than 50% voting rights in electing directors. All significant intercompany amounts and transactions have been eliminated and provisions have been made for noncontrolling interests. Unconsolidated investees, in which the Company typically owns 20% through 50% of the entity, are accounted for by the equity method.
D. Statutory accounting. Stewart Title Guaranty Company (Guaranty) and other title insurance underwriters owned by the Company prepare financial statements in accordance with statutory accounting practices prescribed or permitted by regulatory authorities.
In conforming the statutory financial statements to GAAP, the statutory premium reserve and the reserve for known title losses are eliminated and, in substitution, amounts are established for estimated title losses (Note 1F), for which the net effect, after providing for income taxes, is included in the consolidated statements of operations and comprehensive income (loss). Additionally, the investments in debt securities available-for-sale, which are carried at amortized cost for statutory accounting, are reported at fair value and the net unrealized gains and losses, net of applicable deferred taxes, on the investments are included as a component of accumulated other comprehensive (loss) income within stockholders’ equity.
E. Revenue recognition. Operating revenues from direct title operations are considered earned at the time of the closing of the related real estate transaction. The Company recognizes premium revenues on title insurance policies written by independent agencies (agencies) when the policies are reported to the Company. In addition, where reasonable estimates can be made, the Company accrues for policies issued but not reported until after period end. The Company believes that reasonable estimates can be made when recent and consistent policy issuance information is available. Estimates are based on historical reporting patterns and other information obtained about agencies, as well as current trends in direct operations and in the title industry. In this accrual, future transactions are not being estimated. The Company is estimating revenues on policies that have already been issued by agencies but not yet reported to or received by the Company. The Company has consistently followed the same basic method of estimating unreported policy revenues for more than 10 years.
Revenues generated by the Company's ancillary services operations are generally considered earned at the time the service is performed or the product is delivered to the customer.
F - 9
F. Title losses and related claims. The Company’s method for recording the reserves for title losses on both an interim and annual basis begins with the calculation of its current loss provision rate, which is applied to the Company’s current premiums resulting in a title loss expense for the period. This loss provision rate is set to provide for estimated losses on current year policies and is determined using moving average ratios of recent actual policy loss payment experience (net of recoveries) to premium revenues.
At each quarter end, the Company’s recorded reserve for title losses begins with the prior period’s reserve balance for claim losses, adds the current period provision to that balance and subtracts actual paid claims, resulting in an amount that management compares to its actuarially-based calculation of the ending reserve balance necessary to provide for future reported title losses. The actuarially-based calculation is a paid loss development calculation where loss development factors are selected based on company data and input from the Company’s third-party actuaries. The Company also obtains input from third-party actuaries in the form of a reserve analysis utilizing generally accepted actuarial methods. While the Company is responsible for determining its loss reserves, it utilizes this actuarial input to assess the overall reasonableness of its reserve estimation. If the Company’s recorded reserve amount is not at the actuarial point estimate, but is within a reasonable range (+5.0%/-4.0%) of its actuarially-based reserve calculation and the actuary’s point estimate, the Company’s management assesses the major factors contributing to the different reserve estimates in order to determine the overall reasonableness of its recorded reserve, as well as the position of the recorded reserves relative to the point estimate and the estimated range of reserves. The major factors considered can change from period to period and include items such as current trends in the real estate industry (which management can assess although there is a time lag in the development of this data for use by the actuary), the size and types of claims reported and changes in the Company’s claims management process. If the recorded amount is not within a reasonable range of the Company’s third-party actuary’s point estimate, it will adjust the recorded reserves in the current period and reassess the provision rate on a prospective basis. Once the Company’s reserve for title losses is recorded, it is reduced in future periods as a result of claims payments and may be increased or reduced by revisions to the Company’s estimate of the overall level of required reserves.
Large claims (those exceeding $1.0 million on a single claim), including large title losses due to independent agency defalcations, are analyzed and reserved for separately due to the higher dollar amount of loss, lower volume of claims reported and sporadic reporting of such claims.
Due to the inherent uncertainty in predicting future title policy losses, significant judgment is required by both the Company’s management and its third party actuaries in estimating reserves. As a consequence, the Company’s ultimate liability may be materially greater or less than its current reserves and/or its third party actuary’s calculated estimate.
G. Cash equivalents. Cash equivalents are highly liquid investments with insignificant interest rate risks and maturities of three months or less at the time of acquisition.
H. Short-term investments. Short-term investments comprise time deposits with banks, federal government obligations and other investments maturing in less than one year.
I. Investments in debt and equity securities. The investment portfolio is classified as available-for-sale. Realized gains and losses on sales of investments are determined using the specific identification method. Net unrealized gains and losses on investments available-for-sale, net of applicable deferred taxes, are included as a component of accumulated other comprehensive (loss) income within stockholders’ equity. At the time unrealized gains and losses become realized, they are reclassified from accumulated other comprehensive (loss) income using the specific identification method. Other-than-temporary declines in fair values of investments available-for-sale are charged to income.
J. Property and equipment. Depreciation is principally computed using the straight-line method over the estimated useful lives of the assets at the following rates: buildings – 30 to 40 years and furniture and equipment – 3 to 10 years. Maintenance and repairs are expensed as incurred while improvements are capitalized. Gains and losses are recognized at disposal.
F - 10
K. Title plants. Title plants include compilations of a county’s official land records, prior title examination files, copies of prior title policies, maps and related materials that are geographically indexed to a specific property. The costs of acquiring existing title plants and creating new ones, prior to the time such plants are placed in operation, are capitalized. Title plants are not amortized since there is no indication of any loss of value over time but are subject to review for impairment. The costs of maintaining and operating title plants are expensed as incurred. Gains and losses on sales of copies of title plants or interests in title plants are recognized at the time of sale.
L. Goodwill. Goodwill is not amortized, but is reviewed annually, during the third quarter using June 30 balances, or whenever occurrences of events indicate a potential impairment at the reporting unit level. U.S. GAAP provides an option to assess qualitative factors to determine whether it is more-likely-than-not that the fair value of a reporting unit is less than its carrying amount. If we decide not to use a qualitative assessment or if the reporting unit fails the qualitative assessment, then we perform a two-step quantitative analysis.
The step one analysis is performed, using a combination of the income approach (discounted cash flow (DCF) technique) and the market approach (guideline company and precedent transaction analyses), to determine if the carrying value of the goodwill exceeds its fair value, which would indicate a potential impairment. The DCF model utilizes historical and projected operating results and cash flows, initially driven by estimates of changes in future revenue levels, and risk-adjusted discount rates. Our projected operating results are primarily driven by anticipated mortgage originations, which we obtain from projections by industry experts, for our title reporting units and forecasted contractual revenues for our ancillary services reporting unit. Fluctuations in revenues, followed by our ability to appropriately adjust our employee count and other operating expenses, or large and unanticipated adjustments to title loss reserves, are the primary reasons for increases or decreases in our projected operating results. Our market-based valuation methodologies utilize (i) market multiples of earnings and/or other operating metrics of comparable companies and (ii) our market capitalization and a control premium based on market data and factors specific to our ownership and corporate governance structure. If we determine that the carrying value of the reporting unit's goodwill is greater than its fair value, we then perform the step two analysis to determine the implied fair value of the goodwill and calculate the amount of impairment.
In performing the step two analysis, the implied fair value of goodwill is determined in the same manner as the amount of goodwill recognized in a business combination. In this method, the estimated fair value of the reporting unit is allocated to all the assets and liabilities of that reporting unit (including any unrecognized intangible assets) as if the reporting unit had been acquired in a business combination and the estimated fair value is the purchase price paid. Any impairment of goodwill is determined by the difference between the implied fair value and the carrying amount of the goodwill and is charged to current operations.
While we are responsible for assessing whether an impairment of goodwill exists, we utilize inputs from third-party appraisers in performing the quantitative analysis for our impairment review. We evaluate goodwill based on four reporting units with goodwill balances (direct operations, agency operations, international operations and ancillary services). Goodwill is assigned to these reporting units at the time the goodwill is initially recorded. Once assigned to a reporting unit, the goodwill is pooled and no longer attributable to a specific acquisition. All activities within a reporting unit are available to support the carrying value of the goodwill.
M. Other intangibles. Other intangible assets are comprised principally of non-compete, underwriting and customer relationship agreements and acquired software. Intangible assets are amortized over their estimated lives, which are primarily 3 to 10 years. These intangible assets are reviewed for impairment when certain events or changes in circumstances occur that indicate that the carrying amount of an asset may not be recoverable. The Company performs an analysis to determine whether the carrying amount of each intangible asset is recoverable. The carrying amount is not recoverable when it exceeds the sum of the undiscounted cash flows expected to result from the use and eventual disposition of the asset. For any intangible asset that is not recoverable, the Company calculates the excess of the carrying amount of the intangible asset over its fair value, estimated using the income approach (DCF technique). The resulting difference of the carrying amount over the fair value is treated as the impairment of the asset and is charged to current operations.
N. Other long-lived assets. The Company reviews the carrying values of title plants and other long-lived assets if certain events occur that may indicate impairment. An impairment of these long-lived assets is indicated when projected undiscounted cash flows over the estimated lives of the assets are less than carrying values. If impairment is indicated, the recorded amounts are written down to fair values. There were no significant impairment charges for long-lived assets during the three years ended December 31, 2016.
F - 11
O. Fair values. The fair values of financial instruments, including cash and cash equivalents, short-term investments, notes receivable, notes payable and accounts payable, are determined by the exchange price that would be received for an asset or paid to transfer a liability (an exit price) in the principal, or most advantageous, market for the asset or liability in an orderly transaction between market participants at the measurement date. The net fair values of these financial instruments approximate their carrying values. Investments in debt and equity securities and certain financial instruments are carried at their fair values.
P. Leases. The Company recognizes rent expense under noncancelable operating leases, which generally expire over the next 10 years, on the straight-line basis over the terms of the leases, including provisions for any free rent periods or escalating lease payments.
Q. Income taxes. Deferred tax assets and liabilities are recognized for future tax consequences attributable to differences between the tax basis and the book carrying values of certain assets and liabilities. To the extent that the Company does not believe its deferred tax assets meet the more-likely-than-not realization criteria, it establishes a valuation allowance. When it establishes a valuation allowance, or increases (decreases) the allowance during the year, it records a tax expense (benefit) in its consolidated statements of operations and comprehensive income (loss). Enacted tax rates are used in calculating amounts.
The Company provides for uncertainties in income taxes by prescribing a recognition threshold and measurement attribute for the financial statement recognition and measurement of a tax position taken or expected to be taken in a tax return.
R. Recently adopted accounting pronouncements. In March 2016, the Financial Accounting Standards Board (FASB) issued Accounting Standards Update No. (ASU) 2016-09, Improvements to Employee Share-Based Payment Accounting, which simplified several aspects of the accounting for share-based transactions. The new guidance requires excess tax benefits and tax deficiencies to be recorded in the statement of operations and comprehensive income (loss) when the awards vest or are settled. Additionally, ASU 2016-09 requires the cash flows related to excess tax benefits to be classified as an operating activity along with other income tax cash flows; removes the requirement to include hypothetical excess tax benefits in the application of the treasury stock method when computing earnings per share; allows for repurchase of an employee’s shares for tax withholding purposes at maximum statutory tax rates without triggering liability accounting; clarifies that all cash payments made on an employee’s behalf for withheld shares should be presented as a financing activity on the statement of cash flows; and provides an accounting policy election to account for forfeitures as they occur. This ASU is effective for annual and interim periods beginning after December 15, 2016 and early adoption is allowed provided the entire ASU is adopted.
During the fourth quarter 2016, the Company elected to early adopt ASU 2016-09. Using the modified retrospective method of adoption, the Company recognized a cumulative effect adjustment at January 1, 2016 and reclassified the remaining $0.6 million of unrecognized excess tax benefits from additional paid-in capital to retained earnings in the 2016 statement of equity. The additional impact of the adoption was the recognition of excess tax benefits in the provision for income taxes, rather than in additional paid-in capital, beginning January 1, 2016 and the Company's election to recognize forfeitures in the period they occur. There were no other material impacts of the adoption of ASU 2016-09 and no prior year balances were adjusted.
S. Recent significant accounting pronouncements not yet adopted. In May 2014, the FASB issued ASU 2014-09, Revenue from Contracts with Customers, which eliminated the transaction-specific and industry-specific revenue recognition guidance under current GAAP and replaced it with a principles-based approach for determining revenue recognition. Originally, ASU 2014-09 was effective for annual and interim periods beginning after December 15, 2016. In August 2015, the FASB deferred the effective date of ASU 2014-09 by one year to annual and interim periods beginning after December 15, 2017. In March 2016, the FASB clarified the implementation guidance on principal versus agent considerations. In April 2016, the FASB clarified certain aspects of identifying performance obligations and licensing implementation guidance. In May 2016, the FASB provided additional guidance related to disclosure of remaining performance obligations, as well as other amendments to guidance on collectibility, non-cash consideration and the presentation of sales and other similar taxes collected from customers. Earlier application is permitted only for annual and interim periods after December 15, 2016. The Company expects to adopt ASU 2014-09 on January 1, 2018 using the cumulative effect method of adoption. The Company is still currently evaluating the impact of the adoption of ASU 2014-09 on its consolidated financial statements and related disclosures. Based on a preliminary assessment, the Company does not expect ASU 2014-09 to have a material impact on its consolidated financial statements.
F - 12
In February 2016, the FASB issued ASU 2016-02, Leases, which amended several provisions of Topic 842 (Leases) which include the requirement to recognize in the balance sheet a liability equal to the present value of contractual lease payments and a right-of-use asset representing the right to use the underlying asset for the lease term. This ASU is effective for annual and interim periods beginning after December 15, 2018 and early adoption is allowed. The Company expects to adopt ASU 2016-02 on January 1, 2019 and recognize and measure leases in the financial statements at the beginning of the earliest period presented using a modified retrospective approach. The Company considers the adoption of ASU 2016-02 will result in material increases in the assets and liabilities reported on its consolidated balance sheets. However, the Company expects the new ASU will likely have insignificant impact on its consolidated statements of operations and cash flows. The Company is currently assessing technological and staff resources that will be needed to address changes to its lease management and accounting processes. Refer to Note 16 for the disclosures of future minimum lease payments relating to operating leases of office spaces.
In January 2017, the FASB issued ASU 2017-01, Business Combination: Clarifying the Definition of a Business. The amendments in this ASU change the definition of a business to assist with evaluating when a set of transferred assets and activities is a business. This ASU is effective for annual and interim periods beginning after December 15, 2017 and early adoption is allowed. The Company expects to early adopt the ASU effective January 1, 2017.
Also in January 2017, the FASB issued ASU 2017-04, Intangibles - Goodwill and Other: Simplifying the Test for Goodwill Impairment. To simplify the subsequent measurement of goodwill, the amendments in this ASU eliminate Step 2 from the two-step quantitative goodwill impairment test. Under this new guidance, the annual, or interim, goodwill impairment test is performed by comparing the fair value of a reporting unit with its carrying amount. An impairment charge, if determined applicable, should be recognized for the amount by which the carrying amount exceeds the reporting unit’s fair value; however, the loss recognized should not exceed the total amount of goodwill allocated to that reporting unit. In addition, income tax effects from any tax deductible goodwill on the carrying amount of the reporting unit should be considered when measuring the goodwill impairment loss. This ASU does not amend the optional qualitative assessment of goodwill impairment. This ASU is effective for annual and interim periods beginning after December 15, 2019 and early adoption is allowed. The Company expects to early adopt the ASU effective January 1, 2017.
NOTE 2
Restrictions on cash and investments. The Company maintains investments in accordance with certain statutory requirements in the states of domicile of our underwriters for the funding of statutory premium reserves. Statutory reserve funds, which approximated $485.4 million and $483.3 million at December 31, 2016 and 2015, respectively, are required to be fully funded and invested in high-quality securities and short-term investments. In addition, included within cash and cash equivalents are statutory reserve funds of approximately $13.9 million and $17.2 million at December 31, 2016 and 2015, respectively. Although these cash statutory reserve funds are not restricted or segregated in depository accounts, they are required to be held pursuant to state statutes. If the Company fails to maintain minimum investments or cash and cash equivalents sufficient to meet statutory requirements, the Company may be subject to fines or other penalties, including potential revocation of its business license. These funds are not available for any other purpose. In the event that insurance regulators adjust the determination of the statutory premium reserves of the Company’s title insurers, these restricted funds as well as statutory surplus would correspondingly increase or decrease.
A substantial majority of consolidated cash and investments at each year end was held by the Company’s title insurance subsidiaries. Generally, the types of investments a title insurer can make are subject to legal restrictions. Furthermore, the transfer of funds by a title insurer to its parent or subsidiary operations, as well as other related party transactions, is restricted by law and generally requires the approval of state insurance authorities.
F - 13
NOTE 3
Statutory surplus and dividend restrictions. Substantially all of the consolidated retained earnings at each year end were represented by Guaranty, which owns directly or indirectly all of the subsidiaries included in the consolidation.
Guaranty cannot pay a dividend to its parent in excess of certain limits without the approval of the Texas Insurance Commissioner. The maximum dividend that can be paid after such approval in 2016 is $102.0 million. Guaranty paid dividends of $20.0 million, $15.0 million and $25.0 million in 2016, 2015, and 2014, respectively.
Dividends from Guaranty are also voluntarily restricted primarily to maintain statutory surplus and liquidity at competitive levels and to demonstrate significant claims payment ability. The ability of a title insurer to pay claims can significantly affect the decision of lenders and other customers when buying a policy from a particular insurer.
Surplus as regards policyholders (sum of statutory capital plus surplus) for Guaranty was $509.9 million and $501.8 million at December 31, 2016 and 2015, respectively. Statutory net income for Guaranty was $53.6 million, $83.2 million and $53.2 million in 2016, 2015 and 2014 respectively.
The amount of statutory capital and surplus necessary to satisfy regulatory requirements for Guaranty was $2.0 million (and in the aggregate less than $15.0 million for all of the Company’s underwriter subsidiaries) at December 31, 2016, and each of its underwriter entities was in compliance with such requirements as of December 31, 2016.
NOTE 4
Investments in debt and equity securities. Amortized costs and fair values at December 31, follow:
2016 | 2015 | ||||||||||
Amortized costs | Fair values | Amortized costs | Fair values | ||||||||
($000 omitted) | |||||||||||
Debt securities: | |||||||||||
Municipal | 72,284 | 72,432 | 70,300 | 72,008 | |||||||
Corporate | 338,365 | 343,047 | 303,870 | 309,461 | |||||||
Foreign | 165,735 | 167,027 | 149,914 | 153,221 | |||||||
U.S. Treasury Bonds | 12,795 | 12,613 | 13,803 | 13,906 | |||||||
Equity securities | 30,255 | 36,384 | 27,497 | 31,253 | |||||||
619,434 | 631,503 | 565,384 | 579,849 | ||||||||
The Company believes its investment portfolio is diversified and expects no material loss to result from the failure to perform by issuers of the debt securities it holds. Investments made by the Company are not collateralized. Foreign debt securities primarily include Canadian government and corporate bonds, with aggregate fair values of $139.6 million and $125.2 million as of December 31, 2016 and 2015, respectively, and United Kingdom treasury bonds with aggregate fair values of $22.6 million and $23.1 million as of December 31, 2016 and 2015, respectively.
F - 14
Gross unrealized gains and losses at December 31, were:
2016 | 2015 | ||||||||||
Gains | Losses | Gains | Losses | ||||||||
($000 omitted) | |||||||||||
Debt securities: | |||||||||||
Municipal | 723 | 575 | 1,720 | 12 | |||||||
Corporate | 6,871 | 2,189 | 7,700 | 2,109 | |||||||
Foreign | 2,912 | 1,620 | 3,789 | 482 | |||||||
U.S. Treasury Bonds | 4 | 186 | 128 | 25 | |||||||
Equity securities | 6,800 | 671 | 4,842 | 1,086 | |||||||
17,310 | 5,241 | 18,179 | 3,714 | ||||||||
Debt securities at December 31, 2016 mature, according to their contractual terms, as follows (actual maturities may differ due to call or prepayment rights):
Amortized costs | Fair values | ||||
($000 omitted) | |||||
In one year or less | 53,313 | 53,644 | |||
After one year through five years | 227,877 | 232,594 | |||
After five years through ten years | 225,206 | 225,483 | |||
After ten years | 82,783 | 83,398 | |||
589,179 | 595,119 | ||||
Gross unrealized losses on investments and the fair values of the related securities, aggregated by investment category and length of time that individual securities have been in a continuous unrealized loss position at December 31, 2016, were:
Less than 12 months | More than 12 months | Total | |||||||||||||||
Losses | Fair values | Losses | Fair values | Losses | Fair values | ||||||||||||
($000 omitted) | |||||||||||||||||
Debt securities: | |||||||||||||||||
Municipal | 575 | 32,038 | — | — | 575 | 32,038 | |||||||||||
Corporate | 2,189 | 119,965 | — | — | 2,189 | 119,965 | |||||||||||
Foreign | 1,427 | 70,012 | 193 | 3,160 | 1,620 | 73,172 | |||||||||||
U.S. Treasury Bonds | 186 | 11,847 | — | — | 186 | 11,847 | |||||||||||
Equity securities: | 424 | 5,950 | 247 | 2,250 | 671 | 8,200 | |||||||||||
4,801 | 239,812 | 440 | 5,410 | 5,241 | 245,222 | ||||||||||||
The number of investments in an unrealized loss position as of December 31, 2016 was 192, 11 of which were in unrealized loss positions for more than 12 months. Since the Company does not intend to sell and will more-likely-than-not maintain its investment in equity and debt securities until recovery of the fair value or amortized cost, respectively, these investments are not considered other-than-temporarily impaired. The Company also determined that there is no significant credit risk existing with its debt securities. In 2015, the Company recognized an other-than-temporary impairment of $2.7 million on certain equity securities with significant unrealized losses, reported within investment and other losses - net in the 2015 consolidated statement of operations and other comprehensive loss. In 2016, the Company determined that there was no other-than-temporary impairment on its investments in available-for-sale securities.
F - 15
Gross unrealized losses on investments and the fair values of the related securities, aggregated by investment category and length of time that individual securities have been in a continuous unrealized loss position at December 31, 2015, were:
Less than 12 months | More than 12 months | Total | |||||||||||||||
Losses | Fair values | Losses | Fair values | Losses | Fair values | ||||||||||||
($000 omitted) | |||||||||||||||||
Debt securities: | |||||||||||||||||
Municipal | 9 | 2,230 | 3 | 1,615 | 12 | 3,845 | |||||||||||
Corporate | 1,461 | 83,565 | 648 | 32,871 | 2,109 | 116,436 | |||||||||||
Foreign | 322 | 35,008 | 160 | 3,155 | 482 | 38,163 | |||||||||||
U.S. Treasury Bonds | 6 | 1,195 | 19 | 3,583 | 25 | 4,778 | |||||||||||
Equity securities: | 720 | 4,440 | 366 | 3,224 | 1,086 | 7,664 | |||||||||||
2,518 | 126,438 | 1,196 | 44,448 | 3,714 | 170,886 | ||||||||||||
NOTE 5
Fair value measurements. The Fair Value Measurements and Disclosures Topic of the FASB Accounting Standards Codification (ASC) defines fair value as the exchange price that would be received for an asset or paid to transfer a liability (an exit price) in the principal, or most advantageous, market for the asset or liability in an orderly transaction between market participants at the measurement date. This guidance establishes a three-level fair value hierarchy that prioritizes the inputs used to measure fair value. This hierarchy requires entities to maximize the use of observable inputs when possible. The three levels of inputs used to measure fair value are as follows:
• | Level 1 – quoted prices in active markets for identical assets or liabilities; |
• | Level 2 – observable inputs other than quoted prices included in Level 1, such as quoted prices for similar assets and liabilities in active markets; quoted prices for identical or similar assets and liabilities in markets that are not active; or other inputs that are observable or can be corroborated by observable market data; and |
• | Level 3 – unobservable inputs that are supported by little or no market activity and that are significant to the fair values of the assets or liabilities, including certain pricing models, discounted cash flow methodologies and similar techniques that use significant unobservable inputs. |
At December 31, 2016, financial instruments measured at fair value on a recurring basis are summarized below:
Level 1 | Level 2 | Level 3 | Fair value measurements | ||||||||
($000 omitted) | |||||||||||
Investments available-for-sale: | |||||||||||
Debt securities: | |||||||||||
Municipal | — | 72,432 | — | 72,432 | |||||||
Corporate | — | 343,047 | — | 343,047 | |||||||
Foreign | — | 167,027 | — | 167,027 | |||||||
U.S. Treasury Bonds | — | 12,613 | — | 12,613 | |||||||
Equity securities: | 36,384 | — | — | 36,384 | |||||||
36,384 | 595,119 | — | 631,503 | ||||||||
At December 31, 2015, financial instruments measured at fair value on a recurring basis are summarized below:
F - 16
Level 1 | Level 2 | Level 3 | Fair value measurements | ||||||||
($000 omitted) | |||||||||||
Investments available-for-sale: | |||||||||||
Debt securities: | |||||||||||
Municipal | — | 72,008 | — | 72,008 | |||||||
Corporate | — | 309,461 | — | 309,461 | |||||||
Foreign | — | 153,221 | — | 153,221 | |||||||
U.S. Treasury Bonds | — | 13,906 | — | 13,906 | |||||||
Equity securities: | 31,253 | — | — | 31,253 | |||||||
31,253 | 548,596 | — | 579,849 | ||||||||
At December 31, 2016, Level 1 financial instruments consist of equity securities. Level 2 financial instruments consist of municipal, governmental, and corporate bonds, both U.S. and foreign. In accordance with the Company’s policies and guidelines which incorporate relevant statutory requirements, the Company’s third-party registered investment manager invests only in securities rated as investment grade or higher by the major rating services, where observable valuation inputs are significant. All municipal, foreign, and U.S. Treasury bonds are valued using a third-party pricing service, and the corporate bonds are valued using the market approach, which includes three to ten inputs from relevant market sources, including Financial Industry Regulatory Authority’s (FINRA) Trade Reporting and Compliance Engine (TRACE) and independent broker/dealer quotes, bids and offerings, as well as other relevant market data, such as securities with similar characteristics (i.e. sector, rating, maturity, etc.). Broker/dealer quotes, bids and offerings mentioned above are gathered (typically three to ten) and a consensus risk premium spread (credit spread) over risk-free Treasury yields is developed from the inputs obtained, which is then used to calculate the resulting fair value.
There were no transfers of investments between Level 1 and Level 2 during the three years ended December 31, 2016.
NOTE 6
Investment income and other gains and losses. Income from investments and gross realized investment and other gains and losses are detailed below:
2016 | 2015 | 2014 | ||||||
($000 omitted) | ||||||||
Investment income: | ||||||||
Debt securities | 16,476 | 15,181 | 14,593 | |||||
Short-term investments, cash equivalents and other | 2,449 | 1,669 | 2,213 | |||||
18,925 | 16,850 | 16,806 | ||||||
Investment and other (losses) gains – net: | ||||||||
Realized gains | 9,882 | 5,948 | 12,018 | |||||
Realized losses | (10,548 | ) | (7,317 | ) | (5,274 | ) | ||
(666 | ) | (1,369 | ) | 6,744 | ||||
Proceeds from the sales of investments available-for-sale were $81.1 million, $69.3 million and $58.1 million for the years ended December 31, 2016, 2015 and 2014, respectively. Expenses assignable to investment income were insignificant and there were no significant investments that did not produce income for all years presented.
In 2016, investment and other losses - net included $3.4 million of office closure and early lease termination costs and $3.3 million of realized losses from sale of certain businesses within ancillary services operations, partially offset by $4.0 million of net realized gains from the sale of investments available-for-sale, $1.2 million of realized gain on a cost-basis investment transaction and $0.4 million of realized gain from sale of certain title offices.
F - 17
In 2015, investment and other losses – net included realized losses of $2.7 million relating to other-than-temporary impairment of investment in equity securities available-for-sale, $1.8 million impairment of other intangible assets and $1.4 million relating to office closure costs, partially offset by realized gains of $2.4 million from the sale of debt and equity investments available-for-sale and $1.5 million from the sale of office buildings.
In 2014, investment and other gains – net included realized gains of $5.6 million from the reduction in the fair value of a contingent consideration liability, $3.8 million from the sale of a business and $1.1 million from the sale of debt and equity investments available-for-sale, partially offset by charges of $1.9 million relating to office closure costs, $1.7 million impairment of an other intangible asset and $1.0 million relating to the impairment of a cost-basis investment.
NOTE 7
Income taxes. Income tax expense consists of the following:
2016 | 2015 | 2014 | ||||||
($000 omitted) | ||||||||
Current: | ||||||||
Federal | 4,718 | 4,774 | 3,047 | |||||
State | 1,447 | 709 | (224 | ) | ||||
Foreign | 5,983 | 5,967 | 7,442 | |||||
Deferred: | ||||||||
Federal | 6,262 | (3,986 | ) | 3,916 | ||||
State | (1,347 | ) | (1,375 | ) | (694 | ) | ||
Foreign | 2,542 | (439 | ) | 16 | ||||
Income tax expense | 19,605 | 5,650 | 13,503 | |||||
The following reconciles income tax expense (benefit) computed at the federal statutory rate with income tax expense as reported:
2016 | 2015 | 2014 | ||||||
($000 omitted) | ||||||||
Expected income tax expense (benefit) at 35% (1) | 26,279 | (194 | ) | 15,140 | ||||
Return-to-provision and true-up adjustments | (4,127 | ) | (1,329 | ) | 1,133 | |||
Previously unrecognized research and development credits | (3,434 | ) | — | — | ||||
Nondeductible expenses | 2,772 | 2,768 | 4,060 | |||||
Intercompany dividends, net of deduction for dividends received | (539 | ) | (541 | ) | (319 | ) | ||
Tax-exempt interest | (458 | ) | (404 | ) | (324 | ) | ||
State income tax benefit – net of Federal impact | (407 | ) | (914 | ) | (840 | ) | ||
Noncontrolling interest | 303 | 251 | 186 | |||||
Valuation allowance | 294 | (668 | ) | (5,020 | ) | |||
Foreign tax rate differential | (207 | ) | (329 | ) | (693 | ) | ||
Impairment of goodwill | — | 7,099 | — | |||||
Other – net | (871 | ) | (89 | ) | 180 | |||
Income tax expense | 19,605 | 5,650 | 13,503 | |||||
Effective income tax rates (1) | 26.1 | % | (1,019.4 | )% | 31.2 | % | ||
(1) Calculated using income (loss) before taxes and after noncontrolling interests.
F - 18
Deferred tax assets and liabilities resulting from the same tax jurisdiction are netted and presented as either an asset or liability on the consolidated balance sheets. Deferred tax assets and liabilities resulting from different tax jurisdictions are not netted. Deferred tax assets and liabilities as of December 31 are detailed below.
2016 | 2015 | ||||
($000 omitted) | |||||
Deferred tax assets: | |||||
Accrued expenses | 26,835 | 20,190 | |||
Net operating loss (NOL) carryforwards | 6,275 | 6,428 | |||
Tax credit carryforwards | 6,154 | 20,242 | |||
Federal offset to Canadian deferred tax liability (1) | 4,335 | 1,657 | |||
Foreign currency translation adjustments | 4,238 | 5,220 | |||
Allowance for uncollectible amounts | 3,454 | 3,524 | |||
Fixed assets | 2,067 | 2,094 | |||
Investments | 978 | 3,369 | |||
Other | 476 | 297 | |||
Deferred tax assets – gross | 54,812 | 63,021 | |||
Valuation allowance | (2,457 | ) | (2,217 | ) | |
Deferred tax assets – net | 52,355 | 60,804 | |||
Deferred tax liabilities: | |||||
Amortization – goodwill and other intangibles | (26,851 | ) | (27,991 | ) | |
Title loss provisions | (21,433 | ) | (18,523 | ) | |
Unrealized gains on investments | (3,873 | ) | (4,811 | ) | |
Deferred compensation on life insurance policies | (3,345 | ) | (3,558 | ) | |
Other | (849 | ) | (2,328 | ) | |
Deferred tax liabilities – gross | (56,351 | ) | (57,211 | ) | |
Net deferred income tax (liability) asset | (3,996 | ) | 3,593 | ||
(1) For U.S. income tax purposes, the Company’s Canada operation is a branch of Guaranty. As a result, the branch’s Canadian net deferred tax liability is offset in the U.S. as a deferred tax asset but not in an equal amount given differing tax rates in Canada and the U.S.
At December 31, 2016 and 2015, net deferred tax (liabilities) assets for U.S. federal tax paying components totaled approximately $(1.2) million and $3.8 million, respectively, and net deferred tax liabilities for foreign tax paying components totaled approximately $2.8 million and $0.3 million, respectively. The net increase (decrease) to the valuation allowance during 2016 and 2015 was $0.2 million and $(0.3) million, respectively.
During 2008, the Company recorded a valuation allowance against U.S. deferred tax assets, net of definite-lived deferred tax liabilities, for which realization could not be assured based on a more-likely-than-not standard. The Company retained that valuation allowance for all subsequent periods through December 31, 2011 principally due to the Company’s cumulative three-year operating loss history as of the end of each period. The Company routinely evaluates the extent to which the valuation allowance may be reversed. During 2014, the Company released the remaining $5.0 million valuation allowance on foreign tax credit carryforwards that it believed will, on a more-likely-than-not-basis, be utilized prior to expiration. During 2016 and 2015, there were no material releases of any valuation allowance. The Company believes it is more-likely-than-not it will be able to utilize its net deferred tax assets.
The Company’s $6.2 million of foreign tax credit carryforwards at December 31, 2016 expire in 2022 and 2023. The Company's $6.3 million of deferred tax assets relating to NOL carryforwards include certain state amounts which expire in varying amounts from 2019 through 2036 and foreign amounts which expire in varying amounts from 2020 through 2026 or have unlimited carryforward periods. The future utilization of all NOL and foreign tax credit carryforwards is subject to various limitations. The remaining valuation allowance at December 31, 2016 relates principally to certain state and foreign NOL carryforwards.
F - 19
The Company’s income tax returns are routinely subject to examinations by U.S. federal, foreign, and state and local tax authorities. During 2014, the Internal Revenue Service (IRS) completed its examination of calendar years 2005 through 2008 and the Company received anticipated refunds from previously-filed carryback claims in the amount of $2.8 million. Also during 2014, the IRS completed its examination of the calendar year 2012 U.S. federal tax return without any IRS-initiated adjustments. The Company is also involved in routine examinations by state and local tax jurisdictions for calendar years 2010 through 2014. The Company expects no material adjustments from any tax return examinations.
NOTE 8
Goodwill and other intangibles. The summary of changes in goodwill is as follows:
Title | Ancillary Services and Corporate | Total | ||||||
($000 omitted) | ||||||||
Balances at January 1, 2015 | 202,002 | 49,866 | 251,868 | |||||
Re-allocation of goodwill | 3,951 | (3,951 | ) | — | ||||
Acquisitions | 7,220 | — | 7,220 | |||||
Purchase adjustments | — | (5,268 | ) | (5,268 | ) | |||
Impairment | (1,569 | ) | (34,180 | ) | (35,749 | ) | ||
Disposals | (349 | ) | — | (349 | ) | |||
Balances at December 31, 2015 | 211,255 | 6,467 | 217,722 | |||||
Acquisitions | 300 | — | 300 | |||||
Disposals | (190 | ) | (738 | ) | (928 | ) | ||
Balances at December 31, 2016 | 211,365 | 5,729 | 217,094 | |||||
In connection with the realignment of the Company's reportable segments in 2016 (refer to Note 19), management determined it was appropriate to re-allocate the goodwill attributable to the centralized title services business from the ancillary services and corporate segment to the title segment. For comparability, this adjustment and the 2015 impairment related to the centralized title services business were presented as part of the title segment 2015 activity in the table shown above. The purchase adjustments recorded for 2015 were related to the remeasurement of assumed liabilities related to certain acquisitions from 2014 (refer to Note 20).
The Company evaluates goodwill for impairment annually based on information as of June 30 of the current year or more frequently if circumstances suggest that impairment may exist. In 2016, the Company performed a quantitative assessment for each of its reporting units to determine whether it is more likely than not that the fair value of each reporting unit is less than its carrying amount, including goodwill. Based on the analysis, the Company concluded that the goodwill related to each reporting unit was not impaired.
In 2015, the Company utilized the qualitative assessment for the title reporting units and concluded that the goodwill related to the title reporting units was not impaired. Further, in 2015, based on management's decision to exit the delinquent loan servicing activities included within the ancillary services reporting unit, the Company performed a two-step quantitative assessment of ancillary services' goodwill. Based on the impairment analysis, the Company recorded a $35.7 million impairment of goodwill for 2015, which was presented as impairment of goodwill in the 2015 consolidated statement of operations and comprehensive loss. As discussed above, $1.6 million of the total impairment was related to the centralized title services business and was subsequently included as part of the title segment as a result of the Company's realignment of its reportable segments.
In 2015, the Company also performed an impairment analysis of other intangible assets within the ancillary services and corporate segment. Based on the Company's impairment review using the discounted cash flow technique to estimate fair value, the Company recorded an impairment of $0.9 million on an intangible asset. Further, the Company recognized in 2015 a $0.9 million impairment relating to an intangible asset under the title segment that will not be recoverable in future periods. These impairment losses on other intangible assets were reported within investment and other losses - net in the 2015 consolidated statement of operations and comprehensive loss. During 2016, the Company determined no impairment on other intangible assets was required.
F - 20
The gross carrying amount and accumulated amortization and impairment of other intangibles was $32.7 million and $21.8 million, respectively, at December 31, 2016 and $43.6 million and $25.5 million, respectively, at December 31, 2015. During 2016, other intangible assets with total gross carrying amounts and accumulated amortization and impairment of $11.2 million and $9.1 million, respectively, were written off as part of the sale of certain businesses within the Company's ancillary services operations (refer to Note 21).
The amortization expense recorded for the Company's other intangible assets was $5.5 million and $7.0 million in 2016 and 2015, respectively. The annual amortization expense expected to be recognized in the next five years is approximately $3.4 million in 2017, $2.8 million in 2018, $2.0 million in 2019, $1.0 million in 2020 and $0.4 million in 2021.
NOTE 9
Equity investees. Summarized aggregate financial information for equity investees (in which the Company typically owns 20% through 50% of the equity) is as follows:
2016 | 2015 | 2014 | ||||||
($000 omitted) | ||||||||
For the year: | ||||||||
Revenues | 24,274 | 28,843 | 31,562 | |||||
Net income | 6,542 | 8,830 | 7,914 | |||||
At December 31: | ||||||||
Total assets | 32,324 | 33,555 | 25,533 | |||||
Notes payable | 20,895 | 20,200 | 12,727 | |||||
Stockholders’ equity | 9,483 | 7,213 | 7,665 | |||||
Net premium revenues from policies issued by equity investees were approximately $2.1 million, $2.5 million and $3.1 million in 2016, 2015 and 2014, respectively. Income related to equity investees was $2.8 million, $3.6 million and $3.4 million in 2016, 2015 and 2014, respectively. These amounts are included in title insurance – direct operations in the consolidated statements of operations and comprehensive income (loss).
Goodwill related to equity investees was $7.4 million as of December 31, 2016 and 2015, and is included in investments in investees in the consolidated balance sheets. Equity investments, including the related goodwill balances, are reviewed for impairment annually and upon the occurrence of an event that may indicate an impairment. No impairment was recorded during the three years ended December 31, 2016.
NOTE 10
Notes payable and line of credit. A summary of notes payable follows:
2016 | 2015 | ||||
($000 omitted) | |||||
Banks – varying payments and rates (1) | 92,875 | 98,000 | |||
Other than banks | 13,933 | 4,399 | |||
106,808 | 102,399 | ||||
(1) Average interest rates were 1.97% and 1.68% during the year ended December 31, 2016 and 2015, respectively.
Principal payments on the above notes, based upon the contractual maturities, are due in the amounts of $9.7 million in 2017, $2.3 million in 2018, $94.1 million in 2019, and $0.7 million in 2020. Included within notes payable - other than banks are $7.3 million and $3.8 million of capital lease obligations at December 31, 2016 and 2015, respectively.
F - 21
As of December 31, 2016, the Company had available a $125.0 million unsecured line of credit commitment (Credit Agreement), which expires October 2019, under which borrowings of $92.9 million were outstanding; the remaining balance of the line of credit available for use was $29.6 million, net of an unused $2.5 million letter of credit. The unsecured line of credit can be used for general corporate purposes, including acquisitions. Borrowings bear interest, at the Company's election, at either (a) an Alternate Base Rate plus the Applicable Rate (ABR Borrowing) or (b) LIBOR plus the Applicable Rate (Eurodollar Borrowing). The Applicable Rate ranges from 0.50% to 1.00% per annum for ABR Borrowings and 1.50% to 2.00% per annum for Eurodollar Borrowings based on the Company's consolidated Leverage Ratio.
Also, under the terms of the Credit Agreement, the Company may at any time, subject to certain conditions, request an increase in the amount of the line of credit up to $50.0 million. The Credit Agreement contains customary affirmative and negative covenants. The Credit Agreement also contains certain consolidated financial covenants providing that (a) the ratio of EBITDA (as defined in the Credit Agreement) to fixed charges (as defined in the agreement) not be below 1.25 to 1.00 on a trailing four-quarter basis (Fixed Charge Ratio); (b) the ratio of total Indebtedness to EBITDA for the prior four consecutive quarters must not be greater than 2.25 to 1.00 (Leverage Ratio); and (c) Capital Expenditures in the aggregate for the Company in any calendar year may not exceed $20.0 million, with certain allowances for carryover of unused amounts. The Company was in compliance with all covenants as of December 31, 2016 and 2015.
In February 2016, the Company entered into a first amendment (First Amendment) relating to the Credit Agreement. The First Amendment amended the Credit Agreement, effective as of December 31, 2015, to, among other things, (i) establish an exception to the limitation on restricted payments under the Credit Agreement, which allowed for the cash payment of $12.0 million in April 2016 to the holders of the Company’s Class B Common Stock in respect of the Exchange Agreement (refer to Note 12), (ii) establish an exception to the limitation on restricted payments under the Credit Agreement in respect of the Company’s new share repurchase program of up to $50.0 million, as announced in November 2015, (iii) increase the general permitted restricted payments (dividends) basket in Section 6.07 of the Credit Agreement from $25.0 million to $35.0 million annually, (iv) provide for an exclusion from the calculation of EBITDA of the $35.9 million impairment charge recorded in 2015, and (v) increase the amount of capital expenditures permitted in any calendar year from $20 million to $25 million.
The Company's qualified intermediary in tax-deferred property exchanges pursuant to Section 1031 of the Internal Revenue Code enters into short-term loan agreements with parties to an exchange in the ordinary course of its business. The outstanding balances pursuant to these loans, as included within notes payable - other than banks in the above table, were $6.5 million and $0.4 million as of December 31, 2016 and 2015, respectively, and are secured by cash that is included in cash and cash equivalents on the Company's consolidated balance sheet. Borrowings and repayments on these loans are reflected as financing activities in the consolidated statements of cash flows.
F - 22
NOTE 11
Estimated title losses. A summary of estimated title losses is as follows:
2016 | 2015 | 2014 | ||||||
($000 omitted) | ||||||||
Balances at January 1 | 462,622 | 495,395 | 506,888 | |||||
Provisions: | ||||||||
Current year | 72,586 | 68,029 | 64,577 | |||||
Previous policy years | 18,561 | 38,236 | 16,728 | |||||
Total provisions | 91,147 | 106,265 | 81,305 | |||||
Payments, net of recoveries: | ||||||||
Current year | (18,836 | ) | (19,182 | ) | (18,775 | ) | ||
Previous policy years | (73,194 | ) | (104,450 | ) | (67,898 | ) | ||
Total payments, net of recoveries | (92,030 | ) | (123,632 | ) | (86,673 | ) | ||
Adjustments related to acquired balance | — | (2,303 | ) | 2,268 | ||||
Effects of changes in foreign currency exchange rates | 833 | (13,103 | ) | (8,393 | ) | |||
Balances at December 31 | 462,572 | 462,622 | 495,395 | |||||
Loss ratios as a percentage of title operating revenues: | ||||||||
Current year provisions | 3.8 | % | 3.6 | % | 3.8 | % | ||
Total provisions | 4.8 | % | 5.6 | % | 4.7 | % | ||
The loss provision recorded for the year ended December 31, 2016 reflected an ultimate loss rate of 3.8% of title revenues for policies issued in the current year and a net increase in the loss reserve estimates for prior policy years of $18.6 million. The increase in the loss reserve estimate for prior policy years included $14.3 million related to adverse loss development due to continued elevated claims payment experience for certain years. Total provisions for large title claims related to prior policy years were $3.8 million, $31.7 million and $3.1 million in 2016, 2015 and 2014, respectively.
The 2015 and 2014 loss provisions included 3.6% and 3.8%, respectively, of title revenues related to the current policy year and net increases in the loss reserves estimate for prior policy years of $38.2 million and $16.7 million, respectively. During 2015 and 2014, the Company continued to experience favorable development relative to prior years which allowed the Company to lower the overall loss provision rates during these years. Provisions for prior policy years during 2015 and 2014 included adverse loss development of $6.2 million and $17.9 million, respectively, relating to other than large title losses.
NOTE 12
Common Stock and Class B Common Stock. Prior to April 2016, the Company had two classes of stock outstanding - the Common Stock and the Class B Common Stock. On January 26, 2016, the Company entered into an Exchange Agreement with the holders of Class B Common Stock relating to the exchange of 1,050,012 Class B Common Stock shares, representing all outstanding Class B Common Stock, for 1,050,012 shares of Common Stock plus $12.0 million in aggregate cash. On April 27, 2016, the Company's stockholders approved the Exchange Agreement and the related amendments to the Company's by-laws and certificate of incorporation and entered into a Registration Rights Agreement with the holders of the Class B Common Stock. On the same date after the stockholders' approval, the Company issued 1,050,012 shares of Common Stock plus $12.0 million cash in exchange for the retirement of the outstanding 1,050,012 Class B Common Stock shares. In accordance with U.S. GAAP, the $12.0 million cash payment was recorded as a reduction to retained earnings, similar to dividends on preferred stock (refer to Note 14).
At December 31, 2016 and 2015, there were 145,820 shares of Common Stock held by a subsidiary of the Company which are included in the treasury stock reported in the consolidated balance sheets.
F - 23
NOTE 13
Share-based payments. During the three years ended December 31, 2016, the Company granted executives and senior management shares of restricted common stock which are time-based. Prior to 2016, time-based restricted common stock grants vest at the end of three years after the grant date. The time-based grants in 2016 and future periods vest equally on each of the first three anniversaries of the grant date. The Company also granted performance-based shares of restricted common stock which vest upon achievement of certain financial objectives over a period of three years. The aggregate grant-date fair values of restricted common stock awards in 2016, 2015 and 2014 were $4.1 million (110,000 shares with an average grant price of $37.34), $4.4 million (119,000 shares with an average grant price of $37.16) and $4.0 million (125,000 shares with an average grant price of $32.24), respectively. Awards were made pursuant to the Company’s employee incentive compensation plans and the compensation expense associated with restricted stock awards is recognized over the corresponding vesting period as part of employee costs in the consolidated statements of operations. Additionally, in 2016, 2015 and 2014, the Company granted its board of directors, as a component of their annual director retainer compensation, approximately 18,000, 18,000 and 22,000 shares, respectively, of common stock, which immediately vested at grant date. The aggregate fair values of these director awards at grant dates were $0.6 million, $0.7 million and $0.7 million, respectively, and the associated expense is recognized in other operating expenses in the consolidated statements of operations.
A summary of the restricted common stock award activity during the year ended December 31, 2016 is presented below:
Shares | Weighted-Average Grant-Date Fair Value per Share ($) | ||||
Nonvested balance at January 1, 2016 | 252,190 | 34.88 | |||
Granted | 109,903 | 37.34 | |||
Adjustment for performance-based shares | (36,997 | ) | 32.91 | ||
Vested | (83,286 | ) | 33.23 | ||
Forfeited | (35,483 | ) | 35.03 | ||
Nonvested balance at December 31, 2016 | 206,327 | 37.18 | |||
The fair value of shares that vested in 2016 and 2015 aggregated to $3.8 million and $2.9 million, respectively. For the years ended December 31, 2016, 2015 and 2014, compensation costs recognized in the statements of operations were approximately $3.0 million, $4.4 million and $4.0 million, respectively. The total tax benefits recognized in the statement of operations from tax deductions relating to vesting of restricted common stock awards in 2016, 2015 and 2014 were $1.7 million, $1.0 million and $0.3 million, respectively. As of December 31, 2016, compensation costs not yet recognized related to nonvested restricted common stock awards was $4.0 million, which is expected to be recognized over a weighted average period of 1.7 years.
NOTE 14
Earnings per share. The Company’s basic earnings (loss) per share (EPS) attributable to Stewart is calculated by dividing net income (loss) attributable to Stewart by the weighted-average number of shares of Common Stock outstanding during the reporting periods.
To calculate diluted earnings per share, net income and number of shares are adjusted for the effects of any dilutive shares. Using the if-converted method, net income is adjusted for interest expense, net of any tax effects, applicable to the Convertible Senior Notes, which were fully converted into common stock during October 2014. The number of shares is adjusted by adding the number of dilutive shares, assuming they are issued, during the same reporting period. The treasury stock method is used to calculate the dilutive number of shares related to the Company’s long term incentive and stock option plans. In periods of loss, dilutive shares are excluded from the calculation of the diluted loss per share and diluted loss per share is computed in the same manner as basic loss per share.
F - 24
The calculation of the basic and diluted earnings (loss) per share is as follows:
For the Years Ended December 31, | ||||||||
2016 | 2015 | 2014 | ||||||
($000 omitted) | ||||||||
Numerator: | ||||||||
Net income (loss) attributable to Stewart | 55,478 | (6,204 | ) | 29,753 | ||||
Less: Cash paid on Class B Common Shares conversion (a) | (12,000 | ) | — | — | ||||
Net income (loss) for calculating basic EPS | 43,478 | (6,204 | ) | 29,753 | ||||
Add: Interest expense, net of tax effects | — | — | 1,006 | |||||
Adjusted net income (loss) for calculating diluted EPS | 43,478 | (6,204 | ) | 30,759 | ||||
Denominator (000): | ||||||||
Basic average shares outstanding | 23,364 | 23,544 | 22,778 | |||||
Average number of dilutive shares relating to options | — | — | 2 | |||||
Average number of dilutive shares relating to convertible senior notes | — | — | 1,641 | |||||
Average number of dilutive shares relating to restricted shares grant | 108 | — | 289 | |||||
Diluted average shares outstanding | 23,472 | 23,544 | 24,710 | |||||
Basic earnings (loss) per share attributable to Stewart | 1.86 | (0.26 | ) | 1.31 | ||||
Diluted earnings (loss) per share attributable to Stewart | 1.85 | (0.26 | ) | 1.24 | ||||
(a) - In accordance with the ASC 260, Earnings Per Share, the $12.0 million payment to the holders of the Class B Common Stock shares (refer to Note 12) is treated in a manner similar to the treatment of dividends on preferred stock for the purpose of calculating EPS. Accordingly, the $12.0 million payment was deducted from the 2016 net income to arrive at the adjusted net income for calculating basic and diluted EPS.
NOTE 15
Reinsurance. As is industry practice, the Company cedes risks to other title insurance underwriters and reinsurers on certain transactions. However, the Company remains liable if the reinsurer should fail to meet its obligations. The Company also assumes risks from other underwriters on a transactional basis as well as on certain reinsurance treaties. Payments and recoveries on reinsured losses were insignificant during each of the years ended December 31, 2016, 2015, and 2014. The total amount of premiums for assumed and ceded risks was less than 1.0% of consolidated title revenues in each of the last three years.
NOTE 16
Leases. Lease expense was $41.3 million, $42.9 million and $42.6 million in 2016, 2015 and 2014, respectively. The future minimum lease payments relating to operating leases are summarized as follows (in thousands of dollars):
2017 | 50,274 | |
2018 | 41,967 | |
2019 | 31,468 | |
2020 | 18,666 | |
2021 | 11,375 | |
2022 and after | 14,442 | |
168,192 | ||
F - 25
NOTE 17
Contingent liabilities and commitments. The Company routinely holds third-party funds in segregated escrow accounts pending the closing of real estate transactions resulting in a contingent liability to the Company of approximately $1.0 billion at December 31, 2016. In addition, the Company is contingently liable for disbursements of escrow funds held by agencies in those cases where specific insured closing guarantees have been issued.
The Company owns a qualified intermediary in tax-deferred property exchanges for customers pursuant to Section 1031 of the Internal Revenue Code. The Company holds the proceeds from these transactions until a qualifying exchange can occur. This resulted in a contingent liability to the Company of approximately $1.1 billion at December 31, 2016. As is industry practice, escrow and Section 1031 exchanger fund accounts are not included in the consolidated balance sheets.
In the ordinary course of business, the Company guarantees the third-party indebtedness of certain of its consolidated subsidiaries. As of December 31, 2016, the maximum potential future payments on the guarantees are not more than the related notes payable recorded in the consolidated balance sheets (refer to Note 10). The Company also guarantees the indebtedness related to lease obligations of certain of its consolidated subsidiaries. The maximum future obligations arising from these lease-related guarantees are not more than the Company’s future minimum lease payments (refer to Note 16). As of December 31, 2016, the Company also had unused letters of credit aggregating $5.6 million related to workers’ compensation coverage and other insurance. The Company does not expect to make any payments on these guarantees.
NOTE 18
Regulatory and legal developments. The Company is subject to claims and lawsuits arising in the ordinary course of its business, most of which involve disputed policy claims. In some of these lawsuits, the plaintiff seeks exemplary or treble damages in excess of policy limits. The Company does not expect that any of these ordinary course proceedings will have a material adverse effect on its consolidated financial condition or results of operations. In addition, along with the other major title insurance companies, the Company is party to class action lawsuits concerning the title insurance industry. The Company believes that it has adequate reserves for the various litigation matters and contingencies discussed in this paragraph and that the likely resolution of these matters will not materially affect its consolidated financial condition or results of operations.
The Company is subject to administrative actions and litigation relating to the basis on which premium taxes are paid in certain states. Additionally, the Company receives from time to time various other inquiries from governmental regulators concerning practices in the insurance industry. Many of these practices do not concern title insurance. To the extent the Company is in receipt of such inquiries, it believes that it has adequately reserved for these matters and does not anticipate that the outcome of these inquiries will materially affect its consolidated financial condition or results of operations.
The Company is subject to various other administrative actions and inquiries into its business conduct in certain of the states in which it operates. While the Company cannot predict the outcome of the various regulatory and administrative matters, it believes that it has adequately reserved for these matters and does not anticipate that the outcome of any of these matters will materially affect its consolidated financial condition or results of operations.
F - 26
NOTE 19
Segment information. Prior to 2016, the Company reported three operating segments: title insurance and related services (title), mortgage services and corporate. Effective in the first quarter 2016, as a result of realigning and streamlining the management of the mortgage services operations, the Company began reporting two operating segments: title and ancillary services and corporate. The centralized title services business, previously included in the mortgage services segment, is now included in the title segment. The remaining operations of the mortgage services segment, principally appraisal and valuation services, are not material, in the aggregate, for separate segment presentation and are now included in the ancillary services and corporate segment. In addition, the Company began allocating the costs of its centralized administrative services departments to the respective operating businesses. The new operating segments reflect the current manner that management uses in allocating resources and assessing performance of the Company's businesses.
The title segment provides services needed to transfer title to property in a real estate transaction and includes services such as searching, examining, closing and insuring the condition of the title to the property. In addition, the title segment includes centralized title services, home and personal insurance services and Internal Revenue Code Section 1031 tax-deferred exchanges. The ancillary services and corporate segment historically provided appraisal and valuation services, document management, recording and call center-related services offered to large mortgage lenders and servicers, mortgage brokers and mortgage investors. As of December 31, 2016 the principal offering of ancillary services are appraisal and valuation services. Also included in the ancillary services and corporate segment are expenses of the parent holding company and certain other enterprise-wide overhead costs.
Selected statement of operations information related to these segments for the years ended December 31 is as follows using restated prior year period amounts to conform to the new segment presentation:
2016 | 2015 | 2014 | ||||||
($000 omitted) | ||||||||
Title segment: | ||||||||
Revenues | 1,922,422 | 1,904,258 | 1,730,875 | |||||
Impairment of goodwill | — | 1,569 | — | |||||
Depreciation and amortization | 21,176 | 18,767 | 16,677 | |||||
Income before taxes and noncontrolling interest | 139,083 | 119,032 | 90,786 | |||||
Ancillary services and corporate segment: | ||||||||
Revenues | 84,218 | 129,627 | 139,955 | |||||
Impairment of goodwill | — | 34,180 | — | |||||
Depreciation and amortization | 8,868 | 11,531 | 7,549 | |||||
Loss before taxes and noncontrolling interest | (51,057 | ) | (109,339 | ) | (38,974 | ) | ||
Consolidated Stewart: | ||||||||
Revenues | 2,006,640 | 2,033,885 | 1,870,830 | |||||
Impairment of goodwill | — | 35,749 | — | |||||
Depreciation and amortization | 30,044 | 30,298 | 24,226 | |||||
Income before taxes and noncontrolling interest | 88,026 | 9,693 | 51,812 | |||||
The Company does not provide asset information by reportable operating segment as it does not routinely evaluate the asset position by segment.
Revenues for the years ended December 31 in the United States and all international operations are as follows:
2016 | 2015 | 2014 | ||||||
($000 omitted) | ||||||||
United States | 1,889,144 | 1,925,865 | 1,751,458 | |||||
International | 117,496 | 108,020 | 119,372 | |||||
2,006,640 | 2,033,885 | 1,870,830 | ||||||
F - 27
NOTE 20
Acquisitions. During 2014, the Company completed acquisitions of three companies that provide collateral valuation, appraisal services, settlement services, title and closing services, and quality control and loan file review services for an aggregate purchase price of $40.0 million, net of liabilities assumed. The acquisitions were primarily funded by borrowings on the Company’s unsecured line of credit. The Company has recorded fair value estimates for the assets acquired, liabilities assumed and estimated goodwill of $20.0 million, based on the completion of the Company’s purchase price allocation as of December 31, 2014. During 2015, the Company recorded purchase adjustments of $5.3 million related to the remeasurement of assumed liabilities related to these acquisitions (refer to Note 8). During 2016, the Company sold the quality control services operations, along with other activities within the ancillary services operations (refer to Note 21).
NOTE 21
Exit activities. During the third quarter 2015, management approved the exit plan for the delinquent loan servicing activities, which were included in the ancillary services and corporate segment. The decision was based on continued pricing pressures on existing contracts as well as the overall improvement in the housing market and economy which led to decreased demand for these services. The Company operated the delinquent loan servicing business on a phased exit schedule which was completed at the end of the first quarter 2016. As of December 31, 2016, total cumulative exit-related charges incurred approximated $6.4 million, comprised of $1.6 million of employee termination benefits, $2.3 million of accrued early lease termination costs and $2.5 million of accelerated depreciation of assets. Of these amounts, approximately $0.4 million of employee termination benefits, $1.4 million of accrued early lease termination costs and $1.1 million of accelerated depreciation of assets were recorded during the year ended December 31, 2016 and are included within the employee costs, investment and other (losses) gains - net and depreciation and amortization lines, respectively, in the consolidated statement of operations and comprehensive income (loss).
During the fourth quarter 2016, the Company sold its loan file review and quality control services operations for a combined $1.8 million cash and note receivable, and its government services operations for a combined $1.6 million cash and promissory note. The sale of these operations, which were included in the ancillary services and corporate segment, allows the Company to focus resources on its core business of title insurance and related services. Including the write-off of related goodwill and other intangible assets, the Company recognized total charges of $3.3 million on the sale of these operations in investment and other (losses) gains - net in the 2016 consolidated statement of operations and comprehensive income (loss).
NOTE 22
Other comprehensive (loss) income. Changes in the balances of each component of other comprehensive (loss) income and the related tax effects are as follows:
For the Year Ended December 31, 2016 | For the Year Ended December 31, 2015 | For the Year Ended December 31, 2014 | ||||||||||||||||||
Before-Tax Amount | Tax Expense (Benefit) | Net-of-Tax Amount | Before-Tax Amount | Tax Expense (Benefit) | Net-of Tax Amount | Before-Tax Amount | Tax Expense (Benefit) | Net-of-Tax Amount | ||||||||||||
($000 omitted) | ($000 omitted) | ($000 omitted) | ||||||||||||||||||
Foreign currency translation adjustments | (2,385 | ) | 982 | (3,367 | ) | (16,022 | ) | (4,877 | ) | (11,145 | ) | (10,405 | ) | (2,840 | ) | (7,565 | ) | |||
Unrealized net gains on investments: | ||||||||||||||||||||
Change in unrealized net gains on investments | 544 | 190 | 354 | (5,757 | ) | (2,016 | ) | (3,741 | ) | 15,066 | 5,273 | 9,793 | ||||||||
Less: reclassification adjustment for net gains included in net income (loss) | (2,940 | ) | (1,029 | ) | (1,911 | ) | (2,501 | ) | (875 | ) | (1,626 | ) | (853 | ) | (298 | ) | (555 | ) | ||
(2,396 | ) | (839 | ) | (1,557 | ) | (8,258 | ) | (2,891 | ) | (5,367 | ) | 14,213 | 4,975 | 9,238 | ||||||
Other comprehensive (loss) income | (4,781 | ) | 143 | (4,924 | ) | (24,280 | ) | (7,768 | ) | (16,512 | ) | 3,808 | 2,135 | 1,673 | ||||||
F - 28
NOTE 23
Quarterly financial information (unaudited).
Mar 31 | June 30 | Sept 30 | Dec 31 | Total | ||||||||||
($000 omitted, except per share) | ||||||||||||||
Revenues: | ||||||||||||||
2016 | 438,229 | 489,437 | 553,210 | 525,764 | 2,006,640 | |||||||||
2015 | 448,871 | 531,906 | 555,705 | 497,403 | 2,033,885 | |||||||||
Net (loss) income attributable to Stewart: | ||||||||||||||
2016 | (11,195 | ) | 23,599 | 26,375 | 16,699 | 55,478 | ||||||||
2015 | (12,448 | ) | 17,106 | (13,467 | ) | 2,605 | (6,204 | ) | ||||||
Diluted (loss) earnings per share attributable to Stewart (1): | ||||||||||||||
2016 | (0.48 | ) | 0.49 | 1.12 | 0.71 | 1.85 | ||||||||
2015 | (0.52 | ) | 0.72 | (0.58 | ) | 0.11 | (0.26 | ) | ||||||
(1) Quarterly per share data may not sum to annual totals due to rounding or effects of dilution in particular quarters but not in annual totals.
F - 29
SCHEDULE I
STEWART INFORMATION SERVICES CORPORATION
(Parent Company)
STATEMENTS OF OPERATIONS AND RETAINED EARNINGS
For the Years Ended December 31, | |||||||||
2016 | 2015 | 2014 | |||||||
($000 omitted) | |||||||||
Revenues | |||||||||
Investment income | 20,000 | 15,000 | 25,087 | ||||||
Other losses | — | — | (869 | ) | |||||
Other income | 1,252 | 922 | 90 | ||||||
21,252 | 15,922 | 24,308 | |||||||
Expenses | |||||||||
Employee costs | 832 | 156 | 1,110 | ||||||
Other operating expenses, including $276 each year to affiliates | 6,641 | 7,617 | 3,806 | ||||||
Depreciation | 69 | 162 | 421 | ||||||
Interest | 2,726 | 1,726 | 2,054 | ||||||
10,268 | 9,661 | 7,391 | |||||||
Income before taxes and income (losses) from subsidiaries | 10,984 | 6,261 | 16,917 | ||||||
Income tax expense | 2,928 | — | 1 | ||||||
Income (losses) from subsidiaries | 47,422 | (12,465 | ) | 12,837 | |||||
Net income (loss) | 55,478 | (6,204 | ) | 29,753 | |||||
Retained earnings at beginning of year | 455,519 | 479,733 | 452,314 | ||||||
Cash dividends on Common Stock | (27,840 | ) | (18,010 | ) | (2,334 | ) | |||
Cash paid on Class B Common Shares conversion | (12,000 | ) | — | — | |||||
Cumulative effect adjustment on adoption of new accounting pronouncement | 631 | — | — | ||||||
Retained earnings at end of year | 471,788 | 455,519 | 479,733 | ||||||
See accompanying note to financial statement information.
See accompanying Report of Independent Registered Public Accounting Firm.
S - 1
STEWART INFORMATION SERVICES CORPORATION
(Parent Company)
BALANCE SHEETS
As of December 31, | ||||||
2016 | 2015 | |||||
($000 omitted) | ||||||
Assets | ||||||
Cash and cash equivalents | 2,890 | 832 | ||||
Receivables: | ||||||
Notes - due from subsidiaries | 40,879 | 68,382 | ||||
Receivables from affiliates | 848 | 1,093 | ||||
Allowance for uncollectible amounts | (4 | ) | (7 | ) | ||
41,723 | 69,468 | |||||
Property and equipment, at cost: | ||||||
Furniture and equipment | 2,733 | 2,893 | ||||
Accumulated depreciation | (2,512 | ) | (2,625 | ) | ||
221 | 268 | |||||
Title plant, at cost | 48 | 48 | ||||
Investments in subsidiaries, on an equity-method basis | 688,837 | 653,519 | ||||
Goodwill | 8,470 | 8,470 | ||||
Other assets | 16,698 | 17,457 | ||||
758,887 | 750,062 | |||||
Liabilities | ||||||
Notes payable | 92,875 | 98,000 | ||||
Accounts payable and other liabilities | 24,812 | 22,781 | ||||
117,687 | 120,781 | |||||
Contingent liabilities and commitments | — | — | ||||
Stockholders’ equity | ||||||
Common Stock – $1 par, authorized 50,000,000; issued 23,783,440 and 22,643,255; outstanding 23,431,279 and 22,291,094, respectively | 23,783 | 22,643 | ||||
Class B Common Stock – $1 par, authorized 1,500,000; issued and outstanding 1,050,012 as of December 31, 2015; retired in 2016 | — | 1,050 | ||||
Additional paid-in capital | 157,176 | 156,692 | ||||
Retained earnings (1) | 471,788 | 455,519 | ||||
Accumulated other comprehensive (loss) income: | ||||||
Foreign currency translation adjustments | (16,727 | ) | (13,360 | ) | ||
Unrealized investment gains | 7,846 | 9,403 | ||||
Treasury stock – 352,161 common shares, at cost | (2,666 | ) | (2,666 | ) | ||
Total stockholders’ equity | 641,200 | 629,281 | ||||
758,887 | 750,062 | |||||
(1) Includes undistributed earnings of subsidiaries of $522,104 in 2016 and $514,522 in 2015.
See accompanying note to financial statement information.
See accompanying Report of Independent Registered Public Accounting Firm.
S - 2
STEWART INFORMATION SERVICES CORPORATION
(Parent Company)
STATEMENTS OF CASH FLOWS
For the Years Ended December 31, | |||||||||
2016 | 2015 | 2014 | |||||||
($000 omitted) | |||||||||
Reconciliation of net income (loss) to cash provided (used) by operating activities: | |||||||||
Net income (loss) | 55,478 | (6,204 | ) | 29,753 | |||||
Add (deduct): | |||||||||
Depreciation | 69 | 162 | 421 | ||||||
Other losses | — | — | 869 | ||||||
Decrease (increase) in receivables – net | 245 | (596 | ) | (357 | ) | ||||
Decrease (increase) in other assets – net | 359 | (558 | ) | (828 | ) | ||||
(Decrease) increase in payables and accrued liabilities – net | (496 | ) | (515 | ) | 12,395 | ||||
(Income) losses from subsidiaries | (47,421 | ) | 12,465 | (12,837 | ) | ||||
Other – net | (6,731 | ) | (4,593 | ) | (31,824 | ) | |||
Cash provided (used) by operating activities | 1,503 | 161 | (2,408 | ) | |||||
Investing activities: | |||||||||
Dividends from subsidiary | 20,000 | 15,000 | 25,000 | ||||||
Purchase of property and equipment –net | (22 | ) | — | — | |||||
Collections on notes receivables | 27,500 | — | — | ||||||
Increases in notes receivables | — | (21,500 | ) | (46,875 | ) | ||||
Cash provided (used) by investing activities | 47,478 | (6,500 | ) | (21,875 | ) | ||||
Financing activities: | |||||||||
Proceeds from notes payable | 20,000 | 45,000 | 60,000 | ||||||
Payments on notes payable | (25,125 | ) | (7,000 | ) | — | ||||
Dividends paid | (27,840 | ) | (18,010 | ) | (2,334 | ) | |||
Cash paid on Class B Common Shares conversion | (12,000 | ) | — | — | |||||
Repurchases of Common Stock | (1,053 | ) | (27,950 | ) | (22,048 | ) | |||
Purchase of remaining interest of consolidated subsidiary | (991 | ) | (209 | ) | (321 | ) | |||
Other – net | 86 | 130 | — | ||||||
Cash (used) provided by financing activities | (46,923 | ) | (8,039 | ) | 35,297 | ||||
Increase (decrease) in cash and cash equivalents | 2,058 | (14,378 | ) | 11,014 | |||||
Cash and cash equivalents at beginning of year | 832 | 15,210 | 4,196 | ||||||
Cash and cash equivalents at end of year | 2,890 | 832 | 15,210 | ||||||
Supplemental information: | |||||||||
Income taxes paid | 1 | 1 | 24 | ||||||
Interest paid | 2,716 | 1,681 | 546 | ||||||
See accompanying note to financial statement information.
See accompanying Report of Independent Registered Public Accounting Firm.
S - 3
STEWART INFORMATION SERVICES CORPORATION
(Parent Company)
NOTE TO FINANCIAL STATEMENT INFORMATION
The Parent Company operates as a holding company, transacting substantially all of its business through its subsidiaries. Its consolidated financial statements are included in Part II, Item 8 of Form 10-K. The Parent Company financial statements should be read in conjunction with the aforementioned consolidated financial statements and notes thereto and financial statement schedules.
Reclassifications. Certain prior year amounts in the Parent Company financial statements have been reclassified for comparative purposes. Net income (loss) and stockholders’ equity, as previously reported, were not affected.
Investment income. During 2016, 2015 and 2014, Guaranty paid to the Parent Company dividends of $20.0 million, $15.0 million and $25.0 million, respectively.
Class B Common Stock. In April 2016, the Parent Company's stockholders approved the Class B Exchange Agreement, in which all outstanding shares of Class B Common Stock were retired in exchange for shares of Common Stock plus $12.0 million in cash. Refer to Note 12 to the consolidated financial statements for details.
Income taxes. The Parent Company consistently generates losses, exclusive of dividends or equity earnings from its subsidiaries, and is not expected to generate future income without its subsidiaries. As a result, an increased valuation allowance was recorded during 2016 against deferred tax assets, net of definite-lived deferred tax liabilities, which more-likely-than-not will not be realized by the Parent Company.
S - 4
SCHEDULE II
STEWART INFORMATION SERVICES CORPORATION AND SUBSIDIARIES
VALUATION AND QUALIFYING ACCOUNTS
December 31, 2016
Col. A | Col. B | Col. C Additions | Col. D Deductions | Col. E | ||||||||||||||
Description | Balance at beginning of period | Charged to costs and expenses | Charged to other accounts (describe) | (Describe) | Balance At end of period | |||||||||||||
($000 omitted) | ||||||||||||||||||
Stewart Information Services Corporation and subsidiaries: | ||||||||||||||||||
Year ended December 31, 2016: | ||||||||||||||||||
Estimated title losses | 462,622 | 91,147 | — | 91,197 | (A) | 462,572 | ||||||||||||
Valuation allowance for deferred tax assets | 2,217 | 240 | — | — | 2,457 | |||||||||||||
Allowance for uncollectible amounts | 9,833 | 3,349 | — | 3,535 | (B) | 9,647 | ||||||||||||
Year ended December 31, 2015: | ||||||||||||||||||
Estimated title losses | 495,395 | 106,265 | — | 139,038 | (A) | 462,622 | ||||||||||||
Valuation allowance for deferred tax assets | 2,564 | (347 | ) | — | — | 2,217 | ||||||||||||
Allowance for uncollectible amounts | 9,193 | 3,396 | — | 2,756 | (B) | 9,833 | ||||||||||||
Year ended December 31, 2014: | ||||||||||||||||||
Estimated title losses | 506,888 | 81,305 | 2,268 | (C) | 95,066 | (A) | 495,395 | |||||||||||
Valuation allowance for deferred tax assets | 6,971 | (4,407 | ) | — | — | 2,564 | ||||||||||||
Allowance for uncollectible amounts | 9,871 | 1,977 | — | 2,655 | (B) | 9,193 | ||||||||||||
(A) | Represents primarily payments of policy and escrow losses and loss adjustment expenses. |
(B) | Represents uncollectible accounts written off. |
(C) | Represents amounts added through acquisitions. |
See accompanying Report of Independent Registered Public Accounting Firm.
S - 5
INDEX TO EXHIBITS
Exhibit | ||||
3.1 | — | Restated Certificate of Incorporation of the Registrant, dated April 28, 2016 (incorporated by reference in this report from Exhibit 3.1 of the Current Report on Form 8-K filed April 29, 2016) | ||
3.2 | — | Third Amended and Restated By-Laws of the Registrant, as of April 27, 2016 (incorporated by reference in this report from Exhibit 3.2 of the Current Report on Form 8-K filed April 28, 2016) | ||
4.1 | — | Credit Agreement, dated as of October 21, 2014, by and between the Registrant, the Guarantors party thereto, and Compass Bank, as administrative agent and lenders party thereto (incorporated by reference in this report from Exhibit 10.1 of the Current Report on Form 8-K filed October 23, 2014) | ||
4.2 | — | First Amendment to Credit Agreement, dated effective as of December 31, 2015, among the Registrant, the guarantors named therein, Compass Bank, as administrative agent, and the lenders party thereto (incorporated by reference in this report from Exhibit 10.1 of the Current Report on Form 8-K filed February 11, 2016) | ||
10.1 † | — | Deferred Compensation Agreements dated March 10, 1986, amended July 24, 1990 and October 30, 1992, between the Registrant and certain executive officers (incorporated by reference in this report from Exhibit 10.2 of the Annual Report on Form 10-K for the year ended December 31, 1997) | ||
10.2 † | — | Stewart Information Services Corporation 1999 Stock Option Plan (incorporated by reference in this report from Exhibit 10.3 of the Annual Report on Form 10-K for the year ended December 31, 1999) | ||
10.3 † | — | Stewart Information Services Corporation 2005 Long-Term Incentive Plan, as amended and restated May 1, 2009 (incorporated by reference in this report from Exhibit 10.1 of the Current Report on Form 8-K filed May 5, 2009) | ||
10.4 † | — | Stewart Information Services Corporation 2008 Strategic Incentive Pool Plan (incorporated by reference in this report from Exhibit 10.1 of the Current Report on Form 8-K filed May 14, 2008) | ||
10.5 | — | Nomination and Standstill Agreement, dated as of February 12, 2014, by and among the Registrant and Foundation Onshore Fund, L.P., Foundation Offshore Master Fund, Ltd., Foundation Offshore Fund, Ltd., Foundation Asset Management GP, LLC, Foundation Asset Management, LLC, David Charney, Sky Wilber, Engine Capital, L.P., Engine Jet Capital, L.P., Engine Capital Management, LLC, Engine Investments, LLC, Arnaud Ajdler and Glenn Christenson. (incorporated by reference in this report from Exhibit 10.1 of the Current Report on Form 8-K filed February 14, 2014) | ||
10.6 | — | Agreement, dated as of March 26, 2015, by and among Stewart Information Services Corporation and Bulldog Investors, LLC (incorporated by reference in this report from Exhibit 10.1 of the Current Report on Form 8-K filed on March 27, 2015) | ||
10.7 | — | Exchange Agreement, dated as of January 26, 2016, by and among Stewart Information Services Corporation and the holders of the Class B common stock, par value $1.00 per share, of the Company (incorporated by reference in this report from Exhibit 10.1 of the Current Report on Form 8-K filed on January 27, 2016) | ||
10.8 † | — | Employment Agreement, effective January 1, 2017, by and between Stewart Information Services Corporation and Stewart Morris, Jr. (incorporated by reference in this report from Exhibit 10.3 of the Current Report on Form 8-K filed February 1, 2016) | ||
Exhibit | ||||
10.9 † | — | Employment Agreement, effective January 1, 2017, by and between Stewart Information Services Corporation and Malcolm S. Morris (incorporated by reference in this report from Exhibit 10.4 of the Current Report on Form 8-K filed February 1, 2016) | ||
10.10 † | — | Employment Agreement entered as of March 31, 2016, effective as of January 1, 2016, by and between the Registrant and Matthew W. Morris (incorporated by reference in this report from Exhibit 10.1 of the Current Report on Form 8-K filed April 6, 2016) | ||
10.11 † | — | Employment Agreement entered as of March 31, 2016, effective as of January 1, 2016, by and between the Registrant and Joseph Allen Berryman (incorporated by reference in this report from Exhibit 10.2 of the Current Report on Form 8-K filed April 6, 2016) | ||
10.12 † | — | Employment Agreement entered as of March 31, 2016, effective as of January 1, 2016, by and between the Registrant and Steven M. Lessack (incorporated by reference in this report from Exhibit 10.3 of the Current Report on Form 8-K filed April 6, 2016) | ||
10.13 † | — | Employment Agreement entered as of March 31, 2016, effective as of January 1, 2016, by and between the Registrant and John L. Killea (incorporated by reference in this report from Exhibit 10.4 of the Current Report on Form 8-K filed April 6, 2016) | ||
10.14 † | — | Registration Rights Agreement, dated as of April 27, 2016, by and among the Company and the Class B Common Stockholders (incorporated by reference in this report from Exhibit 10.1 of the Current Report on Form 8-K filed April 28, 2016) | ||
14.1 | — | Code of Ethics for Chief Executive Officers, Principal Financial Officer and Principal Accounting Officer (incorporated by reference in this report from Exhibit 14.1 of the Annual Report on Form 10-K for the year ended December 31, 2004) | ||
21.1* | — | Subsidiaries of the Registrant | ||
23.1* | — | Consent of KPMG LLP, including consent to incorporation by reference of their reports into previously filed Securities Act registration statements | ||
31.1* | — | Certification of Chief Executive Officer pursuant to Section 302 of the Sarbanes-Oxley Act of 2002 | ||
31.2* | — | Certification of Chief Financial Officer pursuant to Section 302 of the Sarbanes-Oxley Act of 2002 | ||
32.1* | — | Certification of Chief Executive Officer pursuant to Section 906 of the Sarbanes-Oxley Act of 2002 | ||
32.2* | — | Certification of Chief Financial Officer pursuant to Section 906 of the Sarbanes-Oxley Act of 2002 | ||
101.INS* | — | XBRL Instance Document | ||
101.SCH* | — | XBRL Taxonomy Extension Schema Document | ||
101.CAL* | — | XBRL Taxonomy Extension Calculation Linkbase Document | ||
Exhibit | ||||
101.DEF* | — | XBRL Taxonomy Extension Definition Linkbase Document | ||
101.LAB* | — | XBRL Taxonomy Extension Label Linkbase Document | ||
101.PRE* | — | XBRL Taxonomy Extension Presentation Linkbase Document | ||
* | Filed herewith |
† | Management contract or compensatory plan |
A complete copy of this Annual Report on Form 10-K,
including these exhibits, can be viewed at www.stewart.com.