Attached files
| file | filename |
|---|---|
| 8-K - 8-K - AVNET INC | avt-20160428x8k.htm |
| EX-99.1 - EX-99.1 - AVNET INC | avt-20160428ex99117ad74.htm |
Avnet, Inc. Q3 Fiscal Year 2016
$ in millions - except per share data
April 28, 2016
CFO Review of Fiscal 2016 Third Quarter Results
|
|
|
Q3' FY15 |
Q2' FY16 |
Q3' FY16 |
Y/Y Chg |
Seq. Chg |
||||||||||
|
Sales |
|
$ |
6,736.9 |
|
$ |
6,848.1 |
|
$ |
6,174.7 |
|
$ |
(562.1) |
|
$ |
(673.3) |
|
|
Gross Profit |
|
$ |
774.4 |
|
$ |
778.2 |
|
$ |
736.8 |
|
$ |
(37.5) |
|
$ |
(41.3) |
|
|
GP Margin |
|
|
11.5 |
% |
|
11.4 |
% |
|
11.9 |
% |
|
44 |
bps |
|
57 |
bps |
|
|
|
|
|
|
|
|
|
|
|
|
|
|
|
|
|
|
|
GAAP SG&A Expenses |
|
$ |
555.1 |
|
$ |
530.8 |
|
$ |
539.0 |
|
$ |
(16.1) |
|
$ |
8.2 |
|
|
Adjusted Operating Expenses (1) |
|
$ |
543.9 |
|
$ |
522.9 |
|
$ |
531.6 |
|
$ |
(12.4) |
|
$ |
8.7 |
|
|
Adjusted Operating Expenses as % of Sales (1) |
|
|
8.1 |
% |
|
7.6 |
% |
|
8.6 |
% |
|
54 |
bps |
|
97 |
bps |
|
Adjusted Operating Expenses as % of Gross Profit (1) |
|
|
70.3 |
% |
|
67.2 |
% |
|
72.2 |
% |
|
190 |
bps |
|
495 |
bps |
|
|
|
|
|
|
|
|
|
|
|
|
|
|
|
|
|
|
|
GAAP Operating Income |
|
$ |
203.7 |
|
$ |
226.1 |
|
$ |
181.6 |
|
$ |
(22.1) |
|
$ |
(44.5) |
|
|
Adjusted Operating Income (1) |
|
$ |
230.4 |
|
$ |
255.3 |
|
$ |
205.2 |
|
$ |
(25.2) |
|
$ |
(50.0) |
|
|
Adjusted Operating Income Margin (1) |
|
|
3.4 |
% |
|
3.7 |
% |
|
3.3 |
% |
|
(10) |
bps |
|
(41) |
bps |
|
|
|
|
|
|
|
|
|
|
|
|
|
|
|
|
|
|
|
GAAP Net Income |
|
$ |
121.5 |
|
$ |
156.0 |
|
$ |
123.5 |
|
$ |
1.9 |
|
$ |
(32.6) |
|
|
Adjusted Net Income (1) |
|
$ |
143.5 |
|
$ |
164.3 |
|
$ |
132.6 |
|
$ |
(10.9) |
|
$ |
(31.7) |
|
|
|
|
|
|
|
|
|
|
|
|
|
|
|
|
|
|
|
|
GAAP Diluted EPS |
|
$ |
0.88 |
|
$ |
1.16 |
|
$ |
0.94 |
|
|
6.8 |
% |
|
(19.0) |
% |
|
Adjusted Diluted EPS (1) |
|
$ |
1.04 |
|
$ |
1.22 |
|
$ |
1.01 |
|
|
(2.9) |
% |
|
(17.2) |
% |
|
|
|
|
|
|
|
|
|
|
|
|
|
|
|
|
|
|
|
Return on Working Capital (ROWC) (1) |
|
|
20.6 |
% |
|
22.8 |
% |
|
18.5 |
% |
|
(207) |
bps |
|
(429) |
bps |
|
Return on Capital Employed (ROCE) (1) |
|
|
11.1 |
% |
|
12.3 |
% |
|
9.9 |
% |
|
(120) |
bps |
|
(240) |
bps |
|
Working Capital Velocity (1) |
|
|
6.0 |
|
|
6.1 |
|
|
5.6 |
|
|
(0.5) |
|
|
(0.5) |
|
|
(1) |
A reconciliation of non-GAAP financial measures is presented in the Non-GAAP Financial Information section of the press release attached as Exhibit 99.1 included in this Current Report on Form 8-K. |
Key Highlights
|
· |
Reported sales for the third quarter of fiscal 2016, decreased 8.3% or 6.9% excluding the translation impact of changes in foreign currency exchange rates (also referred to as “constant currency” or “CC” in the graphs that follow) year over year to $6.2 billion. Organic sales (defined later in this document) decreased 8.6% (7.2% in constant currency) year over year with both operating groups contributing towards this decline. |
|
o |
Sequentially, organic sales decreased 10.0% in constant currency, which was below the normal seasonal range of -9% to -5% primarily due to an expected decline in high volume supply chain engagement at Electronic Marketing (EM) Asia and weaker than expected demand in certain legacy technologies at Technology Solutions (TS). |
|
· |
Gross profit margin increased 57 basis points sequentially and 44 basis points from the year ago quarter to 11.9%. Both operating groups contributed to the sequential and year-over-year improvement. |
|
· |
Adjusted operating income dollars decreased 10.9% year over year to $205.2 million and adjusted operating income margin decreased 10 basis points to 3.3% due to reduced profitability at both operating groups. |
|
o |
Sequentially, adjusted operating income dollars decreased 19.6% and adjusted operating income margin decreased 41 basis points due to the typical seasonal decline at TS. |
|
· |
Adjusted diluted earnings per share of $1.01 decreased $0.03, or 2.9% year over year, primarily due to the decline in operating income and was negatively impacted by approximately $0.01, or 1.0%, due to the translation impact of changes in foreign currency exchange rates. |
|
· |
Cash generated from operations was $212.9 million in the third quarter of fiscal 2016 and cash generated from operations for the trailing twelve months was $596.5 million. |
|
· |
During the third quarter of fiscal 2016, the Company paid a dividend $0.17 per share or $21.9 million, and has paid $66.9 million fiscal year to date. |
|
· |
During the third quarter of fiscal 2016, the Company repurchased $145.7 million worth of stock, or 3.7 million shares, and has repurchased $330.8 million worth of stock, or 8.1 million shares fiscal year to date. The Company still has approximately $221.7 million remaining in the authorized share repurchase program through the end of the March quarter. |
|
o |
For the fiscal year, the company has returned approximately $398 million in the form of buybacks and dividends. |
Avnet, Inc. Q3 Fiscal Year 2016
$ in millions - except per share data
April 28, 2016
|
|
|
|
|
|
|
|
|
|
|
|
|
|
|
|
|
|
Year-over- |
|
|
|
|
|
|
|
|
|
|
|
|
|
|
|
|
|
|
|
Year Growth |
|
|
|
|
|
|
|
|
|
|
|
|
|
|
|
|
|
|
|
Rates |
|
|
|
|
Q3' FY15 |
Q4' FY15 |
Q1' FY16 |
Q2' FY16 |
Q3' FY16 |
Reported |
|||||||||||
|
Avnet, Inc. |
|
$ |
6,736.9 |
|
$ |
6,796.3 |
|
$ |
6,969.7 |
|
$ |
6,848.1 |
|
$ |
6,174.7 |
|
(8.3) |
% |
|
Constant Currency (1) |
|
|
|
|
|
|
|
|
|
|
|
|
|
|
|
|
(6.9) |
% |
|
|
|
|
|
|
|
|
|
|
|
|
|
|
|
|
|
|
|
|
|
Electronics Marketing (EM) |
|
$ |
4,219.5 |
|
$ |
4,315.9 |
|
$ |
4,471.4 |
|
$ |
4,114.6 |
|
$ |
4,041.5 |
|
(4.2) |
% |
|
Constant Currency (1) |
|
|
|
|
|
|
|
|
|
|
|
|
|
|
|
|
(3.3) |
% |
|
Americas |
|
$ |
1,237.2 |
|
$ |
1,269.9 |
|
$ |
1,265.2 |
|
$ |
1,125.1 |
|
$ |
1,192.7 |
|
(3.6) |
% |
|
EMEA |
|
$ |
1,251.9 |
|
$ |
1,245.0 |
|
$ |
1,326.4 |
|
$ |
1,141.1 |
|
$ |
1,330.7 |
|
6.3 |
% |
|
Constant Currency (1) |
|
|
|
|
|
|
|
|
|
|
|
|
|
|
|
|
9.4 |
% |
|
Asia |
|
$ |
1,730.4 |
|
$ |
1,801.0 |
|
$ |
1,879.8 |
|
$ |
1,848.4 |
|
$ |
1,518.1 |
|
(12.3) |
% |
|
Constant Currency (1) |
|
|
|
|
|
|
|
|
|
|
|
|
|
|
|
|
(12.3) |
% |
|
|
|
|
|
|
|
|
|
|
|
|
|
|
|
|
|
|
|
|
|
Technology Solutions (TS) |
|
$ |
2,517.3 |
|
$ |
2,480.5 |
|
$ |
2,498.3 |
|
$ |
2,733.4 |
|
$ |
2,133.2 |
|
(15.3) |
% |
|
Constant Currency (1) |
|
|
|
|
|
|
|
|
|
|
|
|
|
|
|
|
(12.9) |
% |
|
Americas |
|
$ |
1,440.5 |
|
$ |
1,497.3 |
|
$ |
1,508.7 |
|
$ |
1,625.4 |
|
$ |
1,241.2 |
|
(13.8) |
% |
|
EMEA |
|
$ |
717.2 |
|
$ |
624.8 |
|
$ |
688.8 |
|
$ |
794.4 |
|
$ |
615.8 |
|
(14.1) |
% |
|
Constant Currency (1) |
|
|
|
|
|
|
|
|
|
|
|
|
|
|
|
|
(10.8) |
% |
|
Asia |
|
$ |
359.6 |
|
$ |
358.4 |
|
$ |
300.8 |
|
$ |
313.6 |
|
$ |
276.2 |
|
(23.2) |
% |
|
Constant Currency (1) |
|
|
|
|
|
|
|
|
|
|
|
|
|
|
|
|
(19.2) |
% |
|
(1) |
Year-over-year sales growth rate excluding the impact of changes in foreign currency exchange rates. |
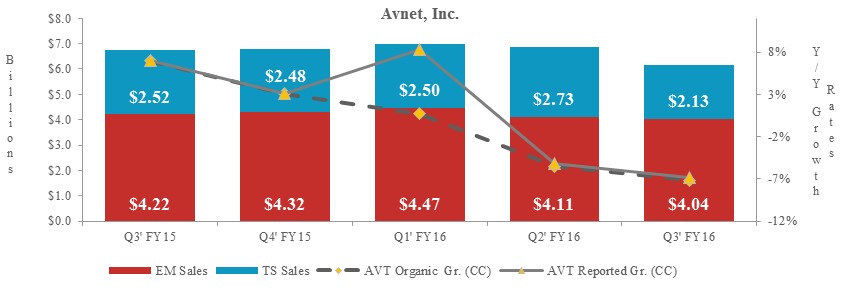
Q1’ FY16 includes the impact of the extra week, excluding the estimate for the extra week, Avnet year-over-year sales would have increased 0.7% in CC and would have declined 5.8% in reported dollars
|
· |
Avnet’s third quarter fiscal 2016 sales decreased 6.9% in constant currency (8.3% in reported dollars) year over year to $6.2 billion and organic sales, decreased 7.2% in constant currency with both operating groups contributing toward this decline. |
|
o |
On a sequential basis, Avnet organic sales decreased 10.0% in constant currency, which was below the normal seasonal range of -9% to -5% primarily due to an expected decline in high volume supply chain engagements at EM Asia and weaker than expected demand in certain legacy data center at TS. |
Avnet, Inc. Q3 Fiscal Year 2016
$ in millions - except per share data
April 28, 2016
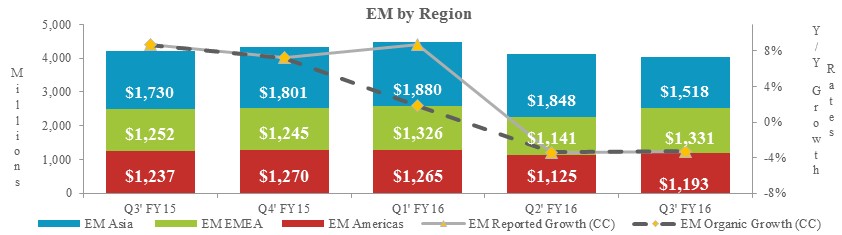
Q1’ FY16 includes the impact of the extra week, excluding the estimate for the extra week, EM year-over-year sales would have increased 1.8% in CC and would have declined 4.6% in reported dollars
|
· |
EM’s third quarter fiscal 2016 sales of $4.0 billion decreased 3.3% year over year in constant currency (4.2% in reported dollars) primarily due to a decrease in the Asia region |
|
o |
Americas’ sales declined 3.6% year over year. |
|
o |
EMEA’s sales increased 9.4% year over year in constant currency and reported sales increased 6.3%. The year-over-year growth in constant currency marks the twelfth consecutive quarter of growth. |
|
o |
Asia’s sales decreased 12.3% year over year in constant currency primarily due to an expected decline in high volume supply chain engagements. |
|
· |
Stronger than typical sequential growth in the western regions was offset by an expected decline in select high volume supply chain engagements in Asia as EM’s sequential sales declined 1.8% (2.1% in constant currency), which is below the low end of the normal seasonal range of -1% to +3%. |
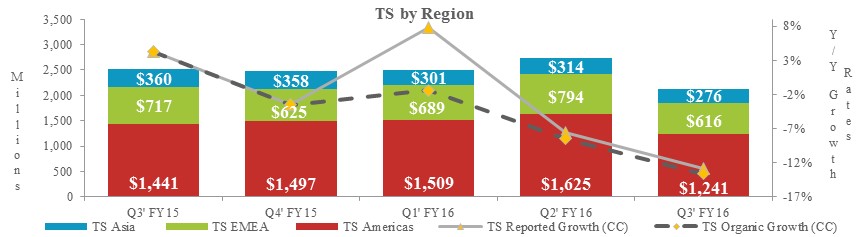
Q1’ FY16 includes the impact of the extra week, excluding the estimate for the extra week, TS year-over-year sales would have declined 1.4% in CC and 7.8% in reported dollars
|
· |
TS’ third quarter fiscal 2016 reported sales of $2.1 billion decreased 12.9% year over year in constant currency (15.3% in reported dollars) driven by declines in select areas of legacy data center products. Organic sales, declined 13.6% in constant currency. |
|
o |
America’s organic sales decreased 14.2% year over year primarily due to declines in servers and storage, coupled with softer demand in Latin America. |
|
o |
EMEA’s organic sales decreased 12.6% year over year in constant currency and reported sales declined 14.1% primarily due to weaker demand in the north region (UK and Ireland). |
|
o |
Asia’s organic sales decreased 19.2% year over year in constant currency and reported sales declined 23.2% primarily due to a softer demand in the region and the adverse impact of the strengthening of the U.S. Dollar against local currencies. |
|
· |
At a product level, year-over-year growth in networking and services was offset by a decline in storage, servers, and software. |
Avnet, Inc. Q3 Fiscal Year 2016
$ in millions - except per share data
April 28, 2016
Gross Profit
|
|
|
|
|
|
|
|
|
|
|
|
|
|
|
|
|
|
|
|
|
|
|
|
Q3' FY15 |
Q4' FY15 |
Q1' FY16 |
Q2' FY16 |
Q3' FY16 |
Y/Y Change |
||||||||||||
|
Gross Profit |
|
$ |
774.4 |
|
$ |
785.8 |
|
$ |
791.5 |
|
$ |
778.2 |
|
$ |
736.8 |
|
$ |
(37.5) |
|
|
Gross Profit Margin |
|
|
11.5 |
% |
|
11.6 |
% |
|
11.4 |
% |
|
11.4 |
% |
|
11.9 |
% |
|
44 |
bps |
|
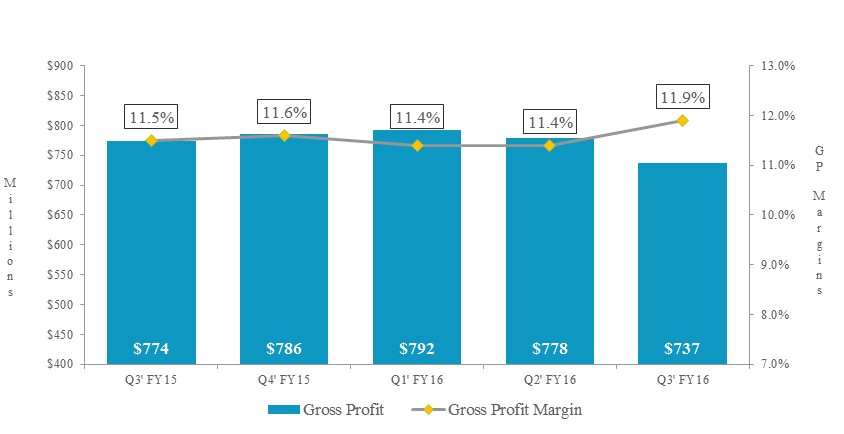
· |
Gross profit of $736.8 million, decreased 4.9% year over year and 5.3% sequentially. The year-over-year decline was driven by lower sales at both operating groups, while the sequential decline was primarily due to the typical seasonal decline at TS partially offset by an improvement at EM. |
|
o |
Gross profit margin of 11.9%, increased 44 basis points from the year ago quarter primarily driven by improvements at both operating groups. |
|
o |
Gross profit margin improved 57 basis points sequentially primarily due to the seasonal business mix shift as higher gross profit margin EM grew to represent 65.5% of Avnet sales as compared to 60.1% in the December quarter. |
|
· |
EM gross profit margin improved year over year and sequentially. |
|
o |
The year-over-year improvement was primarily due to a product mix shift in the Asia region. The sequential increase was due to the seasonal geographic mix shift to the higher margin western regions and the previously mentioned product mix shift in Asia. |
|
· |
TS gross profit margin increased year over year and sequentially. The year-over-year increase was primarily due to improvements across all three regions as a result of portfolio management and product mix difference between years while the sequential increase was due to an improvement in the Americas region. |
Avnet, Inc. Q3 Fiscal Year 2016
$ in millions - except per share data
April 28, 2016
Operating Expenses
|
|
|
Q3' FY15 |
Q4' FY15 |
Q1' FY16 |
Q2' FY16 |
Q3' FY16 |
Y/Y Change |
||||||||||||
|
Selling, General and Administrative Expenses |
|
$ |
555.1 |
|
$ |
561.6 |
|
$ |
558.6 |
|
$ |
530.8 |
|
$ |
539.0 |
|
$ |
(16.1) |
|
|
Amortization of Intangible Assets and Other |
|
|
(11.2) |
|
|
(19.6) |
|
|
(7.5) |
|
|
(7.9) |
|
|
(7.4) |
|
|
3.7 |
|
|
Adjusted Operating Expenses (1) |
|
$ |
543.9 |
|
$ |
542.0 |
|
$ |
551.1 |
|
$ |
522.9 |
|
$ |
531.6 |
|
$ |
(12.4) |
|
|
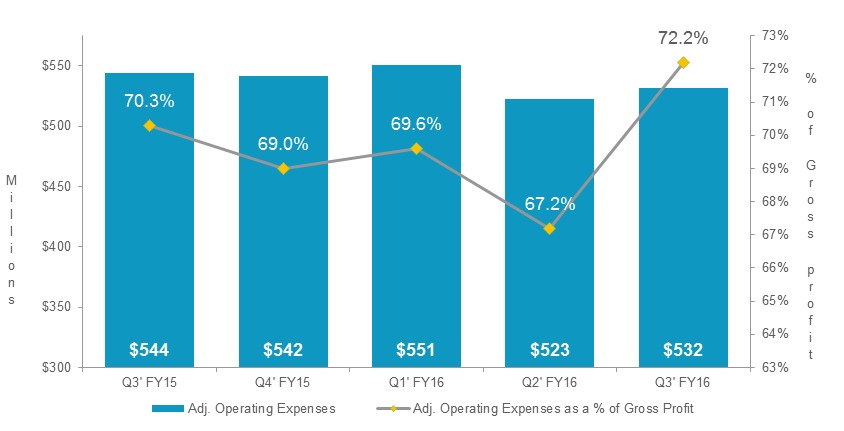
Adjusted Operating Expenses as a % of Gross Profit (1) |
|
|
70.3 |
% |
|
69.0 |
% |
|
69.6 |
% |
|
67.2 |
% |
|
72.2 |
% |
|
190 |
bps |
|
(1) |
A reconciliation of non-GAAP financial measures is presented in the Non-GAAP Financial Information section of the press release attached as Exhibit 99.1 included in this Current Report on Form 8-K. |
|
· |
Adjusted operating expenses were $531.6 million in the third quarter of fiscal 2016, a decrease of $12.4 million, or 2.3%, from the third quarter of fiscal 2015. |
|
o |
The year-over-year decrease in adjusted operating expenses was primarily due to the translation impact of changes in foreign currency exchange rates and from the impact of prior restructuring actions and expense efficiencies including from the Avnet Advantage initiative partially offset by an increase in expenses related to acquisitions and other costs including employee merit compensation increases that took effect in January 2016. |
|
o |
Sequentially, adjusted operating expenses increased $8.7 million, or 1.7%, primarily to fund organic growth at EM EMEA and costs related to acquisitions. |
|
· |
Adjusted operating expenses as a percentage of gross profit of 72.2% increased 190 basis points from the year ago quarter. |
|
o |
EM operating expenses as a percentage of gross profit increased 145 basis points from the year ago quarter primarily due to the lower gross profit related to the decline in revenue. |
|
o |
TS operating expenses as a percentage of gross profit increased 327 basis points from the year ago quarter primarily due to lower gross profit related to the decline in revenue. |
Avnet, Inc. Q3 Fiscal Year 2016
$ in millions - except per share data
April 28, 2016
Operating Income
|
|
|
|
|
|
|
|
|
|
|
|
|
|
|
|
|
|
|
|
|
|
|
|
Q3' FY15 |
Q4' FY15 |
Q1' FY16 |
Q2' FY16 |
Q3' FY16 |
Y/Y Change |
||||||||||||
|
GAAP Operating Income |
|
$ |
203.7 |
|
$ |
180.5 |
|
$ |
207.0 |
|
$ |
226.1 |
|
$ |
181.6 |
|
$ |
(22.1) |
|
|
Adjusted Operating Income (1) |
|
$ |
230.4 |
|
$ |
243.8 |
|
$ |
240.4 |
|
$ |
255.3 |
|
$ |
205.2 |
|
$ |
(25.2) |
|
|
Adjusted Operating Income Margin (1) |
|
|
3.4 |
% |
|
3.6 |
% |
|
3.5 |
% |
|
3.7 |
% |
|
3.3 |
% |
|
(10) |
bps |
|
|
|
|
|
|
|
|
|
|
|
|
|
|
|
|
|
|
|
|
|
|
Electronics Marketing (EM) Total |
|
|
|
|
|
|
|
|
|
|
|
|
|
|
|
|
|
|
|
|
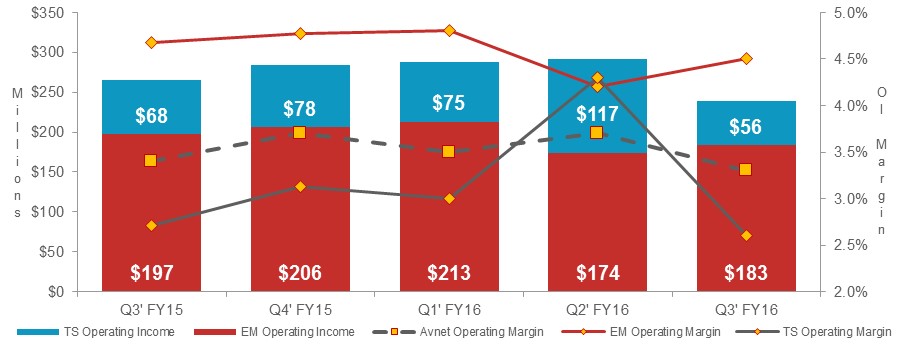
Operating Income |
|
$ |
197.3 |
|
$ |
205.9 |
|
$ |
213.0 |
|
$ |
174.0 |
|
$ |
183.3 |
|
$ |
(14.0) |
|
|
Operating Income Margin |
|
|
4.7 |
% |
|
4.8 |
% |
|
4.8 |
% |
|
4.2 |
% |
|
4.5 |
% |
|
(15) |
bps |
|
|
|
|
|
|
|
|
|
|
|
|
|
|
|
|
|
|
|
|
|
|
Technology Solutions (TS) Total |
|
|
|
|
|
|
|
|
|
|
|
|
|
|
|
|
|
|
|
|
Operating Income |
|
$ |
68.1 |
|
$ |
77.6 |
|
$ |
74.5 |
|
$ |
117.1 |
|
$ |
55.5 |
|
$ |
(12.6) |
|
|
Operating Income Margin |
|
|
2.7 |
% |
|
3.1 |
% |
|
3.0 |
% |
|
4.3 |
% |
|
2.6 |
% |
|
(11) |
bps |
|
(1) |
A reconciliation of non-GAAP financial measures is presented in the Non-GAAP Financial Information section of the press release attached as Exhibit 99.1 included in this Current Report on Form 8-K. |
|
· |
Avnet’s adjusted operating income of $205.2 million decreased 10.9% year over year primarily due to lower profitability at both operating groups. Adjusted operating income, decreased $50.0 million, or 19.6% sequentially as an increase at EM was offset by the typical decline at TS coming off its seasonally strong December quarter. |
|
o |
Avnet adjusted operating income margin of 3.3% decreased 10 basis points year over year and 41 basis points sequentially. |
|
· |
EM operating income margin of 4.5% decreased 15 basis points from the year ago quarter primarily due to the year-over-year decline in sales. Sequentially, operating income margin increased 30 basis points primarily due to the seasonal mix shift to the higher margin western regions. |
Avnet, Inc. Q3 Fiscal Year 2016
$ in millions - except per share data
April 28, 2016
Interest Expense, Other Income (Expense) and Income Taxes
|
|
|
|
|
|
|
|
|
|
|
|
|
|
|
|
|
|
|
|
|
|
|
|
Q3' FY15 |
Q4' FY15 |
Q1' FY16 |
Q2' FY16 |
Q3' FY16 |
Y/Y Change |
||||||||||||
|
Interest Expense |
|
$ |
23.9 |
|
$ |
23.7 |
|
$ |
23.6 |
|
$ |
22.4 |
|
$ |
23.3 |
|
$ |
(0.6) |
|
|
Other Income (Expense) |
|
$ |
(8.9) |
|
$ |
(3.1) |
|
$ |
(5.9) |
|
$ |
(6.5) |
|
$ |
2.2 |
|
$ |
11.1 |
|
|
|
|
|
|
|
|
|
|
|
|
|
|
|
|
|
|
|
|
|
|
|
GAAP Income Tax Expense (Benefit) |
|
$ |
49.4 |
|
$ |
(5.1) |
|
$ |
47.3 |
|
$ |
41.2 |
|
$ |
37.1 |
|
$ |
(12.3) |
|
|
Adjusted Income Tax Expense (1) |
|
$ |
54.1 |
|
$ |
61.2 |
|
$ |
58.0 |
|
$ |
62.0 |
|
$ |
51.6 |
|
$ |
(2.6) |
|
|
GAAP Effective Tax Rate |
|
|
28.9 |
% |
|
(3.3) |
% |
|
26.6 |
% |
|
20.9 |
% |
|
23.1 |
% |
|
(579) |
bps |
|
Adjusted Effective Tax Rate (1) |
|
|
27.4 |
% |
|
27.7 |
% |
|
27.5 |
% |
|
27.4 |
% |
|
28.0 |
% |
|
61 |
bps |
|
(1) |
A reconciliation of non-GAAP financial measures is presented in the Non-GAAP Financial Information section of the press release attached as Exhibit 99.1 included in this Current Report on Form 8-K. |
|
· |
Interest expense of $23.3 million decreased $0.6 million from the year ago quarter primarily due to the repayment at maturity of the $250.0 million 6.0% Notes in September 2015 and a corresponding lower average borrowing rate. |
|
· |
The Company recognized $2.2 million of other income in the third quarter of fiscal 2016 compared with $8.9 million of other expense in the third quarter of fiscal 2015. The decrease in other expense was primarily due to the strengthening of the U.S. Dollar relative to foreign currencies in the third quarter of fiscal 2015 compared to the third quarter of fiscal 2016 and the corresponding higher costs incurred in the third quarter fiscal 2015 to hedge foreign currency exposures. |
|
· |
The GAAP effective tax rate was 23.1% in the third quarter of fiscal 2016 as compared with 28.9% in the third quarter of fiscal 2015. The Company’s effective tax rate was favorably impacted primarily by (i) the mix of income in lower tax jurisdictions and (ii) the release of reserves related to the expiration of statutes of limitation. |
Avnet, Inc. Q3 Fiscal Year 2016
$ in millions - except per share data
April 28, 2016
Net Income and EPS
|
|
|
|
|
|
|
|
|
|
|
|
|
|
|
|
|
|
|
|
|
|
|
|
Q3' FY15 |
Q4' FY15 |
Q1' FY16 |
Q2' FY16 |
Q3' FY16 |
Y/Y Change |
||||||||||||
|
GAAP Net Income |
|
$ |
121.5 |
|
$ |
158.7 |
|
$ |
130.3 |
|
$ |
156.0 |
|
$ |
123.5 |
|
$ |
1.9 |
|
|
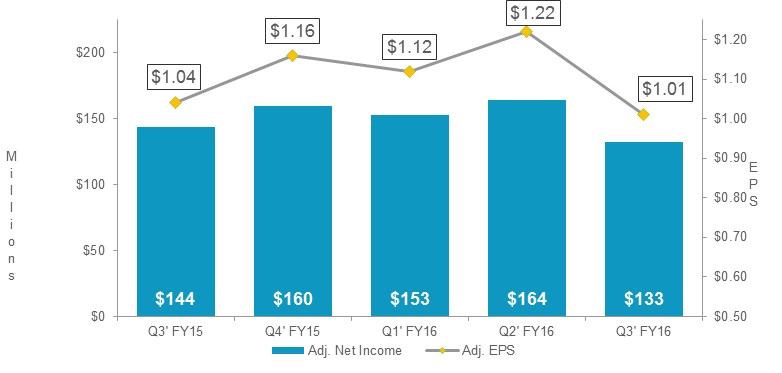
Adjusted Net Income (1) |
|
$ |
143.5 |
|
$ |
159.5 |
|
$ |
152.9 |
|
$ |
164.3 |
|
$ |
132.6 |
|
$ |
(10.9) |
|
|
|
|
|
|
|
|
|
|
|
|
|
|
|
|
|
|
|
|
|
|
|
GAAP Diluted EPS |
|
$ |
0.88 |
|
$ |
1.15 |
|
$ |
0.96 |
|
$ |
1.16 |
|
$ |
0.94 |
|
|
6.8 |
% |
|
Adjusted Diluted EPS (1) |
|
$ |
1.04 |
|
$ |
1.16 |
|
$ |
1.12 |
|
$ |
1.22 |
|
$ |
1.01 |
|
|
(2.9) |
% |
|
(1) |
A reconciliation of non-GAAP financial measures is presented in the Non-GAAP Financial Information section of the press release attached as Exhibit 99.1 included in this Current Report on Form 8-K. |
|
· |
GAAP net income increased by 1.6% year over year to $123.5 million or $0.94 per share on a diluted basis, due to the decrease in the GAAP effective tax rate previously mentioned. |
|
· |
Adjusted net income for the third quarter of fiscal 2016 was $132.6 million, or $1.01 per share on a diluted basis. |
|
o |
Adjusted net income decreased 7.6% from the year ago quarter primarily due to the decline in operating income at both operating groups. Adjusted diluted earnings per share declined $0.03, or 2.9% from the year ago quarter. The year-over-year change was negatively impacted by approximately $0.01 due to the translation impact of changes in foreign currency exchange rates, $0.01 due to the higher tax rate, which were offset by $0.05 benefit from the impact of the Company’s share repurchase program. |
|
o |
Adjusted diluted earnings per share of $1.01 decreased $0.21, or 17.2%, sequentially. |
Avnet, Inc. Q3 Fiscal Year 2016
$ in millions - except per share data
April 28, 2016
Working Capital
|
|
|
|
|
|
|
|
|
|
|
|
|
|
|
|
|
|
|
|
|
|
|
|
Q3' FY15 |
Q4' FY15 |
Q1' FY16 |
Q2' FY16 |
Q3' FY16 |
Y/Y Change |
||||||||||||
|
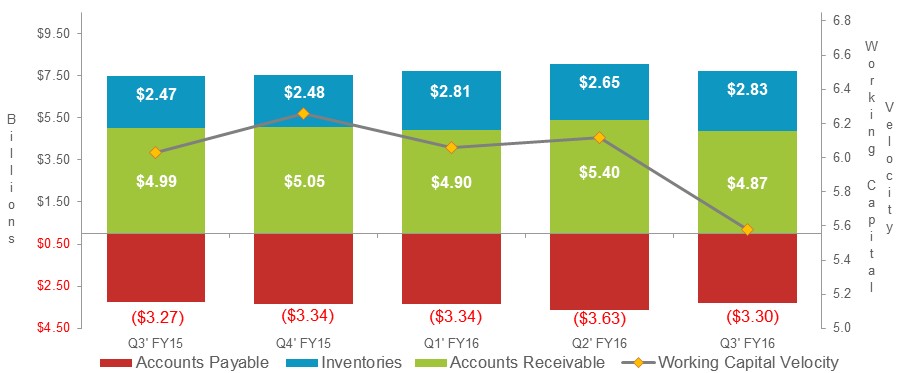
Accounts Receivable |
|
$ |
4,994.8 |
|
$ |
5,054.3 |
|
$ |
4,903.2 |
|
$ |
5,395.0 |
|
$ |
4,874.2 |
|
$ |
(120.6) |
|
|
Inventories |
|
$ |
2,474.4 |
|
$ |
2,482.2 |
|
$ |
2,805.0 |
|
$ |
2,650.2 |
|
$ |
2,826.9 |
|
$ |
352.5 |
|
|
Accounts Payable |
|
$ |
(3,272.0) |
|
$ |
(3,338.1) |
|
$ |
(3,339.8) |
|
$ |
(3,628.1) |
|
$ |
(3,298.0) |
|
$ |
(26.0) |
|
|
Working Capital |
|
$ |
4,197.2 |
|
$ |
4,198.4 |
|
$ |
4,368.4 |
|
$ |
4,417.1 |
|
$ |
4,403.1 |
|
$ |
205.9 |
|
|
Working Capital Velocity (1) |
|
|
6.03 |
|
|
6.27 |
|
|
6.06 |
|
|
6.12 |
|
|
5.58 |
|
|
(0.45) |
|
|
(1) |
A reconciliation of non-GAAP financial measures is presented in the Non-GAAP Financial Information section of the press release attached as Exhibit 99.1 included in this Current Report on Form 8-K. |
|
· |
Working capital (accounts receivable plus inventories less accounts payable) increased $205.9 million, or 4.9%, and $167.4 million, or 4.0%, year over year in constant currency, primarily due to an increase in inventory at EM. |
|
o |
On a sequential basis, working capital decreased $14.1 million, or 0.3%, and decreased 2.0% when adjusted for the translation impact of changes in foreign currency exchange rates, primarily due to the greater than seasonal sales decline at TS. |
|
· |
Working capital velocity declined 0.45 turns from the year ago quarter and declined 0.54 turns sequentially due to the decrease in sales. |
|
· |
Inventories increased $352.5 million, or 14.2%, year over year and 12.6% in constant currency primarily due to: (i) an increase at EM Asia related to high volume supply chain engagements; (ii) an increase in EM EMEA to support the organic revenue growth; and (iii) an increase in EM Americas to support the conversion of the ERP system at the beginning of the fourth quarter and new supplier relationships. |
|
o |
On a sequential basis, inventories increased $176.6 million, or 6.7% (4.8% in constant currency), primarily due to an increase at EM. |
Avnet, Inc. Q3 Fiscal Year 2016
$ in millions - except per share data
April 28, 2016
|
|
|
Q3' FY15 |
Q4' FY15 |
Q1' FY16 |
Q2' FY16 |
Q3' FY16 |
Y/Y Change |
||||||
|
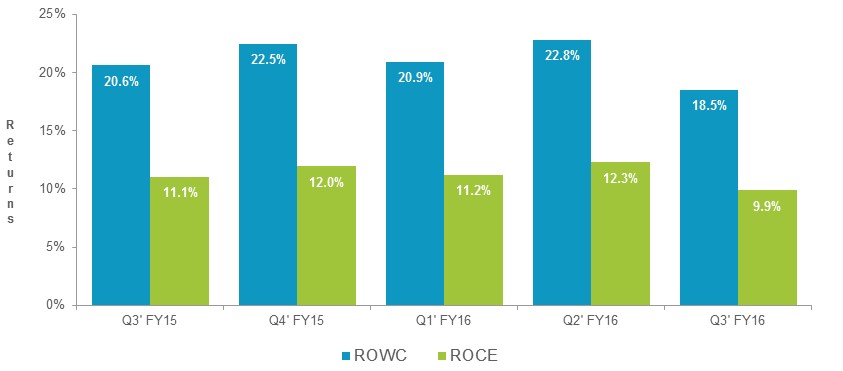
Return on Working Capital (ROWC) (1) |
|
20.6 |
% |
22.5 |
% |
20.9 |
% |
22.8 |
% |
18.5 |
% |
(207) |
bps |
|
Return on Capital Employed (ROCE) (1) |
|
11.1 |
% |
12.0 |
% |
11.2 |
% |
12.3 |
% |
9.9 |
% |
(120) |
bps |
|
(1) |
A reconciliation of non-GAAP financial measures is presented in the Non-GAAP Financial Information section of the press release attached as Exhibit 99.1 included in this Current Report on Form 8-K. |
|
· |
ROWC for the third quarter of fiscal 2016 was 18.5%, a decrease of 207 basis points year over year and 429 basis points sequentially primarily due to a decline in profitability at both operating groups. |
|
· |
ROCE of 9.9% decreased 120 basis points year over year and 240 basis points sequentially. |
Avnet, Inc. Q3 Fiscal Year 2016
$ in millions - except per share data
April 28, 2016
Cash Flow
|
|
|
|
|
|
|
|
|
|
|
|
|
|
|
|
|
|
|
|
|
|
|
|
Q3' FY15 |
|
Q4' FY15 |
|
Q1' FY16 |
|
Q2' FY16 |
|
Q3' FY16 |
|
Y/Y Change |
|
||||||
|
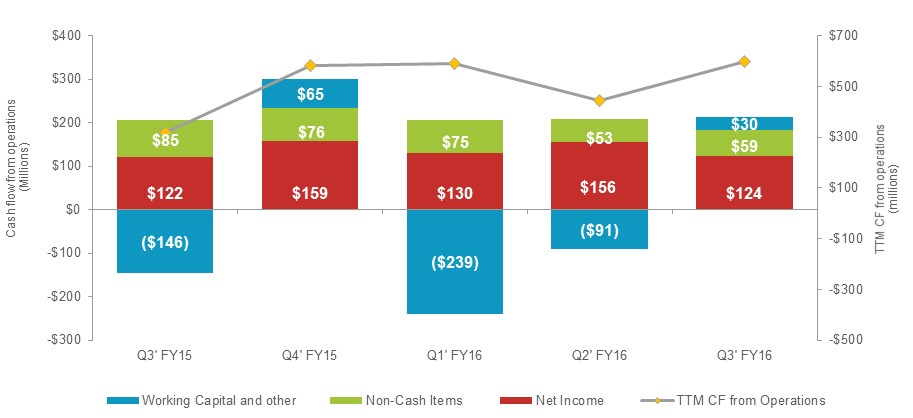
Net Income |
|
$ |
121.5 |
|
$ |
158.7 |
|
$ |
130.3 |
|
$ |
156.0 |
|
$ |
123.5 |
|
$ |
1.9 |
|
|
Non-Cash Items |
|
$ |
84.8 |
|
$ |
75.7 |
|
$ |
74.8 |
|
$ |
53.4 |
|
$ |
59.4 |
|
$ |
(25.4) |
|
|
Working Capital and Other |
|
$ |
(146.2) |
|
$ |
64.9 |
|
$ |
(238.8) |
|
$ |
(91.4) |
|
$ |
30.0 |
|
$ |
176.2 |
|
|
Cash Flow from Operations |
|
$ |
60.1 |
|
$ |
299.3 |
|
$ |
(33.7) |
|
$ |
118.0 |
|
$ |
212.9 |
|
$ |
152.7 |
|
|
TTM CF from Operations |
|
$ |
318.1 |
|
$ |
583.9 |
|
$ |
590.8 |
|
$ |
443.7 |
|
$ |
596.5 |
|
$ |
278.4 |
|
|
· |
During the third quarter of fiscal 2016, cash flow from operations of $212.9 million increased from the year ago quarter primarily due to working capital and other, which was a source of funds in the current year as compared to a use of funds in the prior year. The trailing twelve month cash flow generated from operations was $596.5 million and over the past four quarters, our trailing twelve month cash flow from operations has averaged $553.6 million. |
|
· |
During the third quarter of fiscal 2016, the Company repurchased approximately 3.7 million shares representing an aggregate investment of $145.7 million and has returned approximately $330.8 million in the form of share repurchases to shareholders fiscal year to date. |
|
· |
During the third quarter of fiscal 2016, the Company paid a dividend of $0.17 per share, or $21.9 million in total and has paid approximately $67 million fiscal year to date. |
|
· |
Cash and cash equivalents at the end of the quarter were $1.0 billion, of which $966.8 million was held outside the United States; net debt (total debt less cash and cash equivalents) was approximately $1.3 billion. |
Avnet, Inc. Q3 Fiscal Year 2016
$ in millions - except per share data
April 28, 2016
This document contains certain “forward-looking statements” within the meaning of Section 27A of the Securities Act of 1933, as amended, and Section 21E of the Securities Exchange Act of 1934, as amended. These statements are based on management’s current expectations and are subject to uncertainty and changes in facts and circumstances. The forward-looking statements herein include statements addressing future financial and operating results of Avnet and may include words such as “will,” “anticipate,” “estimate,” “forecast,” “expect,” “believe,” and “should,” and other words and terms of similar meaning in connection with any discussions of future operating or financial performance, business prospects or market conditions. Actual results may differ materially from the expectations contained in the forward-looking statements.
The following factors, among others, could cause actual results to differ materially from those described in the forward-looking statements: the Company’s ability to retain and grow market share and to generate additional cash flow, risks associated with any acquisition activities and the successful integration of acquired companies, an industry down-cycle in semiconductors, IT hardware or software products, declines in sales, changes in business conditions and the economy in general, changes in market demand and pricing pressures, any material changes in the allocation of product or product rebates by suppliers, and other competitive and/or regulatory factors affecting the businesses of Avnet generally.
More detailed information about these and other factors is set forth in Avnet’s filings with the Securities and Exchange Commission, including the Company’s reports on Form 10-K, Form 10-Q and Form 8-K. Except as required by law, Avnet is under no obligation to update any forward-looking statements, whether as a result of new information, future events or otherwise.
Organic Sales
Organic sales is defined as reported sales adjusted for the impact of more than insignificant acquisitions and divestitures by adjusting Avnet’s prior periods to include the sales of acquired businesses and exclude the sales of divested businesses as if the acquisitions and divestitures had occurred at the beginning of the earliest period presented. Additionally, fiscal 2016 sales are adjusted for the estimated impact of the extra week of sales in the first quarter of fiscal 2016 due to the 14-week fiscal first quarter and the 53-week fiscal year. Organic sales in constant currency is defined as organic sales excluding the impact of changes in foreign currency exchange rates.
Non-GAAP Financial Information
In addition to disclosing financial results that are determined in accordance with generally accepted accounting principles in the United States (“GAAP”), the Company also discloses in this document certain non-GAAP financial information including adjusted operating income, adjusted operating expenses, adjusted net income and adjusted diluted earnings per share, as well as sales adjusted for the impact of acquisitions and other items (as defined in the Organic Sales section of this document). There are also references to the impact of foreign currency in the discussion of the Company’s results of operations. When the U.S. Dollar strengthens and the stronger exchange rates of the current year are used to translate the results of operations of Avnet’s subsidiaries denominated in foreign currencies, the resulting impact is a decrease in U.S. Dollars of reported results. Conversely, when the U.S. Dollar weakens and the weaker exchange rates of the current year are used to translate the results of operations of Avnet’s subsidiaries denominated in foreign currencies, the resulting impact is an increase in U.S. Dollars of reported results. In the discussion of the Company’s results of operations, results excluding this impact are referred to as “excluding the translation impact of changes in foreign currency exchange rates” or “constant currency.” In order to determine the translation impact of changes in foreign currency exchange rates for sales, income or expense items, the Company adjusts the exchange rates used in current periods to be consistent with the exchange rates in effect during prior periods. Management believes organic sales and sales in constant currency are useful measures for evaluating current period performance as compared with prior periods and for understanding underlying trends. Management believes that operating income and operating expenses adjusted for (i) restructuring, integration and other expenses and (ii) amortization of acquired intangible assets and other, are useful measures to help investors better assess and understand the Company’s operating performance, especially when comparing results with previous periods or forecasting performance for future periods, primarily because management views the excluded items to be outside of Avnet’s normal operating results or non-cash in nature. Management analyzes operating income and operating expenses without the impact of these items as an indicator of ongoing margin performance and underlying trends in the business. Management also uses these non-GAAP measures to establish operational goals and, in many cases, for measuring performance for compensation purposes.
Additional non-GAAP metrics management uses are adjusted operating income margin, which is defined as adjusted operating income (as defined above) divided by sales and adjusted operating expense to gross profit ratio, which is defined as adjusted operating expenses (as defined above) divided by gross profit.
Management believes net income and diluted EPS adjusted for (i) the impact of the items described above, (ii) certain items impacting other expense and (iii) certain items impacting income tax expense is useful to investors because it provides a measure of the Company’s net profitability on a more comparable basis to historical periods and provides a more meaningful basis for forecasting future performance. Additionally, because of management’s focus on generating shareholder value, of which net profitability is a primary driver, management believes net income and diluted EPS excluding the impact of these items provides an important measure of the Company’s net results for the investing public.
Avnet, Inc. Q3 Fiscal Year 2016
$ in millions - except per share data
April 28, 2016
Other metrics management monitors in its assessment of business performance include return on working capital (ROWC), return on capital employed (ROCE) and working capital velocity (WC velocity).
|
· |
ROWC is defined as annualized adjusted operating income (as defined above) divided by the sum of the monthly average balances of receivables and inventories less accounts payable. |
|
· |
ROCE is defined as annualized, tax effected adjusted operating income (as defined above) divided by the monthly average balances of interest-bearing debt and equity (including the impact of adjustments to operating income discussed above) less cash and cash equivalents. |
|
· |
WC velocity is defined as annualized sales divided by the sum of the monthly average balances of receivables and inventories less accounts payable. |
Any analysis of results and outlook on a non-GAAP basis should be used as a complement to, and in conjunction with, results presented in accordance with GAAP. A reconciliation of the GAAP financial measures to the non-GAAP financial measures is included in the Company’s press release dated April 28, 2016 (Exhibit 99.1) in this Current Report on Form 8-K.