Attached files
| file | filename |
|---|---|
| 8-K - FORM 8-K - COHEN & STEERS, INC. | cns-8kx33116.htm |
| EX-99.1 - CNS EARNINGS RELEASE 03.31.16 - COHEN & STEERS, INC. | cns-earningsreleasex33116.htm |

Cohen & Steers: Q1 2016 Earnings Presentation

2 Legal Disclosures This presentation and other statements that Cohen & Steers may make may contain forward-looking statements within the meaning of Section 27A of the Securities Act of 1933, as amended, and Section 21E of the Securities Exchange Act of 1934, as amended, which reflect management's current views with respect to, among other things, the company's operations and financial performance. You can identify these forward-looking statements by the use of words such as "outlook," "believes," "expects," "potential," "continues," "may," "will," "should," "seeks," "approximately," "predicts," "intends," "plans," "estimates," "anticipates" or the negative versions of these words or other comparable words. Such forward-looking statements are subject to various risks and uncertainties. Accordingly, there are or will be important factors that could cause actual outcomes or results to differ materially from those indicated in these forward-looking statements. The company believes that these factors include, but are not limited to, the risks described in the Risk Factors section of the company's Annual Report on Form 10-K for the year ended December 31, 2015 (Form 10-K), which is accessible on the Securities and Exchange Commission's website at www.sec.gov and on the company's website at www.cohenandsteers.com. These factors are not exhaustive and should be read in conjunction with the other cautionary statements that are included in the company's Form 10-K and other filings with the Securities and Exchange Commission. The company undertakes no obligation to publicly update or review any forward-looking statement, whether as a result of new information, future developments or otherwise. This presentation contains pro forma, or non-GAAP financial measures, which we believe are meaningful in evaluating the company’s performance. For disclosures on pro forma metrics and their GAAP reconciliations, you should refer to the financial reconciliation contained on page 13 of this presentation. Copyright © 2016 Cohen & Steers, Inc. All rights reserved.
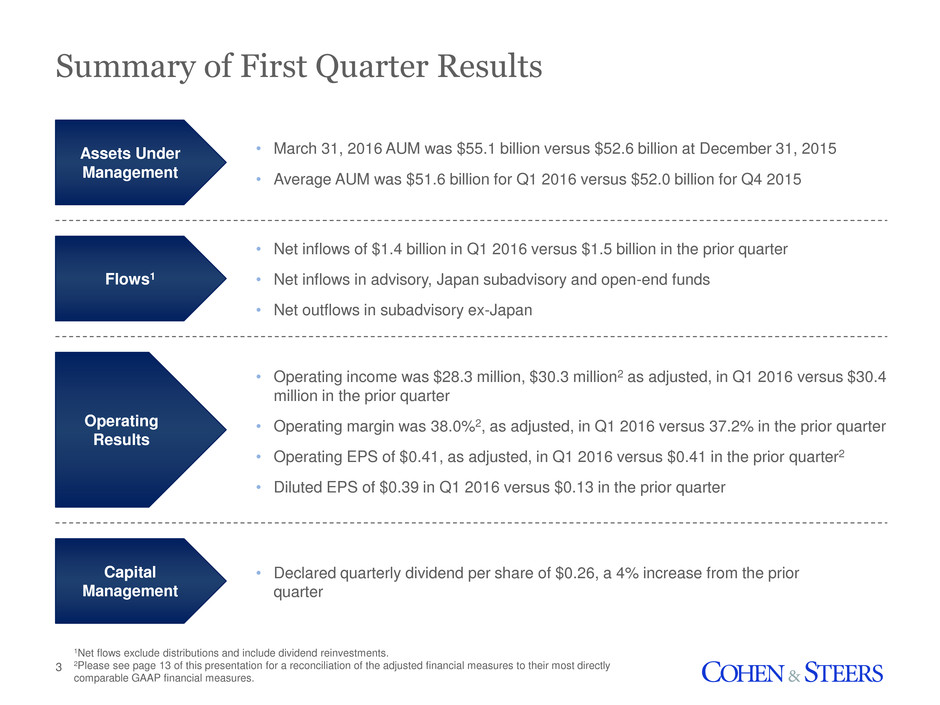
3 Summary of First Quarter Results 1Net flows exclude distributions and include dividend reinvestments. 2Please see page 13 of this presentation for a reconciliation of the adjusted financial measures to their most directly comparable GAAP financial measures. Capital Management • Declared quarterly dividend per share of $0.26, a 4% increase from the prior quarter Operating Results • Operating income was $28.3 million, $30.3 million2 as adjusted, in Q1 2016 versus $30.4 million in the prior quarter • Operating margin was 38.0%2, as adjusted, in Q1 2016 versus 37.2% in the prior quarter • Operating EPS of $0.41, as adjusted, in Q1 2016 versus $0.41 in the prior quarter2 • Diluted EPS of $0.39 in Q1 2016 versus $0.13 in the prior quarter • March 31, 2016 AUM was $55.1 billion versus $52.6 billion at December 31, 2015 • Average AUM was $51.6 billion for Q1 2016 versus $52.0 billion for Q4 2015 • Net inflows of $1.4 billion in Q1 2016 versus $1.5 billion in the prior quarter • Net inflows in advisory, Japan subadvisory and open-end funds • Net outflows in subadvisory ex-Japan Assets Under Management Flows1

4 Revenue ($ in millions) Expenses ($ in millions) Financial Results $83.8 $83.5 $79.7 $81.7 $79.7 Q1 2015 Q2 2015 Q3 2015 Q4 2015 Q1 2016 $49.3 $52.3 $48.2 $51.3 $49.41 Q1 2015 Q2 2015 Q3 2015 Q4 2015 Q1 2016 1Please see page 13 of this presentation for a reconciliation of the adjusted financial measures to their most directly comparable GAAP financial measures. Diluted Earnings per Share $0.45 $0.45 $0.37 $0.13 $0.39 Q1 2015 Q2 2015 Q3 2015 Q4 2015 Q1 2016 Operating Earnings per Share1 Operating Margin 41.2% 37.3% 39.5% 37.2% 38.0%1 Q1 2015 Q2 2015 Q3 2015 Q4 2015 Q1 2016 $0.47 $0.42 $0.43 $0.41 $0.41 Q1 2015 Q2 2015 Q3 2015 Q4 2015 Q1 2016

$35.1 $34.8 $32.8 $34.2 $33.5 $21.8 $21.5 $20.7 $21.5 $21.3 $20.9 $20.9 $20.0 $19.6 $18.3 $3.9 $4.0 $4.0 $4.1 $4.2 $2.1 $2.3 $2.2 $2.3 $2.4 Q1 2015 Q2 2015 Q3 2015 Q4 2015 Q1 2016 Open-end Fund Fees Institutional Fees Closed-end Fund Fees Distribution & Service Fees Portfolio Consulting and Other 5 $83.8 $83.5 $79.7 $81.7 $79.7 Revenue $ in millions

Expenses $ in millions 6 $26.0 $28.4 $25.9 $27.4 $26.1 $12.5 $12.8 $12.2 $13.4 $12.7 $9.2 $9.5 $8.6 $9.0 $8.7 $1.6 $1.6 $1.5 $1.5 $1.9 Q1 2015 Q2 2015 Q3 2015 Q4 2015 Q1 2016 Employee Compensation & Benefits General & Administrative Distribution and Service Fees Depreciation and Amortization $49.3 $52.3 $48.2 $51.3 $49.41 1Please see page 13 of this presentation for a reconciliation of the adjusted financial measures to their most directly comparable GAAP financial measures.
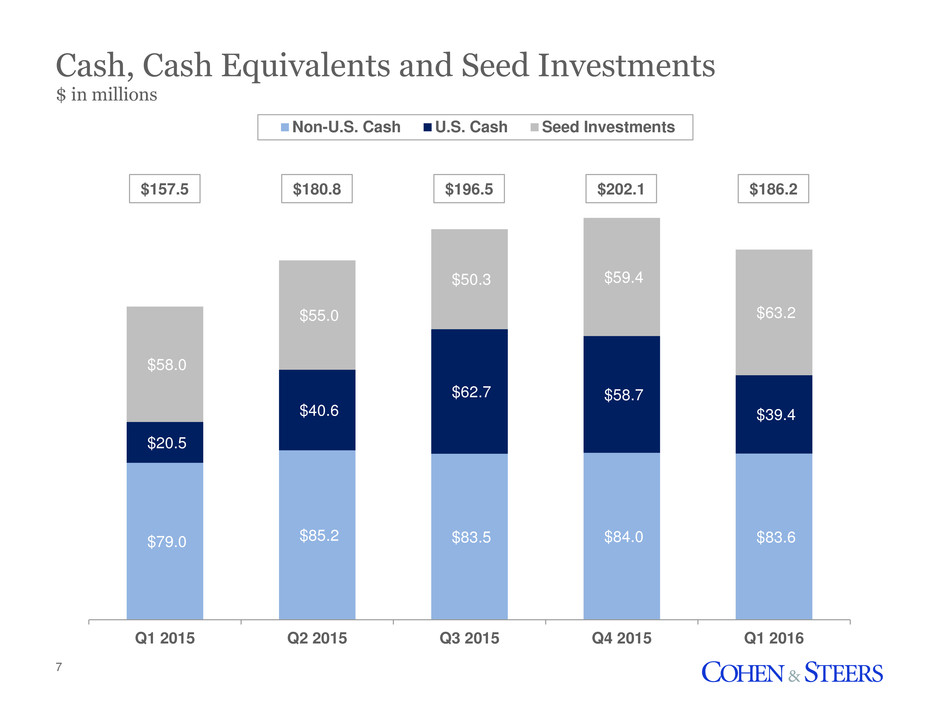
Cash, Cash Equivalents and Seed Investments $ in millions 7 $79.0 $85.2 $83.5 $84.0 $83.6 $20.5 $40.6 $62.7 $58.7 $39.4 $58.0 $55.0 $50.3 $59.4 $63.2 Q1 2015 Q2 2015 Q3 2015 Q4 2015 Q1 2016 Non-U.S. Cash U.S. Cash Seed Investments $157.5 $180.8 $196.5 $202.1 $186.2
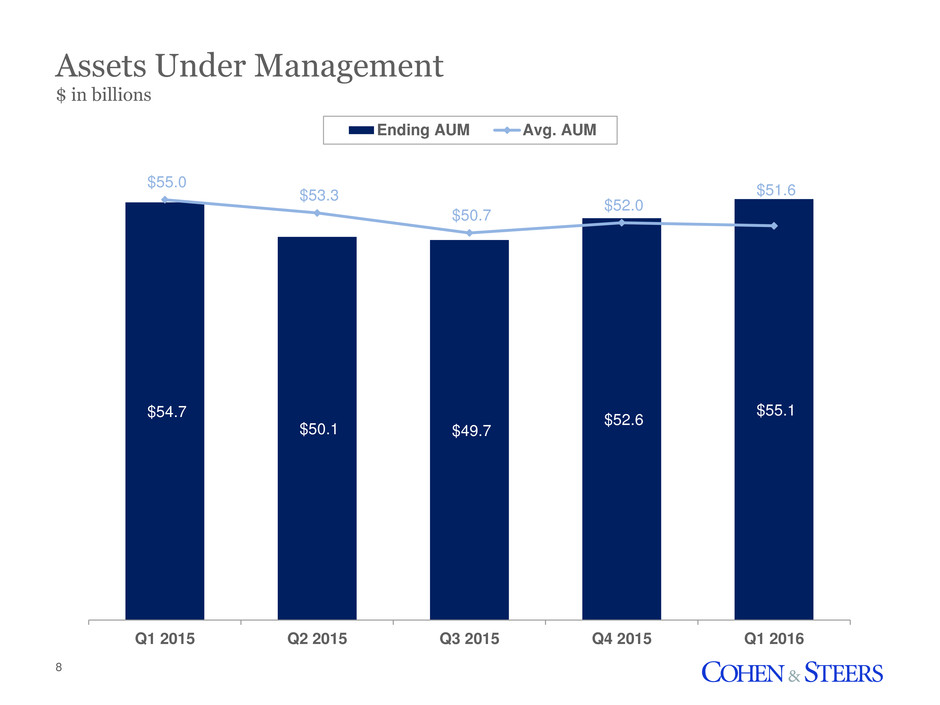
8 $54.7 $50.1 $49.7 $52.6 $55.1 $55.0 $53.3 $50.7 $52.0 $51.6 Q1 2015 Q2 2015 Q3 2015 Q4 2015 Q1 2016 Ending AUM Avg. AUM Assets Under Management $ in billions

9 Ending Assets Under Management: Q1 2016 Open-end Funds 33.0% U.S. Real Estate 52.8% North America 64.8% Japan Subadvisory 25.4% Global/International Real Estate 18.4% Japan 25.6% Closed-end Funds 16.4% Preferred Securities 14.7% Europe 5.4% Advisory 15.0% Global Listed Infrastructure 9.6% APAC ex. Japan 4.2% Subadvisory ex. Japan 10.2% Other 4.5% By Vehicle By Strategy By Client Domicile
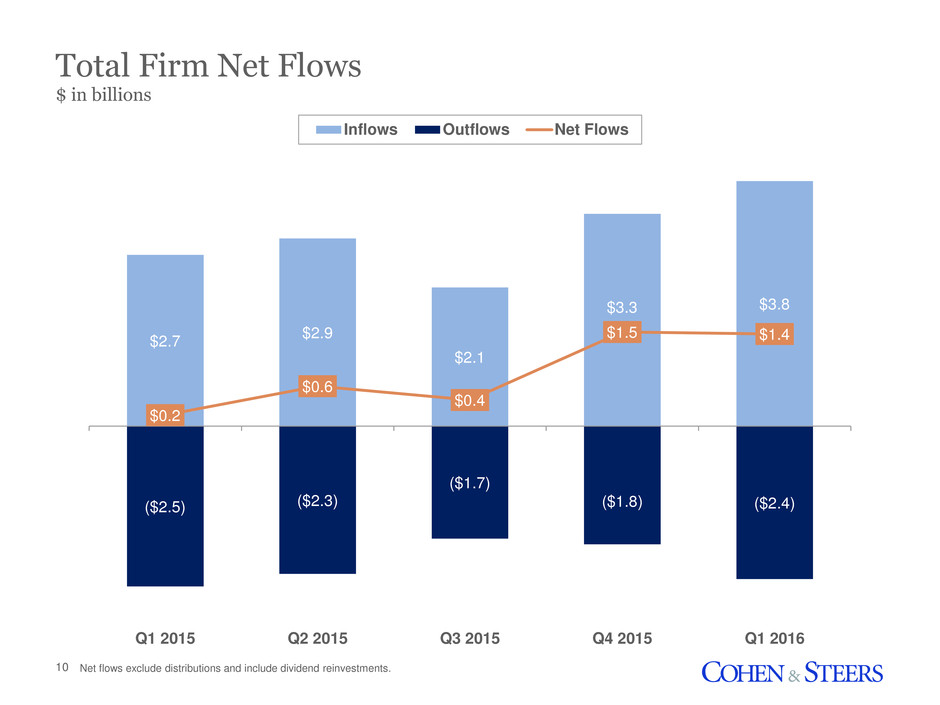
10 ($2.5) ($2.3) ($1.7) ($1.8) ($2.4) $2.7 $2.9 $2.1 $3.3 $3.8 $0.2 $0.6 $0.4 $1.5 $1.4 Q1 2015 Q2 2015 Q3 2015 Q4 2015 Q1 2016 Inflows Outflows Net Flows Total Firm Net Flows $ in billions Net flows exclude distributions and include dividend reinvestments.

11 $1.7 $2.1 $1.2 $2.3 $2.0 ($1.5) ($1.8) ($1.3) ($1.3) ($1.7) Q1 2015 Q2 2015 Q3 2015 Q4 2015 Q1 2016 Open-end Funds Advisory $0.3 $0.1 $0.4 $0.2 $0.2 ($0.3) ($0.2) ($0.3) ($0.3) ($0.2) Q1 2015 Q2 2015 Q3 2015 Q4 2015 Q1 2016 Subadvisory ex. Japan $0.4 $0.4 $0.4 $0.6 $0.9 ($0.3) ($0.1) ($0.1) ($0.1) ($0.0) Q1 2015 Q2 2015 Q3 2015 Q4 2015 Q1 2016 Japan Subadvisory Excludes closed-end fund flows. Net flows exclude distributions and include dividend reinvestments. Net Flows by Investment Vehicle $ in billions $0.2 $0.2 $0.2 $0.2 $0.7 ($0.4) ($0.2) ($0.0) ($0.1) ($0.3) Q1 2015 Q2 2015 Q3 2015 Q4 2015 Q1 2016 Inflows Outflows Net Flows
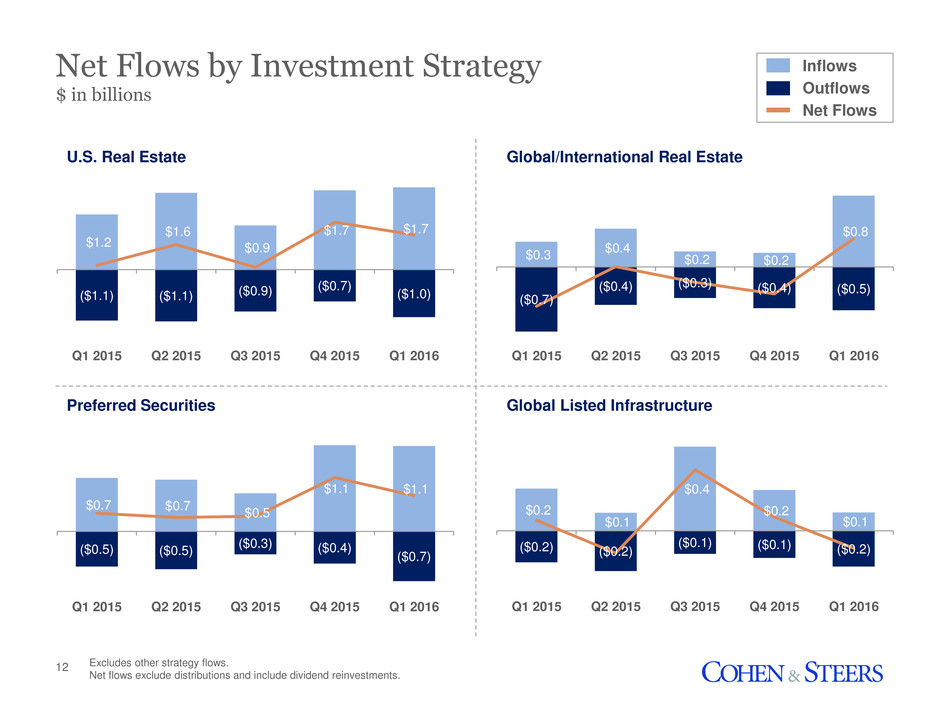
12 $1.2 $1.6 $0.9 $1.7 $1.7 ($1.1) ($1.1) ($0.9) ($0.7) ($1.0) Q1 2015 Q2 2015 Q3 2015 Q4 2015 Q1 2016 U.S. Real Estate $0.3 $0.4 $0.2 $0.2 $0.8 ($0.7) ($0.4) ($0.3) ($0.4) ($0.5) Q1 2015 Q2 2015 Q3 2015 Q4 2015 Q1 2016 Global/International Real Estate $0.7 $0.7 $0.5 $1.1 $1.1 ($0.5) ($0.5) ($0.3) ($0.4) ($0.7) Q1 2015 Q2 2015 Q3 2015 Q4 2015 Q1 2016 Preferred Securities $0.2 $0.1 $0.4 $0.2 $0.1 ($0.2) ($0.2) ($0.1) ($0.1) ($0.2) Q1 2015 Q2 2015 Q3 2015 Q4 2015 Q1 2016 Global Listed Infrastructure Excludes other strategy flows. Net flows exclude distributions and include dividend reinvestments. Net Flows by Investment Strategy $ in billions Inflows Outflows Net Flows

13 Q1 2015 Q2 2015 Q3 2015 Q4 2015 Q1 2016 GAAP Revenue 83.8 83.5 79.7 81.7 79.7 Expenses (49.3) (52.3) (48.2) (51.3) (51.4) Operating Income 34.5 31.2 31.5 30.4 28.3 Provision for income taxes 12.2 12.2 11.5 12.4 11.1 Net income attributable to common stockholders per diluted weighted average share outstanding 0.45 0.45 0.37 0.13 0.39 Operating margin 41.2% 37.3% 39.5% 37.2% 35.5% Non-GAAP Revenue, GAAP basis 83.8 83.5 79.7 81.7 79.7 Expenses, GAAP basis (49.3) (52.3) (48.2) (51.3) (51.4) Exclude accelerated vesting of certain restricted stock units - - - - 1.9 Expenses, as adjusted (49.3) (52.3) (48.2) (51.3) (49.4) Operating income, as adjusted 34.5 31.2 31.5 30.4 30.3 Provision for income taxes1, as adjusted 13.1 11.8 12.0 11.5 11.5 Net operating earnings, as adjusted 21.4 19.3 19.5 18.8 18.8 Diluted weighted average shares outstanding 46.0 45.8 45.8 46.0 46.2 Net operating earnings per diluted weighted average share outstanding, as adjusted 0.47 0.42 0.43 0.41 0.41 Operating margin, as adjusted 41.2% 37.3% 39.5% 37.2% 38.0% Financial Reconciliation $ in millions except per share information 1The provision for income taxes for the periods presented is provided for at a 38% rate, which is the rate the company would pay on its earnings excluding the effect of non-operating gains and losses on seed investments and discrete items. .
