Attached files
| file | filename |
|---|---|
| 8-K - FORM 8-K - VALSPAR CORP | d159420d8k.htm |
| EX-99.1 - EX-99.1 - VALSPAR CORP | d159420dex991.htm |
Sherwin-Williams To Acquire Valspar Expanding Sherwin-Williams’ Product Lines and Building a Global Platform for Growth Exhibit 99.2
Forward Looking Statements 2 105 179 192 0 0 255 255 0 0 177 79 33 53 218 112 48 162 255 50 0 222 223 224 0 177 241 255 193 0 Additional Information and Where to Find it Valspar intends to file with the SEC a proxy statement in connection with the contemplated transactions. The definitive proxy statement will be sent or given to Valspar stockholders and will contain important information about the contemplated transactions. INVESTORS AND SECURITY HOLDERS ARE URGED TO READ CAREFULLY AND IN THEIR ENTIRETY THE PROXY STATEMENT AND ANY OTHER RELEVANT DOCUMENTS FILED WITH THE SEC WHEN THEY BECOME AVAILABLE. Investors and security holders may obtain a free copy of the proxy statement (when it is available) and other documents filed with the SEC at the SEC’s website at www.sec.gov. Certain Information Concerning Participants Valspar and Sherwin-Williams and their respective directors and executive officers may be deemed to be participants in the solicitation of proxies from Valspar investors and security holders in connection with the contemplated transactions. Information about Valspar’s directors and executive officers is set forth in its proxy statement for its 2016 Annual Meeting of Stockholders and its most recent annual report on Form 10-K. Information about Sherwin-Williams' directors and executive officers is set forth in its proxy statement for its 2016 Annual Meeting of Stockholders and its most recent annual report on Form 10-K. These documents may be obtained for free at the SEC’s website at www.sec.gov. Additional information regarding the interests of participants in the solicitation of proxies in connection with the contemplated transactions will be included in the proxy statement that Valspar intends to file with the SEC. Cautionary Statement Regarding Forward-Looking Information This communication contains forward-looking information about Valspar, Sherwin-Williams and the proposed transaction. Forward-looking statements are statements that are not historical facts. These statements can be identified by the use of forward-looking terminology such as “believe,” “expect,” “may,” “will,” “should,” “project,” “could,” “plan,” “goal,” “potential,” “pro forma,” “seek,” “intend” or “anticipate” or the negative thereof or comparable terminology, and include discussions of strategy, financial projections, guidance and estimates (including their underlying assumptions), statements regarding plans, objectives, expectations or consequences of announced transactions, and statements about the future performance, operations, products and services of Valspar and its subsidiaries. Valspar and Sherwin-Williams caution readers not to place undue reliance on these statements. These forward-looking statements are subject to a variety of risks and uncertainties. Consequently, actual results and experience may materially differ from those contained in any forward-looking statements. Such risks and uncertainties include the following: the failure to obtain Valspar stockholder approval of the proposed transaction; the possibility that the closing conditions to the contemplated transactions may not be satisfied or waived, including that a governmental entity may prohibit, delay or refuse to grant a necessary regulatory approval; delay in closing the transaction or the possibility of non-consummation of the transaction; the potential for regulatory authorities to require divestitures in connection with the proposed transaction and the possibility that Valspar stockholders consequently receive $105 per share instead of $113 per share; the occurrence of any event that could give rise to termination of the merger agreement; the risk that stockholder litigation in connection with the contemplated transactions may affect the timing or occurrence of the contemplated transactions or result in significant costs of defense, indemnification and liability; risks inherent in the achievement of cost synergies and the timing thereof; risks related to the disruption of the transaction to Valspar and its management; the effect of announcement of the transaction on Valspar’s ability to retain and hire key personnel and maintain relationships with customers, suppliers and other third parties; fluctuations in the availability and prices of raw materials; difficult global economic and capital markets conditions; risks associated with revenues from foreign markets; interruption, failure or compromise of Valspar’s information systems; and changes in the legal and regulatory environment. These risks and others are described in greater detail in Valspar’s Annual Report on Form 10-K for the fiscal year ended October 30, 2015, as well as in Valspar’s Quarterly Reports on Form 10-Q and other documents filed by Valspar with the SEC after the date thereof. Valspar and Sherwin-Williams make no commitment to revise or update any forward-looking statements in order to reflect events or circumstances occurring or existing after the date any forward-looking statement is made.
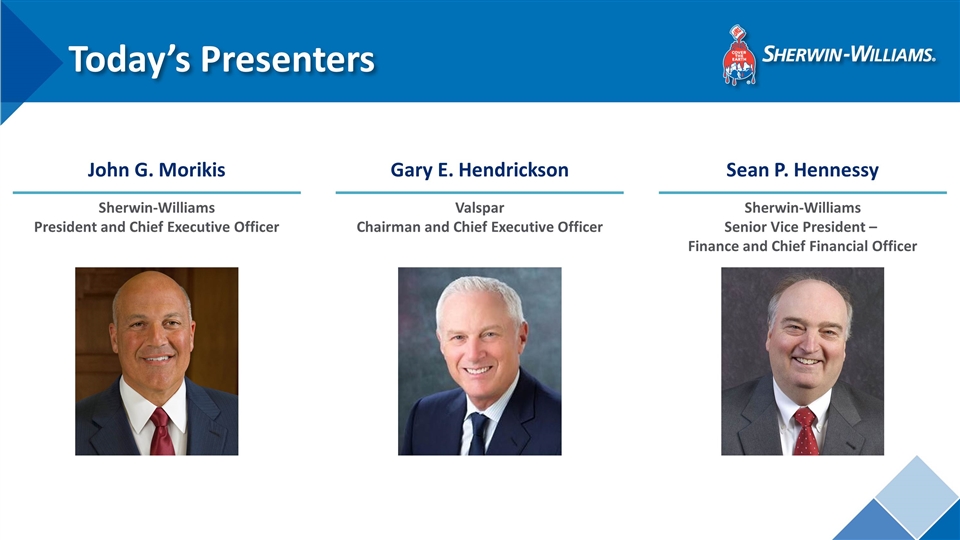
Today’s Presenters John G. Morikis Sherwin-Williams President and Chief Executive Officer Sean P. Hennessy Sherwin-Williams Senior Vice President – Finance and Chief Financial Officer Gary E. Hendrickson Valspar Chairman and Chief Executive Officer
Agenda Introduction 1 2 105 179 192 0 0 255 255 0 0 177 79 33 53 218 112 48 162 255 50 0 222 223 224 0 177 241 255 193 0 2 3 4 Impact on Sherwin-Williams Transaction Overview Summary and Q&A
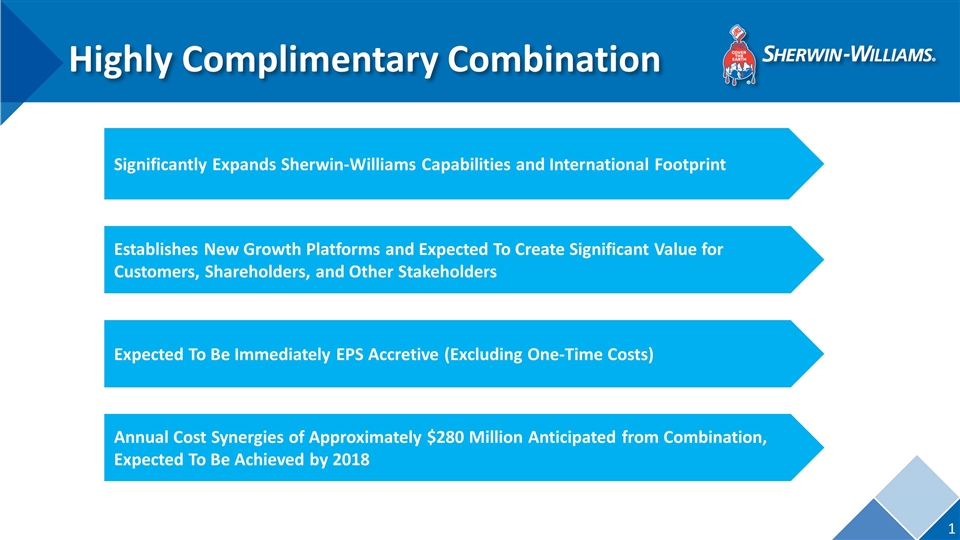
Highly Complimentary Combination 1 Significantly Expands Sherwin-Williams Capabilities and International Footprint Establishes New Growth Platforms and Expected To Create Significant Value for Customers, Shareholders, and Other Stakeholders Expected To Be Immediately EPS Accretive (Excluding One-Time Costs) Annual Cost Synergies of Approximately $280 Million Anticipated from Combination, Expected To Be Achieved by 2018 2 105 179 192 0 0 255 255 0 0 177 79 33 53 218 112 48 162 255 50 0 222 223 224 0 177 241 255 193 0
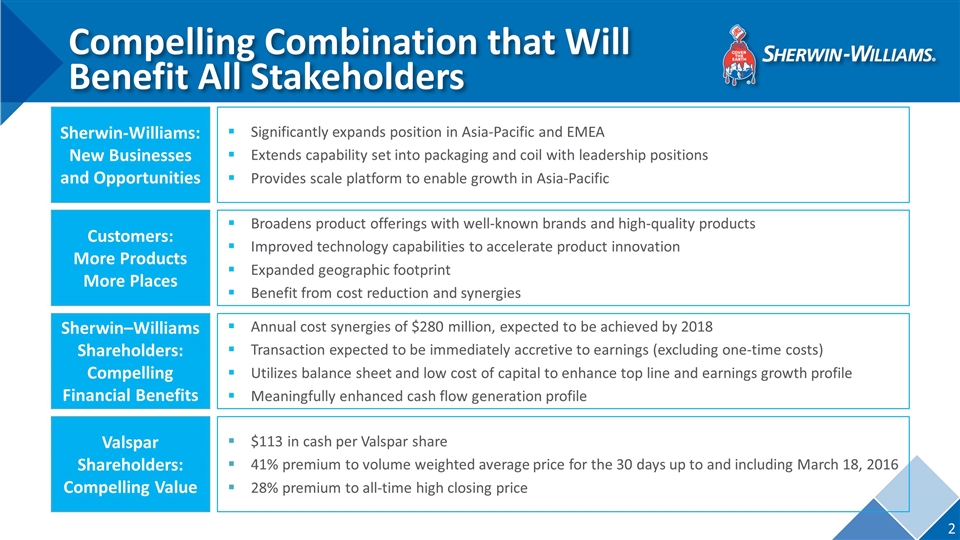
Compelling Combination that Will Benefit All Stakeholders 2 Sherwin-Williams: New Businesses and Opportunities Significantly expands position in Asia-Pacific and EMEA Extends capability set into packaging and coil with leadership positions Provides scale platform to enable growth in Asia-Pacific Sherwin–Williams Shareholders: Compelling Financial Benefits Annual cost synergies of $280 million, expected to be achieved by 2018 Transaction expected to be immediately accretive to earnings (excluding one-time costs) Utilizes balance sheet and low cost of capital to enhance top line and earnings growth profile Meaningfully enhanced cash flow generation profile Customers: More Products More Places Broadens product offerings with well-known brands and high-quality products Improved technology capabilities to accelerate product innovation Expanded geographic footprint Benefit from cost reduction and synergies Valspar Shareholders: Compelling Value $113 in cash per Valspar share 41% premium to volume weighted average price for the 30 days up to and including March 18, 2016 28% premium to all-time high closing price 2 105 179 192 0 0 255 255 0 0 177 79 33 53 218 112 48 162 255 50 0 222 223 224 0 177 241 255 193 0
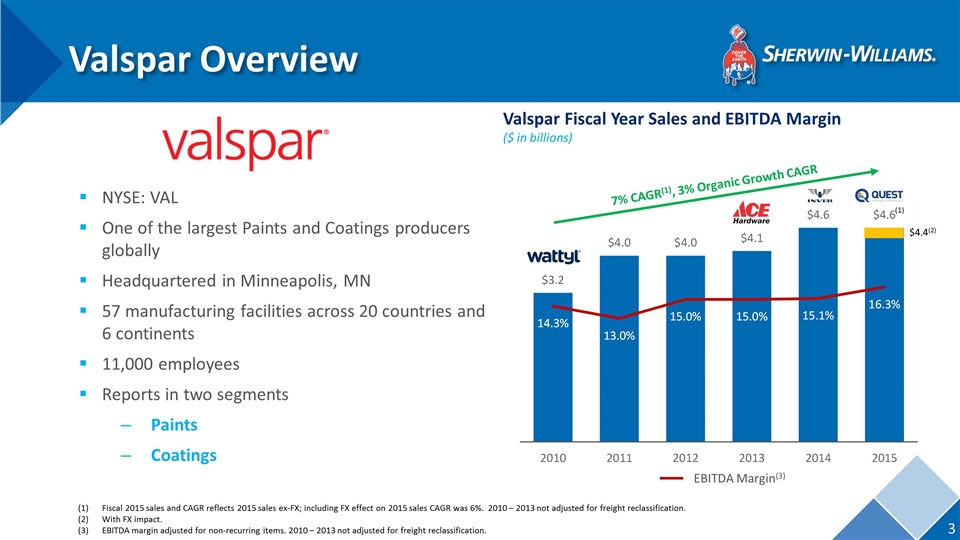
Valspar Overview NYSE: VAL One of the largest Paints and Coatings producers globally Headquartered in Minneapolis, MN 57 manufacturing facilities across 20 countries and 6 continents 11,000 employees Reports in two segments Paints Coatings 3 Valspar Fiscal Year Sales and EBITDA Margin ($ in billions) 7% CAGR(1), 3% Organic Growth CAGR 2 105 179 192 0 0 255 255 0 0 177 79 33 53 218 112 48 162 255 50 0 222 223 224 0 177 241 255 193 0 $4.4(2) (1) Fiscal 2015 sales and CAGR reflects 2015 sales ex-FX; including FX effect on 2015 sales CAGR was 6%. 2010 – 2013 not adjusted for freight reclassification. With FX impact. EBITDA margin adjusted for non-recurring items. 2010 – 2013 not adjusted for freight reclassification. EBITDA Margin(3)
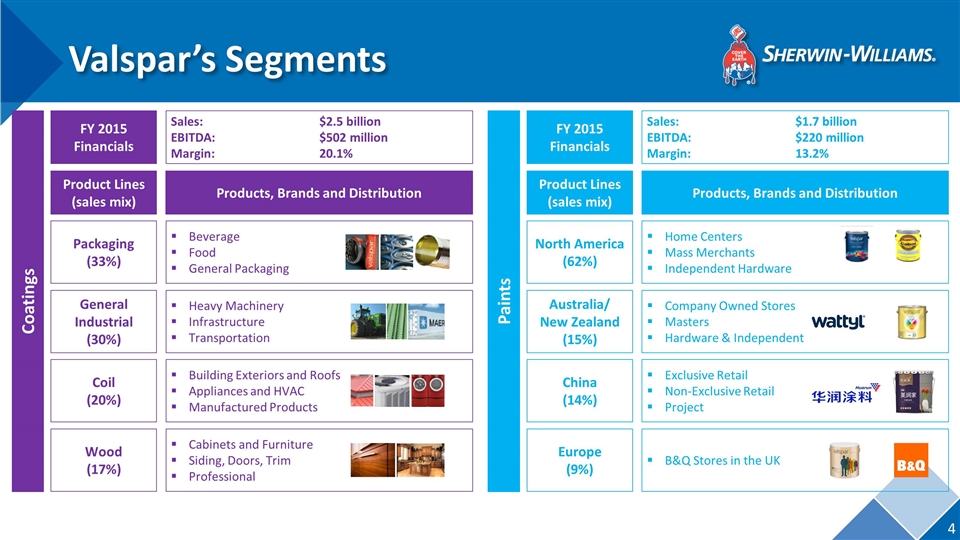
Valspar’s Segments 4 Coatings Product Lines (sales mix) Products, Brands and Distribution Sales: EBITDA: Margin: $2.5 billion $502 million 20.1% Packaging (33%) General Industrial (30%) Coil (20%) Wood (17%) Beverage Food General Packaging Heavy Machinery Infrastructure Transportation Building Exteriors and Roofs Appliances and HVAC Manufactured Products Cabinets and Furniture Siding, Doors, Trim Professional FY 2015 Financials Paints Product Lines (sales mix) Products, Brands and Distribution Sales: EBITDA: Margin: $1.7 billion $220 million 13.2% North America (62%) Australia/ New Zealand (15%) China (14%) Europe (9%) Home Centers Mass Merchants Independent Hardware Company Owned Stores Masters Hardware & Independent Exclusive Retail Non-Exclusive Retail Project B&Q Stores in the UK FY 2015 Financials 2 105 179 192 0 0 255 255 0 0 177 79 33 53 218 112 48 162 255 50 0 222 223 224 0 177 241 255 193 0
Agenda Introduction 1 2 105 179 192 0 0 255 255 0 0 177 79 33 53 218 112 48 162 255 50 0 222 223 224 0 177 241 255 193 0 2 3 4 Impact on Sherwin-Williams Transaction Overview Summary and Q&A
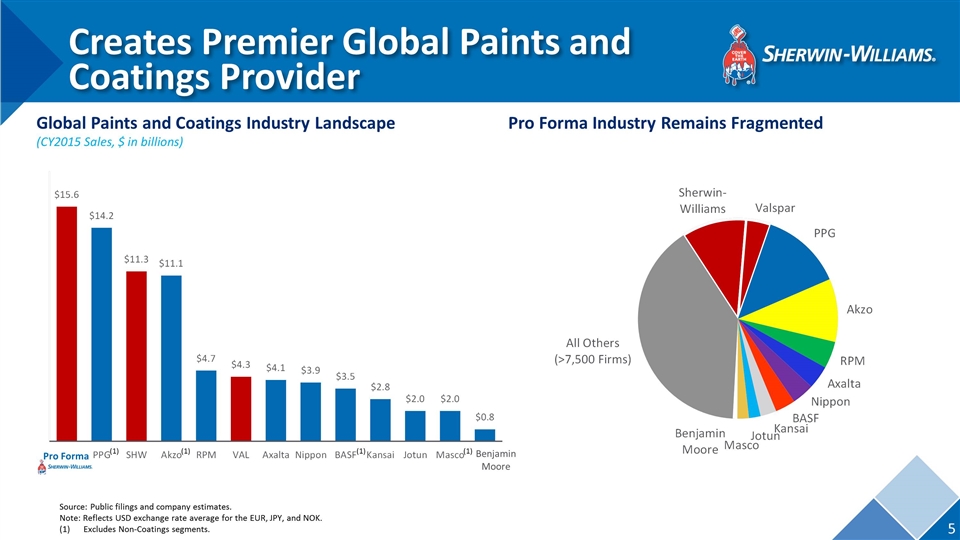
BenjaminMoore Creates Premier Global Paints and Coatings Provider 5 Global Paints and Coatings Industry Landscape (CY2015 Sales, $ in billions) Pro Forma Industry Remains Fragmented Page 5 from January Investor Presentation Source: Public filings and company estimates. Note: Reflects USD exchange rate average for the EUR, JPY, and NOK. (1)Excludes Non-Coatings segments. (1) (1) (1) (1) 2 105 179 192 0 0 255 255 0 0 177 79 33 53 218 112 48 162 255 50 0 222 223 224 0 177 241 255 193 0 Pro Forma
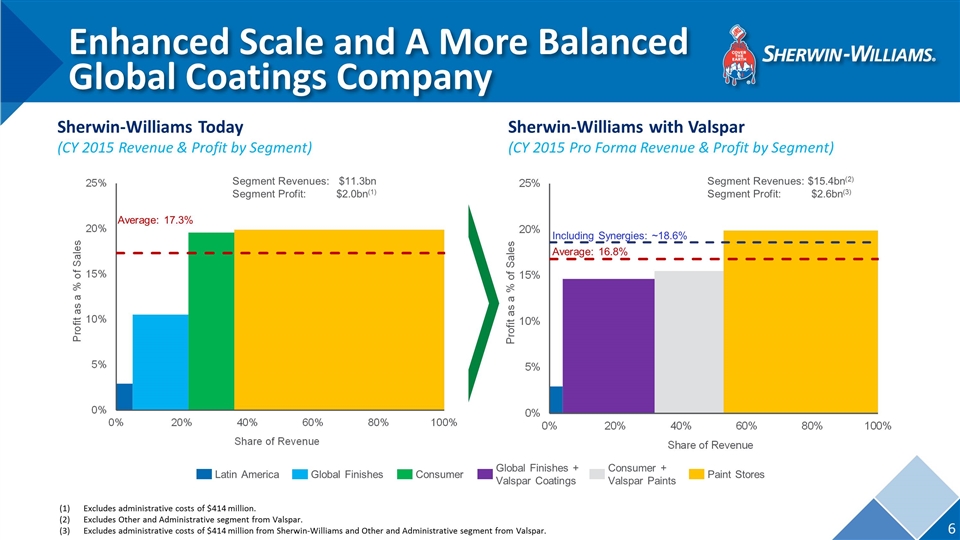
Enhanced Scale and A More Balanced Global Coatings Company 6 Sherwin-Williams Today (CY 2015 Revenue & Profit by Segment) Sherwin-Williams with Valspar (CY 2015 Pro Forma Revenue & Profit by Segment) Average: 17.3% Segment Revenues: $11.3bn Segment Profit:$2.0bn(1) Average: 16.8% 2 105 179 192 0 0 255 255 0 0 177 79 33 53 218 112 48 162 255 50 0 222 223 224 0 177 241 255 193 0 Segment Revenues: $15.4bn(2) Segment Profit:$2.6bn(3) Excludes administrative costs of $414 million. Excludes Other and Administrative segment from Valspar. Excludes administrative costs of $414 million from Sherwin-Williams and Other and Administrative segment from Valspar. Latin America Consumer Paint Stores Global Finishes Including Synergies: ~18.6% Consumer + Valspar Paints Global Finishes + Valspar Coatings
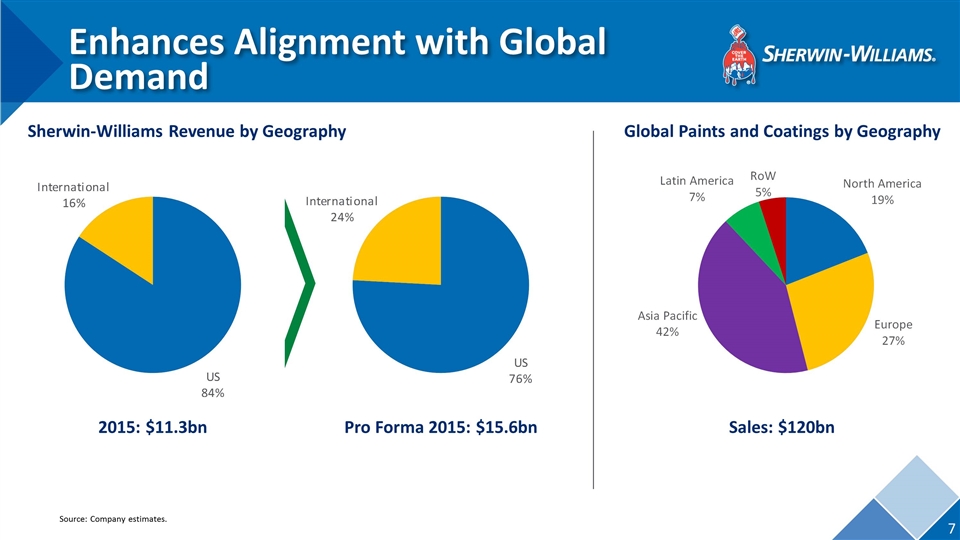
Enhances Alignment with Global Demand 7 Global Paints and Coatings by Geography Sherwin-Williams Revenue by Geography 2015: $11.3bn Pro Forma 2015: $15.6bn Sales: $120bn 2 105 179 192 0 0 255 255 0 0 177 79 33 53 218 112 48 162 255 50 0 222 223 224 0 177 241 255 193 0 Source: Company estimates.
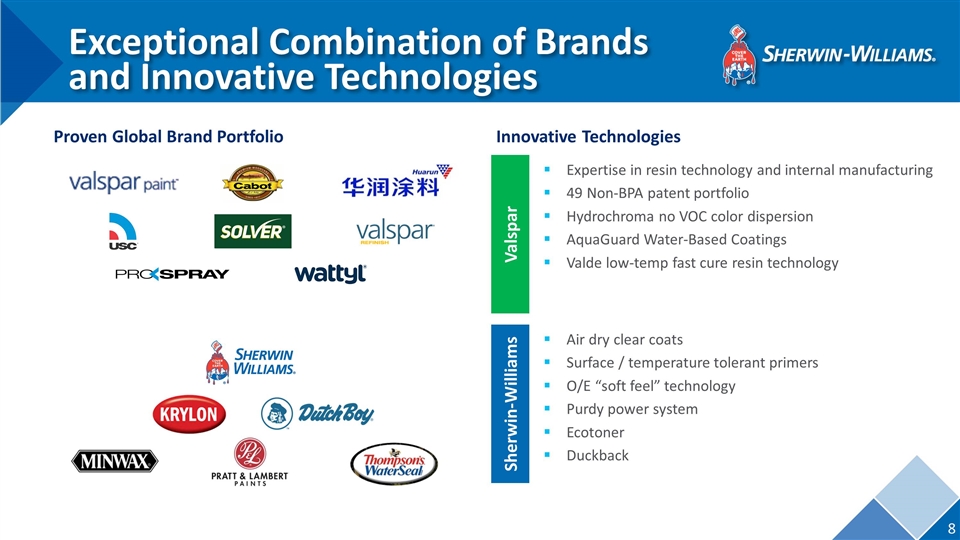
Exceptional Combination of Brands and Innovative Technologies 8 Proven Global Brand Portfolio Innovative Technologies Expertise in resin technology and internal manufacturing 49 Non-BPA patent portfolio Hydrochroma no VOC color dispersion AquaGuard Water-Based Coatings Valde low-temp fast cure resin technology Valspar Air dry clear coats Surface / temperature tolerant primers O/E “soft feel” technology Purdy power system Ecotoner Duckback Sherwin-Williams 2 105 179 192 0 0 255 255 0 0 177 79 33 53 218 112 48 162 255 50 0 222 223 224 0 177 241 255 193 0
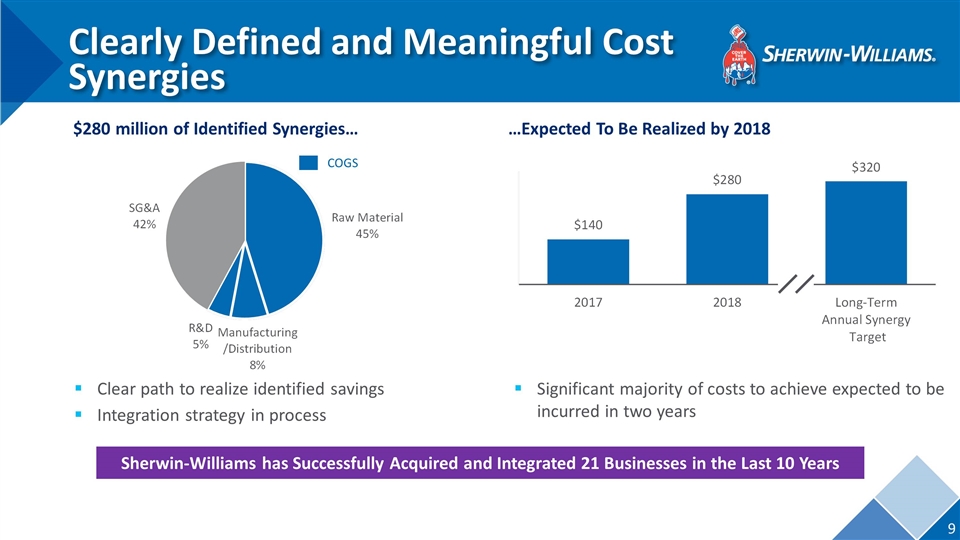
Clearly Defined and Meaningful Cost Synergies 9 $280 million of Identified Synergies… Clear path to realize identified savings Integration strategy in process Significant majority of costs to achieve expected to be incurred in two years …Expected To Be Realized by 2018 Sherwin-Williams has Successfully Acquired and Integrated 21 Businesses in the Last 10 Years 2 105 179 192 0 0 255 255 0 0 177 79 33 53 218 112 48 162 255 50 0 222 223 224 0 177 241 255 193 0 COGS
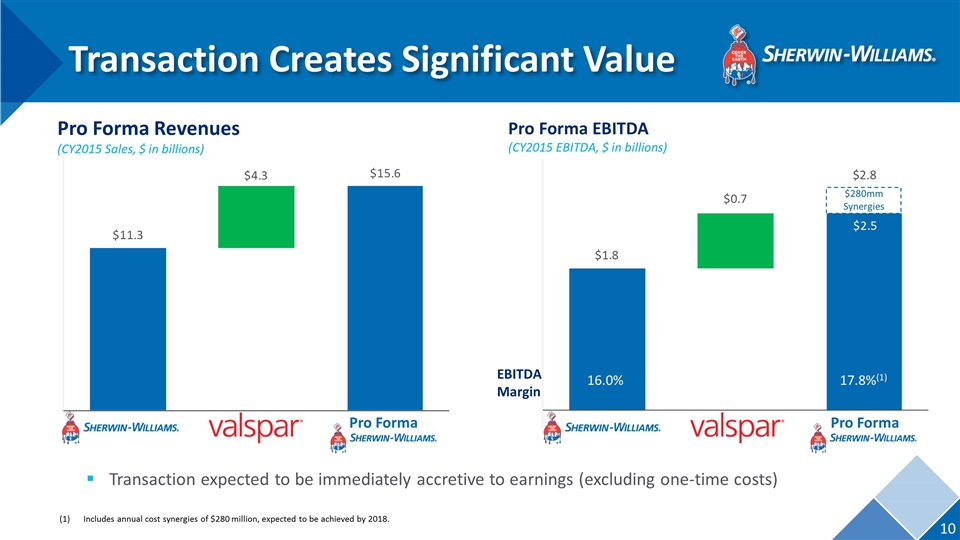
Transaction Creates Significant Value 10 Pro Forma Revenues (CY2015 Sales, $ in billions) Pro Forma EBITDA (CY2015 EBITDA, $ in billions) Transaction expected to be immediately accretive to earnings (excluding one-time costs) Pro Forma 2 105 179 192 0 0 255 255 0 0 177 79 33 53 218 112 48 162 255 50 0 222 223 224 0 177 241 255 193 0 Pro Forma $2.8 $280mm Synergies 17.8%(1) 16.0% EBITDA Margin (1)Includes annual cost synergies of $280 million, expected to be achieved by 2018.
Agenda Introduction 1 2 105 179 192 0 0 255 255 0 0 177 79 33 53 218 112 48 162 255 50 0 222 223 224 0 177 241 255 193 0 2 3 4 Impact on Sherwin-Williams Transaction Overview Summary and Q&A
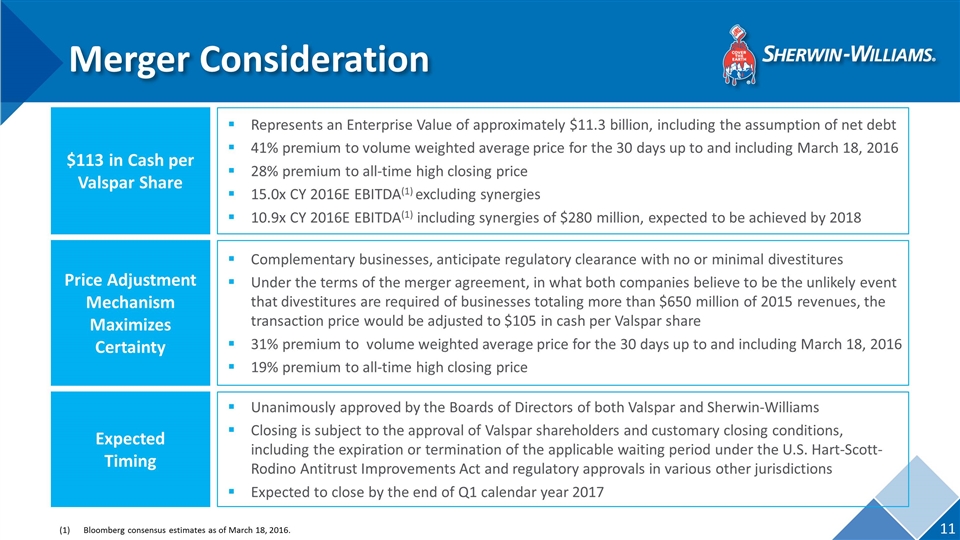
Merger Consideration Represents an Enterprise Value of approximately $11.3 billion, including the assumption of net debt 41% premium to volume weighted average price for the 30 days up to and including March 18, 2016 28% premium to all-time high closing price 15.0x CY 2016E EBITDA(1) excluding synergies 10.9x CY 2016E EBITDA(1) including synergies of $280 million, expected to be achieved by 2018 $113 in Cash per Valspar Share 11 Complementary businesses, anticipate regulatory clearance with no or minimal divestitures Under the terms of the merger agreement, in what both companies believe to be the unlikely event that divestitures are required of businesses totaling more than $650 million of 2015 revenues, the transaction price would be adjusted to $105 in cash per Valspar share 31% premium to volume weighted average price for the 30 days up to and including March 18, 2016 19% premium to all-time high closing price Price Adjustment Mechanism Maximizes Certainty (1)Bloomberg consensus estimates as of March 18, 2016. Unanimously approved by the Boards of Directors of both Valspar and Sherwin-Williams Closing is subject to the approval of Valspar shareholders and customary closing conditions, including the expiration or termination of the applicable waiting period under the U.S. Hart-Scott-Rodino Antitrust Improvements Act and regulatory approvals in various other jurisdictions Expected to close by the end of Q1 calendar year 2017 Expected Timing 2 105 179 192 0 0 255 255 0 0 177 79 33 53 218 112 48 162 255 50 0 222 223 224 0 177 241 255 193 0
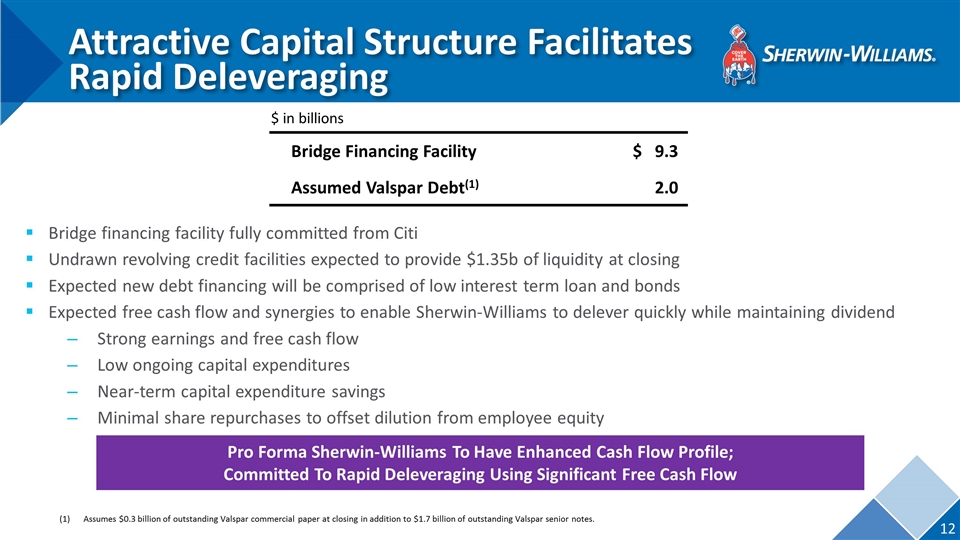
Attractive Capital Structure Facilitates Rapid Deleveraging 12 Bridge Financing Facility $ 9.3 Assumed Valspar Debt(1) 2.0 $ in billions Bridge financing facility fully committed from Citi Undrawn revolving credit facilities expected to provide $1.35b of liquidity at closing Expected new debt financing will be comprised of low interest term loan and bonds Expected free cash flow and synergies to enable Sherwin-Williams to delever quickly while maintaining dividend Strong earnings and free cash flow Low ongoing capital expenditures Near-term capital expenditure savings Minimal share repurchases to offset dilution from employee equity Pro Forma Sherwin-Williams To Have Enhanced Cash Flow Profile; Committed To Rapid Deleveraging Using Significant Free Cash Flow (1)Assumes $0.3 billion of outstanding Valspar commercial paper at closing in addition to $1.7 billion of outstanding Valspar senior notes.
Agenda Transaction Overview and Highlights 1 2 105 179 192 0 0 255 255 0 0 177 79 33 53 218 112 48 162 255 50 0 222 223 224 0 177 241 255 193 0 2 3 4 Impact on Sherwin-Williams Transaction Overview Summary and Q&A
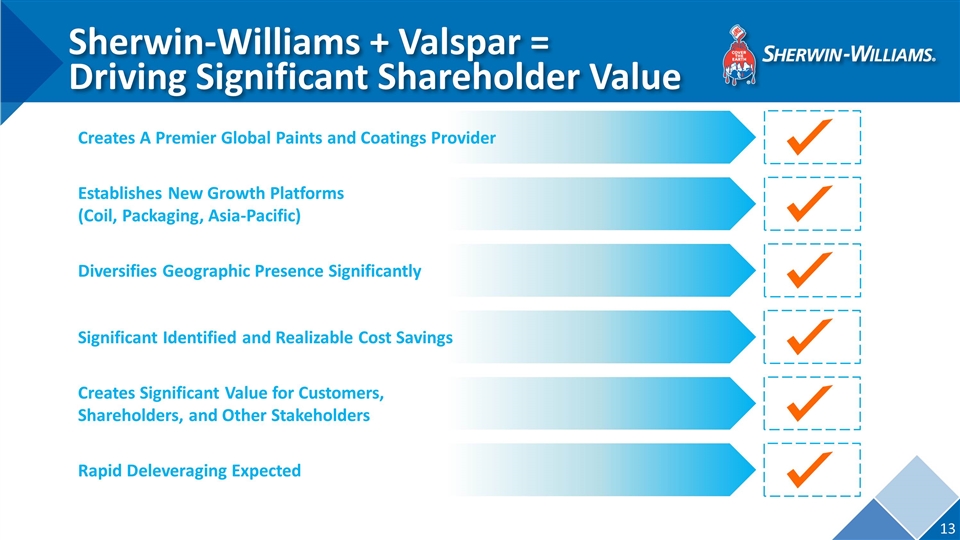
Sherwin-Williams + Valspar = Driving Significant Shareholder Value 13 Creates A Premier Global Paints and Coatings Provider Establishes New Growth Platforms (Coil, Packaging, Asia-Pacific) Significant Identified and Realizable Cost Savings Creates Significant Value for Customers, Shareholders, and Other Stakeholders Rapid Deleveraging Expected Diversifies Geographic Presence Significantly 2 105 179 192 0 0 255 255 0 0 177 79 33 53 218 112 48 162 255 50 0 222 223 224 0 177 241 255 193 0
