Attached files
| file | filename |
|---|---|
| EX-32.1 - EXHIBIT 32.1 - VALSPAR CORP | a10282016_ex32-1.htm |
| EX-31.2 - EXHIBIT 31.2 - VALSPAR CORP | a10282016_ex31-2.htm |
| EX-31.1 - EXHIBIT 31.1 - VALSPAR CORP | a1028201_ex31-1.htm |
| EX-24 - EXHIBIT 24 - VALSPAR CORP | a10282016_ex24.htm |
| EX-23.1 - EXHIBIT 23.1 - VALSPAR CORP | a10282016_ex23-1.htm |
| EX-21.1 - EXHIBIT 21.1 - VALSPAR CORP | a10282016_ex21-1.htm |
| EX-10.24 - EXHIBIT 10.24 - VALSPAR CORP | a10282016_ex10-24.htm |
UNITED STATES SECURITIES AND EXCHANGE COMMISSION | ||
WASHINGTON, D.C. 20549 | ||
FORM 10-K | ||
(Mark One) | |
☒ | ANNUAL REPORT PURSUANT TO SECTION 13 OR 15(d) OF THE SECURITIES EXCHANGE ACT OF 1934 |
For the fiscal year ended October 28, 2016 | |
or | |
☐ | TRANSITION REPORT PURSUANT TO SECTION 13 OR 15(d) OF THE SECURITIES EXCHANGE ACT OF 1934 |
For the transition period from _______________________ to ___________________ | |
Commission File Number 1-3011 | ||
THE VALSPAR CORPORATION | ||||
(Exact name of registrant as specified in its charter) | ||||
Delaware | 36-2443580 | |||
(State of incorporation) | (I.R.S. Employer Identification No.) | |||
1101 South 3rd Street Minneapolis, Minnesota | 55415 | |||
(Address of principal executive offices) | (Zip Code) | |||
(612) 851-7000 | ||||
(Registrant’s telephone number, including area code) | ||||
Securities registered pursuant to Section 12(b) of the Act: | ||||
Title of Each Class | Name of Each Exchange on which Registered | |||
Common Stock, $0.50 Par Value | New York Stock Exchange | |||
Securities registered pursuant to Section 12(g) of the Act: None | ||
Indicate by check mark if the registrant is a well-known seasoned issuer, as defined in Rule 405 of the Securities Act.
☒ Yes ☐No
Indicate by check mark if the registrant is not required to file reports pursuant to Section 13 or Section 15(d) of the Act.
☐ Yes ☒No
Indicate by check mark whether the registrant (1) has filed all reports required to be filed by Section 13 or 15(d) of the Securities Exchange Act of 1934 during the preceding 12 months (or for such shorter period that the registrant was required to file such reports), and (2) has been subject to the filing requirements for the past 90 days.
☒ Yes ☐ No
Indicate by check mark whether the registrant has submitted electronically and posted on its corporate Web site, if any, every Interactive Data File required to be submitted and posted pursuant to Rule 405 of Regulation S-T (§232.405 of this chapter) during the preceding 12 months (or for such shorter period that the registrant was required to submit and post such files).
☒ Yes ☐ No
Indicate by check mark if disclosure of delinquent filers pursuant to Item 405 of Regulation S-K is not contained herein, and will not be contained, to the best of registrant’s knowledge, in definitive proxy or information statements incorporated by reference in Part III of this Form 10-K or any amendment to this Form 10-K. ☒
Indicate by check mark whether the registrant is a large accelerated filer, an accelerated filer, a non-accelerated filer, or a smaller reporting company. See definition of “large accelerated filer,” “accelerated filer” and “smaller reporting company” in Rule 12b-2 of the Exchange Act. (Check one):
Large accelerated filer ☒ | Accelerated filer ☐ | Non-accelerated filer ☐ | Smaller reporting company ☐ |
Indicate by check mark whether the registrant is a shell company (as defined in Rule12b-2 of the Act). ☐Yes ☒ No
The aggregate market value of the voting stock held by persons other than officers, directors and more than 10% stockholders of the registrant as of April 29, 2016 was approximately $8.3 billion based on the closing sales price of $106.69 per share as reported on the New York Stock Exchange. As of December 13, 2016, 79,422,893 shares of Common Stock, $0.50 par value per share (net of 39,019,731 shares in treasury), were outstanding.
DOCUMENTS INCORPORATED IN PART BY REFERENCE
Portions of The Valspar Corporation’s definitive 2017 Proxy Statement (the “Proxy Statement”), to be filed with the Securities and Exchange Commission within 120 days after the end of the fiscal year ended October 28, 2016, are incorporated by reference into Part III to the extent described in this report.
The Valspar Corporation
Form 10-K
Table of Contents
Page | ||
PART I
ITEM 1 BUSINESS
BUSINESS & PRODUCT OVERVIEW
The Valspar Corporation (Valspar, the Company, we, us or our) is a global leader in the paints and coatings industry. We develop, manufacture and distribute a broad range of coatings, paints and related products, and operate our business in two reportable segments: Coatings and Paints. Our consolidated net sales in 2016 were $4,190.6 million. Net sales in the Coatings and Paints segments in 2016 were $2,388.1 million and $1,564.5 million, respectively. By providing high quality products with technologies that add superior value and performance, Valspar’s business has grown organically. Our global growth has also been fueled by the well-executed integration of acquisitions which have further expanded our scale, technology platforms and worldwide portfolio of respected brands.
Valspar is a Delaware corporation founded in 1806. Our principal executive offices are located at 1101 South 3rd Street, Minneapolis, Minnesota 55415, and our telephone number at that address is (612) 851-7000. Our corporate website address is www.valspar.com. The information on our website is not part of this filing.
Our Annual Reports on Form 10-K, Quarterly Reports on Form 10-Q and Current Reports on Form 8-K, and amendments to these reports, are made available free of charge on our website as soon as reasonably practicable after we electronically file such materials with, or furnish such materials to, the Securities and Exchange Commission. You may access these documents on the "Investors" page of our website referred to above.
Coatings Segment
Our Coatings segment includes our industrial product lines and our packaging product line. We offer a broad range of decorative and protective coatings for metal, wood and plastic, primarily for sale to original equipment manufacturing customers in Africa, Asia, Australia, Europe, North America and South America. Products within our Coatings segment include primers, top coats, varnishes, sprays, stains, fillers and other coatings used by customers in a wide range of manufacturing industries, including agricultural and construction equipment, appliances, building products, furniture, metal fabrication, metal packaging and transportation.
Our industrial product lines include general industrial, coil and wood coatings. Our general industrial product line provides customers a single source for powder, liquid and electrodeposition coatings technologies in a wide variety of industries, including agricultural and construction equipment, pipe, lawn and garden, appliance, transportation, and marine shipping containers. Our coil product line produces coatings that are applied to metal coils used to manufacture pre-engineered buildings and building components, other metal building and architectural products and appliances. Our wood product line supplies decorative and protective coatings for wood furniture, building products, cabinets and floors. We also provide color design and technical service to our customers. We supply our industrial products throughout the world.
Our packaging product line includes coatings for the interior and exterior of metal packaging containers, principally metal food containers and beverage cans. We also produce coatings for aerosol and paint cans, crowns for glass bottles, plastic packaging and bottle closures. We believe we are the world’s largest supplier of metal packaging coatings. We supply our packaging products throughout the world via a global manufacturing footprint in many major countries.
Paints Segment
Our Paints segment includes our consumer paints and automotive paint refinish product lines. We offer a wide variety of paints, primers, topcoats and aerosol spray paints through retailers, distribution networks and company-owned stores.
Our consumer paints product line comprises the largest part of our Paints segment. We offer a broad portfolio of interior and exterior decorative paints, stains, primers, varnishes and specialty decorative products, such as enamels, aerosols and faux finishes, used in both the do-it-yourself and professional markets. In the U.S. and Canada, we offer our branded products and private-label brands through more than 10,000 points of sale. The primary distribution channels for these products are home centers, hardware stores, distributors and independent dealers. In China, we sell branded consumer paints primarily through exclusive distribution to both exclusive and non-exclusive brand retailers. In Australia and New Zealand, we sell branded consumer paints through Valspar company-owned stores, big-box retail hardware and independent dealers. In the U.K. and Ireland, we sell branded products primarily through a large home center customer.
We develop highly customized merchandising and marketing support programs for our consumer paint customers, enabling them to differentiate their paint departments from their competitors’ through customer service, paint tinting technology, product and color selection assistance and in-store displays. Our primary brands include VALSPAR and CABOT in the U.S., HUARUN in
1
China, WATTYL, SOLVER, VALSPAR and PASCOL in Australia and New Zealand and VALSPAR and PLASTI-KOTE in the U.K. and Ireland.
Our automotive product line primarily includes refinish paints and body shop accessories sold through automotive refinish distributors, automotive supply retailers and body shops. We distribute these products under the DE BEER, MATRIX, VALSPAR, USC, PRO-SPRAY, OCTORAL and HOUSE OF KOLOR brands in many countries around the world.
Other and Administrative
In addition to the main product lines within our Coatings and Paints segments, we manufacture and sell specialty resins and colorants. The specialty resins and colorants are manufactured for internal use and for external sale to other coatings manufacturers. We also sell furniture protection plans and furniture care and repair products under the GUARDSMAN brand.
Proposed Merger with The Sherwin-Williams Company
On March 19, 2016, Valspar entered into an Agreement and Plan of Merger (the Merger Agreement) with The Sherwin-Williams Company (Sherwin-Williams) and Viking Merger Sub, Inc., a wholly-owned subsidiary of Sherwin-Williams (Merger Sub).
The Merger Agreement provides that, among other things and subject to the terms and conditions of the Merger Agreement, (1) Merger Sub will be merged with and into Valspar (the Merger), with Valspar surviving the Merger as a wholly-owned subsidiary of Sherwin-Williams, and (2) at the effective time of the Merger, each outstanding share of common stock of Valspar, par value $0.50 per share (Valspar common stock) (other than Valspar common stock held in treasury by Valspar, owned by a subsidiary of Valspar or owned by Sherwin-Williams or any of its wholly-owned subsidiaries, or shares with respect to which appraisal rights have been validly exercised and not lost in accordance with Delaware law) will be converted into the right to receive the Merger Consideration.
The Merger Consideration means $113.00 per share in cash, except that if Sherwin-Williams is required, in order to obtain the necessary antitrust approvals, to commit to any divestiture, license, hold separate, sale or other disposition of or with respect to assets, businesses or product lines of Valspar, Sherwin-Williams or their subsidiaries representing, in the aggregate, in excess of $650 million of Net Sales (as defined in the Merger Agreement), then the Merger Consideration will be $105.00 per share in cash.
The Merger Agreement contains certain termination rights, and we may be required to pay Sherwin-Williams a termination fee of $300 million.
For further information on the Merger Agreement, refer to the Merger Agreement, a copy of which was filed as Exhibit 2.1 to our Current Report on Form 8-K filed with the Securities and Exchange Commission on March 21, 2016, and which is incorporated by reference herein.
On June 29, 2016, Valspar stockholders voted to adopt the Merger Agreement at a special meeting of stockholders held for that purpose. Completion of the Merger remains subject to certain closing conditions, including the expiration or termination of the applicable waiting period under the U.S. Hart-Scott-Rodino Antitrust Improvements Act and the receipt of regulatory approvals in certain other jurisdictions.
COMPETITION
All aspects of the coatings and paints business are highly competitive. Some of our competitors are larger and have greater financial resources than we have.
Competition in our Coatings segment is based on formulating products for specific customer applications, meeting customer delivery and application requirements, new technology offerings and pricing. As one of the world's largest industrial coatings manufacturers, we can provide coatings solutions globally and are committed to developing new technologies.
Competition in our Paints segment is based on factors such as consumer brand recognition, product quality, distribution and price. In this segment, we support our brand awareness through advertising and highly customized merchandising and marketing support programs provided to our customers.
RAW MATERIALS
We obtain raw materials from a number of suppliers. The raw materials are derived from petrochemicals, minerals and metals. Our most significant raw materials include solvents, titanium dioxide and epoxy and other resins. Historically, these materials have been generally available on the open market, with pricing and availability subject to fluctuation. Most of the raw materials used in production are purchased from outside sources. We have made, and plan to continue to make, supply arrangements to meet our current and future usage requirements. We manage sourcing of critical raw materials by establishing contracts, buying from multiple sources and identifying alternative or lower cost materials or technology, when possible. We have active initiatives to
2
find lower cost materials, reformulate products with lower cost and more environmentally friendly raw materials and qualify multiple and local sources of supply, including suppliers from Asia and other lower cost regions of the world.
INTELLECTUAL PROPERTY
Our practice is to seek patent protection for our products and manufacturing processes when appropriate. We also license some patented technology from third parties. Nevertheless, our business is not materially dependent upon licenses or similar rights or on any single patent or group of related patents. Although we believe our patent rights are valuable, our knowledge and trade secret information regarding our manufacturing processes and materials have also been important in maintaining our competitive position. We require certain employees to sign confidentiality agreements relating to proprietary information.
While we make efforts to protect our trade secret information, others may independently develop or otherwise acquire substantially equivalent proprietary information or techniques or inappropriately gain access to our proprietary technology or disclose this technology. Any of these factors could adversely impact the value of our proprietary trade secret information and harm our business.
SEASONALITY AND WORKING CAPITAL ITEMS
Our sales volume is traditionally lowest during the first quarter of the fiscal year (November, December and January), and highest in the third quarter of the fiscal year (May, June and July), primarily due to weather and the buying cycle in our Coatings and Paints segments. When sales are lowest, we build inventory, financed by internally generated funds and short-term debt facilities discussed in Note 9 of Notes to Consolidated Financial Statements.
SIGNIFICANT CUSTOMERS
In 2016, our sales to Lowe’s Companies, Inc. (Lowe's) exceeded 10% of consolidated net sales. Our ten largest customers accounted for approximately 31% of consolidated net sales. Our five largest customers in the Paints segment accounted for approximately 47% of our net sales in the segment. Our five largest customers in the Coatings segment accounted for approximately 19% of our net sales in the segment.
BACKLOG AND GOVERNMENT CONTRACTS
We have no significant backlog of orders and generally are able to fill orders on a current basis. No material portion of our business is subject to renegotiation of profits or termination of contracts or subcontracts at the election of the government.
RESEARCH AND DEVELOPMENT
Valspar’s technology innovation has enabled strong new product launches and a robust pipeline of coatings solutions that provide our customers with differentiated, competitively advantaged performance and are cost effective. The base technologies that support our products’ performance and applications have been developed and optimized over many years. Ongoing research and development efforts are focused on delivering the highest value, quality and performance for color and aesthetics, application productivity, in-service durability and environmental footprint and safety.
Valspar maintains a consistently strong investment in research and development, with approximately 1,100 technologists in a worldwide laboratory network, anchored by innovation centers in Minneapolis, MN and Guangzhou, China. Fiscal year 2016 investment was $139.3 million, or 3.3% of net sales, compared to $133.4 million or 3.0% for fiscal 2015 and $136.4 million or 2.9% in fiscal 2014.
ENVIRONMENTAL COMPLIANCE
We undertake to comply with applicable environmental regulations. Capital expenditures for this purpose were not material in fiscal 2016, and we do not expect such expenditures will be material in fiscal 2017.
EMPLOYEES
We employ approximately 11,100 people globally, approximately 360 of whom are subject to collective bargaining agreements in the U.S. We believe our relationship with our union employees is good.
FOREIGN OPERATIONS, EXPORT SALES AND BUSINESS SEGMENT INFORMATION
Our foreign operations are conducted primarily through majority-owned subsidiaries and, to a limited extent, through joint ventures. Revenues from foreign subsidiaries and operations comprised approximately 45% of our total consolidated net sales in 2016.
3
In addition to our manufacturing plants in the U.S., we have manufacturing plants in Australia, Brazil, Canada, China, Finland, France, Germany, India, Ireland, Italy, Malaysia, Mexico, The Netherlands, New Zealand, Poland, Singapore, South Africa, Switzerland, the United Kingdom and Vietnam. We also have joint ventures in Japan, South Africa, Switzerland and Vietnam and sales offices in other countries.
During fiscal 2016, export sales from the U.S. represented 3.4% of our net sales.
For additional financial information regarding our international operations and geographical areas, and our reportable business segments, see Note 15 in Notes to Consolidated Financial Statements.
ITEM 1A RISK FACTORS
You should consider the following risk factors, in addition to the other information presented or incorporated by reference into this Annual Report on Form 10-K, in evaluating our business and any investment in us.
The proposed Merger may not be completed on a timely basis, or at all, and the failure to complete or delays in completing the Merger could adversely affect our business, financial results and stock price.
We can provide no assurance that the Merger will be consummated or consummated in the timeframe or manner currently anticipated. The Merger is subject to a number of conditions including the receipt of regulatory approvals, which are not within our control. There can be no assurance as to when, or if, the conditions to closing of the Merger will be satisfied or waived or that other events will not intervene to delay or result in the termination of the Merger.
Any delay in closing or a failure to close could have a negative impact on our business, financial results and stock price as well as our relationships with our customers, suppliers or employees, and a negative impact on our ability to pursue alternative strategic transactions and/or our ability to implement alternative business plans. If the Merger Agreement is terminated, we may be required to pay a termination fee of $300 million.
Our business and financial results could be adversely impacted during the pendency of the Merger.
The Merger may cause disruptions to our business or business relationships and create uncertainty surrounding our ongoing business operations, which could have an adverse impact on our financial condition, results of operations and cash flows, regardless of whether the Merger is completed, including as a result of the following (all of which could be exacerbated by a delay in completion of the Merger):
• | customers, suppliers or other parties with which we maintain business relationships may experience uncertainty prior to the closing of the Merger and seek alternative relationships with third parties or seek to terminate or re-negotiate their relationships with us; |
• | our employees may experience uncertainty about their future roles with us, which might adversely affect our ability to hire, retain and motivate key personnel and other employees; |
• | the Merger Agreement restricts us from engaging in certain actions without the consent of Sherwin-Williams, which could prevent us from pursuing opportunities that may arise prior to the consummation of the Merger; and |
• | the attention of our management may be directed to transaction-related considerations and may be diverted from the day-to-day operations of our business. |
In addition, we have incurred, and will continue to incur, significant costs, expenses, and fees for professional services and other transaction costs in connection with the Merger, and many of these fees and costs are payable by us regardless of whether or not the Merger is consummated.
Regulatory authorities may require divestitures in connection with the proposed Merger, which could result in Valspar stockholders receiving $105 per share instead of $113 per share as consideration in connection with completion of the Merger.
Following completion of the Merger, Valspar stockholders will receive as merger consideration $113 per share in cash, except that the merger consideration will be $105 per share in cash if Sherwin-Williams is required, in order to obtain the necessary regulatory approvals, to commit to any divestiture, license, hold separate, sale or other disposition of or with respect to assets, businesses or product lines of Valspar, Sherwin-Williams or their subsidiaries representing, in the aggregate, in excess of $650 million of net sales (as defined in the Merger Agreement). There can be no assurance as to whether regulatory authorities will not require such divestitures and accordingly there can be no assurance that Valspar stockholders will receive $113 per share in cash instead of $105 per share in cash.
4
Deterioration of economic conditions could harm our business.
Our business may be adversely affected by changes in national or global economic conditions, including inflation, interest rates, access to and the functioning of capital markets, consumer spending rates, energy availability and costs (including fuel surcharges) and the effects of governmental initiatives to manage economic conditions. Deterioration of national or global economic conditions may reduce demand for our products and overall growth of the paints and coatings industry.
Volatility in financial markets and the deterioration of national or global economic conditions could impact our operations as follows:
• | the financial stability of our customers and suppliers may be compromised, which could result in additional bad debts for us or non-performance by suppliers; |
• | it may become more costly or difficult to obtain financing to fund operations or investment opportunities, or to refinance our debt in the future; and |
• | the value of our investments in debt and equity securities may decline, including our assets held in pension plans. |
At various times, we utilize hedges and other derivative financial instruments to reduce our exposure to various interest rate risks, which qualify for hedge accounting for financial reporting purposes. Volatile fluctuations in market conditions could cause these instruments to become ineffective, which could require any gains or losses associated with these instruments to be reported in our earnings each period.
We have goodwill and intangible assets recorded on our balance sheet. We periodically evaluate the recoverability of the carrying value of our goodwill and intangible assets whenever events or changes in circumstances indicate that such value may not be recoverable. Impairment assessment involves judgment as to assumptions regarding future sales and cash flows and the impact of market conditions on those assumptions. Future events and changing market conditions may impact our assumptions and may result in changes in our estimates of future sales and cash flows that may result in us incurring substantial impairment charges, which would adversely affect our results of operations or financial condition.
Fluctuations in the availability and prices of raw materials could negatively impact our financial results.
We purchase the raw materials needed to manufacture our products from a number of suppliers. Most of our raw materials are derived from petroleum, minerals and metals. Under normal market conditions, these materials are generally available from one or more suppliers on the open market. From time to time, however, the availability and costs of raw materials may fluctuate significantly, which could impair our ability to procure necessary materials, or increase the cost of manufacturing our products. As a result, our raw material costs can be volatile, and we have experienced disruptions in supplies of certain raw materials at various times. These disruptions could affect our ability to manufacture products ordered by our customers, which could negatively impact sales.
When raw material costs increase, our profit margins are reduced unless and until we are able to pass along the increases to our customers through higher prices. If raw material costs increase and if we are unable to pass along, or are delayed in passing along, those increases to our customers, we will experience profit margin reductions.
Many of our customers are in cyclical industries, which may affect the demand for our products.
Many of our customers are in businesses or industries that are cyclical and sensitive to changes in general economic conditions. As a result, the demand for our products depends, in part, upon economic cycles affecting our customers' businesses or industries and general economic conditions. Downward economic cycles affecting the industries of our customers and the deterioration of global economic conditions may reduce our sales and profitability.
The industries in which we operate are highly competitive, and some of our competitors are larger than we are and may have greater financial resources than we do.
All aspects of the paints and coatings business are highly competitive. We face strong competitors in all areas of our business. Any increase in competition may cause us to lose market share or compel us to reduce prices to remain competitive, which could result in reduced margins for our products. Competitive pressures may not only impair our margins but may also impact our revenues and our growth. Many of our competitors are larger than we are and may have greater financial resources than we do. Competition with these companies could curtail price increases or require price reductions or increased spending on marketing, sales and research and development, any of which could adversely affect our results of operations.
5
Our larger competitors may have more resources to finance acquisitions or internal growth in this competitive environment, and may have more resources or capabilities to conduct business with large suppliers or large customers in our industry. Finally, many of our larger competitors operate businesses in addition to paints and coatings and so may be better able to compete during coatings industry downturns.
We have a significant amount of debt.
Our total long-term and short-term debt was $1,778.4 million at October 28, 2016. Our debt categorized as short-term was $221.4 million at October 28, 2016. Our level of debt may have important consequences. For example, it:
• | may require us to dedicate a material portion of our cash flows from operations to make payments on our indebtedness, thereby reducing our ability to fund working capital, capital expenditures or other general corporate purposes; |
• | could make us less attractive to prospective or existing customers or less able to fund potential acquisitions; and |
• | may limit our flexibility to adjust to changing business and market conditions and make us more vulnerable to a downturn in general economic conditions as compared to a competitor that may have less indebtedness. |
Global economic and capital market conditions may cause our access to capital to be more difficult in the future and/or costs to secure such capital more expensive.
We may need new or additional financing in the future to provide liquidity to conduct our operations, expand our business or refinance existing indebtedness. Any sustained weakness in general economic conditions and/or U.S. or global capital markets could adversely affect our ability to raise capital on favorable terms or at all. From time to time we have relied, and we may also rely in the future, on access to financial markets as a source of liquidity for working capital requirements, acquisitions and general corporate purposes. Longer term volatility and continued disruptions in the capital and credit markets as a result of uncertainty, changing or increased regulation of financial institutions, reduced alternatives or failures of significant financial institutions could adversely affect our access to the liquidity needed for our businesses in the longer term. Such disruptions could require us to take measures to conserve cash until the markets stabilize or until alternative credit arrangements or other funding for our business needs can be arranged.
Acquisitions are an important part of our growth strategy, and future acquisitions may not be available or successful.
Acquisitions have historically contributed significantly to the growth of our company. As part of our growth strategy, we intend to continue to pursue acquisitions of complementary businesses and products. If we are not able to identify and complete future acquisitions, our growth may be negatively affected. Even if we are successful in completing future acquisitions, we may experience:
• | difficulties in assimilating acquired companies and products into our existing business; |
• | delays in realizing the benefits from the acquired companies or products; |
• | difficulties due to lack of or limited prior experience in any new markets we may enter; |
• | unforeseen claims and liabilities, including unexpected environmental exposures or product liability; |
• | unforeseen adjustments, charges and write-offs; |
• | unexpected losses of customers of, or suppliers to, acquired businesses; |
• | difficulties in conforming the acquired business’ standards, processes, procedures and controls with our operations; |
• | variability in financial information arising from the application of purchase price accounting; |
• | difficulties in retaining key employees of the acquired businesses; and |
• | challenges arising from the increased geographic diversity and complexity of our operations. |
Any of these factors may make it more difficult to repay our debt or have an adverse effect on results of operations. In addition, an acquisition could materially impair our operating results by causing us to incur debt or requiring us to amortize acquisition-related costs or the cost of acquired assets.
6
We derive a substantial portion of our revenues from foreign markets, which subjects us to additional business risks.
We conduct a substantial portion of our business outside of the U.S. We currently have production facilities, research and development facilities and administrative and sales offices located outside the U.S., including facilities and offices located in Australia, Brazil, Canada, China, Finland, France, Germany, Greece, India, Indonesia, Ireland, Italy, Japan, Malaysia, Mexico, The Netherlands, New Zealand, Poland, Russia, Singapore, South Africa, South Korea, Spain, Switzerland, the United Arab Emirates, the United Kingdom and Vietnam. In 2016, revenues from products sold outside the U.S. accounted for approximately 45% of our consolidated net sales. Accordingly, the majority of our cash and cash equivalents are held by our foreign subsidiaries.
We expect sales in international markets to represent a significant portion of our consolidated net sales. Notwithstanding the benefits of geographic diversification, our ability to achieve and maintain profitable growth in international markets is subject to risks related to the differing legal, political, social and regulatory requirements and economic conditions of many jurisdictions. Risks inherent in international operations include the following:
• | agreements may be difficult to enforce, and receivables may be difficult to collect or have longer payment cycles; |
• | foreign countries may impose additional withholding taxes or otherwise tax our foreign income or adopt other restrictions on foreign trade or investment, including currency exchange controls; |
• | foreign operations may experience labor disputes and difficulties in attracting and retaining key employees; |
• | transportation and other shipping costs may increase; |
• | foreign governments may nationalize private enterprises; |
• | unexpected adverse changes may occur in export duties, quotas and tariffs and difficulties in obtaining export licenses; |
• | intellectual property rights may be more difficult to enforce; |
• | our business and profitability in a particular country could be affected by political or economic changes or terrorist activities and responses to such activities; |
• | unexpected adverse changes in foreign laws or regulatory requirements may occur; and |
• | compliance with a variety of foreign laws and regulations may be burdensome. |
Fluctuations in foreign currency exchange rates could affect our financial results.
We conduct business in various regions throughout the world and are subject to market risk due to changes in the exchange rate of foreign currencies in relation to our reporting currency, the U.S. dollar. The functional currencies of our foreign operations are generally the local currency in the corresponding country. Because our consolidated financial statements are presented in U.S. dollars, we translate revenues and expenses into U.S. dollars at the average exchange rate during each reporting period, as well as assets and liabilities into U.S. dollars at exchange rates in effect at the end of each reporting period. Therefore, increases or decreases in the value of the U.S. dollar against other major currencies will affect our net revenues, operating income and the value of balance sheet items denominated in foreign currencies. We have not used derivative financial instruments to hedge our exposure to translation gains and losses. Fluctuations in foreign currency exchange rates, particularly the strengthening of the U.S. dollar against major currencies, could materially affect our financial results. At October 28, 2016, the regions where we have the largest exposure to our net sales, net income and financial position were China (CNY), Europe (EUR), Mexico (MXN), the UK (GBP), Australia (AUD), Brazil (BRL) and Canada (CAD).
We have certain key customers, and the loss of key customers could negatively affect our business.
Our relationships with certain key customers are important to us. From 2014 through 2016, sales to our largest customer exceeded 10% of our consolidated net sales. In 2016, our ten largest customers accounted for approximately 31% of our consolidated net sales. Our five largest customers in the Paints segment accounted for approximately 47% of our net sales in the segment. Our five largest customers in the Coatings segment accounted for approximately 19% of our net sales in the segment. Although we sell various types of products through various channels of distribution, we believe that the loss of a substantial portion of net sales to our largest customers could have a material adverse effect on us.
We have not typically entered into long-term contracts with our major customers for minimum purchase requirements. If any one of our key customers cease making purchases at historical levels, with little or no notice, we could experience a material adverse effect.
7
Our ability to innovate, develop, produce and market products that meet the demands of our customers could have a negative impact on our results of operations and financial condition.
Our business relies on continued global demand for our brands and products. To achieve business goals, we must develop and sell products that appeal to customers. This is dependent on a number of factors, including our ability to produce products that meet the quality, volume demands, performance and price expectations of our customers. Future growth will depend on our ability to continue to innovate our existing products and to develop and introduce new products that adapt to our customers' specific preferences. If we fail to keep pace with product innovation on a competitive basis or to predict market demands for our products, our business, financial condition and results of operations could be adversely affected.
In addition, our customers’ or consumers’ perceptions about the acceptability or potential environmental or health effects of certain substances could require us to invest additional amounts to develop products that exclude those substances. If we are unable to develop products that exclude those substances when and if required by our customers, we may experience reduced sales and profitability.
Supply disruptions, temporary plant and/or power outages, work stoppages, natural disasters and severe weather events could increase the cost of doing business or otherwise harm our operations, our customers and our suppliers. It is not always possible for us to predict the occurrence or consequence of any such events. However, such events could reduce demand for our products or make it difficult or impossible for us to receive raw materials from suppliers or to deliver products to customers.
If the reputation of our company or one or more of its key brands is damaged, it could harm our business.
Our reputation is one of the foundations of our relationships with key customers and other stakeholders. If we are unable to effectively manage real or perceived issues that negatively affect our reputation, our ability to conduct our business could be impaired, and our financial results could suffer. As we continue to invest in advertising and promotion for our key brands, our financial success is becoming more dependent on the success of our brands. The success of these brands could suffer if our marketing plans or product initiatives do not have the desired effect on a brand’s image, reputation or ability to attract customers. Further, our growth and results could be harmed if the reputation of our company or a key brand is damaged due to real or perceived quality issues, product recalls, regulatory enforcement or actions or customer claims and litigation.
Technology changes, and our ability to protect our technology, could affect our business.
Our product and application technology is supported by underlying chemistry that has been developed over many years. Ongoing research and development efforts focus on improving our internally developed and acquired technology and formulating changes to improve the performance, profitability and cost competitiveness of our products. If our competitors develop new technology, or if our customers’ technology requirements change, and we are not able to develop competitive technology, our business and financial results could suffer. Further, although we seek to protect our proprietary technology and information through confidentiality and trade secret protection programs and practices, patents, cybersecurity measures and other means, if we were unable to protect our material proprietary technology or information, our business and financial results could suffer.
Interruption, failure or compromise of our information systems could adversely affect our business.
We rely on information systems to run most aspects of our business, including sales and distribution of products, purchases of raw materials and supplies, accounting for purchase and sale transactions, manufacturing processes, billing and collections and managing data and records for employees and other parties. Our business may be adversely affected if these systems are interrupted, damaged or compromised or if they fail for any extended period of time due to user errors, programming errors, computer viruses, security breaches or other problems. Information security risks have generally increased in recent years because of the proliferation of new technologies and the increased sophistication and activities of cyber attackers. Although we strive to have appropriate security controls in place, prevention of security breaches cannot be assured, particularly as cyber threats continue to evolve. We may be required to expend additional resources to continue to enhance our security measures or to investigate and remediate any security vulnerabilities. In addition, third-party service providers manage a portion of our information systems, and we are subject to risk as a result of interruption, failure or security breaches of those systems. The consequences of these risks could adversely impact our results of operations and cash flows.
Numerous laws and regulations affect our business, and new laws or regulations, adverse decisions relating to our compliance with existing laws and regulations, or changes to these laws and regulations, could have a negative effect on our financial condition and results of operations.
We are subject to a wide variety of complex domestic and foreign laws and regulations, and legal compliance risks, including securities laws, tax laws, employment and pension-related laws, competition laws, U.S. and foreign export and trading laws and laws governing improper business practices. We are affected by new laws and regulations, and changes to existing laws and
8
regulations, including interpretations by courts and regulators. From time to time, our Company, our operations and the industries in which we operate are being reviewed or investigated by regulators, which could lead to enforcement actions or the assertion of private litigation claims and damages.
We are subject to tax laws and regulations in the United States and multiple foreign jurisdictions. We are affected by changes in tax laws and regulations, as well as changes in related interpretations and other tax guidance. In the ordinary course of our business, we are subject to examinations and investigations by various tax authorities. In addition to existing examinations and investigations, there could be additional examinations and investigations in the future, and existing examinations and investigations could be expanded.
We are subject to numerous laws and regulations that control the manufacturing, marketing, sale, use and disposal of our products. These laws and regulations include health, safety, product liability, environmental and labeling requirements applicable to our products and business.
Environmental laws and regulations control, among other things, the discharge of pollutants into the air and water, the handling, use, treatment, storage and clean-up of hazardous and non-hazardous wastes, the investigation and remediation of soil and groundwater affected by hazardous substances, or otherwise relating to environmental protection and various health and safety matters. These environmental laws and regulations impose strict, retroactive and joint and several liability for the costs of, and damages resulting from, cleaning up current sites, past spills, disposals and other releases of hazardous substances. Violations of these laws and regulations can also result in fines and penalties. We are currently undertaking remedial activities at a number of our facilities and properties and have received notices under the Comprehensive Environmental Response, Compensation and Liability Act, or CERCLA, or analogous state laws, of liability or potential liability in connection with the disposal of material from our operations or former operations. Pursuant to health, safety, product liability and labeling laws and regulations, we have also been subject to various governmental enforcement actions and litigation by individuals relating to the sale or use of or exposure to our products or materials used or contained in our products, including claims for property damage or personal injury claimed to have been caused by our products or materials used or contained in our products.
We are subject to the risk that adverse decisions relating to our compliance with existing laws and regulations and new laws or regulations, or changes in existing laws or regulations or their interpretation could limit our ability to generate revenues, increase our compliance costs and expand our potential liability for enforcement actions by governmental authorities and litigation by individuals.
ITEM 1B UNRESOLVED STAFF COMMENTS
Not applicable.
ITEM 2 PROPERTIES
Our principal offices are located in Minneapolis, Minnesota. Our North American manufacturing operations are conducted at 25 locations (21 owned; 4 leased) in the U.S., Canada and Mexico. The total combined square footage for our principal offices and manufacturing operations in North America is approximately 4,590,000. Asia Pacific manufacturing operations are conducted at 13 locations (11 owned; 2 leased) in Australia, China, Malaysia, New Zealand, Singapore and Vietnam, with a total combined square footage of approximately 2,310,000. European manufacturing operations are conducted at 15 locations (12 owned; 3 leased) in Finland, France, Germany, Ireland, Italy, The Netherlands, Poland, Switzerland and the United Kingdom, with a total combined square footage of approximately 1,702,000. In South America, we own two manufacturing facilities in Brazil with square footage of approximately 471,000. In India, we own one manufacturing facility with square footage of approximately 113,000. In South Africa, we own one manufacturing facility with square footage of approximately 89,000.
9
Shown below is a breakdown of the approximate square footage of principal facilities by region as of October 28, 2016:
Region | Approximate Square Footage Owned | Approximate Square Footage Leased | Total | |||
North America | 3,828,000 | 762,000 | 4,590,000 | |||
Asia Pacific | 2,235,000 | 75,000 | 2,310,000 | |||
Europe | 1,538,000 | 164,000 | 1,702,000 | |||
Other | 673,000 | — | 673,000 | |||
Total | 8,274,000 | 1,001,000 | 9,275,000 | |||
Set forth below is a breakdown of the approximate square footage of principal facilities by business segment:
Business Segment | Approximate Square Footage | |
Coatings | 5,384,000 | |
Paints | 3,114,000 | |
Other and Administrative | 777,000 | |
Total | 9,275,000 | |
We believe our properties are well maintained, in good operating condition and adequate for the purposes for which they are being used. Operating capacity of our manufacturing properties varies by product line, but additional production capacity is available for most product lines by increasing the number of days and/or shifts worked.
ITEM 3 LEGAL PROCEEDINGS
Environmental Matters
We are involved in various claims relating to environmental matters at a number of current and former plant sites and waste management sites. We engage or participate in remedial and other environmental compliance activities at certain of these sites. At other sites, we have been named as a potentially responsible party (PRP) under federal and state environmental laws for site remediation. We analyze each individual site, considering the number of parties involved, the level of our potential liability or contribution relative to the other parties, the nature and magnitude of the hazardous wastes involved, the method and extent of remediation, the potential insurance coverage, the estimated legal and consulting expense with respect to each site and the time period over which any costs would likely be incurred. Based on the above analysis, we estimate the clean-up costs and related claims for each site. The estimates are based in part on discussion with other PRPs, governmental agencies and engineering firms.
We accrue appropriate reserves for potential environmental liabilities when the amount of the costs that will be incurred can be reasonably determined. Accruals are reviewed and adjusted as additional information becomes available. While uncertainties exist with respect to the amounts and timing of our ultimate environmental liabilities, we believe it is neither probable nor reasonably possible that such liabilities, individually or in the aggregate, will have a material adverse effect on our financial condition, results of operations or cash flows.
Other Legal Matters
We are involved in a variety of legal claims and proceedings relating to personal injury, product liability, warranties, customer contracts, employment, trade practices, environmental and other legal matters that arise in the normal course of business. These claims and proceedings include cases where we are one of a number of defendants in proceedings alleging that the plaintiffs suffered injuries or contracted diseases from exposure to chemicals or other ingredients used in the production of some of our products or waste disposal. We are also subject to claims related to the performance of our products. We believe these claims and proceedings are in the ordinary course for a business of the type and size in which we are engaged. While we are unable to predict the ultimate outcome of these claims and proceedings, we believe it is neither probable nor reasonably possible that the costs and liabilities of such matters, individually or in the aggregate, will have a material adverse effect on our financial condition, results of operations or cash flows.
ITEM 4 MINE SAFETY DISCLOSURES
Not applicable.
10
PART II
ITEM 5 | MARKET FOR REGISTRANT’S COMMON EQUITY, RELATED STOCKHOLDER MATTERS AND ISSUER PURCHASES OF EQUITY SECURITIES |
Our common stock is listed on the New York Stock Exchange under the trading symbol VAL. The table below sets forth the quarterly high and low market prices of our common stock for fiscal years 2016 and 2015 as quoted on the New York Stock Exchange.
Market Price (high/low) | |||
For the Fiscal Year | 2016 | 2015 | |
First Quarter | $85.27 - 71.99 | $88.36 - 80.97 | |
Second Quarter | $107.05 - 74.20 | $90.91 - 81.04 | |
Third Quarter | $108.64 - 105.90 | $88.17 - 78.66 | |
Fourth Quarter | $107.40 - 97.62 | $84.05 - 70.58 | |
The quarterly dividend declared November 17, 2016, to be paid on December 15, 2016 to common stockholders of record December 1, 2016, was increased to $0.37 per share. The table below sets forth the quarterly dividends paid for fiscal years 2016 and 2015.
Per Share Dividends | |||||||
For the Fiscal Year | 2016 | 2015 | |||||
First Quarter | $ | 0.33 | $ | 0.30 | |||
Second Quarter | $ | 0.33 | $ | 0.30 | |||
Third Quarter | $ | 0.33 | $ | 0.30 | |||
Fourth Quarter | $ | 0.33 | $ | 0.30 | |||
$ | 1.32 | $ | 1.20 | ||||
The number of record holders of our common stock at December 13, 2016 was 1,101.
ISSUER PURCHASES OF EQUITY SECURITIES
Period | Total Number of Shares Purchased1 | Average Price Paid per Share | Total Number of Shares Purchased as Part of Publicly Announced Plans or Programs1 | Maximum Amount that May Yet be Purchased Under the Plans or Programs1 | |||||||
Repurchase program: | |||||||||||
7/30/16 - 8/26/16 | 0 | N/A | 0 | $ | 1,175,630 | ||||||
8/27/16 - 9/22/16 | 0 | N/A | 0 | $ | 1,175,630 | ||||||
9/23/16 - 10/28/16 | 0 | N/A | 0 | $ | 1,175,630 | ||||||
Other transactions2 | 1,020 | $ | 105.75 | ||||||||
1On November 21, 2014, the Board approved a share repurchase program, with no expiration date, authorizing us to purchase up to $1.5 billion of outstanding shares of our common stock. We repurchased a total of 221,060 shares in fiscal 2016.
2Our other transactions include our acquisition of our common stock in satisfaction of tax-payment obligations upon vesting of restricted stock.
STOCK PERFORMANCE GRAPH
The following graph compares our cumulative total stockholder return for the last five fiscal years with the cumulative total return of the Standard & Poor’s 500 Stock Index and a peer group of companies selected by us on a line-of-business basis. The graph assumes the investment of $100 in our common stock, the S&P 500 Index and the peer group at the end of fiscal 2011 and the reinvestment of all dividends.
11
The companies selected to form the peer group index are: Akzo Nobel N.V.; Ferro Corporation; H.B. Fuller Company; Masco Corporation; Newell Rubbermaid Inc.; PPG Industries, Inc.; RPM International Inc.; and The Sherwin-Williams Company.
COMPARISON OF FIVE YEAR CUMULATIVE TOTAL RETURN
Among The Valspar Corporation, a Peer Group and the S&P 500 Index
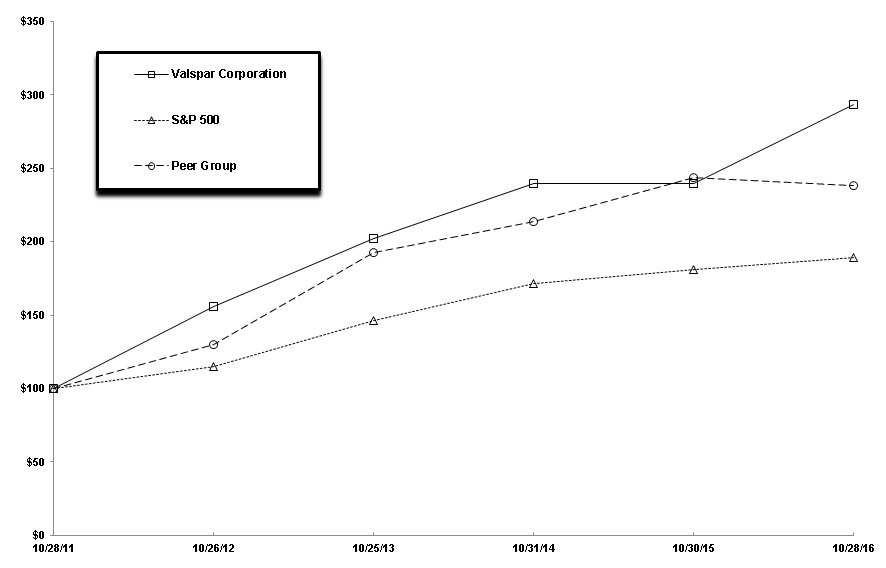
Cumulative Total Return | |||||||||||||||||||||||
Fiscal Year End | 2011 | 2012 | 2013 | 2014 | 2015 | 2016 | |||||||||||||||||
Valspar | $ | 100 | $ | 156 | $ | 202 | $ | 240 | $ | 240 | $ | 294 | |||||||||||
Peer Group | $ | 100 | $ | 130 | $ | 193 | $ | 214 | $ | 244 | $ | 238 | |||||||||||
S&P 500 | $ | 100 | $ | 115 | $ | 147 | $ | 172 | $ | 181 | $ | 189 | |||||||||||
Assumes $100 invested on October 28, 2011 in our common stock, the Peer Group and the S&P 500 Index, including reinvestment of dividends.
EQUITY COMPENSATION PLANS
Plan Category | Number of Securities to be Issued Upon Exercise of Outstanding Options, Warrants and Rights | Weighted-Average Exercise Price of Outstanding Options, Warrants and Rights | Number of Securities Remaining Available for Future Issuance Under Equity Compensation Plans1 | ||||||
Equity compensation plans approved by security holders | 4,343,011 | $ | 41.01 | 4,105,254 | |||||
Equity compensation plans not approved by security holders | None | None | None | ||||||
Total | 4,343,011 | $ | 41.01 | 4,105,254 | |||||
1 | The number of securities remaining available for future issuance under equity compensation plans consists of shares issuable under the 2015 Omnibus Equity Plan, which was approved by the stockholders in February 2015. |
12
ITEM 6 SELECTED FINANCIAL DATA
The following selected financial data has been derived from our audited Consolidated Financial Statements and should be read in conjunction with “Management’s Discussion and Analysis of Financial Condition and Results of Operations” and the Consolidated Financial Statements and related Notes included elsewhere in this Form 10-K.
Fiscal Years | ||||||||||||||||||||
(Dollars in thousands, except per share amounts) | 2016 | 2015 | 2014 | 2013 | 2012 | |||||||||||||||
Operating Results | Net sales | $ | 4,190,552 | $ | 4,392,622 | $ | 4,625,624 | $ | 4,194,977 | $ | 4,106,888 | |||||||||
Cost and Expenses | ||||||||||||||||||||
Cost of sales | 2,654,968 | 2,841,233 | 3,086,578 | 2,836,919 | 2,753,184 | |||||||||||||||
Operating expenses | 1,006,545 | 951,403 | 979,137 | 865,634 | 871,434 | |||||||||||||||
Gain on sale of certain assets | — | 48,001 | — | — | — | |||||||||||||||
Income from operations | 529,039 | 647,987 | 559,909 | 492,424 | 482,270 | |||||||||||||||
Interest expense | 90,560 | 81,348 | 65,330 | 64,758 | 67,604 | |||||||||||||||
Other (income) expense – net | 3,960 | 2,838 | 2,697 | 3,871 | (2,558 | ) | ||||||||||||||
Income before income taxes | 434,519 | 563,801 | 491,882 | 423,795 | 417,224 | |||||||||||||||
Net income | 353,040 | 399,506 | 345,401 | 289,255 | 292,497 | |||||||||||||||
Net income as a percent of sales | 8.4 | % | 9.1 | % | 7.5 | % | 6.9 | % | 7.1 | % | ||||||||||
Return on average equity | 35.9 | % | 42.8 | % | 32.4 | % | 24.7 | % | 24.0 | % | ||||||||||
Per common share: | ||||||||||||||||||||
Net income – basic | $ | 4.47 | $ | 4.97 | $ | 4.13 | $ | 3.29 | $ | 3.20 | ||||||||||
Net income – diluted | 4.36 | 4.85 | 4.01 | 3.20 | 3.10 | |||||||||||||||
Dividends paid | 1.32 | 1.20 | 1.04 | 0.92 | 0.80 | |||||||||||||||
Financial Position | Total assets | $ | 4,314,550 | $ | 4,318,575 | $ | 4,033,951 | $ | 4,025,509 | $ | 3,626,836 | |||||||||
Working capital | 330,465 | 264,491 | (127,164 | ) | 99,717 | 422,405 | ||||||||||||||
Property, plant and equipment, net | 668,443 | 632,765 | 645,102 | 633,475 | 550,968 | |||||||||||||||
Long-term debt, net of current portion | 1,556,952 | 1,706,933 | 950,035 | 1,037,392 | 1,012,578 | |||||||||||||||
Stockholders’ equity | 1,113,423 | 855,009 | 1,011,091 | 1,122,550 | 1,223,523 | |||||||||||||||
Other Statistics | Property, plant and equipment expenditures | $ | 120,420 | $ | 97,126 | $ | 121,271 | $ | 116,749 | $ | 89,363 | |||||||||
Depreciation and amortization expense | 98,022 | 92,603 | 100,910 | 88,159 | 93,704 | |||||||||||||||
Research and development expense | 139,318 | 133,365 | 136,381 | 133,789 | 123,644 | |||||||||||||||
Total cash dividends | $ | 104,553 | $ | 96,890 | $ | 87,427 | $ | 81,189 | $ | 73,351 | ||||||||||
Average diluted common shares outstanding (000’s) | 81,020 | 82,447 | 86,046 | 90,526 | 94,380 | |||||||||||||||
Number of stockholders at year end | 1,105 | 1,201 | 1,219 | 1,290 | 1,365 | |||||||||||||||
Number of employees at year end | 11,083 | 11,130 | 10,513 | 10,702 | 9,755 | |||||||||||||||
Market price range – common stock: | ||||||||||||||||||||
High | $ | 108.64 | $ | 90.91 | $ | 82.26 | $ | 74.25 | $ | 59.81 | ||||||||||
Low | 71.99 | 70.58 | 66.94 | 55.17 | 33.17 | |||||||||||||||
Reference is made to the Notes to Consolidated Financial Statements for a summary of accounting policies and additional information.
13
ITEM 7 | MANAGEMENT’S DISCUSSION AND ANALYSIS OF FINANCIAL CONDITION AND RESULTS OF OPERATIONS (Dollars in thousands, except per share amounts) |
Management’s Discussion and Analysis of Financial Condition and Results of Operations (MD&A) is intended to provide a reader of our financial statements with a narrative from the perspective of management on our financial condition, results of operations, liquidity and certain other factors that may affect our future results. Unless otherwise noted, transactions, trends and other factors significantly impacting our financial condition, results of operations and liquidity are discussed in order of magnitude. In addition, unless expressly stated otherwise, the comparisons presented in this MD&A refer to the same period in the prior year. Our MD&A is presented in six sections:
• | Overview |
• | Results of Operations |
• | Financial Condition |
• | Critical Accounting Estimates |
• | Off-Balance Sheet Arrangements |
• | Forward-Looking Statements |
Our MD&A should be read in conjunction with the Consolidated Financial Statements and related Notes included in Item 8, Financial Statements and Supplementary Data, of this Form 10-K.
OVERVIEW
Valspar is a global leader in the paints and coatings industry. We develop, manufacture and distribute a broad range of coatings, paints and related products and we operate our business in two reportable segments: Coatings and Paints. Our Coatings segment aggregates our industrial and packaging product lines. Our Paints segment aggregates our consumer paints and automotive refinish product lines. See Note 15 in Notes to Consolidated Financial Statements for further information on our reportable segments.
We operate in over 25 countries, and approximately 45% of our total net sales in 2016 were generated outside of the U.S. In the discussions of our operating results, we sometimes refer to the impact of changes in foreign currency exchange rates or the impact of foreign currency exchange rate fluctuations, which are references to the differences between the foreign currency exchange rates we use to translate international operating results from local currencies into U.S. dollars for reporting purposes. The impact of foreign currency exchange rate fluctuations is calculated as the difference between current period activity translated using the current period’s currency exchange rates and the comparable prior-year period’s currency exchange rates. We use this method to calculate the impact of changes in foreign currency exchange rates for all countries where the functional currency is not the U.S. dollar.
We have a 4-4-5 week accounting cycle with the fiscal year ending on the Friday on or immediately preceding October 31. Fiscal years 2016 and 2015 included 52 weeks while fiscal year 2014 included 53 weeks.
Our fundamental business objective is to create long-term value for our stockholders. We intend to accomplish this by:
• | Focusing on Customer Success by delivering coatings products and solutions that add value for our customers; |
• | Building Strong Brands and Distribution Partners by investing in brands that are well recognized in the markets in which we operate and building differentiated distribution networks in key markets; |
• | Developing Differentiated Technologies by investing in technologies that enhance our competitive position and add value for our customers; |
• | Driving Industry-Leading Innovation by developing unique products and services that differentiate us in the marketplace with our customers; and |
• | Attracting and Developing the Best People by creating a world class team with deep expertise and stockholder value orientation. |
In addition to creating value for our stockholders, we are committed to:
14
• | Adhering to our values, engaging in ethical business conduct and doing business with integrity; |
• | Improving the safety and reducing the environmental footprint of our business and the products we manufacture while also delivering solutions that enable our customers to meet their safety and environmental objectives; and |
• | Demonstrating our corporate citizenship by supporting the communities in which we work and live through volunteer efforts and philanthropy. |
Proposed Merger with The Sherwin-Williams Company
On March 19, 2016, Valspar entered into an Agreement and Plan of Merger (the Merger Agreement) with The Sherwin-Williams Company (Sherwin-Williams) and Viking Merger Sub, Inc., a wholly-owned subsidiary of Sherwin-Williams (Merger Sub).
The Merger Agreement provides that, among other things and subject to the terms and conditions of the Merger Agreement, (1) Merger Sub will be merged with and into Valspar (the Merger), with Valspar surviving the Merger as a wholly-owned subsidiary of Sherwin-Williams, and (2) at the effective time of the Merger, each outstanding share of common stock of Valspar, par value $0.50 per share (Valspar common stock) (other than Valspar common stock held in treasury by Valspar, owned by a subsidiary of Valspar or owned by Sherwin-Williams or any of its wholly-owned subsidiaries, or shares with respect to which appraisal rights have been validly exercised and not lost in accordance with Delaware law) will be converted into the right to receive the Merger Consideration.
The Merger Consideration means $113.00 per share in cash, except that if Sherwin-Williams is required, in order to obtain the necessary antitrust approvals, to commit to any divestiture, license, hold separate, sale or other disposition of or with respect to assets, businesses or product lines of Valspar, Sherwin-Williams or their subsidiaries representing, in the aggregate, in excess of $650 million of Net Sales (as defined in the Merger Agreement), then the Merger Consideration will be $105.00 per share in cash.
The Merger Agreement contains certain termination rights, and we may be required to pay Sherwin-Williams a termination fee of $300 million.
For further information on the Merger Agreement, refer to the Merger Agreement, a copy of which was filed as Exhibit 2.1 to our Current Report on Form 8-K filed with the Securities and Exchange Commission on March 21, 2016, and which is incorporated by reference herein.
On June 29, 2016, Valspar stockholders voted to adopt the Merger Agreement at a special meeting of stockholders held for that purpose. Completion of the Merger remains subject to certain closing conditions, including the expiration or termination of the applicable waiting period under the U.S. Hart-Scott-Rodino Antitrust Improvements Act and the receipt of regulatory approvals in certain other jurisdictions.
The following discussion of results of operations and financial condition should be read in the context of this overview.
RESULTS OF OPERATIONS
Overview
Net sales in 2016 were $4,190,552 compared to $4,392,622 in 2015. The decline was primarily due to lower sales in our consumer paints product line, the impact of foreign currency exchange and lower sales in our general industrial product line. This decline was partially offset by the acquisition of the performance coating businesses of Quest Specialty Chemicals (Quest), which took place in the third quarter of 2015, and higher sales in our coil product line.
Foreign currency translation had a $128,600 negative impact on our net sales in 2016. The impact on earnings was partially mitigated by our management of operating activities at the local level, with underlying costs generally denominated in the same currency as sales. This foreign currency exchange impact reflects the strengthening of the U.S. dollar against many international currencies versus the prior year.
Our raw material costs were approximately 80% of our cost of goods sold in 2016 and 2015.
Gross profit as a percent of sales increased to 36.6% from 35.3% in the prior year driven by improved productivity and favorable cost/price comparison. Operating expenses as a percentage of net sales increased to 24.0% from 21.7% primarily due to higher employee-related costs and costs related to the proposed merger, partially offset by lower marketing expenses. Net income as a percent of sales of 8.4% declined from 9.1%. This decline was the result of higher operating expenses and a 2015 gain on sale of certain assets of a non-strategic specialty product offering, partially offset by a lower tax rate and improved gross margin.
15
Restructuring
Fiscal year 2016 restructuring expenses primarily relate to initiatives to improve our global cost structure by consolidating our manufacturing operations in the Paints segment and reducing non-manufacturing headcount in our Paints and Coatings segments. These initiatives included moving manufacturing of selected products in our consumer paints product line to a third party (continuation of an initiative started in 2015), consolidating three sites in our automotive product line as a result of the Quest acquisition and reducing headcount in our Australia and Europe regions. These restructuring activities resulted in pre-tax charges of $18,505 or $0.15 per diluted share after taxes in fiscal year 2016. Included in fiscal 2016 restructuring charges are pre-tax non-cash asset-related charges of $7,358. Asset-related charges include asset impairment charges as well as accelerated depreciation for assets with useful lives that have been shortened, accounted for in accordance with Accounting Standards Codification (ASC)Topic 360, Property, Plant and Equipment. We currently expect additional expenses of approximately $1,200 in fiscal year 2017 for these restructuring plans, primarily related to site clean-up costs, employment-related costs and accelerated depreciation. We currently estimate that upon their completion in fiscal year 2017, these actions will reduce annual costs by approximately $10,000, which is primarily due to lower employee-related costs and lower depreciation expense. We expect a portion of these savings, net of execution costs, will be achieved over the next year and the full annual benefit of these actions is expected in fiscal year 2018.
Restructuring charges in fiscal year 2015 included the following: (i) actions to close a manufacturing facility and other facilities in the Coatings segment to rationalize operations in the Australia region, (ii) actions to streamline and consolidate administrative operations in the Europe region and (iii) initiatives in the Paints segment to improve our North American cost structure through staffing reductions and actions to rationalize our manufacturing operations by moving certain manufacturing to a third party. These restructuring activities resulted in pre-tax charges of $21,569 or $0.18 per diluted share for fiscal year 2015, including pre-tax non-cash asset-related charges of $2,842. See Note 18 in Notes to Consolidated Financial Statements for further information on restructuring.
Financial Results 2016 vs. 2015
The following tables present selected financial data for the years ended October 28, 2016 and October 30, 2015.
Net Sales | 2016 | 2015 | % Change | |||||||
Coatings | $ | 2,388,133 | $ | 2,496,528 | (4.3 | )% | ||||
Paints | 1,564,531 | 1,661,186 | (5.8 | )% | ||||||
Other and Administrative | 237,888 | 234,908 | 1.3 | % | ||||||
Consolidated net sales | $ | 4,190,552 | $ | 4,392,622 | (4.6 | )% | ||||
• | Consolidated Net Sales – Consolidated net sales for the year decreased 4.6%, including a negative impact of 2.9% from foreign currency. Excluding foreign currency exchange, the decrease was driven by lower sales in our consumer paints product line, primarily in North America, and lower sales in our general industrial product line, partially offset by the acquisition of Quest and higher sales in our coil product line. |
• | Coatings Segment Net Sales – Our Coatings segment net sales for the year decreased 4.3%, including a negative impact of 3.6% from foreign currency. Excluding foreign currency exchange, the decrease was driven by lower sales in our general industrial product line offset by improved sales in our coil and wood product lines. |
• | Paints Segment Net Sales – Our Paints segment net sales for the year decreased 5.8%, including a negative impact of 2.1% from foreign currency. Excluding foreign currency exchange, the decrease was driven by lower sales in North America (primarily at Lowe's) and our Australia and Asia regions. This was partially offset by higher sales in our automotive refinish product line primarily due to the acquisition of Quest. |
Approximately $39,000 of the fiscal year 2016 decrease in sales was due to an adjustment in our product line offering at Lowe's, which impacted the first half of fiscal year 2016.
• | Other and Administrative Net Sales – The Other and Administrative category includes the following product lines: resins, furniture protection plans and colorants. Other and Administrative net sales increased 1.3%, including a negative impact of 1.0% from foreign currency. Excluding foreign currency exchange, the increased sales were primarily due to resins and furniture protection plans. |
16
Gross Profit | 2016 | 2015 | |||||
Consolidated gross profit | $ | 1,535,584 | $ | 1,551,389 | |||
As a percent of net sales | 36.6 | % | 35.3 | % | |||
• | Gross Profit – The gross profit rate for 2016 increased 1.3 percentage points compared to 2015. The increase in gross profit rate was primarily driven by improved productivity and favorable cost/price comparison, partially offset by the impact of lower volume on manufacturing cost. Productivity includes procurement and manufacturing efficiencies, product reformulations and benefits from previously completed restructuring actions. Cost/price comparison reflects the impact of market changes in raw material costs, offset by changes in product pricing and promotions. Restructuring charges of $9,906 or 0.2% of net sales and $14,007 or 0.3% of net sales were included in the 2016 and 2015 periods, respectively. |
Operating Expenses | 2016 | 2015 | |||||
Consolidated operating expenses1 | $ | 1,006,545 | $ | 951,403 | |||
As a percent of net sales | 24.0 | % | 21.7 | % | |||
1 | Includes research and development and selling, general and administrative costs. For breakout see Consolidated Statements of Operations. |
• | Consolidated Operating Expenses (dollars) – Consolidated operating expenses increased $55,142 or 5.8% including a favorable impact of 2.7% from foreign currency. Excluding foreign currency exchange, the increase was primarily due to higher employee-related costs, costs related to the proposed merger and the addition of Quest, partially offset by lower marketing expenses. 2016 included costs of $28,021 related to the proposed merger with The Sherwin-Williams Company. There were no costs related to the proposed merger in the prior year. Restructuring charges of $8,599 or 0.2% of net sales and $7,562 or 0.2% of net sales were included in the 2016 and 2015 periods, respectively. |
EBIT1 | 2016 | 2015 | |||||
Coatings | $ | 444,190 | $ | 483,649 | |||
As a percent of net sales | 18.6 | % | 19.4 | % | |||
Paints | 149,539 | 173,435 | |||||
As a percent of net sales | 9.6 | % | 10.4 | % | |||
Other and Administrative | (68,650 | ) | (11,935 | ) | |||
As a percent of net sales | (28.9 | )% | (5.1 | )% | |||
Consolidated EBIT | $ | 525,079 | $ | 645,149 | |||
As a percent of net sales | 12.5 | % | 14.7 | % | |||
1 | EBIT is defined as earnings before interest and taxes. |
• | Consolidated EBIT – EBIT for 2016 declined $120,070 or 18.6% or 2.2 percentage points as a percent of net sales from the prior year. 2015 EBIT included a pre-tax gain of $48,001 from the sale of certain assets of a non-strategic specialty product offering, recorded in the Coatings segment in the first quarter. 2016 EBIT declined due to higher employee-related costs, lower volumes and costs related to the proposed merger, partially offset by improved productivity. Restructuring charges were $18,505 or 0.4% of net sales, compared to $21,569 or 0.5% of net sales in fiscal year 2015. Foreign currency exchange had a negative impact on consolidated EBIT of $11,000 in 2016. |
• | Coatings Segment EBIT – EBIT as a percent of net sales declined 0.8 percentage points from the prior year. The decrease was primarily due to the gain on sale of certain assets in the prior period and higher employee-related costs, partially offset by improved productivity, favorable cost/price comparison and lower restructuring charges. Restructuring charges for the 2016 and 2015 periods were $581 or 0.0% of net sales and $9,574 or 0.4% of net sales, respectively. |
• | Paints Segment EBIT – EBIT as a percent of net sales decreased 0.8 percentage points from the prior year. The decrease was driven by the effect of lower volumes, impairment of a certain asset group in our consumer paints product line and higher restructuring charges, partially offset by improved productivity and favorable cost/price comparison. Restructuring charges for 2016 and 2015 periods were $16,239 or 1.0% of net sales and $11,913 or 0.7% of net sales, respectively. Acquisition-related charges of $5,320 or 0.3% were included in fiscal year 2015. |
• | Other and Administrative EBIT – Other and Administrative EBIT includes corporate expenses. EBIT as a percent of net sales decreased 23.8 percentage points from the prior year primarily due to costs related to the proposed merger and increased employee-related costs. |
17
Interest Expense | 2016 | 2015 | |||||
Consolidated interest expense | $ | 90,560 | $ | 81,348 | |||
• | Interest Expense – Interest expense increased in fiscal year 2016 primarily due to higher average debt levels, primarily from the Quest acquisition. |
Effective Tax Rate | 2016 | 2015 | |||
Effective tax rate | 18.8 | % | 29.1 | % | |
• | Effective Tax Rate – The lower 2016 effective tax rate was primarily due to the recognition of U.S. foreign tax credits, additional U.S. research and development credits, and the reversal of certain foreign valuation allowances. |
Net Income | 2016 | 2015 | % Change | |||||||
Consolidated net income | $ | 353,040 | $ | 399,506 | (11.6 | )% | ||||
Financial Results 2015 vs. 2014
The following tables present selected financial data for the years ended October 30, 2015 and October 31, 2014.
Net sales | 2015 | 2014 | % Change | |||||||
Coatings | $ | 2,496,528 | $ | 2,585,416 | (3.4 | )% | ||||
Paints | 1,661,186 | 1,806,051 | (8.0 | )% | ||||||
Other and Administrative | 234,908 | 234,157 | 0.3 | % | ||||||
Consolidated net sales | $ | 4,392,622 | $ | 4,625,624 | (5.0 | )% | ||||
• | Consolidated Net Sales – Consolidated net sales for the year decreased 5.0%, including a negative impact of 5.0% from foreign currency. Lower sales in our consumer paints product line due to a change in product line offering at Lowe's that took effect in the first quarter of 2015 and the 53rd week in 2014 were primarily offset by net new business in our Coatings segment and the acquisition of Quest in our Paints segment. |
• | Coatings Segment Net Sales – Our Coatings segment net sales for the year decreased 3.4%, including a negative impact of 6.0% from foreign currency. Excluding foreign currency exchange, the increase was due to new business, partially offset by the impact of the 53rd week in 2014. |
• | Paints Segment Net Sales – Our Paints segment net sales for the year decreased 8.0%, including a negative impact of 4.0% from foreign currency. Excluding foreign currency exchange, the decrease in net sales was driven primarily by a change in our product line offering at Lowe's that took effect in the first quarter of 2015, a change in price/mix and the 53rd week in 2014, partially offset by the acquisition of Quest in the third quarter of 2015 and volume growth outside the U.S due to new business. |
Paints segment sales in North America in fiscal year 2015 have declined versus the previous year primarily due to an adjustment in our product line offering at Lowe's. This customer informed us that in fiscal year 2015 they were discontinuing one of the several products that we supply. The total net impact of this adjustment on fiscal year 2015 net sales was approximately $150,000. We took actions to mitigate a portion of the effect on our business of this expected sales decline, including reductions in operating expenses as well as restructuring activities in the Paints segment (see Note 18 in the Consolidated Financial Statements for more information on restructuring activities).
• | Other and Administrative Net Sales – The Other and Administrative category includes the following product lines: resins, furniture protection plans and colorants. Other and Administrative net sales increased 0.3%, including a negative impact of 2.5% from foreign currency. Excluding foreign currency exchange, the increased sales were primarily due to furniture protection plans and resins. |
Gross Profit | 2015 | 2014 | |||||
Consolidated gross profit | $ | 1,551,389 | $ | 1,539,046 | |||
As a percent of net sales | 35.3 | % | 33.3 | % | |||
18
• | Gross Profit – The gross profit rate increased 2.0 percentage points. The increase in gross profit rate was primarily driven by improved productivity, favorable cost/price comparison and lower restructuring charges, partially offset by acquisition-related charges from Quest. Productivity includes procurement efficiencies, product reformulations and benefits from previously completed restructuring actions. Cost/price comparison reflects the impact of market changes in raw material costs, offset by changes in product pricing and promotions. Restructuring charges of $14,007 or 0.3% of net sales and $28,471 or 0.6% of net sales were included in the 2015 and 2014 periods, respectively. Acquisition-related charges of $4,428 or 0.1% of net sales were included in fiscal year 2015. |
Operating Expenses | 2015 | 2014 | |||||
Consolidated operating expenses1 | $ | 951,403 | $ | 979,137 | |||
As a percent of net sales | 21.7 | % | 21.2 | % | |||
1 | Includes research and development and selling, general and administrative costs. For breakout see Consolidated Statements of Operations. |
Consolidated Operating Expenses (dollars) – Consolidated operating expenses decreased $27,734 or 2.8% including a favorable impact of 5.0% from foreign currency. Excluding foreign currency exchange, dollars in fiscal year 2015 increased primarily due to investments to support our growth initiatives, Quest operating expenses and higher bad debt expense, partially offset by lower incentive compensation accruals and lower restructuring charges. Restructuring charges of $7,562 or 0.2% of net sales and 12,668 or 0.3% of net sales were included in the 2015 and 2014 periods, respectively. Acquisition-related charges of $892 were included in fiscal year 2015.
EBIT1 | 2015 | 2014 | |||||
Coatings | $ | 483,649 | $ | 389,390 | |||
As a percent of net sales | 19.4 | % | 15.1 | % | |||
Paints | 173,435 | 192,222 | |||||
As a percent of net sales | 10.4 | % | 10.6 | % | |||
Other and Administrative | (11,935 | ) | (24,400 | ) | |||
As a percent of net sales | (5.1 | )% | (10.4 | )% | |||
Consolidated EBIT | $ | 645,149 | $ | 557,212 | |||
As a percent of net sales | 14.7 | % | 12.0 | % | |||
1 | EBIT is defined as earnings before interest and taxes. |
• | Consolidated EBIT – EBIT for 2015 increased $87,937 or 15.8% or 2.7 percentage points as a percent of net sales from the prior year. Fiscal year 2015 results included a pre-tax gain on sale of certain assets of a non-strategic specialty product line of $48,001. Restructuring charges were $21,569 or 0.5% of net sales, compared to $41,139 or 0.9% of net sales in fiscal year 2014. Acquisition-related charges of $5,320 or 0.1% of net sales were included in fiscal year 2015. Foreign currency exchange had a negative impact of $23,001 on EBIT. |
• | Coatings Segment EBIT – EBIT as a percent of net sales increased 4.3 percentage points from the prior year. The increase was primarily due to the gain on sale of certain assets of a non-strategic specialty product offering of $48,001, improved productivity, favorable cost/price comparison and lower restructuring charges, partially offset by higher operating expense. Restructuring charges for the 2015 and 2014 periods were $9,574 or 0.4% of net sales and $28,902 or 1.1% of net sales, respectively. |
• | Paints Segment EBIT – EBIT as a percent of net sales decreased 0.2 percentage points from the prior year. The decrease was driven by the effect of lower volumes in our consumer product line in North America and acquisition-related charges from the Quest acquisition, partially offset by improved productivity. Restructuring charges for 2015 and 2014 periods were $11,913 or 0.7% of net sales and $11,934 or 0.7% of net sales, respectively. Acquisition-related charges of $5,320 or 0.3% of net sales were included in fiscal year 2015. |
• | Other and Administrative EBIT – Other and Administrative EBIT includes corporate expenses. EBIT as a percent of net sales increased 5.3 percentage points from the prior year primarily due to lower operating expenses and improved operating performance. Restructuring charges of $82 or 0.0% of net sales and $303 or 0.1% of net sales were included in the 2015 and 2014 periods, respectively. |
19
Interest Expense | 2015 | 2014 | |||||
Consolidated interest expense | $ | 81,348 | $ | 65,330 | |||
• | Interest Expense – Interest expense increased in fiscal year 2015 primarily due to higher average debt levels and higher average interest rates. |
Effective Tax Rate | 2015 | 2014 | |||
Effective tax rate | 29.1 | % | 29.8 | % | |
• | Effective Tax Rate – The lower 2015 effective tax rate was primarily due to the U.S. foreign tax credit and the sale of a specialty product offering in a foreign location, which is taxed at a lower rate than the U.S. federal statutory rate, partially offset by a reversal of valuation allowances in 2014, which did not recur in 2015. |
Net Income | 2015 | 2014 | % Change | |||||||
Consolidated net income | $ | 399,506 | $ | 345,401 | 15.7 | % | ||||
FINANCIAL CONDITION
Cash Flow
Cash flow provided by operations was $482,712 in 2016, compared to $383,200 in 2015 and $347,104 in 2014. Cash flow provided by operations in 2016 increased due to overall working capital becoming a source of cash as accounts receivable declined in line with lower sales.
In 2016, we used cash flow from operations to reduce debt by $264,521 and to fund $120,420 in capital expenditures, $104,553 of dividend payments and $24,408 for acquisitions of businesses, net of cash acquired.
Debt and Capital Resources
Our debt classified as current was $221,446 at October 28, 2016 compared to $334,153 at October 30, 2015. Total debt was $1,778,398 at October 28, 2016 and $2,041,086 at October 30, 2015. The decrease in total debt from October 30, 2015 was driven by the use of cash flow from operations to repay debt. The ratio of total debt to capital was 61.5% at October 28, 2016, compared to 70.5% at October 30, 2015. Average debt outstanding during 2016 was $2,019,317 at a weighted average interest rate of 4.48% versus $1,908,101 at 4.26% in 2015. Interest expense for 2016 was $90,560 compared to $81,348 in 2015.
During 2016, $150,000 of unsecured Senior Notes that mature on May 1, 2017 were reclassified as current portion of long-term debt.
On August 3, 2015, we retired $150,000 of unsecured Senior Notes in accordance with their scheduled maturity using commercial paper.
On July 27, 2015, we issued $350,000 of unsecured Senior Notes that mature on January 15, 2026 with a coupon rate of 3.95%. The net proceeds of the issuance were approximately $345,000. The public offering was made pursuant to a registration statement filed with the U.S. Securities and Exchange Commission (SEC). We used the net proceeds from this offering for the repayment of borrowings under the term loan credit facility that was entered into on May 29, 2015.
On May 29, 2015, we entered into a $350,000 term loan credit agreement with a syndicate of banks with a maturity date of November 29, 2016. This facility was used to provide funding for the acquisition of Quest. See Note 2 in the Consolidated Financial Statements for further information on the acquisition. This facility was repaid and terminated on July 29, 2015 primarily using the net proceeds from the unsecured Senior Notes issued in July 2015.
On January 21, 2015, we issued $250,000 of unsecured Senior Notes that mature on February 1, 2025 with a coupon rate of 3.30%, and $250,000 of unsecured Senior Notes that mature on February 1, 2045 with a coupon rate of 4.40%. The net proceeds of both issuances were approximately $492,000 in the aggregate. The public offering was made pursuant to a registration statement filed with the SEC. We used the net proceeds to repay short-term borrowings under our commercial paper program and credit facility in the first quarter of 2015.
20
We maintain a $750,000 unsecured revolving credit facility with a syndicate of banks with a maturity date of December 14, 2018. Under certain circumstances we have the option to increase this credit facility to $1,000,000.
Our short-term debt consists primarily of commercial paper. The weighted-average annual interest rates on outstanding short-term borrowings were 1.27% and 0.64% on October 28, 2016 and October 30, 2015, respectively. To ensure availability of funds, we maintain uncommitted bank lines of credit sufficient to cover outstanding short-term borrowings. These arrangements are reviewed periodically for renewal and modification.
In July 2013, we entered into a U.S. dollar equivalent unsecured committed revolving bilateral credit facility, expiring July 2014. In July 2014, this facility was extended for one year to July 2015. We paid off and terminated the bilateral credit facility in December 2014.
As of October 28, 2016 and October 30, 2015, our bank credit facilities consisted of the following:
October 28, 2016 | |||||||
Total Outstanding | Facility Size | ||||||
December 2018 unsecured committed credit revolving facility1 | $ | 62,389 | $ | 750,000 | |||
Uncommitted bank lines of credit | 8,950 | 109,825 | |||||
Total bank credit facilities | $ | 71,339 | $ | 859,825 | |||
October 30, 2015 | |||||||
Total Outstanding | Facility Size | ||||||
December 2018 unsecured committed credit revolving facility1 | $ | 327,869 | $ | 750,000 | |||
Uncommitted bank lines of credit | 6,153 | 97,512 | |||||
Total bank credit facilities | $ | 334,022 | $ | 847,512 | |||
1 | We have a $450,000 commercial paper program backed by our $750,000 bank syndicate committed credit revolving facility, as amended and restated. We pay a 0.15% per year commitment fee on the full amount of the facility. The facility includes $62,389 and $327,869 of commercial paper as of October 28, 2016 and October 30, 2015, respectively. |
Our unsecured committed credit revolving facility has covenants that require us to maintain certain financial ratios. We were in compliance with these covenants as of October 28, 2016. Our debt covenants do not limit, nor are they reasonably likely to limit, our ability to obtain additional debt or equity financing.
We maintain uncommitted bank lines of credit to meet short-term funding needs in certain of our international locations. These arrangements are reviewed periodically for renewal and modification.
As of October 28, 2016, we had total committed liquidity of $862,331, comprised of $174,720 in cash and cash equivalents and $687,611 in unused committed bank credit facilities, compared to $608,092 of total committed liquidity as of October 30, 2015. At October 28, 2016 we had unused lines of committed and uncommitted credit available from banks of $788,486.
Our cash and cash equivalent balances consist of high quality, short-term money market instruments and cash held by our international subsidiaries that are used to fund those subsidiaries’ day-to-day operating needs. Those balances have also been used to finance international acquisitions. Our investment policy on excess cash is to preserve principal. As of October 28, 2016, $165,616 of the $174,720 of cash (on the Consolidated Balance Sheets) was held by foreign subsidiaries. If these funds were repatriated to the U.S. we would be required to accrue and pay income taxes. No provision has been made for U.S. federal income taxes on certain undistributed earnings of foreign subsidiaries that we intend to permanently invest or that may be remitted substantially tax-free.
We believe cash flow from operations, existing lines of credit, access to credit facilities and access to debt and capital markets will be sufficient to meet our domestic and international liquidity needs. In the current market conditions, we have demonstrated continued access to capital markets. We have committed liquidity and cash reserves in excess of our anticipated funding requirements.
We use derivative instruments with a number of counterparties principally to manage interest rate and foreign currency exchange risks. We evaluate the financial stability of each counterparty and spread the risk among several financial institutions to limit our exposure. We will continue to monitor counterparty risk on an ongoing basis. We do not have any credit-risk related contingent features in our derivative contracts as of October 28, 2016.
21
We paid common stock dividends of $104,553 or $1.32 per share in 2016, an increase of 10.0% per share over 2015 common stock dividends of $96,890 or $1.20 per share.
We have continuing authorization to purchase shares of our common stock for general corporate purposes. We repurchased 221,060 shares totaling $18,134 in 2016 compared to 3,891,545 shares totaling $322,420 in 2015 and 4,705,081 shares totaling $349,181 in 2014. On November 21, 2014, the Board approved a new share repurchase program, with no expiration date, authorizing us to purchase up to $1,500,000 of outstanding shares of common stock. This new program was effective immediately and replaced the previous repurchase authorization. As of October 28, 2016, $1,175,630 remained available for purchase under our repurchase authorization.
We are involved in various claims relating to environmental matters at a number of current and former plant sites and waste management sites. We engage or participate in remedial and other environmental compliance activities at certain of these sites. At other sites, we have been named as a potentially responsible party (PRP) under federal and state environmental laws for site remediation. We analyze each individual site, considering the number of parties involved, the level of our potential liability or contribution relative to the other parties, the nature and magnitude of the hazardous wastes involved, the method and extent of remediation, the potential insurance coverage, the estimated legal and consulting expense with respect to each site and the time period over which any costs would likely be incurred. Based on the above analysis, we estimate the clean-up costs and related claims for each site. The estimates are based in part on discussion with other PRPs, governmental agencies and engineering firms.
We accrue appropriate reserves for potential environmental liabilities when the amount of the costs that will be incurred can be reasonably determined. Accruals are reviewed and adjusted as additional information becomes available. While uncertainties exist with respect to the amounts and timing of our ultimate environmental liabilities, we believe it is neither probable nor reasonably possible that such liabilities, individually or in the aggregate, will have a material adverse effect on our financial condition, results of operations or cash flows.
We are involved in a variety of legal claims and proceedings relating to personal injury, product liability, warranties, customer contracts, employment, trade practices, environmental and other legal matters that arise in the normal course of business. These claims and proceedings include cases where we are one of a number of defendants in proceedings alleging that the plaintiffs suffered injuries or contracted diseases from exposure to chemicals or other ingredients used in the production of some of our products or waste disposal. We are also subject to claims related to the performance of our products. We believe these claims and proceedings are in the ordinary course for a business of the type and size in which we are engaged. While we are unable to predict the ultimate outcome of these claims and proceedings, we believe it is neither probable nor reasonably possible that the costs and liabilities of such matters, individually or in the aggregate, will have a material adverse effect on our financial condition, results of operations or cash flows.
Under various agreements, we are obligated to make future cash payments in fixed amounts. These include payments under our multi-currency credit facilities, senior notes, capital leases, employee benefit plans, non-cancelable operating leases with initial or remaining terms in excess of one year, capital expenditures, commodity purchase commitments, telecommunication commitments, IT commitments, and marketing commitments. Some of our interest charges are variable and are assumed at current rates.
22
Contractual Obligations
The following table summarizes our contractual obligations as of October 28, 2016 for the fiscal years ending in October:
2017 | 2018 | 2019 | 2020 | 2021 | 2022 and thereafter | Total | |||||||||||||||||||||
Notes & interest to banks | $ | 72,247 | $ | 127 | $ | — | $ | — | $ | — | $ | 6 | $ | 72,380 | |||||||||||||
Senior notes & interest | 226,163 | 71,625 | 363,469 | 49,875 | 49,875 | 1,594,243 | 2,355,250 | ||||||||||||||||||||
Bank fees | 1,125 | 1,125 | 141 | — | — | — | 2,391 | ||||||||||||||||||||
Capital leases | 1,047 | 1,047 | 1,047 | 1,047 | 1,047 | 12,996 | 18,231 | ||||||||||||||||||||
Medical retiree/SERP/pension | 1,438 | 1,242 | 1,344 | 1,489 | 1,449 | 19,771 | 26,733 | ||||||||||||||||||||
Operating leases | 32,656 | 25,151 | 17,658 | 11,182 | 9,316 | 32,635 | 128,598 | ||||||||||||||||||||
Capital expenditures | 57,976 | — | — | — | — | — | 57,976 | ||||||||||||||||||||
Commodity purchase commitments | 1,157 | — | — | — | — | — | 1,157 | ||||||||||||||||||||
Telecommunication commitments | 2,133 | — | — | — | — | — | 2,133 | ||||||||||||||||||||
IT commitments | 2,842 | 2,162 | — | — | — | — | 5,004 | ||||||||||||||||||||
Marketing commitments | 27,331 | 17,468 | 14,341 | 14,341 | 14,341 | 111,439 | 199,261 | ||||||||||||||||||||
Total contractual cash obligations | $ | 426,115 | $ | 119,947 | $ | 398,000 | $ | 77,934 | $ | 76,028 | $ | 1,771,090 | $ | 2,869,114 | |||||||||||||
We expect to make cash outlays in the future related to uncertain tax positions. However, due to the uncertainty of the timing of future cash flows, we are unable to make reasonably reliable estimates of the period of cash settlement, if any, with the respective taxing authorities. Accordingly, unrecognized tax benefits of $19,067 as of October 28, 2016, have been excluded from the contractual obligations table above. For further information related to unrecognized tax benefits, see Note 12 in Notes to Consolidated Financial Statements.
CRITICAL ACCOUNTING ESTIMATES
The discussion and analysis of our financial condition and results of operations are based upon our Consolidated Financial Statements, which have been prepared in accordance with generally accepted accounting principles in the United States (GAAP). The preparation of these financial statements requires us to make estimates and assumptions that affect the reported amounts of assets and liabilities, revenues and expenses, and related disclosure of any contingent assets and liabilities at the date of the financial statements. We regularly review our estimates and assumptions, which are based on historical experience and on various other factors that are believed to be reasonable under the circumstances, the results of which form the basis for making judgments about the carrying values of assets and liabilities that are not readily apparent from other sources. Actual results may differ from these estimates under different assumptions or conditions.
We believe the following areas are affected by significant judgments and estimates used in the preparation of our Consolidated Financial Statements and that the judgments and estimates are reasonable:
Revenue Recognition
We recognize revenue from product sales at the time the product is delivered or title has passed, a sales agreement is in place, pricing is fixed or determinable and collection is reasonably assured. Discounts provided to customers at the point of sale are recognized as reductions in revenue as the products are sold. We offer promotional and rebate programs to our customers. These programs require estimates of customer participation and performance and are recorded at the time of sale as deductions from revenue. We also offer consumer programs to promote the sale of our products and record them as a reduction in revenue at the time the consumer offer is made using estimated redemption and participation. Revenues exclude sales taxes collected from our customers.
Additionally, in the U.S., we sell extended furniture protection plans for which revenue is deferred and recognized over the life of the contract. An actuarial study utilizing historical claims data is used to forecast claim payments over the contract period and revenue is recognized based on the forecasted claims payments. Actual claims costs are reflected in earnings in the period incurred. Anticipated losses on programs in progress are charged to earnings when identified. Differences between estimated and actual results, which have been insignificant historically, are recognized as a change in management estimate in a subsequent period.
23
Goodwill and Indefinite-Lived Intangible Assets
Goodwill represents the excess of cost over the fair value of identifiable net assets of businesses acquired. Indefinite-lived intangible assets primarily consist of purchased technology, trademarks and trade names.
Goodwill for each of our reporting units and indefinite-lived assets is tested for impairment at least annually during the fourth quarter, and between annual tests if an event occurs, or circumstances change. A reporting unit is an operating segment or a component of an operating segment for which discrete financial information is available and reviewed by management on a regular basis. We have determined that we have four separate reporting units with goodwill. There was no change to our reporting units in 2016, 2015, or 2014.
The goodwill test involves a two-step process. The first step is a comparison of the reporting unit’s fair value to its carrying value, including goodwill. If the reporting unit’s fair value exceeds its carrying value, no further procedures are required. However, if the reporting unit’s fair value is less than the carrying value, an impairment of goodwill may exist, requiring a second step to measure the amount of impairment loss. In step 2, we would calculate the implied fair value of goodwill by deducting the fair value of all tangible and intangible net assets (including unrecognized intangible assets) of the reporting unit from the fair value of the reporting unit. If the implied fair value of goodwill is less than the recorded goodwill, an impairment charge is recorded for the difference.
In applying the goodwill and indefinite-lived intangible assets impairment tests, we may assess qualitative factors to determine whether it is more likely than not that the fair value of the reporting units is less than its carrying value (step 0). Qualitative factors may include, but are not limited to, economic, market and industry conditions, cost factors, and overall financial performance of the reporting unit. If, after assessing these qualitative factors, the Company determines it is more likely than not that the carrying value is less than the fair value, then performing the two-step impairment test is unnecessary.
For the two-step impairment test, in step 1, we calculate the fair value of the reporting units weighting the income approach and the market approach which is then compared with the reporting units carrying value. For the income approach, we utilize a discounted cash flow where the discount rate reflects the weighted average costs of capital. The income approach is most sensitive to the discount rate, long-term sales growth rates and forecasted operating margins. For the market approach, average revenue and earnings before interest, tax, depreciation and amortization multiples derived from our peer group are weighted and adjusted for size, risk and growth of the individual reporting unit to determine the reporting unit’s business enterprise fair value. Additionally, in assessing goodwill impairment, we consider the implied control premium and if it is reasonable based on other recent market transactions. For reporting units that pass step 1, we perform a sensitivity analysis on the discount rate, long-term sales growth rate and forecasted operating margin assumptions.
Changes in these estimates or a continued decline in general economic conditions could change our conclusion regarding an impairment of goodwill and potentially result in a non-cash impairment loss in a future period. If the fair value exceeds the carrying value, no further work is required and no impairment loss is recognized.
For indefinite-lived intangible assets, we utilize a relief from royalty method when applying the quantitative assessment. The relief from royalty method is most sensitive to the discount rate, royalty rate and long-term sales growth rates. If the carrying value of the indefinite-lived intangible assets exceeds the fair value of the asset, the carrying value is written down to fair value in the period identified.
The following is a description of the goodwill and indefinite-lived assets impairment tests performed for each of the fiscal years:
Fiscal Year 2016
During the annual goodwill and indefinite-lived intangible assets impairment tests, we assessed qualitative factors to determine whether it was more likely than not that the fair value of each reporting unit is less than its carrying value (step 0). We concluded that it was more likely than not that the carrying value was less than the fair value. Accordingly, we did not perform a two-step quantitative analysis.
Fiscal Years 2015 and 2014
During the annual impairment tests, we performed step 1 of the quantitative goodwill impairment test. In both years, we determined that the fair value exceeded the carrying value and did not perform step 2.
24
During the annual impairment tests, we performed step 1 of the indefinite-lived intangible assets impairment test. In both years, we determined that the fair value exceeded the carrying value and did not perform further analysis.
The assumptions used in our impairment testing could be adversely affected by certain risks discussed in “Risk Factors” in Item 1A of this report.
Pension and Post-Retirement Medical Obligations
We sponsor several defined benefit plans for certain hourly and salaried employees. We sponsor post-retirement medical benefits for certain U.S. employees. The amounts recognized in our financial statements are determined on an actuarial basis. To accomplish this, extensive use is made of assumptions about inflation, investment returns, mortality, turnover, medical trend rates and discount rates. A change in these assumptions could cause actual results to differ from those reported. A reduction of 50 basis points in the long-term rate of return and a reduction of 50 basis points in the discount rate would have increased our pension expense $2,236 in fiscal 2016. A 1% increase in the medical trend rates would not have a material effect on post-retirement medical expense or the post-retirement benefit obligation.
Income Taxes
At each period end, it is necessary for us to make certain estimates and assumptions to compute the provision for income taxes including, but not limited to, the projections of the proportion of income (or loss) earned and taxed in the foreign jurisdictions and the extent to which this income (or loss) may also be taxed in the United States, permanent and temporary differences, the likelihood of deferred tax assets being recovered and the outcome of uncertain tax positions. Our income tax returns, like those of most companies, are periodically audited by domestic and foreign tax authorities. These audits include questions regarding our tax filing positions, including the timing and amount of deductions and the allocation of income among various tax jurisdictions. At any one time, multiple tax years are subject to audit by the various tax authorities. We record an accrual for more likely than not exposures after evaluating the positions associated with our various income tax filings. A number of years may elapse before a particular matter for which we have established an accrual is audited and fully resolved or clarified. We adjust our tax contingencies accrual and income tax provision in the period in which matters are effectively settled with tax authorities at amounts different from our established accrual, the statute of limitations expires for the relevant taxing authority to examine the tax position or when more information becomes available. The Internal Revenue Service (IRS) has completed the audit of our U.S. federal tax returns for fiscal years 2010, 2011 and 2013. There were no material adjustments to our income tax expense or balance of unrecognized tax benefits as a result of those audits. The IRS is currently auditing our U.S. federal income tax return for fiscal year 2012. We are also currently under audit in several state and foreign jurisdictions. We do not anticipate any material adjustments to our income tax expense or balance of unrecognized tax benefits as a result of those audits. We also expect various statutes of limitation to expire during the next 12 months. Due to the uncertain response of taxing authorities, a range of outcomes cannot be reasonably estimated at this time.
Stock-based Compensation
The valuation of stock options requires us to use judgments and assumptions. There were no stock options issued in 2016.
Certain restricted stock units have performance-based features that are subject to three-year cliff vesting and a cumulative three-year EPS target. The valuation of these performance awards requires judgment to assess the probability of reaching the targets and the achievement level within the target. If the estimate of the probability or achievement level changes during the performance period, a cumulative adjustment will be recorded in the period the probability or achievement level changes. We currently believe the achievement of the performance targets is probable, and, therefore, we have recognized compensation expense over the requisite service period using the average results of the performance period. The average results include the actual performance for the completed periods associated with these awards and our estimate of the target performance for the remaining performance periods associated with the awards.
Inventories
We record inventories at the lower of cost or net realizable value, with expense estimates made for obsolescence or unsaleable inventory equal to the difference between the recorded cost of inventories and their estimated market value based upon assumptions about future demand and market conditions. On an ongoing basis, we monitor these estimates and record adjustments for differences between estimates and actual experience. Historically, actual results have not significantly deviated from those determined using these estimates. Our domestic inventories, except for Quest, are recorded using the last-in, first-out (LIFO) method, while all other inventories are recorded using the first-in, first-out (FIFO) method. If inventories accounted for using the LIFO method are reduced on a year-over-year basis, liquidation of certain quantities carried at costs prevailing in prior years occurs. If inventories accounted for using the LIFO method are increased on a year-over-year basis, certain quantities are carried at costs prevailing in the current year. An actual valuation of inventory under the LIFO method can be made only at the end of the year based on inventory levels
25
and costs at that time. Interim LIFO calculations are based on management reviews of price changes, as well as estimates of expected year-end inventory levels and costs, and are subject to the final year-end LIFO inventory valuation.
OFF-BALANCE SHEET ARRANGEMENTS
We do not have off-balance sheet arrangements that have, or are reasonably likely to have, a current or future material effect on our financial condition, changes in financial condition, revenues or expenses, results of operations, liquidity, capital expenditures or capital resources.
FORWARD-LOOKING STATEMENTS
Certain statements contained in “Management’s Discussion and Analysis of Financial Condition and Results of Operations” and elsewhere in this report constitute “forward-looking statements” within the meaning of Section 27A of the Securities Act of 1933, as amended, and Section 21E of the Securities Exchange Act of 1934, as amended. The Private Securities Litigation Reform Act of 1995 provides a safe harbor for forward-looking statements.
Forward-looking statements are based on management’s current expectations, estimates, assumptions and beliefs about future events, conditions and financial performance. Forward-looking statements are subject to risks, uncertainties and other factors, many of which are outside our control and could cause actual results to differ materially from such statements. Any statement that is not historical in nature is a forward-looking statement. We may identify forward-looking statements with words and phrases such as “expect,” “project,” “forecast,” “outlook,” “estimate,” “anticipate,” “believe,” “could,” “may,” “will,” “plan to,” “intend,” “should” and similar words or expressions.
These risks, uncertainties and other factors include, but are not limited to, deterioration in general economic conditions, both domestic and international, that may adversely affect our business; fluctuations in availability and prices of raw materials, including raw material shortages and other supply chain disruptions, and the inability to pass along or delays in passing along raw material cost increases to our customers; dependence of internal sales and earnings growth on business cycles affecting our customers and growth in the domestic and international coatings industry; market share loss to, and pricing or margin pressure from, larger competitors with greater financial resources; significant indebtedness that restricts the use of cash flow from operations for acquisitions and other investments; our access to capital is subject to global economic and capital market conditions; dependence on acquisitions for growth, and risks related to future acquisitions, including adverse changes in the results of acquired businesses, the assumption of unforeseen liabilities and disruptions resulting from the integration of acquisitions; risks and uncertainties associated with operating in foreign markets, including achievement of profitable growth in developing markets; impact of fluctuations in foreign currency exchange rates on our financial results; loss of business with key customers; our ability to innovate in order to meet customers' product demands, which may change based on customers' preferences and competitive factors; damage to our reputation and business resulting from product claims or recalls, litigation, customer perception and other matters; our ability to respond to technology changes and to protect our technology; possible interruption, failure or compromise of the information systems we use to operate our business; our reliance on the efforts of vendors, government agencies, utilities and other third parties to achieve adequate compliance and avoid disruption of our business; changes in governmental regulation, including more stringent environmental, health and safety regulations; changes in accounting policies and standards and taxation requirements such as new tax laws or revised tax law interpretations; the nature, cost and outcome of pending and future litigation and other legal proceedings; unusual weather conditions adversely affecting sales; civil unrest and the outbreak of war and other significant national and international events; risks relating to our Merger with Sherwin-Williams including, the possibility that the closing conditions to the contemplated transaction may not be satisfied or waived, including that a governmental entity may prohibit, delay or refuse to grant a necessary regulatory approval; delay in closing the transaction or the possibility of non-consummation of the transaction; the potential for regulatory authorities to require divestitures in connection with the proposed transaction and the possibility that Valspar stockholders consequently receive $105 per share instead of $113 per share; the occurrence of any event that could give rise to termination of the Merger Agreement; the risk that stockholder litigation in connection with the contemplated transaction may affect the timing or occurrence of the contemplated transaction or result in significant costs of defense, indemnification and liability; risks inherent in the achievement of cost synergies and the timing thereof; risks related to the disruption of the transaction to Valspar and its management; and the effect of announcement of the transaction on Valspar’s ability to retain and hire key personnel and maintain relationships with customers, suppliers and other third parties.
We caution investors not to place undue reliance on any such forward-looking statements, which speak only as of the date on which such statements were made. We undertake no obligation to subsequently revise any forward-looking statement to reflect new information, events or circumstances after the date of such statement, except as required by law.
26
ITEM 7A QUANTITATIVE AND QUALITATIVE DISCLOSURES ABOUT MARKET RISK
Our foreign sales and results of operations are subject to the impact of foreign currency fluctuations. As most of our underlying costs are denominated in the same currency as our sales, the effect has not been material. We have not used derivative financial instruments to hedge our exposure to translation gains and losses. A 10% adverse change in foreign currency rates is not expected to have a material effect on our results of operations or financial position. A change of greater than 10% in the exchange rates for individual currencies in geographies where we have a significant presence could have a material impact on our net income or financial position. At October 28, 2016, the regions where we have the largest exposure to our net sales, net income and financial position were China (CNY), Europe (EUR), Mexico (MXN), the UK (GBP), Australia (AUD), Brazil (BRL) and Canada (CAD).
We are also subject to interest rate risk. At October 28, 2016, approximately 4.0% of our total debt consisted of floating rate debt. From time to time, we may enter into interest rate derivatives to hedge a portion of either our variable or fixed rate debt. Assuming the current level of borrowings, a 10% increase in interest rates from those in effect at the end of the fourth quarter would not have a material impact on our results of operations or financial position.
27
ITEM 8 FINANCIAL STATEMENTS AND SUPPLEMENTARY DATA
REPORT OF MANAGEMENT ON INTERNAL CONTROL OVER FINANCIAL REPORTING
Board of Directors and Stockholders
The Valspar Corporation
The Valspar Corporation’s (the “Company”) management is responsible for establishing and maintaining adequate internal control over financial reporting, as such term is defined in Exchange Act Rules 13a-15(f). The Company’s internal control system is designed to provide reasonable assurance regarding the reliability of financial reporting and the preparation of financial statements in accordance with U.S. generally accepted accounting principles. Because of its inherent limitations, internal control over financial reporting may not prevent or detect misstatements.
Under the supervision and with the participation of management, including its principal executive officer and principal financial officer, the Company’s management assessed the design and operating effectiveness of internal control over financial reporting as of October 28, 2016 based on criteria set forth in Internal Control – Integrated Framework issued by the Committee of Sponsoring Organizations of the Treadway Commission (2013 framework) (COSO).
Based on this assessment, management concluded that the Company’s internal control over financial reporting was effective as of October 28, 2016. Ernst & Young LLP, an independent registered public accounting firm, has issued an attestation report on the Company’s internal control over financial reporting as of October 28, 2016. That report is included herein.

Gary E. Hendrickson
Chairman and Chief Executive Officer

James L. Muehlbauer
Chief Financial and Administrative Officer
28
REPORT OF INDEPENDENT REGISTERED PUBLIC ACCOUNTING FIRM ON INTERNAL CONTROL OVER FINANCIAL REPORTING
The Board of Directors and Stockholders
The Valspar Corporation
We have audited The Valspar Corporation and subsidiaries’ internal control over financial reporting as of October 28, 2016, based on criteria established in Internal Control-Integrated Framework issued by the Committee of Sponsoring Organizations of the Treadway Commission (2013 framework) (the COSO criteria). The Valspar Corporation’s management is responsible for maintaining effective internal control over financial reporting, and for its assessment of the effectiveness of internal control over financial reporting included in the accompanying Report of Management on Internal Control over Financial Reporting. Our responsibility is to express an opinion on the corporation’s internal control over financial reporting based on our audit.
We conducted our audit in accordance with the standards of the Public Company Accounting Oversight Board (United States). Those standards require that we plan and perform the audit to obtain reasonable assurance about whether effective internal control over financial reporting was maintained in all material respects. Our audit included obtaining an understanding of internal control over financial reporting, assessing the risk that a material weakness exists, testing and evaluating the design and operating effectiveness of internal control based on the assessed risk, and performing such other procedures as we considered necessary in the circumstances. We believe that our audit provides a reasonable basis for our opinion.
A company’s internal control over financial reporting is a process designed to provide reasonable assurance regarding the reliability of financial reporting and the preparation of financial statements for external purposes in accordance with generally accepted accounting principles. A company’s internal control over financial reporting includes those policies and procedures that (1) pertain to the maintenance of records that, in reasonable detail, accurately and fairly reflect the transactions and dispositions of the assets of the company; (2) provide reasonable assurance that transactions are recorded as necessary to permit preparation of financial statements in accordance with generally accepted accounting principles, and that receipts and expenditures of the company are being made only in accordance with authorizations of management and directors of the company; and (3) provide reasonable assurance regarding prevention or timely detection of unauthorized acquisition, use, or disposition of the company’s assets that could have a material effect on the financial statements.
Because of its inherent limitations, internal control over financial reporting may not prevent or detect misstatements. Also, projections of any evaluation of effectiveness to future periods are subject to the risk that controls may become inadequate because of changes in conditions, or that the degree of compliance with the policies or procedures may deteriorate.
In our opinion, The Valspar Corporation and subsidiaries maintained, in all material respects, effective internal control over financial reporting as of October 28, 2016, based on the COSO criteria.
We also have audited, in accordance with the standards of the Public Company Accounting Oversight Board (United States), the consolidated balance sheets of The Valspar Corporation and subsidiaries as of October 28, 2016 and October 30, 2015, and the related consolidated statements of operations, comprehensive income, changes in equity and cash flows for each of the three years in the period ended October 28, 2016, and our report dated December 20, 2016, expressed an unqualified opinion thereon.

Minneapolis, Minnesota
December 20, 2016
29
REPORT OF INDEPENDENT REGISTERED PUBLIC ACCOUNTING FIRM ON CONSOLIDATED FINANCIAL STATEMENTS
The Board of Directors and Stockholders
The Valspar Corporation
We have audited the accompanying consolidated balance sheets of The Valspar Corporation and subsidiaries (the Corporation) as of October 28, 2016 and October 30, 2015, and the related consolidated statements of operations, comprehensive income, changes in equity, and cash flows for each of the three years in the period ended October 28, 2016. Our audits also included the financial statement schedule listed in Item 15 (a). These financial statements and schedule are the responsibility of the Corporation’s management. Our responsibility is to express an opinion on these financial statements and schedule based on our audits.
We conducted our audits in accordance with the standards of the Public Company Accounting Oversight Board (United States). Those standards require that we plan and perform the audit to obtain reasonable assurance about whether the financial statements are free of material misstatement. An audit includes examining, on a test basis, evidence supporting the amounts and disclosures in the financial statements. An audit also includes assessing the accounting principles used and significant estimates made by management, as well as evaluating the overall financial statement presentation. We believe that our audits provide a reasonable basis for our opinion.
In our opinion, the financial statements referred to above present fairly, in all material respects, the consolidated financial position of The Valspar Corporation and subsidiaries at October 28, 2016 and October 30, 2015, and the consolidated results of their operations and their cash flows for each of the three years in the period ended October 28, 2016, in conformity with U.S. generally accepted accounting principles. Also, in our opinion, the related financial statement schedule, when considered in relation to the basic financial statements taken as a whole, presents fairly, in all material respects the information set forth therein.
We also have audited, in accordance with the standards of the Public Company Accounting Oversight Board (United States), The Valspar Corporation and subsidiaries’ internal control over financial reporting as of October 28, 2016, based on criteria established in Internal Control-Integrated Framework issued by the Committee of Sponsoring Organizations of the Treadway Commission (2013 framework), and our report dated December 20, 2016, expressed an unqualified opinion thereon.
Minneapolis, Minnesota
December 20, 2016
30
The Valspar Corporation and Subsidiaries
Consolidated Balance Sheets
(Dollars in thousands, except per share amounts)
October 28, 2016 | October 30, 2015 | |||||||
Assets | ||||||||
Current assets | Cash and cash equivalents | $ | 174,720 | $ | 185,961 | |||
Restricted cash | 857 | 1,307 | ||||||
Accounts and notes receivable net of allowances (2016 - $7,502; 2015 - $9,550) | 815,432 | 857,256 | ||||||
Inventories | 473,294 | 451,909 | ||||||
Deferred income taxes | 32,033 | 37,707 | ||||||
Prepaid expenses and other | 99,949 | 97,090 | ||||||
Total current assets | 1,596,285 | 1,631,230 | ||||||
Goodwill | 1,284,706 | 1,287,703 | ||||||
Intangibles, net | 625,399 | 643,100 | ||||||
Other Assets | 118,543 | 112,735 | ||||||
Long-term deferred income taxes | 21,174 | 11,042 | ||||||
Property, plant and equipment | ||||||||
Land | 73,855 | 75,634 | ||||||
Buildings | 477,795 | 463,716 | ||||||
Machinery and equipment | 1,130,806 | 1,042,988 | ||||||
Property, plant and equipment, gross | 1,682,456 | 1,582,338 | ||||||
Less accumulated depreciation | (1,014,013 | ) | (949,573 | ) | ||||
Property, plant and equipment, net | 668,443 | 632,765 | ||||||
Total assets | $ | 4,314,550 | $ | 4,318,575 | ||||
Liabilities and Stockholders’ Equity | ||||||||
Current liabilities | Short-term debt | $ | 71,339 | $ | 334,022 | |||
Current portion of long-term debt | 150,107 | 131 | ||||||
Trade accounts payable | 553,152 | 553,737 | ||||||
Income taxes payable | 28,216 | 36,010 | ||||||
Other accrued liabilities | 463,006 | 442,839 | ||||||
Total current liabilities | 1,265,820 | 1,366,739 | ||||||
Long-term debt, net of current portion | 1,556,952 | 1,706,933 | ||||||
Long-term deferred income taxes | 191,821 | 240,919 | ||||||
Other long-term liabilities | 186,534 | 148,975 | ||||||
Total liabilities | 3,201,127 | 3,463,566 | ||||||
Stockholders’ equity | ||||||||
Common stock (par value $0.50 per share; authorized - 250,000,000 shares; shares issued, including shares in treasury - 2016: 118,442,624; 2015: 118,442,624) | 59,220 | 59,220 | ||||||
Additional paid-in capital | 495,920 | 474,044 | ||||||
Retained earnings | 2,458,101 | 2,209,628 | ||||||
Accumulated other comprehensive income (loss) | (217,183 | ) | (195,498 | ) | ||||
Less cost of common stock in treasury (2016 - 39,019,811 shares; 2015 - 39,458,773 shares) | (1,682,635 | ) | (1,692,385 | ) | ||||
Total stockholders’ equity | 1,113,423 | 855,009 | ||||||
Total liabilities and stockholders’ equity | $ | 4,314,550 | $ | 4,318,575 | ||||
See Notes to Consolidated Financial Statements
31
The Valspar Corporation and Subsidiaries
Consolidated Statements of Operations
(Dollars in thousands, except per share amounts)
October 28, 2016 | October 30, 2015 | October 31, 2014 | |||||||||
For the Year Ended | (52 weeks) | (52 weeks) | (53 weeks) | ||||||||
Net sales | $ | 4,190,552 | $ | 4,392,622 | $ | 4,625,624 | |||||
Cost of sales | 2,654,968 | 2,841,233 | 3,086,578 | ||||||||
Gross profit | 1,535,584 | 1,551,389 | 1,539,046 | ||||||||
Research and development | 139,318 | 133,365 | 136,381 | ||||||||
Selling, general and administrative | 867,227 | 818,038 | 842,756 | ||||||||
Operating expenses | 1,006,545 | 951,403 | 979,137 | ||||||||
Gain on sale of certain assets | — | 48,001 | — | ||||||||
Income from operations | 529,039 | 647,987 | 559,909 | ||||||||
Interest expense | 90,560 | 81,348 | 65,330 | ||||||||
Other (income) expense - net | 3,960 | 2,838 | 2,697 | ||||||||
Income before income taxes | 434,519 | 563,801 | 491,882 | ||||||||
Income taxes | 81,479 | 164,295 | 146,481 | ||||||||
Net income | $ | 353,040 | $ | 399,506 | $ | 345,401 | |||||
Net income per common share - basic | $ | 4.47 | $ | 4.97 | $ | 4.13 | |||||
Net income per common share - diluted | $ | 4.36 | $ | 4.85 | $ | 4.01 | |||||
See Notes to Consolidated Financial Statements
32
The Valspar Corporation and Subsidiaries
Consolidated Statements of Comprehensive Income
(Dollars in thousands)
October 28, 2016 | October 30, 2015 | October 31, 2014 | |||||||||
For the Year Ended | (52 weeks) | (52 weeks) | (53 weeks) | ||||||||
Net income | $ | 353,040 | $ | 399,506 | $ | 345,401 | |||||
Other comprehensive income (loss): | |||||||||||
Foreign currency translation | (12,167 | ) | (178,309 | ) | (62,783 | ) | |||||
Defined benefit pension and post-retirement plans adjustment | (14,297 | ) | 2,940 | (17,162 | ) | ||||||
Unrealized gain (loss) on financial instruments | 1,251 | 1,006 | 1,879 | ||||||||
Income tax benefit (provision) | 3,528 | (1,465 | ) | 4,977 | |||||||
Other comprehensive income (loss) | (21,685 | ) | (175,828 | ) | (73,089 | ) | |||||
Comprehensive income | $ | 331,355 | $ | 223,678 | $ | 272,312 | |||||
See Notes to Consolidated Financial Statements
33
The Valspar Corporation and Subsidiaries
Consolidated Statements of Changes in Equity
(Dollars in thousands, except per share amounts)
Common Stock | Additional Paid-in Capital | Retained Earnings | Treasury Stock | Accumulated Other Comprehensive Income (Loss) | Total | ||||||||||||||||||
Balance, October 25, 2013 | $ | 59,220 | $ | 444,609 | $ | 1,648,980 | $ | (1,083,678 | ) | $ | 53,419 | $ | 1,122,550 | ||||||||||
Net income | — | — | 345,401 | — | — | 345,401 | |||||||||||||||||
Other comprehensive income (loss) | — | — | — | — | (73,089 | ) | (73,089 | ) | |||||||||||||||
Restricted stock granted for 62,994 Shares, net of forfeitures | — | 2,886 | — | 2,558 | — | 5,444 | |||||||||||||||||
Director stock granted for 11,124 shares | — | 432 | — | 423 | — | 855 | |||||||||||||||||
Common stock options exercised of 1,098,023 shares | — | 7,855 | — | 36,009 | — | 43,864 | |||||||||||||||||
Purchase of shares of common stock for treasury of 4,705,081 shares | — | — | — | (349,181 | ) | — | (349,181 | ) | |||||||||||||||
Cash dividends on common stock – $1.04 per share (net of forfeited restricted stock dividends of $47) | — | — | (87,380 | ) | — | — | (87,380 | ) | |||||||||||||||
Stock option expense | — | 6,382 | — | — | — | 6,382 | |||||||||||||||||
Purchase of equity award shares | — | (3,755 | ) | — | — | — | (3,755 | ) | |||||||||||||||
Balance, October 31, 2014 | $ | 59,220 | $ | 458,409 | $ | 1,907,001 | $ | (1,393,869 | ) | $ | (19,670 | ) | $ | 1,011,091 | |||||||||
Net income | — | — | 399,506 | — | — | 399,506 | |||||||||||||||||
Other comprehensive income (loss) | — | — | — | — | (175,828 | ) | (175,828 | ) | |||||||||||||||
Stock-based compensation, net | — | 10,157 | — | 3,694 | — | 13,851 | |||||||||||||||||
Director stock granted for 15,067 shares | — | 440 | — | 643 | — | 1,083 | |||||||||||||||||
Common stock options exercised of 621,237 shares | — | 3,212 | — | 19,567 | — | 22,779 | |||||||||||||||||
Purchase of shares of common stock for treasury of 3,891,545 shares | — | — | — | (322,420 | ) | — | (322,420 | ) | |||||||||||||||
Cash dividends on common stock – $1.20 per share (net of forfeited restricted stock dividends of $11) | — | — | (96,879 | ) | — | — | (96,879 | ) | |||||||||||||||
Stock option expense | — | 1,826 | — | — | — | 1,826 | |||||||||||||||||
Balance, October 30, 2015 | $ | 59,220 | $ | 474,044 | $ | 2,209,628 | $ | (1,692,385 | ) | $ | (195,498 | ) | $ | 855,009 | |||||||||
Net income | — | — | 353,040 | — | — | 353,040 | |||||||||||||||||
Other comprehensive income (loss) | — | — | — | — | (21,685 | ) | (21,685 | ) | |||||||||||||||
Stock-based compensation, net | — | 18,718 | — | — | — | 18,718 | |||||||||||||||||
Restricted stock vested and common stock options exercised of 660,022 shares | — | 3,158 | — | 27,884 | — | 31,042 | |||||||||||||||||
Purchase of shares of common stock for treasury of 221,060 shares | — | — | — | (18,134 | ) | — | (18,134 | ) | |||||||||||||||
Cash dividends on common stock – $1.32 per share (net of forfeited restricted stock dividends of $14) | — | — | (104,567 | ) | — | — | (104,567 | ) | |||||||||||||||
Balance, October 28, 2016 | $ | 59,220 | $ | 495,920 | $ | 2,458,101 | $ | (1,682,635 | ) | $ | (217,183 | ) | $ | 1,113,423 | |||||||||
See Notes to Consolidated Financial Statements
34
The Valspar Corporation and Subsidiaries
Consolidated Statements of Cash Flows
(Dollars in thousands)
October 28, 2016 | October 30, 2015 | October 31, 2014 | ||||||||||
For the Year Ended | (52 weeks) | (52 weeks) | (53 weeks) | |||||||||
Operating Activities: | ||||||||||||
Net income | $ | 353,040 | $ | 399,506 | $ | 345,401 | ||||||
Adjustments to reconcile net income to net cash (used in)/provided by operating activities: | ||||||||||||
Depreciation | 86,216 | 82,963 | 92,637 | |||||||||
Amortization | 11,806 | 9,640 | 8,273 | |||||||||
Stock-based compensation | 30,250 | 14,793 | 28,314 | |||||||||
Deferred income taxes | (50,206 | ) | (3,058 | ) | (2,107 | ) | ||||||
(Gain)/loss on asset divestitures | (805 | ) | (51,256 | ) | (3,301 | ) | ||||||
Impairment of certain long-lived assets | 5,867 | — | — | |||||||||
Changes in certain assets and liabilities: | ||||||||||||
(Increase)/decrease in accounts and notes receivable | 42,837 | (83,098 | ) | (116,566 | ) | |||||||
(Increase)/decrease in inventories and other assets | (26,136 | ) | (23,102 | ) | (105,841 | ) | ||||||
Increase/(decrease) in trade accounts payable and other accrued liabilities | 31,279 | 48,791 | 84,111 | |||||||||
Increase/(decrease) in income taxes payable | 9,842 | (6,402 | ) | 3,938 | ||||||||
Increase/(decrease) in other non-current liabilities | (9,645 | ) | (5,128 | ) | 7,175 | |||||||
Other | (1,633 | ) | (449 | ) | 5,070 | |||||||
Net cash (used in)/provided by operating activities | 482,712 | 383,200 | 347,104 | |||||||||
Investing Activities: | ||||||||||||
Purchases of property, plant and equipment | (120,420 | ) | (97,126 | ) | (121,271 | ) | ||||||
Acquisition of businesses, net of cash acquired | (24,408 | ) | (346,680 | ) | — | |||||||
Proceeds from divestiture of businesses | — | 54,552 | 4,716 | |||||||||
Cash proceeds on disposal of assets | 10,128 | 7,650 | 3,872 | |||||||||
(Increase)/decrease in restricted cash | 450 | 1,561 | 683 | |||||||||
Net cash (used in)/provided by investing activities | (134,250 | ) | (380,043 | ) | (112,000 | ) | ||||||
Financing Activities: | ||||||||||||
Net proceeds from issuance of debt | — | 1,187,357 | 123,867 | |||||||||
Payments of debt | (2,078 | ) | (635,686 | ) | (118,714 | ) | ||||||
Net change in other borrowings | 3,037 | (13,988 | ) | 8,937 | ||||||||
Net proceeds (repayments) of commercial paper | (265,480 | ) | (61,007 | ) | 66,393 | |||||||
Proceeds from stock options exercised | 16,416 | 12,043 | 24,233 | |||||||||
Treasury stock purchases | (18,134 | ) | (322,420 | ) | (349,181 | ) | ||||||
Excess tax benefit from stock-based compensation | 14,626 | 13,150 | 19,161 | |||||||||
Dividends paid | (104,553 | ) | (96,890 | ) | (87,427 | ) | ||||||
Net cash (used in)/provided by financing activities | (356,166 | ) | 82,559 | (312,731 | ) | |||||||
Increase/(decrease) in cash and cash equivalents | (7,704 | ) | 85,716 | (77,627 | ) | |||||||
Effect of exchange rate changes on cash and cash equivalents | (3,537 | ) | (27,958 | ) | (10,320 | ) | ||||||
Cash and cash equivalents at beginning of period | 185,961 | 128,203 | 216,150 | |||||||||
Cash and cash equivalents at end of period | $ | 174,720 | $ | 185,961 | $ | 128,203 | ||||||
Interest and income taxes paid: | ||||||||||||
Interest paid, net of amounts capitalized | $ | 90,378 | $ | 76,847 | $ | 65,297 | ||||||
Income taxes paid | $ | 120,183 | $ | 155,283 | $ | 104,291 | ||||||
See Notes to Consolidated Financial Statements
35
Notes to Consolidated Financial Statements
The Valspar Corporation and Subsidiaries
Years Ended October 2016, 2015 and 2014
(Dollars in thousands, except per share amounts)
NOTE 1 – SIGNIFICANT ACCOUNTING POLICIES
Description of Business: The Valspar Corporation (Valspar, the Company, we, us or our) is a global leader in the paints and coatings industry. We develop, manufacture and distribute a broad range of coatings, paints and related products, and operate our business in two reportable segments: Coatings and Paints.
Proposed Merger with The Sherwin-Williams Company
On March 19, 2016, Valspar entered into an Agreement and Plan of Merger (the Merger Agreement) with The Sherwin-Williams Company (Sherwin-Williams) and Viking Merger Sub, Inc., a wholly-owned subsidiary of Sherwin-Williams (Merger Sub).
The Merger Agreement provides that, among other things and subject to the terms and conditions of the Merger Agreement, (1) Merger Sub will be merged with and into Valspar (the Merger), with Valspar surviving the Merger as a wholly-owned subsidiary of Sherwin-Williams, and (2) at the effective time of the Merger, each outstanding share of common stock of Valspar, par value $0.50 per share (Valspar common stock) (other than Valspar common stock held in treasury by Valspar, owned by a subsidiary of Valspar or owned by Sherwin-Williams or any of its wholly-owned subsidiaries, or shares with respect to which appraisal rights have been validly exercised and not lost in accordance with Delaware law) will be converted into the right to receive the Merger Consideration.
The Merger Consideration means $113.00 per share in cash, except that if Sherwin-Williams is required, in order to obtain the necessary antitrust approvals, to commit to any divestiture, license, hold separate, sale or other disposition of or with respect to assets, businesses or product lines of Valspar, Sherwin-Williams or their subsidiaries representing, in the aggregate, in excess of $650 million of Net Sales (as defined in the Merger Agreement), then the Merger Consideration will be $105.00 per share in cash.
The Merger Agreement contains certain termination rights, and we may be required to pay Sherwin-Williams a termination fee of $300 million.
For further information on the Merger Agreement, refer to the Merger Agreement, a copy of which was filed as Exhibit 2.1 to our Current Report on Form 8-K filed with the Securities and Exchange Commission on March 21, 2016, and which is incorporated by reference herein.
On June 29, 2016, Valspar stockholders voted to adopt the Merger Agreement at a special meeting of stockholders held for that purpose. Completion of the Merger remains subject to certain closing conditions, including the expiration or termination of the applicable waiting period under the U.S. Hart-Scott-Rodino Antitrust Improvements Act and the receipt of regulatory approvals in certain other jurisdictions.
In connection with the proposed Merger, we recognized costs of $28,021 for the year ended October 28, 2016 in selling, general and administrative expenses in the Consolidated Statements of Operations, for employee-related expenses, professional services and regulatory fees.
Fiscal Year: We have a 4-4-5 week accounting cycle with the fiscal year ending on the Friday on or immediately preceding October 31. Fiscal years 2016 and 2015 both include 52 weeks while 2014 includes 53 weeks.
Principles of Consolidation: The consolidated financial statements include the accounts of the parent company and its subsidiaries. All intercompany accounts and transactions have been eliminated in consolidation. Investments in which we have significant influence and where we do not have management control and are not the primary beneficiary are accounted for using the equity method. In order to facilitate our year-end closing process, foreign subsidiaries’ financial results are included in our consolidated financial statements on a one-month lag.
Estimates: The preparation of financial statements in conformity with United States generally accepted accounting principles (GAAP) requires us to make estimates and assumptions that affect the amounts reported in the financial statements and accompanying notes. Such estimates and assumptions impact, among others, the following: the amount of revenue deferred under extended furniture protection plans, the amount of accounts receivable that will be uncollectible, the amount of customer rebates owed, the amount of inventory reserves, the amount to be paid for other liabilities, including contingent liabilities, assumptions around the valuation of goodwill and indefinite-lived intangible assets, including impairment, our pension expense and pension funding requirements, the fair value of stock option awards and the computation of our income tax expense and liability. Actual results could differ from these estimates.
36
Revenue Recognition: We recognize revenue from product sales at the time the product is delivered or title has passed, a sales agreement is in place, pricing is fixed or determinable and collection is reasonably assured. Discounts provided to customers at the point of sale are recognized as reductions in revenue as the products are sold. We offer promotional and rebate programs to our customers. These programs require estimates of customer participation and performance and are recorded at the time of sale as deductions from revenue. We also offer consumer programs to promote the sale of our products and record them as a reduction in revenue at the time the consumer offer is made using estimated redemption and participation. Revenues exclude sales taxes collected from our customers.
Additionally, in the U.S., we sell extended furniture protection plans for which revenue is deferred and recognized over the life of the contract. An actuarial study utilizing historical claims data is used to forecast claim payments over the contract period and revenue is recognized based on the forecasted claims payments. Actual claims costs are reflected in earnings in the period incurred. Anticipated losses on programs in progress are charged to earnings when identified. Differences between estimated and actual results, which have been insignificant historically, are recognized as a change in management estimate in a subsequent period.
Freight Costs: Freight costs on shipments to our customers are included in cost of sales.
Allowance for Doubtful Accounts: We estimate the allowance for doubtful accounts by analyzing accounts receivable by age and specific collection risk. When it is deemed probable that a customer account is uncollectible, such as in the event of bankruptcy or other circumstances that make further collection unlikely, that balance is written off against the existing allowance.
Cash Equivalents: We consider all highly liquid instruments purchased with an original maturity of less than three months to be cash equivalents.
Restricted Cash: Restricted cash represents cash that is restricted from withdrawal for contractual or legal reasons.
Inventories: Inventories are stated at the lower of cost or market. Our domestic inventories, except for our Quest Specialty Chemicals (Quest) subsidiaries, are recorded using the last-in, first-out (LIFO) method. The remaining inventories are recorded using the first-in, first-out (FIFO) method.
Other Assets: We have long-term contracts with certain customers, under which we are obligated to make various up-front payments for which we expect to receive a benefit in excess of the cost over the term of the contract. These up-front payments are deferred and reflected in other assets. Contract incentives are amortized on a straight-line basis over the term of the contract, while equipment is amortized on a straight-line basis over the shorter of the economic life of the equipment or the term of the contract. Amortization expense for contract incentives is classified in our Consolidated Statements of Operations as a reduction of revenue. In certain circumstances, payments for equipment will meet the specific identifiable benefit criteria and the amortization expense will be classified in operating expenses.
Goodwill and Indefinite-Lived Intangible Assets: Goodwill represents the excess of cost over the fair value of identifiable net assets of businesses acquired. Indefinite-lived intangible assets primarily consist of purchased technology, trademarks and trade names.
Goodwill for each of our reporting units and indefinite-lived assets is tested for impairment at least annually during the fourth quarter, and between annual tests if an event occurs, or circumstances change. A reporting unit is an operating segment or a component of an operating segment for which discrete financial information is available and reviewed by management on a regular basis. We have determined that we have four separate reporting units with goodwill. There was no change to our reporting units in 2016, 2015 or 2014.
The goodwill test involves a two-step process. The first step is a comparison of the reporting unit’s fair value to its carrying value, including goodwill. If the reporting unit’s fair value exceeds its carrying value, no further procedures are required. However, if the reporting unit’s fair value is less than the carrying value, an impairment of goodwill may exist, requiring a second step to measure the amount of impairment loss. In step 2, we would calculate the implied fair value of goodwill by deducting the fair value of all tangible and intangible net assets (including unrecognized intangible assets) of the reporting unit from the fair value of the reporting unit. If the implied fair value of goodwill is less than the recorded goodwill, an impairment charge is recorded for the difference.
In applying the goodwill and indefinite-lived intangible assets impairment tests, we may assess qualitative factors to determine whether it is more likely than not that the fair value of the reporting units is less than its carrying value (step 0). Qualitative factors may include, but are not limited to, economic, market and industry conditions, cost factors, and overall financial performance of the reporting unit. If, after assessing these qualitative factors, the Company determines it is more likely than not that the carrying value is less than the fair value, then performing the two-step impairment test is unnecessary.
37
For the two-step impairment test, in step 1, we calculate the fair value of the reporting units weighting the income approach and the market approach which is then compared with the reporting units carrying value. For the income approach, we utilize a discounted cash flow where the discount rate reflects the weighted average costs of capital. The income approach is most sensitive to the discount rate, long-term sales growth rates and forecasted operating margins. For the market approach, average revenue and earnings before interest, tax, depreciation and amortization multiples derived from our peer group are weighted and adjusted for size, risk and growth of the individual reporting unit to determine the reporting unit’s business enterprise fair value. Additionally, in assessing goodwill impairment, we consider the implied control premium and if it is reasonable based on other recent market transactions.
For indefinite-lived intangible assets, we utilize a relief from royalty method when applying the quantitative assessment. The relief from royalty method is most sensitive to the discount rate, royalty rate and long-term sales growth rates. If the carrying value of the indefinite-lived intangible assets exceeds the fair value of the asset, the carrying value is written down to fair value in the period identified.
The following is a description of the goodwill and indefinite-lived assets impairment tests performed for each of the fiscal years:
Fiscal Year 2016
During the annual goodwill and indefinite-lived intangible assets impairment tests, we assessed qualitative factors to determine whether it was more likely than not that the fair value of each reporting unit is less than its carrying value (step 0). We concluded that it was more likely than not that the carrying value was less than the fair value. Accordingly, we did not perform a two-step quantitative analysis.
Fiscal Years 2015 and 2014
During the annual impairment tests, we performed step 1 of the quantitative goodwill impairment test. In both years, we determined that the fair value exceeded the carrying value and did not perform step 2.
During the annual impairment tests, we performed step 1 of the indefinite-lived intangible assets impairment test. In both years, we determined that the fair value exceeded the carrying value and did not perform further analysis.
Impairment of Long-Lived Tangible and Intangible Assets with Finite Lives: We evaluate long-lived assets, including tangible and intangible assets with finite lives, for indicators of impairment. An impairment loss is recognized whenever events or changes in circumstances indicate the carrying amount of an asset is not recoverable. When reviewing for impairment, assets are grouped and evaluated at the lowest level for which there are identifiable cash flows that are largely independent of the cash flows of other groups of assets. We consider historical performance and future estimated results in our evaluation of impairment. If the carrying amount of the asset exceeds expected undiscounted future cash flows, we measure the amount of impairment by comparing the carrying amount of the asset to its fair value. Intangibles with finite lives (primarily customer lists and patents) are amortized using the straight-line method over the estimated useful lives.
Property, Plant and Equipment: Property, plant and equipment, including capitalized interest, are recorded at cost. Property under capital lease is being amortized as a provision for depreciation over the shorter of the lease or their useful lives. Expenditures that improve or extend the life of the respective assets are capitalized, while maintenance and repairs are expensed as incurred. Provision for depreciation of property, plant and equipment are made by charges to operations at rates calculated to amortize the cost of the property, plant and equipment over their useful lives (20 years for buildings; 1 to 10 years for machinery and equipment) primarily using the straight-line method.
Stock-Based Compensation: We recognized compensation expense for our stock-based compensation plans, which include non-qualified stock options, cash settled restricted stock units, restricted stock, and other equity settled awards. Expense for options with graded vesting is recognized using the straight-line method. The fair value of stock-based compensation is determined at the grant date and the recognition of the related expense is recorded over the requisite service period of the award. Share awards are issued from common stock in treasury. See Note 10 for additional information.
Advertising Costs: Advertising costs are expensed as incurred and totaled $49,393, $56,697 and $81,855 in 2016, 2015 and 2014, respectively.
Foreign Currency Translation: Foreign currency denominated assets and liabilities are translated into U.S. dollars using the exchange rates in effect at the balance sheet date. Results of operations are translated using the average exchange rates throughout the period. The effect of exchange rate fluctuations on translation of assets and liabilities is recorded as a component of stockholders’
38
equity (accumulated other comprehensive income (loss)). Gains and losses from foreign currency transactions are included in other expense (income), net.
Financial Instruments: All financial instruments are held for purposes other than trading. See Note 8 for additional information.
Research and Development: Research and development is expensed as incurred.
NOTE 2 – ACQUISITIONS AND DIVESTITURES
On February 4, 2016, we purchased ISVA Vernici (ISVA), a European coil coatings manufacturer headquartered in Turin, Italy, for total consideration of approximately $23,000. The ISVA acquisition extends our manufacturing footprint in Europe and brings customers an expanded product offering and increased customer service capabilities. The acquisition was recorded at fair value in our Coatings segment and an allocation of the purchase price has been substantially completed, with the exception of certain tax items. These adjustments are not expected to have a material impact on our consolidated financial statements. We expect to finalize the purchase price allocation within one year of the date of acquisition. The assets, liabilities and operating results have been included in our financial statements from the date of acquisition.
On June 1, 2015, we purchased the performance coating businesses of Quest, which include automotive refinish, aerosol and related specialty paint products, for total consideration of approximately $350,000. The acquisition strengthens our value proposition in automotive refinish and broadens distribution and range of high-performance products. The acquisition was recorded at fair value primarily in our Paints segment and an allocation of the purchase price has been completed. The assets, liabilities and operating results have been included in our financial statements from the date of acquisition.
Pro forma results of operations for the acquisitions noted above have not been presented, as they were immaterial to the reported results.
On December 17, 2014, we completed the divestiture of a non-strategic specialty product line in our Coatings segment. The divested assets consisted primarily of goodwill, working capital and intellectual property. The pro forma results of operations for this divestiture have not been presented, as the impact on the reported results is not material. We recorded a pre-tax gain on the sale of the product line of approximately $48,001 to income from operations.
NOTE 3 – INVENTORIES
The major classes of inventories consist of the following:
2016 | 2015 | ||||||
Manufactured products | $ | 287,040 | $ | 268,832 | |||
Raw materials, supplies and work-in-progress | 186,254 | 183,077 | |||||
Total inventories | $ | 473,294 | $ | 451,909 | |||
Our international inventories are recorded using the first-in, first-out (FIFO) method. Domestic inventories, except for Quest, are recorded using the last-in, first-out (LIFO) method. Total LIFO inventories were $205,161 at October 28, 2016 and $190,132 at October 30, 2015, approximately $49,804 and $55,780 lower, respectively, than such costs determined under the FIFO method.
39
NOTE 4 – GOODWILL AND INTANGIBLE ASSETS
The changes in the carrying amount of goodwill for the fiscal years ended October 28, 2016 and October 30, 2015 are as follows:
Coatings | Paints | Other | Total | ||||||||||||
Balance, October 31, 2014 | $ | 836,594 | $ | 263,855 | $ | 25,375 | $ | 1,125,824 | |||||||
Goodwill acquired | 2,474 | 214,140 | — | 216,614 | |||||||||||
Goodwill disposed | (3,764 | ) | — | — | (3,764 | ) | |||||||||
Currency translation gain (loss) | (41,291 | ) | (7,437 | ) | (2,243 | ) | (50,971 | ) | |||||||
Balance, October 30, 2015 | $ | 794,013 | $ | 470,558 | $ | 23,132 | $ | 1,287,703 | |||||||
Goodwill acquired | 11,845 | — | — | 11,845 | |||||||||||
Measurement period adjustment | — | (3,521 | ) | — | (3,521 | ) | |||||||||
Currency translation gain (loss) | (4,791 | ) | (6,392 | ) | (138 | ) | (11,321 | ) | |||||||
Balance, October 28, 2016 | $ | 801,067 | $ | 460,645 | $ | 22,994 | $ | 1,284,706 | |||||||
Information regarding our intangible assets is as follows:
Estimated Useful Life | Carrying Amount | Accumulated Amortization | Net | ||||||||||
Balance, October 28, 2016 | |||||||||||||
Customer lists | 15 to 40 years | $ | 328,343 | $ | (87,478 | ) | $ | 240,865 | |||||
Technology | Indefinite | 172,381 | — | 172,381 | |||||||||
Trademarks | Indefinite | 202,894 | — | 202,894 | |||||||||
Other | 2 to 50 years | 24,246 | (14,987 | ) | 9,259 | ||||||||
Total | $ | 727,864 | $ | (102,465 | ) | $ | 625,399 | ||||||
Balance, October 30, 2015 | |||||||||||||
Customer lists | 20 to 40 years | $ | 327,782 | $ | (76,070 | ) | $ | 251,712 | |||||
Technology | Indefinite | 175,652 | — | 175,652 | |||||||||
Trademarks | Indefinite | 208,261 | — | 208,261 | |||||||||
Other | 10 to 50 years | 22,064 | (14,589 | ) | 7,475 | ||||||||
Total | $ | 733,759 | $ | (90,659 | ) | $ | 643,100 | ||||||
The decrease in goodwill during fiscal year 2016 is primarily due to foreign currency translation and measurement period adjustments for the Quest acquisition, offset by goodwill acquired from the ISVA acquisition. The decrease in intangible assets during fiscal year 2016 is due to foreign currency translation and amortization, offset by customer lists and trademarks acquired from acquisitions.
The increase in goodwill during fiscal year 2015 is due to the Quest acquisition partially offset by foreign currency translation and the divestiture of a non-strategic specialty product offering in our Coatings segment. The increase in intangible assets during fiscal year 2015 is primarily due to acquired customer lists, trademarks and technology as part of the Quest acquisition, partially offset by foreign currency translation and amortization.
Total intangible asset amortization expense was $11,806, $9,640, and $8,273 in 2016, 2015 and 2014, respectively. The remaining life averages for assets included in the customer lists and other categories is 24 years and 28 years, respectively. Estimated amortization expense for each of the five succeeding fiscal years is approximately $12,000 annually.
40
NOTE 5 – SUPPLEMENTAL DISCLOSURES RELATED TO CURRENT LIABILITIES
Other accrued liabilities include the following:
2016 | 2015 | ||||||
Employee compensation | $ | 168,234 | $ | 149,838 | |||
Customer volume rebates and incentives | 98,748 | 91,933 | |||||
Uninsured loss reserves and deferred revenue | 60,343 | 59,040 | |||||
Taxes, insurance, professional fees and services | 42,777 | 45,755 | |||||
Interest | 25,993 | 25,856 | |||||
Contribution to employees' retirement trusts | 24,296 | 16,218 | |||||
Advertising and promotions | 15,242 | 17,264 | |||||
Restructuring | 7,727 | 12,065 | |||||
Deferred tax liability | 576 | 1,512 | |||||
Other | 19,070 | 23,358 | |||||
Total other accrued liabilities | $ | 463,006 | $ | 442,839 | |||
NOTE 6 – GUARANTEES
Furniture Protection Plans: We sell extended furniture protection plans and offer warranties for certain products. In the U.S., revenue related to furniture protection plans is deferred and recognized over the contract life. The range of contractual lives for our extended furniture protection plans is three years to lifetime warranty (estimated as 20 years). We have not sold lifetime warranty plans since 2005. Our furniture protection plans outstanding as of October 28, 2016 have a weighted average contractual life of approximately 11 years; however, we expect to pay substantially all of the claims for such plans within five years. We periodically assess the adequacy of these recorded amounts and adjust as necessary. Provisions for estimated losses on uncompleted furniture protection plan contracts are made in the period in which such losses can be estimated. The extended furniture protection plans that we enter into have fixed prices. To the extent the actual costs to complete contracts differ from the amounts estimated as of the date of the financial statements, gross margin would be affected in future periods when we revise our estimates.
Warranties: We offer warranties for certain products. For product warranties, we estimate the costs that may be incurred under these warranties based on historical claims data and record a liability in the amount of such costs at the time revenue is recognized. Anticipated losses are charged to earnings when identified.
Changes in the recorded amounts included in other accrued liabilities, both short and long-term during the three years ended October 28, 2016 are as follows:
Balance, October 25, 2013 | $ | 78,818 | |
Additional net deferred revenue/accrual made during the period | 8,982 | ||
Payments made during the period | (7,173 | ) | |
Balance, October 31, 2014 | $ | 80,627 | |
Additional net deferred revenue/accrual made during the period | 11,086 | ||
Payments made during the period | (8,842 | ) | |
Balance, October 30, 2015 | $ | 82,871 | |
Additional net deferred revenue/accrual made during the period | 17,275 | ||
Payments made during the period | (10,108 | ) | |
Balance, October 28, 2016 | $ | 90,038 | |
NOTE 7 – FAIR VALUE MEASUREMENT
We measure certain assets and liabilities at fair value or disclose the fair value of certain assets and liabilities recorded at cost in the Consolidated Financial Statements on both a recurring and non-recurring basis. Fair value is defined as an exit price, or the amount that would be received to sell an asset or paid to transfer a liability in an orderly transaction between market participants at the measurement date. The fair value accounting rules establish a hierarchy for inputs used in measuring fair value that maximizes the use of observable inputs and minimizes use of unobservable inputs. Observable inputs must be used when available. Observable
41
inputs are inputs that market participants would use in valuing the asset or liability based on market data obtained from independent sources. Unobservable inputs are inputs that reflect our assumptions about the factors market participants would use in valuing the asset or liability based upon the best information available. Assets and liabilities measured at fair value are to be categorized into one of the three hierarchy levels based on the inputs used in the valuation. We classify assets and liabilities in their entirety based on the lowest level of input significant to the fair value measurement. Transfers of instruments between levels are recorded based on end of period values. There were no transfers between levels for all periods presented. The three levels are defined as follows:
• | Level 1: Observable inputs based on quoted prices (unadjusted) in active markets for identical assets or liabilities. |
• | Level 2: Observable inputs based on quoted prices for similar assets and liabilities in active markets, or quoted prices for identical assets and liabilities in inactive markets. |
• | Level 3: Unobservable inputs that reflect an entity’s own assumptions about what inputs a market participant would use in pricing the asset or liability based on the best information available in the circumstances. |
Recurring Fair Value Measurements
The following tables provide information by level for assets and liabilities that are recorded at fair value on a recurring basis:
Fair Value at October 28, 2016 | Fair Value Measurements Using Inputs Considered as | ||||||||||||||
Level 1 | Level 2 | Level 3 | |||||||||||||
Assets | |||||||||||||||
Cash equivalents | $ | 39,842 | $ | 39,842 | $ | — | $ | — | |||||||
Restricted cash1 | 857 | 857 | — | — | |||||||||||
Foreign currency contracts2 | 267 | — | 267 | — | |||||||||||
Deferred compensation plan assets3 | 12,864 | 12,864 | — | — | |||||||||||
Total assets | $ | 53,830 | $ | 53,563 | $ | 267 | $ | — | |||||||
Fair Value at October 30, 2015 | Fair Value Measurements Using Inputs Considered as | ||||||||||||||
Level 1 | Level 2 | Level 3 | |||||||||||||
Assets | |||||||||||||||
Cash equivalents | $ | 26,139 | $ | 26,139 | $ | — | $ | — | |||||||
Restricted cash1 | 1,307 | 1,307 | — | — | |||||||||||
Foreign currency contracts2 | 207 | — | 207 | — | |||||||||||
Deferred compensation plan assets3 | 6,579 | 6,579 | — | — | |||||||||||
Total assets | $ | 34,232 | $ | 34,025 | $ | 207 | $ | — | |||||||
1 Restricted cash represents cash that is restricted from withdrawal for contractual or legal reasons.
2 In the Consolidated Balance Sheets, foreign currency contracts are included in prepaid expenses and other when in an asset position and other accrued liabilities when in a liability position. The fair market value was estimated using observable market data for similar financial instruments. See Note 8 for additional information on derivative financial instruments.
3 The Deferred Compensation Plan Assets consist of the investment funds maintained for the future payments under the Company's deferred compensation plan, which is structured as a rabbi trust. Investments held in the rabbi trust are publicly-traded mutual funds. Rabbi trust assets are considered irrevocable, and may only be used to pay participant benefits under the plan. The only exception is the event of bankruptcy, in which case the assets in the rabbi trust would be subject to the claims of creditors of the corporation. In the Consolidated Balance Sheets, rabbi trust assets are included in other assets.
The following tables provide information regarding the estimated fair value of our outstanding debt which is recorded at carrying value in the Consolidated Balance Sheets:
Fair Value at October 28, 2016 | Fair Value Measurements Using Inputs Considered as | ||||||||||||||
Level 1 | Level 2 | Level 3 | |||||||||||||
Debt1 | |||||||||||||||
Publicly traded debt | $ | 1,777,957 | $ | 1,777,957 | $ | — | $ | — | |||||||
Non-publicly traded debt | 78,398 | — | 78,398 | — | |||||||||||
Total debt | $ | 1,856,355 | $ | 1,777,957 | $ | 78,398 | $ | — | |||||||
42
Fair Value at October 30, 2015 | Fair Value Measurements Using Inputs Considered as | ||||||||||||||
Level 1 | Level 2 | Level 3 | |||||||||||||
Debt1 | |||||||||||||||
Publicly traded debt | $ | 1,741,003 | $ | 1,741,003 | $ | — | $ | — | |||||||
Non-publicly traded debt | 341,086 | — | 341,086 | — | |||||||||||
Total debt | $ | 2,082,089 | $ | 1,741,003 | $ | 341,086 | $ | — | |||||||
1 Debt is recorded at carrying value of $1,778,398 and $2,041,086 on the Consolidated Balance Sheets as of October 28, 2016 and October 30, 2015, respectively. The fair value of our publicly traded debt is based on quoted prices (unadjusted) in active markets. The fair value of our non-publicly traded debt was estimated using a discounted cash flow analysis based on our current borrowing costs for debt with similar maturities. In addition, the carrying values of our commercial paper included in non-publicly traded debt approximate the financial instrument’s fair value as the maturities are less than three months. See Note 9 for additional information on debt.
Nonrecurring Fair Value Measurements
We measure certain assets at fair value on a nonrecurring basis. These assets primarily include assets acquired and liabilities assumed as part of an acquisition, as well as property, plant and equipment when the planned use of the asset changes. See Note 2 for additional information on our acquisitions and Note 18 for additional information on restructuring.
NOTE 8 – DERIVATIVE FINANCIAL INSTRUMENTS
We use derivative financial instruments to manage interest rate and foreign currency exchange risks. We enter into derivative financial instruments with high-credit quality counterparties and diversify our positions among such counterparties to reduce our exposure to credit losses. We do not have any credit-risk-related contingent features in our derivative contracts as of October 28, 2016.
At October 28, 2016, we had $6,141 notional amount of foreign currency contracts that mature during fiscal year 2017. These foreign currency contracts have been designated as cash flow hedges with unrealized gains or losses recorded in accumulated other comprehensive income (loss). Gains and losses are reclassified from accumulated other comprehensive income (loss) to other expense (income) in the Consolidated Statements of Operations when the underlying hedged item is realized. At October 30, 2015, we had $8,903 notional amount of foreign currency contracts maturing in fiscal year 2016. There was no material ineffectiveness for these hedges during 2016 or 2015.
At October 28, 2016 and October 30, 2015, we had no treasury lock contracts in place. The accumulated other comprehensive loss amount in our Consolidated Balance Sheets as of October 28, 2016 and October 30, 2015 represents the unamortized gains and losses, net of tax, from treasury lock contracts settled in previous periods. Unamortized gains and losses are reclassified ratably from accumulated other comprehensive income (loss) to interest expense in our Consolidated Statements of Operations over the term of the related debt. At October 28, 2016, the amount that will be recognized in interest expense in fiscal year 2017 is $1,402.
Our derivative assets and liabilities subject to fair value measurement (see Note 7) include the following:
Fair Value at October 28, 2016 | Fair Value at October 30, 2015 | ||||||
Assets | |||||||
Prepaid expenses and other: | |||||||
Foreign currency contracts | $ | 267 | $ | 207 | |||
Total assets | $ | 267 | $ | 207 | |||
43
Derivative gains (losses) recognized in accumulated other comprehensive income (AOCI) and on the Consolidated Statements of Operations for fiscal year ended October 28, 2016 and October 30, 2015, respectively, are as follows:
For the Year Ended October 28, 2016 | Amount of Gain (Loss) Recognized in AOCI | Statement of Operations Classification | Amount of Gain (Loss) Recognized in Earnings | ||||||
Derivatives designated as cash flow hedges | |||||||||
Foreign currency contracts | $ | 60 | Other income (expense), net | $ | 511 | ||||
Treasury lock contracts | 1,191 | Interest expense | (1,191 | ) | |||||
Total derivatives designated as cash flow hedges | $ | 1,251 | Total | $ | (680 | ) | |||
For the Year Ended October 30, 2015 | Amount of Gain (Loss) Recognized in AOCI | Statement of Operations Classification | Amount of Gain (Loss) Recognized in Earnings | ||||||
Derivatives designated as cash flow hedges | |||||||||
Foreign currency contracts | $ | (248 | ) | Other income (expense), net | $ | 1,269 | |||
Treasury lock contracts | 1,254 | Interest expense | (1,254 | ) | |||||
Total derivatives designated as cash flow hedges | $ | 1,006 | Total | $ | 15 | ||||
NOTE 9 – DEBT
Our debt consists of the following:
2016 | 2015 | ||||||
Notes to banks (weighted average interest rate of 2.74% at October 28, 2016 and 9.28% at October 30, 2015) | $ | 8,950 | $ | 6,153 | |||
Commercial paper (1.00% - 1.10% at October 28, 2016 and 0.43% - 0.50% at October 30, 2015) | 62,389 | 327,869 | |||||
Total short-term debt | 71,339 | 334,022 | |||||
Capital leases | 107 | 131 | |||||
Senior notes - due 2017 at 6.05% | 150,000 | — | |||||
Total current portion of long-term debt | 150,107 | 131 | |||||
Notes to banks (weighted average interest rate 1.94% at October 28, 2016 and 0.00% at October 30, 2015) | 132 | 6 | |||||
Capital leases | 6,820 | 6,927 | |||||
Senior notes (at fixed rates) | |||||||
Due 2017 at 6.05% | — | 150,000 | |||||
Due 2019 at 7.25% | 300,000 | 300,000 | |||||
Due 2022 at 4.20% | 400,000 | 400,000 | |||||
Due 2025 at 3.30% | 250,000 | 250,000 | |||||
Due 2026 at 3.95% | 350,000 | 350,000 | |||||
Due 2045 at 4.40% | 250,000 | 250,000 | |||||
Total long-term debt | 1,556,952 | 1,706,933 | |||||
Total debt | $ | 1,778,398 | $ | 2,041,086 | |||
During 2016, $150,000 of unsecured Senior Notes that mature on May 1, 2017 were reclassified as current portion of long-term debt.
On August 3, 2015, we retired $150,000 of unsecured Senior Notes in accordance with their scheduled maturity using commercial paper.
On July 27, 2015, we issued $350,000 of unsecured Senior Notes that mature on January 15, 2026 with a coupon rate of 3.95%. The net proceeds of the issuance were approximately $345,000. The public offering was made pursuant to a registration statement
44
filed with the U.S. Securities and Exchange Commission (SEC). We used the net proceeds from this offering for the repayment of borrowings under the term loan credit facility that was entered into on May 29, 2015.
On May 29, 2015, we entered into a $350,000 term loan credit agreement with a syndicate of banks with a maturity date of November 29, 2016. This facility was used to provide funding for the acquisition of Quest. See Note 2 in the Consolidated Financial Statements for further information on the acquisition. This facility was repaid and terminated on July 29, 2015 primarily using the net proceeds from the unsecured Senior Notes issued in July 2015.
On January 21, 2015, we issued $250,000 of unsecured Senior Notes that mature on February 1, 2025 with a coupon rate of 3.30%, and $250,000 of unsecured Senior Notes that mature on February 1, 2045 with a coupon rate of 4.40%. The net proceeds of both issuances were approximately $492,000 in the aggregate. The public offering was made pursuant to a registration statement filed with the SEC. We used the net proceeds to repay short-term borrowings under our commercial paper program and credit facility in the first quarter of 2015.
We maintain a $750,000 unsecured revolving credit facility with a syndicate of banks with a maturity date of December 14, 2018. Under certain circumstances we have the option to increase this credit facility to $1,000,000.
In July 2013, we entered into a U.S. dollar equivalent unsecured committed revolving bilateral credit facility, expiring July 2014. In July 2014, this facility was extended for one year to July 2015. We paid off and terminated the bilateral credit facility in December 2014.
We have a capital lease covering a building that terminates in 2034. Refer to Note 17 for additional information on leasing arrangements.
As of October 28, 2016 and October 30, 2015, our bank credit facilities consisted of the following:
October 28, 2016 | |||||||
Total Outstanding | Facility Size | ||||||
December 2018 unsecured committed credit revolving facility1 | $ | 62,389 | $ | 750,000 | |||
Uncommitted bank lines of credit | 8,950 | 109,825 | |||||
Total bank credit facilities | $ | 71,339 | $ | 859,825 | |||
October 30, 2015 | |||||||
Total Outstanding | Facility Size | ||||||
December 2018 unsecured committed credit revolving facility1 | $ | 327,869 | $ | 750,000 | |||
Uncommitted bank lines of credit | 6,153 | 97,512 | |||||
Total bank credit facilities | $ | 334,022 | $ | 847,512 | |||
1 | We have a $450,000 commercial paper program backed by our $750,000 bank syndicate committed credit revolving facility, as amended and restated. We pay a 0.15% per year commitment fee on the full amount of the facility. The facility includes $62,389 and $327,869 of commercial paper as of October 28, 2016 and October 30, 2015, respectively. |
Our unsecured committed credit revolving facility has covenants that require us to maintain certain financial ratios. We were in compliance with these covenants as of October 28, 2016. Our debt covenants do not limit, nor are they reasonably likely to limit, our ability to obtain additional debt or equity financing.
We maintain uncommitted bank lines of credit to meet short-term funding needs in certain of our international locations. These arrangements are reviewed periodically for renewal and modification. Borrowings under these debt arrangements had an average annual interest rate of 4.46% in 2016, 10.92% in 2015 and 12.30% in 2014.
Our short-term debt consists primarily of commercial paper. The weighted-average annual interest rates on outstanding short-term borrowings were 1.27% and 0.64% on October 28, 2016 and October 30, 2015, respectively. To ensure availability of funds, we maintain uncommitted bank lines of credit sufficient to cover outstanding short-term borrowings. These arrangements are reviewed periodically for renewal and modification.
45
The future maturities of long-term debt are as follows:
Maturities | |||
2017 | $ | 150,107 | |
2018 | 126 | ||
2019 | 300,000 | ||
2020 | — | ||
2021 | — | ||
Thereafter | 1,256,826 | ||
NOTE 10 – STOCK-BASED COMPENSATION
Our 2015 Omnibus Equity Plan (the Omnibus Plan) authorizes us to grant or issue non-qualified stock options, cash settled awards, share awards and other equity settled awards of up to 7,000,000 shares of common stock. Under the Omnibus Plan, awards denominated in shares of common stock other than options reduce the pool of reserved shares at a multiple of 3.51 times the number of shares awarded. Stock options awarded through the Omnibus Plan reduce the reserved share pool at a rate equal to the number of options granted. As of October 28, 2016, there were 4,105,254 shares available for future grants.
Upon adoption and approval of the Omnibus Plan, all of our previous equity incentive compensation plans were terminated. However, existing awards under those plans continue to vest in accordance with the original vesting schedule and will expire at the end of their original term.
Total stock-based compensation expense was $30,250, $14,793 and $28,314 in 2016, 2015 and 2014, respectively.
Stock Options: Stock options issued to participants other than non-employees and retirement eligible employees vest over three to five years and typically have a contractual term of 10 years. Stock options vest immediately upon grant for non-employee directors.
Stock-based compensation expense included in our Consolidated Statements of Operations for stock options was $5,522, $1,826, and $6,382 in fiscal year 2016, 2015, and 2014, respectively. The total grant-date fair value of options vested during the year was $6,974, $6,363 and $4,444 in fiscal year 2016, 2015 and 2014, respectively. As of October 28, 2016, there was $6,085 of total unrecognized pre-tax compensation cost related to non-vested awards that are expected to be recognized over a weighted-average period of 1.6 years.
The fair value of each option grant is estimated on the date of grant using the Black-Scholes option pricing model. Annually, we make predictive assumptions regarding future stock price volatility, employee exercise behavior, dividend yield, and the forfeiture rate. The dividend yield assumption is based on the expected annual dividend yield on the grant date. Expected stock price volatility is estimated using historical volatility over the expected life of the option. The risk-free interest rate for periods during the expected term of the options is based on yields available on the grant date for U.S. Treasury STRIPS with maturity consistent with the expected life assumption. The expected life represents the period of time that options granted are expected to be outstanding based on historical data to estimate option exercises and employee terminations within the valuation model.
The following table sets forth the weighted-average fair values and assumptions on which the fair values are determined. There were no stock option awards granted during 2016:
2015 | 2014 | ||||
Expected dividend yield | 1.7 | % | 1.4 | % | |
Expected stock price volatility | 23.0 | % | 30.0 | % | |
Risk-free interest rate | 1.8 | % | 2.2 | % | |
Expected life of options | 6.7 years | 6.8 years | |||
Weighted average fair value on the date of grant | $15.72 | $22.54 | |||
46
Stock option activity for the three years ended October 28, 2016 is summarized as follows:
Options Outstanding | Weighted Average Exercise Price per share1 | Weighted Average Remaining Contractual Life | Aggregate Intrinsic Value2 | |||||||||
Balance, October 25, 2013 | 6,062,817 | $ | 31.37 | 5.9 years | $ | 235,887 | ||||||
Granted | 297,865 | 76.50 | ||||||||||
Exercised | (1,098,023 | ) | 25.18 | 54,909 | ||||||||
Canceled | (20,419 | ) | 53.07 | |||||||||
Balance, October 31, 2014 | 5,242,240 | $ | 35.15 | 5.5 years | $ | 246,440 | ||||||
Granted | 467,860 | 72.58 | ||||||||||
Exercised | (621,237 | ) | 28.20 | 34,497 | ||||||||
Canceled | (51,301 | ) | 68.27 | |||||||||
Balance, October 30, 2015 | 5,037,562 | $ | 39.15 | 5.2 years | $ | 210,609 | ||||||
Granted | — | — | ||||||||||
Exercised | (684,735 | ) | 26.90 | 44,994 | ||||||||
Canceled | (9,816 | ) | 67.78 | |||||||||
Balance, October 28, 2016 | 4,343,011 | $ | 41.01 | 4.6 years | $ | 246,345 | ||||||
Exercisable | 3,927,965 | 37.63 | 4.2 years | 236,072 | ||||||||
1 The exercise price of the options granted during these periods was equal to the market price of the underlying stock on the date of grant.
2 Intrinsic values are based on our closing stock price on the last trading day of the year for in-the-money options.
Options exercisable of 4,241,769 at October 30, 2015 and 4,489,970 at October 31, 2014 had weighted-average exercise prices of $32.99 and $29.74, respectively.
Restricted Stock: Restricted stock awards vest over three to five years. Stock-based compensation expense included in our Consolidated Statements of Operations for restricted stock was $2,607, $2,161 and $5,878 in fiscal year 2016, 2015 and 2014, respectively. As of October 28, 2016, there was $3,339 of total unrecognized pre-tax compensation cost related to restricted stock that is expected to be recognized over a weighted-average period of 2.2 years. There were no restricted stock awards granted during fiscal year 2016.
The following table sets forth a reconciliation of restricted stock for the three years ended October 28, 2016:
Shares Outstanding | Weighted Average Grant Date Fair Value | Aggregate Intrinsic Value | ||||||||
Balance, Balance, October 25, 2013 | 356,923 | $ | 39.54 | $ | 25,085 | |||||
Granted | 85,121 | 74.78 | 6,366 | |||||||
Vested | (139,994 | ) | 35.90 | 9,831 | ||||||
Forfeited | (22,127 | ) | 42.79 | (947 | ) | |||||
Balance, Balance, October 31, 2014 | 279,923 | $ | 51.82 | $ | 22,998 | |||||
Granted | 103,863 | 86.21 | 8,954 | |||||||
Vested | (154,703 | ) | 38.57 | 12,948 | ||||||
Forfeited | (13,217 | ) | 77.21 | (1,021 | ) | |||||
Balance, Balance, October 30, 2015 | 215,866 | $ | 76.36 | $ | 17,474 | |||||
Granted | — | — | — | |||||||
Vested | (46,400 | ) | 64.28 | 3,777 | ||||||
Forfeited | (3,429 | ) | 83.72 | (287 | ) | |||||
Balance, October 28, 2016 | 166,037 | $ | 79.58 | $ | 16,227 | |||||
47
Stock-Settled Restricted Stock Units: We have issued both time and performance based stock-settled restricted stock units to certain participants under the Omnibus Plan.
Time-based
Time-based restricted stock units represent future shares issuable and cliff vest at the end of a three to four year service period. Stock-based compensation expense included in our Consolidated Statements of Operations for stock-settled restricted stock units was $4,704, $1,831 and $0 in fiscal year 2016, 2015 and 2014, respectively. As of October 28, 2016, there was $23,102 of total unrecognized pre-tax compensation cost related to these units that is expected to be recognized over a weighted-average period of 2.5 years.
The following table sets forth a reconciliation of the time-based stock-settled restricted stock units:
Units Outstanding | Weighted Average Grant Date Fair Value | Aggregate Intrinsic Value | ||||||||
Balance, October 31, 2014 | — | $ | — | $ | — | |||||
Granted | 93,938 | 85.00 | 7,985 | |||||||
Vested | (1,204 | ) | 86.85 | (105 | ) | |||||
Forfeited | (6,949 | ) | 85.56 | (595 | ) | |||||
Balance, October 30, 2015 | 85,785 | $ | 84.93 | $ | 6,944 | |||||
Granted | 284,950 | 94.35 | 26,885 | |||||||
Vested | (1,050 | ) | 82.43 | 82 | ||||||
Forfeited | (9,902 | ) | 78.93 | (775 | ) | |||||
Balance, October 28, 2016 | 359,783 | $ | 92.56 | $ | 35,162 | |||||
Performance-based
Performance-based units represent shares potentially issuable in the future based upon EPS over a three year performance period. Dividends are accrued during the performance period for these grants. The fair value of performance share units is calculated based on the stock price at the time of grant. Compensation expense included in our Consolidated Statements of Operations for performance-based stock-settled restricted stock units was $6,096 and $2,299 in fiscal years 2016 and 2015, respectively. As of October 28, 2016, there was $8,589 of total unrecognized pre-tax compensation cost related to performance-based stock-settled restricted stock units that is expected to be recognized over a weighted-average period of 1.8 years.
The following table sets forth a reconciliation of the performance-based stock-settled restricted stock units:
Units Outstanding | Weighted Average Grant Date Fair Value | Aggregate Intrinsic Value | ||||||||
Balance, October 31, 2014 | — | $ | — | $ | — | |||||
Granted | 73,468 | 87.03 | 6,394 | |||||||
Vested | (1,598 | ) | 87.03 | (139 | ) | |||||
Forfeited | (5,641 | ) | 87.03 | (490 | ) | |||||
Balance, October 30, 2015 | 66,229 | $ | 87.03 | $ | 5,764 | |||||
Granted | 75,548 | 78.27 | 5,913 | |||||||
Vested | — | — | — | |||||||
Forfeited | (1,288 | ) | 84.41 | (244 | ) | |||||
Balance, October 28, 2016 | 140,489 | $ | 82.32 | $ | 13,574 | |||||
Cash-settled Restricted Stock Units: Cash-settled restricted stock units granted through our Omnibus Plan cliff vest at the end of a three to five year service period. These awards are cash-settled and are classified as a liability, which is marked to market each period. This liability is included within our long-term liabilities. Stock-based compensation expense included in our Consolidated Statements of Operations for cash-settled restricted stock units was $11,321, $5,593 and $15,198 in fiscal year 2016, 2015 and 2014, respectively. Cash payments for cash-settled restricted stock units were $7,783, $15,437 and $8,083 in 2016, 2015 and 2014, respectively. There were no payments for cash-settled restricted stock units prior to 2014. As of October 28, 2016, there
48
was $5,285 of total unrecognized pre-tax compensation cost related to cash-settled restricted stock units that is expected to be recognized over a weighted-average period of 1.8 years.
The following table sets forth a reconciliation of cash-settled restricted stock units for the three years ended October 28, 2016:
Units Outstanding | Weighted Average Grant Date Fair Value | Aggregate Intrinsic Value3 | ||||||||
Balance, October 25, 2013 | 598,523 | $ | 46.41 | $ | 42,064 | |||||
Granted | 143,244 | 71.50 | 10,243 | |||||||
Vested | (111,798 | ) | 37.62 | 7,960 | ||||||
Forfeited | (33,881 | ) | 51.76 | (1,754 | ) | |||||
Balance, October 31, 2014 | 596,088 | $ | 53.78 | $ | 48,975 | |||||
Granted | 48,081 | 84.28 | 4,052 | |||||||
Vested | (180,723 | ) | 43.94 | (15,273 | ) | |||||
Forfeited | (51,630 | ) | 59.30 | (3,017 | ) | |||||
Balance, October 30, 2015 | 411,816 | $ | 60.99 | $ | 33,337 | |||||
Granted | 42,749 | 79.98 | 3,419 | |||||||
Vested | (85,467 | ) | 64.72 | 6,954 | ||||||
Forfeited | (16,595 | ) | 74.98 | (1,244 | ) | |||||
Balance, October 28, 2016 | 352,503 | $ | 61.73 | $ | 34,450 | |||||
3 Intrinsic value of cash-settled restricted stock units vested was based on our closing stock price on the last trading day of the year.
Stock Awards: Stock awards are issued and outstanding upon date awarded. Stock-based compensation expense included in our Consolidated Statements of Operations for stock awards was $0, $1,083, and $856 in fiscal year 2016, 2015 and 2014, respectively. Cash awards were granted in lieu of stock awards to non-employee directors during fiscal year 2016.
NOTE 11 – PENSIONS AND OTHER POST-RETIREMENT BENEFITS
Savings and Retirement Plan: We sponsor a Savings and Retirement Plan for substantially all of our U.S. employees. Under the Plan, we match employee contributions up to a maximum of 3% of employees’ compensation. In addition to matching employees’ contributions throughout the year, there is a year-end discretionary contribution that can range from 4% to 13% of eligible employees’ pay as defined in the Plan. U.S. employees who are not eligible for the Savings and Retirement Plan have the option to participate in a separate 401(k) Employee Stock Ownership Plan. We match employee contributions made by participants in that plan up to a maximum of 3% of employees’ compensation. In addition to matching employees’ contributions throughout the year, there is a discretionary year-end matching contribution that can range from 0% to 3%. Employer contributions to the Plans totaled $27,502, $20,927, and $20,981 for 2016, 2015, and 2014, respectively.
Executive Retirement Plans: We have Supplemental Executive Retirement Plans (SERPs) to provide retirement, death and disability benefits to a limited number of former employees. Annual benefits under the SERPs are based on years of service and individual compensation near retirement.
Pension and Post-Retirement Medical Plans: We sponsor several defined benefit pension plans for certain hourly and salaried employees. The benefits for most of these plans are generally based on stated amounts for each year of service. We fund the plans in amounts consistent with the limits of allowable tax deductions. During fiscal year 2016, we made contributions of approximately $2,101 to our pension plans. We also sponsor a post-retirement medical plan that provides subsidized medical benefits for eligible retired employees and their eligible dependents. The plan changed on January 1, 2009 to eliminate the subsidy for future retirees with the exception of a small group of employees near retirement that will still be eligible for the subsidized coverage at retirement. A 1% increase in the medical trend rates would not have a material effect on post-retirement medical expense or the post-retirement benefit obligation. For the fiscal year ending October 27, 2017, we expect our total contributions to our funded pension plans, unfunded pension, non-qualified plans and post-retirement medical plans to be at least $1,438.
49
The cost of pension and post-retirement medical benefits recognized in the Consolidated Statements of Operations is as follows:
Pension | |||||||||||
2016 | 2015 | 2014 | |||||||||
Service cost | $ | 2,709 | $ | 3,543 | $ | 4,358 | |||||
Interest cost | 12,992 | 13,734 | 14,848 | ||||||||
Expected return on plan assets | (19,115 | ) | (19,294 | ) | (19,907 | ) | |||||
Amortization of prior service cost | 448 | 484 | 480 | ||||||||
Recognized actuarial loss | 6,532 | 6,602 | 6,190 | ||||||||
Net periodic benefit cost | 3,566 | 5,069 | 5,969 | ||||||||
Settlement gain | 66 | (52 | ) | (422 | ) | ||||||
Curtailment gain | — | (2,913 | ) | — | |||||||
Net total benefit cost | $ | 3,632 | $ | 2,104 | $ | 5,547 | |||||
Post-Retirement Medical | |||||||||||
2016 | 2015 | 2014 | |||||||||
Service cost | $ | 287 | $ | 204 | $ | 153 | |||||
Interest cost | 358 | 367 | 382 | ||||||||
Expected return on plan assets | N/A | N/A | N/A | ||||||||
Amortization of prior service cost | (128 | ) | (128 | ) | (128 | ) | |||||
Recognized actuarial loss | 385 | 431 | 369 | ||||||||
Net periodic benefit cost | $ | 902 | $ | 874 | $ | 776 | |||||
The plans’ funded status is shown below, along with a description of how the status changed during the past two years. The benefit obligation is the projected benefit obligation—the actuarial present value, as of a date, of all benefits attributed by the pension benefit formula to employee service rendered prior to that date.
Pension | Post-Retirement Medical | ||||||||||||||
Change in Benefit Obligation | 2016 | 2015 | 2016 | 2015 | |||||||||||
Benefit obligation beginning of year | $ | 320,071 | $ | 354,403 | $ | 8,346 | $ | 9,127 | |||||||
Service cost | 2,709 | 3,543 | 287 | 204 | |||||||||||
Interest cost | 12,992 | 13,734 | 358 | 367 | |||||||||||
Plan participants’ contributions | 64 | 179 | — | — | |||||||||||
Plan amendments | 105 | 473 | — | — | |||||||||||
Actuarial loss/(gain) | 30,703 | 37 | (306 | ) | (254 | ) | |||||||||
Benefits paid | (15,303 | ) | (14,865 | ) | (803 | ) | (1,098 | ) | |||||||
Expenses paid from assets | (361 | ) | (497 | ) | — | — | |||||||||
Currency impact | (7,705 | ) | (9,342 | ) | — | — | |||||||||
Curtailments | — | (6,487 | ) | — | — | ||||||||||
Settlements | — | (21,107 | ) | — | — | ||||||||||
Benefit obligation at end of year | $ | 343,275 | $ | 320,071 | $ | 7,882 | $ | 8,346 | |||||||
50
Pension | Post-Retirement Medical | ||||||||||||||
Change in Plan Assets | 2016 | 2015 | 2016 | 2015 | |||||||||||
Fair value of plan assets at beginning of year | $ | 293,886 | $ | 323,874 | $ | — | $ | — | |||||||
Actual return on plan assets | 25,663 | 9,979 | — | — | |||||||||||
Employer contributions | 2,101 | 3,024 | 803 | 1,098 | |||||||||||
Plan participants’ contributions | 64 | 179 | — | — | |||||||||||
Benefit payments | (15,303 | ) | (14,865 | ) | (803 | ) | (1,098 | ) | |||||||
Expenses paid from assets | (361 | ) | (497 | ) | — | — | |||||||||
Currency impact | (7,326 | ) | (6,701 | ) | — | — | |||||||||
Settlements | — | (21,107 | ) | — | — | ||||||||||
Fair value of assets at end of year | $ | 298,724 | $ | 293,886 | $ | — | $ | — | |||||||
Pension | Post-Retirement Medical | ||||||||||||||
Funded Status | 2016 | 2015 | 2016 | 2015 | |||||||||||
Projected benefit obligation | $ | (343,275 | ) | $ | (320,071 | ) | $ | (7,882 | ) | $ | (8,346 | ) | |||
Plan assets at fair value | 298,724 | 293,886 | — | — | |||||||||||
Net funded status - over / (under) | $ | (44,551 | ) | $ | (26,185 | ) | $ | (7,882 | ) | $ | (8,346 | ) | |||
Funded status - overfunded plans | $ | 1,613 | $ | 1,608 | $ | — | $ | — | |||||||
Funded status - underfunded plans | (46,164 | ) | (27,793 | ) | (7,882 | ) | (8,346 | ) | |||||||
Pension | Post-Retirement Medical | ||||||||||||||
Amounts Recognized in Balance Sheet | 2016 | 2015 | 2016 | 2015 | |||||||||||
Noncurrent assets | $ | 1,613 | $ | 1,608 | $ | — | $ | — | |||||||
Current liabilities | (577 | ) | (663 | ) | (677 | ) | (759 | ) | |||||||
Noncurrent liabilities | (45,587 | ) | (27,130 | ) | (7,205 | ) | (7,587 | ) | |||||||
Pension | Post-Retirement Medical | ||||||||||||||
Amounts in Accumulated Other Comprehensive Income | 2016 | 2015 | 2016 | 2015 | |||||||||||
Net loss | $ | 129,514 | $ | 114,310 | $ | 3,805 | $ | 4,498 | |||||||
Net prior service cost (credit) | 3,956 | 4,298 | (55 | ) | (183 | ) | |||||||||
Other comprehensive loss - total | $ | 133,470 | $ | 118,608 | $ | 3,750 | $ | 4,315 | |||||||
Pension | Post-Retirement Medical | ||||||||||||||
Amortization expense expected to be recognized during next fiscal year | 2016 | 2015 | 2016 | 2015 | |||||||||||
Prior service cost (credits) | $ | 439 | $ | 448 | $ | (55 | ) | $ | (128 | ) | |||||
Net loss | 7,203 | 6,578 | 322 | 385 | |||||||||||
Our pension and post-retirement medical plans with accumulated benefit obligations in excess of plan assets were as follows:
Pension | Post-Retirement Medical | ||||||||||||||
2016 | 2015 | 2016 | 2015 | ||||||||||||
Projected/accumulated post-retirement benefit obligation | $ | 336,597 | $ | 313,799 | $ | 7,882 | $ | 8,346 | |||||||
Accumulated benefit obligation | 332,634 | 309,878 | N/A | N/A | |||||||||||
Fair value of plan assets | 290,434 | 286,006 | N/A | N/A | |||||||||||
51
Our pension and post-retirement medical plans with projected benefit obligations in excess of plan assets were as follows:
Pension | Post-Retirement Medical | ||||||||||
2016 | 2015 | 2016 | 2015 | ||||||||
Projected benefit obligation | $ | 336,597 | $ | 313,799 | N/A | N/A | |||||
Accumulated benefit obligation | 332,634 | 309,878 | N/A | N/A | |||||||
Fair value of plan assets | 290,434 | 286,006 | N/A | N/A | |||||||
Our pension and post-retirement medical plans with projected benefit obligations less than or equal to plan assets were as follows:
Pension | Post-Retirement Medical | ||||||||||
2016 | 2015 | 2016 | 2015 | ||||||||
Projected benefit obligation | $ | 6,677 | $ | 6,272 | N/A | N/A | |||||
Accumulated benefit obligation | 6,638 | 6,195 | N/A | N/A | |||||||
Fair value of plan assets | 8,290 | 7,880 | N/A | N/A | |||||||
Actuarial Assumptions: We determine our actuarial assumptions on an annual basis. The effect of any changes in actuarial assumptions is recorded in net periodic benefit cost. These assumptions are weighted to reflect each country having requirements that may impact the cost of providing retirement benefits. We employ a total return investment approach for the domestic and foreign pension plan assets. A mix of equities and fixed income investments are used to maximize the long-term return on plan assets for a prudent level of risk. In determining the expected long-term rate of return, management considers the historical rates of return, the nature of investments and an expectation of future investment strategies. Our expected return on plan assets utilizes a calculated-value technique that recognizes changes in actual investment return from expected investment return in a systematic and rational manner over a 5 year period. We use the most recent mortality tables available for each country.
Pension | Post-Retirement Medical | ||||||||
Assumption Ranges Used in Net Periodic Benefit Cost | 2016 | 2015 | 2016 | 2015 | |||||
Discount rate | 2.25% - 4.50% | 2.50% - 4.50% | 4.50 | % | 4.25 | % | |||
Expected long-term return on plan assets | 6.00% - 7.25% | 2.50% - 7.25% | N/A | N/A | |||||
Average increase in compensation | 2.25% - 3.25% | 2.25% - 3.25% | N/A | N/A | |||||
Initial medical trend rate | N/A | N/A | 7.00 | % | 7.00 | % | |||
Ultimate medical trend rate | N/A | N/A | 5.00 | % | 5.00 | % | |||
Years to ultimate rate | N/A | N/A | 6 Years | 4 Years | |||||
Pension | Post-Retirement Medical | ||||||||
Assumption Ranges Used to Determine Benefit Obligation | 2016 | 2015 | 2016 | 2015 | |||||
Discount rate | 1.25% - 4.00% | 2.25% - 4.50% | 4.00 | % | 4.50 | % | |||
Rate of compensation increase | 2.25% - 3.25% | 2.25% - 3.25% | N/A | N/A | |||||
Initial medical trend rate | N/A | N/A | 7.00 | % | 7.00 | % | |||
Ultimate medical trend rate | N/A | N/A | 5.00 | % | 5.00 | % | |||
Years to ultimate rate | N/A | N/A | 5 Years | 6 Years | |||||
Investment Strategy: We have a master trust that holds the assets for all our U.S. pension plans. For investment purposes, the plans are managed in an identical way, as their objectives are similar. The Benefit Funds Investment Committee (Committee), along with assistance from external consultants, sets investment guidelines and makes asset allocation decisions based on market conditions, risk tolerance, funding requirements and expected benefit payments. The Committee also oversees the selection of investment managers and monitors asset performance. As pension liabilities are long-term in nature, the Committee employs a long-term rate of return on plan assets approach for a prudent level of risk. Historical returns are considered as well as advice from investment experts. Annually, the Committee and the consultants review the risk versus the return of the investment portfolio to assess the long-term rate of return assumption.
The U.S. investment portfolio contains a diversified portfolio of investment categories, including domestic and international equities and short and long-term fixed income securities. Among the equity investments there is also diversity of style, growth versus value. Plan assets did not include investments in our stock as of the reported dates. The Committee believes with prudent risk tolerance and asset diversification, the plans should be able to meet their pension obligations in the future.
52
The weighted average asset allocations for the past two fiscal years by asset category are as follows:
Pension Plans | ||||||||
Asset Allocation | 2016 | 2015 | Target Allocation | |||||
Equity securities | 57 | % | 60 | % | 50% - 60% | |||
Debt securities | 42 | % | 39 | % | 40% - 50% | |||
Other | 1 | % | 1 | % | — | % | ||
Total | 100 | % | 100 | % | 100 | % | ||
The following tables provide information on the fair value of pension plan assets. See Note 7 for more information on fair value measurements.
Fair Value at | Fair Value Measurements Using Inputs Considered as | ||||||||||||||
October 28, 2016 | Level 1 | Level 2 | Level 3 | ||||||||||||
Domestic Equity Securities | |||||||||||||||
Commingled trust | $ | 80,056 | $ | — | $ | 80,056 | $ | — | |||||||
Mutual fund | 29,184 | 29,184 | — | — | |||||||||||
International Equity Securities | |||||||||||||||
Mutual funds | 60,043 | 27,365 | 32,678 | — | |||||||||||
Total equity securities | 169,283 | 56,549 | 112,734 | — | |||||||||||
Domestic Fixed Income | |||||||||||||||
Mutual fund | 94,468 | 94,468 | — | — | |||||||||||
International Fixed Income | |||||||||||||||
Debt securities | 15,827 | — | 15,827 | — | |||||||||||
Mutual funds | 14,017 | — | 14,017 | — | |||||||||||
Total fixed income | 124,312 | 94,468 | 29,844 | — | |||||||||||
Other Investments | |||||||||||||||
Cash | 2,888 | 2,888 | — | — | |||||||||||
Real estate | 2,241 | — | 1,741 | 500 | |||||||||||
Total other investments | 5,129 | 2,888 | 1,741 | 500 | |||||||||||
Total | $ | 298,724 | $ | 153,905 | $ | 144,319 | $ | 500 | |||||||
53
Fair Value at | Fair Value Measurements Using Inputs Considered as | ||||||||||||||
October 30, 2015 | Level 1 | Level 2 | Level 3 | ||||||||||||
Domestic Equity Securities | |||||||||||||||
Commingled trust | $ | 80,473 | $ | — | $ | 80,473 | $ | — | |||||||
Mutual fund | 29,670 | 29,670 | — | — | |||||||||||
International Equity Securities | |||||||||||||||
Mutual funds | 65,921 | 30,059 | 35,862 | — | |||||||||||
Total equity securities | 176,064 | 59,729 | 116,335 | — | |||||||||||
Domestic Fixed Income | |||||||||||||||
Mutual fund | 89,934 | 89,934 | — | — | |||||||||||
International Fixed Income | |||||||||||||||
Debt securities | 10,104 | — | 10,104 | — | |||||||||||
Mutual funds | 13,212 | — | 13,212 | — | |||||||||||
Total fixed income | 113,250 | 89,934 | 23,316 | — | |||||||||||
Other Investments | |||||||||||||||
Cash | 3,205 | 3,205 | — | — | |||||||||||
Real estate | 1,367 | — | 867 | 500 | |||||||||||
Total other investments | 4,572 | 3,205 | 867 | 500 | |||||||||||
Total | $ | 293,886 | $ | 152,868 | $ | 140,518 | $ | 500 | |||||||
Pension plan investments in publicly-traded corporate stocks and mutual funds are classified as Level 1 investments within the fair value hierarchy, as determined by quoted market prices. Pension plan investments in mutual funds that are not exchange-traded, and commingled trusts, and certain other investments are classified as Level 2 investments within the fair value hierarchy. These investments are valued at net asset value based on the underlying securities, as determined by the sponsor. Level 3 investments are related to real estate in the U.S. pension plans. The fair value is determined primarily based on the cost basis of the real estate. There were no transfers between levels for all periods presented.
Investment securities, in general, are exposed to various risks such as interest rate, credit and overall market volatility. Due to the level of risk associated with certain investment securities, it is reasonably possible that changes in the values of investment securities will occur in the near term and that such changes could materially affect the amounts reported. The valuation methods previously described above may produce a fair value calculation that may not be indicative of net realized value or reflective of future fair values.
The following table provides a reconciliation of the beginning and ending balances of pension assets measured at fair value that used significant unobservable inputs (Level 3):
Total | U.S. | Non-U.S. | |||||||||
Balance, October 31, 2014 | $ | 20,774 | $ | 500 | $ | 20,274 | |||||
Actual return on plan assets relating to assets still held at reporting date | 1,507 | — | 1,507 | ||||||||
Purchases | 336 | — | 336 | ||||||||
Settlements | (21,133 | ) | — | (21,133 | ) | ||||||
Transfers in and/or out of Level 3 | — | — | — | ||||||||
Currency impact | (984 | ) | — | (984 | ) | ||||||
Balance, October 30, 2015 | $ | 500 | $ | 500 | $ | — | |||||
Actual return on plan assets relating to assets still held at reporting date | — | — | — | ||||||||
Purchases | — | — | — | ||||||||
Settlements | — | — | — | ||||||||
Transfers in and/or out of Level 3 | — | — | — | ||||||||
Currency impact | — | — | — | ||||||||
Balance, October 28, 2016 | $ | 500 | $ | 500 | $ | — | |||||
54
Estimated Future Benefits: The following benefit payments, which reflect expected future service, as appropriate, are expected to be paid as follows:
Pension | Post-retirement Medical | ||||||
2017 | $ | 16,036 | $ | 691 | |||
2018 | 16,040 | 592 | |||||
2019 | 16,576 | 549 | |||||
2020 | 17,199 | 533 | |||||
2021 | 17,382 | 482 | |||||
2022- 2026 | 91,115 | 2,166 | |||||
Total | $ | 174,348 | $ | 5,013 | |||
NOTE 12 – INCOME TAXES
Income before income taxes consisted of the following:
2016 | 2015 | 2014 | |||||||||
Domestic | $ | 270,423 | $ | 353,068 | $ | 349,174 | |||||
Foreign | 164,096 | 210,733 | 142,708 | ||||||||
Total income before income taxes | $ | 434,519 | $ | 563,801 | $ | 491,882 | |||||
Significant components of the provision for income taxes are as follows:
2016 | 2015 | 2014 | |||||||||
Current | |||||||||||
Federal | $ | 77,173 | $ | 92,820 | $ | 86,698 | |||||
State | 10,852 | 12,911 | 9,908 | ||||||||
Foreign | 43,660 | 61,622 | 51,982 | ||||||||
Total current | $ | 131,685 | $ | 167,353 | $ | 148,588 | |||||
Deferred | |||||||||||
Federal | $ | (36,739 | ) | $ | 2,192 | $ | 20,166 | ||||
State | (3,201 | ) | 1,236 | 436 | |||||||
Foreign | (10,266 | ) | (6,486 | ) | (22,709 | ) | |||||
Total deferred | (50,206 | ) | (3,058 | ) | (2,107 | ) | |||||
Total income taxes | $ | 81,479 | $ | 164,295 | $ | 146,481 | |||||
55
Significant components of our deferred tax assets and liabilities are as follows:
2016 | 2015 | ||||||
Deferred Tax Assets | |||||||
Insurance reserves | $ | 7,860 | $ | 7,261 | |||
Compensation | 46,815 | 40,716 | |||||
Deferred revenue | 16,722 | 13,163 | |||||
Pension | 14,888 | 8,519 | |||||
Accrued expenses | 32,581 | 30,424 | |||||
Tax credits and carryforwards | 49,957 | 27,164 | |||||
Other | 12,414 | 12,180 | |||||
181,237 | 139,427 | ||||||
Less: valuation allowance | (7,996 | ) | (15,872 | ) | |||
Total deferred tax assets | $ | 173,241 | $ | 123,555 | |||
Deferred Tax Liabilities | |||||||
Prepaids | $ | (19,486 | ) | $ | (20,360 | ) | |
Tax in excess of book depreciation | (35,432 | ) | (32,701 | ) | |||
LIFO | (18,642 | ) | (20,622 | ) | |||
Intangible assets | (238,870 | ) | (235,139 | ) | |||
Other | — | (8,415 | ) | ||||
Total deferred tax liabilities | (312,430 | ) | (317,237 | ) | |||
Net deferred tax liabilities | $ | (139,189 | ) | $ | (193,682 | ) | |
We recognize a valuation allowance if, based on the weight of available evidence, it is more likely than not that some portion, or all, of a deferred tax asset will not be realized. The valuation allowances of $7,996 and $15,872 at the end of fiscal years 2016 and 2015 respectively, primarily relate to foreign net operating losses.
Cumulative foreign tax loss carryforwards at the end of fiscal year 2016 were $74,409. Of this amount, $29,429 will be subject to expiration between fiscal year 2017 and fiscal year 2026. The majority of these foreign tax loss carryforwards will be subject to expiration beginning in 2021. The remaining losses of $44,980 are not subject to expiration. Cumulative foreign tax credits at the end of fiscal year 2016 were $32,324. The majority of these foreign tax credits will be subject to expiration in fiscal years 2025 and 2026.
A reconciliation of income tax computed at the U.S. federal statutory tax rate to the effective income tax rate is as follows:
2016 | 2015 | 2014 | ||||||
Tax (benefit) at U.S. statutory rate | 35.0 | % | 35.0 | % | 35.0 | % | ||
State income taxes, net of federal benefit | 1.5 | % | 1.5 | % | 1.3 | % | ||
Domestic manufacturing activities | (1.8 | )% | (1.5 | )% | (1.6 | )% | ||
Tax credit on foreign dividends | (6.3 | )% | (2.3 | )% | — | % | ||
Non-U.S. taxes | (3.7 | )% | (3.2 | )% | (2.4 | )% | ||
Valuation allowance | (1.8 | )% | — | % | (1.8 | )% | ||
Research and Development Credit | (3.3 | )% | — | % | — | % | ||
Other | (0.8 | )% | (0.4 | )% | (0.7 | )% | ||
Total effective income tax rate | 18.8 | % | 29.1 | % | 29.8 | % | ||
No provision has been made for U.S. federal income taxes on certain undistributed earnings of foreign subsidiaries that we intend to permanently invest or that may be remitted substantially tax-free. The total of undistributed earnings that would be subject to federal income tax if remitted under existing law is approximately $588,777 at October 28, 2016. Determination of the unrecognized deferred tax liability related to these earnings is not practicable because of the complexities with its hypothetical calculation. Upon distribution of these earnings, we will be subject to U.S. taxes and withholding taxes payable to various foreign governments. A credit for foreign taxes already paid would be available to reduce the U.S. tax liability.
We recognize investment tax credits under the "flow-through" method, with the credit reflected as a reduction to income taxes payable and a current income tax benefit in the year realized.
56
Our income tax returns, like those of most companies, are periodically audited by domestic and foreign tax authorities. These audits include questions regarding our tax filing positions, including the timing and amount of deductions and the allocation of income among various tax jurisdictions. At any one time, multiple tax years are subject to audit by the various tax authorities. We record an accrual for uncertain tax positions after evaluating the positions associated with our various income tax filings. A number of years may elapse before a particular matter for which we have established an accrual is audited and fully resolved or clarified. We adjust our tax contingencies accrual and income tax provision in the period in which matters are effectively settled with tax authorities at amounts different from our established accrual, the statute of limitations expires for the relevant taxing authority to examine the tax position or when more information becomes available.
A reconciliation of the beginning and ending amount of unrecognized tax benefits (excluding interest and penalties) for fiscal year 2014 through 2016 is as follows:
Unrecognized tax benefits at October 25, 2013 | $ | 15,363 | |
Increases in tax positions for prior years | 3,004 | ||
Decreases in tax positions for prior years | (217 | ) | |
Increases in tax positions for current year | 3,029 | ||
Settlements | — | ||
Lapse in statute of limitations | (2,413 | ) | |
Unrecognized tax benefits at October 31, 2014 | $ | 18,766 | |
Increases in tax positions for prior years | 2,096 | ||
Decreases in tax positions for prior years | (23 | ) | |
Increases in tax positions for current year | 390 | ||
Settlements | (3,485 | ) | |
Lapse in statute of limitations | (2,144 | ) | |
Unrecognized tax benefits at October 30, 2015 | $ | 15,600 | |
Increases in tax positions for prior years | 2,734 | ||
Decreases in tax positions for prior years | (264 | ) | |
Increases in tax positions for current year | 2,791 | ||
Settlements | — | ||
Lapse in statute of limitations | (1,794 | ) | |
Unrecognized tax benefits at October 28, 2016 | $ | 19,067 | |
We recognize interest and penalties related to unrecognized tax benefits in income tax expense. We had accrued interest and penalties relating to unrecognized tax benefits of $4,179 and $4,243 as of October 28, 2016 and October 30, 2015, respectively. The gross amount of interest expense (income) and penalties included in tax expense for the year ended October 28, 2016, October 30, 2015, and October 31, 2014 was $(63), $(1,137), and $61, respectively.
The total amount of unrecognized tax benefits that would affect our effective tax rate if recognized was $16,674, $13,668, and $18,169 as of October 28, 2016, October 30, 2015 and October 31, 2014, respectively.
The Company and its subsidiaries file income tax returns in the U.S. federal jurisdiction, and numerous state and foreign jurisdictions. With few exceptions, we are no longer subject to U.S. federal, state and local, or non-U.S. income tax examinations by tax authorities for years before 2011. The Internal Revenue Service (IRS) has completed the audit of our U.S. federal tax returns for fiscal years 2010, 2011 and 2013. There were no material adjustments to our income tax expense or balance of unrecognized tax benefits as a result of those audits. The IRS is currently auditing our U.S. federal income tax return for fiscal year 2012. We are also currently under audit in several state and foreign jurisdictions. We do not anticipate any material adjustments to our income tax expense or balance of unrecognized tax benefits as a result of those audits. We also expect various statutes of limitation to expire during the next 12 months. Due to the uncertain response of taxing authorities, a range of outcomes cannot be reasonably estimated at this time.
57
NOTE 13 – NET INCOME PER COMMON SHARE
The following table presents the net income per common share calculations for the three most recent fiscal years:
2016 | 2015 | 2014 | |||||||||
Basic | |||||||||||
Net income | $ | 353,040 | $ | 399,506 | $ | 345,401 | |||||
Weighted-average common shares outstanding - basic | 79,009,955 | 80,429,741 | 83,710,111 | ||||||||
Net income per common share - basic | $ | 4.47 | $ | 4.97 | $ | 4.13 | |||||
Diluted | |||||||||||
Net income | $ | 353,040 | $ | 399,506 | $ | 345,401 | |||||
Weighted-average common shares outstanding - basic | 79,009,955 | 80,429,741 | 83,710,111 | ||||||||
Diluted effect of stock options and unvested restricted stock | 2,010,021 | 2,016,962 | 2,335,946 | ||||||||
Weighted-average common shares outstanding - diluted | 81,019,976 | 82,446,703 | 86,046,057 | ||||||||
Net income per common share - diluted | $ | 4.36 | $ | 4.85 | $ | 4.01 | |||||
Basic earnings per share are based on the weighted-average number of common shares outstanding during each period. In computing diluted earnings per share, the number of common shares outstanding is increased by common stock options and unvested restricted stock with exercise prices lower than the average market prices of common shares during each period and reduced by the number of shares assumed to have been purchased with proceeds from the exercised options. Potential common shares of 14,694, 316,236, and 209,523 related to our outstanding stock options and unvested restricted stock were excluded from the computation of diluted earnings per share for 2016, 2015, and 2014, respectively, as inclusion of these shares would have been antidilutive.
NOTE 14 – ACCUMULATED OTHER COMPREHENSIVE INCOME (LOSS)
Accumulated other comprehensive income (loss), net of tax, consists of the following:
Foreign Currency Translation | Benefit Obligations | Financial Instruments | Accumulated Other Comprehensive Income (loss) | ||||||||||||
Balance, October 25, 2013 | $ | 133,603 | $ | (70,940 | ) | $ | (9,244 | ) | $ | 53,419 | |||||
Other comprehensive income before reclassifications | (62,783 | ) | — | 3,421 | (59,362 | ) | |||||||||
Amounts reclassified from accumulated other comprehensive income | — | (11,462 | ) | (2,265 | ) | (13,727 | ) | ||||||||
Balance, October 31, 2014 | $ | 70,820 | $ | (82,402 | ) | $ | (8,088 | ) | $ | (19,670 | ) | ||||
Other comprehensive income before reclassifications | (178,309 | ) | — | 991 | (177,318 | ) | |||||||||
Amounts reclassified from accumulated other comprehensive income | — | 1,861 | (371 | ) | 1,490 | ||||||||||
Balance, October 30, 2015 | $ | (107,489 | ) | $ | (80,541 | ) | $ | (7,468 | ) | $ | (195,498 | ) | |||
Other comprehensive income before reclassifications | (12,167 | ) | (17,525 | ) | 549 | (29,143 | ) | ||||||||
Amounts reclassified from accumulated other comprehensive income | — | 7,237 | 221 | 7,458 | |||||||||||
Balance, October 28, 2016 | $ | (119,656 | ) | $ | (90,829 | ) | $ | (6,698 | ) | $ | (217,183 | ) | |||
58
The components of other comprehensive income (loss) are as follows:
For the Year Ended | October 28, 2016 | October 30, 2015 | October 31, 2014 | ||||||||||
Foreign currency translation | $ | (12,167 | ) | $ | (178,309 | ) | $ | (62,783 | ) | ||||
Defined Benefit Pension and Post-Retirement Plan Adjustment | |||||||||||||
(Increase)/decrease in net loss | (21,428 | ) | (3,872 | ) | (24,201 | ) | |||||||
Reclassification for recognition of net loss included in net periodic benefit cost | 6,917 | 7,033 | 6,559 | ||||||||||
(Increase)/decrease in net prior service cost | (106 | ) | (577 | ) | 128 | ||||||||
Reclassification for amortization of prior service (credit) cost included in net periodic pension cost | 320 | 356 | 352 | ||||||||||
Income tax benefit (provision) | 4,009 | (1,079 | ) | 5,700 | |||||||||
Defined benefit pension and post-retirement plan adjustment | (10,288 | ) | 1,861 | (11,462 | ) | ||||||||
Unrealized Gain (Loss) on Financial Instruments | |||||||||||||
Net unrealized holding gains (losses) | 571 | 991 | 3,421 | ||||||||||
Reclassification adjustment for net gains (losses) included in net income | 680 | 15 | (1,542 | ) | |||||||||
Income tax benefit (provision) | (481 | ) | (386 | ) | (723 | ) | |||||||
Unrealized gain (loss) on financial instruments | 770 | 620 | 1,156 | ||||||||||
Other comprehensive income (loss) | $ | (21,685 | ) | $ | (175,828 | ) | $ | (73,089 | ) | ||||
We deem our foreign investments to be permanent in nature and therefore do not provide for taxes on foreign currency translation adjustments.
Amounts related to financial instruments are reclassified from accumulated other comprehensive income (loss) to net income based on the nature of the instrument. Gains and losses on foreign currency contracts are reclassified to other expense (income) in the Consolidated Statements of Operations when the underlying hedged item is realized. Unamortized gains and losses on treasury lock contracts are reclassified ratably to interest expense in our Consolidated Statements of Operations over the term of the related debt. See Note 8 for further information on financial instrument reclassifications.
Amounts related to pension and post-retirement medical adjustments are reclassified from accumulated other comprehensive income (loss) to pension cost, which is allocated to cost of sales and operating expenses based on salaries and wages, approximately as follows:
2016 | 2015 | 2014 | |||||||||||
Cost of sales | $ | 2,901 | $ | 3,003 | $ | 2,656 | |||||||
Research and development | 926 | 885 | 964 | ||||||||||
Selling, general and administrative | 3,410 | 3,501 | 3,291 | ||||||||||
Total before income taxes | $ | 7,237 | $ | 7,389 | $ | 6,911 | |||||||
NOTE 15 – SEGMENT INFORMATION
Based on the nature of our products, technology, manufacturing processes, customers and regulatory environment, we aggregate our operating segments into two reportable segments: Coatings and Paints. We are required to report segment information in the same way that management internally organizes its business for assessing performance and making decisions regarding allocation of resources. We evaluate the performance of operating segments and allocate resources based on earnings before interest and taxes (EBIT).
The Coatings segment aggregates our industrial product lines and packaging product line. Industrial products include a broad range of decorative and protective coatings for metal, wood and plastic. Packaging products include both interior and exterior coatings used in packaging containers, principally metal food containers and beverage cans. The products of this segment are sold throughout the world.
The Paints segment aggregates our consumer paint and automotive refinish product lines. Consumer paint products include interior and exterior decorative paints, stains, primers, varnishes, high performance floor paints and specialty decorative products, such
59
as enamels, aerosols and faux finishes primarily distributed for the do-it-yourself and professional markets in Australia, China, Europe and North America. Automotive refinish products include refinish paints and aerosol spray paints sold through automotive refinish distributors, body shops and automotive supply distributors and retailers in many countries around the world.
Our remaining activities are included in Other and Administrative. These activities include specialty polymers and colorants that are used internally and sold to other coatings manufacturers, as well as related products, furniture protection plans and furniture care and repair products. Also included within Other and Administrative are our corporate administrative expenses. The administrative expenses include expenses not directly allocated to any other reportable segment.
In the following table, sales between segments are recorded at selling prices that are below market prices, generally intended to recover internal costs. Segment EBIT includes income realized on inter-segment sales. Comparative segment data for fiscal years 2016, 2015, and 2014 are as follows:
2016 | 2015 | 2014 | |||||||||
Net Sales | |||||||||||
Coatings | $ | 2,388,133 | $ | 2,496,528 | $ | 2,585,416 | |||||
Paints | 1,564,531 | 1,661,186 | 1,806,051 | ||||||||
Other and Administrative | 426,539 | 448,006 | 412,073 | ||||||||
Less inter-segment sales | (188,651 | ) | (213,098 | ) | (177,916 | ) | |||||
Total net sales | $ | 4,190,552 | $ | 4,392,622 | $ | 4,625,624 | |||||
2016 | 2015 | 2014 | |||||||||
EBIT | |||||||||||
Coatings | $ | 444,190 | $ | 483,649 | $ | 389,390 | |||||
Paints | 149,539 | 173,435 | 192,222 | ||||||||
Other and Administrative | (68,650 | ) | (11,935 | ) | (24,400 | ) | |||||
Total EBIT | 525,079 | 645,149 | 557,212 | ||||||||
Interest expense | 90,560 | 81,348 | 65,330 | ||||||||
Income before income taxes | $ | 434,519 | $ | 563,801 | $ | 491,882 | |||||
2016 | 2015 | 2014 | |||||||||
Depreciation and Amortization | |||||||||||
Coatings | $ | 44,581 | $ | 45,442 | $ | 54,039 | |||||
Paints | 33,694 | 28,907 | 30,676 | ||||||||
Other and Administrative | 19,747 | 18,254 | 16,195 | ||||||||
Total depreciation and amortization | $ | 98,022 | $ | 92,603 | $ | 100,910 | |||||
2016 | 2015 | ||||||
Identifiable Assets | |||||||
Coatings | $ | 2,327,740 | $ | 2,268,649 | |||
Paints | 1,553,597 | 1,616,919 | |||||
Other and Administrative1 | 433,213 | 433,007 | |||||
Total identifiable assets | $ | 4,314,550 | $ | 4,318,575 | |||
1 Includes our consolidated cash and cash equivalent balances and restricted cash.
2016 | 2015 | 2014 | |||||||||
Capital Expenditures | |||||||||||
Coatings | $ | 80,370 | $ | 53,459 | $ | 47,122 | |||||
Paints | 16,251 | 16,623 | 42,313 | ||||||||
Other and Administrative | 23,799 | 27,044 | 31,836 | ||||||||
Total capital expenditures | $ | 120,420 | $ | 97,126 | $ | 121,271 | |||||
60
It is not practicable to obtain the information needed to disclose revenues attributable to each of our identified product lines within our reportable segments.
Geographic net sales are based on the country from which the customer was billed for the products sold. The United States is the largest country for customer sales. China and Australia are the only countries outside of the United States that represent more than 10% of consolidated sales. Long-lived assets include property, plant and equipment, intangibles and goodwill attributable to each country’s operations. Net sales and long-lived assets by geographic region are as follows:
2016 | 2015 | 2014 | |||||||||
Net Sales - External | |||||||||||
United States | $ | 2,321,228 | $ | 2,381,677 | $ | 2,478,770 | |||||
China | 467,650 | 545,750 | 524,368 | ||||||||
Australia | 263,624 | 294,726 | 352,540 | ||||||||
Other Countries | 1,138,050 | 1,170,469 | 1,269,946 | ||||||||
Total net sales - external | $ | 4,190,552 | $ | 4,392,622 | $ | 4,625,624 | |||||
2016 | 2015 | ||||||
Long-lived Assets | |||||||
United States | $ | 1,737,776 | $ | 1,743,104 | |||
China | 482,307 | 506,912 | |||||
Australia | 88,921 | 82,275 | |||||
Other Countries | 269,544 | 231,277 | |||||
Total long-lived assets | $ | 2,578,548 | $ | 2,563,568 | |||
We have one significant customer in the Paints segment whose net sales were 12.3%, 14.4%, and 16.9% of total consolidated net sales in 2016, 2015 and 2014, respectively.
NOTE 16 – LEGAL PROCEEDINGS
Environmental Matters
We are involved in various claims relating to environmental matters at a number of current and former plant sites and waste management sites. We engage or participate in remedial and other environmental compliance activities at certain of these sites. At other sites, we have been named as a potentially responsible party (PRP) under federal and state environmental laws for site remediation. We analyze each individual site, considering the number of parties involved, the level of our potential liability or contribution relative to the other parties, the nature and magnitude of the hazardous wastes involved, the method and extent of remediation, the potential insurance coverage, the estimated legal and consulting expense with respect to each site and the time period over which any costs would likely be incurred. Based on the above analysis, we estimate the clean-up costs and related claims for each site. The estimates are based in part on discussion with other PRPs, governmental agencies and engineering firms.
We accrue appropriate reserves for potential environmental liabilities when the amount of the costs that will be incurred can be reasonably determined. Accruals are reviewed and adjusted as additional information becomes available. While uncertainties exist with respect to the amounts and timing of our ultimate environmental liabilities, we believe it is neither probable nor reasonably possible that such liabilities, individually or in the aggregate, will have a material adverse effect on our financial condition, results of operations or cash flows.
Other Legal Matters
We are involved in a variety of legal claims and proceedings relating to personal injury, product liability, warranties, customer contracts, employment, trade practices, environmental and other legal matters that arise in the normal course of business. These claims and proceedings include cases where we are one of a number of defendants in proceedings alleging that the plaintiffs suffered injuries or contracted diseases from exposure to chemicals or other ingredients used in the production of some of our products or waste disposal. We are also subject to claims related to the performance of our products. We believe these claims and proceedings are in the ordinary course for a business of the type and size in which we are engaged. While we are unable to predict the ultimate outcome of these claims and proceedings, we believe it is neither probable nor reasonably possible that the costs and
61
liabilities of such matters, individually or in the aggregate, will have a material adverse effect on our financial condition, results of operations or cash flows.
NOTE 17 – LEASING ARRANGEMENTS
We have future minimum lease payments for operating lease commitments for plant and warehouse equipment, office and warehouse space, vehicles and retail stores that have initial periods ranging from one to ten years, and future minimum lease payments for a capital lease commitment for a building that has an initial period of 20 years at October 28, 2016 as follows:
Capital leases | Operating leases | |||||
2017 | $ | 1,047 | $ | 32,656 | ||
2018 | 1,047 | 25,151 | ||||
2019 | 1,047 | 17,658 | ||||
2020 | 1,047 | 11,182 | ||||
2021 | 1,047 | 9,316 | ||||
2022 and beyond | 12,996 | 32,635 | ||||
Total minimum future lease rental payments | $ | 18,231 | $ | 128,598 | ||
Less amount representing interest | (11,304 | ) | N/A | |||
Present value of net minimum capital lease payments | 6,927 | N/A | ||||
Less current portion of capital leases | (107 | ) | N/A | |||
Obligations under capital leases, excluding current portion | $ | 6,820 | N/A | |||
Rent expense for operating leases was $38,600 in 2016, $44,117 in 2015, and $43,348 in 2014.
Our building capital lease amortizes over 20 years. Our equipment capital leases expired during fiscal year 2016. At October 28, 2016 and October 30, 2015, the gross amount of plant and equipment and related accumulated amortization recorded under capital leases were as follows:
2016 | 2015 | |||||
Building | $ | 5,377 | $ | 5,377 | ||
Equipment | — | 98 | ||||
Less accumulated amortization | (365 | ) | (164 | ) | ||
Net plant and equipment under capital leases | $ | 5,012 | $ | 5,311 | ||
NOTE 18 – RESTRUCTURING
Restructuring charges in fiscal year 2016 primarily relate to initiatives to improve our global cost structure by consolidating our manufacturing operations in the Paints segment and reducing non-manufacturing headcount in our Paints and Coatings segments. These initiatives included moving manufacturing of selected products in our consumer paints product line to a third party (continuation of an initiative started in 2015), consolidating three sites in our automotive product line as a result of the Quest acquisition and reducing headcount in our Australia and Europe regions. These restructuring activities resulted in pre-tax charges of $18,505 in fiscal year 2016. Included in fiscal year 2016 restructuring charges were pre-tax non-cash asset-related charges of $7,358. Asset-related charges include asset impairment charges as well as accelerated depreciation for assets with useful lives that have been shortened, accounted for in accordance with ASC 360.
Restructuring charges in fiscal year 2015 included the following: (i) actions to close a manufacturing facility and other facilities in the Coatings segment to rationalize operations in the Australia region, (ii) actions to streamline and consolidate administrative operations in the Europe region and (iii) initiatives in the Paints segment to improve our North American cost structure through staffing reductions and actions to rationalize our manufacturing operations by moving certain manufacturing to a third party. These restructuring activities resulted in pre-tax charges of $21,569, including non-cash asset-related charges of $2,842.
Fiscal year 2014 restructuring initiatives related primarily to initiatives that began in fiscal year 2013, including the following: (i) actions in the Paints segment to consolidate manufacturing and distribution operations following the acquisition of Ace Hardware Corporation's paint manufacturing business, ongoing profit improvement plans in Australia, and other actions in Asia, (ii) actions in our Coatings segment to consolidate manufacturing operations in Europe following the acquisition of the Inver Group and other actions to rationalize manufacturing operations and lower operating expenses, (iii) overall initiatives to improve our global cost
62
structure, including non-manufacturing headcount reductions, and (iv) in the fourth quarter of 2014, activities initiated to rationalize manufacturing operations in the Coatings segment in the Australia region. These restructuring activities resulted in pre-tax charges of $41,139, including non-cash asset-related charges of $11,141.
The total resulting expenses recognized in fiscal year 2016, 2015, and 2014 included severance and employee benefits, asset impairments, professional services and site clean-up. We plan to pay the majority of the current restructuring liabilities within the next twelve months.
We currently expect additional expenses of approximately $1,200 in fiscal year 2017 for these restructuring plans, primarily related to site clean-up costs, employment-related costs and accelerated depreciation.
The following restructuring charges by segment were recorded in the 2016, 2015 and 2014 periods:
For the Year Ended October 28, 2016 | Liability Beginning Balance 10/30/2015 | Expense | Payments and Other Activity | Liability Ending Balance 10/28/2016 | |||||||||||
Coatings | |||||||||||||||
Severance and employee benefits | $ | 6,679 | $ | 41 | $ | (5,264 | ) | $ | 1,456 | ||||||
Asset-related charges | — | (60 | ) | 60 | — | ||||||||||
Exit costs (consulting/site clean-up) | — | 600 | (175 | ) | 425 | ||||||||||
Total Coatings | 6,679 | 581 | (5,379 | ) | 1,881 | ||||||||||
Paints | |||||||||||||||
Severance and employee benefits | 6,004 | 6,216 | (8,499 | ) | 3,721 | ||||||||||
Asset-related charges | — | 7,418 | (7,418 | ) | — | ||||||||||
Exit costs (consulting/site clean-up) | 1,069 | 2,605 | (2,818 | ) | 856 | ||||||||||
Total Paints | 7,073 | 16,239 | (18,735 | ) | 4,577 | ||||||||||
Other and Administrative | |||||||||||||||
Severance and employee benefits | 38 | 1,685 | (454 | ) | 1,269 | ||||||||||
Total Other and Administrative | 38 | 1,685 | (454 | ) | 1,269 | ||||||||||
Total | $ | 13,790 | $ | 18,505 | $ | (24,568 | ) | $ | 7,727 | ||||||
For the Year Ended October 30, 2015 | Liability Beginning Balance 10/31/2014 | Expense | Payments and Other Activity | Liability Ending Balance 10/30/2015 | |||||||||||
Coatings | |||||||||||||||
Severance and employee benefits | $ | 8,711 | $ | 7,708 | $ | (9,740 | ) | $ | 6,679 | ||||||
Asset-related charges | — | 1,306 | (1,306 | ) | — | ||||||||||
Exit costs (consulting/site clean-up) | 4,437 | 560 | (4,997 | ) | — | ||||||||||
Total Coatings | 13,148 | 9,574 | (16,043 | ) | 6,679 | ||||||||||
Paints | |||||||||||||||
Severance and employee benefits | 803 | 8,160 | (2,959 | ) | 6,004 | ||||||||||
Asset-related charges | — | 1,536 | (1,536 | ) | — | ||||||||||
Exit costs (consulting/site clean-up) | 1,901 | 2,217 | (3,049 | ) | 1,069 | ||||||||||
Total Paints | 2,704 | 11,913 | (7,544 | ) | 7,073 | ||||||||||
Other and Administrative | |||||||||||||||
Severance and employee benefits | 152 | 82 | (196 | ) | 38 | ||||||||||
Total Other and Administrative | 152 | 82 | (196 | ) | 38 | ||||||||||
Total | $ | 16,004 | $ | 21,569 | $ | (23,783 | ) | $ | 13,790 | ||||||
63
For the Year Ended October 31, 2014 | Liability Beginning Balance 10/25/2013 | Expense | Payments and Other Activity | Liability Ending Balance 10/31/2014 | |||||||||||
Coatings | |||||||||||||||
Severance and employee benefits | $ | 18,899 | $ | 10,668 | $ | (20,856 | ) | $ | 8,711 | ||||||
Asset-related charges | — | 9,572 | (9,572 | ) | — | ||||||||||
Exit costs (consulting/site clean-up) | 119 | 8,662 | (4,344 | ) | 4,437 | ||||||||||
Total Coatings | 19,018 | 28,902 | (34,772 | ) | 13,148 | ||||||||||
Paints | |||||||||||||||
Severance and employee benefits | 6,118 | 6,593 | (11,908 | ) | 803 | ||||||||||
Asset-related charges | — | 1,569 | (1,569 | ) | — | ||||||||||
Exit costs (consulting/site clean-up) | 2,196 | 3,772 | (4,067 | ) | 1,901 | ||||||||||
Total Paints | 8,314 | 11,934 | (17,544 | ) | 2,704 | ||||||||||
Other and Administrative | |||||||||||||||
Severance and employee benefits | 1,791 | 303 | (1,942 | ) | 152 | ||||||||||
Total Other and Administrative | 1,791 | 303 | (1,942 | ) | 152 | ||||||||||
Total | $ | 29,123 | $ | 41,139 | $ | (54,258 | ) | $ | 16,004 | ||||||
The ending liability balance at October 28, 2016, October 30, 2015, and October 31, 2014 is included in accrued liabilities and other liabilities on our Consolidated Balance Sheets. The restructuring reserve balances presented are considered adequate to cover committed restructuring actions.
Restructuring charges were recorded in the Statements of Operations for fiscal years 2016, 2015, and 2014 approximately as follows:
For the Year Ended | October 28, 2016 | October 30, 2015 | October 31, 2014 | ||||||||
Cost of sales | $ | 9,906 | $ | 14,007 | $ | 28,471 | |||||
Research and development | (13 | ) | 552 | 2,247 | |||||||
Selling, general and administrative | 8,612 | 7,010 | 10,421 | ||||||||
Total restructuring charges | $ | 18,505 | $ | 21,569 | $ | 41,139 | |||||
NOTE 19 – QUARTERLY RESULTS OF OPERATIONS (UNAUDITED)
The following is a tabulation of the unaudited quarterly results for the years ended October 28, 2016 and October 30, 2015:
Net Sales | Gross Profit | Net Income | Net Income per Common Share - Basic | Net Income per Common Share - Diluted | |||||||||||||||
2016 Quarter Ended | |||||||||||||||||||
January 29, | $ | 885,756 | $ | 318,627 | $ | 52,431 | $ | 0.67 | $ | 0.65 | |||||||||
April 29, | 1,056,797 | 401,441 | 80,027 | 1.01 | 0.99 | ||||||||||||||
July 29, | 1,141,942 | 421,947 | 116,988 | 1.48 | 1.44 | ||||||||||||||
October 28, | 1,106,057 | 393,569 | 103,594 | 1.31 | 1.27 | ||||||||||||||
$ | 4,190,552 | $ | 1,535,584 | $ | 353,040 | $ | 4.47 | $ | 4.36 | ||||||||||
2015 Quarter Ended | |||||||||||||||||||
January 30, | $ | 1,014,669 | $ | 333,292 | $ | 103,974 | $ | 1.27 | $ | 1.24 | |||||||||
May 1, | 1,079,289 | 393,203 | 90,314 | 1.12 | 1.09 | ||||||||||||||
July 31, | 1,149,126 | 411,283 | 102,862 | 1.29 | 1.25 | ||||||||||||||
October 30, | 1,149,538 | 413,611 | 102,356 | 1.29 | 1.26 | ||||||||||||||
$ | 4,392,622 | $ | 1,551,389 | $ | 399,506 | $ | 4.97 | $ | 4.85 | ||||||||||
The quarters may not sum to the fiscal year amount due to rounding and the effect of weighting.
64
NOTE 20 – RECENTLY ISSUED ACCOUNTING STANDARDS
In November 2016, the Financial Accounting Standards Board (FASB) issued guidance on the classification and presentation of changes in restricted cash on the statement of cash flows. Amounts generally described as restricted cash and restricted cash equivalents will be included with cash and cash equivalents when reconciling the beginning-of-period and end-of-period total amounts shown on the statement of cash flows. The guidance is effective for fiscal years beginning after December 15, 2017, which means the first quarter of our fiscal year 2019. Early adoption is permitted. Adoption of this guidance will not have a material impact on our consolidated financial statements.
In October 2016, the FASB issued guidance on intra-entity asset transfers (other than inventory) that will require immediate recognition of current and deferred income tax consequences for intercompany asset transfers at the time of the asset transfer. Under the existing standard, current and deferred income tax consequences are recognized when the assets are sold to an outside party. This new guidance is intended to align with International Accounting Standards 12 – Income Taxes. The guidance is effective for fiscal years beginning on or after December 15, 2017, which means the first quarter of our fiscal year 2019. Early adoption is permitted. Adoption of this guidance is not expected to have a material impact on our consolidated financial statements.
In August 2016, the FASB issued guidance on the classification of certain cash receipts and payments in the statement of cash flows and is intended to simplify guidance that is currently absent for debt prepayments and extinguishment costs, contingent consideration payments made after business combinations, and separately identifiable cash flows, among other clarifications. The guidance is effective for fiscal years beginning after December 15, 2017, which means the first quarter of our fiscal year 2019. Early adoption is permitted. We are currently reviewing the revised guidance and assessing the potential impact on our consolidated financial statements.
In March 2016, the FASB issued an update to accounting standards regarding accounting for employee share-based payments. The new guidance is intended to provide simplification of share-based payment transaction accounting, including the accounting for income taxes, forfeitures, and statutory tax withholding requirements, as well as presentation in the statement of cash flows. This update is effective for fiscal years, and interim periods within those years, beginning after December 15, 2016, which means the first quarter of our fiscal year 2018. Early adoption is permitted. We are currently reviewing the revised guidance and assessing the impact on our consolidated financial statements.
In February 2016, the FASB issued guidance on leases. The new guidance requires the recognition of lease assets and lease liabilities by lessees for those leases classified as operating leases under existing GAAP. The guidance is effective for fiscal years beginning after December 15, 2018, which means the first quarter of our fiscal year 2020, and modified retrospective adoption is required. Early adoption is permitted. We are currently reviewing the revised guidance and assessing the impact on our consolidated financial statements.
In November 2015, the FASB issued guidance that simplifies the balance sheet classification of deferred taxes. The new guidance requires that deferred tax assets and deferred tax liabilities be presented as non-current in the consolidated balance sheets. The guidance is effective for fiscal years, and interim periods within those years, beginning after December 15, 2016, which means the first quarter of our fiscal year 2018. Early adoption is permitted. Adoption of this guidance is not expected to have a material impact on our consolidated financial statements.
In September 2015, the FASB issued guidance that eliminates the requirement for an acquirer in a business combination to account for measurement-period adjustments retrospectively. Under the previous standard, an acquirer in a business combination reported provisional amounts with respect to acquired assets and liabilities when their measurements are incomplete as of the end of the reporting period, and adjusted the provisional amounts (and the related impact on earnings) by restating prior period financial statements during the measurement period not exceeding one year from the date of acquisition. The new guidance requires that the cumulative impact of a measurement-period adjustment (including the impact on prior periods) be recognized in the reporting period in which the adjustment is identified, thus eliminating the requirement to restate prior period financial statements. The new standard requires disclosure of the nature and amount of measurement-period adjustments as well as information with respect to the portion of the adjustments recorded in current-period earnings that would have been recorded in previous reporting periods if the adjustments to provisional amounts had been recognized as of the acquisition date. We adopted this guidance in the first quarter of our fiscal year 2016. Adoption of this guidance did not have a material impact on our consolidated financial statements.
In July 2015, the FASB issued guidance that simplifies the measurement of inventory by requiring certain inventory to be measured at the lower of cost or net realizable value. The guidance is effective for fiscal years, and interim periods within those years, beginning after December 15, 2016, which means the first quarter of our fiscal year 2018. Early adoption is permitted. Adoption of this guidance is not expected to have a material impact on our consolidated financial statements.
65
In April 2015, the FASB issued guidance on the recognition of fees paid by a customer for cloud computing arrangements. The new guidance clarifies that if a cloud computing arrangement includes a software license, the customer should account for the software license consistent with the acquisition of other software licenses. If the arrangement does not include a software license, the customer should account for the arrangement as a service contract. The guidance is effective for fiscal years, and interim periods within those years, beginning after December 15, 2015, which means the first quarter of our fiscal year 2017. Early adoption is permitted. Adoption of this guidance is not expected to have a material impact on our consolidated financial statements.
In April 2015, the FASB issued guidance that changes the presentation of debt issuance costs in financial statements. Under the new guidance, debt issuance costs will be presented as a direct deduction from the carrying value of the related debt liability, consistent with debt discounts. The guidance is effective for fiscal years, and interim periods within those years, beginning after December 15, 2015, which means the first quarter of our fiscal year 2017, and retrospective adoption is required. Early adoption is permitted. Adoption of this guidance is not expected to have a material impact on our consolidated financial statements.
In May 2014, the FASB issued revised guidance on revenue recognition. The standard provides a single revenue recognition model which is intended to improve comparability over a range of industries, companies and geographical boundaries and to enhance disclosures. The guidance, following a one-year deferral issued by the FASB in August 2015, is effective for fiscal years and interim periods within those years beginning after December 15, 2017, which means the first quarter of our fiscal year 2019. Early adoption is permitted. Either full retrospective or modified retrospective adoption is permitted. We are currently reviewing the revised guidance and assessing the potential impact on our consolidated financial statements. In addition to the expanded disclosures regarding revenue, this guidance may impact timing of revenue recognition in some arrangements with variable consideration or contracts for the sale of good or services.
We have determined that all other recently issued accounting standards will not have a material impact on our consolidated financial statements or do not apply to our operations.
66
ITEM 9 | CHANGES IN AND DISAGREEMENTS WITH ACCOUNTANTS ON ACCOUNTING AND FINANCIAL DISCLOSURE |
None.
ITEM 9A CONTROLS AND PROCEDURES
Disclosure controls and procedures (as defined in Exchange Act Rules 13a-15(e) and 15d-15(e)) are our controls and other procedures that are designed to ensure that information required to be disclosed by us in the reports that we file or submit under the Exchange Act is recorded, processed, summarized and reported within the time periods specified in the Securities and Exchange Commission’s rules and forms. Disclosure controls and procedures include, without limitation, controls and procedures designed to ensure that information required to be disclosed by us in the reports that we file or submit under the Exchange Act is accumulated and communicated to our management, including our Chief Executive Officer and Chief Financial Officer, as appropriate, to allow timely decisions regarding required disclosure.
Evaluation of Disclosure Controls and Procedures
We have evaluated the effectiveness of the design and operation of our disclosure controls and procedures as of October 28, 2016. Based on that evaluation, the Chief Executive Officer and Chief Financial Officer concluded that our disclosure controls and procedures are effective.
Changes in Internal Controls
The Report of Management on Internal Control over Financial Reporting is set forth on page 27.
The Report of the Independent Registered Public Accounting Firm on Internal Control over Financial Reporting is set forth on page 28.
There were no changes in our internal control over financial reporting during the quarter ended October 28, 2016 that have materially affected, or are reasonably likely to materially affect, our internal control over financial reporting.
ITEM 9B OTHER INFORMATION
Not applicable.
PART III
ITEM 10 DIRECTORS, EXECUTIVE OFFICERS AND CORPORATE GOVERNANCE
The information in the sections titled “Election of Directors,” “Section 16(a) Beneficial Ownership Reporting Compliance” and “Corporate Governance” in the Proxy Statement is incorporated herein by reference. The information regarding executive officers is set forth below.
67
EXECUTIVE OFFICERS OF THE REGISTRANT
The names and ages of all of our executive officers, all of whom are approved by the Board of Directors for re-election in February of each year, and the positions held by them are as listed below. There are no family relationships between any of the officers or between any officer and director.
Name | Age | Position |
Gary E. Hendrickson | 60 | Chairman since June 2012, Chief Executive Officer since June 2011 and President since February 2008 |
James L. Muehlbauer | 55 | Executive Vice President and Chief Financial and Administrative Officer since March 2013 |
Rolf Engh | 63 | Executive Vice President since July 2005, General Counsel and Secretary since April 1993 |
Howard Heckes | 51 | Executive Vice President and President, Global Coatings since December 2014 |
Les Ireland | 52 | Executive Vice President and President, Global Consumer Paints since December 2014 |
The foregoing executive officers have served in the stated capacity for the registrant during the past five years, except for the following:
Mr. Hendrickson was also Chief Operating Officer from February 2008 to June 2011.
Prior to March 2013, Mr. Muehlbauer was Executive Vice President and Chief Financial Officer at Best Buy Co., Inc. since April 2008.
Prior to December 2014, Mr. Heckes was Senior Vice President, Global Consumer since October 2008.
Prior to December 2014, Mr. Ireland was an independent consultant from April 2010 to December 2014, President at Ames True Temper from November 2012 to July 2013, and President, North America Power Tools & Accessories at Black & Decker Corporation from October 2008 to March 2010.
ITEM 11 EXECUTIVE COMPENSATION
The information in the sections titled “Compensation Committee Report” and “Executive and Director Compensation” in the Proxy Statement is incorporated herein by reference.
ITEM 12 | SECURITY OWNERSHIP OF CERTAIN BENEFICIAL OWNERS AND MANAGEMENT AND RELATED STOCKHOLDER MATTERS |
The information in the sections titled “Share Ownership of Certain Beneficial Owners” and “Share Ownership of Management” in the Proxy Statement is incorporated herein by reference.
ITEM 13 | CERTAIN RELATIONSHIPS AND RELATED TRANSACTIONS AND DIRECTOR INDEPENDENCE |
The information in the sections titled “Corporate Governance – Director Independence” and “Certain Relationships and Related Person Transactions” in the Proxy Statement is incorporated herein by reference.
ITEM 14 PRINCIPAL ACCOUNTANT FEES AND SERVICES
The information in the sections titled “Audit Fee Information” and “Pre-Approval of Services by Independent Auditors” in the Proxy Statement is incorporated herein by reference.
68
PART IV
ITEM 15 EXHIBITS AND FINANCIAL STATEMENT SCHEDULES
(a) Documents filed as part of this report.
(1) Financial Statements
Page | ||||
36–66 | ||||
64 | ||||
(2) | Financial Statement Schedules |
Schedule II – Valuation and Qualifying Accounts and Reserves can be found on page 74.
All other schedules for which provision is made in the applicable accounting regulations of the Securities and Exchange Commission are not required under the related instructions or are inapplicable and therefore have been omitted.
(3) Exhibits
Exhibit Number | Description | ||
2.1 | Agreement and Plan of Merger, dated as of March 19, 2016, by and among The Valspar Corporation, The Sherwin-Williams Company and Viking Merger Sub, Inc. (incorporated by reference to Exhibit 2.1 of the Company’s Form 8-K filed on March 21, 2016) | ||
3.1 | Certificate of Incorporation – as amended to and including June 30, 1970, with further amendments to Article Four dated February 29, 1984, February 25, 1986, February 26, 1992, February 26, 1997 and May 22, 2003 and to Article Eleven dated February 25, 1987 (incorporated by reference to Form 10-K for the period ended October 31, 1997, amendment filed with Form 10-Q for the quarter ended April 25, 2003) | ||
3.2 | Amended and Restated Bylaws of The Valspar Corporation (as amended and restated through March 19, 2016) (incorporated by reference to Exhibit 3.1 of the Company’s Form 8-K filed on March 21, 2016) | ||
4.1 | Indenture dated April 24, 2002, between the Registrant and Bank One Trust Company, N.A., as Trustee, relating to Registrant’s 6% Notes due 2007 (The Bank of New York Trust Company, N.A. is the successor in interest to Bank One) (incorporated by reference to Form 10-K for the period ended October 25, 2002, amendment filed with Form 10-Q for the quarter ended April 30, 2004) | ||
4.2 | Second Supplemental Indenture, dated as of April 17, 2007, to indenture dated as of April 24, 2002, between the Registrant and The Bank of New York Trust Company, N.A. relating to the Registrant’s 5.625% Notes due 2012 and 6.050% Notes due 2017 (incorporated by reference to Exhibit 4.2 to Form 8-K filed on April 18, 2007) | ||
69
Exhibit Number | Description | ||
4.3 | Indenture dated July 15, 2005 between the Registrant and The Bank of New York Trust Company, N.A., as Trustee, relating to the Company’s 5.100% Notes due 2015, including form of Registrant’s 5.100% Notes due 2015 (incorporated by reference to Form 8-K filed on July 18, 2005) | ||
4.4 | Third Supplemental Indenture, between the Registrant and U.S. Bank, National Association, as Trustee, dated June 19, 2009, to Indenture dated April 24, 2002, between the Registrant and The Bank of New York Trust Company, N.A. relating to the Registrant’s 7.250% Notes due 2019 (incorporated by reference to Form 8-K filed on June 23, 2009) | ||
4.5 | Fourth Supplemental Indenture, between the Registrant and U.S. Bank, National Association, as Series Trustee, and The Bank of New York Mellon Trust Company, N.A., as Original Trustee, dated January 13, 2012, to Indenture dated April 24, 2002, between the Registrant and The Bank of New York Mellon Trust Company, N.A. relating to the Registrant’s 4.200% Notes due 2022 (incorporated by reference to Form 8-K filed on January 17, 2012) | ||
4.6 | Fifth Supplemental Indenture, among the Registrant, The Bank of New York Mellon Trust Company, N.A. (as successor to Bank One Trust Company, N.A.) and U.S. Bank National Association, as series trustee, dated as of January 21, 2015, to Indenture dated as of April 24, 2002, between the Company and The Bank of New York Mellon Trust Company, N.A. (as successor to Bank One Trust Company, N.A.) (incorporated by reference to Form 8-K filed on January 21, 2015) | ||
4.7 | Sixth Supplemental Indenture, among the Registrant, The Bank of New York Mellon Trust Company, N.A. (as successor to Bank One Trust Company, N.A.) and U.S. Bank National Association, as series trustee, dated as of July 27, 2015, to Indenture dated as of April 24, 2002, between the Company and The Bank of New York Mellon Trust Company, N.A. (as successor to Bank One Trust Company, N.A.) (incorporated by reference to Form 8-K filed on July 28, 2015) | ||
10.1 | The Valspar Corporation Key Employees’ Supplementary Retirement Plan, restated effective October 15, 2008 (incorporated by reference to Form 10-K for the period ended October 31, 2008)* | ||
10.2 | The Valspar Corporation 1991 Stock Option Plan – as amended through August 21, 2007 (incorporated by reference to Form 10-K for the period ended October 31, 2008)* | ||
10.3 | The Valspar Corporation Stock Option Plan for Non-Employee Directors – as amended through October 17, 2007 (incorporated by reference to Form 10-K for the period ended October 31, 2008)* | ||
10.4 | Form of Change in Control Employment Agreement between the Registrant and the Registrant’s Named Executives – as amended through December 10, 2008 (incorporated by reference to Form 10-K for the period ended October 31, 2008)* | ||
10.5 | Form of Nonstatutory Stock Option Agreement for Officers under the Corporation’s 1991 Stock Option Plan – as amended August 21, 2007 (incorporated by reference to Form 10-K for the period ended October 31, 2008)* | ||
10.6 | Amended and Restated Credit Agreement, dated as of December 16, 2013, by and among the registrant, certain subsidiaries of the registrant, Wells Fargo Bank, National Association, as administrative agent for the lenders and an issuing bank and lender, Bank of America, N.A., as syndication agent and an issuing bank and lender, and certain other lenders (incorporated by reference to Form 8-K filed on December 18, 2013) | ||
10.7 | Form of Stock Option Granted to Non-Employee Directors – as amended October 17, 2007 (incorporated by reference to Form 10-K for the period ended October 31, 2008)* | ||
10.8 | Form of Stock Option Granted to Certain Executive Officers (incorporated by reference to Form 10-Q for the quarter ended April 28, 2006)* | ||
10.9 | The Valspar Corporation 2009 Omnibus Equity Plan (as amended through February 15, 2012) (incorporated by reference to Form 10-Q for the quarter ended April 27, 2012)* | ||
70
Exhibit Number | Description | ||
10.10 | Amendment to The Valspar Corporation 2009 Omnibus Equity Plan (incorporated by reference to Form 8-K filed on October 6, 2014)* | ||
10.11 | Form of Indemnification Letter Agreement to Non-Employee Directors and Certain Executive Officers (incorporated by reference to Form 10-Q for the quarter ended January 30, 2009)* | ||
10.12 | Term Sheet for Compensation Program for Non-Employee Directors (incorporated by reference to Form 8-K filed on October 23, 2009)* | ||
10.13 | Letter Agreement between Registrant and Gary E. Hendrickson dated as of February 17, 2011 (incorporated by reference to Form 10-Q filed for the quarter ended January 28, 2011)* | ||
10.14 | Confidentiality and Noncompetition Agreement between Registrant and Gary E. Hendrickson dated as of February 17, 2011 (incorporated by reference to Form 10-Q filed for the quarter ended January 28, 2011) | ||
10.15 | Restricted Stock Unit Agreement between Registrant and Gary E. Hendrickson dated effective as of June 1, 2011 (incorporated by reference to Form 10-Q filed for the quarter ended January 28, 2011)* | ||
10.16 | Letter Agreement with James L. Muehlbauer dated as of February 11, 2013 (incorporated by reference to Form 8-K filed on March 4, 2013)* | ||
10.17 | Form of Change in Control Employment Agreement (for executive officers first elected in fiscal 2013) (incorporated by reference to Form 10-Q filed for the quarter ended April 26, 2013)* | ||
10.18 | Adoption Agreement for The Valspar Corporation Nonqualified Deferred Compensation Plan (incorporated by reference to Form 8-K filed on May 15, 2014)* | ||
10.19 | The Valspar Corporation Nonqualified Deferred Compensation Plan (incorporated by reference to Form 8-K filed on May 15, 2014)* | ||
10.20 | Amendment to The Valspar Corporation Nonqualified Deferred Compensation Plan and Adoption Agreement, dated as of September 27, 2016 (incorporated by reference to Form 8-K filed on September 29, 2016)* | ||
10.21 | The Valspar Corporation 2015 Omnibus Equity Plan (incorporated by reference to Appendix A to the Definitive Proxy Statement for the Annual Meeting of Stockholders, filed on January 16, 2015)* | ||
10.22 | Amendment to The Valspar Corporation 2015 Omnibus Equity Plan (incorporated by reference to Exhibit 10.1 of Valspar’s Form 8-K filed on June 10, 2016)* | ||
10.23 | The Valspar Corporation Amended and Restated Key Employee Annual Bonus and Long-Term Incentive Plan dated June 8, 2016 (incorporated by reference to Exhibit 10.2 of Valspar’s Form 8-K filed on June 10, 2016)* | ||
10.24** | Amended and restated The Valspar Corporation Employee Health Plan* | ||
14.1† | Code of Ethics and Business Conduct (incorporated by reference to Form 10-K for the period ended October 29, 2004) | ||
21.1** | Subsidiaries of the Registrant | ||
23.1** | Consent of Independent Registered Public Accounting Firm – Ernst & Young LLP | ||
24** | Powers of Attorney | ||
71
Exhibit Number | Description | ||
31.1** | Section 302 Certification of the Chief Executive Officer | ||
31.2** | Section 302 Certification of the Chief Financial Officer | ||
32.1** | Certification of Chief Executive Officer and Chief Financial Officer Pursuant to 18 U.S.C. §1350, as Adopted Pursuant to Section 906 of the Sarbanes-Oxley Act of 2002 | ||
101.INS** | XBRL Instance Document | ||
101.SCH** | XBRL Schema Document | ||
101.CAL** | XBRL Calculation Linkbase Document | ||
101.DEF** | XBRL Definition Linkbase Document | ||
101.LAB** | XBRL Label Linkbase Document | ||
101.PRE** | XBRL Presentation Linkbase Document | ||
*Compensatory plans or arrangements required to be filed pursuant to Item 15(b) of Form 10-K.
**Filed electronically herewith.
†Available at the Registrant’s website at http://www.valspar.com.
Portions of the 2017 Proxy Statement are incorporated herein by reference as set forth in Items 10, 11, 12, 13 and 14 of this report. Only those portions expressly incorporated by reference herein shall be deemed filed with the Commission.
72
SIGNATURES
Pursuant to the requirements of Section 13 or 15(d) of the Securities Exchange Act of 1934, the registrant has duly caused this report to be signed on its behalf by the undersigned, thereunto duly authorized.
THE VALSPAR CORPORATION | ||||
/s/ Rolf Engh | 12/20/2016 | |||
Rolf Engh, Secretary | ||||
Pursuant to the requirements of the Securities Exchange Act of 1934, this report has been signed below by the following persons on behalf of the registrant and in the capacities and on the dates indicated. | ||||
/s/ Gary E. Hendrickson | 12/20/2016 | |||
Gary E. Hendrickson, Chairman, Chief Executive Officer and Director (principal executive officer and director) | ||||
/s/ James L. Muehlbauer | 12/20/2016 | |||
James L. Muehlbauer, Executive Vice President and Chief Financial and Administrative Officer (principal financial officer) | ||||
/s/ Brenda A. McCormick | 12/20/2016 | |||
Brenda A. McCormick, Vice President and Corporate Controller (principal accounting officer) | ||||
Directors | ||||
Jack J. Allen* | ||||
John M. Ballbach* | ||||
John S. Bode* | ||||
William M. Cook* | ||||
Jeffrey H. Curler* | ||||
Shane D. Fleming* | ||||
Ian R. Friendly* | ||||
Janel S. Haugarth* | ||||
Mae C. Jemison* | ||||
David R. Lumley* | ||||
Rolf Engh, by signing his name hereto, does hereby sign this document on behalf of each of the above-named officers and/or directors of the registrant pursuant to powers of attorney duly executed by such persons. | ||||
/s/ Rolf Engh | 12/20/2016 | |||
Rolf Engh, Attorney-in-fact | ||||
73
The Valspar Corporation
Schedule II – Valuation and Qualifying Accounts and Reserves
Changes in the allowance for doubtful accounts were as follows:
(dollars in thousands) | 2016 | 2015 | 2014 | ||||||||
Beginning balance | $ | 9,550 | $ | 10,585 | $ | 16,939 | |||||
Amount acquired through acquisitions | — | 401 | — | ||||||||
Bad debt expense | 111 | 2,091 | (4,512 | ) | |||||||
Uncollectable accounts written off, net of recoveries | (2,159 | ) | (3,527 | ) | (1,842 | ) | |||||
Ending balance | $ | 7,502 | $ | 9,550 | $ | 10,585 | |||||
74