Attached files
| file | filename |
|---|---|
| EX-31.2 - CERTIFICATION OF CEO/CFO PURSUANT TO SECTION 302 - VALSPAR CORP | valspar095485_ex31-2.htm |
| EX-23.1 - CONSENT OF INDEPENDENT REGISTERED PUBLIC ACCOUNTING FIRM - VALSPAR CORP | valspar095485_ex23-1.htm |
| EX-32.1 - CERTIFICATION OF CEO/CFO PURSUANT TO SECTION 906 - VALSPAR CORP | valspar095485_ex32-1.htm |
| EX-21.1 - SUBSIDIARIES OF THE REGISTRANT - VALSPAR CORP | valspar095485_ex21-1.htm |
| EX-10.19 - THE VALSPAR CORPORATION 2009 OMNIBUS EQUITY PLAN - VALSPAR CORP | valspar095485s1_ex10-19.htm |
| EX-31.1 - CERTIFICATION OF CEO PURSUANT TO SECTION 302 - VALSPAR CORP | valspar095485_ex31-1.htm |
WASHINGTON, D.C. 20549
|
|
|
|
|
|
|
FORM 10-K |
|
|
|
|
|
|
|
|
x |
ANNUAL REPORT PURSUANT TO SECTION 13 OR 15(d) OF THE SECURITIES EXCHANGE ACT OF 1934 |
|
|
For the fiscal year ended October 30, 2009 |
|
or |
|
|
o |
TRANSITION REPORT PURSUANT TO SECTION 13 OR 15(d) OF THE SECURITIES EXCHANGE ACT OF 1934 |
|
|
For the transition period from _______________________ to ___________________ |
|
|
|
|
Commission File Number 1-3011 |
|
|
|
|
|
|
|
|
|
|
|
|
Delaware |
|
36-2443580 |
|
(State of incorporation) |
|
(I.R.S. Employer Identification No.) |
|
|
|
|
|
901 3rd Avenue South |
|
|
|
Minneapolis, Minnesota |
|
55402 |
|
(Address of principal executive offices) |
|
(Zip Code) |
Registrant’s telephone number, including area code: (612) 851-7000
|
|
|
|
|
Title of Each Class |
|
Name of Each Exchange on which Registered |
|
|
|
|
|
Common Stock, $.50 Par Value |
|
New York Stock Exchange |
|
Common Stock Purchase Rights |
|
New York Stock Exchange |
Securities registered pursuant to Section 12(g) of the Act: None
Indicate by check mark if the
registrant is a well-known seasoned issuer, as defined in Rule 405 of the
Securities Act.
x
Yes o No
Indicate by check mark if the
registrant is not required to file reports pursuant to Section 13 or Section
15(d) of the Act.
o Yes x No
Indicate by check
mark whether the registrant (1) has filed all reports required to be filed by
Section 13 or 15(d) of the Securities Exchange Act of 1934 during the preceding
12 months (or for such shorter period that the registrant was required to file
such reports), and (2) has been subject to the filing requirements for the past
90 days.
x Yes o No
Indicate by check mark
whether the registrant has submitted electronically and posted on its corporate
Web site, if any, every Interactive Data File required to be submitted and
posted pursuant to Rule 405 of Regulation S-T (§232.405 of this chapter) during
the preceding 12 months (or for such shorter period that the registrant was
required to submit and post such files).
o Yes o No
Indicate by check mark if disclosure of delinquent filers pursuant to Item 405 of Regulation S-K is not contained herein, and will not be contained, to the best of registrant’s knowledge, in definitive proxy or information statements incorporated by reference in Part III of this Form 10-K or any amendment to this Form 10-K. x
Indicate by check mark whether the registrant is a large accelerated filer, an accelerated filer, a non-accelerated filer, or a smaller reporting company. See definition of “large accelerated filer,” “accelerated filer” and “smaller reporting company” in Rule 12b-2 of the Exchange Act. (Check one):
Large accelerated filer x Accelerated filer o Non-accelerated filer o Smaller reporting company o
Indicate by check mark whether the registrant is a shell company (as defined in Rule12b-2 of the Act). o Yes x No
The aggregate market value of the voting stock held by persons other than officers, directors and more than 5% stockholders of the registrant as of May 1, 2009 was $1.9 billion based on the closing sales price of $23.38 per share as reported on the New York Stock Exchange. As of December 14, 2009, 99,513,733 shares of Common Stock, $.50 par value per share (net of 18,928,891 shares in treasury), were outstanding.
DOCUMENTS INCORPORATED IN PART BY REFERENCE
Portions of The Valspar Corporation’s definitive Proxy Statement dated January 15, 2010 (the “Proxy Statement”), to be filed with the Securities and Exchange Commission within 120 days after the end of the fiscal year ended October 30, 2009, are incorporated by reference into Part III to the extent described in this report.
The Valspar Corporation
Form 10-K
Table of Contents
|
|
|
|
BUSINESS |
OVERVIEW
The Valspar
Corporation is a leading global coatings and paints manufacturer and
distributor, based on revenues and trade publication rankings. We manufacture
and distribute a broad portfolio of coatings, paints and related products. We
operate our business in two reportable segments: Coatings and Paints. Our net
sales in 2009 from our Coatings and Paints segments were $1,582.8 million and
$1,072.4 million, respectively. Our total net sales in 2009 were $2,879.0
million.
Our Coatings segment includes a broad range of decorative and protective coatings for metal, wood and plastic, primarily for sale to original equipment manufacturing (OEM) customers. Products within our Coatings segment include primers, top coats, varnishes, inks, sprays, stains, fillers and other coatings used by customers in a wide range of manufacturing industries, including building products, appliances, furniture, transportation, agricultural and construction equipment, metal packaging and metal fabrication. We utilize a wide variety of coatings technologies to meet our customers’ coatings requirements, including electrodeposition, powder, solvent-based, waterborne and UV light-cured coatings. This segment includes our packaging product line and our three industrial product lines: coil, general industrial and wood.
Our packaging product line includes coatings for the interior and exterior of metal packaging containers, principally food containers and beverage cans. We also produce coatings for aerosol and paint cans, crowns for glass bottles, plastic packaging and bottle closures. We believe we are the world’s largest supplier of metal packaging coatings. Consolidation and globalization of our customers has occurred in this product line and we have responded by offering a wide variety of packaging coatings products throughout the world.
Our coil product line includes coatings that are applied to metal coils used to manufacture pre-engineered buildings and building components, other metal building and architectural products and appliances. We believe we are the largest supplier of coil coatings in North America. We also supply coil coatings in Asia, South America and Northern and Eastern Europe.
Our general industrial product line provides customers in a wide variety of industries with a single source for powder, liquid and electrodeposition coatings technologies. With our wide range of products and technologies, we are able to supply customers around the world. We have expanded our infrastructure to support customers in Europe, Central and South America and Asia.
Our wood product line includes decorative and protective coatings for wood furniture, building products, cabinets and floors. We believe we are one of the world’s largest suppliers of wood coatings. We have color design, manufacturing and technical service capabilities in the U.S. and Asia, which are important regions for wood furniture production.
Our Paints segment includes a wide variety of products such as paints, primers, topcoats and aerosol spray paints sold primarily through retailers and distribution networks. We sell branded and other products in our Paints segment, including Valspar, Cabot, Huarun, DeBeer and House of Kolor. We support these brands through advertising and marketing programs. This segment includes our architectural and automotive refinish product lines.
Our architectural product line comprises the largest part of our Paints segment. We offer a broad portfolio of interior and exterior paints, stains, primers, varnishes, high performance floor paints and specialty decorative products. We sell these products primarily into the do-it-yourself and professional markets through home centers, mass merchants, hardware wholesalers and independent dealers. We offer our own branded products and private label brands for customers. We continue to invest in brands, including Valspar, Cabot and Huarun. At key customers, we also offer additional marketing and customer support by providing Valspar personnel to train paint department employees and to answer paint questions in stores. In China, we sell our Huarun brand of architectural coatings through distributors and retail outlets.
Our automotive product line includes refinish paints and aerosol spray paints that are sold through automotive refinish distributors, body shops, automotive supply distributors and automotive supply retailers. Our Valspar, De Beer and House of Kolor brands are offered in many countries around the world.
In addition to the main product lines within our two segments, we manufacture and sell specialty polymers, colorants and gelcoats, and we sell furniture protection plans under the Guardsman brand. The specialty polymers and colorants are manufactured for internal use and for external sale to other coatings manufacturers. Our gelcoats and related products are sold to boat manufacturers, shower and tub manufacturers and others.
Much of our growth has occurred during the last decade. During this time we have expanded our business into international markets. A significant portion of our business growth has been accomplished through acquisitions.
1
The Valspar Corporation is a Delaware corporation and was founded in 1806. Our principal executive offices are located at 901 3rd Avenue South, Minneapolis, Minnesota 55402, and our telephone number at that address is (612) 851-7000. Our corporate website address is www.valsparglobal.com. The information on our website is not part of this filing.
PRODUCTS
Coatings Segment
The Coatings segment
includes a broad range of decorative and protective coatings for metal, wood
and plastic, primarily for sale to OEM customers in North America, South
America, Europe and Asia. Products within our Coatings segment include primers,
top coats, varnishes, inks, sprays, stains, fillers and other coatings used by
customers in a wide range of manufacturing industries, including building
products, appliances, furniture, transportation, agricultural and construction
equipment, metal packaging and metal fabrication.
We utilize a wide variety of coatings technologies to meet our customers’ coatings requirements, including electrodeposition, powder, solvent-based, waterborne and UV light-cured coatings. This broad technology capability allows us to customize products to our customers’ specifications and to provide “one stop” integrated solutions. For example, we believe that we are one of only a small number of coatings manufacturers that currently have the technological and manufacturing capabilities to be a single source coatings supplier to appliance makers.
The packaging product line includes coatings for both interior and exterior use in metal packaging containers, principally food containers and beverage cans for global customers. We also produce coatings for aerosol and paint cans, crowns for glass bottles, plastic packaging and bottle closures. We believe we are the world’s largest supplier of metal packaging coatings, producing coatings for the entire can. Consolidation and globalization of our customers has occurred in this product line, and we have responded to these trends by offering a wide variety of packaging coatings products throughout the world.
Our coil coatings are applied to pre-engineered buildings and building components, other metal building and architectural products and appliances. We believe we are the leading coil coatings manufacturer in North America, with particular strength in coil coatings for metal buildings and appliances. With our broad technology portfolio, we have a product for nearly every type of coil coatings application requirement.
Within our general industrial product line, we offer a single source for powder, liquid and electrodeposition coatings technologies to customers in a wide variety of industries, including transportation, and agricultural and construction equipment. We continue to follow our customers with manufacturing and technical service as they move into Europe, Central and South America and Asia.
Our wood product line supplies decorative and protective coatings for wood furniture, building products, cabinets and floors. We offer color design, manufacturing and technical service for customers throughout North America and Asia which serve the domestic and export markets.
Paints Segment
Our architectural
paints products comprise a broad portfolio of interior and exterior paints,
stains, primers, varnishes, high performance floor paints and specialty decorative
products, such as enamels, aerosols and faux finishes, used in both the
do-it-yourself and professional markets. The primary distribution channels for
these products are home centers, mass merchants, hardware wholesalers,
distributors and independent dealers in the U.S. and Canada. In China, the
primary distribution channel is a network of distributors and retail outlets.
Sales of our architectural products are seasonal, with the lowest levels
occurring in the first quarter of our fiscal year.
We develop highly customized merchandising and marketing support programs for our architectural paint customers, enabling them to differentiate their paint departments from their competitors’ through product and color selection assistance, point-of-purchase materials and labeling. We offer branded products under the names Valspar, Cabot, Plasti-Kote, McCloskey and, in China, Huarun and Idol. We support these brands through advertising and marketing programs.
Within the Paints segment, we also manufacture and distribute automotive refinish paints around the world under the brand names Valspar, De Beer and House of Kolor. We also supply aerosol spray paints for automotive supply distributors and large automotive supply retailers under the Plasti-Kote brand name.
All Other
In addition to our
main product lines, we manufacture and sell specialty polymers, gelcoats and
colorants, and we sell furniture protection plans under the Guardsman brand. We
manufacture specialty polymers and colorants for internal use and for external
sale to other coatings manufacturers. Our gelcoats and related products are
sold to boat manufacturers, shower and tub manufacturers and others.
COMPETITION
All aspects of
the coatings and paints business are highly competitive. We face strong
competitors in all areas of our business, some of which are larger and better
capitalized than us.
2
Competition in our Coatings segment is based on formulating products for specific customer applications, meeting customer delivery requirements and providing technical assistance to the customer in product application, price and new technology offerings. In addition, the markets for industrial coatings are becoming increasingly global as customers are looking for global coatings solutions. We can provide global coatings solutions to customers due to our position as one of the world’s largest industrial coatings manufacturers and our commitment to developing innovative technologies.
Competition in our Paints segment is based on factors such as consumer brand recognition, product quality, distribution and price. In this segment, we support our brand awareness through advertising and highly customized merchandising and marketing support programs to our customers. We offer high quality products through our distribution networks.
RAW MATERIALS
We obtain raw
materials from a number of suppliers. The raw materials are derived from
petrochemicals, minerals and metals. Historically, all of these materials have
been generally available on the open market, with pricing and availability
subject to fluctuation. The chemical industry’s economic cycle for the past
four to five years has been volatile. Early in 2009, due to weak economic
conditions, prices for many of the raw materials we purchased moderated from
the historical highs of 2008. As the year progressed, material prices began to
rise again as crude oil and other feedstock prices recovered. Current raw
material price levels are still above trend lines from the early part of this
decade. Raw material demand and price volatility are managed to minimize the
impact on our operations. Because our raw material costs average approximately
80% of our cost of goods sold, the efficient use of raw materials is a critical
cost component of the products we manufacture.
PATENTS
Our policy is
to seek patent protection for our products and manufacturing processes when
appropriate. We also license some patented technology from other sources. Our
business is not materially dependent upon licenses or similar rights or on any
single patent or group of related patents. Although we believe our patent
rights are valuable, our knowledge and trade secret information regarding our
manufacturing processes and materials have also been important in maintaining
our competitive position. As a condition of employment, except where otherwise
prohibited by law or union rules, we require each employee to sign a
confidentiality agreement relating to proprietary information.
While we make efforts to protect our trade secret information, others may independently develop or otherwise acquire substantially equivalent proprietary information or techniques or gain access to our proprietary technology or disclose this technology. Any of these factors could adversely impact the value of our proprietary trade secret information and harm our business.
SEASONALITY AND WORKING CAPITAL ITEMS
Our sales
volume is traditionally lowest during the first quarter of the fiscal year
(November, December and January), and highest in the third quarter of the
fiscal year (May, June and July), primarily due to weather and the buying cycle
in the Coatings and Paints segments. When sales are generally lowest, we build
inventory, the financing for which is provided primarily by internally
generated funds and short-term and long-term credit lines discussed in Note 5
of Notes to Consolidated Financial Statements.
SIGNIFICANT CUSTOMERS
In 2009, our
sales to Lowe’s Companies, Inc. exceeded 10% of net sales, and our ten largest
customers accounted for approximately 38% of net sales. In 2009, our five
largest customers in the Paints segment accounted for approximately 63% of our
net sales in the segment.
BACKLOG AND GOVERNMENT CONTRACTS
We have no
significant backlog of orders and generally are able to fill orders on a
current basis. No material portion of our business is subject to renegotiation
of profits or termination of contracts or subcontracts at the election of the
government.
RESEARCH AND DEVELOPMENT
Our product and
application technology is supported by underlying chemistry that has not changed
over time. Ongoing research and development efforts include reviewing our
propriety technology, including the technology we have acquired through our
acquisitions, and making formulation changes to improve our products. This has
resulted in several successful product improvements. For example, we have
recently commercialized a new coil coating product with improved hardness,
adhesion and flexibility. In our architectural line, we have introduced an
improved concrete coating. In our wood line, we have commercialized a
waterborne ultraviolet energy cured product line. Moreover, we have continued
to expand our line of polymers and we now have a full portfolio of both
water-based and conventional polymers for architectural, industrial and
packaging products.
Research and development costs for fiscal 2009 were $91.3 million or 3.2% of net sales, compared to $96.6 million or 2.8% of net sales for fiscal 2008 and $90.3 million or 2.8% of net sales for fiscal 2007. Our primary emphasis has been on developing and refining emerging technologies in our Coatings segment.
3
ENVIRONMENTAL COMPLIANCE
We undertake to
comply with applicable regulations relating to protection of the environment
and workers’ safety. Capital expenditures for this purpose were not material in
fiscal 2009, and capital expenditures for fiscal 2010 to comply with existing
laws and regulations are also not expected to be material.
EMPLOYEES
We employ
approximately 8,800 persons, approximately 500 of whom are subject to
collective bargaining agreements in the United States. We believe that our
relationship with our unionized employees is good.
FOREIGN OPERATIONS AND EXPORT SALES
Our foreign
operations are conducted primarily through majority-owned subsidiaries and, to
a limited extent, through joint ventures. Our various acquisitions and joint
ventures over the past several years have increased revenues from foreign
subsidiaries and operations, which comprised approximately 38% of our total
revenues in fiscal 2009. Sales from foreign operations as a percent of
consolidated sales decreased in 2009 compared to 2008, but we expect the
percentage to increase in the years ahead.
We have manufacturing plants in Australia, Brazil, Canada, China, France, Germany, Ireland, Malaysia, Mexico, The Netherlands, Singapore, Switzerland, Thailand, the United Kingdom and Vietnam. We also have joint ventures in China, Japan, South Africa and Vietnam and sales offices in other countries.
During fiscal 2009, export sales from the United States represented 2.2% of our business.
|
|
|
|
RISK FACTORS |
You should consider the following risk factors, in addition to the other information presented or incorporated by reference into this Annual Report on Form 10-K, in evaluating our business and your investment in us.
Deterioration of economic conditions could harm our business.
Our business may be adversely affected by changes in national or global economic conditions, including inflation, interest rates, access to and functioning of capital markets, consumer spending rates, energy availability and costs (including fuel surcharges), and the effects of governmental initiatives to manage economic conditions.
The recent volatility in financial markets and the deterioration of national and global economic conditions could impact our operations as follows:
|
|
|
|
• |
the value of our investments in debt and equity securities may decline, including our assets held in pension plans; |
|
|
|
|
• |
financial stability of our customers and suppliers may be compromised, which could result in additional bad debts for us or non-performance by suppliers; and |
|
|
|
|
• |
it may become more costly or difficult to obtain financing to fund operations or investment opportunities, or to refinance our debt in the future. |
Additionally, we utilize hedges and other derivative financial instruments to reduce our exposure to various interest rate risks, which qualify for hedge accounting for financial reporting purposes. Volatile fluctuations in market conditions could cause these instruments to become ineffective, which could require any gains or losses associated with these instruments to be reported in our earnings each period.
Fluctuations in the supply and prices of raw materials could negatively impact our financial results.
We purchase the raw materials needed to manufacture our products from a number of suppliers. The majority of our raw materials are petroleum-based derivatives and minerals and metals. Under normal market conditions, these materials are generally available on the open market. From time to time, however, the prices and availability of these raw materials may fluctuate significantly, which could impair our ability to procure necessary materials, or increase the cost of manufacturing our products. During the past four to five years, our raw material costs have been volatile. When raw material costs increase, our profit margins are reduced unless and until we are able to pass along the increases to our customers through higher prices. If raw material costs increase, and if we are unable to pass along, or are delayed in passing along, those increases to our customers, we will experience profit margin reductions.
Many of our customers are in cyclical industries, which may affect the demand for our products.
Many of our customers, especially for our industrial products, are in businesses and industries that are cyclical in nature and sensitive to changes in general economic conditions. As a result, the demand for our products by these customers depends, in part, upon general economic conditions. The challenging global economic environment has had the most severe impact on our industrial product lines. Downward economic cycles affecting the industries of our customers will reduce sales of our products. When general economic conditions deteriorate, we may suffer reductions in our sales and profitability.
4
The industries in which we operate are highly competitive and some of our competitors may be larger and may have greater financial resources than we do.
All aspects of the coatings and paints business are highly competitive. We face strong competitors in all areas of our business. Any increase in competition may cause us to lose market share or compel us to reduce prices to remain competitive, which could result in reduced margins for our products. Competitive pressures may not only impair our margins but may also impact our revenues and our growth. A number of our competitors are larger than us and may have greater financial resources than we do. Increased competition with these companies could curtail price increases or could require price reductions or increased spending on marketing and sales, any of which could adversely affect our results of operations.
Industry sources estimate that the top ten largest coatings manufacturers represent more than half of the world’s coatings sales. Our larger competitors may have more resources to finance acquisitions or internal growth in this competitive environment. Also, we buy our raw materials from large suppliers, primarily chemical companies. In many of our product lines, we then sell our finished goods to large customers, such as do-it-yourself home centers, large equipment manufacturers and can makers. Our larger competitors may have more resources or capabilities to conduct business with these large suppliers and large customers. Finally, many of our larger competitors operate businesses other than paints and coatings. These competitors may be better able to compete during industry downturns.
We have a significant amount of indebtedness.
Our total debt, including notes payable, was $880.4 million at October 30, 2009. Our level of indebtedness may have important consequences. For example, it:
|
|
|
|
• |
may require us to dedicate a material portion of our cash flow from operations to make payments on our indebtedness, thereby reducing the availability of our cash flow to fund working capital, capital expenditures, acquisitions or other general corporate purposes; |
|
|
|
|
• |
could make us less attractive to prospective or existing customers or less able to fund potential acquisitions; and |
|
|
|
|
• |
may limit our flexibility to adjust to changing business and market conditions and make us more vulnerable to a downturn in general economic conditions as compared to a competitor that may have lower indebtedness. |
Future acquisitions may not be successful.
Acquisitions have historically contributed significantly to the growth of our company. As part of our growth strategy, we intend to continue to pursue acquisitions of complementary businesses and products. If we are successful in completing such acquisitions, we may experience:
|
|
|
|
• |
difficulties in assimilating acquired companies and products into our existing business; |
|
|
|
|
• |
delays in realizing the benefits from the acquired companies or products; |
|
|
|
|
• |
diversion of our management’s time and attention from other business concerns; |
|
|
|
|
• |
difficulties due to lack of or limited prior experience in any new markets we may enter; |
|
|
|
|
• |
unforeseen claims and liabilities, including unexpected environmental exposures or product liability; |
|
|
|
|
• |
unforeseen adjustments, charges and write-offs; |
|
|
|
|
• |
problems enforcing the indemnification obligations of sellers of businesses for claims and liabilities; |
|
|
|
|
• |
unexpected losses of customers of, or suppliers to, the acquired business; |
|
|
|
|
• |
difficulty in conforming the acquired business’ standards, processes, procedures and controls with our operations; |
|
|
|
|
• |
variability in financial information arising from the implementation of purchase price accounting; |
|
|
|
|
• |
difficulties in retaining key employees of the acquired businesses; and |
|
|
|
|
• |
challenges arising from the increased scope, geographic diversity and complexity of our operations. |
Any of these factors may make it more difficult to repay our debt. In addition, an acquisition could materially impair our operating results by causing us to incur debt or requiring us to amortize acquisition expenses or the cost of acquired assets. We can give no assurance that we will continue to be able to identify, acquire and integrate successful strategic acquisitions in the future or be able to implement successfully our operating and growth strategies within our existing markets or with respect to any future product or geographic diversification efforts.
5
We derive a substantial portion of our revenues from foreign markets, which subjects us to additional business risks.
We conduct a substantial portion of our business outside of the United States. We and our joint ventures currently have production facilities, research and development facilities, and administrative and sales offices located outside the United States, including facilities and offices located in Australia, Brazil, Canada, China, Finland, France, Germany, Ireland, Malaysia, Mexico, The Netherlands, Singapore, South Africa, Switzerland, Thailand, the United Kingdom and Vietnam. In 2009, revenues from products sold outside the United States accounted for approximately 38% of our net sales.
We expect sales from international markets to continue to represent a significant portion of our net sales. Notwithstanding the benefits of geographic diversification, our business is subject to risks related to the differing legal, political, social and regulatory requirements and economic conditions of many jurisdictions. Risks inherent in international operations include the following:
|
|
|
|
• |
agreements may be difficult to enforce and receivables difficult to collect; |
|
|
|
|
• |
foreign customers may have longer payment cycles; |
|
|
|
|
• |
foreign countries may impose additional withholding taxes or otherwise tax our foreign income, or adopt other restrictions on foreign trade or investment, including currency exchange controls; |
|
|
|
|
• |
foreign operations may experience staffing difficulties and labor disputes; |
|
|
|
|
• |
transportation and other shipping costs may increase; |
|
|
|
|
• |
foreign governments may nationalize private enterprises; |
|
|
|
|
• |
unexpected adverse changes in export duties, quotas and tariffs and difficulties in obtaining export licenses; |
|
|
|
|
• |
intellectual property rights may be more difficult to enforce; |
|
|
|
|
• |
fluctuations in exchange rates may affect product demand and may adversely affect the profitability in U.S. dollars of products and services we provide in international markets where payment for our products and services is made in the local currency; |
|
|
|
|
• |
general economic conditions in the countries in which we operate could have an adverse effect on our earnings from operations in those countries; |
|
|
|
|
• |
our business and profitability in a particular country could be affected by political or economic repercussions on a domestic, country specific or global level from terrorist activities and the response to such activities; |
|
|
|
|
• |
difficulties in attracting and retaining key employees outside of the United States; |
|
|
|
|
• |
unexpected adverse changes in foreign laws or regulatory requirements may occur; and |
|
|
|
|
• |
compliance with a variety of foreign laws and regulations may be burdensome. |
We have certain key customers.
Our relationships with certain key customers are important to us. From 2007 through 2009, sales to our largest customer exceeded 10% of our total net sales. In 2009, our ten largest customers accounted for approximately 38% of our total net sales. Although we sell various types of products through various channels of distribution, we believe that the loss of a substantial portion of our sales to our largest customers could have a material adverse impact on us.
Environmental laws and regulations affect our business.
We are subject to numerous environmental laws and regulations that impose various environmental controls on us, including among other things, the discharge of pollutants into the air and water, the handling, use, treatment, storage and clean-up of hazardous and non-hazardous wastes, the investigation and remediation of soil and groundwater affected by hazardous substances, or otherwise relating to environmental protection and various health and safety matters. These laws and regulations govern actions that may have adverse environmental effects and also require compliance with certain practices when handling and disposing of hazardous wastes. These laws and regulations also impose strict, retroactive and joint and several liability for the costs of, and damages resulting from, cleaning up current sites, past spills, disposals and other releases of hazardous substances and violations of these laws and regulations can also result in fines and penalties. We are currently undertaking remedial activities at a number of our facilities and properties, and have received notices under the Comprehensive Environmental Response, Compensation and Liability Act, or CERCLA, or analogous state laws of liability or potential liability in connection with the disposal of material from our operations or former operations.
We are also subject to the risk that new environmental laws or regulations, or changes in existing laws or regulations or their interpretation, could expand our potential liability by regulating additional substances or increasing our obligations with respect to the handling, disposal or remediation of regulated substances.
In addition, our customers’ or consumers’ perceptions about the acceptability or potential environmental or health effects of certain substances could require us to invest additional amounts to develop products that exclude those substances. If we are unable to develop products that exclude those substances when and if required by our customers, we may experience reduced sales and profitability.
6
|
|
|
|
UNRESOLVED STAFF COMMENTS |
Not Applicable.
|
|
|
|
PROPERTIES |
We lease our principal offices located in Minneapolis, Minnesota. North America manufacturing operations are conducted at thirty-one locations (29 owned; 2 leased), primarily in California, Illinois, Indiana, North Carolina, Pennsylvania and Texas, including one owned manufacturing facility in both Canada and Mexico. The total combined square footage for our principal offices and manufacturing operations in North America is approximately 4,385,000, which includes 130,000 square feet at our principal offices. Asia Pacific manufacturing operations are conducted at eleven locations (8 owned; 3 leased) in Australia, China, Malaysia, Singapore, Thailand and Vietnam with a total combined square footage of approximately 1,252,000. European manufacturing operations are conducted at nine locations (8 owned; 1 leased) in France, Germany, Ireland, The Netherlands, Switzerland and the United Kingdom with a total combined square footage of approximately 929,000. In South America, we own one manufacturing facility in Brazil with square footage of approximately 400,000. In South Africa, we own one manufacturing facility with square footage of approximately 54,000.
Set forth below is a breakdown of the approximate square footage of principal facilities by region as of October 30, 2009:
|
|
|
|
|
|
|
|
|
|
|
|
|
Region |
|
Approximate |
|
Approximate |
|
Total |
|
|||
|
North America |
|
|
3,862,000 |
|
|
523,000 |
|
|
4,385,000 |
|
|
Asia Pacific |
|
|
1,144,000 |
|
|
108,000 |
|
|
1,252,000 |
|
|
Europe |
|
|
834,000 |
|
|
95,000 |
|
|
929,000 |
|
|
Other |
|
|
454,000 |
|
|
— |
|
|
454,000 |
|
|
Total |
|
|
6,294,000 |
|
|
726,000 |
|
|
7,020,000 |
|
Set forth below is a breakdown of principal facilities square footage by business segment:
|
|
|
|
|
|
|
Business Segment |
|
Approximate |
|
|
|
Coatings |
|
|
3,884,000 |
|
|
Paints |
|
|
2,259,000 |
|
|
All Other |
|
|
877,000 |
|
|
Total |
|
|
7,020,000 |
|
Management believes our manufacturing properties are well maintained, in good operating condition and adequate for the purposes for which they are being used. We had restructuring initiatives in 2009 that included plant closures, which are reflected above. See Note 15 in Notes to Consolidated Financials Statements for more information. Operating capacity varies by product line, but additional production capacity is available for most product lines by increasing the number of days and/or shifts worked.
7
|
|
|
|
LEGAL PROCEEDINGS |
Environmental Matters
We are involved in
various claims relating to environmental matters at a number of current and
former plant sites. We engage or participate in remedial and other
environmental compliance activities at certain of these sites. At other sites,
we have been named as a potentially responsible party (“PRP”) under federal and
state environmental laws for site remediation. Management analyzes each
individual site, considering the number of parties involved, the level of our
potential liability or contribution relative to the other parties, the nature
and magnitude of the hazardous wastes involved, the method and extent of
remediation, the potential insurance coverage, the estimated legal and
consulting expense with respect to each site and the time period over which any
costs would likely be incurred. Based on the above analysis, management
estimates the clean-up costs and related claims for each site. The estimates
are based in part on discussion with other PRPs, governmental agencies and
engineering firms.
We accrue appropriate reserves for potential environmental liabilities, which are reviewed and adjusted as additional information becomes available. While uncertainties exist with respect to the amounts and timing of our ultimate environmental liabilities, management believes there is not a reasonable possibility that such liabilities, individually or in the aggregate, will have a material adverse effect on our financial condition or results of operations.
Other Legal Matters
We are involved in a
variety of legal claims and proceedings relating to personal injury, product
liability, warranties, customer contracts, employment, trade practices,
environmental and other legal matters that arise in the normal course of business.
These claims and proceedings include cases where we are one of a number of
defendants in proceedings alleging that the plaintiffs suffered injuries or
contracted diseases from exposure to chemicals or other ingredients used in the
production of some of our products or waste disposal. We believe these claims
and proceedings are not out of the ordinary course for a business of the type
and size in which we are engaged. While we are unable to predict the ultimate
outcome of these claims and proceedings, management believes there is not a
reasonable possibility that the costs and liabilities of such matters,
individually or in the aggregate, will have a material adverse effect on our
financial condition or results of operations.
|
|
|
|
SUBMISSION OF MATTERS TO A VOTE OF SECURITY HOLDERS |
There was no matter submitted during the fourth quarter of fiscal year 2009 to a vote of security holders.
EXECUTIVE OFFICERS OF THE REGISTRANT
The names and
ages of all of our executive officers, all of whom are approved by the Board of
Directors for re-election in February of each year, and the positions held by
them are as listed below. There are no family relationships between any of the
officers or between any officer and director.
|
|
|
|
|
|
|
Name |
|
Age |
|
Position |
|
William L. Mansfield |
|
61 |
|
Chairman since August 2007 and Chief Executive Officer since February 2005 |
|
|
|
|
|
|
|
Lori A. Walker |
|
52 |
|
Senior Vice President and Chief Financial Officer since February 2008 |
|
|
|
|
|
|
|
Gary E. Hendrickson |
|
53 |
|
President and Chief Operating Officer since February 2008 and Director since August 2009 |
|
|
|
|
|
|
|
Steven L. Erdahl |
|
57 |
|
Executive Vice President since April 2004 |
|
|
|
|
|
|
|
Rolf Engh |
|
56 |
|
Executive Vice President since July 2005, General Counsel and Secretary since April 1993 |
|
|
|
|
|
|
|
Anthony L. Blaine |
|
42 |
|
Senior Vice President – Human Resources since January 2007 |
The foregoing executive officers have served in the stated capacity for the registrant during the past five years, except for the following:
Prior to February 2008, Mr. Mansfield was President since February 2005. Prior to February 2005, Mr. Mansfield was Executive Vice President and Chief Operating Officer since April 2004.
Prior to February 2008, Ms. Walker was Vice President, Treasurer and Controller since October 2004.
Prior to February 2008, Mr. Hendrickson was Senior Vice President since July 2005. Prior to July 2005, Mr. Hendrickson was Group Vice President – Wood Coatings since April 2004.
Prior to July 2005, Mr. Engh was Senior Vice President since November 1998.
Prior to January 2007, Mr. Blaine was Vice President – Human Resources at MeadWestvaco Corporation since June 2001.
8
|
|
|
|
|
|
|
|
|
|
MARKET FOR REGISTRANT’S COMMON EQUITY, RELATED STOCKHOLDER MATTERS AND ISSUER PURCHASES OF EQUITY SECURITIES |
Our Common Stock is listed on the New York Stock Exchange under the trading symbol VAL. The table below sets forth the quarterly high and low market prices of the Common Stock for fiscal years 2009 and 2008 as quoted on the New York Stock Exchange.
|
|
|
|
|
|
|
|
|
|
|
|
Market Price (high/low) |
|
||||
|
For the Fiscal Year |
|
2009 |
|
2008 |
|
||
|
First Quarter |
|
$ |
21.32–14.47 |
|
$ |
26.20–17.38 |
|
|
Second Quarter |
|
$ |
24.91–15.13 |
|
$ |
23.27–18.10 |
|
|
Third Quarter |
|
$ |
25.61–21.51 |
|
$ |
22.68–17.95 |
|
|
Fourth Quarter |
|
$ |
28.60–24.80 |
|
$ |
24.95–16.02 |
|
The quarterly dividend declared December 9, 2009, to be paid on January 15, 2010 to common stockholders of record December 28, 2009, was increased to $0.16 per share. The table below sets forth the quarterly dividend paid for fiscal years 2009 and 2008.
|
|
|
|
|
|
|
|
|
|
|
|
Per Share Dividends |
|
||||
|
For the Fiscal Year |
|
2009 |
|
2008 |
|
||
|
First Quarter |
|
$ |
0.15 |
|
$ |
0.14 |
|
|
Second Quarter |
|
$ |
0.15 |
|
$ |
0.14 |
|
|
Third Quarter |
|
$ |
0.15 |
|
$ |
0.14 |
|
|
Fourth Quarter |
|
$ |
0.15 |
|
$ |
0.14 |
|
|
|
|
$ |
0.60 |
|
$ |
0.56 |
|
The number of record holders of our Common Stock at December 14, 2009 was 1,448.
ISSUER PURCHASES OF EQUITY SECURITIES
|
|
|
|
|
|
|
|
|
|
|
|
|
|
|
|
Period |
|
Total
Number |
|
Average |
|
Total
Number of |
|
Maximum
Number |
|
||||
|
8/01/09 – 8/28/09 |
|
|
180,000 |
|
|
$ 27.30 |
|
|
180,000 |
|
|
3,820,000 |
|
|
8/29/09 – 9/25/09 |
|
|
1,135,000 |
|
|
27.16 |
|
|
1,135,000 |
|
|
2,685,000 |
|
|
9/26/09 – 10/30/09 |
|
|
685,000 |
|
|
27.21 |
|
|
685,000 |
|
|
2,000,000 |
|
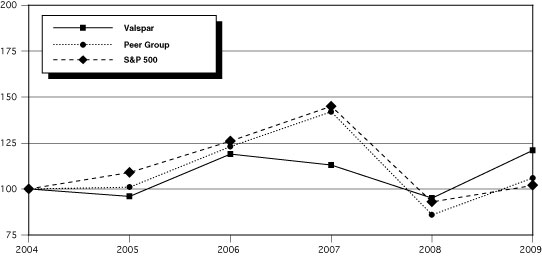
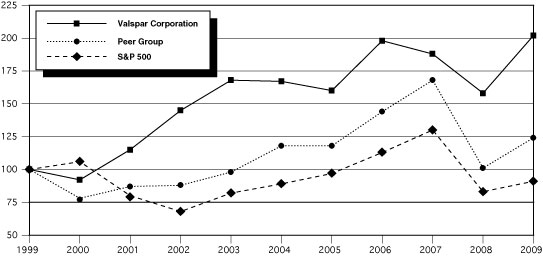
Stock Performance Graphs
The following graphs
compare our cumulative total shareholder return for the last five fiscal years
and the last ten fiscal years with the cumulative total return of the Standard
& Poor’s 500 Stock Index and a peer group of companies selected by us on a
line-of-business basis. The graphs assume the investment of $100 in our Common
Stock, the S&P 500 Index and the peer group at the end of fiscal 2004 and
fiscal 1999, respectively, and the reinvestment of all dividends.
The companies selected to form the peer group index are: Akzo Nobel N.V.; Ferro Corporation; H.B. Fuller Company; Masco Corporation; Newell Rubbermaid Inc.; PPG Industries, Inc.; RPM International Inc. and The Sherwin-Williams Company.
We included the ten-year graph because we believe the ten-year graph provides information regarding performance of our Common Stock over an extended period.
9
COMPARISON OF FIVE YEAR CUMULATIVE TOTAL RETURN
Among The Valspar Corporation, a Peer Group and the S&P 500 Index
|
|
|
|
|
|
|
|
|
|
|
|
|
|
|
|
|
|
|
|
|
|
|
|
Cumulative Total Return |
|
||||||||||||||||
|
|
|
||||||||||||||||||
|
|
|
2004 |
|
2005 |
|
2006 |
|
2007 |
|
2008 |
|
2009 |
|
||||||
|
Valspar |
|
$ |
100 |
|
$ |
96 |
|
$ |
119 |
|
$ |
113 |
|
$ |
95 |
|
$ |
121 |
|
|
Peer Group |
|
$ |
100 |
|
$ |
101 |
|
$ |
123 |
|
$ |
142 |
|
$ |
86 |
|
$ |
106 |
|
|
S&P 500 |
|
$ |
100 |
|
$ |
109 |
|
$ |
126 |
|
$ |
145 |
|
$ |
93 |
|
$ |
102 |
|
Assumes $100 invested on October 31, 2004 in the Common Stock of The Valspar Corporation, the Peer Group and the S&P 500 Index, including reinvestment of dividends.
COMPARISON OF TEN YEAR CUMULATIVE TOTAL RETURN
Among The Valspar Corporation, a Peer Group and the S&P 500 Index
|
|
|
|
|
|
|
|
|
|
|
|
|
|
|
|
|
|
|
|
|
|
|
|
|
|
|
|
|
|
|
|
|
|
|
|
|
|
|
Cumulative Total Return |
||||||||||||||||||||||||||||||||
|
|
|
|||||||||||||||||||||||||||||||||
|
|
|
1999 |
|
2000 |
|
2001 |
|
2002 |
|
2003 |
|
2004 |
|
2005 |
|
2006 |
|
2007 |
|
2008 |
|
2009 |
|
|||||||||||
|
Valspar |
|
$ |
100 |
|
$ |
92 |
|
$ |
115 |
|
$ |
145 |
|
$ |
168 |
|
$ |
167 |
|
$ |
160 |
|
$ |
198 |
|
$ |
188 |
|
$ |
158 |
|
$ |
202 |
|
|
Peer Group |
|
$ |
100 |
|
$ |
78 |
|
$ |
87 |
|
$ |
88 |
|
$ |
98 |
|
$ |
118 |
|
$ |
118 |
|
$ |
144 |
|
$ |
168 |
|
$ |
101 |
|
$ |
124 |
|
|
S&P 500 |
|
$ |
100 |
|
$ |
106 |
|
$ |
80 |
|
$ |
68 |
|
$ |
82 |
|
$ |
89 |
|
$ |
97 |
|
$ |
113 |
|
$ |
130 |
|
$ |
83 |
|
$ |
91 |
|
Assumes $100 invested on October 31, 1999 in the Common Stock of The Valspar Corporation, the Peer Group and the S&P 500 Index, including reinvestment of dividends.
10
|
|
|
|
SELECTED FINANCIAL DATA |
The following selected financial data has been derived from our audited Consolidated Financial Statements and should be read in conjunction with “Management’s Discussion and Analysis of Financial Condition and Results of Operations” and the Consolidated Financial Statements and related notes included elsewhere in this Form 10-K.
|
|
|
|
|
|
|
|
|
|
|
|
|
|
|
|
|
|
|
|
|
|
|
|
|
Fiscal Years |
|
|||||||||||||
|
(Dollars in thousands, |
|
2009 |
|
2008 |
|
2007 |
|
2006 |
|
2005 |
|
|||||||
|
Operating Results |
|
Net Sales |
|
$ |
2,879,042 |
|
$ |
3,482,378 |
|
$ |
3,249,287 |
|
$ |
2,978,062 |
|
$ |
2,713,950 |
|
|
|
|
Cost and Expenses |
|
|
|
|
|
|
|
|
|
|
|
|
|
|
|
|
|
|
|
Cost of Sales |
|
|
1,900,114 |
|
|
2,504,947 |
|
|
2,277,490 |
|
|
2,072,157 |
|
|
1,928,352 |
|
|
|
|
Operating Expense |
|
|
687,960 |
|
|
684,056 |
|
|
662,224 |
|
|
598,468 |
|
|
514,735 |
|
|
|
|
Income from Operations |
|
|
290,968 |
|
|
293,375 |
|
|
309,573 |
|
|
307,437 |
|
|
270,863 |
|
|
|
|
Interest Expense |
|
|
50,394 |
|
|
57,745 |
|
|
61,662 |
|
|
46,206 |
|
|
44,522 |
|
|
|
|
Other (Income) Expense – Net |
|
|
2,246 |
|
|
6,933 |
|
|
(11,860 |
) |
|
3,799 |
|
|
621 |
|
|
|
|
Income Before Income Taxes |
|
|
238,328 |
|
|
228,697 |
|
|
259,771 |
|
|
257,432 |
|
|
225,720 |
|
|
|
|
Net Income |
|
|
160,153 |
|
|
150,766 |
|
|
172,115 |
|
|
175,252 |
|
|
147,618 |
|
|
|
|
Net Income as a Percent of Sales |
|
|
5.6 |
% |
|
4.3 |
% |
|
5.3 |
% |
|
5.9 |
% |
|
5.4 |
% |
|
|
|
Return on Average Equity |
|
|
10.8 |
% |
|
10.6 |
% |
|
13.1 |
% |
|
15.2 |
% |
|
14.3 |
% |
|
|
|
Per Common Share: |
|
|
|
|
|
|
|
|
|
|
|
|
|
|
|
|
|
|
|
Net Income – Basic |
|
$ |
1.50 |
* |
$ |
1.39 |
* |
$ |
1.52 |
* |
$ |
1.73 |
|
$ |
1.45 |
|
|
|
|
Net Income – Diluted |
|
|
1.49 |
* |
|
1.38 |
* |
|
1.50 |
* |
|
1.71 |
|
|
1.42 |
|
|
|
|
Dividends Paid |
|
|
0.60 |
|
|
0.56 |
|
|
0.52 |
|
|
0.44 |
|
|
0.40 |
|
|
|
|
Stockholders’ Equity |
|
|
15.12 |
|
|
14.53 |
|
|
13.72 |
|
|
12.17 |
|
|
10.57 |
|
|
Financial Position |
|
Total Assets |
|
$ |
3,511,024 |
|
$ |
3,520,042 |
|
$ |
3,452,281 |
|
$ |
3,191,535 |
|
$ |
2,732,383 |
|
|
|
|
Working Capital** |
|
|
406,638 |
|
|
435,897 |
|
|
458,141 |
|
|
389,394 |
|
|
432,966 |
|
|
|
|
Property, Plant and Equipment, Net |
|
|
471,088 |
|
|
489,716 |
|
|
514,396 |
|
|
459,605 |
|
|
427,822 |
|
|
|
|
Long-Term Debt, Excluding Current Portion |
|
|
873,095 |
|
|
763,129 |
|
|
648,988 |
|
|
350,267 |
|
|
706,415 |
|
|
|
|
Stockholders’ Equity |
|
|
1,504,507 |
|
|
1,452,868 |
|
|
1,380,797 |
|
|
1,240,063 |
|
|
1,061,092 |
|
|
Other Statistics |
|
Property, Plant and Equipment Expenditures |
|
$ |
57,897 |
|
$ |
43,045 |
|
$ |
76,940 |
|
$ |
75,417 |
|
$ |
62,731 |
|
|
|
|
Depreciation and Amortization Expense |
|
|
82,862 |
|
|
80,831 |
|
|
71,811 |
|
|
68,716 |
|
|
68,395 |
|
|
|
|
Research and Development Expense |
|
|
91,303 |
|
|
96,552 |
|
|
90,322 |
|
|
82,608 |
|
|
79,286 |
|
|
|
|
Total Cash Dividends |
|
$ |
60,116 |
|
$ |
55,854 |
|
$ |
52,670 |
|
$ |
44,655 |
|
$ |
40,658 |
|
|
|
|
Average Diluted Common Shares Outstanding (000’s) |
|
|
100,921 |
|
|
100,326 |
|
|
102,617 |
|
|
102,726 |
|
|
104,150 |
|
|
|
|
Number of Stockholders at Year-End |
|
|
1,449 |
|
|
1,467 |
|
|
1,474 |
|
|
1,532 |
|
|
1,524 |
|
|
|
|
Number of Employees at Year-End |
|
|
8,788 |
|
|
9,341 |
|
|
9,946 |
|
|
9,556 |
|
|
7,540 |
|
|
|
|
Market Price Range – Common Stock: |
|
|
|
|
|
|
|
|
|
|
|
|
|
|
|
|
|
|
|
High |
|
$ |
28.60 |
|
$ |
26.20 |
|
$ |
29.58 |
|
$ |
29.62 |
|
$ |
25.52 |
|
|
|
|
Low |
|
|
14.47 |
|
|
16.02 |
|
|
24.00 |
|
|
21.54 |
|
|
20.41 |
|
|
|
|
|
Reference is made to the Notes to Consolidated Financial Statements for a summary of accounting policies and additional information. |
|
|
|
|
|
Per share data has been adjusted to reflect a 2 for 1 stock split effective in September 2005. |
|
|
|
|
|
* |
Huarun Redeemable Stock accrual reduced basic and diluted net income per common share by $0.10 in 2009, $0.12 in 2008 and $0.18 in 2007. The accrual was related to the minority interest shares of Huarun Paints Holding Company Limited as further described in Note 2 in Notes to Consolidated Financial Statements. Adjusted net income per common share diluted was $1.59 for 2009, $1.50 for 2008 and $1.68 for 2007. See related reconciliation in “Management’s Discussion and Analysis of Financial Condition and Results of Operations — Overview — Earnings per Share” for more information. In 2009 and 2008, net income per common share basic and diluted included $0.18 and $0.16 per share in restructuring charges, respectively. See Note 15 in Notes to Consolidated Financial Statements for more information. Net income per common share basic and diluted for 2008 and 2007 included gains on the sale of assets of $0.09 and $0.10, respectively. |
|
|
|
|
** |
Working Capital is defined as accounts receivable plus inventory less accounts payable. |
11
|
|
|
|
MANAGEMENT’S DISCUSSION AND ANALYSIS OF FINANCIAL CONDITION AND RESULTS OF OPERATIONS |
In response to the market conditions in fiscal year 2009 we took the following actions:
|
|
|
|
• |
Expanded our restructuring actions that started in 2008 to lower our cost structure and further increase our operational efficiency. The main focus of our actions was in our Coatings segment, which is largely comprised of product lines most directly affected by the economic slowdown. |
|
|
|
|
• |
Enhanced our liquidity by issuing $300,000,000 of unsecured, senior notes that mature on June 15, 2019 with a coupon rate of 7.25% and establishing a new $475,000,000 three-year credit facility. |
|
|
|
|
• |
Managed working capital to maximize cash flow, with a particular focus on lowering our inventory levels and minimizing accounts receivable write-offs. |
|
|
|
|
In addition, despite the difficult economic environment, we did the following: |
|
|
|
|
|
• |
Continued to invest in our brands and technologies, which enabled us to gain new business in most of our product lines. |
|
|
|
|
• |
Made aggregate pension contributions of $21,992,000 to maintain appropriate funding levels. |
|
|
|
|
• |
Increased our dividend for the 32nd consecutive year. |
Business Performance
Net sales decreased to
$2,879,042,000 from $3,482,378,000 in 2008, primarily driven by lower volume.
We were able to partially offset volume declines with new business in most of
our product lines. Despite the challenging economic climate, our earnings
increased for the year due to a combination of improved raw material cost
comparisons, previous customer price increases, improved efficiency in our
operations resulting from previously completed restructuring actions that began
in fiscal year 2008, productivity initiatives and effective control of
expenses.
Sales in our Coatings segment decreased significantly, reflecting continued weakness in industrial markets. Despite the volume declines, we reduced our cost structure, which allowed us to remain profitable in all product lines in this segment. The U.S. architectural market continued to decline in 2009, however, sales growth in our architectural product line outperformed this market. We believe this is due to increased brand awareness and a consumer shift from the professional channel to the do-it-yourself channel. Our global presence remained strong. International sales accounted for approximately 38% of consolidated net sales.
During the third quarter of 2008, we initiated a comprehensive series of actions to lower our cost structure and further increase our operational efficiency. During the first quarter of 2009, we expanded these restructuring activities. We expect the total restructuring cost to be $0.35 to $0.38 per share after tax. Restructuring activities during 2009 resulted in pre-tax charges of $28,557,000 or $0.18 per share after tax. Restructuring activities during 2008 resulted in pre-tax charges of $23,454,000 or $0.16 per share after tax. See Note 15 in Notes to Consolidated Financial Statements for more information on restructuring.
During the year, we generated $219,682,000 in free cash flow (net cash provided by operating activities less capital expenditures and dividends), an increase of $54,131,000 from 2008, and reduced our total debt, including notes payable, by $42,282,000. Our liquidity position is strong, with $187,719,000 in cash and $420,629,000 unused committed bank credit facilities providing total committed liquidity of $608,348,000 at year-end, compared to $429,932,000 at the end of 2008.
During the year, we repurchased 2,000,000 shares of our stock for $54,387,000. Our board of directors raised the dividend in fiscal year 2009 by 7.1% to $0.60 per share.
Earnings Per Share
Net income per share
available to common stockholders was $1.49 for 2009 and $1.38 for 2008. We
accrued $9,954,000 in 2009 for the Huarun Redeemable Stock (see Note 2 in Notes
to Consolidated Financial Statements for further details). This compares to an
accrual of $12,195,000 in 2008. The accrual reduced basic and diluted income
available to common stockholders by $0.10 and $0.12 per share in 2009 and 2008,
respectively. We acquired the remaining Huarun Redeemable Stock in the fourth
quarter of 2009; refer to Note 2 in Notes to Consolidated Financial Statements
for further details. The table below presents adjusted net income per common
share – diluted, which excludes a non-cash accrual relating to Huarun
Redeemable Stock. The table also presents
restructuring charges and a gain on the sale of a non-strategic specialty
product line included in net income in the respective periods.
12
|
|
|
|
|
|
|
|
|
|
|
|
|
2009 |
|
|
2008 |
|
|
Net income per common share – diluted |
|
$ |
1.49 |
|
$ |
1.38 |
|
|
Huarun redeemable stock accrual |
|
|
0.10 |
|
|
0.12 |
|
|
Adjusted net income per common share – diluted |
|
$ |
1.59 |
|
$ |
1.50 |
|
|
Restructuring charges |
|
$ |
0.18 |
|
$ |
0.16 |
|
|
Gain on sale of a non-strategic specialty product line |
|
$ |
— |
|
$ |
(0.09 |
) |
“Adjusted net income per common share – diluted” is a non-GAAP financial measure. Management discloses this measure because we believe the measure may assist investors in comparing our results of operations in the respective periods without regard to the effect on results in the 2009 and 2008 periods of the non-cash accrual related to the Huarun Redeemable Stock. As the Huarun Redeemable Stock was redeemed, acquisition accounting was applied. In addition, fiscal year 2009 and 2008 included after-tax restructuring charges of $0.18 and $0.16 per share, respectively. Fiscal year 2008 included an after-tax benefit of $0.09 per share for a gain on the sale of a non-strategic specialty product line.
OPERATIONS 2009 VS. 2008
|
|
|
|
|
|
|
|
|
|
|
|
|
Net Sales |
|
|
2009 |
|
|
2008 |
|
|
% Change |
|
|
Coatings |
|
$ |
1,582,786,000 |
|
$ |
2,053,747,000 |
|
|
-22.9 |
% |
|
Paints |
|
|
1,072,372,000 |
|
|
1,127,073,000 |
|
|
-4.9 |
% |
|
All Other |
|
|
223,884,000 |
|
|
301,558,000 |
|
|
-25.8 |
% |
|
Consolidated Net Sales |
|
$ |
2,879,042,000 |
|
$ |
3,482,378,000 |
|
|
-17.3 |
% |
|
|
|
|
• |
Consolidated Net Sales – The sales decline for 2009 was 14.3% after excluding the negative effect of foreign currency of 3.2% and the positive effect of acquisitions of 0.2%. The decrease in core sales was primarily due to lower volume, partially offset by previous customer price increases. The challenging global economic environment negatively affected demand. Fiscal year 2009 included 52 weeks compared to 53 weeks in 2008, which negatively affected sales by 1.1%. |
|
|
|
|
• |
Coatings Segment Net Sales – The sales decrease for 2009 was 18.7% after excluding the negative impact of foreign currency of 4.4% and the positive effect of acquisitions of 0.2%. All of our product lines had reduced sales reflecting weakness in global industrial markets. Our general industrial, wood and coil product lines primarily drove the core sales decline. Fiscal year 2009 included 52 weeks compared to 53 weeks in 2008, which negatively affected sales by 1.1%. |
|
|
|
|
• |
Paints Segment Net Sales – The sales decline for 2009 was 4.0% after excluding the negative effect of foreign currency of 0.9%. Sales were down primarily due to promotional spending to build our brand in the Asia architectural product line and weak market conditions in our global automotive refinish product line, partially offset by increased sales in our domestic architectural product line. Fiscal year 2009 included 52 weeks compared to 53 weeks in 2008, which negatively affected sales by 1.3%. |
|
|
|
|
• |
All Other Net Sales – The All Other category includes resins, colorants, gelcoats and our furniture protection plan business. Sales for 2009 decreased 23.1% after excluding the negative effect of foreign currency of 2.7%. The lower sales were due to weak demand. Fiscal year 2009 included 52 weeks compared to 53 weeks in 2008, which negatively affected sales by 1.3%. |
|
|
|
|
|
|
|
|
|
|
Gross Profit |
|
|
2009 |
|
|
2008 |
|
|
Consolidated Gross Profit |
|
$ |
978,928,000 |
|
$ |
977,431,000 |
|
|
As a percent of Net Sales |
|
|
34.0 |
% |
|
28.1 |
% |
|
|
|
|
• |
Consolidated Gross Profit – The increase in gross profit as a percent of net sales was primarily due to improved raw material cost comparisons, previous customer price increases, favorable product mix and productivity gains from previously completed restructuring actions, partially offset by continuing restructuring charges and higher incentive compensation accruals. Restructuring charges of $22,280,000 or 0.8% of net sales and $15,694,000 or 0.5% of net sales were included in the 2009 and 2008 periods, respectively. |
|
|
|
|
|
|
|
|
|
|
Operating Expenses* |
|
|
2009 |
|
|
2008 |
|
|
Consolidated Operating Expenses |
|
$ |
687,960,000 |
|
$ |
684,056,000 |
|
|
As a percent of Net Sales |
|
|
23.9 |
% |
|
19.6 |
% |
|
|
|
|
* |
Includes research and development, selling and administrative costs and amortization expense. For breakout see Consolidated Statements of Income. |
|
|
|
|
• |
Consolidated Operating Expenses (dollars) – Consolidated operating expenses increased 0.6% to $687,960,000 in 2009 compared to the prior year. Operating expenses for 2009 included restructuring charges of $6,277,000 or 0.2% of net sales. Operating expenses for 2008 included restructuring charges of $7,489,000 or 0.2% of net sales and a pre-tax gain on the sale of a non-strategic specialty product line of $14,167,000 or 0.4% of net sales. The operating expense dollar increase is due to the 2008 gain on the sale of the specialty product line and higher 2009 incentive-based compensation accruals, partially offset by favorable effect of foreign currency exchange, benefits from previously completed restructuring actions and effective expense controls. |
|
|
|
|
• |
Consolidated Operating Expenses (percent of net sales) – As a percent of consolidated net sales, consolidated operating expenses increased 4.3 percentage points from last year. The increase was primarily due to lower sales volume. |
13
|
|
|
|
|
|
|
|
|
|
EBIT* |
|
|
2009 |
|
|
2008 |
|
|
Coatings |
|
$ |
185,528,000 |
|
$ |
188,267,000 |
|
|
As a percent of Net Sales |
|
|
11.7 |
% |
|
9.2 |
% |
|
Paints |
|
|
135,561,000 |
|
|
94,587,000 |
|
|
As a percent of Net Sales |
|
|
12.6 |
% |
|
8.4 |
% |
|
All Other |
|
|
(32,367,000 |
) |
|
3,588,000 |
|
|
As a percent of Net Sales |
|
|
-14.5 |
% |
|
1.2 |
% |
|
Consolidated EBIT |
|
$ |
288,722,000 |
|
$ |
286,442,000 |
|
|
As a percent of Net Sales |
|
|
10.0 |
% |
|
8.2 |
% |
|
|
|
|
* |
We evaluate the performance of operating segments and allocate resources based on profit or loss from operations before interest expense and taxes (EBIT). |
|
|
|
|
|
|
|
• |
Consolidated EBIT – EBIT for 2009 increased $2,280,000 or 0.8% from the prior year. Consolidated EBIT included restructuring charges of $28,557,000 or 1.0% of net sales and $23,454,000 or 0.7% of net sales in the 2009 and 2008 periods, respectively. In addition, fiscal year 2008 included a $14,167,000 gain, or 0.4% of net sales, on the sale of a non-strategic specialty product line. For Consolidated EBIT, as well as EBIT of the segments discussed below, foreign currency fluctuation had no material effect. |
|
|
|
|
• |
Coatings Segment EBIT – EBIT included restructuring charges of $18,237,000 or 1.2% of net sales and $12,951,000 or 0.6% of net sales in the 2009 and 2008 periods, respectively. The increase in EBIT as a percent of net sales was driven primarily by improved raw material cost comparisons, previous customer price increases and productivity gains from previously completed restructuring actions, partially offset by lower sales volume and higher 2009 restructuring charges compared to 2008. |
|
|
|
|
• |
Paints Segment EBIT – EBIT included restructuring charges of $4,429,000 or 0.4% of net sales and $7,153,000 or 0.6% of net sales in the 2009 and 2008 periods, respectively. The increase in EBIT as a percent of net sales was driven primarily by improved raw material cost comparisons, previous customer price increases and productivity gains from previously completed restructuring actions. |
|
|
|
|
• |
All Other EBIT – All Other EBIT includes corporate expenses. EBIT included restructuring charges of $5,891,000 or 2.6% of net sales and $3,350,000 or 1.1% of net sales in the 2009 and 2008 periods, respectively. The 2008 period also included a pre-tax gain on the sale of a non-strategic specialty product line for $14,167,000, or 4.7% of net sales. The decrease in EBIT as a percent of net sales was driven primarily by the decline in net sales, higher incentive compensation accruals and the 2008 gain. |
|
|
|
|
|
|
|
|
|
|
Interest Expense |
|
|
2009 |
|
|
2008 |
|
|
Consolidated Interest Expense |
|
$ |
50,394,000 |
|
$ |
57,745,000 |
|
|
|
|
|
• |
Interest Expense – The 2009 decrease is primarily due to lower average debt levels and lower average interest rates. |
|
|
|
|
|
|
|
|
|
|
Effective Tax Rate |
|
|
2009 |
|
|
2008 |
|
|
Effective Tax Rate |
|
|
32.8 |
% |
|
34.1 |
% |
|
|
|
|
• |
Effective Tax Rate – The lower 2009 tax rate is due to favorable geographic mix of earnings and certain discrete items related to the accounting for uncertain tax positions. |
|
|
|
|
|
|
|
|
|
|
|
|
|
Net Income |
|
|
2009 |
|
|
2008 |
|
|
% Change |
|
|
Consolidated Net Income |
|
$ |
160,153,000 |
|
$ |
150,766,000 |
|
|
6.2 |
% |
OPERATIONS 2008 VS. 2007
|
|
|
|
|
|
|
|
|
|
|
|
|
Net Sales |
|
|
2008 |
|
|
2007 |
|
|
% Change |
|
|
Coatings |
|
$ |
2,053,747,000 |
|
$ |
1,851,687,000 |
|
|
10.9 |
% |
|
Paints |
|
|
1,127,073,000 |
|
|
1,088,819,000 |
|
|
3.5 |
% |
|
All Other |
|
|
301,558,000 |
|
|
308,781,000 |
|
|
-2.3 |
% |
|
Consolidated Net Sales |
|
$ |
3,482,378,000 |
|
$ |
3,249,287,000 |
|
|
7.2 |
% |
|
|
|
|
• |
Consolidated Net Sales – Sales growth for 2008 was 1.3%, excluding the favorable impact of foreign currency of 3.5% and acquisitions of 2.4%. Core growth was primarily due to increased selling prices partially offset by lower demand resulting from the decline in the U.S. housing and construction markets. Fiscal year 2008 included 53 weeks compared to 52 weeks in 2007. |
|
|
|
|
• |
Coatings Segment Net Sales – Sales growth for 2008 was 2.3%, excluding the favorable impact of foreign currency of 4.5% and acquisitions of 4.1%. Coatings core sales growth was driven by our packaging, general industrial and coil product lines partially offset by weak sales in the wood coatings product line related to weakness in the furniture and new construction markets. |
|
|
|
|
• |
Paints Segment Net Sales – Sales growth for 2008 was 1.0%, excluding the favorable impact of foreign currency of 2.3% and acquisitions of 0.2%. Sales in our architectural product line have been adversely affected by continued weakness in the U.S. housing market. Our architectural product line, however, performed well in comparison to our competitors. We believe this was due to increased brand awareness resulting from our continuing investment in the Valspar and Cabot brands. We continue to experience growth in the Huarun Paints architectural product line in the Chinese domestic market. |
|
|
|
|
• |
All Other Net Sales – Sales for 2008 decreased 3.8%, excluding the positive effect of foreign currency of 1.5%. The sales decline reflects weak market conditions for these products. |
|
|
|
|
|
|
|
|
|
|
Gross Profit |
|
|
2008 |
|
|
2007 |
|
|
Consolidated Gross Profit |
|
$ |
977,431,000 |
|
$ |
971,797,000 |
|
|
As a percent of Net Sales |
|
|
28.1 |
% |
|
29.9 |
% |
14
|
|
|
|
• |
Consolidated Gross Profit – The decrease in gross profit as a percent of net sales was primarily due to the lag between higher raw material costs and the impact of selling price increases. The decrease is also due to 2008 restructuring charges, which were $15,694,000 or 0.5% of net sales. |
|
|
|
|
|
|
|
|
|
|
Operating Expenses* |
|
|
2008 |
|
|
2007 |
|
|
Consolidated Operating Expenses |
|
$ |
684,056,000 |
|
$ |
662,224,000 |
|
|
As a percent of Net Sales |
|
|
19.6 |
% |
|
20.4 |
% |
|
|
|
|
* |
Includes research and development, selling and administrative costs and amortization expense. For breakout see Consolidated Statement of Income. |
|
|
|
|
|
|
|
• |
Consolidated Operating Expenses (dollars) – Operating expenses increased 3.3% to $684,056,000 in 2008 compared to the prior year. Operating expenses for 2008 included restructuring charges of $7,489,000 and a pre-tax gain on the sale of a non-strategic specialty product line of $14,167,000. The increase in operating expense in dollars is due to acquisitions, restructuring costs and increased incentive compensation, partially offset by a gain on the sale of a non-strategic specialty product line and expense controls. |
|
|
|
|
• |
Consolidated Operating Expenses (percent of net sales) – As a percent of consolidated net sales, consolidated operating expenses decreased 0.8% compared to last year. The decrease was driven primarily by a gain on the sale of a specialty product line and expense controls, partially offset by restructuring charges and higher incentive compensation. |
|
|
|
|
|
|
|
|
|
|
EBIT* |
|
|
2008 |
|
|
2007 |
|
|
Coatings |
|
$ |
188,267,000 |
|
$ |
198,073,000 |
|
|
As a percent of Net Sales |
|
|
9.2 |
% |
|
10.7 |
% |
|
Paints |
|
|
94,587,000 |
|
|
105,947,000 |
|
|
As a percent of Net Sales |
|
|
8.4 |
% |
|
9.7 |
% |
|
All Other |
|
|
3,588,000 |
|
|
17,413,000 |
|
|
As a percent of Net Sales |
|
|
1.2 |
% |
|
5.6 |
% |
|
Consolidated EBIT |
|
$ |
286,442,000 |
|
$ |
321,433,000 |
|
|
As a percent of Net Sales |
|
|
8.2 |
% |
|
9.9 |
% |
|
|
|
|
* |
We evaluate the performance of operating segments and allocate resources based on profit or loss from operations before interest expense and taxes (EBIT). |
|
|
|
|
|
|
|
• |
Consolidated EBIT – EBIT for 2008 decreased $34,991,000 or 10.9% compared to the prior year. The decrease in EBIT as a percent of net sales was primarily driven by the lag between raw material cost increases and the impact of pricing actions and restructuring charges. Consolidated EBIT for 2008 included pre-tax restructuring charges of $23,454,000 or 0.7% of net sales. For Consolidated EBIT, as well as EBIT of the segments discussed below, foreign currency fluctuation had no material effect. |
|
|
|
|
• |
Coatings Segment EBIT – The decrease in EBIT as a percent of net sales was primarily driven by the lag between raw material cost increases and the impact of pricing actions and restructuring charges. EBIT for 2008 included restructuring charges of $12,951,000 or 0.6% of net sales. |
|
|
|
|
• |
Paints Segment EBIT – The decrease in EBIT as a percent of net sales was primarily driven by the lag between raw material cost increases and the impact of pricing actions and restructuring charges. EBIT for 2008 included restructuring charges of $7,153,000 or 0.6% of net sales. |
|
|
|
|
• |
All Other EBIT – All Other EBIT includes corporate expenses. The decrease in EBIT as a percent of net sales was primarily driven by the decrease in net sales and the lag between raw material cost increases and the impact of pricing actions and restructuring charges. EBIT for 2008 included restructuring charges of $3,350,000 or 1.1% of net sales. Both 2008 and 2007 include pre-tax gains on the sale of assets of $14,167,000 and $16,500,000, respectively. |
|
|
|
|
|
|
|
|
|
|
Interest Expense |
|
|
2008 |
|
|
2007 |
|
|
Consolidated Interest Expense |
|
$ |
57,745,000 |
|
$ |
61,662,000 |
|
|
|
|
|
• |
Interest Expense – The 2008 decrease is due primarily to lower average interest rates, partially offset by higher average debt levels. |
|
|
|
|
|
|
|
|
|
|
Effective Tax Rate |
|
|
2008 |
|
|
2007 |
|
|
Effective Tax Rate |
|
|
34.1 |
% |
|
33.7 |
% |
|
|
|
|
• |
Effective Tax Rate – The 2008 effective income tax rate reflects certain discrete items due to the accounting for uncertain tax positions. |
|
|
|
|
|
|
|
|
|
|
|
|
|
Net Income |
|
|
2008 |
|
|
2007 |
|
|
% Change |
|
|
Consolidated Net Income |
|
$ |
150,766,000 |
|
$ |
172,115,000 |
|
|
-12.4 |
% |
FINANCIAL CONDITION
Net cash provided by operations was $337,695,000 in 2009,
compared to $264,450,000 in 2008 and $190,682,000 in 2007. The cash provided by
operations in 2009 was primarily generated by net income, a decrease in
accounts receivable, a decline in inventory and other current assets and the
2009 settlement of treasury lock contracts (see Note 6 in Notes to Consolidated
Financial Statements for further details), partially offset by a decrease in
other deferred liabilities and a reduction in income taxes payable. The decline
of $40,530,000 in accounts receivable was primarily due to lower sales levels.
The inventory and other current assets decrease of $38,076,000 was primarily
due to proactive inventory management in response to lower sales levels. The
$24,236,000 decrease in other deferred liabilities was primarily driven by the
2009 pension contributions (see Note 13 in Notes to Consolidated Financial
Statements for further details). The $17,554,000 decrease in income taxes
payable was due to timing of payments.
15
During 2009, cash provided by operations and $23,956,000 in proceeds from the sale of treasury stock were used to fund $60,116,000 in dividend payments, $57,897,000 in capital expenditures, $54,387,000 in share repurchases, $49,851,000 to reduce our bank borrowings, $45,047,000 to purchase the remaining Huarun Redeemable Stock and $4,818,000 to settle the remaining deferred liability for excess cash related to the Huarun Paints acquisition (for both Huarun related transactions, see Note 2 in Notes to Consolidated Financial Statements for further discussion). In 2009, our cash balance increased by $97,646,000.
Capital expenditures for property, plant and equipment were $57,897,000 in 2009, compared with $43,045,000 in 2008. We anticipate capital spending in fiscal 2010 to be approximately $80,000,000.
The ratio of total debt to capital decreased to 36.9% at the end of 2009 compared to 38.8% for 2008. Average debt outstanding during 2009 was $972,657,000 at a weighted average interest rate of 5.18% versus $1,087,279,000 at 5.31% last year. Interest expense for 2009 was $50,394,000 compared to $57,745,000 in 2008.
Under various agreements, we are obligated to make future cash payments in fixed amounts. These include payments under our multi-currency credit facilities, senior notes, industrial development bonds, employee benefit plans, non-cancelable operating leases with initial or remaining terms in excess of one year, commodity purchase commitments and telecommunication commitments. Interest charges are variable and assumed at current rates.
The following table summarizes our fixed cash obligations as of October 30, 2009 for the fiscal years ending in October:
CONTRACTUAL CASH OBLIGATIONS
|
|
|
|
|
|
|
|
|
|
|
|
|
|
|
|
|
|
|
|
|
|
|
|
|
(Dollars in thousands) |
|
|
2010 |
|
|
2011 |
|
|
2012 |
|
|
2013 |
|
|
2014 |
|
|
2015
and |
|
|
Total |
|
|
Notes & Interest to Banks |
|
$ |
9,414 |
|
$ |
2,031 |
|
$ |
61,946 |
|
$ |
— |
|
$ |
— |
|
$ |
— |
|
$ |
73,391 |
|
|
Senior Notes & Interest |
|
|
49,725 |
|
|
49,725 |
|
|
244,100 |
|
|
38,475 |
|
|
38,475 |
|
|
729,019 |
|
|
1,149,519 |
|
|
Industrial Development Bonds & Interest |
|
|
65 |
|
|
65 |
|
|
65 |
|
|
65 |
|
|
65 |
|
|
12,542 |
|
|
12,867 |
|
|
Medical Retiree/SERP/Pension |
|
|
1,781 |
|
|
1,944 |
|
|
2,044 |
|
|
2,040 |
|
|
2,038 |
|
|
16,410 |
|
|
26,257 |
|
|
Operating Leases |
|
|
16,523 |
|
|
13,273 |
|
|
10,989 |
|
|
7,974 |
|
|
7,142 |
|
|
12,699 |
|
|
68,600 |
|
|
Commodity Purchase Commitments |
|
|
4,149 |
|
|
— |
|
|
— |
|
|
— |
|
|
— |
|
|
— |
|
|
4,149 |
|
|
Telecommunication Commitments |
|
|
1,705 |
|
|
1,705 |
|
|
45 |
|
|
— |
|
|
— |
|
|
— |
|
|
3,455 |
|
|
Total Contractual Cash Obligations |
|
$ |
83,362 |
|
$ |
68,743 |
|
$ |
319,189 |
|
$ |
48,554 |
|
$ |
47,720 |
|
$ |
770,670 |
|
$ |
1,338,238 |
|
We expect to make cash outlays in the future related to uncertain tax positions. However, due to the uncertainty of the timing of future cash flows, we are unable to make reasonably reliable estimates of the period of cash settlement, if any, with the respective taxing authorities. Accordingly, gross unrecognized tax benefits of $33,397,000 as of October 30, 2009, have been excluded from the contractual obligations table above. For further information related to unrecognized tax benefits see Note 10 in Notes to Consolidated Financial Statements.
During the third quarter of 2009, we issued $300,000,000 of unsecured, senior notes that mature on June 15, 2019 with a coupon rate of 7.25%. The public offering was made pursuant to a registration statement filed with the U.S. Securities and Exchange Commission. We used the net proceeds of $296,772,000 to repay our commercial paper borrowings and a portion of our borrowings under our existing bank credit facilities.
During the third quarter of 2009, we entered into a $465,000,000 unsecured committed revolving credit facility with a syndicate of banks expiring on June 30, 2012. The new credit facility replaced our $150,000,000 364-Day Credit Agreement that was due to mature in November 2009 and our $600,000,000 Five-Year Credit Agreement that was due to mature in October 2010, which were both terminated on June 26, 2009. During the fourth quarter of 2009, the new credit facility was expanded by $10,000,000 to a total facility size of $475,000,000. The credit facility is a backstop to our $350,000,000 U.S. Commercial Paper program established in 2006. We had notes to banks under this new facility totaling $50,000,000 at October 30, 2009. In connection with the new credit facility, we entered into a bi-lateral U.S. dollar equivalent $13,500,000 unsecured committed revolving credit facility, under which we had notes to banks totaling $10,593,000 at October, 30, 2009. The new credit facilities contain covenants that require us to maintain certain financial ratios. We were in compliance with these covenants as of October 30, 2009.
At October 30, 2009, we had unused lines of committed and uncommitted credit available from banks of $538,164,000.
16
We believe cash flow from operations, existing lines of credit, access to credit facilities and access to debt and capital markets will be sufficient to meet our current and projected needs for financing. In the current market conditions, despite the prevailing credit crisis, we have demonstrated continued access to these markets. We have committed liquidity and cash reserves in excess of our anticipated funding requirements.
Our cash and cash equivalent balances consist of high quality short-term money market instruments and cash held by our international subsidiaries that are used to fund day-to-day operating needs. Those balances have also been used to finance acquisitions. Our investment policy on excess cash is to preserve principal.
We use derivative instruments with a number of counterparties principally to manage well-defined interest rate and foreign currency exchange risks. We evaluate the financial stability of each counterparty and spread the risk among many financial institutions to limit our exposure. We will continue to monitor counterparty risk on an ongoing basis.
Common stock dividends of $60,116,000 in 2009 represented a 7.6% increase over 2008. The dividend in 2009 was increased to $0.60 per share from $0.56 per share in 2008.
We have continuing authorization to purchase shares of our common stock at management’s discretion for general corporate purposes. Shares repurchased in 2009 were 2,000,000 shares totaling $54,387,000. Shares repurchased in 2008 were 1,850,000 shares totaling $39,675,000. We repurchased 2,596,300 shares totaling $71,840,000 in 2007. We retired 2,000,000 of those shares in 2007.
We are involved in various claims relating to environmental and waste disposal matters at a number of current and former plant sites. We engage or participate in remedial and other environmental compliance activities at certain of these sites. At other sites, we have been named as a potentially responsible party (PRP) under federal and state environmental laws for the remediation of hazardous waste. Management analyzes each individual site, considering the number of parties involved, the level of potential liability or contribution by us relative to the other parties, the nature and magnitude of the wastes involved, the method and extent of remediation, the potential insurance coverage, the estimated legal and consulting expense with respect to each site, and the time period over which any costs would likely be incurred. Based on the above analysis, management estimates the remediation or other clean-up costs and related claims for each site. The estimates are based in part on discussions with other PRPs, governmental agencies and engineering firms.
We accrue appropriate reserves for potential environmental liabilities, which are continually reviewed and adjusted as additional information becomes available. While uncertainties exist with respect to the amounts and timing of our ultimate environmental liabilities, management believes there is not a reasonable possibility that such liabilities, individually or in the aggregate, will have a material adverse effect on our financial condition or results of operations.
We are involved in a variety of legal claims and proceedings relating to personal injury, product liability, warranties, customer contracts, employment, trade practices, environmental and other legal matters that arise in the normal course of business. These claims and proceedings include cases where we are one of a number of defendants in proceedings alleging that the plaintiffs suffered injuries or contracted diseases from exposure to chemicals or other ingredients used in the production of some of our products or waste disposal. We believe these claims and proceedings are not out of the ordinary course for a business of the type and size in which we are engaged. While we are unable to predict the ultimate outcome of these claims and proceedings, management believes there is not a reasonable possibility that the costs and liabilities of such matters, individually or in the aggregate, will have a material adverse effect on our financial condition or results of operations.
CRITICAL ACCOUNTING POLICIES AND ESTIMATES
The discussion and analysis of our financial condition and
results of operations are based upon our consolidated financial statements,
which have been prepared in accordance with generally accepted accounting
principles in the United States (GAAP). The preparation of these financial statements
requires us to make estimates and assumptions that affect the reported amounts
of assets and liabilities, revenues and expenses, and related disclosure of any
contingent assets and liabilities at the date of the financial statements. We
regularly review our estimates and assumptions, which are based on historical
experience and on various other factors that are believed to be reasonable
under the circumstances, the results of which form the basis for making
judgments about the carrying values of assets and liabilities that are not
readily apparent from other sources. Actual results may differ from these
estimates under different assumptions or conditions.
We believe the following critical accounting policies are affected by significant judgments and estimates used in the preparation of our consolidated financial statements and that the judgments and estimates are reasonable:
17
Revenue Recognition
Other than extended furniture protection plans,
revenue from sales is recognized at the time of product delivery, passage of
title, a sales agreement is in place, pricing is fixed or determinable and
collection is reasonably assured. Discounts provided to customers at the point
of sale are recognized as a reduction in revenue as the products are sold. We
sell extended furniture protection plans for which revenue is deferred and
recognized over the life of the contract. An actuarial study utilizing
historical claims data is used to forecast claim payments over the contract
period, and revenue is recognized based on the forecasted claims payments.
Actual claims costs are reflected in earnings in the period incurred.
Anticipated losses on programs in progress are charged to earnings when
identified.
Supplier and Customer Rebates
We record supplier and customer rebates as a reduction
of cost of goods sold or a reduction to revenue, respectively, as they are
earned, in accordance with the underlying agreement. The customer rebate
estimate is developed based on historical experience plus current activity for the
customer’s purchases. Customer rebates that increase based on different levels
of sales volume are recognized immediately when the current activity plus
expected volume triggers a higher earned rebate. The supplier rebate estimate
is developed based on contractual terms of our current purchasing activity.
Supplier rebates that increase based on different levels of purchases are
recognized when there is certainty that the current level of purchases will
trigger a higher rebate earned.
Valuation of Goodwill and Indefinite-Lived
Intangible Assets
Goodwill represents the excess of cost over the fair
value of identifiable net assets of businesses acquired. Other intangible
assets consist of customer lists and relationships, purchased technology and
patents and trademarks.
Goodwill for our five reporting units is reviewed for impairment at least annually using a two-step process (see Note 14 in Notes to Consolidated Financial Statements). In the first step, we compare the fair value of each reporting unit, as computed primarily by present value cash flow calculations, to its book carrying value, including goodwill. If the fair value exceeds the carrying value, no further work is required and no impairment loss is recognized. If the carrying value exceeds the fair value, the goodwill of the reporting unit is potentially impaired and we would then complete step 2 in order to measure the impairment loss. In step 2, the implied fair value is compared to the carrying amount of the goodwill. If the implied fair value of goodwill is less than the carrying value of goodwill, we would recognize an impairment loss equal to the difference. The implied fair value is calculated by allocating the fair value of the reporting unit (as determined in step 1) to all of its assets and liabilities (including unrecognized intangible assets) and any excess in fair value that is not assigned to the assets and liabilities is the implied fair value of goodwill.
Management also reviews other intangible assets with finite lives for impairment at least annually to determine if any adverse conditions exist that would indicate impairment. If the carrying value of the finite-lived intangible assets exceeds the discounted cash flows resulting from the use and disposition of the asset, the carrying value is written down to fair value in the period identified. Indefinite-lived intangible assets are reviewed at least annually for impairment by calculating the fair value of the assets and comparing with their carrying value. In assessing fair value, management generally utilizes a relief from royalty method.
During the fourth quarters of 2009 and 2008, management completed the annual goodwill and intangible asset impairment reviews with no impairments to the carrying values identified.
Considerable management judgment is necessary to evaluate the impact of operating and macroeconomic changes and to estimate future cash flows. Assumptions used in our impairment evaluations, such as forecasted sales growth rates and our cost of capital or discount rate, are based on the best available market information and are consistent with our internal forecasts and operating plans. Additionally, in assessing goodwill impairment we considered the implied control premium and concluded it was reasonable based on other recent market transactions. Changes in these estimates or a continued decline in general economic conditions could change our conclusion regarding an impairment of goodwill and potentially result in a non-cash impairment loss in a future period.
The discount rate and sales growth assumptions are the two material assumptions utilized in our calculations of the present value cash flows used to estimate the fair value of the reporting units when performing the annual goodwill impairment test and in testing indefinite-lived intangible assets for impairment. We utilize a cash flow approach in estimating the fair value of the reporting units, where the discount rate reflects a weighted average cost of capital rate. The cash flow model used to derive fair value is most sensitive to the discount rate and sales growth assumptions used. The estimated fair value of the reporting units and indefinite-lived intangible assets have historically exceeded the carrying value of such reporting units or indefinite-lived intangible assets by a substantial amount. We perform a sensitivity analysis on the discount rate and revenue growth assumptions. Either the discount rate could increase by 10% of the discount rate utilized or the sales growth assumption could decline to a zero growth environment and our reporting units and indefinite-lived intangible assets would continue to have fair value in excess of carrying value. We do not have any reporting units that are at risk of failing step 1 of our goodwill impairment test. Also, we do not have any indefinite-lived intangible assets at risk of failing our impairment test. There have been no significant events since the timing of our impairment tests that would have triggered additional impairment testing.
18
The assumptions used in our impairment testing could be adversely affected by certain of the risks discussed in “Risk Factors” in Item 1A of this report. For additional information about goodwill, see Note 8 in Notes to Consolidated Financial Statements.
Pension and Post-Retirement Medical
Obligations
We sponsor
several defined benefit plans for certain hourly and salaried employees. We
sponsor post-retirement medical benefits for certain U.S. employees. We account
for our defined benefit pension plans and post-retirement medical plans in
accordance with GAAP, which requires the amount recognized in financial
statements to be determined on an actuarial basis. To accomplish this,
extensive use is made of assumptions about inflation, investment returns,
mortality, turnover, medical trend rates and discount rates. A change in these
assumptions could cause actual results to differ from those reported. A
reduction of 50 basis points in the long-term rate of return and a reduction of
50 basis points in the discount rate would have increased our pension expense
$2,048,000 in 2009. A 1% increase in the medical trend rates would not have a
material effect on post-retirement medical expense or the post-retirement
benefit obligation. See Note 13 in Notes to Consolidated Financial Statements,
for further details regarding accounting for pensions and post-retirement
medical benefits.
Income Taxes
At each period
end, it is necessary for us to make certain estimates and assumptions to
compute the provision for income taxes including, but not limited to the
expected operating income (or loss) for the year, projections of the proportion
of income (or loss) earned and taxed in the foreign jurisdictions and the
extent to which this income (or loss) may also be taxed in the United States,
permanent and temporary differences, the likelihood of deferred tax assets
being recovered and the outcome of uncertain tax positions. Our income tax
returns, like those of most companies, are periodically audited by domestic and
foreign tax authorities. These audits include questions regarding our tax
filing positions, including the timing and amount of deductions and the
allocation of income among various tax jurisdictions. At any one time, multiple
tax years are subject to audit by the various tax authorities. We record an
accrual for more likely than not exposures after evaluating the positions
associated with our various income tax filings. A number of years may elapse
before a particular matter for which we have established an accrual is audited
and fully resolved or clarified. We adjust our tax contingencies accrual and
income tax provision in the period in which matters are effectively settled
with tax authorities at amounts different from our established accrual, the
statute of limitations expires for the relevant taxing authority to examine the
tax position or when more information becomes available.
FORWARD-LOOKING STATEMENTS
Certain
statements contained in “Management’s Discussion and Analysis of Financial
Condition and Results of Operations” and elsewhere in this report constitute
“forward-looking statements” within the meaning of Section 27A of the
Securities Act of 1933 and Section 21E of the Securities Exchange Act of 1934.
The Private Securities Litigation Reform Act of 1995 provides a safe harbor for
forward-looking statements made by or on behalf of the Company. These forward-looking
statements are based on management’s current expectations, estimates,
assumptions and beliefs concerning future events, conditions and financial
performance. Forward-looking statements are necessarily subject to risks,
uncertainties and other factors, many of which are outside our control and
could cause actual results to differ materially from such statements. Any
statement that is not historical in nature is a forward-looking statement and
may be identified by the use of words and phrases such as “expects,”
“anticipates,” “believes,” “will,” “will likely result,” “will continue,”
“plans to” and similar expressions. These uncertainties and other factors
include, but are not limited to, changes in general economic conditions both
domestic and international, including recessions and other external economic
and political factors, which may adversely affect our business, the value of
our investments, the financial stability of our customers and suppliers and our
ability to obtain financing; dependence of internal earnings growth on economic
conditions and growth in the domestic and international coatings industry;
competitive factors including pricing pressure and product competition; risks
related to any future acquisitions, including risks of adverse changes in the
results of acquired businesses and the assumption of unforeseen liabilities;
risks of disruptions in business resulting from the integration process and
higher interest costs resulting from further borrowing for any such
acquisitions; our reliance on the efforts of vendors, government agencies,
utilities and other third parties to achieve adequate compliance and avoid
disruption of our business; risks of disruptions in business resulting from our
relationships with customers and suppliers; risks and uncertainties associated
with operations and achievement of growth in developing markets, including
China and Central and South America; unusual weather conditions adversely
affecting sales; changes in raw materials pricing and availability; delays in
passing along cost increases to customers; changes in governmental regulation,
including more stringent environmental, health and
safety regulations; changes in accounting policies and standards and taxation
requirements such as new tax laws or revised tax law interpretations; the
nature, cost and outcome of pending and future litigation and other legal
proceedings; civil unrest and the outbreak of war and other significant
national and international events; and other risks and uncertainties. The
foregoing list is not exhaustive, and we disclaim any obligation to
subsequently revise any forward-looking statements to reflect events or
circumstances after the date of such statements.
19
OFF-BALANCE SHEET ARRANGEMENTS
We do not have
off-balance sheet arrangements that have, or are reasonably likely to have, a
current or future material effect on our financial condition, changes in
financial condition, revenues or expenses, results of operations, liquidity,
capital expenditures or capital resources.
|
|
|
|
QUANTITATIVE AND QUALITATIVE DISCLOSURES ABOUT MARKET RISK |
Portions of our sales and results of operations are subject to the impact of foreign currency fluctuations. We have not hedged our exposure to translation gains and losses; however, we have reduced our exposure by borrowing funds in local currencies. A 10% adverse change in foreign currency rates would not have a material effect on our results of operations or financial position.
We are also subject to interest rate risk. At October 30, 2009, approximately 3% of our total debt consisted of floating rate debt. Assuming the current level of borrowings, a 10% increase in interest rates from those in effect on October 30, 2009 would not have a material effect on our results of operations or financial position.
20
|
|
|
|
FINANCIAL STATEMENTS AND SUPPLEMENTARY DATA |
REPORT OF MANAGEMENT ON INTERNAL CONTROL OVER FINANCIAL REPORTING
Board of
Directors and Stockholders
The Valspar Corporation
The Valspar Corporation’s (the “Company”) management is responsible for establishing and maintaining adequate internal control over financial reporting, as such term is defined in Exchange Act Rules 13a-15(f). The Company’s internal control system is designed to provide reasonable assurance regarding the reliability of financial reporting and the preparation of financial statements in accordance with U.S. generally accepted accounting principles. Because of its inherent limitations, internal control over financial reporting may not prevent or detect misstatements.
Under the supervision and with the participation of management, including its principal executive officer and principal financial officer, the Company’s management assessed the design and operating effectiveness of internal control over financial reporting as of October 30, 2009 based on the framework set forth in Internal Control – Integrated Framework issued by the Committee of Sponsoring Organizations of the Treadway Commission.
Based on this assessment, management concluded that the Company’s internal control over financial reporting was effective as of October 30, 2009. Ernst & Young LLP, an independent registered public accounting firm, has issued an attestation report on the Company’s internal control over financial reporting as of October 30, 2009. That report is included herein.

William L.
Mansfield
Chairman and Chief Executive Officer

Lori A. Walker
Senior Vice President and Chief Financial Officer
21
REPORT OF INDEPENDENT REGISTERED PUBLIC ACCOUNTING FIRM ON CONSOLIDATED FINANCIAL STATEMENTS
The Board of
Directors and Shareholders
The Valspar Corporation
We have audited the accompanying consolidated balance sheets of The Valspar Corporation and subsidiaries (the Corporation) as of October 30, 2009, and October 31, 2008, and the related consolidated statements of income, changes in equity, and cash flows for each of the three years in the period ended October 30, 2009. Our audits also included the financial statement schedule listed in Item 15(a). These financial statements are the responsibility of the Corporation’s management. Our responsibility is to express an opinion on these financial statements based on our audits.
We conducted our audits in accordance with the standards of the Public Company Accounting Oversight Board (United States). Those standards require that we plan and perform the audit to obtain reasonable assurance about whether the financial statements are free of material misstatement. An audit includes examining, on a test basis, evidence supporting the amounts and disclosures in the financial statements. An audit also includes assessing the accounting principles used and significant estimates made by management, as well as evaluating the overall financial statement presentation. We believe that our audits provide a reasonable basis for our opinion.
In our opinion, the financial statements referred to above present fairly, in all material respects, the consolidated financial position of The Valspar Corporation and subsidiaries at October 30, 2009, and October 31, 2008, and the consolidated results of their operations and their cash flows for each of the three years in the period ended October 30, 2009, in conformity with U.S. generally accepted accounting principles. Also, in our opinion, the related financial statement schedule, when considered in relation to the basic financial statements taken as a whole, presents fairly, in all material respects, the information set forth therein.
As discussed in Note 13, Pension and Other Postretirement Benefits, to the consolidated financial statements, effective October 26, 2007, the Corporation adopted the recognition and disclosure provisions originally issued in Statement of Financial Accounting Standards (SFAS) No. 158, “Employers’ Accounting for Defined Benefit Pension and Other Postretirement Plans — an amendment of FASB Statements No. 87, 88, 106, and 132(R)”(codified primarily in FASB ASC 715). Also, effective October 30, 2009, the Corporation adopted the measurement provision originally issued in SFAS No. 158. In addition, as discussed in Note 10, Income Taxes, effective October 27, 2007, the Corporation adopted the provisions originally issued in FASB Interpretation No. 48, “Accounting for Uncertainty in Income Taxes — an interpretation of FASB Statement No. 109”(codified primarily in FASB ASC 740).
We also have audited, in accordance with the standards of the Public Company Accounting Oversight Board (United States), The Valspar Corporation’s internal control over financial reporting as of October 30, 2009, based on criteria established in Internal Control — Integrated Framework issued by the Committee of Sponsoring Organizations of the Treadway Commission, and our report dated December 18, 2009, expressed an unqualified opinion thereon.

Minneapolis,
Minnesota
December 18, 2009
22
REPORT OF INDEPENDENT REGISTERED PUBLIC ACCOUNTING FIRM ON INTERNAL CONTROL OVER FINANCIAL REPORTING
The Board of
Directors and Shareholders
The Valspar Corporation
We have audited The Valspar Corporation and subsidiaries’ (the Corporation) internal control over financial reporting as of October 30, 2009, based on criteria established in Internal Control — Integrated Framework issued by the Committee of Sponsoring Organizations of the Treadway Commission (the COSO criteria). The Valspar Corporation’s management is responsible for maintaining effective internal control over financial reporting, and for its assessment of the effectiveness of internal control over financial reporting included in the accompanying Report of Management on Internal Control over Financial Reporting. Our responsibility is to express an opinion on the Corporation’s internal control over financial reporting based on our audit.
We conducted our audit in accordance with the standards of the Public Company Accounting Oversight Board (United States). Those standards require that we plan and perform the audit to obtain reasonable assurance about whether effective internal control over financial reporting was maintained in all material respects. Our audit included obtaining an understanding of internal control over financial reporting, assessing the risk that a material weakness exists, testing and evaluating the design and operating effectiveness of internal control based on the assessed risk, and performing such other procedures as we considered necessary in the circumstances. We believe that our audit provides a reasonable basis for our opinion.
A corporation’s internal control over financial reporting is a process designed to provide reasonable assurance regarding the reliability of financial reporting and the preparation of financial statements for external purposes in accordance with generally accepted accounting principles. A corporation’s internal control over financial reporting includes those policies and procedures that (1) pertain to the maintenance of records that, in reasonable detail, accurately and fairly reflect the transactions and dispositions of the assets of the corporation; (2) provide reasonable assurance that transactions are recorded as necessary to permit preparation of financial statements in accordance with generally accepted accounting principles, and that receipts and expenditures of the corporation are being made only in accordance with authorizations of management and directors of the corporation; and (3) provide reasonable assurance regarding prevention or timely detection of unauthorized acquisition, use, or disposition of the corporation’s assets that could have a material effect on the financial statements.
Because of its inherent limitations, internal control over financial reporting may not prevent or detect misstatements. Also, projections of any evaluation of effectiveness to future periods are subject to the risk that controls may become inadequate because of changes in conditions, or that the degree of compliance with the policies or procedures may deteriorate.
In our opinion, The Valspar Corporation maintained, in all material respects, effective internal control over financial reporting as of October 30, 2009, based on the COSO criteria.
We also have audited, in accordance with the standards of the Public Company Accounting Oversight Board (United States), the consolidated balances sheets as of October 30, 2009, and October 31, 2008, and the related consolidated statements of income, changes in equity, and cash flows for each of the three years in the period ended October 31, 2009, and our report dated December 18, 2009, expressed an unqualified opinion thereon.
Ernst & Young LLP
Minneapolis,
Minnesota
December 18, 2009
23
Consolidated Balance Sheets
(Dollars in
thousands, except per share amounts)
|
|
|
|
|
|
|
|
|
|
|
|
|
|
|
|
October 30, 2009 |
|
October 31, 2008 |
|
||
|
Assets |
|
|
|
|
|
|
|
|
|
|
Current Assets |
|
Cash and cash equivalents |
|
$ |
187,719 |
|
$ |
90,073 |
|
|
|
|
Accounts and notes receivable, less allowances for doubtful accounts (2009 – $21,768; 2008 – $16,389) |
|
|
518,188 |
|
|
565,237 |
|
|
|
|
Inventories |
|
|
238,449 |
|
|
271,423 |
|
|
|
|
Deferred income taxes |
|
|
34,479 |
|
|
31,989 |
|
|
|
|
Prepaid expenses and other current assets |
|
|
83,631 |
|
|
88,298 |
|
|
|
|
Total Current Assets |
|
|
1,062,466 |
|
|
1,047,020 |
|
|
Goodwill |
|
|
|
|
1,337,997 |
|
|
1,352,813 |
|
|
Intangibles, net |
|
|
|
|
629,923 |
|
|
619,468 |
|
|
Other Assets |
|
|
|
|
4,192 |
|
|
7,123 |
|
|
Long Term Deferred Income Taxes |
|
|
|
|
5,358 |
|
|
3,902 |
|
|
Property, Plant and Equipment |
|
Land |
|
|
35,815 |
|
|
34,978 |
|
|
|
|
Buildings |
|
|
339,219 |
|
|
328,552 |
|
|
|
|
Machinery and equipment |
|
|
710,113 |
|
|
672,930 |
|
|
|
|
Gross Property, Plant and Equipment |
|
|
1,085,147 |
|
|
1,036,460 |
|
|
|
|
Less accumulated depreciation |
|
|
(614,059 |
) |
|
(546,744 |
) |
|
|
|
Net Property, Plant and Equipment |
|
|
471,088 |
|
|
489,716 |
|
|
|
|
Total Assets |
|
$ |
3,511,024 |
|
$ |
3,520,042 |
|
|
Liabilities and Stockholders’ Equity |
|
|
|
|
|
|
|
||
|
Current Liabilities |
|
Notes payable and commercial paper |
|
$ |
7,278 |
|
$ |
159,514 |
|
|
|
|
Current portion of long-term debt |
|
|
— |
|
|
12 |
|
|
|
|
Trade accounts payable |
|
|
349,999 |
|
|
400,763 |
|
|
|
|
Income taxes |
|
|
4,762 |
|
|
29,156 |
|
|
|
|
Accrued liabilities |
|
|
349,440 |
|
|
290,898 |
|
|
|
|
Total Current Liabilities |
|
|
711,479 |
|
|
880,343 |
|
|
Long-Term Debt, net of current portion |
|
|
|
|
873,095 |
|
|
763,129 |
|
|
Deferred Income Taxes |
|
|
|
|
235,975 |
|
|
224,764 |
|
|
Deferred Liabilities |
|
|
|
|
185,968 |
|
|
165,361 |
|
|
|
|
Total Liabilities |
|
|
2,006,517 |
|
|
2,033,597 |
|
|
Huarun Redeemable Stock |
|
|
|
|
— |
|
|
33,577 |
|
|
Stockholders’ Equity |
|
Common stock (par value $0.50 per share); shares authorized 250,000,000; shares issued, including shares in treasury: (2009 – 118,442,624; 2008 – 118,442,624) |
|
|
59,220 |
|
|
59,220 |
|
|
|
|
Additional paid-in capital |
|
|
353,086 |
|
|
331,083 |
|
|
|
|
Retained earnings |
|
|
1,269,738 |
|
|
1,180,011 |
|
|
|
|
Accumulated other comprehensive income (loss) |
|
|
67,997 |
|
|
90,036 |
|
|
|
|
Less cost of common stock in treasury |
|
|
(245,534 |
) |
|
(207,482 |
) |
|
|
|
Total Stockholders’ Equity |
|
|
1,504,507 |
|
|
1,452,868 |
|
|
|
|
Total Liabilities and Stockholders’ Equity |
|
$ |
3,511,024 |
|
$ |
3,520,042 |
|
See Notes to Consolidated Financial Statements
24
Consolidated Statements of Income
(Dollars in
thousands, except per share amounts)
|
|
|
|
|
|
|
|
|
|
|
|
|
For the Year Ended |
|
October
30, 2009 |
|
October
31, 2008 |
|
October
26, 2007 |
|
|||
|
Net Sales |
|
$ |
2,879,042 |
|
$ |
3,482,378 |
|
$ |
3,249,287 |
|
|
Cost of Sales |
|
|
1,900,114 |
|
|
2,504,947 |
|
|
2,277,490 |
|
|
Gross Profit |
|
|
978,928 |
|
|
977,431 |
|
|
971,797 |
|
|
Research and Development |
|
|
91,303 |
|
|
96,552 |
|
|
90,322 |
|
|
Selling and Administrative |
|
|
589,082 |
|
|
579,567 |
|
|
565,959 |
|
|
Amortization Expense |
|
|
7,575 |
|
|
7,937 |
|
|
5,943 |
|
|
Income from Operations |
|
|
290,968 |
|
|
293,375 |
|
|
309,573 |
|
|
Interest Expense |
|
|
50,394 |
|
|
57,745 |
|
|
61,662 |
|
|
Other Expense (Income), net |
|
|
2,246 |
|
|
6,933 |
|
|
(11,860 |
) |
|
Income before Income Taxes |
|
|
238,328 |
|
|
228,697 |
|
|
259,771 |
|
|
Income Taxes |
|
|
78,175 |
|
|
77,931 |
|
|
87,656 |
|
|
Net Income |
|
$ |
160,153 |
|
$ |
150,766 |
|
$ |
172,115 |
|
|
Huarun Redeemable Stock Accrual1 |
|
|
(9,954 |
) |
|
(12,195 |
) |
|
(18,619 |
) |
|
Net Income Available to Common Stockholders |
|
$ |
150,199 |
|
$ |
138,571 |
|
$ |
153,496 |
|
|
Net Income Per Common Share – Basic |
|
$ |
1.50 |
|
$ |
1.39 |
|
$ |
1.52 |
|
|
Net Income Per Common Share – Diluted |
|
$ |
1.49 |
|
$ |
1.38 |
|
$ |
1.50 |
|
|
|
|
|
1 |
Huarun Redeemable Stock accrual reduced basic and diluted earnings per share by $0.10 in 2009, $0.12 in 2008 and by $0.18 in 2007 as further described in Note 2 in Notes to Consolidated Financial Statements. |
See Notes to Consolidated Financial Statements
25
Statement of Changes in Equity
(Dollars in thousands, except per share
amounts)
|
|
|
|
|
|
|
|
|
|
|
|
|
|
|
|
|
|
|
|
|
|
|
|
Common |
|
Additional |
|
Retained |
|
Treasury |
|
Accumulated |
|
Total |
|
||||||
|
Balance, October 27, 2006 |
|
$ |
60,220 |
|
$ |
326,011 |
|
$ |
1,007,225 |
|
$ |
(177,477 |
) |
$ |
24,084 |
|
$ |
1,240,063 |
|
|
Net Income |
|
|
— |
|
|
— |
|
|
172,115 |
|
|
— |
|
|
— |
|
|
172,115 |
|
|
Foreign Currency Translation |
|
|
— |
|
|
— |
|
|
— |
|
|
— |
|
|
70,108 |
|
|
70,108 |
|
|
Minimum Pension Liability Adjustment, net of tax of $11,752 |
|
|
— |
|
|
— |
|
|
— |
|
|
— |
|
|
28,632 |
|
|
28,632 |
|
|
Net Unrealized Gain (Loss) on Financial Instruments, net of tax of $136 |
|
|
— |
|
|
— |
|
|
— |
|
|
— |
|
|
(217 |
) |
|
(217 |
) |
|
|
|
|
|
|
|
|
|
|
|
|
|
|
|
|
|
|
|
||
|
Comprehensive Income |
|
|
|
|
|
|
|
|
|
|
|
|
|
|
|
|
$ |
270,638 |
|
|
|
|
|
|
|
|
|
|
|
|
|
|
|
|
|
|
|
|
||
|
Cumulative effect of adopting SFAS 158 (FASB ASC Topic 715), net of tax of $16,710 |
|
|
— |
|
|
— |
|
|
— |
|
|
— |
|
|
(40,711 |
) |
|
(40,711 |
) |
|
Restricted Stock Granted for 4,286 Shares |
|
|
— |
|
|
46 |
|
|
— |
|
|
70 |
|
|
— |
|
|
116 |
|
|
Common Stock Options Exercised of 1,348,896 Shares |
|
|
— |
|
|
16,393 |
|
|
— |
|
|
12,540 |
|
|
— |
|
|
28,933 |
|
|
Purchase of Shares of Common Stock for Treasury of 596,300 Shares |
|
|
— |
|
|
— |
|
|
— |
|
|
(15,821 |
) |
|
— |
|
|
(15,821 |
) |
|
Retirement of Common Stock of 2,000,000 Shares |
|
|
(1,000 |
) |
|
(55,019 |
) |
|
— |
|
|
— |
|
|
— |
|
|
(56,019 |
) |
|
Cash Dividends on Common Stock – $0.52 per Share |
|
|
— |
|
|
— |
|
|
(52,670 |
) |
|
— |
|
|
— |
|
|
(52,670 |
) |
|
Stock Option Expense |
|
|
— |
|
|
11,575 |
|
|
— |
|
|
— |
|
|
— |
|
|
11,575 |
|
|
Huarun Redeemable Stock Accrual |
|
|
— |
|
|
— |
|
|
(18,619 |
) |
|
— |
|
|
— |
|
|
(18,619 |
) |
|
Huarun Minority Interest Shares (LTIP) |
|
|
— |
|
|
13,337 |
|
|
— |
|
|
— |
|
|
— |
|
|
13,337 |
|
|
Other |
|
|
— |
|
|
— |
|
|
— |
|
|
— |
|
|
(25 |
) |
|
(25 |
) |
|
Balance, October 26, 2007 |
|
$ |
59,220 |
|
$ |
312,343 |
|
$ |
1,108,051 |
|
$ |
(180,688 |
) |
$ |
81,871 |
|
$ |
1,380,797 |
|
|
Net Income |
|
|
— |
|
|
— |
|
|
150,766 |
|
|
— |
|
|
— |
|
|
150,766 |
|
|
Foreign Currency Translation |
|
|
— |
|
|
— |
|
|
— |
|
|
— |
|
|
8,184 |
|
|
8,184 |
|
|
Change in Unfunded Benefit Obligations, net of tax of $868 |
|
|
— |
|
|
— |
|
|
— |
|
|
— |
|
|
(419 |
) |
|
(419 |
) |
|
Net Unrealized Gain (Loss) on Financial Instruments, net of tax of $250 |
|
|
— |
|
|
— |
|
|
— |
|
|
— |
|
|
400 |
|
|
400 |
|
|
|
|
|
|
|
|
|
|
|
|
|
|
|
|
|
|
|
|
||
|
Comprehensive Income |
|
|
|
|
|
|
|
|
|
|
|
|
|
|
|
|
$ |
158,931 |
|
|
|
|
|
|
|
|
|
|
|
|
|
|
|
|
|
|
|
|
||
|
Restricted Stock Granted for 56,634 Shares |
|
|
— |
|
|
397 |
|
|
— |
|
|
670 |
|
|
— |
|
|
1,067 |
|
|
Common Stock Options Exercised of 1,179,702 Shares |
|
|
— |
|
|
9,103 |
|
|
— |
|
|
12,211 |
|
|
— |
|
|
21,314 |
|
|
Purchase of Shares of Common Stock for Treasury of 1,850,000 Shares |
|
|
— |
|
|
— |
|
|
— |
|
|
(39,675 |
) |
|
— |
|
|
(39,675 |
) |
|
Cash Dividends on Common Stock – $0.56 per Share |
|
|
— |
|
|
— |
|
|
(55,854 |
) |
|
— |
|
|
— |
|
|
(55,854 |
) |
|
Stock Option Expense |
|
|
— |
|
|
9,240 |
|
|
— |
|
|
— |
|
|
— |
|
|
9,240 |
|
|
Huarun Redeemable Stock Accrual |
|
|
— |
|
|
— |
|
|
(12,195 |
) |
|
— |
|
|
— |
|
|
(12,195 |
) |
|
Cumulative effect of adopting FIN 48 (FASB ASC Topic 740) |
|
|
— |
|
|
— |
|
|
(10,757 |
) |
|
— |
|
|
— |
|
|
(10,757 |
) |
|
Balance, October 31, 2008 |
|
$ |
59,220 |
|
$ |
331,083 |
|
$ |
1,180,011 |
|
$ |
(207,482 |
) |
$ |
90,036 |
|
$ |
1,452,868 |
|
|
Net Income |
|
|
— |
|
|
— |
|
|
160,153 |
|
|
— |
|
|
— |
|
|
160,153 |
|
|
Foreign Currency Translation |
|
|
— |
|
|
— |
|
|
— |
|
|
— |
|
|
8,186 |
|
|
8,186 |
|
|
Change in Unfunded Benefit Obligations, net of tax of $20,915 |
|
|
— |
|
|
— |
|
|
— |
|
|
— |
|
|
(35,323 |
) |
|
(35,323 |
) |
|
Net Unrealized Gain (Loss) on Financial Instruments, net of tax of $3,191 |
|
|
— |
|
|
— |
|
|
— |
|
|
— |
|
|
5,098 |
|
|
5,098 |
|
|
|
|
|
|
|
|
|
|
|
|
|
|
|
|
|
|
|
|
||
|
Comprehensive Income |
|
|
|
|
|
|
|
|
|
|
|
|
|
|
|
|
$ |
138,114 |
|
|
|
|
|
|
|
|
|
|
|
|
|
|
|
|
|
|
|
|
||
|
Restricted Stock Granted for 112,990 Shares |
|
|
— |
|
|
837 |
|
|
— |
|
|
1,272 |
|
|
— |
|
|
2,109 |
|
|
Common Stock Options Exercised of 1,426,341 Shares |
|
|
— |
|
|
11,781 |
|
|
— |
|
|
15,063 |
|
|
— |
|
|
26,844 |
|
|
Purchase of Shares of Common Stock for Treasury of 2,000,000 Shares |
|
|
— |
|
|
— |
|
|
— |
|
|
(54,387 |
) |
|
— |
|
|
(54,387 |
) |
|
Cash Dividends on Common Stock – $0.60 per Share |
|
|
— |
|
|
— |
|
|
(60,116 |
) |
|
— |
|
|
— |
|
|
(60,116 |
) |
|
Stock Option Expense |
|
|
— |
|
|
9,385 |
|
|
— |
|
|
— |
|
|
— |
|
|
9,385 |
|
|
Huarun Redeemable Stock Accrual |
|
|
— |
|
|
— |
|
|
(9,954 |
) |
|
— |
|
|
— |
|
|
(9,954 |
) |
|
Pension Plans Measurement Date Change (see Note 13 in Notes to Consolidated Financial Statements) |
|
|
— |
|
|
|
|
|
(356 |
) |
|
— |
|
|
— |
|
|
(356 |
) |
|
Balance, October 30, 2009 |
|
$ |
59,220 |
|
$ |
353,086 |
|
$ |
1,269,738 |
|
$ |
(245,534 |
) |
$ |
67,997 |
|
$ |
1,504,507 |
|
See Notes to Consolidated Financial Statements
26
Consolidated Statements of Cash Flows
(Dollars in thousands)
|
|
|
|
|
|
|
|
|
|
|
|
|
|
|
For the Year Ended |
|
|
|
October 30, 2009 |
|
October 31, 2008 |
|
October 26, 2007 |
|
|||
|
Operating Activities |
|
Net Income |
|
$ |
160,153 |
|
$ |
150,766 |
|
$ |
172,115 |
|
|
|
|
Adjustments to Reconcile Net Income to Net Cash Provided by (used in) Operating Activities: |
|
|
|
|
|
|
|
|
|
|
|
|
|
Depreciation |
|
|
75,287 |
|
|
72,894 |
|
|
65,868 |
|
|
|
|
Amortization |
|
|
7,575 |
|
|
7,937 |
|
|
5,943 |
|
|
|
|
Deferred Income Taxes |
|
|
18,397 |
|
|
(7,488 |
) |
|
2,827 |
|
|
|
|
Net (Gain) Loss on Disposal of Assets |
|
|
940 |
|
|
(7,916 |
) |
|
444 |
|
|
|
|
Stock Option Expense |
|
|
9,385 |
|
|
9,240 |
|
|
11,575 |
|
|
|
|
Changes in Certain Assets and Liabilities, |
|
|
|
|
|
|
|
|
|
|
|
|
|
Decrease (Increase) in Accounts and Notes Receivable |
|
|
40,530 |
|
|
(21,993 |
) |
|
(16,475 |
) |
|
|
|
Decrease (Increase) in Inventories and Other Assets |
|
|
38,076 |
|
|
15,684 |
|
|
22,096 |
|
|
|
|
Increase (Decrease) in Trade Accounts Payable and Accrued Liabilities |
|
|
15,507 |
|
|
33,528 |
|
|
(63,445 |
) |
|
|
|
Increase (Decrease) in Income Taxes Payable |
|
|
(17,554 |
) |
|
25,988 |
|
|
(15,521 |
) |
|
|
|
Increase (Decrease) in Other Deferred Liabilities |
|
|
(24,236 |
) |
|
(5,102 |
) |
|
333 |
|
|
|
|
Settlement of Treasury Lock Contracts |
|
|
|
|
|
|
|
|
|
|
|
|
|
(see Note 6 in Notes to Consolidated Financial Statements for further details) |
|
|
11,600 |
|
|
— |
|
|
4,566 |
|
|
|
|
Other |
|
|
2,035 |
|
|
(9,088 |
) |
|
356 |
|
|
|
|
Net Cash Provided by (Used in) Operating Activities |
|
|
337,695 |
|
|
264,450 |
|
|
190,682 |
|
|
Investing Activities |
|
Purchases of Property, Plant and Equipment |
|
|
(57,897 |
) |
|
(43,045 |
) |
|
(76,940 |
) |
|
|
|
Acquired Businesses (net of cash) |
|
|
— |
|
|
(64,647 |
) |
|
(171,008 |
) |
|
|
|
Cash Proceeds on Disposal of Assets |
|
|
581 |
|
|
38,210 |
|
|
1,712 |
|
|
|
|
Purchase of Huarun Redeemable Stock |
|
|
(45,047 |
) |
|
(21,501 |
) |
|
— |
|
|
|
|
Net Cash Provided by (Used in) Investing Activities |
|
|
(102,363 |
) |
|
(90,983 |
) |
|
(246,236 |
) |
|
Financing Activities |
|
Proceeds from Issuance of Senior Notes |
|
|
296,772 |
|
|
— |
|
|
347,200 |
|
|
|
|
Payments on Senior Notes |
|
|
— |
|
|
(100,000 |
) |
|
(350,000 |
) |
|
|
|
Net Change in Other Borrowings |
|
|
(346,623 |
) |
|
18,104 |
|
|
163,376 |
|
|
|
|
Proceeds from Sales of Treasury Stock |
|
|
23,956 |
|
|
20,200 |
|
|
25,328 |
|
|
|
|
Purchase of Shares of Common Stock for Treasury |
|
|
(54,387 |
) |
|
(39,675 |
) |
|
(15,821 |
) |
|
|
|
Retirement of Common Stock |
|
|
— |
|
|
— |
|
|
(56,019 |
) |
|
|
|
Excess Tax Benefit from Stock-Based Compensation |
|
|
1,343 |
|
|
473 |
|
|
2,086 |
|
|
|
|
Deferred Liability-Excess Cash – Huarun |
|
|
(4,818 |
) |
|
(11,390 |
) |
|
(19,734 |
) |
|
|
|
Dividends Paid |
|
|
(60,116 |
) |
|
(55,854 |
) |
|
(52,670 |
) |
|
|
|
Net Cash Provided by (Used in) Financing Activities |
|
|
(143,873 |
) |
|
(168,142 |
) |
|
43,746 |
|
|
|
|
Effect of Exchange Rates on Cash and Cash Equivalents |
|
|
6,187 |
|
|
(200 |
) |
|
8,518 |
|
|
|
|
Increase (Decrease) in Cash and Cash Equivalents |
|
|
97,646 |
|
|
5,125 |
|
|
(3,290 |
) |
|
Cash and Cash Equivalents at Beginning of Year |
|
|
90,073 |
|
|
84,948 |
|
|
88,238 |
|
||
|
Cash and Cash Equivalents at End of Year |
|
$ |
187,719 |
|
$ |
90,073 |
|
$ |
84,948 |
|
||
See Notes to Consolidated Financial Statements
27
Notes to Consolidated Financial Statements
The Valspar
Corporation • Years Ended October 2009, 2008 and 2007
(Dollars in thousands, except per share amounts)
NOTE 1 – SIGNIFICANT ACCOUNTING POLICIES
Fiscal Year: The Valspar Corporation has a 4-4-5 week accounting cycle with the fiscal year ending on the Friday on or immediately preceding October 31. Fiscal years 2009, 2008 and 2007 include 52, 53 and 52 weeks, respectively. Subsequent to October 30, 2009, we settled certain income tax audits that are expected to decrease our fiscal year 2010 effective income tax rate by approximately 1.0 to 1.5 percentage points. There were no other subsequent events that would require disclosure or adjustments to the accompanying consolidated financial statements through December 18, 2009, which is our Form 10-K filing date.
Codification: In June 2009, the Financial Accounting Standards Board (FASB) issued Accounting Standards Codification Topic 105, Generally Accepted Accounting Principles (Topic 105). This standard establishes the FASB Accounting Standards Codification (ASC) as the sole source of authoritative U.S. generally accepted accounting principles (GAAP). The ASC superseded all existing GAAP upon its effective date. Topic 105 was effective for interim or annual reporting periods ending after September 15, 2009, and therefore we have updated references to GAAP in our consolidated financial statements for the fiscal year ending on October 30, 2009. Adoption of this standard did not have an impact on consolidated net earnings, cash flows or financial position.
Principles of Consolidation: The consolidated financial statements include the accounts of the parent company and its subsidiaries. All intercompany accounts and transactions have been eliminated in consolidation. Investments in which we have a 20-50% interest and where we do not have management control and are not the primary beneficiary are accounted for using the equity method. In order to facilitate our year-end closing process, foreign entities’ financial results are included in our consolidated financial statements on a one-month lag.
Estimates: The preparation of financial statements in conformity with United States GAAP requires us to make estimates and assumptions that affect the amounts reported in the financial statements and accompanying notes. Such estimates and assumptions impact, among others, the following: the amount of revenue deferred under extended furniture protection plans, the amount of supplier rebates earned, the amount of customer rebates owed, the amount to be paid for other liabilities, including contingent liabilities, assumptions around the valuation of Goodwill and Indefinite-Lived Intangible Assets, including impairment, our pension expense and pension funding requirements, and the computation of our income tax expense and liability. Actual results could differ from these estimates.
Revenue Recognition: Other than extended furniture protection plans, revenue from sales is recognized at the time of product delivery, passage of title, a sales agreement is in place, pricing is fixed or determinable and collection is reasonably assured. Discounts provided to customers at the point of sale are recognized as a reduction in revenue as the products are sold. We sell extended furniture protection plans for which revenue is deferred and recognized over the life of the contract. An actuarial study utilizing historical claims data is used to forecast claims payments over the contract period and revenue is recognized over the contract period based on the forecasted claims payments. Actual claims costs are reflected in earnings in the period incurred. Anticipated losses on programs in progress are charged to earnings when identified. Revenues exclude sales taxes collected from our customers.
Allowance for Doubtful Accounts: We estimate the allowance for doubtful accounts by analyzing accounts receivable by age, specific collection risk and evaluating the historical write-off percentage over the past five year period. Accounts are written off sooner in the event of bankruptcy or other circumstances that make further collection unlikely. When it is deemed probable that a customer account is uncollectible, that balance is written off against the existing allowance.
Cash Equivalents: We consider all highly liquid instruments purchased with an original maturity of less than three months to be cash equivalents.
Inventories: Inventories are stated at the lower of cost or market. Our domestic inventories are recorded on the last-in, first-out (LIFO) method. The remaining inventories are recorded using the first-in, first-out (FIFO) method.
Property, Plant and Equipment: Property, plant and equipment are recorded at cost. Expenditures that improve or extend the life of the respective assets are capitalized, while maintenance and repairs are expensed as incurred. Provision for depreciation of property is made by charges to operations at rates calculated to amortize the cost of the property over its useful life (twenty years for buildings; three to ten years for machinery and equipment) primarily using the straight-line method.
Impairment of Long-Lived Tangible and Intangible Assets: We evaluate long-lived assets, including intangible assets with finite lives, for impairment at least annually. An impairment loss is recognized whenever events or changes in circumstances indicate the carrying amount of an asset is not recoverable. When reviewing for impairment, assets are grouped and evaluated at the lowest level for which there are identifiable cash flows that are largely independent of the cash flows of other groups of assets. We consider historical performance and future estimated results in our evaluation of impairment. If the carrying amount of the asset exceeds expected undiscounted future cash flows, we measure the amount of impairment by comparing the carrying amount of the asset to its fair value, generally by discounting expected future cash flows.
28
Management also reviews other intangible assets with finite lives for impairment at least annually to determine if any adverse conditions exist that would indicate impairment. If the carrying value of the finite-lived intangible assets exceeds the undiscounted cash flows resulting from the use and disposition of the asset, the carrying value is written down to fair value in the period identified.
We amortize intangibles with finite lives, which includes our patents and customer lists.
Goodwill and Indefinite-Lived Intangible Assets: Goodwill represents the excess of cost over the fair value of identifiable net assets of businesses acquired. Indefinite-lived intangible assets consist of purchased technology, trademarks and trade names.
Goodwill for our five reporting units (see Note 14) is reviewed for impairment at least annually using a two-step process. In the first step, we compare the fair value of each reporting unit, as computed primarily by present value cash flow calculations, to its carrying value, including goodwill. If the fair value exceeds the carrying value, no further work is required and no impairment loss is recognized. If the carrying value exceeds the fair value, the goodwill of the reporting unit is potentially impaired and we would then complete step 2 in order to measure the impairment loss. In step 2, we would calculate the implied fair value of goodwill by deducting the fair value of all tangible and intangible net assets (including unrecognized intangible assets) of the reporting unit from the fair value of the reporting unit (as determined in step 1). If the implied fair value of goodwill is less than the carrying value of goodwill, we would recognize an impairment loss equal to the difference.
Management reviews indefinite-lived intangible assets at least annually for impairment by calculating the fair value of the assets and comparing with their carrying value. In assessing fair value, management generally utilizes a relief from royalty method. If the carrying value of the indefinite-lived intangible assets exceeds the fair value of the asset, the carrying value is written down to fair value in the period identified.
During the fourth quarters of 2009 and 2008, management completed the annual goodwill and indefinite-lived intangible asset impairment reviews with no impairments to the carrying values identified.
Stock-Based Compensation: Our stock-based employee compensation plans are comprised primarily of fixed stock options, but also include restricted stock. Options generally have a contractual term of 10 years, vest ratably over three or five years for employees and immediately upon grant for non-employee directors. Restricted shares vest after three or five years. We account for our stock based compensation using a fair value method. See Note 9 for additional information.
Contingent Liabilities: We are involved in various claims relating to environmental and waste disposal matters at a number of current and former plant sites. We engage or participate in remedial and other environmental compliance activities at certain of these sites. At other sites, we have been named as a potentially responsible party (PRP) under federal and state environmental laws for the remediation of hazardous waste. Management analyzes each individual site, considering the number of parties involved, the level of potential liability or contribution by us relative to the other parties, the nature and magnitude of the wastes involved, the method and extent of remediation, the potential insurance coverage, the estimated legal and consulting expense with respect to each site, and the time period over which any costs would likely be incurred. Based on the above analysis, management estimates the remediation or other cleanup costs and related claims for each site. The estimates are based in part on discussions with other PRPs, governmental agencies and engineering firms.
We accrue appropriate reserves for potential environmental liabilities, which are continually reviewed and adjusted as additional information becomes available. While uncertainties exist with respect to the amounts and timing of our ultimate environmental liabilities, management believes there is not a reasonable possibility that such liabilities, individually or in the aggregate, will have a material adverse effect on our financial condition or results of operations.
We are involved in a variety of legal claims and proceedings relating to personal injury, product liability, warranties, customer contracts, employment, trade practices, environmental and other legal matters that arise in the normal course of business. These claims and proceedings include cases where we are one of a number of defendants in proceedings alleging that the plaintiffs suffered injuries or contracted diseases from exposure to chemicals or other ingredients used in the production of some of our products or waste disposal. We believe these claims and proceedings are not out of the ordinary course for a business of the type and size in which we are engaged. While we are unable to predict the ultimate outcome of these claims and proceedings, management believes there is not a reasonable possibility that the costs and liabilities of such matters, individually or in the aggregate, will have a material adverse effect on our financial condition or results of operations.
Advertising Costs: Advertising costs are expensed as incurred and totaled $82,096 (2.9% of net sales), $93,925 (2.7% of net sales) and $101,010 (3.1% of net sales) in 2009, 2008 and 2007, respectively.
Foreign Currency: Foreign currency denominated assets and liabilities are translated into U.S. dollars using the exchange rates in effect at the balance sheet date. Results of operations are translated using the average exchange rates throughout the period. The effect of exchange rate fluctuations on translation of assets and liabilities is recorded as a component of stockholders’ equity (accumulated other comprehensive income). Gains and losses from foreign currency transactions are included in other expense (income), net.
29
Net Income Per Share: The following table reflects the components of common shares outstanding for the three most recent fiscal years:
|
|
|
|
|
|
|
|
|
|
|
|
|
|
|
2009 |
|
2008 |
|
2007 |
|
|||
|
Weighted-average common shares outstanding – basic |
|
|
100,036,809 |
|
|
99,650,574 |
|
|
100,938,940 |
|
|
Dilutive effect of stock options and unvested restricted stock |
|
|
884,642 |
|
|
675,675 |
|
|
1,678,238 |
|
|
Equivalent average common shares outstanding – diluted |
|
|
100,921,451 |
|
|
100,326,249 |
|
|
102,617,178 |
|
Basic earnings per share are based on the weighted average number of common shares outstanding during each year. In computing diluted earnings per share, the number of common shares outstanding is increased by common stock options with exercise prices lower than the average market prices of common shares during each year and reduced by the number of shares assumed to have been purchased with proceeds from the exercised options. Potential common shares of 5,248,594, 4,176,277 and 1,151,502 related to our outstanding stock options were excluded from the computation of diluted earnings per share for 2009, 2008 and 2007, respectively, as inclusion of these shares would have been antidilutive.
Financial Instruments: All financial instruments are held for purposes other than trading. See Note 6 for additional information.
Accumulated Other Comprehensive Income: Period end balances for accumulated other comprehensive income are comprised of the following:
|
|
|
|
|
|
|
|
|
|
|
|
|
|
|
Year
ended |
|
Year
ended |
|
Year
ended |
|
|||
|
Foreign currency translation |
|
$ |
138,045 |
|
$ |
129,859 |
|
$ |
121,675 |
|
|
Pension and postretirement benefits, net |
|
|
(77,679 |
) |
|
(42,356 |
) |
|
(41,937 |
) |
|
Net unrealized gain (loss) on financial instruments |
|
|
7,631 |
|
|
2,533 |
|
|
2,133 |
|
|
Accumulated other comprehensive income (loss) |
|
$ |
67,997 |
|
$ |
90,036 |
|
$ |
81,871 |
|
Research and Development: Research and development is expensed as incurred.
Reclassification: Certain amounts in the prior years’ financial statements have been reclassified to conform to the 2009 presentation. Such reclassifications had no effect on net income or stockholders’ equity as previously reported.
NOTE 2 – ACQUISITIONS AND DIVESTITURES
In October 2008, we completed the sale of a non-strategic specialty product line to W.M. Barr & Co., Inc. No manufacturing equipment or plants were included in the transaction.
In January 2008, we completed the sale of our commercial/industrial polymer floor coatings product line to Sika AG. The product line had annual sales of approximately $17,000 in fiscal year 2007. No manufacturing equipment or plants were included in the transaction.
In December 2007, we acquired control of Aries Coil Coatings S.A. de C.V. (Aries), a privately owned manufacturer of high-performance coil and packaging coatings based in Monterrey, Mexico. We acquired the remaining shares of this business in the second quarter of 2008. Aries had annual sales in calendar year 2007 of approximately $40,000. This transaction was accounted for as a purchase. Accordingly, the net assets and operating results have been included in our financial statements from the date of acquisition.
In August 2007, we acquired Teknos Nova Coil TNC Oy (TNC), a privately owned manufacturer of high-performance coil coatings based in Helsinki, Finland. TNC’s revenues for calendar 2006 were approximately €31,000. This transaction was accounted for as a purchase. The net assets and operating results have been included in our fiscal year 2007 financial statements from the date of acquisition.
In January 2007, we acquired from Tekno S.A. a majority of the voting shares of a coil coatings business in Brazil. Tekno’s revenue for 2006 was approximately $11,000. In the fourth quarter of fiscal year 2008, we acquired the remaining shares of this business and have accounted for this transaction as a purchase. The net assets and operating results have been included in our fiscal year 2008 financial statements from the date of acquisition.
In December 2006, we acquired the powder coatings business of H.B. Fuller Company. H.B. Fuller’s powder coatings business, which had net sales of approximately $75,000 in 2005, serves customers in 26 countries from manufacturing facilities in the United States and the United Kingdom. This transaction was accounted for as a purchase. The net assets and operating results have been included in our financial statements from the date of acquisition.
Pro forma results of operations for the fiscal year 2008 and 2007 acquisitions and divestitures noted above have not been presented, as they were immaterial to the reported results on an individual and combined basis.
In July 2006, we acquired approximately 80% of the share capital of Huarun Paints Holdings Company Limited (Huarun Paints), one of China’s largest independent coatings companies, from Champion Regal Limited, a Hong Kong based investment company, and certain other stockholders. Huarun Paints is one of China’s leading domestic suppliers of wood and furniture coatings, and a supplier of architectural coatings. Huarun Paints sells its products primarily through an extensive network of distributors and retail paint stores throughout China. Huarun Paints’ revenue for fiscal year 2006 was approximately $200,000. The cash purchase price was approximately $290,386. The net assets and operating results have been included in our financial statements from the date of acquisition. Goodwill has been allocated to the Paints (approximately 60%) and Coatings (approximately 40%) segments. The pro forma results of operations for this acquisition have not been presented, as the impact on reported results is not material.
30
Certain of the shares not purchased by us at the closing were subject to various put and call rights. The put and call rights are classified outside of stockholders’ equity in Huarun Redeemable Stock. During the fourth quarter of 2008, certain minority stockholders exercised their right to sell shares to us. During the fourth quarter of 2009, we acquired the remaining Huarun Redeemable Stock, reducing the balance to zero. Acquisition accounting was applied upon the acquisition of the shares in 2009 and 2008.
The Huarun Redeemable Stock was accrued to redemption value and the amount of accretion is shown as an adjustment below net income to arrive at the net income available to common stockholders. We accrued $9,954, $12,195 and $18,619 during 2009, 2008 and 2007, respectively. This accrual reduced basic and diluted income per common share available to common stockholders by $0.10, $0.12 and $0.18 for 2009, 2008 and 2007, respectively.
Certain other Huarun shares were awarded by Huarun prior to the acquisition closing. The pre-acquisition share awards are classified as equity awards as there is no obligation to purchase the shares, and if we were to purchase the shares, we would purchase the shares at fair market value.
The terms of the acquisition also required us to pay to Champion Regal and certain other stockholders an amount equal to the excess cash, as defined in the purchase agreement, held by Huarun as of the closing date. The liability was to be paid as soon as practical before the third anniversary of the closing date, including interest at 6%. The excess cash of $34,370 was recorded as a deferred liability under purchase accounting. We made a payment of $4,818 plus accrued interest during the first quarter of 2009 to reduce this liability to zero. During fiscal years 2008 and 2007, we paid $11,390 and $19,734 plus interest, respectively. The total payments, excluding interest, of $35,942 included $1,572 of unfavorable foreign currency exchange.
NOTE 3 – INVENTORIES
The major classes of inventories consist of the following:
|
|
|
|
|
|
|
|
|
|
|
|
2009 |
|
2008 |
|
||
|
Manufactured products |
|
$ |
134,535 |
|
$ |
153,325 |
|
|
Raw materials, supplies and work-in-progress |
|
|
103,914 |
|
|
118,098 |
|
|
|
|
$ |
238,449 |
|
$ |
271,423 |
|
Inventories stated at cost determined by the last-in, first-out (LIFO) method aggregate $122,551 at October 30, 2009 and $130,619 at October 31, 2008, approximately $53,426 and $82,471 lower, respectively, than such costs determined under the first-in, first-out (FIFO) method.
NOTE 4 – SUPPLEMENTAL DISCLOSURES RELATED TO CURRENT LIABILITIES
Trade accounts payable include $26,689 and $33,146 of issued checks, which had not cleared our bank accounts as of October 30, 2009 and October 31, 2008, respectively.
Accrued liabilities include the following:
|
|
|
|
|
|
|
|
|
|
|
|
|
2009 |
|
|
2008 |
|
|
Employee compensation |
|
$ |
117,080 |
|
$ |
85,514 |
|
|
Uninsured loss reserves and deferred revenue |
|
|
63,476 |
|
|
60,687 |
|
|
Customer volume rebates and incentives |
|
|
53,018 |
|
|
45,691 |
|
|
Contribution to employees’ retirement trusts |
|
|
21,592 |
|
|
17,455 |
|
|
Interest |
|
|
20,372 |
|
|
12,816 |
|
|
Taxes, insurance, professional fees and services |
|
|
21,455 |
|
|
18,956 |
|
|
Advertising and promotions |
|
|
23,529 |
|
|
17,153 |
|
|
Restructuring |
|
|
6,144 |
|
|
11,387 |
|
|
Deferred tax liability |
|
|
2,155 |
|
|
2,117 |
|
|
Other |
|
|
20,619 |
|
|
19,122 |
|
|
|
|
$ |
349,440 |
|
$ |
290,898 |
|
NOTE 5 – DEBT AND CREDIT ARRANGEMENTS
Our debt consists of the following:
|
|
|
|
|
|
|
|
|
|
|
|
|
2009 |
|
|
2008 |
|
|
Commercial paper |
|
$ |
— |
|
$ |
148,325 |
|
|
Short-term bank lines of credit (weighted average interest rate of 5.70% at October 30, 2009) |
|
|
7,278 |
|
|
11,189 |
|
|
Current portion of long-term debt |
|
|
— |
|
|
12 |
|
|
Total Short-term Borrowings |
|
$ |
7,278 |
|
$ |
159,526 |
|
|
Notes to banks |
|
$ |
60,593 |
|
$ |
250,627 |
|
|
Senior notes |
|
|
|
|
|
|
|
|
Due 2012 at 5.625% |
|
|
200,000 |
|
|
200,000 |
|
|
Due 2015 at 5.10% |
|
|
150,000 |
|
|
150,000 |
|
|
Due 2017 at 6.05% |
|
|
150,000 |
|
|
150,000 |
|
|
Due 2019 at 7.25% |
|
|
300,000 |
|
|
— |
|
|
Industrial development bonds |
|
|
12,502 |
|
|
12,502 |
|
|
Total Long-term Debt, net of current portion |
|
$ |
873,095 |
|
$ |
763,129 |
|
|
Total Debt |
|
$ |
880,373 |
|
$ |
922,655 |
|
31
During the third quarter of 2009, we entered into a $465,000 unsecured committed revolving credit facility with a syndicate of banks expiring on June 30, 2012. The new credit facility replaced our $150,000 364-Day Credit Agreement that was due to mature in November 2009 and our $600,000 Five-Year Credit Agreement that was due to mature in October 2010, which were both terminated on June 26, 2009. During the fourth quarter of 2009, the new credit facility was expanded by $10,000 to a total facility size of $475,000. The credit facility is a backstop to our $350,000 U.S. Commercial Paper program established in 2006. We had notes to banks under this new facility totaling $50,000 at October 30, 2009. In connection with the new credit facility we entered into a bi-lateral U.S. dollar equivalent $13,500 unsecured committed revolving credit facility, under which we had notes to banks totaling $10,593 at October, 30, 2009. We had $150,000 and $100,627 outstanding as of October 31, 2008 under the replaced $150,000 364-Day Credit Agreement and $600,000 Five-Year Credit Agreement, respectively. Under our $350,000 U.S. Commercial Paper program, we had $0 and $148,325 outstanding as of October 30, 2009 and October 31, 2008, respectively. The weighted average interest rate on the commercial paper borrowings was 3.81% for 2008.
The new credit facilities contain covenants that require us to maintain certain financial ratios. We were in compliance with these covenants as of October 30, 2009.
Under other short-term bank lines of credit around the world, we may borrow up to $117,535 on such terms as the banks and we may mutually agree. Borrowings under these facilities totaled $7,278 and $11,189 at October 30, 2009 and October 31, 2008, respectively. These arrangements are reviewed periodically for renewal and modification. Borrowings under these debt arrangements had an average annual interest rate of 5.70% for 2009, 5.88% in 2008 and 6.16% in 2007.
During the third quarter of 2009, we issued $300,000 of unsecured, senior notes that mature on June 15, 2019 with a coupon rate of 7.25%. The public offering was made pursuant to a registration statement filed with the U.S. Securities and Exchange Commission. We used the net proceeds of $296,772 to repay our commercial paper borrowings and a portion of our borrowings under our existing bank credit facilities.
The future maturities of long-term debt are as follows:
|
|
|
|
|
|
|
|
|
|
Maturities |
|
|
2010 |
|
$ |
— |
|
|
2011 |
|
|
— |
|
|
2012 |
|
|
260,593 |
|
|
2013 |
|
|
— |
|
|
2014 |
|
|
— |
|
|
Thereafter |
|
|
612,502 |
|
To ensure availability of funds, we maintain bank credit lines sufficient to cover outstanding short-term borrowings. Our available liquidity under the short-term bank lines and revolving credit facilities was $606,035 with outstanding borrowings of $67,871 at October 30, 2009. We had unused lines of credit under the short-term bank lines and revolving credit facilities of $538,164 at October 30, 2009 and $528,396 at October 31, 2008.
Interest paid during 2009, 2008 and 2007 was $42,648, $61,485 and $61,582, respectively.
The table below summarizes the carrying value and fair market value of our outstanding debt. The fair market value of our publicly traded debt is based on observable market prices. The fair market value of our non-publicly traded debt was estimated using a discounted cash flow analysis based on our current borrowing costs for debt with similar maturities.
|
|
|
|
|
|
|
|
|
|
|
|
October 30, 2009 |
|
||||
|
|
|
||||||
|
|
|
|
Balance
Sheet |
|
|
Fair
Market |
|
|
Publicly traded debt |
|
$ |
800,000 |
|
$ |
867,942 |
|
|
Non-publicly traded debt |
|
|
80,373 |
|
|
77,676 |
|
|
Total debt |
|
$ |
880,373 |
|
$ |
945,618 |
|
|
|
|||||||
|
|
|
October 31, 2008 |
|
||||
|
|
|
||||||
|
|
|
|
Balance
Sheet |
|
|
Fair
Market |
|
|
Publicly traded debt |
|
$ |
500,000 |
|
$ |
410,170 |
|
|
Non-publicly traded debt |
|
|
422,655 |
|
|
418,080 |
|
|
Total debt |
|
$ |
922,655 |
|
$ |
828,250 |
|
We did not elect the option to report our debt at fair value in our Consolidated Balance Sheets.
NOTE 6 – FINANCIAL INSTRUMENTS
We use derivative financial instruments to manage well-defined interest rate and foreign currency exchange risks. We enter into derivative financial instruments and money market funds with high-credit quality counterparties and diversify our positions among such counterparties to reduce our exposure to credit losses.
In March 2008, the Financial Accounting Standards Board (“FASB”) expanded the disclosure requirements for financial instruments. The expanded disclosures include qualitative disclosures about objectives and strategies for using derivatives, quantitative disclosures about fair value gains and losses on derivative instruments and their location in the financial statements and disclosures about credit-risk-related contingent features in derivative agreements. We do not have any credit-risk-related contingent features in our derivative contracts as of October 30, 2009. These additional disclosures are required for financial statements issued for fiscal periods beginning after November 15, 2008.
In September 2006, the FASB issued new fair value and disclosure requirements that defined fair value, established a framework in GAAP for measuring fair value and expanded disclosures about fair value measurements. The changes did not increase the required use of fair value measurement in the financial statements. The requirements are effective for fiscal years beginning after November 15, 2007 for financial assets and liabilities, and will be effective for nonfinancial assets and liabilities for years beginning after November 15, 2008, which is our fiscal year 2010.
32
During the first quarter of 2009, we adopted the fair value disclosure requirements for our financial assets and liabilities. Our financial assets subject to fair value measurement disclosures consist of money market funds that are included in our cash and cash equivalents balance as of October 30, 2009, with a fair value of $74,119. These assets have observable prices that are quoted on an active exchange and are therefore classified as Level 1 inputs under the fair value hierarchy. The carrying value of the money market funds approximates fair value, as the maturities are less than three months. Our financial liabilities subject to fair value measurement rules consist of interest rate swaps and forward foreign currency exchange contracts (foreign currency contracts) with fair values totaling $1,476 and $170, respectively. The interest rate swaps and foreign currency contracts have observable prices that are not quoted on active exchanges, and are therefore classified as Level 2 inputs under the fair value hierarchy.
At October 30, 2009, we had an aggregate $50,000 of notional amount interest rate swap contracts, which have been designated as cash flow hedges, to pay fixed rates of interest and receive a floating interest rate based on LIBOR. All contracts mature during fiscal 2011. The interest rate swap contracts are reflected at fair value in the consolidated balance sheet. Unrealized gains and losses are recorded in accumulated other comprehensive income. Amounts to be received or paid under the contracts are recognized as interest expense over the life of the contracts. There was no ineffectiveness for these swaps recognized in interest expense for the year ended October 30, 2009. We had $100,000 of notional amount interest rate swap contracts in place as of October 31, 2008. There was an immaterial amount of ineffectiveness for these swaps recognized in interest expense for the year ended October 31, 2008.
During the third quarter of 2009, we terminated $50,000 notional amount of interest rate swap contracts yielding a pretax loss of $1,667. The contracts had been designated as cash flow hedges to pay fixed rates of interest and receive a floating interest rate based on LIBOR. The interest rate swap contracts were terminated as a result of the repayment of the hedged LIBOR based borrowings. The loss is reflected as an increase to interest expense in our statement of income.
At October 30, 2009, we had $8,665 notional amount of foreign currency contracts maturing during fiscal year 2010. These foreign currency contracts have been designated as cash flow hedges with unrealized gains or losses recorded in accumulated other comprehensive income. Realized gains and losses will be recognized in Other Expense (Income) when they occur. At October 31, 2008, we had $6,757 notional amount of foreign currency contracts maturing during fiscal year 2009. There was no ineffectiveness for these hedges during 2009 or 2008.
At October 30, 2009 and October 31, 2008 we had no treasury lock contracts in place. During the third quarter of 2009, we terminated $150,000 of treasury lock contracts as a result of the third quarter senior note issuance, yielding a pretax gain of $11,600. This gain is reflected, net of tax, in accumulated other comprehensive income in our consolidated balance sheet as of October 30, 2009 and will be reclassified ratably to our statements of income as a decrease to interest expense over the term of the related debt.
The following table shows the balance sheet classifications and fair values of our derivative instruments as of October 30, 2009.
|
|
|
|
|
|
|
|
|
Derivative Balance Sheet Location as of October 30, 2009 |
||||||
|
|
|
Balance Sheet Classification |
|
Fair Value |
|
|
|
Liability derivatives |
|
|
|
|
|
|
|
Derivatives designated as hedges: |
|
|
|
|
|
|
|
Foreign currency contracts |
|
Accrued liabilities |
|
$ |
170 |
|
|
Interest rate swap contracts |
|
Deferred liabilities |
|
|
1,476 |
|
|
Total liability derivatives |
|
|
|
$ |
1,646 |
|
The gain (loss) on our derivative instruments for the year ended October 30, 2009 was as follows:
|
|
|
|
|
|
|
|
|
|
|
|
Derivative Gains and Losses for the Fiscal Year ended October 30, 2009 |
|||||||||
|
|
|
|
|
|
|
|
|
|
|
|
|
|
Amount
of Gain (Loss) |
|
Statement of Income Classification |
|
|
Gain
(Loss) |
|
|
|
Derivatives designated as cash flow hedges |
|
|
|
|
|
|
|
|
|
|
Foreign currency contracts |
|
$ |
(44 |
) |
Other income / (expense), net |
|
$ |
1,031 |
|
|
Interest rate swap contracts |
|
|
(908 |
) |
Interest expense |
|
|
(3,395 |
) |
|
Total derivatives designated as cash flow hedges |
|
$ |
(952 |
) |
|
|
$ |
(2,364 |
) |
|
|
|
|
* |
Accumulated other comprehensive income (loss) (AOCI) is included on the Consolidated Balance Sheet in the Stockholders’ Equity section called Other and is reported net of tax |
|
|
|
|
** |
Amounts reported are pretax |
Additionally, as of October 30, 2009, the AOCI balance included a net unrealized after-tax gain of $8,583 that resulted from treasury lock contracts that have been settled. The gain is recognized as a benefit to interest expense over the life of the issued debt, which resulted in a pretax benefit of $887 for the year ended October 30, 2009.
33
NOTE 7 – GUARANTEES AND CONTRACTUAL OBLIGATIONS
We are required to disclose information about certain guarantees and contractual obligations in our periodic financial statements. We do not have any guarantees that require recognition at fair value.
We sell extended furniture protection plans and offer warranties for certain of our products. Revenue related to furniture protection plans is deferred and recognized over the contract life. Historical claims data is used to forecast claims payments over the contract period and revenue is recognized based on the forecasted claims payments. Actual claims costs are reflected in earnings in the period incurred. Anticipated losses on programs in progress are charged to earnings when identified. For product warranties, we estimate the costs that may be incurred under these warranties based on historical claims data and record a liability in the amount of such costs at the time revenue is recognized.
We periodically assess the adequacy of these recorded amounts and adjust as necessary. Provisions for estimated losses on uncompleted contracts are made in the period in which such losses are estimable. The extended furniture protection plans that we enter into have fixed prices. To the extent the actual costs to complete contracts are higher than the amounts estimated as of the date of the financial statements, gross margin would be negatively affected in future quarters when we revise our estimates. Our practice is to revise estimates as soon as such changes in estimates become known.
Changes in the recorded amounts, both short and long-term, during the period are as follows:
|
|
|
|
|
|
|
Balance, October 27, 2006 |
|
$ |
87,287 |
|
|
Change in accrual from previous fiscal year |
|
|
(1,280 |
) |
|
Additional net deferred revenue/accrual made during the period |
|
|
16,118 |
|
|
Payments made during the period |
|
|
(16,983 |
) |
|
Balance, October 26, 2007 |
|
$ |
85,142 |
|
|
Change in accrual from previous fiscal year |
|
|
— |
|
|
Additional net deferred revenue/accrual made during the period |
|
|
5,311 |
|
|
Payments made during the period |
|
|
(12,460 |
) |
|
Balance, October 31, 2008 |
|
$ |
77,993 |
|
|
Change in accrual from previous fiscal year |
|
|
— |
|
|
Additional net deferred revenue/accrual made during the period |
|
|
(699 |
) |
|
Payments made during the period |
|
|
(6,791 |
) |
|
Balance, October 30, 2009 |
|
$ |
70,503 |
|
NOTE 8 – GOODWILL AND OTHER INTANGIBLE ASSETS
The changes in the carrying amount of goodwill for the fiscal years ended October 30, 2009 and October 31, 2008 are as follows:
|
|
|
|
|
|
|
|
|
|
|
|
|
|
|
|
|
|
|
Coatings |
|
|
Paints |
|
|
Other |
|
|
Total |
|
|
Balance, October 26, 2007 |
|
$ |
1,051,908 |
|
$ |
222,136 |
|
$ |
24,907 |
|
$ |
1,298,951 |
|
|
Goodwill acquired (disposed/adjusted) |
|
|
48,775 |
|
|
2,794 |
|
|
— |
|
|
51,569 |
|
|
Currency translation gain (loss) |
|
|
(4,440 |
) |
|
9,494 |
|
|
(2,761 |
) |
|
2,293 |
|
|
Balance, October 31, 2008 |
|
$ |
1,096,243 |
|
$ |
234,424 |
|
$ |
22,146 |
|
$ |
1,352,813 |
|
|
Goodwill acquired (disposed/adjusted) |
|
|
(16,622 |
) |
|
(1,102 |
) |
|
— |
|
|
(17,724 |
) |
|
Currency translation gain (loss) |
|
|
(159 |
) |
|
1,482 |
|
|
1,585 |
|
|
2,908 |
|
|
Balance, October 30, 2009 |
|
$ |
1,079,462 |
|
$ |
234,804 |
|
$ |
23,731 |
|
$ |
1,337,997 |
|
Information regarding our other intangible assets is as follows:
|
|
|
|
|
|
|
|
|
|
|
|
|
|
|
|
|
|
|
Estimated |
|
|
Carrying |
|
|
Accumulated |
|
|
Net |
|
|
Balance, October 31, 2008 |
|
|
|
|
|
|
|
|
|
|
|
|
|
|
Customer Lists |
|
|
40 years |
|
$ |
277,193 |
|
$ |
(35,121 |
) |
$ |
242,072 |
|
|
Technology |
|
|
Indefinite |
|
|
200,834 |
|
|
— |
|
|
200,834 |
|
|
Trademarks |
|
|
Indefinite |
|
|
175,665 |
|
|
— |
|
|
175,665 |
|
|
Other |
|
|
10 years |
|
|
11,523 |
|
|
(10,626 |
) |
|
897 |
|
|
|
|
|
|
|
$ |
665,215 |
|
$ |
(45,747 |
) |
$ |
619,468 |
|
|
Balance, October 30, 2009 |
|
|
|
|
|
|
|
|
|
|
|
|
|
|
Customer Lists |
|
|
40 years |
|
$ |
280,728 |
|
$ |
(42,219 |
) |
$ |
238,509 |
|
|
Technology |
|
|
Indefinite |
|
|
204,144 |
|
|
— |
|
|
204,144 |
|
|
Trademarks |
|
|
Indefinite |
|
|
186,835 |
|
|
— |
|
|
186,835 |
|
|
Other |
|
|
10 years |
|
|
11,538 |
|
|
(11,103 |
) |
|
435 |
|
|
|
|
|
|
|
$ |
683,245 |
|
$ |
(53,322 |
) |
$ |
629,923 |
|
34
The balance as of October 30, 2009 reflects the final purchase price allocation related to the acquisition of Aries ($17,252 was reclassified from goodwill to other intangible assets, pretax). The balance as of October 31, 2008 reflects the final purchase price allocation related to the acquisition of TNC ($18,621 was reclassified from goodwill to other intangible assets, pretax).
Amortization lives are based on management’s estimates. Amortization lives for intangible assets range from 10 to 40 years. The remaining life averages for assets included in the Customer List and Other categories were 34 years and 5 years, respectively.
Total amortization expense was $7,575, $7,937 and $5,943 in 2009, 2008 and 2007, respectively. Estimated amortization expense for each of the five succeeding fiscal years based on intangible assets as of October 30, 2009 was approximately $7,500 annually.
NOTE 9 – STOCK-BASED COMPENSATION
Until February 2009, we had stock-based compensation plans comprised of stock options and restricted stock, which could be granted to officers, employees, non-employee directors and consultants. In February 2009, stockholders approved a new equity compensation plan, the 2009 Omnibus Equity Plan (Omnibus Plan). The new plan resulted in one pool of reserved shares that will be used for equity grants, totaling 5,229,684 shares, equal to the total reserved shares remaining under the previous equity compensation plans at the time the Omnibus Plan was approved. Under the new plan, equity compensation awarded through restricted stock reduces the pool of reserved shares at a multiple of 2.53 times the actual number of shares awarded. Stock option awards reduce the reserved shares pool at a rate equal to the number of options granted. Options generally have a contractual term of 10 years, vest ratably over three years or five years for employees and vest immediately upon grant for non-employee directors. Restricted shares vest after three or five years. The table below summarizes the stock option and restricted stock activity for the three years ended October 30, 2009.
|
|
|
|
|
|
|
|
|
|
|
|
|
|
|
|
|
|
|
|
|
|
|
|
|
Shares Reserved |
|
|
Shares Outstanding |
|
||||||||||||||
|
|
|
|
||||||||||||||||||
|
|
|
Total |
|
Stock |
|
Restricted |
|
|
Total |
|
Stock |
|
Restricted |
|
||||||
|
|
||||||||||||||||||||
|
Balance, October 27, 2006 |
|
|
7,562,143 |
|
|
5,275,255 |
|
|
2,286,888 |
|
|
|
12,420,104 |
|
|
12,045,507 |
|
|
374,597 |
|
|
Granted |
|
|
(1,424,816 |
) |
|
(1,396,250 |
) |
|
(28,566 |
) |
|
|
1,424,816 |
|
|
1,396,250 |
|
|
28,566 |
|
|
Exercised / Vested |
|
|
— |
|
|
— |
|
|
— |
|
|
|
(1,432,197 |
) |
|
(1,348,896 |
) |
|
(83,301 |
) |
|
Canceled / Forfeited |
|
|
243,337 |
|
|
219,057 |
|
|
24,280 |
|
|
|
(243,337 |
) |
|
(219,057 |
) |
|
(24,280 |
) |
|
|
||||||||||||||||||||
|
Balance, October 26, 2007 |
|
|
6,380,664 |
|
|
4,098,062 |
|
|
2,282,602 |
|
|
|
12,169,386 |
|
|
11,873,804 |
|
|
295,582 |
|
|
Granted |
|
|
(1,987,227 |
) |
|
(1,900,734 |
) |
|
(86,493 |
) |
|
|
1,987,227 |
|
|
1,900,734 |
|
|
86,493 |
|
|
Exercised / Vested |
|
|
— |
|
|
— |
|
|
— |
|
|
|
(1,284,179 |
) |
|
(1,179,702 |
) |
|
(104,477 |
) |
|
Canceled / Forfeited |
|
|
612,977 |
|
|
583,118 |
|
|
29,859 |
|
|
|
(612,977 |
) |
|
(583,118 |
) |
|
(29,859 |
) |
|
|
||||||||||||||||||||
|
Balance, October 31, 2008 |
|
|
5,006,414 |
|
|
2,780,446 |
|
|
2,225,968 |
|
|
|
12,259,457 |
|
|
12,011,718 |
|
|
247,739 |
|
|
Granted |
|
|
(1,908,442 |
) |
|
(1,776,650 |
) |
|
(131,792 |
) |
|
|
1,889,640 |
|
|
1,776,650 |
|
|
112,990 |
|
|
Exercised / Vested |
|
|
— |
|
|
— |
|
|
— |
|
|
|
(1,527,900 |
) |
|
(1,426,341 |
) |
|
(101,559 |
) |
|
Canceled / Forfeited |
|
|
384,590 |
|
|
384,590 |
|
|
— |
|
|
|
(384,590 |
) |
|
(384,590 |
) |
|
— |
|
|
|
||||||||||||||||||||
|
Balance, October 30, 2009 |
|
|
3,482,562 |
|
|
1,388,386 |
|
|
2,094,176 |
|
|
|
12,236,607 |
|
|
11,977,437 |
|
|
259,170 |
|
|
Exercisable |
|
|
|
|
|
|
|
|
|
|
|
|
8,576,291 |
|
|
8,576,291 |
|
|
N/A |
|
|
|
||||||||||||||||||||
Stock Options: Total stock-based compensation expense included in our Consolidated Statements of Income in fiscal 2009, 2008 and 2007 was $9,385 ($5,997 net of tax), $9,240 ($5,899 net of tax) and $11,575 ($7,324 net of tax), respectively. Awards to retirement-eligible employees are expensed at the grant date.
As of October 30, 2009, there was $11,338 of total unrecognized before-tax compensation cost related to non-vested awards that is expected to be recognized over a weighted-average period of 2.3 years.
35
Stock option activity for the three years ended October 30, 2009 is summarized as follows:
|
|
|
|
|
|
|
|
|
|
|
|
|
|
|
|
|
|
Options |
|
Weighted
Average |
|
Weighted
Average |
|
Aggregate |
|
||||
|
Balance, October 27, 2006 |
|
|
12,045,507 |
|
$ |
20.50 |
|
|
6.2 years |
|
$ |
74,535 |
|
|
Granted |
|
|
1,396,250 |
|
|
25.56 |
|
|
|
|
|
|
|
|
Exercised |
|
|
(1,348,896 |
) |
|
18.78 |
|
|
|
|
|
12,921 |
|
|
Canceled |
|
|
(219,057 |
) |
|
25.09 |
|
|
|
|
|
|
|
|
Balance, October 26, 2007 |
|
|
11,873,804 |
|
$ |
21.21 |
|
|
5.9 years |
|
$ |
44,605 |
|
|
Granted |
|
|
1,900,734 |
|
|
18.62 |
|
|
|
|
|
|
|
|
Exercised |
|
|
(1,179,702 |
) |
|
17.12 |
|
|
|
|
|
6,514 |
|
|
Canceled |
|
|
(583,118 |
) |
|
24.14 |
|
|
|
|
|
|
|
|
Balance, October 31, 2008 |
|
|
12,011,718 |
|
$ |
21.06 |
|
|
5.9 years |
|
$ |
17,036 |
|
|
Granted |
|
|
1,776,650 |
|
|
26.34 |
|
|
|
|
|
|
|
|
Exercised |
|
|
(1,426,341 |
) |
|
17.55 |
|
|
|
|
|
10,140 |
|
|
Canceled |
|
|
(384,590 |
) |
|
20.75 |
|
|
|
|
|
|
|
|
Balance, October 30, 2009 |
|
|
11,977,437 |
|
$ |
22.27 |
|
|
6.1 years |
|
$ |
41,073 |
|
|
Exercisable |
|
|
8,576,291 |
|
|
21.69 |
|
|
4.9 years |
|
|
33,314 |
|
Options exercisable of 8,936,910 at October 31, 2008 and 9,145,993 at October 26, 2007 had weighted average exercise prices of $20.82 and $19.99, respectively.
The total intrinsic value at October 30, 2009 is based on our closing stock price on the last trading day of the year for in-the-money options. The exercise prices of the options granted during these periods are equal to the market price of the underlying stock on the date of grant. The fair value of each option grant is estimated on the date of grant using the Black-Scholes option pricing model. The following table sets forth the weighted average fair values and assumptions on which the fair values are determined:
|
|
|
|
|
|
|
|
|
|
|
|
|
|
|
2009 |
|
2008 |
|
2007 |
|
|||
|
Expected dividend yield |
|
|
2.3 |
% |
|
3.0 |
% |
|
2.0 |
% |
|
Expected stock price volatility |
|
|
30.0 |
% |
|
27.9 |
% |
|
21.6 |
% |
|
Risk-free interest rate |
|
|
2.9 |
% |
|
3.4 |
% |
|
4.3 |
% |
|
Expected life of options |
|
|
6 years |
|
|
6 years |
|
|
6 years |
|
|
Weighted average fair value on the date of grant |
|
|
$ 6.89 |
|
|
$ 4.29 |
|
|
$ 5.95 |
|
Restricted Stock – We grant restricted stock to certain employees through our Omnibus Plan. Previously, we granted restricted stock to certain employees through share reserves under our Key Employee Bonus Plan and our Stock Incentive Plan. In February 2009, the share reserves under the Omnibus Plan replaced those reserves.
The following table sets forth a reconciliation of restricted shares for the three years ended October 30, 2009.
|
|
|
|
|
|
|
|
|
|
|
|
|
|
|
Shares |
|
Weighted
Average |
|
Aggregate |
|
|||
|
Balance, October 27, 2006 |
|
|
374,597 |
|
$ |
25.14 |
|
$ |
9,979 |
|
|
Granted |
|
|
28,566 |
|
|
26.30 |
|
|
751 |
|
|
Vested |
|
|
(83,301 |
) |
|
24.57 |
|
|
2,389 |
|
|
Forfeited |
|
|
(24,280 |
) |
|
26.20 |
|
|
(636 |
) |
|
|
|
|
|
|
|
|
|
|
|
|
|
Balance, October 26, 2007 |
|
|
295,582 |
|
$ |
25.32 |
|
$ |
7,262 |
|
|
Granted |
|
|
86,493 |
|
|
21.34 |
|
|
1,845 |
|
|
Vested |
|
|
(104,477 |
) |
|
23.91 |
|
|
2,138 |
|
|
Forfeited |
|
|
(29,859 |
) |
|
26.10 |
|
|
(779 |
) |
|
|
|
|
|
|
|
|
|
|
|
|
|
Balance, October 31, 2008 |
|
|
247,739 |
|
$ |
24.44 |
|
$ |
5,066 |
|
|
Granted |
|
|
112,990 |
|
|
18.66 |
|
|
2,109 |
|
|
Vested |
|
|
(101,559 |
) |
|
24.35 |
|
|
1,902 |
|
|
Forfeited |
|
|
— |
|
|
— |
|
|
— |
|
|
|
|
|
|
|
|
|
|
|
|
|
|
Balance, October 30, 2009 |
|
|
259,170 |
|
$ |
21.95 |
|
$ |
6,575 |
|
36
NOTE 10 – INCOME TAXES
Income before income taxes consisted of the following:
|
|
|
|
|
|
|
|
|
|
|
|
|
Year Ended |
|
2009 |
|
2008 |
|
2007 |
|
|||
|
Domestic |
|
$ |
163,737 |
|
$ |
161,556 |
|
$ |
190,598 |
|
|
Foreign |
|
|
74,591 |
|
|
67,141 |
|
|
69,173 |
|
|
|
|
$ |
238,328 |
|
$ |
228,697 |
|
$ |
259,771 |
|
Significant components of the provision for income taxes are as follows:
|
|
|
|
|
|
|
|
|
|
|
|
|
|
|
2009 |
|
2008 |
|
2007 |
|
|||
|
Current |
|
|
|
|
|
|
|
|
|
|
|
Federal |
|
$ |
34,038 |
|
$ |
53,256 |
|
$ |
61,183 |
|
|
State |
|
|
3,682 |
|
|
6,927 |
|
|
5,732 |
|
|
Foreign |
|
|
22,058 |
|
|
25,236 |
|
|
15,695 |
|
|
Total Current |
|
|
59,778 |
|
|
85,419 |
|
|
82,610 |
|
|
Deferred |
|
|
|
|
|
|
|
|
|
|
|
Federal |
|
|
12,618 |
|
|
(2,556 |
) |
|
232 |
|
|
State |
|
|
2,576 |
|
|
(777 |
) |
|
(6 |
) |
|
Foreign |
|
|
3,203 |
|
|
(4,155 |
) |
|
4,820 |
|
|
Total Deferred |
|
|
18,397 |
|
|
(7,488 |
) |
|
5,046 |
|
|
Total Income Taxes |
|
$ |
78,175 |
|
$ |
77,931 |
|
$ |
87,656 |
|
Significant components of our deferred tax assets and liabilities are as follows:
|
|
|
|
|
|
|
|
|
|
|
|
|
|
|
2009 |
|
2008 |
|
2007 |
|
|||
|
Deferred tax assets: |
|
|
|
|
|
|
|
|
|
|
|
Product liability accruals |
|
$ |
4,456 |
|
$ |
4,690 |
|
$ |
4,476 |
|
|
Insurance accruals |
|
|
3,630 |
|
|
3,431 |
|
|
3,387 |
|
|
Deferred compensation |
|
|
21,805 |
|
|
18,857 |
|
|
17,418 |
|
|
Deferred revenue |
|
|
11,226 |
|
|
11,819 |
|
|
10,451 |
|
|
Workers’ compensation accruals |
|
|
1,460 |
|
|
1,465 |
|
|
1,508 |
|
|
Employee compensation accruals |
|
|
3,260 |
|
|
3,054 |
|
|
6,634 |
|
|
Pension |
|
|
24,908 |
|
|
11,502 |
|
|
3,775 |
|
|
Other |
|
|
49,414 |
|
|
51,901 |
|
|
27,003 |
|
|
Total deferred tax assets |
|
|
120,159 |
|
|
106,719 |
|
|
74,652 |
|
|
Deferred tax liabilities: |
|
|
|
|
|
|
|
|
|
|
|
Tax in excess of book depreciation |
|
|
(43,606 |
) |
|
(34,057 |
) |
|
(34,263 |
) |
|
Amortization |
|
|
(251,592 |
) |
|
(242,009 |
) |
|
(232,100 |
) |
|
Other |
|
|
(23,254 |
) |
|
(21,643 |
) |
|
(20,775 |
) |
|
Total deferred tax liabilities |
|
|
(318,452 |
) |
|
(297,709 |
) |
|
(287,138 |
) |
|
Net deferred tax liabilities |
|
$ |
(198,293 |
) |
$ |
(190,990 |
) |
$ |
(212,486 |
) |
A reconciliation of income tax computed at the U.S. federal statutory tax rate to the effective income tax rate is as follows:
|
|
|
|
|
|
|
|
|
|
|
|
|
|
|
2009 |
|
2008 |
|
2007 |
|
|||
|
Tax at U.S. statutory rate |
|
|
35.0 |
% |
|
35.0 |
% |
|
35.0 |
% |
|
State income taxes, net of federal benefit |
|
|
1.7 |
% |
|
2.2 |
% |
|
1.5 |
% |
|
Non-U.S. taxes |
|
|
(1.2 |
%) |
|
(1.7 |
%) |
|
(1.7 |
%) |
|
Other |
|
|
(2.7 |
%) |
|
(1.4 |
%) |
|
(1.1 |
%) |
|
|
|
|
32.8 |
% |
|
34.1 |
% |
|
33.7 |
% |
No provision has been made for U.S. federal income taxes on certain undistributed earnings of foreign subsidiaries that we intend to permanently invest or that may be remitted substantially tax-free. The total of undistributed earnings that would be subject to federal income tax if remitted under existing law is approximately $296,337 at October 30, 2009. Determination of the unrecognized deferred tax liability related to these earnings is not practicable because of the complexities with its hypothetical calculation. Upon distribution of these earnings, we will be subject to U.S. taxes and withholding taxes payable to various foreign governments. A credit for foreign taxes already paid would be available to reduce the U.S. tax liability.
Income taxes paid during 2009, 2008 and 2007 were $78,946, $58,755 and $105,084, respectively.
37
At each period end, it is necessary for us to make certain estimates and assumptions to compute the provision for income taxes including, but not limited to the expected operating income (or loss) for the year, projections of the proportion of income (or loss) earned and taxed in the foreign jurisdictions and the extent to which this income (or loss) may also be taxed in the United States, permanent and temporary differences, the likelihood of deferred tax assets being realized and the outcome of uncertain tax positions. Our income tax returns, like those of most companies, are periodically audited by domestic and foreign tax authorities. These audits include questions regarding our tax filing positions, including the timing and amount of deductions and the allocation of income among various tax jurisdictions. At any one time, multiple tax years are subject to audit by the various tax authorities. We record an accrual for uncertain tax positions after evaluating the positions associated with our various income tax filings. A number of years may elapse before a particular matter for which we have established an accrual is audited and fully resolved or clarified. We adjust our tax contingencies accrual and income tax provision in the period in which matters are effectively settled with tax authorities at amounts different from our established accrual, the statute of limitations expires for the relevant taxing authority to examine the tax position or when more information becomes available.
We adopted the amended provisions of ASC Topic 740, Income Taxes, at the beginning of fiscal year 2008, on October 27, 2007. As a result of the adoption, we recorded a cumulative effect adjustment of $10,757, increasing our liability for unrecognized tax benefits, interest and penalties and reducing the October 27, 2007 retained earnings balance.
A reconciliation of the beginning and ending amount of gross unrecognized tax benefits (excluding interest and penalties) for fiscal year 2008 and 2009 is as follows:
|
|
|
|
|
|
|
Gross unrecognized tax benefits at October 27, 2007 |
|
$ |
47,504 |
|
|
Increases in tax positions for prior years |
|
|
— |
|
|
Decreases in tax positions for prior years |
|
|
(799 |
) |
|
Increases in tax positions for current year |
|
|
3,222 |
|
|
Settlements |
|
|
— |
|
|
Lapse in statute of limitations |
|
|
(5,130 |
) |
|
Gross unrecognized tax benefits at October 31, 2008 |
|
$ |
44,797 |
|
|
Increases in tax positions for prior years |
|
|
170 |
|
|
Decreases in tax positions for prior years |
|
|
(7,176 |
) |
|
Increases in tax positions for current year |
|
|
2,649 |
|
|
Settlements |
|
|
(388 |
) |
|
Lapse in statute of limitations |
|
|
(6,655 |
) |
|
Gross unrecognized tax benefits at October 30, 2009 |
|
$ |
33,397 |
|
We recognize interest and penalties related to unrecognized tax benefits in income tax expense. We had recognized accrued interest and penalties relating to unrecognized tax benefits of $13,196 and $12,397 as of October 30, 2009 and October 31, 2008 respectively. The gross amount of interest and penalties included in tax expense for the year ended October 30, 2009 was $799.
The total amount of unrecognized tax benefits that would affect our effective tax rate if recognized was $29,907 and $31,977 as of October 30, 2009 and October 31, 2008 respectively.
The Company and its subsidiaries file income tax returns in the U.S. federal jurisdiction, and numerous state and foreign jurisdictions. With few exceptions, we are no longer subject to U.S. federal, state and local, or non-U.S. income tax examinations by tax authorities for years before 2004. The Internal Revenue Service (IRS) concluded its examination of our U.S. federal tax returns for the fiscal years ended 2004 and 2005 in April 2008. There were no material adjustments to our income tax expense or balance of unrecognized tax benefits as a result of the IRS examination. We are currently under audit in several state and foreign jurisdictions. We also expect various statutes of limitation to expire during the next 12 months. Due to the uncertain response of taxing authorities, a range of outcomes cannot be reasonably estimated at this time.
NOTE 11 – LEASING ARRANGEMENTS
We have operating lease commitments outstanding at October 30, 2009, for plant and warehouse equipment, office and warehouse space and automobiles. The leases have initial periods ranging from one to ten years, with minimum future rental payments as follows:
|
|
|
|
|
|
|
|
|
Minimum |
|
|
|
2010 |
|
$ |
16,523 |
|
|
2011 |
|
|
13,273 |
|
|
2012 |
|
|
10,989 |
|
|
2013 |
|
|
7,974 |
|
|
2014 |
|
|
7,142 |
|
|
2015 and beyond |
|
|
12,699 |
|
|
|
|
$ |
68,600 |
|
Rent expense for operating leases was $22,885 in 2009, $24,604 in 2008 and $22,597 in 2007.
NOTE 12 – LITIGATION
We are involved in a variety of legal claims and proceedings relating to personal injury, product liability, warranties, customer contracts, employment, trade practices, environmental and other legal matters that arise in the normal course of business. These claims and proceedings include cases where we are one of a number of defendants in proceedings alleging that the plaintiffs suffered injuries or contracted diseases from exposure to chemicals or other ingredients used in the production of some of our products or waste disposal. We believe these claims and proceedings are not out of the ordinary course for a business of the type and size in which we are engaged. While we are unable to predict the ultimate outcome of these claims and proceedings, management believes there is not a reasonable possibility that the costs and liabilities of such matters, individually or in the aggregate, will have a material adverse effect on our financial condition or results of operations.
38
NOTE 13 – PENSIONS AND OTHER POSTRETIREMENT BENEFITS
Savings and Retirement Plan: We sponsor a Savings and Retirement Plan for substantially all of our U.S. employees. Under the Plan, we match employee contributions up to a maximum match of 3% of employees’ compensation. In addition to matching employees’ contributions throughout the year, there is a year-end contribution that can range from 4% to 13% of eligible employees’ pay as defined in the Plan. Employees that are not eligible for the Savings and Retirement Plan have the option to participate in the 401(k) Employee Stock Ownership Plan. We match employee contributions (up to a maximum match of 3% of employees’ compensation), and based on our financial performance there is a discretionary match that can range from 0-3%. Contributions to the Plans totaled $28,517, $23,855, and $21,490, for 2009, 2008 and 2007, respectively.
Executive Retirement Plans: We have a limited number of Supplemental Executive Retirement Plans (SERPs) to provide designated executives with retirement, death and disability benefits. Annual benefits under the SERPs are based on years of service and individual compensation near retirement.
Pension and Post-Retirement Medical Plans: We also sponsor several defined benefit pension plans for certain hourly and salaried employees. The benefits for most of these plans are generally based on stated amounts for each year of service. We fund the plans in amounts consistent with the limits of allowable tax deductions. During fiscal year 2009, we made discretionary contributions of approximately $21,992 to our pension plans. We also sponsor a post-retirement medical plan that provides subsidized medical benefits for eligible retired employees and their eligible dependents. The plan changed on January 1, 2009 to eliminate the subsidy for future retirees with the exception of a small group of employees near retirement that will still be eligible for the subsidized coverage at retirement. A 1% increase in the medical trend rates would not have a material effect on post-retirement medical expense or the post-retirement benefit obligation. For the fiscal year ending October 29, 2010, we expect our total contributions to our funded pension plans, unfunded pension, non-qualified plans and post-retirement medical plans to be at least $1,700.
Effective for our fiscal year ending October 30, 2009, we have adopted all provisions related to the accounting and disclosure for employers’ defined benefit pension and other post retirement plans. We adopted the recognition and disclosure provisions in fiscal year 2007. In fiscal year 2009, we were required to measure the plans’ assets and obligations that determine our funded status as of the end of our fiscal year. Previously our measurement date was July 31. We elected to use the Alternate method to transition to the new measurement date. Under this method, the expense is calculated based on a 15-month period from July 31, 2008 to October 30, 2009 and is prorated to assign costs to the three-month adjustment period (adjustment to retained earnings) and the twelve-month period, which is our fiscal year 2009 expense. The adoption of this requirement did not have a material effect on our 2009 financial condition or results of operations.
The cost of pension and post-retirement medical benefits is as follows:
|
|
|
|
|
|
|
|
|
|
|
|
|
|
|
Pension |
|
|||||||
|
Net Periodic Benefit Cost |
|
2009 |
|
2008 |
|
2007 |
|
|||
|
Service cost |
|
$ |
2,748 |
|
$ |
3,774 |
|
$ |
3,593 |
|
|
Interest cost |
|
|
13,356 |
|
|
13,447 |
|
|
12,697 |
|
|
Expected return on plan assets |
|
|
(15,487 |
) |
|
(15,670 |
) |
|
(14,969 |
) |
|
Amortization of transition asset obligation |
|
|
— |
|
|
(34 |
) |
|
(125 |
) |
|
Amortization of prior service cost |
|
|
617 |
|
|
733 |
|
|
673 |
|
|
Recognized actuarial loss |
|
|
2,043 |
|
|
3,033 |
|
|
3,511 |
|
|
Settlement loss |
|
|
2,102 |
|
|
— |
|
|
— |
|
|
Curtailment |
|
|
(740 |
) |
|
(33 |
) |
|
— |
|
|
Net periodic benefit cost |
|
$ |
4,639 |
|
$ |
5,250 |
|
$ |
5,380 |
|
|
|
|
|
|
|
|
|
|
|
|
|
|
|
|
Post-Retirement Medical |
|
|||||||
|
Net Periodic Benefit Cost |
|
2009 |
|
2008 |
|
2007 |
|
|||
|
Service cost |
|
$ |
283 |
|
$ |
1,168 |
|
$ |
819 |
|
|
Interest cost |
|
|
599 |
|
|
928 |
|
|
715 |
|
|
Expected return on plan assets |
|
|
N/A |
|
|
N/A |
|
|
N/A |
|
|
Amortization of prior service cost |
|
|
(3,786 |
) |
|
(82 |
) |
|
(128 |
) |
|
Recognized actuarial loss |
|
|
3,215 |
|
|
388 |
|
|
253 |
|
|
Net periodic benefit cost |
|
$ |
311 |
|
$ |
2,402 |
|
$ |
1,659 |
|
The plans’ funded status is shown below, along with a description of how the status changed during the past two years. The benefit obligation is the projected benefit obligation—the actuarial present value, as of a date, of all benefits attributed by the pension benefit formula to employee service rendered prior to that date. In certain countries outside the U.S., fully funding pension plans is not a common practice, as funding provides no economic benefit.
|
|
|
|
|
|
|
|
|
|
|
|
|
|
|
|
|
|
Pension |
|
Post-Retirement Medical |
|
||||||||
|
|
|
|
|||||||||||
|
Change in Benefit Obligation |
|
2009 |
|
2008 |
|
2009 |
|
2008 |
|
||||
|
Benefit obligation beginning of year |
|
$ |
209,848 |
|
$ |
226,044 |
|
$ |
9,324 |
|
$ |
15,272 |
|
|
Service cost |
|
|
2,748 |
|
|
3,774 |
|
|
283 |
|
|
1,168 |
|
|
Interest cost |
|
|
13,356 |
|
|
13,447 |
|
|
599 |
|
|
928 |
|
|
Plan participants’ contributions |
|
|
485 |
|
|
527 |
|
|
— |
|
|
— |
|
|
Plan amendments |
|
|
136 |
|
|
455 |
|
|
— |
|
|
(7,797 |
) |
|
Actuarial loss (gain) |
|
|
28,651 |
|
|
(17,921 |
) |
|
1,262 |
|
|
1,240 |
|
|
Benefits paid |
|
|
(15,196 |
) |
|
(10,733 |
) |
|
(1,501 |
) |
|
(1,487 |
) |
|
Currency impact |
|
|
(2,383 |
) |
|
(5,745 |
) |
|
— |
|
|
— |
|
|
Settlement loss |
|
|
549 |
|
|
— |
|
|
— |
|
|
— |
|
|
Curtailment |
|
|
(995 |
) |
|
— |
|
|
— |
|
|
— |
|
|
Change in measurement date |
|
|
861 |
|
|
— |
|
|
608 |
|
|
— |
|
|
Benefit obligation at end of year |
|
$ |
238,060 |
|
$ |
209,848 |
|
$ |
10,575 |
|
$ |
9,324 |
|
39
|
|
|
|
|
|
|
|
|
|
|
|
|
|
|
|
|
|
Pension |
|
Post-Retirement Medical |
|
||||||||
|
|
|
|
|||||||||||
|
Change in Plan Assets |
|
2009 |
|
2008 |
|
2009 |
|
2008 |
|
||||
|
Fair value of plan assets at beginning of year |
|
$ |
176,393 |
|
$ |
204,121 |
|
$ |
— |
|
$ |
— |
|
|
Actual return on plan assets |
|
|
(16,932 |
) |
|
(14,648 |
) |
|
— |
|
|
— |
|
|
Employer contributions |
|
|
21,992 |
|
|
2,613 |
|
|
1,501 |
|
|
1,487 |
|
|
Plan participants’ contributions |
|
|
485 |
|
|
527 |
|
|
— |
|
|
— |
|
|
Benefit payments |
|
|
(15,196 |
) |
|
(10,733 |
) |
|
(1,501 |
) |
|
(1,487 |
) |
|
Currency impact |
|
|
(2,959 |
) |
|
(5,487 |
) |
|
— |
|
|
— |
|
|
Change in measurement date |
|
|
3,430 |
|
|
— |
|
|
— |
|
|
— |
|
|
Fair value of assets at end of year |
|
$ |
167,213 |
|
$ |
176,393 |
|
$ |
— |
|
$ |
— |
|
|
|
|
|
|
|
|
|
|
|
|
|
|
|
|
|
|
|
Pension |
|
Post-Retirement Medical |
|
||||||||
|
|
|
|
|||||||||||
|
Funded Status |
|
2009 |
|
2008 |
|
2009 |
|
2008 |
|
||||
|
Projected benefit obligation |
|
$ |
(238,060 |
) |
$ |
(209,848 |
) |
$ |
(10,575 |
) |
$ |
(9,324 |
) |
|
Plan assets at fair value |
|
|
167,213 |
|
|
176,393 |
|
|
— |
|
|
— |
|
|
Company contributions after measurement date |
|
|
— |
|
|
167 |
|
|
— |
|
|
— |
|
|
Benefits paid after measurement date |
|
|
— |
|
|
65 |
|
|
— |
|
|
— |
|
|
Net funded status – over (under) |
|
$ |
(70,847 |
) |
$ |
(33,223 |
) |
$ |
(10,575 |
) |
$ |
(9,324 |
) |
|
Funded status – overfunded plans |
|
$ |
— |
|
$ |
— |
|
$ |
— |
|
$ |
— |
|
|
Funded status – underfunded plans |
|
|
(70,847 |
) |
|
(33,223 |
) |
|
(10,575 |
) |
|
(9,324 |
) |
|
|
|
|
|
|
|
|
|
|
|
|
|
|
|
|
|
|
Pension |
|
Post-Retirement Medical |
|
||||||||
|
|
|
|
|||||||||||
|
Amounts Recognized in Balance Sheet: |
|
2009 |
|
2008 |
|
2009 |
|
2008 |
|
||||
|
Noncurrent assets |
|
$ |
— |
|
$ |
— |
|
$ |
— |
|
$ |
— |
|
|
Current liabilities |
|
|
(461 |
) |
|
(505 |
) |
|
(1,075 |
) |
|
(866 |
) |
|
Noncurrent liabilities |
|
|
(70,386 |
) |
|
(32,718 |
) |
|
(9,500 |
) |
|
(8,458 |
) |
|
|
|
|
|
|
|
|
|
|
|
|
|
|
|
|
|
|
Pension |
|
Post-Retirement Medical |
|
||||||||
|
|
|
|
|||||||||||
|
Amounts in Accumulated Other Comprehensive Income: |
|
2009 |
|
2008 |
|
2009 |
|
2008 |
|
||||
|
Net (gain) / loss |
|
$ |
117,883 |
|
$ |
63,711 |
|
$ |
5,465 |
|
$ |
7,363 |
|
|
Net prior service cost (credit) |
|
|
4,387 |
|
|
5,156 |
|
|
(3,694 |
) |
|
(8,427 |
) |
|
Net transition obligation / (asset) |
|
|
— |
|
|
— |
|
|
— |
|
|
— |
|
|
Other comprehensive income – total |
|
|
122,270 |
|
|
68,867 |
|
|
1,771 |
|
|
(1,064 |
) |
|
|
|
|
|
|
|
|
|
|
|
|
|
|
|
|
|
|
Pension |
|
Post-Retirement Medical |
|
||||||||
|
|
|
|
|||||||||||
|
Amortization Expense Expected to be Recognized During Next Fiscal Year |
|
2009 |
|
2008 |
|
2009 |
|
2008 |
|
||||
|
Prior service cost (credits) |
|
$ |
456 |
|
$ |
615 |
|
$ |
(2,872 |
) |
$ |
(3,786 |
) |
|
Net loss |
|
|
4,927 |
|
|
2,048 |
|
|
2,629 |
|
|
3,215 |
|
|
Transition obligation (asset) |
|
|
— |
|
|
— |
|
|
— |
|
|
— |
|
Our pension and post-retirement medical plans with accumulated benefit obligations in excess of Plan Assets were as follows:
|
|
|
|
|
|
|
|
|
|
|
|
|
|
|
|
|
|
Pension |
|
Post-Retirement Medical |
|
||||||||
|
|
|
|
|||||||||||
|
|
|
2009 |
|
2008 |
|
2009 |
|
2008 |
|
||||
|
Projected /accumulated post-retirement benefit obligation |
|
$ |
238,060 |
|
$ |
177,658 |
|
$ |
10,575 |
|
$ |
9,324 |
|
|
Accumulated benefit obligation |
|
|
230,444 |
|
|
170,228 |
|
|
N/A |
|
|
N/A |
|
|
Fair value of plan assets |
|
|
167,213 |
|
|
144,443 |
|
|
— |
|
|
— |
|
Our pension plans with projected benefit obligations in excess of Plan Assets were as follows:
|
|
|
|
|
|
|
|
|
|
|
|
|
|
|
|
|
|
Pension |
|
Post-Retirement Medical |
|
||||||||
|
|
|
|
|||||||||||
|
|
|
2009 |
|
2008 |
|
2009 |
|
2008 |
|
||||
|
Projected benefit obligation |
|
$ |
238,060 |
|
$ |
209,848 |
|
|
N/A |
|
|
N/A |
|
|
Accumulated benefit obligation |
|
|
230,444 |
|
|
201,344 |
|
|
N/A |
|
|
N/A |
|
|
Fair value of plan assets |
|
|
167,213 |
|
|
176,393 |
|
|
N/A |
|
|
N/A |
|
We did not have any pension plans with projected benefit obligations less than Plan Assets as of October 30, 2009 or October 31, 2008.
40
Actuarial Assumptions: We determine our actuarial assumptions on an annual basis. These assumptions are weighted to reflect each country with requirements that may have an impact on the cost of providing retirement benefits.
|
|
|
|
|
|
|
|
|
|
|
|
|
|
|
|
|
|
Pension |
|
Post-Retirement Medical |
|
||||||||
|
|
|
|
|||||||||||
|
Assumption ranges used in net periodic benefit cost |
|
|
2009 |
|
|
2008 |
|
|
2009 |
|
|
2008 |
|
|
Discount rate |
|
|
6.00% – 7.00% |
|
|
5.25% – 6.50% |
|
|
6.75% |
|
|
6.25% |
|
|
Expected long-term return on plan assets |
|
|
6.50% – 8.50% |
|
|
5.75% – 8.50% |
|
|
N/A |
|
|
N/A |
|
|
Average increase in compensation |
|
|
2.25% – 4.25% |
|
|
2.25% – 4.25% |
|
|
N/A |
|
|
N/A |
|
|
Initial medical trend rate |
|
|
N/A |
|
|
N/A |
|
|
8.00% |
|
|
9.00% |
|
|
Ultimate medical trend rate |
|
|
N/A |
|
|
N/A |
|
|
5.00% |
|
|
5.00% |
|
|
Years to ultimate rate |
|
|
N/A |
|
|
N/A |
|
|
3 Years |
|
|
4 Years |
|
|
|
|
|
|
|
|
|
|
|
|
|
|
|
|
|
|
|
Pension |
|
Post-Retirement Medical |
|
||||||||
|
|
|
|
|||||||||||
|
Assumption ranges used to determine benefit obligation: |
|
|
2009 |
|
|
2008 |
|
|
2009 |
|
|
2008 |
|
|
Discount rate |
|
|
5.50% – 6.75% |
|
|
6.00% – 7.00% |
|
|
4.75% |
|
|
6.75% |
|
|
Rate of compensation increase |
|
|
2.25% – 4.00% |
|
|
2.25% – 4.25% |
|
|
N/A |
|
|
N/A |
|
|
Initial medical trend rate |
|
|
N/A |
|
|
N/A |
|
|
7.00% |
|
|
8.00% |
|
|
Ultimate medical trend rate |
|
|
N/A |
|
|
N/A |
|
|
5.00% |
|
|
5.00% |
|
|
Years to ultimate rate |
|
|
N/A |
|
|
N/A |
|
|
2 Years |
|
|
3 Years |
|
Investment Strategy: We have a master trust that holds the assets for all the U.S. pension plans. For investment purposes the plans are managed in an identical way, as their objectives are similar. The Benefit Funds Investment Committee, along with assistance from external consultants, sets investment guidelines and makes asset allocation decisions. These are established based on market conditions, risk tolerance, funding requirements and expected benefit payments. The Committee also oversees the selection of investment managers and monitors asset performance. As pension liabilities are long-term in nature, the Committee employs a long-term rate of return on plan assets approach for a prudent level of risk. Historical returns are considered as well as advice from investment experts. Annually, the Committee and the consultants review the risk versus the return of the investment portfolio to assess the long-term rate of return assumption.
The U.S. investment portfolio contains a diversified portfolio of investment categories, including domestic and international equities and short and long-term fixed income securities. Among the equity investments there is also diversity of style, growth versus value. Plan assets did not include investments in our stock as of the reported dates. The Committee believes with prudent risk tolerance and asset diversification, the plans should be able to meet their pension obligations in the future.
The weighted average asset allocations for the past two fiscal years by asset category are as follows:
|
|
|
|
|
|
|
|
|
|
|
|
|
|
|
Pension Plans |
|
|||||||
|
|
|
|||||||||
|
Asset Allocation |
|
2009 |
|
2008 |
|
Target |
|
|||
|
Equity securities |
|
|
57% |
|
|
58% |
|
|
50 – 60% |
|
|
Debt securities |
|
|
39% |
|
|
39% |
|
|
40 – 50% |
|
|
Other |
|
|
4% |
|
|
3% |
|
|
0% |
|
|
Total |
|
|
100% |
|
|
100% |
|
|
100% |
|
Estimated Future Benefits: The following benefit payments, which reflect expected future service, as appropriate, are expected to be paid as follows:
|
|
|
|
|
|
|
|
|
|
|
|
Pension |
|
Post-retirement |
|
||
|
2010 |
|
$ |
11,617 |
|
$ |
1,100 |
|
|
2011 |
|
|
11,797 |
|
|
1,268 |
|
|
2012 |
|
|
12,110 |
|
|
1,322 |
|
|
2013 |
|
|
12,438 |
|
|
1,316 |
|
|
2014 |
|
|
12,887 |
|
|
1,254 |
|
|
2015 – 2019 |
|
|
71,390 |
|
|
3,780 |
|
|
|
|
$ |
132,239 |
|
$ |
10,040 |
|
NOTE 14 – SEGMENT INFORMATION
Based on the nature of our products, technology, manufacturing processes, customers and regulatory environment, we aggregate our operating segments into two reportable segments: Coatings and Paints. We are required to report segment information in the same way that management internally organizes its business for assessing performance and making decisions regarding allocation of resources. We evaluate the performance of operating segments and allocate resources based on profit or loss from operations before interest expense and taxes (EBIT).
The Coatings segment aggregates our industrial and packaging product lines. Industrial products include a broad range of decorative and protective coatings for metal, wood and plastic. Packaging products include both interior and exterior coatings used in metal packaging containers, principally food containers and beverage cans. The products of this segment are sold throughout the world.
The Paints segment aggregates our architectural and automotive refinish product lines. Architectural products include interior and exterior decorative paints, primers, varnishes, high performance floor paints and specialty decorative products, such as enamels, aerosols and faux varnishes for the do-it-yourself and professional markets in North America and China.
41
Our remaining activities are included in All Other. These activities include specialty polymers and colorants that are used internally and sold to other coatings manufacturers, as well as gelcoats and related products and furniture protection plans. Also included within All Other are our Corporate administrative expenses. The administrative expenses include interest and amortization expense, certain environmental-related expenses and other expenses not directly allocated to any other operating segment.
In the following table, sales between segments are recorded at selling prices that are below market prices, generally intended to recover internal costs. Segment EBIT includes income realized on inter-segment sales. Identifiable assets are those directly identified with each reportable segment. Corporate assets included within All Other include cash and cash equivalents, deferred pension assets, intangibles and the headquarters property, plant and equipment. The accounting policies of the reportable segments are the same as those described in Note 1. Comparative segment data for fiscal years 2009, 2008 and 2007 are as follows:
|
|
|
|
|
|
|
|
|
|
|
|
|
|
|
2009 |
|
2008 |
|
2007 |
|
|||
|
Net Sales: |
|
|
|
|
|
|
|
|
|
|
|
Coatings |
|
$ |
1,582,786 |
|
$ |
2,053,747 |
|
$ |
1,851,687 |
|
|
Paints |
|
|
1,072,372 |
|
|
1,127,073 |
|
|
1,088,819 |
|
|
All Other |
|
|
316,251 |
|
|
404,721 |
|
|
421,382 |
|
|
Less Intersegment sales |
|
|
(92,367 |
) |
|
(103,163 |
) |
|
(112,601 |
) |
|
|
|
$ |
2,879,042 |
|
$ |
3,482,378 |
|
$ |
3,249,287 |
|
|
|
|
|
|
|
|
|
|
|
|
|
|
|
|
2009 |
|
2008 |
|
2007 |
|
|||
|
EBIT: |
|
|
|
|
|
|
|
|
|
|
|
Coatings |
|
$ |
185,528 |
|
$ |
188,267 |
|
$ |
198,073 |
|
|
Paints |
|
|
135,561 |
|
|
94,587 |
|
|
105,947 |
|
|
All Other |
|
|
(32,367 |
) |
|
3,588 |
|
|
17,413 |
|
|
Total EBIT |
|
$ |
288,722 |
|
$ |
286,442 |
|
$ |
321,433 |
|
|
Interest Expense |
|
$ |
50,394 |
|
$ |
57,745 |
|
$ |
61,662 |
|
|
Income before Income Taxes |
|
$ |
238,328 |
|
$ |
228,697 |
|
$ |
259,771 |
|
|
|
|
|
|
|
|
|
|
|||
|
|
|
2009 |
|
2008 |
|
2007 |
|
|||
|
Depreciation and Amortization: |
|
|
|
|
|
|
|
|
|
|
|
Coatings |
|
$ |
45,439 |
|
$ |
46,715 |
|
$ |
39,427 |
|
|
Paints |
|
|
18,566 |
|
|
16,891 |
|
|
15,660 |
|
|
All Other |
|
|
18,857 |
|
|
17,225 |
|
|
16,724 |
|
|
|
|
$ |
82,862 |
|
$ |
80,831 |
|
$ |
71,811 |
|
|
|
|
|
|
|
|
|
|
|||
|
|
|
2009 |
|
2008 |
|
2007 |
|
|||
|
Identifiable Assets: |
|
|
|
|
|
|
|
|
|
|
|
Coatings |
|
$ |
2,293,130 |
|
$ |
2,379,946 |
|
$ |
2,337,518 |
|
|
Paints |
|
|
818,732 |
|
|
847,285 |
|
|
764,051 |
|
|
All Other * |
|
|
399,162 |
|
|
292,811 |
|
|
350,712 |
|
|
|
|
$ |
3,511,024 |
|
$ |
3,520,042 |
|
$ |
3,452,281 |
|
*Includes our consolidated cash and cash equivalent balances
|
|
|
|
|
|
|
|
|
|
|
|
|
|
|
2009 |
|
2008 |
|
2007 |
|
|||
|
Capital Expenditures: |
|
|
|
|
|
|
|
|
|
|
|
Coatings |
|
$ |
25,761 |
|
$ |
24,059 |
|
$ |
46,348 |
|
|
Paints |
|
|
8,047 |
|
|
6,338 |
|
|
15,643 |
|
|
All Other |
|
|
24,089 |
|
|
12,648 |
|
|
14,949 |
|
|
|
|
$ |
57,897 |
|
$ |
43,045 |
|
$ |
76,940 |
|
Geographic net sales are based on the country from which the customer was billed for the products sold. The United States is the largest country for customer sales. China is the only country outside of the United States that represents more than 10% of consolidated sales. Long-lived assets include property, plant and equipment, intangibles and goodwill attributable to each country’s operations. Net sales and long-lived assets by geographic region are as follows:
|
|
|
|
|
|
|
|
|
|
|
|
|
|
|
2009 |
|
2008 |
|
2007 |
|
|||
|
Net Sales – External: |
|
|
|
|
|
|
|
|
|
|
|
United States |
|
$ |
1,790,084 |
|
$ |
2,067,337 |
|
$ |
2,053,810 |
|
|
China |
|
|
328,634 |
|
|
381,419 |
|
|
328,750 |
|
|
Other Countries |
|
|
760,324 |
|
|
1,033,622 |
|
|
866,727 |
|
|
|
|
$ |
2,879,042 |
|
$ |
3,482,378 |
|
$ |
3,249,287 |
|
|
|
|
|
|
|
|
|
|
|
|
|
|
|
|
|
2009 |
|
|
2008 |
|
|
2007 |
|
|
Long-lived Assets: |
|
|
|
|
|
|
|
|
|
|
|
United States |
|
$ |
1,513,885 |
|
$ |
1,531,575 |
|
$ |
1,559,735 |
|
|
China |
|
|
459,004 |
|
|
462,318 |
|
|
423,111 |
|
|
Other Countries |
|
|
466,119 |
|
|
468,104 |
|
|
421,150 |
|
|
|
|
$ |
2,439,008 |
|
$ |
2,461,997 |
|
$ |
2,403,996 |
|
We have one significant customer in the Paints segment whose net sales ranged from 16.0% to 20.1% of total sales over the last three years.
42
NOTE 15 – RESTRUCTURING
During the third quarter of 2008, we initiated a comprehensive series of actions to lower our cost structure and further increase our operational efficiency. During the first quarter of 2009, we expanded these restructuring activities. We expect the total restructuring cost to be $0.35 to $0.38 per share after tax. The restructuring activities in 2009 resulted in pre-tax charges of $28,557 or $0.18 per share after tax. The restructuring activities in 2008 resulted in pre-tax charges of $23,454 or $0.16 per share after tax. The remaining restructuring charges to be incurred in 2010 are primarily in the Coatings and Paints segments. We plan to pay the remaining restructuring liabilities by the middle of fiscal year 2010.
The restructuring initiatives included plant closures, reductions to research and development and selling and administrative expenses, manufacturing consolidation and relocation, and the exit of non-strategic product lines in certain geographies. We have reduced manufacturing capacity and our overall global head-count to lower our costs in light of challenging global economic conditions.
The following net restructuring and impairment charges by segment were recorded in 2009 and 2008:
Year Ended October 30, 2009
|
|
|
|
|
|
|
|
|
|
|
|
|
|
|
|
|
|
Liability |
|
Expense |
|
Activity |
|
Liability |
|
||||
|
Coatings |
|
|
|
|
|
|
|
|
|
|
|
|
|
|
Severance and employee benefits |
|
$ |
7,842 |
|
$ |
12,339 |
|
$ |
(18,487 |
) |
$ |
1,694 |
|
|
Asset impairments |
|
|
— |
|
|
3,417 |
|
|
(3,417 |
) |
|
— |
|
|
Exit costs (consulting/site clean-up) |
|
|
423 |
|
|
2,010 |
|
|
(1,421 |
) |
|
1,012 |
|
|
Contract term costs (leases) |
|
|
— |
|
|
471 |
|
|
(471 |
) |
|
— |
|
|
Total Coatings |
|
|
8,265 |
|
|
18,237 |
|
|
(23,796 |
) |
|
2,706 |
|
|
|
|
|
|
|
|
|
|
|
|
|
|
|
|
|
Paints |
|
|
|
|
|
|
|
|
|
|
|
|
|
|
Severance and employee benefits |
|
|
— |
|
|
1,374 |
|
|
(547 |
) |
|
827 |
|
|
Asset impairments |
|
|
— |
|
|
1,935 |
|
|
(1,935 |
) |
|
— |
|
|
Exit costs (consulting/site clean-up) |
|
|
2,252 |
|
|
1,120 |
|
|
(816 |
) |
|
2,556 |
|
|
Contract term costs (leases) |
|
|
— |
|
|
— |
|
|
— |
|
|
— |
|
|
Total Paints |
|
|
2,252 |
|
|
4,429 |
|
|
(3,298 |
) |
|
3,383 |
|
|
|
|
|
|
|
|
|
|
|
|
|
|
|
|
|
All Other |
|
|
|
|
|
|
|
|
|
|
|
|
|
|
Severance and employee benefits |
|
|
806 |
|
|
615 |
|
|
(1,366 |
) |
|
55 |
|
|
Asset impairments |
|
|
— |
|
|
3,647 |
|
|
(3,647 |
) |
|
— |
|
|
Exit costs (consulting/site clean-up) |
|
|
64 |
|
|
1,568 |
|
|
(1,632 |
) |
|
— |
|
|
Contract term costs (leases) |
|
|
— |
|
|
61 |
|
|
(61 |
) |
|
— |
|
|
Total All Other |
|
|
870 |
|
|
5,891 |
|
|
(6,706 |
) |
|
55 |
|
|
Total |
|
$ |
11,387 |
|
$ |
28,557 |
|
$ |
(33,800 |
) |
$ |
6,144 |
|
|
|
|
|
|
|
|
|
|
|
|
|
|
|
|
|
Year Ended October 31, 2008 |
|
|
|
|
|
|
|
|
|
|
|
|
|
|
|
|
Liability |
|
Expense |
|
Activity |
|
Liability |
|
||||
|
Coatings |
|
|
|
|
|
|
|
|
|
|
|
|
|
|
Severance and employee benefits |
|
$ |
— |
|
$ |
10,509 |
|
$ |
(2,667 |
) |
$ |
7,842 |
|
|
Asset impairments |
|
|
— |
|
|
1,630 |
|
|
(1,630 |
) |
|
— |
|
|
Exit costs (consulting/site clean-up) |
|
|
— |
|
|
800 |
|
|
(377 |
) |
|
423 |
|
|
Contract term costs (leases) |
|
|
— |
|
|
12 |
|
|
(12 |
) |
|
— |
|
|
Total Coatings |
|
|
— |
|
|
12,951 |
|
|
(4,686 |
) |
|
8,265 |
|
|
|
|
|
|
|
|
|
|
|
|
|
|
|
|
|
Paints |
|
|
|
|
|
|
|
|
|
|
|
|
|
|
Severance and employee benefits |
|
|
— |
|
|
176 |
|
|
(176 |
) |
|
— |
|
|
Asset impairments |
|
|
— |
|
|
4,720 |
|
|
(4,720 |
) |
|
— |
|
|
Exit costs (consulting/site clean-up) |
|
|
— |
|
|
2,257 |
|
|
(5 |
) |
|
2,252 |
|
|
Contract term costs (leases) |
|
|
— |
|
|
— |
|
|
— |
|
|
— |
|
|
Total Paints |
|
|
— |
|
|
7,153 |
|
|
(4,901 |
) |
|
2,252 |
|
|
|
|
|
|
|
|
|
|
|
|
|
|
|
|
|
All Other |
|
|
|
|
|
|
|
|
|
|
|
|
|
|
Severance and employee benefits |
|
|
— |
|
|
1,399 |
|
|
(593 |
) |
|
806 |
|
|
Asset impairments |
|
|
— |
|
|
1,815 |
|
|
(1,815 |
) |
|
— |
|
|
Exit costs (consulting/site clean-up) |
|
|
— |
|
|
136 |
|
|
(72 |
) |
|
64 |
|
|
Contract term costs (leases) |
|
|
— |
|
|
— |
|
|
— |
|
|
— |
|
|
Total All Other |
|
|
— |
|
|
3,350 |
|
|
(2,480 |
) |
|
870 |
|
|
Total |
|
$ |
— |
|
$ |
23,454 |
|
$ |
(12,067 |
) |
$ |
11,387 |
|
The liability ending balance at October 30, 2009 is included in accrued liabilities on our Consolidated Balance Sheet. The restructuring reserve balances presented are considered adequate to cover committed restructuring actions that we expect to complete in fiscal year 2010. The restructuring expenses recorded are included in the Consolidated Statement of Income. For 2009, $22,280 was charged to Cost of Sales and $6,277 was charged to Selling and Administrative expense. For 2008, $15,694 was charged to Cost of Sales, $7,489 was charged to Selling and Administrative expense and $271 was charged to Other Expense (Income).
43
NOTE 16 – RECENTLY ISSUED ACCOUNTING STANDARDS
The FASB issued SFAS No. 157, “Fair Value Measurements” (now part of FASB ASC Topic 820, “Fair Value Measurements and Disclosures”) in September 2006, which defines fair value, establishes a framework for measuring fair value in GAAP and expands disclosures about fair value measurements. Topic 820 applies under other accounting pronouncements that require or permit fair value measurements. This statement does not require us to make any new fair value measurements. We adopted Topic 820 for financial assets and liabilities in the first quarter of 2009 (see Note 6 for further details).
In February 2008, the FASB delayed the effective date for the implementation of Topic 820 solely for nonfinancial assets and nonfinancial liabilities, except those nonfinancial items that are recognized or disclosed at fair value in the financial statements on a recurring basis (i.e., at least annually). The new effective date would be for fiscal years beginning after November 15, 2008 or our fiscal year 2010. We do not expect the adoption of Topic 820 to have a material impact on our consolidated financial statements.
In December 2007, the FASB issued SFAS No. 141(R), “Business Combinations” (now part of FASB ASC Topic 805, “Business Combinations”), and SFAS No. 160, “Non-controlling Interests in Consolidated Financial Statements” (now part of FASB ASC Topic 810, “Consolidation”), which changed the accounting for and reporting of business combinations and non-controlling interests in consolidated financial statements. Both pronouncements are required to be adopted simultaneously and are effective for the first annual reporting period beginning on or after December 15, 2008, which is our fiscal year 2010. Earlier adoption is prohibited. Topic 805 applies prospectively to business combinations for which the acquisition date is on or after the date of adoption. Topic 810 shall be applied prospectively as of the beginning of the fiscal year of adoption, except for the presentation and disclosure requirements, which shall be applied retrospectively for all periods presented. Generally, the effect of Topic 805 will depend on future acquisitions. However, the accounting for the resolution of any tax uncertainties remaining will be subject to the provisions of Topic 805. We do not expect the adoption of either pronouncement to have a material impact on our consolidated financial statements.
NOTE 17 – QUARTERLY RESULTS OF OPERATIONS (UNAUDITED)
The following is a tabulation of the unaudited quarterly results for the years ended October 30, 2009 and October 31, 2008:
|
|
|
|
|
|
|
|
|
|
|
|
|
|
|
|
|
|
|
|
|
|
|
|
|
|
|
Net |
|
Gross |
|
Net |
|
Huarun |
|
Huarun |
|
Net
Income |
|
Net
Income |
|
|||||||
|
2009 Quarter Ended: |
|
|
|
|
|
|
|
|
|
|
|
|
|
|
|
|
|
|
|
|
|
|
|
January 30 |
|
$ |
639,497 |
|
$ |
189,344 |
|
$ |
14,168 |
|
$ |
(3,318 |
) |
$ |
(0.03 |
) |
$ |
10,850 |
|
$ |
0.11 |
|
|
May 1 |
|
|
668,384 |
|
|
221,136 |
|
|
31,130 |
|
|
(3,318 |
) |
|
(0.03 |
) |
|
27,812 |
|
|
0.28 |
|
|
July 31 |
|
|
794,580 |
|
|
290,246 |
|
|
64,951 |
|
|
(3,318 |
) |
|
(0.03 |
) |
|
61,633 |
|
|
0.61 |
|
|
October 30 |
|
|
776,581 |
|
|
278,202 |
|
|
49,904 |
|
|
— |
|
|
— |
|
|
49,904 |
|
|
0.49 |
|
|
|
|
$ |
2,879,042 |
|
$ |
978,928 |
|
$ |
160,153 |
|
$ |
(9,954 |
) |
$ |
(0.10 |
) |
$ |
150,199 |
|
$ |
1.49 |
|
|
2008 Quarter Ended: |
|
|
|
|
|
|
|
|
|
|
|
|
|
|
|
|
|
|
|
|
|
|
|
January 25 |
|
$ |
765,124 |
|
$ |
210,465 |
|
$ |
24,015 |
|
$ |
(2,914 |
) |
$ |
(0.03 |
) |
$ |
21,101 |
|
$ |
0.21 |
|
|
April 25 |
|
|
836,379 |
|
|
244,261 |
|
|
40,847 |
|
|
(2,915 |
) |
|
(0.03 |
) |
|
37,932 |
|
|
0.38 |
|
|
July 25 |
|
|
957,683 |
|
|
274,702 |
|
|
46,989 |
|
|
(3,049 |
) |
|
(0.03 |
) |
|
43,940 |
|
|
0.44 |
|
|
October 31 |
|
|
923,192 |
|
|
248,003 |
|
|
38,915 |
|
|
(3,317 |
) |
|
(0.03 |
) |
|
35,598 |
|
|
0.35 |
|
|
|
|
$ |
3,482,378 |
|
$ |
977,431 |
|
$ |
150,766 |
|
$ |
(12,195 |
) |
$ |
(0.12 |
) |
$ |
138,571 |
|
$ |
1.38 |
|
The first, second, third and fourth quarters of fiscal year 2009 included restructuring costs of $0.06, $0.05, $0.03 and $0.04 per share, respectively; see Note 15 for more information. In the fourth quarter of 2008, income from continuing operations included an after-tax benefit of $9,054 or $0.09 per share for a gain on the sale of a non-strategic specialty product line. In addition, the third and fourth quarters of 2008 included restructuring costs of $0.03 and $0.13 per share, respectively; see Note 15 for more information.
44
|
|
|
|
CHANGES IN AND DISAGREEMENTS WITH ACCOUNTANTS ON ACCOUNTING AND FINANCIAL DISCLOSURE |
None.
|
|
|
|
CONTROLS AND PROCEDURES |
Disclosure controls and procedures (as defined in Exchange Act Rules 13a-15(e) and 15d-15(e)) are our controls and other procedures that are designed to ensure that information required to be disclosed by us in the reports that we file or submit under the Exchange Act is recorded, processed, summarized and reported within the time periods specified in the Securities and Exchange Commission’s rules and forms. Disclosure controls and procedures include, without limitation, controls and procedures designed to ensure that information required to be disclosed by us in the reports that we file or submit under the Exchange Act is accumulated and communicated to our management, including our Chief Executive Officer and Chief Financial Officer, as appropriate, to allow timely decisions regarding required disclosure.
Evaluation of Disclosure Controls and Procedures
We have evaluated the effectiveness of the design and operation of our disclosure controls and procedures as of October 30, 2009. Based on that evaluation, the Chief Executive Officer and Chief Financial Officer concluded that our disclosure controls and procedures are effective.
Changes in Internal Controls
The report of Management on Internal Control over Financial Reporting is set forth on page 21.
The Report of the Independent Registered Public Accounting Firm on Internal Control over Financial Reporting is set forth on page 23.
There were no changes in our internal control over financial reporting during the quarter ended October 30, 2009 that have materially affected, or are reasonably likely to materially affect, our internal control over financial reporting.
|
|
|
|
OTHER INFORMATION |
Not applicable.
|
|
|
|
DIRECTORS, EXECUTIVE OFFICERS AND CORPORATE GOVERNANCE |
The information in the sections titled “Election of Directors,” “Section 16(a) Beneficial Ownership Reporting Compliance” and “Corporate Governance” in the Proxy Statement is incorporated herein by reference. The information regarding executive officers is set forth in Part I of this report.
|
|
|
|
EXECUTIVE AND DIRECTOR COMPENSATION |
The information in the sections titled “Compensation Committee Report” and “Executive and Director Compensation” in the Proxy Statement is incorporated herein by reference.
|
|
|
|
SECURITY OWNERSHIP OF CERTAIN BENEFICIAL OWNERS AND MANAGEMENT AND RELATED STOCKHOLDER MATTERS |
The information in the sections titled “Share Ownership of Certain Beneficial Owners” and “Share Ownership of Management” in the Proxy Statement is incorporated herein by reference.
EQUITY COMPENSATION PLANS
|
|
|
|
|
|
|
|
|
|
|
|
|
Plan Category |
|
Number
of Securities |
|
Weighted-Average |
|
Number
of Securities |
|
|||
|
Equity Compensation Plans Approved by Security Holders |
|
|
11,977,437 |
|
$ |
22.27 |
|
|
3,482,562 |
|
|
Equity Compensation Plans Not Approved by Security Holders |
|
|
None |
|
|
None |
|
|
None |
|
|
Total |
|
|
11,977,437 |
|
$ |
22.27 |
|
|
3.482,562 |
|
|
|
|
|
(1) |
The number of securities remaining available for future issuance under equity compensation plans consists of shares issuable under outstanding stock options under The Valspar Corporation 1991 Stock Option Plan and The Valspar Corporation Stock Option Plan for Non-Employee Directors. In December 2008, the Board of Directors approved the 2009 Omnibus Equity Plan, which was approved by the stockholders in February 2009. The 2009 Omnibus Equity Plan replaced other equity compensation plans for future grants. |
45
|
|
|
|
CERTAIN RELATIONSHIPS AND RELATED TRANSACTIONS AND DIRECTOR INDEPENDENCE |
The information in the sections titled “Corporate Governance – Director Independence” and “Certain Relationships and Related Transactions” in the Proxy Statement is incorporated herein by reference.
|
|
|
|
PRINCIPAL ACCOUNTANT FEES AND SERVICES |
The information in the sections titled “Audit Fee Information” and “Pre-Approval of Services by Independent Auditors” in the Proxy Statement is incorporated herein by reference.
|
|
|
|
EXHIBITS AND FINANCIAL STATEMENT SCHEDULES |
|
|
|
|
|
|
(a) |
Documents filed as part of this report. |
|
|
|
|
|
|
|
|
(1) |
Financial Statements |
|
|
|
|
|
|
|
|
|
|
|
Page |
|
|
|||
|
|
Report of Management on Internal Control Over Financial Reporting |
|
21 |
|
|
Report of Independent Registered Public Accounting Firm on Consolidated Financial Statements |
|
22 |
|
|
Report of Independent Registered Public Accounting Firm on Internal Control Over Financial Reporting |
|
23 |
|
|
Consolidated Balance Sheets – October 30, 2009 and October 31, 2008 |
|
24 |
|
|
Consolidated Statements of Income – Years ended October 30, 2009, October 31, 2008 and October 26, 2007 |
|
25 |
|
|
Consolidated Statement of Changes in Equity – Years ended October 30, 2009, October 31, 2008 and October 26, 2007 |
|
26 |
|
|
Consolidated Statements of Cash Flows – Years ended October 30, 2009, October 31, 2008 and October 26, 2007 |
|
27 |
|
|
Notes to Consolidated Financial Statements |
|
28–44 |
|
|
Selected Quarterly Financial Data (Unaudited) |
|
44 |
|
|
|
|
|
|
(2) |
Financial Statement Schedules |
|
|
|
|
|
|
|
|
|
Schedule II – Valuation and Qualifying Accounts and Reserves can be found on page 49. |
|
|
|
|
|
|
|
|
|
All other schedules for which provision is made in the applicable accounting regulations of the Securities and Exchange Commission are not required under the related instructions or are inapplicable and therefore have been omitted. |
||
|
|
|
|
|
|
|
(3) |
Exhibits |
|||
|
|
|
|
|
|
|
|
Exhibit |
|
Description |
|
|
|
||||
|
|
2.1 |
|
|
Agreement for Sale and Purchase of Shares in Huarun Paints Holdings Company Limited dated June 20, 2006 (incorporated by reference to Form 10-Q for the quarter ended July 8, 2006) |
|
|
|
|
|
|
|
|
3.1 |
|
|
Certificate of Incorporation – as amended to and including June 30, 1970, with further amendments to Article Four dated February 29, 1984, February 25, 1986, February 26, 1992, February 26, 1997 and May 22, 2003 and to Article Eleven dated February 25, 1987 (incorporated by reference to Form 10-K for the period ended October 31, 1997, amendment filed with Form 10-Q for the quarter ended April 25, 2003) |
|
|
|
|
|
|
|
|
3.2 |
|
|
By-Laws – as amended and restated, effective August 19, 2009 (incorporated by reference to Form 10-Q for the quarter ended July 31, 2009) |
|
|
|
|
|
|
|
|
4.1 |
|
|
Rights Agreement dated as of May 1, 2000, between the Registrant and ChaseMellon Stockholder Services, L.L.C., as Rights Agent (incorporated by reference to Form 8-A filed on May 3, 2000) |
|
|
|
|
|
|
|
|
4.2 |
|
|
Indenture dated April 24, 2002, between the Registrant and Bank One Trust Company, N.A., as Trustee, relating to Registrant’s 6% Notes due 2007 (The Bank of New York Trust Company, N.A. is the successor in interest to Bank One) (incorporated by reference to Form 10-K for the period ended October 25, 2002, amendment filed with Form 10-Q for the quarter ended April 30, 2004) |
|
|
|
|
|
|
|
|
4.3 |
|
|
Second Supplemental Indenture, dated as of April 17, 2007, to indenture dated as of April 24, 2002, between the Registrant and The Bank of New York Trust Company, N.A. relating to the Registrant’s 5.625% Notes due 2012 and 6.050% Notes due 2017 (incorporated by reference to Exhibit 4.2 to Form 8-K filed on April 18, 2007) |
|
|
|
|
|
|
|
|
4.4 |
|
|
Indenture dated July 15, 2005 between the Registrant and The Bank of New York Trust Company, N.A., as Trustee, relating to the Company’s 5.100% Notes due 2015, including form of Registrant’s 5.100% Notes due 2015 (incorporated by reference to Form 8-K filed on July 18, 2005) |
|
|
|
|
|
|
|
|
4.5 |
|
|
Third Supplemental Indenture, between the Registrant and U.S. Bank, National Association, as Trustee, dated June 19, 2009, to Indenture dated April 24, 2002, between the Registrant and The Bank of New York Trust Company, N.A. (incorporated by reference to Form 8-K filed on June 23, 2009) |
46
|
|
|
|
|
|
|
|
Exhibit |
|
Description |
|
|
|
||||
|
|
10.1 |
|
|
The Valspar Corporation Key Employees’ Supplementary Retirement Plan, restated effective October 15, 2008 (incorporated by reference to Form 10-K for the period ended October 31, 2008)** |
|
|
|
|
|
|
|
|
10.2 |
|
|
The Valspar Corporation 1991 Stock Option Plan – as amended through August 21, 2007 (incorporated by reference to Form 10-K for the period ended October 31, 2008)** |
|
|
|
|
|
|
|
|
10.3 |
|
|
The Valspar Corporation Key Employee Annual Bonus Plan For Officers – as amended and restated on October 20, 2009 (incorporated by reference to Form 8-K filed on October 23, 2009)** |
|
|
|
|
|
|
|
|
10.4 |
|
|
The Valspar Corporation Stock Option Plan For Non-Employee Directors – as amended through October 17, 2007 (incorporated by reference to Form 10-K for the period ended October 31, 2008)** |
|
|
|
|
|
|
|
|
10.5 |
|
|
The Valspar Corporation Annual Bonus Plan –as amended through December 11, 2002 (incorporated by reference to Form 10-Q for the quarter ended April 25, 2003)** |
|
|
|
|
|
|
|
|
10.6 |
|
|
The Valspar Corporation Incentive Bonus Plan (incorporated by reference to Form 10-K for the period ended October 30, 1992)** |
|
|
|
|
|
|
|
|
10.7 |
|
|
The Valspar Corporation 2001 Stock Incentive Plan (incorporated by reference to Form 10-K for the period ended October 25, 2002)** |
|
|
|
|
|
|
|
|
10.8 |
|
|
The Valspar Corporation Key Employee Long-Term Incentive Bonus Program – as amended through December 12, 2007 (incorporated by reference to Form 10-K for the period ended October 31, 2008)** |
|
|
|
|
|
|
|
|
10.9 |
|
|
Change in Control Employment Agreement between the Registrant and the Company’s Named Executives – as amended through December 10, 2008 (incorporated by reference to Form 10-K for the period ended October 31, 2008)** |
|
|
|
|
|
|
|
|
10.10 |
|
|
The Valspar Corporation Supplemental Executive Retirement Plan for William L. Mansfield, restated effective December 31, 2008 (incorporated by reference to Form 10-K for the period ended October 31, 2008)** |
|
|
|
|
|
|
|
|
10.11 |
|
|
Employment Transition Agreement and Release between the Registrant and Paul C. Reyelts (incorporated by reference to Form 10-Q for the quarter ended January 30, 2009)** |
|
|
|
|
|
|
|
|
10.12 |
|
|
Form of Nonstatutory Stock Option Agreement for Officers under the Corporation’s 1991 Stock Option Plan – as amended August 21, 2007 (incorporated by reference to Form 10-K for the period ended October 31, 2008)** |
|
|
|
|
|
|
|
|
10.13 |
|
|
Arrangements with New President and Chief Executive Officer (incorporated by reference to Form 10-Q for the quarter ended January 28, 2005)** |
|
|
|
|
|
|
|
|
10.14 |
|
|
Confidentiality and Noncompetition Agreement between Registrant and William L. Mansfield (incorporated by reference to Form 10-Q for the quarter ended January 28, 2005) |
|
|
|
|
|
|
|
|
10.15 |
|
|
Three-Year Credit Agreement dated June 30, 2009 with Wells Fargo Bank, National Association, as administrative agent and an issuing bank, Wachovia Bank, National Association, as an issuing bank, and certain other lenders (incorporated by reference to Form 8-K filed on July 2, 2009) |
|
|
|
|
|
|
|
|
10.16 |
|
|
Form of Stock Option Granted to Non-Employee Directors – as amended October 17, 2007 (incorporated by reference to Form 10-K for the period ended October 31, 2008)** |
|
|
|
|
|
|
|
|
10.17 |
|
|
Form of Restricted Stock Granted to Certain Executive Officers (incorporated by reference to Form 10-Q for the quarter ended April 28, 2006)** |
|
|
|
|
|
|
|
|
10.18 |
|
|
Form of Stock Option Granted to Certain Executive Officers (incorporated by reference to Form 10-Q for the quarter ended April 28, 2006)** |
|
|
|
|
|
|
|
|
10.19* |
|
|
The Valspar Corporation 2009 Omnibus Equity Plan – as amended through October 20, 2009.** |
|
|
|
|
|
|
|
|
10.20 |
|
|
Form of Indemnification Letter Agreement to Non-Employee Directors and Certain Executive Officers (incorporated by reference to Form 10-Q for the quarter ended January 30, 2009)** |
|
|
|
|
|
|
|
|
10.21 |
|
|
Term Sheet for Compensation Program for Non-Employee Directors (incorporated by reference to Form 8-K filed on October 23, 2009)** |
|
|
|
|
|
|
|
|
14.1 |
|
|
Code of Ethics and Business Conduct (incorporated by reference to Form 10-K for the period ended October 29, 2004) |
|
|
|
|
|
|
|
|
21.1* |
|
|
Subsidiaries of the Registrant |
|
|
|
|
|
|
|
|
23.1* |
|
|
Consent of Independent Registered Public Accounting Firm – Ernst & Young LLP |
|
|
|
|
|
|
|
|
31.1* |
|
|
Section 302 Certification of the Chief Executive Officer |
|
|
|
|
|
|
|
|
31.2* |
|
|
Section 302 Certification of the Chief Financial Officer |
|
|
|
|
|
|
|
|
32.1* |
|
|
Certification of Chief Executive Officer and Chief Financial Officer Pursuant to 18 U.S.C. §1350, as Adopted Pursuant to Section 906 of the Sarbanes-Oxley Act of 2002 |
*Filed electronically herewith.
**Compensatory Plan or arrangement required to be filed pursuant to Item 15(b) of Form 10-K.
Portions of the 2010 Proxy Statement are incorporated herein by reference as set forth in Items 10, 11, 12, 13 and 14 of this report. Only those portions expressly incorporated by reference herein shall be deemed filed with the Commission.
47
Pursuant to the requirements of Section 13 or 15(d) of the Securities Exchange Act of 1934, the registrant has duly caused this report to be signed on its behalf by the undersigned, thereunto duly authorized.
|
|
|
|
|
|
|
|
|
THE VALSPAR CORPORATION |
|
|
|
|
|
|
|
|
|
|
|
/s/ Rolf Engh |
12/18/09 |
|
|
|
|
|||
|
|
|
Rolf Engh, Secretary |
|
|
Pursuant to the requirements of the Securities Exchange Act of 1934, this report has been signed below by the following persons on behalf of the registrant and in the capacities and on the dates indicated.
|
|
|
|
|
|
|
/s/ William L. Mansfield |
12/18/09 |
|
/s/ Susan S. Boren |
12/18/09 |
|
|
||||
|
William L. Mansfield, Director |
|
|
Susan S. Boren, Director |
|
|
Chairman and Chief Executive Officer |
|
|
|
|
|
(principal executive officer) |
|
|
/s/ John S. Bode |
12/18/09 |
|
|
|
|
||
|
/s/ Lori A. Walker |
12/18/09 |
|
John S. Bode, Director |
|
|
|
|
|
||
|
Lori A. Walker, Senior Vice President |
|
|
/s/ Jeffrey H. Curler |
12/18/09 |
|
and Chief Financial Officer |
|
|
||
|
(principal financial officer) |
|
|
Jeffrey H. Curler, Director |
|
|
|
|
|
|
|
|
/s/ Tracy C. Jokinen |
12/18/09 |
|
/s/ Ian R. Friendly |
12/18/09 |
|
|
||||
|
Tracy C. Jokinen, Vice President and |
|
|
Ian R. Friendly, Director |
|
|
Controller (principal accounting officer) |
|
|
|
|
|
|
|
|
/s/ Charles W. Gaillard |
12/18/09 |
|
|
|
|
||
|
|
|
|
Charles W. Gaillard, Director |
|
|
|
|
|
|
|
|
|
|
|
/s/ Janel S. Haugarth |
12/18/09 |
|
|
|
|
||
|
|
|
|
Janel S. Haugarth, Director |
|
|
|
|
|
|
|
|
|
|
|
/s/ Gary E. Hendrickson |
12/18/09 |
|
|
|
|
||
|
|
|
|
Gary E. Hendrickson, Director |
|
|
|
|
|
|
|
|
|
|
|
/s/ Mae C. Jemison |
12/18/09 |
|
|
|
|
||
|
|
|
|
Mae C. Jemison, Director |
|
|
|
|
|
|
|
|
|
|
|
/s/ Stephen D. Newlin |
12/18/09 |
|
|
|
|
||
|
|
|
|
Stephen D. Newlin, Director |
|
|
|
|
|
|
|
|
|
|
|
/s/ Gregory R. Palen |
12/18/09 |
|
|
|
|
||
|
|
|
|
Gregory R. Palen, Director |
|
|
|
|
|
|
|
|
|
|
|
/s/ Richard L. White |
12/18/09 |
|
|
|
|
||
|
|
|
|
Richard L. White, Director |
|
48
The
Valspar Corporation
Schedule II – Valuation and Qualifying Accounts and Reserves
|
|
|
|
|
|
|
|
|
|
|
|
|
|
|
|
|
|
|
Description |
|
Balance
at |
|
(1) |
|
(2) |
|
Deductions
– |
|
Balance
at End |
|
|||||
|
Reserves and allowances deducted from asset accounts: |
|
|
|
|
|
|
|
|
|
|
|
|
|
|
|
|
|
Allowance for doubtful accounts: |
|
|
|
|
|
|
|
|
|
|
|
|
|
|
|
|
|
Year ended October 30, 2009 |
|
$ |
16,389,000 |
|
$ |
11,185,564 |
|
|
|
|
$ |
6,156,195 |
1 |
$ |
21,768,000 |
|
|
|
|
|
|
|
|
|
|
|
|
|
|
(349,631 |
)2 |
|
|
|
|
Year ended October 31, 2008 |
|
$ |
10,598,000 |
|
$ |
13,159,314 |
|
|
|
|
$ |
7,606,063 |
1 |
$ |
16,389,000 |
|
|
|
|
|
|
|
|
|
|
|
|
|
|
(237,749 |
)2 |
|
|
|
|
Year ended October 26, 2007 |
|
$ |
13,145,000 |
|
$ |
1,319,878 |
|
|
|
|
$ |
4,455,867 |
1 |
$ |
10,598,000 |
|
|
|
|
|
|
|
|
|
|
|
|
|
|
(588,989 |
)2 |
|
|
|
|
|
|
|
1 |
Uncollectible accounts written off. |
|
|
|
|
2 |
Recoveries on accounts previously written off. |
49