Attached files
UNITED STATES
SECURITIES AND EXCHANGE COMMISSION
Washington, D.C. 20549
FORM 10-K
| ☒ | ANNUAL REPORT PURSUANT TO SECTION 13 OR 15(d) OF THE SECURITIES EXCHANGE ACT OF 1934 |
For the fiscal year ended December 31, 2015
| ☐ | TRANSITION REPORT PURSUANT TO SECTION 13 OR 15(d) OF THE SECURITIES EXCHANGE ACT OF 1934 |
For the transition period from ______to ______
Commission File Number 1-12709

Tompkins Financial Corporation
(Exact name of registrant as specified in its charter)
| New York | 16-1482357 | |
| (State or other jurisdiction of incorporation or organization) | (I.R.S. Employer Identification No.) | |
| The Commons, P.O. Box 460, Ithaca, New York | 14851 | |
| (Address of principal executive offices) | (Zip Code) |
Registrant’s telephone number, including area code: (888) 503-5753
Securities registered pursuant to Section 12(b) of the Act:
| Common Stock ($.10 Par Value Per Share) | NYSE MKT LLC | |||||
| (Title of class) | (Name of exchange on which traded) | |||||
Securities registered pursuant to Section 12(g) of the Act: None
Indicate by check mark if the registrant is a well-known seasoned issuer, as defined in Rule 405 of Securities Act. Yes ☐ No ☒.
Indicate by check mark if the registrant is not required to file reports pursuant to Section 13 or Section 15(d) of the Act. Yes ☐ No ☒.
Indicate by check mark whether the registrant: (1) has filed all reports required to be filed by Section 13 or 15(d) of the Securities Exchange Act of 1934 during the preceding 12 months (or for such shorter period that the registrant was required to file such reports) and (2) has been subject to such filing requirements for the past 90 days. Yes ☒ No ☐.
Indicate by check mark whether the registrant has submitted electronically and posted on its corporate Web site, if any, every Interactive Data File required to be submitted and posted pursuant to Rule 405 of Regulation S-T (S232.405 of this chapter) during the preceding 12 months (or for such shorter period that the registrant was required to submit and post such files). Yes ☒ No ☐.
Indicate by check mark if disclosure of delinquent filers pursuant to Item 405 of Regulation S-K is not contained herein, and will not be contained, to the best of the registrant’s knowledge, in definitive proxy or information statements incorporated by reference in Part III of this Form 10-K or any amendment to this Form 10-K. ☒
Indicate by check mark whether the registrant is a large accelerated filer, an accelerated filer, a nonaccelerated filer, or a smaller reporting company.
| Large Accelerated Filer ☐ | Accelerated Filer ☒ | Nonaccelerated Filer ☐ | Smaller Reporting Company ☐ |
Indicate by check mark whether the registrant is a shell company (as defined in Rule 12b-2 of the Exchange Act). Yes ☐ No ☒.
The aggregate market value of the registrant’s common stock held by non-affiliates was $630,812,000 on June 30, 2015, based on the closing sales price of a share of the registrant’s common stock, $.10 par value (the “Common Stock”), as reported on the NYSE MKT LLC, on such date.
The number of shares of the registrant’s Common Stock outstanding as of February 28, 2016, was 14,988,740 shares.
DOCUMENTS INCORPORATED BY REFERENCE
Portions of the registrant’s definitive Proxy Statement relating to its 2016 Annual Meeting of stockholders, to be held on May 9, 2016, are incorporated by reference into Part III of this Form 10-K where indicated.
TOMPKINS FINANCIAL CORPORATION
Annual Report on Form 10-K
For the Fiscal Year Ended December 31, 2015
Table of Contents
The disclosures set forth in this Item 1. Business are qualified by the section captioned “Forward-Looking Statements” in Item 7. Management’s Discussion and Analysis of Financial Condition and Results of Operations of this Report and other cautionary statements set forth elsewhere in this Report.
General
Tompkins Financial Corporation (“Tompkins” or the “Company”) is headquartered in Ithaca, New York and is registered as a Financial Holding Company with the Federal Reserve Board under the Bank Holding Company Act of 1956, as amended. The Company is a locally oriented, community-based financial services organization that offers a full array of products and services, including commercial and consumer banking, leasing, trust and investment management, financial planning and wealth management, and insurance. At December 31, 2015, the Company’s subsidiaries included: four wholly-owned banking subsidiaries, Tompkins Trust Company (the “Trust Company”), The Bank of Castile (DBA Tompkins Bank of Castile), Mahopac Bank (formerly known as Mahopac National Bank, DBA Tompkins Mahopac Bank), VIST Bank (DBA Tompkins VIST Bank); and a wholly-owned insurance agency subsidiary, Tompkins Insurance Agencies, Inc. (“Tompkins Insurance”). The Trust Company provides a full array of trust and investment services under the Tompkins Financial Advisors brand, including investment management, trust and estate, financial and tax planning as well as life, disability and long-term care insurance services. The Company’s principal offices are located at The Commons, Ithaca, New York, 14851, and its telephone number is (888) 503-5753. The Company’s common stock is traded on the NYSE MKT LLC under the Symbol “TMP.”
Tompkins was organized in 1995, under the laws of the State of New York, as a bank holding company for the Trust Company, a commercial bank that has operated in Ithaca, New York and surrounding communities since 1836. Information relating to revenues, profit and loss, and total assets for the Company’s three business segments - banking, insurance, and wealth management - is incorporated herein by reference to Part II, Item 8. of this Report.
The Company’s strategic initiatives include diversification within its markets, growth of its fee-based businesses, and growth internally and through acquisitions of financial institutions, branches, and financial services businesses. As such, the Company from time to time considers acquiring banks, thrift institutions, branch offices of banks or thrift institutions, or other businesses within markets currently served by the Company or in other locations that would complement the Company’s business or its geographic reach. The Company generally targets merger or acquisition partners that are culturally similar and have experienced management and possess either significant market presence or have potential for improved profitability through financial management, economies of scale and expanded services. The Company has pursued acquisition opportunities in the past, and continues to review new opportunities. The Company's most recent material acquisition was its 2012 acquisition of VIST Financial, a financial holding company headquartered in Wyomissing, Pennsylvania, and parent to VIST Bank, VIST Insurance, LLC ("VIST Insurance"), and VIST Capital Management, LLC ("VIST Capital Management").
Although Tompkins is a corporate entity, legally separate and distinct from its affiliates, bank holding companies such as Tompkins are generally required to act as a source of financial strength for their banking subsidiaries. Tompkins’ principal source of income is dividends from its subsidiaries. There are certain regulatory restrictions on the extent to which these subsidiaries can pay dividends or otherwise supply funds to Tompkins. See the section “Supervision and Regulation” for further details.
Narrative Description of Business
Information about the Company’s business segments are included in “Note 22 Segment and Related Information” in the Notes to Consolidated Financial Statements in Part II, Item 8. of this Report. The Company has identified three business segments, consisting of banking, insurance and wealth management.
Banking services consist primarily of attracting deposits from the areas served by the Company’s four banking subsidiaries’ 63 banking offices (44 offices in New York and 19 offices in Pennsylvania), and using those deposits to originate a variety of commercial loans, agricultural loans, consumer loans, real estate loans, and leases in those same areas. The Company’s lending function is managed within the guidelines of a comprehensive Board-approved lending policy. Policies and procedures are reviewed on a regular basis. Reporting systems are in place to provide management with ongoing information related to loan production, loan quality, concentrations of credit, loan delinquencies and nonperforming and potential problem loans. The Company has an independent third party loan review process that reviews and validates the risk identification and assessment made by the lenders and credit personnel. The results of these reviews are presented to the Board of Directors of each of the Company’s banking subsidiaries, and the Company’s Audit Committee.
1
The Company’s principal expenses are interest on deposits, interest on borrowings, and operating and general administrative expenses, as well as provisions for loan and lease losses. Funding sources, other than deposits, include borrowings, securities sold under agreements to repurchase, and cash flow from lending and investing activities. The Company’s principal sources of income include interest income on loans and securities.
The Company maintains a portfolio of securities such as obligations of U.S. government agencies and U.S. government sponsored entities, obligations of states and political subdivisions thereof, and equity securities. Management typically invests in securities with short to intermediate average lives in order to better match the interest rate sensitivities of its assets and liabilities. Investment decisions are made within policy guidelines established by the Company’s Board of Directors. The investment policy is based on the asset/liability management goals of the Company, and is monitored by the Company’s Asset/Liability Management Committee. The intent of the policy is to establish a portfolio of high quality diversified securities, which optimizes net interest income within safety and liquidity limits deemed acceptable by the Asset/Liability Management Committee.
Tompkins Insurance Agencies Inc. was formed in 2001, resulting from an acquisition. Insurance services include property and casualty insurance, employee benefit consulting, and life, long-term care and disability insurance. Tompkins Insurance is headquartered in Batavia, New York. Over the years, Tompkins Insurance has acquired smaller insurance agencies in the market areas serviced by the Company’s banking subsidiaries and successfully consolidated them into Tompkins Insurance. The VIST Financial acquisition in 2012, which included VIST Insurance, nearly doubled the Company’s annual insurance revenues. Tompkins Insurance offers services to customers of the Company’s banking subsidiaries by sharing offices with The Bank of Castile, Trust Company, and VIST Bank. In addition to these shared offices, Tompkins Insurance has five stand-alone offices in Western New York, two stand-alone offices in Tompkins County, New York and one stand-alone office in Montgomery County, Pennsylvania.
Wealth management services consists of investment management, trust and estate, financial and tax planning as well as life, disability and long-term care insurance services. Wealth management services are under the trade name Tompkins Financial Advisors. Tompkins Financial Advisors has office locations at all four of the Company’s subsidiary banks.
Tompkins provides a variety of financial services to individuals and small business customers. Some of the traditional services are detailed below.
Banking Services
The Company’s subsidiary banks provide financial services to corporations and other business clients. Lending activities include loans for a variety of business purposes, including real estate financing, construction, equipment financing, accounts receivable financing, and commercial leasing. Other commercial services include deposit and cash management services, letters of credit, sweep accounts, credit cards, purchasing cards, Internet-based account services, and remote deposit services. The Company’s subsidiary banks provide a variety of retail banking services including checking accounts, savings accounts, time deposits, IRA products, brokerage services, residential mortgage loans, personal loans, home equity loans, credit cards, debit cards and safe deposit services. Retail services are accessible through a variety of delivery systems including branch facilities, ATMs, voice response, Mobile banking, Internet banking, and remote deposit services.
Trust and Investment Management Services
The Company offers a comprehensive suite of financial services to customers, including investment management, trust and estate, financial and tax planning as well as life, disability and long-term care insurance services. These services are offered by Tompkins Trust Company, using the trade name of Tompkins Financial Advisors. Tompkins Financial Advisors has office locations at all four of the Company’s subsidiary banks.
Insurance Services
The Company provides property and casualty insurance, employee benefit consulting, and life, long-term care and disability insurance through Tompkins Insurance.
Subsidiaries
The Company operates four banking subsidiaries, and an insurance agency subsidiary. In addition, the Company also owns 100% of the common stock of Tompkins Capital Trust I, Sleepy Hollow Capital Trust I, Leesport Capital Trust II, and Madison Statutory Trust I. The Company’s banking subsidiaries operate 63 offices, including 2 limited-service offices, with 44 banking offices located in New York and 19 banking offices located in southeastern Pennsylvania. The decision to operate as four locally managed community banks reflects management’s commitment to community banking as a business strategy. For Tompkins, personal delivery of high quality services, a commitment to the communities in which we operate, and the convergence of a single-source financial service provider characterize management’s community banking approach. The combined resources of the Tompkins organization provides increased capacity for growth and the greater capital resources necessary to make investments in technology and services. Tompkins has a comprehensive suite of products and services that are now available in the markets served by all four banking subsidiaries. These services include trust and investment services, insurance, leasing, card services, internet banking, and remote deposit services.
2
Tompkins Trust Company (the “Trust Company”)
The Trust Company is a New York State-chartered commercial bank that has operated in Ithaca, New York and surrounding communities since 1836. The Trust Company provides trust and investment services through Tompkins Investment Services (“TIS”), a division of Tompkins Trust Company. Tompkins Investment Services has office locations at all four of the Company’s subsidiary banks, and provides a full range of money management services. The Trust Company operates 13 banking offices, including one limited-service banking office in the counties of Tompkins, Cortland, Cayuga and Schuyler, New York. The Trust Company’s largest market area is Tompkins County, which has a population of approximately 104,000. Education plays a significant role in the Tompkins County economy with Cornell University and Ithaca College being two of the county’s major employers. The Trust Company has a full-service office in Cortland, New York and a full-service office in Auburn, New York. Both of these offices are located in counties contiguous to Tompkins County. The Trust Company also recently announced plans to expand into Onondaga County, with an office expected to open in 2016. As of December 31, 2015, the Trust Company had total assets of $1.8 billion, total loans of $1.0 billion and total deposits of $1.4 billion.
Tompkins Bank of Castile
Tompkins Bank of Castile is a New York State-chartered commercial bank and conducts its operations through its 17 banking offices, in towns situated in and around the areas commonly known as the Genesee Valley region of New York State. The main business office for Tompkins Bank of Castile is located in Batavia, New York and is shared with Tompkins Insurance. Tompkins Bank of Castile serves a five-county market, much of which is rural in nature, but also includes Monroe County (population approximately 750,000), where the city of Rochester is located. The population of the counties served by Tompkins Bank of Castile, other than Monroe, is approximately 210,000. Tompkins Bank of Castile’s lending portfolio includes loans to the agricultural industry. As of December 31, 2015, Tompkins Bank of Castile had total assets of $1.3 billion, total loans of $931.6 million and total deposits of $1.1 billion.
Tompkins Mahopac Bank (formerly known as Mahopac National Bank)
Mahopac Bank is a commercial bank that operates 14 banking offices. The 14 banking offices include 5 full-service offices in Putnam County, New York, 3 full-service offices in Dutchess County, New York, and 6 full-service offices in Westchester County, New York.
Putnam County has a population of approximately 100,000 and is about 60 miles north of Manhattan. Dutchess County has a population of approximately 297,000, and Westchester County has a population of approximately 969,000. As of December 31, 2015, Tompkins Mahopac Bank had total assets of $1.1 billion, total loans of $732.0 million and total deposits of $900.8 million.
Tompkins VIST Bank
Tompkins VIST Bank is a full service Pennsylvania State-charted commercial bank that was acquired as part of the VIST acquisition in August 2012. Tompkins VIST Bank operates 19 banking offices in Pennsylvania, including one limited-service office. The 19 banking offices include 11 offices in Berks County, 5 offices in Montgomery County, 1 office in Philadelphia County, 1 office in Delaware County and 1 office in Schuylkill County. The population of the counties served by Tompkins VIST Bank is Philadelphia 1.6 million, Montgomery 812,000, Delaware 562,000, Berks 414,000 and Schuykill 147,000. The main office is located in Wyomissing, Pennsylvania. As of December 31, 2015, Tompkins VIST Bank had total assets of $1.4 billion, total loans of $1.1 billion and total deposits of $1.0 billion.
Tompkins Insurance Agencies, Inc. (“Tompkins Insurance”)
Tompkins Insurance is headquartered in Batavia, New York. Insurance services include property and casualty insurance, employee benefit consulting, and life, long-term care and disability insurance. Over the past fourteen years, Tompkins Insurance has acquired smaller insurance agencies in the market areas serviced by the Company’s banking subsidiaries and successfully consolidated them into Tompkins Insurance. The 2012 VIST Financial acquisition, which included VIST Insurance (now merged with and into Tompkins Insurance), nearly doubled the Company’s annual insurance revenues. Tompkins Insurance offers services to customers of the Company’s banking subsidiaries by sharing offices with Tompkins Bank of Castile, Trust Company, and Tompkins VIST Bank. In addition to these shared offices, Tompkins Insurance has five stand-alone offices in Western New York and two stand-alone offices in Tompkins County, New York and one stand-alone office in Montgomery County, Pennsylvania.
Tompkins Capital Trust I
Tompkins Capital Trust I is a Delaware statutory business trust formed in 2009. In 2009, Tompkins Capital Trust I issued $20.5 million of trust preferred securities and lent the proceeds to the Company to support business growth and for general corporate purposes. The Company guarantees, on a subordinated basis, payments of distributions on the trust preferred securities and payments on the redemption of the trust preferred securities. In accordance with the applicable accounting standards related to variable interest entities, the accounts of Tompkins Capital Trust I are not included in the Company’s consolidated financial statements. However, the $20.5 million of fixed rate (7%) trust preferred securities issued by Tompkins Capital Trust I are included in the Tier 1 capital of the Company for regulatory capital purposes pursuant to regulatory guidelines.
3
Sleepy Hollow Capital Trust I
Sleepy Hollow Capital Trust I, a Delaware statutory business trust, was formed in 2003 and issued $4.0 million of floating rate (three-month LIBOR plus 305 basis points) trust preferred securities. The Company acquired Sleepy Hollow Capital Trust I through the acquisition of Sleepy Hollow Bancorp, Inc. in 2008.
Leesport Capital Trust II
Leesport Capital Trust II, a Delaware statutory business trust, was formed in 2002 and issued $10.0 million of mandatory redeemable capital securities carrying a floating interest rate of three month LIBOR plus 3.45%. The Company assumed the rights and obligations of VIST Financial pertaining to the Leesport Capital Trust II through the Company’s acquisition of VIST Financial in 2012.
Madison Statutory Trust I
Madison Statutory Trust I, a Connecticut statutory business trust formed in 2003, issued $5.0 million of mandatory redeemable capital securities carrying a floating interest rate of three month LIBOR plus 3.10%. VIST Financial assumed Madison Statutory Trust I pursuant to the purchase of Madison Bancshares Group, Ltd in 2004. The Company assumed the rights and obligations of VIST Financial pertaining to the Madison Statutory Trust I through the Company’s acquisition of VIST Financial in 2012.
For additional details on the above capital trusts refer to “Note 11 - Trust Preferred Debentures” in the Notes to Consolidated Financial Statements in Part II, Item 8. of this Report.
Competition
Competition for commercial banking and other financial services is strong in the Company’s market areas. In one or more aspects of its business, the Company’s subsidiaries compete with other commercial banks, savings and loan associations, credit unions, finance companies, Internet-based financial services companies, mutual funds, insurance companies, brokerage and investment banking companies, and other financial intermediaries. Some of these competitors have substantially greater resources and lending capabilities and may offer services that the Company does not currently provide. In addition, many of the Company’s non-bank competitors are not subject to the same extensive Federal regulations that govern financial holding companies and Federally-insured banks.
Competition among financial institutions is based upon interest rates offered on deposit accounts, interest rates charged on loans and other credit and service charges, the quality and scope of the services rendered the convenience of facilities and, in the case of loans to commercial borrowers, relative lending limits. Management believes that a community based financial organization is better positioned to establish personalized financial relationships with both commercial customers and individual households. The Company’s community commitment and involvement in its primary market areas, as well as its commitment to quality and personalized financial services, are factors that contribute to the Company’s competitiveness. Management believes that each of the Company’s subsidiary banks can compete successfully in its primary market areas by making prudent lending decisions quickly and more efficiently than its competitors, without compromising asset quality or profitability, although no assurances can be given that such factors will assure success.
Supervision and Regulation
Regulatory Agencies
As a registered financial holding company, the Company is regulated under the Bank Holding Company Act of 1956 as amended (“BHC Act”), and is subject to examination and comprehensive regulation by the Federal Reserve Board (“FRB”). The Company is also subject to the jurisdiction of the Securities and Exchange Commission (“SEC”) and is subject to disclosure and regulatory requirements under the Securities Act of 1933, as amended (the “Securities Act”), and the Securities Exchange Act of 1934, as amended (the “Exchange Act”). The Company’s common stock is traded on the NYSE MKT LLC under the Symbol “TMP” and is subject to the rules of the NYSE MKT LLC for listed companies.
The Company’s banking subsidiaries are subject to examination and comprehensive regulation by various regulatory authorities, including the Federal Deposit Insurance Corporation (“FDIC”), the New York State Department of Financial Services (“NYSDFS”), and the Pennsylvania Department of Banking and Securities (“PDBS”). Each of these agencies issues regulations and requires the filing of reports describing the activities and financial condition of the entities under its jurisdiction. Likewise, such agencies conduct examinations on a recurring basis to evaluate the safety and soundness of the institutions, and to test compliance with various regulatory requirements, including: consumer protection, privacy, fair lending, the Community Reinvestment Act, the Bank Secrecy Act, sales of non-deposit investments, electronic data processing, and trust department activities.
4
The Company’s wealth management subsidiary is subject to examination and regulation by various regulatory agencies, including the SEC and the Financial Industry Regulatory Authority (“FINRA”). The trust division of Tompkins Trust Company is subject to examination and comprehensive regulation by the FDIC and NYSDFS.
The Company’s insurance subsidiary is subject to examination and regulation by the NYSDFS and the Pennsylvania Insurance Department.
Federal Home Loan Bank System
The Company’s banking subsidiaries are also members of the Federal Home Loan Bank (“FHLB”), which provides a central credit facility primarily for member institutions for home mortgage and neighborhood lending. The Company’s banking subsidiaries are subject to the rules and requirements of the FHLB, including the requirement to acquire and hold shares of capital stock in the FHLB in an amount at least equal to the sum of 0.35% of the aggregate principal amount of its unpaid residential mortgage loans and similar obligations at the beginning of each year, up to a maximum of $25.0 million. The Company’s banking subsidiaries were in compliance with FHLB rules and requirements as of December 31, 2015.
Regulatory Reform
The Dodd-Frank Wall Street Reform and Consumer Protection Act (the “Dodd-Frank Act”), which was enacted in July 2010, has significantly changed the financial regulatory landscape in the United States. Many of the Dodd-Frank Act’s provisions are subject to final rulemaking by the U.S. financial regulatory agencies. While many of the regulations that directly affect the Company’s businesses have been adopted, the full impact of the Dodd-Frank Act will depend to a large extent on how such rules are phased-in and implemented by the primary U.S. financial regulatory agencies. The Company continues to analyze the impact of rules adopted under the Dodd-Frank Act on the Company’s businesses. However, the full impact will not be known until the rules, and other regulatory initiatives that overlap with the rules are finalized and their combined impacts can be understood. Because the Company has total consolidated assets of less than $50 billion, the Company will be exempt from certain provisions of the Dodd-Frank Act which pertain only to larger institutions.
The Dodd-Frank Act broadened the base for FDIC insurance assessment, as discussed in greater detail below. The legislation also contained provisions impacting publicly-traded companies generally, such as requirements that companies give shareholders a non-binding vote on executive compensation and “golden parachute” payments, and include numerous additional compensation-related disclosures in their proxy materials. As required by the Dodd-Frank Act, the FRB and other federal banking regulators promulgated rules prohibiting excessive compensation paid to bank holding company executives, regardless of whether the company is publicly traded. The Dodd-Frank Act established a new Bureau of Consumer Financial Protection (“CFPB”) with broad powers to supervise and enforce consumer protection laws. The CFPB has broad rule-making authority for a wide range of consumer protection laws that apply to all banks and savings institutions, including the authority to prohibit “unfair, deceptive or abusive” acts and practices. The CFPB has examination and enforcement authority over all banks and savings institutions with more than $10 billion in assets. The Company and its subsidiaries are required to comply with the rules of the CFPB, however these rules are enforced by our primary regulators, the FRB and the FDIC, not the CFPB.
The Dodd-Frank Act requires that any interchange transaction fee charged for a debit transaction be reasonable and proportional to the cost incurred by the issuer for the transaction. FRB regulations mandated by the Dodd-Frank Act limit interchange fees on debit cards to a maximum of 21 cents per transaction plus 5 basis points of the transaction amount. Issuers that, together with their affiliates, have less than $10 billion of assets, such as the Company, are exempt from the debit card interchange fee standards. However, FRB regulations prohibit all issuers, including the Company and its banking subsidiaries, from restricting the number of networks over which electronic debit transactions may be processed to less than two unaffiliated networks.
The Dodd-Frank Act also required the federal financial regulatory agencies to adopt rules that prohibit banks and their affiliates from engaging in proprietary trading and investing in and sponsoring certain unregistered investment companies (defined as hedge funds and private equity funds). The statutory provision is commonly called the “Volcker Rule.” Compliance with the Volker Rule is generally required by July 21, 2017. The Volker Rule is not expected to have a material effect on the Company.
Bank Holding Company Regulation
In general, the BHC Act limits the business of bank holding companies to banking, managing or controlling banks and other activities that the FRB has determined to be so closely related to banking as to be a proper incident thereto. In addition, bank holding companies that qualify and elect to be financial holding companies may engage in any activity, or acquire and retain the shares of a company engaged in any activity, that is either (i) financial in nature or incidental to such financial activity (as determined by the FRB in consultation with the Secretary of the Treasury) or (ii) complementary to a financial activity and does not pose a substantial risk to the safety and soundness of depository institutions or the financial system generally (as solely determined by the Federal Reserve Board), without prior approval of the FRB. Activities that are financial in nature include securities underwriting and dealing, insurance underwriting and making merchant banking investments. The Company is registered as a financial holding company.
5
To maintain financial holding company status, a financial holding company and all of its depository institution subsidiaries must be “well capitalized” and “well managed.” A depository institution subsidiary is considered to be “well capitalized” if it satisfies the requirements for this status discussed in the section captioned “Capital Adequacy and Prompt Corrective Action,” included elsewhere in this item. A depository institution subsidiary is considered “well managed” if it received a composite rating and management rating of at least “satisfactory” in its most recent examination. A financial holding company’s status will also depend upon it maintaining its status as “well capitalized” and “well managed’ under applicable FRB regulations. If a financial holding company ceases to meet these capital and management requirements, the FRB’s regulations provide that the financial holding company must enter into an agreement with the FRB to comply with all applicable capital and management requirements. Until the financial holding company returns to compliance, the FRB may impose limitations or conditions on the conduct of its activities, and the company may not commence any of the broader financial activities permissible for financial holding companies or acquire a company engaged in such financial activities without prior approval of the FRB. If the company does not return to compliance within 180 days, the FRB may require divestiture of the holding company’s depository institutions. Bank holding companies and banks must also be both well capitalized and well managed in order to acquire banks located outside their home state.
In order for a financial holding company to commence any new activity permitted by the BHC Act or to acquire a company engaged in any new activity permitted by the BHC Act, each insured depository institution subsidiary of the financial holding company must have received a rating of at least “satisfactory” in its most recent examination under the Community Reinvestment Act (“CRA”). See the section captioned “Community Reinvestment Act” included elsewhere in this item.
The FRB has the power to order any bank holding company or its subsidiaries to terminate any activity or to terminate its ownership or control of any subsidiary when the FRB has reasonable grounds to believe that continuation of such activity or such ownership or control constitutes a serious risk to the financial soundness, safety or stability of any bank subsidiary of the bank holding company.
Share Repurchases and Dividends
Under FRB regulations, the Company may not, without providing prior notice to the FRB, purchase or redeem its own common stock if the gross consideration for the purchase or redemption, combined with the net consideration paid for all such purchases or redemptions during the preceding twelve months, is equal to ten percent or more of the Company’s consolidated net worth.
FRB regulations provide that dividends shall not be paid except out of current earnings and unless the prospective rate of earnings retention by the Company appears consistent with its capital needs, asset quality, and overall financial condition. Tompkins’ primary source of funds to pay dividends on its common stock is dividends from its subsidiary banks. The subsidiary banks are subject to regulations that restrict the dividends that they may pay to Tompkins.
Transactions with Affiliates and Other Related Parties
There are Federal laws and regulations that govern transactions between the Company’s non-bank subsidiaries and its banking subsidiaries including Sections 23A and 23B of the Federal Reserve Act and related regulations. These laws establish certain quantitative limits and other prudent requirements for loans, purchases of assets, and certain other transactions between a member bank and its affiliates. In general, transactions between the banking subsidiaries and its non-bank subsidiaries must be on terms and conditions, including credit standards, that are substantially the same or at least as favorable to the banking subsidiaries as those prevailing at the time for comparable transactions involving non-affiliated companies. The Dodd-Frank Act significantly expanded the coverage and scope of the limitations on affiliate transactions within a banking organization.
The Company’s authority to extend credit to its directors, executive officers and 10% shareholders, as well as to entities controlled by such persons, is governed by the requirements of Sections 22(g) and 22(h) of the Federal Reserve Act and Regulation O as promulgated by the FRB. Among other things, these provisions require that extensions of credit to insiders (i) be made on terms that are substantially the same as, and follow credit underwriting procedures that are not less stringent than, those prevailing for comparable transactions with unaffiliated persons and that do not involve more than the normal risk of repayment or present other unfavorable features; and (ii) not exceed certain limitations on the amount of credit extended to such persons, individually and in the aggregate, which limits are based, in part, on the amount of the Bank’s capital. In addition, extensions of credit in excess of certain limits must be approved by the Bank’s board of directors.
6
Mergers and Acquisitions
The BHC Act, the Bank Merger Act and other federal and state statutes regulate acquisitions of commercial banks. The BHC Act requires the prior approval of the FRB for the direct or indirect acquisition by a bank holding company of more than 5.0% of the voting shares of a commercial bank or its parent holding company. Under the Bank Merger Act, the prior approval of the FRB or other appropriate bank regulatory authority is required for a member bank to merge with another bank or purchase the assets or assume the deposits of another bank. In reviewing applications seeking approval of merger and acquisition transactions, the bank regulatory authorities will consider, among other things, the competitive effect and public benefits of the transactions, the capital position of the combined organization, the risks to the stability of the U.S. banking or financial system, the applicant’s performance record under the CRA (see the section captioned “Community Reinvestment Act” included elsewhere in this item) and fair housing laws and the effectiveness of the subject organizations in combating money laundering activities.
Support of Subsidiary Banks
The Dodd-Frank Act codified the FRB’s longstanding policy of requiring bank holding companies to act as a source of financial and managerial strength to their subsidiary banks, as a statutory requirement. Under this requirement, Tompkins is expected to commit resources to support its banking subsidiaries, including at times when it may not be advantageous for Tompkins to do so. Any capital loans by a bank holding company to any of its subsidiary banks are subordinated in right of payment to deposits and to certain other indebtedness of such subsidiary banks. In the event of a bank holding company’s bankruptcy, any commitment by the bank holding company to a federal bank regulatory agency to maintain the capital of a subsidiary bank will be assumed by the bankruptcy trustee and entitled to priority of payment.
Liability of Commonly Controlled Institutions
FDIC-insured depository institutions can be held liable for any loss incurred, or reasonably expected to be incurred, by the FDIC due to the default of an FDIC-insured depository institution controlled by the same bank holding company, or for any assistance provided by the FDIC to an FDIC-insured depository institution controlled by the same bank holding company that is in danger of default. “Default” means generally the appointment of a conservator or receiver. “In danger of default” means generally the existence of certain conditions indicating that default is likely to occur in the absence of regulatory assistance.
Capital Adequacy and Prompt Corrective Action
In July 2013, the FRB approved and published the final Basel III Capital Rules establishing a new comprehensive capital framework for U.S. banking organizations. The rules implement the Basel Committee’s December 2010 framework known as “Basel III” for strengthening international capital standards as well as certain provisions of the Dodd-Frank Act. The Basel III Capital Rules substantially revised the risk-based capital requirements applicable to bank holding companies and depository institutions, including Tompkins, compared to the existing U.S. risk-based capital rules. The Basel III Capital Rules define the components of capital and address other issues affecting the numerator in banking institutions’ regulatory capital ratios. The Basel III Capital Rules also address risk weights and other issues affecting the denominator in banking institutions’ regulatory capital ratios and replace the existing risk-weighting approach, which was derived from the Basel I capital accords of the Basel Committee, with a more risk-sensitive approach based, in part, on the standardized approach in the Basel Committee’s 2004 “Basel II” capital accords. The Basel III Capital Rules also implement the requirements of Section 939A of the Dodd-Frank Act to remove references to credit ratings from the federal banking agencies’ rules. The Basel III Capital Rules became effective for Tompkins on January 1, 2015 (subject to a phase-in period).
The Basel III Capital Rules, among other things, (i) introduce a new capital measure called “Common Equity Tier 1” (“CET1”), (ii) specify that Tier 1 capital consists of CET1 and “Additional Tier 1 capital” instruments meeting specified requirements, (iii) define CET1 narrowly by requiring that most deductions/adjustments to regulatory capital measures be made to CET1 and not to the other components of capital and (iv) expand the scope of the deductions/adjustments as compared to existing regulations.
Under the Basel III Capital Rules, the initial minimum capital ratios as of January 1, 2015 are as follows:
| · | 4.0% Tier 1 capital ratio to average consolidated assets (known as the “leverage ratio”) |
| · | 4.5% CET1 to risk-weighted assets; |
| · | 6.0% Tier 1 capital (that is, CET1 plus Additional Tier 1 capital) to risk-weighted assets; |
| · | 8.0% Total capital (that is, Tier 1 capital plus Tier 2 capital) to risk-weighted assets; and |
When fully phased in on January 1, 2019, the Basel III Capital Rules will require Tompkins to maintain (i) a minimum ratio of CET1 to risk-weighted assets of at least 4.5%, plus a 2.5% “capital conservation buffer” (which when fully phased in, effectively results in a minimum ratio of CET1 to risk-weighted assets of at least 7%), (ii) a minimum ratio of Tier 1 capital to risk-weighted assets of at least 6.0%, plus the capital conservation buffer (which when fully phased in, effectively results in a minimum Tier 1 capital ratio of 8.5%), (iii) a minimum ratio of Total capital (that is, Tier 1 plus Tier 2) to risk-weighted assets of at least 8.0%, plus the capital conservation buffer (which when fully phased in, effectively results in a minimum total capital ratio of 10.5%) and (iv) a minimum leverage ratio of 4.0%, calculated as the ratio of Tier 1 capital to average assets.
7
The Basel III Capital Rules also provide for a “countercyclical capital buffer” that is applicable to only certain covered institutions and is not expected to have any current applicability to Tompkins.
The aforementioned capital conservation buffer is designed to absorb losses during periods of economic stress. Banking institutions with a ratio of CET1 to risk-weighted assets above the minimum but below the conservation buffer (or below the combined capital conservation buffer and countercyclical capital buffer, when the latter is applied) will face constraints on dividends, equity repurchases and compensation based on the amount of the shortfall.
The Basel III Capital Rules impose stricter regulatory capital deductions from and adjustments to capital, with most deductions and adjustments taken against CET1 capital. These include, for example, the requirement that (i) mortgage servicing assets, net of associated deferred tax liabilities; (ii) deferred tax assets, which cannot be realized through net operating loss carrybacks, net of any relative valuation allowances and net of deferred tax liabilities; and (iii) significant investments (i.e. 10% or more ownership) in unconsolidated financial institutions be deducted from CET1 to the extent that any one such category exceeds 10% of CET1 or all such categories in the aggregate exceed 15% to CET1. Under the Basel III Capital Rule, the effect of certain accumulated other comprehensive items are not excluded, which could result in significant variations in the level of capital depending upon the impact of interest rate fluctuations on the fair value of the Company’s securities portfolio. Contained within the rule was a one-time option to permanently opt-out of the inclusion of accumulated other comprehensive income in the capital calculation based upon asset size. Tompkins decided to opt out of this requirement in January 2015.
The Basel III Capital Rules also require the phase-out of certain hybrid securities, such as trust preferred securities, as Tier 1 capital of bank holding companies in equal installments between 2013 and 2016. Trust preferred securities no longer included in Tier 1 capital may nonetheless be included as a component of Tier 2 capital. However, because the trust preferred securities of Tompkins were issued prior to May 19, 2010, and because Tompkins’ total consolidated assets were less than $15.0 billion as of December 31, 2009, our trust preferred securities are permanently grandfathered under the final rule and may continue to be included as Tier 1 capital.
Implementation of the deductions and other adjustments to CET1 began on January 1, 2015 and will be phased-in over a four-year period (beginning at 40% on January 1, 2015 and an additional 20% per year thereafter). The implementation of the capital conservation buffer began on January 1, 2016 at the 0.625% level and will be phased in over a four-year period (increasing by that amount on each subsequent January 1, until it reaches 2.5% on January 1, 2019).
In addition, the Basel III Capital Rules provide more advantageous risk weights for derivatives and repurchase-style transactions cleared through a qualifying central counterparty and increase the scope of eligible guarantors and eligible collateral for purposes of credit risk mitigation.
The Standardized Approach Proposal expands the risk-weighting categories from the current four Basel I-derived categories (0%, 20%, 50% and 100%) to a much larger and more risk-sensitive number of categories, depending on the nature of the assets, generally ranging from 0% for U.S. government and agency securities, to 600% for certain equity exposures, and resulting in higher risk weights for a variety of asset categories, including many residential mortgages and certain commercial real estate. Specifics include, among other things:
| - | Applying a 150% risk weight instead of a 100% risk weight for certain high volatility commercial real estate acquisition, development and construction loans. |
| - | For residential mortgage exposures, the current approach of a 50% risk weight for high-quality seasoned mortgages and a 100% risk-weight for all other mortgages is replaced with a risk weight of between 35% and 200% depending upon the mortgage’s loan-to-value ratio and whether the mortgage is a “category 1” or “category 2” residential mortgage exposure (based on eight criteria that include the term, use of negative amortization, balloon payments and certain rate increases). |
| - | Assigning a 150% risk weight to exposures (other than residential mortgage exposures) that are 90 days past due. |
| - | Providing for a 20% credit conversion factor for the unused portion of a commitment with an original maturity of one year or less that is not unconditionally cancellable (currently set at 0%). |
8
| - | Providing for a risk weight, generally not less than 20% with certain exceptions, for securities lending transactions based on the risk weight category of the underlying collateral securing the transaction. |
| - | Providing for a 100% risk weight for claims on securities firms. |
| - | Eliminating the current 50% cap on the risk weight for OTC derivatives. |
With respect to the Company’s banking subsidiaries, the Basel III Capital Rules revised the “prompt corrective action” (“PCA”) regulations adopted pursuant to Section 38 of the FDIA, by: (i) introducing a CET1 ratio requirement at each PCA category (other than critically undercapitalized), with the required CET1 ratio being 6.5% for well-capitalized status; (ii) increasing the minimum Tier 1 capital ratio requirement for each category, with the minimum Tier 1 capital ratio for well-capitalized status being 8% (as compared to 6%); and (iii) eliminating the provision that permitted a bank with a composite supervisory rating of 1 and a 3% leverage ratio to be considered adequately capitalized. The Capital Rules did not change the total risk-based capital requirement for any PCA category.
Management believes that the Company is in compliance, and will continue to be in compliance, with the targeted capital ratios as such requirements are phased in.
For further information concerning the regulatory capital requirements, actual capital amounts and the ratios of Tompkins and its bank subsidiaries, see the discussion in “Note 20 - Regulations and Supervision” in Notes to Consolidated Financial Statements in Part II, Item 8. of this Report.
Deposit Insurance
Substantially all of the deposits of the Company’s banking subsidiaries are insured up to applicable limits by the Deposit Insurance Fund (“DIF”) of the FDIC and are subject to deposit insurance assessments to maintain the DIF. The Dodd-Frank Act permanently increased the maximum amount of deposit insurance to $250,000 per deposit category, per depositor, per institution retroactive to January 1, 2008.
The Company’s banking subsidiaries pay deposit insurance premiums to the FDIC based on assessment rates established by the FDIC. The assessment rates are based upon the risk the institution poses to the Deposit Insurance Fund, or DIF. Under this assessment system, risk is defined and measured using an institution’s supervisory ratings with other risk measures, including financial ratios. The current total base assessment rates on an annualized basis range from 2.5 basis points for certain “well-capitalized,” “well-managed” banks, with the highest ratings, to 45 basis points for institutions posing the most risk to the DIF. The FDIC may raise or lower these assessment rates on a quarterly basis based on various factors to achieve a reserve ratio, which the Dodd-Frank Act has mandated to be no less than 1.35 percent of insured deposits. In 2011, the FDIC redefined the deposit insurance assessment base to equal average consolidated total assets minus average tangible equity as required by the Dodd-Frank Act.
FDIC insurance expense totaled $3.0 million, $2.9 million and $3.2 million in 2015, 2014 and 2013, respectively. FDIC insurance expense includes deposit insurance assessments, assessments related to participation in the Temporary Liquidity Guaranty Program (“TLGP”) program, and Financing Corporation (“FICO”) assessments related to outstanding FICO bonds. FICO is a mixed-ownership government corporation established by the Competitive Equality Banking Act of 1987 whose sole purpose was to function as a financing vehicle for the now defunct Federal Savings & Loan Insurance Corporation. The Company paid FICO assessments of $288,000 in 2015, $282,000 in 2014, and $286,000 in 2013.
Depositor Preference
The Federal Deposit Insurance Act provides that, in the event of the “liquidation or other resolution” of an insured depository, the claims of depositors of the institution, including the claims of the FDIC, as subrogee of the insured depositors, and certain claims for administrative expenses of the FDIC as receiver, will have priority over other general unsecured claims against the institution. If an insured depository institution fails, insured and uninsured depositors, along with the FDIC, will have priority in payment ahead of unsecured, non-deposit creditors, including the parent bank holding company, with respect to any extensions of credit they have made to such insured depository institutions.
Community Reinvestment Act
The Company’s subsidiary banks are subject to the Community Reinvestment Act (“CRA”) and to certain fair lending and reporting requirements that relate to home mortgage lending. The CRA requires the federal banking regulators to assess the record of a financial institution in meeting the credit needs of the local communities, including low-and moderate-income neighborhoods, consistent with the safe and sound operation of the bank. The federal agencies consider an institution’s performance under the CRA in evaluating applications for mergers and acquisitions, and new offices. The ratings assigned by the federal agencies are publicly disclosed. As of December 31, 2015 the Company’s subsidiary banks all had ratings of satisfactory or better.
9
Sarbanes-Oxley Act of 2002
The Sarbanes-Oxley Act of 2002 implemented a broad range of corporate governance, accounting and reporting requirements for companies that have securities registered under the Exchange Act. These requirements include: (1) requirements for audit committees, including independence and financial expertise; (2) certification of financial statements by the chief executive officer and chief financial officer of the reporting company; (3) standards for auditors and regulation of audits; (4) disclosure and reporting requirements for the reporting company and directors and executive officers; and (5) a range of civil and criminal penalties for fraud and other violations of securities laws.
The USA Patriot Act
The Uniting and Strengthening America by Providing Appropriate Tools Required to Intercept and Obstruct Terrorism Act of 2001 (“USA Patriot Act”) imposes obligations on financial institutions, including banks and broker-dealer subsidiaries to implement policies, procedures and controls which are reasonably designed to detect and report instances of money laundering and the financing of terrorism. Failure of a financial institution to maintain and implement adequate programs to combat money laundering and terrorist financing, or to comply with all of the relevant laws or regulations, could have serious legal and reputational consequences for the institution, including causing applicable bank regulatory authorities not to approve merger or acquisition transactions when regulatory approval is required or to prohibit such transactions even if approval is not required.
Financial Privacy
In accordance with the Gramm Leach Bliley Act, federal banking regulators adopted rules that limit the ability of banks and other financial institutions to disclose non-public information about consumers to non-affiliated third parties. These limitations require disclosure of privacy policies to consumers and, in some circumstances, allow consumers to prevent disclosure of certain personal information to a non-affiliated third party. These provisions affect how consumer information is transmitted through diversified financial companies and conveyed to outside vendors.
Office of Foreign Assets Control Regulation
The United States has imposed economic sanctions that affect transactions with designated foreign countries, nationals and others. These are known as the “OFAC” rules based on their administration by the US Treasury Department Office of Foreign Assets Control (“OFAC”). The OFAC-administered sanctions take many forms. Generally, however, they include restrictions on trade with or investment in a sanctioned country and a blocking of assets in which the government or specially designated nationals of the sanctioned country have an interest.
Consumer Protection Laws
In connection with their lending and leasing activities, the Company’s banking subsidiaries are subject to a number of federal and state laws designed to protect borrowers and promote lending. These laws include the Equal Credit Opportunity Act, the Fair Credit Reporting Act, the Fair and Accurate Credit Transaction Act of 2003, the Truth in Lending Act, the Home Mortgage Disclosure Act, and the Real Estate Settlement Procedures Act, and similar laws at the State level.
On January 10, 2013, the CFPB issued a final rule implementing the ability-to-repay and qualified mortgage (QM) provisions of the Truth in Lending Act, as amended by the Dodd-Frank Act (the “QM Rule”). The QM Rule provides that a lender making a special type of loan, known as a Qualified Mortgage, is entitled to presume that the loan complies with the ATR safe harbor requirements. The QM Rule establishes different types of Qualified Mortgages that are generally identified as loans with restriction on loan features, limits or fees being changed and underwriting requirements. The QM Rule is effective for loan applications taken on or after January 1, 2014.
Cybersecurity
In March 2015, federal regulators issued two related statements regarding cybersecurity. One statement indicates that financial institutions should design multiple layers of security controls to establish lines of defense and to ensure that their risk management processes also address the risk posed by compromised customer credentials, including security measures to reliably authenticate customers accessing internet-based services of the financial institution. The other statement indicates that a financial institution’s management is expected to maintain sufficient business continuity planning processes to ensure the rapid recovery, resumption and maintenance of the institution’s operations after a cyber-attack involving destructive malware. A financial institution is also expected to develop appropriate processes to enable recovery of data and business operations and address rebuilding network capabilities and restoring data if the institution or its critical service providers fall victim to this type of cyber-attack. If we fail to observe the regulatory guidance, we could be subject to various regulatory sanctions, including financial penalties.
10
In the ordinary course of business, Tompkins relies on electronic communications and information systems to conduct our operations and to store sensitive data. Tompkins employs an in-depth, layered, defensive approach that leverages people, processes and technology to manage and maintain cybersecurity controls. Tompkins employs a variety of preventative and detective tools to monitor, block, and provide alerts regarding suspicious activity, as well as to report on any suspected advanced persistent threats. Notwithstanding the strength of our defensive measures, the threat from cyber attacks is severe, attacks are sophisticated and increasing in volume, and attackers respond rapidly to changes in defensive measures. While to date, Tompkins has not experienced a significant compromise, significant data loss or any material financial losses related to cybersecurity attacks, our systems and those of our customers and third-party service providers are under constant threat and it is possible that we could experience a significant event in the future. Risks and exposures related to cybersecurity attacks are expected to remain high for the foreseeable future due to the rapidly evolving nature and sophistication of these threats, as well as due to the expanding use of Internet banking, mobile banking and other technology-based products and services by us and our customers. See Item 1A. Risk Factors for a further discussion of risks related to cybersecurity.
Incentive Compensation
The Dodd-Frank Act required the federal bank regulatory agencies and the SEC to establish joint regulations or guidelines prohibiting incentive-based payment arrangements at specified regulated entities, such as the Company, having at least $1 billion in total assets that encourage inappropriate risks by providing an executive officer, employee, director or principal shareholder with excessive compensation, fees, or benefits or that could lead to material financial loss to the entity. In addition, these regulators must establish regulations or guidelines requiring enhanced disclosure to regulators of incentive-based compensation arrangements. The agencies proposed such regulations in 2011, but the regulations have not been finalized. Officials from the FRB have recently indicated that the U.S. banking regulators are in the process of preparing for public comment a new rule on incentive compensation. If these or other regulations are adopted in a form similar to that initially proposed, they will impose limitations on the manner in which the Company may structure compensation for its executives. Given the uncertainty at this time whether or when a final rule will be adopted, management cannot determine the potential impact on the Company.
In 2010, the FRB, OCC and FDIC issued comprehensive final guidance on incentive compensation policies intended to ensure that the incentive compensation policies of banking organizations do not undermine the safety and soundness of such organizations by encouraging excessive risk-taking. The guidance, which covers all employees that have the ability to materially affect the risk profile of an organization, either individually or as part of a group, is based upon the key principles that a banking organization’s incentive compensation arrangements should (i) provide incentives that do not encourage risk-taking beyond the organization’s ability to effectively identify and manage risks, (ii) be compatible with effective internal controls and risk management, and (iii) be supported by strong corporate governance, including active and effective oversight by the organization’s board of directors. Management believes the current and past compensation practices of the Company do not encourage excessive risk taking or undermine the safety and soundness of the organization.
The FRB will review, as part of the regular, risk-focused examination process, the incentive compensation arrangements of banking organizations, such as the Company, that are not “large, complex banking organizations.” These reviews will be tailored to each organization based on the scope and complexity of the organization’s activities and the prevalence of incentive compensation arrangements. The findings of the supervisory initiatives will be included in reports of examination. Deficiencies will be incorporated into the organization’s supervisory ratings, which can affect the organization’s ability to make acquisitions and take other actions. Enforcement actions may be taken against a banking organization if its incentive compensation arrangements, or related risk-management control or governance processes, pose a risk to the organization’s safety and soundness and the organization is not taking prompt and effective measures to correct the deficiencies.
Other Legislative Initiatives
From time to time, various legislative and regulatory initiatives are introduced in Congress and state legislatures, as well as by regulatory authorities. These initiatives may include proposals to expand or contract the powers of bank holding companies and depository institutions or proposals to change the financial institution regulatory environment. Such legislation could change banking laws and the operating environment of Tompkins in substantial, but unpredictable ways. We cannot predict whether any such legislation will be enacted, and, if enacted, the effect that it, or any implementing regulations would have on our financial condition or results of operations.
Employees
At December 31, 2015, the Company had 1,038 employees, approximately 117 of whom were part-time. No employees are covered by a collective bargaining agreement and the Company believes its employee relations are excellent.
11
Available Information
The Company maintains a website at www.tompkinsfinancial.com. The Company makes available free of charge through its website its annual reports on Form 10-K, quarterly reports on Form 10-Q, current reports on Form 8-K, its proxy statements related to its shareholders’ meetings, and amendments to these reports or statements, filed or furnished pursuant to Section 13(a) or 15(d) of the Exchange Act, as soon as reasonably practicable after the Company electronically files such material with, or furnishes such material to, the SEC. Copies of these reports are also available at no charge to any person who requests them, with such requests directed to Tompkins Financial Corporation, Investor Relations Department, The Commons, Ithaca, New York 14851, telephone no. (888) 503-5753. Materials that the Company files with the SEC may be read and copied at the SEC’s Public Reference Room at 100 F Street, NE, Washington, D.C. 20549. This information may also be obtained by calling the SEC at 1-800-SEC-0330. The SEC also maintains an Internet website that contains reports, proxy and information statements and other information regarding issuers that file electronically with the SEC at www.sec.gov. The Company is not including the information contained on the Company’s website as a part of, or incorporating it by reference into, this Annual Report on Form 10-K, or into any other report filed with or furnished to the SEC by the Company.
The Company’s business, operating results, financial condition, liquidity, and cash flow may be impacted by numerous factors, including but not limited to those discussed below. These items may cause the Company’s results to vary materially from recent results.
Risks Related to the Company’s Business
Repayment of the Company’s commercial business loans is often dependent on the cash flows of the borrower, which may be difficult to predict, and the collateral securing these loans may fluctuate in value.
The Company offers different types of commercial loans to a variety of businesses. Real estate lending is generally considered to be collateral based lending with loan amounts based on predetermined loan to collateral values. As such, declines in real estate valuations in the Company’s market area would lower the value of the collateral securing these loans. The Company’s commercial business loans are primarily made based on the cash flow of the borrower and secondarily on the underlying collateral provided by the borrower, with liquidation of the underlying real estate collateral being viewed as the primary source of repayment in the event of borrower default. The borrowers’ cash flow may be difficult to predict, and collateral securing these loans may fluctuate in value. The repayment of commercial business loans depends primarily on the cash flow and credit worthiness of the borrower and secondarily on the underlying collateral provided by the borrower. Although commercial business loans are often collateralized by equipment, inventory, accounts receivable, or other business assets, the liquidation of collateral in the event of default is often an insufficient source of repayment. As of December 31, 2015, commercial and commercial real estate loans totaled $2.6 billion or 68.7% of total loans.
As part of the Company’s commercial business lending activities, the Company originates agricultural loans, consisting of agricultural real estate loans and agricultural operating loans. As of December 31, 2015, $177.3 million or 4.7% of the Company’s total loan portfolio consisted of agriculturally-related loans, including $89.0 million in agricultural real estate loans and $88.3 million in agricultural operating loans. Payments on agricultural loans, primarily dairy loans, are dependent on the profitable operation or management of the related farm property. The success of the farm may be affected by many factors outside the control of the borrower, including adverse weather conditions that prevent the planting of a crop or limit crop yields, declines in market prices for agricultural products and the impact of governmental regulations and subsidies. Many farms are dependent upon a limited number of key individuals whose injury or death may significantly affect the successful operation of the farm. If the cash flow from a farming operation is diminished, the borrower’s ability to repay the loan may be impaired. While agricultural operating loans are generally secured by a blanket lien on the farm’s operating assets, any repossessed collateral in respect of a defaulted loan may not provide an adequate source of repayment of the outstanding balance.
12
Declines in asset values may result in impairment charges and may adversely affect the value of the Company’s investments, financial performance, and capital.
A majority of the Company’s investment portfolio is comprised of securities which are collateralized by residential mortgages. These residential mortgage-backed securities include securities of U.S. government agencies, U.S. government-sponsored entities, and private-label collateralized mortgage obligations (“CMOs”). The Company’s securities portfolio also includes obligations of U.S. government-sponsored entities, obligations of states and political subdivisions thereof, U.S. corporate debt securities and equity securities. A more detailed discussion of the investment portfolio, including types of securities held, the carrying and fair values, and contractual maturities is provided in the Notes to Consolidated Financial Statements in Part II, Item 8 of this Report. The fair value of investments may be affected by factors other than the underlying performance of the issuer or composition of the obligations themselves, such as rating downgrades, adverse changes in the business climate and a lack of liquidity for resale of certain investment securities. The Company periodically, but not less than quarterly, evaluates investments and other assets for impairment indicators. Under U.S. generally accepted accounting principles, declines in the fair value of held-to-maturity and available-for-sale securities below their cost that are deemed to be other than temporary are reflected in earnings to the extent the impairment is related to credit losses. The amount of the impairment related to other non-credit related factors for available-for-sale securities is recognized in other comprehensive income provided that the Company does not intend to sell the underlying debt security and it is more-likely-than not that the Company would not have to sell the debt security prior to recovery of the unrealized loss, which may be to maturity. If the Company intended to sell any securities with an unrealized loss or it is more-likely-than not that the Company would be required to sell the investment securities, before recovery of their amortized cost basis, then the entire unrealized loss would be recorded in earnings. The fair value of certain investments in the Company’s securities portfolio, and the amount of any recorded charges for other-than-temporary impairment (“OTTI”) during the most recent fiscal year, are discussed in Part II, Item 8 of this Report on Form 10-K. Given the market conditions and the significant judgments involved, there is risk that further declines in fair value may occur and additional OTTI charges may be recorded in earnings in future periods.
As of December 31, 2015, the Company had $104.2 million of goodwill and other intangible assets. The Company is required to test our goodwill for impairment on a periodic basis. A significant decline in the Company’s expected future cash flows, a significant adverse change in business climate, slower growth rates or a significant and sustained decline in the price of the Company’s common stock, may necessitate taking charges in the future related to the impairment of the Company’s goodwill and intangible assets. If an impairment determination is made in a future reporting period, the Company’s earnings and the book value of these intangible assets would be reduced by the amount of the impairment.
The Company may be adversely affected by the soundness of other financial institutions.
Financial services institutions are interrelated as a result of counterparty relationships. The Company has exposure to many different industries and counterparties, and routinely executes transactions with counterparties in the financial services industry. The most important counterparty for the Company, in terms of liquidity, is the Federal Home Loan Bank of New York (“FHLBNY”). The Company also has a relationship with the Federal Home Loan Bank of Pittsburgh (“FHLBPITT”). The Company uses FHLBNY as its primary source of overnight funds and also has long-term advances and repurchase agreements with FHLBNY. The Company has placed sufficient collateral in the form of commercial and residential real estate loans at FHLBNY. In addition, the Company is required to hold stock in FHLBNY and FHLBPITT. The amount of borrowed funds and repurchase agreements with the FHLBNY and FHLBPITT, and the amount of FHLBNY and FHLBPITT stock held by the Company, at its most recent fiscal year-end are discussed in Part II, Item 8 of this Report on Form 10-K.
There are 12 branches of the FHLB, including New York and Pittsburgh. The FHLBNY and the FHLBPITT are jointly and severally liable along with the other Federal Home Loan Banks for the consolidated obligations issued on behalf of the Federal Home Loan Banks through the Office of Finance. Dividends on, redemption of, or repurchase of shares of the FHLBNY’s or FHLBPITT’s capital stock cannot occur unless the principal and interest due on all consolidated obligations have been paid in full. If another Federal Home Loan Bank were to default on its obligation to pay principal or interest on any consolidated obligations, the Federal Home Loan Finance Agency (the “Finance Agency”) may allocate the outstanding liability among one or more of the remaining Federal Home Loan Banks on a pro rata basis or on any other basis the Finance Agency may determine. As a result, the FHLBNY’s or FHLBPITT’s ability to pay dividends on, to redeem, or to repurchase shares of capital stock could be affected by the financial condition of one or more of the other Federal Home Loan Banks. To the Company’s knowledge, no Federal Home Loan Bank has ever defaulted on its debt since the FHLB System was established in 1932, but there can be no assurance that such a default will not occur in the future.
Systemic weakness in the FHLB could result in higher costs of FHLB borrowings, reduced value of FHLB stock, and increased demand for alternative sources of liquidity that are more expensive, such as brokered time deposits, the discount window at the Federal Reserve, or lines of credit with correspondent banks.
The Company relies on cash dividends from its subsidiaries to fund its operations, and payment of those dividends could be discontinued at any time.
The Company is a financial holding company whose principal assets and sources of income are its wholly-owned subsidiaries. The Company is a separate and distinct legal entity from its subsidiaries, and therefore the Company relies primarily on dividends from these banking and other subsidiaries to meet its obligations and to provide funds for the payment of dividends to the Company’s shareholders, to the extent declared by the Company’s board of directors. Various federal and state laws and regulations limit the amount of dividends that a bank may pay to its parent company and impose regulatory capital and liquidity requirements on the Company and its banking subsidiaries. Further, as a holding company, the Company’s right to participate in a distribution of assets upon the liquidation or reorganization of a subsidiary is subject to the prior claims of the subsidiary’s creditors (including, in the case of the Company’s banking subsidiaries, the banks’ depositors). If the Company were unable to receive dividends from its subsidiaries it would materially and adversely affects the Company’s liquidity and its ability to service its debt, pay its other obligations, or pay cash dividends on its common or preferred stock.
13
The Company’s business may be adversely affected by conditions in the financial markets and local and national economies.
General economic conditions impact the banking and financial services industry. The Company’s financial performance generally, and in particular, the ability of borrowers to pay interest on and repay the principal of outstanding loans and the value of collateral securing these loans, is highly dependent upon the business environment in the markets where the Company operates. The Company serves numerous market areas within New York State and Pennsylvania, and the Company is dependent on the economic conditions of these two states. Unfavorable or uncertain economic and market conditions could lead to credit quality concerns related to repayment ability and collateral protection as well as reduced demand for the services offered by the Company’s three business segments. In recent years there has been gradual improvement in the U.S. economy as evidenced by a rebound in the housing market, lower unemployment and higher equities markets; however economic growth has been uneven and opinions vary on the strengthen and direction of the economy. A downturn in the economy or financial markets could adversely affect the credit quality of the Company’s loan portfolio, results of operations and financial condition.
Economic downturns could affect the volume of income from and demand for fee-based services, including investment services and insurance commissions and fees. Revenues from the trust and wealth management businesses are dependent on the level of assets under management. Market volatility that leads customers to pull money out of the market or lower equity and bond prices can reduce the Company’s assets under management and thereby decrease revenues. Revenue from insurance commissions and fees could be negatively affected by fluctuations in insurance premiums and other factors beyond the Company’s control, including changes in laws and regulations impacting the healthcare and insurance markets.
The Company is subject to interest rate risk.
The Company’s earnings, financial condition and liquidity are susceptible to fluctuations in market interest rates. This exposure is a result of assets and liabilities repricing at different times and by different amounts as interest rates change. Net interest income, which is the difference between interest earned on loans and investments and interest paid on deposits and borrowings, is the largest component of the Company’s total revenues. The level of net interest income is dependent upon the volume and mix of interest-earning assets and interest-bearing liabilities, the level of nonperforming assets, and the level and trend of interest rates. Changes in market interest rates will also affect the level of prepayments on the Company’s loans and payments on mortgage-backed securities, resulting in the receipt of proceeds that may be reinvested at a lower rate than the loan or mortgage-backed security being prepaid. Interest rates are highly sensitive to many factors, including: inflation, economic growth, employment levels, monetary policy and international markets. Significant fluctuations in interest rates could have a material adverse affect on the Company’s earnings, financial condition, and liquidity.
The Company manages interest rate risk using an income simulation to measure interest rate risk inherent in its on-balance sheet and off-balance sheet financial instruments at a given point in time by showing the potential effect of interest rate shifts on net interest income for future periods. Each quarter the Company’s Asset/Liability Management Committee reviews the simulation results to determine whether the exposure of net interest income to changes in interest rates remains within Board-approved levels. The Committee also discusses strategies to manage this exposure and incorporates these strategies into the investment and funding decisions of the Company. In addition, the Company has focused on expanding its fee-based business to help mitigate its exposure to fluctuations in interest rates, and the impact on the Company’s earnings.
For additional information about how the Company manages its interest rate risk, refer to Part II, Item 7A, “Quantitative and Qualitative Disclosures About Market Risk” of this Report.
The Company is subject to liquidity risk.
Liquidity risk refers to the Company’s ability to ensure sufficient cash flow and liquid assets are available to satisfy current and future financial obligations, including demand for loans and deposits withdrawals, funding operating costs, and for other corporate purposes. In addition to cash flow and short-term investments, the Company obtains funding through deposits and various short-term and long-term wholesale borrowings, including Federal funds purchased and securities sold under agreements to repurchase, brokered certificates of deposit, and borrowings from the FHLBNY and FHLBPITT and others. The Company also maintains available lines of credit with the FHLBNY and FHLBPITT that are secured by loans. Management closely monitors its liquidity position for compliance with internal policies and is comfortable that available sources of liquidity are adequate to meet funding needs in the normal course of business.
14
The Company operates in a highly regulated environment and may be adversely impacted by changes in laws and regulations.
The Company is subject to extensive state and federal laws and regulations, supervision, and legislation that affect how it conducts its business. The majority of these laws and regulations are for the protection of consumers, depositors and the deposit insurance funds. The regulations influence such things as the Company’s lending practices, capital structure, investment practices, and dividend policy. The Dodd-Frank Act, enacted in July 2010, represents a comprehensive overhaul of the financial services industry in the United States and requires federal agencies to implement many new rules. Many parts of the Dodd-Frank Act are now in effect, while others depend on rules that have yet to be adopted or implemented. Reforms, both under the Dodd-Frank Act and otherwise, will have a significant effect on the entire financial services industry. Although it is difficult to predict the magnitude and extent of these effects, compliance with new regulations and other initiatives will likely negatively impact revenue and increase the cost of doing business, both in terms of transition expenses and on an ongoing basis. Any new regulatory requirements or changes to existing requirements could require changes to the Company’s businesses, result in increased compliance costs and affect the profitability of such businesses. The Company has established an extensive internal control structure to ensure compliance with governing laws and regulations, including those related to financial reporting. Refer to “Supervision and Regulation” for additional information on material laws and regulations impacting the Company’s business.
As discussed above under the “Supervision and Regulation” section, under Basel III and the Dodd-Frank Act the federal banking agencies have established stricter risk-based capital requirements and leverage limits to apply to banks and bank holding companies. These requirements, and any other new regulations, could adversely affect the Company’s ability to pay dividends, or could require it to reduce business levels or to raise capital, including in ways that may adversely affect its results of operations or financial condition.
The Company operates in a highly competitive industry and market areas.
Competition for commercial banking and other financial services is strong in the Company’s market areas. In one or more aspects of its business, the Company’s subsidiaries compete with other commercial banks, savings and loan associations, credit unions, finance companies, Internet-based financial services companies, mutual funds, insurance companies, brokerage and investment banking companies, and other financial intermediaries. Some of these competitors have substantially greater resources and lending capabilities and may offer services that the Company does not currently provide. In addition, many of the Company’s non-bank competitors are not subject to the same extensive Federal regulations that govern financial holding companies and Federally insured banks. The Company focuses on providing unparalleled customer service, which includes offering a strong suite of products and services. Based upon our ability to grow our customer base in recent years, management feels that this business model does allow the Company to compete effectively in the markets it serves, but there can be no assurance that this business model will be successful.
The Company’s information systems may experience an interruption or breach in security.
In the ordinary course of business we rely on electronic communications and information system to conduct our operations and to store sensitive data. Any failure, interruption or breach in security of these systems could result in significant disruption to our operations. Information security breaches and cybersecurity-related incidents may include, but are not limited to, attempts to access information, including customer and company information, malicious code, computer viruses and denial of service attacks that could result in unauthorized access, misuse, loss or destruction of data (including confidential customer information), account takeovers, unavailability of service or other events. These types of threats may derive from human error, fraud or malice on the part of external or internal parties, or may result from accidental technological failure. Further, to access our products and services our customers may use computers and mobile devices that are beyond our security control systems. Our technologies, systems, networks and software, and those of other financial institutions have been, an are likely to continue to be, the target of cybersecurity threats and attacks, which may range from uncoordinated individual attempts to sophisticated and targeted measures directed at us. The risk of a security breach or disruption, particularly through cyber attack or cyber intrusion, has increased as the number, intensity and sophistication of attempted attacks and intrusions from around the world have increased.
Our business requires the collection and retention of large volumes of customer data, including personally identifiable information in various information systems that we maintain and in those maintained by third parties with whom we contract to provide data services. We also maintain important internal company data such as personally identifiable information about our employees and information relating to our operations. The integrity and protection of that customer and company data is important to us. Our collection of such customer and company data is subject to extensive regulation and oversight.
Our customers and employees have been, and will continue to be, targeted by parties using fraudulent e-mails and other communications in attempts to misappropriate passwords, bank account information or other personal information or to introduce viruses or other malware through "Trojan horse" programs to our information systems and/or our customers' computers. Though we endeavor to mitigate these threats through product improvements, use of encryption and authentication technology and customer and employee education, such cyber attacks against us or incidents in general and the risks of cyber crime are complex and continue to evolve. More generally, publicized information concerning security and cyber-related problems could inhibit the use or growth of electronic or web-based applications or solutions as a means of conducting commercial transactions.
Although we make significant efforts to maintain the security and integrity of our information systems and have implemented various measures to manage the risk of a security breach or disruption, there can be no assurance that our security efforts and measures will be effective or that attempted security breaches or disruptions would not be successful or damaging. Even the most well protected information, networks, systems and facilities remain potentially vulnerable because attempted security breaches, particularly cyber attacks and intrusions, or disruptions will occur in the future, and because the techniques used in such attempts are constantly evolving and generally are not recognized until launched against a target, and in some cases are designed not to be detected and, in fact, may not be detected. Accordingly, we may be unable to anticipate these techniques or to implement adequate security barriers or other preventative measures, and thus it is virtually impossible for us to entirely mitigate this risk. While we maintain specific “cyber” insurance coverage, which would apply in the event of various breach scenarios, the amount of coverage may not be adequate in any particular case. Furthermore, because cyber threat scenarios are inherently difficult to predict and can take many forms, some breaches may not be covered under our cyber insurance coverage. A security breach or other significant disruption of our information systems or those related to our customers, merchants and our third party vendors, including as a result of cyber attacks, could (i) disrupt the proper functioning of our networks and systems and therefore our operations and/or those of certain of our customers; (ii) result in the unauthorized access to, and destruction, loss, theft, misappropriation or release of confidential, sensitive or otherwise valuable information of ours or our customers; (iii) result in a violation of applicable privacy, data breach and other laws, subjecting us to additional regulatory scrutiny and expose the us to civil litigation, governmental fines and possible financial liability; (iv) require significant management attention and resources to remedy the damages that result; or (v) harm our reputation or cause a decrease in the number of customers that choose to do business with us. The occurrence of any of the foregoing could have a material adverse effect on our business, financial condition and results of operations.
15
The Company is subject to the risks presented by acquisitions.
The Company’s strategic initiatives include diversification within its markets, growth of its fee-based businesses, and growth internally and through acquisitions of financial institutions, branches, and financial services businesses. As such, the Company from time to time considers acquiring banks, thrift institutions, branch offices of banks or thrift institutions, or other businesses within markets currently served by the Company or in other locations that would complement the Company’s business or its geographic reach. The Company generally targets merger or acquisition partners that are culturally similar and have experienced management and possess either significant market presence or have potential for improved profitability through financial management, economies of scale and expanded services. Future acquisitions will be accompanied by the risks commonly encountered in acquisitions. These risks include among other things: the difficulty of integrating operations and personnel, the potential disruption of our ongoing business, the inability of management to maximize financial and strategic position, the inability to maintain uniform standards, controls, procedures and policies, and the impairment of relationships with employees and customers as a result of changes in ownership and management. Further, the asset quality or other financial characteristics of an acquired company may deteriorate after the acquisition agreement is signed or after the acquisition closes.
The Company’s operations rely on certain external vendors.
The Company relies on certain external vendors to provide products and services necessary to maintain day-to-day operations of the Company. Accordingly, the Company’s operations are exposed to risk that these vendors will not perform in accordance with the contracted arrangements under service level agreements. The Company has controls around contracts and vendor management to manage risks associated with using external vendors. Nevertheless, the failure of an external vendor to perform in accordance with the contracted arrangements under service level agreements, because of changes in the vendor’s organizational structure, financial condition, support for existing products and services or strategic focus or for any other reason, could be disruptive to the Company’s operations, which could have a material adverse impact on the Company’s business and, in turn, the Company’s financial condition and results of operations.
Risks Associated with the Company’s Common Stock
The Company’s stock price may be volatile.
The Company’s stock price can fluctuate widely in response to a variety of factors, including: actual or anticipated variations in our operating results; recommendations by securities analysts; significant acquisitions or business combinations; operating and stock price performance of other companies that investors deem comparable to Tompkins; new technology used, or services offered by our competitors; news reports relating to trends, concerns and other issues in the financial services industry; and changes in government regulations. Other factors, including general market fluctuations, industry-wide factors and economic and general political conditions and events, including terrorist attacks, economic slowdowns or recessions, interest rate changes, credit loss trends or currency fluctuations, may adversely affect the Company’s stock price even though they do not directly pertain to the Company’s operating results.
The trading volume in our common stock is less than that of larger financial services companies, which may adversely affect the price of our common stock.
The Company’s common stock is traded on the NYSE MKT LLC. The trading volume in the Company’s common stock is less than that of larger financial services companies. A public trading market having the desired characteristics of depth, liquidity and orderliness depends on the presence in the marketplace of willing buyers and sellers of our common stock at any given time. This presence depends on the individual decisions of investors and general economic and market conditions over which we have no control. Given the lower trading volume of the Company’s common stock, significant sales of our common stock, or the expectation of these sales, could cause our stock price to fall.
An investment in our common stock is not an insured deposit.
The Company’s common stock is not a bank deposit and, therefore, is not insured against loss by the FDIC, any other deposit insurance fund or by any other public or private entity. Investment in the Company’s common stock is inherently risky for the reasons described in this “Risk Factors” section and is subject to the same market forces that affect the price of common stock in any company. As a result, if you acquire the Company’s common stock, you may lose some or all of your investment.
16
Dividend Payments
Holders of Tompkins’ common stock are only entitled to receive such dividends as its board of directors may declare out of funds legally available for such payments. While Tompkins has a long history of paying dividends on its common stock, Tompkins is not required to pay dividends on its common stock and could reduce or eliminate its common stock dividend in the future. This could adversely affect the market price of Tompkins’ common stock. Also, Tompkins is a bank holding company, and its ability to declare and pay dividends is dependent on certain federal regulatory considerations, including the guidelines of the Federal Reserve regarding capital adequacy and dividends. See “Supervision and Regulation” for a description of certain material limitations on the Company’s ability to pay dividends to shareholders.
Item 1B. Unresolved Staff Comments
None.
The Company’s executive offices are located at 110 North Tioga Street, Ithaca, New York. The Company’s banking subsidiaries have 63 branch offices, of which 32 are owned and 31 are leased at market rents. The Company’s insurance subsidiary has 7 stand-alone offices, of which 5 are owned by the Company and 2 are leased at market rents. The Company’s wealth management and financial planning subsidiary has 2 offices which are leased at a market rent, and shares other locations with the Company’s subsidiaries. Management believes the current facilities are suitable for their present and intended purposes. For additional information about the Company’s facilities, including rental expenses, see “Note 7 Premises and Equipment” in Notes to Consolidated Financial Statements in Part II, Item 8. of this Report.
The Company is subject to various claims and legal actions that arise in the ordinary course of conducting business. Management does not expect the ultimate disposition of these matters to have a material adverse impact on the Company’s financial statements.
Item 4. Mine Safety Disclosures
Not applicable
17
Executive Officers of the Registrant
The information concerning the Company’s executive officers is provided below as of March 1, 2016.
| Name | Age | Title | Year Joined Company |
| Stephen S. Romaine | 51 | President and CEO | January 2000 |
| David S. Boyce | 49 | Executive Vice President | January 2001 |
| Francis M. Fetsko | 51 | Executive Vice President, COO, CFO and Treasurer | October 1996 |
| Alyssa H. Fontaine | 35 | Executive Vice President & General Counsel | January 2016 |
| Scott L. Gruber | 59 | Executive Vice President | April 2013 |
| Gregory J. Hartz | 55 | Executive Vice President | August 2002 |
| Gerald J. Klein, Jr. | 57 | Executive Vice President | January 2000 |
| John M. McKenna | 49 | Executive Vice President | April 2009 |
| Susan M. Valenti | 61 | Executive Vice President of Corporate Marketing | March 2012 |
| Bonita N. Lindberg | 59 | Senior Vice President, Director of Human Resources | December 2015 |
Business Experience of the Executive Officers:
Stephen S. Romaine was appointed President and Chief Executive Officer of the Company effective January 1, 2007. From 2003 through 2006, he served as President and Chief Executive Officer of Mahopac Bank. Prior to this appointment, Mr. Romaine was Executive Vice President and Chief Financial Officer of Mahopac Bank. Mr. Romaine currently serves on the board of the New York Bankers Association, currently serving as its Vice Chairman.
David S. Boyce has been employed by the Company since January 2001 and was promoted to Executive Vice President in April 2004. He was appointed President and Chief Executive Officer of Tompkins Insurance Agencies in 2002. He has been employed by Tompkins Insurance Agencies and a predecessor company to Tompkins Insurance Agencies for 27 years.
Francis M. Fetsko has been employed by the Company since 1996, and has served as Chief Financial Officer since December 2000. He also serves as the Chief Financial Officer for the Company’s four banking subsidiaries. In July 2003, he was promoted to Executive Vice President and he assumed the additional role of Chief Operating Officer in April 2012.
Alyssa H. Fontaine joined the Company in January 2016 as Executive Vice President and General Counsel. She had previously been a partner with Harris Beach PLLC, a law firm which she joined in 2006. Ms. Fontaine was a member of the firm’s Corporate Practice Group and served on the Financial Institutions and Capital Markets Industry Team. While in private practice, Ms. Fontaine served as the Company’s transaction counsel during our acquisitions of Sleepy Hollow Bancorp and VIST Financial Corp. She is a member of the Board of Directors of the Ithaca Community Childcare Center (IC3).
Scott L. Gruber has been employed by the Company since April 2013 and was appointed President & COO of VIST Bank and Executive Vice President of the Company effective April 30, 2013. He was appointed President & CEO of VIST Bank effective January 1, 2014. Mr. Gruber brings more than thirty years of banking experience to his position at VIST Bank, before joining VIST, Mr. Gruber spent sixteen years at National Penn Bank, and most recently as Group Executive Vice President where he led the Corporate Banking team. Prior to that, Mr. Gruber was President of the Central Region leading the commercial and retail banking business.
Gregory J. Hartz has been employed by the Company since 2002 and was appointed President and Chief Executive Officer of Tompkins Trust Company and Executive Vice President of the Company effective January 1, 2007. Previously, he was Senior Vice President of Tompkins Trust Company, with responsibility for Tompkins Investment Services. Mr. Hartz is past Chair of the Independent Bankers Association of New York State, and currently serves on the board of Cayuga Medical Center, Cayuga Health Systems, Legacy Foundation of Tompkins County, Boyce Thompson Institute, and is Chair of the Tompkins County Area Development.
Gerald J. Klein, Jr. has been employed by the Company since 2000 and was appointed President and Chief Executive Officer of Mahopac Bank and Executive Vice President of the Company effective January 1, 2007. Previously, he was Executive Vice President of Mahopac Bank, responsible for all lending and credit functions at the Bank.
| 18 |
John M. McKenna has been employed by the Company since April 2009. He was appointed President and CEO of The Bank of Castile effective January 1, 2015. McKenna had been a Senior Vice President at Bank of Castile for five years, concentrating in commercial lending. He has more than 25 years of banking experience including approximately 17 years with JPMorgan Chase Bank and its predecessors and 4 years with Citibank including experiences in investment banking, commercial lending and retail banking. Mr. McKenna currently serves on the NYBA PAC Committee.
Susan M. Valenti joined Tompkins in March of 2012 as Senior Vice President, Corporate Marketing. Prior to joining the Company, Susan spent 23 years at JPMorgan Chase working in a variety of marketing roles, most recently as Vice President of Chase Private Client Marketing Executive. Prior to that time she was Vice President, Retail Rebranding Project Lead and led the rebranding of The Bank of New York branches and Bank One to Chase. She was promoted to Executive Vice President of the Company in June of 2014.
Bonita N. Lindberg joined Tompkins in December 2015 as Senior Vice President, Director of Human Resources, which also includes the Company’s Learning & Development function. Lindberg comes to Tompkins from Cortland Regional Medical Center and Albany International Corporation. Lindberg was certified as a Senior Professional in Human Resources in 2001. She is very active in the Central New York community as a member of the human resources committee with Hospicare and Palliative Care Services of Tompkins County, and a former board member of Cayuga Medical Center. She is also a former board member and current conference board member for the Society for Human Resource Management in Tompkins County.
| Item 5. | Market for Registrant’s Common Equity, Related Stockholder Matters and Issuer Purchases of Equity Securities |
Market Price and Dividend Information
The Company’s common stock is traded under the symbol “TMP” on the NYSE MKT LLC (the “Exchange”). The high and low closing sale prices, which represent actual transactions as quoted on the Exchange, of the Company’s common stock for each quarterly period in 2014 and 2015 are presented below. The per share dividends paid by the Company in each quarterly period in 2014 and 2015 and the payment dates of these dividends are also presented below.
| Market Price | Cash Dividends | |||||||||||||
| High | Low | Amount | Date Paid | |||||||||||
| 2014 | 1st Quarter | $ | 50.30 | $ | 45.42 | $ | 0.40 | 2/14/14 | ||||||
| 2nd Quarter | 50.81 | 44.90 | 0.40 | 5/15/14 | ||||||||||
| 3rd Quarter | 48.78 | 44.04 | 0.40 | 8/15/14 | ||||||||||
| 4th Quarter | 56.18 | 43.98 | 0.42 | 11/14/14 | ||||||||||
| 2015 | 1st Quarter | $ | 54.57 | $ | 50.91 | $ | 0.42 | 2/17/15 | ||||||
| 2nd Quarter | 55.48 | 50.65 | 0.42 | 5/15/15 | ||||||||||
| 3rd Quarter | 55.45 | 50.81 | 0.42 | 8/17/15 | ||||||||||
| 4th Quarter | 62.78 | 52.70 | 0.44 | 11/16/15 | ||||||||||
As of February 29, 2016 there were approximately 3,589 holders of record of the Company’s common stock.
The Company’s ability to pay dividends is generally limited to earnings from the prior year, although retained earnings and dividends from its subsidiaries may also be used to pay dividends under certain circumstances. The Company’s primary source of funds to pay for shareholder dividends is receipt of dividends from its subsidiaries. Future dividend payments to the Company by its subsidiaries will be dependent on a number of factors, including the earnings and financial condition of each subsidiary, and are subject to the regulatory limitations discussed in “Note 20 Regulations and Supervision” in Notes to Consolidated Financial Statements in Part II, Item 8. of this Report.
| 19 |
The following table reflects all Company repurchases, including those made pursuant to publicly announced plans or programs, during the quarter ended December 31, 2015.
| Issuer Purchases of Equity Securities | ||||||||||||||||
| Total Number of Shares Purchased |
Average Price Paid Per Share |
Total Number of Shares Purchased as Part of Publicly Announced Plans or Programs |
Maximum Number (or Approximate Dollar Value) of Shares that May Yet Be Purchased Under the Plans or Programs |
|||||||||||||
| Period | (a) | (b) | (c) | (d) | ||||||||||||
| October 1, 2015 through | ||||||||||||||||
| October 31, 2015 | 6,053 | $ | 52.66 | 4,300 | 231,053 | |||||||||||
| November 1, 2015 through | ||||||||||||||||
| November 30, 2015 | 10,353 | $ | 59.76 | 0 | 231,053 | |||||||||||
| December 1, 2015 through | ||||||||||||||||
| December 31, 2015 | 0 | $ | 0.00 | 0 | 231,053 | |||||||||||
| Total | 16,406 | $ | 57.14 | 4,300 | 231,053 | |||||||||||
Included above are 1,753 shares purchased in October 2015, at an average cost of $51.61, and 586 shares purchased in November 2015, at an average cost of $59.76 by the trustee of the rabbi trust established by the Company under the Company’s Stock Retainer Plan For Eligible Directors of Tompkins Financial Corporation and Participating Subsidiaries, and were part of the director deferred compensation under that plan. In addition, included in November's totals are 9,767 shares purchased at an average price of $59.76 related to the funding of shareholder accounts enrolled in the company's Dividend Reinvestment Plan.
On July 24, 2014, the Company’s Board of Directors authorized a share repurchase plan for the Company to repurchase up to 400,000 shares of the Company’s common stock. Purchases may be made over the 24 months following adoption of the plan. The repurchase program may be suspended, modified or terminated at any time for any reason. As of the date of this report, the Company has repurchased 168,947 shares under this program, at an average price of $48.02.
Recent Sales of Unregistered Securities
None.
Equity Compensation Plan Information
Information regarding securities authorized for issuance under equity compensation plans is provided in Part III, “Item 12. Security Ownership of Certain Beneficial Owners and Management and Related Stockholder Matters” of this Report.
Performance Graph
The following graph compares the Company’s cumulative total stockholder return over the five-year period from December 31, 2010 through December 31, 2015, with (1) the total return index for the NASDAQ Composite and (2) the total return index for SNL Bank Index. The graph assumes $100.00 was invested on December 31, 2010, in the Company’s common stock and the comparison groups and assumes the reinvestment of all cash dividends prior to any tax effect and retention of all stock dividends.
In accordance with and to the extent permitted by applicable law or regulation, the information set forth below under the heading “Performance Graph” shall not be incorporated by reference into any future filing under the Securities Act or Exchange Act and shall not be deemed to be “soliciting material” or to be “filed” with the SEC under the Securities Act or the Exchange Act, except to the extent that the Company specifically requests that such information be treated as soliciting material or specifically incorporates it by reference into such filings. The performance graph represents past performance and should not be considered an indication of future performance.
| 20 |
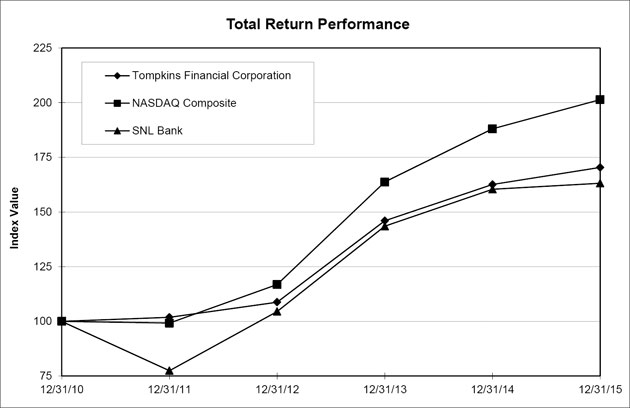
| Period Ending | |||||||
| Index | 12/31/10 | 12/31/11 | 12/31/12 | 12/31/13 | 12/31/14 | 12/31/15 | |
| Tompkins Financial Corporation | 100.00 | 101.83 | 108.76 | 145.99 | 162.56 | 170.38 | |
| NASDAQ Composite | 100.00 | 99.21 | 116.82 | 163.75 | 188.03 | 201.40 | |
| SNL Bank | 100.00 | 77.44 | 104.51 | 143.49 | 160.40 | 163.14 | |
| Item 6. | Selected Financial Data |
The following consolidated selected financial data is taken from the Company’s audited financial statements as of and for the five years ended December 31, 2015. The following selected financial data should be read in conjunction with the consolidated financial statements and the notes thereto in Part II, Item 8. of this Report. All of the Company’s acquisitions during the five year period were accounted for using the purchase method. Accordingly, the operating results of the acquired companies are included in the Company’s results of operations since their respective acquisition dates.
| 21 |
| Year ended December 31, | ||||||||||||||||
| (in thousands except per share data) | 2015 | 2014 | 2013 | 2012 1 | 2011 | |||||||||||
| FINANCIAL STATEMENT HIGHLIGHTS | ||||||||||||||||
| Assets | $ | 5,689,995 | $ | 5,269,561 | $ | 5,003,039 | $ | 4,837,197 | $ | 3,400,248 | ||||||
| Total loans | 3,772,042 | 3,393,288 | 3,194,284 | 2,954,610 | 1,981,849 | |||||||||||
| Deposits | 4,395,306 | 4,169,154 | 3,947,216 | 3,950,169 | 2,660,564 | |||||||||||
| Other borrowings | 536,285 | 356,541 | 331,531 | 111,848 | 186,075 | |||||||||||
| Total equity | 516,466 | 489,583 | 457,939 | 441,360 | 299,143 | |||||||||||
| Interest and dividend income | 188,746 | 184,493 | 185,104 | 158,356 | 137,088 | |||||||||||
| Interest expense | 20,365 | 20,683 | 23,975 | 24,213 | 25,682 | |||||||||||
| Net interest income | 168,381 | 163,810 | 161,129 | 134,143 | 111,406 | |||||||||||
| Provision for loan and lease losses | 2,945 | 2,306 | 6,161 | 8,837 | 8,945 | |||||||||||
| Net gains on securities transactions | 1,108 | 391 | 599 | 324 | 396 | |||||||||||
| Net income attributable to Tompkins | ||||||||||||||||
| Financial Corporation | 58,421 | 52,041 | 50,856 | 31,285 | 35,419 | |||||||||||
| PER SHARE INFORMATION | ||||||||||||||||
| Basic earnings per share | 3.91 | 3.51 | 3.48 | 2.44 | 3.21 | |||||||||||
| Diluted earnings per share | 3.87 | 3.48 | 3.46 | 2.43 | 3.20 | |||||||||||
| Adjusted diluted earnings per share2 | 3.63 | 3.48 | 3.36 | 3.16 | 3.21 | |||||||||||
| Cash dividends per share | 1.70 | 1.62 | 1.54 | 1.46 | 1.40 | |||||||||||
| Book value per share | 34.48 | 32.87 | 31.05 | 30.67 | 26.89 | |||||||||||
| Tangible book value per share3 | 27.42 | 25.69 | 23.70 | 22.96 | 22.58 | |||||||||||
| SELECTED RATIOS | ||||||||||||||||
| Return on average assets | 1.07 | % | 1.03 | % | 1.03 | % | 0.76 | % | 1.07 | % | ||||||
| Return on average equity | 11.51 | % | 10.76 | % | 11.47 | % | 8.30 | % | 12.02 | % | ||||||
| Average shareholders’ equity to average assets | 9.31 | % | 9.54 | % | 9.00 | % | 9.21 | % | 8.94 | % | ||||||
| Dividend payout ratio | 43.48 | % | 46.15 | % | 44.25 | % | 59.84 | % | 43.61 | % | ||||||
| OTHER SELECTED DATA (in whole numbers, unless otherwise noted) | ||||||||||||||||
| Employees (average full-time equivalent) | 998 | 1,000 | 989 | 839 | 719 | |||||||||||
| Banking offices | 63 | 65 | 66 | 66 | 45 | |||||||||||
| Bank access centers (ATMs) | 85 | 85 | 84 | 83 | 63 | |||||||||||
| Trust and investment services assets under management, or custody (in thousands) | $ | 3,852,972 | $ | 3,761,972 | $ | 3,443,636 | $ | 3,240,782 | $ | 2,780,622 | ||||||
| 1 Includes the impact of the acquisition of VIST Financial on August 1, 2012. | ||||||||||||
| 2 Adjusted diluted earnings per share reflects adjustments made for certain nonrecurring items, including merger and integration expenses. Adjustments for nonrecurring items in 2015 included a $(3.6) million after-tax gain on a pension plan curtailment. There were no adjustments in 2014. 2013 included an $(846,000) after-tax gain on the redemption of trust preferred stock and a $(771,000) after-tax gain on a deposit conversion. Also, in 2013, 2012 and 2011, after-tax merger related expenses totaled $140,000, $9.7 million and $152,000, respectively. There was also an after-tax VISA accrual adjustment of $243,000 in 2012. Adjusted diluted earnings per share is a non-GAAP measure that management believes provides management and investors with information that is useful in understanding the Company’s financial performance and condition. Please see the discussion below under “Results of Operations (Comparison of December 31, 2015 and 2014 results) General” for an explanation of why management believes this non-GAAP financial measure is useful and a reconciliation to diluted earnings per share. For a more detailed accounting and reconciliation of the Company's non-GAAP measures refer to table "Operating Net Income/Adjusted Diluted Earnings Per Share (Non-GAAP)" on page 26 of this document. | ||||||||||||
| 3 Tangible equity capital is used to calculate tangible book value per share and excludes from shareholders’ equity goodwill and other intangibles of $104.2 million in 2015, $106.9 million in 2014, $108.4 million in 2013, $110.9 million in 2012, and $48.0 million in 2011. This is a non-GAAP measure that management believes provides management and investors with information that is useful in understanding the Company’s financial performance and condition. | ||||||||||||
| 22 |
Item 7. Management’s Discussion and Analysis of Financial Condition and Results of Operations
The following analysis is intended to provide the reader with a further understanding of the consolidated financial condition and results of operations of the Company and its operating subsidiaries for the periods shown. This Management’s Discussion and Analysis of Financial Condition and Results of Operations should be read in conjunction with other sections of this Report on Form 10-K, including Part I, “Item 1. Business,” Part II, “Item 6. Selected Financial Data,” and Part II, “Item 8. Financial Statements and Supplementary Data.”
Overview
Tompkins Financial Corporation (“Tompkins” or the “Company”) is headquartered in Ithaca, New York and is registered as a Financial Holding Company with the Federal Reserve Board under the Bank Holding Company Act of 1956, as amended. The Company is a locally oriented, community-based financial services organization that offers a full array of products and services, including commercial and consumer banking, leasing, trust and investment management, financial planning and wealth management, insurance, and brokerage services. At December 31, 2015, the Company’s subsidiaries included: four wholly-owned banking subsidiaries, Tompkins Trust Company (the “Trust Company”), The Bank of Castile (DBA Tompkins Bank of Castile), Mahopac Bank (formerly known as Mahopac National Bank, DBA Tompkins Mahopac Bank), VIST Bank (DBA Tompkins VIST Bank); and a wholly-owned insurance agency subsidiary, Tompkins Insurance Agencies, Inc. (“Tompkins Insurance”). The Trust Company provides a full array of trust and investment services under the Tompkins Financial Advisors brand, including investment management, trust and estate, financial and tax planning as well as life, disability and long-term care insurance services. The Company’s principal offices are located at The Commons, Ithaca, New York, 14851, and its telephone number is (888) 503-5753. The Company’s common stock is traded on the NYSE MKT LLC under the Symbol “TMP.”
On August 1, 2012, Tompkins completed its acquisition of VIST Financial, a financial holding company headquartered in Wyomissing, Pennsylvania, and parent to VIST Bank, VIST insurance, LLC (“VIST Insurance”), and VIST Capital Management, LLC (“VIST Capital Management”). On the acquisition date, VIST Financial had $1.4 billion in total assets, $889.3 million in loans, and $1.2 billion in deposits. On the acquisition date, VIST Financial was merged into Tompkins. VIST Bank, a Pennsylvania state-charted commercial bank, became a wholly-owned subsidiary of Tompkins and operates as a separate subsidiary bank of Tompkins. VIST Insurance was merged into Tompkins Insurance, and VIST Capital Management became part of Tompkins Financial Advisors. The acquisition expands the Company’s presence into the southeastern region of Pennsylvania. The acquisition of VIST Insurance has approximately doubled the Company’s annual insurance revenues.
Forward-Looking Statements
The Company is making this statement in order to satisfy the “Safe Harbor” provision contained in the Private Securities Litigation Reform Act of 1995. The statements contained in this Report on Form 10-K that are not statements of historical fact may include forward-looking statements that involve a number of risks and uncertainties. Such forward-looking statements are made based on management’s expectations and beliefs concerning future events impacting the Company and are subject to certain uncertainties and factors relating to the Company’s operations and economic environment, all of which are difficult to predict and many of which are beyond the control of the Company, that could cause actual results of the Company to differ materially from those matters expressed and/or implied by forward-looking statements. The following factors, in addition to those listed as Risk Factors in Item 1A are among those that could cause actual results to differ materially from the forward-looking statements: changes in general economic, market and regulatory conditions; the development of an interest rate environment that may adversely affect the Company’s interest rate spread, other income or cash flow anticipated from the Company’s operations, investment and/or lending activities; changes in laws and regulations affecting banks, bank holding companies and/or financial holding companies, such as the Dodd-Frank Act and Basel III; technological developments and changes; the ability to continue to introduce competitive new products and services on a timely, cost-effective basis; governmental and public policy changes, including environmental regulation; protection and validity of intellectual property rights; reliance on large customers; and financial resources in the amounts, at the times and on the terms required to support the Company’s future businesses.
23
Critical Accounting Policies
In the course of normal business activity, management must select and apply many accounting policies and methodologies and make estimates and assumptions that lead to the financial results presented in the Company’s consolidated financial statements and accompanying notes. There are uncertainties inherent in making these estimates and assumptions, which could materially affect our results of operations and financial position.
Management considers accounting estimates to be critical to reported financial results if (i) the accounting estimates require management to make assumptions about matters that are highly uncertain, and (ii) different estimates that management reasonably could have used for the accounting estimate in the current period, or changes in the accounting estimate that are reasonably likely to occur from period to period, could have a material impact on the Company’s consolidated financial statements. Management considers the accounting policies relating to the allowance for loan and lease losses (“allowance”), pension and postretirement benefits, the review of the securities portfolio for other-than-temporary impairment and the accounting for acquired loans to be critical accounting policies because of the uncertainty and subjectivity involved in these policies and the material effect that estimates related to these areas can have on the Company’s results of operations.
Allowance for loan and lease losses
Management considers the accounting policy relating to the allowance to be a critical accounting policy because of the high degree of judgment involved, the subjectivity of the assumptions used and the potential changes in the economic environment that could result in changes to the amount of the allowance.
The Company has developed a methodology to measure the amount of estimated loan loss exposure inherent in the loan portfolio to assure that an appropriate allowance is maintained. The Company’s methodology is based upon guidance provided in SEC Staff Accounting Bulletin No. 102, Selected Loan Loss Allowance Methodology and Documentation Issues and includes allowance allocations calculated in accordance with Accounting Standards Codification (“ASC”) Topic 310, Receivables, and allowance allocations calculated in accordance with ASC Topic 450 Contingencies. The model is comprised of evaluating impaired loans, criticized and classified loans, historical losses, and qualitative factors. Management has deemed these components appropriate in evaluating the appropriateness of the allowance for loan and lease losses. While none of these components, when used independently, is effective in arriving at a reserve level that appropriately measures the risk inherent in the portfolio, management believes that using them collectively, provides reasonable measurement of the loss exposure in the portfolio. The various factors used in the methodologies are reviewed on a quarterly basis.
Although we believe our process for determining the allowance adequately considers all of the factors that would likely result in credit losses, this evaluation is inherently subjective as it requires material estimates, including expected default probabilities, the loss emergence periods, the amounts and timing of expected future cash flows on impaired loans, and estimated losses based on historical loss experience and current economic conditions. All of these factors may be susceptible to significant change. To the extent that actual results differ from management estimates, additional loan loss provisions may be required that would adversely impact earnings for future periods.
Pension and other post retirement benefits
The calculation of the expenses and liabilities related to pensions and other post-retirement benefits is a critical accounting policy that requires estimates and assumptions of key factors including, but not limited to, discount rate, return on plan assets, future salary increases, employment levels, employee retention, and life expectancies of plan participants. The Company uses an actuarial firm to assist in making these estimates. Changes in assumptions due to market conditions, governing laws and regulations, or Company specific circumstances may result in material changes to the Company’s pension and other post-retirement expenses and liabilities.
Investment securities
Another critical accounting policy is the policy for reviewing available-for-sale securities and held-to-maturity securities to determine if declines in fair value below amortized cost are other-than-temporary as required by FASB ASC Topic 320, Investments – Debt and Equity Securities. When other-than-temporary impairment has occurred, the amount of the other-than-temporary impairment recognized in earnings depends on whether the Company intends to sell the security and whether it is more likely than not will be required to sell the security before recovery of its amortized cost basis less any current-period credit loss. If the Company intends to sell the security or more likely than not will be required to sell the security before recovery of its amortized cost basis less any current-period credit loss, the other-than-temporary impairment is recognized in earnings equal to the entire difference between the investment’s amortized cost basis and its fair value at the balance sheet date. If the Company does not intend to sell the security and it is not more likely than not that the Company will be required to sell the security before recovery of its amortized cost basis less any current-period credit loss, the other-than-temporary impairment is separated into the amount representing the credit loss and the amount related to all other factors. The amount of the total other-than-temporary impairment related to the credit loss is recognized in earnings. In estimating other-than-temporary impairment losses, management considers, among other factors, the length of time and extent to which the fair value has been less than cost, the financial condition and near term prospects of the issuer, underlying collateral of the security, and the structure of the security.
24
Acquired loans
The accounting policy for acquired loans is a critical accounting policy. Acquired loans are initially recorded at their acquisition date fair values. The carryover of allowance for loan losses is prohibited as any credit losses in the loans are included in the determination of the fair value of the loans at the acquisition date. Fair values for acquired loans are based on a discounted cash flow methodology that involves assumptions and judgments as to credit risk, prepayment risk, liquidity risk, default rates, loss severity, payment speeds, collateral values and discount rate. Subsequent to the acquisition of acquired impaired loans, the Generally Accepted Accounting Principles ("GAAP") requires the continued estimation of expected cash flows to be received. This estimation requires numerous assumptions, interpretations and judgments using internal and third-party credit quality information. Changes in expected cash flows could result in the recognition of impairment through provision for credit losses.
For acquired loans that are not deemed impaired at acquisition, credit discounts representing the principal losses expected over the life of the loan are a component of the initial fair value. Subsequent to the purchase date, the methods utilized to estimate the required allowance for loan losses for the non-impaired acquired loans is similar to originated loans.
All accounting policies are important and the reader of the financial statements should review these policies, described in “Note 1 Summary of Significant Accounting Policies” in Notes to Consolidated Financial Statements in Part II, Item 8. of this Form 10-K, to gain a better understanding of how the Company’s financial performance is reported.
Results of Operations
(Comparison of December 31, 2015 and 2014 results)
General
The Company reported diluted earnings per share of $3.87 in 2015, compared to diluted earnings per share of $3.48 in 2014. Net income attributable to Tompkins Financial Corporation for the year ended December 31, 2015, was $58.4 million, up 12.3% compared to $52.0 million in 2014. Results for 2015 were positively impacted by a one-time curtailment gain of $3.6 million, after-tax, related to changes to the Company’s defined benefit pension plan. Exclusive of this one-time gain, net income and diluted earnings per share for 2015 were $54.8 million and $3.63, respectively.
In addition to earnings per share, key performance measurements for the Company include return on average shareholders’ equity (ROE) and return on average assets (ROA). ROE was 11.51% in 2015, compared to 10.76% in 2014, while ROA was 1.07% in 2015 and 1.03% in 2014. Tompkins’ 2015 ROE and ROA were in the 83rd percentile for ROE and the 65th percentile for ROA of its peer group. The peer group is derived from the Federal Reserve Board and represents banks and bank holding companies with assets between $3.0 billion and $10.0 billion. The comparative peer group ratios are as of December 31, 2015.
The Company’s net operating income available to common shareholders (non-GAAP) in 2015 amounted to $54.0 million or $3.63 per diluted share compared to $51.5 million or $3.48 per diluted share in 2014. Operating (non-GAAP) net income for 2015 excludes the $3.6 million, after-tax, gain on changes to the Company’s pension plan. There were no adjustments to 2014 net operating income.
The following table summarizes the Company’s results of operations for the periods indicated on a GAAP basis and on an operating (non-GAAP) basis for the periods indicated. The Company believes the non-GAAP measures provide meaningful comparisons of our underlying operational performance and facilitates management’s and investors’ assessments of business and performance trends in comparison to others in the financial services industry. In addition, the Company believes the exclusion of the nonoperating items from our performance enables management and investors to perform a more effective evaluation and comparison of our results and to assess performance in relation to our ongoing operations. These non-GAAP financial measures should not be considered in isolation or as a measure of the Company’s profitability or liquidity; they are in addition to, and are not a substitute for, financial measures under GAAP. Net operating income, adjusted diluted earnings per share, and operating return on average tangible equity capital as presented herein may be different from non-GAAP financial measures used by other companies, and may not be comparable to similarly titled measures reported by other companies. Further, the Company may utilize other measures to illustrate performance in the future. Non-GAAP financial measures have limitations since they do not reflect all of the amounts associated with the Company’s results of operations as determined in accordance with GAAP.
25
| Operating Net Income/Adjusted Diluted Earnings Per Share (Non-GAAP) | ||||||||
| As of December 31, | ||||||||
| (in thousands, except per share data) | 2015 | 2014 | ||||||
| Net income attributable to Tompkins Financial Corporation | $ | 58,421 | $ | 52,041 | ||||
| Less: dividends and undistributed earnings allocated to unvested stock awards | (834 | ) | (503 | ) | ||||
| Net income available to common shareholders (GAAP) | 57,587 | 51,538 | ||||||
| Diluted earnings per share (GAAP) | 3.87 | 3.48 | ||||||
| Adjustments for non-operating income and expense, net of tax: | ||||||||
|
Gain on pension plan curtailment |
(3,602 | ) | 0 | |||||
| Total adjustments, net of tax | (3,602 | ) | 0 | |||||
| Net operating income available to common shareholders (Non-GAAP) | 53,985 | 51,538 | ||||||
| Adjusted diluted earnings per share (Non-GAAP) | 3.63 | 3.48 | ||||||
| Operating Return on Average Tangible Common Equity (Non-GAAP) | ||||||||
| As of December 31, | ||||||||
| (in thousands, except per share data) | 2015 | 2014 | ||||||
| Net operating income available to common shareholders (Non-GAAP) | $ | 53,985 | $ | 51,538 | ||||
|
Amortization of intangibles, net of tax |
1,208 | 1,257 | ||||||
| Adjusted net operating income available to common shareholders (Non-GAAP) | 55,193 | 52,795 | ||||||
| Average Tompkins Financial Corporation shareholders’ common equity | 506,243 | 482,087 | ||||||
| Average goodwill and intangibles 1 | 104,837 | 106,748 | ||||||
| Average Tompkins financial Corporation shareholders’ tangible common equity (Non-GAAP) | 401,406 | 375,339 | ||||||
| Adjusted operating return on average shareholders’ tangible common equity (Non-GAAP) | 13.75 | % | 14.07 | % | ||||
| 1 Average goodwill and intangibles exclude mortgage servicing rights. | ||||||||
Segment Reporting
The Company operates in three business segments: banking, insurance and wealth management. Insurance is comprised of property and casualty insurance services and employee benefit consulting operated under the Tompkins Insurance Agencies, Inc. subsidiary. Wealth management activities include the results of the Company’s trust, financial planning, and wealth management services conducted under the trust department of the Trust Company. All other activities are considered banking. For additional financial information on the Company’s segments, refer to “Note 22 – Segment and Related Information” in the Notes to Consolidated Financial Statements in Part II, Item 8. of this Report.
Banking Segment
The Banking segment reported net income of $51.6 million for the year ending December 31, 2015, representing a $5.6 million or 12.1% increase compared to 2014, driven mainly by growth in interest income and lower noninterest expenses. Net interest income increased $4.6 million in 2015, up 2.8% versus 2014, due primarily to loan growth, which more than offset lower average loan yields. Interest income increased $4.2 million or 2.3%, while interest expense declined $320,000 or 1.5% compared to 2014. All associated segment results have been reconciled to their corresponding consolidated financial statement amounts (see “Note 22 – Segment and Related Information” in the Notes to Consolidated Financial Statements in Part II, Item 8. of this Report for additional details).
The provision for loan and lease losses was $2.9 million in 2015, compared to $2.3 million in the prior year. The increase reflects the growth in total loans, partially offset by continued improvement in credit quality.
Noninterest income declined by $322,000 or 1.2% when compared to 2014. Declines in noninterest income included income on miscellaneous investments (down $361,000), gains on sale of loans (down $308,000), other fee income (down $295,000), card service income (down $105,000), and service charges on deposit accounts (down $79,000). These were partially offset by gains on available-for-sale (“AFS”) securities (up $1.1 million), and the gain on sale of other real-estate owned (“OREO”) (up $332,000).
26
Noninterest expenses decreased by $5.0 million or 4.1% compared to 2014, reflecting the impact of the one-time gain related to changes to the Company’s pension plan, which resulted in a $5.4 million credit to noninterest expense in the second quarter of 2015.
Insurance Segment
The Insurance segment reported net income of $3.6 million, up 18.4% when compared to 2014. Insurance commissions and fees increased $797,000 or 2.8% over the prior year. Revenues from the Company’s primary insurance lines: commercial, personal insurance and health and benefit insurance all increased compared to the prior year. 2015 also included a pre-tax gain of $329,000 related to the sale of certain customer relationships in the fourth quarter of 2015, which were acquired in the 2012 acquisition of VIST Insurance. Noninterest expense increased $268,000 in 2015, up 1.1% compared to 2014. Increases in salaries and benefits costs, associated with merit increases and additional headcount contributed to most of the noninterest expense variance for the current year compared to prior year. The year over year increase was partially offset by the one-time gain related to changes to the Company’s pension plan, which resulted in a $462,000 credit to noninterest expense in the second quarter of 2015.
Wealth Management Segment
The Wealth Management segment reported net income of $3.1 million for the twelve month period ended December 31, 2015, an increase of $245,000 or 8.4% compared to 2014. Investment services revenue of $16.0 million was flat compared to 2014. Noninterest expenses were down $431,000 or 3.6% compared to 2014, mainly due to the one-time gain related to changes to the Company’s pension plan, which resulted in a $131,000 credit to noninterest expense in the second quarter of 2015. The market value of assets under management or in custody at December 31, 2015, totaled $3.9 billion, an increase of 2.4% compared to year-end 2014.
Net Interest Income
Net interest income is the Company’s largest source of revenue, representing 70.1% of total revenues for the twelve months ended December 31, 2015, and 69.8% of total revenues for the twelve months ended December 31, 2014. Net interest income was up 2.8% in 2015 compared to 2014. Net interest income is dependent on the volume and composition of interest earning assets and interest-bearing liabilities and the level of market interest rates. The Company’s net interest income over the past several years benefitted from steady growth in average earning assets, which were up 8.7% in 2015 compared to 2014, and lower funding costs which were down 1.5% in 2015 compared to 2014. For 2015 and 2014, the Company’s net interest income also benefitted from accretable yield attributable to loans acquired with evidence of credit deterioration and accounted for in accordance with ASC Topic 310-30. These favorable factors offset the impact of lower asset yields and lower net interest margins compared to prior year. The taxable equivalent net interest margin was 3.38% in 2015 compared to 3.57% in 2014.
Table 1 – Average Statements of Condition and Net Interest Analysis shows average interest-earning assets and interest-bearing liabilities, and the corresponding yield or cost associated with each. Taxable-equivalent net interest income for 2015 was up 3.0% over 2014, benefitting from growth in average earning assets, which increased by 8.7% in 2015, and growth in noninterest bearing deposits, which increased by 13.9% compared to the prior year. These factors helped to lessen the impact of lower asset yields and a lower net interest margin compared to prior year.
Tax-equivalent interest income was up $4.6 million or 2.5% in 2015 over 2014. The increase in taxable-equivalent interest income was the result of the $408.2 million or 8.7% increase in average interest-earning assets in 2015 over 2014 average interest-earning assets. The growth in average earning assets and the higher concentration of loans helped to offset lower asset yields. The average yield on interest earning assets for 2015 declined by 23 basis points or 5.7% compared to the average yield on interest earning assets for 2014. Average loan balances were up $293.0 million or 9.0% in 2015 compared to 2014, while the average yields on loans were down 27 basis points or 5.7%. Average loan balances represented 69.3% of earning assets in 2015 compared to 69.0% 2014. Average balances on securities were up $109.5 million or 7.7% compared to 2014, while the average yields on the securities portfolio were down 17 basis points or 7.1% compared to 2014.
Interest expense for 2015 was down $318,000 or 1.5% compared to 2014, while average interest bearing liabilities were up $226.4 million or 6.2%. The decrease in interest expense reflects lower average rates paid on deposits and borrowings during 2015 when compared to 2014 and growth in noninterest bearing deposit balances. The average rate paid on interest bearing deposits was 0.32% in 2015, down 3 basis points when compared to 2014. Average interest bearing deposits in 2015 were up $67.7 million or 2.1% compared to 2014. Average noninterest bearing deposit balances in 2015 were up $125.9 million or 13.9% over 2014 and represented 24.0% of total deposits compared to 22.1% in 2014. Average other borrowings increased by $166.4 million or 66.2% year over year, mainly due to a higher volume of overnight borrowings with the FHLB in 2015.
27
| Table 1 - Average Statements of Condition and Net Interest Analysis |
| For the year ended December 31, | ||||||||||||||||||||||||||||||||||||
| 2015 | 2014 | 2013 | ||||||||||||||||||||||||||||||||||
| (dollar amounts in thousands) | Average Balance (YTD) |
Interest | Average Yield/Rate |
Average Balance (YTD) |
Interest | Average Yield/Rate |
Average Balance (YTD) |
Interest | Average Yield/Rate |
|||||||||||||||||||||||||||
| ASSETS | ||||||||||||||||||||||||||||||||||||
| Interest-earning assets | ||||||||||||||||||||||||||||||||||||
| Interest-bearing balances due from banks | $ | 1,812 | $ | 4 | 0.22 | % | $ | 1,014 | $ | 2 | 0.20 | % | $ | 2,005 | $ | 10 | 0.50 | % | ||||||||||||||||||
| Securities1 | ||||||||||||||||||||||||||||||||||||
| U.S. Government securities | 1,441,420 | 30,500 | 2.12 | % | 1,332,449 | 30,384 | 2.28 | % | 1,326,999 | 28,817 | 2.17 | % | ||||||||||||||||||||||||
| Trading securities | 8,231 | 352 | 4.28 | % | 10,068 | 418 | 4.15 | % | 14,188 | 589 | 4.15 | % | ||||||||||||||||||||||||
| State and municipal2 | 88,504 | 3,308 | 3.74 | % | 85,402 | 3,290 | 3.85 | % | 95,276 | 4,893 | 5.14 | % | ||||||||||||||||||||||||
| Other securities2 | 3,785 | 121 | 3.20 | % | 4,489 | 139 | 3.10 | % | 7,714 | 265 | 3.44 | % | ||||||||||||||||||||||||
| Total securities | 1,541,940 | 34,281 | 2.22 | % | 1,432,408 | 34,231 | 2.39 | % | 1,444,177 | 34,564 | 2.39 | % | ||||||||||||||||||||||||
| FHLBNY and FRB stock | 24,046 | 1,129 | 4.70 | % | 19,168 | 810 | 4.23 | % | 22,153 | 749 | 3.38 | % | ||||||||||||||||||||||||
| Total loans and leases, net of unearned income2,3 | 3,531,945 | 157,222 | 4.45 | % | 3,238,992 | 152,958 | 4.72 | % | 3,053,538 | 153,569 | 5.03 | % | ||||||||||||||||||||||||
| Total interest-earning assets | 5,099,743 | 192,636 | 3.78 | % | 4,691,582 | 188,001 | 4.01 | % | 4,521,873 | 188,892 | 4.18 | % | ||||||||||||||||||||||||
| Other assets | 355,471 | 375,073 | 406,626 | |||||||||||||||||||||||||||||||||
| Total assets | 5,455,214 | 5,066,655 | 4,928,499 | |||||||||||||||||||||||||||||||||
| LIABILITIES & EQUITY | ||||||||||||||||||||||||||||||||||||
| Deposits | ||||||||||||||||||||||||||||||||||||
| Interest-bearing deposits | ||||||||||||||||||||||||||||||||||||
| Interest bearing checking, savings, & money market | 2,363,087 | 3,821 | 0.16 | % | 2,286,707 | 4,312 | 0.19 | % | 2,224,028 | 4,938 | 0.22 | % | ||||||||||||||||||||||||
| Time deposits | 895,391 | 6,630 | 0.74 | % | 904,040 | 6,769 | 0.75 | % | 939,630 | 7,827 | 0.83 | % | ||||||||||||||||||||||||
| Total interest-bearing deposits | 3,258,478 | 10,451 | 0.32 | % | 3,190,747 | 11,081 | 0.35 | % | 3,163,658 | 12,765 | 0.40 | % | ||||||||||||||||||||||||
| Federal funds purchased & securities sold under agreements to repurchase | 137,917 | 2,709 | 1.96 | % | 145,876 | 2,947 | 2.02 | % | 177,784 | 3,749 | 2.11 | % | ||||||||||||||||||||||||
| Other borrowings | 417,737 | 4,897 | 1.17 | % | 251,312 | 4,368 | 1.74 | % | 222,345 | 4,862 | 2.19 | % | ||||||||||||||||||||||||
| Trust preferred debentures | 37,417 | 2,308 | 6.17 | % | 37,249 | 2,287 | 6.14 | % | 41,643 | 2,599 | 6.24 | % | ||||||||||||||||||||||||
| Total interest-bearing liabilities | 3,851,549 | 20,365 | 0.53 | % | 3,625,184 | 20,683 | 0.57 | % | 3,605,430 | 23,975 | 0.67 | % | ||||||||||||||||||||||||
| Noninterest bearing deposits | 1,029,545 | 903,628 | 806,387 | |||||||||||||||||||||||||||||||||
| Accrued expenses and other liabilities | 66,366 | 54,244 | 73,117 | |||||||||||||||||||||||||||||||||
| Total liabilities | 4,947,460 | 4,583,056 | 4,484,934 | |||||||||||||||||||||||||||||||||
| Tompkins Financial Corporation Shareholders’ equity | 506,243 | 482,087 | 442,054 | |||||||||||||||||||||||||||||||||
| Noncontrolling interest | 1,511 | 1,512 | 1,511 | |||||||||||||||||||||||||||||||||
| Total equity | 507,754 | 483,599 | 443,565 | |||||||||||||||||||||||||||||||||
| Total liabilities and equity | $ | 5,455,214 | $ | 5,066,655 | $ | 4,928,499 | ||||||||||||||||||||||||||||||
| Interest rate spread | 3.25 | % | 3.44 | % | 3.51 | % | ||||||||||||||||||||||||||||||
| Net interest income/margin on earning assets | 172,271 | 3.38 | % | 167,318 | 3.57 | % | 164,917 | 3.65 | % | |||||||||||||||||||||||||||
| Tax Equivalent Adjustment | (3,890 | ) | (3,508 | ) | (3,788 | ) | ||||||||||||||||||||||||||||||
| Net interest income per consolidated financial statements | $ | 168,381 | $ | 163,810 | $ | 161,129 | ||||||||||||||||||||||||||||||
1 Average balances and yields on available-for-sale securities are based on historical amortized cost.
2 Interest income includes the tax effects of taxable-equivalent adjustments using a combined New York State and Federal effective income tax rate of 40% to increase tax exempt interest income to taxable-equivalent basis.
3 Nonaccrual loans are included in the average asset totals presented above. Payments received on nonaccrual loans have been recognized as disclosed in Note 1 of the Company’s condensed consolidated financial statements included in Part 1 of the Company’s annual report on Form 10-K for the fiscal year ended December 31, 2015.
| 28 |
| Table 2 - Analysis of Changes in Net Interest Income | ||||||||||||||
| 2015 vs. 2014 | 2014 vs. 2013 | |||||||||||||||||||||||
| Increase (Decrease) Due to Change in Average |
Increase (Decrease) Due to Change in Average |
|||||||||||||||||||||||
| (in thousands)(taxable equivalent) | Volume | Yield/Rate | Total | Volume | Yield/Rate | Total | ||||||||||||||||||
| INTEREST INCOME: | ||||||||||||||||||||||||
| Certificates of deposit, other banks | $ | 4 | $ | (2 | ) | $ | 2 | $ | (8 | ) | $ | 0 | $ | (8 | ) | |||||||||
| Investments1 | ||||||||||||||||||||||||
| Taxable | 2,204 | (2,172 | ) | 32 | (147 | ) | 1,417 | 1,270 | ||||||||||||||||
| Tax-exempt | 116 | (98 | ) | 18 | (507 | ) | (1,096 | ) | (1,603 | ) | ||||||||||||||
| FHLB and FRB stock | 229 | 90 | 319 | (101 | ) | 162 | 61 | |||||||||||||||||
| Loans, net1 | 13,041 | (8,777 | ) | 4,264 | 9,327 | (9,938 | ) | (611 | ) | |||||||||||||||
| Total interest income | $ | 15,594 | $ | (10,959 | ) | $ | 4,635 | $ | 8,564 | $ | (9,455 | ) | $ | (891 | ) | |||||||||
| INTEREST EXPENSE: | ||||||||||||||||||||||||
| Interest-bearing deposits: | ||||||||||||||||||||||||
| Interest checking, savings and money market | 144 | (635 | ) | (491 | ) | 138 | (764 | ) | (626 | ) | ||||||||||||||
| Time | (65 | ) | (74 | ) | (139 | ) | (295 | ) | (763 | ) | (1,058 | ) | ||||||||||||
| Federal funds purchased and securities sold under agreements to repurchase | (156 | ) | (82 | ) | (238 | ) | (645 | ) | (157 | ) | (802 | ) | ||||||||||||
| Other borrowings | 1,961 | (1,411 | ) | 550 | 359 | (1,165 | ) | (806 | ) | |||||||||||||||
| Total interest expense | $ | 1,884 | $ | (2,202 | ) | $ | (318 | ) | $ | (443 | ) | $ | (2,849 | ) | $ | (3,292 | ) | |||||||
| Net interest income | $ | 13,710 | $ | (8,757 | ) | $ | 4,953 | $ | 9,007 | $ | (6,606 | ) | $ | 2,401 | ||||||||||
1 Interest income includes the tax effects of taxable-equivalent adjustments using a combined New York State and Federal effective income tax rate of 40% to increase tax exempt interest income to taxable-equivalent basis.
Changes in net interest income occur from a combination of changes in the volume of interest-earning assets and interest-bearing liabilities, and in the rate of interest earned or paid on them. The above table illustrates changes in interest income and interest expense attributable to changes in volume (change in average balance multiplied by prior year rate), changes in rate (change in rate multiplied by prior year volume), and the net change in net interest income. The net change attributable to the combined impact of volume and rate has been allocated to each in proportion to the absolute dollar amounts of the change. In 2015, net interest income increased by $5.0 million, resulting from a $4.6 million increase in interest income and a $318,000 decrease in interest expense. Growth in average balances on interest-earning assets contributed to a $15.6 million increase in interest income, while the lower yields on average earning assets offset this growth by $11.0 million. The decrease in interest expense reflects lower rates paid on interest bearing liabilities, partially offset by growth in average balances of interest bearing liabilities.
Provision for Loan and Lease Losses
The provision for loan and lease losses represents management’s estimate of the expense necessary to maintain the allowance for loan and lease losses at an appropriate level. The provision for loan and lease losses was $2.9 million in 2015, compared to $2.3 million in 2014. The increase in provision expense was mainly a result of year-over-year loan growth. Asset quality metrics were improved from prior year, with lower levels of nonperforming loans and leases and criticized and classified loans compared to prior year. See the section captioned “The Allowance for Loan and Lease Losses” included within “Management’s Discussion and Analysis of Financial Condition and Results of Operations-Financial Condition” of this Report for further analysis of the Company’s allowance for loan and lease losses.
| 29 |
Noninterest Income
| Year ended December 31, | ||||||||||||
| (in thousands) | 2015 | 2014 | 2013 | |||||||||
| Insurance commissions and fees | $ | 29,286 | $ | 28,489 | $ | 27,916 | ||||||
| Investment services | 15,416 | 15,493 | 15,109 | |||||||||
| Service charges on deposit accounts | 9,325 | 9,404 | 8,495 | |||||||||
| Card services | 7,837 | 7,942 | 7,216 | |||||||||
| Net mark-to-market gains (losses) | 90 | 62 | 17 | |||||||||
| Other income | 8,878 | 8,984 | 10,546 | |||||||||
| Net gain on securities transactions | 1,108 | 391 | 599 | |||||||||
| Total | $ | 71,940 | $ | 70,765 | $ | 69,898 | ||||||
Noninterest income is a significant source of income for the Company, representing 29.9% of total revenues in 2015, and 30.2% in 2014, and is an important factor in the Company’s results of operations. Noninterest income increased 1.7% over 2014. The year-over-year changes in the various noninterest categories are discussed in more detail below.
Insurance commissions and fees increased $797,000 or 2.8% over 2014. Revenues for commercial insurance lines, personal insurance lines, and health and benefit related insurance products were all up for the year compared to 2014.
Investment services income of $15.4 million in 2015 was in line with the same period in 2014. Investment services income includes trust services, financial planning, and wealth management services. With fees largely based on the market value and the mix of assets managed, the general direction of the stock market can have a considerable impact on fee income. The market value of assets managed by, or in custody of, the Trust Company was $3.9 billion at December 31, 2015, and $3.8 billion at December 31, 2014. These figures include $1.2 billion in 2015 and $1.1 billion in 2014, of Company-owned securities where no income is recognized as the Trust Company serves as custodian. The increase in fair value of assets reflects successful business development initiatives resulting in customer retention. Equities markets were generally flat to lower during 2015 as compared to 2014.
Service charges on deposit accounts in 2015 were down less than 1% compared to prior year. Overdraft fees, the largest component of service charges on deposit accounts, were down $483,000 or 7.3% in 2015 compared to 2014. The decrease in overdraft fees was partially offset by increases in cycle fees on personal and business accounts, which were up $452,000 or 19.3%, as a result of new deposit products introduced in 2015.
Card services income decreased $105,000 or 1.3% over 2014. The primary components of card services income are fees related to debit card transactions and ATM usage. Debit card income remained relatively flat compared to 2014, while fees associated with ATM transactions were down 8.1% compared to 2014. Favorable trends in the number of transactions were partially offset by lower interchange fees in 2015.
Net mark-to-market gains on securities and borrowings held at fair value were $90,000 in 2015, up $28,000 compared to 2014. Mark-to-market losses or gains relate to the change in the fair value of securities and borrowings where the Company has elected the fair value option. The year-over-year gains are mainly attributed to changes in market interest rates.
The Company recognized $1.1 million of gains on sales/calls of available-for-sale securities in 2015, compared to $391,000 of gains in 2014. Sales of available-for-sale securities are generally the result of general portfolio maintenance and interest rate risk management.
Other income of $8.9 million was down $106,000 or 1.2% compared to 2014. The significant components of other income are other service charges, increases in cash surrender value of corporate owned life insurance (“COLI”), gains on the sales of residential mortgage loans, FDIC indemnification asset accretion and income from miscellaneous equity investments, including the Company’s investment in a Small Business Investment Company (“SBIC”). The decrease in 2015 reflects lower gains on sales of residential loans (down $308,000) and decreased income from miscellaneous equity investments (down $361,000) compared to 2014. These were partially offset by increases in OREO gains (up $332,000) and COLI income (up $181,000) in 2015 compared with 2014.
| 30 |
Noninterest Expense
| Year ended December 31, | ||||||||||||
| (in thousands) | 2015 | 2014 | 2013 | |||||||||
| Salaries and wages | $ | 72,707 | $ | 69,558 | $ | 67,200 | ||||||
| Pension and other employee benefits | 16,025 | 21,102 | 22,164 | |||||||||
| Net occupancy expense of premises | 12,312 | 12,203 | 11,757 | |||||||||
| Furniture and fixture expense | 6,146 | 5,708 | 5,701 | |||||||||
| FDIC insurance | 2,992 | 2,906 | 3,214 | |||||||||
| Amortization of intangible assets | 2,013 | 2,095 | 2,197 | |||||||||
| Merger and integration related expense | 0 | 0 | 228 | |||||||||
| Other | 37,667 | 41,121 | 40,641 | |||||||||
| Total | $ | 149,862 | $ | 154,693 | $ | 153,102 | ||||||
Salaries and wages and pension and other employee benefit expenses decreased $1.9 million or 2.1% compared to 2014. For 2015, salaries and wages were up $3.1 million or 4.5% over the prior year. The increases reflect additional employees, annual merit increases and higher accruals for incentive compensation. Pension and other employee benefits were down $5.1 million or 24.1% over 2014. The decrease in pension and other employee benefit expenses was mainly a result of a one-time curtailment gain of $6.0 million, related to changes to the Company’s defined benefit pension plan.
Other operating expenses of $37.7 million decreased by $3.5 million or 8.4% compared to 2014. The primary components of other operating expenses in 2015 were technology expense ($6.2 million), marketing expense ($4.8 million), professional fees ($5.4 million), cardholder expense ($2.7 million) and other miscellaneous expense ($18.9 million). The $3.5 million decrease in other operating expense in 2015 when compared to 2014 was mainly due to lower costs associated with loan origination expenses, and expenses related to other real estate owned.
The Company’s efficiency ratio, defined as operating expense excluding amortization of intangible assets, divided by tax-equivalent net interest income plus noninterest income before securities gains and losses (increase in the cash surrender value of COLI is shown on a tax equivalent basis) was 60.5% in 2015, compared to 63.9% in 2014. Tax equivalency was based upon a 40% tax rate. Excluding the tax equivalent adjustments for tax-exempt securities and tax-exempt loans and leases, the efficiency ratio would be 61.5% in 2015 and 64.8% in 2014. The 2015 ratio was favorably impacted by the one-time gain related to the changes to the Company’s pension plan. Excluding this gain, the two ratios for 2015 would have been 64.0% and 62.9%, respectively.
Noncontrolling Interests
Net income attributable to noncontrolling interests represents the portion of net income in consolidated majority-owned subsidiaries that is attributable to the minority owners of a subsidiary. The Company had net income attributable to noncontrolling interests of $131,000 in 2015 and 2014. The noncontrolling interests relate to three real estate investment trusts, which are substantially owned by the Company’s banking subsidiaries.
Income Tax Expense
The provision for income taxes provides for Federal, New York State and Pennsylvania State income taxes. The 2015 provision was $29.0 million. The effective tax rate for the Company was 33.1% in 2015, up from 32.7% in 2014. The effective rates differ from the U.S. statutory rate of 35.0% during the comparable periods primarily due to the effect of tax-exempt income from loans, securities, and life insurance assets, and investments in tax credits.
Results of Operations
(Comparison of December 31, 2014 and 2013 results)
General
The Company reported diluted earnings per share of $3.48 in 2014, compared to diluted earnings per share of $3.46 in 2013. Net income attributable to Tompkins Financial Corporation for the year ended December 31, 2014, was $52.0 million, up 2.3% compared to $50.9 million in 2013. Earnings for 2013 included certain nonrecurring items comprised of $846,000 in an after-tax gain on the redemption of trust preferred debentures, an after-tax gain on a deposit conversion of $771,000, and after-tax merger related expense of $140,000. Collectively, these items had a favorable impact to 2013 results of approximately $0.10 per share.
In addition to earnings per share, key performance measurements for the Company included return on average shareholders’ equity (ROE) and return on average assets (ROA). ROE was 10.76% in 2014, compared to 11.47% in 2013, while ROA was 1.03% in 2014 and 2013.
| 31 |
Segment Reporting
Banking Segment
The Banking segment reported net income of $46.1 million for the year ending December 31, 2014, representing a $901,000 or 2.0% increase compared to 2013, driven mainly by growth in net interest income and a lower provision for loan and lease losses. Net interest income increased $2.7 million in 2014, up 1.7% versus 2013, due primarily to loan growth and the lower cost of funds. Interest income declined $559,000 or 0.3%, while interest expense declined $3.3 million or 13.7% compared to the 2013. All associated segment results have been reconciled to their corresponding consolidated financial statement amounts (see “Note 22 – Segment and Related Information” in the Notes to Consolidated Financial Statements in Part II, Item 8. of this Report for additional details).
The provision for loan and lease losses was $2.3 million in 2014, compared to $6.2 million in the prior year reflecting an improvement in credit quality.
Noninterest income declined by $452,000 or 1.6% when compared to year-end 2013. Included in 2013 results were two nonrecurring events: a $1.4 million pre-tax gain on the redemption of a Trust Preferred debenture acquired as part of the VIST acquisition and a $1.3 million pre-tax gain related to a deposit account conversion. For 2014, noninterest income improvements included a $909,000 or 10.7% in service charges on deposit accounts, a $726,000 or 10.1% increase in card services income, and a $495,000 increase in gains on loan sales. These were partially offset by a decline in gains on securities transactions of $208,000.
Noninterest expenses were relatively flat compared to 2013 as salaries and wages and occupancy expense increases offset declines in employee benefit costs.
Insurance Segment
The Insurance segment reported net income of $3.1 million, down 3.9% when compared to 2013. Insurance commissions and fees increased $573,000 or 2.1% over the prior year. Revenues from the Company’s primary insurance lines: commercial, personal insurance and health and benefit insurance all increased compared to the prior year. Noninterest expense increased $1.1 million in 2014, up 4.8% compared to 2013. Increases in salaries and benefits costs, associated with merit increases and additional headcount contributed to most of the noninterest expense variance for 2014 compared to 2013.
Wealth Management Segment
The Wealth Management segment reported net income of $2.9 million for the twelve month period ended December 31, 2014, an increase of $407,000 or 16.1% compared to 2013. Investment services revenue of $15.5 million was up 2.5% from 2013. The market value of assets under management or in custody at December 31, 2014, totaled $3.8 billion, an increase of 9.2% compared to year-end 2013.
Net Interest Income
Net interest income is the Company’s largest source of revenue, representing 69.8% of total revenues for the twelve months ended December 31, 2014, and 69.7% of total revenues for the twelve months ended December 31, 2013. Net interest income was up 1.7% in 2014 compared to 2013. Net interest income is dependent on the volume and composition of interest earning assets and interest-bearing liabilities and the level of market interest rates. The Company’s net interest income over the past several years benefitted from steady growth in average earning assets, which were up 3.8% in 2014 compared to 2013, and lower funding costs which were down 13.7% in 2014 compared to 2013. For 2014 and 2013, the Company’s net interest income also benefitted from accretable yield attributable to loans acquired with evidence of credit deterioration and accounted for in accordance with ASC Topic 310-30.
The increase in taxable-equivalent interest income in 2014 was the result of a $169.7 million or 3.8% increase in average interest-earning assets in 2014 over 2013 average interest-earning assets. The growth in average earning assets and the higher concentration of loans helped to offset lower asset yields. The average yield on interest earning assets declined by 17 basis points or 4.1% for the period ended December 31, 2014. Average loan balances were up $185.5 million or 6.1% in 2014 compared to 2013, while the average yields on loans were down 31 basis points or 6.2%. Average loan balances represented 69.0% of earning assets in 2014 compared to 67.5% 2013. The average securities balance of $34.2 million and the average yield on securities of 2.39% for 2014 were both in line with 2013.
| 32 |
Interest expense for 2014 was down $3.3 million or 13.7% compared to 2013, while average interest bearing liabilities were in line with the prior year. The decrease in interest expense reflected lower average rates paid on deposits and borrowings during 2014 when compared to 2013 and growth in noninterest bearing deposit balances. The average rate paid on interest bearing deposits was 0.35%, down 5 basis points when compared to 2013. Average interest bearing deposits in 2014 were in line with 2013. Average noninterest bearing deposit balances in 2014 were up $97.2 million or 12.1% over 2013 and represented 22.1% of total deposits compared to 20.3% in 2013. Average other borrowings increased by $29.0 million or 13.0% year over year, mainly due to a higher volume of overnight borrowings with the FHLB in 2014.
Provision for Loan and Lease Losses
The provision for loan and lease losses was $2.3 million in 2014, compared to $6.2 million in 2013. Net loan charge-offs of $1.3 million in 2014 were down from $2.8 million in 2013. The decrease in provision expense was mainly a result of improved asset quality metrics and recoveries received on previously charged off credits.
Noninterest Income
Noninterest income represented 30.2% of total revenues in 2014, and 30.3% in 2013, and was an important factor in the Company’s results of operations. Noninterest income increased 1.2% over 2013.
Insurance commissions and fees increased $573,000 or 2.1% over 2013. Revenues for commercial insurance lines, personal insurance lines, and health and benefit related insurance products were all up in 2014 compared to the same period in 2013.
Investment services income in 2014 increased by $384,000 or 2.5% over 2013. Investment services income includes trust services, financial planning, and wealth management services. With fees largely based on the market value and the mix of assets managed, the general direction of the stock market can have a considerable impact on fee income. The market value of assets managed by, or in custody of, Tompkins was $3.8 billion at December 31, 2014, and $3.4 billion at December 31, 2013. These figures include $1.1 billion in 2014 and $906.8 million in 2013, of Company-owned securities where Tompkins Trust Company served as custodian. The increase in fair value of assets reflected favorable market conditions as well as successful business development initiatives resulting in customer retention.
Service charges on deposit accounts were up $909,000 or 10.7%, compared to 2013. The year-over-year increase was due to service fee income on deposit accounts which were up $897,000, and was slightly offset by overdraft fees which were down $84,000 compared to December 31, 2013. The largest component of this category is overdraft fees, which is largely driven by customer activity.
Card services income increased $726,000 or 10.1% over 2013. The primary components of card services income are fees related to debit card transactions and ATM usage. The increase over prior year was mainly in debit card income. Favorable trends in the number of cards issued and transaction volume were partially offset by lower interchange fees as a result of regulatory changes.
Net mark-to-market gains on securities and borrowings held at fair value were $62,000 in 2014, up $45,000 compared to 2013. Mark-to-market losses or gains relate to the change in the fair value of securities and borrowings where the Company has elected the fair value option. The year-over-year gains were mainly attributed to changes in market interest rates.
The Company recognized $391,000 of gains on sales/calls of available-for-sale securities in 2014, compared to $599,000 of gains in 2013. Sales of available-for-sale securities are generally the result of general portfolio maintenance and interest rate risk management.
Other income of $9.0 million was down $1.6 million or 14.8% compared to 2013. The significant components of other income are other service charges, increases in cash surrender value of corporate owned life insurance (“COLI”), gains on the sales of residential mortgage loans, FDIC indemnification asset accretion and income from miscellaneous equity investments, including the Company’s investment in a Small Business Investment Company (“SBIC”). Other income for 2013 included a pre-tax gain of $1.4 million on the redemption of a Trust Preferred debenture acquired as part of the VIST Financial acquisition and a pre-tax $1.3 million gain associated with certain deposit accounts that were converted to alternative products during the fourth quarter of 2013.
| 33 |
Noninterest Expense
Noninterest expenses of $154.7 million for 2014 were in line with 2013. Changes in various components of noninterest expense are discussed below.
Salaries and wages and pension and other employee benefit expenses increased $1.3 million or 1.5% over 2013. For 2014, salaries and wages were up $2.4 million or 3.5% over the prior year. The increases reflected additional employees, annual merit increases and higher accruals for incentive compensation. Pension and other employee benefits were down $1.1 million or 4.8% over 2013. The decrease in pension and other employee benefit expenses was mainly a result of an increase in the discount rate used to calculate the annual expense of these plans.
Net occupancy expense increased $446,000 or 3.8% in 2014 over 2013. The increase reflects higher expenses related to rent, utilities, real estate taxes, depreciation and general maintenance of properties for the year.
Other operating expenses of $41.1 million, increased by $480,000 or 1.2% compared to 2013. The primary components of other operating expenses in 2014 were technology expense ($6.2 million), marketing expense ($5.0 million), professional fees ($6.1 million), cardholder expense ($2.7 million) and other miscellaneous expense ($21.2 million). The increase in other miscellaneous expense when compared to 2013 was mainly due to amortization of the FDIC indemnification asset as a result of better than expected performance on FDIC covered loans.
The Company’s efficiency ratio, defined as operating expense excluding amortization of intangible assets, divided by tax-equivalent net interest income plus noninterest income before securities gains and losses (increase in the cash surrender value of COLI is shown on a tax equivalent basis) was 63.9% in 2014, compared to 64.0% in 2013. Tax equivalency was based upon a 40% tax rate. Excluding the tax equivalent adjustments for tax-exempt securities and tax-exempt loans and leases, the efficiency ratio would be 64.8% in 2014 and 65.0% in 2013.
Noncontrolling Interests
The Company had net income attributable to noncontrolling interests of $131,000 in 2014 and 2013. The noncontrolling interests relate to three real estate investment trusts, which are substantially owned by the Company’s banking subsidiaries.
Income Tax Expense
The provision for income taxes provides for Federal, New York State and Pennsylvania State income taxes. The 2014 provision was $25.4 million. The effective tax rate for the Company was 32.7% in 2014, up from 29.0% in 2013.
FINANCIAL CONDITION
Total assets, at December 31, 2015, grew by $420.4 million or 8.0% compared to the previous year-end. The growth was mainly in the loan portfolio which was up $378.8 million or 11.2% over year-end 2014.
As of December 31, 2015, total securities comprised 27.1% of total assets, compared to 28.5% of total assets at year-end 2014. The securities portfolio primarily contains mortgage-backed securities, obligations of U.S. Government sponsored entities, and obligations of states and political subdivisions. The Company has no investments in preferred stock of U.S. Government sponsored entities and no investments in pools of trust preferred securities. A more detailed discussion of the securities portfolio is provided below in this section under the caption “Securities”.
Loans and leases were 66.3% of total assets at December 31, 2015, compared to 64.4% of total assets at December 31, 2014. A more detailed discussion of the loan portfolio is provided below in this section under the caption “Loans and Leases”.
Total deposits increased by $226.2 million or 5.4% compared to December 31, 2014. Noninterest bearing deposits and checking, savings and money market deposits grew by $115.3 million or 11.3% and $153.8 million or 6.8%, respectively, compared to December 31, 2014. Time deposit balances decreased by 4.8% compared to 2014 year-end. Other borrowings, consisting mainly of short term advances with the FHLB, were up $179.7 million from December 31, 2014. A more detailed discussion of deposits and borrowings is provided below in this section under the caption “Deposits and Other Liabilities”.
| 34 |
Shareholders’ Equity
The Consolidated Statements of Changes in Shareholders’ Equity included in the Consolidated Financial Statements of the Company contained in Part II, Item 8. of this Report, detail the changes in equity capital. Total shareholders’ equity was up $26.9 million or 5.5% to $516.5 million at December 31, 2015, from $489.6 million at December 31, 2014. Additional paid-in capital increased by $1.9 million, from $348.9 million at December 31, 2014, to $350.8 million at December 31, 2015. The $1.9 million increase included the following: $1.9 million related to stock-based compensation; $1.7 million of proceeds from stock option exercises and the related tax benefits; $1.6 million related to shares issued for the employee stock ownership plan; and $355,000 related to shares issued for director deferred compensation plan. These were partially offset by the Company’s repurchase of 67,481 shares of its common stock for $3.5 million. Retained earnings increased by $32.3 million, reflecting net income of $58.4 million less dividends of $25.4 million.
Accumulated other comprehensive loss increased from $24.0 million at December 31, 2014 to $31.0 million at December 31, 2015; reflecting a $5.6 million decrease in unrealized gains on available-for-sale securities due to market interest rates, and an $1.4 million unrealized loss associated with employee benefit plans. Under regulatory requirements, amounts reported as accumulated other comprehensive income/loss related to net unrealized gain or loss on available-for-sale securities and the funded status of the Company’s defined benefit post-retirement benefit plans do not increase or reduce regulatory capital and are not included in the calculation of risk-based capital and leverage capital ratios.
Total shareholders’ equity was up $31.6 million or 6.9% to $489.6 million at December 31, 2014, from $457.9 million at December 31, 2013. Additional paid-in capital increased by $2.8 million, from $346.1 million at December 31, 2013, to $348.9 million at December 31, 2014. The $2.8 million increase included the following: $1.7 million of proceeds from stock option exercises and the related tax benefits; $1.5 million related to stock-based compensation; $2.2 million related to shares issued for dividend reinvestment plans; $1.5 million related to shares issued for the employee stock ownership plan; and $329,000 related to shares issued for director deferred compensation plan. These were partially offset by the Company’s repurchase of 101,466 shares of its common stock for $4.6 million. Retained earnings increased by $28.1 million, reflecting net income of $52.0 million less dividends of $24.0 million.
Accumulated other comprehensive loss decreased from $25.1 million at December 31, 2013 to $24.0 million at December 31, 2014; reflecting a $11.1 million increase in unrealized gains on available-for-sale securities due to market interest rates, and an $10.1 million unrealized loss associated with postretirement benefit plans.
The Company continued its long history of increasing cash dividends with a per share increase of 4.9% in 2015, which followed an increase of 5.2% in 2014. Dividends per share amounted to $1.70 in 2015, compared to $1.62 in 2014, and $1.54 in 2013. Cash dividends paid represented 43.5%, 46.1%, and 44.2% of after-tax net income in each of 2015, 2014, and 2013, respectively.
On July 24, 2014, the Company’s Board of Directors authorized a share repurchase plan for the Company to repurchase up to 400,000 shares of the Company’s common stock. Purchases may be made over the 24 months following adoption of the plan. The repurchase program may be suspended, modified or terminated at any time for any reason. During 2015, the Company repurchased 67,481 shares at an average price of $51.97.
The Company and its subsidiary banks are subject to quantitative capital measures established by regulation to ensure capital adequacy. Consistent with the objective of operating a sound financial organization, the Company and its subsidiary banks maintain capital ratios well above regulatory minimums and meet the requirements to be considered well-capitalized under the regulatory guidelines.
As of December 31, 2015, the capital ratios for the Company’s four subsidiary banks exceeded the minimum levels required to be considered well capitalized. Additional information on the Company’s capital ratios and regulatory requirements is provided in “Note 20 - Regulations and Supervision” in Notes to Consolidated Financial Statements in Part II, Item 8. of this Report on Form 10-K.
Securities
The Company maintains a portfolio of securities such as U.S. Treasuries, U.S. government sponsored entities securities, U.S. government agencies, non-U.S. Government agencies or sponsored entities mortgage-backed securities, obligations of states and political subdivisions thereof and equity securities. Management typically invests in securities with short to intermediate average lives in order to better match the interest rate sensitivities of its assets and liabilities. Investment decisions are made within policy guidelines established by the Company’s Board of Directors. The investment policy established by the Company’s Board of Directors is based on the asset/liability management goals of the Company, and is monitored by the Company’s Asset/Liability Management Committee. The intent of the policy is to establish a portfolio of high quality diversified securities, which optimizes net interest income within safety and liquidity limits deemed acceptable by the Asset/Liability Management Committee.
| 35 |
The Company classifies its securities at date of purchase as available-for-sale, held-to-maturity or trading. Securities, other than certain obligations of states and political subdivisions thereof, are generally classified as available-for-sale. Securities available-for-sale may be used to enhance total return, provide additional liquidity, or reduce interest rate risk. The held-to-maturity portfolio consists of obligations of U.S. Government sponsored entities and obligations of state and political subdivisions. The securities in the trading portfolio reflect those securities that the Company elects to account for at fair value, with the adoption of ASC Topic 825, Financial Instrument.
The Company’s total securities portfolio at December 31, 2015 totaled $1.54 billion compared to $1.50 billion at December 31, 2014. The tables below show The decrease in the available-for-sale portfolio during 2015 was mainly due to decreases in mortgage-backed securities issued by U.S. Government sponsored entities, partially offset by an increase in obligations of U.S. state and political subdivisions during the year. In addition, fair values decreased between year-end 2014 and year-end 2015 as a result of changes in market interest rates. The increase in the held-to-maturity portfolio was due to purchases of obligations of U.S. Government Additional information on the securities portfolio is available in “Note 2 Securities” in Notes to Consolidated Financial Statements in Part II, Item 8. of this Report, which details the types of securities held, the carrying and fair values, and the contractual maturities as of December 31, 2015 and 2014.
| Available-for-Sale Securities | 2015 | 2014 | 2013 | |||||||||||||||||||||
| (in thousands) | Amortized Cost |
Fair Value | Amortized Cost |
Fair Value | Amortized Cost |
Fair Value | ||||||||||||||||||
| Obligations of U.S. Government sponsored entities | $ | 551,176 | $ | 552,893 | $ | 553,300 | $ | 557,820 | $ | 558,130 | $ | 556,345 | ||||||||||||
| Obligations of U.S. states and political subdivisions | 83,981 | 84,726 | 70,790 | 71,510 | 68,216 | 67,962 | ||||||||||||||||||
| Mortgage-backed securities-residential, issued by | ||||||||||||||||||||||||
| U.S. Government agencies | 94,459 | 94,678 | 108,931 | 109,926 | 147,766 | 146,678 | ||||||||||||||||||
| U.S. Government sponsored entities | 656,947 | 650,097 | 660,195 | 659,120 | 587,843 | 577,472 | ||||||||||||||||||
| Non-U.S. Government agencies or sponsored entities | 192 | 194 | 267 | 271 | 306 | 311 | ||||||||||||||||||
| U.S. corporate debt securities | 2,500 | 2,162 | 2,500 | 2,162 | 5,000 | 4,633 | ||||||||||||||||||
| Total debt securities | 1,389,255 | 1,384,750 | 1,395,983 | 1,400,809 | 1,367,261 | 1,353,401 | ||||||||||||||||||
| Equity securities | 1,000 | 934 | 1,475 | 1,427 | 1,475 | 1,410 | ||||||||||||||||||
| Total available-for-sale securities | $ | 1,390,255 | $ | 1,385,684 | $ | 1,397,458 | $ | 1,402,236 | $ | 1,368,736 | $ | 1,354,811 | ||||||||||||
Equity securities include miscellaneous investments carried at fair value, which approximates cost.
| Held-to-Maturity Securities | 2015 | 2014 | 2013 | |||||||||||||||||||||
| Amortized Cost |
Fair Value | Amortized Cost |
Fair Value | Amortized Cost |
Fair Value | |||||||||||||||||||
| Obligations of U.S. Government sponsored entities | $ | 132,482 | $ | 132,687 | $ | 71,906 | $ | 72,269 | $ | 0 | $ | 0 | ||||||||||||
| Obligations of U.S. states and political subdivisions | 13,589 | 13,999 | 16,262 | 16,767 | 18,980 | 19,625 | ||||||||||||||||||
| Total held-to-maturity securities | $ | 146,071 | $ | 146,686 | $ | 88,168 | $ | 89,036 | $ | 18,980 | $ | 19,625 | ||||||||||||
| 36 |
| Trading Securities | 2015 | 2014 | 2013 | |||||||||
| Fair Value | Fair Value | Fair Value | ||||||||||
| Obligations of U.S. Government sponsored entities | $ | 6,601 | $ | 7,404 | $ | 8,275 | ||||||
| Mortgage-backed securities-residential issued by U.S. Government sponsored entities | 767 | 1,588 | 2,716 | |||||||||
| Total trading securities | $ | 7,368 | $ | 8,992 | $ | 10,991 | ||||||
The decrease in trading securities reflects principal repayments and maturities received during 2015. The pre-tax mark-to-market losses on trading securities were $295,000, $269,000 and $538,000 in 2015, 2014 and 2013, respectively.
Quarterly, the Company evaluates all investment securities with a fair value less than amortized cost to identify any other-than-temporary impairment as defined under generally accepted accounting principles. The Company did not recognize any net credit impairment charge to earnings on investment securities in 2015, 2014, and 2013. During 2013, the Company sold three non-U.S. Government agencies or sponsored entities mortgage backed securities for a gain of approximately $94,000. Prior to 2013, these non-U.S. Government agencies or sponsored entities mortgage backed securities were determined to be other-than-temporarily impaired and the Company did recognize net credit impairment charges to earnings of $441,000 over the life of these securities.
The Company uses a two step modeling approach to analyze each non-agency CMO issue to determine whether or not the current unrealized losses are due to credit impairment and therefore other-than-temporarily impaired (“OTTI”). Step one in the modeling process applies default and severity credit vectors to each security based on current credit data detailing delinquency, bankruptcy, foreclosure and real estate owned (REO) performance. The results of the credit vector analysis are compared to the security’s current credit support coverage to determine if the security has adequate collateral support. If the security’s current credit support coverage falls below certain predetermined levels, step two is utilized. In step two, the Company uses a third party to assist in calculating the present value of current estimated cash flows to ensure there are no adverse changes in cash flows during the quarter leading to an other-than-temporary-impairment. Management’s assumptions used in step two include default and severity vectors and prepayment assumptions along with various other criteria including: percent decline in fair value; credit rating downgrades; probability of repayment of amounts due, credit support and changes in average life. As a result of the modeling process, the Company does not consider any investment security to be other-than-temporarily impaired at December 31, 2015. Future changes in interest rates or the credit quality and credit support of the underlying issuers may reduce the market value of these and other securities. If such decline is determined to be other than temporary, the Company will record the necessary charge to earnings and/or accumulated other comprehensive income to reduce the securities to their then current fair value.
The Company also holds non-marketable Federal Home Loan Bank New York (“FHLBNY”) stock, non-marketable Federal Home Loan Bank Pittsburgh (“FHLBPITT”) stock and non-marketable Atlantic Community Bankers Bank (“ACBB”) stock, all of which are required to be held for regulatory purposes and for borrowing availability. The required investment in FHLB stock is tied to the Company’s borrowing levels with the FHLB. Holdings of FHLBNY stock, FHLBPITT stock and ACBB stock totaled $20.1million, $9.8 million and $95,000 at December 31, 2015, respectively. These securities are carried at par, which is also cost. The FHLBNY and FHLBPITT continue to pay dividends and repurchase stock. As such, the Company has not recognized any impairment on its holdings of FHLBNY and FHLBPITT stock. At December 31, 2014, the Company’s holdings of FHLBNY stock, FHLBPITT stock, and ACBB stock totaled $14.6 million, $6.6 million, and $95,000, respectively.
Management’s policy is to purchase investment grade securities that, on average, have relatively short expected durations. This policy helps mitigate interest rate risk and provides sources of liquidity without significant risk to capital. The contractual maturity distribution of debt securities and mortgage-backed securities as of December 31, 2015, along with the weighted average yield of each category, is presented in Table 3-Maturity Distribution below. Balances are shown at amortized cost and weighted average yields are calculated on a fully taxable-equivalent basis. Expected maturities will differ from contractual maturities presented in Table 3-Maturity Distribution below, because issuers may have the right to call or prepay obligations with or without penalty and mortgage-backed securities will pay throughout the periods prior to contractual maturity.
| 37 |
Table 3 - Maturity Distribution
| As of December 31, 2015 | ||||||||||||||||
| Securities Available-for-Sale1 |
Securities Held-to-Maturity |
|||||||||||||||
| (dollar amounts in thousands) | Amount | Yield2 | Amount | Yield2 | ||||||||||||
| Obligations of U.S. Government sponsored entities | ||||||||||||||||
| Within 1 year | $ | 47,983 | 3.54 | % | $ | 0 | 0.00 | % | ||||||||
| Over 1 to 5 years | 318,817 | 1.84 | % | 10,860 | 2.04 | % | ||||||||||
| Over 5 to 10 years | 184,376 | 2.12 | % | 121,622 | 2.49 | % | ||||||||||
| $ | 551,176 | 2.08 | % | $ | 132,482 | 2.45 | % | |||||||||
| Obligations of U.S. state and political subdivisions | ||||||||||||||||
| Within 1 year | $ | 5,953 | 3.37 | % | $ | 9,249 | 3.75 | % | ||||||||
| Over 1 to 5 years | 32,646 | 3.33 | % | 3,209 | 7.23 | % | ||||||||||
| Over 5 to 10 years | 34,784 | 3.03 | % | 963 | 7.82 | % | ||||||||||
| Over 10 years | 10,598 | 3.45 | % | 168 | 8.48 | % | ||||||||||
| $ | 83,981 | 3.22 | % | $ | 13,589 | 4.92 | % | |||||||||
| Mortgage-backed securities - residential | ||||||||||||||||
| Within 1 year | $ | 119 | 5.23 | % | $ | 0 | 0.00 | % | ||||||||
| Over 1 to 5 years | 18,792 | 3.46 | % | 0 | 0.00 | % | ||||||||||
| Over 5 to 10 years | 128,578 | 2.67 | % | 0 | 0.00 | % | ||||||||||
| Over 10 years | 604,109 | 2.08 | % | 0 | 0.00 | % | ||||||||||
| $ | 751,598 | 2.22 | % | $ | 0 | 0.00 | % | |||||||||
| Other securities | ||||||||||||||||
| Over 10 years | $ | 2,500 | 3.36 | % | $ | 0 | 0.00 | % | ||||||||
| Equity securities | 1,000 | 3.00 | % | 0 | 0.00 | % | ||||||||||
| $ | 3,500 | 3.26 | % | $ | 0 | 0.00 | % | |||||||||
| Total securities | ||||||||||||||||
| Within 1 year | $ | 54,055 | 3.52 | % | $ | 9,249 | 3.75 | % | ||||||||
| Over 1 to 5 years | 370,255 | 2.05 | % | 14,069 | 3.22 | % | ||||||||||
| Over 5 to 10 years | 347,738 | 2.41 | % | 122,585 | 2.53 | % | ||||||||||
| Over 10 years | 617,207 | 2.11 | % | 168 | 8.48 | % | ||||||||||
| Equity securities | 1,000 | 3.00 | % | 0 | 0.00 | % | ||||||||||
| $ | 1,390,255 | 2.22 | % | $ | 146,071 | 2.68 | % | |||||||||
| 1 Balances of available-for-sale securities are shown at amortized cost. | ||||||||
| 2 Interest income includes the tax effects of taxable-equivalent adjustments using a combined New York State and Federal effective income tax rate of 40% to increase tax exempt interest income to taxable-equivalent basis. |
The average taxable-equivalent yield on the securities portfolio was 2.22% in 2015 and 2.39% in 2014 and 2013.
At December 31, 2015, there were no holdings of any one issuer, other than the U.S. Government sponsored entities, in an amount greater than 10% of the Company’s shareholders’ equity.
38
Loans and Leases
Table 4 Composition of Loan and Lease Portfolio
| Originated Loans and Leases | As of December 31, | |||||||||||||||||||
| (in thousands) | 2015 | 2014 | 2013 | 2012 | 2011 | |||||||||||||||
| Commercial and industrial | ||||||||||||||||||||
| Agriculture | $ | 88,299 | $ | 78,507 | $ | 74,788 | $ | 77,777 | $ | 67,566 | ||||||||||
| Commercial and industrial other | 768,024 | 688,529 | 562,439 | 446,876 | 417,128 | |||||||||||||||
| Subtotal commercial and industrial | 856,323 | 767,036 | 637,227 | 524,653 | 484,694 | |||||||||||||||
| Commercial real estate | ||||||||||||||||||||
| Construction | 103,037 | 72,427 | 46,441 | 41,605 | 47,304 | |||||||||||||||
| Agriculture | 86,935 | 58,994 | 52,627 | 48,309 | 53,071 | |||||||||||||||
| Commercial real estate other | 1,167,250 | 979,621 | 903,320 | 722,273 | 665,859 | |||||||||||||||
| Subtotal commercial real estate | 1,357,222 | 1,111,042 | 1,002,388 | 812,187 | 766,234 | |||||||||||||||
| Residential real estate | ||||||||||||||||||||
| Home equity | 202,578 | 186,957 | 171,809 | 159,720 | 161,278 | |||||||||||||||
| Mortgages | 823,841 | 710,904 | 658,966 | 573,861 | 500,034 | |||||||||||||||
| Subtotal residential real estate | 1,026,419 | 897,861 | 830,775 | 733,581 | 661,312 | |||||||||||||||
| Consumer and other | ||||||||||||||||||||
| Indirect | 17,829 | 18,298 | 21,202 | 26,679 | 32,787 | |||||||||||||||
| Consumer and other | 40,904 | 35,874 | 32,312 | 32,251 | 30,961 | |||||||||||||||
| Subtotal consumer and other | 58,733 | 54,172 | 53,514 | 58,930 | 63,748 | |||||||||||||||
| Leases | 14,861 | 12,251 | 5,563 | 4,618 | 6,489 | |||||||||||||||
| Total loans and leases | 3,313,558 | 2,842,362 | 2,529,467 | 2,133,969 | 1,982,477 | |||||||||||||||
| Less: unearned income and deferred costs and fees | (2,790 | ) | (2,388 | ) | (2,223 | ) | (863 | ) | (628 | ) | ||||||||||
| Total originated loans and leases, net of unearned income and deferred costs and fees | $ | 3,310,768 | $ | 2,839,974 | $ | 2,527,244 | $ | 2,133,106 | $ | 1,981,849 | ||||||||||
| Acquired Loans | ||||||||||||||||||||
| Commercial and industrial | ||||||||||||||||||||
| Commercial and industrial other | $ | 84,810 | $ | 97,034 | $ | 128,503 | $ | 167,427 | $ | 0 | ||||||||||
| Subtotal commercial and industrial | 84,810 | 97,034 | 128,503 | 167,427 | 0 | |||||||||||||||
| Commercial real estate | ||||||||||||||||||||
| Construction | 4,892 | 35,906 | 39,353 | 43,074 | 0 | |||||||||||||||
| Agriculture | 2,095 | 3,182 | 3,135 | 3,247 | 0 | |||||||||||||||
| Commercial real estate other | 284,952 | 308,488 | 366,438 | 445,359 | 0 | |||||||||||||||
| Subtotal commercial real estate | 291,939 | 347,576 | 408,926 | 491,680 | 0 | |||||||||||||||
| Residential real estate | ||||||||||||||||||||
| Home equity | 42,092 | 56,008 | 67,183 | 81,657 | 0 | |||||||||||||||
| Mortgages | 27,491 | 32,282 | 35,336 | 41,618 | 0 | |||||||||||||||
| Subtotal residential real estate | 69,583 | 88,290 | 102,519 | 123,275 | 0 | |||||||||||||||
| Consumer and other | ||||||||||||||||||||
| Indirect | 0 | 0 | 5 | 24 | 0 | |||||||||||||||
| Consumer and other | 911 | 1,095 | 1,219 | 1,498 | 0 | |||||||||||||||
| Subtotal consumer and other | 911 | 1,095 | 1,224 | 1,522 | 0 | |||||||||||||||
| Covered loans | 14,031 | 19,319 | 25,868 | 37,600 | 0 | |||||||||||||||
| Total acquired loans and leases | $ | 461,274 | $ | 553,314 | $ | 667,040 | $ | 821,504 | $ | 0 | ||||||||||
The Company did not have any acquired loans accounted for in accordance with ASC Topic 805 for the year ended December 31, 2011.
Total loans and leases of $3.8 billion at December 31, 2015 were up $378.8 million or 11.2% from December 31, 2014. The growth was mainly due to organic loan growth. On August 1, 2012, the Company acquired $889.3 million of loans in the VIST Financial acquisition. These loans are shown in the table under the acquired loan heading. All other loans, including loans originated by VIST Bank since acquisition date of August 1, 2012, are considered originated loans. Originated loan balances at December 31, 2015 are up 16.6% over year-end 2014. The increase in originated loans, over prior year-end, was in all loan categories. As of December 31, 2015 total loans and leases represented 66.3% of total assets compared to 64.4% of total assets at December 31, 2014.
39
Residential real estate loans of $1.1 billion at December 31, 2015, including home equity loans, increased by $109.9 million or 11.1% from $986.2 million at year-end 2014, and comprised 29.1% of total loans and leases at December 31, 2015. The growth in residential real estate loan balances reflects higher origination volumes due to the low interest rate environment as well as a decision to retain certain residential mortgages in the portfolio rather than sell them in the secondary market due to interest rate considerations. The Company’s Asset/Liability Committee meets regularly and establishes standards for selling and retaining residential real estate mortgage originations.
The Company may sell residential real estate loans in the secondary market based on interest rate considerations. These residential real estate loans are generally sold to Federal Home Loan Mortgage Corporation (“FHLMC”) or State of New York Mortgage Agency (“SONYMA”) without recourse in accordance with standard secondary market loan sale agreements. These residential real estate loans also are subject to customary representations and warranties made by the Company, including representations and warranties related to gross incompetence and fraud. The Company has not had to repurchase any loans as a result of these representations and warranties. While in the past in rare circumstances the Company agreed to sell residential real estate loans with recourse, the Company has not done so in the past several years and the amount of such loans included on the Company’s balance sheet at December 31, 2015 was insignificant. The Company has never had to repurchase a loan sold with recourse.
During 2015, 2014, and 2013, the Company sold residential mortgage loans totaling $3.2 million, $19.9 million, and $13.2 million, respectively, and realized net gains on these sales of $54,000, $362,000, and $301,000, respectively. These residential real estate loans are generally sold without recourse in accordance with standard secondary market loan sale agreement. When residential mortgage loans are sold to FHLMC or SONYMA, the Company typically retains all servicing rights, which provides the Company with a source of fee income. In connection with the sales in 2015, 2014, and 2013, the Company recorded mortgage-servicing assets of $18,000, $146,000, and $85,000, respectively.
The Company has not originated any hybrid loans, such as payment option ARMs. The Company underwrites residential real estate loans in accordance with secondary market standards in effect at the time of origination, including loan-to-value (“LTV”) and documentation requirements. The Company does not underwrite low or reduced documentation loans other than those that meet secondary market standards for low or reduced documentation loans. In those instances, W-2’s and paystubs are used instead of sending Verification of Employment forms to employers to verify income and bank deposit statements are used instead of Verification of Deposit forms mailed to financial institutions to verify deposit balances.
Commercial real estate loans totaled $1.6 billion at December 31, 2015; an increase of $190.5 million compared to December 31, 2014, and represented 43.7% of total loans and leases at December 31, 2015, compared to 43.0% at December 31, 2014.
Commercial and industrial loans totaled $941.1 million at December 31, 2015, which is an increase of $77.1 million from $864.1 million reported as of December 31, 2014. As of December 31, 2015, agriculturally-related loans totaled $177.3 million or 4.7% of total loans and leases compared to $140.7 million or 4.2% of total loans and leases at December 31, 2014. Agriculturally-related loans include loans to dairy farms and cash and vegetable crop farms. Agriculturally related loans are primarily made based on identified cash flows of the borrower with consideration given to underlying collateral, personal guarantees, and government related guarantees. Agriculturally-related loans are generally secured by the assets or property being financed or other business assets such as accounts receivable, livestock, equipment or commodities/crops.
The consumer loan portfolio includes personal installment loans, indirect automobile financing, and overdraft lines of credit. Consumer and other loans were $59.6 million at December 31, 2015, compared to $55.3 million at December 31, 2014.
The lease portfolio increased by 21.3% to $14.9 million at December 31, 2015 from $12.3 million at December 31, 2014. As of December 31, 2015, commercial leases and municipal leases represented 100.0% of total leases. Management continues to review leasing opportunities, primarily commercial leasing and municipal leasing.
Acquired loans were recorded at fair value pursuant to the purchase accounting guidelines in FASB ASC 805 – “Fair Value Measurements and Disclosures” (as determined by the present value of expected future cash flows) with no valuation allowance (i.e., the allowance for loan losses). At acquisition, the Company evaluated whether each acquired loan (regardless of size) was within the scope of ASC 310-30, “Receivables – Loans and Debt Securities Acquired with Deteriorated Credit Quality”.
40
The carrying value of loans acquired from VIST and accounted for in accordance with ASC Subtopic 310-30, “Loans and Debt Securities Acquired with Deteriorated Credit Quality,” was $26.5 million at December 31, 2015, compared to $34.4 million at December 31, 2014. Under ASC Subtopic 310-30, loans may be aggregated and accounted for as pools of loans if the loans being aggregated have common risk characteristics. The Company elected to account for the loans with evidence of credit deterioration individually rather than aggregate them into pools. The difference between the undiscounted cash flows expected at acquisition and the investment in the acquired loans, or the “accretable yield,” is recognized as interest income utilizing the level-yield method over the life of each loan. Contractually required payments for interest and principal that exceed the undiscounted cash flows expected at acquisition, or the “non-accretable difference,” are not recognized as a yield adjustment, as a loss accrual or as a valuation allowance.
Increases in expected cash flows subsequent to the acquisition are recognized prospectively through an adjustment of the yield on the loans over the remaining life, while decreases in expected cash flows are recognized as impairment through a loss provision and an increase in the allowance for loan losses. Valuation allowances (recognized in the allowance for loan losses) on these impaired loans reflect only losses incurred after the acquisition (representing all cash flows that were expected at acquisition but currently are not expected to be received).
The carrying value of loans not exhibiting evidence of credit impairment at the time of the acquisition (i.e. loans outside of the scope of ASC 310-30) was $434.8 million at December 31, 2015 as compared to $518.9 million at December 31, 2014. The fair value of the acquired loans not exhibiting evidence of credit impairment was determined by projecting contractual cash flows discounted at risk-adjusted interest rates.
The carrying value of the acquired loans reflects management’s best estimate of the amount to be realized from the acquired loan and lease portfolios. However, the amounts the Company actually realizes on these loans could differ materially from the carrying value reflected in these financial statements, based upon the timing of collections on the acquired loans in future periods, underlying collateral values and the ability of borrowers to continue to make payments.
Purchased performing loans were recorded at fair value, including a credit discount. Credit losses on acquired performing loans are estimated based on analysis of the performing portfolio. Such estimated credit losses are recorded as an accretable discount in a manner similar to purchased impaired loans. The fair value discount other than for credit loss is accreted as an adjustment to yield over the estimated lives of the loans. Interest is accrued daily on the outstanding principal balances of purchased performing loans. Fair value adjustments are also accreted into income over the estimated lives of the loans on a level yield basis.
At December 31, 2015, acquired loans included $14.0 million of covered loans as compared to $19.3 million of covered loans at the prior year-end. VIST Financial had acquired these loans in an FDIC assisted transaction in the fourth quarter of 2010. In accordance with loss sharing agreements with the FDIC, certain losses and expenses relating to covered loans may be reimbursed by the FDIC at 70% or, if certain levels of reimbursement are reached, 80%. See Note 5 – “FDIC Indemnification Asset Related to Covered Loans” in the Notes to Consolidated Financial Statements in Part II, Item 8. of this Report on Form 10-K.
The Company has adopted comprehensive lending policies, underwriting standards and loan review procedures. The Company reviewed the lending policies of Tompkins and VIST Financial, and adopted a uniform policy for the Company. There were no significant changes to the Company’s existing policies, underwriting standards and loan review. The Company’s Board of Directors approves the lending policies at least annually. The Company recognizes that exceptions to policy guidelines may occasionally occur and has established procedures for approving exceptions to these policy guidelines. Management has also implemented reporting systems to monitor loan originations, loan quality, concentrations of credit, loan delinquencies and nonperforming loans and potential problem loans.
The Company’s loan and lease customers are located primarily in the New York and Pennsylvania communities served by its four subsidiary banks. Although operating in numerous communities in New York State and Pennsylvania, the Company is still dependent on the general economic conditions of these states. Other than geographic and general economic risks, management is not aware of any material concentrations of credit risk to any industry or individual borrower.
41
Analysis of Past Due and Nonperforming Loans
| (in thousands) | 2015 | 2014 | 2013 | 2012 | 2011 | |||||||||||||||
| Loans 90 days past due and accruing | ||||||||||||||||||||
| Commercial real estate | $ | 0 | $ | 0 | $ | 161 | $ | 0 | $ | 0 | ||||||||||
| Residential real estate | 58 | 106 | 446 | 257 | 1,378 | |||||||||||||||
| Consumer and other | 0 | 0 | 0 | 0 | 2 | |||||||||||||||
| Total loans 90 days past due and accruing | 58 | 106 | 607 | 257 | 1,380 | |||||||||||||||
| Nonaccrual loans | ||||||||||||||||||||
| Commercial and industrial | 1,738 | 2,116 | 1,679 | 1,340 | 7,105 | |||||||||||||||
| Commercial real estate | 6,054 | 7,520 | 23,364 | 25,014 | 26,352 | |||||||||||||||
| Residential real estate | 9,863 | 9,043 | 13,086 | 11,084 | 5,884 | |||||||||||||||
| Consumer and other | 182 | 349 | 254 | 302 | 237 | |||||||||||||||
| Leases | 0 | 0 | 0 | 0 | 10 | |||||||||||||||
| Total nonaccrual loans | 17,837 | 19,028 | 38,383 | 37,740 | 39,588 | |||||||||||||||
| Troubled debt restructurings not included above | 3,915 | 3,444 | 45 | 1,532 | 428 | |||||||||||||||
| Total nonperforming loans and leases | 21,810 | 22,578 | 39,035 | 39,529 | 41,396 | |||||||||||||||
| Other real estate owned | 2,692 | 5,683 | 4,253 | 4,862 | 1,334 | |||||||||||||||
| Total nonperforming assets | $ | 24,502 | $ | 28,261 | $ | 43,288 | $ | 44,391 | $ | 42,730 | ||||||||||
| Total nonperforming loans and leases as a percentage of total loans and leases | 0.58 | % | 0.67 | % | 1.22 | % | 1.34 | % | 2.09 | % | ||||||||||
| Total nonperforming assets as a percentage of total assets | 0.43 | % | 0.54 | % | 0.87 | % | 0.92 | % | 1.26 | % | ||||||||||
| Allowance as a percentage of nonperforming loans and leases | 146.74 | % | 128.43 | % | 71.65 | % | 62.34 | % | 66.65 | % | ||||||||||
* The 2015, 2014, 2013 and 2012 columns in the above table excludes $2.5 million, $3.5 million, $7.0 million and $18.7 million, respectively, of acquired loans that are 90 days past due and accruing interest. These loans were originally recorded at fair value on the acquisition date of August 1, 2012. These loans are considered to be accruing as we can reasonably estimate future cash flows on these acquired loans and we expect to fully collect the carrying value of these loans. Therefore, we are accreting the difference between the carrying value of these loans and their expected cash flows into interest income.
The level of nonperforming assets at the past five year ends is illustrated in the table above. The table shows that the balances of nonperforming loans and assets were fairly consistent between 2011 and 2013 and down significantly in 2014 and 2015, and the ratios of nonperforming assets to total assets and nonperforming loans to total loans steadily improved over the period. The Company’s total nonperforming assets as a percentage of total assets is 0.43% at December 31, 2015, down from 0.54% at December 31, 2014, and continues to compare favorably to its peer group’s most recent ratio of 0.90% at December 31, 2015. The peer data is from the Federal Reserve Board and represents banks or bank holding companies with assets between $3.0 billion and $10.0 billion.
Nonperforming loans at December 31, 2015 were down 3.4% from December 31, 2014. Nonperforming loans represented 0.58% of total loans at December 31, 2015, compared to 0.67% of total loans at December 31, 2014, and 1.22% of total loans at December 31, 2013. A breakdown of nonperforming loans by portfolio segment is shown above. Loans past due 90 days and accruing interest, nonaccrual loans, and other real estate owned were down at year-end 2015 from year-end 2014.
At December 31, 2015, nonaccrual loans secured by commercial real estate were down $1.5 million or 19.5% from prior year-end and represented 33.9% of total nonaccrual loans compared to 39.5% at December 31, 2014. Nonaccrual loans secured by residential real estate were up 9.1% and represented 55.3% of total nonaccrual loans at December 31, 2015 compared to 47.5% for the same period in 2014.
Loans are considered modified in a troubled debt restructuring (“TDR”) when, due to a borrower’s financial difficulties; the Company makes a concession(s) to the borrower that it would not otherwise consider. When modifications are provided for reasons other than as a result of the financial distress of the borrower, these loans are not classified as TDRs or impaired. These modifications may include, among others, an extension of the term of the loan, and granting a period when interest-only payments can be made, with the principal payments made over the remaining term of the loan or at maturity. TDRs are included in the above table within the following categories: “loans 90 days past due and accruing”, “nonaccrual loans”, or “troubled debt restructurings not included above”. Loans in the latter category include loans that meet the definition of a TDR but are performing in accordance with the modified terms and have shown a satisfactory period of repayment (generally six consecutive months) and where full collection of all is reasonably assured. At December 31, 2015, the Company had total TDRs of $8.0 million, which are included in the above table; $3.9 million in the line captioned “Troubled debt restructurings not included above” and the remainder within nonaccrual loans.
42
In general, the Company places a loan on nonaccrual status if principal or interest payments becomes 90 days or more past due and/or management deems the collectability of the principal and/or interest to be in question, as well as when called for by regulatory requirements. Although in nonaccrual status, the Company may continue to receive payments on these loans. These payments are generally recorded as a reduction to principal and interest income is recorded only after principal recovery is reasonably assured. The difference between the interest income that would have been recorded if these loans and leases had been paid in accordance with their original terms and the interest income that was recorded for the year ended December 31, 2015, was $2.9 million. The amounts for the years ended December 31, 2014 and 2013 were $1.7 million and $1.2 million, respectively. The Company had no material commitments to make additional advances to borrowers with nonperforming loans.
A loan is impaired when, based on current information and events, it is probable that we will be unable to collect all amounts due according to the contractual terms of the loan agreement. Impaired loans consist of our non-homogenous nonaccrual loans and loans that are 90 days or more past due. Specific reserves on individually identified impaired loans that are not collateral dependent are measured based on the present value of expected future cash flows discounted at the original effective interest rate of each loan. For loans that are collateral dependent, impairment is measured based on the fair value of the collateral less estimated selling costs, and such impaired amounts are generally charged off.
The Company’s recorded investment in originated loans and leases that are considered impaired totaled $9.1 million at December 31, 2015, and $10.4 million at December 31, 2014. At December 31, 2015 there was a specific reserve of $288,000 related to a commercial real estate loan, compared to a $652,000 reserve on a commercial real estate loan in 2014. The majority of impaired loans are collateral dependent impaired loans that have limited exposure or require limited specific reserves because of the amount of collateral support with respect to these loans or the loans have been written down to fair value. Interest payments on impaired loans are typically applied to principal unless collectability of the principal amount is reasonably assured. In these cases, interest is recognized on a cash basis. There was no interest income recognized on impaired loans and leases for 2015, 2014 and 2013.
The ratio of the allowance to nonperforming loans (loans past due 90 days and accruing, nonaccrual loans and restructured troubled debt) was 146.74% at December 31, 2015, compared to 128.43% at December 31, 2014. The Company’s nonperforming loans are mostly made up of collateral dependent impaired loans requiring little to no specific allowance due to the level of collateral available with respect to these loans and/or previous charge-offs.
Management reviews the loan portfolio for evidence of potential problem loans and leases. Potential problem loans and leases are loans and leases that are currently performing in accordance with contractual terms, but where known information about possible credit problems of the related borrowers causes management to have doubt as to the ability of such borrowers to comply with the present loan payment terms and may result in such loans and leases becoming nonperforming at some time in the future. Management considers loans and leases classified as Substandard, which continue to accrue interest, to be potential problem loans and leases. The Company, through its credit administration function, identified 29 commercial relationships from the originated portfolio and 23 commercial relationships from the acquired portfolio totaling $12.2 million and $3.1 million, respectively at December 31, 2015 that were potential problem loans. At December 31, 2014 there were 34 relationships totaling $14.8 million in the originated portfolio and 21 relationships totaling $8.8 million in the acquired portfolio that were considered potential problem loans.
Of the 29 commercial relationships from the originated portfolio, there were 2 relationships that equaled or exceeded $1.0 million, which in aggregate totaled $4.0 million. Of the 23 commercial relationships from the acquired loan portfolio, there were no relationships that equaled or exceeded $1.0 million. The Company has seen improvement in the volume of potential problem loans over the past few years after seeing the volume increase in 2009 and 2010 as a result of weak economic conditions. The decrease in the dollar volume of potential problem loans since year-end 2014 was mainly due to the upgrade of several large commercial credits to a risk grading better than Substandard. The potential problem loans remain in a performing status due to a variety of factors, including payment history, the value of collateral supporting the credits, and personal or government guarantees. These factors, when considered in the aggregate, give management reason to believe that the current risk exposure on these loans does not warrant accounting for these loans as nonperforming. However, these loans do exhibit certain risk factors, which have the potential to cause them to become nonperforming. Accordingly, management’s attention is focused on these credits, which are reviewed on at least a quarterly basis.
While there has been general improvement in economic conditions, concerns continue to exist about the strength and sustainability of such improvements; the troubled state of financial and credit markets, including the impact international economic conditions could have on the U.S. economy; Federal Reserve positioning of monetary policy; low levels of workforce participation; and continued stagnant population growth in many of the Company’s primary market areas.
43
The Allowance for Loan and Lease Losses
Originated loans and leases
The methodology for determining the allowance is considered by management to be a critical accounting policy due to the high degree of judgment involved, the subjectivity of the assumptions utilized and the potential for changes in the economic environment that could result in changes to the amount of the allowance. Management’s determination of the adequacy of the allowance is based on periodic evaluations of the loan portfolio and of current economic conditions.
Tompkins' model has been designed with certain key concepts in mind, including:
| 1. | An acknowledgement that arriving at an appropriate allowance requires a high degree of management judgment and results in a range of estimated losses. | |
| 2. | The allowance should be maintained at a level appropriate to cover estimated losses on loans individually evaluated for impairment, as well as estimated credit losses inherent in the remainder of the portfolio. | |
| 3. | Estimates of credit losses should consider all significant factors that affect the collectability of the portfolio as of the evaluation date. | |
| 4. | Loss emergence period is a critical assumption in the allowance estimate, which represents the average amount of time between when loss events occur for specific loan types and when such problem loans are identified and the related loss amounts are confirmed through charge-offs | |
| 5. | The allowance should be based on a comprehensive, well-documented, and consistently applied analysis of the loan portfolio. |
The model is comprised of four major components that management has deemed appropriate in evaluating the appropriateness of the allowance for loan and lease losses. While none of these components, when used independently, is effective in arriving at a reserve level that appropriately measures the risk inherent in the portfolio, management believes that using them collectively, provides reasonable measurement of the loss exposure in the portfolio. The components include:
| 1. | Impaired Loans - Management considers a loan to be impaired if, based on current information, it is probable that the Company will be unable to collect all scheduled payments of principal or interest when due, according to the contractual terms of the loan agreement. When a loan is considered to be impaired, the amount of the impairment is measured based on the present value of expected future cash flows discounted at the effective interest rate of the loan or, as a practical expedient, at the observable market price or the fair value of collateral (less costs to sell) if the loan is collateral dependent. Management excludes large groups of smaller balance homogeneous loans such as residential mortgages, consumer loans, and leases, which are collectively evaluated. |
| 2. | Individually Reviewed Credits – For loans that are not impaired, but are rated special mention or worse, management evaluates credits based on elevated risk characteristics and assigns reserves based upon analysis of historical loss experience of loans with similar risk characteristics. |
| 3. | Historical Loss Experience - For loans that are not impaired, or reviewed individually, management assigns a reserve based upon historical loss experience over a designated look-back period. Management has evaluated a variety of look-back periods and has determined that a seven year look back period is appropriate to capture a full range of economic cycles. |
44
| 4. | Qualitative/Subjective Analysis – The model also includes an analysis of a variety of subjective factors to support the reserve estimate. These subjective factors may include reserve allocations for risks that may not otherwise be fully recognized in other components of the model. Among the subjective factors that are routinely considered as part of this analysis are: growth trends in the portfolio, changes in management and/or polices related to lending activities, trends in classified or past due/nonaccrual loans, concentrations of credit, local and national economic trends, and industry trends. |
Periodically, management conducts an analysis to estimate the loss emergence period for various loan categories based on samples of historical charge-offs. Model output by loan category is reviewed to evaluate the reasonableness of the reserve levels in comparison to the estimated loss emergence period applied to historical loss experience.
In addition to the components discussed above, management reviews the model output for reasonableness by analyzing the results in comparisons to recent trends in the loan/lease portfolio, through back-testing of results from prior models in comparison to actual loss history, and by comparing our reserves and loss history to industry peer results.
The model results are reviewed by management at the Corporate Credit Policy Committee and at the Audit Committee of the Board of Directors. Additionally, on an annual basis, management conducts a validation process of the model. This validation includes reviewing the appropriateness of model calculations, back testing of model results and appropriateness of key assumptions used in the model.
Although we believe our process for determining the allowance adequately considers all of the factors that would likely result in credit losses, this evaluation is inherently subjective as it requires material estimates, including expected default probabilities, loss emergence periods, the amounts and timing of expected future cash flows on impaired loans, and estimated losses based on historical loss experience and current economic conditions. All of these factors may be susceptible to significant change. To the extent that actual results differ from management estimates, additional loan loss provisions may be required that would adversely impact earnings for future periods. Based on its evaluation of the allowance as of December 31, 2015, management considers the allowance to be appropriate. Under adversely or positively different conditions or assumptions, the Company would need to increase or decrease the allowance.
Acquired Loans and Leases
As part of our determination of the fair value of our acquired loans at the time of acquisition, the Company established a credit mark to provide for future losses in our acquired loan portfolio. There was no allowance for loan losses carried over from the acquired company. To the extent that credit quality deteriorates subsequent to acquisition, such deterioration would result in the establishment of an allowance for the acquired loan portfolio.
Acquired loans accounted for under ASC 310-30
Acquired loans were accounted for under ASC 310-30, and our allowance for loan losses is estimated based upon our expected cash flows for these loans. To the extent that we experience a deterioration in borrower credit quality resulting in a decrease in our expected cash flows subsequent to the acquisition of the loans, an allowance for loan losses would be established based on our estimate of future credit losses over the remaining life of the loans.
Acquired loans accounted for under ASC 310-20
We establish our allowance for loan losses through a provision for credit losses based upon an evaluation process that is similar to our evaluation process used for originated loans. This evaluation, which includes a review of loans on which full collectability may not be reasonably assured, considers, among other matters, the estimated fair value of the underlying collateral, economic conditions, historical net loan loss experience, carrying value of the loans, which includes the remaining net purchase discount or premium, and other factors that warrant recognition in determining our allowance for loan losses.
The allocation of the Company’s allowance as of December 31, 2015, and each of the previous four years is illustrated in Table 5- Allocation of the Allowance for Loan and Lease Losses, below.
45
Table 5 - Allocation of the Allowance for Originated and Acquired Loan and Lease Losses
| As of December 31, | ||||||||||||||||||||
| (in thousands) | 2015 | 2014 | 2013 | 2012 | 2011 | |||||||||||||||
| Originated loans outstanding at end of year | $ | 3,310,768 | $ | 2,839,974 | $ | 2,527,244 | $ | 2,133,106 | $ | 1,981,849 | ||||||||||
| Allocation of the originated allowance by originated loan type: | ||||||||||||||||||||
| Commercial and industrial | $ | 10,495 | $ | 9,157 | $ | 8,406 | $ | 7,533 | $ | 8,936 | ||||||||||
| Commercial real estate | 15,479 | 12,069 | 10,459 | 10,184 | 12,662 | |||||||||||||||
| Residential real estate | 4,070 | 5,030 | 5,771 | 4,981 | 4,247 | |||||||||||||||
| Consumer and other | 1,268 | 1,900 | 2,059 | 1,940 | 1,709 | |||||||||||||||
| Leases | 0 | 0 | 5 | 5 | 39 | |||||||||||||||
| Total | $ | 31,312 | $ | 28,156 | $ | 26,700 | $ | 24,643 | $ | 27,593 | ||||||||||
| Allocation of the originated allowance as a percentage of total originated allowance: | ||||||||||||||||||||
| Commercial and industrial | 34 | % | 32 | % | 31 | % | 31 | % | 32 | % | ||||||||||
| Commercial real estate | 49 | % | 43 | % | 39 | % | 41 | % | 46 | % | ||||||||||
| Residential real estate | 13 | % | 18 | % | 22 | % | 20 | % | 16 | % | ||||||||||
| Consumer and other | 4 | % | 7 | % | 8 | % | 8 | % | 6 | % | ||||||||||
| Total | 100 | % | 100 | % | 100 | % | 100 | % | 100 | % | ||||||||||
| Loan and lease types as a percentage of total originated loans and leases: | ||||||||||||||||||||
| Commercial and industrial | 26 | % | 27 | % | 25 | % | 24 | % | 24 | % | ||||||||||
| Commercial real estate | 41 | % | 39 | % | 40 | % | 39 | % | 39 | % | ||||||||||
| Residential real estate | 31 | % | 32 | % | 33 | % | 33 | % | 33 | % | ||||||||||
| Consumer and other | 2 | % | 2 | % | 2 | % | 4 | % | 3 | % | ||||||||||
| Leases | 0 | % | 0 | % | 0 | % | 0 | % | 1 | % | ||||||||||
| Total | 100 | % | 100 | % | 100 | % | 100 | % | 100 | % | ||||||||||
|
As of December 31, |
||||||||||||||||||||
| (in thousands) | 2015 | 2014 | 2013 | 2012 | 2011 | |||||||||||||||
| Acquired loans outstanding at end of year | $ | 461,274 | $ | 553,314 | $ | 667,040 | $ | 821,504 | $ | 0 | ||||||||||
|
Allocation of the acquired allowance by acquired loan type: |
||||||||||||||||||||
| Commercial and industrial | $ | 433 | $ | 431 | $ | 168 | $ | 0 | $ | 0 | ||||||||||
| Commercial real estate | 61 | 337 | 770 | 0 | 0 | |||||||||||||||
| Residential real estate | 198 | 51 | 274 | 0 | 0 | |||||||||||||||
| Consumer and other | 0 | 22 | 58 | 0 | 0 | |||||||||||||||
| Total | $ | 692 | $ | 841 | $ | 1,270 | $ | 0 | $ | 0 | ||||||||||
| Allocation of the acquired allowance as a percentage of total acquired allowance: | ||||||||||||||||||||
| Commercial and industrial | 62 | % | 51 | % | 13 | % | 0 | % | 0 | % | ||||||||||
| Commercial real estate | 9 | % | 40 | % | 61 | % | 0 | % | 0 | % | ||||||||||
| Residential real estate | 29 | % | 6 | % | 22 | % | 0 | % | 0 | % | ||||||||||
| Consumer and other | 0 | % | 3 | % | 5 | % | 0 | % | 0 | % | ||||||||||
| Total | 100 | % | 100 | % | 100 | % | 0 | % | 0 | % | ||||||||||
| Loan and lease types as a percentage of total acquired loans and leases: | ||||||||||||||||||||
| Commercial and industrial | 18 | % | 18 | % | 19 | % | 20 | % | 0 | % | ||||||||||
| Commercial real estate | 63 | % | 63 | % | 61 | % | 60 | % | 0 | % | ||||||||||
| Residential real estate | 15 | % | 16 | % | 15 | % | 15 | % | 0 | % | ||||||||||
| Consumer and other | 0 | % | 0 | % | 1 | % | 1 | % | 0 | % | ||||||||||
| Covered | 3 | % | 3 | % | 4 | % | 4 | % | 0 | % | ||||||||||
| Total | 100 | % | 100 | % | 100 | % | 100 | % | 0 | % | ||||||||||
The above tables provide, as of the dates indicated, an allocation of the allowance for probable and inherent loan losses by loan type. The allocation is neither indicative of the specific amounts or the loan categories in which future charge-offs may occur, nor is it an indicator of future loss trends. The allocation of the allowance to each category does not restrict the use of the allowance to absorb losses in any category.
| 46 |
The five year trend in the allowance is shown above. The growth in the total allowance balance in 2015 over 2014 and in 2014 over 2013 was mainly driven by growth in total loans, which were up 11.2% and 6.2%, respectively. The increased allocations related to loan growth were partially offset by improving asset quality measures, including lower levels of net loan losses, nonperforming loans, and balances of loans internally classified Special Mention or Substandard over the past few years. As of December 31, 2015, the total allowance for loan and lease losses was $32.0 million, which was up $3.0 million or 10.4% from year-end 2014. The year-end allowance for originated loans and leases was up $3.2 million compared to prior year, and the allowance for acquired loans was down $149,000 over year-end 2014.
The $3.2 million or 11.2% increase in the allowance for originated loans in 2015 over 2014 was mainly due to the 16.6% growth in the originated portfolio. The increase in the reserve allocations for commercial and industrial and commercial real estate loans was mainly due to the growth rates of 11.6% and 22.2%, respectively, in these portfolios in 2015 over 2014. The higher loan balances impact the historical component of the Company’s allowance model, which applies a historical loss factor to each portfolio of pass rated credits. Partially offsetting the need for additional reserves resulting from loan growth was improvement in asset quality measures in the originated portfolio. The amount of originated loans internally-classified Special Mention, Substandard and Doubtful totaled $37.8 million at December 31, 2015 compared to $56.3 million at December 31, 2014 and $77.4 million at December 31, 2013. Net recoveries in the originated loan portfolio totaled $689,000 in 2015, $163,000 in 2014, and $1.1 million in 2013. Nonperforming loans and leases were down 3.4% from year-end 2014. The decrease in the allocation for residential real estate loans in 2015 compared to 2014 was a result of favorable adjustments to environmental factors reflecting improvements in past due residential loans, and a decrease in net charge-offs.
The decrease in the allowance for acquired loans and leases reflects improved asset quality in 2015. The amount of acquired loans internally-classified as Special Mention and Substandard at December 31, 2015 was down $9.8 million or 35.8% compared to December 31, 2014, reflecting charge-offs, successful workouts and related paydowns during 2015.
The level of future charge-offs is dependent upon a variety of factors such as national and local economic conditions, trends in various industries, underwriting characteristics, and conditions unique to each borrower. Given uncertainties surrounding these factors, it is difficult to estimate future losses.
Table 6 - Analysis of the Allowance for Originated and Acquired Loan and Lease Losses
|
December 31, |
||||||||||||||||||||
| (in thousands) | 2015 | 2014 | 2013 | 2012 | 2011 | |||||||||||||||
| Average originated loans outstanding during year | $ | 3,023,456 | $ | 2,624,282 | $ | 2,307,493 | $ | 2,301,901 | $ | 1,928,540 | ||||||||||
| Balance of allowance at beginning of year | 28,156 | 26,700 | 24,643 | 27,593 | 27,832 | |||||||||||||||
| Originated loans charged-off: | ||||||||||||||||||||
| Commercial and industrial | 221 | 470 | 1,605 | 5,328 | 2,403 | |||||||||||||||
| Commercial real estate | 363 | 639 | 651 | 3,977 | 4,488 | |||||||||||||||
| Residential real estate | 338 | 512 | 752 | 2,390 | 2,730 | |||||||||||||||
| Consumer and other | 1,074 | 1,308 | 1,282 | 826 | 608 | |||||||||||||||
| Leases | 0 | 0 | 0 | 0 | 3 | |||||||||||||||
| Total loans charged-off | $ | 1,996 | $ | 2,929 | $ | 4,290 | $ | 12,521 | $ | 10,232 | ||||||||||
| Recoveries of originated loans previously charged-off: | ||||||||||||||||||||
| Commercial and industrial | 809 | 636 | 4,162 | 198 | 424 | |||||||||||||||
| Commercial real estate | 1,277 | 1,832 | 718 | 200 | 280 | |||||||||||||||
| Residential real estate | 112 | 88 | 48 | 30 | 33 | |||||||||||||||
| Consumer and other | 487 | 536 | 419 | 306 | 311 | |||||||||||||||
| Total loans recovered | $ | 2,685 | $ | 3,092 | $ | 5,347 | $ | 734 | $ | 1,048 | ||||||||||
| Net loans (recovered) charged-off | (689 | ) | (163 | ) | (1,057 | ) | 11,787 | 9,184 | ||||||||||||
| Additions to allowance charged to operations | 2,467 | 1,293 | 1,000 | 8,837 | 8,945 | |||||||||||||||
| Balance of originated allowance at end of year | $ | 31,312 | $ | 28,156 | $ | 26,700 | $ | 24,643 | $ | 27,593 | ||||||||||
| Originated allowance as a percentage of originated loans and leases outstanding | 0.95 | % | 0.99 | % | 1.06 | % | 1.16 | % | 1.39 | % | ||||||||||
| Net (recoveries) charge-offs as a percentage of average originated loans and leases outstanding during the year | (0.02 | %) | (0.01 | %) | (0.05 | %) | 0.51 | % | 0.48 | % | ||||||||||
| 47 |
|
December 31, |
||||||||||||||||||||
| (in thousands) | 2015 | 2014 | 2013 | 2012 | 2011 | |||||||||||||||
| Average acquired loans outstanding during year | $ | 508,490 | $ | 614,740 | $ | 746,045 | $ | 80,208 | $ | 0 | ||||||||||
| Balance of allowance at beginning of year | 841 | 1,270 | 0 | 0 | 0 | |||||||||||||||
| Acquired loans charged-off: | ||||||||||||||||||||
| Commercial and industrial | 77 | 293 | 2,991 | 0 | 0 | |||||||||||||||
| Commercial real estate | 400 | 631 | 179 | 0 | 0 | |||||||||||||||
| Residential real estate | 302 | 484 | 696 | 0 | 0 | |||||||||||||||
| Consumer and other | 6 | 51 | 25 | 0 | 0 | |||||||||||||||
| Total loans charged-off | $ | 785 | $ | 1,459 | $ | 3,891 | $ | 0 | $ | 0 | ||||||||||
| Recoveries of acquired loans previously charged-off: | ||||||||||||||||||||
| Commercial and industrial | 7 | 0 | 0 | 0 | 0 | |||||||||||||||
| Commercial real estate | 142 | 0 | 0 | 0 | 0 | |||||||||||||||
| Residential real estate | 9 | 0 | 0 | 0 | 0 | |||||||||||||||
| Consumer and other | 0 | 17 | 0 | 0 | 0 | |||||||||||||||
| Total loans recovered | $ | 158 | $ | 17 | $ | 0 | $ | 0 | $ | 0 | ||||||||||
| Net loans charged-off | 627 | 1,442 | 3,891 | 0 | 0 | |||||||||||||||
| Additions to allowance charged to operations | 478 | 1,013 | 5,161 | 0 | 0 | |||||||||||||||
| Balance of acquired allowance at end of year | $ | 692 | $ | 841 | $ | 1,270 | $ | 0 | $ | 0 | ||||||||||
| Acquired allowance as a percentage of acquired loans outstanding | 0.14 | % | 0.14 | % | 0.17 | % | 0.00 | % | 0.00 | % | ||||||||||
| Net charge-offs as a percentage of average acquired loans and leases outstanding during the year | 0.12 | % | 0.23 | % | 0.52 | % | 0.00 | % | 0.00 | % | ||||||||||
| Total net charge-offs as a percentage of average total loans and leases outstanding during the year | 0.00 | % | 0.04 | % | 0.09 | % | 0.49 | % | 0.48 | % | ||||||||||
The provision for loan and lease losses represents management’s estimate of the expense necessary to maintain the allowance for loan and lease losses at an appropriate level. The provision for loan and lease losses was $2.9 million in 2015, compared to $2.3 million in 2014. The provision for originated loans and leases was $2.5 million in 2015, up from $1.3 million in 2014. The increase in the provision expense for originated loans was driven by the growth in the originated portfolio in 2015 over 2014, partly offset by improvements in asset quality measures. The provision expense for originated loans in 2015 and 2014 benefitted from significant recoveries on two commercial/commercial real estate relationships that resulted in overall net recoveries on originated loans of $689,000 in 2015 and $163,000 in 2014. The provision for acquired loans was $478,000 in 2015, down from $1.0 million in 2014. Net charge-offs in the acquired portfolio were $627,000 in 2015, down from $1.4 million in 2014.
For 2015, total net recoveries were $62,000 or 0.002% of average total loans and leases compared to net charge-offs of $1.3 million or 0.04% of average total loans and leases for 2014. The most recent peer ratio as of December 31, 2015 was 0.09%.
The ratio of the allowance for originated loan and lease losses as a percentage of total loans was 0.95% at year-end 2015 compared to 0.99% at year-end 2014, which is reflective of the improvement in the level of loans internally classified Special Mention, Substandard and Doubtful and nonperforming loans and leases. Management believes that, based upon its evaluation as of December 31, 2015, the allowance is appropriate.
Deposits and Other Liabilities
Total deposits were $4.4 billion at December 31, 2015, an increase of $226.2 million or 5.4% compared to year-end 2014. The increase from year-end 2014 consisted of interest checking, savings and money market balances (up $153.8 million), and noninterest bearing deposits (up $115.3 million), which were partially offset by time deposits (down $42.9 million).
| 48 |
The most significant source of funding for the Company is core deposits. The Company defines core deposits as total deposits less time deposits of $250,000 or more, brokered deposits and municipal money market deposits. Core deposits grew by $139.1 million or 4.1% to $3.5 billion at year-end 2015 from $3.4 billion at year-end 2014. Core deposits represented 80.1% of total deposits at December 31, 2015, compared to 81.1% of total deposits at December 31, 2014.
Municipal money market accounts totaled $566.0 million at year-end 2015, which was an increase of 16.9% over year-end 2014. In general, there is a seasonal pattern to municipal deposits starting with a low point during July and August. Account balances tend to increase throughout the fall and into the winter months from tax deposits and receive an additional inflow at the end of March from the electronic deposit of state funds.
Table 1-Average Statements of Condition and Net Interest Analysis, above, shows the average balance and average rate paid on the Company’s primary deposit categories for the years ended December 31, 2015, 2014, and 2013. Average interest-bearing deposits were up 2.1% in 2015 over 2014. The average cost of interest-bearing deposits was 0.32% for 2015 and 0.35% for 2014. Average noninterest bearing deposits at December 31, 2015 were up $125.9 million or 13.9% over year-end 2014. A maturity schedule of time deposits outstanding at December 31, 2015, is included in “Note 8 Deposits” in Notes to Consolidated Financial Statements in Part II, Item 8. of this Report.
The Company uses both retail and wholesale repurchase agreements. Retail repurchase agreements are arrangements with local customers of the Company, in which the Company agrees to sell securities to the customer with an agreement to repurchase those securities at a specified later date. Retail repurchase agreements totaled $66.3 million at December 31, 2015, and $60.7 million at December 31, 2014. Management generally views local repurchase agreements as an alternative to large time deposits. The Company’s wholesale repurchase agreements amounted to $70.2 million at December 31, 2015, and $86.3 million at December 31, 2014. At December 31, 2015, the wholesale repurchase agreements included $55.0 million with the FHLB and $15.2 million with a large financial institution. Refer to “Note 9 Federal Funds Purchased and Securities Sold Under Agreements to Repurchase” in Notes to Consolidated Financial Statements in Part II, Item 8. of this Report for further details on the Company’s repurchase agreements.
The Company’s other borrowings totaled $536.3 million at year-end 2015, up $179.7 million or 50.4% from $356.5 million at year-end 2014. The $536.3 million in borrowings at December 31, 2015, included $272.2 million in overnight advances from the FHLB, $250.0 million in term advances from the FHLB and a $13.5 million advance from a bank. Borrowings at year-end 2014 included $232.1 million in overnight advances from the FHLB, $111.0 million of FHLB term advances, and a $13.5 million advance from a bank. Of the $250.0 million of the FHLB term advances at year-end 2015, $80.0 million are due over one year. In 2007, the Company elected to account for a $10.0 million advance with the FHLB at fair value. The fair value of this advance decreased by $385,000 (pre-tax net mark-to-market gain of $385,000) over the 12-months ended December 31, 2015. Refer to “Note 10 Other Borrowings” in Notes to Consolidated Financial Statements in Part II, Item 8. of this Report for further details on the Company’s term borrowings with the FHLB.
LIQUIDITY MANAGEMENT
The objective of liquidity management is to ensure the availability of adequate funding sources to satisfy the demand for credit, deposit withdrawals, operating expenses, and business investment opportunities. The Company’s large, stable core deposit base and strong capital position are the foundation for the Company’s liquidity position. The Company uses a variety of resources to meet its liquidity needs, which include deposits, cash and cash equivalents, short-term investments, cash flow from lending and investing activities, repurchase agreements, and borrowings. The Company may also use borrowings as part of a growth strategy. Asset and liability positions are monitored primarily through the Asset/Liability Management Committee of the Company’s subsidiary banks. This Committee reviews periodic reports on the liquidity and interest rate sensitivity positions. Comparisons with industry and peer groups are also monitored. The Company’s strong reputation in the communities it serves, along with its strong financial condition, provides access to numerous sources of liquidity as described below. Management believes these diverse liquidity sources provide sufficient means to meet all demands on the Company’s liquidity that are reasonably likely to occur.
Core deposits, discussed above under “Deposits and Other Liabilities”, are a primary and low cost funding source obtained primarily through the Company’s branch network. In addition to core deposits, the Company uses non-core funding sources to support asset growth. These non-core funding sources include time deposits of $250,000 or more, brokered time deposits, national deposit listing services, municipal money market accounts, bank borrowings, securities sold under agreements to repurchase, overnight borrowings and term advances from the FHLB and other funding sources. Rates and terms are the primary determinants of the mix of these funding sources.
Non-core funding sources totaled $1.5 billion at December 31, 2015, an increase of $256.3 million or 19.8% from $1.2 billion at December 31, 2014. Non-core funding sources increased year-over-year as the Company used growth in core deposits, brokered deposits, and time deposits of $250,000 or more to fund earning asset growth. Non-core funding sources as a percentage of total liabilities increased from 27.0% at year-end 2014 to 29.9% at year-end 2015.
| 49 |
Non-core funding sources may require securities to be pledged against the underlying liability. Securities carried at $1.2 billion and $1.1 billion at December 31, 2015 and 2014, respectively, were either pledged or sold under agreements to repurchase. Pledged securities or securities sold under agreements to repurchase represented 81.2% of total securities at December 31, 2015, compared to 72.3% of total securities at December 31, 2014.
Cash and cash equivalents totaled $58.3 million as of December 31, 2015, up from $56.1 million at December 31, 2014. Short-term investments, consisting of securities due in one year or less, decreased from $79.8 million at December 31, 2014, to $64.0 million on December 31, 2015. The Company also had $7.4 million of securities designated as trading securities at December 31, 2015.
Cash flow from the loan and investment portfolios provides a significant source of liquidity. These assets may have stated maturities in excess of one year, but have monthly principal reductions. Total mortgage-backed securities, at fair value, were $745.0 million at December 31, 2015 compared with $769.3 million at December 31, 2014. Outstanding principal balances of residential mortgage loans, consumer loans, and leases totaled approximately $1.2 billion at December 31, 2015 as compared to $1.1 million at December 31, 2014. Aggregate amortization from monthly payments on these assets provides significant additional cash flow to the Company.
Liquidity is enhanced by ready access to national and regional wholesale funding sources including Federal funds purchased, repurchase agreements, brokered certificates of deposit, and FHLB advances. Through its subsidiary banks, the Company has borrowing relationships with the FHLB and correspondent banks, which provide secured and unsecured borrowing capacity. At December 31, 2015, the unused borrowing capacity on established lines with the FHLB was $1.1 billion.
As members of the FHLB, the Company’s subsidiary banks can use certain unencumbered mortgage-related assets and securities to secure additional borrowings from the FHLB. At December 31, 2015, total unencumbered mortgage loans and securities of the Company were $521.5 million. Additional assets may also qualify as collateral for FHLB advances upon approval of the FHLB.
The Company has not identified any trends or circumstances that are reasonably likely to result in material increases or decreases in liquidity in the near term.
| Table 7 - Loan Maturity | ||||||||||||||||
| Remaining maturity of originated loans | At December 31, 2015 | |||||||||||||||
| Within | ||||||||||||||||
| (in thousands) | Total | 1 year | 1-5 years | After 5 years | ||||||||||||
| Commercial and industrial | $ | 856,323 | $ | 217,523 | $ | 323,384 | $ | 315,416 | ||||||||
| Commercial real estate | 1,357,222 | 37,130 | 108,011 | 1,212,081 | ||||||||||||
| Residential real estate | 1,026,419 | 606 | 10,365 | 1,015,448 | ||||||||||||
| Total | $ | 3,239,964 | $ | 255,259 | $ | 441,760 | $ | 2,542,945 | ||||||||
| Remaining maturity of acquired loans |
At December 31, 2015 |
|||||||||||||||
| Within | ||||||||||||||||
| (in thousands) | Total | 1 year | 1-5 years | After 5 years | ||||||||||||
| Commercial and industrial | $ | 84,810 | $ | 29,555 | $ | 14,744 | $ | 40,511 | ||||||||
| Commercial real estate | 291,939 | 12,595 | 157,844 | 121,500 | ||||||||||||
| Residential real estate | 69,583 | 19,107 | 3,395 | 47,081 | ||||||||||||
| Covered Loans | 14,031 | 4,911 | 2,742 | 6,378 | ||||||||||||
| Total | $ | 460,363 | $ | 66,168 | $ | 178,725 | $ | 215,470 | ||||||||
Of the loan amounts shown above in Table 7 - Loan Maturity, maturing over 1 year, $1.5 billion have fixed rates and $1.9 billion have adjustable rates.
| 50 |
OFF-BALANCE SHEET ARRANGEMENTS
In the normal course of business the Company is party to certain financial instruments, which in accordance with accounting principles generally accepted in the United States, are not included in its Consolidated Statements of Condition. These transactions include commitments under standby letters of credit, unused portions of lines of credit, and commitments to fund new loans and are undertaken to accommodate the financing needs of the Company’s customers. Loan commitments are agreements by the Company to lend monies at a future date. These loan and letter of credit commitments are subject to the same credit policies and reviews as the Company’s loans. Because most of these loan commitments expire within one year from the date of issue, the total amount of these loan commitments as of December 31, 2015, are not necessarily indicative of future cash requirements. Further information on these commitments and contingent liabilities is provided in “Note 17 Commitments and Contingent Liabilities” in Notes to Consolidated Financial Statements in Part II, Item 8. of this Report.
CONTRACTUAL OBLIGATIONS
The Company leases land, buildings, and equipment under operating lease arrangements extending to the year 2090. Most leases include options to renew for periods ranging from 5 to 20 years. In addition, the Company has a software contract for its core banking application through July 31, 2017, along with contracts for more specialized software programs through 2018. Further information on the Company’s lease arrangements is provided in “Note 7 Premises and Equipment” in Notes to Consolidated Financial Statements in Part II, Item 8. of this Report. The Company’s contractual obligations as of December 31, 2015, are shown in Table 8-Contractual Obligations and Commitments below.
| Table 8 - Contractual Obligations and Commitments | ||||||||||||||||||||
| Contractual cash obligations | At December 31, 2015 Payments due within |
|||||||||||||||||||
| (in thousands) | Total | 1 year | 1-3 years | 3-5 years | After 5 years | |||||||||||||||
| Long-term debt | $ | 341,117 | $ | 235,763 | $ | 95,224 | $ | 10,130 | $ | 0 | ||||||||||
| Trust Preferred Debentures1 | 87,122 | 2,196 | 4,392 | 4,392 | 76,142 | |||||||||||||||
| Operating leases | 37,663 | 4,661 | 7,590 | 6,447 | 18,965 | |||||||||||||||
| Software contracts | 4,351 | 2,464 | 1,851 | 36 | 0 | |||||||||||||||
| Total contractual cash obligations | $ | 470,253 | $ | 245,084 | $ | 109,057 | $ | 21,005 | $ | 95,107 | ||||||||||
| 1 Includes interest payments and assumes contractual payments made until maturity without conversion to stock or early redemption. | ||||||||||||||||||||
RECENTLY ISSUED ACCOUNTING STANDARDS
Refer to “Note 1 Summary of Significant Accounting Policies” in Notes to Consolidated Financial Statements in Part II, Item 8. of this Form 10-K for details of recently issued accounting pronouncements and their expected impact on the Company’s financial statements.
Fourth Quarter Summary
Fourth quarter 2015 net income was $13.9 million, an increase of 9.2% compared to the fourth quarter of 2014 net income of $12.7 million. Diluted earnings per share of $0.92 for the fourth quarter of 2015 were up 8.2% from $0.85 for the comparable period in 2014.
Net interest income on a taxable-equivalent basis totaled $44.5 million in the fourth quarter of 2015, up 4.1% from $42.7 million in the year-earlier quarter. Growth in average earning assets of $462.0 million was partially offset by an 18 basis point narrowing of the net interest margin to 3.35% in the fourth quarter of 2015 from 3.53% in 2014’s fourth quarter. The rise in average earning assets was attributable to a $387.3 million increase in average loans and leases and a $65.6 million increase in average investment securities balances. The yield on average interest earning assets of 3.74% for the fourth quarter of 2015 was down 20 basis points or 5.1% compared to the fourth quarter of 2014, and was partially offset by a lower cost of funds in 2015. Average noninterest bearing deposits balances for the fourth quarter of 2015 were up $132.7 million or 13.6% compared to the fourth quarter of 2014, and $54.7 million or 5.2% compared to the third quarter of 2015. The average cost of interest bearing liabilities in the fourth quarter of 2015 was 0.52% compared to 0.53% in the third quarter of 2015 and 0.54% in the fourth quarter of 2014.
51
Provision for loan and lease losses was $1.5 million for the fourth quarter of 2015, compared to $1.6 million in the fourth quarter of 2014. Net charge-offs totaled $494,000 in the fourth quarter of 2015, compared to net charge-offs of $344,000 for the fourth quarter of 2014.
Noninterest income was $17.9 million for the fourth quarter of 2015, which was in line with the same period in 2014, and up 2.8% from the third quarter of 2015. Fee based income was up 2.5% in the fourth quarter of 2015 compared to the same period in 2014. Insurance revenue was up 4.2% and deposit fees were up 5.0% compared to the fourth quarter of 2014, while investment service revenue was down 1.2% compared to the same period in 2014. Gains on sales of available-for-sale securities were $3,000 for the fourth quarter of 2015 compared to gains of $241,000 reported for the same period in 2014.
Noninterest expense was $39.4 million in the fourth quarter of 2015, which was in line with the same period in 2014, and up 3.9% compared to the third quarter of 2015.
| Item 7A. | Quantitative and Qualitative Disclosures About Market Risk |
MARKET RISK
Interest rate risk is the primary market risk category associated with the Company’s operations. Interest rate risk refers to the volatility of earnings caused by changes in interest rates. The Company manages interest rate risk using income simulation to measure interest rate risk inherent in its on-balance sheet and off-balance sheet financial instruments at a given point in time by showing the potential effect of interest rate shifts on net interest income for future periods. Each quarter the Company’s Asset/Liability Management Committee reviews the simulation results to determine whether the exposure of net interest income to changes in interest rates remains within Board-approved levels. The Committee also discusses strategies to manage this exposure and incorporates these strategies into the investment and funding decisions of the Company. The Company does not currently use derivatives, such as interest rate swaps, to manage its interest rate risk exposure, but may consider such instruments in the future.
The Company’s Board of Directors has set a policy that interest rate risk exposure will remain within a range whereby net interest income will not decline by more than 10% in one year as a result of a 100 basis point parallel change in rates. Based upon the simulation analysis performed as of November 30, 2015, a 200 basis point parallel upward change in interest rates over a one-year time frame would result in a one-year decrease in net interest income of approximately 1.9% from the base case, while a 100 basis point parallel decline in interest rates over a one-year period would result in a one-year decrease in net interest income of approximately 1.1% from the base case. The simulation assumes no balance sheet growth and no management action to address balance sheet mismatches.
The decrease in net interest income in the rising rate scenario is a result of the balance sheet showing a more liability sensitive position. Rate sensitive assets which reprice or are replaced into higher rates outpace rising non-maturity deposit costs, resulting in an expansion of balance sheet spread and a decreasing trend in net interest income. The slight exposure in the 100 basis point decline scenario results from the Company’s assets repricing downward to a greater degree than the rates on the Company’s interest-bearing liabilities, mainly deposits. Rates on savings and money market accounts are at low levels given the historically low interest rate environment experienced in recent years. In addition, the model assumes that prepayments accelerate in the down interest rate environment resulting in additional pressure on asset yields as proceeds are reinvested at lower rates.
In our most recent simulation, the base case scenario, which assumes interest rates remain unchanged from the date of the simulation, reflects a net interest margin that remains relatively stable over the next 12 to 18 months.
Although the simulation model is useful in identifying potential exposure to interest rate movements, actual results may differ from those modeled as the repricing, maturity, and prepayment characteristics of financial instruments may change to a different degree than modeled. In addition, the model does not reflect actions that management may employ to manage its interest rate risk exposure. The Company’s current liquidity profile, capital position, and growth prospects, offer a level of flexibility for management to take actions that could offset some of the negative effects of unfavorable movements in interest rates. Management believes the current exposure to changes in interest rates is not significant in relation to the earnings and capital strength of the Company.
In addition to the simulation analysis, management uses an interest rate gap measure. Table 9-Interest Rate Risk Analysis below is a Condensed Static Gap Report, which illustrates the anticipated repricing intervals of assets and liabilities as of December 31, 2015. The Company’s one-year interest rate gap was a negative $423.8 million or 7.45% of total assets at December 31, 2015, compared with a negative $225.8 million or 4.28% of total assets at December 31, 2014. A negative gap position exists when the amount of interest-bearing liabilities maturing or repricing exceeds the amount of interest-earning assets maturing or repricing within a particular time period. This analysis suggests that the Company’s net interest income is more vulnerable to an increasing rate environment than it is to a prolonged declining interest rate environment. An interest rate gap measure could be significantly affected by external factors such as a rise or decline in interest rates, loan or securities prepayments, and deposit withdrawals.
52
| Table 9 - Interest Rate Risk Analysis | ||||||||||||||||||||
| Condensed Static Gap - December 31, 2015 | Repricing Interval | |||||||||||||||||||
| (in thousands) | Total | 0-3 months | 3-6 months | 6-12 months | 12 months | |||||||||||||||
| Interest-earning assets* | $ | 5,347,702 | $ | 1,066,424 | $ | 251,181 | $ | 424,521 | $ | 1,742,126 | ||||||||||
| Interest-bearing liabilities | 3,966,960 | 1,664,886 | 201,769 | 299,288 | 2,165,943 | |||||||||||||||
| Net gap position | (598,462 | ) | 49,412 | 125,233 | (423,817 | ) | ||||||||||||||
| Net gap position as a percentage of total assets | (10.52 | )% | 0.87 | % | 2.20 | % | (7.45 | )% | ||||||||||||
| *Balances of available-for-sale securities are shown at amortized cost. | ||||||||||||||||||||
53
[This Page Intentionally Left Blank]
54
| Item 8. | Financial Statements and Supplementary Data |
Financial Statements and Supplementary Data consist of the consolidated financial statements as indexed and presented below and the Unaudited Quarterly Financial Data presented in Part II, Item 8. of this Report.
55
Management’s Statement of Responsibility
Management is responsible for preparation of the consolidated financial statements and related financial information contained in all sections of this annual report, including the determination of amounts that must necessarily be based on judgments and estimates. It is the belief of management that the consolidated financial statements have been prepared in conformity with accounting principles generally accepted in the United States of America.
Management establishes and monitors the Company’s system of internal accounting controls to meet its responsibility for reliable financial statements. The system is designed to provide reasonable assurance that assets are safeguarded, and that transactions are executed in accordance with management’s authorization and are properly recorded.
The Audit/Examining Committee of the board of directors, composed solely of outside directors, meets periodically and privately with management, internal auditors, and independent registered public accounting firm, KPMG LLP, to review matters relating to the quality of financial reporting, internal accounting control, and the nature, extent, and results of audit efforts. The independent registered public accounting firm and internal auditors have unlimited access to the Audit/Examining Committee to discuss all such matters. The consolidated financial statements have been audited by KPMG, LLP for the purpose of expressing an opinion on the consolidated financial statements. In addition, KPMG, LLP has audited internal control over financial reporting, as of December 31, 2015.
| /s/ Stephen S. Romaine |
/s/ Francis M. Fetsko |
Date: March 15, 2016 | ||
| Stephen S. Romaine | Francis M. Fetsko | |||
| Chief Executive Officer | Chief Financial Officer | |||
| Chief Operating Officer |
56
Report of Independent Registered Public Accounting Firm
The Board of Directors and Shareholders
Tompkins Financial Corporation:
We have audited the accompanying consolidated statements of condition of Tompkins Financial Corporation and subsidiaries (the Company) as of December 31, 2015 and 2014, and the related consolidated statements of income, comprehensive income, cash flows, and changes in shareholders’ equity for each of the years in the three-year period ended December 31, 2015. These consolidated financial statements are the responsibility of the Company’s management. Our responsibility is to express an opinion on these consolidated financial statements based on our audits.
We conducted our audits in accordance with the standards of the Public Company Accounting Oversight Board (United States). Those standards require that we plan and perform the audit to obtain reasonable assurance about whether the financial statements are free of material misstatement. An audit includes examining, on a test basis, evidence supporting the amounts and disclosures in the financial statements. An audit also includes assessing the accounting principles used and significant estimates made by management, as well as evaluating the overall financial statement presentation. We believe that our audits provide a reasonable basis for our opinion.
In our opinion, the consolidated financial statements referred to above present fairly, in all material respects, the financial position of Tompkins Financial Corporation and subsidiaries as of December 31, 2015 and 2014, and the results of their operations and their cash flows for each of the years in the three-year period ended December 31, 2015, in conformity with U.S. generally accepted accounting principles.
We also have audited, in accordance with the standards of the Public Company Accounting Oversight Board (United States), Tompkins Financial Corporation and subsidiaries’ internal control over financial reporting as of December 31, 2015, based on criteria established in Internal Control – Integrated Framework (2013) issued by the Committee of Sponsoring Organizations of the Treadway Commission (COSO), and our report dated March 15, 2016 expressed an unqualified opinion on the effectiveness of the Company’s internal control over financial reporting.
| /s/ KPMG LLP | |
| Rochester, New York | |
| March 15, 2016 |
57
Report of Independent Registered Public Accounting Firm
The Board of Directors and Shareholders
Tompkins Financial Corporation:
We have audited Tompkins Financial Corporation and subsidiaries’ (the Company) internal control over financial reporting as of December 31, 2015, based on criteria established in Internal Control-Integrated Framework (2013) issued by the Committee of Sponsoring Organizations of the Treadway Commission (COSO). The Company’s management is responsible for maintaining effective internal control over financial reporting, and for its assessment of the effectiveness of internal control over financial reporting included in the accompanying Management’s Annual Report on Internal Control over Financial Reporting. Our responsibility is to express an opinion on the Company’s internal control over financial reporting based on our audit.
We conducted our audit in accordance with the standards of the Public Company Accounting Oversight Board (United States). Those standards require that we plan and perform the audit to obtain reasonable assurance about whether effective internal control over financial reporting was maintained in all material respects. Our audit included obtaining an understanding of internal control over financial reporting, assessing the risk that a material weakness exists, and testing and evaluating the design and operating effectiveness of internal control based on the assessed risk. Our audit also included performing such other procedures as we considered necessary in the circumstances. We believe that our audit provides a reasonable basis for our opinion.
A company’s internal control over financial reporting is a process designed to provide reasonable assurance regarding the reliability of financial reporting and the preparation of financial statements for external purposes in accordance with generally accepted accounting principles. A company’s internal control over financial reporting includes those policies and procedures that (1) pertain to the maintenance of records that, in reasonable detail, accurately and fairly reflect the transactions and dispositions of the assets of the company; (2) provide reasonable assurance that transactions are recorded as necessary to permit preparation of financial statements in accordance with generally accepted accounting principles, and that receipts and expenditures of the company are being made only in accordance with authorizations of management and directors of the company; and (3) provide reasonable assurance regarding prevention or timely detection of unauthorized acquisition, use, or disposition of the company’s assets that could have a material effect on the financial statements.
Because of its inherent limitations, internal control over financial reporting may not prevent or detect misstatements. Also, projections of any evaluation of effectiveness to future periods are subject to the risk that controls may become inadequate because of changes in conditions, or that the degree of compliance with the policies or procedures may deteriorate.
In our opinion, the Company maintained, in all material respects, effective internal control over financial reporting as of December 31, 2015, based on criteria established in Internal Control-Integrated Framework (2013) issued by the Committee of Sponsoring Organizations of the Treadway Commission (COSO).
We also have audited, in accordance with the standards of the Public Company Accounting Oversight Board (United States), the consolidated statements of condition of Tompkins Financial Corporation and subsidiaries as of December 31, 2015 and 2014, and the related consolidated statements of income, comprehensive income, cash flows, and changes in shareholders’ equity for each of the years in the three-year period ended December 31, 2015, and our report dated March 15, 2016 expressed an unqualified opinion on those consolidated financial statements.
| /s/ KPMG LLP | |
| Rochester, New York | |
| March 15, 2016 |
58
TOMPKINS FINANCIAL CORPORATION
CONSOLIDATED STATEMENTS OF CONDITION
| (In thousands, except share and per share data) (Unaudited) | As of | As of | ||||||
| ASSETS | 12/31/2015 | 12/31/2014 | ||||||
| Cash and noninterest bearing balances due from banks | $ | 56,261 | $ | 53,921 | ||||
| Interest bearing balances due from banks | 1,996 | 2,149 | ||||||
| Cash and Cash Equivalents | 58,257 | 56,070 | ||||||
| Trading securities, at fair value | 7,368 | 8,992 | ||||||
| Available-for-sale securities, at fair value (amortized cost of $1,390,255 at December 31, 2015 and $1,397,458 at December 31, 2014) | 1,385,684 | 1,402,236 | ||||||
| Held-to-maturity securities, at amortized cost (fair value of $146,686 at December 31, 2015 and $89,036 at December 31, 2014) | 146,071 | 88,168 | ||||||
| Originated loans and leases, net of unearned income and deferred costs and fees | 3,310,768 | 2,839,974 | ||||||
| Acquired loans and leases, covered | 14,031 | 19,319 | ||||||
| Acquired loans and leases, non-covered | 447,243 | 533,995 | ||||||
| Less: Allowance for loan and lease losses | 32,004 | 28,997 | ||||||
| Net Loans and Leases | 3,740,038 | 3,364,291 | ||||||
| FDIC indemnification asset | 158 | 1,903 | ||||||
| Federal Home Loan Bank stock | 29,969 | 21,259 | ||||||
| Bank premises and equipment, net | 60,331 | 59,800 | ||||||
| Corporate owned life insurance | 75,792 | 73,725 | ||||||
| Goodwill | 91,792 | 92,243 | ||||||
| Other intangible assets, net | 12,448 | 14,649 | ||||||
| Accrued interest and other assets | 82,087 | 86,225 | ||||||
| Total Assets | $ | 5,689,995 | $ | 5,269,561 | ||||
| LIABILITIES | ||||||||
| Deposits: | ||||||||
| Interest bearing: | ||||||||
| Checking, savings and money market | 2,401,519 | 2,247,708 | ||||||
| Time | 855,133 | 898,081 | ||||||
| Noninterest bearing | 1,138,654 | 1,023,365 | ||||||
| Total Deposits | 4,395,306 | 4,169,154 | ||||||
| Federal funds purchased and securities sold under agreements to repurchase | 136,513 | 147,037 | ||||||
| Other borrowings, including certain amounts at fair value of $10,576 at December 31, 2015 and $10,961 at December 31, 2014 | 536,285 | 356,541 | ||||||
| Trust preferred debentures | 37,509 | 37,337 | ||||||
| Other liabilities | 67,916 | 69,909 | ||||||
| Total Liabilities | $ | 5,173,529 | $ | 4,779,978 | ||||
| EQUITY | ||||||||
| Tompkins Financial Corporation shareholders’ equity: | ||||||||
| Common Stock - par value $.10 per share: Authorized 25,000,000 shares; Issued: 15,015,594 at December 31, 2015; and 14,931,354 at December 31, 2014 | 1,502 | 1,493 | ||||||
| Additional paid-in capital | 350,823 | 348,889 | ||||||
| Retained earnings | 197,445 | 165,160 | ||||||
| Accumulated other comprehensive loss | (31,001 | ) | (24,011 | ) | ||||
| Treasury stock, at cost – 116,126 shares at December 31, 2015, and 111,436 shares at December 31, 2014 | (3,755 | ) | (3,400 | ) | ||||
| Total Tompkins Financial Corporation Shareholders’ Equity | 515,014 | 488,131 | ||||||
| Noncontrolling interests | 1,452 | 1,452 | ||||||
| Total Equity | $ | 516,466 | $ | 489,583 | ||||
| Total Liabilities and Equity | $ | 5,689,995 | $ | 5,269,561 | ||||
See notes to consolidated financial statements.
59
TOMPKINS FINANCIAL CORPORATION
CONSOLIDATED STATEMENTS OF INCOME
| Year ended December 31, | ||||||||||||
| (in thousands, except per share data) | 2015 | 2014 | 2013 | |||||||||
| INTEREST AND DIVIDEND INCOME | ||||||||||||
| Loans | $ | 154,636 | $ | 150,966 | $ | 151,711 | ||||||
| Due from banks | 4 | 2 | 10 | |||||||||
| Trading securities | 352 | 418 | 589 | |||||||||
| Available-for-sale securities | 29,525 | 31,298 | 31,360 | |||||||||
| Held-to-maturity securities | 3,100 | 999 | 685 | |||||||||
| Federal Home Loan Bank stock and Federal Reserve Bank stock | 1,129 | 810 | 749 | |||||||||
| Total Interest and Dividend Income | 188,746 | 184,493 | 185,104 | |||||||||
| INTEREST EXPENSE | ||||||||||||
| Time certificates of deposits of $250,000 or more | 1,367 | 1,370 | 3,000 | |||||||||
| Other deposits | 9,084 | 9,711 | 9,765 | |||||||||
| Federal funds purchased and securities sold under agreements to repurchase | 2,709 | 2,947 | 3,749 | |||||||||
| Trust preferred debentures | 2,308 | 2,287 | 2,599 | |||||||||
| Other borrowings | 4,897 | 4,368 | 4,862 | |||||||||
| Total Interest Expense | 20,365 | 20,683 | 23,975 | |||||||||
| Net Interest Income | 168,381 | 163,810 | 161,129 | |||||||||
| Less: Provision for loan and lease losses | 2,945 | 2,306 | 6,161 | |||||||||
| Net Interest Income After Provision for Loan and Lease Losses | 165,436 | 161,504 | 154,968 | |||||||||
| NONINTEREST INCOME | ||||||||||||
| Insurance commissions and fees | 29,286 | 28,489 | 27,916 | |||||||||
| Investment services income | 15,416 | 15,493 | 15,109 | |||||||||
| Service charges on deposit accounts | 9,325 | 9,404 | 8,495 | |||||||||
| Card services income | 7,837 | 7,942 | 7,216 | |||||||||
| Mark-to-market loss on trading securities | (295 | ) | (269 | ) | (538 | ) | ||||||
| Mark-to-market gain on liabilities held at fair value | 385 | 331 | 555 | |||||||||
| Other income | 8,878 | 8,984 | 10,546 | |||||||||
| Net gain on securities transactions | 1,108 | 391 | 599 | |||||||||
| Total Noninterest Income | 71,940 | 70,765 | 69,898 | |||||||||
| NONINTEREST EXPENSES | ||||||||||||
| Salaries and wages | 72,707 | 69,558 | 67,200 | |||||||||
| Pension and other employee benefits | 16,025 | 21,102 | 22,164 | |||||||||
| Net occupancy expense of premises | 12,312 | 12,203 | 11,757 | |||||||||
| Furniture and fixture expense | 6,146 | 5,708 | 5,701 | |||||||||
| FDIC insurance | 2,992 | 2,906 | 3,214 | |||||||||
| Amortization of intangible assets | 2,013 | 2,095 | 2,197 | |||||||||
| Merger and integration related expenses | 0 | 0 | 228 | |||||||||
| Other operating expenses | 37,667 | 41,121 | 40,641 | |||||||||
| Total Noninterest Expenses | 149,862 | 154,693 | 153,102 | |||||||||
| Income Before Income Tax Expense | 87,514 | 77,576 | 71,764 | |||||||||
| Income Tax Expense | 28,962 | 25,404 | 20,777 | |||||||||
| Net Income Attributable to Noncontrolling Interests and Tompkins Financial Corporation | 58,552 | 52,172 | 50,987 | |||||||||
| Less: Net income attributable to noncontrolling interests | 131 | 131 | 131 | |||||||||
| Net Income Attributable to Tompkins Financial Corporation | $ | 58,421 | $ | 52,041 | $ | 50,856 | ||||||
| Basic Earnings Per Share | $ | 3.91 | $ | 3.51 | $ | 3.48 | ||||||
| Diluted Earnings Per Share | $ | 3.87 | $ | 3.48 | $ | 3.46 | ||||||
See notes to consolidated financial statements.
60
TOMPKINS FINANCIAL CORPORATION
CONSOLIDATED STATEMENTS OF COMPREHENSIVE INCOME
| Year ended December 31, | ||||||||||||
| (in thousands) | 2015 | 2014 | 2013 | |||||||||
| Net income attributable to noncontrolling interests and Tompkins Financial Corporation | $ | 58,552 | $ | 52,172 | $ | 50,987 | ||||||
| Other comprehensive income (loss), net of tax: | ||||||||||||
| Available-for-sale securities: | ||||||||||||
| Change in net unrealized gain/loss during the period | (4,946 | ) | 11,459 | (34,354 | ) | |||||||
| Reclassification adjustment for net realized gain on sale included in available-for-sale securities | (665 | ) | (235 | ) | (359 | ) | ||||||
| Employee benefit plans: | ||||||||||||
| Net retirement plan gain (loss) | 1,108 | (14,527 | ) | 10,088 | ||||||||
| Net retirement plan prior service cost | 0 | 3,769 | 0 | |||||||||
| Amortization of net retirement plan actuarial gain | 1,331 | 639 | 1,547 | |||||||||
| Amortization of net retirement plan prior service cost (credit) | (3,818 | ) | 3 | 35 | ||||||||
| Amortization of net retirement plan transition liability | 0 | 0 | 30 | |||||||||
| Other comprehensive (loss) gain | (6,990 | ) | 1,108 | (23,013 | ) | |||||||
| Subtotal comprehensive income attributable to noncontrolling interests and Tompkins Financial Corporation | 51,562 | 53,280 | 27,974 | |||||||||
| Less: Total comprehensive income attributable to noncontrolling interests | (131 | ) | (131 | ) | (131 | ) | ||||||
| Total comprehensive income attributable to Tompkins Financial Corporation | $ | 51,431 | $ | 53,149 | $ | 27,843 | ||||||
See notes to consolidated financial statements.
61
CONSOLIDATED STATEMENTS OF CASH FLOW
| Year ended December 31, | ||||||||||||
| (in thousands) | 2015 | 2014 | 2013 | |||||||||
| OPERATING ACTIVITIES | ||||||||||||
| Net income attributable to Tompkins Financial Corporation | $ | 58,421 | $ | 52,041 | $ | 50,856 | ||||||
| Adjustments to reconcile net income, attributable to Tompkins Financial Corporation, to net cash provided by operating activities: | ||||||||||||
| Provision for loan and lease losses | 2,945 | 2,306 | 6,161 | |||||||||
| Depreciation and amortization of premises, equipment, and software | 6,468 | 5,710 | 5,706 | |||||||||
| Accretion related to purchase accounting | (5,453 | ) | (8,378 | ) | (12,152 | ) | ||||||
| Amortization of intangible assets | 2,013 | 2,095 | 2,197 | |||||||||
| Earnings from corporate owned life insurance, net | (2,064 | ) | (1,883 | ) | (2,021 | ) | ||||||
| Net amortization on securities | 11,907 | 10,683 | 13,317 | |||||||||
| Mark-to-market loss on trading securities | 295 | 269 | 538 | |||||||||
| Mark-to-market gain loss on liabilities held at fair value | (385 | ) | (331 | ) | (555 | ) | ||||||
| Deferred income tax expense | 2,904 | 5,031 | 8,018 | |||||||||
| Net gain on sale of securities transactions | (1,108 | ) | (391 | ) | (599 | ) | ||||||
| Net (gain) loss on sale of loans | (54 | ) | (362 | ) | 133 | |||||||
| Proceeds from sale of loans | 3,282 | 20,263 | 13,483 | |||||||||
| Loans originated for sale | (3,774 | ) | (19,596 | ) | (13,384 | ) | ||||||
| Gain on redemption of trust preferred | 0 | 0 | (1,410 | ) | ||||||||
| Gain on IRA conversion | 0 | (140 | ) | (1,285 | ) | |||||||
| Gain on pension plan curtailment | (6,003 | ) | 0 | 0 | ||||||||
| Net loss on sale of bank premises and equipment | 11 | 6 | 191 | |||||||||
| Stock-based compensation expense | 1,903 | 1,506 | 1,382 | |||||||||
| Decrease in interest receivable | 85 | 68 | 929 | |||||||||
| Increase (decrease) in accrued interest payable | 105 | (253 | ) | (945 | ) | |||||||
| Proceeds from maturities, calls and principal paydowns of trading securities | 1,315 | 1,711 | 4,893 | |||||||||
| Contribution to pension plan | 0 | 0 | (8,000 | ) | ||||||||
| Decrease in FDIC prepaid insurance | 0 | 0 | 5,386 | |||||||||
| Other, net | 9,631 | 7,008 | 10,867 | |||||||||
| Net Cash Provided by Operating Activities | 82,444 | 77,363 | 83,706 | |||||||||
| INVESTING ACTIVITIES | ||||||||||||
| Proceeds from maturities, calls and principal paydowns of available-for-sale securities | 249,800 | 219,082 | 250,911 | |||||||||
| Proceeds from sales of available-for-sale securities | 137,594 | 90,551 | 115,796 | |||||||||
| Proceeds from maturities, calls and principal paydowns of held-to-maturity securities | 11,709 | 11,557 | 13,315 | |||||||||
| Purchases of available-for-sale securities | (391,116 | ) | (348,555 | ) | (398,811 | ) | ||||||
| Purchases of held-to-maturity securities | (69,947 | ) | (80,817 | ) | (8,236 | ) | ||||||
| Net increase in loans and leases | (375,205 | ) | (195,010 | ) | (240,160 | ) | ||||||
| Proceeds from sale of commercial loans | 0 | 0 | 5,160 | |||||||||
| Net (increase) decrease in Federal Home Loan Bank and Federal Reserve Bank Stock | (8,710 | ) | 3,782 | (5,558 | ) | |||||||
| Proceeds from sale of bank premises and equipment | 87 | 198 | 130 | |||||||||
| Purchases of bank premises and equipment | (6,343 | ) | (9,040 | ) | (6,545 | ) | ||||||
| Purchased of corporate owned life insurance | 0 | (2,500 | ) | (2,212 | ) | |||||||
| Net cash (used in) provided by acquisitions | 0 | (415 | ) | 0 | ||||||||
| Other, net | (789 | ) | 412 | (2,172 | ) | |||||||
| Net Cash Used in Investing Activities | (452,920 | ) | (310,755 | ) | (278,382 | ) | ||||||
| FINANCING ACTIVITIES | ||||||||||||
| Net increase in demand, money market, and savings deposits | 269,100 | 189,559 | 105,228 | |||||||||
| Net (decrease) increase in time deposits | (41,440 | ) | 34,243 | (103,882 | ) | |||||||
| Net decrease in securities sold under agreements to repurchase and Federal funds purchased | (9,400 | ) | (19,555 | ) | (45,117 | ) | ||||||
| Increase in other borrowings | 452,759 | 339,948 | 309,974 | |||||||||
| Redemption of trust preferred debentures | 0 | 0 | (5,191 | ) | ||||||||
| Repayment of other borrowings | (272,630 | ) | (314,606 | ) | (89,736 | ) | ||||||
| Net shares issued related to restricted stock awards | (195 | ) | 64 | 40 | ||||||||
| Cash dividends | (25,411 | ) | (23,983 | ) | (22,463 | ) | ||||||
| Repurchase of common stock | (3,505 | ) | (4,602 | ) | 0 | |||||||
| Shares issued for dividend reinvestment plan | 0 | 2,186 | 4,046 | |||||||||
| Shares issued for employee stock ownership plan | 1,595 | 1,528 | 717 | |||||||||
| Common stock issued | 50 | 50 | 0 | |||||||||
| Net proceeds from exercise of stock options | 1,382 | 1,512 | 4,683 | |||||||||
| Tax benefit from stock option exercises | 358 | 234 | 331 | |||||||||
| Net Cash Provided by Financing Activities | 372,663 | 206,578 | 158,630 | |||||||||
| Net Increase (Decrease) Cash and Cash Equivalents | 2,187 | (26,814 | ) | (36,046 | ) | |||||||
| Cash and cash equivalents at beginning of year | 56,070 | 82,884 | 118,930 | |||||||||
| Total Cash & Cash Equivalents at End of Year | 58,257 | 56,070 | 82,884 | |||||||||
62
CONSOLIDATED STATEMENTS OF CASH FLOW (continued)
Supplemental Cash Flow Information
| Year ended December 31, | ||||||||||||
| (in thousands) | 2015 | 2014 | 2013 | |||||||||
| Cash paid during the year for - Interest | $ | 21,768 | $ | 22,660 | $ | 27,935 | ||||||
| Cash paid, net of refunds, during the year for - Income taxes | 22,672 | 10,764 | 14,844 | |||||||||
| Non-cash investing and financing activities: | ||||||||||||
| Transfer of loans to other real estate owned | 1,276 | 5,591 | 5,971 | |||||||||
See notes to consolidated financial statements.
63
| TOMPKINS FINANCIAL CORPORATION | |||||||||||||||
| CONSOLIDATED STATEMENTS OF CHANGES IN SHAREHOLDERS’ EQUITY |
| (in thousands except share and per share data) | Common Stock |
Additional Paid-in Capital |
Retained Earnings |
Accumulated Other Comprehensive (Loss) Income | Treasury Stock |
Non- controlling Interests |
Total | |||||||||||||||||||||
| Balances at December 31, 2012 | $ | 1,443 | $ | 334,649 | $ | 108,709 | $ | (2,106 | ) | $ | (2,787 | ) | $ | 1,452 | $ | 441,360 | ||||||||||||
| Net income attributable to noncontrolling interests and Tompkins Financial Corporation | 50,856 | 131 | 50,987 | |||||||||||||||||||||||||
| Other comprehensive loss | (23,013 | ) | (23,013 | ) | ||||||||||||||||||||||||
| Total Comprehensive Income | 27,974 | |||||||||||||||||||||||||||
| Cash dividends ($1.54 per share) | (22,463 | ) | (22,463 | ) | ||||||||||||||||||||||||
| Net exercise of stock options and related tax benefit (144,732 shares, net) | 14 | 5,000 | 5,014 | |||||||||||||||||||||||||
| Stock-based compensation expense | 1,382 | 1,382 | ||||||||||||||||||||||||||
| Shares issued for dividend reinvestment plan (92,068 shares) | 9 | 4,037 | 4,046 | |||||||||||||||||||||||||
| Shares issued for employee stock ownership plan (17,290 shares) | 2 | 715 | 717 | |||||||||||||||||||||||||
| Directors deferred compensation plan (5,395 shares) | 284 | (284 | ) | 0 | ||||||||||||||||||||||||
| Restricted stock activity (104,206 shares) | 11 | 29 | 40 | |||||||||||||||||||||||||
| Dividend to noncontrolling interests | (131 | ) | (131 | ) | ||||||||||||||||||||||||
| Balances at December 31, 2013 | $ | 1,479 | $ | 346,096 | $ | 137,102 | $ | (25,119 | ) | $ | (3,071 | ) | $ | 1,452 | $ | 457,939 | ||||||||||||
| Net income attributable to noncontrolling interests and Tompkins Financial Corporation | 52,041 | 131 | 52,172 | |||||||||||||||||||||||||
| Other comprehensive income | 1,108 | 1,108 | ||||||||||||||||||||||||||
| Total Comprehensive Income | 53,280 | |||||||||||||||||||||||||||
| Cash dividends ($1.62 per share) | (23,983 | ) | (23,983 | ) | ||||||||||||||||||||||||
| Net exercise of stock options and related tax benefit (75,323 shares, net) | 7 | 1,739 | 1,746 | |||||||||||||||||||||||||
| Common stock repurchased and returned to unissued status (101,466 shares) | (10 | ) | (4,592 | ) | (4,602 | ) | ||||||||||||||||||||||
| Stock-based compensation expense | 1,506 | 1,506 | ||||||||||||||||||||||||||
| Shares issued for dividend reinvestment plan (46,081 shares) | 4 | 2,182 | 2,186 | |||||||||||||||||||||||||
| Shares issued for employee stock ownership plan (31,192 shares) | 3 | 1,525 | 1,528 | |||||||||||||||||||||||||
| Directors deferred compensation plan (5,987 shares) | 329 | (329 | ) | 0 | ||||||||||||||||||||||||
| Restricted stock activity (94,137 shares) | 10 | 54 | 64 | |||||||||||||||||||||||||
| Shares issued for purchase acquisition (1,080 shares) | 50 | 50 | ||||||||||||||||||||||||||
| Dividend to noncontrolling interests | (131 | ) | (131 | ) | ||||||||||||||||||||||||
| Balances at December 31, 2014 | $ | 1,493 | $ | 348,889 | $ | 165,160 | $ | (24,011 | ) | $ | (3,400 | ) | $ | 1,452 | $ | 489,583 | ||||||||||||
| 64 |
TOMPKINS FINANCIAL CORPORATION
| CONSOLIDATED STATEMENTS OF CHANGES IN SHAREHOLDERS’ EQUITY (continued) |
| (in thousands except share and per share data) | Common Stock |
Additional Paid-in Capital | Retained Earnings |
Accumulated Other Comprehensive (Loss) Income | Treasury Stock |
Non-controlling Interests | Total | |||||||||||||||||||||
| Balances at December 31, 2014 | $ | 1,493 | $ | 348,889 | $ | 165,160 | $ | (24,011 | ) | $ | (3,400 | ) | $ | 1,452 | $ | 489,583 | ||||||||||||
| Net income attributable to noncontrolling interests and Tompkins Financial Corporation | 58,421 | 131 | 58,552 | |||||||||||||||||||||||||
| Other comprehensive loss | (6,990 | ) | (6,990 | ) | ||||||||||||||||||||||||
| Total Comprehensive Income | 51,562 | |||||||||||||||||||||||||||
| Cash dividends ($1.70 per share) | (25,411 | ) | (25,411 | ) | ||||||||||||||||||||||||
| Net exercise of stock options and related tax benefit (80,681 shares, net) | 8 | 1,732 | 1,740 | |||||||||||||||||||||||||
| Common stock repurchased and returned to unissued status (67,481 shares) | (6 | ) | (3,499 | ) | (3,505 | ) | ||||||||||||||||||||||
| Stock-based compensation expense | 1,903 | 1,903 | ||||||||||||||||||||||||||
| Shares issued for employee stock ownership plan (29,575 shares) | 3 | 1,592 | 1,595 | |||||||||||||||||||||||||
| Directors deferred compensation plan (4,690 shares) | 355 | (355 | ) | 0 | ||||||||||||||||||||||||
| Restricted stock activity (40,505 shares) | 4 | (199 | ) | (195 | ) | |||||||||||||||||||||||
| Shares issued for purchase acquisition (960 shares) | 50 | 50 | ||||||||||||||||||||||||||
| Adoption of ASU 2014-01 Investments Accounting for Investments in Qualified Affordable Housing Projects | (725 | ) | (725 | ) | ||||||||||||||||||||||||
| Dividend to noncontrolling interests | (131 | ) | (131 | ) | ||||||||||||||||||||||||
| Balances at December 31, 2015 | $ | 1,502 | $ | 350,823 | $ | 197,445 | $ | (31,001 | ) | $ | (3,755 | ) | $ | 1,452 | $ | 516,466 | ||||||||||||
See notes to consolidated financial statements.
| 65 |
Note 1 Summary of Significant Accounting Policies
Basis of Presentation: Tompkins Financial Corporation (“Tompkins” or “the Company”) is a registered Financial Holding Company with the Federal Reserve Board pursuant to the Bank Holding Company Act of 1956, as amended, organized under the laws of New York State, and is the parent company of Tompkins Trust Company (the “Trust Company”), The Bank of Castile, Mahopac Bank (formerly known as The Mahopac National Bank), VIST Bank, Tompkins Insurance Agencies, Inc. (“Tompkins Insurance”) and TFA Management, Inc. (“TFA Management”. Unless the context otherwise requires, the term “Company” refers to Tompkins Financial Corporation and its subsidiaries.
The consolidated financial information included herein combines the results of operations, the assets, liabilities, and shareholders’ equity (including comprehensive income or loss) of the Company and all entities in which the Company has a controlling financial interest. All significant intercompany balances and transactions are eliminated in consolidation.
The Company determines whether it has a controlling financial interest in an entity by first evaluating whether the entity is a voting interest entity or a variable interest entity under U.S. accounting principles generally accepted. Voting interest entities are entities in which the total equity investment at risk is sufficient to enable the entity to finance itself independently and provides the equity holders with the obligation to absorb losses, the right to receive residual returns and the right to make decisions about the entity’s activities. The Company consolidates voting interest entities in which it has all, or at least a majority of, the voting interest. As defined in applicable accounting standards, variable interest entities (VIEs) are entities that lack one or more of the characteristics of a voting interest entity. A controlling financial interest in a VIE is present when the Company has both the power and ability to direct the activities of the VIE that most significantly impact the VIE’s economic performance and an obligation to absorb losses or the right to receive benefits that could potentially be significant to the VIE. The Company’s wholly owned subsidiaries, Tompkins Capital Trust I, Sleepy Hollow Capital Trust I, Leesport Capital Trust II, and Madison Statutory Trust I are VIE’s for which the Company is not the primary beneficiary. Accordingly, the accounts of these entities are not included in the Company’s consolidated financial statements.
The consolidated financial statements have been prepared in accordance with U.S. generally accepted accounting principles. In preparing the financial statements, management is required to make estimates and assumptions that affect the reported amounts of assets and liabilities, and disclose contingent assets and liabilities, at the date of the financial statements and the reported amounts of revenue and expense during the reporting period. Actual results could differ from those estimates. Significant items subject to such estimates and assumptions include the allowance for loan and lease losses, valuation of intangible assets, deferred income tax assets, other-than-temporary impairment on investments, and obligations related to employee benefits. Amounts in the prior years’ consolidated financial statements are reclassified when necessary to conform to the current year’s presentation.
The consolidated financial information included herein combines the results of operations, the assets, liabilities, and shareholders’ equity of the Company and its subsidiaries. Amounts in the prior periods’ unaudited condensed consolidated financial statements are reclassified when necessary to conform to the current periods’ presentation.
The Company has evaluated subsequent events for potential recognition and/or disclosure and determined that no further disclosures were required.
CASH AND CASH EQUIVALENTS: Cash and cash equivalents in the Consolidated Statements of Cash Flows include cash and noninterest bearing balances due from banks, interest-bearing balances due from banks, Federal funds sold, and money market funds. Management regularly evaluates the credit risk associated with the counterparties to these transactions and believes that the Company is not exposed to any significant credit risk on cash and cash equivalents. Each bank subsidiary is required to maintain reserve balances by the Federal Reserve Bank of New York. At December 31, 2015, and December 31, 2014 the reserve requirements for the Company’s banking subsidiaries totaled $5.4 million and $4.4 million, respectively.
Securities: Management determines the appropriate classification of debt and equity securities at the time of purchase. Securities are classified as held-to-maturity when the Company has the positive intent and ability to hold the securities to maturity. Held-to-maturity securities are stated at amortized cost. Debt securities not classified as held-to-maturity and marketable equity securities are classified as either available-for-sale or trading. Available-for-sale securities are stated at fair value with the unrealized gains and losses, net of tax, excluded from earnings and reported as a separate component of accumulated comprehensive income or loss, in shareholders’ equity. Trading securities are stated at fair value, with unrealized gains or losses included in earnings.
Securities with limited marketability or restricted equity securities, such as Federal Home Loan Bank stock and Federal Reserve Bank stock, are carried at cost.
Premiums and discounts are amortized or accreted over the expected life of the related security as an adjustment to yield using the interest method. Dividend and interest income are recognized when earned. Realized gains and losses on the sale of securities are included in net gain on securities transactions. The cost of securities sold is based on the specific identification method.
| 66 |
At least quarterly, the Company performs an assessment to determine whether there have been any events or economic circumstances indicating that a security with an unrealized loss has suffered other-than-temporary impairment. A debt security is considered impaired if the fair value is less than its amortized cost basis at the reporting date. If impaired, the Company then assesses whether the unrealized loss is other-than-temporary. An unrealized loss on a debt security is generally deemed to be other-than-temporary and a credit loss is deemed to exist if the present value, discounted at the security’s effective rate, of the expected future cash flows is less than the amortized cost basis of the debt security. As a result, the credit loss component of an other-than-temporary impairment write-down for debt securities is recorded in earnings while the remaining portion of the impairment loss is recognized, net of tax, in other comprehensive income provided that the Company does not intend to sell the underlying debt security and it is more-likely-than not that the Company would not have to sell the debt security prior to recovery of the unrealized loss, which may be to maturity. If the Company intended to sell any securities with an unrealized loss or it is more-likely-than not that the Company would be required to sell the investment securities, before recovery of their amortized cost basis, then the entire unrealized loss would be recorded in earnings.
Loans and Leases: Loans are reported at their principal outstanding balance, net of deferred loan origination fees and costs, and unearned income. The Company has the ability and intent to hold its loans for the foreseeable future, except for certain residential real estate loans held-for-sale. The Company provides motor vehicle and equipment financing to its customers through direct financing leases. These leases are carried at the aggregate of lease payments receivable, plus estimated residual values, less unearned income. Unearned income on direct financing leases is amortized over the lease terms, resulting in a level rate of return.
Residential real estate loans originated and intended for sale in the secondary market are carried at the lower of aggregate cost or estimated fair value. Fair value is determined on the basis of the rates quoted in the secondary market. Net unrealized losses attributable to changes in market interest rates are recognized through a valuation allowance by charges to income. Loans are generally sold on a non-recourse basis with servicing retained. Any gain or loss on the sale of loans is recognized at the time of sale as the difference between the recorded basis in the loan and the net proceeds from the sale. The Company may use commitments at the time loans are originated or identified for sale to mitigate interest rate risk. The commitments to sell loans and the commitments to originate loans held-for-sale at a set interest rate, if originated, are considered derivatives under ASC Topic 815. The impact of the estimated fair value adjustment was not significant to the consolidated financial statements.
Interest income on loans is accrued and credited to income based upon the principal amount outstanding. Loan origination fees and costs are deferred and recognized over the life of the loan as an adjustment to yield. Loans are considered past due if the required principal and interest payments have not been received as of the date such payments are due. Loans and leases, including impaired loans, are generally classified as nonaccrual if they are past due as to maturity or payment of principal or interest for a period of more than 90 days, unless such loans are well secured and in the process of collection. Loans that are past due less than 90 days may also be classified as nonaccrual if repayment in full of principal or interest is in doubt.
Loans may be returned to accrual status when all principal and interest amounts contractually due (including arrearages) are reasonably assured of repayment within an acceptable time period, and there is a sustained period (generally six consecutive months) of repayment performance by the borrower in accordance with the contractual terms of the loan agreement. When interest accrual is discontinued, all unpaid accrued interest is reversed. Payments received on loans on nonaccrual are generally applied to reduce the principal balance of the loan.
The Company applies the provisions of ASC Topic 310-10-35, Loan Impairment, to all impaired commercial and commercial real estate loans over $250,000 and to all loans restructured in a troubled debt restructuring. Allowances for loan losses for the remaining loans are recognized in accordance with ASC Topic 450, Contingencies (“ASC Topic 450”). Management considers a loan to be impaired if, based on current information, it is probable that the Company will be unable to collect all scheduled payments of principal or interest when due, according to the contractual terms of the loan agreement. When a loan is considered to be impaired, the amount of the impairment is measured based on the present value of expected future cash flows discounted at the effective interest rate of the loan or, as a practical expedient, at the observable market price or the fair value of collateral (less costs to sell) if the loan is collateral dependent. Management excludes large groups of smaller balance homogeneous loans such as residential mortgages, consumer loans, and leases, which are collectively evaluated.
Loans are considered modified in a troubled debt restructuring (“TDR”) when, due to a borrower’s financial difficulties, the Company makes a concession(s) to the borrower that it would not otherwise consider. These modifications may include, among others, an extension for the term of the loan, and granting a period when interest-only payments can be made with the principal payments and interest caught up over the remaining term of the loan or at maturity. Generally, a nonaccrual loan that has been modified in a TDR remains on non-accrual status for a period of six months to demonstrate that the borrower is able to meet the terms of the modified loan. However, performance prior to the modification, or significant events that coincide with the modification, are included in assessing whether the borrower can meet the new terms and may result in the loan being returned to accrual status at the time of loan modification or after a shorter performance period. If the borrower’s ability to meet the revised payment schedule is uncertain, the loan remains on nonaccrual status.
In general, the principal balance of a loan is charged off in full or in part when management concludes, based on the available facts and circumstances, that collection of principal in full is not probable. For commercial and commercial real estate loans, this conclusion is generally based upon a review of the borrower’s financial condition and cash flow, payment history, economic conditions, and the conditions in the various markets in which the collateral, if any, may be liquidated. In general, consumer loans are charged-off in accordance with regulatory guidelines which provide that such loans be charged-off when the Company becomes aware of the loss, such as from a triggering event that may include new information about a borrower’s intent/ability to repay the loan, bankruptcy, fraud or death, among other things, but in no case will the charge-off exceed specified delinquency timeframes. Such delinquency timeframes state that closed-end retail loans (loans with pre-defined maturity dates, such as real estate mortgages, home equity loans and consumer installment loans) that become past due 120 cumulative days and open-end retail loans (loans that roll-over at the end of each term, such as home equity lines of credit) that become past due 180 cumulative days should be classified as a loss and charged-off. For residential real estate loans, charge-off decisions are based upon past due status, current assessment of collateral value, and general market conditions in the areas where the properties are located.
| 67 |
ACQUIRED LOANS AND LEASES: Loans acquired in acquisitions, subsequent to the effective date of ASC Topic 805, Business Combination, are recorded at fair value and subsequently accounted for in accordance with ASC Topic 310, and there is no carryover of related allowance for loan and lease losses. Loans acquired with evidence of credit impairment are accounted for under ASC Subtopic 310-30. These loans may be aggregated and accounted for as pools of loans if the loans being aggregated have common risk characteristics. In the VIST acquisition, the Company elected to account for the loans with evidence of credit deterioration individually rather than aggregate them into pools. The difference between the undiscounted cash flows expected at acquisition and the investment in the acquired loans, or the “accretable yield,” is recognized as interest income utilizing the level-yield method over the life of each loan. Contractually required payments for interest and principal that exceed the undiscounted cash flows expected at acquisition, or the “non-accretable difference,” are not recognized as a yield adjustment, as a loss accrual or as a valuation allowance.
Increases in expected cash flows subsequent to the acquisition are recognized prospectively through an adjustment of the yield on the loans over the remaining life, while decreases in expected cash flows are recognized as impairment through a loss provision and an increase in the allowance for loan losses. Valuation allowances (recognized in the allowance for loan losses) on these impaired loans reflect only losses incurred after the acquisition (representing all cash flows that were expected at acquisition but currently are not expected to be received).
Acquired loans not exhibiting evidence of credit impairment at the time of acquisition are accounted for under ASC Subtopic 310-20. The Company amortizes/accretes into interest income the premium/discount determined at the date of purchase over the life of the loan on a level yield basis. Subsequent to the acquisition date, the methods used to estimate the appropriate allowance for loan losses are similar to originated loans. These loans are placed on nonaccrual status in accordance with the Company’s policy for originated loans.
Acquired loans that met the criteria for nonaccrual of interest prior to the acquisition may be considered performing upon acquisition, regardless of whether the customer is contractually delinquent, if we can reasonably estimate the timing and amount of the expected cash flows on such loans and if the Company expects to fully collect the new carrying value of the loans. As such, we may no longer consider the loan to be nonaccrual or nonperforming and may accrue interest on these loans, including the impact of any accretable discount. The Company determined at acquisition that it could reasonably estimate future cash flows on acquired loans that were past due 90 days or more and on which the Company expects to fully collect the carrying value of the loans net of the allowance for acquired loan losses. As such, the Company does not consider these loans to be nonaccrual or nonperforming.
ALLOWANCE FOR LOAN AND LEASE LOSSES: The Company has developed a methodology to measure the amount of estimated loan loss exposure inherent in the loan portfolio to assure that an appropriate allowance is maintained. The Company’s methodology is based upon guidance provided in SEC Staff Accounting Bulletin No. 102, Selected Loan Loss Allowance Methodology and Documentation Issues and allowance allocations are calculated in accordance with ASC Topic 310, Receivables and ASC Topic 450, Contingencies. The model is comprised of four major components that management has deemed appropriate in evaluating the appropriateness of the allowance for loan and lease losses. While none of these components, when used independently, is effective in arriving at a reserve level that appropriately measures the risk inherent in the portfolio, management believes that using them collectively, provides reasonable measurement of the loss exposure in the portfolio. The components include: impaired loans; individually reviewed and graded loans; historical loss experience; and qualitative or subjective analysis. For impaired loans an allowance is recognized if the fair value of the loan is less than the recorded investment in the loan (recorded investment in the loan is the principal balance plus any accrued interest, net of deferred loan fees or costs and unamortized premium or discount). A loan’s fair value reflects the present value of expected future cash flows discounted at the loan’s effective interest rate, or if the loan is collateral dependent, the fair value of the collateral, less estimated disposal costs. If the loan is collateral dependent, the principal balance of the loan is charged-off in an amount equal to the impairment measurement. The fair value of collateral dependent loans is derived primarily from collateral appraisals performed by independent third-party appraisers. For loans that are not impaired, but are rated special mention or worse, management evaluates credits based on elevated risk characteristics and assigns reserves based upon analysis of historical loss experience of loans with similar risk characteristics. For loans that are not impaired or reviewed individually, management assigns a reserve based upon historical loss experience over a designated look-back period. Management has evaluated a variety of look-back periods and has determined that a seven year look back period is appropriate to capture a full range of economic cycles. Management has also evaluated a variety of statistical methods in analyzing loss history, including averages, weighted averages and loss emergence periods and has determined that by applying a loss emergence period analysis to historical losses over a full economic cycle has resulted in a reasonable estimate of losses inherent in the loan portfolio. The model also includes an analysis of a variety of subjective factors to support the reserve estimate. These subjective factors may include reserve allocations for risks that may not otherwise be fully recognized in other components of the model. Among the subjective factors that are routinely considered as part of this analysis are: growth trends in the portfolio, changes in management and/or polices related to lending activities, trends in classified or nonaccrual loans, concentrations of credit, local and national economic trends, and industry trends.
| 68 |
Periodically, management conducts an analysis to estimate the loss emergence period for various loan categories based on samples of historical charge-offs. Model output by loan category is reviewed to evaluate the reasonableness of the reserve levels in comparison to the estimated loss emergence period applied to historical loss experience.
In addition to the components discussed above, management reviews the model output for reasonableness by analyzing the results in comparisons to recent trends in the loan/lease portfolio, through back-testing of results from prior models in comparison to actual loss history, and by comparing our reserves and loss history to industry peer results.
The model results are reviewed by management at the Corporate Credit Policy Committee and at the Audit Committee of the Board of Directors. Additionally, on an annual basis, management conducts a validation process of the model. This validation includes reviewing the appropriateness of model calculations, back testing of model results and appropriateness of key assumptions used in the model. In addition, various Federal and State regulatory agencies, as part of their examination process, review the Company’s allowance and may require the Company to recognize additions to the allowance based on their judgments about information available to them at the time of their examination.
For acquired credit impaired loans accounted for under FASB ASC Topic 310-30, Loans and Debt Securities Acquired with Deteriorated Credit Quality, (“ASC Topic 310-30”), the Company’s allowance for loan and lease losses is estimated based upon our expected cash flows for these loans. To the extent that we experience a deterioration in borrower credit quality resulting in a decrease in our expected cash flows subsequent to the acquisition of the loans, an allowance for loan losses would be established based on our estimate of future credit losses over the remaining life of the loans.
For acquired non-credit impaired loans accounted for under FASB ASC Topic 310-20, Nonrefundable Fees and Other Costs, (“ASC Topic 310-20”), the Company’s allowance for loan and lease losses is maintained through provisions for loan losses based upon an evaluation process that is similar to our evaluation process used for originated loans. This evaluation, which includes a review of loans on which full collectability may not be reasonably assured, considers, among other matters, the estimated fair value of the underlying collateral, economic conditions, historical net loan loss experience, carrying value of the loans, which includes the remaining net purchase discount or premium, and other factors that warrant recognition in determining our allowance for loan losses.
Premises and Equipment: Land is carried at cost. Premises and equipment are stated at cost, less allowances for depreciation. The provision for depreciation for financial reporting purposes is computed generally by the straight-line method at rates sufficient to write-off the cost of such assets over their estimated useful lives. Buildings are amortized over a period of 10-39 years, and furniture, fixtures, and equipment are amortized over a period of 2-20 years. Leasehold improvements are generally depreciated over the lesser of the lease term or the estimated lives of the improvements. Maintenance and repairs are charged to expense as incurred. Gains or losses on disposition are reflected in earnings.
Other Real Estate Owned: Other real estate owned consists of properties formerly pledged as collateral to loans, which have been acquired by the Company through foreclosure proceedings or acceptance of a deed in lieu of foreclosure. Upon transfer of a loan to foreclosure status, an appraisal is generally obtained and any excess of the loan balance over the fair value, less estimated costs to sell, is charged against the allowance for loan/lease losses. Expenses and subsequent adjustments to the fair value are treated as other operating expense.
Goodwill: Goodwill represents the excess of purchase price over the fair value of assets acquired in a transaction using purchase accounting. Goodwill has an indefinite useful life and is not amortized, but is tested for impairment. Goodwill impairment tests are performed on an annual basis or when events or circumstances dictate. The Company tests goodwill annually as of December 31st. The Company has the option to perform a qualitative assessment of goodwill, which considers company-specific and economic characteristics that might impact its carrying value. If based on this qualitative assessment, it is more likely than not that the fair value of the reporting unit is less than its carrying amount, then a quantitative test (Step 1) is performed, which compares the fair value of the reporting unit to the carrying amount of the reporting unit in order to identify potential impairment. If the estimated fair value of a reporting unit exceeds its carrying amount, the goodwill of the reporting unit is not considered impaired. However, if the carrying amount of the reporting unit were to exceed its estimated fair value, a second step (Step 2) would be performed that would compare the implied fair value of the reporting unit’s goodwill with the carrying amount of the goodwill for the reporting unit. The implied fair value of goodwill is determined in the same manner as goodwill that is recognized in a business combination. Significant judgment and estimates are involved in estimating the fair value of the assets and liabilities of the reporting units.
Other Intangible assets: Other intangible assets include core deposit intangibles, customer related intangibles, covenants not to compete, and mortgage servicing rights. Core deposit intangibles represent a premium paid to acquire a base of stable, low cost deposits in the acquisition of a bank, or a bank branch, using purchase accounting. The amortization period for core deposit intangible ranges from 5 years to 10 years, using an accelerated method. The covenants not to compete are amortized on a straight-line basis over 3 to 6 years, while customer related intangibles are amortized on an accelerated basis over a range of 6 to 15 years. The amortization period is monitored to determine if circumstances require such periods to be revised. The Company periodically reviews its intangible assets for changes in circumstances that may indicate the carrying amount of the asset is impaired. The Company tests its intangible assets for impairment on an annual basis or more frequently if conditions indicate that an impairment loss has more likely than not been incurred.
| 69 |
Income Taxes: Deferred tax assets and liabilities are recognized for the future tax consequences attributable to differences between the financial statement carrying amounts of existing assets and liabilities and their respective tax bases. Deferred tax assets and liabilities are measured using enacted tax rates expected to apply to taxable income in the years in which those temporary differences are expected to be recovered or settled. The effect on deferred tax assets and liabilities of a change in tax rates is recognized in income in the period that includes the enactment date. Deferred taxes are reviewed quarterly and reduced by a valuation allowance if, based upon the information available, it is more likely than not that some or all of the deferred tax assets will not be realized. Realization of deferred tax assets is dependent upon the generation of a sufficient level of future taxable income and recoverable taxes paid in prior years. Although realization is not assured, management believes it is more likely than not that all of the deferred tax assets will be realized. The Company’s policy is to recognize interest and penalties on unrecognized tax benefits in income tax expense in the Consolidated Statements of Income.
Securities Sold Under Agreements to Repurchase: Securities sold under agreements to repurchase (repurchase agreements) are agreements in which the Company transfers the underlying securities to a third-party custodian’s account that explicitly recognizes the Company’s interest in the securities. The agreements are accounted for as secured financing transactions provided the Company maintains effective control over the transferred securities and meets other criteria as specified in FASB ASC Topic 860, Transfers and Servicing (“ASC Topic 860”). The Company’s agreements are accounted for as secured financings; accordingly, the transaction proceeds are reflected as liabilities and the securities underlying the agreements continue to be carried in the Company’s securities portfolio.
Treasury Stock: The cost of treasury stock is shown on the Consolidated Statements of Condition as a separate component of shareholders’ equity, and is a reduction to total shareholders’ equity. Shares are released from treasury at fair value, identified on an average cost basis.
Trust and Investment Services: Assets held in fiduciary or agency capacities for customers are not included in the accompanying Consolidated Statements of Condition, since such items are not assets of the Company. Fees associated with providing trust and investment services are included in noninterest income.
Earnings Per Share: Basic earnings per share is calculated by dividing net income available to common shareholders by the weighted average number of shares outstanding during the year, exclusive of shares represented by the unvested portion of restricted stock and restricted stock units. Diluted earnings per share is calculated by dividing net income available to common shareholders by the weighted average number of shares outstanding during the year plus the dilutive effect of the unvested portion of restricted stock and restricted stock units and stock issuable upon conversion of common stock equivalents (primarily stock options) or certain other contingencies. The Company currently uses authoritative accounting guidance under ASC Topic 260, Earnings Per Share, which provides that unvested share-based payment awards that contain nonforfeitable rights to dividends or dividend equivalents (whether paid or unpaid) are participating securities and shall be included in the computation of earnings per share pursuant to the two-class method. The Company issues stock-based compensation awards that included restricted stock awards that contain such rights.
Segment Reporting: The Company manages its operations through three reportable business segments in accordance with the standards set forth in FASB ASC Topic 280, “Segment Reporting”. The three segments are: (i) banking (“Banking”), (ii) insurance (“Tompkins Insurance Agencies, Inc.”) and (iii) wealth management (“Tompkins Financial Advisors”). The Company’s insurance services and wealth management services are managed separately from the Bank. Additional information on the segments is presented in Note 22- “Segment and Related Information.”
Comprehensive Income: For the Company, comprehensive income represents net income plus the net change in unrealized gains or losses on securities available-for-sale for the period (net of taxes), and the actuarial gain or loss and amortization of unrealized amounts in the Company’s defined-benefit retirement and pension plan, supplemental employee retirement plan, and post-retirement life and healthcare benefit plan (net of taxes), and is presented in the Consolidated Statements of Comprehensive Income and Consolidated Statements of Changes in Shareholders’ Equity. Accumulated other comprehensive income (loss) represents the net unrealized gains or losses on securities available-for-sale (net of tax) and unrecognized net actuarial gain or loss, unrecognized prior service costs, and unrecognized net initial obligation (net of tax) in the Company’s defined-benefit retirement and pension plan, supplemental employee retirement plan, and post-retirement life and healthcare benefit plan.
PENSION AND OTHER EMPLOYEE BENEFITS: The Company maintains noncontributory defined-benefit and defined contribution plans, which cover substantially all employees of the Company. In addition, the Company also maintains supplemental employee retirement plans for certain executives and a post-retirement life and healthcare plan. These plans are discussed in detail in Note 12 “Employee Benefit Plans”. The Company incurs certain employment-related expenses associated with these plans. In order to measure the expense associated with these plans, various assumptions are made including the discount rate used to value certain liabilities, expected return on plan assets, anticipated mortality rates, and expected future healthcare costs. The assumptions are based on historical experience as well as current facts and circumstances. A third-party actuarial firm is used to assist management in measuring the expense and liability associated with the plans. The Company uses a December 31 measurement date for its plans. As of the measurement date, plan assets are determined based on fair value, generally representing observable market prices. The projected benefit obligation is primarily determined based on the present value of projected benefit distributions at an assumed discount rate.
| 70 |
The expenses associated with these plans are charged to current operating expenses. The Company recognizes an asset for a plan’s overfunded status or a liability for a plan’s underfunded status in the Company’s consolidated statements of condition, and recognizes changes in the funded status of these plans in comprehensive income, net of applicable taxes, in the year in which the change occurred.
Effective July 31, 2015, the DB Pension Plan that had been accruing benefits was frozen. As a result, participants no longer accrued additional benefits in this Plan as of this date. Effective August 1, 2015, all active participants of the two DB Pension Plans began participation in the new 2015 DC Retirement Plan. Similar to the DC Retirement Plan, the 2015 DC Retirement Plan provides Company contributions to an account set up in the participant’s name, and those contributions are based on the participant’s compensation, age and service. The first contribution for this 2015 DC Retirement Plan will be made in March 2016.
STOCK BASED COMPENSATION: Under FASB ASC Topic 718, Compensation - Stock Compensation (“ASC Topic 718”), compensation costs recognized include the compensation cost for all share-based payments based upon the grant date fair value estimated in accordance with ASC Topic 718. Compensation cost is recorded on a straight-line basis over the vesting period of the awards. The Company’s stock-based employee compensation plan is described in Note 13 “Stock Plans and Stock Based Compensation”, of this Report.
FAIR VALUE MEASUREMENTS: The Company accounts for the provisions of FASB ASC Topic 820, Fair Value Measurements and Disclosures (“ASC Topic 820”), for financial assets and financial liabilities. ASC Topic 820 defines fair value, establishes a framework for measuring fair value in generally accepted accounting principles, and expands disclosures about fair value measurements. See Note 19 “Fair Value Measurements”.
In general, fair values of financial instruments are based upon quoted market prices, where available. If such quoted market prices are not available, fair value is based upon internally developed models that primarily use, as inputs, observable market-based parameters. Valuation adjustments may be made to ensure that financial instruments are recorded at fair value. These adjustments may include amounts to reflect counterparty credit quality and the Company’s creditworthiness, among others.
RECENT ACCOUNTING PRONOUNCEMENTS
ASU 2014-01, “Investments (Topic 323), Accounting for Investments in Qualified Affordable Housing Projects.” The amendments in this ASU provide guidance on accounting for investments by a reporting entity in flow-through limited liability entities that manage or invest in affordable housing projects that qualify for the low-income housing tax credit. The amendments permit reporting entities to make an accounting policy election to account for their investments in qualified affordable housing projects using the proportional amortization method if certain conditions are met. Under the proportional amortization method, an entity amortizes the initial cost of the investment in proportion to the tax credits and other tax benefits received and recognize the net investment performance in the income statement as a component of income tax expense (benefit). The amendments in this ASU became effective for the Company for annual periods beginning January 1, 2015 and if material will be applied retrospectively to all periods presented. A reporting entity that uses the effective yield method to account for its investments in qualified affordable housing projects before the date of adoption may continue to apply the effective yield method for those preexisting investments.
The Company previously accounted for its investments in qualified affordable housing projects under the cost method; however, the Company determined that its investments in its qualified affordable housing projects meet the conditions set forth in ASU 2014-01 to account for these investments under the proportional amortization method. The Company believes that amortizing its investments in qualified affordable housing projects as a component of income tax expense rather than as a component of operating expenses better reflects the nature and intent of these investments. As a result of adopting ASU 2014-01, the Company recognized additional income tax expense attributable to the amortization of investments in qualified affordable housing projects of $0.5 million during the twelve months ended December 31, 2015. While the adoption of ASU 2014-01 requires retrospective application to all periods presented, the Company did not restate income tax expense for the twelve months ended December 31, 2014 as the amount of additional income tax expense attributable to the amortization of investments in qualified affordable housing projects was not considered material. The net effect of adoption is $725,000 and is reported in the Statement of Changes in Shareholder’s Equity for the twelve months ended December 31, 2015. The Company’s remaining investment in qualified affordable housing projects, net of amortization totaled $2.6 million and $3.9 million at December 31, 2015 and December 31, 2014, respectively.
| 71 |
ASU 2014-12 “Compensation—Stock Compensation” (Topic 718”): Accounting for Share-Based Payments When the Terms of an Award Provide That a Performance Target Could Be Achieved after the Requisite Service Period, a consensus of the FASB Emerging Issues Task Force (ASU 2014-12). ASU 2014-12 requires that a performance target that affects vesting of share-based payment awards and that could be achieved after the requisite service period be treated as a performance condition. Compensation cost should be recognized in the period in which it becomes probable that the performance target will be achieved and should represent the compensation cost attributable to the periods for which the requisite service has already been rendered. If the performance target becomes probable of being achieved before the end of the requisite service period, the remaining unrecognized compensation cost should be recognized prospectively over the remaining requisite service period. The total amount of compensation cost recognized during and after the requisite service period should reflect the number of awards that are expected to vest and should be adjusted to reflect those awards that ultimately vest. The requisite service period ends when the employee can cease rendering service and still be eligible to vest in the award if the performance target is achieved. ASU 2014-12 is effective for all entities for interim and annual periods beginning after December 15, 2015, with early adoption permitted. An entity may apply the amendments in ASU 2014-12 either (i) prospectively to all awards granted or modified after the effective date or (ii) retrospectively to all awards with performance targets that are outstanding as of the beginning of the earliest annual period presented in the financial statements and to all new or modified awards thereafter. The adoption of ASU 2014-12 is not expected to have a material impact on the Company’s consolidated financial condition or results of operations because the Company has not historically granted performance-based stock compensation.
ASU 2015-01, “Income Statement – Extraordinary and Unusual Items (Subtopic 225-20) – Simplifying Income Statement Presentation by Eliminating the Concept of Extraordinary Items.” ASU 2015-01 eliminates from U.S. GAAP the concept of extraordinary items, which, among other things, required an entity to segregate extraordinary items considered to be unusual and infrequent from the results of ordinary operations and show the item separately in the income statement, net of tax, after income from continuing operations. ASU 2015-01 is effective for us beginning January 1, 2016, though early adoption is permitted. ASU 2015-01 is not expected to have a significant impact on our financial statements.
ASU 2015-02, “Consolidation (Topic 810) – Amendments to the Consolidation Analysis.” ASU 2015-02 implements changes to both the variable interest consolidation model and the voting interest consolidation model. ASU 2015-02 (i) eliminates certain criteria that must be met when determining when fees paid to a decision maker or service provider do not represent a variable interest, (ii) amends the criteria for determining whether a limited partnership is a variable interest entity and (iii) eliminates the presumption that a general partner controls a limited partnership in the voting model. ASU 2015-02 will be effective for us on January 1, 2016 and is not expected to have a significant impact on our financial statements.
ASU 2015-03, “Interest – Imputation of Interest (Subtopic 835-30) – Simplifying the Presentation of Debt Issuance Costs.” ASU 2015-03 requires that debt issuance costs related to a recognized debt liability be presented in the balance sheet as a direct deduction from the carrying amount of that debt liability, consistent with debt discounts. The recognition and measurement guidance for debt issuance costs are not affected by the amendments in ASU 2015-03. ASU 2015-03 will be effective for us on January 1, 2016, though early adoption is permitted. ASU 2015-03 is not expected to have a significant impact on our financial statements.
ASU 2015-05, “Intangibles – Goodwill and Other - Internal-Use Software (Subtopic 350-40) – Customer’s Accounting for Fees Paid in a Cloud Computing Arrangement.” ASU 2015-05 addresses accounting for fees paid by a customer in cloud computing arrangements such as (i) software as a service, (ii) platform as a service, (iii) infrastructure as a service and (iv) other similar hosting arrangements. ASU 2015-05 provides guidance to customers about whether a cloud computing arrangement includes a software license. If a cloud computing arrangement includes a software license, then the customer should account for the software license element of the arrangement consistent with the acquisition of other software licenses. If a cloud computing arrangement does not include a software license, the customer should account for the arrangement as a service contract. ASU 2015-05 will be effective for us on January 1, 2016 and is not expected to have a significant impact on our financial statements.
ASU 2015-15, “Interest – Imputation of Interest (Subtopic 835-30) – Presentation and Subsequent Measurement of Debt Issuance Costs Associated with Line-of-Credit Arrangements. Amendments to SEC Paragraphs Pursuant to Staff Announcement at June 18, 2015 EITF Meeting.” ASU 2015-15 adds SEC paragraphs pursuant to an SEC Staff Announcement that given the absence of authoritative guidance within ASU 2015-03 for debt issuance costs related to line-of-credit arrangements, the SEC staff would not object to an entity deferring and presenting debt issuance costs as an asset and subsequently amortizing the deferred debt issuance costs ratably over the term of the line-of-credit arrangement, regardless of whether there are any outstanding borrowings on the line-of-credit arrangement.
ASU 2015-16, “Business Combinations (Topic 805) – Simplifying the Accounting for Measurement-Period Adjustments.” ASU 2015-16 requires that adjustments to provisional amounts that are identified during the measurement period of a business combination be recognized in the reporting period in which the adjustment amounts are determined. Furthermore, the income statement effects of such adjustments, if any, must be calculated as if the accounting had been completed at the acquisition date. The portion of the amount recorded in current-period earnings that would have been recorded in previous reporting periods if the adjustment to the provisional amounts had been recognized as of the acquisition date. Under previous guidance, adjustments to provisional amounts identified during the measurement period are to be recognized retrospectively. ASU 2015-16 will be effective for us on January 1, 2016 and is not expected to have a significant impact on our financial statements.
| 72 |
ASU 2016-1, “No. 2016-01, Financial Instruments – Overall (Subtopic 825-10): Recognition and Measurement of Financial Assets and Financial Liabilities. ASU 2016-1, among other things, (i) requires equity investments, with certain exceptions, to be measured at fair value with changes in fair value recognized in net income, (ii) simplifies the impairment assessment of equity investments without readily determinable fair values by requiring a qualitative assessment to identify impairment, (iii) eliminates the requirement for public business entities to disclose the methods and significant assumptions used to estimate the fair value that is required to be disclosed for financial instruments measured at amortized cost on the balance sheet, (iv) requires public business entities to use the exit price notion when measuring the fair value of financial instruments for disclosure purposes, (v) requires an entity to present separately in other comprehensive income the portion of the total change in the fair value of a liability resulting from a change in the instrument-specific credit risk when the entity has elected to measure the liability at fair value in accordance with the fair value option for financial instruments, (vi) requires separate presentation of financial assets and financial liabilities by measurement category and form of financial asset on the balance sheet or the accompanying notes to the financial statements and (viii) clarifies that an entity should evaluate the need for a valuation allowance on a deferred tax asset related to available-for-sale. ASU 2016-1 will be effective for us on January 1, 2018 and is not expected to have a significant impact on our financial statements.
Note 2 Securities
Available-for-Sale Securities
The following tables summarize available-for-sale securities held by the Company at December 31, 2015 and 2014:
| (in thousands) | Available-for-Sale Securities | |||||||||||||||
| December 31, 2015 | Amortized Cost |
Gross Unrealized Gains | Gross Unrealized Losses | Fair Value | ||||||||||||
| (in thousands) | ||||||||||||||||
| Obligations of U.S. Government sponsored entities | $ | 551,176 | $ | 3,512 | $ | 1,795 | $ | 552,893 | ||||||||
| Obligations of U.S. states and political subdivisions | 83,981 | 898 | 153 | 84,726 | ||||||||||||
| Mortgage-backed securities – residential, issued by | ||||||||||||||||
| U.S. Government agencies | 94,459 | 1,535 | 1,316 | 94,678 | ||||||||||||
| U.S. Government sponsored entities | 656,947 | 3,599 | 10,449 | 650,097 | ||||||||||||
| Non-U.S. Government agencies or sponsored entities | 192 | 2 | 0 | 194 | ||||||||||||
| U.S. corporate debt securities | 2,500 | 0 | 338 | 2,162 | ||||||||||||
| Total debt securities | 1,389,255 | 9,546 | 14,051 | 1,384,750 | ||||||||||||
| Equity securities | 1,000 | 0 | 66 | 934 | ||||||||||||
| Total available-for-sale securities | $ | 1,390,255 | $ | 9,546 | $ | 14,117 | $ | 1,385,684 | ||||||||
| (in thousands) | Available-for-Sale Securities | |||||||||||||||
| December 31, 2014 | Amortized Cost |
Gross Unrealized Gains | Gross Unrealized Losses | Fair Value | ||||||||||||
| (in thousands) | ||||||||||||||||
| Obligations of U.S. Government sponsored entities | $ | 553,300 | $ | 6,222 | $ | 1,702 | $ | 557,820 | ||||||||
| Obligations of U.S. states and political subdivisions | 70,790 | 999 | 279 | 71,510 | ||||||||||||
| Mortgage-backed securities – residential, issued by | ||||||||||||||||
| U.S. Government agencies | 108,931 | 2,339 | 1,344 | 109,926 | ||||||||||||
| U.S. Government sponsored entities | 660,195 | 7,309 | 8,384 | 659,120 | ||||||||||||
| Non-U.S. Government agencies or sponsored entities | 267 | 4 | 0 | 271 | ||||||||||||
| U.S. corporate debt securities | 2,500 | 0 | 338 | 2,162 | ||||||||||||
| Total debt securities | 1,395,983 | 16,873 | 12,047 | 1,400,809 | ||||||||||||
| Equity securities | 1,475 | 0 | 48 | 1,427 | ||||||||||||
| Total available-for-sale securities | $ | 1,397,458 | $ | 16,873 | $ | 12,095 | $ | 1,402,236 | ||||||||
| 73 |
Held-to-Maturity Securities
The following tables summarize held-to-maturity securities held by the Company at December 31, 2015 and 2014:
| Held-to-Maturity Securities | ||||||||||||||||
| December 31, 2015 | Amortized Cost | Gross Unrealized Gains |
Gross Unrealized Losses |
Fair Value | ||||||||||||
| (in thousands) | ||||||||||||||||
| Obligations of U.S. Government sponsored entities | $ | 132,482 | $ | 649 | $ | 444 | $ | 132,687 | ||||||||
| Obligations of U.S. states and political subdivisions | 13,589 | 414 | 4 | 13,999 | ||||||||||||
| Total held-to-maturity debt securities | $ | 146,071 | $ | 1,063 | $ | 448 | $ | 146,686 | ||||||||
Held-to-Maturity Securities
| Held-to-Maturity Securities | ||||||||||||||||
| December 31, 2014 | Amortized Cost | Gross Unrealized Gains |
Gross Unrealized Losses |
Fair Value |
||||||||||||
| (in thousands) | ||||||||||||||||
| Obligations of U.S. Government sponsored entities | $ | 71,906 | $ | 400 | $ | 37 | $ | 72,269 | ||||||||
| Obligations of U.S. states and political subdivisions | $ | 16,262 | $ | 505 | $ | 0 | $ | 16,767 | ||||||||
| Total held-to-maturity debt securities | $ | 88,168 | $ | 905 | $ | 37 | $ | 89,036 | ||||||||
The following table sets forth information with regard to sales transactions of securities available-for-sale:
| Year ended December 31, | ||||||||||||
| (in thousands) | 2015 | 2014 | 2013 | |||||||||
| Proceeds from sales | $ | 137,594 | $ | 90,551 | $ | 115,796 | ||||||
| Gross realized gains | 1,359 | 426 | 762 | |||||||||
| Gross realized losses | (282 | ) | (78 | ) | (163 | ) | ||||||
| Net gains on sales of available-for-sale securities | $ | 1,077 | $ | 348 | $ | 599 | ||||||
There were no sales of held-to-maturity securities in 2015, 2014, and 2013.
The following table summarizes available-for-sale securities that had unrealized losses at December 31, 2015:
| December 31, 2015 | ||||||||||||||||||||||||
| Available-for-Sale Securities | Less than 12 Months | 12 Months or Longer | Total | |||||||||||||||||||||
| (in thousands) | Fair Value | Unrealized Losses |
Fair Value | Unrealized Losses |
Fair Value | Unrealized Losses |
||||||||||||||||||
| Obligations of U.S. Government sponsored entities | $ | 183,697 | $ | 1,618 | $ | 5,844 | $ | 177 | $ | 189,541 | $ | 1,795 | ||||||||||||
| Obligations of U.S. states and political subdivisions | 25,402 | 141 | 3,408 | 12 | 28,810 | 153 | ||||||||||||||||||
| Mortgage-backed securities – residential, issued by | ||||||||||||||||||||||||
| U.S. Government agencies | 32,636 | 350 | 30,244 | 966 | 62,880 | 1,316 | ||||||||||||||||||
| U.S. Government sponsored entities | 364,420 | 4,102 | 176,325 | 6,347 | 540,745 | 10,449 | ||||||||||||||||||
| U.S. corporate debt securities | 0 | 0 | 2,163 | 338 | 2,163 | 338 | ||||||||||||||||||
| Equity Securities | 0 | 0 | 934 | 66 | 934 | 66 | ||||||||||||||||||
| Total available-for-sale securities | $ | 606,155 | $ | 6,211 | $ | 218,918 | $ | 7,906 | $ | 825,073 | $ | 14,117 | ||||||||||||
| 74 |
The following table summarizes held-to-maturity securities that had unrealized losses at December 31, 2015:
| Held-to-Maturity Securities | Less than 12 Months | 12 Months or Longer | Total | |||||||||||||||||||||
| (in thousands) | Fair Value | Unrealized Losses |
Fair Value |
Unrealized Losses |
Fair Value | Unrealized Losses |
||||||||||||||||||
| Obligations of U.S. Government sponsored entities | $ | 29,671 | $ | 444 | $ | 0 | $ | 0 | $ | 29,671 | $ | 444 | ||||||||||||
| Obligations of U.S. sponsored entities | $ | 1,966 | $ | 4 | $ | 0 | $ | 0 | $ | 1,966 | $ | 4 | ||||||||||||
| Total held-to-maturity securities | $ | 31,637 | $ | 448 | $ | 0 | $ | 0 | $ | 31,637 | $ | 448 | ||||||||||||
The following table summarizes available-for-sale securities that had unrealized losses at December 31, 2014:
| December 31, 2014 | ||||||||||||||||||||||||
| Available-for-Sale Securities | Less than 12 Months | 12 Months or Longer | Total | |||||||||||||||||||||
| (in thousands) | Fair Value | Unrealized Losses |
Fair Value | Unrealized Losses |
Fair Value | Unrealized Losses |
||||||||||||||||||
| Obligations of U.S. Government sponsored entities | $ | 71,363 | $ | 385 | $ | 65,497 | $ | 1,317 | $ | 136,860 | $ | 1,702 | ||||||||||||
| Obligations of U.S. states and political subdivisions | 15,451 | 124 | 8,102 | 155 | 23,553 | 279 | ||||||||||||||||||
| Mortgage-backed securities – residential, issued by | ||||||||||||||||||||||||
| U.S. Government agencies | 2,623 | 21 | 28,502 | 1,323 | 31,125 | 1,344 | ||||||||||||||||||
| U.S. Government sponsored entities | 162,377 | 719 | 271,503 | 7,665 | 433,880 | 8,384 | ||||||||||||||||||
| U.S. corporate debt securities | 0 | 0 | 2,163 | 338 | 2,163 | 338 | ||||||||||||||||||
| Equity securities | 0 | 0 | 952 | 48 | 952 | 48 | ||||||||||||||||||
| Total available-for-sale securities | $ | 251,814 | $ | 1,249 | $ | 376,719 | $ | 10,846 | $ | 628,533 | $ | 12,095 | ||||||||||||
The following table summarizes held-to-maturity securities that had unrealized losses at December 31, 2014:
| Held-to-Maturity Securities | Less than 12 Months | 12 Months or Longer | Total | |||||||||||||||||||||
| (in thousands) | Fair Value | Unrealized Losses | Fair Value | Unrealized Losses | Fair Value | Unrealized Losses | ||||||||||||||||||
| Obligations of U.S. states and political subdivisions | $ | 15,095 | $ | 37 | $ | 0 | $ | 0 | $ | 15,095 | $ | 37 | ||||||||||||
| Total held-to-maturity securities | $ | 15,095 | $ | 37 | $ | 0 | $ | 0 | $ | 15,095 | $ | 37 | ||||||||||||
The gross unrealized losses reported for residential mortgage-backed securities relate to investment securities issued by U.S. government sponsored entities such as Federal National Mortgage Association and Federal Home Loan Mortgage Corporation, U.S. government agencies such as Government National Mortgage Association, and non-agencies. The total gross unrealized losses, shown in the tables above, were primarily attributable to changes in interest rates and levels of market liquidity, relative to when the investment securities were purchased, and not due to the credit quality of the investment securities.
The Company does not intend to sell the investment securities that are in an unrealized loss position until recovery of unrealized losses (which may be until maturity), and it is not more-likely-than not that the Company will be required to sell the investment securities, before recovery of their amortized cost basis, which may be at maturity. Accordingly, as of December 31, 2015, and December 31, 2014, management believes the unrealized losses detailed in the tables above are not other-than-temporary.
| 75 |
The Company did not recognize any net credit impairment charge to earnings on investment securities in 2015 and 2014. During 2013, the Company sold three non-U.S. Government agencies or sponsored entities mortgage backed securities for a gain of approximately $94,000. Prior to 2013, these non-U.S. Government agencies or sponsored entities mortgage backed securities were determined to be other-than-temporarily impaired and the Company did recognize net credit impairment charges to earnings of $441,000 over the life of these securities. Also during 2013, one non-U.S. Government agencies or sponsored entities mortgage backed security was repaid in full. The Company did not recognize any net credit impairment charge to earnings for this security in 2013.
The following table summarizes the roll-forward of credit losses on debt securities held by the Company for which a portion of an other-than-temporary impairment is recognized in other comprehensive income:
| As of December 31, | ||||||||||
| (in thousands) | 2015 | 2014 | 2013 | |||||||
| Credit losses at beginning of the period | $ | 0 | $ | 0 | $ | 441 | ||||
| Sales of securities for which an other-than-temporary impairment was previously recognized |
0 | 0 | (441 | ) | ||||||
| Ending balance of credit losses on debt securities held for which a portion of an other-than-temporary impairment was recognized in other comprehensive income |
$ | 0 | $ | 0 | $ | 0 | ||||
The amortized cost and estimated fair value of debt securities by contractual maturity are shown in the following table. Expected maturities may differ from contractual maturities because issuers may have the right to call or prepay obligations with or without call or prepayment penalties. Mortgage-backed securities are shown separately since they are not due at a single maturity date.
| December 31, 2015 (in thousands) |
Amortized Cost |
Fair Value |
|||||
| Available-for-sale securities: | |||||||
| Due in one year or less | $ | 53,936 | $ | 54,735 | |||
| Due after one year through five years | 351,462 | 353,736 | |||||
| Due after five years through ten years | 219,161 | 218,561 | |||||
| Due after ten years | 13,098 | 12,749 | |||||
| Total | 637,657 | 639,781 | |||||
| Mortgage-backed securities | 751,598 | 744,969 | |||||
| Total available-for-sale debt securities | $ | 1,389,255 | $ | 1,384,750 | |||
| December 31, 2014 (in thousands) |
Amortized Cost |
Fair Value |
||||||
| Available-for-sale securities: | ||||||||
| Due in one year or less | $ | 67,281 | $ | 68,350 | ||||
| Due after one year through five years | 342,548 | 347,230 | ||||||
| Due after five years through ten years | 199,724 | 199,276 | ||||||
| Due after ten years | 17,037 | 16,636 | ||||||
| Total | 626,590 | 631,492 | ||||||
| Mortgage-backed securities | 769,393 | 769,317 | ||||||
| Total available-for-sale debt securities | $ | 1,395,983 | $ | 1,400,809 | ||||
| December 31, 2015 (in thousands) |
Amortized Cost |
Fair Value |
||||||
| Held-to-maturity securities: | ||||||||
| Due in one year or less | $ | 9,249 | $ | 9,294 | ||||
| Due after one year through five years | 14,069 | 14,341 | ||||||
| Due after five years through ten years | 122,585 | 122,853 | ||||||
| Due after ten years | 168 | 198 | ||||||
| Total held-to-maturity debt securities | $ | 146,071 | $ | 146,686 | ||||
| 76 |
| December 31, 2014 (in thousands) |
Amortized Cost |
Fair Value |
||||||
| Held-to-maturity securities: | ||||||||
| Due in one year or less | $ | 11,400 | $ | 11,471 | ||||
| Due after one year through five years | 3,440 | 3,694 | ||||||
| Due after five years through ten years | 73,020 | 73,518 | ||||||
| Due after ten years | 308 | 353 | ||||||
| Total held-to-maturity debt securities | $ | 88,168 | $ | 89,036 | ||||
Trading Securities
The following summarizes trading securities, at estimated fair value, as of:
| (in thousands) | December 31, 2015 | December 31, 2014 | ||||||
| Obligations of U.S. Government sponsored entities | $ | 6,601 | $ | 7,404 | ||||
| Mortgage-backed securities – residential, issued by | ||||||||
| U.S. Government sponsored entities | 767 | 1,588 | ||||||
| Total trading securities | $ | 7,368 | $ | 8,992 | ||||
The decrease in trading securities reflects principal repayments and maturities received during 2015. The pre-tax mark-to-market losses on trading securities were $295,000, $269,000 and $538,000 for 2015, 2014 and 2013, respectively.
The Company pledges securities as collateral for public deposits and other borrowings, and sells securities under agreements to repurchase. See “Note 9 - Federal Funds Purchased and Securities Sold Under Agreements to Repurchase” for further discussion. Securities carried of $1.2 billion and $1.1 billion at December 31, 2015 and 2014, respectively, were either pledged or sold under agreements to repurchase.
Except for U.S. government securities, there were no holdings, when taken in the aggregate, of any single issuer that exceeded 10% of shareholders’ equity at December 31, 2015.
The Company has equity investments in small business investment companies (“SBIC”) established for the purpose of providing financing to small businesses in market areas served by the Company. As of December 31, 2015 and 2014, these investments totaled $1.8 million and $2.1 million, respectively, and were included in other assets on the Company’s Consolidated Statements of Condition. The investment is accounted for under the equity method of accounting. As of December 31, 2015, the Company reviewed this investment and determined that there was no impairment.
The Company also holds non-marketable Federal Home Loan Bank New York (“FHLBNY”) stock, non-marketable Federal Home Loan Bank Pittsburgh (“FHLBPITT”) stock and non-marketable Atlantic Community Bankers Bank (“ACBB”) stock, all of which are required to be held for regulatory purposes and for borrowing availability. The required investment in FHLB stock is tied to the Company’s borrowing levels with the FHLB. Holdings of FHLBNY stock, FHLBPITT stock and ACBB stock totaled $20.1 million, $9.8 million and $95,000 at December 31, 2015, respectively. These securities are carried at par, which is also cost. The FHLBNY and FHLBPITT continue to pay dividends and repurchase stock. As such, the Company has not recognized any impairment on its holdings of FHLBNY and FHLBPITT stock.
| 77 |
Note 3 Loans and Leases
Loans and Leases at December 31, 2015 and December 31, 2014 were as follows:
| December 31, 2015 | December 31, 2014 | |||||||||||||||||||||||
| (in thousands) | Originated | Acquired | Total Loans and Leases |
Originated | Acquired | Total Loans and Leases |
||||||||||||||||||
| Commercial and industrial | ||||||||||||||||||||||||
| Agriculture | $ | 88,299 | $ | 0 | $ | 88,299 | $ | 78,507 | $ | 0 | $ | 78,507 | ||||||||||||
| Commercial and industrial other | 768,024 | 84,810 | 852,834 | 688,529 | 97,034 | 785,563 | ||||||||||||||||||
| Subtotal commercial and industrial | 856,323 | 84,810 | 941,133 | 767,036 | 97,034 | 864,070 | ||||||||||||||||||
| Commercial real estate | ||||||||||||||||||||||||
| Construction | 103,037 | 4,892 | 107,929 | 72,427 | 35,906 | 108,333 | ||||||||||||||||||
| Agriculture | 86,935 | 2,095 | 89,030 | 58,994 | 3,182 | 62,176 | ||||||||||||||||||
| Commercial real estate other | 1,167,250 | 284,952 | 1,452,202 | 979,621 | 308,488 | 1,288,109 | ||||||||||||||||||
| Subtotal commercial real estate | 1,357,222 | 291,939 | 1,649,161 | 1,111,042 | 347,576 | 1,458,618 | ||||||||||||||||||
| Residential real estate | ||||||||||||||||||||||||
| Home equity | 202,578 | 42,092 | 244,670 | 186,957 | 56,008 | 242,965 | ||||||||||||||||||
| Mortgages | 823,841 | 27,491 | 851,332 | 710,904 | 32,282 | 743,186 | ||||||||||||||||||
| Subtotal residential real estate | 1,026,419 | 69,583 | 1,096,002 | 897,861 | 88,290 | 986,151 | ||||||||||||||||||
| Consumer and other | ||||||||||||||||||||||||
| Indirect | 17,829 | 0 | 17,829 | 18,298 | 0 | 18,298 | ||||||||||||||||||
| Consumer and other | 40,904 | 911 | 41,815 | 35,874 | 1,095 | 36,969 | ||||||||||||||||||
| Subtotal consumer and other | 58,733 | 911 | 59,644 | 54,172 | 1,095 | 55,267 | ||||||||||||||||||
| Leases | 14,861 | 0 | 14,861 | 12,251 | 0 | 12,251 | ||||||||||||||||||
| Covered loans | 0 | 14,031 | 14,031 | 0 | 19,319 | 19,319 | ||||||||||||||||||
| Total loans and leases | 3,313,558 | 461,274 | 3,774,832 | 2,842,362 | 553,314 | 3,395,676 | ||||||||||||||||||
| Less: unearned income and deferred costs and fees | (2,790 | ) | 0 | (2,790 | ) | (2,388 | ) | 0 | (2,388 | ) | ||||||||||||||
| Total loans and leases, net of unearned income and deferred costs and fees | $ | 3,310,768 | $ | 461,274 | $ | 3,772,042 | $ | 2,839,974 | $ | 553,314 | $ | 3,393,288 | ||||||||||||
The outstanding principal balance and the related carrying amount of the Company’s loans acquired in the VIST Acquisition were as follows at December 31:
| (in thousands) | 2015 | 2014 | ||||||
| Acquired Credit Impaired Loans | ||||||||
| Outstanding principal balance | $ | 32,752 | $ | 44,273 | ||||
| Carrying amount | 26,507 | 34,410 | ||||||
| Acquired Non-Credit Impaired Loans | ||||||||
| Outstanding principal balance | 439,389 | 525,182 | ||||||
| Carrying amount | 434,767 | 518,904 | ||||||
| Total Acquired Loans | ||||||||
| Outstanding principal balance | 472,141 | 569,455 | ||||||
| Carrying amount | 461,274 | 553,314 | ||||||
| 78 |
The following tables present changes in accretable yield on loans acquired from VIST Bank that were considered credit impaired.
| (in thousands) | ||||
| Balance at January 1, 2014 | $ | 10,954 | ||
| Accretion | (4,598 | ) | ||
| Disposals (loans paid in full) | (250 | ) | ||
| Reclassifications to/from nonaccretable difference | 2,498 | |||
| Balance at December 31, 2014 | $ | 8,604 | ||
| (in thousands) | ||||
| Balance at January 1, 2015 | $ | 8,604 | ||
| Accretion | (2,696 | ) | ||
| Disposals (loans paid in full) | (331 | ) | ||
| Reclassifications to/from nonaccretable difference1 | 1,215 | |||
| Balance at December 31, 2015 | $ | 6,792 |
| 1 Results in increased interest income as a prospective yield adjustment over the remaining life of the loans, as well as increased interest income from loan sales, modification and prepayments. |
At December 31, 2015, acquired loans included $14.0 million of covered loans. VIST Financial had previously acquired these loans in an FDIC assisted transaction in the fourth quarter of 2010. In accordance with a loss sharing agreement with the FDIC, certain losses and expenses relating to covered loans may be reimbursed by the FDIC at 70% or, if net losses exceed certain levels specified in the loss sharing agreements, 80%. See Note 5 – “FDIC Indemnification Asset Related to Covered Loans” for further discussion of the loss sharing agreements and related FDIC indemnification asset.
The Company has adopted comprehensive lending policies, underwriting standards and loan review procedures. The Company reviewed the lending policies of Tompkins and VIST Financial, and adopted a uniform policy for the Company. There were no significant changes to the Company’s existing policies, underwriting standards and loan review. The Company’s Board of Directors approves the lending policies at least annually. The Company recognizes that exceptions to policy guidelines may occasionally occur and has established procedures for approving exceptions to these policy guidelines. Management has also implemented reporting systems to monitor loan originations, loan quality, concentrations of credit, loan delinquencies and nonperforming loans and potential problem loans.
Residential real estate loans
The Company’s policy is to underwrite residential real estate loans in accordance with secondary market guidelines in effect at the time of origination, including loan-to-value (“LTV”) and documentation requirements. LTV’s exceeding 80% for fixed rate loans and 85% for adjustable rate loans require private mortgage insurance to reduce the exposure to 78%. The Company verifies applicants’ income, obtains credit reports and independent real estate appraisals in the underwriting process to ensure adequate collateral coverage and that loans are extended to individuals with good credit and income sufficient to repay the loan. The Company originates both fixed rate and adjustable rate residential real estate loans. Over the past two years, the vast majority of residential loan originations have been fixed rate loans, most of which have been sold in the secondary market on a non-recourse basis with related servicing rights retained. Adjustable rate residential real estate loans may be underwritten based upon an initial rate which is below the fully indexed rate; however, the initial rate is generally less than 100 basis points below the fully indexed rate. As such, the Company does not believe that this practice creates any significant credit risk.
The Company may sell residential real estate loans in the secondary market based on interest rate considerations. These residential real estate loans are generally sold to Federal Home Loan Mortgage Corporation (“FHLMC”) or State of New York Mortgage Agency (“SONYMA”) without recourse in accordance with standard secondary market loan sale agreements. These residential real estate loan sales are subject to customary representations and warranties, including representations and warranties related to gross incompetence and fraud. The Company has not had to repurchase any loans as a result of these general representations and warranties. While in the past, in rare circumstances, the Company agreed to sell residential real estate loans with recourse, the Company has not done so in the past several years and the amount of such loans is insignificant. The Company has never had to repurchase a loan sold with recourse.
During 2015, 2014, and 2013, the Company sold residential mortgage loans totaling $3.2 million, $19.9 million, and $13.2 million, respectively, and realized net gains on these sales of $54,000, $362,000, and $301,000, respectively. These residential real estate loans are generally sold without recourse in accordance with standard secondary market loan sale agreements. When residential mortgage loans are sold to FHLMC or SONYMA, the Company typically retains all servicing rights, which provides the Company with a source of fee income. In connection with the sales in 2015, 2014, and 2013, the Company recorded mortgage-servicing assets of $18,000, $146,000, and $85,000, respectively.
| 79 |
Amortization of mortgage servicing assets amounted to $146,000 in 2015, $149,000 in 2014, and $232,000 in 2013. At December 31, 2015 and 2014, the Company serviced residential mortgage loans aggregating $135.9 million and $158.3 million, including loans securitized and held as available-for-sale securities. Mortgage servicing rights, at amortized basis, totaled $894,000 at December 31, 2015 and $1.0 million at 2014. These mortgage servicing rights were evaluated for impairment at year-end 2015 and 2014 and no impairment was recognized. Loans held for sale, which are included in residential real estate totaled $546,000 and $0 at December 31, 2015 and 2014, respectively.
As members of the FHLB, the Company’s subsidiary banks may use unencumbered mortgage related assets to secure borrowings from the FHLB. At December 31, 2015 and 2014, the Company had $250.0 million and $111.0 million, respectively, of term advances from the FHLB that were secured by residential mortgage loans.
Commercial and industrial loans
The Company’s policy sets forth guidelines for debt service coverage ratios, LTV’s and documentation standards. Commercial and industrial loans are primarily made based on identified cash flows of the borrower with consideration given to underlying collateral and personal or government guarantees. The Company’s policy establishes debt service coverage ratio limits that require a borrower’s cash flow to be sufficient to cover principal and interest payments on all new and existing debt. Commercial and industrial loans are generally secured by the assets being financed or other business assets such as accounts receivable or inventory. Many of the loans in the commercial portfolio have variable interest rates tied to Prime Rate, FHLBNY borrowing rates, or U.S. Treasury indices.
Commercial real estate
The Company’s policy sets forth guidelines for debt service coverage ratios, LTV’s and documentation standards. Commercial real estate loans are primarily made based on identified cash flows of the borrower with consideration given to underlying real estate collateral and personal or government guarantees. The Company’s policy establishes a maximum LTV of 75% and debt service coverage ratio limits that require a borrower’s cash flow to be sufficient to cover principal and interest payments on all new and existing debt. Commercial real estate loans may be fixed or variable rate loans with interest rates tied to Prime Rate, FHLBNY borrowing rates, or U.S. Treasury indices.
Agriculture loans
Agriculturally-related loans include loans to dairy farms and vegetable crop farms. Agriculturally-related loans are primarily made based on identified cash flows of the borrower with consideration given to underlying collateral, personal guarantees, and government related guarantees. Agriculturally-related loans are generally secured by the assets or property being financed or other business assets such as accounts receivable, livestock, equipment, or commodities/crops. The Company’s policy establishes a maximum LTV of 75% for real estate secured loans and debt service coverage ratio limits that require a borrower’s cash flow to be sufficient to cover principal and interest payments on all new and existing debt. The policy also establishes maximum LTV ratios for non-real estate collateral, such as livestock, commodities/crops, equipment and accounts receivable. Agriculturally-related loans may be fixed or variable rate loans with interest tied to Prime Rate, FHLBNY borrowing rates, or U.S. Treasury indices.
Consumer and other loans
The consumer loan portfolio includes personal installment loans, direct and indirect automobile financing, and overdraft lines of credit. The majority of the consumer portfolio consists of indirect and direct automobile loans. Consumer loans are generally short-term and have fixed rates of interest that are set giving consideration to current market interest rates, the financial strength of the borrower, and internal profitability targets. The policy establishes maximum debt to income ratios and includes guidelines for verification of applicants’ income and receipt of credit reports.
Leases
Leases are primarily made to commercial customers and the origination criteria typically includes the value of the underlying assets being financed, the useful life of the assets being financed, and identified cash flows of the borrower. Most leases carry a fixed rate of interest that is set giving consideration to current market interest rates, the financial strength of the borrower, and internal profitability targets.
Loan and Lease Customers
The Company’s loan and lease customers are located primarily in the upstate New York communities served by its three subsidiary banks and in the Pennsylvania communities served by recently acquired VIST Bank. The Trust Company operates fifteen banking offices in the counties of Tompkins, Cayuga, Cortland, and Schuyler, New York. The Bank of Castile operates seventeen banking offices in the Genesee Valley region of New York State as well as Monroe County. Mahopac National Bank is located in Putnam County, New York, and operates five offices in that county, three offices in neighboring Dutchess County, New York, and six offices in Westchester County, New York. VIST Bank operates 20 offices in Southeastern Pennsylvania. Other than general economic risks, management is not aware of any material concentrations of credit risk to any industry or individual borrower.
| 80 |
Directors and officers of the Company and its affiliated companies were customers of, and had other transactions with, the Company’s banking subsidiaries in the ordinary course of business. Such loans and commitments were made on substantially the same terms, including interest rates and collateral, as those prevailing at the time for comparable transactions with other persons not related to the Company, and did not involve more than normal risk of collectability or present other unfavorable features.
Loans to Related Parties
Loan transactions with related parties at December 31 are summarized as follows:
| (in thousands) | 2015 | 2014 | ||||||
| Balance at beginning of year | $ | 20,842 | $ | 30,582 | ||||
| New Directors/Executive Officers | 308 | 445 | ||||||
| New loans and advancements | 604 | 9,387 | ||||||
| Loan Payments | (10,372 | ) | (19,572 | ) | ||||
| Balance at end of year | $ | 11,382 | $ | 20,842 | ||||
Nonaccrual Loans and Leases
Loans are considered past due if the required principal and interest payments have not been received as of the date such payments are due. Loans are placed on nonaccrual status either due to the delinquency status of principal and/or interest (generally when past due 90 or more days) or a judgment by management that the full repayment of principal and interest is unlikely. When interest accrual is discontinued, all unpaid accrued interest is reversed. Payments received on loans on nonaccrual are generally applied to reduce the principal balance of the loan. Loans are generally returned to accrual status when all the principal and interest amounts contractually due are brought current and future payments are reasonably assured. When management determines that the collection of principal in full is improbable, management will charge-off a partial amount or full amount of the loan balance. Management considers specific facts and circumstances relative to each individual credit in making such a determination. For residential and consumer loans, management uses specific regulatory guidance and thresholds for determining charge-offs.
Acquired loans that met the criteria for nonaccrual of interest prior to the acquisition may be considered performing upon acquisition, regardless of whether the customer is contractually delinquent, if we can reasonably estimate the timing and amount of the expected cash flows on such loans and if the Company expects to fully collect the new carrying value of the loans. As such, we may no longer consider the loan to be nonaccrual or nonperforming and may accrue interest on these loans, including the impact of any accretable discount. The Company has determined that it can reasonably estimate future cash flows on our current portfolio of acquired loans that are past due 90 days or more and on which the Company is accruing interest and expect to fully collect the carrying value of the loans net of the allowance for acquired loan losses.
The below table is an age analysis of past due loans, segregated by originated and acquired loan and lease portfolios, and by class of loans, as of December 31, 2015 and 2014.
| 81 |
| December 31, 2015 | ||||||||||||||||||||||||
| (in thousands) | 30-89 days | 90 days or more | Current Loans | Total Loans | 90 days and accruing1 |
Nonaccrual | ||||||||||||||||||
| Originated Loans and Leases | ||||||||||||||||||||||||
| Commercial and industrial | ||||||||||||||||||||||||
| Agriculture | $ | 0 | $ | 0 | $ | 88,299 | $ | 88,299 | $ | 0 | $ | 0 | ||||||||||||
| Commercial and industrial other | 507 | 867 | 766,650 | 768,024 | 0 | 1,091 | ||||||||||||||||||
| Subtotal commercial and industrial | 507 | 867 | 854,949 | 856,323 | 0 | 1,091 | ||||||||||||||||||
| Commercial real estate | ||||||||||||||||||||||||
| Construction | 0 | 0 | 103,037 | 103,037 | 0 | 0 | ||||||||||||||||||
| Agriculture | 0 | 0 | 86,935 | 86,935 | 0 | 106 | ||||||||||||||||||
| Commercial real estate other | 225 | 3,580 | 1,163,445 | 1,167,250 | 0 | 4,365 | ||||||||||||||||||
| Subtotal commercial real estate | 225 | 3,580 | 1,353,417 | 1,357,222 | 0 | 4,471 | ||||||||||||||||||
| Residential real estate | ||||||||||||||||||||||||
| Home equity | 729 | 1,868 | 199,981 | 202,578 | 58 | 1,873 | ||||||||||||||||||
| Mortgages | 1,161 | 5,140 | 817,540 | 823,841 | 0 | 5,889 | ||||||||||||||||||
| Subtotal residential real estate | 1,890 | 7,008 | 1,017,521 | 1,026,419 | 58 | 7,762 | ||||||||||||||||||
| Consumer and other | ||||||||||||||||||||||||
| Indirect | 494 | 250 | 17,085 | 17,829 | 0 | 107 | ||||||||||||||||||
| Consumer and other | 164 | 0 | 40,740 | 40,904 | 0 | 75 | ||||||||||||||||||
| Subtotal consumer and other | 658 | 250 | 57,825 | 58,733 | 0 | 182 | ||||||||||||||||||
| Leases | 0 | 0 | 14,861 | 14,861 | 0 | 0 | ||||||||||||||||||
| Total loans and leases | 3,280 | 11,705 | 3,298,573 | 3,313,558 | 58 | 13,506 | ||||||||||||||||||
| Less: unearned income and deferred costs and fees | 0 | 0 | (2,790 | ) | (2,790 | ) | 0 | 0 | ||||||||||||||||
| Total originated loans and leases, net of unearned income and deferred costs and fees | $ | 3,280 | $ | 11,705 | $ | 3,295,783 | $ | 3,310,768 | $ | 58 | $ | 13,506 | ||||||||||||
| Acquired Loans and Leases | ||||||||||||||||||||||||
| Commercial and industrial | ||||||||||||||||||||||||
| Commercial and industrial other | $ | 20 | $ | 936 | $ | 83,854 | $ | 84,810 | $ | 338 | $ | 647 | ||||||||||||
| Subtotal commercial and industrial | 20 | 936 | 83,854 | 84,810 | 338 | 647 | ||||||||||||||||||
| Commercial real estate | ||||||||||||||||||||||||
| Construction | 0 | 359 | 4,533 | 4,892 | 0 | 359 | ||||||||||||||||||
| Agriculture | 0 | 0 | 2,095 | 2,095 | 0 | 0 | ||||||||||||||||||
| Commercial real estate other | 150 | 1,671 | 283,131 | 284,952 | 550 | 1,224 | ||||||||||||||||||
| Subtotal commercial real estate | 150 | 2,030 | 289,759 | 291,939 | 550 | 1,583 | ||||||||||||||||||
| Residential real estate | ||||||||||||||||||||||||
| Home equity | 426 | 364 | 41,302 | 42,092 | 0 | 712 | ||||||||||||||||||
| Mortgages | 336 | 1,926 | 25,229 | 27,491 | 1,103 | 1,389 | ||||||||||||||||||
| Subtotal residential real estate | 762 | 2,290 | 66,531 | 69,583 | 1,103 | 2,101 | ||||||||||||||||||
| Consumer and other | ||||||||||||||||||||||||
| Consumer and other | 1 | 0 | 910 | 911 | 0 | 0 | ||||||||||||||||||
| Subtotal consumer and other | 1 | 0 | 910 | 911 | 0 | 0 | ||||||||||||||||||
| Covered loans | 276 | 524 | 13,231 | 14,031 | 524 | 0 | ||||||||||||||||||
| Total acquired loans and leases, net of unearned income and deferred costs and fees | $ | 1,209 | $ | 5,780 | $ | 454,285 | $ | 461,274 | $ | 2,515 | $ | 4,331 | ||||||||||||
1 Includes acquired loans that were recorded at fair value at the acquisition date.
82
| December 31, 2014 | ||||||||||||||||||||||||
| (in thousands) | 30-89 days | 90 days or more | Current Loans | Total Loans | 90 days and accruing1 |
Nonaccrual | ||||||||||||||||||
| Originated loans and leases | ||||||||||||||||||||||||
| Commercial and industrial | ||||||||||||||||||||||||
| Agriculture | $ | 0 | $ | 0 | $ | 78,507 | $ | 78,507 | $ | 0 | $ | 0 | ||||||||||||
| Commercial and industrial other | 889 | 1,329 | 686,311 | 688,529 | 0 | 1,435 | ||||||||||||||||||
| Subtotal commercial and industrial | 889 | 1,329 | 764,818 | 767,036 | 0 | 1,435 | ||||||||||||||||||
| Commercial real estate | ||||||||||||||||||||||||
| Construction | 206 | 0 | 72,221 | 72,427 | 0 | 0 | ||||||||||||||||||
| Agriculture | 0 | 105 | 58,889 | 58,994 | 0 | 131 | ||||||||||||||||||
| Commercial real estate other | 760 | 3,247 | 975,614 | 979,621 | 0 | 4,911 | ||||||||||||||||||
| Subtotal commercial real estate | 966 | 3,352 | 1,106,724 | 1,111,042 | 0 | 5,042 | ||||||||||||||||||
| Residential real estate | ||||||||||||||||||||||||
| Home equity | 1,414 | 1,061 | 184,482 | 186,957 | 59 | 1,279 | ||||||||||||||||||
| Mortgages | 2,963 | 5,308 | 702,633 | 710,904 | 47 | 6,194 | ||||||||||||||||||
| Subtotal residential real estate | 4,377 | 6,369 | 887,115 | 897,861 | 106 | 7,473 | ||||||||||||||||||
| Consumer and other | ||||||||||||||||||||||||
| Indirect | 542 | 75 | 17,681 | 18,298 | 0 | 101 | ||||||||||||||||||
| Consumer and other | 75 | 4 | 35,795 | 35,874 | 0 | 248 | ||||||||||||||||||
| Subtotal consumer and other | 617 | 79 | 53,476 | 54,172 | 0 | 349 | ||||||||||||||||||
| Leases | 0 | 0 | 12,251 | 12,251 | 0 | 0 | ||||||||||||||||||
| Total loans and leases | 6,849 | 11,129 | 2,824,384 | 2,842,362 | 106 | 14,299 | ||||||||||||||||||
| Less: unearned income and deferred costs and fees | 0 | 0 | 0 | (2,388 | ) | 0 | 0 | |||||||||||||||||
| Total originated loans and leases, net of unearned income and deferred costs and fees | $ | 6,849 | $ | 11,129 | $ | 2,824,384 | $ | 2,839,974 | $ | 106 | $ | 14,299 | ||||||||||||
| Acquired loans and leases | ||||||||||||||||||||||||
| Commercial and industrial | ||||||||||||||||||||||||
| Commercial and industrial other | $ | 5 | $ | 1,156 | $ | 95,873 | $ | 97,034 | $ | 475 | $ | 681 | ||||||||||||
| Subtotal commercial and industrial | 5 | 1,156 | 95,873 | 97,034 | 475 | 681 | ||||||||||||||||||
| Commercial real estate | ||||||||||||||||||||||||
| Construction | 0 | 1,759 | 34,147 | 35,906 | 1,385 | 436 | ||||||||||||||||||
| Agriculture | 0 | 0 | 3,182 | 3,182 | 0 | 0 | ||||||||||||||||||
| Commercial real estate other | 0 | 1,918 | 306,570 | 308,488 | 77 | 2,042 | ||||||||||||||||||
| Subtotal commercial real estate | 0 | 3,677 | 343,899 | 347,576 | 1,462 | 2,478 | ||||||||||||||||||
| Residential real estate | ||||||||||||||||||||||||
| Home equity | 135 | 704 | 55,169 | 56,008 | 177 | 592 | ||||||||||||||||||
| Mortgages | 1,041 | 907 | 30,334 | 32,282 | 500 | 978 | ||||||||||||||||||
| Subtotal residential real estate | 1,176 | 1,611 | 85,503 | 88,290 | 677 | 1,570 | ||||||||||||||||||
| Consumer and other | ||||||||||||||||||||||||
| Consumer and other | 5 | 0 | 1,090 | 1,095 | 0 | 0 | ||||||||||||||||||
| Subtotal consumer and other | 5 | 0 | 1,090 | 1,095 | 0 | 0 | ||||||||||||||||||
| Covered loans | 533 | 914 | 17,872 | 19,319 | 914 | 0 | ||||||||||||||||||
| Total acquired loans and leases, net of unearned income and deferred costs and fees | $ | 1,719 | $ | 7,358 | $ | 544,237 | $ | 553,314 | $ | 3,528 | $ | 4,729 | ||||||||||||
1 Includes acquired loans that were recorded at fair value at the acquisition date.
The difference between the interest income that would have been recorded if nonaccrual loans and leases had paid in accordance with their original terms and the interest income that was recorded for the year ended December 31, 2015, 2014 and 2013 was $1.2 million, $1.7 million and $1.2 million, respectively. The Company had no material commitments to make additional advances to borrowers with nonperforming loans.
83
Note 4 Allowance for Loan and Lease Losses
Originated Loans and Leases
Management reviews the appropriateness of the allowance for loan and lease losses (“allowance”) on a regular basis. Management considers the accounting policy relating to the allowance to be a critical accounting policy, given the inherent uncertainty in evaluating the levels of the allowance required to cover credit losses in the portfolio and the material effect that assumptions could have on the Company’s results of operations. The Company has developed a methodology to measure the amount of estimated loan loss exposure inherent in the loan portfolio to assure that an appropriate allowance is maintained. The Company’s methodology is based upon guidance provided in SEC Staff Accounting Bulletin No. 102, Selected Loan Loss Allowance Methodology and Documentation Issues and allowance allocations are calculated in accordance with ASC Topic 310, Receivables and ASC Topic 450, Contingencies.
The model is comprised of four major components that management has deemed appropriate in evaluating the appropriateness of the allowance for loan and lease losses. While none of these components, when used independently, is effective in arriving at a reserve level that appropriately measures the risk inherent in the portfolio, management believes that using them collectively, provides reasonable measurement of the loss exposure in the portfolio. The four components include: impaired loans; individually reviewed and graded loans; historical loss experience; and qualitative or subjective analysis.
Since the methodology is based upon historical experience and trends as well as management’s judgment, factors may arise that result in different estimations. Significant factors that could give rise to changes in these estimates may include, but are not limited to, changes in economic conditions in the local area, concentration of risk, changes in interest rates, and declines in local property values. While management’s evaluation of the allowance as of December 31, 2015, considers the allowance to be appropriate, under different conditions or assumptions, the Company may need to adjust the allowance.
Acquired Loans and Leases
As part of our determination of the fair value of our acquired loans at the time of acquisition, the Company established a credit mark to provide for future losses in our acquired loan portfolio. To the extent that credit quality deteriorates subsequent to acquisition, such deterioration would result in the establishment of an allowance for the acquired loan portfolio.
| Changes in the allowance for loan and lease losses at December 31, are summarized as follows: | ||||||||||||
| (in thousands) | 2015 | 2014 | 2013 | |||||||||
| Total allowance at beginning of year | $ | 28,997 | $ | 27,970 | $ | 24,643 | ||||||
| Provisions charged to operations | 2,945 | 2,306 | 6,161 | |||||||||
| Recoveries on loans and leases | 2,843 | 3,109 | 5,347 | |||||||||
| Charge-offs on loans and leases | (2,781 | ) | (4,388 | ) | (8,181 | ) | ||||||
| Total allowance at end of year | $ | 32,004 | $ | 28,997 | $ | 27,970 | ||||||
The following tables detail activity in the allowance for originated and acquired loan and lease losses by portfolio segment for the twelve months ended December 31, 2015 and 2014.
| December 31, 2015 | ||||||||||||||||||||||||
| (in thousands) | Commercial and Industrial | Commercial Real Estate |
Residential Real Estate |
Consumer and Other |
Finance Leases |
Total | ||||||||||||||||||
| Allowance for originated loans and leases: | ||||||||||||||||||||||||
| Beginning balance | $ | 9,157 | $ | 12,069 | $ | 5,030 | $ | 1,900 | $ | 0 | $ | 28,156 | ||||||||||||
| Charge-offs | (221 | ) | (363 | ) | (338 | ) | (1,074 | ) | 0 | (1,996 | ) | |||||||||||||
| Recoveries | 809 | 1,277 | 112 | 487 | 0 | 2,685 | ||||||||||||||||||
| Provision | 750 | 2,496 | (734 | ) | (45 | ) | 2,467 | |||||||||||||||||
| Ending Balance | $ | 10,495 | $ | 15,479 | $ | 4,070 | $ | 1,268 | $ | 0 | $ | 31,312 | ||||||||||||
84
| December 31, 2015 | ||||||||||||||||||||||||
| (in thousands) | Commercial and Industrial |
Commercial Real Estate |
Residential Real Estate |
Consumer and Other |
Finance Leases |
Total | ||||||||||||||||||
| Allowance for acquired loans: | ||||||||||||||||||||||||
| Beginning balance | $ | 431 | $ | 337 | $ | 51 | $ | 22 | $ | 0 | $ | 841 | ||||||||||||
| Charge-offs | (77 | ) | (400 | ) | (302 | ) | (6 | ) | 0 | (785 | ) | |||||||||||||
| Recoveries | 7 | 142 | 9 | 0 | 0 | 158 | ||||||||||||||||||
| Provision | 72 | (18 | ) | 440 | (16 | ) | 0 | 478 | ||||||||||||||||
| Ending Balance | $ | 433 | $ | 61 | $ | 198 | $ | 0 | $ | 0 | $ | 692 | ||||||||||||
| December 31, 2014 | ||||||||||||||||||||||||
| (in thousands) | Commercial and Industrial |
Commercial Real Estate |
Residential Real Estate |
Consumer and Other |
Finance Leases |
Total | ||||||||||||||||||
| Allowance for originated loans and leases: | ||||||||||||||||||||||||
| Beginning balance | $ | 8,406 | $ | 10,459 | $ | 5,771 | $ | 2,059 | $ | 5 | $ | 26,700 | ||||||||||||
| Charge-offs | (470 | ) | (639 | ) | (512 | ) | (1,308 | ) | 0 | (2,929 | ) | |||||||||||||
| Recoveries | 636 | 1,832 | 88 | 536 | 0 | 3,092 | ||||||||||||||||||
| Provision | 585 | 417 | (317 | ) | 613 | (5 | ) | 1,293 | ||||||||||||||||
| Ending Balance | $ | 9,157 | $ | 12,069 | $ | 5,030 | $ | 1,900 | $ | 0 | $ | 28,156 | ||||||||||||
| December 31, 2014 | ||||||||||||||||||||||||
| (in thousands) | Commercial and Industrial |
Commercial Real Estate |
Residential Real Estate |
Consumer and Other |
Finance Leases |
Total | ||||||||||||||||||
| Allowance for acquired loans: | ||||||||||||||||||||||||
| Beginning balance | $ | 168 | $ | 770 | $ | 274 | $ | 58 | $ | 0 | $ | 1,270 | ||||||||||||
| Charge-offs | (293 | ) | (631 | ) | (484 | ) | (51 | ) | 0 | (1,459 | ) | |||||||||||||
| Recoveries | 0 | 0 | 0 | 17 | 0 | 17 | ||||||||||||||||||
| Provision | 556 | 198 | 261 | (2 | ) | 0 | 1,013 | |||||||||||||||||
| Ending Balance | $ | 431 | $ | 337 | $ | 51 | $ | 22 | $ | 0 | $ | 841 | ||||||||||||
At December 31, 2015 and 2014, the allocation of the allowance for loan and lease losses summarized on the basis of the Company’s impairment methodology was as follows:
| December 31, 2015 | ||||||||||||||||||||||||
| (in thousands) | Commercial and Industrial |
Commercial Real Estate |
Residential Real Estate |
Consumer and Other |
Finance Leases |
Total | ||||||||||||||||||
| Allowance for originated loans and leases: | ||||||||||||||||||||||||
| Individually evaluated for impairment | $ | 0 | $ | 288 | $ | 0 | $ | 0 | $ | 0 | $ | 288 | ||||||||||||
| Collectively evaluated for impairment | 10,495 | 15,191 | 4,070 | 1,268 | 0 | 31,024 | ||||||||||||||||||
| Ending balance | $ | 10,495 | $ | 15,479 | $ | 4,070 | $ | 1,268 | $ | 0 | $ | 31,312 | ||||||||||||
| Allowance for acquired loans: | ||||||||||||||||||||||||
| Individually evaluated for impairment | $ | 433 | $ | 0 | $ | 128 | $ | 0 | $ | 0 | $ | 561 | ||||||||||||
| Collectively evaluated for impairment | 0 | 61 | 70 | 0 | 0 | 131 | ||||||||||||||||||
| Ending balance | $ | 433 | $ | 61 | $ | 198 | $ | 0 | $ | 0 | $ | 692 | ||||||||||||
85
| December 31, 2014 | ||||||||||||||||||||||||
| (in thousands) | Commercial and Industrial |
Commercial Real Estate |
Residential Real Estate |
Consumer and Other |
Finance Leases |
Total | ||||||||||||||||||
| Allowance for originated loans and leases: | ||||||||||||||||||||||||
| Individually evaluated for impairment | $ | 0 | $ | 652 | $ | 0 | $ | 0 | $ | 0 | $ | 652 | ||||||||||||
| Collectively evaluated for impairment | 9,157 | 11,417 | 5,030 | 1,900 | 0 | 27,504 | ||||||||||||||||||
| Ending balance | $ | 9,157 | $ | 12,069 | $ | 5,030 | $ | 1,900 | $ | 0 | $ | 28,156 | ||||||||||||
| Allowance for acquired loans: | ||||||||||||||||||||||||
| Individually evaluated for impairment | $ | 414 | $ | 100 | $ | 0 | $ | 0 | $ | 0 | $ | 514 | ||||||||||||
| Collectively evaluated for impairment | 17 | 237 | 51 | 22 | 0 | 327 | ||||||||||||||||||
| Ending balance | $ | 431 | $ | 337 | $ | 51 | $ | 22 | $ | 0 | $ | 841 | ||||||||||||
The recorded investment in loans and leases summarized on the basis of the Company’s impairment methodology as of December 31, 2015 and December 31, 2014 was as follows:
| December 31, 2015 | ||||||||||||||||||||||||
| (in thousands) | Commercial and Industrial |
Commercial Real Estate |
Residential Real Estate |
Consumer and Other |
Finance Leases |
Total | ||||||||||||||||||
| Originated loans and leases: | ||||||||||||||||||||||||
| Individually evaluated for impairment | $ | 1,206 | $ | 5,655 | $ | 2,270 | $ | 0 | $ | 0 | $ | 9,131 | ||||||||||||
| Collectively evaluated for impairment | 855,117 | 1,351,567 | 1,024,149 | 58,733 | 14,861 | 3,304,427 | ||||||||||||||||||
| Total | $ | 856,323 | $ | 1,357,222 | $ | 1,026,419 | $ | 58,733 | $ | 14,861 | $ | 3,313,558 | ||||||||||||
| December 31, 2015 | ||||||||||||||||||||||||
| (in thousands) | Commercial and Industrial |
Commercial Real Estate |
Residential Real Estate |
Consumer and Other |
Covered Loans |
Total | ||||||||||||||||||
| Acquired loans: | ||||||||||||||||||||||||
| Individually evaluated for impairment | $ | 647 | $ | 5,226 | $ | 1,177 | $ | 0 | $ | 0 | $ | 7,050 | ||||||||||||
| Loans acquired with deteriorated credit quality | 567 | 9,335 | 3,801 | 0 | 12,804 | 26,507 | ||||||||||||||||||
| Collectively evaluated for impairment | 83,596 | 277,378 | 64,605 | 911 | 1,227 | 427,717 | ||||||||||||||||||
| Total | $ | 84,810 | $ | 291,939 | $ | 69,583 | $ | 911 | $ | 14,031 | $ | 461,274 | ||||||||||||
| December 31, 2014 | ||||||||||||||||||||||||
| (in thousands) | Commercial and Industrial |
Commercial Real Estate |
Residential Real Estate |
Consumer and Other |
Finance Leases |
Total | ||||||||||||||||||
| Originated loans and leases: | ||||||||||||||||||||||||
| Individually evaluated for impairment | $ | 1,283 | $ | 7,675 | $ | 1,408 | $ | 0 | $ | 0 | $ | 10,366 | ||||||||||||
| Collectively evaluated for impairment | 765,753 | 1,103,367 | 896,453 | 54,172 | 12,251 | 2,831,996 | ||||||||||||||||||
| Total | $ | 767,036 | $ | 1,111,042 | $ | 897,861 | $ | 54,172 | $ | 12,251 | $ | 2,842,362 | ||||||||||||
86
| December 31, 2014 | ||||||||||||||||||||||||
| (in thousands) | Commercial and Industrial |
Commercial Real Estate |
Residential Real Estate |
Consumer and Other |
Covered Loans |
Total | ||||||||||||||||||
| Acquired loans: | ||||||||||||||||||||||||
| Individually evaluated for impairment | $ | 628 | $ | 1,195 | $ | 440 | $ | 0 | $ | 0 | $ | 2,263 | ||||||||||||
| Loans acquired with deteriorated credit quality | 995 | 11,640 | 3,669 | 0 | 18,106 | 34,410 | ||||||||||||||||||
| Collectively evaluated for impairment | 95,411 | 334,741 | 84,181 | 1,095 | 1,213 | 516,641 | ||||||||||||||||||
| Total | $ | 97,034 | $ | 347,576 | $ | 88,290 | $ | 1,095 | $ | 19,319 | $ | 553,314 | ||||||||||||
A loan is impaired when, based on current information and events, it is probable that we will be unable to collect all amounts due according to the contractual terms of the loan agreement. Impaired loans consist of our non-homogenous nonaccrual loans, and all loans restructured in a troubled debt restructuring (TDR). Specific reserves on individually identified impaired loans that are not collateral dependent are measured based on the present value of expected future cash flows discounted at the original effective interest rate of each loan. For loans that are collateral dependent, impairment is measured based on the fair value of the collateral less estimated selling costs, and such impaired amounts are generally charged off. The majority of impaired loans are collateral dependent impaired loans that have limited exposure or require limited specific reserves because of the amount of collateral support with respect to these loans, and previous charge-offs. Interest payments on impaired loans are typically applied to principal unless collectability of the principal amount is reasonably assured. In these cases, interest is recognized on a cash basis. There was no interest income recognized on impaired loans and leases, collected in cash, for 2015, 2014 and 2013.
| 12/31/2015 | 12/31/2014 | |||||||||||||||||||||||
| (in thousands) | Recorded Investment |
Unpaid Principal Balance |
Related Allowance |
Recorded Investment |
Unpaid Principal Balance |
Related Allowance |
||||||||||||||||||
| Originated loans and leases with no related allowance | ||||||||||||||||||||||||
| Commercial and industrial | ||||||||||||||||||||||||
| Commercial and industrial other | $ | 1,206 | $ | 1,211 | $ | 0 | $ | 1,283 | $ | 1,307 | $ | 0 | ||||||||||||
| Commercial real estate | ||||||||||||||||||||||||
| Commercial real estate other | 5,049 | 5,249 | 0 | 6,021 | 6,628 | 0 | ||||||||||||||||||
| Residential real estate | ||||||||||||||||||||||||
| Home equity | 2,270 | 2,270 | 0 | 1,408 | 1,499 | 0 | ||||||||||||||||||
| Subtotal | $ | 8,525 | $ | 8,730 | $ | 0 | $ | 8,712 | $ | 9,434 | $ | 0 | ||||||||||||
| Originated loans and leases with related allowance | ||||||||||||||||||||||||
| Commercial real estate | ||||||||||||||||||||||||
| Commercial real estate other | 606 | 606 | 288 | 1,654 | 1,654 | 652 | ||||||||||||||||||
| Subtotal | $ | 606 | $ | 606 | $ | 288 | $ | 1,654 | $ | 1,654 | $ | 652 | ||||||||||||
| Total | $ | 9,131 | $ | 9,336 | $ | 288 | $ | 10,366 | $ | 11,088 | $ | 652 | ||||||||||||
87
| 12/31/2015 | 12/31/2014 | |||||||||||||||||||||||
| (in thousands) | Recorded Investment |
Unpaid Principal Balance |
Related Allowance |
Recorded Investment |
Unpaid Principal Balance |
Related Allowance |
||||||||||||||||||
| Acquired loans with no related allowance | ||||||||||||||||||||||||
| Commercial and industrial | ||||||||||||||||||||||||
| Commercial and industrial other | $ | 128 | $ | 128 | $ | 0 | $ | 64 | $ | 64 | $ | 0 | ||||||||||||
| Commercial real estate | ||||||||||||||||||||||||
| Construction | 359 | 359 | 0 | 0 | 0 | 0 | ||||||||||||||||||
| Commercial real estate other | 4,739 | 5,077 | 0 | 941 | 1,204 | 0 | ||||||||||||||||||
| Residential real estate | ||||||||||||||||||||||||
| Home equity | 1,177 | 1,177 | 0 | 440 | 440 | 0 | ||||||||||||||||||
| Subtotal | $ | 6,403 | $ | 6,741 | $ | 0 | $ | 1,445 | $ | 1,708 | $ | 0 | ||||||||||||
| Acquired loans with related allowance | ||||||||||||||||||||||||
| Commercial and industrial | ||||||||||||||||||||||||
| Commercial and industrial other | 519 | 519 | 433 | 564 | 564 | 414 | ||||||||||||||||||
| Commercial real estate | ||||||||||||||||||||||||
| Commercial real estate other | 128 | 128 | 128 | 254 | 254 | 100 | ||||||||||||||||||
| Subtotal | $ | 647 | $ | 647 | $ | 561 | $ | 818 | $ | 818 | $ | 514 | ||||||||||||
| Total | $ | 7,050 | $ | 7,388 | $ | 561 | $ | 2,263 | $ | 2,526 | $ | 514 | ||||||||||||
The average recorded investment and interest income recognized on impaired originated loans for the twelve months ended December 31, 2015, 2014 and 2013 was as follows:
| As of December 31, | ||||||||||||||||||||||||
| 2015 | 2014 | 2013 | ||||||||||||||||||||||
| (in thousands) | Average Recorded Investment |
Interest Income Recognized |
Average Recorded Investment |
Interest Income Recognized |
Average Recorded Investment |
Interest Income Recognized |
||||||||||||||||||
| Originated loans and leases with no related allowance | ||||||||||||||||||||||||
| Commercial and industrial | ||||||||||||||||||||||||
| Commercial and industrial other | $ | 1,293 | $ | 0 | $ | 2,366 | $ | 0 | $ | 4,918 | $ | 0 | ||||||||||||
| Commercial real estate | ||||||||||||||||||||||||
| Construction | 0 | 0 | 0 | 0 | 6,201 | 0 | ||||||||||||||||||
| Commercial real estate other | 7,490 | 0 | 8,078 | 0 | 10,775 | 0 | ||||||||||||||||||
| Residential real estate | ||||||||||||||||||||||||
| Home equity | 1,337 | 0 | 1,408 | 0 | 1,223 | 0 | ||||||||||||||||||
| Subtotal | $ | 10,120 | $ | 0 | $ | 11,852 | $ | 0 | $ | 23,117 | $ | 0 | ||||||||||||
| Originated loans and leases with related allowance | ||||||||||||||||||||||||
| Commercial real estate | ||||||||||||||||||||||||
| Commercial real estate other | 245 | 0 | 892 | 0 | 0 | 0 | ||||||||||||||||||
| Subtotal | $ | 245 | $ | 0 | $ | 892 | $ | 0 | $ | 0 | $ | 0 | ||||||||||||
| Total | $ | 10,365 | $ | 0 | $ | 12,744 | $ | 0 | $ | 23,117 | $ | 0 | ||||||||||||
88
The average recorded investment and interest income recognized on impaired acquired loans for the twelve months ended December 31, 2015, 2014 and 2013 was as follows:
| As of December 31, | ||||||||||||||||||||||||
| 2015 | 2014 | 2013 | ||||||||||||||||||||||
| (in thousands) | Average Recorded Investment |
Interest Income Recognized |
Average Recorded Investment |
Interest Income Recognized |
Average Recorded Investment |
Interest Income Recognized |
||||||||||||||||||
| Acquired loans with no related allowance | ||||||||||||||||||||||||
| Commercial and industrial | ||||||||||||||||||||||||
| Commercial and industrial other | $ | 748 | $ | 0 | $ | 252 | $ | 0 | $ | 1,042 | $ | 0 | ||||||||||||
| Commercial real estate | ||||||||||||||||||||||||
| Construction | 367 | 0 | 0 | 0 | 0 | 0 | ||||||||||||||||||
| Commercial real estate other | 3,936 | 0 | 1,147 | 0 | 3,999 | 102 | ||||||||||||||||||
| Residential real estate | ||||||||||||||||||||||||
| Home equity | 1,147 | 0 | 440 | 0 | 73 | 0 | ||||||||||||||||||
| Subtotal | $ | 6,198 | $ | 0 | $ | 1,839 | $ | 0 | $ | 5,114 | $ | 102 | ||||||||||||
| Acquired loans with related allowance | ||||||||||||||||||||||||
| Commercial and industrial | ||||||||||||||||||||||||
| Commercial and industrial other | 523 | 0 | 831 | 0 | 0 | 0 | ||||||||||||||||||
| Commercial real estate | ||||||||||||||||||||||||
| Commercial real estate other | 52 | 0 | 266 | 0 | 724 | 0 | ||||||||||||||||||
| Subtotal | $ | 575 | $ | 0 | $ | 1,097 | $ | 0 | $ | 724 | $ | 0 | ||||||||||||
| Total | $ | 6,773 | $ | 0 | $ | 2,936 | $ | 0 | $ | 5,838 | $ | 102 | ||||||||||||
The average recorded investment in impaired loans was $17.1 million and $15.7 million at December 31, 2015 and 2014, respectively.
Loans are considered modified in a TDR when, due to a borrower’s financial difficulties, the Company makes a concession(s) to the borrower that it would not otherwise consider. When modifications are provided for reasons other than as a result of the financial distress of the borrower, these loans are not classified as TDRs or impaired. These modifications primarily include, among others, an extension of the term of the loan, and granting a period when interest-only payments can be made, with the principal payments and interest caught up over the remaining term of the loan or at maturity, among others.
89
The following tables present loans by class modified in 2015 as troubled debt restructurings.
Troubled Debt Restructuring
| December 31, 2015 | Twelve months ended | |||||||||||||||||||
| Defaulted TDRs5 | ||||||||||||||||||||
| (in thousands) | Number of Loans |
Pre-Modification Outstanding Recorded Investment |
Post- Modification Outstanding Recorded Investment |
Number of Loans |
Post- Modification Outstanding Recorded Investment |
|||||||||||||||
| Commercial and industrial | ||||||||||||||||||||
| Commercial and industrial other1 | 5 | $ | 433 | $ | 433 | 2 | $ | 311 | ||||||||||||
| Commercial real estate | ||||||||||||||||||||
| Commercial real estate other2 | 3 | 2,552 | 2,552 | 0 | 0 | |||||||||||||||
| Residential real estate | ||||||||||||||||||||
| Home equity3 | 14 | 1,558 | 1,558 | 2 | 136 | |||||||||||||||
| Mortgages4 | 2 | 269 | 269 | 0 | 0 | |||||||||||||||
| Total | 24 | $ | 4,812 | $ | 4,812 | 4 | $ | 447 | ||||||||||||
| 1 | Represents the following concessions: extension of term (2 loans $319,000) and reduction of rate (3 loans $114,000). |
| 2 | Represents the following concessions: extension of term (1 loan $28,000) and reduction of rate (2 loans $2.5 million). |
| 3 | Represents the following concessions: extension of term (9 loans $630,000 million) and reduction of rate (5 loans $928,000). |
| 4 | Represents the following concessions: extension of term and reduction of rate (2 loans $269,000). |
| 5 | TDRs that defaulted during the 12 months ended December 31, 2015, that had been restructured in the prior twelve months. |
| December 31, 2014 | Twelve months ended | |||||||||||||||||||
| Defaulted TDRs3 | ||||||||||||||||||||
| (in thousands) | Number of Loans |
Pre-Modification Outstanding Recorded Investment |
Post- Modification Outstanding Recorded Investment |
Number of Loans |
Post- Modification Outstanding Recorded Investment |
|||||||||||||||
| Commercial and industrial | ||||||||||||||||||||
| Commercial and industrial other1 | 1 | $ | 86 | $ | 86 | 0 | $ | 0 | ||||||||||||
| Commercial real estate | ||||||||||||||||||||
| Commercial real estate other2 | 4 | 917 | 917 | 1 | 63 | |||||||||||||||
| Total | 5 | $ | 1,003 | $ | 1,003 | 1 | $ | 63 | ||||||||||||
| 1 | Represents the following concessions: extension of term and reduction in rate. |
| 2 | Represents the following concessions: extension of term and reduction in rate. |
| 3 | TDRs that defaulted during the 12 months ended December 31, 2014 that had been restructured in the prior twelve months. |
The Company recognized TDRs with a balance of $4.8 million during 2015, compared to $1.0 million in 2014. The Company is not committed to lend additional amounts as of December 31, 2015 to customers with outstanding loans that are classified as TDRs.
| 90 |
The following table presents credit quality indicators (internal risk grade) by class of commercial loans, commercial real estate loans and agricultural loans as of December 31, 2015 and 2014.
| December 31, 2015 | ||||||||||||||||||||||||
| (in thousands) | Commercial and Industrial Other | Commercial and Industrial Agriculture | Commercial Real Estate Other | Commercial Real Estate Agriculture | Commercial Real Estate Construction | Total | ||||||||||||||||||
| Originated loans and leases | ||||||||||||||||||||||||
| Internal risk grade: | ||||||||||||||||||||||||
| Pass | $ | 759,023 | $ | 87,488 | $ | 1,143,238 | $ | 86,445 | $ | 99,508 | $ | 2,175,702 | ||||||||||||
| Special Mention | 3,531 | 78 | 12,378 | 141 | 3,529 | 19,657 | ||||||||||||||||||
| Substandard | 5,470 | 733 | 11,634 | 349 | 0 | 18,186 | ||||||||||||||||||
| Total | $ | 768,024 | $ | 88,299 | $ | 1,167,250 | $ | 86,935 | $ | 103,037 | $ | 2,213,545 | ||||||||||||
| December 31, 2015 | ||||||||||||||||||||||||
| (in thousands) | Commercial and Industrial Other | Commercial and Industrial Agriculture | Commercial Real Estate Other | Commercial Real Estate Agriculture | Commercial Real Estate Construction | Total | ||||||||||||||||||
| Acquired loans | ||||||||||||||||||||||||
| Internal risk grade: | ||||||||||||||||||||||||
| Pass | $ | 82,662 | $ | 0 | $ | 271,584 | $ | 423 | $ | 4,533 | $ | 359,202 | ||||||||||||
| Special Mention | 0 | 0 | 540 | 0 | 0 | 540 | ||||||||||||||||||
| Substandard | 2,148 | 0 | 12,828 | 1,672 | 359 | 17,007 | ||||||||||||||||||
| Total | $ | 84,810 | $ | 0 | $ | 284,952 | $ | 2,095 | $ | 4,892 | $ | 376,749 | ||||||||||||
| December 31, 2014 | ||||||||||||||||||||||||
| (in thousands) | Commercial and Industrial Other | Commercial and Industrial Agriculture | Commercial Real Estate Other | Commercial Real Estate Agriculture | Commercial Real Estate Construction | Total | ||||||||||||||||||
| Originated loans and leases | ||||||||||||||||||||||||
| Internal risk grade: | ||||||||||||||||||||||||
| Pass | $ | 670,478 | $ | 78,250 | $ | 945,898 | $ | 58,455 | $ | 68,696 | $ | 1,821,777 | ||||||||||||
| Special Mention | 12,602 | 151 | 19,692 | 155 | 3,731 | 36,331 | ||||||||||||||||||
| Substandard | 5,449 | 106 | 14,031 | 384 | 0 | 19,970 | ||||||||||||||||||
| Total | $ | 688,529 | $ | 78,507 | $ | 979,621 | $ | 58,994 | $ | 72,427 | $ | 1,878,078 | ||||||||||||
| December 31, 2014 | ||||||||||||||||||||||||
| (in thousands) | Commercial and Industrial Other | Commercial and Industrial Agriculture | Commercial Real Estate Other | Commercial Real Estate Agriculture | Commercial Real Estate Construction | Total | ||||||||||||||||||
| Acquired loans | ||||||||||||||||||||||||
| Internal risk grade: | ||||||||||||||||||||||||
| Pass | $ | 94,054 | $ | 0 | $ | 288,193 | $ | 1,352 | $ | 33,686 | $ | 417,285 | ||||||||||||
| Special Mention | 83 | 0 | 5,675 | 0 | 0 | 5,758 | ||||||||||||||||||
| Substandard | 2,897 | 0 | 14,620 | 1,830 | 2,220 | 21,567 | ||||||||||||||||||
| Total | $ | 97,034 | $ | 0 | $ | 308,488 | $ | 3,182 | $ | 35,906 | $ | 444,610 | ||||||||||||
| 91 |
The following table presents credit quality indicators by class of residential real estate loans and by class of consumer loans as of December 31, 2015 and 2014. Nonperforming loans include nonaccrual, impaired and loans 90 days past due and accruing interest, all other loans are considered performing.
December 31, 2015
| (in thousands) | Residential Home Equity |
Residential Mortgages | Consumer Indirect |
Consumer Other |
Total | |||||||||||||||
| Originated loans and leases | ||||||||||||||||||||
| Performing | $ | 200,647 | $ | 817,952 | $ | 17,722 | $ | 40,829 | $ | 1,077,150 | ||||||||||
| Nonperforming | 1,931 | 5,889 | 107 | 75 | 8,002 | |||||||||||||||
| Total | $ | 202,578 | $ | 823,841 | $ | 17,829 | $ | 40,904 | $ | 1,085,152 | ||||||||||
| December 31, 2015 | ||||||||||||||||||||
| (in thousands) | Residential Home Equity |
Residential Mortgages | Consumer Indirect |
Consumer Other |
Total | |||||||||||||||
| Acquired Loans and Leases | ||||||||||||||||||||
| Performing | $ | 41,380 | $ | 26,102 | $ | 0 | $ | 911 | $ | 68,393 | ||||||||||
| Nonperforming | 712 | 1,389 | 0 | 0 | 2,101 | |||||||||||||||
| Total | $ | 42,092 | $ | 27,491 | $ | 0 | $ | 911 | $ | 70,494 | ||||||||||
| December 31, 2014 | ||||||||||||||||||||
| (in thousands) | Residential Home Equity |
Residential Mortgages | Consumer Indirect |
Consumer Other |
Total | |||||||||||||||
| Originated loans and leases | ||||||||||||||||||||
| Performing | $ | 185,619 | $ | 704,663 | $ | 18,197 | $ | 35,626 | $ | 944,105 | ||||||||||
| Nonperforming | 1,338 | 6,241 | 101 | 248 | 7,928 | |||||||||||||||
| Total | $ | 186,957 | $ | 710,904 | $ | 18,298 | $ | 35,874 | $ | 952,033 | ||||||||||
December 31, 2014
| (in thousands) | Residential Home Equity |
Residential Mortgages | Consumer Indirect |
Consumer Other |
Total | |||||||||||||||
| Acquired loans | ||||||||||||||||||||
| Performing | $ | 55,416 | $ | 31,304 | $ | 0 | $ | 1,095 | $ | 87,815 | ||||||||||
| Nonperforming | 592 | 978 | 0 | 0 | 1,570 | |||||||||||||||
| Total | $ | 56,008 | $ | 32,282 | $ | 0 | $ | 1,095 | $ | 89,385 | ||||||||||
Note 5 FDIC Indemnification Asset Related to Covered Loans
Certain loans acquired in the VIST Financial acquisition were covered loans with loss share agreements with the FDIC. Covered loans totaled $14.0 million in 2015 and $19.3 million in 2014. Under the terms of loss sharing agreements, the FDIC will reimburse the Company for 70 percent of net losses on covered single family assets incurred up to $4.0 million, and 70 percent of net losses on covered commercial assets incurred up to $12.0 million. The FDIC will increase its reimbursement of net losses to 80 percent if net losses exceed the $4.0 million and $12 million thresholds, respectively. The term for loss sharing on residential real estate loans is ten years, while the term for loss sharing on non-residential real estate loans is five years in respect to losses and eight years in respect to loss recoveries.
The receivable arising from the loss sharing agreements (referred to as the “FDIC indemnification asset” on our consolidated statements of financial condition) is measured separately from covered loans because the agreements are not contractually part of the covered loans and are not transferable should the Company choose to dispose of the covered loans. As of the acquisition date with VIST Financial, the Company recorded an aggregate FDIC indemnification asset of $4.4 million, consisting of the present value of the expected future cash flows the Company expected to receive from the FDIC under loss sharing agreements. The FDIC indemnification asset is reduced as loss sharing payments are received from the FDIC for losses realized on covered loans. Actual or expected losses in excess of the acquisition date estimates will result in an increase in the FDIC indemnification asset and the immediate recognition of non-interest income in our financial statements.
| 92 |
The FDIC indemnification asset totaled $158,000 at December 31, 2015, $1.9 million at December 31, 2014, and $4.8 million at December 31, 2013.
A decrease in expected losses would generally result in a corresponding decline in the FDIC indemnification asset and the non-accretable difference. Reductions in the FDIC indemnification asset due to actual or expected losses that are less than the acquisition date estimates are recognized prospectively over the shorter of (i) the estimated life of the applicable covered loans or (ii) the term of the loss sharing agreements with the FDIC.
Changes in the FDIC indemnification asset for the period ending December 31, 2015 are shown below.
| December 31, 2015 | ||||
| (in thousands) | ||||
| Balance at January 1, 2015 | $ | 1,903 | ||
| Prospective adjustment for additional cash flows | (585 | ) | ||
| Increase due to impairment on covered loans | 0 | |||
| Reimbursements from the FDIC | (1,160 | ) | ||
| Balance at December 31, 2015 | $ | 158 |
Note 6 Goodwill and Other Intangible Assets
| (in thousands) | Banking | Insurance | Wealth Management | Total | ||||||||||||
| Balance at January 1, 2014 | $ | 64,369 | 19,560 | 8,211 | 92,140 | |||||||||||
| Acquisitions | 0 | 103 | 0 | 103 | ||||||||||||
| Balance at December 31, 2014 | 64,369 | 19,663 | 8,211 | 92,243 | ||||||||||||
| Goodwill related to sale of portion of business unit1 | 0 | (451 | ) | 0 | (451 | ) | ||||||||||
| Balance at December 31, 2015 | $ | 64,369 | $ | 19,212 | $ | 8,211 | $ | 91,792 | ||||||||
1 The $451,000 reduction of goodwill in 2015 reflects an adjustment related to the sale of a certain insurance customer relationships. In 2015 Tompkins Insurance sold a portion of its personal lines insurance revenues, which were acquired in a previous acquisition, to a third party.
Goodwill is assigned to reporting units. The Company reviews its goodwill and intangible assets annually, or more frequently if an event occurs or circumstances change that would more likely than not reduce the fair value of a reporting unit below its carrying value. Based on the Company’s 2015 review, there was no impairment of its goodwill or intangible assets. The Company’s impairment testing is highly sensitive to certain assumptions and estimates used. In the event that economic or credit conditions deteriorate significantly, additional interim impairment tests may be required.
| Other Intangible Assets | ||||||||||||
| The following table provides information regarding our amortizing intangible assets | ||||||||||||
| December 31, 2015 | Gross Carrying | Accumulated | Net Carrying | |||||||||
| (in thousands) | Amount | Amortization | Amount | |||||||||
| Amortized intangible assets: | ||||||||||||
| Core deposit intangible | $ | 18,774 | $ | 11,873 | $ | 6,901 | ||||||
| Customer relationships | 8,165 | 4,065 | 4,100 | |||||||||
| Other intangibles | 5,356 | 3,909 | 1,447 | |||||||||
| Total intangible assets | $ | 32,295 | $ | 19,847 | $ | 12,448 | ||||||
| December 31, 2014 | Gross Carrying | Accumulated | Net Carrying | |||||||||
| (in thousands) | Amount | Amortization | Amount | |||||||||
| Amortized intangible assets: | ||||||||||||
| Core deposit intangible | $ | 18,774 | $ | 10,538 | $ | 8,236 | ||||||
| Customer relationships | 8,252 | 3,423 | 4,829 | |||||||||
| Other intangibles | 5,310 | 3,726 | 1,584 | |||||||||
| Total intangible assets | $ | 32,336 | $ | 17,687 | $ | 14,649 | ||||||
| 93 |
Amortization expense related to intangible assets totaled $2.0 million in 2015, $2.1 million in 2014 and $2.2 million in 2013. The estimated aggregate future amortization expense for intangible assets remaining as of December 31, 2015 is as follows:
| Estimated amortization expense:* | ||||
| (in thousands) | ||||
| For the year ended December 31, 2016 | $ | 1,913 | ||
| For the year ended December 31, 2017 | 1,797 | |||
| For the year ended December 31, 2018 | 1,643 | |||
| For the year ended December 31, 2019 | 1,523 | |||
| For the year ended December 31, 2020 | 1,416 | |||
| *Excludes the amortization of mortgage servicing rights. Amortization of mortgage servicing rights was $146,000 in 2015, $149,000 in 2014 and $232,000 in 2013. |
| Note 7 Premises and Equipment | ||||||||
| Premises and equipment at December 31 were as follows: | ||||||||
| (in thousands) | 2015 | 2014 | ||||||
| Land | $ | 9,364 | $ | 9,402 | ||||
| Premises and equipment | 68,876 | 67,658 | ||||||
| Furniture, fixtures, and equipment | 56,743 | 52,338 | ||||||
| Accumulated depreciations and amortization | (74,652 | ) | (69,598 | ) | ||||
| Total | $ | 60,331 | $ | 59,800 | ||||
| Depreciation and amortization expenses in 2015, 2014 and 2013 are included in operating expenses as follows: | ||||||||||||
| (in thousands) | 2015 | 2014 | 2013 | |||||||||
| Premises | $ | 2,030 | $ | 1,949 | $ | 1,875 | ||||||
| Furniture, fixtures, and equipment | 3,730 | 3,066 | 3,044 | |||||||||
| Total | $ | 5,760 | $ | 5,015 | $ | 4,919 | ||||||
| The following is a summary of the future minimum lease payments under non-cancelable operating leases as of December 31, 2015: |
| (in thousands) | ||||||
| 2016 | $ | 4,661 | ||||
| 2017 | 3,921 | |||||
| 2018 | 3,669 | |||||
| 2019 | 3,547 | |||||
| 2020 | 2,900 | |||||
| Thereafter | 16,406 | |||||
| Total | $ | 35,104 | ||||
The Company leases land, buildings and equipment under operating lease arrangements extending to the year 2090. Total gross rental expense amounted to $4.9 million in 2015, $4.8 million in 2014, and $4.8 million in 2013. Most leases include options to renew for periods ranging from 5 to 20 years. Options to renew are not included in the above future minimum rental commitments.
| 94 |
Note 8 Deposits
Aggregate time deposits of $250,000 or more were $397.8 million at December 31, 2015, and $415.8 million at December 31, 2014. Scheduled maturities of time deposits at December 31, 2015, were as follows:
| (in thousands) | Less than $250,000 | $250,000 and over |
Total | |||||||
| Maturity | ||||||||||
| Three months or less | $ | 100,983 | $ | 166,730 | $ | 267,713 | ||||
| Over three through six months | 81,971 | 64,501 | 146,472 | |||||||
| Over six through twelve months | 125,648 | 72,701 | 198,349 | |||||||
| Total due in 2016 | $ | 308,602 | $ | 303,932 | $ | 612,534 | ||||
| 2017 | 84,871 | 47,754 | 132,625 | |||||||
| 2018 | 32,219 | 29,029 | 61,248 | |||||||
| 2019 | 14,677 | 7,670 | 22,347 | |||||||
| 2020 | 10,609 | 5,733 | 16,342 | |||||||
| 2021 and thereafter | 6,383 | 3,654 | 10,037 | |||||||
| Total | $ | 457,361 | $ | 397,772 | $ | 855,133 | ||||
Note 9 Federal Funds Purchased and Securities Sold Under Agreements to Repurchase
Information regarding securities sold under agreements to repurchase and Federal funds purchased is detailed in the following tables for the years ended December 31:
| Securities Sold Under Agreements to Repurchase | 2015 | 2014 | 2013 | |||||||
| (dollar amounts in thousands) | ||||||||||
| Total outstanding at December 31 | $ | 136,513 | $ | 147,037 | $ | 167,724 | ||||
| Maximum month-end balance | 146,397 | 160,295 | 201,933 | |||||||
| Average balance during the year | 137,917 | 145,876 | 177,779 | |||||||
| Weighted average rate at December 31 | 1.90 | % | 1.83 | % | 1.97 | % | ||||
| Average interest rate paid during the year | 1.96 | % | 2.02 | % | 2.11 | % | ||||
| Federal Funds Purchased | ||||||||||
| Average balance during the year | 0 | 0 | 5 | |||||||
| Weighted average rate at December 31 | N/A | N/A | N/A | |||||||
| Average interest rate paid during the year | 0.00 | % | 0.00 | % | 0.75 | % | ||||
Securities sold under agreements to repurchase (“repurchase agreements”) are secured borrowings that typically mature within thirty to ninety days, although the Company has entered into repurchase agreements with the Federal Home Loan Bank (“FHLB”) with maturities that extend through 2017. The Company uses both retail and wholesale repurchase agreements. Retail repurchase agreements are arrangements with local customers of the Company, in which the Company agrees to sell securities to the customer with an agreement to repurchase those securities at a specified later date. Retail repurchase agreements totaled $66.3 million at December 31, 2015. At December 31, 2015, the Company had $70.2 million in wholesale repurchase agreements. Of this $70.2 million in wholesale repurchase agreements, $55.0 million were with the Federal Home Loan Bank of New York and $15.2 million were with one large financial institution. The $70.2 million of wholesale repurchase agreements mature as follows: $60.2 million in 2016 and $10.0 million in 2017.
Securities sold under agreements to repurchase are stated at the amount of cash received in connection with the transaction. The Company may be required to provide additional collateral based on the fair value of the underlying securities.
Federal funds purchased are short-term borrowings that typically mature within one to ninety days.
95
Note 10 Other Borrowings
The following table summarized the Company’s borrowings as of December 31:
| (in thousands) | 2015 | 2014 | ||||||
| Overnight FHLB advances | $ | 272,199 | $ | 232,080 | ||||
| Term FHLB advances | 250,576 | 110,961 | ||||||
| Other | 13,510 | 13,500 | ||||||
| Total other borrowings | $ | 536,285 | $ | 356,541 | ||||
The Company, through its subsidiary banks, had available line-of-credit agreements with correspondent banks permitting borrowings to a maximum of approximately $58.0 million at December 31, 2015 and 2014. There were no outstanding advances against those lines at December 31, 2015 and December 31, 2014.
Through its subsidiary banks, the Company has borrowing relationships with the FHLB, which provides secured borrowing capacity, subject to available collateral. At December 31, 2015 and 2014, the unused borrowing capacity on established lines with the FHLB was $1.1 billion.
As members of the FHLB, the Company’s subsidiary banks can use certain unencumbered residential and commercial real estate related assets and investment securities to secure borrowings from the FHLB. At December 31, 2015, total unencumbered residential and commercial real estate related loans and investment securities pledged at the FHLB were $521.5 million. At December 31, 2015, there were $272.2 million in overnight advances and $250.0 million in term advances with the FHLB, with a weighted average rate of 0.97%, compared to $232.1 million in overnight advances and $111.0 million in term advances at December 31, 2014, with a weighted average rate of 1.11%. At December 31, 2015, the term advances with the FHLB include $170.0 million which mature within one year and $80.0 million which mature over one year. Maturities of advances due over one year include $60.0 million in 2017, $10.0 million in 2018 and $10.0 million in 2019.
The Company’s FHLB borrowings at December 31, 2015 included $30.0 million, at cost, in fixed-rate callable borrowings, which can be called by the FHLB if certain conditions are met. Additional details on the fixed-rate callable advances are provided in the following table.
| Current Balance | Rate | Maturity Date | Call Date | Call Frequency | Call Features | |||||||
| 5,000,000 | 4.41% | March 29, 2017 | March 31, 2016 | Quarterly | LIBOR strike 6.0% | |||||||
| 5,000,000 | 4.89% | May 22, 2017 | February 22, 2016 | Quarterly | LIBOR strike 7.0% | |||||||
| 10,000,000 | 5.14% | June 8, 2017 | March 9, 2016 | Quarterly | LIBOR strike 7.0% | |||||||
| 10,000,000 | 5.19% | June 8, 2017 | March 9, 2016 | Quarterly | FHLB Option | |||||||
| Total | $30,000,000 |
Other borrowings included a term borrowing with a bank totaling $13.5 million at December 31, 2015 and 2014.
The Company elected to apply the fair value option for a $10.0 million, 10-year fixed convertible FLHB advance at 5.183%, convertible at the end of 3 years with a maturity of June 28, 2017. The $10.0 million advance identified for fair value was selected because its duration was similar to the durations of trading securities. As of December 31, 2015, the aggregate fair value of the $10.0 million FHLB advance was approximately $10.6 million. For the twelve months ended December 31, 2015, the fair value of this advance decreased by $0.4 million. The change in fair value is included on the Company’s Consolidated Statements of Income in “Mark-to-Market Gain (Loss) on Liabilities Held at Fair Value.”
96
Note 11 Trust Preferred Debentures
The Company has four unconsolidated subsidiary trusts (“the Trusts”): Tompkins Capital Trust I, Sleepy Hollow Capital Trust I, Leesport Capital Trust II, and Madison Statutory Trust I. The latter two were acquired in the acquisition of VIST Financial, while Sleepy Hollow Capital Trust I was acquired in a previous acquisition. The Company owns 100% of the common equity of each Trust. The Trusts were formed for the purpose of issuing Company-obligated mandatorily redeemable capital securities to third-party investors and investing the proceeds from the sale in junior subordinated debt securities (subordinated debt) issued by the Company, which are the sole assets of each Trust. Since third-party investors are the primary beneficiaries, the Trusts are not consolidated in the Company’s financial statements. Distributions on the preferred securities issued by the Trusts are payable quarterly at a rate per annum equal to the interest rate being earned by the Trusts on the debenture held by the Trusts and are recorded as interest expense in the consolidated financial statements.
The preferred securities are subject to mandatory redemption, in whole or in part, upon repayment of the subordinated debt. The subordinated debt, net of the Company’s investment in the Trusts, qualifies as Tier 1 capital under the Board of Governors of the Federal Reserve System (FRB) guidelines. The Company has entered into agreements which, when taken collectively, fully and unconditionally guarantee the obligations under the preferred securities subject to the terms of each of the guarantees.
The following table provides information relating to the Trusts as of December 31, 2015:
| Description | Issuance Date | Par Amount | Interest Rate | Maturity Date | ||
| Tompkins Capital Trust I | April 2009 | $ | 20.5 million | 7% fixed | April 2039 | |
| Sleepy Hollow Capital Trust I | August 2003 | $ | 4.0 million | 3-month LIBOR plus 3.05% | August 2033 | |
| Leesport Capital Trust II | September 2002 | $ | 10.0 million | 3-month LIBOR plus 3.45% | September 2032 | |
| Madison Statutory Trust I | June 2003 | $ | 5.0 million | 3-month LIBOR plus 3.10% | June 2033 | |
Tompkins Capital Trust I
In 2009, the Company issued $20.5 million aggregate liquidation amount of 7.0% cumulative trust preferred securities through a newly-formed subsidiary, Tompkins Capital Trust I, a Delaware statutory trust, whose common stock is 100% owned by the Company. The Trust Preferred Securities were offered and sold in reliance upon the exemption from registration provided by Rule 506 of Regulation D of the Securities Act of 1933, as amended (the “Securities Act”). The proceeds from the issuance of the Trust Preferred Securities, together with the Company’s capital contribution of $636,000 to the trust, were used to acquire the Company’s Subordinated Debentures that are due concurrently with the Trust Preferred Securities. The net proceeds of the offering are being used to support business growth and for general corporate purposes.
The Trust Preferred Securities and the Company’s debentures are dated April 10, 2009, have a 30 year maturity, and carry a fixed rate of interest of 7.0%. The Trust Preferred Securities have a liquidation amount of $1,000 per security. The Company has retained the right to redeem the Trust Preferred Securities at par (plus accrued but unpaid interest) at a date which is no earlier than 5 years from the date of issuance. Commencing in 2019, and during specified annual windows thereafter, holders may convert the Trust Preferred Securities into shares of the Company’s common stock at a conversion price equal to the greater of (i) $41.35, or (ii) the average closing price of the Company’s common stock during the first three months of the year in which the conversion will be completed.
The Company has guaranteed the distributions with respect to, and amounts payable upon liquidation or redemption of, the Trust Preferred Securities on a subordinated basis as and to the extent set forth in the Preferred Securities Guarantee Agreement entered into on April 10, 2009, between the Company and Wilmington Trust Company, as Preferred Guarantee Trustee.
Sleepy Hollow Capital Trust I
In August 2003, Sleepy Hollow Capital Trust I issued $4.0 million of floating rate (three-month LIBOR plus 305 basis points) trust preferred securities, which represent beneficial interests in the assets of the trust. The trust preferred securities will mature on August 30, 2033. Distributions on the trust preferred securities are payable quarterly in arrears on March 31, June 30, September 30 and December 31 of each year. Sleepy Hollow Capital Trust I also issued $0.1 million of common equity securities to the Company. The proceeds of the offering were used to acquire the Company’s Subordinated Debentures that are due concurrently with the Trust Preferred Securities.
97
Leesport Capital Trust II
Leesport Capital Trust II, a Delaware statutory business trust, was formed on September 26, 2002 and issued $10.0 million of mandatory redeemable capital securities carrying a floating interest rate of three month LIBOR plus 3.45%. These debentures are the sole assets of the Trust. The terms of the junior subordinated debentures are the same as the terms of the capital securities. The obligations under the debentures constitute a full and unconditional guarantee by VIST Financial of the obligations of the Trust under the capital securities. These securities must be redeemed in September 2032, but may be redeemed at anytime. The Company assumed the rights and obligations of VIST Financial pertaining to the Leesport Capital Trust II through the Company’s acquisition of VIST Financial in August 2012.
Madison Statutory Trust I
Madison Statutory Trust, a Connecticut statutory business trust, was formed on June 26, 2003 and issued $5.0 million of mandatory redeemable capital securities carrying a floating interest rate of three month LIBOR plus 3.10%. These debentures are the sole assets of the Trust. The terms of the junior subordinated debentures are the same as the terms of the capital securities. The obligations under the debentures constitute a full and unconditional guarantee by VIST Financial of the obligations of the Trust under the capital securities. These securities must be redeemed in June 2033, but may be redeemed at any time. The Company assumed the rights and obligations of VIST Financial pertaining to the Madison Statutory Trust I through the Company’s acquisition of VIST Financial in August 2012.
Note 12 Employee Benefit Plans
The Company maintains two noncontributory defined-benefit plans and two non-contributory defined-contribution retirement plans which cover substantially all employees of the Company.
The benefits under the noncontributory defined-benefit plans (the “DB Pension Plans”) are based on years of service and percentages of the employees’ average final compensation. Assets of the Company’s DB Pension Plans are invested in common and preferred stock, U. S. Government securities, corporate bonds and notes, and mutual funds. At December 31, 2015 and 2014, the plan assets included 42,192 shares of Tompkins’ common stock that had a fair value of $2.4 million and $2.3 million, respectively.
Effective January 1, 2010, the Company stopped admitting new employees to its noncontributory DB Pension Plan. As a result, the defined contribution plan (“DC Retirement Plan”) was created for employees hired on or after January 1, 2010 who had reached the age of 21 and completed one year of service. For participants in the DC Retirement Plan, the Company makes contributions to an account set up in the participant’s name. The amount equals a percentage of base pay and varies based on the participant’s age plus service as of the previous January 1st. The DC Retirement Plan offers the participant a wide range of investment alternatives from which to choose. Expenses related to the DC Retirement Plan totaled $2.4 million in 2015, $1.4 million in 2014 and $850,000 in 2013.
Effective July 31, 2015, the DB Pension Plan that had been accruing benefits was frozen. As a result, participants no longer accrued additional benefits in this Plan as of this date. Effective August 1, 2015, all active participants of the two DB Pension Plans began participation in a new defined contribution plan (the “2015 DC Retirement Plan”). Similar to the DC Retirement Plan, the 2015 DC Retirement Plan provides Company contributions to an account set up in the participant’s name, and those contributions are based on the participant’s compensation, age and service. The first contribution for this 2015 DC Retirement Plan will be made in March 2016.
The Company maintains supplemental employee retirement plans (the “SERP”) for certain executives. All benefits provided under the SERP are unfunded and the Company makes payments to plan participants.
The Company also maintains a post-retirement life and healthcare benefit plan (the “Life and Healthcare Plan”), which was amended in 2005. For employees commencing employment after January 1, 2005, the Company does not contribute towards post retirement Healthcare benefits. Retirees and employees who were eligible to retire when the Life and Healthcare Plan was amended were unaffected. Generally, all other employees were eligible for Health Reimbursement Accounts (“HRA”) with an initial balance equal to the amount of the Company’s estimated then current liability. Contributions to the plan are limited to an annual contribution of 4% of the total HRA balances. Employees, upon retirement, will be able to utilize their HRA for qualified health costs and deductibles.
98
The Company engages independent, external actuaries to compute the amounts of liabilities and expenses relating to these plans, subject to the assumptions that the Company selects. The benefit obligation for these plans represents the liability of the Company for current and former employees, and is affected primarily by the following: service cost (benefits attributed to employee service during the period); interest cost (interest on the liability due to the passage of time); actuarial gains/losses (experience during the year different from that assumed and changes in plan assumptions); and benefits paid to participants.
The following table sets forth the changes in the projected benefit obligation for the DB Pension Plans and SERP and the accumulated post-retirement benefit obligation for the Life and Healthcare Plan; and the respective plan assets, and the plans’ funded status and amounts recognized in the Company’s Consolidated Statements of Condition at December 31, 2015 and 2014 (the measurement dates of the plans).
| (in thousands) | DB Pension Plans | Life and Healthcare Plan | SERP Plan | ||||||||||||||||
| 2015 | 2014 | 2015 | 2014 | 2015 | 2014 | ||||||||||||||
| Change in benefit obligation: | |||||||||||||||||||
| Benefit obligation at beginning of year | $ | 79,138 | $ | 65,621 | $ | 8,927 | $ | 8,448 | $ | 22,862 | $ | 17,282 | |||||||
| Service cost | 1,587 | 2,434 | 236 | 202 | 201 | 222 | |||||||||||||
| Interest cost | 2,987 | 3,069 | 323 | 367 | 928 | 865 | |||||||||||||
| Plan participants’ contributions | 0 | 0 | 202 | 210 | 0 | 0 | |||||||||||||
| Amendments | 0 | (6,282 | ) | 0 | 0 | 0 | 0 | ||||||||||||
| Curtailments | (677 | ) | 0 | 0 | 0 | 0 | 0 | ||||||||||||
| Actuarial loss (gain) | (4,224 | ) | 16,761 | (467 | ) | 192 | (1,210 | ) | 4,992 | ||||||||||
| Benefits paid | (2,592 | ) | (2,465 | ) | (489 | ) | (492 | ) | (621 | ) | (499 | ) | |||||||
| Benefit obligation at end of year | $ | 76,219 | $ | 79,138 | $ | 8,732 | $ | 8,927 | $ | 22,160 | $ | 22,862 | |||||||
| Change in plan assets: | |||||||||||||||||||
| Fair value of plan assets at beginning | |||||||||||||||||||
| of year | $ | 71,227 | $ | 70,933 | $ | 0 | $ | 0 | $ | 0 | $ | 0 | |||||||
| Actual return on plan assets | 296 | 2,759 | 0 | 0 | 0 | 0 | |||||||||||||
| Plan participants’ contributions | 0 | 0 | 202 | 210 | 0 | 0 | |||||||||||||
| Employer contributions | 0 | 0 | 287 | 282 | 621 | 499 | |||||||||||||
| Benefits paid | (2,592 | ) | (2,465 | ) | (489 | ) | (492 | ) | (621 | ) | (499 | ) | |||||||
| Fair value of plan assets at end of year | $ | 68,931 | $ | 71,227 | $ | 0 | $ | 0 | $ | 0 | $ | 0 | |||||||
| Unfunded status | $ | (7,288 | ) | $ | (7,911 | ) | $ | (8,732 | ) | $ | (8,927 | ) | $ | (22,160 | ) | $ | (22,862 | ) | |
The accumulated benefit obligation for the DB Pension Plans for 2015 and 2014 was $76.2 million and $79.1 million, respectively. The accumulated benefit obligation for the Life and Healthcare plan for 2015 and 2014 was $8.7 million and $8.9 million, respectively. The accumulated benefit obligation for the SERP for 2015 and 2014 was $22.2 million and $22.9 million, respectively. The unfunded status of the DB Pension plan has been recognized in other liabilities in the Consolidated Statement of Condition at December 31, 2015 in the amount of $7.3 million. The unfunded status of the Life and Healthcare and SERP plans has been recognized in other liabilities in the Consolidated Statement of Condition at December 31, 2015, in the amounts of $8.7 million, and $22.2 million, respectively. The unfunded status of the DB Pension plans in the amount of $7.9 million has been recognized in other liabilities in the Consolidated Statement of Condition at December 31, 2014. The unfunded status of the Life and Healthcare and SERP plans has been recognized in other liabilities in the Consolidated Statement of Condition at December 31, 2014, in the amounts of $8.9 million, and $22.9 million, respectively.
There was an amendment entry for the DB Pension Plans during 2014. This represents the installation of a lump sum benefit option to the Retirement Plan.
There was a curtailment entry for the DB Pension Plans during 2015. This represents the Retirement Plan freeze effective July 31, 2015.
99
Net periodic benefit cost and other comprehensive income includes the following components:
| (in thousands) | DB Pension Plans |
Life and Healthcare Plan |
SERP Plan |
|||||||||||||||||||||||||||||||||
| Components of net periodic benefit cost | 2015 | 2014 | 2013 | 2015 | 2014 | 2013 | 2015 | 2014 | 2013 | |||||||||||||||||||||||||||
| Service cost | $ | 1,587 | $ | 2,434 | $ | 2,915 | $ | 236 | $ | 201 | $ | 265 | $ | 201 | $ | 222 | $ | 479 | ||||||||||||||||||
| Interest cost | 2,987 | 3,069 | 2,688 | 323 | 367 | 345 | 928 | 866 | 737 | |||||||||||||||||||||||||||
| Expected return on plan assets | (5,028 | ) | (5,024 | ) | (4,009 | ) | 0 | 0 | 0 | 0 | 0 | 0 | ||||||||||||||||||||||||
| Amortization of prior service (credit) cost | (448 | ) | (123 | ) | (123 | ) | 16 | 16 | 16 | 73 | 112 | 166 | ||||||||||||||||||||||||
| Recognized net actuarial loss | 1,573 | 859 | 2,023 | 19 | 0 | 96 | 626 | 206 | 460 | |||||||||||||||||||||||||||
| Recognized net actuarial gain due to curtailments | (6,003 | ) | 0 | 0 | 0 | 0 | 0 | 0 | 0 | 0 | ||||||||||||||||||||||||||
| Amortization of transition liability | 0 | 0 | 0 | 0 | 0 | 50 | 0 | 0 | 0 | |||||||||||||||||||||||||||
| Net periodic benefit (credit) cost | $ | (5,332 | ) | $ | 1,215 | $ | 3,494 | $ | 594 | $ | 584 | $ | 772 | $ | 1,828 | $ | 1,406 | $ | 1,842 | |||||||||||||||||
| Other changes in plan assets and benefit obligations recognized in other comprehensive income | ||||||||||||||||||||||||||||||||||||
| Net actuarial loss (gain) | $ | (169 | ) | $ | 19,027 | $ | (12,890 | ) | $ | (467 | ) | $ | 192 | $ | (1,169 | ) | $ | (1,210 | ) | $ | 4,992 | $ | (2,754 | ) | ||||||||||||
| Recognized actuarial loss | (1,573 | ) | (859 | ) | (2,023 | ) | (19 | ) | 0 | (96 | ) | (626 | ) | (206 | ) | (460 | ) | |||||||||||||||||||
| Prior service credit | 0 | (6,282 | ) | 0 | 0 | 0 | 0 | 0 | 0 | 0 | ||||||||||||||||||||||||||
| Recognized prior service cost (credit) | 6,451 | 123 | 123 | (16 | ) | (16 | ) | (16 | ) | (73 | ) | (112 | ) | (166 | ) | |||||||||||||||||||||
| Recognized net initial obligation | 0 | 0 | 0 | 0 | 0 | (50 | ) | 0 | 0 | 0 | ||||||||||||||||||||||||||
| Recognized in other comprehensive income | $ | 4,709 | $ | 12,009 | $ | (14,790 | ) | $ | (502 | ) | $ | 176 | $ | (1,331 | ) | $ | (1,909 | ) | $ | 4,674 | $ | (3,380 | ) | |||||||||||||
| Total recognized in net periodic benefit cost and other comprehensive income | $ | (623 | ) | $ | 13,224 | $ | (11,296 | ) | $ | 92 | $ | 760 | $ | (559 | ) | $ | (81 | ) | $ | 6,080 | $ | (1,538 | ) | |||||||||||||
Pre-tax amounts recognized as a component of accumulated other comprehensive income as of year-end that have not been recognized as a component of the Company’s combined net periodic benefit cost of the Company’s defined-benefit pension plan, post-retirement healthcare benefit plan and SERP are presented in the following table.
| (in thousands) | DB Pension Plans |
Life and Healthcare Plan |
SERP Plan |
|||||||||||||||||||||||||||||||||
| 2015 | 2014 | 2013 | 2015 | 2014 | 2013 | 2015 | 2014 | 2013 | ||||||||||||||||||||||||||||
| Net actuarial loss (gain) | $ | 38,695 | $ | 40,437 | $ | 22,269 | $ | 889 | $ | 1,375 | $ | 1,183 | $ | 6,739 | $ | 8,575 | $ | 3,789 | ||||||||||||||||||
| Prior service cost (credit) | (55 | ) | (6,506 | ) | (347 | ) | 250 | 266 | 281 | 576 | 648 | 760 | ||||||||||||||||||||||||
| Total | $ | 38,640 | $ | 33,931 | 21,922 | $ | 1,139 | $ | 1,641 | $ | 1,464 | $ | 7,315 | $ | 9,223 | $ | 4,549 | |||||||||||||||||||
The pre-tax amounts included in accumulated other comprehensive income that are expected to be recognized in net periodic pension cost during the fiscal year ended December 31, 2016 are shown below.
| (in thousands) | Pension Plans | Life and Healthcare Plan |
SERP Plan | |||||||||
| Actuarial loss | $ | 944 | $ | 1 | $ | 412 | ||||||
| Prior service cost | (15 | ) | 16 | 73 | ||||||||
| Total | $ | 929 | $ | 17 | $ | 485 | ||||||
| 100 |
Weighted-average assumptions used in accounting for the plans were as follows:
| (in thousands) |
DB Pension Plans |
Life and Healthcare Plan |
SERP Plan |
|||||||||||||||||||||||||||||||||
| 2015 | 2014 | 2013 | 2015 | 2014 | 2013 | 2015 | 2014 | 2013 | ||||||||||||||||||||||||||||
| Discount Rates | ||||||||||||||||||||||||||||||||||||
| Benefit Cost for Plan Year | 3.81 | % | 4.76 | % | 3.85 | % | 3.80 | % | 4.70 | % | 3.80 | % | 4.00 | % | 5.00 | % | 4.20 | % | ||||||||||||||||||
| Benefit Obligation at End of Plan Year | 4.05 | % | 3.81 | % | 4.76 | % | 4.14 | % | 3.80 | % | 4.70 | % | 4.32 | % | 4.00 | % | 5.00 | % | ||||||||||||||||||
| Expected long-term return on plan assets | 7.25 | % | 7.25 | % | 7.25 | % | N/A | N/A | N/A | N/A | N/A | N/A | ||||||||||||||||||||||||
| Rate of compensation increase | ||||||||||||||||||||||||||||||||||||
| Benefit Cost for Plan Year | 5.00 | % | 5.00 | % | 5.00 | % | 5.00 | % | 5.00 | % | 5.00 | % | 5.00 | % | 5.00 | % | 5.00 | % | ||||||||||||||||||
| Benefit Obligation at End of Plan Year | 5.00 | % | 5.00 | % | 5.00 | % | 5.00 | % | 5.00 | % | 5.00 | % | 5.00 | % | 5.00 | % | 5.00 | % | ||||||||||||||||||
Tompkins Trust Company offers post-retirement life and healthcare benefits, although as previously mentioned, has discontinued providing postretirement healthcare to participants hired after 2004. The weighted average annual assumed rate of increase in the per capita cost of covered benefits (the health care cost trend rate) is 6.50% beginning in 2015, and is assumed to decrease gradually to 4.5% in 2026 and beyond. A 1% increase in the assumed health care cost trend rate, would increase service and interest costs by approximately $18,700 and increase the Company’s benefit obligation by approximately $190,000. A 1% decrease in the assumed health care cost trend rate, would decrease service and interest costs by approximately $16,000 and decrease the Company’s benefit obligation by approximately $167,000.
To develop the expected long-term rate of return on assets assumption for the Pension Plan, the Company considered the historical returns and the future expectations for returns for each asset class, as well as target asset allocations of the pension portfolio. Based on this analysis, the Company selected 7.25% as the long-term rate of return on asset assumption.
Effective year-end 2015, Tompkins changed the methodology used to determine the discount rates for calculating year-end liabilities. Historically, Tompkins used an average of the discount rates derived from the Citigroup Regular and Above Median yield curves. Effective year-end 2015, Tompkins began using the discount rates derived from the Citigroup Regular curve only. This new methodology produced discount rates of 4.05%, 4.14%, and 4.32% for the DB Pension, and Life and Healthcare plans, and SERP respectively. The former methodology would have produced discount rates of 4.10%, 4.20%, and 4.40%, respectively.
Based on the Company’s anticipation of future experience under the defined benefit pension plan, the mortality tables used to determine future benefit obligations under the plan were updated as of December 31, 2015 to the RP-2014 Mortality Table for annuitants and non-annuitants, fully generational with projected mortality improvements using Scale MP-2015, with no collar adjustment. The appropriateness of the assumptions is reviewed annually.
Cash Flows
Plan assets are amounts that have been segregated and restricted to provide benefits, and include amounts contributed by the Company and amounts earned from investing contributions, less benefits paid. The Company funds the cost of the SERP and the post-retirement medical and life insurance benefits on a pay-as-you-go basis.
The benefits as of December 31, 2015, expected to be paid in each of the next five fiscal years, and in the aggregate for the five fiscal years thereafter were as follows:
| (in thousands) | DB Pension Plans | Life and Healthcare Plan |
SERP Plan | ||||||||||
| 2016 | $ | 3,862 | $ | 485 | $ | 622 | |||||||
| 2017 | 3,882 | 473 | 670 | ||||||||||
| 2018 | 3,790 | 441 | 666 | ||||||||||
| 2019 | 4,189 | 463 | 661 | ||||||||||
| 2020 | 4,143 | 468 | 701 | ||||||||||
| 2021-2025 | 22,269 | 2,586 | 3,795 | ||||||||||
| Total | $ | 42,135 | $ | 4,916 | $ | 7,115 |
| 101 |
Plan Assets
The Company’s DB Pension Plans’ weighted-average asset allocations at December 31, 2015 and 2014, respectively, by asset category are as follows:
| 2015 | 2014 | |||||||
| Equity securities | 75 | % | 71 | % | ||||
| Debt securities | 24 | % | 28 | % | ||||
| Other | 1 | % | 1 | % | ||||
| Total Allocation | 100 | % | 100 | % | ||||
It is the policy of the Trustees to invest the Pension Trust Fund (the “Fund”) for total return. The Trustees seek the maximum return consistent with the interests of the participants and beneficiaries and prudent investment management. The management of the Fund’s assets is in compliance with the guidelines established in the Company’s Pension Plan and Trust Investment Policy, which is reviewed and approved annually by the Tompkins Board of Directors, and the Pension Investment Review Committee.
The intention is for the Fund to be prudently diversified. The Fund’s investments will be invested among the fixed income, equity and cash equivalent sectors. The pension committee will designate minimum and maximum positions in any of the sectors. In no case shall more than 10% of the Fund assets consist of qualified securities or real estate of the Company. Unless otherwise approved by the Trustees, the following investments are prohibited:
| 1. | Restricted stock, private placements, short positions, calls, puts, or margin transactions; |
| 2. | Commodities, oil and gas properties, real estate properties, or |
| 3. | Any investment that would constitute a prohibited transaction as described in the Employee Retirement Income Security Act of 1974 (“ERISA”), section 407, 29 U.S.C. 1106. |
In general, the investment in debt securities is limited to readily marketable debt securities having a Standard & Poor’s rating of “A” or Moody’s rating of “A”, securities of, or guaranteed by the United States Government or its agencies, or obligations of banks or their holding companies that are rated in the three highest ratings assigned by Fitch Investor Service, Inc. In addition, investments in equity securities must be listed on the NYSE or traded on the national Over The Counter market or listed on the NASDAQ. Cash equivalents generally may be United States Treasury obligations, commercial paper having a Standard & Poor’s rating of “A-1” or Moody’s National Credit Officer rating of “P-1”or higher.
The major categories of assets in the Company’s DB Pension Plan as of year-end are presented in the following table. Assets are segregated by the level of valuation inputs within the fair value hierarchy established by ASC Topic 820 utilized to measure fair value (see Note 19-Fair Value Measurements).
| Fair Value Measurements | ||||||||||||||||
| December 31, 2015 | ||||||||||||||||
| (in thousands) | Fair Value 2015 |
(Level 1) | (Level 2) | (Level 3) | ||||||||||||
| Cash and cash equivalents | $ | 694 | $ | 694 | $ | 0 | $ | 0 | ||||||||
| U.S. Treasury securities | 7,599 | 7,599 | 0 | 0 | ||||||||||||
| U.S. Government sponsored entities securities | 508 | 0 | 508 | 0 | ||||||||||||
| Corporate bonds and notes | 6,627 | 0 | 6,627 | 0 | ||||||||||||
| Common stocks | 25,324 | 25,324 | 0 | 0 | ||||||||||||
| Mutual funds | 27,429 | 27,429 | 0 | 0 | ||||||||||||
| Preferred stocks | 750 | 0 | 750 | 0 | ||||||||||||
| Total Fair Value of Plan Assets | $ | 68,931 | $ | 61,046 | $ | 7,885 | $ | 0 | ||||||||
| 102 |
|
Fair Value Measurements |
||||||||||||||||
| December 31, 2014 | ||||||||||||||||
| (in thousands) | Fair Value 2014 |
(Level 1) | (Level 2) | (Level 3) | ||||||||||||
| Cash and cash equivalents | $ | 784 | $ | 784 | $ | 0 | $ | 0 | ||||||||
| U.S. Treasury securities | 6,954 | 6,954 | 0 | 0 | ||||||||||||
| U.S. Government sponsored entities securities | 1,422 | 0 | 1,422 | 0 | ||||||||||||
| Corporate bonds and notes | 7,168 | 0 | 7,168 | 0 | ||||||||||||
| Common stocks | 19,225 | 19,225 | 0 | 0 | ||||||||||||
| Mutual funds | 34,924 | 34,924 | 0 | 0 | ||||||||||||
| Preferred stocks | 750 | 0 | 750 | 0 | ||||||||||||
| Total Fair Value of Plan Assets | $ | 71,227 | $ | 61,887 | $ | 9,340 | $ | 0 | ||||||||
The Company determines the fair value for its pension plan assets using an independent pricing service. The pricing service uses a variety of techniques to determine fair value, including market maker bids, quotes and pricing models. Inputs to the model include recent trades, benchmark interest rates, spreads, and actual and projected cash flows. Based on the inputs used by our independent pricing services, the Company identifies the appropriate level within the fair value hierarchy to report these fair values. U.S. Treasury securities, common stocks and mutual funds are considered Level 1 based on quoted prices in active markets.
The Company has an Employee Stock Ownership Plan (ESOP) and a 401(k) Investment and Stock Ownership Plan (ISOP) covering substantially all employees of the Company. The ESOP allows for Company contributions in the form of common stock of the Company. Annually, the Tompkins Board of Directors determines a profit-sharing payout to its employees in accordance with a performance-based formula. A percentage of the approved amount is paid in Company common stock into the ESOP. Contributions are limited to a maximum amount as stipulated in the ESOP. The remaining percentage is either paid out in cash or deferred into the ISOP at the direction of the employee. Compensation expense related to the ESOP and ISOP totaled $4.4 million in 2015, $3.9 million in 2014, and $3.5 million in 2013.
Under the ISOP, employees may contribute a percentage of their eligible compensation with a Company match of such contributions up to a maximum match of 4%. Participation in the 401(k) Plan is contingent upon certain age and service requirements. The Company’s expense associated with these matching provisions was $2.3 million in 2015, $2.2 million in 2014, and $2.2 million in 2013.
Life insurance benefits are provided to certain officers of the Company. In connection with these policies, the Company reflects life insurance assets on its Consolidated Statements of Condition of $75.8 million at December 31, 2015, and $73.7 million at December 31, 2014. The insurance is carried at its cash surrender value on the Consolidated Statements of Condition. Increases in the cash surrender value of the insurance are reflected as noninterest income, net of any related mortality expense.
The Company provides split dollar life insurance benefits to certain employees. The plan is unfunded and the estimated liability of the plan of $1.3 million and $1.2 million is recorded in other liabilities in the Consolidated Statements of Condition at December 31, 2015 and 2014, respectively. Compensation expense related to the split dollar life insurance was approximately $47,000 in 2015 and $43,000 in 2014.
Note 13 Stock Plans and Stock Based Compensation
Under the Tompkins Financial Corporation 2009 Equity Plan (“2009 Equity Plan”), the Company may grant incentive stock options, stock appreciation rights, shares of restricted stock and restricted stock units covering up to 902,000, common shares to certain officers, employees, and nonemployee directors. Stock options and stock appreciation rights are granted at an exercise price equal to the stock’s fair value at the date of grant, may not have a term in excess of ten years, and have vesting periods that range between one and seven years from the grant date. Restricted stock awards have vesting periods that range between one and seven years from grant date, and have grant date fair values that equal the closing price of the Company’s common stock on grant date. Prior to the adoption of the 2009 Equity Plan, the Company had similar stock option plans, which remain in effect solely with respect to unexercised options issued under these plans.
| 103 |
The Company granted 109,750 equity awards to its employees in 2015. The awards consisted of 61,235 shares of restricted stock and 48,515 stock appreciation rights. The Company granted 186,982 equity awards to its employees in 2014. The awards consisted of 101,100 shares of restricted stock, 81,495 stock appreciation rights, and 4,387 shares of stock. The Company granted 172,495 equity awards to its employees in 2013. The awards consisted of 106,325 shares of restricted stock, 62,420 stock appreciation rights, and 3,750 shares of stock.
The following table presents the activity related to stock options and stock appreciation rights under all plans for the twelve months ended December 31, 2015.
|
Number of |
Weighted Average Exercise Price |
Weighted Average Remaining Contractual Term |
Aggregate Intrinsic Value |
|||||||||||||
| Outstanding at January 1, 2015 | 593,699 | $ | 40.06 | |||||||||||||
| Granted | 48,515 | $ | 56.29 | |||||||||||||
| Exercised | (176,274 | ) | $ | 38.22 | ||||||||||||
| Forfeited | (24,924 | ) | $ | 42.24 | ||||||||||||
| Outstanding at December 31, 2015 | 441,016 | $ | 42.46 | 5.63 | $ | 6,047,872 | ||||||||||
| Exercisable at December 31, 2015 | 209,385 | $ | 38.46 | 3.31 | $ | 3,706,186 | ||||||||||
Total stock-based compensation expense for stock options was $509,000 in 2015, $734,000 in 2014, and $833,000 in 2013. As of December 31, 2015, unrecognized compensation cost related to unvested stock options totaled $1.6 million. The cost is expected to be recognized over a weighted average period of 4.7 years. Cash proceeds, tax benefits and intrinsic value related to total stock options exercised is as follows:
| (in thousands) | 2015 | 2014 | 2013 | |||||||||
| Proceeds from stock option exercises | $ | 1,382 | $ | 1,512 | $ | 4,683 | ||||||
| Tax benefits related to stock option exercises | 358 | 234 | 331 | |||||||||
| Intrinsic value of stock option exercises | 3,014 | 2,112 | 1,922 | |||||||||
The Company uses the Black-Scholes option-valuation model to determine the fair value of each incentive stock options and stock appreciation rights at the date of grant. The valuation model estimates fair value based on the assumptions listed in the table below. The risk-free rate is the interest rate available on zero-coupon U.S. Treasury instruments with a remaining term equal to the expected term of the share option at the time of grant. The expected dividend yield is based on the dividend trends and the market price of the Company’s stock price at grant. Volatility is largely based on historical volatility of the Company’s stock price. Expected term is based upon historical experience of employee exercises and terminations as the vesting term of the grants. The fair values of the grants are expensed over the vesting periods.
| 2015 | 2014 | 2013 | ||||||||||
| Weighted per share average fair value at grant date | $ | 8.96 | $ | 8.32 | $ | 9.50 | ||||||
| Risk-free interest rate | 1.80 | % | 1.91 | % | 0.78 | % | ||||||
| Expected dividend yield | 3.80 | % | 5.14 | % | 4.00 | % | ||||||
| Volatility | 25.32 | % | 30.96 | % | 38.46 | % | ||||||
| Expected life (years) | 6.00 | 6.00 | 5.50 | |||||||||
| 104 |
| Options Outstanding | Options Exercisable | |||||||||||||||||||||
| Range of Exercise Prices |
Number Outstanding |
Weighted Average Remaining Contractual Life |
Weighted Average Exercise Price |
Number Exercisable |
Weighted Average Exercise Price |
|||||||||||||||||
| $ | 13.00-20.00 | 626 | 3.96 | $ | 16.47 | 626 | $ | 16.47 | ||||||||||||||
| $ | 20.01-29.30 | 6,778 | 5.38 | $ | 21.75 | 6,778 | $ | 21.75 | ||||||||||||||
| $ | 29.31-35.70 | 1,669 | 2.97 | $ | 30.96 | 1,669 | $ | 30.96 | ||||||||||||||
| $ | 35.71-37.50 | 144,900 | 3.92 | $ | 37.13 | 100,514 | $ | 37.19 | ||||||||||||||
| $ | 37.51-41.00 | 73,205 | 5.38 | $ | 40.28 | 29,781 | $ | 39.80 | ||||||||||||||
| $ | 41.01-50.00 | 165,323 | 6.04 | $ | 45.11 | 70,017 | $ | 41.71 | ||||||||||||||
| $ | 50.01-60.00 | 48,515 | 9.85 | $ | 56.29 | 0 | $ | 0 | ||||||||||||||
| 441,016 | 5.63 | $ | 42.46 | 209,385 | $ | 38.46 | ||||||||||||||||
The following table presents activity related to restricted stock awards for the twelve months ended December 31, 2015.
| Number of Shares | Weighted Average Exercise Price |
||||||||
| Unvested at January 1, 2015 | 224,726 | $ | 44.15 | ||||||
| Granted | 61,235 | 56.29 | |||||||
| Vested | (22,841 | ) | 52.00 | ||||||
| Forfeited | (15,773 | ) | 43.58 | ||||||
| Unvested at December 31, 2015 | 247,347 | $ | 47.57 | ||||||
The company granted 61,235 restricted stock awards in 2015 at an average grant date fair value of $56.29. The Company granted 101,100 restricted stock awards in 2014 at an average grant date fair value of $49.22. The Company granted 106,325 restricted stock awards in 2013 at an average grant date fair value of $40.60. The grant date fair values were the closing prices of the Company’s common stock on the grant dates. The Company recognized stock-based compensation related to restricted stock awards of $1.4 million in 2015, $771,000 in 2014, and $550,000 in 2013. Unrecognized compensation costs related to restricted stock awards totaled $8.9 million at December 31, 2015 and will be recognized over 5.7 years on a weighted average basis.
Note 14 Other Noninterest Income and Expense
Other income and operating expense totals are presented in the table below. Components of these totals exceeding 1% of the aggregate of total other noninterest income and total other noninterest expenses for any of the years presented below are stated separately.
| Year ended December 31, | ||||||||||||
| (in thousands) | 2015 | 2014 | 2013 | |||||||||
| NONINTEREST INCOME | ||||||||||||
| Other service charges | $ | 2,972 | $ | 3,267 | $ | 3,802 | ||||||
| Increase in cash surrender value of corporate owned life insurance | 2,064 | 1,883 | 2,021 | |||||||||
| Net gain (loss) on sale of loans | 54 | 362 | (133 | ) | ||||||||
| Other miscellaneous income | 3,788 | 3,472 | 4,856 | |||||||||
| Total other noninterest income | $ | 8,878 | $ | 8,984 | $ | 10,546 | ||||||
| NONINTEREST EXPENSES | ||||||||||||
| Marketing expense | $ | 4,780 | $ | 4,942 | $ | 4,958 | ||||||
| Professional fees | 5,352 | 6,094 | 5,651 | |||||||||
| Technology expense | 6,220 | 6,172 | 6,056 | |||||||||
| Cardholder expense | 2,653 | 2,712 | 3,433 | |||||||||
| Other miscellaneous expenses | 18,662 | 21,201 | 20,543 | |||||||||
| Total other noninterest expenses | $ | 37,667 | $ | 41,121 | $ | 40,641 | ||||||
| 105 |
Note 15 Income Taxes
The income tax expense (benefit) attributable to income from operations is summarized as follows:
| (in thousands) | Current | Deferred | Total | ||||||||||
| 2015 | |||||||||||||
| Federal | $ | 22,955 | $ | 2,841 | $ | 25,796 | |||||||
| State | 3,103 | 63 | 3,166 | ||||||||||
| Total | $ | 26,058 | $ | 2,904 | $ | 28,962 | |||||||
| 2014 | |||||||||||||
| Federal | $ | 19,749 | $ | 2,915 | $ | 22,664 | |||||||
| State | 624 | 2,116 | 2,740 | ||||||||||
| Total | $ | 20,373 | $ | 5,031 | $ | 25,404 | |||||||
| 2013 | |||||||||||||
| Federal | $ | 11,826 | $ | 7,138 | $ | 18,964 | |||||||
| State | 933 | 880 | 1,813 | ||||||||||
| Total | $ | 12,759 | $ | 8,018 | $ | 20,777 | |||||||
The primary reasons for the differences between income tax expense and the amount computed by applying the statutory federal income tax rate to earnings are as follows:
| 2015 | 2014 | 2013 | ||||||||||
| Statutory federal income tax rate | 35.0 | % | 35.0 | % | 35.0 | % | ||||||
| State income taxes, net of federal benefit | 2.4 | 2.3 | 1.6 | |||||||||
| Tax exempt income | (2.5 | ) | (2.5 | ) | (3.0 | ) | ||||||
| Bank-owned life insurance income | (0.8 | ) | (0.8 | ) | (1.0 | ) | ||||||
| Federal tax credit | (0.8 | ) | (1.0 | ) | (2.3 | ) | ||||||
| All other | (0.2 | ) | (0.2 | ) | (1.3 | ) | ||||||
| Total | 33.1 | % | 32.8 | % | 29.0 | % | ||||||
Deferred income taxes reflect the net tax effects of temporary differences between the carrying amount of assets and liabilities for financial reporting purposes and the amounts used for income tax purposes. Significant components of the Company’s deferred tax assets and liabilities as of December 31 were as follows:
| (in thousands) | 2015 | 2014 | 2013 | |||||||||
| Deferred tax assets: | ||||||||||||
| Allowance for loan and lease losses | $ | 12,411 | $ | 11,276 | $ | 10,946 | ||||||
| Interest income on nonperforming loans | 1,207 | 395 | 1,712 | |||||||||
| Compensation and benefits | 14,032 | 13,081 | 12,448 | |||||||||
| Purchase accounting adjustments | 1,920 | 3,538 | 5,746 | |||||||||
| Intangibles | 0 | 0 | 95 | |||||||||
| Liabilities held at fair value | 218 | 364 | 497 | |||||||||
| Tax credit carryforward | 831 | 1,995 | 3,990 | |||||||||
| Other | 2,546 | 2,347 | 2,838 | |||||||||
| Total | $ | 33,165 | $ | 32,996 | $ | 38,272 | ||||||
| Deferred tax liabilities: | ||||||||||||
| Prepaid pension | $ | 10,992 | $ | 9,377 | $ | 10,154 | ||||||
| Depreciation | 3,277 | 2,553 | 2,948 | |||||||||
| Intangibles | 567 | 236 | 0 | |||||||||
| Other | 2,144 | 1,741 | 1,050 | |||||||||
| Total deferred tax liabilities | $ | 16,980 | $ | 13,907 | $ | 14,152 | ||||||
| Net deferred tax asset at year-end | $ | 16,185 | $ | 19,089 | $ | 24,120 | ||||||
| Net deferred tax asset at beginning of year | $ | 19,089 | $ | 24,120 | $ | 32,138 | ||||||
| Decrease in net deferred tax asset | (2,904 | ) | (5,031 | ) | (8,018 | ) | ||||||
| Deferred tax expense | $ | 2,904 | $ | 5,031 | $ | 8,018 | ||||||
| 106 |
This analysis does not include recorded deferred tax assets (liabilities) of $1.8 million and ($1.8) million as of December 31, 2015 and 2014, respectively, related to net unrealized holdings losses/(gains) in the available-for-sale securities portfolio. In addition, the analysis excludes the recorded deferred tax assets of $18.1 million and $17.2 million, as of December 31, 2015 and 2014, respectively, related to employee benefit plans.
Realization of deferred tax assets is dependent upon the generation of future taxable income or the existence of sufficient taxable income within the carry-back period. A valuation allowance is provided when it is more likely than not that some portion of the deferred tax assets will not be realized. In assessing the need for a valuation allowance, management considers the scheduled reversal of the deferred tax liabilities, the level of historical taxable income, and the projected future taxable income over the periods in which the temporary differences comprising the deferred tax assets will be deductible. Based on its assessment, management determined that no valuation allowance is necessary at December 31, 2015 and 2014.
At December 31, 2015 and December 31, 2014, the Company had no ASC 740-10 unrecognized tax benefits. The Company does not expect the total amount of unrecognized tax benefits to significantly increase within the next twelve months. The Company recognizes interest and penalties on unrecognized tax benefits in income tax expense in its Consolidated Statements of Income.
The Company is subject to U.S. federal income tax and income tax in various state jurisdictions. All tax years ending after December 31, 2011 are open to examination by the taxing authorities.
Note 16 Other Comprehensive Income
The tax effect allocated to each component of other comprehensive income (loss) were as follows:
| December 31, 2015 | Before-Tax Amount |
Tax (Expense) Benefit |
Net of Tax | |||||||||
| Available-for-sale securities: | ||||||||||||
| (in thousands) | ||||||||||||
| Change in net unrealized gain during the period | $ | (8,241 | ) | $ | 3,295 | $ | (4,946 | ) | ||||
| Reclassification adjustment for net realized gain on sale included in available-for-sale securities | (1,108 | ) | 443 | (665 | ) | |||||||
| Net unrealized losses | (9,349 | ) | 3,738 | (5,611 | ) | |||||||
| Employee benefit plans: | ||||||||||||
| Net retirement plan gain | 1,846 | (738 | ) | 1,108 | ||||||||
| Amortization of net retirement plan actuarial loss | 2,218 | (887 | ) | 1,331 | ||||||||
| Amortization of net retirement plan prior service (cost) credit | (6,362 | ) | 2,544 | (3,818 | ) | |||||||
| Employee benefit plans | (2,298 | ) | 919 | (1,379 | ) | |||||||
| Other comprehensive loss | $ | (11,647 | ) | $ | 4,657 | $ | (6,990 | ) |
| 107 |
|
December 31, 2014
Available-for-sale securities: |
Before-Tax Amount |
Tax (Expense) Benefit |
Net of Tax | |||||||||
| (in thousands) | ||||||||||||
| Change in net unrealized loss during the period | $ | 19,094 | $ | (7,635 | ) | $ | 11,459 | |||||
| Reclassification adjustment for net realized gain on sale included in available-for-sale securities | (391 | ) | 156 | (235 | ) | |||||||
| Net unrealized gains | 18,703 | (7,479 | ) | 11,224 | ||||||||
| Employee benefit plans: | ||||||||||||
| Net retirement plan loss | (24,211 | ) | 9,684 | (14,527 | ) | |||||||
| Net retirement plan prior service credit | 6,282 | (2,513 | ) | 3,769 | ||||||||
| Amortization of net retirement plan actuarial loss | 1,065 | (426 | ) | 639 | ||||||||
| Amortization of net retirement plan prior service credit | 5 | (2 | ) | 3 | ||||||||
| Employee benefit plans | (16,859 | ) | 6,743 | (10,116 | ) | |||||||
| Other comprehensive income | $ | 1,844 | $ | (736 | ) | $ | 1,108 | |||||
|
December 31, 2013
(in thousands) |
Before-Tax Amount |
Tax (Expense) Benefit |
Net of Tax | |||||||||
| Available-for-sale securities: | ||||||||||||
| Change in net unrealized loss during the period | $ | (57,250 | ) | $ | 22,896 | $ | (34,354 | ) | ||||
|
Reclassification adjustment for net realized gain on sale included in available-for-sale securities |
(599 | ) | 240 | (359 | ) | |||||||
| Net unrealized losses | (57,849 | ) | 23,136 | (34,713 | ) | |||||||
| Employee benefit plans: | ||||||||||||
| Net retirement plan loss | 16,813 | (6,725 | ) | 10,088 | ||||||||
| Amortization of net retirement plan actuarial loss | 2,579 | (1,032 | ) | 1,547 | ||||||||
| Amortization of net retirement plan prior service credit | 59 | (24 | ) | 35 | ||||||||
| Amortization of net retirement plan transition liability | 50 | (20 | ) | 30 | ||||||||
| Employee benefit plans | 19,501 | (7,801 | ) | 11,700 | ||||||||
| Other comprehensive loss | $ | (38,348 | ) | $ | 15,335 | $ | (23,013 | ) | ||||
The following table presents the activity in our accumulated other comprehensive income for the periods indicated:
|
(in thousands) |
Available-for-Sale Securities |
Employee Benefit Plans |
Accumulated Other Comprehensive Income (loss) |
|||||||||
| Balance at January 1, 2013 | $ | 26,356 | $ | (28,462 | ) | $ | (2,106 | ) | ||||
| Other comprehensive (loss) income | (34,713 | ) | 11,700 | (23,013 | ) | |||||||
| Balance at December 31, 2013 | $ | (8,357 | ) | $ | (16,762 | ) | $ | (25,119 | ) | |||
| Balance at January 1, 2014 | (8,357 | ) | (16,762 | ) | (25,119 | ) | ||||||
| Other comprehensive income (loss) | 11,224 | (10,116 | ) | 1,108 | ||||||||
| Balance at December 31, 2014 | $ | 2,867 | $ | (26,878 | ) | $ | (24,011 | ) | ||||
| Balance at January 1, 2015 | 2,867 | (26,878 | ) | (24,011 | ) | |||||||
| Other comprehensive loss | (5,611 | ) | (1,379 | ) | (6,990 | ) | ||||||
| Balance at December 31, 2015 | $ | (2,744 | ) | $ | (28,257 | ) | $ | (31,001 | ) | |||
| 108 |
| December 31, 2015 | ||||||
| Details about Accumulated other Comprehensive Income Components (in thousands) |
Amount Reclassified from Accumulated Other Comprehensive Income1 |
Affected Line Item in the Statement Where Net Income is Presented | ||||
| Available-for-sale securities: | ||||||
| Unrealized gains and losses on available-for-sale securities | $ | 1,108 | Net gain on securities transactions | |||
| (443 | ) | Tax expense | ||||
| 665 | Net of tax | |||||
| Employee benefit plans: | ||||||
| Amortization of the following 2 | ||||||
| Net retirement plan actuarial loss | (2,218 | ) | ||||
| Net retirement plan prior service credit | 359 | |||||
| (1,859 | ) | Total before tax | ||||
| 744 | Tax benefit | |||||
| (1,115 | ) | Net of tax | ||||
| December 31, 2014 | ||||||
| Details about Accumulated other Comprehensive Income Components (in thousands) |
Amount Reclassified from Accumulated Other Comprehensive Income1 |
Affected Line Item in the Statement Where Net Income is Presented | ||||
| Available-for-sale securities: | ||||||
| Unrealized gains and losses on available-for-sale securities | $ | 391 | Net gain on securities transactions | |||
| (156 | ) | Tax expense | ||||
| 235 | Net of tax | |||||
| Employee benefit plans: | ||||||
| Amortization of the following 2 | ||||||
| Net retirement plan actuarial loss | (1,065 | ) | ||||
| Net retirement plan prior service credit | (5 | ) | ||||
| (1,070 | ) | Total before tax | ||||
| 428 | Tax benefit | |||||
| (642 | ) | Net of tax | ||||
1 Amounts in parentheses indicate debits in income statement.
2 The accumulated other comprehensive income components are included in the computation of net periodic benefit cost (See Note 12 - “Employee Benefit Plans”).
Note 17 Commitments and Contingent Liabilities
The Company, in the normal course of business, is a party to financial instruments with off-balance-sheet risk to meet the financial needs of its customers. These financial instruments include loan commitments, standby letters of credit, and unused portions of lines of credit. The contract, or notional amount, of these instruments represents the Company’s involvement in particular classes of financial instruments. These instruments involve, to varying degrees, elements of credit and interest rate risk in excess of the amount recognized on the Consolidated Statements of Condition.
| 109 |
The Company’s maximum potential obligations to extend credit for loan commitments (unfunded loans, unused lines of credit, and standby letters of credit) outstanding on December 31 were as follows:
| (in thousands) | 2015 | 2014 | ||||||
| Loan commitments | $ | 200,316 | $ | 435,904 | ||||
| Standby letters of credit | 58,639 | 58,200 | ||||||
| Undisbursed portion of lines of credit | 719,234 | 410,664 | ||||||
| Total | $ | 978,189 | $ | 904,768 | ||||
Commitments to extend credit (including lines of credit) are agreements to lend to a customer as long as there is no violation of any condition established in the contract. Commitments generally have fixed expiration dates or other termination clauses and may require payment of a fee. Standby letters of credit are conditional commitments to guarantee the performance of a customer to a third party. The Company extends standby letters of credit to its customers in the normal course of business. The standby letters of credit are generally short-term. As of December 31, 2015, the Company’s maximum potential obligation under standby letters of credit was $58.6 million. Management uses the same credit policies in making commitments to extend credit and standby letters of credit as are used for on-balance-sheet lending decisions. Based upon management’s evaluation of the counterparty, the Company may require collateral to support commitments to extend credit and standby letters of credit. The credit risk amounts are equal to the contractual amounts, assuming the amounts are fully advanced and collateral or other security is of no value. The Company does not anticipate losses as a result of these transactions. These commitments also have off-balance-sheet interest-rate risk, in that the interest rate at which these commitments were made may not be at market rates on the date the commitments are fulfilled. Since some commitments and standby letters of credit are expected to expire without being drawn upon, the total commitment amounts do not necessarily represent future cash flow requirements.
At December 31, 2015, the Company had rate lock agreements associated with mortgage loans to be sold in the secondary market (certain of which relate to loan applications for which no formal commitment has been made) amounting to approximately $422,000. In order to limit the interest rate risk associated with rate lock agreements, as well as the interest rate risk associated with mortgages held for sale, if any, the Company enters into agreements to sell loans in the secondary market to unrelated investors on a loan-by-loan basis. At December 31, 2015, the Company had approximately $422,000 of commitments to sell mortgages to unrelated investors on a loan-by-loan basis.
In the normal course of business, the Company is involved in various legal proceedings. In the opinion of management, based upon the review with counsel, the proceedings are not expected to have a material effect on the Company’s financial condition or results of operations.
| 110 |
Note 18 Earnings Per Share
Calculation of basic earnings per share (Basic EPS) and diluted earnings per share (Diluted EPS) is shown below.
| Year ended December 31, | ||||||||||||
| (in thousands, except share and per share data) | 2015 | 2014 | 2013 | |||||||||
| Basic | ||||||||||||
| Net income available to common shareholders | $ | 58,421 | $ | 52,041 | $ | 50,856 | ||||||
| Less: dividends and undistributed earnings allocated to unvested restricted stock awards | (834 | ) | (503 | ) | (418 | ) | ||||||
| Net earnings allocated to common shareholders | 57,587 | 51,538 | 50,438 | |||||||||
| Weighted average shares outstanding, including participating securities | 14,940,274 | 14,824,333 | 14,587,187 | |||||||||
| Less: average participating securities | (212,081 | ) | (147,711 | ) | (109,570 | ) | ||||||
| Weighted average shares outstanding - Basic | 14,728,193 | 14,676,622 | 14,477,617 | |||||||||
| Diluted | ||||||||||||
| Net earnings allocated to common shareholders | 57,587 | 51,538 | 50,438 | |||||||||
| Weighted average shares outstanding - Basic | 14,728,193 | 14,676,622 | 14,477,617 | |||||||||
| Dilutive effect of common stock options or restricted stock awards | 134,833 | 113,002 | 96,302 | |||||||||
| Weighted average shares outstanding - Diluted | 14,863,026 | 14,789,624 | 14,573,919 | |||||||||
| Basic EPS | 3.91 | 3.51 | 3.48 | |||||||||
| Diluted EPS | 3.87 | 3.48 | 3.46 | |||||||||
There were approximately 72,321 weighted average stock options as of December 31, 2015; 108,159 for 2014; and 229,868 for 2013, that were not considered in the calculation of diluted earnings per share since the stock options’ exercise prices were greater than the average market price during these periods.
Note 19 Fair Value Measurements
FASB ASC Topic 820, Fair Value Measurements and Disclosures, defines fair value, establishes a framework for measuring fair value in generally accepted accounting principles and expands disclosures about fair value measurements. FASB ASC Topic 820 also establishes a fair value hierarchy that prioritizes the inputs to valuation techniques used to measure fair value. The hierarchy gives the highest priority to unadjusted quoted prices in active markets for identical assets or liabilities (level 1 measurements) and the lowest priority to unobservable inputs (Level 3 measurements).
The three levels of the fair value hierarchy are:
Level 1 – Unadjusted quoted prices in active markets that are accessible at the measurement date for identical, unrestricted assets or liabilities;
Level 2 – Quoted prices for similar assets or liabilities in active markets, quoted prices for identical or similar assets or liabilities in markets that are not active, or inputs that are observable, either directly or indirectly, for substantially the full term of the asset or liability;
Level 3 – Prices or valuation techniques that require inputs that are both significant to the fair value measurement and unobservable (i.e., supported by little or no market activity).
| 111 |
The following table summarizes financial assets and financial liabilities measured at fair value on a recurring basis as of December 31, 2015 and 2014 segregated by the level of valuation inputs within the fair value hierarchy used to measure fair value.
Recurring Fair Value Measurements
December 31, 2015
| (in thousands) | Fair Value 12/31/2015 |
(Level 1) | (Level 2) | (Level 3) | ||||||||||||
| Trading securities | ||||||||||||||||
| Obligations of U.S. Government sponsored entities | $ | 6,601 | $ | 0 | $ | 6,601 | $ | 0 | ||||||||
| Mortgage-backed securities - residential | 767 | 0 | 767 | 0 | ||||||||||||
| Available-for-sale securities | ||||||||||||||||
| Obligations of U.S. Government sponsored entities | 552,893 | 0 | 552,893 | 0 | ||||||||||||
| Obligations of U.S. states and political subdivisions | 84,726 | 0 | 84,726 | 0 | ||||||||||||
| Mortgage-backed securities - residential | ||||||||||||||||
| U.S. Government agencies | 94,678 | 0 | 94,678 | 0 | ||||||||||||
| U.S. Government sponsored entities | 650,097 | 0 | 650,097 | 0 | ||||||||||||
| Non-U.S. Government agencies or sponsored entities | 194 | 0 | 194 | 0 | ||||||||||||
| U.S. corporate debt securities | 2,162 | 0 | 2,162 | 0 | ||||||||||||
| Equity securities | 934 | 0 | 0 | 934 | ||||||||||||
| Borrowings | ||||||||||||||||
| Other borrowings | 10,576 | 0 | 10,576 | 0 | ||||||||||||
The change in the fair value of available-for-sale securities valued using significant unobservable inputs (level 3), between January 1, 2015 and December 31, 2015 was mainly due to the reclassification of $475,000 of securities from available-for-sale securities to other assets to reflect the nonmarketable nature of these securities.
| 112 |
| Recurring Fair Value Measurements | ||||||||||||||||
| December 31, 2014 | ||||||||||||||||
| (in thousands) | Fair Value 12/31/14 |
(Level 1) | (Level 2) | (Level 3) | ||||||||||||
| Trading securities | ||||||||||||||||
| Obligations of U.S. Government sponsored entities | $ | 7,404 | $ | 0 | $ | 7,404 | $ | 0 | ||||||||
| Mortgage-backed securities - residential | 1,588 | 0 | 1,588 | 0 | ||||||||||||
| Available-for-sale securities | ||||||||||||||||
| Obligations of U.S. Government sponsored entities | 557,820 | 0 | 557,820 | 0 | ||||||||||||
| Obligations of U.S. states and political subdivisions | 71,510 | 0 | 71,510 | 0 | ||||||||||||
| Mortgage-backed securities - residential | ||||||||||||||||
| U.S. Government agencies | 109,926 | 0 | 109,926 | 0 | ||||||||||||
| U.S. Government sponsored entities | 659,120 | 0 | 659,120 | 0 | ||||||||||||
| U.S. corporate debt securities | 2,162 | 0 | 2,162 | 0 | ||||||||||||
| Equity securities | 1,427 | 0 | 0 | 1,427 | ||||||||||||
| Borrowings | ||||||||||||||||
| Other borrowings | 10,961 | 0 | 10,961 | 0 | ||||||||||||
The change in the fair value of the $1.4 million of available-for-sale securities valued using significant unobservable inputs (level 3), between January 1, 2014 and December 31, 2014 was immaterial.
The Company determines fair value for its trading securities using independently quoted market prices.
The Company determines fair value for its available-for-sale securities using an independent bond pricing service for identical assets or very similar securities. The pricing service uses a variety of techniques to determine fair value, including market maker bids, quotes and pricing models. Inputs to the model include recent trades, benchmark interest rates, spreads, and actual and projected cash flows. The Company reviews the prices supplied by the independent pricing service, as well as their underlying pricing methodologies, for reasonableness and to ensure such prices are aligned with traditional pricing matrices. In general, the Company’s investment portfolio consists of traditional investments, nearly all of which are U.S. Treasury obligations, federal agency bullet or mortgage pass-through securities, or general obligation municipal bonds. Pricing for such instruments is fairly generic and is easily obtained. At least annually, the Company will validate prices supplied by the independent pricing service by comparing to prices obtained from a second third-party source. Based on the inputs used by our independent pricing services, the Company identifies the appropriate level within the fair value hierarchy to report these fair values.
Fair values of borrowings are estimated using Level 2 inputs based upon observable market data. The Company determines fair value for its borrowings using a discounted cash flow technique based upon expected cash flows and current spreads on FHLB advances with the same structure and terms. The Company also receives pricing information from third parties, including the FHLB. The pricing obtained is considered representative of the transfer price if the liabilities were assumed by a third party. The Company’s potential credit risk did not have a material impact on the quoted settlement prices used in measuring the fair value of the FHLB borrowings for the twelve months ended December 31, 2015.
There were no transfers between Level 2 and Level 3 values during 2015.
Certain assets are measured at fair value on a nonrecurring basis, that is, they are not measured at fair value on an ongoing basis but are subject to fair value adjustments in certain circumstances. For the Company, these include loans held for sale, collateral dependent impaired loans, other real estate owned, goodwill and other intangible assets. During 2015, certain collateral dependent impaired loans and other real estate owned at December 31, 2015, were adjusted down to fair value. Collateral values are estimated using Level 2 inputs based upon observable market data. Real estate values are generally valued using independent appraisals or other indications of value based on recent comparable sales of similar properties or assumptions generally available in the market.
| 113 |
| Fair value measurements at reporting date using: | Gain (losses) from fair value changes |
|||||||||||||||||||
| (in thousands) | As of | Quoted prices in active markets for identical assets | Significant other observable inputs | Significant unobservable inputs |
Twelve months ended | |||||||||||||||
| Assets: | 12/31/2015 | (Level 1) | (Level 2) | (Level 3) | 12/31/2015 | |||||||||||||||
| Impaired Loans | $ | 5,730 | $ | 0 | $ | 5,730 | $ | 0 | $ | (326 | ) | |||||||||
| Other real estate owned | 1,995 | 0 | 1,995 | 0 | 714 | |||||||||||||||
| Fair value measurements at reporting date using: | Gain (losses) from fair value changes |
|||||||||||||||||||
| (in thousands) | As of | Quoted prices in active markets for identical assets | Significant other observable inputs | Significant unobservable inputs | Twelve months ended | |||||||||||||||
| Assets: | 12/31/2014 | (Level 1) | (Level 2) | (Level 3) | 12/31/2014 | |||||||||||||||
| Impaired Loans | $ | 2,891 | $ | 0 | $ | 2,891 | $ | 0 | $ | (1,090 | ) | |||||||||
| Other real estate owned | 5,493 | 0 | 5,493 | 0 | (338 | ) | ||||||||||||||
The following table presents the carrying amounts and estimated fair values of the Company’s financial instruments at December 31, 2015 and 2014. The carrying amounts shown in the table are included in the Consolidated Statements of Condition under the indicated captions. The fair value estimates, methods and assumptions set forth below for the Company’s financial instruments, including those financial instruments carried at cost, are made solely to comply with disclosures required by generally accepted accounting principles in the United States and does not always incorporate the exit-price concept of fair value prescribed by ASC Topic 820-10 and should be read in conjunction with the financial statements and notes included in this Report.
| Estimated Fair Value of Financial Instruments | ||||||||||||||||||||
| December 31, 2015 | ||||||||||||||||||||
| (in thousands) | Carrying Amount |
Fair Value | (Level 1) | (Level 2) | (Level 3) | |||||||||||||||
| Financial Assets: | ||||||||||||||||||||
| Cash and cash equivalents | $ | 58,257 | $ | 58,257 | $ | 58,257 | $ | 0 | $ | 0 | ||||||||||
| Securities - held-to-maturity | 146,071 | 146,686 | 0 | 146,686 | ||||||||||||||||
| FHLB and FRB stock | 29,969 | 29,969 | 0 | 29,969 | 0 | |||||||||||||||
| Accrued interest receivable | 16,433 | 16,433 | 0 | 16,433 | 0 | |||||||||||||||
| Loans and leases, net1 | 3,740,038 | 3,739,695 | 0 | 5,730 | 3,733,965 | |||||||||||||||
| Financial Liabilities: | ||||||||||||||||||||
| Time deposits | $ | 855,133 | $ | 853,839 | $ | 0 | $ | 853,839 | $ | 0 | ||||||||||
| Other deposits | 3,540,173 | 3,540,173 | 0 | 3,540,173 | 0 | |||||||||||||||
| Securities sold under agreements to repurchase | 136,513 | 138,161 | 0 | 138,161 | 0 | |||||||||||||||
| Other borrowings | 525,709 | 527,041 | 0 | 527,041 | 0 | |||||||||||||||
| Trust preferred debentures | 37,509 | 45,190 | 0 | 45,190 | 0 | |||||||||||||||
| Accrued interest payable | 1,973 | 1,973 | 0 | 1,973 | 0 | |||||||||||||||
1 Lease receivables, although excluded from the scope of ASC Topic 825, are included in the estimated fair value amounts at their carrying value.
| 114 |
| Estimated Fair Value of Financial Instruments | ||||||||||||||||||||
| December 31, 2014 | ||||||||||||||||||||
| (in thousands) | Carrying Amount |
Fair Value | (Level 1) | (Level 2) | (Level 3) | |||||||||||||||
| Financial Assets: | ||||||||||||||||||||
| Cash and cash equivalents | $ | 56,070 | $ | 56,070 | $ | 56,070 | $ | 0 | $ | 0 | ||||||||||
| Securities - held-to-maturity | 88,168 | 89,036 | 0 | 89,036 | ||||||||||||||||
| FHLB and FRB stock | 21,259 | 21,259 | 0 | 21,259 | 0 | |||||||||||||||
| Accrued interest receivable | 16,518 | 16,518 | 0 | 16,518 | 0 | |||||||||||||||
| Loans and leases, net1 | 3,364,291 | 3,383,742 | 0 | 2,891 | 3,380,851 | |||||||||||||||
| Financial Liabilities: | ||||||||||||||||||||
| Time deposits | $ | 898,081 | $ | 899,871 | $ | 0 | $ | 899,871 | $ | 0 | ||||||||||
| Other deposits | 3,271,073 | 3,271,073 | 0 | 3,271,073 | 0 | |||||||||||||||
| Securities sold under agreements to repurchase | 147,037 | 151,201 | 151,201 | |||||||||||||||||
| Other borrowings | 345,580 | 350,043 | 0 | 350,043 | 0 | |||||||||||||||
| Trust preferred debentures | 37,337 | 39,453 | 0 | 39,453 | 0 | |||||||||||||||
| Accrued interest payable | 1,868 | 1,868 | 0 | 1,868 | 0 | |||||||||||||||
1 Lease receivables, although excluded from the scope of ASC Topic 825, are included in the estimated fair value amounts at their carrying value.
The following methods and assumptions were used in estimating fair value disclosures for financial instruments.
Cash and Cash Equivalents: The carrying amounts reported in the Consolidated Statements of Condition for cash, noninterest-bearing deposits, money market funds, and Federal funds sold approximate the fair value of those assets.
Securities: Fair values for U.S. Treasury securities are based on quoted market prices. Fair values for obligations of U.S. government sponsored entities, mortgage-backed securities-residential, obligations of U.S. states and political subdivisions, and U.S. corporate debt securities are based on quoted market prices, where available, as provided by third party pricing vendors. If quoted market prices were not available, fair values are based on quoted market prices of comparable instruments in active markets and/or based upon matrix pricing methodology, which uses comprehensive interest rate tables to determine market price, movement and yield relationships. For miscellaneous equity securities, carrying value is cost. These securities are reviewed periodically to determine if there are any events or changes in circumstances that would adversely affect their value.
FHLB stock: The carrying amount of FHLB stock approximates fair value. If the stock is redeemed, the Company will receive an amount equal to the par value of the stock.
Loans and Leases: The fair values of residential loans are estimated using discounted cash flow analyses, based upon available market benchmarks for rates and prepayment assumptions. The fair values of commercial and consumer loans are estimated using discounted cash flow analyses, based upon interest rates currently offered for loans and leases with similar terms and credit quality. The fair value of loans held for sale are determined based upon contractual prices for loans with similar characteristics.
ACCRUED INTEREST RECEIVABLE AND ACCRUED INTEREST PAYABLE: The carrying amount of these short term instruments approximate fair value.
Deposits: The fair values disclosed for noninterest bearing accounts and accounts with no stated maturities are equal to the amount payable on demand at the reporting date. The fair value of time deposits is based upon discounted cash flow analyses using rates offered for FHLB advances, which is the Company’s primary alternative source of funds.
Securities Sold Under Agreements to Repurchase: The carrying amounts of repurchase agreements and other short-term borrowings approximate their fair values. Fair values of long-term borrowings are estimated using a discounted cash flow approach, based on current market rates for similar borrowings. For securities sold under agreements to repurchase where the Company has elected the fair value option, the Company also receives pricing information from third parties, including the FHLB.
| 115 |
Other Borrowings: The fair values of other borrowings are estimated using discounted cash flow analysis, discounted at the Company’s current incremental borrowing rate for similar borrowing arrangements. For other borrowings where the Company has elected the fair value option, the Company also receives pricing information from third parties, including the FHLB.
TRUST PREFERRED DEBENTURES: The fair value of the trust preferred debentures has been estimated using a discounted cash flow analysis which uses a discount factor of a market spread over current interest rates for similar instruments.
Note 20 Regulations and Supervision
Capital Requirements:
The Company and its subsidiary banks are subject to various regulatory capital requirements administered by Federal bank regulatory agencies. Failure to meet minimum capital requirements can initiate certain mandatory and possibly additional discretionary actions by regulators that, if undertaken, could have a direct material adverse effect on the Company’s business, results of operation and financial condition. Under capital adequacy guidelines and the regulatory framework for prompt corrective action (PCA), banks must meet specific guidelines that involve quantitative measures of assets, liabilities, and certain off-balance-sheet items as calculated under regulatory accounting practices. Capital amounts and classifications of the Company and its subsidiary banks are also subject to qualitative judgments by regulators concerning components, risk weightings, and other factors. Quantitative measures established by regulation to ensure capital adequacy require the maintenance of minimum amounts and ratios (set forth in the table below) of common equity Tier II capital total capital and Tier 1 capital (as defined in the regulations) to risk-weighted assets (as defined), and of Tier 1 capital to average assets (as defined). Management believes that the Company and its subsidiary banks meet all capital adequacy requirements to which they are subject.
As of December 31, 2015, the most recent notifications from Federal bank regulatory agencies categorized Tompkins Trust Company, The Bank of Castile, Mahopac Bank, and VIST Bank as “well capitalized” under the regulatory framework for PCA. To be categorized as well capitalized, the Company and its subsidiary banks must maintain total risk-based, Tier 1 risk-based, common equity Tier 1 capital and Tier 1 leverage ratios as set forth in the table below. There are no conditions or events since that notification that management believes have changed the capital category of the Company or its subsidiary banks. Actual capital amounts and ratios of the Company and its subsidiary banks are as follows:
| 116 |
| Actual | Required to be Adequately Capitalized |
Required to be Well Capitalized |
|||||
| (dollar amounts in thousands) | Amount/Ratio | Amount/Ratio | Amount/Ratio | ||||
| December 31, 2015 | |||||||
| Total Capital (to risk-weighted assets) | |||||||
| The Company (consolidated) | $520,891/13.0% | >$319,711/>8.0% | >$399,638/>10.0% | ||||
| Trust Company | $151,299/13.7% | >$88,274/>8.0% | >$110,342/>10.0% | ||||
| Castile | $104,568/10.5% | >$79,657/>8.0% | >$99,571/>10.0% | ||||
| Mahopac | $110,158/14.0% | >$62,943/>8.0% | >$78,678/>10.0% | ||||
| VIST | $133,925/12.4% | >$86,371/>8.0% | >$107,964/>10.0% | ||||
| Common EquityTier 1 Capital (to risk-weighted assets) | |||||||
| The Company (consolidated) | $449,535/11.3% | >$179,837/>4.5% | >$259,765/>6.5% | ||||
| Trust Company | $143,005/13.0% | >$49,654/>4.5% | >$71,722/>6.5% | ||||
| Castile | $97,097/9.8% | >$44,807/>4.5% | >$64,721/>6.5% | ||||
| Mahopac | $100,322/12.8% | >$35,405/>4.5% | >$51,141/>6.5% | ||||
| VIST | $127,229/11.8% | >$48,584/>4.5% | >$70,177/>6.5% | ||||
| Tier 1 Capital (to risk-weighted assets) | |||||||
| The Company (consolidated) | $487,043/12.2% | >$239,783/>6.0% | >$319,711/>8.0% | ||||
| Trust Company | $143,005/13.0% | >$66,205/>6.0% | >$88,274/>8.0% | ||||
| Castile | $97,097/9.8% | >$59,743/>6.0% | >$79,657/>8.0% | ||||
| Mahopac | $100,322/12.8% | >$47,207/>6.0% | >$62,943/>8.0% | ||||
| VIST | $127,229/11.8% | >$64,779/>6.0% | >$86,371/>8.0% | ||||
| Tier 1 Capital (to average assets) | |||||||
| The Company (consolidated) | $487,043/8.8% | >$220,995/>4.0% | >$276,243/>5.0% | ||||
| Trust Company | $143,005/8.0% | >$71,319/>4.0% | >$89,148/>5.0% | ||||
| Castile | $97,097/7.7% | >$50,309/>4.0% | >$62,887/>5.0% | ||||
| Mahopac | $100,322/9.2% | >$43,865/>4.0% | >$54,831/>5.0% | ||||
| VIST | $127,229/9.1% | >$55,650/>4.0% | >$69,563/>5.0% | ||||
| December 31, 2014 | |||||||
| Total Capital (to risk-weighted assets) | |||||||
| The Company (consolidated) | $474,358/13.6% | >$278,992/>8.0% | >$348,741/>10.0% | ||||
| Trust Company | $137,424/13.8% | >$79,626/>8.0% | >$99,533/>10.0% | ||||
| Castile | $95,008/11.3% | >$67,040/>8.0% | >$83,799/>10.0% | ||||
| Mahopac | $103,036/15.0% | >$54,884/>8.0% | >$68,605/>10.0% | ||||
| VIST | $120,464/12.7% | >$75,674/>8.0% | >$94,592/>10.0% | ||||
| Tier 1 Capital (to risk-weighted assets) | |||||||
| The Company (consolidated) | $444,947/12.8% | >$139,496/>4.0% | >$209,244/>6.0% | ||||
| Trust Company | $129,751/13.0% | >$39,813/>4.0% | >$57,920/>6.0% | ||||
| Castile | $88,288/10.5% | >$33,520/>4.0% | >$50,280/>6.0% | ||||
| Mahopac | $94,445/13.8% | >$27,442/>4.0% | >$41,163/>6.0% | ||||
| VIST | $115,276/12.2% | >$37,837/>4.0% | >$56,755/>6.0% | ||||
| Tier 1 Capital (to average assets) | |||||||
| The Company (consolidated) | $444,947/8.7% | >$152,534/>3.0% | >$254,223/>5.0% | ||||
| Trust Company | $129,751/7.8% | >$49,823/>3.0% | >$83,038/>5.0% | ||||
| Castile | $88,288/7.8% | >$34,115/>3.0% | >$56,858/>5.0% | ||||
| Mahopac | $94,445/9.2% | >$30,896/>3.0% | >$51,494/>5.0% | ||||
| VIST | $115,276/9.0% | >$38,236/>3.0% | >$63,727/>5.0% |
| 117 |
Note 21 Condensed Parent Company Only Financial Statements
Condensed financial statements for Tompkins (the Parent Company) as of December 31 are presented below.
| Condensed Statements of Condition | ||||||||
| (in thousands) | 2015 | 2014 | ||||||
| Assets | ||||||||
| Cash | $ | 5,759 | $ | 6,646 | ||||
| Available-for-sale securities, at fair value | 0 | 225 | ||||||
| Investment in subsidiaries, at equity | 548,227 | 517,131 | ||||||
| Other | 12,940 | 15,951 | ||||||
| Total Assets | $ | 566,926 | $ | 539,953 | ||||
| Liabilities and Shareholders’ Equity | ||||||||
| Borrowings | $ | 13,510 | $ | 13,500 | ||||
| Trust preferred debentures issued to non-consolidated subsidiary | 37,509 | 37,337 | ||||||
| Other liabilities | 893 | 985 | ||||||
| Tompkins Financial Corporation Shareholders’ Equity | 515,014 | 488,131 | ||||||
| Total Liabilities and Shareholders’ Equity | $ | 566,926 | $ | 539,953 | ||||
| Condensed Statements of Income | ||||||||||||
| (in thousands) | 2015 | 2014 | 2013 | |||||||||
| Dividends from available-for-sale securities | $ | 2 | $ | 2 | $ | 4 | ||||||
| Dividends received from subsidiaries | 28,667 | 28,727 | 25,991 | |||||||||
| Other income | 593 | 1,059 | 1,627 | |||||||||
| Total Operating Income | 29,262 | 29,788 | 27,622 | |||||||||
| Interest expense | 2,648 | 2,703 | 3,087 | |||||||||
| Other expenses | 5,996 | 6,484 | 6,352 | |||||||||
| Total Operating Expenses | 8,644 | 9,187 | 9,439 | |||||||||
| Income Before Taxes and Equity in Undistributed | ||||||||||||
| Earnings of Subsidiaries | 20,618 | 20,601 | 18,183 | |||||||||
| Income tax benefit | 2,987 | 3,654 | 3,959 | |||||||||
| Equity in undistributed earnings of subsidiaries | 34,816 | 27,786 | 28,714 | |||||||||
| Net Income | $ | 58,421 | $ | 52,041 | $ | 50,856 | ||||||
| 118 |
| Condensed Statements of Cash Flows | ||||||||||||
| (in thousands) | 2015 | 2014 | 2013 | |||||||||
| Operating activities | ||||||||||||
| Net income | $ | 58,421 | $ | 52,041 | $ | 50,856 | ||||||
| Adjustments to reconcile net income to net cash provided by operating activities Equity in undistributed earnings of subsidiaries | (34,816 | ) | (27,799 | ) | (28,800 | ) | ||||||
| Other, net | 1,153 | (1,233 | ) | (1,807 | ) | |||||||
| Net Cash Provided by Operating Activities | 24,758 | 23,009 | 20,249 | |||||||||
| Investing activities | ||||||||||||
| Other, net | 81 | 85 | (3,482 | ) | ||||||||
| Net Cash Used in Investing Activities | 81 | 85 | (3,482 | ) | ||||||||
| Financing activities | ||||||||||||
| Borrowings, net | 0 | (1,000 | ) | (10,691 | ) | |||||||
| Cash dividends | (25,411 | ) | (23,983 | ) | (22,463 | ) | ||||||
| Repurchase of common shares | (3,505 | ) | (4,602 | ) | 0 | |||||||
| Redemption of trust preferred debentures | (195 | ) | 64 | 40 | ||||||||
| Shares issued for dividend reinvestment plans | 0 | 2,186 | 4,046 | |||||||||
| Shares issued for employee stock ownership plan | 1,595 | 1,528 | 717 | |||||||||
| Net proceeds from exercise of stock options | 1,382 | 1,512 | 4,683 | |||||||||
| Tax benefits of stock options exercised | 358 | 234 | 331 | |||||||||
| Common stock issued | 50 | 50 | 0 | |||||||||
| Net Cash (Used in) Provided by Financing Activities | (25,726 | ) | (24,011 | ) | (23,337 | ) | ||||||
| Net (decrease) increase in cash | (887 | ) | (917 | ) | (6,570 | ) | ||||||
| Cash at beginning of year | 6,646 | 7,563 | 14,135 | |||||||||
| Cash at End of Year | $ | 5,759 | $ | 6,646 | $ | 7,565 | ||||||
A Statement of Changes in Shareholders’ Equity has not been presented since it is the same as the Consolidated Statement of Changes in shareholders’ Equity previously presented.
Note 22 Segment and Related Information
The Company manages its operations through three reportable business segments in accordance with the standards set forth in FASB ASC 280, “Segment Reporting”: (i) banking and financial services (“Banking”), (ii) insurance services (“Tompkins Insurance Agencies, Inc”) and (iii) wealth management (“Tompkins Financial Advisors”). The Company’s insurance services and wealth management services are managed separately from the Banking segment.
Banking
The bank segment is primarily comprised of its four banking subsidiaries: Tompkins Trust Company; a commercial bank with thirteen banking offices operated in Ithaca, NY and surrounding communities, the Bank of Castile (DBA Tompkins Bank of Castile); a commercial bank with seventeen banking offices located in the Genesee Valley region of New York State as well as Monroe County; Mahopac Bank (DBA Tompkins Mahopac Bank); a commercial bank with fourteen full-service banking offices located in the counties north of New York City; and VIST Bank (DBA Tompkins VIST Bank), a banking organization with nineteen banking offices headquartered and operating in Southeastern Pennsylvania.
Banking services consist primarily of attracting deposits from the areas served by the Company’s banking subsidiaries and using those deposits to originate a variety of commercial loans, agricultural loans, consumer loans, real estate loans and leases in those same areas. The Company’s subsidiary banks provide a variety of retail banking services including checking accounts, savings accounts, time deposits, IRA products, residential mortgage loans, personal loans, home equity loans, credit cards, debit cards and safe deposit services delivered through its branch facilities, ATMs, voice response, mobile banking, Internet banking and remote deposit services. The Company’s subsidiary banks also provide a variety of commercial banking services such as lending activities for a variety of business purposes, including real estate financing, construction, equipment financing, accounts receivable financing and commercial leasing. Other commercial services include deposit and cash management services, letters of credit, sweep accounts, credit cards, Internet-based account services, mobile banking and remote deposit services. The banking subsidiaries do not engage in sub-prime lending.
| 119 |
Insurance
The Company provides property and casualty insurance services and employee benefits consulting through Tompkins Insurance Agencies, Inc; a 100% wholly-owned subsidiary of the Company, headquartered in Batavia, New York. Tompkins Insurance is an independent insurance agency, representing many major insurance carriers and provides employee benefit consulting to employers in Western and Central New York and Southeastern Pennsylvania, assisting them with their medical, group life insurance and group disability insurance. Through the 2012 acquisition of VIST Financial, Tompkins Insurance expanded its operations with the addition of VIST Insurance, a full service agency offering a similar array of insurance products as Tompkins Insurance in southeastern Pennsylvania. Tompkins Insurance offers services to customers of the Company’s banking subsidiaries by sharing offices with The Bank of Castile, Tompkins Trust Company and VIST Bank. In addition to these shared offices, Tompkins Insurance has five stand-alone offices in Western New York, one stand-alone office in Tompkins County, New York and one stand-alone office in Montgomery County, Pennsylvania.
Wealth Management
The Wealth Management segment is generally organized under the Tompkins Financial Advisors brand. Tompkins Financial Advisors offers a comprehensive suite of financial services to customers, including trust and estate services, investment management and financial and insurance planning for individuals, corporate executives, small business owners and high net worth individuals. Tompkins Advisors has offices in each of the Company’s four subsidiary banks. As part of the acquisition of VIST Financial Corp. in 2012, VIST Capital Management, LLC was added into Tompkins Financial Advisors brand; offering a complimentary assortment of full service investment advisory and brokerage services for individual financial planning, investments and corporate and small business pension and retirement planning solutions.
Summarized financial information concerning the Company’s reportable segments and the reconciliation to the Company’s consolidated results is shown in the following table. Investment in subsidiaries is netted out of the presentations below. The “Intercompany” column identifies the intercompany activities of revenues, expenses and other assets between the banking and financial services segments. The Company accounts for intercompany fees and services at an estimated fair value according to regulatory requirements for the services provided. Intercompany items relate primarily to the use of human resources, information systems, accounting and marketing services provided by any of the banks and the holding company. All other accounting policies are the same as those described in Note 1 “Summary of significant accounting policies” in this report.
| As of and for the year ended December 31, 2015 | ||||||||||||||||||||
| (in thousands) | Banking | Insurance | Wealth Management | Intercompany | Consolidated | |||||||||||||||
| Interest income | $ | 188,598 | $ | 2 | $ | 148 | $ | (2 | ) | $ | 188,746 | |||||||||
| Interest expense | 20,367 | 0 | 0 | (2 | ) | 20,365 | ||||||||||||||
| Net interest income | 168,231 | 2 | 148 | 0 | 168,381 | |||||||||||||||
| Provision for loan and lease losses | 2,945 | 0 | 0 | 0 | 2,945 | |||||||||||||||
| Noninterest income | 27,096 | 29,818 | 16,037 | (1,011 | ) | 71,940 | ||||||||||||||
| Noninterest expense | 115,706 | 23,783 | 11,384 | (1,011 | ) | 149,862 | ||||||||||||||
| Income before income tax expense | 76,676 | 6,037 | 4,801 | 0 | 87,514 | |||||||||||||||
| Income tax expense | 24,923 | 2,416 | 1,623 | 0 | 28,962 | |||||||||||||||
| Net Income attributable to noncontrolling interests and Tompkins Financial Corporation | 51,753 | 3,621 | 3,178 | 0 | 58,552 | |||||||||||||||
| Less: Net income attributable to noncontrolling interests | 131 | 0 | 0 | 0 | 131 | |||||||||||||||
| Net Income attributable to Tompkins Financial Corporation | $ | 51,622 | $ | 3,621 | $ | 3,178 | $ | 0 | $ | 58,421 | ||||||||||
| Depreciation and amortization | $ | 5,985 | $ | 367 | $ | 116 | $ | 0 | $ | 6,468 | ||||||||||
| Assets | 5,646,459 | 36,625 | 13,951 | (7,040 | ) | 5,689,995 | ||||||||||||||
| Goodwill | 64,500 | 19,662 | 8,081 | 0 | 92,243 | |||||||||||||||
| Other intangibles, net | 7,820 | 4,187 | 441 | 0 | 12,448 | |||||||||||||||
| Net loans and leases | 3,740,038 | 0 | 0 | 0 | 3,740,038 | |||||||||||||||
| Deposits | 4,401,896 | 0 | 0 | (6,590 | ) | 4,395,306 | ||||||||||||||
| Total equity | 476,138 | 28,182 | 12,146 | 0 | 516,466 | |||||||||||||||
| 120 |
| As of and for the year ended December 31, 2014 | ||||||||||||||||||||
| (in thousands) | Banking | Insurance | Wealth Management | Intercompany & Merger |
Consolidated | |||||||||||||||
| Interest income | $ | 184,355 | $ | 6 | $ | 138 | $ | (6 | ) | $ | 184,493 | |||||||||
| Interest expense | 20,687 | 2 | 0 | (6 | ) | 20,683 | ||||||||||||||
| Net interest income | 163,668 | 4 | 138 | 0 | 163,810 | |||||||||||||||
| Provision for loan and lease losses | 2,306 | 0 | 0 | 0 | 2,306 | |||||||||||||||
| Noninterest income | 27,418 | 28,620 | 16,072 | (1,345 | ) | 70,765 | ||||||||||||||
| Noninterest expense | 120,708 | 23,515 | 11,815 | (1,345 | ) | 154,693 | ||||||||||||||
| Income before income tax expense | 68,072 | 5,109 | 4,395 | 0 | 77,576 | |||||||||||||||
| Income tax expense | 21,890 | 2,052 | 1,462 | 0 | 25,404 | |||||||||||||||
| Net Income attributable to noncontrolling interests and Tompkins Financial Corporation | 46,182 | 3,057 | 2,933 | 0 | 52,172 | |||||||||||||||
| Less: Net income attributable to noncontrolling interests | 131 | 0 | 0 | 0 | 131 | |||||||||||||||
| Net Income attributable to Tompkins Financial Corporation | $ | 46,051 | $ | 3,057 | $ | 2,933 | $ | 0 | $ | 52,041 | ||||||||||
| Depreciation and amortization | $ | 5,296 | $ | 271 | $ | 143 | $ | 0 | $ | 5,710 | ||||||||||
| Assets | 5,226,145 | 34,040 | 13,779 | (4,403 | ) | 5,269,561 | ||||||||||||||
| Goodwill | 64,369 | 19,662 | 8,211 | 0 | 92,242 | |||||||||||||||
| Other intangibles, net | 9,301 | 4,827 | 521 | 0 | 14,649 | |||||||||||||||
| Net loans and leases | 3,364,291 | 0 | 0 | 0 | 3,364,291 | |||||||||||||||
| Deposits | 4,173,244 | 0 | 0 | (4,090 | ) | 4,169,154 | ||||||||||||||
| Total equity | 453,037 | 26,419 | 10,127 | 0 | 489,583 | |||||||||||||||
| As of and for the year ended December 31, 2013 | ||||||||||||||||||||
| (in thousands) | Banking | Insurance | Wealth Management | Intercompany & Merger | Consolidated | |||||||||||||||
| Interest income | $ | 184,914 | $ | 8 | $ | 189 | $ | (7 | ) | $ | 185,104 | |||||||||
| Interest expense | 23,982 | 0 | 0 | (7 | ) | 23,975 | ||||||||||||||
| Net interest income | 160,932 | 8 | 189 | 0 | 161,129 | |||||||||||||||
| Provision for loan and lease losses | 6,161 | 0 | 0 | 0 | 6,161 | |||||||||||||||
| Noninterest income | 27,870 | 27,660 | 15,889 | (1,521 | ) | 69,898 | ||||||||||||||
| Noninterest expense | 119,926 | 22,431 | 12,266 | (1,521 | ) | 153,102 | ||||||||||||||
| Income before income tax expense | 62,715 | 5,237 | 3,812 | 0 | 71,764 | |||||||||||||||
| Income tax expense | 17,434 | 2,057 | 1,286 | 0 | 20,777 | |||||||||||||||
| Net Income attributable to noncontrolling interests and Tompkins Financial Corporation | 45,281 | 3,180 | 2,526 | 0 | 50,987 | |||||||||||||||
| Less: Net income attributable to noncontrolling interests | 131 | 0 | 0 | 0 | 131 | |||||||||||||||
| Net Income attributable to Tompkins Financial Corporation | $ | 45,150 | $ | 3,180 | $ | 2,526 | $ | 0 | $ | 50,856 | ||||||||||
| Depreciation and amortization | $ | 5,360 | $ | 210 | $ | 135 | $ | 0 | $ | 5,706 | ||||||||||
| Assets | 4,965,154 | 31,639 | 12,730 | (6,484 | ) | 5,003,039 | ||||||||||||||
| Goodwill | 64,369 | 19,560 | 8,211 | 0 | 92,140 | |||||||||||||||
| Other intangibles, net | 10,716 | 4,988 | 594 | 0 | 16,298 | |||||||||||||||
| Net loans and leases | 3,166,314 | 0 | 0 | 0 | 3,166,314 | |||||||||||||||
| Deposits | 3,953,428 | 0 | 0 | (6,212 | ) | 3,947,216 | ||||||||||||||
| Total equity | 421,631 | 25,812 | 10,496 | 0 | 457,939 | |||||||||||||||
| 121 |
| Unaudited Quarterly Financial Data | ||||||||||||||||
| 2014 | ||||||||||||||||
| (in thousands) | First | Second | Third | Fourth | ||||||||||||
| Interest and dividend income | $ | 45,365 | $ | 45,819 | $ | 46,618 | $ | 46,691 | ||||||||
| Interest expense | 5,338 | 5,303 | 5,043 | 4,999 | ||||||||||||
| Net interest income | 40,027 | 40,516 | 41,575 | 41,692 | ||||||||||||
| Provision for loan and lease losses | 743 | 67 | (59 | ) | 1,555 | |||||||||||
| Income before income tax | 18,508 | 19,241 | 20,652 | 19,175 | ||||||||||||
| Net income | 12,569 | 13,061 | 13,722 | 12,689 | ||||||||||||
| Net income per common share (basic) | 0.85 | 0.88 | 0.92 | 0.86 | ||||||||||||
| Net income per common share (diluted) | 0.84 | 0.87 | 0.92 | 0.85 | ||||||||||||
| Item 9. | Changes in and Disagreements with Accountants on Accounting and Financial Disclosure |
None.
| Item 9A. | Controls and Procedures |
Evaluation of Disclosure Controls and Procedures
The Company’s management, including its Chief Executive Officer and Chief Financial Officer, evaluated the effectiveness of the design and operation of the Company’s disclosure controls and procedures (as defined in Rule 13a-15(e) under the Exchange Act) as of December 31, 2015. Based upon that evaluation, the Company’s Chief Executive Officer and Chief Financial Officer concluded that as of the end of the period covered by this Form 10-K, the Company’s disclosure controls and procedures were effective.
Management’s Annual Report on Internal Control Over Financial Reporting
The Company’s management is responsible for establishing and maintaining adequate internal control over financial reporting for the Company. As of December 31, 2015, management evaluated the effectiveness of the Company’s internal control over financial reporting based on the framework for effective internal control over financial reporting established in “Internal Control - Integrated Framework (2013),” issued by the Committee of Sponsoring Organizations (COSO) of the Treadway Commission. Based on its evaluation under the COSO framework, management concluded that the Company’s internal control over financial reporting was effective as of December 31, 2015. The results of management’s assessment was reviewed with the Company’s Audit Committee of its Board of Directors. The registered public accounting firm that audited the Company’s financial statements included in this report has issued a report on the Company’s internal controls over financial reporting, which is included in Part II, Item 8 of this Report.
| 122 |
Changes in Internal Control Over Financial Reporting
There were no changes in the Company’s internal control over financial reporting that occurred during the year ended December 31, 2015, that materially affected, or are reasonably likely to materially affect, the Company’s internal control over financial reporting.
| Item 9B. | Other Information |
None.
| Item 10. | Directors, Executive Officers and Corporate Governance |
The information required by this item is incorporated herein by reference to the material under the captions “Proposal No. 1 – Election of Directors” and “Section 16(a) Beneficial Ownership Reporting Compliance”; the discussion of the Company’s code of ethics under “Proposal No. 1 – Election of Directors - Corporate Governance Matters”; and the discussion of the Audit/Examining Committee under “Proposal No. 1 – Election of Directors - Matters Relating to the Board of Directors - Board of Directors Meetings and Committees” all in the Company’s proxy statement relating to its 2016 annual meeting of shareholders (the “Proxy Statement”), which the Company intends to file with the Securities and Exchange Commission on or about April 1, 2016; and the material captioned “Executive Officers of the Registrant” in Part I of this Report on Form 10-K.
| Item 11. | Executive Compensation |
The information called for by this item is incorporated herein by reference to the material under the captions, “Executive Compensation”, “Proposal No. 1 - Election of Directors - Director Compensation”, “Executive Compensation – Compensation Committee Interlocks and Insider Participation” and “Executive Compensation – Compensation Committee Report” in the Proxy Statement.
The material incorporated herein by reference to the material under the caption “Executive Compensation - Compensation Committee Report” in the Proxy Statement is deemed “furnished” within this Report on Form 10-K and shall not be deemed to be “soliciting material” or to be “filed” with the Commission or subject to Regulation 14A, or to the liabilities of Section 18 of the Exchange Act, and shall not be deemed to be incorporated by reference into any filing under the Securities Act or the Exchange Act, except to the extent that the Company specifically requests that the information be treated as soliciting material or specifically incorporates it by reference into such filing.
| Item 12. | Security Ownership of Certain Beneficial Owners and Management and Related Stockholder Matters |
Information regarding security ownership of management and certain beneficial owners is incorporated by reference to all information under the caption of “Security Ownership of Certain Beneficial Owners and Management” in the Proxy Statement.
| 123 |
Information regarding stock-based compensation awards outstanding and available for future grant as of December 31, 2015 is presented in the table below.
Equity Compensation Plan Information
| Plan Category | Number of Securities to be Issued Upon Exercise of Outstanding Options, Warrants and Rights |
Weighted Average Exercise Price of Outstanding Options, Warrants and Rights |
Number of Securities Remaining Available For Future Issuance Under Equity Compensation Plans (excluding Securities in Column (a)) |
||||
| Equity Compensation Plans Approved by Security Holders | 688,363 | $44.29 | 117,327 | ||||
| Equity Compensation Plans Not Approved by Security Holders | 0 | 0 | 0 |
| Item 13. | Certain Relationships and Related Transactions, and Director Independence |
The information called for by this item is incorporated herein by reference to the material under the captions “Proposal No. 1 - Election of Directors - Corporate Governance Matters - Affirmative Determination of Director Independence” and “Transactions with Related Persons” in the Proxy Statement.
| Item 14. | Principal Accountant Fees and Services |
The information called for by this item is incorporated herein by reference to the material under the caption “Independent Registered Public Accounting Firm” in the Proxy Statement.
| Item 15. | Exhibits and Financial Statement Schedules |
| (a)(1) | The following financial statements and Report of KPMG are included in this Annual Report on Form 10-K: |
| Report of KPMG LLP, Independent Registered Public Accounting Firm
Consolidated Statements of Condition for the years ended December 31, 2015 and 2014 Consolidated Statements of Income for the years ended December 31, 2015, 2014, and 2013 Consolidated Statement of Comprehensive Income for the years ended December 31, 2015, 2014, and 2013 Consolidated Statements of Cash Flows for the years ended December 31, 2015, 2014, and 2013 Consolidated Statements of Changes in Shareholders’ Equity for the years ended December 31, 2015, 2014, and 2013 Notes to Consolidated Financial Statements Unaudited Quarterly Financial Data |
| (a)(2) | List of Financial Schedules |
|
Not Applicable. |
| (a)(3) | Exhibits |
|
The exhibits listed on the Exhibit Index of this Annual Report on Form 10-K, incorporated by reference in this Item 15, have been previously filed, are filed herewith, or are incorporated herein by reference to other filings. |
| 124 |
SIGNATURES
Pursuant to the requirements of Section 13 or 15(d) of the Securities Exchange Act of 1934, the registrant has duly caused this report to be signed on its behalf by the undersigned, thereunto duly authorized.
| TOMPKINS FINANCIAL CORPORATION | ||
| /S/ Stephen S. Romaine | ||
| By: | Stephen S. Romaine | |
| President and Chief Executive Officer | ||
| (Principal Executive Officer) | ||
| Date: March 15, 2016 | ||
| 125 |
POWER OF ATTORNEY
KNOW ALL PERSONS BY THESE PRESENTS, that each person whose signature appears below constitutes and appoints, jointly and severally, Stephen S. Romaine and Francis M. Fetsko, and each of them, as his or her true and lawful attorneys-in-fact and agents, each with full power of substitution, for him or her, and in his or her name, place and stead, in any and all capacities, to sign any amendments to this Report on Form 10-K, and to file the same, with Exhibits thereto and other documents in connection therewith, with the Securities and Exchange Commission, granting unto said attorneys-in-fact and agents, and each of them, full power and authority to do and perform each and every act and thing requisite or necessary to be done as fully to all intents and purposes as he or she might or could do in person, hereby ratifying and confirming all that said attorneys-in-fact and agents, or any of them, or their substitutes, may lawfully do or cause to be done by virtue hereof.
Pursuant to the requirements of the Securities Exchange Act of 1934, this report has been signed by the following persons on behalf of the Registrant and in the capacities and on the dates indicated.
| Signature | Date | Capacity | Signature | Date |
Capacity
|
|||||
| /S/Thomas R. Rochon | 3/15/16 | Chairman of the Board | /S/Carl E. Haynes | 3/15/16 | Director | |||||
| Thomas R. Rochon | Director | Carl E. Haynes | ||||||||
| /S/Stephen S. Romaine | 3/15/16 | President and Chief Executive | /S/Susan A. Henry | 3/15/16 | Director | |||||
| Stephen S. Romaine | Officer (Principal Executive Officer) | Susan A. Henry | ||||||||
| Director | ||||||||||
| /S/James W. Fulmer | 3/15/16 | Vice Chairman, Director | /S/Patricia A. Johnson | 3/15/16 | Director | |||||
| James W. Fulmer | Patricia A. Johnson | |||||||||
| /S/Francis M. Fetsko | 3/15/16 | Executive Vice President and | /S/Frank C. Milewski | 3/15/16 | Director | |||||
| Francis M. Fetsko | Chief Financial Officer | Frank C. Milewski | ||||||||
| (Principal Financial Officer) | ||||||||||
| (Principal Accounting | /S/Sandra A. Parker | 3/15/16 | Director | |||||||
| Officer) | Sandra A. Parker | |||||||||
| /S/John E. Alexander | 3/15/16 | Director | ||||||||
| John E. Alexander | /S/Michael H. Spain | |||||||||
| Michael H. Spain | 3/15/16 | Director | ||||||||
| /S/Paul J. Battaglia | 3/15/16 | Director | ||||||||
| Paul J. Battaglia | /S/Alfred J. Weber | |||||||||
| Alfred J. Weber | 3/15/16 | Director | ||||||||
| /S/Daniel J. Fessenden | 3/15/16 | Director | ||||||||
| Daniel J. Fessenden | /S/Craig Yunker | |||||||||
| Craig Yunker | 3/15/16 | Director |
| 126 |
|
(a)(3) Exhibits
|
||
| Item No. | Description | |
| 2.1 | Agreement and Plan of Reorganization, dated as of March 14, 1995, among the Bank, the Company and the Interim Bank, incorporated herein by reference to Exhibit 2 to the Company’s Registration Statement on From 8-A (No. 0-38625), filed with the Commission on January 22, 1996. | |
| 2.2 | Agreement and Plan of Reorganization, dated as of July 30, 1999, between the Company and Letchworth, incorporated herein by reference to Annex A to the Company’s Registration Statement on Form S-4 (Registration No. 333-90411), filed with the Commission on November 5, 1999. | |
| 2.3 | Agreement and Plan of Merger, dated January 25, 2012, by and among the Company, TMP Mergeco, Inc. and VIST Financial Corp., incorporated herein by reference to Exhibit 2.1 to the Company’s Current Report on Form 8-K, filed with the Commission on January 26, 2012. | |
| 2.4 | First Amendment to the Agreement and Plan of Merger, dated July 31, 2012, by and among the Company, TMP Mergeco, Inc. and VIST Financial Corp., incorporated herein by reference to Exhibit 10.1 to the Company’s Amended Quarterly Report on Form 10-Q/A, filed with the Commission on September 7, 2012. | |
| 3.1 | Amended and Restated Certificate of Incorporation of the Company, incorporated herein by reference to Exhibit 3(i) to the Company’s Form 10-Q, filed with the Commission on August 11, 2008. | |
| 3.2 | Second Amended and Restated Bylaws of the Company, incorporated herein by reference to Exhibit 3.1 to the Company’s Current Report on Form 8-K, filed with the Commission on January 31, 2011. | |
| 4.1 | Form of Specimen Common Stock Certificate of the Company, incorporated herein by reference to Exhibit 4 to the Company’s Registration Statement on Form 8-A (No. 0-27514), filed with the Commission on December 29, 1995. | |
| 4.2 | Indenture (Tompkins Capital Trust I), dated as of April 10, 2009, incorporated herein by reference to Exhibit 4.1 to the Company’s Current Report on Form 8-K, filed with the Commission on April 16, 2009. | |
| 4.3 | Form of Subordinated Debenture (Tompkins Capital Trust I), included as Exhibit A to Exhibit 4.2 and incorporated herein by reference. | |
| 4.4 | Amended and Restated Trust Agreement (Tompkins Capital Trust I), dated as of April 10, 2009, incorporated herein by reference to Exhibit 4.3 to the Company’s Current Report on Form 8-K, filed with the Commission on April 16, 2009. | |
| 4.5 | Form of Convertible Preferred Security Certificate of Tompkins Capital Trust I, included as Exhibit D to Exhibit 4.4 and incorporated herein by reference. | |
| 4.6 | Preferred Securities Guarantee Agreement, dated as of April 10, 2009, incorporated herein by reference to Exhibit 4.5 to the Company’s Current Report on From 8-K, filed with the Commission on April 16, 2009. | |
| 4.7 | Agreement as to Expenses and Liabilities, dated as of April 10, 2009, incorporated herein by reference to Exhibit 4.6 to the Company’s Current Report on Form 8-K, filed with the Commission on April 16, 2009. | |
| 10.1* | Supplemental Executive retirement Agreement between Scott L. Gruber and Tompkins Financial Corporation dated April 30, 2013, incorporated herein by reference to Exhibit 10.1 to the Company’s Annual Report on Form 10-K, filed with the Commission on March 17, 2015. | |
| 10.2* | Amended and Restated Retainer Plan for Eligible Directors of Tompkins Financial Corporation and Its Wholly-owned Subsidiaries incorporated by reference to Exhibit 10.2 to the Company’s Annual Report on Form 10-K, filed with the Commission on March 16, 2009. | |
| 10.3* | Form of Director Deferred Compensation Agreement, incorporated herein by reference to Exhibit 10.4 to the Company’s Registration Statement on Form 8-A (No. 0-27514), filed with the Commission on December 29, 1995. | |
| 10.4* | Deferred Compensation Plan for Senior Officers, incorporated herein by reference to Exhibit 10.5 to the Company’s Registration Statement on Form 8-A (No. 0-27514), filed with the Commission on December 29, 1995. | |
| 10.5 | Lease Agreement dated August 20, 1993, between Tompkins County Trust Company and Comex Plaza Associates, relating to leased property at the Rothschild Building, Ithaca, NY, incorporated herein by reference to Exhibit 10.8 to the Company’s Form 10-K, filed with the Commission on March 26, 1996. | |
| 10.6* | 2001 Stock Option Plan, incorporated herein by reference to Exhibit 99 to the Company’s Registration Statement on Form S-8 (No. 333-75822), filed with the Commission on December 12, 2001. | |
| 127 |
| 10.7* | Supplemental Executive Retirement Agreement between James W. Fulmer and Tompkins Trustco, Inc., dated December 28, 2005, incorporated herein by reference to Exhibit 10.14 to the Company’s Annual Report on Form 10-K, filed with the Commission on March 16, 2006. | |
| 10.8* | Amendment to Supplemental Executive Retirement Agreement between James W. Fulmer and the Company (formerly know as Tompkins Trustco, Inc.) dated as of September 2, 2015, incorporated herein by reference to Exhibit 10.1 to the Company’s Quarterly Report on Form 10-Q, filed with the Commission on November 10, 2015. | |
| 10.9* | Supplemental Executive Retirement Agreement between Stephen S. Romaine and Tompkins Trustco, Inc., dated December 28, 2005, incorporated herein by reference to Exhibit 10.16 to the Company’s Annual Report on Form 10-K, filed with the Commission on March 16, 2006. | |
| 10.10* | Supplemental Executive Retirement Agreement between Francis M. Fetsko and Tompkins Trustco, Inc., dated December 28, 2005, incorporated herein by reference to Exhibit 10.17 to the Company’s Annual Report on Form 10-K, filed with the Commission on March 16, 2006. | |
| 10.11* | Supplemental Executive Retirement Agreement between David S. Boyce and Tompkins Trustco, Inc., dated December 28, 2005, incorporated herein by reference to Exhibit 10.18 to the Company’s Annual Report on Form 10-K, filed with the Commission on March 16, 2006. | |
| 10.12* | Form of Officer Group Term Life Replacement Plan (the “Plan”) among Tompkins Trust Company and the Participants in the Plan, incorporated herein by reference to Exhibit 10.20 to the Company’s Annual Report on Form 10-K, filed with the Commission on March 16, 2006. | |
| 10.13* | Tompkins Trustco, Inc. Officer Group Term Life Replacement Plan, as amended on June 26, 2006, incorporated herein by reference to Exhibit 10.2 to the Company’s Quarterly Report Form 10-Q, filed with the Commission on August 9, 2006. | |
| 10.14* | 2009 Equity Plan, incorporated herein by reference to Exhibit 99 to the Company’s Registration Statement on Form S-8 (No. 333-160738), filed with the Commission on July 22, 2009. | |
| 10.15* | Supplemental Executive Retirement Agreement between the Company and Gregory J. Hartz, dated May 12, 2011, incorporated herein by reference to Exhibit 10.23 to the Company’s Annual Report on Form 10-K, filed with the Commission on March 9, 2012. | |
| 10.16* | Form of Award under 2009 Equity Plan, incorporated herein by reference to Exhibit 10.17 to the Company’s Annual Report on Form 10-K, filed with the Commission on March 18, 2013. | |
| 21 | Subsidiaries of Registrant, incorporated herein by reference to Exhibit 21 to the Company’s Annual Report on Form 10-K, filed with the Commission on March 17, 2014. | |
| 23 | Consent of Independent Registered Public Accounting Firm (filed herewith) | |
| 24 | Power of Attorney, included on signature page of this Report on Form 10-K. | |
| 31.1 | Certification of the Chief Executive Officer as required pursuant to Section 302 of the Sarbanes-Oxley Act of 2002 (filed herewith). | |
| 31.2 | Certification of the Chief Financial Officer as required pursuant to Section 302 of the Sarbanes-Oxley Act of 2002 (filed herewith). | |
| 32.1 | Certification of the Chief Executive Officer Pursuant to 18 U.S.C. Section 1350, as adopted pursuant to Section 906 of the Sarbanes-Oxley Act of 2002 (filed herewith). | |
| 32.2 | Certification of the Chief Financial Officer Pursuant to 18 U.S.C. Section 1350, as adopted pursuant to Section 906 of the Sarbanes-Oxley Act of 2002 (filed herewith). |
| 128 |
| 101* | The following materials from the company’s Annual report on Form 10-K for the year ended December 31, 2015, formatted in XBRL (eXtensibel Business reporting Language): (i) Condensed Consolidated Statements of Condition as of December 31, 2015; (ii) Condensed Consolidated Statements of Income as of December 31, 2015; (iii) Condensed consolidated Statements of Comprehensive Income as of December 31, 2015; (iv) Condensed Consolidated Statements of Cash Flows as of December 31, 2015; (v) Condensed Consolidated Statements of Changes in Shareholders’ Equity as of December 31, 2015; and (vi) Notes to Unaudited Condensed Consolidated Financial Statements. |
| 129 |

P.O. Box 460, Ithaca, New York 14851
(607) 273-3210
www.tompkinsfinancial.com