Attached files
| file | filename |
|---|---|
| EX-23 - EXHIBIT 23 - TOMPKINS FINANCIAL CORP | ex_23.htm |
| EX-31.1 - EXHIBIT 31.1 - TOMPKINS FINANCIAL CORP | ex31_1.htm |
| EX-32.1 - EXHIBIT 32.1 - TOMPKINS FINANCIAL CORP | ex32_1.htm |
| EX-32.2 - EXHIBIT 32.2 - TOMPKINS FINANCIAL CORP | ex32_2.htm |
| EX-31.2 - EXHIBIT 31.2 - TOMPKINS FINANCIAL CORP | ex31_2.htm |
|
|
|
|
|
UNITED STATES |
||
|
SECURITIES AND EXCHANGE COMMISSION |
||
|
Washington, D.C. 20549 |
||
|
|
|
|
|
|
|
|
|
|
|
|
|
FORM 10-K |
||
x ANNUAL REPORT PURSUANT TO SECTION 13 OR
15(d) OF THE
SECURITIES EXCHANGE ACT OF 1934
For the fiscal year ended December 31, 2009
o TRANSITION REPORT PURSUANT TO SECTION 13
OR 15(d) OF THE
SECURITIES EXCHANGE ACT OF 1934
For the transition period from ______to ______
Commission File Number 1-12709

Tompkins Financial Corporation
(Exact name of registrant as specified in its charter)
|
|
|
|
New York |
16-1482357 |
|
(State or other jurisdiction of incorporation or organization) |
(I.R.S. Employer Identification No.) |
|
|
|
|
The Commons, P.O. Box 460, Ithaca, New York |
14851 |
|
(Address of principal executive offices) |
(Zip Code) |
Registrant’s telephone number, including area code: (607) 273-3210
Securities registered pursuant to Section 12(b) of the Act:
|
|
|
|
Common Stock ($.10 Par Value Per Share) |
NYSE-Amex |
|
(Title of class) |
(Name of exchange on which traded) |
Securities registered pursuant to Section 12(g) of the Act: None
Indicate by
check mark if the registrant is a well-known seasoned issuer, as defined in
Rule 405 of Securities Act.
Yes o No x.
Indicate by
check mark if the registrant is not required to file reports pursuant to
Section 13 or Section 15(d) of the Act.
Yes o No x.
Indicate by check mark whether the registrant: (1) has filed all reports required to be filed by Section 13 or 15(d) of the Securities Exchange Act of 1934 during the preceding 12 months (or for such shorter period that the registrant was required to file such reports) and (2) has been subject to such filing requirements for the past 90 days. Yes x No o.
Indicate by check mark whether the registrant has submitted electronically and posted on its corporate Web site, if any, every Interactive Data File required to be submitted and posted pursuant to Rule 405 of Regulation S-T during the preceding 12 months (or for such shorter period that the registrant was required to submit and post such files).* Yes o No o. *The registrant has not yet been phased into the interactive data requirements.
Indicate by check mark if disclosure of delinquent filers pursuant to Item 405 of Regulation S-K is not contained herein, and will not be contained, to the best of the registrant’s knowledge, in definitive proxy or information statements incorporated by reference in Part III of this Form 10-K or any amendment to this Form 10-K. x
Indicate by check mark whether the registrant is a large accelerated filer, an accelerated filer, a nonaccelerated filer, or a smaller reporting company.
|
|
|
|
|
|
|
|
Large Accelerated Filer o |
Accelerated Filer x |
Nonaccelerated Filer o |
Smaller Reporting Company o |
Indicate by check mark whether the registrant is a shell company (as defined in Rule 12b-2 of the Exchange Act). Yes o No x.
The aggregate market value of the registrant’s voting stock held by non-affiliates was $395,859,616 on June 30, 2009, based on the closing sales price of a share of the registrant’s common stock, $.10 par value (the “Common Stock”), as reported on the NYSE-Amex, on such date.
The number of shares of the registrant’s Common Stock outstanding as of February 25, 2010, was 10,728,128 shares.
DOCUMENTS INCORPORATED BY REFERENCE
Portions of the registrant’s definitive Proxy Statement relating to its 2010 Annual Meeting of stockholders to be held on May 10, 2010, which will be filed with the Securities and Exchange Commission within 120 days after the end of the fiscal year to which this Report relates, are incorporated by reference into Part III of this Form 10-K where indicated.
TOMPKINS FINANCIAL CORPORATION
Annual Report on Form 10-K
For the Fiscal Year Ended December 31, 2009
Table of Contents
[This Page Intentionally Left Blank]
|
|
|
|
Business |
The disclosures set forth in this Item1. Business are qualified by the section captioned “Forward-Looking Statements” in Item 6. Management’s Discussion and Analysis of Financial Condition and Results of Operations of this Report and other cautionary statements set forth elsewhere in this Report.
General
Tompkins Financial Corporation, (“Tompkins” or the “Company”) is headquartered in Ithaca, New York and is registered as a Financial Holding Company with the Federal Reserve Board under the Bank Holding Company Act of 1956, as amended. The Company is a locally oriented, community-based financial services organization that offers a full array of products and services, including commercial and consumer banking, leasing, trust and investment management, financial planning and wealth management, insurance, and brokerage services. The Company’s subsidiaries include: three wholly-owned banking subsidiaries, Tompkins Trust Company (the “Trust Company”), The Bank of Castile and The Mahopac National Bank (“Mahopac National Bank”); a wholly-owned insurance subsidiary, Tompkins Insurance Agencies, Inc. (“Tompkins Insurance”); a wholly-owned financial planning, wealth management and broker-dealer subsidiary, AM&M Financial Services, Inc. (“AM&M”); and Tompkins Capital Trust I and Sleepy Hollow Capital Trust I, each of whose common stock is 100% owned by the Company. The Company’s principal offices are located at The Commons, Ithaca, New York, 14851, and its telephone number is (607) 273-3210. The Company’s common stock is traded on the NYSE-Amex under the Symbol “TMP.”
Tompkins was organized in 1995, under the laws of the State of New York, as a bank holding company for the Trust Company, a commercial bank that has operated in Ithaca, New York and surrounding communities since 1836. Information relating to revenues, profit and loss, and total assets for the Company’s two business segments – banking and financial services - is incorporated herein by reference to Part II, Item 7. of this Report.
The Company’s strategic initiatives include diversification within its markets, growth of its fee-based businesses, and growth internally and through acquisitions of financial institutions, branches, and financial services businesses. As such, the Company from time to time considers acquiring banks, thrift institutions, branch offices of banks or thrift institutions, or other businesses within markets currently served by the Company or in other locations that would complement the Company’s business or its geographic reach. The Company generally targets merger or acquisition partners that are culturally similar and have experienced management and possess either significant market presence or have potential for improved profitability through financial management, economies of scale and expanded services. The Company has pursued acquisition opportunities in the past, and continues to review different opportunities.
On May 9, 2008, the Company acquired control of Sleepy Hollow Bancorp, Inc., (“Sleepy Hollow”), a privately held bank holding company located in Sleepy Hollow, New York. The outstanding shares of common stock of Sleepy Hollow were cancelled and exchanged for the right to receive the merger consideration totaling $30.2 million. The cost of the Sleepy Hollow acquisition was approximately $30.5 million, including acquisition related costs of approximately $234,000. Upon completion of the Sleepy Hollow acquisition, Sleepy Hollow Bank, the wholly-owned subsidiary of Sleepy Hollow, was merged into Mahopac National Bank, and its five full service offices and one limited service office, all in Westchester County, New York, became offices of Mahopac National Bank. Additional information on recent acquisitions is provided in “Note 2 Mergers and Acquisitions” in the Notes to Consolidated Financial Statements in Part II, Item 7. of this Report.
Narrative Description of Business
Information about the Company’s business segments is included in “Note 22 Segment and Related Information” in the Notes to Consolidated Financial Statements in Part II, Item 7. of this Report. The Company has identified two business segments, banking and financial services. Financial services activities consist of the results of the Company’s trust, financial planning and wealth management, broker-dealer services, and insurance and risk management operations. All other activities are considered banking.
Banking services consist primarily of attracting deposits from the areas served by the Company’s banking subsidiaries’ 45 banking offices and using those deposits to originate a variety of commercial loans, consumer loans, real estate loans, and leases in those same areas. Residential real estate mortgage loans are generally underwritten in accordance with Federal Home Loan Mortgage Corporation (“FHLMC”) guidelines, which enhance the liquidity of these lending products. The Company’s subsidiary banks have sold residential mortgage loans to FHLMC over the past several years to manage exposure to changing interest rates and to take advantage of favorable market conditions. The Company’s subsidiary banks retain the servicing of the loans sold to FHLMC and record a servicing asset at the time of sale. For additional details on loan sales, refer to “Note 5 Loan and Lease Classification Summary and Related Party Transactions” in the Notes to Consolidated Financial Statements in Part II, Item 7. of this Report.
The Company’s lending function is managed within the guidelines of a comprehensive Board-approved lending policy. Policies and procedures are reviewed on a regular basis. Reporting systems are in place to provide management with ongoing information related
1
to loan production, loan quality, concentrations of credit, loan delinquencies and nonperforming and potential problem loans. The Company has an independent loan review process that reviews and validates the risk identification and assessment made by the lenders and credit personnel. The results of these reviews are presented to the Board of Directors of each of the Company’s banking subsidiaries, and the Company’s Audit Committee.
The Company’s principal expenses are interest on deposits, interest on borrowings, and operating and general administrative expenses, as well as provisions for loan and lease losses. Funding sources, other than deposits, include borrowings, securities sold under agreements to repurchase, and cash flow from lending and investing activities. Tompkins provides a variety of financial services to individuals and small business customers. Some of the traditional banking services and financial services are detailed below.
Commercial Services
The Company’s subsidiary banks provide financial services to corporations and other business clients. Lending activities include loans for a variety of business purposes, including real estate financing, construction, equipment financing, accounts receivable financing, and commercial leasing. Other commercial services include deposit and cash management services, letters of credit, sweep accounts, credit cards, purchasing cards, Internet-based account services, and remote deposit services.
Retail Services
The Company’s subsidiary banks provide a variety of retail banking services including checking accounts, savings accounts, time deposits, IRA products, brokerage services, residential mortgage loans, personal loans, home equity loans, credit cards, debit cards and safe deposit services. Retail services are accessible through a variety of delivery systems including branch facilities, ATMs, voice response, Internet banking, and remote deposit services, a service that brings deposit capability to an individual’s desk any time of the day or night.
Securities Portfolio
The Company maintains a portfolio of securities such as U.S. government sponsored entities securities, obligations of states and political subdivisions thereof, equity securities, and interest-bearing deposits. Management typically invests in securities with short to intermediate average lives in order to better match the interest rate sensitivities of its assets and liabilities.
Investment decisions are made within policy guidelines established by the Company’s Board of Directors. The investment policy established by the Company’s Board of Directors is based on the asset/liability management goals of the Company, and is monitored by the Company’s Asset/Liability Management Committee. The intent of the policy is to establish a portfolio of high quality diversified securities, which optimizes net interest income within safety and liquidity limits deemed acceptable by the Asset/Liability Management Committee. Securities, other than certain obligations of states and political subdivisions thereof, are generally classified as available-for-sale. Securities available-for-sale may be used to enhance total return, provide additional liquidity, or reduce interest rate risk.
The Company adopted FASB ASC Topic 825, Financial Instruments (“ASC Topic 825”), effective January 1, 2008. With the adoption, the Company elected to account for certain securities and certain borrowings at fair value, with unrealized gains or losses included in earnings.
Trust and Investment Management Services
The Company provides trust and investment services through Tompkins Investment Services (“TIS”), a division of Tompkins Trust Company, and investment services through AM&M. Tompkins Investment Services, with office locations at all three of the Company’s subsidiary banks, provides a full range of money management services, including investment management accounts, custody accounts, trusts, retirement plans and rollovers, estate settlement, and financial planning. AM&M provides fee-based financial planning and wealth management services for small business owners, professionals and corporate executives and other individuals with complex financial needs.
Broker-Dealer Services
AM&M operates a broker-dealer subsidiary, Ensemble Financial Services, Inc., which is an outsourcing company for financial planners and investment advisors.
Insurance Services
The Company provides property and casualty insurance services and employee benefits consulting through Tompkins Insurance. Tompkins Insurance is an independent insurance agency, representing many major insurance carriers. Tompkins Insurance has automated systems for record keeping, claim processing and coverage confirmation, and can provide insurance pricing comparisons from a wide range of insurance companies. Tompkins Insurance provides employee benefits consulting to employers in Western and Central New York, assisting them with their medical, group life insurance and group disability insurance. In addition to its seven stand-alone offices, Tompkins Insurance shares several offices with The Bank of Castile and The Trust Company. AM&M operates a subsidiary that creates customized risk management plans using life, disability and long-term care insurance products.
2
Subsidiaries
The Company operates three banking subsidiaries, an insurance agency subsidiary, and a financial planning, wealth management, and broker-dealer subsidiary in New York. In addition, The Company also owns 100% of the common stock of Tompkins Capital Trust I and Sleepy Hollow Capital Trust I. The Company’s subsidiary banks operate 45 offices, including 3 limited-service offices, serving communities in New York. The decision to operate as three locally managed community banks reflects management’s commitment to community banking as a business strategy. For Tompkins, personal delivery of high quality services, a commitment to the communities in which we operate, and the convergence of a single-source financial service provider characterize management’s community banking approach. The combined resources of the Tompkins organization provides increased capacity for growth and the greater capital resources necessary to make investments in technology and services. Tompkins has developed several specialized financial services that are now available in markets served by all three subsidiary banks. These services include trust and investment services, insurance, leasing, card services, Internet banking, and remote deposit services.
Tompkins Trust Company (the “Trust Company”)
The Trust Company is a New York State-chartered commercial bank that has operated in Ithaca, New York and surrounding communities since 1836. The Trust Company operates 15 banking offices, including 2 limited-service banking offices in the counties of Tompkins, Cortland, Cayuga and Schuyler, New York. The Trust Company’s largest market area is Tompkins County, which has a population of approximately 101,000. Education plays a significant role in the Tompkins County economy with Cornell University and Ithaca College being two of the county’s major employers. The negative trends affecting the national economy have had an impact on the markets served by the Trust Company, as evidenced by an increase in the unemployment rate. Nevertheless, trends for unemployment and housing compare favorably to New York State and national trends. The Trust Company has a full-service office in Cortland, New York and a full-service office in Auburn, New York. Both of these offices are located in counties contiguous to Tompkins County.
The Bank of Castile (“The Bank of Castile”)
The Bank of Castile is a New York State-chartered commercial bank and conducts its operations through its 15 banking offices, in towns situated in and around the areas commonly known as the Letchworth State Park area and the Genesee Valley region of New York State. The main business office for The Bank of Castile is located in Batavia, New York and is shared with Tompkins Insurance. The Bank of Castile serves a five-county market, much of which is rural in nature, but also includes Monroe County, where the city of Rochester is located. The population of the counties served by The Bank of Castile, other than Monroe, is approximately 205,000. The Bank of Castile lending portfolio includes loans to the agricultural industry. Weak economic conditions and low milk prices strained the agricultural industry in 2009.
The Mahopac National Bank (“Mahopac National Bank”)
Mahopac
National Bank operates 15 banking offices, including 1 limited-service office
in counties near New York City. The 15 banking offices include 5 full-service
offices in Putnam County, New York, 3 full-service offices in Dutchess County,
New York, and 6 full-service offices, 1 limited-service office, in Westchester
County, New York. Mahopac’s presence in Westchester County increased with the
Company’s May 9, 2008 acquisition of Sleepy Hollow Bancorp, Inc., (“Sleepy
Hollow”), a privately held bank holding company located in Sleepy Hollow, New
York. At the time of the acquisition, Sleepy Hollow Bank, the wholly-owned
subsidiary of Sleepy Hollow, operated 5 full-service offices and 1
limited-service facility, all in Westchester County, New York. Upon completion
of the Sleepy Hollow acquisition, Sleepy Hollow Bank was merged into Mahopac
National Bank.
Putnam County has a population of approximately 99,000 and is
about 60 miles north of Manhattan. Dutchess County has a population of
approximately 293,000, and Westchester County has a population of approximately
954,000. All three counties have seen an increase in the unemployment rate as a
result of the downturn in the State and national economies. Given the
proximities of these counties to New York City, the significant layoffs at financial
firms and large corporations are likely to have an impact on the local
economies, the extent of which is difficult to estimate. The recent turbulence
experienced by many financial industry competitors has also provided continued
opportunities for growth.
Tompkins Insurance Agencies, Inc. (“Tompkins Insurance”)
Tompkins Insurance is headquartered in Batavia, New York, and offers property and casualty insurance to individuals and businesses primarily in Western and Central New York. Over the past several years, Tompkins Insurance has acquired smaller insurance agencies generally in the market areas serviced by the Company’s banking subsidiaries. Tompkins Insurance offers services to customers of the Company’s banking subsidiaries by sharing offices with The Bank of Castile and The Trust Company. In addition to these shared offices, Tompkins Insurance has four stand-alone offices in Western New York, and two stand-alone offices in Tompkins County, New York.
AM&M Financial Services, Inc. (“AM&M”)
AM&M is headquartered in Pittsford, New York and offers financial services through three operating companies: (1) AM&M Planners, Inc., which provides fee based financial planning and wealth management services for corporate executives, small business owners and high net worth individuals; (2) Ensemble Financial Services, Inc., an independent broker-dealer and outsourcing company for financial planners and investment advisors; and (3) Ensemble Risk Solutions, Inc., which creates customized risk management plans using life, disability and long-term care insurance products.
3
Tompkins Capital Trust I
Tompkins Capital Trust I is a Delaware statutory business trust formed in 2009. In 2009, the Tompkins Capital Trust I issued $20.5 million of trust preferred securities and lent the proceeds to the Company to support business growth and for general corporate purposes. The Company guarantees, on a subordinated basis, payments of distributions on the trust preferred securities and payments on the redemption of the trust preferred securities. Tompkins Capital Trust I is a variable interest entity for which the Company is not the primary beneficiary. In accordance with the applicable accounting standards related to variable interest entities, the accounts of Tompkins Capital Trust I are not included in the Company’s consolidated financial statements. However, the $20.5 million of trust preferred securities issued by Tompkins Capital Trust I are included in the Tier 1 capital of the Company for regulatory capital purposes pursuant to regulatory guidelines.
Sleepy Hollow Capital Trust I
Sleepy Hollow Capital Trust I, a Delaware statutory business trust, was formed in August 2003 and issued $4.0 million of floating rate (three-month LIBOR plus 305 basis points) trust preferred securities. The Company acquired Sleepy Hollow Capital Trust I through the acquisition of Sleepy Hollow Bancorp, Inc. in May 2008.
For additional details on Tompkins Capital Trust I and Sleepy Hollow Capital Trust I refer to “Note 12 Trust Preferred Debentures” in the Notes to Consolidated Financial Statements in Part II, Item 7. of this Report.
Competition
Competition for commercial banking and other financial services is strong in the Company’s market areas. In one or more aspects of its business, the Company’s subsidiaries compete with other commercial banks, savings and loan associations, credit unions, finance companies, Internet-based financial services companies, mutual funds, insurance companies, brokerage and investment banking companies, and other financial intermediaries. Some of these competitors have substantially greater resources and lending capabilities and may offer services that the Company does not currently provide. In addition, many of the Company’s non-bank competitors are not subject to the same extensive Federal regulations that govern financial holding companies and Federally insured banks.
Competition among financial institutions is based upon interest rates offered on deposit accounts, interest rates charged on loans and other credit and service charges, the quality and scope of the services rendered, the convenience of facilities and, in the case of loans to commercial borrowers, relative lending limits. Management believes that a community based financial organization is better positioned to establish personalized financial relationships with both commercial customers and individual households. The Company’s community commitment and involvement in its primary market areas, as well as its commitment to quality and personalized financial services, are factors that contribute to the Company’s competitiveness. Management believes that each of the Company’s subsidiary banks can compete successfully in its primary market areas by making prudent lending decisions quickly and more efficiently than its competitors, without compromising asset quality or profitability, although no assurances can be given that such factors will assure success.
Supervision and Regulation
Regulatory Agencies
As a registered financial holding company, the Company is subject to examination and comprehensive regulation by the Federal Reserve Board (“FRB”). The Company’s banking subsidiaries are subject to examination and comprehensive regulation by various regulatory authorities, including the Federal Deposit Insurance Corporation (“FDIC”), the Office of the Comptroller of the Currency (“OCC”), and the New York State Banking Department (“NYSBD”). Each of these agencies issues regulations and requires the filing of reports describing the activities and financial condition of the entities under its jurisdiction. Likewise, such agencies conduct examinations on a recurring basis to evaluate the safety and soundness of the institutions, and to test compliance with various regulatory requirements, including: consumer protection, privacy, fair lending, the Community Reinvestment Act, the Bank Secrecy Act, sales of non-deposit investments, electronic data processing, and trust department activities.
The Company’s financial services subsidiaries are subject to examination and regulation by various regulatory agencies, including the New York State Insurance Department, Securities and Exchange Commission (“SEC”), and the Financial Industry Regulatory Authority (“FINRA”). Tompkins Investment Services is subject to examination and comprehensive regulation by the FDIC and NYSBD.
Share Repurchases and Dividends
Under FRB regulations, the Company may not, without providing prior notice to the FRB, purchase or redeem its own common stock if the gross consideration for the purchase or redemption, combined with the net consideration paid for all such purchases or redemptions during the preceding twelve months, is equal to ten percent or more of the Company’s consolidated net worth.
FRB regulations provide that dividends shall not be paid except out of current earnings and unless the prospective rate of earnings retention by the Company appears consistent with its capital needs, asset quality, and overall financial condition. Tompkins’ primary source of funds to pay dividends on its common stock is dividends from its subsidiary banks. The subsidiary banks are subject to regulations that restrict the dividends that they may pay to Tompkins.
4
Liability of Commonly Controlled Institutions
FDIC-insured depository institutions can be held liable for any loss incurred, or reasonably expected to be incurred, by the FDIC due to the default of an FDIC-insured depository institution controlled by the same bank holding company, or for any assistance provided by the FDIC to an FDIC-insured depository institution controlled by the same bank holding company that is in danger of default. “Default” means generally the appointment of a conservator or receiver. “In danger of default” means generally the existence of certain conditions indicating that default is likely to occur in the absence of regulatory assistance.
Intercompany Transactions
There are Federal laws and regulations that govern transactions between the Company’s non-bank subsidiaries and its banking subsidiaries. These laws establish certain quantitative limits and other prudent requirements for loans, purchases of assets, and certain other transactions between a member bank and its affiliates. In general, transactions between the banking subsidiaries and its non-bank subsidiaries must be on terms and conditions, including credit standards, that are substantially the same or at least as favorable to the banking subsidiaries as those prevailing at the time for comparable transactions involving non-affiliated companies.
Capital Adequacy
The Federal Reserve Board, the OCC and the FDIC have substantially similar risk-based capital ratio and leverage ratio guidelines for banking institutions. The guidelines are intended to ensure that banking organizations have adequate capital given the risk levels of assets and off-balance sheet financial instruments. Under the guidelines, banking organizations are required to maintain minimum ratios for Tier I capital and total capital to risk-weighted assets. For purposes of calculating the ratios, a banking organization’s assets and some of its specified off-balance sheet commitments and obligations are assigned to various risk categories. A depository institution’s or holding company’s capital, in turn, is classified in one of three tiers, depending upon type:
Core Capital (Tier 1). Tier 1 capital includes common equity, retained earnings, qualifying non-cumulative preferred stock, a limited amount of qualifying cumulative preferred stock at the holding company level, minority interests in equity accounts of consolidated subsidiaries, qualifying trust preferred securities, less goodwill, most intangible assets and certain other assets.
Supplementary Capital (Tier 2). Tier 2 capital includes, among other things, perpetual preferred stock and trust preferred securities not meeting the Tier 1 definition, qualifying mandatory convertible debt securities, qualifying subordinated debt, and allowances for possible loan losses, subject to limitations.
Market Risk Capital (Tier 3). Tier 3 capital includes qualifying unsecured subordinated debt.
Tompkins, like other bank holding companies, is required to maintain Tier 1 capital and “total capital” (the sum of Tier 1, Tier 2 and Tier 3 capital) equal to at least 4.0% and 8.0%, respectively, of its total risk-weighted assets. The bank subsidiaries, like other depository institutions, are required to maintain similar capital levels under capital adequacy guidelines. For a depository institution to be “well capitalized” under the regulatory framework for prompt corrective action, its Tier 1 and total capital ratios must be at least 6.0% and 10.0% on a risk-adjusted basis, respectively.
Bank holding companies and banks are also required to comply with minimum leverage ratio requirements. The leverage ratio is the ratio of a banking organization’s Tier 1 capital to its total adjusted quarterly average assets. The minimum permissible leverage ratio is 3.0% for financial holding companies and banks that either have the highest supervisory rating or have implemented the appropriate federal regulatory authority’s risk-adjusted measure for market risk. All other financial holding companies and banks are required to maintain a minimum leverage ratio of 4.0%, unless a different minimum is specified by an appropriate regulatory authority. For a depository institution to be considered “well capitalized” under the regulatory framework for prompt corrective action, its leverage ratio must be at least 5.0%.
For further information concerning the regulatory capital requirements, actual capital amounts and the ratios of Tompkins and its bank subsidiaries, see the discussion in “Note 20 Regulations and Supervision” in Notes to Consolidated Financial Statements in Part II, Item 7. of this Report.
Deposit Insurance
Historically, all deposit accounts of the Company’s subsidiary banks were insured by the Deposit Insurance Fund (“DIF”), generally in amounts up to $100,000 per depositor. Certain types of retirement accounts are insured up to $250,000 per insured depositor. In October 2008, the FDIC announced the Temporary Liquidity Guarantee Program (“TLGP”). The TLGP provides full FDIC deposit insurance on funds invested in noninterest-bearing transaction accounts, and Negotiable Order of Withdrawal (“NOW”) accounts paying less than 0.5% interest per annum held at participating FDIC insured institutions. In November 2008, Tompkins elected to participate in the TLGP. For this additional insurance coverage, participating depository institutions paid a fee of 10 basis points per quarter on amounts in covered accounts exceeding $250,000. The TLGP was initially set to end on December 31, 2009, but was extended until June 30, 2010. The extension provided an opportunity to opt out of the program, however, Tompkins has elected to continue enrollment. A new risk-based pricing schedule will accompany this extension and cost increases will range from an additional 5 - 15 basis points (annualized) for Risk Category I through IV institutions. Risk Category I institutions would be assessed an additional 5 basis points for continued participation in the program. All of Tompkins’ subsidiary banks fall within the Risk Category I classification as of the report date. Separately, Congress extended the temporary increase in the standard coverage limit to $250,000 until December 31, 2013.
5
On December 16, 2008, the Board of Directors of the FDIC voted to adopt a final rule increasing risk-based assessment rates uniformly by 7 basis points (7 cents for every $100 of deposits), on an annual basis, for the first quarter of 2009. This increase is a response to higher levels of bank failures that occurred in 2008. The assessment increase creates a path for the DIF to return to its statutorily mandated level. Under the final rule, risk-based rates would range between 12 and 50 basis points (annualized) for the first quarter 2009 assessment. The Chairman of the Committee on Banking, Housing, and Urban Affairs also introduced legislation which was in approved by Congress in May 2009, The Depositor Protection Act of 2009, which increased the FDIC’s borrowing authority with the U.S. Treasury to $100.0 billion from $30.0 billion with a temporary ceiling of $500.0 billion through 2010.
On May 22 2009, the FDIC approved a final rule for a special assessment of 5 basis points on each insured depository institution’s assets minus Tier 1 capital; not to exceed 10 basis points of the institution’s risk-based assessment as of June 30, 2009, to restore the DIF. The Company’s subsidiary banks paid a special assessment of $1.4 million in 2009.
On November 12, 2009, the FDIC adopted a final rule requiring insured depository institutions to prepay their estimated quarterly insurance premium for the fourth quarter of 2009, and all of 2010, 2011 and 2012. For purposes of calculating the assessment; beginning on September 29, 2009, the FDIC increased annual assessment rates uniformly by 3 basis points beginning in 2011. In addition, an institution’s third quarter 2009 assessment base was increased quarterly at a 5 percent annual growth rate through the end of 2012. On December 30, 2009, the Company paid $12.2 million related to the 3 year premium FDIC insurance prepayments for its subsidiary banks.
Insurance premiums for periods covered in this report were governed by The Federal Deposit Insurance Reform Act of 2005 and The Federal Deposit Insurance Reform Conforming Amendments Act of 2005 (collectively the “Reform Act”). Under the Reform Act, the FDIC modified its risk-based deposit premium assessment system under which each depository institution is placed in one of four assessment categories based on the institution’s capital classification under the prompt corrective action provisions and an institution’s long-term debt issuer ratings. Effective January 1, 2007, the adjusted assessment rates for insured institutions under the modified system range from 5 basis points to 43 basis points depending upon the assessment category into which the insured institution is placed. Under the previous assessment system, the adjusted assessment rates ranged from 0 basis points to 27 basis points.
The Reform Act provided for a one-time assessment credit for eligible insured depository institutions (those institutions that were in existence on December 31, 1996 and paid a deposit insurance assessment prior to that date, or are a successor to any such institution). The credit was to be used to offset up to 100% of the 2007 DIF assessment, and if not completely used in 2007, was to be applied to not more than 90% of each of the aggregate 2008, 2009 and 2010 DIF assessments. The Company’s one-time historical assessment credit was $1.0 million, of which $370,000 and $657,000 were used to offset the Federal deposit insurance assessments in 2008 and 2007, respectively. FDIC insurance expense, excluding the TLGP program, special assessments levied in 2009, and Financing Corporation (“FICO”) assessments totaled $2.9 million in 2009, $865,000 in 2008 and $14,000 in 2007.
In addition to the risk-based deposit insurance assessments, the FDIC is a collection agent for additional assessments imposed by FICO, a separate U.S. government agency affiliated with the FDIC, on insured deposits to pay for the interest cost of FICO bonds. The Company paid FICO assessments of $246,000 in 2009 and $225,000 in 2008.
Depositor Preference
The Federal Deposit Insurance Act provides that, in the event of the “liquidation or other resolution” of an insured depository, the claims of depositors of the institution, including the claims of the FDIC, as subrogee of the insured depositors, and certain claims for administrative expenses of the FDIC as receiver, will have priority over other general unsecured claims against the institution. If an insured depository institution fails, insured and uninsured depositors, along with the FDIC, will have priority in payment ahead of unsecured, non-deposit creditors, including the parent bank holding company, with respect to any extensions of credit they have made to such insured depository institutions.
Community Reinvestment Act
The Company’s subsidiary banks are subject to the Community Reinvestment Act (“CRA”) and to certain fair lending and reporting requirements that relate to home mortgage lending. The CRA requires the federal banking regulators to assess the record of a financial institution in meeting the credit needs of the local communities, including low-and moderate-income neighborhoods, consistent with the safe and sound operation of the bank. The federal agencies consider an institution’s performance under the CRA in evaluating applications for mergers and acquisitions, and new offices. The ratings assigned by the federal agencies are publicly disclosed.
6
Sarbanes-Oxley Act of 2002
The Sarbanes-Oxley Act of 2002 implemented a broad range of corporate governance, accounting and reporting requirements for companies that have securities registered under the Exchange Act of 1934. These requirements include: (1) requirements for audit committees, including independence and financial expertise; (2) certification of financial statements by the chief executive officer and chief financial officer of the reporting company; (3) standards for auditors and regulation of audits; (4) disclosure and reporting requirements for the reporting company and directors and executive officers; and (5) a range of civil and criminal penalties for fraud and other violations of securities laws.
The USA Patriot Act
The Uniting and Strengthening America by Providing Appropriate Tools Required to Intercept and Obstruct Terrorism Act of 2001 (“USA Patriot Act”) imposes obligations on financial institutions, including banks and broker-dealer subsidiaries to implement policies, procedures and controls which are reasonably designed to detect and report instances of money laundering and the financing of terrorism.
The Emergency Economic Stabilization Act of 2008
In the third quarter of 2008, the Federal Reserve, the U.S. Treasury, and the FDIC initiated measures to stabilize the financial markets and to provide liquidity for financial institutions. The Emergency Economic Stabilization Act of 2008 (“EESA”) was enacted in October of 2008 and authorizes the U.S. Treasury to provide funds to be used to restore liquidity and stability to the U.S. financial system. Under authority of EESA, the U.S. Treasury initiated a voluntary capital purchase program to encourage financial institutions to build capital to increase lending and to support the economy. Under the program, the U.S. Treasury has been purchasing senior preferred shares of financial institutions, together with warrants to purchase shares of common stock. The Company determined that it did not need additional capital and, although eligible to participate in this program, elected not to issue and sell shares of preferred stock. As mentioned above, EESA also increased FDIC insurance deposit limits for most accounts from $100,000 to $250,000 through December 31, 2009.
Financial Privacy
In accordance with the Gramm Leach Bliley Act, federal banking regulators adopted rules that limit the ability of banks and other financial institutions to disclose non-public information about consumers to non-affiliated third parties. These limitations require disclosure of privacy policies to consumers and, in some circumstances, allow consumers to prevent disclosure of certain personal information to a non-affiliated third party. These provisions affect how consumer information is transmitted through diversified financial companies and conveyed to outside vendors.
Office of Foreign Assets Control Regulation
The United States has imposed economic sanctions that affect transactions with designated foreign countries, nationals and others. These are known as the “OFAC” rules based on their administration by the US Treasury Department Office of Foreign Assets Control (“OFAC”). The OFAC-administered sanctions take many forms. Generally, however, they include restrictions on trade with or investment in a sanctioned country and a blocking of assets in which the government or specially designated nationals of the sanctioned country have an interest.
Consumer Protection Laws
In connection with their lending and leasing activities, the Company’s banking subsidiaries are subject to a number of federal and state laws designed to protect borrowers and promote lending. These laws include the Equal Credit Opportunity Act, the Fair Credit Reporting Act, the Truth in Lending Act, the Home Mortgage Disclosure Act, and the Real Estate Settlement Procedures Act, and similar laws at the State level.
Effective July 1, 2010, a new federal banking rule under the Electronic Fund Transfer Act will prohibit financial institutions from charging consumers fees for paying overdrafts on automated teller machines (“ATM”) and one-time debit card transactions, unless a consumer consents, or opts in, to the overdraft service for those type of transactions. If a consumer does not opt in, any ATM transaction or debit that overdraws the consumer’s account will be denied. Overdrafts on the payment of checks and regular electronic bill payments are not covered by this new rule. Before opting in, the consumer must be provided a notice that explains the financial institution’s overdraft services, including the fees associated with the service, and the consumer’s choices. Financial institutions must provide consumers who do not opt in with the same account terms, conditions and features (including pricing) that they provide to consumers who do opt in.
Other Legislative Initiatives
From time to time, various legislative and regulatory initiatives are introduced in Congress and state legislatures, as well as by regulatory authorities. These initiatives may include proposals to expand or contract the powers of bank holding companies and depository institutions or proposals to change the financial institution regulatory environment. Such legislation could change banking laws and the operating environment of Tompkins in substantial, but unpredictable ways. We cannot predict whether any such legislation will be enacted, and, if enacted, the effect that it, or any implementing regulations would have on our financial condition or results of operations.
7
Employees
At December 31, 2009, the Company had 744 employees, approximately 80 of whom were part-time. No employees are covered by a collective bargaining agreement and the Company believes its employee relations are excellent.
Available Information
The Company maintains a website at www.tompkinsfinancialcorp.com. The Company makes available free of charge (other than an investor’s own Internet access charges) through its website its annual reports on Form 10-K, quarterly reports on Form 10-Q, and current reports on Form 8-K, its proxy statements related to its annual shareholders’ meetings, and amendments to these reports or statements, filed or furnished pursuant to Section 13(a) or 15(d) of the Securities Exchange Act of 1934 as amended (the “Exchange Act”), as soon as reasonably practicable after the Company electronically files such material with, or furnishes such material to, the Securities and Exchange Commission (the “SEC”). Copies of these reports are also available at no charge to any person who requests them, with such requests directed to Tompkins Financial Corporation, Investor Relations Department, The Commons, Ithaca, New York 14851, telephone no. (607) 273-3210. Materials that the Company files with the SEC may be read and copied at the SEC’s Public Reference Room at 100 F Street, NE, Washington, D.C. 20549. This information may also be obtained by calling the SEC at 1-800-SEC-0330. The SEC also maintains an Internet website that contains reports, proxy and information statements and other information regarding issuers that file electronically with the SEC at www.sec.gov. The Company is not including the information contained on the Company’s website as a part of, or incorporating it by reference into, this Annual Report on Form 10-K, or into any other report filed with or furnished to the SEC by the Company.
The Company’s business, operating results, financial condition, liquidity, and cash flow may be impacted by numerous factors, including but not limited to those discussed below. These items may cause the Company’s results to vary materially from recent results.
Economic Conditions / Financial Markets
General economic conditions impact the banking and financial services industry. The Company’s financial performance generally, and in particular the ability of borrowers to pay interest on and repay the principal of outstanding loans and the value of collateral securing these loans, is highly dependent upon the business environment in the markets where the Company operates. Unfavorable or uncertain economic and market conditions could lead to credit quality concerns related to repayment ability and collateral protection as well as reduced demand for the services offered by the Company’s two business segments.
Economic conditions have been weak over the last three years. Overall market conditions in 2009 included a weakened housing market with falling home prices and rising foreclosures, higher unemployment, difficulties in financial and credit markets, slowdown in consumer spending, a decrease in consumer confidence, slumping auto sales, and generally reduced business activity across a wide range of industries and regions in the U.S.
The U.S. government, the Federal Reserve and other regulators have taken numerous steps to increase liquidity and to restore investor confidence; however, there continues to be pressure on asset values and liquidity and a general lack of confidence in the financial markets. As such, the followings risks are associated with economic conditions:
|
|
|
|
• |
A further downturn in the housing markets and continued pressure on real estate values may result in higher delinquencies, foreclosures, and charge-offs, which would negatively affect the Company’s financial condition and results of operations. |
|
|
|
|
• |
A continued rise in unemployment may result in lower demand for the Company’s products and services. |
|
|
|
|
• |
Weak equities markets and declining stock market prices may affect the volume of income and demand for fee-based services in the Company’s financial services segment. |
|
|
|
|
• |
Lower earnings could result from other-than-temporary impairment charges related to the Company’s investment securities portfolio. |
|
|
|
|
• |
An increase in bank failures may result in additional increases in FDIC premiums as well as additional banking regulations, which would negatively affect the Company’s results of operations. In 2009, the Company’s FDIC insurance deposit expense increased significantly over prior year as a result of higher deposit premium rates and a special assessment in the second quarter of 2009. |
Economic conditions in 2008 and 2009 contributed to an increase in the Company’s past due loans and leases, nonperforming assets and net loan and lease losses as well as a decrease in income from certain fee based products and services. While Tompkins operates in markets that have been impacted to a lesser extent than many areas around the country, there is no assurance that these conditions may not adversely affect the credit quality of the Company’s loans, results of operations and financial condition going forward.
8
Interest Rate Risk
The Company’s earnings, financial condition and liquidity are susceptible to fluctuations in market interest rates. This exposure is a result of assets and liabilities repricing at different times and by different amounts as interest rates changes. Net interest income, which is the difference between interest earned on loans and investments and interest paid on deposits and borrowings, is the largest component of the Company’s total revenues. The level of net interest income is dependent upon the volume and mix of interest-earning assets and interest-bearing liabilities, the level of nonperforming assets, and the level and trend of interest rates. Changes in market interest rates will also affect the level of prepayments on the Company’s loans and payments on mortgage-backed securities, resulting in the receipt of proceeds that may be reinvested at a lower rate than the loan or mortgage-backed security being prepaid. Interest rates are highly sensitive to many factors, including: inflation, economic growth, employment levels, monetary policy and international markets. Significant fluctuations in interest rates could have a material adverse affect on the Company’s earnings, financial condition, and liquidity.
The Company manages interest rate risk using income simulation to measure interest rate risk inherent in its on-balance sheet and off-balance sheet financial instruments at a given point in time by showing the potential effect of interest rate shifts on net interest income for future periods. Each quarter the Company’s Asset/Liability Management Committee reviews the simulation results to determine whether the exposure of net interest income to changes in interest rates remains within Board-approved levels. The Committee also discusses strategies to manage this exposure and incorporates these strategies into the investment and funding decisions of the Company. In addition, the Company has focused on expanding its fee-based business to help mitigate its exposure to fluctuations in interest rates.
For additional information about how the Company manages its interest rate risk, refer to Part II, Item 6A, “Quantitative and Qualitative Disclosures About Market Risk” of this Report.
Credit Risk
The Company’s business of originating and underwriting loans involves credit risk, which is the risk of loss of principal or interest because borrowers, guarantors and related parties fail to perform in accordance with the terms of their loan agreements. The Company has seen some deterioration in asset quality measures over the past two years, driven in large part by weak economic conditions. While management believes that it has appropriately identified and reserved for the credit exposure in these lending relationships, a continuation or worsening of the current economic conditions may result in further declines in asset quality measures and increases in loan losses. To help mitigate credit risk, the Company has adopted comprehensive credit policies, underwriting standards, and loan review procedures. The Company has developed an internal loan grading system which is applied to all commercial and commercial real estate loans. On a quarterly basis, the Company reviews all commercial and commercial real estate loans greater than $500,000 that are below a certain risk rating. Meetings are held to discuss these relationships, including operating results, future cash flows, recent developments and the borrower’s outlook, accrual status, and the timing and extent of potential losses, considering collateral valuation and other factors. The Company maintains an allowance for loan losses that in management’s judgment is adequate to absorb losses inherent in the loan and lease portfolio.
As of December 31, 2009, residential real estate loans represented approximately 32.5% of the Company’s loan portfolio. In light of the Company’s underwriting standards, historical experience, and current trends within the residential portfolio, these types of loans are generally viewed as having less risk of default than commercial or commercial real estate loans. See Part II, Item 7, “Loans and Leases” and “The Allowance for Loan and Lease Losses” of this Report for further discussion of the lending portfolio and the allowance for loan and lease losses.
The Company regularly reviews its investment securities for declines in value below amortized cost that might be characterized as other-than-temporary. Any declines in value below amortized cost that are deemed to be other-than- temporary are charged to earnings. Management believes that it has established policies and procedures that are appropriate to mitigate the risk of loss. Nonetheless, these policies and procedures may not prevent unexpected losses that could have a material adverse effect on the Company’s business, financial condition, results of operations, or liquidity.
With weak economic conditions throughout 2009 and into 2010, credit risk may continue to increase. A weakening economy, increasing unemployment or further deterioration of housing markets could result in increased credit losses.
Government Laws and Regulations
The Company is subject to extensive state and federal laws and regulations, supervision, and legislation that affect how it conducts its business. The majority of these laws and regulations are for the protection of consumers, depositors and the deposit insurance funds. The regulations influence such things as the Company’s lending practices, capital structure, investment practices, and dividend policy. Given the current unfavorable and uncertain conditions in the economy and financial markets, it is likely that there will be significant changes to the regulatory environment for the banking and financial services industry. Any changes to state and federal banking laws and regulations may negatively impact the Company’s ability to expand services and to increase shareholder value. There can also be significant cost related to compliance with various laws and regulations. The Company has established an extensive internal control structure to ensure compliance with governing laws and regulations, including those related to financial reporting. Refer to “Supervision and Regulation” for additional information on laws and regulations.
9
The Federal Reserve’s monetary policies also affect the Company’s operating results and financial condition. These policies, which include open market operations in U.S. Government securities, changes in the discount rate on member bank borrowings, and changes in reserve requirements against member bank deposits, can have a major effect upon the source and cost of funds and the rates of return earned on loans and investments.
The Company is subject to state and federal tax laws and regulations. Changes to these regulations could impact future tax expense and the value of deferred tax assets. Each of the Company’s banking subsidiaries is a majority owner of a real estate investment trust (“REIT”). Legislation is periodically proposed at the State level that would change the treatment of dividends paid by the REITs. Changes to the laws governing the taxation of REITs would likely result in additional income tax expense.
Competition
Competition for commercial banking and other financial services is strong in the Company’s market areas. In one or more aspects of its business, the Company’s subsidiaries compete with other commercial banks, savings and loan associations, credit unions, finance companies, Internet-based financial services companies, mutual funds, insurance companies, brokerage and investment banking companies, and other financial intermediaries. Some of these competitors have substantially greater resources and lending capabilities and may offer services that the Company does not currently provide. In addition, many of the Company’s non-bank competitors are not subject to the same extensive Federal regulations that govern financial holding companies and Federally insured banks. The Company focuses on providing unparalleled customer service, which includes offering a strong suite of products and services. Based upon our ability to grow our customer base in recent years, management feels that this business model does allow the Company to compete effectively in the markets it serves.
Operational Risk
The Company is subject to certain operational risks, including, but not limited to, data processing system failures and errors, customer or employee fraud and catastrophic failures resulting from terrorist acts or natural disasters. The Company depends upon data processing, software, communication, and information exchange on a variety of computing platforms and networks and over the Internet. Despite instituted safeguards, the Company cannot be certain that all of its systems are entirely free from vulnerability to attack or other technological difficulties or failures. If information security is breached or other technology difficulties or failures occur, information may be lost or misappropriated, services and operations may be interrupted and the Company could be exposed to claims from customers. Any of these results could have a material adverse effect on the Company’s business, financial condition, results of operations or liquidity. The Company maintains a system of internal controls to mitigate against such occurrences and maintains insurance coverage for exposures that are insurable. The Company regularly tests internal controls to ensure that they are appropriate and functioning as designed.
Technological Development and Changes
The financial services industry is subject to rapid technological changes with frequent introductions of new technology driven products and services. In addition to improving the Company’s ability to serve customers, the effective use of technology increases efficiencies and helps to maintain or reduce expenses. The Company’s ability to keep pace with technological changes affecting the financial industry and to introduce new products and services based on this new technology will be important to the Company’s continued success.
Integration of Acquisitions
The Company periodically reviews potential acquisition opportunities involving other financial institutions and financial services companies. The Company seeks merger or acquisition partners that are culturally similar, present long-term growth opportunities, have experienced management, and have the potential for improved profitability through economies of scale or expanded services. Risks associated with acquisitions include potential exposure to asset quality issues of the acquired entity, the difficulty and expense of integrating the operations and personnel of the acquired entity, potential disruption to the business of the acquired entity, potential diversion of management time and attention from other matters and impairment of relationships with, and the possible loss of, key employees and customers of the acquired entity. Failure to realize expected revenue increases, cost savings, and/or other projected benefits from an acquisition could have a material adverse effect on the Company’s financial condition and results of operations.
|
|
|
|
Unresolved Staff Comments |
None.
|
|
|
|
Properties |
The Company’s executive offices are located at 110 North Tioga Street, Ithaca, New York. The Company’s banking subsidiaries have 45 branch offices, of which 28 are owned and 17 are leased at market rents. The Company’s insurance subsidiary has 5 stand-alone offices, of which 3 are owned by the Company and 2 are leased at market rents. The Company’s wealth management and financial planning subsidiary has 1 office, which it leases at a market rent. Management believes the current facilities are suitable for their present and intended purposes. For additional information about the Company’s facilities, including rental expenses, see “Note 8 Bank Premises and Equipment” in Notes to Consolidated Financial Statements in Part II, Item 7. of this Report.
10
|
|
|
|
Legal Proceedings |
In October 2007, Visa USA (“Visa”) completed a reorganization in contemplation of its initial public offering (“IPO”), which was completed in the first quarter of 2008. As part of that reorganization, Tompkins and other member banks of Visa received shares of common stock of Visa, Inc. Those banks are also obligated under various agreements with Visa to share in losses stemming from certain litigation (“Covered Litigation”). Tompkins is not a named defendant in any of the Covered Litigation. Although Visa set aside a portion of the proceeds from its IPO in an escrow account to fund any judgments or settlements that may arise out of the Covered Litigation, guidance from the Securities and Exchange Commission (“SEC”) indicated that Visa member banks should record a liability for the fair value of the contingent obligation to Visa. As of December 31, 2009, the Company had a liability of $450,000 related to the Visa litigation.
The Company is involved in legal proceedings in the normal course of business, none of which are expected to have a material adverse impact on the financial condition or results of operations of the Company.
Executive Officers of the Registrant
The information concerning the Company’s executive officers is provided below as of March 1, 2010. Unless otherwise stated, executive officers’ terms run until the first meeting of the board of directors after the Company’s annual meeting of shareholders, and until their successors are elected and qualified.
|
|
|
|
|
|
Name |
Age |
Title |
Year Joined Company |
|
Stephen S. Romaine |
45 |
President and CEO |
January 2000 |
|
James W. Fulmer |
58 |
Vice Chairman of the Board |
January 2000 |
|
Robert B. Bantle |
58 |
Executive Vice President |
March 2001 |
|
David S. Boyce |
43 |
Executive Vice President |
January 2001 |
|
Francis M. Fetsko |
45 |
Executive Vice President and CFO |
October 1996 |
|
Gregory J. Hartz |
49 |
Executive Vice President |
August 2002 |
|
Gerald J. Klein, Jr. |
51 |
Executive Vice President |
January 2000 |
|
Richard W. Page, Jr. |
48 |
Senior Vice President and Chief Technology Officer |
August 2008 |
|
Thomas J. Rogers |
39 |
Executive Vice President |
January 2006 |
|
Kathleen M. Rooney |
57 |
Executive Vice President |
April 2004 |
Business Experience of the Executive Officers:
Stephen S. Romaine was appointed President and Chief Executive Officer of the Company effective January 1, 2007. From 2003 through 2006, he served as President and Chief Executive Officer of Mahopac National Bank. Prior to this appointment, Mr. Romaine was Executive Vice President and Chief Financial Officer of Mahopac National Bank. Mr. Romaine currently serves on the board of the New York Bankers Association.
James W. Fulmer has served as Vice Chairman since January 1, 2007, and Director of the Company since 2000. He previously served as President of the Company since 2000. He has also served as a Director of The Bank of Castile since 1988 and as its Chairman since 1992. Effective December 18, 2002, he assumed the additional responsibilities of President and Chief Executive Officer of The Bank of Castile. Mr. Fulmer has served as a Director of Mahopac National Bank since 1999, as Chairman of Tompkins Insurance Agencies since January 1, 2001, and as Chairman of AM&M Financial Services, Inc. since January 2006. He served as the President and Chief Executive Officer of Letchworth Independent Bancshares Corporation from 1991 until its merger with the Company in 1999. Mr. Fulmer also served as the Chief Executive Officer of The Bank of Castile from 1996 through April 2000. He was elected to the Board of the Federal Home Loan Bank in 2006, effective January 2007.
Robert B. Bantle has been employed by the Company since March 2001. He currently serves as Executive Vice President of Tompkins Services, a group that provides support to the Company in the areas of Human Resources, Training & Development, Consumer and Residential Lending Services, Collections, and Commercial Loan Operations. Prior to this assignment, he was also responsible for several additional areas including Operations, Information Technology, Remote Banking, and Card Services.
David S. Boyce has been employed by the Company since January 2001 and was promoted to Executive Vice President in April 2004. He was appointed President and Chief Executive Officer of Tompkins Insurance Agencies in 2002. He has been employed by Tompkins Insurance Agencies, and a predecessor company to Tompkins Insurance Agencies for 16 years.
Francis M. Fetsko has been employed by the Company since 1996, and has served as Chief Financial Officer since December 2000. In July 2003, he was promoted to Executive Vice President. Mr. Fetsko also serves as Chief Financial Officer of Tompkins Trust Company, The Bank of Castile, and Mahopac National Bank.
11
Gregory J. Hartz has been employed by the Company since 2002 and was appointed President and Chief Executive Officer of Tompkins Trust Company and Executive Vice President of the Company effective January 1, 2007. Previously, he was Senior Vice President of Tompkins Trust Company, with responsibility for Tompkins Investment Services.
Gerald J. Klein, Jr. has been employed by the Company since 2000 and was appointed President and Chief Executive Officer of Mahopac National Bank and Executive Vice President of the Company effective January 1, 2007. Previously, he was Executive Vice President of Mahopac National Bank, responsible for all lending and credit functions at the Bank.
Richard W. Page, Jr. has been employed with Tompkins since 2007 as its Senior Vice President and Chief Technology Officer. He was made a Senior Vice President of the Company, effective August 4, 2008. He was formerly with IBM, and is a graduate of Buffalo University, with an MBA from Syracuse University.
Thomas J. Rogers has been employed by the Company since its acquisition of AM&M Financial Services, Inc. in January 2006, and was appointed President and Chief Executive Officer of AM&M Financial Services, Inc. at that time. He was appointed Executive Vice President of the Company on January 24, 2007. He has been employed by AM&M Financial Services, Inc. since 1998.
Kathleen M. Rooney has been employed by the Company since April 2004 and served as Senior Vice President and Corporate Marketing Officer since April 2005. She was appointed Executive Vice President, Corporate Marketing Officer of the Company on April 24, 2007. Ms. Rooney is also a Senior Vice President of Mahopac National Bank with responsibility for the Bank’s Community Banking Division. Prior to joining the Company, Ms. Rooney was employed by JPMorgan Chase for over 28 years in various capacities, most recently as the Senior Vice President and Investments Executive responsible for sales, service, operation and compliance of brokerage, portfolio management and trust products for the retail bank.
|
|
|
|
Market for Registrant’s Common Equity, Related Stockholder Matters and Issuer Purchases of Equity Securities |
Market Price and Dividend Information
The Company’s common stock is traded under the symbol “TMP” on the NYSE-Amex (the “Exchange”). The high and low closing sale prices, which represent actual transactions as quoted on the Exchange, of the Company’s common stock for each quarterly period in 2008 and 2009 are presented below. The per share dividends paid by the Company in each quarterly period in 2008 and 2009 and the payment dates of these dividends are also presented below.
|
|
|
|
|
|
|
|
|
|
|
|
|
|
|
|
|
|
|
|
|
|
|
|
Market Price |
|
Cash Dividends |
|
||||||||
|
|
|
|
|
|
High |
|
Low |
|
Amount |
|
Date Paid |
|
||||
|
2008 |
|
|
1st Quarter |
|
$ |
46.00 |
|
$ |
32.88 |
|
$ |
.29 |
|
|
2/15/08 |
|
|
|
|
|
2nd Quarter |
|
|
46.50 |
|
|
33.82 |
|
|
.29 |
|
|
5/15/08 |
|
|
|
|
|
3rd Quarter |
|
|
49.55 |
|
|
33.16 |
|
|
.31 |
|
|
8/15/08 |
|
|
|
|
|
4th Quarter |
|
|
53.91 |
|
|
33.86 |
|
|
.31 |
|
|
11/14/08 |
|
|
|
|
|
|
|
|
|
|
|
|
|
|
|
|
|
|
|
|
2009 |
|
|
1st Quarter |
|
$ |
50.76 |
|
$ |
29.55 |
|
$ |
.31 |
|
|
2/16/09 |
|
|
|
|
|
2nd Quarter |
|
|
45.95 |
|
|
36.64 |
|
|
.31 |
|
|
5/15/09 |
|
|
|
|
|
3rd Quarter |
|
|
43.59 |
|
|
38.25 |
|
|
.31 |
|
|
8/14/09 |
|
|
|
|
|
4th Quarter |
|
|
41.23 |
|
|
35.68 |
|
|
.31 |
|
|
11/16/09 |
|
Cash dividends per share and the high and low market prices in the table above have been retroactively adjusted to reflect a 10% stock dividend paid on February 15, 2010.
As of February 22, 2010, there were approximately 2,087 holders of record of the Company’s common stock.
The Company’s ability to pay dividends is generally limited to earnings from the prior year, although retained earnings and dividends from its subsidiaries may also be used to pay dividends under certain circumstances. The Company’s primary source of funds to pay for shareholder dividends is receipt of dividends from its subsidiaries. Future dividend payments to the Company by its subsidiaries will be dependent on a number of factors, including the earnings and financial condition of each subsidiary, and are subject to the regulatory limitations discussed in “Note 20 Regulations and Supervision” in Notes to Consolidated Financial Statements in Part II, Item 7. of this Report.
12
Issuer Purchases of Equity Securities
The following table includes all Company repurchases, including those made pursuant to publicly announced plans or programs during the quarter ended December 31, 2009.
|
|
|
|
|
|
|
|
|
|
|
|
|
|
|
|
|
|||||||||||||
|
Period |
|
Total Number of |
|
Average Price Paid |
|
Total Number of |
|
Maximum Number |
|
||||
|
October 1, 2009 through October 31, 2009 |
|
|
1,122 |
|
$ |
43.11 |
|
|
0 |
|
|
143,500 |
|
|
|
|
|
|
|
|
|
|
|
|
|
|
|
|
|
November 1, 2009 through November 30, 2009 |
|
|
400 |
|
$ |
40.64 |
|
|
0 |
|
|
143,500 |
|
|
|
|
|
|
|
|
|
|
|
|
|
|
|
|
|
December 1, 2009 through December 31, 2009 |
|
|
1,055 |
|
$ |
40.41 |
|
|
0 |
|
|
143,500 |
|
|
Total |
|
|
2,577 |
|
$ |
41.62 |
|
|
0 |
|
|
143,500 |
|
On July 22, 2008, the Company’s Board of Directors approved a stock repurchase plan (the “2008 Plan”). The 2008 Plan authorizes the repurchase of up to 150,000 shares of the Company’s outstanding common stock over a two-year period. The 2008 Plan replaces a previous repurchase plan that expired in July 2008. The Company did not purchase any shares under the 2008 Plan during the fourth quarter of 2009. The Company has purchased 6,500 shares under the 2008 Plan since its inception: 5,000 shares at an average price of $35.51 during the first quarter of 2009 and 1,500 shares at an average price of $38.53 in 2008.
Included above are 1,122 shares purchased in October 2009, at an average cost of $43.11, 400 shares purchased in November 2009 at an average cost of $40.64, and 1,055 shares purchased in December 2009, at an average cost of $40.41 by the trustee of the rabbi trust established by the Company under the Company’s Stock Retainer Plan For Eligible Directors of Tompkins Financial Corporation and Participating Subsidiaries, and were part of the director deferred compensation under that plan. Shares purchased under the rabbi trust are not part of the Board approved stock repurchase plan.
Recent Sales of Unregistered Securities
None
Equity Compensation Plan Information
Information regarding securities authorized for issuance under equity compensation plans is provided in Part III, “Item 11. Security Ownership of Certain Beneficial Owners and Management and Related Stockholder Matters” of this Report.
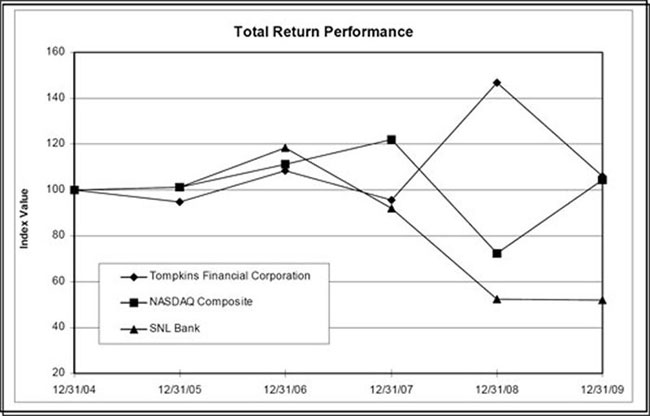
Performance Graph
The following graph compares the Company’s cumulative total stockholder return since December 31, 2004, with (1) the total return index for the NASDAQ Composite and (2) the total return index for SNL Bank Index. The graph assumes $100.00 was invested on December 31, 2004, in the Company’s common stock and the comparison groups and assumes the reinvestment of all cash dividends prior to any tax effect and retention of all stock dividends.
In accordance with and to the extent permitted by applicable law or regulation, the information set forth below under the heading “Performance Graph” shall not be incorporated by reference into any future filing under the Securities Act of 1933, as amended (the “Securities Act”), or Exchange Act and shall not be deemed to be “soliciting material” or to be “filed” with the SEC under the Securities Act or the Exchange Act. The performance graph represents past performance and should not be considered an indication of future performance.
13
|
|
|
|
|
|
|
|
|
|
|
|
|
|
|
|
|
|
|
|
|
|
|
|
Period Ending |
|||||||||||||||||
|
|
|
||||||||||||||||||
|
Index |
|
12/31/04 |
|
12/31/05 |
|
12/31/06 |
|
12/31/07 |
|
12/31/08 |
|
12/31/09 |
|
||||||
|
Tompkins Financial Corporation |
|
|
100.00 |
|
|
94.63 |
|
|
108.45 |
|
|
95.60 |
|
|
146.94 |
|
|
105.87 |
|
|
NASDAQ Composite |
|
|
100.00 |
|
|
101.37 |
|
|
111.03 |
|
|
121.92 |
|
|
72.49 |
|
|
104.31 |
|
|
SNL Bank |
|
|
100.00 |
|
|
101.36 |
|
|
118.57 |
|
|
92.14 |
|
|
52.57 |
|
|
52.03 |
|
|
|
|
|
Selected Financial Data |
The following consolidated selected financial data is taken from the Company’s audited financial statements as of and for the five years ended December 31, 2009. The following selected financial data should be read in conjunction with the consolidated financial statements and the notes thereto in Part II, Item 7. of this Report. All of the Company’s acquisitions during this five year period were accounted for using the purchase method. Accordingly, the operating results of the acquired companies are included in the Company’s results of operations since their respective acquisition dates.
14
|
|
|
|
|
|
|
|
|
|
|
|
|
|
|
|
|
|
|
|
|
Year ended December 31 |
|
|||||||||||||
|
(in thousands except per share data) |
|
2009 |
|
2008 |
|
2007 |
|
2006 |
|
2005 |
|
|||||
|
FINANCIAL STATEMENT HIGHLIGHTS |
|
|
|
|
|
|
|
|
|
|
|
|
|
|
|
|
|
Assets |
|
$ |
3,153,260 |
|
$ |
2,867,722 |
|
$ |
2,359,459 |
|
$ |
2,210,837 |
|
$ |
2,106,870 |
|
|
Total loans |
|
|
1,914,818 |
|
|
1,817,531 |
|
|
1,440,122 |
|
|
1,326,298 |
|
|
1,271,349 |
|
|
Deposits |
|
|
2,439,864 |
|
|
2,134,007 |
|
|
1,720,826 |
|
|
1,709,420 |
|
|
1,683,010 |
|
|
Other borrowings |
|
|
208,956 |
|
|
274,791 |
|
|
210,862 |
|
|
85,941 |
|
|
63,673 |
|
|
Shareholders’ equity |
|
|
245,008 |
|
|
219,361 |
|
|
198,647 |
|
|
191,072 |
|
|
182,673 |
|
|
Interest and dividend income |
|
|
146,795 |
|
|
140,783 |
|
|
132,441 |
|
|
121,041 |
|
|
106,707 |
|
|
Interest expense |
|
|
39,758 |
|
|
50,393 |
|
|
58,412 |
|
|
48,184 |
|
|
31,686 |
|
|
Net interest income |
|
|
107,037 |
|
|
90,390 |
|
|
74,029 |
|
|
72,857 |
|
|
75,021 |
|
|
Provision for loan and lease losses |
|
|
9,288 |
|
|
5,428 |
|
|
1,529 |
|
|
1,424 |
|
|
2,659 |
|
|
Net securities gains (losses) |
|
|
348 |
|
|
477 |
|
|
384 |
|
|
15 |
|
|
(1,526 |
) |
|
Net income |
|
|
31,831 |
|
|
29,834 |
|
|
26,371 |
|
|
27,767 |
|
|
27,685 |
|
|
PER SHARE INFORMATION (1) |
|
|
|
|
|
|
|
|
|
|
|
|
|
|
|
|
|
Basic earnings per share |
|
|
2.98 |
|
|
2.81 |
|
|
2.47 |
|
|
2.56 |
|
|
2.55 |
|
|
Diluted earnings per share |
|
|
2.96 |
|
|
2.78 |
|
|
2.45 |
|
|
2.52 |
|
|
2.52 |
|
|
Cash dividends per share |
|
|
1.24 |
|
|
1.20 |
|
|
1.13 |
|
|
1.04 |
|
|
0.97 |
|
|
Book value per share |
|
|
22.87 |
|
|
20.44 |
|
|
18.71 |
|
|
17.49 |
|
|
16.70 |
|
|
SELECTED RATIOS |
|
|
|
|
|
|
|
|
|
|
|
|
|
|
|
|
|
Return on average assets |
|
|
1.06 |
% |
|
1.13 |
% |
|
1.16 |
% |
|
1.30 |
% |
|
1.36 |
% |
|
Return on average equity |
|
|
13.66 |
% |
|
14.15 |
% |
|
13.88 |
% |
|
14.90 |
% |
|
15.69 |
% |
|
Average shareholders’ equity to average assets |
|
|
7.74 |
% |
|
8.01 |
% |
|
8.38 |
% |
|
8.71 |
% |
|
8.66 |
% |
|
Dividend payout ratio |
|
|
41.61 |
% |
|
42.70 |
% |
|
45.75 |
% |
|
40.63 |
% |
|
38.04 |
% |
|
|
|
|
|
|
|
|
|
|
|
|
|
|
|
|
|
|
|
OTHER SELECTED DATA (in whole numbers, unless otherwise noted) |
|
|
|
|
|
|
|
|
|
|
||||||
|
Employees (average full-time equivalent) |
|
|
720 |
|
|
686 |
|
|
662 |
|
|
658 |
|
|
587 |
|
|
Banking offices |
|
|
45 |
|
|
45 |
|
|
39 |
|
|
37 |
|
|
34 |
|
|
Bank access centers (ATMs) |
|
|
67 |
|
|
69 |
|
|
61 |
|
|
59 |
|
|
51 |
|
|
Trust and investment services assets under management, or custody (in thousands) |
|
$ |
2,542,792 |
|
$ |
2,161,484 |
|
$ |
2,345,575 |
|
$ |
2,183,114 |
|
$ |
1,534,557 |
|
(1) Per share data has been retroactively adjusted to reflect a 10% stock dividend paid on February 15, 2010 and a 10% stock dividend paid on May 15, 2006.
|
|
|
|
Management’s Discussion and Analysis of Financial Condition and Results of Operations |
The following analysis is intended to provide the reader with a further understanding of the consolidated financial condition and results of operations of the Company and its operating subsidiaries for the periods shown. This Management’s Discussion and Analysis of Financial Condition and Results of Operations should be read in conjunction with other sections of this Report on Form 10-K, including Part I, “Item 1. Business”, Part II, “Item 5. Selected Financial Data”, and Part II, “Item 7. Financial Statements and Supplementary Data”.
OVERVIEW
Tompkins Financial Corporation (“Tompkins” or the “Company”), is registered as a financial holding company with the Federal Reserve Board under the Bank Holding Company Act of 1956, as amended. Tompkins is the corporate parent of 3 community banks, Tompkins Trust Company (“Trust Company”), The Bank of Castile, and The Mahopac National Bank (“Mahopac National Bank”), which together operate 45 banking offices, including 3 limited-service offices, in local market areas throughout New York State. The Company expanded its banking offices in 2008 with the acquisition of Sleepy Hollow Bancorp, Inc., effective May 9, 2008, which added 6 banking offices, including 1 limited service office, all in Westchester County, New York.
In addition to traditional banking products and services, the Company provides a full range of money management services through Tompkins Investment Services, a division of Tompkins Trust Company, and AM&M Financial Services, Inc. (“AM&M”); and insurance products and services through Tompkins Insurance Agencies, Inc. (“Tompkins Insurance”). AM&M, a fee-based financial planning and wealth management firm headquartered in Pittsford, New York, has three operating companies: (1) AM&M Planners, Inc., which provides fee based financial planning and wealth management services for corporate executives, small business owners, and high net worth individuals; (2) Ensemble Financial Services, Inc., an independent broker-dealer and leading outsourcing company for financial planners and investment advisors; and (3) Ensemble Risk Solutions, Inc., which creates customized risk management plans using life, disability and long-term care insurance products.
15
Tompkins Insurance is an independent insurance agency with a history of over 100 years of service to individual and business clients throughout Western New York. Tompkins Insurance has expanded its geographic footprint into the Ithaca, New York market area with the acquisition of three insurance agencies over the past three years.
Each Tompkins subsidiary operates with a community focus, meeting the needs of the unique communities served. The Company conducts its business through its wholly-owned subsidiaries, Tompkins Trust Company, The Bank of Castile, Mahopac National Bank, Tompkins Insurance, and AM&M. Unless the context otherwise requires, the term “Company” refers to Tompkins Financial Corporation and its subsidiaries.
Forward-Looking Statements
The Company is making this statement in order to satisfy the “Safe Harbor” provision contained in the Private Securities Litigation Reform Act of 1995. The statements contained in this Report on Form 10-K that are not statements of historical fact may include forward-looking statements that involve a number of risks and uncertainties. Such forward-looking statements are made based on management’s expectations and beliefs concerning future events impacting the Company and are subject to certain uncertainties and factors relating to the Company’s operations and economic environment, all of which are difficult to predict and many of which are beyond the control of the Company, that could cause actual results of the Company to differ materially from those matters expressed and/or implied by forward-looking statements. The following factors are among those that could cause actual results to differ materially from the forward-looking statements: changes in general economic, market and regulatory conditions; the development of an interest rate environment that may adversely affect the Company’s interest rate spread, other income or cash flow anticipated from the Company’s operations, investment and/or lending activities; changes in laws and regulations affecting banks, bank holding companies and/or financial holding companies; technological developments and changes; the ability to continue to introduce competitive new products and services on a timely, cost-effective basis; governmental and public policy changes, including environmental regulation; protection and validity of intellectual property rights; reliance on large customers; and financial resources in the amounts, at the times and on the terms required to support the Company’s future businesses. In addition, such forward-looking statements could be affected by general industry and market conditions and growth rates, general economic and political conditions, including interest rate and currency exchange rate fluctuations, and other factors.
Critical Accounting Policies
In the course of normal business activity, management must select and apply many accounting policies and methodologies and make estimates and assumptions that lead to the financial results presented in the consolidated financial statements and accompanying notes of the Company. There are uncertainties inherent in making these estimates and assumptions, which could materially affect our results of operations and financial position. Management considers the accounting policy relating to the allowance for loan and lease losses (“allowance”) to be a critical accounting policy because of the uncertainty and subjectivity inherent in estimating the levels of allowance needed to cover probable credit losses within the loan portfolio and the material effect that these estimates can have on the Company’s results of operations.
The Company has developed a methodology to measure the amount of estimated loan loss exposure inherent in the loan portfolio to assure that an adequate allowance is maintained. The Company’s methodology is based upon guidance provided in SEC Staff Accounting Bulletin No. 102, Selected Loan Loss Allowance Methodology and Documentation Issues and includes allowance allocations calculated in accordance with Accounting Standards Codification (“ASC”) Topic 310, Receivables, and allowance allocations calculated in accordance with ASC Topic 450 Contingencies. The Company’s methodology for determining and allocating the allowance for loan and lease losses focuses on ongoing reviews of larger individual loans and leases, historical net charge-offs, delinquencies in the loan and lease portfolio, the level of impaired and nonperforming assets, values of underlying loan and lease collateral, the overall risk characteristics of the portfolios, changes in character or size of the portfolios, geographic location, current economic conditions, changes in capabilities and experience of lending management and staff, and other relevant factors. The various factors used in the methodologies are reviewed on a periodic basis.
Since the methodology is based upon historical experience, market trends, and management’s judgment, factors may arise that result in different estimations. Significant factors that could give rise to changes in these estimates may include, but are not limited to, changes in economic conditions in the local area, changes in interest rates, concentration of risk, declines in local property values, and the view of regulatory authorities towards loan classifications. While management considers the allowance to be adequate as of December 31, 2009, under adversely different conditions or assumptions, the Company would need to increase the allowance. Refer to the section captioned “Allowance for Loan and Lease Losses” elsewhere in this discussion for further details on the Company’s methodology and allowance.
Another critical accounting policy is the policy for pensions and other post-retirement benefits. The calculation of the expenses and liabilities related to pensions and post-retirement benefits requires estimates and assumptions of key factors including, but not limited to, discount rate, return on plan assets, future salary increases, employment levels, employee retention, and life expectancies of plan participants. The Company uses an actuarial firm in making these estimates and assumptions. Changes in these assumptions due to market conditions, governing laws and regulations, or Company specific circumstances may result in material changes to the Company’s pension and other post-retirement expenses and liabilities.
Another critical accounting policy is the policy for reviewing available-for-sale securities and held-to-maturity securities to determine if declines in fair value below amortized cost are other-than-temporary as required by FASB ASC Topic 320, Investments – Debt and
16
Equity Securities. When an other-than-temporary impairment has occurred, the amount of the other-than-temporary impairment recognized in earnings depends on whether the Company intends to sell the security or more likely than not will be required to sell the security before recovery of its amortized cost basis less any current-period credit loss. If the Company intends to sell the security or more likely than not will be required to sell the security before recovery of its amortized cost basis less any current-period credit loss, the other-than-temporary impairment is recognized in earnings equal to the entire difference between the investment’s amortized cost basis and its fair value at the balance sheet date. If the Company does not intend to sell the security and it is not more likely than not that the Company will be required to sell the security before recovery of its amortized cost basis less any current-period credit loss, the other-than-temporary impairment is separated into the amount representing the credit loss and the amount related to all other factors. The amount of the total other-than-temporary impairment related to the credit loss is recognized in earnings. In estimating other-than-temporary impairment losses, management considers, among other factors, the length of time and extent to which the fair value has been less than cost, the financial condition and near term prospects of the issuer, underlying collateral of the security, and the structure of the security.
All accounting policies are important and the reader of the financial statements should review these policies, described in “Note 1 Summary of Significant Accounting Policies” in Notes to Consolidated Financial Statements in Part II, Item 7. of this Form 10-K, to gain a better understanding of how the Company’s financial performance is reported.
RESULTS OF OPERATIONS
(Comparison of December 31, 2009 and 2008 results)
General
The Company reported diluted earnings per share of $2.96 in 2009, an increase of 6.5% over diluted earnings per share of $2.78 in 2008. Net income for the year ended December 31, 2009, was $31.8 million, up 6.7% compared to $29.8 million in 2008. Improvement in 2009 results over prior year was largely due to improved net interest margin and growth in earning assets. Both 2009 and 2008 results included certain nonrecurring items. Net income for 2009 included $1.4 million of expense related to the FDIC’s special deposit insurance assessment. This item negatively impacted 2009 diluted earnings per share by $0.07. Net income for 2008 included after-tax income of $983,000 ($1.6 million pre-tax) related to the Visa IPO. This item added $0.09 to 2008 diluted earnings per share.
In addition to earnings per share, key performance measurements for the Company include return on average shareholders’ equity (ROE) and return on average assets (ROA). ROE was 13.66% in 2009, compared to 14.15% in 2008, while ROA was 1.06% in 2009, compared to 1.13% in 2008. Tompkins’ ROA and ROE continue to compare favorably to peer ratios, ranking in the 83rd percentile for ROA and the 89th percentile for ROE of its peer group. The peer group is from the Federal Reserve Board and represents banks and bank holding companies with assets between $3.0 billion and $10.0 billion. The peer ratios are as of December 31, 2009, the most recent data available from the Federal Reserve Board. Total revenues, consisting of net interest income and noninterest income, were $153.3 million in 2009, up $16.8 million or 12.3% over 2008. Revenues in 2008 included $1.6 million of income related to the Visa IPO. Total revenues in 2009 benefited from solid growth in net interest income, resulting from lower funding costs and growth in average earning assets. Low market interest rates in 2009 affected both asset yields and funding costs. However, deposit pricing strategies resulted in funding costs decreasing at a faster rate than asset yields. Noninterest income in 2009 benefited from net gains on assets and liabilities held at fair value and gains on the sales of residential mortgage loans as low interest rates led to higher volumes of loan originations.
Total assets were up 10.0% to $3.2 billion at December 31, 2009. Asset growth over the past twelve months included a $97.3 million increase in total loans and leases and a $168.7 million increase in the securities portfolio. Nonperforming assets increased to 1.12% of total assets, up from 0.56% at year-end 2008, driven in part by deteriorating trends in asset quality due to weak economic conditions.
Segment Reporting
The
Company has identified two business segments, banking and financial services.
Financial services activities consist of the results of the Company’s trust,
financial planning and wealth management, broker-dealer services, and risk
management operations. All other activities are considered banking.
The Banking
segment reported net income of $28.4 million in 2009, up $2.4 million or 9.5%
from net income of $26.0 million in 2008, driven by strong growth in net
interest income. Net interest income of $106.8 million was up $16.6 million, or
18.4% in 2009 from $90.2 million in 2008. Net interest income benefited from
growth in average earning assets and lower rates paid on interest-bearing
liabilities. Both 2009 and 2008 had nonrecurring items, which affect the
year-over-year comparison of operating results. Noninterest expense in 2009
included $1.4 million of expense ($0.07 per diluted share) related to the
FDIC’s special assessment, while noninterest income in 2008 included $1.6
million ($0.09 per diluted share) related to the Visa IPO.
The provision for loan and lease losses in 2009 was $9.3 million, compared to $5.4 million in 2008. The higher provision expense reflects deterioration in asset quality measures as evidenced by an increase in net charge-offs and nonperforming loans, growth in loans and leases, and the impacts of a weak economy.
17
Noninterest income of $21.2 million in 2009 was up 1.6% over 2008. As previously mentioned, 2008 noninterest income included $1.6 million of proceeds from the Visa IPO. Service charges on deposit accounts were down $880,000 or 8.6% in 2009 from the prior year. Noninterest income in 2009 benefited from net mark-to-market gains on securities and liabilities held at fair value of $1.5 million compared to net mark-to-market losses of $1.2 million in 2008. Higher residential loan originations and sales in 2009 produced gains on sales of loans of $1.4 million in 2009, up from $105,000 in 2008.
Noninterest expenses totaled $76.7 million in 2009, an increase of $9.0 million or 13.3% over the same period in 2008. The two main contributors to the growth in noninterest expense were FDIC deposits insurance assessments and salaries and benefits. FDIC deposit insurance assessments totaled $5.0 million in 2009, up from $933,000 in 2008, reflecting the special assessment and higher deposit premiums.
The Financial Services segment had net income of $3.4 million in 2009, a decrease of $464,000 or 12.0% from net income of $3.9 million in 2008. Noninterest income derived from the Financial Services segment was $25.6 million in 2009, a decrease of $207,000 or 0.8% compared the same period in 2008. Volatility in the bond and equity markets and a weak overall economy in 2009 had an adverse affect on fee-based businesses, including investment services income. The market value of assets managed by or in custody of the Company at year-end 2009 was up over prior year-end, increasing over the course of the year as a result of higher market levels and new business initiatives. Insurance revenues were up $700,000 or 6.0% in 2009 over prior year. Noninterest expenses of $20.5 million in 2009 were up $550,000 or 2.8% over the same period prior year. The increase was mainly in salaries and benefits, reflecting annual merit increases, stock-based and other incentive compensation accruals, and other operating expenses.
Net Interest Income
Table 1 – Average Statements of Condition and Net Interest Analysis shows average interest-earning assets and interest-bearing liabilities, and the corresponding yield or cost associated with each. Taxable-equivalent net interest income for 2009 was $110.0 million, an increase of $16.8 million, or 18.0%, compared to the same period in 2008. The favorable year-over-year comparison primarily resulted from an increase in the average volume of interest-earning assets, and an increase in net interest margin compared to the same period in the prior year. For 2009, average earning assets were up $359.4 million or 14.7%, over the same period in 2008. The taxable-equivalent net interest margin for 2009 of 3.92% was up from 3.81% in 2008. The net interest margin benefited from the decrease in short-term market interest rates throughout 2009, which reduced both asset yields and funding costs. The lower short-term market rates led to a 54 basis point decrease in the yield on average earning assets to 5.34% for 2009, compared to 5.88% for 2008; however, the decrease in yield on average earning assets was more than offset by lower funding costs. The average cost of interest-bearing liabilities for 2009 was down 83 basis points to 1.72%, compared to 2.55% for 2008.
Taxable-equivalent interest income was up 4.3% in 2009 over 2008. The growth in taxable-equivalent interest income was primarily a result of higher average loan and investment balances as average yields were lower year-over-year. Average loan balances were up $237.7 million or 14.7% in 2009 over 2008, while the average yield on loans decreased 56 basis points to 5.83%. Loan growth in 2009 included a $125.5 million increase in average commercial real estate loans, and a $47.8 million increase in average residential real estate loans. The decrease in yields on average loans in 2009 was partly due to refinancing activity as a result of the prime interest rate reduction of 400 basis points in 2008. Average securities balances were up $97.7 million in 2009 over 2008, while average yields were down 31 basis points.
Interest expense for 2009 was down 21.1% compared to 2008, reflecting lower average rates paid on deposits and borrowings, partially offset by growth in average balances. The average rate paid on interest-bearing deposits during 2009 of 1.28% was 90 basis points lower than the average rate paid in 2008. The decrease in the average cost of interest-bearing deposits reflects a decrease in the interest rates offered on deposit products due to decreases in average market rates combined with an increase in the relative proportion of lower cost savings and money market deposits. Average interest-bearing deposit balances increased by $314.5 million or 19.9% in 2009 compared to 2008. The majority of the increase was in average interest checking, savings and money market deposit balances, which were up 24.5% to $1.1 billion, and average time deposits of $100,000 or less balances were up 9.2% to $420.4 million. Average noninterest bearing deposit balances of $427.0 million were up 4.8% in 2009 over the same period in 2008. Average other borrowings of $204.5 million were up 6.4% over prior year, while the average yield was down 27 basis points from prior year.
18
Table 1 - Average Statements of Condition and Net Interest Analysis
|
|
|
|
|
|
|
|
|
|
|
|
|
|
|
|
|
|
|
|
|
|
|
|
|
|
|
|
|
|
December 31, |
|
||||||||||||||||||||||
|
|
|
2009 |
|
2008 |
|
2007 |
|
||||||||||||||||||
|
(dollar amounts in thousands) |
|
Average |
|
Interest |
|
Average |
|
Average |
|
Interest |
|
Average |
|
Average |
|
Interest |
|
Average |
|
||||||
|
ASSETS |
|
|
|
|
|
|
|
|
|
|
|
|
|
|
|
|
|
|
|
|
|
|
|
|
|
|
Interest-earning assets: |
|
|
|
|
|
|
|
|
|
|
|
|
|
|
|
|
|
|
|
|
|
|
|
|
|
|
Certificates of deposit, other banks |
|
$ |
17,017 |
|
$ |
27 |
|
0.16 |
% |
$ |
6,239 |
|
$ |
133 |
|
2.13 |
% |
$ |
4,820 |
|
$ |
217 |
|
4.50 |
% |
|
Money market funds |
|
|
17,130 |
|
|
36 |
|
0.21 |
|
|
9,064 |
|
|
246 |
|
2.71 |
|
|
4,149 |
|
|
205 |
|
4.94 |
|
|
Securities (1) |
|
|
|
|
|
|
|
|
|
|
|
|
|
|
|
|
|
|
|
|
|
|
|
|
|
|
U.S. Government securities |
|
|
721,438 |
|
|
31,812 |
|
4.41 |
|
|
615,234 |
|
|
29,130 |
|
4.73 |
|
|
535,700 |
|
|
25,619 |
|
4.78 |
|
|
Trading securities |
|
|
35,067 |
|
|
1,362 |
|
3.88 |
|
|
43,331 |
|
|
1,923 |
|
4.44 |
|
|
59,213 |
|
|
2,762 |
|
4.66 |
|
|
State and municipal (2) |
|
|
111,253 |
|
|
6,715 |
|
6.04 |
|
|
110,551 |
|
|
6,648 |
|
6.01 |
|
|
103,213 |
|
|
6,270 |
|
6.07 |
|
|
Other securities (2) |
|
|
20,710 |
|
|
1,064 |
|
5.14 |
|
|
21,620 |
|
|
1,177 |
|
5.44 |
|
|
18,499 |
|
|
1,031 |
|
5.57 |
|
|
Total securities |
|
|
888,468 |
|
|
40,953 |
|
4.61 |
|
|
790,736 |
|
|
38,878 |
|
4.92 |
|
|
716,625 |
|
|
35,682 |
|
4.98 |
|
|
Federal funds sold |
|
|
8,542 |
|
|
15 |
|
0.18 |
|
|
5,258 |
|
|
115 |
|
2.19 |
|
|
4,120 |
|
|
217 |
|
5.27 |
|
|
FHLB and FRB stock |
|
|
20,274 |
|
|
893 |
|
4.40 |
|
|
18,490 |
|
|
1,074 |
|
5.81 |
|
|
13,450 |
|
|
1,010 |
|
7.51 |
|
|
Loans, net of unearned income (3) |
|
|
|
|
|
|
|
|
|
|
|
|
|
|
|
|
|
|
|
|
|
|
|
|
|
|
Residential real estate |
|
|
623,176 |
|
|
33,576 |
|
5.39 |
|
|
575,356 |
|
|
34,057 |
|
5.92 |
|
|
490,839 |
|
|
31,359 |
|
6.39 |
|
|
Commercial real estate |
|
|
660,887 |
|
|
41,903 |
|
6.34 |
|
|
535,366 |
|
|
33,711 |
|
6.30 |
|
|
424,748 |
|
|
31,418 |
|
7.40 |
|
|
Commercial loans (2) |
|
|
466,076 |
|
|
25,461 |
|
5.46 |
|
|
402,263 |
|
|
28,383 |
|
7.06 |
|
|
355,084 |
|
|
28,272 |
|
7.96 |
|
|
Consumer and other |
|
|
87,283 |
|
|
6,083 |
|
6.97 |
|
|
85,350 |
|
|
6,118 |
|
7.17 |
|
|
81,865 |
|
|
5,862 |
|
7.16 |
|
|
Lease financing (2) |
|
|
13,031 |
|
|
784 |
|
6.02 |
|
|
14,381 |
|
|
841 |
|
5.85 |
|
|
9,881 |
|
|
627 |
|
6.35 |
|
|
Total loans, net of unearned income |
|
|
1,850,453 |
|
|
107,807 |
|
5.83 |
|
|
1,612,716 |
|
|
103,110 |
|
6.39 |
|
|
1,362,417 |
|
|
97,538 |
|
7.16 |
|
|
Total interest-earning assets |
|
|
2,801,884 |
|
|
149,731 |
|
5.34 |
|
|
2,442,503 |
|
|
143,556 |
|
5.88 |
|
|
2,105,581 |
|
|
134,869 |
|
6.41 |
|
|
Noninterest-earning assets |
|
|
207,123 |
|
|
|
|
|
|
|
190,517 |
|
|
|
|
|
|
|
160,643 |
|
|
|
|
|
|
|
|
|
|
|
|
|
|
|
|
|
|
|
|
|
|
|
|
|
|
|
||||||
|
Total assets |
|
$ |
3,009,007 |
|
|
|
|
|
|
$ |
2,633,020 |
|
|
|
|
|
|
$ |
2,266,224 |
|
|
|
|
|
|
|
|
|
|
|
|
|
|
|
|
|
|
|
|
|
|
|
|
|
|
|
|
|
|
|
|
|
|
|
|
|
|
|
|
|
|
|
|
|
|
|
|
|
|
|
|
|
|
|
|
|
|
|
|
|
LIABILITIES & SHAREHOLDERS’EQUITY |
|
|
|
|
|
|
|
|
|
|
|
|
|
|
|
|
|
|
|
|
|
|
|
|
|
|
Deposits: |
|
|
|
|
|
|
|
|
|
|
|
|
|
|
|
|
|
|
|
|
|
|
|
|
|
|
Interest-bearing deposits Interest checking, savings, and money market |
|
$ |
1,128,648 |
|
$ |
8,694 |
|
0.77 |
% |
$ |
906,404 |
|
$ |
12,983 |
|
1.43 |
% |
$ |
723,297 |
|
$ |
14,361 |
|
1.99 |
% |
|
Time Deposits > $100,000 |
|
|
303,761 |
|
|
5,442 |
|
1.79 |
|
|
282,547 |
|
|
9,039 |
|
3.20 |
|
|
304,614 |
|
|
14,750 |
|
4.84 |
|
|
Time Deposits < $100,000 |
|
|
420,351 |
|
|
9,223 |
|
2.19 |
|
|
384,903 |
|
|
12,273 |
|
3.19 |
|
|
343,969 |
|
|
15,651 |
|
4.55 |
|
|
Brokered Time Dep. < $100,000 |
|
|
43,218 |
|
|
852 |
|
1.97 |
|
|
7,580 |
|
|
233 |
|
3.07 |
|
|
14,729 |
|
|
723 |
|
4.91 |
|
|
Total interest-bearing deposits |
|
|
1,895,978 |
|
|
24,211 |
|
1.28 |
|
|
1,581,434 |
|
|
34,528 |
|
2.18 |
|
|
1,386,609 |
|
|
45,485 |
|
3.28 |
|
|
Federal funds purchased and securities sold under agreements to repurchase |
|
|
190,975 |
|
|
6,254 |
|
3.27 |
|
|
203,385 |
|
|
7,496 |
|
3.69 |
|
|
199,126 |
|
|
8,125 |
|
4.08 |
|
|
Other borrowings |
|
|
204,467 |
|
|
8,206 |
|
4.01 |
|
|
192,144 |
|
|
8,216 |
|
4.28 |
|
|
100,824 |
|
|
4,802 |
|
4.76 |
|
|
Trust preferred debentures |
|
|
17,311 |
|
|
1,087 |
|
6.28 |
|
|
2,552 |
|
|
153 |
|
6.00 |
|
|
0 |
|
|
0 |
|
0.00 |
|
|
Total interest-bearing liabilities |
|
|
2,308,731 |
|
|
39,758 |
|
1.72 |
|
|
1,979,515 |
|
|
50,393 |
|
2.55 |
|
|
1,686,559 |
|
|
58,412 |
|
3.46 |
|
|
Noninterest-bearing deposits |
|
|
427,025 |
|
|
|
|
|
|
|
407,336 |
|
|
|
|
|
|
|
356,457 |
|
|
|
|
|
|
|
Accrued expenses and other liabilities |
|
|
40,242 |
|
|
|
|
|
|
|
35,384 |
|
|
|
|
|
|
|
33,246 |
|
|
|
|
|
|
|
Total liabilities |
|
|
2,775,998 |
|
|
|
|
|
|
|
2,422,235 |
|
|
|
|
|
|
|
2,076,262 |
|
|
|
|
|
|
|
Tompkins Financial Corporation shareholders’ equity |
|
|
231,498 |
|
|
|
|
|
|
|
207,382 |
|
|
|
|
|
|
|
188,482 |
|
|
|
|
|
|
|
Noncontrolling interest |
|
|
1,511 |
|
|
|
|
|
|
|
3,403 |
|
|
|
|
|
|
|
1,480 |
|
|
|
|
|
|
|
Total equity |
|
|
233,009 |
|
|
|
|
|
|
|
210,785 |
|
|
|
|
|
|
|
189,962 |
|
|
|
|
|
|
|
Total liabilities and equity |
|
$ |
3,009,007 |
|
|
|
|
|
|
$ |
2,633,020 |
|
|
|
|
|
|
$ |
2,266,224 |
|
|
|
|
|
|
|
Interest rate spread |
|
|
|
|
|
|
|
3.62 |
% |
|
|
|
|
|
|
3.33 |
% |
|
|
|
|
|
|
2.95 |
% |
|
Net interest income/margin on earning assets |
|
|
|
|
$ |
109,973 |
|
3.92 |
% |
|
|
|
$ |
93,163 |
|
3.81 |
% |
|
|
|
$ |
76,457 |
|
3.63 |
% |
|
Tax equivalent adjustment |
|
|
|
|
|
(2,936 |
) |
|
|
|
|
|
|
(2,773 |
) |
|
|
|
|
|
|
(2,428 |
) |
|
|
|
Net interest income per consolidated financial statements |
|
|
|
|
$ |
107,037 |
|
|
|
|
|
|
$ |
90,390 |
|
|
|
|
|
|
$ |
74,029 |
|
|
|
(1) Average balances and yields on available-for-sale securities are based on amortized cost.
(2) Interest income includes the tax effects of taxable-equivalent adjustments using a combined New York State and Federal effective income tax rate of 40% to increase tax-exempt interest income to a taxable equivalent basis.
(3) Nonaccrual loans are included in the average loan totals presented above. Payments received on nonaccrual loans have been recognized as disclosed in “Note 1 Summary of Significant Accounting Policies” in the Notes to Consolidated Financial Statements in Part II, Item 7. of this Report.
19
Table 2 - Analysis of Changes in Net Interest Income
|
|
|
|
|
|
|
|
|
|
|
|
|
|
|
|
|
|
|
|
|
|
(in thousands) (taxable equivalent) |
|
2009 vs. 2008 |
|
2008 vs. 2007 |
|
||||||||||||||
|
|
|
Increase (Decrease) Due to Change in |
|
Increase (Decrease) Due to Change in |
|
||||||||||||||
|
|
|
Volume |
|
Average |
|
Total |
|
Volume |
|
Average |
|
Total |
|
||||||
|
INTEREST INCOME: |
|
|
|
|
|
|
|
|
|
|
|
|
|
|
|
|
|
|
|
|
Certificates of deposit, other banks |
|
$ |
91 |
|
$ |
(197 |
) |
$ |
(106 |
) |
$ |
52 |
|
$ |
(136 |
) |
$ |
(84 |
) |
|
Money market funds |
|
|
120 |
|
|
(330 |
) |
|
(210 |
) |
|
164 |
|
|
(123 |
) |
|
41 |
|
|
Federal funds sold |
|
|
45 |
|
|
(145 |
) |
|
(100 |
) |
|
49 |
|
|
(151 |
) |
|
(102 |
) |
|
Investments: |
|
|
|
|
|
|
|
|
|
|
|
|
|
|
|
|
|
|
|
|
Taxable |
|
|
4,418 |
|
|
(2,410 |
) |
|
2,008 |
|
|
3,190 |
|
|
(372 |
) |
|
2,818 |
|
|
Tax-exempt |
|
|
(4 |
) |
|
71 |
|
|
67 |
|
|
415 |
|
|
(37 |
) |
|
378 |
|
|
FHLB and FRB stock |
|
|
96 |
|
|
(277 |
) |
|
(181 |
) |
|
325 |
|
|
(261 |
) |
|
64 |
|
|
Loans, net: |
|
|
|
|
|
|
|
|
|
|
|
|
|
|
|
|
|
|
|
|
Taxable |
|
|
14,276 |
|
|
(9,886 |
) |
|
4,390 |
|
|
16,235 |
|
|
(10,849 |
) |
|
5,386 |
|
|
Tax-exempt |
|
|
88 |
|
|
219 |
|
|
307 |
|
|
365 |
|
|
(179 |
) |
|
186 |
|
|
Total interest income |
|
$ |
19,130 |
|
$ |
(12,955 |
) |
$ |
6,175 |
|
$ |
20,795 |
|
$ |
(12,108 |
) |
$ |
8,687 |
|
|
|
|
|
|
|
|
|
|
|
|
|
|
|
|
|
|
|
|
|
|
|
INTEREST EXPENSE: |
|
|
|
|
|
|
|
|
|
|
|
|
|
|
|
|
|
|
|
|
Interest-bearing deposits: |
|
|
|
|
|
|
|
|
|
|
|
|
|
|
|
|
|
|
|
|
Interest checking, savings, and money market |
|
|
2,673 |
|
|
(6,962 |
) |
|
(4,289 |
) |
|
3,153 |
|
|
(4,531 |
) |
|
(1,378 |
) |
|
Time |
|
|
2,653 |
|
|
(8,681 |
) |
|
(6,028 |
) |
|
541 |
|
|
(10,120 |
) |
|
(9,579 |
) |
|
Federal funds purchased and securities sold under agreements to repurchase |
|
|
(439 |
) |
|
(803 |
) |
|
(1,242 |
) |
|
171 |
|
|
(800 |
) |
|
(629 |
) |
|
Other borrowings |
|
|
1,251 |
|
|
(327 |
) |
|
924 |
|
|
4,010 |
|
|
(443 |
) |
|
3,567 |
|
|
Total interest expense |
|
$ |
6,138 |
|
$ |
(16,773 |
) |
$ |
(10,635 |
) |
$ |
7,875 |
|
$ |
(15,894 |
) |
$ |
(8,019 |
) |
|
Net interest income |
|
$ |
12,992 |
|
$ |
3,818 |
|
$ |
16,810 |
|
$ |
12,920 |
|
$ |
3,786 |
|
$ |
16,706 |
|
Notes: See notes to Table 1 above.
Changes in net interest income occur from a combination of changes in the volume of interest-earning assets and interest-bearing liabilities, and in the rate of interest earned or paid on them. The above table illustrates changes in interest income and interest expense attributable to changes in volume (change in average balance multiplied by prior year rate), changes in rate (change in rate multiplied by prior year volume), and the net change in net interest income. The net change attributable to the combined impact of volume and rate has been allocated to each in proportion to the absolute dollar amounts of the change. The $16.8 million increase in taxable-equivalent net interest income from 2008 to 2009 resulted from a $6.2 million increase in interest income and an $10.6 million decrease in interest expense. An increased volume of interest earning assets, in excess of interest bearing liabilities contributed to a net $13.0 million increase in taxable-equivalent net interest income between 2008 and 2009, while changes in interest rates increased taxable-equivalent net interest income by $3.8 million, resulting in the net increase of $16.8 million from 2008.
Provision for Loan and Lease Losses
The provision for loan and lease losses represents management’s estimate of the expense necessary to maintain the allowance for loan and lease losses at an adequate level. The provision for loan and lease losses was $9.3 million in 2009, compared to $5.4 million in 2008. The increase in 2009 over prior year was due to growth in the overall loan portfolio, increases in nonperforming loans and leases and net charge-offs, as well as concerns over deteriorating economic conditions and uncertain real estate markets. Nonperforming loans and leases were $34.9 million or 1.82% of total loans and leases at December 31, 2009, compared with $16.0 million or 0.88% of total loans and leases at December 31, 2008. Net charge-offs of $3.6 million in 2009 represented 0.20% of average loans and leases during the period, compared to net charge-offs of $2.8 million in 2008, representing 0.18% of average loans and leases. See the section captioned “The Allowance for Loan and Lease Losses” included within “Management’s Discussion and Analysis of Financial Condition and Results of Operations-Financial Condition” of this Report for further analysis of the Company’s allowance for loan and lease losses.
Noninterest Income
Noninterest income is a significant source of income for the Company, representing 30.2% of total revenues in 2009, and 33.7% in 2008, and is an important factor in the Company’s results of operations. The decrease in noninterest income as a percentage of revenues in 2009 compared to 2008 was due to the $16.6 million or 18.4% growth in net interest income outpacing the growth in noninterest income which remained relatively flat compared to 2008. The May 2008 acquisition of Sleepy Hollow Bancorp, Inc.
20
(“Sleepy Hollow”) contributed to the stronger growth in net interest income, as the impact of the acquisition on the Company’s financial statements is included for a full year in 2009, and only a partial year in 2008.
Investment services income was $13.3 million in 2009, a decrease of 6.0% from $14.2 million in 2008. Investment services income reflects income from Tompkins Investment Services (“TIS”), a division within the Trust Company, and AM&M. Investment services income includes trust services, financial planning, wealth management services, and brokerage related services. TIS generates fee income through managing trust and investment relationships, managing estates, providing custody services, and managing investments in employee benefits plans. TIS also oversees retail brokerage activities in the Company’s banking offices. AM&M provides financial planning services, wealth management services, and brokerage services to independent financial planners and investment advisors. With fees largely based on the market value and the mix of assets managed, the general direction of the stock market can have a considerable impact on fee income. The market value of assets managed by, or in custody of, Tompkins was $2.5 billion at December 31, 2009, up 13.6% from $2.2 billion at December 31, 2008. These figures include $733.0 million and $541.1 million, respectively, of Company-owned securities where TIS is custodian. The increase in the market value of assets over prior year, reflects a rebound in equity markets and new business. The Company was successful with business development initiatives and customer retention despite the challenging equities markets in 2009 and the recent turmoil in the financial markets.
Insurance commissions and fees were $12.3 million in 2009, an increase of $700,000 or 6.0% over 2008. The growth was at Tompkins Insurance and AM&M. Health and benefit related insurance commissions and fees were up $302,000 or 112.8% over prior year. The Company established this business line in late 2007, and added staff to expand its presence in the life, health and benefits areas. Revenues for personal lines were up $139,000 or 3.0% over prior year, while revenues for commercial lines were in line with prior year. Tompkins Insurance and AM&M continue to increase their penetration rate for customers of the Company’s banking subsidiaries.
Service charges on deposit accounts were $9.3 million in 2009, down 8.6% compared to $10.2 million in 2008. The largest component of this category is overdraft fees, which is largely driven by customer activity. Customer activity has been changing over the past several years, with electronic transactions such as debit cards and Internet banking reducing the volume of checks.
Card services income of $3.7 million in 2009 was up $326,000 or 9.8% from 2008. The primary components of card services income are fees related to debit card transactions and ATM usage. Debit card income increased by 7.8% compared to 2008 to $2.3 million, the increase was mainly due to higher volume, partially attributable to the full year impact of a reward based program implemented in the second quarter of 2008. ATM fee income increased by 7.8% compared to 2008, mainly due increased foreign transaction fees.
Net
mark-to-market gains on securities and borrowings held at fair value totaled
$1.5 million in 2009, compared to net mark-to-market losses of $1.2 million in
2008. Mark-to-market losses or gains relate to the change in the fair value of
securities and borrowings where the Company has elected the fair value option.
The favorable gain year-over-year is mainly attributed to changes in market
interest rates.
The $1.6 million gain on Visa stock redemption in 2008 relates
to the proceeds received from the Company’s allocation of the Visa, Inc.
initial public offering (the “Visa IPO”), and consists of a $1.2 million gain
on the partial redemption of Visa stock and a $0.4 million partial reversal of
a fourth quarter 2007 accrual for indemnification charges. Visa withheld a
portion of the shares allocated to its member banks to create an escrow account
to cover the costs and liabilities associated with certain litigation for which
its member banks are obligated to indemnify Visa. Visa’s funding of this escrow
account allowed member banks to reverse litigation related accruals made in the
fourth quarter of 2007, up to each bank’s proportionate membership interest in
the $3.0 billion used to fund the escrow account.
Other income of $5.9 million in 2009 is up $140,000 or 2.4% from 2008. The primary components of other income are other service charges, increases in cash surrender value of life insurance, gains on sales of residential mortgage loans and income from miscellaneous equity investments, including the Company’s investment in a Small Business Investment Company (“SBIC”).
Other service charge income of $1.9 million was down $720,000 or 27.1% compared to the same period in 2008. Lower safe deposit box fees, lower loan related fees, and lower servicing income were the primary contributors to the decrease in other service charge income.
Increases in cash surrender value of corporate owned life insurance (“COLI”), net of mortality expense, were $1.1 million in 2009, compared to $1.4 million in 2008. The COLI relates to life insurance policies covering certain senior officers of the Company and its subsidiaries. The Company’s average investment in COLI was $35.3 million during 2009, compared to $32.8 million during 2008. The increase reflects earnings as well as the full year impact of the $3.5 million of COLI acquired in the Sleepy Hollow acquisition during the second quarter of 2008. Although income associated with the insurance policies is not included in interest income, the COLI produced an annualized tax-equivalent return of 5.1% for 2009, compared to 7.4% for 2008.
Net gains on the sales of residential mortgage loans totaled $1.4 million for 2009, compared to net gains of $105,000 in 2008. The increase in gains on sales of residential mortgage loans in 2009 is mainly a result of increased residential mortgage refinancing activity
21
and the decision to sell certain loans in the secondary market to FHLMC. Low market interest rates led to a significant increase in the volume of homeowners refinancing existing mortgages to lower fixed rates. To manage interest rate risk exposures, the Company sold certain fixed rate loan production that had rates below or maturities greater than the thresholds set by the Company’s Asset/Liability Committee.
As of December 31, 2009, the Company’s miscellaneous equity investments, including its investment in an SBIC, totaled $4.3 million, compared to $4.5 million at year-end 2008. Income related to these investments was $767,000 in 2009, up from $546,000 in 2008. The increase in 2009 over 2008 reflects gains on the sale of one equity investment as the company was acquired. This gain was partially offset by lower income related to the Company’s SBIC investment. For 2009, the Company recognized income from this investment of $212,000, compared with income of $546,000 in 2008. The Company believes that as of December 31, 2009, there is no impairment with respect to this SBIC investment.
Management may periodically sell available-for-sale securities for liquidity purposes, to improve yields, or to adjust the risk profile of the portfolio. In 2009, the Company recognized net gains of $348,000 on sales of available-for-sale securities, primarily securities of U.S. government entities. The net gains on sales of available-for-sale securities of $477,000 in 2008 were primarily on the sale of the Company’s Mastercard stock that it received as a member bank at the time of Mastercard’s initial public offering.
Noninterest Expense
Noninterest expenses for 2009 were $96.6 million, an increase of 11.0% over noninterest expenses of $87.1 million for 2008. The increase in 2009 over 2008 was primarily in compensation and benefits related expenses, and FDIC deposit insurance expense. The acquisition of Sleepy Hollow impacted several noninterest expense categories discussed below.
Personnel-related expense increased by $3.4 million or 6.7% in 2009 over 2008. The increase was mainly in pension and other employee benefit related expenses, which were up $3.1 million or 29.7% in 2009 over 2008. Pension expense was up $2.0 million, while health and dental insurance was up $598,000 for the year ended December 31, 2009, when compared to the same period in 2008. The increase was partially due to an increase in average full-time equivalent employees (“FTEs”). Year-to-date December 31, 2009 FTEs of 720 were up from 686 at December 31, 2008. Salaries and wages were also up over prior year as a result of the increase in average FTEs, as well as annual merit increases.
Expenses related to bank premises and furniture and fixtures increased by $561,000 or 5.1% for the twelve months ended December 31, 2009 over the same period in 2008. 2009 reflected a full year of additional expense associated with the May 2008 acquisition of Sleepy Hollow, which added six banking offices to the Company’s branch network.
FDIC insurance of $5.0 million in 2009 is over prior year by $4.0 million, or 433.3%. The increase reflects higher insurance premiums and a special deposit insurance assessment of $1.4 million in the second quarter of 2009. The increase in 2009 was also partly related to the additional 10 basis points paid on covered transaction accounts exceeding the $250,000 under the Temporary Liquidity Guaranty Program. Deposit insurance expense in 2008 was also favorably impacted by the Company’s use of available credits to offset deposit assessments; these credits were fully used in 2008.
Other operating expenses increased by $1.6 million or 6.6% in 2009 when compared to 2008. The primary components of other operating expense are marketing expense, professional fees, software licensing and maintenance, cardholder expense and other.
Professional fees for 2009 increased by $296,000 or 9.8% compared to 2008. Professional fees include amounts paid to outside consultants for assistance on projects or initiatives.
Software licensing and maintenance fee expense increased by $309,000 or 12.4% in 2009 over 2008. The increase in 2009 was mainly due to increased licensing fees related to the core operating system and the implementation of new software applications.
Cardholder expenses were up $307,000 or 25.1% for 2009 over 2008, as a result of higher volume of customer transactions.
Additional items contributing to the change in other operating expenses were the following: legal expense (up $253,000), audit and examination expense (up $147,000), education and training (up $115,000), telephone (up $241,000), printing and supplies (down $202,000), and merger related expenses (down $266,000).
The Company’s efficiency ratio, defined as operating expense excluding amortization of intangible assets, divided by tax-equivalent net interest income plus noninterest income before securities gains and losses (increase in the cash surrender value of COLI is shown on a tax equivalent basis), improved to 61.2% in 2009, compared to 61.7% in 2008. Tax equivalency was based upon a 40% tax rate. Excluding the tax equivalent adjustments for tax-exempt securities and tax-exempt loans and leases, the efficiency ratio would be 62.3% in 2009 and 63.0% in 2008.
22
Noncontrolling Interest
Noncontrolling interest expense represents the portion of net income in consolidated majority-owned subsidiaries that is attributable to the minority owners of a subsidiary. The Company had noncontrolling interest expense of $131,000 in 2009, down from $297,000 in the prior year. The noncontrolling interests are mainly in three real estate investment trusts, which are substantially owned by the Company’s banking subsidiaries. In 2008, the Company acquired noncumulative redeemable preferred stock of $4.5 million in connection with the acquisition of Sleepy Hollow. This preferred stock was accounted for as a noncontrolling interest on the consolidated financial statements. On October 15, 2008, the Company redeemed all noncumulative redeemable preferred stock acquired in the acquisition of Sleepy Hollow.
Income Tax Expense
The provision for income taxes provides for Federal and New York State income taxes. The 2009 provision was $15.4 million, compared to $13.8 million in 2008. The effective tax rate for the Company was 32.6% in 2009 compared to 31.6% in 2008. The increase in the effective rate in 2009 compared to 2008 was primarily the result of a lower proportion of tax advantaged income as a percentage of total pre-tax income.
RESULTS OF OPERATIONS
(Comparison of December 31, 2008 and 2007 results)
General
The Company reported diluted earnings per share of $2.78 in 2008, an increase of 13.5% over diluted earnings per share of $2.45 in 2007. Net income for the year ended December 31, 2008, was $29.8 million, up 13.1% compared to $26.4 million in 2007. Improvement in 2008 results over prior year was largely due to improved net interest margin and growth in earning assets. Both 2008 and 2007 net income included certain nonrecurring items. Net income for 2008 included after-tax income of $983,000 ($1.6 million pre-tax) related to the Visa IPO. This item added $0.09 to 2008 diluted earnings per share. Net income for 2007 included an after-tax charge of $517,000 for the Company’s estimated contingent obligation related to VISA USA litigation indemnification and an after-tax charge of $712,000 for reorganization and associated consulting charges related to certain profit improvement initiatives. These two items reduced diluted earnings per share by $0.11 in 2007.
Return on average shareholder’s equity was 14.15% in 2008, compared to 13.88% in 2007, while return on average assets was 1.13% in 2008, compared to 1.16% in 2007.
Total revenues, consisting of net interest income and noninterest income, were $136.4 million in 2008, up $18.3 million or 15.5% over 2007. Revenues in 2008 included $1.6 million of income related to the Visa IPO. Total revenues in 2008 benefited from solid growth in net interest income, resulting from lower funding costs and growth in average earning assets. Market interest rates were significantly lower in 2008 than in 2007, affecting both asset yields and funding costs. However, deposit pricing strategies resulted in funding costs decreasing at a faster rate than asset yields. The downward trend in the equities market and overall economy in 2008 had an adverse affect on fee-based businesses, including investment services income. Noninterest income in 2008 benefited from the successful implementation of certain profit improvement initiatives (implemented in 2007), the $1.6 million pre-tax gain related to the Visa IPO, the acquisitions of Sleepy Hollow and a small insurance agency, and gains on sales of available-for-sale securities.
Total assets were up 21.5% to $2.9 billion at December 31, 2008. Asset growth over the previous twelve months included a $377.4 million increase in total loans and leases and a $107.9 million increase in the securities portfolio. The acquisition of Sleepy Hollow, with $269.2 million in total assets at the time of acquisition on May 9, 2008, contributed to the asset growth. Nonperforming assets increased to 0.56% of total assets, up from 0.40% at year-end 2007, driven in part by weak economic conditions.
Segment Reporting
The Banking segment reported net income of $26.0 million in 2008, up $4.4 million or 20.6% from net income of $21.5 million in 2007, driven by strong growth in net interest income. Both 2008 and 2007 had nonrecurring items, which affect the year-over-year comparison of net income. Net income in 2008 included after-tax income of $983,000 related to the Visa IPO. Net income in 2007 included an after-tax charge of $712,000 ($1.2 million pre-tax) in reorganization and associated consulting charges related to certain profit improvement initiatives and an after-tax charge of $517,000 ($862,000 pre-tax) related to certain contingent liabilities associated with the Company’s membership in Visa USA. Net interest income in 2008 was $90.2 million, up $16.4 million or 22.3% over 2007, driven by lower funding costs and growth in average earning assets.
The provision for loan and lease losses in 2008 was $5.4 million, compared to $1.5 million in 2007. The increase reflects growth in total loans and leases, an increase in net charge-offs and nonperforming loans, and the impacts of a slowing economy.
Noninterest income of $20.9 million in 2008 was up 9.2% over 2007, mainly a result of the $1.6 million of proceeds from the Visa IPO. Service charges on deposit accounts totaled $10.2 million, a decrease of 2.0% from 2007.
23
Noninterest expenses totaled $67.7 million in 2008, an increase of $7.3 million or 12.1% over the same period in 2007. The increase over prior year is mainly in salaries and benefit expenses and occupancy expenses, both of which were directly impacted by the Sleepy Hollow acquisition with the addition of five staffed branches.
The Financial Services segment had net income of $3.9 million in 2008, a decrease of $977,000 or 20.2% from net income of $4.8 million in 2007. Noninterest income was $25.8 million in 2008, an increase of $365,000 or 1.4% over the same period in 2007. The downward trend in the equities market and overall economy in 2008 had an adverse affect on fee-based businesses, including investment services income. Noninterest expenses of $20.0 million in 2008 were up $1.8 million or 10.1% over the same period prior year. The increase was mainly in salaries and benefits, reflecting annual merit increases, stock-based and other incentive compensation accruals, and other operating expenses.
Net Interest Income
Table 1 – Average Statements of Condition and Net Interest Analysis shows average interest-earning assets and interest-bearing liabilities, and the corresponding yield or cost associated with each. Taxable-equivalent net interest income for 2008 was $93.2 million, an increase of $16.7 million, or 21.9%, compared to the same period in 2007. The favorable year-over-year comparison primarily resulted from an increase in the average volume of interest-earning assets, and an increase in net interest margin compared to the same period in the prior year. For 2008, average earning assets were up $336.9 million or 16.0%, over the same period in 2007. Contributing to the growth was the acquisition of Sleepy Hollow in May 2008. The taxable-equivalent net interest margin for 2008 of 3.81% was up from 3.63% in 2007. The net interest margin benefited from the decrease in short-term market interest rates during the latter part of 2007 and throughout 2008. The lower short-term market rates led to a 53 basis point decrease in the yield on average earning assets to 5.88% for 2008 compared to 6.41% for 2007; however, the decrease in yield on average earning assets was more than offset by lower funding costs. The average cost of interest-bearing liabilities for 2008 was down 91 basis points to 2.55%, compared to 3.46% for 2007.
Taxable-equivalent interest income was up 6.4% in 2008 over 2007. The growth in taxable-equivalent interest income was primarily a result of higher average loan and investment balances as average yields were lower year-over-year. Average loan balances were up $250.3 million or 18.4% in 2008 over 2007, while the average yield on loans decreased 77 basis points to 6.39%. Loan growth in 2008 included a $110.6 million increase in average commercial real estate loans, $84.5 million increase in average residential real estate loans and a $47.2 million increase in average commercial loans. The decrease in yields on average loans in 2008 compared to 2007 is mainly a result of the prime interest rate reduction of 400 basis points in 2008. Average securities balances were up $74.1 million in 2008 over 2007, while average yields were down 6 basis points.
Interest expense for 2008 was down 13.7% compared to 2007, reflecting lower average rates paid on deposits and borrowings, partially offset by growth in average balances. The average rate paid on interest bearing deposits during 2008 of 2.18% was 110 basis points lower than the average rate paid in 2007. The decrease in the average cost of interest bearing deposits reflects a decrease in the interest rates offered on deposit products due to decreases in average market rates combined with an increase in the relative proportion of lower cost savings and money market deposits. Average interest-bearing deposit balances increased by $194.8 million or 14.1% in 2008 compared to 2007. The majority of the increase was in average interest checking, savings and money market deposit balances, which were up 25.3% to $906.4 million. Average time deposits of $100,000 or more balances were down 7.2% to $282.5 million. Average noninterest bearing deposit balances of $407.3 million were up 14.3% in 2008 over the same period in 2007. Contributing to the growth in average deposit balances was the acquisition of Sleepy Hollow in May 2008. Average other borrowings were up $91.3 million or 90.6% over prior year, while the average cost was down 48 basis points.
Changes in net interest income occur from a combination of changes in the volume of interest-earning assets and interest-bearing liabilities, and in the rate of interest earned or paid on them. Table 2 –Analysis of Changes in Net Interest Income illustrates changes in interest income and interest expense attributable to changes in volume (change in average balance multiplied by prior year rate), changes in rate (change in rate multiplied by prior year volume), and the net change in net interest income. The net change attributable to the combined impact of volume and rate has been allocated to each in proportion to the absolute dollar amounts of the change. The $16.7 million increase in taxable-equivalent net interest income from 2007 to 2008 resulted from an $8.7 million increase in interest income and an $8.0 million decrease in interest expense. An increased volume of interest earning assets, in excess of interest bearing liabilities contributed to a net $12.9 million increase in taxable-equivalent net interest income between 2007 and 2008, while changes in interest rates increased taxable-equivalent net interest income by $3.8 million, resulting in the net increase of $16.7 million from 2007.
Provision for Loan and Lease Losses
The provision for loan and lease losses was $5.4 million in 2008, compared to $1.5 million in 2007. The increase in 2008 over prior year was due to increases in nonperforming loans and leases and net charge-offs, as well as concerns over deteriorating economic conditions and uncertain real estate markets. Nonperforming loans and leases were $16.0 million or 0.88% of total loans and leases at December 31, 2008, compared with $9.3 million or 0.65% of total loans and leases at December 31, 2007. Net charge-offs of $2.8 million in 2008 represented 0.18% of average loans and leases during the period, compared to net charge-offs of $1.3 million in 2007, representing 0.09% of average loans and leases.
24
Noninterest Income
Noninterest income accounted for 33.7% of total revenues in 2008, and 37.3% in 2007. The decrease in noninterest income as a percentage of revenues in 2008 compared to 2007 was due to the $16.4 million or 22.1% growth in net interest income outpacing the $2.0 million or 4.5% growth in noninterest income.
Investment services income was $14.2 million in 2008, a decrease of 1.8% from $14.4 million in 2007. With fees largely based on the market value and the mix of assets managed, the general direction of the stock market can have a considerable impact on fee income. Equities markets were down significantly in 2008 compared to 2007, which contributed to the decrease in the market value of assets managed by, or in custody of Tompkins. The market value of assets managed by, or in custody of, Tompkins was $2.2 billion at December 31, 2008, down 7.9% from $2.3 billion at December 31, 2007. These figures include $541.1 million and $484.5 million, respectively, of Company-owned securities where TIS is custodian. The Company was successful with business development initiatives and customer retention despite the challenging equities markets in 2008 and the recent turmoil in the financial markets.
Insurance commissions and fees were $11.6 million in 2008, an increase of $561,000 or 5.1% over 2007. The increase in insurance commissions and fees was mainly in health and benefit related insurance products. This product line was started late in the fourth quarter of 2007. Revenues for personal and commercial lines were slightly ahead of prior year. Commissions and fees in 2008 also benefited from the acquisition of a firm that specializes in insurance solutions for investment professionals during 2008.
Service charges on deposit accounts were $10.2 million in 2008, down 2.0% compared to $10.4 million in 2007. The largest component of this category is overdraft fees, which is largely driven by customer activity. Customer activity has been changing over the past several years, with electronic transactions such as debit cards and Internet banking reducing the volume of checks. The Company reviewed and revised the way that it processes these transactions during the second quarter of 2007 to process electronic transactions substantially the same as paper transactions, which had a favorable impact on overdraft income in 2007.
Card services income of $3.3 million in 2008 was down $115,000 or 3.3% from 2007. The primary components of card services income are fees related to debit card transactions and ATM transactions. ATM fee income increased by 17.0% compared to 2007, mainly due to higher volume and increased foreign transaction fees. Debit card income for 2008 was down compared to 2007. The Company introduced a new rewards program in the second quarter of 2008, and the Company’s liability under the new rewards program has offset debit card income.
Net mark-to-market losses on securities and borrowings held at fair value totaled $1.2 million in 2008 compared to net mark-to-market losses of $736,000 in 2007. Mark-to-market losses or gains relate to the change in the fair value of securities and borrowings where the Company has elected the fair value option.
The $1.6 million gain on Visa stock redemption relates to the proceeds received from the Company’s allocation of the Visa, Inc. initial public offering (the “Visa IPO”), and consists of a $1.2 million gain on the partial redemption of Visa stock and a $0.4 million partial reversal of a fourth quarter 2007 accrual for indemnification charges. Visa withheld a portion of the shares allocated to its member banks to create an escrow account to cover the costs and liabilities associated with certain litigation for which its member banks are obligated to indemnify Visa. Visa’s funding of this escrow account allowed member banks to reverse litigation related accruals made in the fourth quarter of 2007, up to each bank’s proportionate membership interest in the $3.0 billion used to fund the escrow account.
Other income increased by $738,000 or 14.6% in 2008 over 2007. The primary components of other income are other service charges, increases in cash surrender value of life insurance, gains on sales of residential mortgage loans and income from miscellaneous equity investments, including the Company’s investment in a SBIC. The majority of the increase over prior year was due to higher income on the Company’s COLI investment and SBIC investment.
2008 noninterest income includes $1.4 million of net increases in cash surrender value of corporate owned life insurance (COLI), which is up $326,000 or 29.1% compared with 2007. The Company’s average investment in COLI was $32.8 million during 2008, compared to $26.5 million during 2007. The Company purchased $3.0 million of additional insurance in the fourth quarter of 2007 and acquired $3.5 million in the acquisition of Sleepy Hollow. Although income associated with the insurance policies is not included in interest income, the COLI produced an annualized tax-equivalent return of 7.35% for 2008, compared to 7.06% for 2007.
For 2008, the Company recognized income of $546,000 related to its SBIC investment, compared with income of $331,000 in 2007.
Net gains on sales of available-for-sale securities of $477,000 in 2008 reflect sales of available-for-sale securities, for which prices were favorably impacted by the Federal Reserve actions to reduce interest rates in 2008. The net gains on sales of available-for-sale securities of $384,000 in 2007 were primarily on the sale of the Company’s Mastercard stock that it received as a member bank at the time of Mastercard’s initial public offering.
25
Noninterest Expense
Noninterest expenses for 2008 were $87.1 million, an increase of 11.5% over noninterest expenses of $78.1 million for 2007. The increase in 2008 over 2007 was primarily in compensation and benefits related expenses, and regulatory agency expense. The acquisition of Sleepy Hollow impacted several noninterest expense categories discussed below.
Personnel-related expense increased by $5.2 million or 11.6% in 2008 over 2007. The acquisition of Sleepy Hollow included the addition of six banking offices, including one limited service office, and 30 full time equivalent employees (FTEs). Year-to-date December 31, 2008 average FTEs of 686 were up from 662 at December 31, 2007. Salaries and wages associated with the increased number of average FTEs, annual salary adjustments and higher incentive compensation accruals, recognizing the Company’s improved performance, contributed to the increase over 2007. Personnel-related expense for 2007 included pre-tax severance charges of $740,000 related to reorganization and profit improvement initiatives implemented in 2007.
Expenses related to bank premises and furniture and fixtures increased by $1.1 million or 11.3% for the twelve months ended December 31, 2008 over the same period in 2007. Additions to the Company’s branch network, as well as higher real estate taxes and utility costs contributed to the increased expenses for premises and furniture and fixtures year-over-year. The acquisition of Sleepy Hollow in May of 2008 added six banking offices to the Company’s branch network.
FDIC insurance expense was up $727,000 or 352.9% in 2008 when compared to 2007. The increase was partially due to higher insurance premiums in 2008. In addition, 2008 expenses benefitted from the use of one-time FDIC assessment credits. These credits reduced 2008 expense by $370,000.
Other operating expenses increased by $1.7 million or 7.5% in 2008 when compared to 2007. The primary components of other operating expense are marketing expense, professional fees, software licensing and maintenance, cardholder expense and other.
Marketing expenses of $3.6 million in 2008 were up 18.9% over 2007. The primary reason for the period over period increase was the expenses for ad campaigns and mailings related to the addition of six new branches in the acquisition of Sleepy Hollow.
Software license and maintenance fee expense increased by $432,000 or 20.9% in 2008 over 2007. The increase in 2008 was mainly due to increased licensing fees related to the core operating system and the implementation of new software applications, including software to increase efficiencies in loan underwriting.
Professional fees for 2008 were down by $247,000 or 7.6% compared to 2007. Professional fees in 2007 included consulting fees of $827,000, related to the implementation of certain profit improvement initiatives in 2007.
Cardholder expenses were up $251,000 or 25.8% for 2008 over 2007, mainly due to the conversion of a new debit and ATM operating system. The new system was implemented in April 2008. In addition, transaction volume was up over prior year.
Also contributing to the increase in other operating expenses were the following: fair value adjustments related to nonmarketable equity investments (up $545,000), merger related expenses (up $274,000), printing and supplies (up $237,000); and telephone (up $129,000).
The Company’s efficiency ratio, defined as operating expense excluding amortization of intangible assets, divided by tax-equivalent net interest income plus noninterest income before securities gains and losses (increase in the cash surrender value of COLI is shown on a tax equivalent basis), improved to 61.7% in 2008, compared to 64.1% in 2007. Tax equivalency was based upon a 40% tax rate. Excluding the tax equivalent adjustments for tax-exempt securities and tax-exempt loans and leases, the efficiency ratio would be 63.0% in 2008 and 65.4% in 2007.
Noncontrolling Interest
Noncontrolling interest expense represents the portion of net income in consolidated majority-owned subsidiaries that is attributable to the minority owners of a subsidiary. The Company had noncontrolling interest expense of $297,000 in 2008, up $166,000 compared to prior year. The noncontrolling interests are mainly in three real estate investment trusts, which are substantially owned by the Company’s banking subsidiaries. In addition, the Company acquired noncumulative redeemable preferred stock of $4.5 million in connection with the acquisition of Sleepy Hollow. This preferred stock was accounted for as a noncontrolling interest on the consolidated financial statements. On October 15, 2008, the Company redeemed this preferred stock.
Income Tax Expense
The provision for income taxes provides for Federal and New York State income taxes. The 2008 provision was $13.8 million, compared to $12.0 million in 2007. The effective tax rate for the Company was 31.6% in 2008 compared to 31.3% in 2007.
26
FINANCIAL CONDITION
Total assets grew by $285.5 million or 10.0% to $3.2 billion at December 31, 2009, compared to $2.9 billion at December 31, 2008. Table 3-Balance Sheet Comparisons below provides a comparison of average and year-end balances of selected balance sheet categories over the past three years, and the change in those balances between 2008 and 2009. Management has focused on growing average earning assets to increase net interest income and offset the negative impact of declining yields on interest-earning assets. Earning asset growth over year-end 2008 included a $97.3 million increase in the total loans and leases, and a $171.5 million increase in securities.
Loans and leases totaled $1.9 billion or 60.7% of total assets at December 31, 2009, compared to $1.8 billion or 63.4% of total assets at December 31, 2008. The 5.4% growth in total loans and leases from year-end 2008 was primarily in commercial and commercial real estate loans. The residential real estate portfolio was in line with year-end 2008, as the Company decided to sell certain loans in the secondary market to FHLMC. A more detailed discussion of the loan portfolio is provided below in this section under the caption “Loans and Leases”.
Nonperforming loans (loans on nonaccrual, loans past due 90 days or more and still accruing interest, and loans restructured in a troubled debt restructuring) were $34.9 million at December 31, 2009, up from $16.0 million at December 31, 2008. Nonperforming loans represented 1.82% of total loans at December 31, 2009, compared to 0.88% of total loans at December 31, 2008. For 2009, net charge-offs were $3.6 million, up from $2.8 million in the same period of 2008. A more detailed discussion of nonperforming loans and other asset quality measures is provided below in this section under the caption “Allowance for Loan and Lease Losses”.
Over the past year, there has been significant attention to subprime consumer real estate lending in the media. The Company has not engaged in the origination or purchase of subprime loans as a line of business. As a result, losses in the Company’s residential portfolio have been relatively low, totaling $511,000 for the twelve months ended December 31, 2009, and $585,000 for the same period in 2008.
As of December 31, 2009, total securities were $1.0 billion or 31.9% of total assets, compared to $833.8 million or 29.1% of total assets at year-end 2008. The securities portfolio is comprised primarily of mortgage-backed securities, obligations of U.S. Government sponsored entities, and obligations of states and political subdivisions. The Company has no investments in preferred stock of U.S. Government sponsored entities and no investments in pools of Trust Preferred securities. A more detailed discussion of the securities portfolio is provided below in this section under the caption “Securities”.
Total deposits were $2.4 billion at December 31, 2009, up $305.9 million or 14.3% over December 31, 2008. The growth in total deposits from December 31, 2008 was mainly in money market and savings balances, which were up $189.5 million or 20.7%. Noninterest bearing deposit balances were up $11.1 million or 2.5%. Time deposit balances were up $91.6 million or 13.0%. Other funding sources include Federal funds purchased, securities sold under agreements to repurchase, other borrowings, and trust preferred debentures. These funding sources totaled $426.8 million at December 31, 2009, down $48.2 million or 10.1% from $475.0 million at December 31, 2008. Included in this total are certain borrowings that the Company elected to account for at fair value. As of December 31, 2009, the Company had $15.0 million of borrowings with the FHLB accounted for at fair value, with an aggregate fair value of $16.8 million. During 2009, the Company issued $20.5 million aggregate liquidation amount of 7.0% cumulative trust preferred securities through a newly-formed subsidiary, Tompkins Capital Trust I, a wholly-owned Delaware statutory trust. A more detailed discussion of deposits and borrowings is provided below in this section under the caption “Deposits and Other Liabilities”. In addition, refer to “Note 10 Securities Sold Under Agreements to Repurchase and Federal Funds Purchased”, “Note 11 Other Borrowings”, and “Note 12 Trust Preferred Debentures” in Notes to Consolidated Financial Statements in Part II, Item 7. of this Report for further details on these funding sources.
27
Table 3 - Balance Sheet Comparisons
|
|
|
|
|
|
|
|
|
|
|
|
|
|
|
|
|
|
|
AVERAGE BALANCE SHEET |
|
As of December 31, |
|
|
|
|
|
|
|
|||||||
|
|
|
|
|
|
|
|
|
|
|
|
Change (2008 to 2009) |
|
||||
|
(in thousands) |
|
2009 |
|
2008 |
|
2007 |
|
Amount |
|
Percentage |
|
|||||
|
Total assets |
|
$ |
3,009,007 |
|
$ |
2,633,020 |
|
$ |
2,266,224 |
|
|
375,987 |
|
|
14.28 |
% |
|
Earning assets * |
|
|
2,801,884 |
|
|
2,442,503 |
|
|
2,105,581 |
|
|
359,381 |
|
|
14.71 |
% |
|
Total loans and leases, less unearned income and net deferred costs and fees |
|
|
1,850,453 |
|
|
1,612,716 |
|
|
1,362,417 |
|
|
237,737 |
|
|
14.74 |
% |
|
Securities * |
|
|
888,468 |
|
|
790,736 |
|
|
716,624 |
|
|
97,732 |
|
|
12.36 |
% |
|
Core deposits ** |
|
|
1,674,159 |
|
|
1,516,226 |
|
|
1,318,859 |
|
|
157,933 |
|
|
10.42 |
% |
|
Time deposits of $100,000 and more |
|
|
303,761 |
|
|
282,547 |
|
|
304,614 |
|
|
21,214 |
|
|
7.51 |
% |
|
Federal funds purchased and securities sold under agreements to repurchase |
|
|
190,975 |
|
|
203,385 |
|
|
199,126 |
|
|
(12,410 |
) |
|
(6.10 |
%) |
|
Other borrowings |
|
|
204,467 |
|
|
192,144 |
|
|
100,824 |
|
|
12,323 |
|
|
6.41 |
% |
|
Shareholders’ equity |
|
|
233,009 |
|
|
210,785 |
|
|
189,962 |
|
|
22,224 |
|
|
10.54 |
% |
|
|
|
|
|
|
|
|
|
|
|
|
|
|
|
|
|
|
|
ENDING BALANCE SHEET |
|
As of December 31, |
|
Change (2008 to 2009) |
|
|||||||||||
|
(in thousands) |
|
2009 |
|
2008 |
|
2007 |
|
Amount |
|
Percentage |
|
|||||
|
Total assets |
|
$ |
3,153,260 |
|
$ |
2,867,722 |
|
$ |
2,359,459 |
|
|
285,538 |
|
|
9.96 |
% |
|
Earning assets * |
|
|
2,922,138 |
|
|
2,664,650 |
|
|
2,189,920 |
|
|
257,488 |
|
|
9.66 |
% |
|
Total loans and leases, less unearned income and net deferred costs and fees |
|
|
1,914,818 |
|
|
1,817,531 |
|
|
1,440,122 |
|
|
97,288 |
|
|
5.35 |
% |
|
Securities * |
|
|
985,503 |
|
|
820,030 |
|
|
728,206 |
|
|
165,473 |
|
|
20.18 |
% |
|
Core deposits ** |
|
|
1,725,315 |
|
|
1,631,354 |
|
|
1,351,412 |
|
|
93,961 |
|
|
5.76 |
% |
|
Time deposits of $100,000 and more |
|
|
327,890 |
|
|
277,847 |
|
|
245,375 |
|
|
50,043 |
|
|
18.01 |
% |
|
Federal funds purchased and securities sold under agreements to repurchase |
|
|
192,784 |
|
|
196,304 |
|
|
195,447 |
|
|
(3,520 |
) |
|
(1.79 |
%) |
|
Other borrowings |
|
|
208,965 |
|
|
274,791 |
|
|
210,862 |
|
|
(65,826 |
) |
|
(23.95 |
%) |
|
Shareholders’ equity |
|
|
245,008 |
|
|
219,361 |
|
|
198,647 |
|
|
25,647 |
|
|
11.69 |
% |
* Balances of available-for-sale securities are shown at amortized cost.
** Core deposits equal total deposits less time deposits of $100,000 and more, brokered deposits, and municipal money market deposits.
Shareholders’ Equity
The Consolidated Statements of Changes in Shareholders’ Equity included in the Consolidated Financial Statements of the Company contained in Part II, Item 8. of this Report, detail the changes in equity capital, including payments to shareholders in the form of cash and stock dividends. The Company continued its long history of increasing cash dividends with a per share increase of 3.3% in 2009, which follows an increase of 6.2% in 2008. Dividends per share amounted to $1.24 in 2009, compared to $1.20 in 2008, and $1.13 in 2007. Dividends per share were retroactively adjusted to reflect a 10% stock dividend paid February 15, 2010. Cash dividends paid represented 41.5%, 42.7%, and 45.6% of after-tax net income in each of 2009, 2008, and 2007, respectively.
Total shareholders’ equity was up $25.6 million or 11.7% to $245.0 million at December 31, 2009, from $219.4 million at December 31, 2008. The increase was mainly in retained earnings, which increased by $18.6 million to $92.4 million, reflecting net income of $31.8 million less dividend of $13.2 million. Additional paid-in capital increased by $2.7 million, from $152.8 million at December 31, 2008, to $155.6 million at December 31, 2009. The $2.7 million included the following: $952,000 of proceeds from stock option exercises and the related tax benefits of $163,000; $938,000 related to stock-based compensation; $629,000 related to shares issued for dividend reinvestment plans; and $243,000 related to shares issued for director deferred compensation plan. In the fourth quarter of 2009, the Company began to issue shares of the Company’s common stock for its dividend reinvestment plan. Previously, the shares were purchased in the open market by the plan. The Company repurchased 5,000 shares of its common stock for $177,000 during the twelve month period ended December 31, 2009.
Accumulated other comprehensive loss decreased by $4.5 million, from a net unrealized loss of $7.6 million at December 31, 2008, to a net unrealized loss of $3.1 million at December 31, 2009. The change resulted from a $3.6 million increase in unrealized gains on available-for-sale securities due to lower market rates, and an $875,000 positive adjustment related to postretirement benefit plans. Under regulatory requirements, amounts reported as accumulated other comprehensive income/loss related to net unrealized gain or loss on available-for-sale securities and the funded status of the Company’s defined benefit post-retirement benefit plans do not increase or reduce regulatory capital and are not included in the calculation of risk-based capital and leverage ratios.
28
Total shareholders’ equity was up $20.7 million or 10.4% to $219.4 million at December 31, 2008, from $198.6 million at December 31, 2007. Additional paid-in capital increased by $5.1 million, from $147.7 million at December 31, 2007, to $152.8 million at December 31, 2008, reflecting the effects of the exercise of stock options and stock-based compensation expense. The Company repurchased 1,500 shares of its common stock for $58,000 during the twelve month period ended December 31, 2008. Retained earnings increased $16.5 million from $57.3 million at December 31, 2007, to $73.8 million at December 31, 2008, reflecting net income of $29.8 million less dividends paid of $12.7 million and a cumulative-effect adjustment of $582,000 related to the adoption new authoritative accounting guidance under ASC Topic 715, Compensation-Retirement Benefits. Accumulated other comprehensive loss increased by $702,000 from a net unrealized loss of $6.9 million at December 31, 2007, to a net unrealized loss of $7.6 million at December 31, 2008, reflecting an increase in unrealized gains on available-for-sale securities due to lower market rates, offset by amounts recognized in other comprehensive income related to postretirement benefit plans.
On July 22, 2008, the Company’s Board of Directors approved a stock repurchase plan (the “2008 Plan”). The 2008 Plan authorizes the repurchase of up to 150,000 shares of the Company’s outstanding common stock over a two-year period. The Company repurchased 5,000 shares of common stock at an average price of $35.51 under the 2008 Plan during the first quarter of 2009; no shares were repurchased during the remainder of 2009. Since inception of the 2008 Plan, the Company has repurchased 6,500 shares at an average price of $36.21.
During 2009, the Company issued $20.5 million aggregate liquidation amount of 7.0% cumulative trust preferred securities through a newly-formed subsidiary, Tompkins Capital Trust I, a wholly-owned Delaware statutory trust (“Tompkins Capital Trust I”). The Trust Preferred Securities were offered and sold in reliance upon the exemption from registration provided by Rule 506 of Regulation D of the Securities Act of 1933, as amended (the “Securities Act”). The proceeds from the issuance of the Trust Preferred Securities, together with the Company’s capital contribution of $636,000 to the trust, were used to acquire the Company’s Subordinated Debentures that are due concurrently with the Trust Preferred Securities. The net proceeds of the offering are being used to support business growth and for general corporate purposes.
The Trust Preferred Securities have a 30 year maturity, and carry a fixed rate of interest of 7.0%. The Trust Preferred Securities have a liquidation amount of $1,000 per security. The Company has retained the right to redeem the Trust Preferred Securities at par (plus accrued but unpaid interest) at a date which is no earlier than 5 years from the date of issuance. Commencing in 2019, and during specified annual windows thereafter, holders may convert the Trust Preferred Securities into shares of the Company’s common stock at a conversion price equal to the greater of (i) $41.35, or (ii) the average closing price of Tompkins Financial Corporation’s common stock during the first three months of the year in which the conversion will be completed.
The Company has guaranteed the distributions with respect to, and amounts payable upon liquidation or redemption of, the Trust Preferred Securities on a subordinated basis as and to the extent set forth in the Preferred Securities Guarantee Agreement entered into on April 10, 2009, between the Company and Wilmington Trust Company, as Preferred Guarantee Trustee.
In accordance with the applicable accounting standards related to variable interest entities, the accounts of Tompkins Capital Trust I will not be included in the Company’s consolidated financial statements. However, $20.5 million in Tompkins’ Subordinated Debentures issued to Tompkins Capital Trust I will be included in the Tier 1 capital of the Company for regulatory capital purposes pursuant to regulatory guidelines.
The Company and its subsidiary banks are subject to quantitative capital measures established by regulation to ensure capital adequacy. Consistent with the objective of operating a sound financial organization, the Company and its subsidiary banks maintain capital ratios well above regulatory minimums, as detailed in “Note 20 Regulations and Supervision” in Notes to Consolidated Financial Statements in Part II, Item 7. of this Report on Form 10-K.
Securities
The Company’s securities portfolio (excluding fair value adjustments on available-for-sale securities) at December 31, 2009, was $985.5 million, reflecting an increase of 20.2% from $820.0 million at December 31, 2008. “Note 3 Securities” in Notes to Consolidated Financial Statements in Part II, Item 7. of this Report, details the types of securities held, the carrying and fair values, and the contractual maturities as of December 31, 2009 and 2008.
29
The following tables summarize available-for-sale and held-to-maturity securities held by the Company at year end.
|
|
|
|
|
|
|
|
|
|
|
|
|
|
|
|
|
|
|
|
|
|
Available-for-Sale Securities |
|
2009 |
|
2008 |
|
2007 |
|
||||||||||||
|
(in thousands) |
|
Amortized |
|
Fair |
|
Amortized |
|
Fair |
|
Amortized |
|
Fair |
|
||||||
|
U.S. Treasury securities |
|
$ |
1,991 |
|
$ |
2,079 |
|
$ |
3,102 |
|
$ |
3,263 |
|
$ |
0 |
|
$ |
0 |
|
|
Obligations of U.S. Government sponsored entities |
|
|
377,920 |
|
|
379,015 |
|
|
191,435 |
|
|
196,262 |
|
|
180,765 |
|
|
181,622 |
|
|
Obligations of U.S. states and political subdivisions |
|
|
61,176 |
|
|
63,695 |
|
|
63,158 |
|
|
63,554 |
|
|
51,852 |
|
|
52,292 |
|
|
Mortgage-backed securities – residential |
|
|
461,677 |
|
|
477,681 |
|
|
465,612 |
|
|
473,971 |
|
|
381,290 |
|
|
382,225 |
|
|
U.S. Corporate debt securities |
|
|
5,032 |
|
|
5,136 |
|
|
2,500 |
|
|
2,500 |
|
|
2,500 |
|
|
2,500 |
|
|
Total debt securities |
|
|
907,796 |
|
|
927,606 |
|
|
725,807 |
|
|
739,550 |
|
|
616,407 |
|
|
618,639 |
|
|
Equity securities |
|
|
1,164 |
|
|
1,164 |
|
|
1,669 |
|
|
1,669 |
|
|
2,071 |
|
|
2,071 |
|
|
Total available-for-sale securities |
|
$ |
908,960 |
|
$ |
928,770 |
|
$ |
727,476 |
|
$ |
741,219 |
|
$ |
618,478 |
|
$ |
620,710 |
|
Equity securities also include miscellaneous investments carried at fair value, which approximates cost.
Substantially all of the above mortgage-backed securities are residential direct pass through securities or collateralized mortgage obligations issued or backed by Federal sponsored enterprises. Available-for-sale mortgage-backed securities also include non-agency issue mortgage-backed securities, which totaled $12.7 million (amortized cost) at December 31, 2009, $17.3 million (amortized cost) at December 31, 2008, and $10.4 million (amortized cost) at December 31, 2007. During the third quarter of 2009, the Company determined that three non-agency issue mortgage-backed securities were other-than-temporarily impaired based on our analysis of these three securities. As a result, the Company recorded other-than-temporary impairment charges of $2.0 million in the third quarter of 2009 on these investments. The $2.0 million represented the amount by which the cost exceeded the estimated fair value of these securities. The credit loss component of $146,000 was recorded as net other-than-temporary impairment losses in the accompanying consolidated statements of income, while the remaining non-credit portion of the impairment loss was recognized in other comprehensive income (loss) in the accompanying consolidated statements of condition and changes in shareholders’ equity. The Company reviewed these securities in the fourth quarter of 2009 and determined that no additional other-than-temporary charges were necessary. As of December 31, 2009, the amount by which the cost of these securities exceeded fair was $1.8 million. A continuation or worsening of current economic conditions may result in additional other-than-temporary impairment losses related to these investments.
|
|
|
|
|
|
|
|
|
|
|
|
|
|
|
|
|
|
|
|
|
|
Held-to-Maturity Securities |
|
2009 |
|
2008 |
|
2007 |
|
||||||||||||
|
(in thousands) |
|
Amortized |
|
Fair |
|
Amortized |
|
Fair |
|
Amortized |
|
Fair |
|
||||||
|
Obligations of U.S. states and political subdivisions |
|
$ |
44,825 |
|
$ |
46,340 |
|
$ |
54,453 |
|
$ |
55,064 |
|
$ |
49,593 |
|
$ |
50,297 |
|
|
Total held-to-maturity securities |
|
$ |
44,825 |
|
$ |
46,340 |
|
$ |
54,453 |
|
$ |
55,064 |
|
$ |
49,593 |
|
$ |
50,297 |
|
30
The following table summarizes held-for-trading securities held by the Company at year end.
|
|
|
|
|
|
|
|
|
|
|
|
|
Held-for-Trading Securities |
|
2009 |
|
2008 |
|
2007 |
|
|||
|
(in thousands) |
|
Fair |
|
Fair |
|
Fair |
|
|||
|
Obligations of U.S. Government sponsored entities |
|
$ |
17,986 |
|
$ |
18,370 |
|
$ |
37,110 |
|
|
Mortgage-backed securities – residential |
|
|
13,732 |
|
$ |
19,731 |
|
|
23,025 |
|
|
Total held-for-trading securities |
|
$ |
31,718 |
|
$ |
38,101 |
|
$ |
60,135 |
|
In the first quarter of 2007, the Company elected to apply the fair value option for certain securities within its available-for-sale portfolio with an aggregate cost basis of $65.9 million and an aggregate book value of $63.4 million as of the January 1, 2007 date of adoption. Included in the $65.9 million were $40.6 million of obligations of U.S. Government sponsored entities (total portfolio of $217.5 million) and $25.3 million of mortgage-backed securities (total portfolio of $349.8 million). The Company selected these securities based upon yield and average remaining life. The securities selected had yields of less than 4.0% and average lives greater than 1.5 years. As a result of the election to early adopt, the cumulative unrealized loss related to these available-for-sale securities of $2.5 million was recorded directly in the Company’s financial statements as a cumulative-effect adjustment, net of tax, to retained earnings.
Tompkins subsequently sold the approximately $62.0 million in securities that were carried in the Company’s trading portfolio and reinvested the proceeds in trading securities that provide for a higher yield and will reflect an improvement in the Company’s liquidity and interest rate risk exposure position. However, while in the aggregate the impacts of the early adoption of the accounting guidelines and related transactions resulted in overall improvement in earnings for accounting purposes, it had no impact on the overall cash proceeds.
As of December 31, 2009, the Company’s trading securities totaled $31.7 million compared to $38.1 million as of December 31, 2008. The decrease in trading securities reflects maturities or calls during 2009. The pre-tax mark-to-market gains on trading securities in 2009 were $204,000, compared to pre-tax net mark-to-market gains of $811,000 in 2008 and $612,000 in 2007.
The Company holds non-marketable Federal Home Loan Bank New York (“FHLBNY”) stock and non-marketable Federal Reserve Bank (“FRB”) stock, both of which are required to be held for regulatory purposes and for borrowing availability. The required investment in FHLB stock is tied to the Company’s borrowing levels with the FHLB. Holdings of FHLBNY stock and FRB stock totaled $18.1 million and $1.9 million at December 31, 2009, respectively, $21.0 million and $1.9 million at December 31, 2008, respectively, and $17.6 million and $729,000 at December 31, 2007, respectively. These securities are carried at par, which is also cost. While some Federal Home Loan Banks have stopped paying dividends and repurchasing stock upon reductions in debt levels, the FHLBNY continues to pay dividends and repurchase its stock. As such, the Company has not recognized any credit loss other-than-temporary impairment on its holdings of FHLBNY stock.
Management’s policy is to purchase investment grade securities that, on average, have relatively short expected durations. This policy helps mitigate interest rate risk and provides sources of liquidity without significant risk to capital. A large percentage of securities are direct obligations of the Federal government and its agencies. The contractual maturity distribution of debt securities and mortgage-backed securities as of December 31, 2009, along with the weighted average yield of each category, is presented in Table 4-Maturity Distribution below. Balances are shown at amortized cost and weighted average yields are calculated on a fully taxable-equivalent basis. Expected maturities will differ from contractual maturities presented in Table 4-Maturity Distribution below, because issuers may have the right to call or prepay obligations with or without penalty and mortgage-backed securities will pay throughout the periods prior to contractual maturity.
31
Table 4 - Maturity Distribution
|
|
|
|
|
|
|
|
|
|
|
|
|
|
|
|
|
|
As of December 31, 2009 |
|
||||||||||
|
|
|
Securities |
|
Securities |
|
||||||||
|
(dollar amounts in thousands) |
|
Amount |
|
Yield (FTE) |
|
Amount |
|
Yield (FTE) |
|
||||
|
|
|
|
|
|
|
|
|
|
|
|
|
|
|
|
U.S. Treasury securities |
|
|
|
|
|
|
|
|
|
|
|
|
|
|
Within 1 year |
|
$ |
0 |
|
|
0.00 |
% |
$ |
0 |
|
|
0.00 |
% |
|
Over 1 to 5 years |
|
|
1,991 |
|
|
2.88 |
% |
|
0 |
|
|
0.00 |
% |
|
Over 5 to 10 years |
|
|
0 |
|
|
0.00 |
% |
|
0 |
|
|
0.00 |
% |
|
Over 10 years |
|
|
0 |
|
|
0.00 |
% |
|
0 |
|
|
0.00 |
% |
|
|
|
$ |
1,991 |
|
|
2.88 |
% |
$ |
0 |
|
|
0.00 |
% |
|
|
|
|
|
|
|
|
|
|
|
|
|
|
|
|
Obligations of U.S. Government sponsored entities |
|
|
|
|
|
|
|
|
|
|
|
|
|
|
Within 1 year |
|
$ |
5,500 |
|
|
3.24 |
% |
$ |
0 |
|
|
0.00 |
% |
|
Over 1 to 5 years |
|
|
94,770 |
|
|
2.67 |
% |
|
0 |
|
|
0.00 |
% |
|
Over 5 to 10 years |
|
|
272,621 |
|
|
3.86 |
% |
|
0 |
|
|
0.00 |
% |
|
Over 10 years |
|
|
5,029 |
|
|
5.10 |
% |
|
0 |
|
|
0.00 |
% |
|
|
|
$ |
377,920 |
|
|
3.57 |
% |
$ |
0 |
|
|
0.00 |
% |
|
|
|
|
|
|
|
|
|
|
|
|
|
|
|
|
Obligations of U.S. state and political subdivisions |
|
|
|
|
|
|
|
|
|
|
|
|
|
|
Within 1 year |
|
$ |
5,584 |
|
|
5.31 |
% |
$ |
17,017 |
|
|
4.56 |
% |
|
Over 1 to 5 years |
|
|
29,200 |
|
|
5.20 |
% |
|
19,200 |
|
|
5.90 |
% |
|
Over 5 to 10 years |
|
|
24,113 |
|
|
5.53 |
% |
|
7,131 |
|
|
6.32 |
% |
|
Over 10 years |
|
|
2,279 |
|
|
6.01 |
% |
|
1,477 |
|
|
7.16 |
% |
|
|
|
$ |
61,176 |
|
|
5.37 |
% |
$ |
44,825 |
|
|
5.50 |
% |
|
|
|
|
|
|
|
|
|
|
|
|
|
|
|
|
Mortgage-backed securities – residential |
|
|
|
|
|
|
|
|
|
|
|
|
|
|
Within 1 year |
|
$ |
0 |
|
|
0.00 |
% |
$ |
0 |
|
|
0.00 |
% |
|
Over 1 to 5 years |
|
|
9,025 |
|
|
4.48 |
% |
|
0 |
|
|
0.00 |
% |
|
Over 5 to 10 years |
|
|
103,065 |
|
|
4.45 |
% |
|
0 |
|
|
0.00 |
% |
|
Over 10 years |
|
|
349,587 |
|
|
4.82 |
% |
|
0 |
|
|
0.00 |
% |
|
|
|
$ |
461,677 |
|
|
4.73 |
% |
$ |
0 |
|
|
0.00 |
% |
|
|
|
|
|
|
|
|
|
|
|
|
|
|
|
|
Other securities |
|
|
|
|
|
|
|
|
|
|
|
|
|
|
Within 1 year |
|
$ |
0 |
|
|
0.00 |
% |
$ |
0 |
|
|
0.00 |
% |
|
Over 1 to 5 years |
|
|
2,532 |
|
|
4.01 |
% |
|
0 |
|
|
0.00 |
% |
|
Over 5 to 10 years |
|
|
0 |
|
|
0.00 |
% |
|
0 |
|
|
0.00 |
% |
|
Over 10 years |
|
|
2,500 |
|
|
3.03 |
% |
|
0 |
|
|
0.00 |
% |
|
Equity securities |
|
|
1,164 |
|
|
1.35 |
% |
|
0 |
|
|
0.00 |
% |
|
|
|
$ |
6,196 |
|
|
3.12 |
% |
$ |
0 |
|
|
0.00 |
% |
|
|
|
|
|
|
|
|
|
|
|
|
|
|
|
|
Total securities |
|
|
|
|
|
|
|
|
|
|
|
|
|
|
Within 1 year |
|
$ |
11,084 |
|
|
4.29 |
% |
$ |
17,017 |
|
|
4.56 |
% |
|
Over 1 to 5 years |
|
|
137,518 |
|
|
3.31 |
% |
|
19,200 |
|
|
5.90 |
% |
|
Over 5 to 10 years |
|
|
399,799 |
|
|
4.11 |
% |
|
7,131 |
|
|
6.32 |
% |
|
Over 10 years |
|
|
359,395 |
|
|
4.82 |
% |
|
1,477 |
|
|
7.16 |
% |
|
Equity securities |
|
|
1,164 |
|
|
1.35 |
% |
|
0 |
|
|
0.00 |
% |
|
|
|
$ |
908,960 |
|
|
4.27 |
% |
$ |
44,825 |
|
|
5.50 |
% |
* Balances of available-for-sale securities are shown at amortized cost.
At December 31, 2009, there were no holdings of any one issuer, other than the U.S. Government sponsored entities, in an amount greater than 10% of the Company’s shareholders’ equity.
32
Loans and Leases
Interest and fees earned on loans is the Company’s primary source of revenues. Total loans and leases, net of unearned income and net deferred loan fees and costs, grew by $97.3 million or 5.4%, to $1.91 billion at December 31, 2009, from $1.82 billion at December 31, 2008. Loan growth in 2009 was affected by $89.0 million of sales of residential mortgage loans during the year. Demand for residential mortgage loans was strong in 2009, largely driven by the low interest rate environment. The growth in 2008 over 2009 included $151.2 million of loans acquired in connection with the acquisition of Sleepy Hollow in May 2008. As of December 31, 2009, total loans represented 60.7% of total assets compared to 63.4% as of December 31, 2008. Table 5-Loan and Lease Classification Summary below details the composition and volume changes in the loan and lease portfolio over the past five years.
Table 5 – Loan and Lease Classification Summary
|
|
|
|
|
|
|
|
|
|
|
|
|
|
|
|
|
|
|
|
|
As of December 31, |
|
|||||||||||||
|
(in thousands) |
|
2009 |
|
2008 |
|
2007 |
|
2006 |
|
2005 |
|
|||||
|
Residential real estate |
|
$ |
622,942 |
|
$ |
625,263 |
|
$ |
504,353 |
|
$ |
469,146 |
|
$ |
475,155 |
|
|
Commercial real estate |
|
|
641,737 |
|
|
571,929 |
|
|
422,279 |
|
|
393,829 |
|
|
347,443 |
|
|
Real estate construction |
|
|
58,125 |
|
|
52,114 |
|
|
43,002 |
|
|
26,130 |
|
|
30,309 |
|
|
Commercial |
|
|
494,495 |
|
|
467,420 |
|
|
381,666 |
|
|
345,194 |
|
|
306,410 |
|
|
Consumer and other |
|
|
86,687 |
|
|
87,998 |
|
|
80,730 |
|
|
82,341 |
|
|
100,249 |
|
|
Leases |
|
|
12,821 |
|
|
14,968 |
|
|
10,832 |
|
|
11,962 |
|
|
14,864 |
|
|
|
|
|
|
|
|
|
|
|
|
|
|
|
|
|
|
|
|
Total loans and leases |
|
|
1,916,807 |
|
|
1,819,692 |
|
|
1,442,862 |
|
|
1,328,602 |
|
|
1,274,430 |
|
|
Less: unearned income and deferred costs and fees |
|
|
(1,989 |
) |
|
(2,161 |
) |
|
(2,740 |
) |
|
(2,304 |
) |
|
(3,081 |
) |
|
Total loans and leases, net of unearned income and deferred costs and fees |
|
$ |
1,914,818 |
|
$ |
1,817,531 |
|
$ |
1,440,122 |
|
$ |
1,326,298 |
|
$ |
1,271,349 |
|
Residential real estate loans, including home equity loans, of $622.9 million at year-end 2009 decreased by $2.3 million or 0.37% from $625.3 million at year-end 2008, and comprised 32.5% of total loans and leases at December 31, 2009. Residential real estate mortgage loans are generally underwritten in accordance with secondary market guidelines to enhance the liquidity of these generally longer-term assets. As part of its asset/liability management strategy the Company may sell certain residential mortgage loans in the secondary market. The Company generally sells loans without recourse. Loans are generally sold to Federal Home Loan Mortgage Corporation (“FHLMC”) or State of New York Mortgage Agency (“SONYMA”). During 2009, 2008, and 2007, the Company sold residential mortgage loans totaling $89.0 million, $11.3 million, and $10.7 million, respectively, and realized gains on these sales of $1.4 million, $105,000, and $159,000, respectively. When residential mortgage loans are sold or securitized, the Company typically retains all servicing, providing the Company with a source of fee income. Residential mortgage loans serviced for others totaled $206.0 million at December 31, 2009, compared to $149.9 million at December 31, 2008. In connection with the loan sales and securitizations in 2009, 2008, and 2007, the Company recorded mortgage-servicing assets of $648,000, $26,000, and $46,000, respectively. Amortization of mortgage servicing amounted to $245,000 in 2009, $117,000 in 2008 and $122,000 in 2007. Capitalized mortgage servicing rights totaled $1.4 million at December 31, 2009, and $961,000 at December 31, 2008, and are reported as intangible assets on the Consolidated Statements of Condition.
Commercial real estate loans increased by $69.8 million, or 12.2%, from $571.9 million at year-end 2008 to $641.7 million at year-end 2009. Commercial real estate loans of $641.7 million represented 33.5% of total loans and leases at December 31, 2009. Commercial loans totaled $494.5 million at December 31, 2009, which is a 5.8% increase from commercial loans of $467.4 million at December 31, 2008. Growth in commercial lending, including commercial real estate, reflects the Company’s continued emphasis on commercial lending. Management believes that the Company’s community banking strategy provides value to small business customers, while commercial lending products are typically attractive to the Company from a yield and interest rate risk perspective.
The consumer loan portfolio includes personal installment loans, indirect automobile financing, and overdraft lines of credit. The Company faces significant competition from local and national lenders as well as auto finance companies for consumer lending products. Consumer and other loans were $86.7 million at December 31, 2009, down from $88.0 million at December 31, 2008.
The lease portfolio decreased by 14.3% to $12.8 million at December 31, 2009, from $15 million at December 31, 2008. The lease portfolio has traditionally consisted of leases on vehicles for consumers and small businesses. Competition for automobile financing has led to a decline in the consumer lease portfolio over the past several years. Management continues to review leasing opportunities, primarily commercial leasing and municipal leasing. As of December 31, 2009, commercial leases and municipal leases represented 96.1% of total leases, while consumer leases made up the remaining 3.9%. As of December 31, 2008, commercial leases and municipal leases represented 95.7% of total leases, while consumer leases made up the remaining 4.3%.
The Company’s loan and lease customers are located primarily in the New York communities served by its three subsidiary banks.
33
Other than general economic risks, management is not aware of any material concentrations of credit risk to any industry or individual borrower. Further information on the Company’s lending activities, including related party transactions, is provided in “Note 5 Loan and Lease Classification Summary and Related Party Transactions” in Notes to Consolidated Financial Statements in Part II, Item 7. of this Report.
The Allowance for Loan and Lease Losses
Management reviews the adequacy of the allowance for loan and lease losses (“allowance”) on a regular basis. Management considers the accounting policy relating to the allowance to be a critical accounting policy, given the inherent uncertainty in evaluating the levels of the allowance required to cover credit losses in the portfolio and the material effect that assumptions could have on the Company’s results of operations. The Company’s methodology for determining and allocating the allowance for loan and lease losses focuses on ongoing reviews of larger individual loans and leases, historical net charge-offs, delinquencies in the loan and lease portfolio, the level of impaired and nonperforming assets, values of underlying loan and lease collateral, the overall risk characteristics of the portfolios, changes in character or size of the portfolios, geographic location, current economic conditions, changes in capabilities and experience of lending management and staff, and other relevant factors. The various factors used in the methodologies are reviewed on a periodic basis.
The Company has developed a methodology to measure the amount of estimated loan loss exposure inherent in the loan portfolio to assure that an adequate allowance is maintained. The Company’s methodology is based upon guidance provided in SEC Staff Accounting Bulletin No. 102, Selected Loan Loss Allowance Methodology and Documentation Issues and includes an estimate of exposure for the following: specifically reviewed and graded loans; historical loss experience by product type; past due and nonperforming loans; and other internal and external factors such as local and regional economic conditions, growth trends, and credit policy and underwriting standards.
At least annually, management reviews all commercial and commercial real estate loans exceeding a certain threshold and assigns a risk rating grade. At least quarterly, management reviews all loans and leases over a certain dollar threshold that are internally risk rated below a predetermined grade, giving consideration to payment history, debt service payment capacity, collateral support, strength of guarantors, industry trends, and other factors relevant to the particular borrowing relationship. Through this process, management identifies impaired loans. For loans and leases considered impaired, estimated exposure amounts are based upon collateral values or discounted cash flows. For internally reviewed commercial and commercial real estate loans that are not impaired but whose internal risk rating is below a certain level, estimated exposures are assigned based upon several factors, including the borrower’s financial condition, payment history, collateral adequacy, and business conditions, and historical loss factors.
For commercial loans and commercial mortgage loans not specifically reviewed, and for homogenous loan portfolios such as residential mortgage loans and consumer loans, estimated exposure amounts are assigned based upon historical loss experience and current charge-off trends, past due status, and management’s judgment of the effects of current economic conditions on portfolio performance.
In addition to the above components, amounts are maintained based upon management’s judgment and assessment of other quantitative and qualitative factors such as regional and local economic conditions, concentrations of credit, industry concerns, adverse market changes in estimated or appraised collateral value, and portfolio growth trends.
Since the methodology is based upon historical experience and trends as well as management’s judgment, factors may arise that result in different estimations. Significant factors that could give rise to changes in these estimates may include, but are not limited to, changes in economic conditions in the local area, concentration of risk, changes in interest rates, and declines in local property values. While management’s evaluation of the allowance as of December 31, 2009, considers the allowance to be adequate, under adversely different conditions or assumptions, the Company would need to increase the allowance.
The allocation of the Company’s allowance as of December 31, 2009, and each of the previous four years is illustrated in Table 6- Allocation of the Allowance for Loan and Lease Losses, below.
34
Table 6 - Allocation of the Allowance for Loan and Lease Losses
|
|
|
|
|
|
|
|
|
|
|
|
|
|
|
|
|
|
|
|
|
As of December 31, |
|
|||||||||||||
|
(dollar amounts in thousands) |
|
2009 |
|
2008 |
|
2007 |
|
2006 |
|
2005 |
|
|||||
|
Total loans outstanding at end of year |
|
$ |
1,914,818 |
|
$ |
1,817,531 |
|
$ |
1,440,122 |
|
$ |
1,326,298 |
|
$ |
1,271,349 |
|
|
ALLOCATION OF THE ALLOWANCE BY LOAN TYPE: |
|
|
|
|
|
|
|
|
|
|
|
|
|
|
|
|
|
Commercial |
|
$ |
7,143 |
|
$ |
6,274 |
|
$ |
6,135 |
|
$ |
6,308 |
|
$ |
5,354 |
|
|
Real estate |
|
|
14,857 |
|
|
10,116 |
|
|
6,640 |
|
|
5,609 |
|
|
5,357 |
|
|
Consumer and all other |
|
|
2,350 |
|
|
2,282 |
|
|
1,832 |
|
|
2,236 |
|
|
2,850 |
|
|
Unallocated |
|
|
0 |
|
|
0 |
|
|
0 |
|
|
175 |
|
|
116 |
|
|
Total |
|
$ |
24,350 |
|
$ |
18,672 |
|
$ |
14,607 |
|
$ |
14,328 |
|
$ |
13,677 |
|
|
ALLOCATION OF THE ALLOWANCE AS A PERCENTAGE OF TOTAL ALLOWANCE: |
|
|
|
|
|
|
|
|
|
|
|
|
|
|
|
|
|
Commercial |
|
|
29 |
% |
|
34 |
% |
|
42 |
% |
|
44 |
% |
|
39 |
% |
|
Real estate |
|
|
61 |
% |
|
54 |
% |
|
45 |
% |
|
39 |
% |
|
39 |
% |
|
Consumer and all other |
|
|
10 |
% |
|
12 |
% |
|
13 |
% |
|
16 |
% |
|
21 |
% |
|
Unallocated |
|
|
0 |
% |
|
0 |
% |
|
0 |
% |
|
1 |
% |
|
1 |
% |
|
Total |
|
|
100 |
% |
|
100 |
% |
|
100 |
% |
|
100 |
% |
|
100 |
% |
|
LOAN AND LEASE TYPES AS A PERCENTAGE OF TOTAL LOANS AND LEASES: |
|
|
|
|
|
|
|
|
|
|
|
|
|
|
|
|
|
Commercial |
|
|
26 |
% |
|
26 |
% |
|
27 |
% |
|
26 |
% |
|
24 |
% |
|
Real estate |
|
|
69 |
% |
|
68 |
% |
|
67 |
% |
|
67 |
% |
|
67 |
% |
|
Consumer and all other |
|
|
5 |
% |
|
6 |
% |
|
6 |
% |
|
7 |
% |
|
9 |
% |
|
Total |
|
|
100 |
% |
|
100 |
% |
|
100 |
% |
|
100 |
% |
|
100 |
% |
Management is committed to early recognition of loan problems and to maintaining an adequate allowance. The above allocation is neither indicative of the specific amounts or the loan categories in which future charge-offs may occur, nor is it an indicator of future loss trends. The allocation of the allowance to each category does not restrict the use of the allowance to absorb losses in any category. The increase in the overall allowance over the past two years reflects higher allocations driven by deterioration in asset quality measures, including higher net charge-offs, internally-classified loans, and nonperforming loans and leases; weak economic conditions; soft real estate markets; and growth in the loan portfolio. The higher net charge-offs during 2009 and 2008 directly increased the historical loss factors in the allowance model. The allocations assigned to the internally-classified loans were also up in 2009 with the increase in the balances of loans internally-classified. Allocations for the internally-classified credits are based upon a specific review of these credits and historical loss experience, which has increased over the past two years with the increase in net charge-offs. Factors contributing to the increase in the allocation for real estate loans include: higher balances of internally-classified commercial real estate loans in 2009; weak and uncertain economic conditions and soft real estate markets; and growth in the portfolio.
The level of future charge-offs is dependent upon a variety of factors such as national and local economic conditions, trends in various industries, underwriting characteristics, and conditions unique to each borrower. Given uncertainties surrounding these factors, it is difficult to estimate future losses.
The principal balances of nonperforming loans and leases, including impaired loans and leases, as of December 31, are detailed in the table below.
|
|
|
|
|
|
|
|
|
|
|
|
|
|
|
|
|
|
|
(dollar amounts in thousands) |
|
2009 |
|
2008 |
|
2007 |
|
2006 |
|
2005 |
|
|||||
|
Loans 90 days past due and accruing |
|
$ |
369 |
|
$ |
161 |
|
$ |
312 |
|
$ |
8 |
|
$ |
12 |
|
|
Nonaccrual loans |
|
|
31,289 |
|
|
15,798 |
|
|
8,890 |
|
|
2,994 |
|
|
4,072 |
|
|
Troubled debt restructurings not included above |
|
|
3,265 |
|
|
69 |
|
|
145 |
|
|
0 |
|
|
50 |
|
|
Total nonperforming loans and leases |
|
|
34,923 |
|
|
16,028 |
|
|
9,347 |
|
|
3,002 |
|
|
4,134 |
|
|
Other real estate owned |
|
|
299 |
|
|
110 |
|
|
5 |
|
|
348 |
|
|
366 |
|
|
Total nonperforming assets |
|
$ |
35,222 |
|
$ |
16,138 |
|
$ |
9,352 |
|
$ |
3,350 |
|
$ |
4,500 |
|
|
Allowance as a percentage of loans and leases outstanding |
|
|
1.27 |
% |
|
1.03 |
% |
|
1.01 |
% |
|
1.08 |
% |
|
1.08 |
% |
|
Allowance as a percentage of nonperforming loans and leases |
|
|
69.72 |
% |
|
116.50 |
% |
|
156.27 |
% |
|
477.28 |
% |
|
330.84 |
% |
|
Total nonperforming assets as percentage of total assets |
|
|
1.12 |
% |
|
0.56 |
% |
|
0.40 |
% |
|
0.15 |
% |
|
0.21 |
% |
Nonperforming assets include nonaccrual loans, troubled debt restructurings (“TDR”), and foreclosed real estate. Nonperforming assets of $35.2 million at December 31, 2009 were up $19.1 million or 118.3% over year-end 2008. In general, the increase in nonperforming assets is reflective of the current weak economy, which has pressured real estate values in some of the Company’s markets and stressed the financial
35
conditions of various commercial borrowers and agricultural borrowers. As of December 31, 2009, nonperforming loans included $19.6 million of commercial real estate loans, $7.6 million of commercial loans and $6.0 million of residential real estate loans. As of December 31, 2008, nonperforming loans included $7.7 million of commercial real estate loans, $2.7 million of commercial loans and $4.9 million of residential real estate loans. As of December 31, 2009, approximately $5.1 million of nonperforming loans were secured by U.S. government guarantees, while $6.0 million were secured by one-to-four family residential properties. The TDR consists of one commercial relationship, consisting of two commercial real estate loans. The two loans were modified with concessions granted due to the stressed financial condition of the borrower. The loan is currently performing according to the modified terms.
Although up from year-end 2008, the Company’s ratio of nonperforming assets to total assets of 1.12% continues to compare favorably to a peer ratio of 3.70%. The peer data is from the Federal Reserve Board and represents banks or bank holding companies with assets between $3.0 billion and $10.0 billion. The peer ratio is as of December 31, 2009, the most recent data available from the Federal Reserve Board.
As of December 31, 2009, the Company’s recorded investment in loans and leases that are considered impaired totaled $30.0 million compared to $9.7 million at December 31, 2008. A loan is impaired when, based on current information and events, it is probable that we will be unable to collect all amounts due according to the contractual terms of the loan agreement. Impaired loans consist of our nonaccrual loans, loans that are 90 days or more past due, and other loans for which the Company determine that noncompliance with contractual terms of the loan agreement is probable. Losses on individually identified impaired loans that are not collateral dependent are measured based on the present value of expected future cash flows discounted at the original effective interest rate of each loan. For loans that are collateral dependent, impairment is measured based on the fair value of the collateral less estimated selling costs. The $23.6 million of impaired loans at December 30, 2009, had related allowances of $803,000, and the $9.7 million of impaired loans at December 31, 2008, had related allowances of $520,000.
The allowance represented 1.27% of total loans and leases outstanding at December 31, 2009, up from 1.03% at December 31, 2008. The increase in the ratio of the allowance to total loans and leases outstanding was consistent with the increase in our nonperforming assets, net charge-offs and internally-classified loans during 2009 as well as the overall weakness in the economy.
The allowance coverage of nonperforming loans (loans past due 90 days and accruing, nonaccrual loans, and restructured troubled debt) was 0.70 times at December 31, 2009, compared to 1.17 times at December 31, 2008. This ratio has trended downward since 2006 as the growth in nonperforming loans has outpaced the growth in the allowance. Although nonperforming loans are up over the past two years, the Company’s loss experience continues to be low compared to industry levels with net charge-offs to average total loans and leases of 0.20% in 2009.
The difference between the interest income that would have been recorded if nonaccrual loans and leases had been paid in accordance with their original terms and the interest income recorded for the years ended December 31, 2009 was $669,000. For December 31, 2008 and 2007, the amounts were not material.
A discussion of the Company’s policy for placing loans on nonaccrual status is included in “Note 1 Summary of Significant Accounting Policies” in Notes to Consolidated Financial Statements in Part II, Item 7. of this Report.
The Company’s historical loss experience is detailed in Table 7-Analysis of the Allowance for Loan and Lease Losses.
36
Table 7 - Analysis of the Allowance for Loan and Lease Losses
|
|
|
|
|
|
|
|
|
|
|
|
|
|
|
|
|
|
|
|
|
December 31 |
|
|||||||||||||
|
(in thousands) |
|
2009 |
|
2008 |
|
2007 |
|
2006 |
|
2005 |
|
|||||
|
Average loans outstanding during year |
|
$ |
1,850,453 |
|
$ |
1,612,716 |
|
$ |
1,362,417 |
|
$ |
1,269,650 |
|
$ |
1,220,016 |
|
|
Balance of allowance at beginning of year |
|
|
18,672 |
|
|
14,607 |
|
|
14,328 |
|
|
13,677 |
|
|
12,549 |
|
|
|
|
|
|
|
|
|
|
|
|
|
|
|
|
|
|
|
|
LOANS CHARGED-OFF: |
|
|
|
|
|
|
|
|
|
|
|
|
|
|
|
|
|
Commercial, financial, agricultural |
|
|
1,929 |
|
|
1,490 |
|
|
672 |
|
|
333 |
|
|
890 |
|
|
Real estate – mortgage |
|
|
511 |
|
|
585 |
|
|
118 |
|
|
43 |
|
|
408 |
|
|
Real estate – construction |
|
|
599 |
|
|
0 |
|
|
0 |
|
|
0 |
|
|
0 |
|
|
Installment loans to individuals |
|
|
742 |
|
|
725 |
|
|
448 |
|
|
504 |
|
|
595 |
|
|
Lease financing |
|
|
0 |
|
|
0 |
|
|
0 |
|
|
210 |
|
|
0 |
|
|
Other loans |
|
|
453 |
|
|
490 |
|
|
522 |
|
|
174 |
|
|
344 |
|
|
Total loans charged-off |
|
$ |
4,234 |
|
$ |
3,290 |
|
$ |
1,760 |
|
$ |
1,264 |
|
$ |
2,237 |
|
|
|
|
|
|
|
|
|
|
|
|
|
|
|
|
|
|
|
|
RECOVERIES OF LOANS PREVIOUSLY CHARGED-OFF: |
|
|
|
|
|
|
|
|
|
|
|
|
|
|
|
|
|
Commercial, financial, agricultural |
|
|
267 |
|
|
94 |
|
|
143 |
|
|
136 |
|
|
210 |
|
|
Real estate – mortgage |
|
|
32 |
|
|
2 |
|
|
9 |
|
|
19 |
|
|
32 |
|
|
Installment loans to individuals |
|
|
147 |
|
|
170 |
|
|
241 |
|
|
226 |
|
|
277 |
|
|
Lease financing |
|
|
0 |
|
|
0 |
|
|
0 |
|
|
3 |
|
|
37 |
|
|
Other loans |
|
|
178 |
|
|
176 |
|
|
117 |
|
|
107 |
|
|
150 |
|
|
Total loans recovered |
|
$ |
624 |
|
$ |
442 |
|
$ |
510 |
|
$ |
491 |
|
$ |
706 |
|
|
Net loans charged-off |
|
|
3,610 |
|
|
2,848 |
|
|
1,250 |
|
|
773 |
|
|
1,531 |
|
|
Allowance acquired in purchase acquisition |
|
|
0 |
|
|
1,485 |
|
|
0 |
|
|
0 |
|
|
0 |
|
|
Additions to allowance charged to operations |
|
|
9,288 |
|
|
5,428 |
|
|
1,529 |
|
|
1,424 |
|
|
2,659 |
|
|
Balance of allowance at end of year |
|
$ |
24,350 |
|
$ |
18,672 |
|
$ |
14,607 |
|
$ |
14,328 |
|
$ |
13,677 |
|
|
Net charge-offs as a percentage of average loans and leases outstanding during the year |
|
|
0.20 |
% |
|
0.18 |
% |
|
0.09 |
% |
|
0.06 |
% |
|
0.13 |
% |
As previously stated, the provision for loan and lease losses represents management’s estimate of the expense necessary to maintain the allowance for loan and lease losses at an adequate level. The provision for loan and lease losses was $9.3 million in 2009, compared to $5.4 million in 2008. The increase in 2009 over prior year was due to increases in nonperforming loans and leases and net charge-offs as well as concerns over weak economic conditions and uncertain real estate markets. The Company acquired an allowance of $1.5 million in connection with the acquisition of Sleepy Hollow in May 2008. The ratio of net charge-offs to average total loans and leases of 0.20% is up over prior year, but is favorable to a peer ratio of 1.58%. The peer data is from the Federal Reserve Board and represents banks or bank holding companies with assets between $3.0 billion and $10.0 billion. The peer ratio is as of December 31, 2009, the most recent data available from the Federal Reserve Board.
Management reviews the loan portfolio continuously for evidence of potential problem loans and leases. Potential problem loans and leases are loans and leases that are currently performing in accordance with contractual terms, but where known information about possible credit problems of the related borrowers causes management to have doubt as to the ability of such borrowers to comply with the present loan payment terms and may result in such loans and leases becoming nonperforming at some time in the future. Management considers loans and leases classified as Substandard, which continue to accrue interest, to be potential problem loans and leases. The Company, through its internal loan review function, identified 67 commercial relationships totaling $83.9 million at December 31, 2009, and 36 commercial relationships totaling $20.3 million at December 31, 2008, which it classified as Substandard, which continue to accrue interest. Of the 67 commercial relationships, there are 19 relationships that equaled or exceeded $1.0 million, which in aggregate totaled $71.4 million. The Company has seen an increase in potential problem loans over the course of 2009 as weak economic conditions have strained the cash flows and collateral values of its borrowers’. The Company continues to monitor these relationships; however, management cannot predict the extent to which continued weak economic conditions or other factors may further impact borrowers. These loans remain in a performing status due to a variety of factors, including payment history, the value of collateral supporting the credits, and personal or government guarantees. These factors, when considered in the aggregate, give management reason to believe that the current risk exposure on these loans does not warrant accounting for these loans as nonperforming. However, these loans do exhibit certain risk factors, which have the potential to cause them to become nonperforming. Accordingly, management’s attention is focused on these credits, which are reviewed on at least a quarterly basis.
37
Deposits and Other Liabilities
Total deposits of $2.4 billion at December 31, 2009, were up $305.9 million or 14.3% over year-end 2008. Deposit growth included $203.1 million in interest checking, savings and money market balances, $91.6 million in time deposits and $11.1 million in noninterest bearing deposits.
Core deposits, defined as total deposits less time deposits of $100,000 or more, brokered deposits and municipal money market deposits, grew by $94.0 million or 5.8% to $1.7 billion at year-end 2009 from $1.6 billion at year-end 2008. Core deposits represented 70.7% of total deposits at December 31, 2009, compared to 76.4% of total deposits at December 31, 2008. Municipal money market accounts increased by $137.2 million, or 67.2% to $341.1 million at year-end 2009 from $203.9 million at year-end 2008. Time deposits of $100,000 and more were up $50.0 million or 18.0% between year-end 2009 and year-end 2008. Table 1-Average Statements of Condition and Net Interest Analysis shows the average balance and average rate paid on the Company’s primary deposit categories for the years ended December 31, 2009, 2008, and 2007. A maturity schedule of time deposits outstanding at December 31, 2009, is included in “Note 9 Deposits” in Notes to Consolidated Financial Statements in Part II, Item 7. of this Report.
The Company uses both retail and wholesale repurchase agreements. Retail repurchase agreements are arrangements with local customers of the Company, in which the Company agrees to sell securities to the customer with an agreement to repurchase those securities at a specified later date. Retail repurchase agreements totaled $47.3 million at December 31, 2009, and $42.1 million at December 31, 2008. Management generally views local repurchase agreements as an alternative to large time deposits. The Company’s wholesale repurchase agreements are primarily with the Federal Home Loan Bank (“FHLB”) and amounted to $145.5 million at December 31, 2009, and $153.2 million at December 31, 2008. Included in the $145.5 million of wholesale repurchase agreements at year-end 2008, is a $5.5 million repurchase agreement with the FHLB where the Company elected to adopt the fair value option. The fair value of this repurchase agreement decreased by $177,000 (net mark-to-market pre-tax gain of $177,000) over the 12-months ended December 31, 2009. During 2009, the Company prepaid a $10.0 million repurchase agreement with the FHLB, where the Company had elected the fair value option. Net mark-to-market pre-tax gains of $242,000 related to this repurchase agreement are included in 2009. The $242,000 pre-tax gain and the $177,000 pre-tax gain are included on the Company’s Consolidated Statements of Income in “Mark-to-Market Gain (Loss) on Liabilities Held at Fair Value.” Refer to “Note 10 Securities Sold Under Agreements to Repurchase and Federal Funds Purchased” in Notes to Consolidated Financial Statements in Part II, Item 7. of this Report for further details on the Company’s repurchase agreements.
The Company’s other borrowings totaled $209.0 million at year-end 2009, down $65.8 million or 24.0% from $274.8 million at year-end 2008. The $209.0 million in borrowings at December 31, 2009, included $170.3 million in term advances, $13.5 million of overnight FHLB advances, and a $25.0 million advance from a money center bank. Of the $170.3 million of the FHLB term advances at year-end 2009, $150.3 million are due over one year and have a weighted average rate of 4.35%. In 2007, the Company elected to account for a $10.0 million advance with the FHLB at fair value. The fair value of this advance decreased by $844,000 (net mark-to-market gain of $844,000) over the 12-months ended December 31, 2009. Refer to “Note 11 Other Borrowings” in Notes to Consolidated Financial Statements in Part II, Item 7. of this Report for further details on the Company’s term borrowings with the FHLB.
Other borrowings included a term borrowing with a bank totaling $25.0 million at December 31, 2009, and $24.0 million at December 31, 2008. There were also a Treasury Tax and Loan Note account with the Federal Reserve Bank of New York totaling $100,000 at December 31, 2009 and 2008, and borrowings from unrelated financial institutions totaling $30,000 and $39,000 at December 31, 2009 and 2008, respectively.
LIQUIDITY MANAGEMENT
The objective of liquidity management is to ensure the availability of adequate funding sources to satisfy the demand for credit, deposit withdrawals, operating expenses, and business investment opportunities. The Company’s large, stable core deposit base and strong capital position are the foundation for the Company’s liquidity position. The Company uses a variety of resources to meet its liquidity needs, which include deposits, cash and cash equivalents, short-term investments, cash flow from lending and investing activities, repurchase agreements, and borrowings. The Company may also use borrowings as part of a growth strategy. Asset and liability positions are monitored primarily through the Asset/Liability Management Committee of the Company’s subsidiary banks. This Committee reviews periodic reports on the liquidity and interest rate sensitivity positions. Comparisons with industry and peer groups are also monitored. The Company’s strong reputation in the communities it serves, along with its strong financial condition, provides access to numerous sources of liquidity as described below. Management believes these diverse liquidity sources provide sufficient means to meet all demands on the Company’s liquidity that are reasonably likely to occur.
Core deposits are a primary low cost funding source obtained mainly through the Company’s branch network. Core deposits totaled $1.7 billion at year-end 2009, up $94.0 million or 5.8% from year-end 2008, with the increase mainly in money market and savings deposits and noninterest-bearing deposits. Core deposits represented 70.7% of total deposits and 59.3% of total liabilities at December 31, 2009, compared to 76.4% of total deposits and 61.6% of total liabilities at December 31, 2008.
38
In addition to core deposits, the Company uses non-core funding sources to support asset growth. These non-core funding sources include time deposits of $100,000 or more, brokered time deposits, municipal money market accounts, securities sold under agreements to repurchase, overnight borrowings and term advances from the FHLB and other funding sources. Rates and terms are the primary determinants of the mix of these funding sources. Non-core funding sources increased by $142.5 million to $1.1 billion at year end 2009, from $973.7 million at year-end 2008. As a percentage of total liabilities, non-core funding sources increased from 36.8% at year-end 2008 to 38.4% at year-end 2009. Overnight borrowing from the FHLB declined $60.0 million during 2009 offsetting growth of $137.1 million in municipal money market accounts, $50.0 million in time deposits of $100,000 or more and $24.7 million in brokered time deposits.
Non-core funding sources may require securities to be pledged against the underlying liability. Securities carried at $772.7 million and $699.6 million at December 31, 2009 and 2008, respectively, were either pledged or sold under agreements to repurchase. Pledged securities represented 83.9% of total securities at December 31, 2009, compared to 79.1% of total securities at December 31, 2008.
Cash and cash equivalents totaled $45.5 million as of December 31, 2009, down from $52.3 million at December 31, 2008. Short-term investments, consisting of securities due in one year or less, decreased from $41.9 million at December 31, 2008, to $30.1 million on December 31, 2009. The Company also has $31.7 million of securities designated as trading securities.
Cash flow from the loan and investment portfolios provides a significant source of liquidity. These assets may have stated maturities in excess of one year, but have monthly principal reductions. Total mortgage-backed securities, at fair value, were $477.7 million at December 31, 2009 compared with $474.0 million at December 31, 2008. Outstanding principal balances of residential mortgage loans, consumer loans, and leases totaled approximately $722.5 million at December 31, 2009 as compared to $728.2 million at December 31, 2008. Aggregate amortization from monthly payments on these assets provides significant additional cash flow to the Company.
Liquidity is enhanced by ready access to national and regional wholesale funding sources including Federal funds purchased, repurchase agreements, brokered certificates of deposit, and FHLB advances. Through its subsidiary banks, the Company has borrowing relationships with the FHLB and correspondent banks, which provide secured and unsecured borrowing capacity. At December 31, 2009, the unused borrowing capacity on established lines with the FHLB was $508.4 million. As members of the FHLB, the Company’s subsidiary banks can use certain unencumbered mortgage-related assets to secure additional borrowings from the FHLB. At December 31, 2009, total unencumbered residential mortgage loans of the Company were $213.2 million. Additional assets may also qualify as collateral for FHLB advances upon approval of the FHLB.
The Company has not identified any trends or circumstances that are reasonably likely to result in material increases or decreases in liquidity in the near term.
Table 8-Loan Maturity details total scheduled maturities of selected loan categories.
Table 8 - Loan Maturity
|
|
|
|
|
|
|
|
|
|
|
|
|
|
|
|
Remaining maturity of selected loans |
|
At December 31, 2009 |
|
||||||||||
|
(in thousands) |
|
Total |
|
Within 1 year |
|
1-5 years |
|
After 5 years |
|
||||
|
Commercial real estate |
|
$ |
641,737 |
|
$ |
11,026 |
|
$ |
67,623 |
|
$ |
563,088 |
|
|
Real estate construction |
|
|
58,125 |
|
|
21,303 |
|
|
1,865 |
|
|
34,957 |
|
|
Commercial |
|
|
492,647 |
|
|
163,139 |
|
|
153,671 |
|
|
175,837 |
|
|
Total |
|
$ |
1,192,509 |
|
$ |
195,468 |
|
$ |
223,159 |
|
$ |
773,882 |
|
Loan balances are shown net of unearned income and deferred costs and fees.
Of the loan amounts shown above in Table 8-Loan Maturity maturing over one year, $664.0 million have fixed rates and $528.5 million have adjustable rates.
OFF-BALANCE SHEET ARRANGEMENTS
In the normal course of business the Company is party to certain financial instruments, which in accordance with accounting principles generally accepted in the United States, are not included in its Consolidated Statements of Condition. These transactions include commitments under standby letters of credit, unused portions of lines of credit, and commitments to fund new loans and are undertaken to accommodate the financing needs of the Company’s customers. Loan commitments are agreements by the Company to lend monies at a future date. These loan and letter of credit commitments are subject to the same credit policies and reviews as the Company’s loans. Because most of these loan commitments expire within one year from the date of issue, the total amount of these loan commitments as of December 31, 2009, are not necessarily indicative of future cash requirements. Further information on these commitments and contingent liabilities is provided in “Note 17 Commitments and Contingent Liabilities” in Notes to Consolidated Financial Statements in Part II, Item 7. of this Report.
39
CONTRACTUAL OBLIGATIONS
The Company leases land, buildings, and equipment under operating lease arrangements extending to the year 2090. Most leases include options to renew for periods ranging from 5 to 20 years. In addition, the Company has a software contract for its core banking application through July 31, 2015, along with contracts for more specialized software programs through 2016. Further information on the Company’s lease arrangements is provided in “Note 8 Premises and Equipment” in Notes to Consolidated Financial Statements in Part II, Item 7. of this Report. The Company’s contractual obligations as of December 31, 2009, are shown in Table 9-Contractual Obligations and Commitments below.
Table 9 – Contractual Obligations and Commitments
|
|
|
|
|
|
|
|
|
|
|
|
|
|
|
|
|
|
|
Contractual Cash Obligations |
|
Payments Due By Period |
|
|||||||||||||
|
(in thousands) |
|
Total |
|
Within |
|
1-3 years |
|
3-5 years |
|
Over 5 |
|
|||||
|
Long-term debt |
|
$ |
370,253 |
|
$ |
42,332 |
|
$ |
98,742 |
|
$ |
103,388 |
|
$ |
125,791 |
|
|
Operating leases |
|
|
19,610 |
|
|
2,208 |
|
|
3,157 |
|
|
2,478 |
|
|
11,767 |
|
|
Software contracts |
|
|
3,517 |
|
|
1,291 |
|
|
1,718 |
|
|
477 |
|
|
31 |
|
|
Total contractual cash obligations |
|
$ |
393,380 |
|
$ |
45,831 |
|
$ |
103,617 |
|
$ |
106,343 |
|
$ |
137,589 |
|
RECENTLY ISSUED ACCOUNTING STANDARDS
Refer to “Note 1 Summary of Significant Accounting Policies” in Notes to Consolidated Financial Statements in Part II, Item 7. of this Form 10-K for details of recently issued accounting pronouncements and their expected impact on the Company’s financial statements.
Fourth Quarter Summary
The Company reported diluted earnings per share of $0.76 for the fourth quarter of 2009, an 11.8% increase from $0.68 for the comparable year-ago period, and a 3.8% decrease from $0.79 per share reported in the third quarter of 2009. Fourth quarter 2009 net income was $8.2 million, up 12.9% over fourth quarter 2008 net income of $7.3 million and down 2.9% from third quarter 2009 net income of $8.5 million.
Taxable-equivalent net interest income rose 12.2% to $28.6 million in the fourth quarter of 2009 from $25.5 million in the same quarter 2008 and represented a record quarterly level for the Company. The growth in taxable-equivalent net increase income was due to growth in average earning assets, which increased $306.9 million or 11.8%, to $2.9 billion in the fourth quarter of 2009 from $2.6 billion in the fourth quarter of 2008, and lower rates paid on interest-bearing liabilities. The growth in average earnings assets in the fourth quarter over the year-earlier quarter included a $140.1 million or 8.0% increase in average loans and leases, and a $111.1 million or 13.0% increase in average securities. The yield on interest earning assets was 5.18% in the fourth quarter of 2009, down 49 basis points from 5.67% in the fourth quarter of 2008. The rate paid on interest-bearing liabilities was 1.57% in the fourth quarter of 2009, down 63 basis points from 2.20% in the same quarter prior year.
The provision for loan and lease losses was $2.8 million for the fourth quarter of 2009, compared to $2.1 million for the fourth quarter of 2008. The increase in the provision in 2009 over prior year was due to increases in nonperforming loans and leases and net charge-offs as well as concerns over weak economic conditions and uncertain real estate markets. Nonperforming loans and leases were $34.9 million or 1.82% of total loans and leases at December 31, 2009, compared with $16.0 million or 0.88% of total loans and leases at December 31, 2008. Net charge-offs totaled $1.2 million in the fourth quarter of 2009, representing an annualized 0.25% of average loans and leases compared with net charge-offs of $739,000 or an annualized 0.17% of average loans and lease in the same period of 2008.
Total noninterest income in the fourth quarter of 2009 was $12.1 million, up $1.8 million, or 17.5%, from the fourth quarter of 2008. Key fee income categories in the fourth quarter of 2009 were comparable to the same quarter prior year. Net mark-to-market gains on securities and liabilities held at fair value totaled $352,000 in the fourth quarter of 2009 compared to net mark-to-market losses of $856,000 in the same quarter prior year. Increased residential mortgage loan origination volume in 2009 resulted in gains on sales of loans of $202,000 in the fourth quarter of 2009 compared to gains of $15,000 in the same quarter prior year.
Noninterest expense totaled $24.9 million for the 2009 fourth quarter, up $2.2 million, or 9.7%, from $22.7 million for the 2008 fourth quarter. Salary and benefit related expenses were up $536,000 or 4.0% over the same quarter prior year. The increase was due to annual salary adjustments, additional FTEs, and higher benefit-related expenses, mainly pension and health insurance. Higher FDIC insurance deposit assessments were also a significant contributor to the increase in noninterest expenses in the quarter.
40
|
|
|
|
Quantitative and Qualitative Disclosures About Market Risk |
MARKET RISK
Interest rate risk is the primary market risk category associated with the Company’s operations. Interest rate risk refers to the volatility of earnings caused by changes in interest rates. The Company manages interest rate risk using income simulation to measure interest rate risk inherent in its on-balance sheet and off-balance sheet financial instruments at a given point in time by showing the potential effect of interest rate shifts on net interest income for future periods. Each quarter the Company’s Asset/Liability Management Committee reviews the simulation results to determine whether the exposure of net interest income to changes in interest rates remains within Board-approved levels. The Committee also discusses strategies to manage this exposure and incorporates these strategies into the investment and funding decisions of the Company. The Company does not currently use derivatives, such as interest rate swaps, to manage its interest rate risk exposure, but may consider such instruments in the future.
The Company’s Board of Directors has set a policy that interest rate risk exposure will remain within a range whereby net interest income will not decline by more than 10% in one year as a result of a 100 basis point parallel change in rates. Based upon the simulation analysis performed as of November 30, 2009, a 200 basis point parallel upward change in interest rates over a one-year time frame would result in a one-year decline in net interest income from the base case of approximately 1.7%, while a 100 basis point parallel decline in interest rates over a one-year period would result in a marginal decrease in one-year net interest income from the base case of 1.2%. The simulation assumes no balance sheet growth and no management action to address balance sheet mismatches.
The negative exposure in a rising rate environment is mainly driven by the repricing assumptions of the Company’s core deposit base and the lag in the repricing of the Company’s adjustable rate assets. Longer-term, the impact of a rising rate environment is positive as the asset base continues to reset at higher levels, while the repricing of the rate sensitive liabilities moderates. The moderate exposure in the 100 basis point decline scenario results from the Company’s assets repricing downward to a greater degree than the rates on the Company’s interest-bearing liabilities, mainly deposits. Rates on savings and money market accounts are at low levels given the historically low interest rate environment experienced in recent years. In addition, the model assumes that prepayments accelerate in the down interest rate environment resulting in additional pressure on asset yields as proceeds are reinvested at lower rates.
In our most recent simulation, the base case scenario, which assumes interest rates remain unchanged from the date of the simulation, showed a relatively flat net interest margin during 2010.
Although the simulation model is useful in identifying potential exposure to interest rate movements, actual results may differ from those modeled as the repricing, maturity, and prepayment characteristics of financial instruments may change to a different degree than modeled. In addition, the model does not reflect actions that management may employ to manage its interest rate risk exposure. The Company’s current liquidity profile, capital position, and growth prospects, offer a level of flexibility for management to take actions that could offset some of the negative effects of unfavorable movements in interest rates. Management believes the current exposure to changes in interest rates is not significant in relation to the earnings and capital strength of the Company.
In addition to the simulation analysis, management uses an interest rate gap measure. Table 10-Interest Rate Risk Analysis below is a Condensed Static Gap Report, which illustrates the anticipated repricing intervals of assets and liabilities as of December 31, 2009. The Company’s one-year interest rate gap was a negative $113,000 or 3.59% of total assets at December 31, 2009, compared with a negative $12,000 or .44% of total assets at December 31, 2008. A negative gap position exists when the amount of interest-bearing liabilities maturing or repricing exceeds the amount of interest-earning assets maturing or repricing within a particular time period. This analysis suggests that the Company’s net interest income is more vulnerable to an increasing rate environment than it is to a prolonged declining interest rate environment. An interest rate gap measure could be significantly affected by external factors such as a rise or decline in interest rates, loan or securities prepayments, and deposit withdrawals.
Table 10 – Interest Rate Risk Analysis
|
|
|
|
|
|
|
|
|
|
|
|
|
|
|
|
|
|
|
Condensed Static Gap - December 31, 2009 |
|
Repricing Interval |
|
|||||||||||||
|
(dollar amounts in thousands) |
|
Total |
|
0-3 months |
|
3-6 months |
|
6-12 months |
|
Cumulative |
|
|||||
|
Interest-earning assets* |
|
$ |
2,922,138 |
|
$ |
723,268 |
|
$ |
227,652 |
|
$ |
327,716 |
|
$ |
1,278,636 |
|
|
Interest-bearing liabilities |
|
|
2,404,688 |
|
|
965,084 |
|
|
178,338 |
|
|
248,471 |
|
|
1,391,893 |
|
|
Net gap position |
|
|
|
|
|
(241,816) |
|
|
49,314 |
|
|
79,245 |
|
|
(113,257) |
|
|
Net gap position as a percentage of total assets |
|
|
|
|
|
(7.67%) |
|
|
1.56% |
|
|
2.51% |
|
|
(3.59%) |
|
41
[This Page Intentionally Left Blank]
42
|
|
|
|
Financial Statements and Supplementary Data |
Financial Statements and Supplementary Data consist of the consolidated financial statements as indexed and presented below and the Unaudited Quarterly Financial Data presented in Part II, Item 7. of this Report
43
Management’s Statement of Responsibility
Management is responsible for preparation of the consolidated financial statements and related financial information contained in all sections of this annual report, including the determination of amounts that must necessarily be based on judgments and estimates. It is the belief of management that the consolidated financial statements have been prepared in conformity with accounting principles generally accepted in the United States of America.
Management establishes and monitors the Company’s system of internal accounting controls to meet its responsibility for reliable financial statements. The system is designed to provide reasonable assurance that assets are safeguarded, and that transactions are executed in accordance with management’s authorization and are properly recorded.
The Audit/Examining Committee of the board of directors, composed solely of outside directors, meets periodically and privately with management, internal auditors, and independent registered public accounting firm, KPMG LLP, to review matters relating to the quality of financial reporting, internal accounting control, and the nature, extent, and results of audit efforts. The independent registered public accounting firm and internal auditors have unlimited access to the Audit/Examining Committee to discuss all such matters. The consolidated financial statements have been audited by KPMG, LLP for the purpose of expressing an opinion on the consolidated financial statements. In addition, KPMG, LLP has audited internal control over financial reporting.
|
|
|
|
|
|
|
|
Date: March 12, 2010 |
|
|
|
|
|
|
|
Stephen S. Romaine |
|
Francis M. Fetsko |
|
|
Chief Executive Officer |
|
Chief Financial Officer |
|


44
Report of Independent Registered Public Accounting Firm
The Board of Directors and
Shareholders
Tompkins Financial Corporation:
We have audited the accompanying consolidated statements of condition of Tompkins Financial Corporation and subsidiaries (the Company) as of December 31, 2009 and 2008, and the related consolidated statements of income, changes in shareholders’ equity, and cash flows for each of the years in the three-year period ended December 31, 2009. These consolidated financial statements are the responsibility of the Company’s management. Our responsibility is to express an opinion on these consolidated financial statements based on our audits.
We conducted our audits in accordance with the standards of the Public Company Accounting Oversight Board (United States). Those standards require that we plan and perform the audit to obtain reasonable assurance about whether the financial statements are free of material misstatement. An audit includes examining, on a test basis, evidence supporting the amounts and disclosures in the financial statements. An audit also includes assessing the accounting principles used and significant estimates made by management, as well as evaluating the overall financial statement presentation. We believe that our audits provide a reasonable basis for our opinion.
In our opinion, the consolidated financial statements referred to above present fairly, in all material respects, the financial position of Tompkins Financial Corporation and subsidiaries as of December 31, 2009 and 2008, and the results of their operations and their cash flows for each of the years in the three-year period ended December 31, 2009, in conformity with U.S. generally accepted accounting principles.
We also have audited, in accordance with the standards of the Public Company Accounting Oversight Board (United States), Tompkins Financial Corporation and subsidiaries’ internal control over financial reporting as of December 31, 2009, based on criteria established in Internal Control – Integrated Framework issued by the Committee of Sponsoring Organizations of the Treadway Commission (COSO), and our report dated March 12, 2010 expressed an unqualified opinion on the effectiveness of the Company's internal control over financial reporting.

Syracuse, New York
March 12, 2010
45
Report of Independent Registered Public Accounting Firm
The Board of Directors and
Shareholders
Tompkins Financial Corporation:
We have audited Tompkins Financial Corporation and subsidiaries’ (the Company) internal control over financial reporting as of December 31, 2009, based on criteria established in Internal Control-Integrated Framework issued by the Committee of Sponsoring Organizations of the Treadway Commission (COSO). The Company’s management is responsible for maintaining effective internal control over financial reporting and for its assessment of the effectiveness of internal control over financial reporting, included in the accompanying Management’s Annual Report on Internal Control over Financial Reporting. Our responsibility is to express an opinion on the Company’s internal control over financial reporting based on our audit.
We conducted our audit in accordance with the standards of the Public Company Accounting Oversight Board (United States). Those standards require that we plan and perform the audit to obtain reasonable assurance about whether effective internal control over financial reporting was maintained in all material respects. Our audit included obtaining an understanding of internal control over financial reporting, assessing the risk that a material weakness exists, and testing and evaluating the design and operating effectiveness of internal control based on the assessed risk. Our audit also included performing such other procedures as we considered necessary in the circumstances. We believe that our audit provides a reasonable basis for our opinion.
A company’s internal control over financial reporting is a process designed to provide reasonable assurance regarding the reliability of financial reporting and the preparation of financial statements for external purposes in accordance with generally accepted accounting principles. A company’s internal control over financial reporting includes those policies and procedures that (1) pertain to the maintenance of records that, in reasonable detail, accurately and fairly reflect the transactions and dispositions of the assets of the company; (2) provide reasonable assurance that transactions are recorded as necessary to permit preparation of financial statements in accordance with generally accepted accounting principles, and that receipts and expenditures of the company are being made only in accordance with authorizations of management and the directors of the company; and (3) provide reasonable assurance regarding prevention or timely detection of unauthorized acquisition, use, or disposition of the company’s assets that could have a material effect on the financial statements.
Because of its inherent limitations, internal control over financial reporting may not prevent or detect misstatements. Also, projections of any evaluation of effectiveness to future periods are subject to the risk that controls may become inadequate because of changes in conditions, or that the degree of compliance with the policies or procedures may deteriorate.
In our opinion, the Company maintained, in all material respects, effective internal control over financial reporting as of December 31, 2009, based on criteria established in Internal Control-Integrated Framework issued by the Committee of Sponsoring Organizations of the Treadway Commission (COSO).
We have also audited, in accordance with the standards of the Public Company Accounting Oversight Board (United States), the consolidated statements of condition of Tompkins Financial Corporation and subsidiaries as of December 31, 2009 and 2008, and the related consolidated statements of income, changes in shareholders’ equity, and cash flows for each of the years in the three-year period ended December 31, 2009, and our report dated March 12, 2010 expressed an unqualified opinion on those consolidated financial statements.
Syracuse, New York
March 12, 2010
46
Consolidated Statements of Condition
|
|
|
|
|
|
|
|
|
|
|
|
As of December 31 |
|
||||
|
(in thousands except share and per share data) |
|
2009 |
|
2008 |
|
||
|
ASSETS |
|
|
|
|
|
|
|
|
|
|
|
|
|
|
|
|
|
Cash and noninterest bearing balances due from banks |
|
$ |
43,686 |
|
$ |
48,133 |
|
|
Interest bearing balances due from banks |
|
|
1,676 |
|
|
4,116 |
|
|
Money market funds |
|
|
100 |
|
|
100 |
|
|
Cash and Cash Equivalents |
|
|
45,462 |
|
|
52,349 |
|
|
|
|
|
|
|
|
|
|
|
Trading securities, at fair value |
|
|
31,718 |
|
|
38,101 |
|
|
Available-for-sale securities, at fair value |
|
|
928,770 |
|
|
741,219 |
|
|
Held-to-maturity securities, fair value of $46,340 at December 31, 2009, and $55,064 at December 31, 2008 |
|
|
44,825 |
|
|
54,453 |
|
|
Loans and leases, net of unearned income and deferred costs and fees |
|
|
1,914,818 |
|
|
1,817,531 |
|
|
Less: Allowance for loan and lease losses |
|
|
24,350 |
|
|
18,672 |
|
|
Net Loans and Leases |
|
|
1,890,468 |
|
|
1,798,859 |
|
|
|
|
|
|
|
|
|
|
|
Federal Home Loan Bank and Federal Reserve Bank stock |
|
|
20,041 |
|
|
22,874 |
|
|
Bank premises and equipment, net |
|
|
46,650 |
|
|
46,613 |
|
|
Corporate owned life insurance |
|
|
35,953 |
|
|
34,804 |
|
|
Goodwill |
|
|
41,589 |
|
|
41,479 |
|
|
Other intangible assets |
|
|
4,864 |
|
|
5,299 |
|
|
Accrued interest and other assets |
|
|
62,920 |
|
|
31,672 |
|
|
Total Assets |
|
$ |
3,153,260 |
|
$ |
2,867,722 |
|
|
|
|
|
|
|
|
|
|
|
LIABILITIES |
|
|
|
|
|
|
|
|
|
|
|
|
|
|
|
|
|
Deposits: |
|
|
|
|
|
|
|
|
Interest bearing: |
|
|
|
|
|
|
|
|
Checking, savings, and money market |
|
$ |
1,183,145 |
|
$ |
980,011 |
|
|
Time |
|
|
794,738 |
|
|
703,107 |
|
|
Noninterest bearing |
|
|
461,981 |
|
|
450,889 |
|
|
Total Deposits |
|
|
2,439,864 |
|
|
2,134,007 |
|
|
|
|
|
|
|
|
|
|
|
Federal funds purchased and securities sold under agreement to repurchase ($5,500 valued at fair value at December 31, 2009 and $16,170 valued at fair value at December 31, 2008) |
|
|
192,784 |
|
|
196,304 |
|
|
Other borrowings ($11,335 valued at fair value at December 31, 2009 and $12,179 valued at fair value at December 31, 2008) |
|
|
208,965 |
|
|
274,791 |
|
|
Trust preferred debentures |
|
|
25,056 |
|
|
3,888 |
|
|
Other liabilities |
|
|
41,583 |
|
|
39,371 |
|
|
Total Liabilities |
|
|
2,908,252 |
|
|
2,648,361 |
|
|
|
|
|
|
|
|
|
|
|
Equity |
|
|
|
|
|
|
|
|
Tompkins Financial Corporation shareholders’ equity: |
|
|
|
|
|
|
|
|
|
|
|
|
|
|
|
|
|
Common stock – par value $0.10 per share: Authorized 25,000,000 shares; Issued: 9,785,265 shares at December 31, 2009, and 9,727,418 shares at December 31, 2008 |
|
|
978 |
|
|
973 |
|
|
Additional paid-in capital |
|
|
155,589 |
|
|
152,842 |
|
|
Retained earnings |
|
|
92,402 |
|
|
73,779 |
|
|
Accumulated other comprehensive loss |
|
|
(3,087 |
) |
|
(7,602 |
) |
|
Treasury stock at cost- 81,723 shares at December 31, 2009, and 76,881 shares at December 31, 2008 |
|
|
(2,326 |
) |
|
(2,083 |
) |
|
Total Tompkins Financial Corporation Shareholders’ Equity |
|
$ |
243,556 |
|
$ |
217,909 |
|
|
Noncontrolling Interest |
|
|
1,452 |
|
|
1,452 |
|
|
Total Equity |
|
$ |
245,008 |
|
$ |
219,361 |
|
|
Total Liabilities and Equity |
|
$ |
3,153,260 |
|
$ |
2,867,722 |
|
See notes to consolidated financial statements.
47
|
|
|
|
|
|
|
|
|
|
|
|
|
|
|
Year ended December 31 |
|
|||||||
|
(in thousands except per share data) |
|
2009 |
|
2008 |
|
2007 |
|
|||
|
INTEREST AND DIVIDEND INCOME |
|
|
|
|
|
|
|
|
|
|
|
Loans |
|
$ |
107,452 |
|
$ |
102,840 |
|
$ |
97,418 |
|
|
Due from banks |
|
|
27 |
|
|
133 |
|
|
217 |
|
|
Federal funds sold |
|
|
15 |
|
|
115 |
|
|
217 |
|
|
Money market funds |
|
|
36 |
|
|
246 |
|
|
0 |
|
|
Trading securities |
|
|
1,362 |
|
|
1,923 |
|
|
2,762 |
|
|
Available-for-sale securities |
|
|
35,196 |
|
|
32,561 |
|
|
28,763 |
|
|
Held-to-maturity securities |
|
|
1,814 |
|
|
1,891 |
|
|
2,054 |
|
|
Other |
|
|
893 |
|
|
1,074 |
|
|
1,010 |
|
|
Total Interest and Dividend Income |
|
|
146,795 |
|
|
140,783 |
|
|
132,441 |
|
|
INTEREST EXPENSE |
|
|
|
|
|
|
|
|
|
|
|
Time certificates of deposit of $100,000 or more |
|
|
5,442 |
|
|
9,039 |
|
|
14,750 |
|
|
Other deposits |
|
|
18,769 |
|
|
25,489 |
|
|
30,735 |
|
|
Federal funds purchased and securities sold under agreements to repurchase |
|
|
6,254 |
|
|
7,496 |
|
|
8,125 |
|
|
Other borrowings |
|
|
8,206 |
|
|
8,216 |
|
|
4,802 |
|
|
Trust preferred debentures |
|
|
1,087 |
|
|
153 |
|
|
0 |
|
|
Total Interest Expense |
|
|
39,758 |
|
|
50,393 |
|
|
58,412 |
|
|
Net Interest Income |
|
|
107,037 |
|
|
90,390 |
|
|
74,029 |
|
|
Less: Provision for Loan/Lease Losses |
|
|
9,288 |
|
|
5,428 |
|
|
1,529 |
|
|
Net Interest Income After Provision for Loan/Lease Losses |
|
|
97,749 |
|
|
84,962 |
|
|
72,500 |
|
|
NONINTEREST INCOME |
|
|
|
|
|
|
|
|
|
|
|
Investment services income |
|
|
13,328 |
|
|
14,179 |
|
|
14,446 |
|
|
Insurance commissions and fees |
|
|
12,307 |
|
|
11,607 |
|
|
11,046 |
|
|
Service charges on deposit accounts |
|
|
9,312 |
|
|
10,192 |
|
|
10,401 |
|
|
Card services income |
|
|
3,664 |
|
|
3,338 |
|
|
3,453 |
|
|
Mark-to-market gain on trading securities |
|
|
204 |
|
|
811 |
|
|
612 |
|
|
Mark-to-market gain (loss) on liabilities held at fair value |
|
|
1,263 |
|
|
(2,001 |
) |
|
(1,348 |
) |
|
Gain on VISA stock redemption |
|
|
0 |
|
|
1,639 |
|
|
0 |
|
|
Other income |
|
|
5,933 |
|
|
5,793 |
|
|
5,055 |
|
|
Net other than temporary impairment losses (1) |
|
|
(146 |
) |
|
0 |
|
|
0 |
|
|
Net gain on sale of available-for-sale securities |
|
|
348 |
|
|
477 |
|
|
384 |
|
|
Total Noninterest Income |
|
|
46,213 |
|
|
46,035 |
|
|
44,049 |
|
|
NONINTEREST EXPENSES |
|
|
|
|
|
|
|
|
|
|
|
Salaries and wages |
|
|
40,459 |
|
|
40,140 |
|
|
35,225 |
|
|
Pension and other employee benefits |
|
|
13,367 |
|
|
10,307 |
|
|
9,986 |
|
|
Net occupancy expense of bank premises |
|
|
7,135 |
|
|
6,839 |
|
|
6,046 |
|
|
Furniture and fixture expense |
|
|
4,462 |
|
|
4,197 |
|
|
3,866 |
|
|
FDIC insurance |
|
|
4,976 |
|
|
933 |
|
|
206 |
|
|
Amortization of intangible assets |
|
|
915 |
|
|
906 |
|
|
653 |
|
|
Other operating expenses |
|
|
25,303 |
|
|
23,734 |
|
|
22,074 |
|
|
Total Noninterest Expenses |
|
|
96,617 |
|
|
87,056 |
|
|
78,056 |
|
|
Income Before Income Tax Expense |
|
|
47,345 |
|
|
43,941 |
|
|
38,493 |
|
|
Income Tax Expense |
|
|
15,383 |
|
|
13,810 |
|
|
11,991 |
|
|
Net Income Attributable to Noncontrolling Interests and |
|
|
|
|
|
|
|
|
|
|
|
Tompkins Financial Corporation |
|
|
31,962 |
|
|
30,131 |
|
|
26,502 |
|
|
Less: Net Income Attributable to Noncontrolling Interest |
|
|
131 |
|
|
297 |
|
|
131 |
|
|
Net Income Attributable to Tompkins Financial Corporation |
|
$ |
31,831 |
|
$ |
29,834 |
|
$ |
26,371 |
|
|
Basic earnings per share (2) |
|
$ |
2.98 |
|
$ |
2.81 |
|
$ |
2.47 |
|
|
Diluted earnings per share (2) |
|
$ |
2.96 |
|
$ |
2.78 |
|
$ |
2.45 |
|
|
|
|
|
|
|
(1) |
In 2009, $1.78 million of gross other-than-temporary impairment losses on debt securities available for sale were recognized, of which $1.63 million, were recognized in accumulated other comprehensive loss, net of tax. |
|
|
|
|
|
|
(2) |
Per share data has been retroactively adjusted to reflect a 10% stock dividend paid on February 15, 2010. |
See notes to consolidated financial statements.
48
|
|
|
|
|
|
|
|
|
|
|
|
|
|
Year ended December 31 |
|
||||||||
|
(in thousands) |
|
2009 |
|
2008 |
|
2007 |
|
|||
|
OPERATING ACTIVITIES |
|
|
|
|
|
|
|
|
|
|
|
Net income attributable to Tompkins Financial Corporation |
|
$ |
31,831 |
|
$ |
29,834 |
|
$ |
26,371 |
|
|
Adjustments to reconcile net income attributable to Tompkins Financial Corporation to net cash provided by operating activities: |
|
|
|
|
|
|
|
|
|
|
|
Provision for loan/lease losses |
|
|
9,288 |
|
|
5,428 |
|
|
1,529 |
|
|
Depreciation and amortization premises, equipment, and software |
|
|
4,484 |
|
|
4,670 |
|
|
4,334 |
|
|
Amortization of intangible assets |
|
|
915 |
|
|
906 |
|
|
653 |
|
|
Earnings from corporate owned life insurance, net |
|
|
(1,090 |
) |
|
(1,448 |
) |
|
(1,122 |
) |
|
Net amortization on securities |
|
|
1,878 |
|
|
1,326 |
|
|
1,443 |
|
|
Other-than-temporary impairment loss |
|
|
146 |
|
|
0 |
|
|
0 |
|
|
Mark-to-market gain on trading securities, net |
|
|
(204 |
) |
|
(811 |
) |
|
(612 |
) |
|
Mark-to-market (gain) loss on liabilities held at fair value |
|
|
(1,263 |
) |
|
2,001 |
|
|
1,348 |
|
|
Deferred income tax (benefit) expense |
|
|
(1,854 |
) |
|
1,124 |
|
|
(1,529 |
) |
|
Net gain on sale of securities |
|
|
(348 |
) |
|
(477 |
) |
|
(384 |
) |
|
Net gain on sale of loans |
|
|
(1,357 |
) |
|
(105 |
) |
|
(159 |
) |
|
Proceeds from sale of loans |
|
|
90,357 |
|
|
11,453 |
|
|
10,906 |
|
|
Loans originated for sale |
|
|
(90,206 |
) |
|
(11,010 |
) |
|
(11,059 |
) |
|
Net loss (gain) on sale of bank premises and equipment |
|
|
7 |
|
|
(52 |
) |
|
27 |
|
|
Stock-based compensation expense |
|
|
938 |
|
|
931 |
|
|
713 |
|
|
Increase in interest receivable |
|
|
(139 |
) |
|
(257 |
) |
|
(203 |
) |
|
Decrease in interest payable |
|
|
(799 |
) |
|
(1,108 |
) |
|
(399 |
) |
|
Proceeds from sales of trading securities |
|
|
0 |
|
|
479 |
|
|
61,912 |
|
|
Purchases of trading securities |
|
|
0 |
|
|
(3,998 |
) |
|
(72,300 |
) |
|
Proceeds from payments/maturities of trading securities |
|
|
6,315 |
|
|
26,007 |
|
|
14,034 |
|
|
Contribution to pension plan |
|
|
0 |
|
|
(10,000 |
) |
|
0 |
|
|
Increase in FDIC prepaid insurance |
|
|
(11,423 |
) |
|
0 |
|
|
0 |
|
|
Other, net |
|
|
(13,612 |
) |
|
6,638 |
|
|
2,070 |
|
|
Net Cash Provided by Operating Activities |
|
|
23,864 |
|
|
61,531 |
|
|
37,573 |
|
|
INVESTING ACTIVITIES |
|
|
|
|
|
|
|
|
|
|
|
Proceeds from maturities of available-for-sale securities |
|
|
303,700 |
|
|
225,873 |
|
|
125,292 |
|
|
Proceeds from sales of available-for-sale securities |
|
|
32,510 |
|
|
62,571 |
|
|
61,714 |
|
|
Proceeds from maturities of held-to-maturity securities |
|
|
21,506 |
|
|
12,511 |
|
|
16,961 |
|
|
Purchases of available-for-sale securities |
|
|
(519,902 |
) |
|
(351,666 |
) |
|
(221,357 |
) |
|
Purchases of held-to-maturity securities |
|
|
(11,930 |
) |
|
(17,447 |
) |
|
(7,622 |
) |
|
Net increase in loans/leases |
|
|
(99,691 |
) |
|
(229,428 |
) |
|
(114,762 |
) |
|
Net decrease (increase) in Federal Home Loan Bank and Federal Reserve Bank stock |
|
|
2,833 |
|
|
(4,536 |
) |
|
(6,004 |
) |
|
Proceeds from sales of bank premises and equipment |
|
|
53 |
|
|
119 |
|
|
134 |
|
|
Purchase of bank premises and equipment |
|
|
(5,165 |
) |
|
(2,771 |
) |
|
(5,548 |
) |
|
Purchase of corporate owned life insurance |
|
|
0 |
|
|
0 |
|
|
(3,000 |
) |
|
Net cash provided by (used in) acquisitions |
|
|
0 |
|
|
12,176 |
|
|
(314 |
) |
|
Other, net |
|
|
(1,875 |
) |
|
(103 |
) |
|
(43 |
) |
|
Net Cash Used in Investing Activities |
|
|
(277,961 |
) |
|
(292,701 |
) |
|
(154,549 |
) |
|
FINANCING ACTIVITIES |
|
|
|
|
|
|
|
|
|
|
|
Net increase in demand, money market, and savings deposits |
|
|
214,226 |
|
|
177,350 |
|
|
95,486 |
|
|
Net increase (decrease) in time deposits |
|
|
91,631 |
|
|
6,794 |
|
|
(84,080 |
) |
|
Net (decrease) increase in securities sold under agreements to repurchase and Federal funds purchased |
|
|
(3,102 |
) |
|
240 |
|
|
3,404 |
|
|
Increase in other borrowings |
|
|
11,000 |
|
|
145,200 |
|
|
208,100 |
|
|
Repayment of other borrowings |
|
|
(75,981 |
) |
|
(82,655 |
) |
|
(83,974 |
) |
|
Cash dividends |
|
|
(13,208 |
) |
|
(12,728 |
) |
|
(12,023 |
) |
|
Proceeds from issuance of trust preferred debentures, net of issuance cost |
|
|
21,073 |
|
|
0 |
|
|
0 |
|
|
Shares issued for dividend reinvestment plans |
|
|
631 |
|
|
0 |
|
|
0 |
|
|
Repurchase of common stock |
|
|
(178 |
) |
|
(58 |
) |
|
(12,914 |
) |
|
Redemption of preferred stock |
|
|
0 |
|
|
(4,524 |
) |
|
0 |
|
|
Net proceeds from exercise of stock options |
|
|
955 |
|
|
3,354 |
|
|
611 |
|
|
Tax benefit from stock option exercises |
|
|
163 |
|
|
587 |
|
|
51 |
|
|
Net Cash Provided by Financing Activities |
|
|
247,210 |
|
|
233,560 |
|
|
114,661 |
|
|
Net (decrease) increase in cash and cash equivalents |
|
|
(6,887 |
) |
|
2,390 |
|
|
(2,315 |
) |
|
Cash and cash equivalents at beginning of year |
|
|
52,349 |
|
|
49,959 |
|
|
52,274 |
|
|
Cash and Cash Equivalents at End of Year |
|
$ |
45,462 |
|
$ |
52,349 |
|
$ |
49,959 |
|
49
|
|
|
|
|
|
|
|
|
|
|
|
|
SUPPLEMENTAL CASH FLOW INFORMATION: |
|
|
|
|
|
|
|
|
|
|
|
Cash paid during the year for - Interest |
|
$ |
40,558 |
|
$ |
51,501 |
|
$ |
58,811 |
|
|
Cash paid during the year for - Income taxes |
|
|
28,117 |
|
|
9,872 |
|
|
9,802 |
|
|
Non-cash investing and financing activities: |
|
|
|
|
|
|
|
|
|
|
|
Fair value of non-cash assets other than goodwill acquired in purchase acquisitions |
|
|
0 |
|
|
208,101 |
|
|
9 |
|
|
Fair value of liabilities assumed in purchase acquisitions |
|
|
0 |
|
|
238,737 |
|
|
0 |
|
|
Goodwill related to acquisitions |
|
|
0 |
|
|
18,585 |
|
|
1,659 |
|
|
Fair value of shares issued for acquisitions |
|
|
0 |
|
|
0 |
|
|
701 |
|
|
Transfer of available-for-sale securities to trading securities with adoption of fair value option |
|
|
0 |
|
|
0 |
|
|
63,383 |
|
See notes to consolidated financial statements.
50
Consolidated Statements of Changes in Shareholders’ Equity
|
|
|
|
|
|
|
|
|
|
|
|
|
|
|
|
|
|
|
|
|
|
|
|
|
(in thousands except share and per share data) |
|
Common |
|
Additional |
|
Retained |
|
Accumulated |
|
Treasury |
|
Noncontrolling |
|
Total |
|
|||||||
|
BALANCES AT DECEMBER 31, 2006 |
|
$ |
989 |
|
$ |
158,203 |
|
$ |
44,429 |
|
$ |
(12,487 |
) |
$ |
(1,514 |
) |
$ |
1,452 |
|
$ |
191,072 |
|
|
Comprehensive income: |
|
|
|
|
|
|
|
|
|
|
|
|
|
|
|
|
|
|
|
|
|
|
|
Net income attributable to noncontrolling interest and Tompkins Financial Corporation |
|
|
|
|
|
|
|
|
26,371 |
|
|
|
|
|
|
|
|
131 |
|
|
26,502 |
|
|
Other comprehensive income |
|
|
|
|
|
|
|
|
|
|
|
4,065 |
|
|
|
|
|
|
|
|
4,065 |
|
|
|
|
|
|
|
|
|
|
|
|
|
|
|
|
|
|
|
|
|
|
|||
|
Total Comprehensive Income |
|
|
|
|
|
|
|
|
|
|
|
|
|
|
|
|
|
|
|
|
30,567 |
|
|
|
|
|
|
|
|
|
|
|
|
|
|
|
|
|
|
|
|
|
|
|||
|
Cash dividends ($1.13 per share) |
|
|
|
|
|
|
|
|
(12,023 |
) |
|
|
|
|
|
|
|
|
|
|
(12,023 |
) |
|
Exercise of stock options, and related tax benefit (34,495 shares, net) |
|
|
4 |
|
|
658 |
|
|
|
|
|
|
|
|
|
|
|
|
|
|
662 |
|
|
Common stock repurchased and returned to unissued status (332,347 shares) |
|
|
(33 |
) |
|
(12,881 |
) |
|
|
|
|
|
|
|
|
|
|
|
|
|
(12,914 |
) |
|
Stock issued for purchase acquisition (23,713 shares) |
|
|
2 |
|
|
699 |
|
|
|
|
|
|
|
|
|
|
|
|
|
|
701 |
|
|
Directors deferred compensation plan (6,748 shares) |
|
|
|
|
|
265 |
|
|
|
|
|
|
|
|
(265 |
) |
|
|
|
|
0 |
|
|
Cumulative effect adjustment – adoption of SFAS 159 |
|
|
|
|
|
|
|
|
(1,522 |
) |
|
1,522 |
|
|
|
|
|
|
|
|
0 |
|
|
Stock-based compensation expense |
|
|
|
|
|
713 |
|
|
|
|
|
|
|
|
|
|
|
|
|
|
713 |
|
|
Dividend to minority interest holders |
|
|
|
|
|
|
|
|
|
|
|
|
|
|
|
|
|
(131 |
) |
|
(131 |
) |
|
BALANCES AT DECEMBER 31, 2007 |
|
$ |
962 |
|
$ |
147,657 |
|
$ |
57,255 |
|
$ |
(6,900 |
) |
$ |
(1,779 |
) |
$ |
1,452 |
|
$ |
198,647 |
|
|
Comprehensive income: |
|
|
|
|
|
|
|
|
|
|
|
|
|
|
|
|
|
|
|
|
|
|
|
Net income attributable to noncontrolling interest and Tompkins Financial Corporation |
|
|
|
|
|
|
|
|
29,834 |
|
|
|
|
|
|
|
|
297 |
|
|
30,131 |
|
|
Other comprehensive income |
|
|
|
|
|
|
|
|
|
|
|
(702 |
) |
|
|
|
|
|
|
|
(702 |
) |
|
|
|
|
|
|
|
|
|
|
|
|
|
|
|
|
|
|
|
|
|
|||
|
Total Comprehensive Income |
|
|
|
|
|
|
|
|
|
|
|
|
|
|
|
|
|
|
|
|
29,429 |
|
|
|
|
|
|
|
|
|
|
|
|
|
|
|
|
|
|
|
|
|
|
|||
|
Cash dividends ($1.20 per share) |
|
|
|
|
|
|
|
|
(12,728 |
) |
|
|
|
|
|
|
|
|
|
|
(12,728 |
) |
|
Exercise of stock options and related tax benefit (116,236 shares, net) |
|
|
12 |
|
|
3,929 |
|
|
|
|
|
|
|
|
|
|
|
|
|
|
3,941 |
|
|
Common stock repurchased and returned to Unissued status (1,500 shares) |
|
|
|
|
|
(58 |
) |
|
|
|
|
|
|
|
|
|
|
|
|
|
(58 |
) |
|
Reduction in shares issued for purchase acquisition (2,748 shares) |
|
|
(1 |
) |
|
79 |
|
|
|
|
|
|
|
|
|
|
|
|
|
|
78 |
|
|
Directors deferred compensation plan (5,985 shares) |
|
|
|
|
|
304 |
|
|
|
|
|
|
|
|
(304 |
) |
|
|
|
|
0 |
|
|
Cumulative effect adjustment – adoption of EITF 06-4 |
|
|
|
|
|
|
|
|
(582 |
) |
|
|
|
|
|
|
|
|
|
|
(582 |
) |
|
Stock-based compensation expense |
|
|
|
|
|
931 |
|
|
|
|
|
|
|
|
|
|
|
|
|
|
931 |
|
|
Noncontrolling interest acquired in connection with Sleepy Hollow Bancorp, Inc. |
|
|
|
|
|
|
|
|
|
|
|
|
|
|
|
|
|
4,443 |
|
|
4,443 |
|
|
Repayment of noncontrolling interest acquired in connection with Sleepy Hollow Bancorp, Inc. |
|
|
|
|
|
|
|
|
|
|
|
|
|
|
|
|
|
(4,443 |
) |
|
(4,443 |
) |
|
Dividend to minority interest holders |
|
|
|
|
|
|
|
|
|
|
|
|
|
|
|
|
|
(297 |
) |
|
(297 |
) |
|
BALANCES AT DECEMBER 31, 2008 |
|
$ |
973 |
|
$ |
152,842 |
|
$ |
73,779 |
|
$ |
(7,602 |
) |
$ |
(2,083 |
) |
$ |
1,452 |
|
$ |
219,361 |
|
|
Comprehensive income: |
|
|
|
|
|
|
|
|
|
|
|
|
|
|
|
|
|
|
|
|
|
|
|
Net income attributable to noncontrolling interest and Tompkins Financial Corporation |
|
|
|
|
|
|
|
|
31,831 |
|
|
|
|
|
|
|
|
131 |
|
|
31,962 |
|
|
Other comprehensive income |
|
|
|
|
|
|
|
|
|
|
|
4,515 |
|
|
|
|
|
|
|
|
4,515 |
|
|
|
|
|
|
|
|
|
|
|
|
|
|
|
|
|
|
|
|
|
|
|||
|
Total Comprehensive Income |
|
|
|
|
|
|
|
|
|
|
|
|
|
|
|
|
|
|
|
|
36,477 |
|
|
|
|
|
|
|
|
|
|
|
|
|
|
|
|
|
|
|
|
|
|
|||
|
Cash dividends ($1.24 per share) |
|
|
|
|
|
|
|
|
(13,208 |
) |
|
|
|
|
|
|
|
|
|
|
(13,208 |
) |
|
Exercise of stock options and related tax benefit (34,393 shares, net) |
|
|
3 |
|
|
1,115 |
|
|
|
|
|
|
|
|
|
|
|
|
|
|
1,118 |
|
|
Common stock repurchased and returned to unissued status (5,000 shares) |
|
|
(1 |
) |
|
(177 |
) |
|
|
|
|
|
|
|
|
|
|
|
|
|
(178 |
) |
|
Stock-based compensation expense |
|
|
|
|
|
938 |
|
|
|
|
|
|
|
|
|
|
|
|
|
|
938 |
|
|
Shares issued for dividend reinvestment plan (15,554 shares) |
|
|
2 |
|
|
629 |
|
|
|
|
|
|
|
|
|
|
|
|
|
|
631 |
|
|
Directors deferred compensation plan (4,842 shares) |
|
|
|
|
|
243 |
|
|
|
|
|
|
|
|
(243 |
) |
|
|
|
|
0 |
|
|
Net shares issued related restricted stock awards (12,900 shares) |
|
|
1 |
|
|
(1 |
) |
|
|
|
|
|
|
|
|
|
|
|
|
|
0 |
|
|
Dividend to minority interest holders |
|
|
|
|
|
|
|
|
|
|
|
|
|
|
|
|
|
(131 |
) |
|
(131 |
) |
|
BALANCES AT DECEMBER 31, 2009 |
|
$ |
978 |
|
$ |
155,589 |
|
$ |
92,402 |
|
$ |
(3,087 |
) |
$ |
(2,326 |
) |
$ |
1,452 |
|
$ |
245,008 |
|
Per share data has been retroactively adjusted to reflect a 10% stock dividend paid on February 15, 2010.
See notes to consolidated financial statements.
51
Note 1 Summary of Significant Accounting Policies
BASIS OF PRESENTATION: Tompkins Financial Corporation (“Tompkins” or “the Company”) is a registered Financial Holding Company with the Federal Reserve Board pursuant to the Bank Holding Company Act of 1956, as amended, organized under the laws of New York State, and is the parent company of Tompkins Trust Company (the “Trust Company”), The Bank of Castile, The Mahopac National Bank (“Mahopac National Bank”), Tompkins Insurance Agencies, Inc. (“Tompkins Insurance”) and AM&M Financial Services, Inc. (“AM&M”). Unless the context otherwise requires, the term “Company” refers to Tompkins Financial Corporation and its subsidiaries.
The consolidated financial information included herein combines the results of operations, the assets, liabilities, and shareholders’ equity (including comprehensive income or loss) of the Company and all entities in which the Company has a controlling financial interest. All significant intercompany balances and transactions are eliminated in consolidation.
The Company determines whether it has a controlling financial interest in an entity by first evaluating whether the entity is a voting interest entity or a variable interest entity under U.S. accounting principles generally accepted. Voting interest entities are entities in which the total equity investment at risk is sufficient to enable the entity to finance itself independently and provides the equity holders with the obligation to absorb losses, the right to receive residual returns and the right to make decisions about the entity’s activities. The Company consolidates voting interest entities in which it has all, or at least a majority of, the voting interest. As defined in applicable accounting standards, variable interest entities (VIEs) are entities that lack one or more of the characteristics of a voting interest entity. A controlling financial interest in an entity is present when an enterprise has a variable interest, or a combination of variable interests, that will absorb a majority of the entity’s expected losses, receive a majority of the entity’s expected residual returns, or both. The enterprise with a controlling financial interest, known as the primary beneficiary, consolidates the VIE. The Company’s wholly owned subsidiaries, Tompkins Capital Trust I and Sleepy Hollow Capital Trust I, are VIE’s for which the Company is not the primary beneficiary. Accordingly, the accounts of these entities are not included in the Company’s consolidated financial statements.
The consolidated financial statements have been prepared in accordance with U.S. generally accepted accounting principles. In preparing the financial statements, management is required to make estimates and assumptions that affect the reported amounts of assets and liabilities, and disclose contingent assets and liabilities, at the date of the financial statements and the reported amounts of revenue and expense during the reporting period. Actual results could differ from those estimates. Significant items subject to such estimates and assumptions include the allowance for loan and lease losses, valuation of intangible assets, deferred income tax assets, other-than-temporary impairment on investments, and obligations related to employee benefits. Amounts in the prior years’ consolidated financial statements are reclassified when necessary to conform to the current year’s presentation.
The Company has evaluated subsequent events for potential recognition and/or disclosure through March 12, 2010, the date the consolidated financial statements included in this Annual Report on Form 10-K were issued.
CASH EQUIVALENTS: Cash equivalents in the Consolidated Statements of Cash Flows include cash and noninterest bearing balances due from banks, interest-bearing balances due from banks, Federal funds sold, and money market funds. Management regularly evaluates the credit risk associated with the counterparties to these transactions and believes that the Company is not exposed to any significant credit risk on cash and cash equivalents. Each bank subsidiary is required to maintain reserve balances by the Federal Reserve Bank of New York. At December 31, 2009, and December 31, 2008 the reserve requirements for the Company’s banking subsidiaries totaled $3,704,000 and $5,995,000, respectively.
SECURITIES: Management determines the appropriate classification of debt and equity securities at the time of purchase. Securities are classified as held-to-maturity when the Company has the positive intent and ability to hold the securities to maturity. Held-to-maturity securities are stated at amortized cost. Debt securities not classified as held-to-maturity and marketable equity securities are classified as either available-for-sale or trading. Available-for-sale securities are stated at fair value with the unrealized gains and losses, net of tax, excluded from earnings and reported as a separate component of accumulated comprehensive income or loss, in shareholders’ equity. Trading securities are stated at fair value, with unrealized gains or losses included in earnings.
Securities with limited marketability or restricted equity securities, such as Federal Home Loan Bank stock and Federal Reserve Bank stock, are carried at cost.
Premiums and discounts are amortized or accreted over the expected life of the related security as an adjustment to yield using the interest method. Dividend and interest income are recognized when earned. Realized gains and losses on the sale of securities are included in securities gains (losses). The cost of securities sold is based on the specific identification method.
At least quarterly, the Company reviews its investment portfolio to identify any securities where there is other-than-temporary impairment. In cases where fair value is less than amortized cost and the Company intends to sell a debt security, it is more likely than not to be required to sell a debt security before recovery of its amortized cost basis, or the Company does not expect to recover the entire amortized cost basis of a debt security, an other-than-temporary impairment is considered to have occurred. If the Company intends to sell the debt security or more likely than not will be required to sell the security before recovery of its amortized cost basis, the other-than-temporary impairment is recognized in earnings equal to the entire difference between the debt security’s amortized cost basis and its fair value at the balance sheet date. If the Company does not expect to recover the entire amortized cost basis of the security, the Company does not intend to sell the security and it is not more likely than not that the Company will be required to sell the security before recovery of its amortized cost basis, the other-than-temporary impairment is separated into (a) the amount representing the credit loss and (b) the amount related to all other factors. The amount of
52
Note 1 Summary of Significant Accounting Policies (continued)
the other-than-temporary impairment related to the credit loss is recognized in earnings while the amount related to other factors is recognized in other comprehensive income, net of applicable taxes. Subsequently, the Company accounts for the other-than-temporarily impaired debt security as if the security had been purchased on the measurement date of the other-than-temporary impairment at an amortized cost basis equal to the previous amortized cost basis less the other-than-temporary impairment recognized in earnings. The cost basis of individual equity securities is written down to estimated fair value through a charge to earnings when declines in value below cost are considered to be other than temporary. Realized gains and losses on the sales of investment securities are determined using the specific identification method.
LOANS AND LEASES: Loans are reported at their principal outstanding balance, net of deferred loan origination fees and costs, and unearned income. The Company has the ability and intent to hold its loans for the foreseeable future, except for certain residential real estate loans held-for-sale. The Company provides motor vehicle and equipment financing to its customers through direct financing leases. These leases are carried at the aggregate of lease payments receivable, plus estimated residual values, less unearned income. Unearned income on direct financing leases is amortized over the lease terms, resulting in a level rate of return.
Interest income on loans is accrued and credited to income based upon the principal amount outstanding. Loan origination fees and costs are deferred and recognized over the life of the loan as an adjustment to yield.
Residential real estate loans originated and intended for sale in the secondary market are carried at the lower of aggregate cost or estimated fair value. Fair value is determined on the basis of the rates quoted in the secondary market. Net unrealized losses attributable to changes in market interest rates are recognized through a valuation allowance by charges to income. Loans are generally sold on a non-recourse basis with servicing retained. Any gain or loss on the sale of loans is recognized at the time of sale as the difference between the recorded basis in the loan and the net proceeds from the sale. The Company may use commitments at the time loans are originated or identified for sale to mitigate interest rate risk. The commitments to sell loans are considered derivatives under ASC Topic 815. The impact of the estimated fair value adjustment was not significant to the consolidated financial statements.
The Company accounts for impaired loans under FASB ASC Topic 310, Receivables (“ASC Topic 310”), which requires that impaired loans, except for large groups of smaller-balance homogeneous loans, be measured based on either the present value of expected future cash flows discounted at the loan’s effective interest rate, the loan’s observable market price or the fair value of the collateral (less costs to sell) if the loan is collateral dependent. If the measurement of the impaired loan is less than the recorded investment in the loan, an impairment reserve is recognized as part of the allowance for loan losses.
The Company applies the provisions of ASC Topic 310 to all impaired commercial and commercial real estate loans over $250,000 and to all loans restructured in a troubled debt restructuring. Allowances for loan losses for the remaining loans are recognized in accordance with ASC Topic 450, Contingencies (“ASC Topic 450”). Management considers a loan to be impaired if, based on current information, it is probable that the Company will be unable to collect all scheduled payments of principal or interest when due, according to the contractual terms of the loan agreement. When a loan is considered to be impaired, the amount of the impairment is measured based on the present value of expected future cash flows discounted at the effective interest rate of the loan or, as a practical expedient, at the observable market price or the fair value of collateral (less costs to sell) if the loan is collateral dependent. Management excludes large groups of smaller balance homogeneous loans such as residential mortgages, consumer loans, and leases, which are collectively evaluated.
Loans are considered to have been modified in a troubled debt restructuring (“TDR”) when due to a borrower’s financial difficulties, the Company makes certain concessions to the borrower that it would not otherwise consider. Modifications may include interest rate reductions, principal or interest forgiveness, forbearance, and other actions intended to minimize economic loss and to avoid foreclosure or repossession of collateral. Generally, a nonaccrual loan that has been modified in a TDR remains on non-accrual status for a period of six months to demonstrate that the borrower is able to meet the terms of the modified loan. However, performance prior to the modification, or significant events that coincide with the modification, are included in assessing whether the borrower can meet the new terms and may result in the loan being returned to accrual status at the time of loan modification or after a shorter performance period. If the borrower’s ability to meet the revised payment schedule is uncertain, the loan remains on nonaccrual status.
ALLOWANCE FOR LOAN AND LEASE LOSSES: Management regularly reviews the allowance for loan and lease losses in order to maintain the allowance at a level consistent with the inherent risk of loss in the loan and lease portfolios. The Company has developed a methodology to measure the amount of estimated loan loss exposure inherent in the loan portfolio to ensure that an adequate allowance is maintained. The methodology includes an estimate of exposure for the following: specifically reviewed and graded loans; historical loss experience by product type; past due and nonperforming loans; and other internal and external factors such as local and regional economic conditions, growth trends, collateral values, and credit policy and underwriting standards. The methodology includes a review of loans considered impaired in accordance with ASC Topic 310. In addition, other commercial loans and commercial mortgage loans are evaluated using an internal rating system. An estimated exposure amount is assigned to these internally reviewed credits based upon a review of the borrower’s financial condition, payment history, collateral adequacy, business conditions, and historical loss experience. For commercial loans and commercial mortgage loans not specifically reviewed, and for homogenous loan portfolios such as residential mortgage loans and consumer loans, estimated exposure amounts are assigned based upon historical loss experience as well as past due status. Lastly, additional allowances are maintained based upon management judgment and assessment of other quantitative and qualitative factors such as regional and local economic conditions, portfolio growth trends, new lending products, and new market areas.
53
Note 1 Summary of Significant Accounting Policies (continued)
Since the methodology is based upon historical experience and trends as well as management’s judgment, factors may arise that result in different estimations. Significant factors that could give rise to changes in these estimates may include, but are not limited to, changes in economic conditions in the local area, concentration of risk, and declines in local property values. In addition, various Federal and State regulatory agencies, as part of their examination process, review the Company’s allowance and may require the Company to recognize additions to the allowance based on their judgments about information available to them at the time of their examination which may not be currently available to management.
INCOME RECOGNITION ON IMPAIRED AND NONACCRUAL LOANS AND LEASES: Loans and leases, including impaired loans, are generally classified as nonaccrual if they are past due as to maturity or payment of principal or interest for a period of more than 90 days, unless such loans are well secured and in the process of collection. Loans that are past due less than 90 days may also be classified as nonaccrual if repayment in full of principal or interest is in doubt.
Loans may be returned to accrual status when all principal and interest amounts contractually due (including arrearages) are reasonably assured of repayment within an acceptable time period, and there is a sustained period of repayment performance by the borrower in accordance with the contractual terms of the loan agreement. Payments received on loans carried as nonaccrual are generally applied as a reduction to the outstanding balance on the Company’s books. When the future collectibility of the recorded loan balance is expected, interest income may be recognized on a cash basis.
OTHER REAL ESTATE OWNED: Other real estate owned consists of properties formerly pledged as collateral to loans, which have been acquired by the Company through foreclosure proceedings or acceptance of a deed in lieu of foreclosure. Upon transfer of a loan to foreclosure status, an appraisal is obtained and any excess of the loan balance over the fair value, less estimated costs to sell, is charged against the allowance for loan/lease losses. Expenses and subsequent adjustments to the fair value are treated as other operating expense.
PREMISES AND EQUIPMENT: Land is carried at cost. Premises and equipment are stated at cost, less allowances for depreciation. The provision for depreciation for financial reporting purposes is computed generally by the straight-line method at rates sufficient to write-off the cost of such assets over their estimated useful lives. Buildings are amortized over a period of 10-39 years, and furniture, fixtures, and equipment are amortized over a period of 2-20 years. Maintenance and repairs are charged to expense as incurred. Gains or losses on disposition are reflected in earnings.
INCOME TAXES: Deferred tax assets and liabilities are recognized for the future tax consequences attributable to differences between the financial statement carrying amounts of existing assets and liabilities and their respective tax bases. Deferred tax assets and liabilities are measured using enacted tax rates expected to apply to taxable income in the years in which those temporary differences are expected to be recovered or settled. The effect on deferred tax assets and liabilities of a change in tax rates is recognized in income in the period that includes the enactment date. Deferred taxes are reviewed quarterly and reduced by a valuation allowance if, based upon the information available, it is more likely than not that some or all of the deferred tax assets will not be realized. Realization of deferred tax assets is dependent upon the generation of a sufficient level of future taxable income and recoverable taxes paid in prior years. Although realization is not assured, management believes it is more likely than not that all of the deferred tax assets will be realized. The Company’s policy is to recognize interest and penalties on unrecognized tax benefits in income tax expense in the Consolidated Statements of Income.
GOODWILL: Goodwill represents the excess of purchase price over the fair value of assets acquired in a transaction using purchase accounting. The Company tests goodwill for impairment at least annually.
OTHER INTANGIBLE ASSETS: Other intangible assets include core deposit intangibles, customer related intangibles, covenants not to compete, and mortgage servicing rights. Core deposit intangibles represent a premium paid to acquire a base of stable, low cost deposits in the acquisition of a bank, or a bank branch, using purchase accounting. The amortization period for core deposit intangible ranges from 5 years to 10 years, using an accelerated method. The covenants not to compete are amortized on a straight-line basis over 3 to 6 years, while the customer related intangible is amortized on an accelerated basis over a range of 6 to 15 years. The amortization period is monitored to determine if circumstances require such periods to be revised. The Company periodically reviews its intangible assets for changes in circumstances that may indicate the carrying amount of the asset is impaired. The Company tests its intangible assets for impairment on an annual basis or more frequently if conditions indicate that an impairment loss has more likely than not been incurred.
SECURITIES SOLD UNDER AGREEMENTS TO REPURCHASE: Securities sold under agreements to repurchase (repurchase agreements) are agreements in which the Company transfers the underlying securities to a third-party custodian’s account that explicitly recognizes the Company’s interest in the securities. The agreements are accounted for as secured financing transactions provided the Company maintains effective control over the transferred securities and meets other criteria as specified in FASB ASC Topic 860, Transfers and Servicing (“ASC Topic 860”). The Company’s agreements are accounted for as secured financings; accordingly, the transaction proceeds are reflected as liabilities and the securities underlying the agreements continue to be carried in the Company’s securities portfolio.
Under FASB ASC Topic 825, Financial Instruments (“ASC Topic 825”) the Company elected to account for certain repurchase agreements at fair value, with unrealized gains or losses included in earnings.
TREASURY STOCK: The cost of treasury stock is shown on the Consolidated Statements of Condition as a separate component of shareholders’ equity, and is a reduction to total shareholders’ equity. Shares are released from treasury at fair value, identified on an average cost basis.
54
Note 1 Summary of Significant Accounting Policies (continued)
TRUST AND INVESTMENT SERVICES: Assets held in fiduciary or agency capacities for customers are not included in the accompanying Consolidated Statements of Condition, since such items are not assets of the Company. Fees associated with providing trust and investment services are included in noninterest income.
EARNINGS PER SHARE: Basic earnings per share is calculated by dividing net income available to common shareholders by the weighted average number of shares outstanding during the year. Diluted earnings per share is calculated by dividing net income available to common shareholders by the weighted average number of shares outstanding during the year plus the dilutive effect of stock issuable upon conversion of common stock equivalents (primarily stock options) or certain other contingencies.
SEGMENT REPORTING: The Company has identified two business segments, banking and financial services. Financial services activities consist of the results of the Company’s trust, financial planning and wealth management, broker-dealer, and risk management operations. All other activities are considered banking.
COMPREHENSIVE INCOME: For the Company, comprehensive income represents net income plus the net change in unrealized gains or losses on securities available-for-sale for the period (net of taxes), and the actuarial gain or loss and amortization of unrealized amounts in the Company’s defined-benefit retirement and pension plan, supplemental employee retirement plan, and post-retirement life and healthcare benefit plan (net of taxes), and is presented in the Consolidated Statements of Changes in Shareholders’ Equity. Accumulated other comprehensive income (loss) represents the net unrealized gains or losses on securities available-for-sale (net of tax) and unrecognized net actuarial gain or loss, unrecognized prior service costs, and unrecognized net initial obligation (net of tax) in the Company’s defined-benefit retirement and pension plan, supplemental employee retirement plan, and post-retirement life and healthcare benefit plan.
PENSION AND OTHER EMPLOYEE BENEFITS: The Company incurs certain employment-related expenses associated with its noncontributory defined-benefit pension plan, supplemental employee retirement plan and post-retirement healthcare benefit plan. In order to measure the expense associated with these plans, various assumptions are made including the discount rate used to value certain liabilities, expected return on plan assets, anticipated mortality rates, and expected future healthcare costs. The assumptions are based on historical experience as well as current facts and circumstances. A third-party actuarial firm is used to assist management in measuring the expense and liability associated with the plans. The Company uses a December 31 measurement date for its plans. As of the measurement date, plan assets are determined based on fair value, generally representing observable market prices. The projected benefit obligation is primarily determined based on the present value of projected benefit distributions at an assumed discount rate.
Periodic pension expense or credits include service costs, interest costs based on the assumed discount rate, the expected return on plan assets based on actuarially derived market-related values, and amortization of actuarial gains or losses. Periodic postretirement benefit expense or credits include service costs, interest costs based on the assumed discount rate, amortization of unrecognized net transition obligations, and recognized actuarial gains or losses.
STOCK BASED COMPENSATION: Under FASB ASC Topic 718, Compensation - Stock Compensation (“ASC Topic 718”), compensation costs recognized include: (a) the compensation cost for all share-based payments granted prior to, but not yet vested as of January 1, 2006, based upon the grant date fair value estimated in accordance with the provisions of ASC Topic 718, and (b) the compensation cost for all share-based payments granted subsequent to January 1, 2006, based on the grant date fair value estimated. Compensation cost is recorded on a straight-line basis over the vesting period of the awards.
The Company’s stock-based employee compensation plan is described in Note 14 “Stock Plans and Stock Based Compensation”, of this Report.
FAIR VALUE MEASUREMENTS: On January 1, 2007, the Company adopted the provisions of FASB ASC Topic 820, Fair Value Measurements and Disclosures (“ASC Topic 820”), for financial assets and financial liabilities. ASC Topic 820 defines fair value, establishes a framework for measuring fair value in generally accepted accounting principles, and expands disclosures about fair value measurements. See Note 19 – “Fair Value Measurements”.
In general, fair values of financial instruments are based upon quoted market prices, where available. If such quoted market prices are not available, fair value is based upon internally developed models that primarily use, as inputs, observable market-based parameters. Valuation adjustments may be made to ensure that financial instruments are recorded at fair value. These adjustments may include amounts to reflect counterparty credit quality and the Company’s creditworthiness, among other things, as well as unobservable parameters. Any such valuation adjustments are applied consistently over time.
ENDORSEMENT SPLIT-DOLLAR LIFE INSURANCE: On January 1, 2008, the Company adopted FASB ASC Topic 718 Compensation – Retirement Benefits (“ASC Topic 718”). With the adoption, the Company recognized a cumulative-effect adjustment to retained earnings totaling $582,000 related to accounting for certain endorsement split-dollar life insurance arrangements.
55
Note 1 Summary of Significant Accounting Policies (continued)
RECENT ACCOUNTING PRONOUNCEMENTS
The Financial Accounting Standards Board’s (“FASB”) Accounting Standards Codification (“ASC”) became effective on July 1, 2009. At that date, the ASC became FASB’s officially recognized source of authoritative U.S. generally accepted accounting principles (“GAAP”) applicable to all public and non-public non-governmental entities, superseding existing FASB, American Institute of Certified Public Accountants, Emerging Issues Task Force (“EITF”) and related literature. Rules and interpretive releases of the SEC under the authority of federal securities laws are also sources of authoritative GAAP for SEC registrants. All other accounting literature is considered non-authoritative. The switch to the ASC affects how companies refer to U.S. GAAP in financial statements and accounting policies. Citing particular content in the ASC involves specifying the unique numeric path to the content through the Topic, Subtopic, Section and Paragraph structure. The Company adopted this accounting standard as of September 30, 2009. The adoption of this accounting standard, which was subsequently codified into ASC Topic 105, Generally Accepted Accounting Principles, did not have an impact on the Company’s consolidated financial statements.
FASB ASC Topic 260, Earnings Per Share (“ASC Topic 260”). On January 1, 2009, the Company adopted new authoritative accounting guidance under ASC Topic 260, which provides that unvested share-based payment awards that contain nonforfeitable rights to dividends or dividend equivalents (whether paid or unpaid) are participating securities and shall be included in the computation of earnings per share pursuant to the two-class method. The Company’s adoption of this guidance did not have a material impact on the Company’s consolidated financial statements.
FASB ASC Topic 320, Investments - Debt and Equity Securities (“ASC Topic 320”). New authoritative accounting guidance under ASC Topic 320 (i) changes existing guidance for determining whether an impairment is other than temporary to debt securities and (ii) replaces the existing requirement that the entity’s management assert it has both the intent and ability to hold an impaired security until recovery with a requirement that management assert: (a) it does not have the intent to sell the security; and (b) it is more likely than not it will not have to sell the security before recovery of its cost basis. Under ASC Topic 320, declines in the fair value of held-to-maturity and available-for-sale securities below their cost that are deemed to be other than temporary are reflected in earnings as realized losses to the extent the impairment is related to credit losses. The amount of the impairment related to other factors is recognized in other comprehensive income. The Company’s adoption of the provisions of the new authoritative accounting guidance under ASC Topic 320 during the second quarter of 2009 did not have a material impact on the Company’s consolidated financial statements. See Note 3 – “Securities” for details on the Company’s impairment analysis of debt securities.
FASB ASC Topic 715, Compensation - Retirement Benefits (“ASC Topic 715”). New authoritative accounting guidance under ASC Topic 715 provides guidance related to an employer’s disclosures about plan assets of defined benefit pension or other post-retirement benefit plans. Under ASC Topic 715, disclosures should provide users of financial statements with an understanding of how investment allocation decisions are made, the factors that are pertinent to an understanding of investment policies and strategies, the major categories of plan assets, the inputs and valuation techniques used to measure the fair value of plan assets, the effect of fair value measurements using significant unobservable inputs on changes in plan assets for the period and significant concentrations of risk within plan assets. The disclosures required by ASC Topic 715 will be included in the Company’s financial statements beginning with the financial statements for the year ended December 31, 2009.
FASB ASC Topic 805, Business Combinations (“ASC Topic 805”). On January 1, 2009, new authoritative accounting guidance under ASC Topic 805 became applicable to the accounting for business combinations closing on or after January 1, 2009. ASC Topic 805 applies to all transactions and other events in which one entity obtains control over one or more other businesses. ASC Topic 805 requires an acquirer, upon initially obtaining control of another entity, to recognize the assets, liabilities and any non-controlling interest in the acquiree at fair value as of the acquisition date. Contingent consideration is required to be recognized and measured at fair value on the date of acquisition rather than at a later date when the amount of that consideration may be determinable beyond a reasonable doubt. This fair value approach replaces the cost-allocation process required under previous accounting guidance whereby the cost of an acquisition was allocated to the individual assets acquired and liabilities assumed based on their estimated fair value. ASC Topic 805 requires acquirers to expense acquisition-related costs as incurred rather than allocating such costs to the assets acquired and liabilities assumed, as was previously the case under prior accounting guidance. Assets acquired and liabilities assumed in a business combination that arise from contingencies are to be recognized at fair value if fair value can be reasonably estimated. If fair value of such an asset or liability cannot be reasonably estimated, the asset or liability would generally be recognized in accordance with FASB ASC Topic 450, Contingencies (“ASC Topic 450”). Under ASC Topic 805, the requirements of FASB ASC Topic 420, Exit or Disposal Cost Obligations, would have to be met in order to accrue for a restructuring plan in purchase accounting. Pre-acquisition contingencies are to be recognized at fair value, unless it is a non-contractual contingency that is not likely to materialize, in which case, nothing should be recognized in purchase accounting and, instead, that contingency would be subject to the probable and estimable recognition criteria of ASC Topic 450. The requirements of ASC Topic 805 will apply prospectively to any future business combinations closing on or after January 1, 2009. As of December 31, 2009, the adoption of this standard did not have an impact on the Company’s financial statements. However, the adoption of this standard will have a significant impact on how the Company accounts for acquisitions, if any, prospectively.
56
Note 1 Summary of Significant Accounting Policies (continued)
FASB ASC Topic 810, Consolidation (“ASC Topic 810”). New authoritative accounting guidance under ASC Topic 810 amended prior guidance to establish accounting and reporting standards for the non-controlling interest in a subsidiary and for the deconsolidation of a subsidiary. Under ASC Topic 810, a non-controlling interest in a subsidiary, which is sometimes referred to as minority interest, is an ownership interest in the consolidated entity that should be reported as a component of equity in the consolidated financial statements. Among other requirements, ASC Topic 810 requires consolidated net income to be reported at amounts that include the amounts attributable to both the parent and the non-controlling interest. It also requires disclosure, on the face of the consolidated income statement, of the amounts of consolidated net income attributable to the parent and to the non-controlling interest. The new authoritative accounting guidance under ASC Topic 810 became effective on January 1, 2009 and did not have a significant impact on the Company’s consolidated financial statements.
Further new authoritative accounting guidance under ASC Topic 810 amends prior guidance to change how a company determines when an entity that is insufficiently capitalized or is not controlled through voting (or similar rights) should be consolidated. The determination of whether a company is required to consolidate an entity is based on, among other things, an entity’s purpose and design and a company’s ability to direct the activities of the entity that most significantly impact the entity’s economic performance. The new authoritative accounting guidance requires additional disclosures about the reporting entity’s involvement with variable-interest entities and any significant changes in risk exposure due to that involvement as well as its affect on the entity’s financial statements. The new authoritative accounting guidance under ASC Topic 810 will be effective January 1, 2010 and is not expected to have a significant impact on the Company’s consolidated financial statements.
FASB ASC Topic 815, Derivatives and Hedging (“ASC Topic 815”). New authoritative accounting guidance under ASC Topic 815 amends prior guidance to amend and expand the disclosure requirements for derivatives and hedging activities to provide greater transparency about (i) how and why an entity uses derivative instruments, (ii) how derivative instruments and related hedge items are accounted for under ASC Topic 815, and (iii) how derivative instruments and related hedged items affect an entity’s financial position, results of operations and cash flows. To meet those objectives, the new authoritative accounting guidance requires qualitative disclosures about objectives and strategies for using derivatives, quantitative disclosures about fair value amounts of gains and losses on derivative instruments and disclosures about credit-risk-related contingent features in derivative agreements. The new authoritative accounting guidance under ASC Topic 815 became effective on January 1, 2009 and did not have a significant impact on the Company’s consolidated financial statements.
FASB ASC Topic 820, Fair Value Measurements and Disclosures (“ASC Topic 820”). New authoritative accounting guidance under ASC Topic 820 affirms that the objective of fair value when the market for an asset is not active is the price that would be received to sell the asset in an orderly transaction, and clarifies and includes additional factors for determining whether there has been a significant decrease in market activity for an asset when the market for that asset is not active. ASC Topic 820 requires an entity to base its conclusion about whether a transaction was not orderly on the weight of the evidence. The new accounting guidance amended prior guidance to expand certain disclosure requirements. The Company’s adoption of the new authoritative accounting guidance under ASC Topic 820 during the second quarter of 2009 did not significantly impact the Company’s consolidated financial statements.
Further new authoritative accounting guidance (Accounting Standards Update No. 2009-5) under ASC Topic 820 provides guidance for measuring the fair value of a liability in circumstances in which a quoted price in an active market for the identical liability is not available. In such instances, a reporting entity is required to measure fair value utilizing a valuation technique that uses (i) the quoted price of the identical liability when traded as an asset, (ii) quoted prices for similar liabilities or similar liabilities when traded as assets, or (iii) another valuation technique that is consistent with the existing principles of ASC Topic 820, such as an income approach or market approach. The new authoritative accounting guidance also clarifies that when estimating the fair value of a liability, a reporting entity is not required to include a separate input or adjustment to other inputs relating to the existence of a restriction that prevents the transfer of the liability. The new authoritative accounting guidance under ASC Topic 820 was effective for the Company’s financial statements for fiscal years beginning after October 1, 2009 and did not have a significant impact on the Company’s consolidated financial statements.
FASB ASC Topic 825, Financial Instruments (“ASC Topic 825”). New authoritative accounting guidance under ASC Topic 825 requires an entity to provide disclosures about the fair value of financial instruments in interim financial information and amends prior guidance to require those disclosures in summarized financial information at interim reporting periods. The interim disclosures required under Topic 825 are included in Note 19- “Fair Value Measurements”.
FASB ASC Topic 855, Subsequent Events (“ASC Topic 855”). New authoritative accounting guidance under ASC Topic 855 establishes general standards of accounting for and disclosure of events that occur after the balance sheet date but before financial statements are issued or available to be issued. ASC Topic 855 defines (i) the period after the balance sheet date during which a reporting entity’s management should evaluate events or transactions that may occur for potential recognition or disclosure in the financial statements, (ii) the circumstances under which an entity should recognize events or transactions occurring after the balance sheet date in its financial statements, and (iii) the disclosures an entity should make about events or transactions that occurred after the balance sheet date. The new authoritative accounting guidance under ASC Topic 855 became effective for the Company’s financial statements for periods ending after June 15, 2009 and did not have a significant impact on the Company’s consolidated financial statements.
57
Note 1 Summary of Significant Accounting Policies (continued)
FASB ASC Topic 860, Transfers and Servicing, (“ASC Topic 860”). New authoritative accounting guidance under ASC Topic 860 amends prior accounting guidance to enhance reporting about transfers of financial assets, including securitizations, and where companies have continuing exposure to the risks related to transferred financial assets. The new authoritative accounting guidance eliminates the concept of a “qualifying special-purpose entity” and changes the requirements for derecognizing financial assets. The new authoritative accounting guidance also requires additional disclosures about all continuing involvements with transferred financial assets including information about gains and losses resulting from transfers during the period. The new authoritative accounting guidance under ASC Topic 860 will be effective January 1, 2010 and is not expected to have a significant impact on the Company’s financial statements.
Note 2 Mergers and Acquisitions
The acquisitions discussed below were accounted for as purchase transactions. The purchase price was allocated to the underlying assets and liabilities based on estimated fair values at the date of acquisition. The operating results of the acquired companies are included in the Company’s results of operations since their respective dates of acquisition.
On May 9, 2008, the Company acquired Sleepy Hollow Bancorp, Inc., (“Sleepy Hollow”), a privately held bank holding company located in Sleepy Hollow, New York. The outstanding shares of common stock of Sleepy Hollow were cancelled and exchanged for the right to receive the per-share cash merger consideration totaling $30.2 million. The total cost of the Sleepy Hollow acquisition was approximately $30.5 million, including acquisition related costs of approximately $234,000. Sleepy Hollow Bank, the wholly-owned subsidiary of Sleepy Hollow, was merged into Mahopac National Bank.
The transaction resulted in intangible assets of $21.1 million, including goodwill of $18.4 million, core deposit intangibles of $2.4 million, and a covenant-not-to-compete of $313,000. The core deposit intangible asset is being amortized over 10 years using an accelerated method. The covenant-not-to-compete is being amortized over 3 years. The goodwill is not being amortized but will be evaluated at least annually for impairment. Goodwill is not deductible for taxes. The results of operations of Sleepy Hollow are included in the Company’s consolidated earnings commencing on May 9, 2008.
On May 1, 2008, AM&M acquired the stock of Robert G. Relph Comprehensive Brokerage Services, Inc., a local insurance agency engaged in the provision of insurance brokerage services, in a cash transaction. The transaction resulted in goodwill of $234,000, customer related intangibles of $68,000 and a covenant-not-to-compete of $12,000. The customer related intangibles and covenant-not-to-compete are being amortized over 15 years and 5 years, respectively. Additional merger consideration of $23,000 was paid in 2009 as certain criteria was met, and recorded as part of goodwill.
On September 28, 2007, AM&M acquired the assets of Francis M. Celona, CPA, P.C., a local accounting and financial services company in Honeoye Falls, New York, in a cash transaction. The transaction resulted in initial goodwill of $47,000, customer related intangibles of $56,000 and a covenant-not-to-compete of $6,000. The customer related intangibles and covenant-not-to-compete are being amortized over 15 years and 5 years, respectively. In addition to the merger consideration paid at closing, additional contingent amounts of up to $180,000 may be paid over a period of three years from closing, depending on certain criteria being met. Additional payments of $60,000 and $58,000 were made in 2009 and 2008, respectively, and recorded as part of goodwill.
On September 1, 2007, Tompkins Insurance acquired Flint-Farrell Insurance Agency, an insurance agency in Amherst, New York, in a cash transaction. The transaction resulted in goodwill of $110,000, customer related intangibles of $58,000 and a covenant-not-to-compete of $24,000. The customer related intangibles and covenant-not-to-compete are being amortized over 15 and 5 years, respectively. Goodwill was increased by $18,000 in 2008 as the requirements for contingent consideration were met.
On January 6, 2006, the Company completed its acquisition of AM&M Financial Services, Inc. (“AM&M”), a fee-based financial planning firm headquartered in Pittsford, New York. Under the terms of the Agreement and Plan of Merger dated November 21, 2005 by and between the Company and AM&M, the Company acquired all of the issued and outstanding shares of AM&M stock for an initial merger consideration of $2,375,000 in cash and 59,377 shares of Tompkins common stock. The transaction resulted in intangible assets of $4.7 million, including goodwill of $3.7 million, customer related intangible of $968,000, and a covenant-not-to-compete of $108,000. The customer related intangible and the covenant-not-to-compete are being amortized over 15 years and 5 years, respectively.
In addition to the merger consideration paid at closing, additional contingent amounts of up to $8.5 million (payable one-half in cash and one-half in Tompkins common stock) may be paid over a period of four years from closing, depending on the operating results of AM&M. There was no provision for contingent consideration in 2008. Operating results for AM&M in 2007 and 2006 resulted in additional consideration, which was recorded as goodwill at the time of payment, under the criteria established by SFAS No. 141. The amount of additional goodwill recorded in 2007 and 2006 were $1.5 million and $2.2 million, respectively. In 2008, the Company adjusted the goodwill recorded at year-end 2007 related to the contingent consideration by $79,000.
58
Note 3 Securities
Available-for-Sale Securities
The following summarizes available-for-sale securities held by the Company:
|
|
|
|
|
|
|
|
|
|
|
|
|
|
|
|
|
|
|
|
|
Available-for-Sale Securities |
|
|||||||
|
December 31, 2009 (in thousands) |
|
Amortized |
|
Gross |
|
Gross |
|
Fair |
|
||||
|
U.S. Treasury securities |
|
$ |
1,991 |
|
$ |
88 |
|
$ |
0 |
|
$ |
2,079 |
|
|
Obligations of U.S. Government sponsored entities |
|
|
377,920 |
|
|
3,369 |
|
|
2,274 |
|
|
379,015 |
|
|
Obligations of U.S. states and political subdivisions |
|
|
61,176 |
|
|
2,537 |
|
|
18 |
|
|
63,695 |
|
|
Mortgage-backed securities – residential |
|
|
461,677 |
|
|
18,211 |
|
|
2,207 |
|
|
477,681 |
|
|
U.S. corporate debt securities |
|
|
5,032 |
|
|
104 |
|
|
0 |
|
|
5,136 |
|
|
Total debt securities |
|
|
907,796 |
|
|
24,309 |
|
|
4,499 |
|
|
927,606 |
|
|
Equity securities |
|
|
1,164 |
|
|
0 |
|
|
0 |
|
|
1,164 |
|
|
Total available-for-sale securities |
|
$ |
908,960 |
|
$ |
24,309 |
|
$ |
4,499 |
|
$ |
928,770 |
|
|
|
|
|
|
|
|
|
|
|
|
|
|
|
|
|
|
|
|
|
|
Available-for-Sale Securities |
|
|||||||
|
December 31, 2008 (in thousands) |
|
Amortized |
|
Gross |
|
Gross |
|
Fair |
|
||||
|
U.S. Treasury securities |
|
$ |
3,102 |
|
$ |
161 |
|
$ |
0 |
|
$ |
3,263 |
|
|
Obligations of U.S. Government sponsored entities |
|
|
191,435 |
|
|
4,913 |
|
|
86 |
|
|
196,262 |
|
|
Obligations of U.S. states and political subdivisions |
|
|
63,158 |
|
|
721 |
|
|
325 |
|
|
63,554 |
|
|
Mortgage-backed securities – residential |
|
|
465,612 |
|
|
11,323 |
|
|
2,964 |
|
|
473,971 |
|
|
U.S. corporate debt securities |
|
|
2,500 |
|
|
0 |
|
|
0 |
|
|
2,500 |
|
|
Total debt securities |
|
|
725,807 |
|
|
17,118 |
|
|
3,375 |
|
|
739,550 |
|
|
Equity securities |
|
|
1,669 |
|
|
0 |
|
|
0 |
|
|
1,669 |
|
|
Total available-for-sale securities |
|
$ |
727,476 |
|
$ |
17,118 |
|
$ |
3,375 |
|
$ |
741,219 |
|
Equity securities include miscellaneous investments carried at fair value, which approximates cost.
Substantially all of the above mortgage-backed securities are residential direct pass through securities or collateralized mortgage obligations issued or backed by Federal sponsored entities. Available-for-sale mortgage-backed securities also include non-agency issue mortgage-backed securities, which totaled $12.7 million (amortized cost) at December 31, 2009, and $17.3 million (amortized cost) at December 31, 2008.
Held-to-Maturity Securities
The following summarizes held-to-maturity securities held by the Company:
|
|
|
|
|
|
|
|
|
|
|
|
|
|
|
|
|
|
|
|
|
Held-to-Maturity Securities |
|
|||||||
|
December 31, 2009 (in thousands) |
|
Amortized |
|
Gross |
|
Gross |
|
Fair |
|
||||
|
Obligations of U.S. states and political subdivisions |
|
$ |
44,825 |
|
$ |
1,570 |
|
$ |
55 |
|
$ |
46,340 |
|
|
Total held-to-maturity debt securities |
|
$ |
44,825 |
|
$ |
1,570 |
|
$ |
55 |
|
$ |
46,340 |
|
59
Note 3 Securities (continued)
|
|
|
|
|
|
|
|
|
|
|
|
|
|
|
|
|
|
|
|
|
Held-to-Maturity Securities |
|
|||||||
|
December 31, 2008 (in thousands) |
|
Amortized |
|
Gross |
|
Gross |
|
Fair |
|
||||
|
Obligations of U.S. states and political subdivisions |
|
$ |
54,453 |
|
$ |
829 |
|
$ |
218 |
|
$ |
55,064 |
|
|
Total held-to-maturity debt securities |
|
$ |
54,453 |
|
$ |
829 |
|
$ |
218 |
|
$ |
55,064 |
|
Realized gains on available-for-sale securities were $411,000 in 2009, $547,000 in 2008 and $423,000 in 2007; realized losses on available-for-sale securities were $63,000 in 2009, $70,000 in 2008, and $39,000 in 2007.
The following table summarizes available-for-sale and held-to-maturity securities that had unrealized losses at December 31, 2009 and December 31, 2008, segregated according to the length of time the securities had been in a continuous unrealized loss position.
December 31, 2009
|
|
|
|
|
|
|
|
|
|
|
|
|
|
|
|
|
|
|
|
|
|
Available-for-Sale Securities |
|
Less than 12 Months |
|
12 Months or Longer |
|
Total |
|
||||||||||||
|
(in thousands) |
|
Fair Value |
|
Unrealized |
|
Fair Value |
|
Unrealized |
|
Fair Value |
|
Unrealized |
|
||||||
|
Obligations of U.S. Government sponsored entities |
|
$ |
188,529 |
|
$ |
2,274 |
|
$ |
0 |
|
$ |
0 |
|
$ |
188,529 |
|
$ |
2,274 |
|
|
Obligations of U.S. states and political subdivisions |
|
|
1,679 |
|
|
18 |
|
|
0 |
|
|
0 |
|
|
1,679 |
|
|
18 |
|
|
Mortgage-backed securities – residential |
|
|
35,979 |
|
|
612 |
|
|
16,202 |
|
|
1,595 |
|
|
52,181 |
|
|
2,207 |
|
|
Total available-for-sale securities |
|
$ |
226,187 |
|
$ |
2,904 |
|
$ |
16,202 |
|
$ |
1,595 |
|
$ |
242,389 |
|
$ |
4,499 |
|
|
|
|
|
|
|
|
|
|
|
|
|
|
|
|
|
|
|
|
|
|
|
Held-to-Maturity Securities |
|
Less than 12 Months |
|
12 Months or Longer |
|
Total |
|
||||||||||||
|
(in thousands) |
|
Fair Value |
|
Unrealized |
|
Fair Value |
|
Unrealized |
|
Fair Value |
|
Unrealized |
|
||||||
|
Obligations of U.S. states and political subdivisions |
|
$ |
1,099 |
|
$ |
45 |
|
$ |
320 |
|
$ |
10 |
|
$ |
1,419 |
|
$ |
55 |
|
|
Total held-to-maturity securities |
|
$ |
1,099 |
|
$ |
45 |
|
$ |
320 |
|
$ |
10 |
|
$ |
1,419 |
|
$ |
55 |
|
December 31, 2008
|
|
|
|
|
|
|
|
|
|
|
|
|
|
|
|
|
|
|
|
|
|
Available-for-Sale Securities |
|
Less than 12 Months |
|
12 Months or Longer |
|
Total |
|
||||||||||||
|
(in thousands) |
|
Fair Value |
|
Unrealized |
|
Fair Value |
|
Unrealized |
|
Fair Value |
|
Unrealized |
|
||||||
|
Obligations of U.S. Government sponsored entities |
|
$ |
7,267 |
|
$ |
86 |
|
$ |
0 |
|
$ |
0 |
|
$ |
7,267 |
|
$ |
86 |
|
|
Obligations of U.S. states and political subdivisions |
|
|
18,872 |
|
|
320 |
|
$ |
105 |
|
$ |
5 |
|
$ |
18,977 |
|
$ |
325 |
|
|
Mortgage-backed securities – residential |
|
|
22,801 |
|
|
2,683 |
|
|
10,010 |
|
|
281 |
|
|
32,811 |
|
|
2,964 |
|
|
Total securities |
|
$ |
48,940 |
|
$ |
3,089 |
|
$ |
10,115 |
|
$ |
286 |
|
$ |
59,055 |
|
$ |
3,375 |
|
60
Note 3 Securities (continued)
|
|
|
|
|
|
|
|
|
|
|
|
|
|
|
|
|
|
|
|
|
|
Held-to-Maturity Securities |
|
Less than 12 Months |
|
12 Months or Longer |
|
Total |
|
||||||||||||
|
(in thousands) |
|
Fair Value |
|
Unrealized |
|
Fair Value |
|
Unrealized |
|
Fair Value |
|
Unrealized |
|
||||||
|
Obligations of U.S. states and political subdivisions |
|
$ |
13,350 |
|
$ |
189 |
|
$ |
326 |
|
$ |
29 |
|
$ |
13,676 |
|
$ |
218 |
|
|
Total held-to-maturity securities |
|
$ |
13,350 |
|
$ |
189 |
|
$ |
326 |
|
$ |
29 |
|
$ |
13,676 |
|
$ |
218 |
|
The gross unrealized losses reported for mortgage-backed securities-residential relate to investment securities issued by U.S. government sponsored enterprises such as Federal National Mortgage Association and Federal Home Loan Mortgage Corporation, U.S. government agencies such as Government National Mortgage Association, and non-agencies. Total gross unrealized losses were primarily attributable to changes in interest rates and levels of market liquidity, relative to when the investment securities were purchased, and not due to the credit quality of the investment securities.
The Company does not intend to sell the investment securities that are in an unrealized loss position and it is not more-likely-than not that the Company will be required to sell the investment securities, before recovery of their amortized cost basis, which may be at maturity. Accordingly, as of December 31, 2009, and December 31, 2008, management believes the unrealized losses detailed in the tables above are not other-than-temporary.
Ongoing Assessment of Other-Than-Temporary Impairment
On a quarterly basis, the Company performs an assessment to determine whether there have been any events or economic circumstances indicating that a security with an unrealized loss has suffered other-than-temporary impairment. A debt security is considered impaired if the fair value is less than its amortized cost basis at the reporting date. If impaired, the Company then assesses whether the unrealized loss is other-than-temporary. An unrealized loss on a debt security is generally deemed to be other-than-temporary and a credit loss is deemed to exist if the present value, discounted at the security’s effective rate, of the expected future cash flows is less than the amortized cost basis of the debt security. As a result, the credit loss component of an other-than-temporary impairment write-down for debt securities is recorded in earnings while the remaining portion of the impairment loss is recognized, net of tax, in other comprehensive income provided that the Company does not intend to sell the underlying debt security and it is more-likely-than not that the Company would not have to sell the debt security prior to recovery of the unrealized loss. If the Company intended to sell any securities with an unrealized loss or it is more-likely-than not that the Company would be required to sell the investment securities, before recovery of their amortized cost basis, then the entire unrealized loss would be recorded in earnings.
The Company considers the following factors in determining whether a credit loss exists and the period over which the debt security is expected to recover.
|
|
|
|
|
|
- |
The length of time and the extent to which the fair value has been less than the amortized cost basis; |
|
|
|
|
|
|
- |
The level of credit enhancement provided by the structure which includes, but is not limited to, credit subordination positions, excess spreads, overcollateralization, protective triggers; |
|
|
|
|
|
|
- |
Changes in the near term prospects of the issuer or underlying collateral of a security, such as changes in default rates, loss severities given default and significant changes in prepayment assumptions; |
|
|
|
|
|
|
- |
The level of excess cash flow generated from the underlying collateral supporting the principal and interest payments of the debt securities; and |
|
|
|
|
|
|
- |
Any adverse change to the credit conditions of the issuer or the security such as credit downgrades by the rating agencies. |
During the third quarter of 2009, the Company determined that three private label mortgage backed securities were other-than-temporarily impaired based on our analysis of the above factors for these three securities. As a result, the Company recorded other-than-temporary impairment charges of $2.0 million in the third quarter of 2009 on these investments. The credit loss component of $146,000 was recorded as net other-than-temporary impairment losses in the accompanying consolidated statements of income, while the remaining non-credit portion of the impairment loss was recognized in other comprehensive income (loss) in the accompanying consolidated statements of condition and changes in shareholders’ equity. The Company reviewed these securities in the fourth quarter of 2009 and determined that no additional other-than-temporary charges were necessary. As of December 31, 2009, the amount by which the cost of these securities exceeded fair was $1.8 million. A continuation or worsening of current economic conditions may result in additional other-than-temporary impairment losses related to these investments.
61
Note 3 Securities (continued)
The following table summarizes the roll-forward of credit losses on debt securities held by the Company for which a portion of an other-than-temporary impairment is recognized in other comprehensive income:
|
|
|
|
|
|
|
(in thousands) |
|
December 31, 2009 |
|
|
|
Credit losses at beginning of the period |
|
$ |
0 |
|
|
Credit losses related to securities for which an other-than-temporary impairment was not previously recognized |
|
|
146 |
|
|
Ending balance of credit losses on debt securities held for which a portion of an other-than-temporary impairment was recognized in other comprehensive income |
|
$ |
146 |
|
The amortized cost and estimated fair value of debt securities by contractual maturity are shown in the following table. Expected maturities may differ from contractual maturities because issuers may have the right to call or prepay obligations with or without call or prepayment penalties. Mortgage-backed securities are shown separately since they are not due at a single maturity date.
|
|
|
|
|
|
|
|
|
|
December 31, 2009 (in thousands) |
|
Amortized |
|
Fair |
|
||
|
Available-for-sale securities: |
|
|
|
|
|
|
|
|
Due in one year or less |
|
$ |
11,084 |
|
$ |
11,231 |
|
|
Due after one year through five years |
|
|
128,493 |
|
|
130,008 |
|
|
Due after five years through ten years |
|
|
296,734 |
|
|
298,694 |
|
|
Due after ten years |
|
|
9,808 |
|
|
9,992 |
|
|
Total |
|
|
446,119 |
|
|
449,925 |
|
|
Mortgage-backed securities |
|
|
461,677 |
|
|
477,681 |
|
|
Total available-for-sale debt securities |
|
$ |
907,796 |
|
$ |
927,606 |
|
|
|
|
|
|
|
|
|
|
|
December 31, 2008 (in thousands) |
|
Amortized |
|
Fair |
|
||
|
Available-for-sale securities: |
|
|
|
|
|
|
|
|
Due in one year or less |
|
$ |
16,640 |
|
$ |
16,742 |
|
|
Due after one year through five years |
|
|
70,769 |
|
|
71,999 |
|
|
Due after five years through ten years |
|
|
159,268 |
|
|
163,137 |
|
|
Due after ten years |
|
|
13,518 |
|
|
13,701 |
|
|
Total |
|
|
260,195 |
|
|
265,579 |
|
|
Mortgage-backed securities |
|
|
465,612 |
|
|
473,971 |
|
|
Total available-for-sale debt securities |
|
$ |
725,807 |
|
$ |
739,550 |
|
|
|
|
|
|
|
|
|
|
|
December 31, 2009 (in thousands) |
|
Amortized |
|
Fair |
|
||
|
Held-to-maturity securities: |
|
|
|
|
|
|
|
|
Due in one year or less |
|
$ |
17,017 |
|
$ |
17,153 |
|
|
Due after one year through five years |
|
|
19,200 |
|
|
20,185 |
|
|
Due after five years through ten years |
|
|
7,131 |
|
|
7,511 |
|
|
Due after ten years |
|
|
1,477 |
|
|
1,491 |
|
|
Total held-to-maturity debt securities |
|
$ |
44,825 |
|
$ |
46,340 |
|
62
Note 3 Securities (continued)
|
|
|
|
|
|
|
|
|
|
December 31, 2008 (in thousands) |
|
Amortized |
|
Fair |
|
||
|
Held-to-maturity securities: |
|
|
|
|
|
|
|
|
Due in one year or less |
|
$ |
20,474 |
|
$ |
20,528 |
|
|
Due after one year through five years |
|
|
21,608 |
|
|
22,089 |
|
|
Due after five years through ten years |
|
|
10,389 |
|
|
10,552 |
|
|
Due after ten years |
|
|
1,982 |
|
|
1,895 |
|
|
Total held-to-maturity debt securities |
|
$ |
54,453 |
|
$ |
55,064 |
|
Trading Securities
The following summarizes trading securities, at estimated fair value, as of:
|
|
|
|
|
|
|
|
|
|
(in thousands) |
|
December 31, 2009 |
|
December 31, 2008 |
|
||
|
|
|
|
|
|
|
|
|
|
Obligations of U.S. Government sponsored entities |
|
$ |
17,986 |
|
$ |
18,370 |
|
|
Mortgage-backed securities – residential |
|
|
13,732 |
|
|
19,731 |
|
|
Total |
|
$ |
31,718 |
|
$ |
38,101 |
|
The net gains on trading account securities, which reflect mark-to-market adjustments, totaled $204,000 in 2009, $811,000 in 2008 and $612,000 in 2007.
The Company pledges securities as collateral for public deposits and other borrowings, and sells securities under agreements to repurchase (see Note 10 Securities Sold Under Agreements to Repurchase and Federal Funds Purchased). Securities carried of $772.7 million and $699.6 million at December 31, 2009 and 2008, respectively, were either pledged or sold under agreements to repurchase.
Except for U.S. government securities, there were no holdings, when taken in the aggregate, of any single issuer that exceeded 10% of shareholders’ equity at December 31, 2009.
The Company has an equity investment in a small business investment company (“SBIC”) established for the purpose of providing financing to small businesses in market areas served by the Company. As of December 31, 2009 and 2008, this investment totaled $3.4 million and $3.5 million, respectively, and was included in other assets on the Company’s Consolidated Statements of Condition. The investment is accounted for under the equity method of accounting. As of December 31, 2009, the Company reviewed this investment and determined that there was no impairment.
The Company also holds non-marketable Federal Home Loan Bank New York (“FHLBNY”) stock and non-marketable Federal Reserve Bank (“FRB”) stock, both of which are required to be held for regulatory purposes and for borrowing availability. The required investment in FHLB stock is tied to the Company’s borrowing levels with the FHLB. Holdings of FHLBNY stock and FRB stock totaled $18.1 million and $1.9 million at December 31, 2009, respectively, and $21.0 million and $1.9 million at December 31, 2008, respectively. These securities are carried at par, which is also cost. While some Federal Home Loan Banks have stopped paying dividends and repurchasing stock upon reductions in debt levels, the FHLBNY continues to pay dividends and repurchase its stock. As such, the Company has not recognized any credit loss other-than-temporary impairment on its holdings of FHLBNY stock.
63
Note 4 Comprehensive Income
Comprehensive income for the three years ended December 31 is summarized below:
|
|
|
|
|
|
|
|
|
|
|
|
|
(in thousands) |
|
2009 |
|
2008 |
|
2007 |
|
|||
|
Net income attributable to noncontrolling interests and Tompkins Financial Corporation |
|
$ |
31,962 |
|
$ |
30,131 |
|
$ |
26,502 |
|
|
Other comprehensive income (loss), net of tax: |
|
|
|
|
|
|
|
|
|
|
|
|
|
|
|
|
|
|
|
|
|
|
|
Unrealized gain on available-for-sale securities: |
|
|
|
|
|
|
|
|
|
|
|
Net unrealized holding gain on available-for-sale securities arising during the year. Pre-tax net unrealized holding gain was $8,048 in 2009 $11,988 in 2008 and $7,977 in 2007. |
|
|
4,829 |
|
|
7,193 |
|
|
4,786 |
|
|
|
|
|
|
|
|
|
|
|
|
|
|
Reclassification adjustment for net realized gain on the sale of available-for-sale securities (pre-tax net gain of $348 in 2009, $477 in 2008, and $384 in 2007). |
|
|
(209 |
) |
|
(286 |
) |
|
(230 |
) |
|
|
|
|
|
|
|
|
|
|
|
|
|
Other-than-temporary impairment on available-for-sale securities (includes $1,779 of gross OTTI losses less $146 of gross losses recognized in income) Pre-tax unrealized loss of $1,633 in 2009, $0 in 2008 and $0 in 2007. |
|
|
(980 |
) |
|
0 |
|
|
0 |
|
|
Employee benefit plans: |
|
|
|
|
|
|
|
|
|
|
|
Amortization of actuarial gains (losses), prior service cost, and transition obligation (pre-tax of $(1,458) in 2009, $12,682 in 2008, and $1,299 in 2007). |
|
|
875 |
|
|
(7,609 |
) |
|
(491 |
) |
|
|
|
|||||||||
|
Other comprehensive income (loss) |
|
|
4,515 |
|
|
(702 |
) |
|
4,065 |
|
|
Subtotal comprehensive income attributable to noncontrolling interest and Tompkins Financial Corporation |
|
|
36,477 |
|
|
29,429 |
|
|
30,567 |
|
|
Less: Other comprehensive income attributable to noncontrolling interest |
|
|
(131 |
) |
|
(297 |
) |
|
(131 |
) |
|
Total comprehensive income attributable to Tompkins Financial Corporation |
|
$ |
36,346 |
|
$ |
29,132 |
|
$ |
30,436 |
|
|
|
|
|
|
|
|
|
|
|
|
|
|
The components of accumulated other comprehensive loss, net of tax, as of year-end were follows: |
||||||||||
|
|
|
|
|
|
|
|
|
|
|
|
|
(in thousands) |
|
2009 |
|
2008 |
|
2007 |
|
|||
|
Net unfunded liability for employee benefit plans |
|
$ |
(14,973 |
) |
$ |
(15,848 |
) |
$ |
(8,239 |
) |
|
Net unrealized gain (loss) on available-for-sale securities |
|
|
11,886 |
|
|
8,246 |
|
|
1,339 |
|
|
Total accumulated other comprehensive loss |
|
$ |
(3,087 |
) |
$ |
(7,602 |
) |
$ |
(6,900 |
) |
Note 5 Loan and Lease Classification Summary and Related Party Transactions
Loans and Leases at December 31 were as follows:
|
|
|
|
|
|
|
|
|
|
(in thousands) |
|
2009 |
|
2008 |
|
||
|
Residential real estate |
|
$ |
622,942 |
|
$ |
625,263 |
|
|
Commercial real estate |
|
|
641,737 |
|
|
571,929 |
|
|
Real estate construction |
|
|
58,125 |
|
|
52,114 |
|
|
Commercial |
|
|
494,495 |
|
|
467,420 |
|
|
Consumer and other |
|
|
86,687 |
|
|
87,998 |
|
|
Leases |
|
|
12,821 |
|
|
14,968 |
|
|
Total loans and leases |
|
|
1,916,807 |
|
|
1,819,692 |
|
|
Less unearned income and net deferred costs and fees |
|
|
(1,989 |
) |
|
(2,161 |
) |
|
Total loans and leases, net of unearned income and deferred costs and fees |
|
$ |
1,914,818 |
|
$ |
1,817,531 |
|
As part of its asset/liability management strategy the Company may sell certain residential mortgage loans in the secondary market. Loans are generally sold to Federal Home Loan Mortgage Corporation (“FHLMC”) or State of New York Mortgage Agency (“SONYMA”). During 2009, 2008, and 2007, the Company sold residential mortgage loans totaling $89.0 million, $11.3 million, and $10.7 million, respectively, and realized gains on these sales of $1.4 million, $105,000, and $159,000, respectively. When residential mortgage loans are sold, the Company typically retains all servicing rights, which provides the Company with a source of
64
Note 5 Loan and Lease Classification Summary and Related Party Transactions (continued)
fee income. In connection with the sales in 2009, 2008, and 2007, the Company recorded mortgage-servicing assets of $648,000, $26,000, and $46,000, respectively.
Amortization of mortgage servicing assets amounted to $245,000 in 2009, $117,000 in 2008 and $122,000 in 2007. At December 31, 2009 and 2008, the Company serviced residential mortgage loans aggregating $206.0 million and $149.9 million, including loans securitized and held as available-for-sale securities. Mortgage servicing rights, at amortized basis evaluated for impairment, totaled $1.4 million at December 31, 2009 and $961,000 at December 31, 2008. Loans held for sale, which are included in residential real estate in the table above, totaled $1.4 million and $145,000 at December 31, 2009 and 2008, respectively. No loans were securitized in 2009 and 2008.
As members of the FHLB, the Company’s subsidiary banks may use unencumbered mortgage related assets to secure borrowings from the FHLB. At December 31, 2009, the Company had $170.3 million in term advances from the FHLB that were secured by residential mortgage loans.
The Company’s loan and lease customers are located primarily in the upstate New York communities served by its three subsidiary banks. The Trust Company operates fourteen banking offices in the counties of Tompkins, Cayuga, Cortland, and Schuyler, New York. The Bank of Castile operates fourteen banking offices in towns situated in and around the areas commonly known as the Letchworth State Park area and the Genesee Valley region of New York State. Mahopac National Bank is located in Putnam County, New York, and operates five offices in that county, three offices in neighboring Dutchess County, New York, and six offices in Westchester County, New York. Other than general economic risks, management is not aware of any material concentrations of credit risk to any industry or individual borrower.
Directors and officers of the Company and its affiliated companies were customers of, and had other transactions with, the Company’s banking subsidiaries in the ordinary course of business. Such loans and commitments were made on substantially the same terms, including interest rates and collateral, as those prevailing at the time for comparable transactions with other persons not related to the Company, and did not involve more than normal risk of collectibility or present other unfavorable features.
Loan transactions with related parties at December 31 are summarized as follows:
|
|
|
|
|
|
|
|
|
|
(in thousands) |
|
2009 |
|
2008 |
|
||
|
Balance at beginning of year |
|
$ |
10,504 |
|
$ |
12,653 |
|
|
New Directors/Executive Officers |
|
|
159 |
|
|
480 |
|
|
Former Directors/Executive Officers |
|
|
0 |
|
|
(518 |
) |
|
New loans and advancements |
|
|
20,789 |
|
|
2,232 |
|
|
Loan payments |
|
|
(5,836 |
) |
|
(4,343 |
) |
|
Balance at end of year |
|
$ |
25,615 |
|
$ |
10,504 |
|
Note 6 Allowance for Loan and Lease Losses
Changes in the allowance for loan and lease losses at December 31 are summarized as follows:
|
|
|
|
|
|
|
|
|
|
|
|
|
(in thousands) |
|
2009 |
|
2008 |
|
2007 |
|
|||
|
Allowance at beginning of year |
|
$ |
18,672 |
|
$ |
14,607 |
|
$ |
14,328 |
|
|
Provisions charged to operations |
|
|
9,288 |
|
|
5,428 |
|
|
1,529 |
|
|
Recoveries on loans and leases |
|
|
624 |
|
|
442 |
|
|
510 |
|
|
Loans and leases charged-off |
|
|
(4,234 |
) |
|
(3,290 |
) |
|
(1,760 |
) |
|
Allowance acquired in purchase acquisition |
|
|
0 |
|
|
1,485 |
|
|
0 |
|
|
Allowance at end of year |
|
$ |
24,350 |
|
$ |
18,672 |
|
$ |
14,607 |
|
The Company’s recorded investment in loans and leases that are considered impaired totaled $30.0 million at December 31, 2009 and $9.7 million at December 31, 2008. The average recorded investment in impaired loans and leases was $17.0 million in 2009, $8.6 million in 2008, $6.8 million in 2007. At December 31, 2009, $13.1 million of impaired loans had specific reserve allocations of $803,000 and $16.9 million had no specific reserve allocation. At December 31, 2008, $4.6 million of impaired loans had specific reserve allocations of $414,000 and $5.1 million had no specific reserve allocations. Interest income recognized on impaired loans and leases, all collected in cash, and was $1.4 million for 2009, $455,000 for 2008, and $283,000 for 2007.
65
Note 6 Allowance for Loan and Lease Losses (continued)
The principal balances of nonperforming loans and leases, including impaired loans and leases, at December 31 are detailed in the table below.
|
|
|
|
|
|
|
|
|
|
(in thousands) |
|
2009 |
|
2008 |
|
||
|
Loans 90 days past due and accruing |
|
$ |
369 |
|
$ |
161 |
|
|
Nonaccrual loans |
|
|
31,289 |
|
|
15,798 |
|
|
Troubled debt restructurings not included above |
|
|
3,265 |
|
|
69 |
|
|
Nonperforming loans and leases |
|
$ |
34,923 |
|
$ |
16,028 |
|
The difference between the interest income that would have been recorded if these loans and leases had been paid in accordance with their original terms and the interest income that was recorded for the year ended December 31, 2009 was $669,000. The amounts for the years ended December 31, 2008, and 2007 were not significant. The Company had no material commitments to make additional advances to borrowers with nonperforming loans.
Note 7 Goodwill and Other Intangible Assets
Information regarding the carrying amount and the amortization expense of the Company’s acquired intangible assets are disclosed in the tables below.
|
|
|
|
|
|
|
|
|
|
|
|
|
December 31, 2009 (in thousands) |
|
Gross Carrying |
|
Accumulated |
|
Net Carrying |
|
|||
|
Amortized intangible assets: |
|
|
|
|
|
|
|
|
|
|
|
Core deposit intangible |
|
$ |
7,891 |
|
$ |
6,158 |
|
$ |
1,733 |
|
|
Other intangibles |
|
|
6,492 |
|
|
3,361 |
|
|
3,131 |
|
|
Subtotal amortized intangible assets |
|
|
14,383 |
|
|
9,519 |
|
|
4,864 |
|
|
Goodwill – Banking segment |
|
|
25,323 |
|
|
1,723 |
|
|
23,600 |
|
|
Goodwill – Financial Services segment |
|
|
18,290 |
|
|
301 |
|
|
17,989 |
|
|
Subtotal goodwill |
|
|
43,613 |
|
|
2,024 |
|
|
41,589 |
|
|
Total intangible assets |
|
$ |
57,996 |
|
$ |
11,543 |
|
$ |
46,453 |
|
|
|
|
|
|
|
|
|
|
|
|
|
|
December 31, 2008 (in thousands) |
|
Gross Carrying |
|
Accumulated |
|
Net Carrying |
|
|||
|
Amortized intangible assets: |
|
|
|
|
|
|
|
|
|
|
|
Core deposit intangible |
|
$ |
7,891 |
|
$ |
5,672 |
|
$ |
2,219 |
|
|
Other intangibles |
|
|
5,766 |
|
|
2,686 |
|
|
3,080 |
|
|
Subtotal amortized intangible assets |
|
|
13,657 |
|
|
8,358 |
|
|
5,299 |
|
|
Goodwill – Banking segment |
|
|
25,296 |
|
|
1,723 |
|
|
23,573 |
|
|
Goodwill – Financial Services segment |
|
|
18,207 |
|
|
301 |
|
|
17,906 |
|
|
Subtotal goodwill |
|
|
43,503 |
|
|
2,024 |
|
|
41,479 |
|
|
Total intangible assets |
|
$ |
57,160 |
|
$ |
10,382 |
|
$ |
46,778 |
|
The changes in the carrying amount of goodwill for the year ended December 31, 2009 are provided in the following table. The changes in goodwill were in both the Banking segment and the Financial Services segment.
|
|
|
|
|
|
|
|
|
|
(in thousands) |
|
Gross Carrying Amount |
|
Net Carrying Amount |
|
||
|
Balance as of January 1, 2009 |
|
$ |
43,503 |
|
$ |
41,479 |
|
|
Goodwill adjustments related to prior year acquisitions – Banking Segment |
|
|
27 |
|
|
27 |
|
|
Goodwill adjustments related to prior year acquisitions – Financial Services Segment |
|
|
83 |
|
|
83 |
|
|
Balance as of December 31, 2009 |
|
$ |
43,613 |
|
$ |
41,589 |
|
At December 31, 2009, the Company had unamortized goodwill related to its various acquisitions totaling $41.6 million compared with $41.5 million at December 31, 2008. During 2009, the Company recorded additional goodwill of $60,000 related to the acquisition of Fran Celona, CPA, P.C., and $23,000 related to the acquisition of Robert G. Relph Comprehensive Brokerage Services, Inc., as the requirement for contingent consideration was met resulting in additional consideration being paid. In addition, the Company adjusted the goodwill recorded during 2008 related to the acquisition of Sleepy Hollow Bancorp, Inc. by $27,000.
66
Note 7 Goodwill and Other Intangible Assets (continued)
At December 31, 2009, the Company had core deposit intangible assets related to various acquisitions of $1.7 million compared to $2.2 million at December 31, 2008. Amortization of core deposit intangible assets amounted to $485,000 in 2009, $470,000 in 2008 and $278,000 in 2007.
At December 31, 2009, other intangible assets, consisting of mortgage servicing rights, customer lists and contracts, and covenants-not-to-compete, totaled $3.1 million compared with $3.1 million at December 31, 2008.
The Company reviews its goodwill and intangible assets annually, or more frequently if conditions warrant, for impairment. In testing goodwill for impairment, the Company compares the estimated fair value of each reporting unit to their respective carrying amounts, including goodwill. Based on the Company’s 2009 review, there was no impairment of its goodwill or intangible assets. The Company’s estimated fair value significantly exceeds the carrying value for all reporting units. The Company’s goodwill impairment testing is, however, highly sensitive to certain assumptions and estimates used. In the event that further significant deterioration in the economy and credit conditions beyond the levels already reflected in our cash flow forecasts occur, or changes in the strategy or performance of our business or product offerings occur, additional interim impairment tests may be required.
Amortization expense related to intangible assets totaled $915,000 in 2009, $906,000 in 2008, and $653,000 in 2007. The estimated aggregate future amortization expense for intangible assets remaining as of December 31, 2009 is as follows:
|
|
|
|
|
|
|
Estimated amortization expense: * |
|
|
|
|
|
For the year ended December 31, 2010 |
|
$ |
764 |
|
|
For the year ended December 31, 2011 |
|
|
563 |
|
|
For the year ended December 31, 2012 |
|
|
456 |
|
|
For the year ended December 31, 2013 |
|
|
370 |
|
|
For the year ended December 31, 2014 |
|
|
313 |
|
*Excludes the amortization of mortgage servicing rights. Amortization of mortgage servicing rights was $245,000, $117,000, and $122,000 in 2009, 2008, and 2007, respectively.
Note 8 Premises and Equipment
Premises and equipment at December 31 were as follows:
|
|
|
|
|
|
|
|
|
|
|
|
|
(in thousands) |
|
2009 |
|
2008 |
|
2007 |
|
|||
|
Land |
|
$ |
7,652 |
|
$ |
7,727 |
|
$ |
7,591 |
|
|
Premises |
|
|
52,395 |
|
|
51,418 |
|
|
47,473 |
|
|
Furniture, fixtures, and equipment |
|
|
36,434 |
|
|
34,116 |
|
|
31,934 |
|
|
Accumulated depreciation and amortization |
|
|
(49,831 |
) |
|
(46,648 |
) |
|
(42,187 |
) |
|
Total |
|
$ |
46,650 |
|
$ |
46,613 |
|
$ |
44,811 |
|
Depreciation and amortization expenses in 2009, 2008, and 2007 are included in operating expenses as follows:
|
|
|
|
|
|
|
|
|
|
|
|
|
(in thousands) |
|
2009 |
|
2008 |
|
2007 |
|
|||
|
Premises |
|
$ |
1,633 |
|
$ |
1,768 |
|
$ |
1,378 |
|
|
Furniture, fixtures, and equipment |
|
|
2,439 |
|
|
2,443 |
|
|
2,431 |
|
|
Total |
|
$ |
4,072 |
|
$ |
4,211 |
|
$ |
3,809 |
|
The following is a summary of the future minimum lease payments under non-cancelable operating leases as of December 31, 2009:
|
|
|
|
|
|
|
(in thousands) |
|
|
|
|
|
2010 |
|
|
2,212 |
|
|
2011 |
|
|
1,680 |
|
|
2012 |
|
|
1,477 |
|
|
2013 |
|
|
1,295 |
|
|
2014 |
|
|
1,183 |
|
|
Thereafter |
|
|
11,767 |
|
|
Total |
|
$ |
19,614 |
|
67
Note 8 Premises and Equipment (continued)
The Company leases land, buildings and equipment under operating lease arrangements extending to the year 2090. Total gross rental expense amounted to $2.4 million in 2009, $2.4 million in 2008, and $2.1 million in 2007. Most leases include options to renew for periods ranging from 5 to 20 years. Options to renew are not included in the above future minimum rental commitments. The Company has two land lease commitments with terms expiring in 2042 and 2090.
Note 9 Deposits
The aggregate time deposits of $100,000 or more were $327.9 million at December 31, 2009, and $277.8 million at December 31, 2008. Scheduled maturities of time deposits at December 31, 2009, were as follows:
|
|
|
|
|
|
|
|
|
|
|
|
|
(in thousands) |
|
Less than |
|
$100,000 |
|
Total |
|
|||
|
Maturity |
|
|
|
|
|
|
|
|
|
|
|
Three months or less |
|
$ |
117,852 |
|
$ |
144,598 |
|
$ |
262,450 |
|
|
Over three through six months |
|
|
113,068 |
|
|
64,786 |
|
|
177,854 |
|
|
Over six through twelve months |
|
|
145,920 |
|
|
82,615 |
|
|
228,535 |
|
|
Total due in 2010 |
|
|
376,840 |
|
|
291,999 |
|
|
668,839 |
|
|
2011 |
|
|
62,716 |
|
|
24,207 |
|
|
86,923 |
|
|
2012 |
|
|
17,256 |
|
|
7,701 |
|
|
24,957 |
|
|
2013 |
|
|
3,148 |
|
|
1,773 |
|
|
4,921 |
|
|
2014 |
|
|
1,899 |
|
|
440 |
|
|
2,339 |
|
|
2015 and thereafter |
|
|
4,989 |
|
|
1,770 |
|
|
6,759 |
|
|
Total |
|
$ |
466,848 |
|
$ |
327,890 |
|
$ |
794,738 |
|
Note 10 Securities Sold Under Agreements to Repurchase and Federal Funds Purchased
Information regarding securities sold under agreements to repurchase and Federal funds purchased for the years ended December 31, is detailed in the tables below:
|
|
|
|
|
|
|
|
|
|
|
|
|
Securities Sold Under Agreements to Repurchase |
|
2009 |
|
2008 |
|
2007 |
|
|||
|
Total outstanding at December 31 |
|
$ |
192,784 |
|
$ |
195,304 |
|
$ |
195,447 |
|
|
Maximum month-end balance |
|
|
203,094 |
|
|
225,065 |
|
|
206,888 |
|
|
Average balance during the year |
|
|
190,965 |
|
|
203,219 |
|
|
198,950 |
|
|
Weighted average rate at December 31 |
|
|
2.97 |
% |
|
3.46 |
% |
|
3.97 |
% |
|
Average interest rate paid during the year |
|
|
3.27 |
% |
|
3.69 |
% |
|
4.08 |
% |
|
|
|
|
|
|
|
|
|
|
|
|
|
Federal Funds Purchased (dollar amounts in thousands) |
|
2009 |
|
2008 |
|
2007 |
|
|||
|
Total outstanding at December 31 |
|
$ |
0 |
|
$ |
1,000 |
|
$ |
0 |
|
|
Maximum month-end balance |
|
|
0 |
|
|
1,000 |
|
|
6,800 |
|
|
Average balance during the year |
|
|
91 |
|
|
165 |
|
|
176 |
|
|
Weighted average rate at December 31 |
|
|
N/A |
|
|
0.50 |
% |
|
N/A |
|
|
Average interest rate paid during the year |
|
|
0.52 |
% |
|
2.42 |
% |
|
5.39 |
% |
Securities sold under agreements to repurchase are secured borrowings that typically mature within thirty to ninety days, although the Company has entered into repurchase agreements with the Federal Home Loan Bank (“FHLB”) with maturities that extend through 2017. As of December 31, 2009, the Company had $145.0 million in repurchase agreements with the FHLB, of which $135.0 million mature over one year. Maturities of repurchase agreements due over one year include $20.0 million in 2011, $5.0 million in 2012, $35.0 million in 2013, $20.0 million in 2014, $45.0 million in 2016, and $10.0 million in 2017.
Securities sold under agreements to repurchase are stated at the amount of cash received in connection with the transaction. The Company may be required to provide additional collateral based on the fair value of the underlying securities.
68
Note 10 Securities Sold Under Agreements to Repurchase and Federal Funds Purchased (continued)
Total securities sold under agreements to repurchase at December 31, 2009, includes a $5.0 million, 7-year repo convertible FHLB advance at 4.715%, convertible at the end of 3 years, where the Company elected to apply the fair value option pursuant to FASB ASC Topic 825. The $5.0 million identified for fair value was selected because the duration was similar to the duration of trading securities. As of December 31, 2009, the aggregate fair value of the $5.0 million of securities sold under agreements to repurchase was $5.5 million. For the twelve months ended December 31, 2009, the fair value of these borrowings decreased by $177,000. During 2009, the Company prepaid a $10.0 million repurchase agreement with the FHLB, where the Company had elected the fair value option. Net mark-to-market pre-tax gains of $242,000 related to this repurchase agreement are included in 2009 results. The $242,000 pre-tax gain and the $177,000 pre-tax gain are included on the Company’s Consolidated Statements of Income in “Mark-to-Market Gain (Loss) on Liabilities Held at Fair Value.”
Federal funds purchased are short-term borrowings that typically mature within one to ninety days.
Note 11 Other Borrowings
The following table summarizes the Company’s borrowings as of December 31:
|
|
|
|
|
|
|
|
|
|
(in thousands) |
|
2009 |
|
2008 |
|
||
|
Overnight FHLB advances |
|
$ |
13,500 |
|
$ |
73,500 |
|
|
Term FHLB advances |
|
|
170,335 |
|
|
177,152 |
|
|
Other |
|
|
25,130 |
|
|
24,139 |
|
|
Total borrowings |
|
$ |
208,965 |
|
$ |
274,791 |
|
The Company, through its subsidiary banks, had available line-of-credit agreements with banks permitting borrowings to a maximum of approximately $28.0 million at December 31, 2009 and 2008. There were no outstanding advances against those lines at December 31, 2009; there were $1.0 million of outstanding advances at December 31, 2008.
Through its subsidiary banks, the Company has borrowing relationships with the FHLB and correspondent banks, which provide secured and unsecured borrowing capacity. At December 31, 2009, the unused borrowing capacity on established lines with the FHLB was $508.4 million.
As members of the FHLB, the Company’s subsidiary banks can use certain unencumbered mortgage-related assets to secure additional borrowings from the FHLB. At December 31, 2009, total unencumbered residential mortgage loans of the Company were $213.2 million. Additional assets may also qualify as collateral for FHLB advances upon approval of the FHLB. At December 31, 2009, there were $170.3 million in term advances with the FHLB with a weighted average rate of 4.32% compared to $177.2 million at December 31, 2008 with a weighted average rate of 4.38%. Of the $170.3 million of term advances with the FHLB at December 31, 2009, $20.0 million matures in one year and $150.3 million matures over one year. Maturities of advances due over one year include $24.0 million in 2011, $30.0 million in 2012, $15.0 million in 2013, $20.0 million in 2014, $10.0 million in 2015, and $51.3 million in 2017.
The Company’s FHLB borrowings at December 31, 2009 included $131.5 million, at cost, in fixed-rate callable borrowings, which can be called by the FHLB if certain conditions are met. Additional details on the fixed-rate callable advances are provided in the following table.
69
Note 11 Other Borrowings (continued)
|
|
|
|
|
|
|
|
|
|
|
|
|
|
|
|
|
|
|
|
Current |
|
|
Rate |
|
Maturity Date |
|
Call Date |
|
Call |
|
Call Features |
|
|
|
|
|
||||||||||||||
|
|
|
$ |
10,000,000 |
|
|
4.945 |
|
December 21, 2010 |
|
March 21, 2010 |
|
Quarterly |
|
FHLB option |
|
|
|
|
|
3,000,000 |
|
|
5.120 |
|
January 31, 2011 |
|
January 31, 2010 |
|
Quarterly |
|
FHLB option |
|
|
|
|
|
3,000,000 |
|
|
4.880 |
|
January 31, 2011 |
|
January 31, 2010 |
|
Quarterly |
|
FHLB option |
|
|
|
|
|
3,000,000 |
|
|
5.120 |
|
March 7, 2011 |
|
March 5, 2010 |
|
Quarterly |
|
FHLB option |
|
|
|
|
|
5,000,000 |
|
|
4.710 |
|
November 28, 2011 |
|
February 28, 2010 |
|
Quarterly |
|
FHLB option |
|
|
|
|
|
12,500,000 |
|
|
4.416 |
|
September 28, 2012 |
|
September 28, 2010 |
|
One time |
|
FHLB option |
|
|
|
|
|
5,000,000 |
|
|
2.800 |
|
January 22, 2013 |
|
January 22, 2011 |
|
One time |
|
FHLB option |
|
|
|
|
|
5,000,000 |
|
|
3.065 |
|
February 28, 2013 |
|
February 28, 2011 |
|
Quarterly |
|
FHLB option |
|
|
|
|
|
5,000,000 |
|
|
3.390 |
|
May 2, 2013 |
|
May 2, 2011 |
|
One time |
|
FHLB option |
|
|
|
|
|
10,000,000 |
|
|
4.680 |
|
June 9, 2014 |
|
March 8, 2010 |
|
Quarterly |
|
FHLB option |
|
|
|
|
|
10,000,000 |
|
|
4.756 |
|
June 9, 2014 |
|
March 8, 2010 |
|
Quarterly |
|
FHLB option |
|
|
|
|
|
10,000,000 |
|
|
3.850 |
|
June 3, 2015 |
|
June 3, 2010 |
|
One time |
|
FHLB option |
|
|
|
|
|
5,000,000 |
|
|
4.405 |
|
March 29, 2017 |
|
March 29, 2010 |
|
Quarterly |
|
Libor strike 6.0% |
|
|
|
|
|
5,000,000 |
|
|
4.894 |
|
May 22, 2017 |
|
May 22, 2010 |
|
Quarterly |
|
Libor strike 7.0% |
|
|
|
|
|
10,000,000 |
|
|
4.915 |
|
June 8, 2017 |
|
June 8, 2010 |
|
Quarterly |
|
FHLB option |
|
|
|
|
|
10,000,000 |
|
|
5.135 |
|
June 8, 2017 |
|
March 8, 2010 |
|
Quarterly |
|
Libor strike 7.0% |
|
|
|
|
|
10,000,000 |
|
|
5.189 |
|
June 8, 2017 |
|
June 8, 2012 |
|
Quarterly |
|
FHLB option |
|
|
|
|
|
10,000,000 |
|
|
5.183 |
|
June 28, 2017 |
|
June 28, 2012 |
|
One time |
|
FHLB option |
|
|
|
|
|
|
|
|
|
|
|
|
|
|
|
|||
|
Total |
|
$ |
131,500,000 |
|
|
|
|
|
|
|
|
|
|
|
|
|
|
|
|
|
|
|
|
|
|
|
|
|
|
|||
Other borrowings included a term borrowing with a bank totaling $25.0 million and $24.0 million at December 31, 2009 and 2008. There were also a Treasury Tax and Loan Note account with the Federal Reserve Bank of New York totaling $100,000 at December 31, 2009 and 2008, and borrowings from unrelated financial institutions totaling $30,000 and $39,000 at December 31, 2009 and 2008, respectively.
The Company elected to apply the fair value option for a $10.0 million, 10-year fixed convertible FLHB advance at 5.183%, convertible at the end of 3 years with a maturity of June 28, 2017. The $10.0 million advance identified for fair value was selected because its duration was similar to the durations of trading securities. As of December 31, 2009, the aggregate fair value of the $10.0 million FHLB advance was approximately $11.3 million. For the twelve months ended December 31, 2009, the fair value of this advance decreased by $844,000. The change in fair value is included on the Company’s Consolidated Statements of Income in “Mark-to-Market Gain (Loss) on Liabilities Held at Fair Value.”
Note 12 Trust Preferred Debentures
Tompkins Capital Trust I
During 2009, the Company issued $20.5 million aggregate liquidation amount of 7.0% cumulative trust preferred securities through a newly-formed subsidiary, Tompkins Capital Trust I, a Delaware statutory trust, whose common stock is 100% owned by the Company. The Trust Preferred Securities were offered and sold in reliance upon the exemption from registration provided by Rule 506 of Regulation D of the Securities Act of 1933, as amended (the “Securities Act”). The proceeds from the issuance of the Trust Preferred Securities, together with the Company’s capital contribution of $636,000 to the trust, were used to acquire the Company’s Subordinated Debentures that are due concurrently with the Trust Preferred Securities. The net proceeds of the offering are being used to support business growth and for general corporate purposes.
The Trust Preferred Securities and the Company’s debentures are dated April 10, 2009, have a 30 year maturity, and carry a fixed rate of interest of 7.0%. The Trust Preferred Securities have a liquidation amount of $1,000 per security. The Company has retained the right to redeem the Trust Preferred Securities at par (plus accrued but unpaid interest) at a date which is no earlier than 5 years from the date of issuance. Commencing in 2019, and during specified annual windows thereafter, holders may convert the Trust Preferred Securities into shares of the Company’s common stock at a conversion price equal to the greater of (i) $41.35, or (ii) the average closing price of the Company’s common stock during the first three months of the year in which the conversion will be completed.
The Company has guaranteed the distributions with respect to, and amounts payable upon liquidation or redemption of, the Trust Preferred Securities on a subordinated basis as and to the extent set forth in the Preferred Securities Guarantee Agreement entered into on April 10, 2009, between the Company and Wilmington Trust Company, as Preferred Guarantee Trustee (the “Guarantee”).
70
Note 12 Trust Preferred Debentures (continued)
Sleepy Hollow Capital Trust I
In August 2003, Sleepy Hollow Capital Trust I issued $4.0 million of floating rate (three-month LIBOR plus 305 basis points) trust preferred securities, which represent beneficial interests in the assets of the trust. The trust preferred securities will mature on August 30, 2033. Distributions on the trust preferred securities are payable quarterly in arrears on March 31, June 30, September 30 and December 31 of each year. Sleepy Hollow Capital Trust I also issued $0.1 million of common equity securities to the Company. The proceeds of the offering were used to acquire the Company’s Subordinated Debentures that are due concurrently with the Trust Preferred Securities.
Note 13 Employee Benefit Plans
The Company maintains a noncontributory defined-benefit retirement and pension plan (the “Pension Plan”) covering substantially all employees of the Company. The benefits are based on years of service and percentage of the employees’ average compensation. Assets of the Company’s Pension Plan are invested in common and preferred stock, U. S. Government securities, corporate bonds and notes, and mutual funds. At December 31, 2009, the plan assets included 38,357 shares of Tompkins common stock that had a fair value of $1.6 million.
The Company acquired Sleepy Hollow Bancorp, Inc., (“Sleepy Hollow”) effective May 9, 2008. At the time of acquisition, Sleepy Hollow was in the process of terminating its defined benefit pension plan. During 2009, the remaining assets of the plan were distributed and the termination completed.
The Company maintains supplemental employee retirement plans (the “SERP”) for certain executives. All benefits provided under the SERP are unfunded and the Corporation makes payments to plan participants.
The Company also maintains a post-retirement life and healthcare benefit plan (the “Life and Healthcare Plan”), which was amended in 2005. For employees commencing employment after January 1, 2005, the Company does not contribute towards the Life and Healthcare Plan. Retirees and employees who were eligible to retire when the Life and Healthcare Plan was amended were unaffected. Generally, all other employees were eligible for Health Savings Accounts (“HSA”) with an initial balance equal to the amount of the Company’s estimated then current liability. Contributions to the plan are limited to an annual contribution of 4% of the total HSA balances. Employees, upon retirement, will be able to utilize their HSA for qualified health costs and deductibles.
The Company engages independent, external actuaries to compute the amounts of liabilities and expenses relating to these plans, subject to the assumptions that the Company selects. The benefit obligation for these plans represents the liability of the Company for current and retired employees, and is affected primarily by the following: service cost (benefits attributed to employee service during the period); interest cost (interest on the liability due to the passage of time); actuarial gains/losses (experience during the year different from that assumed and changes in plan assumptions); and benefits paid to participants.
The following table sets forth the changes in the projected benefit obligation for the Pension Plan and SERP and the accumulated benefit obligation for the Life and Healthcare Plan; and the respective plan assets, and the plans’ funded status and amounts recognized in the Company’s Consolidated Statements of Condition at December 31, 2009 and 2008 (the measurement dates of the plans).
71
Note 13 Employee Benefit Plans (continued)
|
|
|
|
|
|
|
|
|
|
|
|
|
|
|
|
|
|
|
|
|
|
|
|
Pension Plan |
|
Life and Healthcare Plan |
|
SERP Plan |
|
||||||||||||
|
(in thousands) |
|
2009 |
|
2008 |
|
2009 |
|
2008 |
|
2009 |
|
2008 |
|
||||||
|
Change in benefit obligation: |
|
|
|
|
|
|
|
|
|
|
|
|
|
|
|
|
|
|
|
|
Benefit obligation at beginning of year |
|
$ |
40,328 |
|
$ |
37,596 |
|
$ |
6,004 |
|
$ |
5,245 |
|
$ |
9,107 |
|
$ |
8,506 |
|
|
Service cost |
|
|
2,178 |
|
|
1,908 |
|
|
98 |
|
|
133 |
|
|
164 |
|
|
169 |
|
|
Interest cost |
|
|
2,410 |
|
|
2,249 |
|
|
372 |
|
|
346 |
|
|
559 |
|
|
515 |
|
|
Plan participants’ contributions |
|
|
0 |
|
|
0 |
|
|
142 |
|
|
106 |
|
|
0 |
|
|
0 |
|
|
Actuarial loss (gain) |
|
|
1,295 |
|
|
231 |
|
|
341 |
|
|
139 |
|
|
540 |
|
|
73 |
|
|
Benefits paid |
|
|
(1,795 |
) |
|
(1,656 |
) |
|
(402 |
) |
|
(340 |
) |
|
(315 |
) |
|
(259 |
) |
|
Plan amendments |
|
|
0 |
|
|
0 |
|
|
0 |
|
|
375 |
|
|
0 |
|
|
103 |
|
|
Benefit obligation at end of year |
|
$ |
44,416 |
|
$ |
40,328 |
|
$ |
6,555 |
|
$ |
6,004 |
|
$ |
10,055 |
|
$ |
9,107 |
|
|
Change in plan assets: |
|
|
|
|
|
|
|
|
|
|
|
|
|
|
|
|
|
|
|
|
Fair value of plan assets at beginning of year |
|
$ |
35,581 |
|
$ |
36,407 |
|
$ |
0 |
|
$ |
0 |
|
$ |
0 |
|
$ |
0 |
|
|
Actual return (loss) on plan assets |
|
|
4,600 |
|
|
(9,170 |
) |
|
0 |
|
|
0 |
|
|
0 |
|
|
0 |
|
|
Plan participants’ contributions |
|
|
0 |
|
|
0 |
|
|
142 |
|
|
106 |
|
|
0 |
|
|
0 |
|
|
Employer contribution |
|
|
0 |
|
|
10,000 |
|
|
260 |
|
|
234 |
|
|
315 |
|
|
259 |
|
|
Benefits paid |
|
|
(1,795 |
) |
|
(1,656 |
) |
|
(402 |
) |
|
(340 |
) |
|
(315 |
) |
|
(259 |
) |
|
Fair value of plan assets at end of year |
|
$ |
38,386 |
|
$ |
35,581 |
|
$ |
0 |
|
$ |
0 |
|
$ |
0 |
|
$ |
0 |
|
|
Unfunded status |
|
$ |
(6,030 |
) |
$ |
(4,747 |
) |
$ |
(6,555 |
) |
$ |
(6,004 |
) |
$ |
(10,055 |
) |
$ |
(9,107 |
) |
The accumulated benefit obligation for the Pension Plan for 2009 and 2008 was $43.3 million and $39.2 million, respectively. The accumulated benefit obligation for the SERP for 2009 and 2008 was $6.4 million and $6.0 million, respectively. The unfunded status of the pension, life and healthcare and SERP plans has been recognized in other liabilities in the Consolidated Statement of Condition at December 31, 2009, in the amounts of $6.0 million, $6.6 million, and $10.1 million, respectively. The unfunded status of the pension, life and healthcare and SERP plans has been recognized in other liabilities in the Consolidated Statement of Condition at December 31, 2008, in the amounts of $4.7 million, $6.0 million, and $9.1 million, respectively.
Net periodic benefit cost and other comprehensive income includes the following components:
|
|
|
|
|
|
|
|
|
|
|
|
|
|
|
|
|
|
|
|
|
|
|
|
|
|
|
|
|
|
|
(in thousands) |
|
Pension Plan |
|
Life and Healthcare Plan |
|
SERP Plan |
|
|||||||||||||||||||||
|
Components of net periodic benefit cost |
|
2009 |
|
2008 |
|
2007 |
|
2009 |
|
2008 |
|
2007 |
|
2009 |
|
2008 |
|
2007 |
|
|||||||||
|
Service cost |
|
$ |
2,178 |
|
$ |
1,908 |
|
$ |
1,872 |
|
$ |
98 |
|
$ |
133 |
|
$ |
120 |
|
$ |
164 |
|
$ |
169 |
|
$ |
173 |
|
|
Interest cost |
|
|
2,410 |
|
|
2,249 |
|
|
2,049 |
|
|
372 |
|
|
346 |
|
|
306 |
|
|
559 |
|
|
515 |
|
|
484 |
|
|
Expected return on plan assets |
|
|
(2,638 |
) |
|
(3,277 |
) |
|
(2,885 |
) |
|
0 |
|
|
0 |
|
|
0 |
|
|
0 |
|
|
0 |
|
|
0 |
|
|
Amortization of prior service (credit) cost |
|
|
(105 |
) |
|
(105 |
) |
|
(107 |
) |
|
16 |
|
|
16 |
|
|
0 |
|
|
101 |
|
|
101 |
|
|
93 |
|
|
Recognized net actuarial loss |
|
|
1,502 |
|
|
546 |
|
|
577 |
|
|
0 |
|
|
0 |
|
|
0 |
|
|
91 |
|
|
61 |
|
|
92 |
|
|
Amortization of transition liability |
|
|
0 |
|
|
0 |
|
|
0 |
|
|
67 |
|
|
67 |
|
|
67 |
|
|
0 |
|
|
0 |
|
|
0 |
|
|
Net periodic benefit cost |
|
$ |
3,347 |
|
$ |
1,321 |
|
$ |
1,506 |
|
$ |
553 |
|
$ |
562 |
|
$ |
493 |
|
$ |
915 |
|
$ |
846 |
|
$ |
842 |
|
|
Other changes in plan assets and benefit obligations recognized in other comprehensive income |
|
|
|
|
|
|
|
|
|
|
|
|
|
|
|
|
|
|
|
|
|
|
|
|
|
|
|
|
|
Net actuarial (gain) loss |
|
$ |
(667 |
) |
$ |
12,678 |
|
$ |
1,755 |
|
$ |
341 |
|
$ |
139 |
|
$ |
(99 |
) |
$ |
540 |
|
$ |
73 |
|
$ |
338 |
|
|
Recognized actuarial loss |
|
|
(1,502 |
) |
|
(546 |
) |
|
(577 |
) |
|
0 |
|
|
0 |
|
|
0 |
|
|
(91 |
) |
|
(61 |
) |
|
(92 |
) |
|
Prior service cost |
|
|
0 |
|
|
0 |
|
|
27 |
|
|
0 |
|
|
375 |
|
|
0 |
|
|
0 |
|
|
103 |
|
|
0 |
|
|
Recognized prior service cost (credit) |
|
|
105 |
|
|
105 |
|
|
107 |
|
|
(16 |
) |
|
(16 |
) |
|
0 |
|
|
(101 |
) |
|
(101 |
) |
|
(93 |
) |
|
Recognized net initial obligation |
|
|
0 |
|
|
0 |
|
|
0 |
|
|
(67 |
) |
|
(67 |
) |
|
(67 |
) |
|
0 |
|
|
0 |
|
|
0 |
|
|
Recognized in other comprehensive income |
|
$ |
(2,064 |
) |
$ |
12,237 |
|
$ |
1,312 |
|
$ |
258 |
|
$ |
431 |
|
$ |
(166 |
) |
$ |
348 |
|
$ |
14 |
|
$ |
153 |
|
|
Total recognized in net periodic benefit cost and other comprehensive income |
|
$ |
1,283 |
|
$ |
13,558 |
|
$ |
2,818 |
|
$ |
811 |
|
$ |
993 |
|
$ |
327 |
|
$ |
1,263 |
|
$ |
860 |
|
$ |
995 |
|
72
Note 13 Employee Benefit Plans (continued)
Pre-tax amounts recognized as a component of accumulated other comprehensive income as of year-end that have not been recognized as a component of the Company’s combined net periodic benefit cost of the Company’s defined benefit retirement and pension plan, post-retirement healthcare benefit plan and SERP are presented in the following table.
|
|
|
|
|
|
|
|
|
|
|
|
|
|
|
|
|
|
|
|
|
|
|
|
|
|
|
|
|
|
|
(in thousands) |
|
Pension Plan |
|
Life and Healthcare Plan |
|
SERP Plan |
|
|||||||||||||||||||||
|
|
|
2009 |
|
2008 |
|
2007 |
|
2009 |
|
2008 |
|
2007 |
|
2009 |
|
2008 |
|
2007 |
|
|||||||||
|
Net actuarial loss (gain) |
|
$ |
21,820 |
|
$ |
23,989 |
|
$ |
11,857 |
|
$ |
276 |
|
$ |
(65 |
) |
$ |
(204 |
) |
$ |
2,367 |
|
$ |
1,918 |
|
$ |
1,906 |
|
|
Prior service cost (credit) |
|
|
(601 |
) |
|
(706 |
) |
|
(811 |
) |
|
343 |
|
|
359 |
|
|
0 |
|
|
499 |
|
|
600 |
|
|
598 |
|
|
Unrecognized net initial obligation |
|
|
0 |
|
|
0 |
|
|
0 |
|
|
252 |
|
|
319 |
|
|
386 |
|
|
0 |
|
|
0 |
|
|
0 |
|
|
Total |
|
$ |
21,219 |
|
$ |
23,283 |
|
$ |
11,046 |
|
$ |
871 |
|
$ |
613 |
|
$ |
182 |
|
$ |
2,866 |
|
$ |
2,518 |
|
$ |
2,504 |
|
The pre-tax amounts included in accumulated other comprehensive income that are expected to be recognized in net periodic pension cost during the fiscal year ended December 31, 2010 are shown below.
|
|
|
|
|
|
|
|
|
|
|
|
|
(in thousands) |
|
Pension |
|
Life and |
|
SERP Plan |
|
|||
|
Actuarial loss |
|
$ |
1,284 |
|
$ |
0 |
|
$ |
100 |
|
|
Prior service cost |
|
|
(131 |
) |
|
16 |
|
|
101 |
|
|
Net initial obligation |
|
|
0 |
|
|
67 |
|
|
0 |
|
|
Total |
|
$ |
1,153 |
|
$ |
83 |
|
$ |
201 |
|
Weighted-average assumptions used in accounting for the plans were as follows:
|
|
|
|
|
|
|
|
|
|
|
|
|
|
|
|
|
|
|
|
|
|
|
|
|
|
|
|
|
|
|
|
|
Pension Plan |
|
Life and Healthcare Plan |
|
SERP Plan |
|
|||||||||||||||||||||
|
|
|
2009 |
|
2008 |
|
2007 |
|
2009 |
|
2008 |
|
2007 |
|
2009 |
|
2008 |
|
2007 |
|
|||||||||
|
Discount rates: |
|
|
|
|
|
|
|
|
|
|
|
|
|
|
|
|
|
|
|
|
|
|
|
|
|
|
|
|
|
Benefit Cost for Plan Year |
|
|
6.05 |
% |
|
6.25 |
% |
|
6.00 |
% |
|
6.05 |
% |
|
6.25 |
% |
|
6.00 |
% |
|
6.05 |
% |
|
6.25 |
% |
|
6.00 |
% |
|
Benefit Obligation at End of Plan Year |
|
|
5.90 |
% |
|
6.05 |
% |
|
6.25 |
% |
|
5.90 |
% |
|
6.05 |
% |
|
6.25 |
% |
|
5.90 |
% |
|
6.05 |
% |
|
6.25 |
% |
|
Expected long-term return on plan assets |
|
|
7.50 |
% |
|
8.25 |
% |
|
8.25 |
% |
|
N/A |
|
|
N/A |
|
|
N/A |
|
|
N/A |
|
|
N/A |
|
|
N/A |
|
|
Rate of compensation increase |
|
|
|
|
|
|
|
|
|
|
|
|
|
|
|
|
|
|
|
|
|
|
|
|
|
|
|
|
|
Benefit Cost for Plan Year |
|
|
5.50 |
% |
|
5.50 |
% |
|
5.00 |
% |
|
5.50 |
% |
|
5.50 |
% |
|
4.00 |
% |
|
5.00 |
% |
|
5.00 |
% |
|
5.00 |
% |
|
Benefit Obligation at End of Plan Year |
|
|
5.50 |
% |
|
5.50 |
% |
|
5.50 |
% |
|
5.50 |
% |
|
5.50 |
% |
|
5.50 |
% |
|
5.00 |
% |
|
5.00 |
% |
|
5.00 |
% |
Tompkins Trust Company offers post-retirement life and healthcare benefits, although as previously mentioned, has discontinued adding participants to the plan effective January 1, 2005. The weighted average annual assumed rate of increase in the per capita cost of covered benefits (the health care cost trend rate) is 8.0% beginning in 2009, and is assumed to decrease gradually to 5.0% in 2020 and beyond. A 1% increase in the assumed health care cost trend rate, would increase service and interest costs by approximately $11,000 and increase the Company’s benefit obligation by approximately $139,000. A 1% decrease in the assumed health care cost trend rate, would decrease service and interest costs by approximately $11,000 and decrease the Company’s benefit obligation by approximately $136,000.
To develop the expected long-term rate of return on asset assumption, the Company considered the historical returns and the future expectations for returns for each asset class, as well as target asset allocations of the pension portfolio. Based on this analysis, the Company selected 7.50% as the long-term rate of return on assets assumption.
The discount rate used to determine the Company’s pension and other post-retirement benefit obligations as of December 31, 2009, and December 31, 2008, were determined by matching estimated benefit cash flows to a yield curve derived from Citigroup’s regular bond yield and above-median bond yield curve at December 31, 2009 and December 31, 2008.
Cash Flows
Plan assets are amounts that have been segregated and restricted to provide benefits, and include amounts contributed by the Company and amounts earned from investing contributions, less benefits paid. The Company funds the cost of the SERP and the post-retirement medical and life insurance benefits on a pay-as-you-go basis.
73
Note 13 Employee Benefit Plans (continued)
The benefits as of December 31, 2009, expected to be paid in each of the next five fiscal years, and in the aggregate for the five fiscal years thereafter were as follows:
|
|
|
|
|
|
|
|
|
|
|
|
|
(in thousands) |
|
Pension |
|
Life and |
|
SERP Plan |
|
|||
|
2010 |
|
|
1,975 |
|
|
376 |
|
|
285 |
|
|
2011 |
|
|
2,052 |
|
|
388 |
|
|
283 |
|
|
2012 |
|
|
2,167 |
|
|
401 |
|
|
281 |
|
|
2013 |
|
|
2,296 |
|
|
430 |
|
|
278 |
|
|
2014 |
|
|
2,440 |
|
|
447 |
|
|
268 |
|
|
2015-2019 |
|
|
15,764 |
|
|
2,526 |
|
|
2,333 |
|
|
Total |
|
$ |
26,694 |
|
$ |
4,568 |
|
$ |
3,728 |
|
The Company is not required to make a contribution to its Pension Plan in 2010; however, the Company may contribute to the pension plan in 2010.
Plan Assets
The Company’s defined benefit retirement and pension plan weighted-average asset allocations at December 31, 2009 and 2008, by asset category are as follows:
|
|
|
|
|
|
|
|
|
|
|
|
2009 |
|
2008 |
|
||
|
Equity securities |
|
|
74 |
% |
|
56 |
% |
|
Debt securities |
|
|
25 |
% |
|
28 |
% |
|
Other |
|
|
1 |
% |
|
16 |
% |
|
Total Allocation |
|
|
100 |
% |
|
100 |
% |
It is the policy of the Trustees to invest the Pension Trust Fund (the “Fund”) for total return. The Trustees seek the maximum return consistent with the interests of the participants and beneficiaries and prudent investment management. The management of the Fund’s assets is in compliance with the guidelines established in the Company’s Pension Plan and Trust Investment Policy, which is reviewed and approved annually by the Tompkins Board of Directors, and the Pension Investment Review Committee.
The intention is for the Fund to be prudently diversified. The Fund’s investments will be invested among the fixed income, equity and cash equivalent sectors. The pension committee will designate minimum and maximum positions in any of the sectors. In no case shall more than 10% of the Fund assets consist of qualified securities or real estate of the Company. Unless otherwise approved by the Trustees, the following investments are prohibited:
|
|
|
|
|
|
1. |
Restricted stock, private placements, short positions, calls, puts, or margin transactions; |
|
|
|
|
|
|
2. |
Commodities, oil and gas properties, real estate properties, or |
|
|
|
|
|
|
3. |
Any investment that would constitute a prohibited transaction as described in the Employee Retirement Income Security Act of 1974 (“ERISA”), section 407, 29 U.S.C. 1106. |
In general, the investment in debt securities is limited to readily marketable debt securities having a Standard & Poor’s rating of “A” or Moody’s rating of “A”, securities of, or guaranteed by the United States Government or its agencies, or obligations of banks or their holding companies that are rated in the three highest ratings assigned by Fitch Investor Service, Inc. In addition, investments in equity securities must be listed on the NYSE or are traded on the national Over The Counter market or listed on the NASDAQ. Cash equivalents generally may be United States Treasury obligations, commercial paper having a Standard & Poor’s rating of “A-1” or Moody’s National Credit Officer rating of “P-1”or higher.
74
Note 13 Employee Benefit Plans (continued)
The major categories of assets in the Company’s Pension Plan as of year-end are presented in the following table. Assets are segregated by the level of valuation inputs within the fair value hierarchy established by ASC Topic 820 utilized to measure fair value (see Note 19 – Fair Value Measurements).
|
|
|
|
|
|
|
|
|
|
|
|
|
|
|
|
Fair Value
Measurements |
|
|
|
|
|
|
|
|
|
|
|
|
|
|
(In thousands) |
|
Fair |
|
Quoted Prices |
|
Significant Other |
|
Significant |
|
||||
|
|
|
|
|
|
|
|
|
|
|
|
|
|
|
|
Cash and cash equivalents |
|
$ |
478 |
|
$ |
478 |
|
$ |
0 |
|
$ |
0 |
|
|
U.S. Treasury securities |
|
|
1,871 |
|
|
1,871 |
|
|
0 |
|
|
0 |
|
|
U.S. Government agency securities |
|
|
1,739 |
|
|
0 |
|
|
1,739 |
|
|
0 |
|
|
Corporate bonds and notes |
|
|
6,016 |
|
|
0 |
|
|
6,016 |
|
|
0 |
|
|
Common stocks |
|
|
14,204 |
|
|
14,204 |
|
|
0 |
|
|
0 |
|
|
Mutual funds |
|
|
13,328 |
|
|
13,328 |
|
|
0 |
|
|
0 |
|
|
Preferred stocks |
|
|
750 |
|
|
0 |
|
|
750 |
|
|
0 |
|
|
|
|
|
|
|
|
|
|
|
|
|
|
|
|
|
Total Fair Value of Plan Assets |
|
$ |
38,386 |
|
$ |
29,881 |
|
$ |
8,505 |
|
$ |
0 |
|
The Company determines the fair value for its pension plan assets using an independent pricing service. The pricing service uses a variety of techniques to determine fair value, including market maker bids, quotes and pricing models. Inputs to the model include recent trades, benchmark interest rates, spreads, and actual and projected cash flows. Based on the inputs used by our independent pricing services, we identify the appropriate level within the fair value hierarchy to report these fair values. U.S. Treasury securities, common stocks and mutual funds are considered Level 1 based on quoted prices in active markets.
The Company has an Employee Stock Ownership Plan (ESOP) and a 401(k) Investment and Stock Ownership Plan (ISOP) covering substantially all employees of the Company. The ESOP allows for Company contributions in the form of common stock of the Company. Annually, the Tompkins Board of Directors determines a profit-sharing payout to its employees in accordance with a performance-based formula. A percentage of the approved amount is paid in Company common stock into the ESOP. Contributions are limited to a maximum amount as stipulated in the ESOP. The remaining percentage is either paid out in cash or deferred into the ISOP at the direction of the employee. Compensation expense related to the ESOP and ISOP totaled $2.7 million in 2009, $2.7 million in 2008, and $1.4 million in 2007.
Under the ISOP, employees may contribute a percentage of their eligible compensation with a Company match of such contributions up to a maximum match of 4%. The Company provided certain matching contributions to the ISOP based upon the amount of contributions made by plan participants. The expense associated with these matching provisions was $1.2 million in 2009, $1.2 million in 2008, and $1.1 million in 2007.
Life insurance benefits are provided to certain officers of the Company. In connection with these policies, the Company reflects life insurance assets on its Consolidated Statements of Condition of $36.0 million at December 31, 2009, and $34.8 million at December 31, 2008. The insurance is carried at its cash surrender value on the Consolidated Statements of Condition. Increases in the cash surrender value of the insurance are reflected as noninterest income, net of any related mortality expense.
The Company provides split dollar life insurance benefits to certain employees. On January 1, 2008, the Company changed its accounting policy and recognized a cumulative-effect adjustment to retained earnings totaling $582,000 related to accounting for certain endorsement split-dollar life insurance arrangements in connection with the adoption of FASB ASC Topic 718, Compensation – Retirement Benefits (“ASC Topic 718”). The plan is unfunded and the estimated liability of the plan of $728,000 was recorded in other liabilities in the Consolidated Statements of Condition at December 31, 2009. Compensation expense related to the split dollar life insurance was approximately $64,000 in 2009.
Note 14 Stock Plans and Stock Based Compensation
Under the Tompkins Financial Corporation 2009 Equity Plan (“2009 Equity Plan”), the Company may grant incentive stock options, stock appreciation rights, shares of restricted stock and restricted stock units covering up to 902,000 common shares to certain officers, employees, and nonemployee directors. Stock options are granted at an exercise price equal to the stock’s fair market value at the date of grant, may not have a term in excess of ten years, and have vesting periods that range between one and seven years from the grant date. Prior to the adoption of the 2009 Equity Plan, the Company had similar stock option plans, which remain in effect solely with respect to unexercised options issued under these plans. The Company granted 235,070 equity awards to its employees in
75
Note 14 Stock Plans and Stock Based Compensation (continued)
the third quarter of 2009. The third quarter 2009 awards included 14,190 of restricted stock and 220,880 of stock appreciation rights. The Company granted 2,200 incentive stock options in 2008 and 325,875 incentive stock options in 2007. The Company’s practice is to issue original issue shares of its common stock upon exercise of equity awards rather than treasury shares. Share numbers and share prices have been retroactively adjusted to reflect the 10% stock dividend paid on February 15, 2010.
The following table presents the activity related to stock options under all plans for the twelve months ended December 31, 2009.
|
|
|
|
|
|
|
|
|
|
|
|
|
|
|
|
|
|
Number of Shares |
|
Weighted Average |
|
Weighted Average |
|
Aggregate |
|
||||
|
Outstanding at January 1, 2009 |
|
|
888,328 |
|
$ |
35.44 |
|
|
|
|
|
|
|
|
Granted |
|
|
220,880 |
|
|
41.71 |
|
|
|
|
|
|
|
|
Exercised |
|
|
(46,152 |
) |
|
28.71 |
|
|
|
|
|
|
|
|
Expired |
|
|
0 |
|
|
0.00 |
|
|
|
|
|
|
|
|
Forfeited |
|
|
(19,213 |
) |
|
37.82 |
|
|
|
|
|
|
|
|
Outstanding at December 31, 2009 |
|
|
1,043,843 |
|
$ |
37.08 |
|
|
6.65 |
|
$ |
1,475,067 |
|
|
Exercisable at December 31, 2009 |
|
|
419,399 |
|
$ |
33.68 |
|
|
4.41 |
|
$ |
1,475,067 |
|
Total stock-based compensation expense for stock options was $912,000 in 2009, $931,000 in 2008 and $713,000 in 2007.
The
total intrinsic value, which is the amount by which the fair value of the
underlying stock exceeds the exercise price of an option on the exercise date,
of options exercised was $730,000 in 2009, $2.1 million in 2008 and $780,000 in
2007.
As of December 31, 2009, unrecognized compensation cost related to
unvested stock options totaled $5.6 million. The cost is expected to be
recognized over a weighted average period of 5.4 years. The amount of cash
received from the exercise of stock options was $1.0 million in 2009, $3.4
million for 2008, and $647,000 for 2007, respectively. The tax benefit realized
from stock options exercised during 2009, 2008, and 2007 was $163,000, $587,000,
and $51,000, respectively.
The Company uses the Black-Scholes option-valuation model to determine the fair value of each incentive stock options and stock appreciation rights at the date of grant. This valuation model estimates fair value based on the assumptions listed in the table below. The risk-free interest rate is the interest rate available on zero-coupon U.S. Treasury instruments with a remaining term equal to the expected term of the share option at the time of grant. The expected dividend yield is based on dividend trends and the market price of the Company’s stock price at grant. Volatility is largely based on historical volatility of the Company’s stock price. Expected term is based upon historical experience of employee exercises and terminations as well as the vesting term of the grants.
|
|
|
|
|
|
|
|
|
|
|
|
|
|
|
2009 |
|
2008 |
|
2007 |
|
|||
|
Weighted per share average fair value at grant date |
|
$ |
13.12 |
|
$ |
13.45 |
|
$ |
10.17 |
|
|
Risk-free interest rate |
|
|
2.90 |
% |
|
3.69 |
% |
|
3.55 |
% |
|
Expected dividend yield |
|
|
3.13 |
% |
|
2.57 |
% |
|
3.12 |
% |
|
Volatility |
|
|
40.03 |
% |
|
33.00 |
% |
|
32.97 |
% |
|
Expected life (years) |
|
|
6.50 |
|
|
6.50 |
|
|
6.50 |
|
The following summarizes outstanding and exercisable options at December 31, 2009:
|
|
|
|
|
|
|
|
|
|
|
|
|
|
|
|
|
|
|
|
|
|
|
|
|
|
|
|
|
|
|
Options Outstanding |
|
Options Exercisable |
|
|||||||||||||||||||||
|
Range of |
|
Number |
|
Weighted Average |
|
Weighted |
|
Number |
|
Weighted |
|
|||||||||||||||
|
$20.00-29.30 |
|
|
|
131,276 |
|
|
|
|
2.21 |
|
|
|
$ |
26.95 |
|
|
|
|
131,276 |
|
|
|
$ |
26.95 |
|
|
|
$29.31-35.70 |
|
|
|
8,011 |
|
|
|
|
4.04 |
|
|
|
$ |
34.95 |
|
|
|
|
8,011 |
|
|
|
$ |
34.95 |
|
|
|
$35.71-35.78 |
|
|
|
154,983 |
|
|
|
|
4.34 |
|
|
|
$ |
35.77 |
|
|
|
|
154,983 |
|
|
|
$ |
35.77 |
|
|
|
$35.79-36.00 |
|
|
|
2,420 |
|
|
|
|
5.76 |
|
|
|
$ |
35.87 |
|
|
|
|
2,420 |
|
|
|
$ |
35.87 |
|
|
|
$36.01-37.50 |
|
|
|
279,132 |
|
|
|
|
7.91 |
|
|
|
$ |
37.28 |
|
|
|
|
47,552 |
|
|
|
$ |
37.28 |
|
|
|
$37.51-41.00 |
|
|
|
244,941 |
|
|
|
|
6.19 |
|
|
|
$ |
38.68 |
|
|
|
|
75,157 |
|
|
|
$ |
38.62 |
|
|
|
$41.01-50.00 |
|
|
|
223,080 |
|
|
|
|
9.70 |
|
|
|
$ |
41.75 |
|
|
|
|
0 |
|
|
|
$ |
0.00 |
|
|
|
|
|
|
|
1,043,843 |
|
|
|
|
6.65 |
|
|
|
$ |
37.08 |
|
|
|
|
419,399 |
|
|
|
$ |
33.68 |
|
|
76
Note 14 Stock Plans and Stock Based Compensation (continued)
The Company granted 14,190 restricted stock awards during the third quarter of 2009, with a grant date fair value of $41.71, which was the closing price of the Company’s common stock on the grant date. Prior to 2009, there were no restricted stock awards. The Company recognized stock-based compensation related to these restricted stock awards of $26,000 in 2009. Unrecognized compensation costs related to the restricted stock awards totaled $539,000 at December 31, 2009 and will be recognized over 6.7 years on a weighted average basis.
|
|
|
|
|
|
|
|
|
|
|
|
Number of Shares |
|
Weighted Average Exercise |
|
||
|
Unvested at January 1, 2009 |
|
|
0 |
|
$ |
0.00 |
|
|
Granted |
|
|
14,190 |
|
|
41.71 |
|
|
Vested |
|
|
0 |
|
|
0.00 |
|
|
Forfeited |
|
|
0 |
|
|
0.00 |
|
|
Unvested at December 31, 2009 |
|
|
14,190 |
|
$ |
41.71 |
|
Note 15 Other Noninterest Income and Expense
Other noninterest income and expense totals are presented in the table below. Components of these totals exceeding 1% of the aggregate of total interest income and total noninterest income for any of the years presented below are stated separately.
|
|
|
|
|
|
|
|
|
|
|
|
|
|
|
Year ended December 31 |
|
|||||||
|
(in thousands except per share data) |
|
2009 |
|
2008 |
|
2007 |
|
|||
|
NONINTEREST INCOME |
|
|
|
|
|
|
|
|
|
|
|
Other service charges |
|
$ |
1,937 |
|
$ |
2,657 |
|
$ |
2,643 |
|
|
Increase in cash surrender value of corporate owned life insurance |
|
|
1,090 |
|
|
1,448 |
|
|
1,122 |
|
|
Net gain on sale of loans |
|
|
1,357 |
|
|
105 |
|
|
159 |
|
|
Other income |
|
|
1,549 |
|
|
1,583 |
|
|
1,131 |
|
|
Total Other Noninterest Income |
|
$ |
5,933 |
|
$ |
5,793 |
|
$ |
5,055 |
|
|
NONINTEREST EXPENSES |
|
|
|
|
|
|
|
|
|
|
|
Marketing expense |
|
$ |
3,778 |
|
$ |
3,581 |
|
$ |
3,013 |
|
|
Professional Fees |
|
|
3,307 |
|
|
3,011 |
|
|
3,258 |
|
|
Software licensing and maintenance |
|
|
2,812 |
|
|
2,503 |
|
|
2,071 |
|
|
Cardholder expense |
|
|
1,532 |
|
|
1,225 |
|
|
974 |
|
|
Other operating expenses |
|
|
13,874 |
|
|
13,414 |
|
|
12,758 |
|
|
Total Other Noninterest Expenses |
|
$ |
25,303 |
|
$ |
23,734 |
|
$ |
22,074 |
|
Note 16 Income Taxes
The income tax (benefit) expense attributable to income from operations is summarized as follows:
|
|
|
|
|
|
|
|
|
|
|
|
|
(in thousands) |
|
Current |
|
Deferred |
|
Total |
|
|||
|
2009 |
|
|
|
|
|
|
|
|
|
|
|
Federal |
|
$ |
15,896 |
|
$ |
(1,362 |
) |
$ |
14,055 |
|
|
State |
|
|
1,341 |
|
|
(492 |
) |
|
1,328 |
|
|
Total |
|
$ |
17,237 |
|
$ |
(1,854 |
) |
$ |
15,383 |
|
|
2008 |
|
|
|
|
|
|
|
|
|
|
|
Federal |
|
$ |
11,538 |
|
$ |
1,090 |
|
$ |
12,628 |
|
|
State |
|
|
1,148 |
|
|
34 |
|
|
1,182 |
|
|
Total |
|
$ |
12,686 |
|
$ |
1,124 |
|
$ |
13,810 |
|
|
2007 |
|
|
|
|
|
|
|
|
|
|
|
Federal |
|
$ |
12,806 |
|
$ |
(1,351 |
) |
$ |
11,455 |
|
|
State |
|
|
714 |
|
|
(178 |
) |
|
536 |
|
|
Total |
|
$ |
13,520 |
|
$ |
(1,529 |
) |
$ |
11,991 |
|
77
Note 16 Income Taxes (continued)
The primary reasons for the differences between income tax expense and the amount computed by applying the statutory federal income tax rate to earnings are as follows:
|
|
|
|
|
|
|
|
|
|
|
|
|
|
|
2009 |
|
2008 |
|
2007 |
|
|||
|
Statutory federal income tax rate |
|
|
35.0 |
% |
|
35.0 |
% |
|
35.0 |
% |
|
State income taxes, net of federal benefit |
|
|
1.8 |
|
|
1.8 |
|
|
0.9 |
|
|
Tax exempt income |
|
|
(3.3 |
) |
|
(3.3 |
) |
|
(3.2 |
) |
|
All other |
|
|
(0.9 |
) |
|
(1.9 |
) |
|
(1.4 |
) |
|
Total |
|
|
32.6 |
% |
|
31.6 |
% |
|
31.3 |
% |
Deferred income taxes reflect the net tax effects of temporary differences between the carrying amounts of assets and liabilities for financial reporting purposes and the amounts used for income tax purposes. Significant components of the Company’s deferred tax assets and liabilities as of December 31 were as follows:
|
|
|
|
|
|
|
|
|
|
|
|
|
(in thousands) |
|
2009 |
|
2008 |
|
2007 |
|
|||
|
Deferred tax assets: |
|
|
|
|
|
|
|
|
|
|
|
Allowance for loan and lease losses |
|
$ |
9,544 |
|
$ |
7,344 |
|
$ |
5,803 |
|
|
Compensation and benefits |
|
|
8,218 |
|
|
7,161 |
|
|
6,860 |
|
|
Liabilities held at fair value |
|
|
727 |
|
|
1,327 |
|
|
534 |
|
|
Other |
|
|
2,050 |
|
|
4,165 |
|
|
2,170 |
|
|
Total deferred tax assets |
|
$ |
20,539 |
|
$ |
19,997 |
|
$ |
15,367 |
|
|
Deferred tax liabilities: |
|
|
|
|
|
|
|
|
|
|
|
Pension |
|
$ |
6,017 |
|
$ |
7,334 |
|
$ |
3,895 |
|
|
Depreciation |
|
|
748 |
|
|
1,149 |
|
|
382 |
|
|
Intangibles |
|
|
2,306 |
|
|
1,360 |
|
|
499 |
|
|
Other |
|
|
829 |
|
|
1,369 |
|
|
817 |
|
|
Total deferred tax liabilities |
|
$ |
9,900 |
|
$ |
11,212 |
|
$ |
5,593 |
|
|
Net deferred tax asset at year-end |
|
$ |
10,639 |
|
$ |
8,785 |
|
$ |
9,774 |
|
|
Net deferred tax asset at beginning of year |
|
$ |
8,785 |
|
$ |
9,774 |
|
$ |
7,243 |
|
|
(Decrease) increase in net deferred tax asset |
|
|
1,854 |
|
|
(989 |
) |
|
2,531 |
|
|
Purchase accounting adjustments, net |
|
|
0 |
|
|
135 |
|
|
(1,002 |
) |
|
Deferred tax (benefit) expense |
|
$ |
(1,854 |
) |
$ |
1,124 |
|
$ |
(1,529 |
) |
This analysis does not include recorded deferred tax liabilities of $7.9 million and $5.5 million as of December 31, 2009 and 2008, respectively, related to net unrealized holding gains in the available-for-sale securities portfolio. In addition, the analysis excludes the recorded deferred tax assets of $10.0 million and $10.6 million, as of December 31, 2009 and 2008, respectively, related to employee benefit plans.
Realization of deferred tax assets is dependent upon the generation of future taxable income or the existence of sufficient taxable income within the carry-back period. A valuation allowance is provided when it is more likely than not that some portion of the deferred tax assets will not be realized. In assessing the need for a valuation allowance, management considers the scheduled reversal of the deferred tax liabilities, the level of historical taxable income, and the projected future taxable income over the periods in which the temporary differences comprising the deferred tax assets will be deductible. Based on its assessment, management determined that no valuation allowance is necessary at December 31, 2009 and 2008.
At December 31, 2009 and December 31, 2008, the Company had no unrecognized tax benefits. The Company does not expect the total amount of unrecognized tax benefits to significantly increase within the next twelve months. The Company recognizes interest and penalties on unrecognized tax benefits in income tax expense in its Consolidated Statements of Income.
The Company is subject to U.S. federal income tax and income tax in various state jurisdictions. All tax years ending after December 31, 2006 are open to examination by the taxing authorities.
78
Note 17 Commitments and Contingent Liabilities
The Company, in the normal course of business, is a party to financial instruments with off-balance-sheet risk to meet the financial needs of its customers. These financial instruments include loan commitments, standby letters of credit, and unused portions of lines of credit. The contract, or notional amount, of these instruments represents the Company’s involvement in particular classes of financial instruments. These instruments involve, to varying degrees, elements of credit and interest rate risk in excess of the amount recognized on the Consolidated Statements of Condition. The Company minimizes its exposure to loss under these commitments by subjecting them to credit approval and monitoring procedures.
The Company’s maximum potential obligations to extend credit for loan commitments (unfunded loans, unused lines of credit, and standby letters of credit) outstanding on December 31 were as follows:
|
|
|
|
|
|
|
|
|
|
(in thousands) |
|
2009 |
|
2008 |
|
||
|
Loan commitments |
|
$ |
135,769 |
|
$ |
54,143 |
|
|
Standby letters of credit |
|
|
50,522 |
|
|
45,092 |
|
|
Undisbursed portion of lines of credit |
|
|
231,900 |
|
|
289,713 |
|
|
Total |
|
$ |
418,191 |
|
$ |
388,948 |
|
Commitments to extend credit (including lines of credit) are agreements to lend to a customer as long as there is no violation of any condition established in the contract. Commitments generally have fixed expiration dates or other termination clauses and may require payment of a fee. Standby letters of credit are conditional commitments to guarantee the performance of a customer to a third party. The Company extends standby letters of credit to its customers in the normal course of business. The standby letters of credit are generally short-term. As of December 31, 2009, the Company’s maximum potential obligation under standby letters of credit was $50.5 million. Management uses the same credit policies in making commitments to extend credit and standby letters of credit as are used for on-balance-sheet lending decisions. Based upon management’s evaluation of the counterparty, the Company may require collateral to support commitments to extend credit and standby letters of credit. The credit risk amounts are equal to the contractual amounts, assuming the amounts are fully advanced and collateral or other security is of no value. The Company does not anticipate losses as a result of these transactions. These commitments also have off-balance-sheet interest-rate risk, in that the interest rate at which these commitments were made may not be at market rates on the date the commitments are fulfilled. Since some commitments and standby letters of credit are expected to expire without being drawn upon, the total commitment amounts do not necessarily represent future cash flow requirements.
At December 31, 2009, the Company had rate lock agreements associated with mortgage loans to be sold in the secondary market (certain of which relate to loan applications for which no formal commitment has been made) amounting to approximately $6.5 million. In order to limit the interest rate risk associated with rate lock agreements, as well as the interest rate risk associated with mortgages held for sale, if any, the Company enters into agreements to sell loans in the secondary market to unrelated investors on a loan-by-loan basis. At December 31, 2009, the Company had approximately $6.5 million of commitments to sell mortgages to unrelated investors on a loan-by-loan basis.
In the normal course of business, the Company is involved in various legal proceedings. In the opinion of management, based upon the review with counsel, the proceedings are not expected to have a material effect on the Company’s financial condition or results of operations.
In October 2007, Visa USA (“Visa”) completed a reorganization in contemplation of its initial public offering (“IPO”) expected to occur in 2008. As part of that reorganization, Tompkins and other member banks of Visa received shares of common stock of Visa, Inc. Those banks are also obligated under various agreements with Visa to share in losses stemming from certain litigation (“Covered Litigation”). Tompkins is not a named defendant in any of the Covered Litigation. Guidance from the Securities and Exchange Commission (“SEC”) indicates that Visa member banks should record a liability for the fair value of the contingent obligation to Visa in accordance with accounting guidance. The estimation of the Company’s proportionate share of any potential losses related to the Covered Litigation is extremely difficult and involves a great deal of judgment.
As of December 31, 2009, the Company has a liability of $450,000 included as a component of “Other Liabilities” in the Consolidated Statements of Condition, representing its estimate of the fair value of potential losses related to the remaining covered Visa litigation. The estimation of the Company’s proportionate share of any potential losses related to certain Covered Litigation is extremely difficult and involves a high degree of judgment. The Company’s proportionate share of the remaining covered Visa litigation is subject to change depending upon future litigation developments. Class B shares which were not redeemed will be converted to Class A shares, at a conversion rate to be determined based upon the member banks’ actual liability for litigation expenses, on the later of three years or the settlement of the litigation indemnified by the member banks. However, the remaining Class B shares are available to fund future Visa litigation liabilities indemnified by the member banks until that time.
79
Note 18 Earnings Per Share
Calculation of basic earnings per share (Basic EPS) and diluted earnings per share (Diluted EPS) is shown below. Share and per share data was retroactively adjusted to reflect a 10% stock dividend approved on January 26, 2010, and paid on February 15, 2010.
|
|
|
|
|
|
|
|
|
|
|
|
|
For year ended
December 31, 2009 |
|
Net |
|
Weighted |
|
Per Share |
|
|||
|
Basic EPS: |
|
|
|
|
|
|
|
|
|
|
|
Net income attributable to Tompkins Financial Corporation |
|
$ |
31,831 |
|
|
10,686,989 |
|
$ |
2.98 |
|
|
|
|
|
|
|
|
|
|
|
|
|
|
Effect of potentially dilutive common shares: |
|
|
|
|
|
72,531 |
|
|
|
|
|
|
|
|
|
|
|
|
|
|
|
|
|
Diluted EPS: |
|
|
|
|
|
|
|
|
|
|
|
Net income attributable to Tompkins Financial Corporation plus assumed conversions |
|
$ |
31,831 |
|
|
10,759,520 |
|
$ |
2.96 |
|
The effect of dilutive securities calculation for the year ended December 31, 2009, excludes stock options and stock appreciation rights covering an aggregate of 637,436 of common stock because they are anti-dilutive.
|
|
|
|
|
|
|
|
|
|
|
|
|
For year ended
December 31, 2008 |
|
Net |
|
Weighted |
|
Per Share |
|
|||
|
Basic EPS: |
|
|
|
|
|
|
|
|
|
|
|
Net income attributable to Tompkins Financial Corporation |
|
$ |
29,834 |
|
|
10,616,475 |
|
$ |
2.81 |
|
|
|
||||||||||
|
Effect of potentially dilutive common shares: |
|
|
|
|
|
102,367 |
|
|
|
|
|
|
||||||||||
|
Diluted EPS: |
|
|
|
|
|
|
|
|
|
|
|
Net income attributable to Tompkins Financial Corporation plus assumed conversions |
|
$ |
29,834 |
|
|
10,718,842 |
|
$ |
2.78 |
|
The effect of dilutive securities calculation for the year ended December 31, 2008, excludes stock options covering 536,100 shares of common stock because they are anti-dilutive.
|
|
|
|
|
|
|
|
|
|
|
|
|
For year ended
December 31, 2007 |
|
Net |
|
Weighted |
|
Per Share |
|
|||
|
Basic EPS: |
|
|
|
|
|
|
|
|
|
|
|
Net income attributable to Tompkins Financial Corporation |
|
$ |
26,371 |
|
|
10,666,396 |
|
$ |
2.47 |
|
|
|
||||||||||
|
Effect of potentially dilutive common shares: |
|
|
|
|
|
83,130 |
|
|
|
|
|
Shares issuable as contingent consideration for acquisition |
|
|
|
|
|
10,442 |
|
|
|
|
|
|
||||||||||
|
Diluted EPS: |
|
|
|
|
|
|
|
|
|
|
|
|
||||||||||
|
Net income attributable to Tompkins Financial Corporation plus assumed conversions |
|
$ |
26,371 |
|
|
10,759,968 |
|
$ |
2.45 |
|
The effect of dilutive securities calculation for the year ended December 31, 2007, excludes stock options covering 422,077 shares of common stock because they are anti-dilutive.
80
Note 19 Fair Value Measurements
FASB ASC Topic 820, Fair Value Measurements and Disclosures, defines fair value, establishes a framework for measuring fair value in generally accepted accounting principles and expands disclosures about fair value measurements. FASB ASC Topic 820 also establishes a fair value hierarchy that prioritizes the inputs to valuation techniques used to measure fair value. The hierarchy gives the highest priority to unadjusted quoted prices in active markets for identical assets or liabilities (level 1 measurements) and the lowest priority to unobservable inputs (Level 3 measurements).
The three levels of the fair value hierarchy are:
Level 1 – Unadjusted quoted prices in active markets that are accessible at the measurement date for identical, unrestricted assets or liabilities;
Level 2 – Quoted prices for similar assets or liabilities in active markets, quoted prices for identical or similar assets or liabilities in markets that are not active, or inputs that are observable, either directly or indirectly, for substantially the full term of the asset or liability;
Level 3 – Prices or valuation techniques that require inputs that are both significant to the fair value measurement and unobservable (i.e., supported by little or no market activity).
The following table summarizes financial assets and financial liabilities measured at fair value on a recurring basis as of December 31, 2009 and 2008, segregated by the level of valuation inputs within the fair value hierarchy used to measure fair value.
|
|
|
|
|
|
|
|
|
|
|
|
|
|
|
|
Recurring Fair Value
Measurements |
|
|
|
|
|
|
|
|
|
||||
|
(In thousands) |
|
Fair |
|
Quoted Prices |
|
Significant Other |
|
Significant |
|
||||
|
Trading securities |
|
|
|
|
|
|
|
|
|
|
|
|
|
|
Obligations of U.S. Government sponsored entities |
|
$ |
17,986 |
|
$ |
17,986 |
|
$ |
0 |
|
$ |
0 |
|
|
Mortgage-backed securities – residential |
|
|
13,732 |
|
|
13,732 |
|
|
0 |
|
|
0 |
|
|
|
|
|
|
|
|
|
|
|
|
|
|
|
|
|
Available-for-sale securities |
|
|
|
|
|
|
|
|
|
|
|
|
|
|
U.S. Treasury securities |
|
|
2,079 |
|
|
2,079 |
|
|
0 |
|
|
0 |
|
|
Obligations of U.S. Government sponsored entities |
|
|
379,015 |
|
|
0 |
|
|
379,015 |
|
|
0 |
|
|
Obligations of U.S. states and political subdivisions |
|
|
63,695 |
|
|
0 |
|
|
63,695 |
|
|
0 |
|
|
Mortgage-backed securities – residential |
|
|
477,681 |
|
|
0 |
|
|
477,681 |
|
|
0 |
|
|
U.S. corporate debt securities |
|
|
5,136 |
|
|
0 |
|
|
5,136 |
|
|
0 |
|
|
Equity securities |
|
|
1,164 |
|
|
0 |
|
|
0 |
|
|
1,164 |
|
|
|
|
|
|
|
|
|
|
|
|
|
|
|
|
|
Borrowings |
|
|
|
|
|
|
|
|
|
|
|
|
|
|
Securities sold under agreement to Repurchase |
|
|
5,500 |
|
|
0 |
|
|
5,500 |
|
|
0 |
|
|
Other borrowings |
|
|
11,335 |
|
|
0 |
|
|
11,335 |
|
|
0 |
|
|
|
|
|
|
|
|
|
|
|
|
|
|
|
|
The change in the fair value of the $1.2 million of available-for-sale securities valued using significant unobservable inputs (Level 3), between January 1, 2009 and December 31, 2009 was immaterial.
81
Note 19 Fair Value Measurements (continued)
|
|
|
|
|
|
|
|
|
|
|
|
|
|
|
|
Recurring Fair Value
Measurements |
|
|
|
|
|
|
|
|
|
|
|
|
|
|
(In thousands) |
|
Fair |
|
Quoted Prices |
|
Significant Other |
|
Significant |
|
||||
|
Trading securities |
|
|
|
|
|
|
|
|
|
|
|
|
|
|
Obligations of U.S. Government sponsored entities |
|
$ |
18,370 |
|
$ |
18,370 |
|
$ |
0 |
|
$ |
0 |
|
|
Mortgage-backed securities – Residential |
|
|
19,731 |
|
|
19,731 |
|
|
0 |
|
|
0 |
|
|
|
|
|
|
|
|
|
|
|
|
|
|
|
|
|
Available-for-sale securities |
|
|
|
|
|
|
|
|
|
|
|
|
|
|
U.S. Treasury securities |
|
|
3,263 |
|
|
3,263 |
|
|
0 |
|
|
0 |
|
|
Obligations of U.S. Government sponsored entities |
|
|
196,262 |
|
|
0 |
|
|
196,262 |
|
|
0 |
|
|
Obligations of U.S. states and political subdivisions |
|
|
63,554 |
|
|
0 |
|
|
63,554 |
|
|
0 |
|
|
Mortgage-backed securities – residential |
|
|
473,971 |
|
|
0 |
|
|
473,971 |
|
|
0 |
|
|
U.S. corporate debt securities |
|
|
2,500 |
|
|
0 |
|
|
2,500 |
|
|
0 |
|
|
Equity securities |
|
|
1,669 |
|
|
0 |
|
|
0 |
|
|
1,669 |
|
|
|
|
|
|
|
|
|
|
|
|
|
|
|
|
|
Borrowings |
|
|
|
|
|
|
|
|
|
|
|
|
|
|
Securities sold under agreement to Repurchase |
|
|
16,170 |
|
|
0 |
|
|
16,170 |
|
|
0 |
|
|
Other borrowings |
|
|
12,179 |
|
|
0 |
|
|
12,179 |
|
|
0 |
|
|
|
|
|
|
|
|
|
|
|
|
|
|
|
|
The Company determines fair value for its trading securities using independently quoted market prices. The Company determines fair value for its available-for-sale securities using an independent bond pricing service for identical assets or very similar securities. The pricing service uses a variety of techniques to determine fair value, including market maker bids, quotes and pricing models. Inputs to the model include recent trades, benchmark interest rates, spreads, and actual and projected cash flows. Based on the inputs used by our independent pricing services, we identify the appropriate level within the fair value hierarchy to report these fair values.
Fair values of borrowings are estimated using Level 2 inputs based upon observable market data. The Company determines fair value for its borrowings using a discounted cash flow technique based upon expected cash flows and current spreads on FHLB advances with the same structure and terms. The Company also receives pricing information from third parties, including the FHLB. The pricing obtained is considered representative of the transfer price if the liabilities were assumed by a third party. The Company’s potential credit risk did not have a material impact on the quoted settlement prices used in measuring the fair value of the FHLB borrowings for the twelve months ended December 31, 2009.
Certain assets are measured at fair value on a nonrecurring basis. For the Company, these include loans held for sale, collateral dependent impaired loans, other real estate owned, goodwill and other intangible assets. During the fourth quarter of 2009, certain collateral dependent impaired loans were remeasured and reported at fair value through a specific valuation allowance for loan and lease losses based upon the fair value of the underlying collateral. Collateral values are estimated using Level 2 inputs based upon observable market data or Level 3 inputs based upon customized discounting criteria.
82
Note 19 Fair Value Measurements (continued)
|
|
|
|
|
|
|
|
|
|
|
|
|
|
|
|
Non-Recurring
Fair Value Measurements |
|
|
|
|
|
|
|
|
|
||||
|
(In thousands) |
|
Fair |
|
Quoted Prices |
|
Significant Other |
|
Significant |
|
||||
|
Collateral Dependent Impaired Loans |
|
$ |
13,123 |
|
$ |
— |
|
$ |
13,123 |
|
$ |
— |
|
|
|
|
|
|
|
|
|
|
|
|
|
|
|
|
|
Other Real Estate Owned |
|
|
299 |
|
|
— |
|
|
299 |
|
|
— |
|
The following table presents the carrying amounts and estimated fair values of the Company’s financial instruments at December 31, 2009 and 2008. The carrying amounts shown in the table are included in the Consolidated Statements of Condition under the indicated captions. The fair value estimates, methods and assumptions set forth below for the Company’s financial instruments, including those financial instruments carried at cost, are made solely to comply with disclosures required by generally accepted accounting principles in the United States and does not always incorporate the exit-price concept of fair value prescribed by ASC Topic 820-10 and should be read in conjunction with the financial statements and notes included in this Report.
|
|
|
|
|
|
|
|
|
|
|
|
|
|
|
|
Estimated Fair Value of Financial Instruments |
|
2009 |
|
2008 |
|
||||||||
|
( in thousands) |
|
Carrying |
|
Fair |
|
Carrying |
|
Fair |
|
||||
|
Financial Assets: |
|
|
|
|
|
|
|
|
|
|
|
|
|
|
|
|
|
|
|
|
|
|
|
|
|
|
|
|
|
Cash and cash equivalents |
|
$ |
45,462 |
|
$ |
45,462 |
|
$ |
52,349 |
|
$ |
52,349 |
|
|
Securities – trading |
|
|
31,718 |
|
|
31,718 |
|
|
38,101 |
|
|
38,101 |
|
|
Securities – available-for-sale |
|
|
928,770 |
|
|
928,770 |
|
|
741,219 |
|
|
741,219 |
|
|
Securities – held-to-maturity |
|
|
44,825 |
|
|
46,340 |
|
|
54,453 |
|
|
55,064 |
|
|
Loans and leases, net 1 |
|
|
1,890,468 |
|
|
1,904,400 |
|
|
1,798,859 |
|
|
1,860,467 |
|
|
FHLB and FRB stock |
|
|
20,041 |
|
|
20,041 |
|
|
22,874 |
|
|
22,874 |
|
|
Accrued interest receivable |
|
|
13,474 |
|
|
13,474 |
|
|
13,336 |
|
|
13,336 |
|
|
|
|
|
|
|
|
|
|
|
|
|
|
|
|
|
Financial Liabilities |
|
|
|
|
|
|
|
|
|
|
|
|
|
|
Time deposits |
|
$ |
794,738 |
|
$ |
799,830 |
|
$ |
703,107 |
|
$ |
705,813 |
|
|
Other deposits |
|
|
1,645,126 |
|
|
1,645,126 |
|
|
1,430,900 |
|
|
1,430,900 |
|
|
Securities sold under agreements to repurchase |
|
|
187,284 |
|
|
198,781 |
|
|
180,134 |
|
|
190,596 |
|
|
Securities sold under agreements to repurchase (valued at fair value) |
|
|
5,500 |
|
|
5,500 |
|
|
16,170 |
|
|
16,170 |
|
|
Other borrowings |
|
|
197,630 |
|
|
208,118 |
|
|
262,612 |
|
|
280,154 |
|
|
Other borrowings (valued at fair value) |
|
|
11,335 |
|
|
11,335 |
|
|
12,179 |
|
|
12,179 |
|
|
Trust preferred debentures |
|
|
25,056 |
|
|
25,777 |
|
|
3,888 |
|
|
3,859 |
|
|
Accrued interest payable |
|
|
2,461 |
|
|
2,461 |
|
|
3,260 |
|
|
3,260 |
|
|
|
|
|
1 |
Lease receivables, although excluded from the scope of ASC Topic 825, are included in the estimated fair value amounts at their carrying value. |
The following methods and assumptions were used in estimating fair value disclosures for financial instruments.
CASH AND CASH EQUIVALENTS: The carrying amounts reported in the Consolidated Statements of Condition for cash, noninterest-bearing deposits, money market funds, and Federal funds sold approximate the fair value of those assets.
SECURITIES: Fair values for U.S. Treasury securities are based on quoted market prices. Fair values for obligations of U.S. government sponsored entities, mortgage-backed securities-residential, obligations of U.S. states and political subdivisions, and U.S. corporate debt securities are based on quoted market prices, where available, as provided by third party pricing vendors. If quoted market prices were not available, fair values are based on quoted market prices of comparable instruments in active markets and/or based upon matrix pricing methodology, which uses comprehensive interest rate tables to determine market price, movement and yield relationships.
83
Note 19 Fair Value Measurements (continued)
FHLB AND FRB STOCK: The carrying amount of FHLB and FRB stock approximates fair value. If the stock is redeemed, the Company will receive an amount equal to the par value of the stock. For miscellaneous equity securities, carrying value is cost. These securities are reviewed periodically to determine if there are any events or changes in circumstances that would adversely affect their value.
LOANS AND LEASES: The fair values of residential loans are estimated using discounted cash flow analyses, based upon available market benchmarks for rates and prepayment assumptions. The fair values of commercial and consumer loans are estimated using discounted cash flow analyses, based upon interest rates currently offered for loans and leases with similar terms and credit quality. The fair value of loans held for sale are determined based upon contractual prices for loans with similar characteristics.
ACCRUED INTEREST RECEIVABLE AND ACCRUED INTEREST PAYABLE: The carrying amount of these short term instruments approximate fair value.
DEPOSITS: The fair values disclosed for noninterest bearing accounts and accounts with no stated maturities are equal to the amount payable on demand at the reporting date. The fair value of time deposits is based upon discounted cash flow analyses using rates offered for FHLB advances, which is the Company’s primary alternative source of funds.
SECURITIES SOLD UNDER AGREEMENTS TO REPURCHASE: The carrying amounts of repurchase agreements and other short-term borrowings approximate their fair values. Fair values of long-term borrowings are estimated using a discounted cash flow approach, based on current market rates for similar borrowings. For securities sold under agreements to repurchase where the Company has elected the fair value option, the Company also receives pricing information from third parties, including the FHLB.
OTHER BORROWINGS: The fair values of other borrowings are estimated using discounted cash flow analysis, discounted at the Company’s current incremental borrowing rate for similar borrowing arrangements. For other borrowings where the Company has elected the fair value option, the Company also receives pricing information from third parties, including the FHLB.
TRUST PREFERRED DEBENTURES: The fair value of the trust preferred debentures has been estimated using a discounted cash flow analysis which uses a discount factor of a market spread over current interest rates for similar instruments.
Note 20 Regulations and Supervision
The Company and its subsidiary banks are subject to various regulatory capital requirements administered by Federal bank regulatory agencies. Failure to meet minimum capital requirements can initiate certain mandatory, and possibly additional discretionary actions by regulators that, if undertaken, could have a direct material adverse effect on the Company’s business, results of operation and financial condition. Under capital adequacy guidelines and the regulatory framework for prompt corrective action (PCA), banks must meet specific guidelines that involve quantitative measures of assets, liabilities, and certain off-balance-sheet items as calculated under regulatory accounting practices. Capital amounts and classifications of the Company and its subsidiary banks are also subject to qualitative judgments by regulators concerning components, risk weightings, and other factors. Quantitative measures established by regulation to ensure capital adequacy require the maintenance of minimum amounts and ratios (set forth in the table below) of total capital and Tier 1 capital (as defined in the regulations) to risk-weighted assets (as defined), and of Tier 1 capital to average assets (as defined). Management believes that the Company and its subsidiary banks meet all capital adequacy requirements to which they are subject.
As of December 31, 2009, the most recent notifications from Federal bank regulatory agencies categorized the Tompkins Trust Company, The Bank of Castile and Mahopac National Bank as “well capitalized” under the regulatory framework for PCA. To be categorized as well capitalized, the Company and its subsidiary banks must maintain total risk-based, Tier 1 risk-based, and Tier 1 leverage ratios as set forth in the table below. There are no conditions or events since that notification that management believes have changed the capital category of the Company or its subsidiary banks. Actual capital amounts and ratios of the Company and its subsidiary banks are as follows:
84
Note 20 Regulations and Supervision (continued)
|
|
|
|
|
|
|
|
|
|
|
|
Actual |
|
Required |
|
Required |
|
|
(dollar amounts in thousands) |
|
Amount/Ratio |
|
Amount/Ratio |
|
Amount/Ratio |
|
|
December 31, 2009 |
|
|
|
|
|
|
|
|
Total Capital (to risk-weighted assets) |
|
|
|
|
|
|
|
|
The Company (consolidated) |
|
$252,271/12.1% |
|
>$166,987/>8.0% |
|
>$208,734/>10.0% |
|
|
Trust Company |
|
$118,393/13.2% |
|
>$71,524/>8.0% |
|
>$89,405/>10.0% |
|
|
Castile |
|
$64,281/11.5% |
|
>$44,654/>8.0% |
|
>$55,817/>10.0% |
|
|
Mahopac |
|
$75,358/12.6% |
|
>$47,786/>8.0% |
|
>$59,732/>10.0% |
|
|
Tier I Capital (to risk-weighted assets) |
|
|
|
|
|
|
|
|
The Company (consolidated) |
|
$227,765/10.9% |
|
>$83,494/>4.0% |
|
>$125,240/>6.0% |
|
|
Trust Company |
|
$109,347/12.2% |
|
>$35,762/>4.0% |
|
>$53,643/>6.0% |
|
|
Castile |
|
$57,301/10.3% |
|
>$22,327/>4.0% |
|
>$33,490/>6.0% |
|
|
Mahopac |
|
$67,881/11.4% |
|
>$23,893/>4.0% |
|
>$35,839/>6.0% |
|
|
Tier I Capital (to average assets) |
|
|
|
|
|
|
|
|
The Company (consolidated) |
|
$227,765/7.4% |
|
>$92,766/>3.0% |
|
>$154,610/>5.0% |
|
|
Trust Company |
|
$109,347/7.4% |
|
>$44,319/>3.0% |
|
>$73,866/>5.0% |
|
|
Castile |
|
$57,301/7.4% |
|
>$23,348/>3.0% |
|
>$38,913/>5.0% |
|
|
Mahopac |
|
$67,881/8.1% |
|
>$25,099/>3.0% |
|
>$41,831/>5.0% |
|
|
|
|
|
|
|
|
|
|
|
|
|
|
|
|
|
|
|
|
December 31, 2008 |
|
|
|
|
|
|
|
|
Total Capital (to risk-weighted assets) |
|
|
|
|
|
|
|
|
The Company (consolidated) |
|
$204,656/10.6% |
|
>$154,458/>8.0% |
|
>$193,073/>10.0% |
|
|
Trust Company |
|
$99,909/12.0% |
|
>$66,622/>8.0% |
|
>$83,277/>10.0% |
|
|
Castile |
|
$51,978/10.3% |
|
>$40,218/>8.0% |
|
>$50,273/>10.0% |
|
|
Mahopac |
|
$62,002/10.6% |
|
>$46,712/>8.0% |
|
>$58,390/>10.0% |
|
|
Tier I Capital (to risk-weighted assets) |
|
|
|
|
|
|
|
|
The Company (consolidated) |
|
$185,828/9.6% |
|
>$77,229/>4.0% |
|
>$115,844/>6.0% |
|
|
Trust Company |
|
$92,680/11.1% |
|
>$33,311/>4.0% |
|
>$49,966/>6.0% |
|
|
Castile |
|
$46,303/9.2% |
|
>$20,109/>4.0% |
|
>$30,164/>6.0% |
|
|
Mahopac |
|
$56,077/9.6% |
|
>$23,356/>4.0% |
|
>$35,034/>6.0% |
|
|
Tier I Capital (to average assets) |
|
|
|
|
|
|
|
|
The Company (consolidated) |
|
$185,828/6.7% |
|
>$83,050/>3.0% |
|
>$138,416/>5.0% |
|
|
Trust Company |
|
$92,680/7.1% |
|
>$39,127/>3.0% |
|
>$65,211/>5.0% |
|
|
Castile |
|
$46,303/6.6% |
|
>$20,921/>3.0% |
|
>$34,868/>5.0% |
|
|
Mahopac |
|
$56,077/7.1% |
|
>$23,662/>3.0% |
|
>$39,436/>5.0% |
|
|
|
|
|
|
|
|
|
|
Generally, dividends from the banking subsidiaries to the Company are limited to retained net profits for the current year and two preceding years, unless specific approval is received from the appropriate bank regulatory authority. At December 31, 2009 the retained net profits of the Company’s bank subsidiaries available to pay dividends were $29.4 million.
Each bank subsidiary is required to maintain reserve balances by the Federal Reserve Bank of New York. At December 31, 2009, and December 31, 2008 the reserve requirements for the Company’s banking subsidiaries totaled $3,704,000 and $5,995,000, respectively.
85
Note 21 Condensed Parent Company Only Financial Statements
Condensed financial statements for Tompkins (the Parent Company) as of December 31 are presented below.
|
|
|
|
|
|
|
|
|
|
|
|
|||||||||||||
|
Condensed Statements of Condition |
|
|
|
|
|
|
|
|
|
|
|||||||||||||
|
|
|
|
|
|
|
|
|
|
|
|
|||||||||||||
|
(in thousands) |
|
|
|
|
2009 |
|
2008 |
|
|||||||||||||||
|
|
|
|
|
|
|
|
|
|
|
|
|||||||||||||
|
ASSETS |
|
|
|
|
|
|
|
|
|
|
|||||||||||||
|
|
|
|
|
|
|
|
|
|
|
|
|||||||||||||
|
Cash |
|
|
|
|
$ |
5,714 |
|
$ |
3,662 |
|
|||||||||||||
|
Available-for-sale securities, at fair value |
|
|
|
|
|
225 |
|
|
641 |
|
|||||||||||||
|
Investment in subsidiaries, at equity |
|
|
|
|
|
278,588 |
|
|
233,743 |
|
|||||||||||||
|
Other |
|
|
|
|
|
6,392 |
|
|
5,457 |
|
|||||||||||||
|
Total Assets |
|
$ |
290,919 |
|
$ |
243,503 |
|
||||||||||||||||
|
|
|
|
|
|
|
|
|
|
|
|
|||||||||||||
|
LIABILITIES AND SHAREHOLDERS’ EQUITY |
|
|
|
|
|
|
|
|
|
|
|||||||||||||
|
|
|
|
|
|
|
|
|
|
|
|
|||||||||||||
|
Borrowings |
|
|
|
|
$ |
25,000 |
|
$ |
24,000 |
|
|||||||||||||
|
Trust Preferred Debentures Issued to Non-Consolidated Subsidiary |
|
|
|
|
|
21,161 |
|
|
0 |
|
|||||||||||||
|
Other Liabilities |
|
|
|
|
|
1,202 |
|
|
1,594 |
|
|||||||||||||
|
Tompkins Financial Corporation Shareholders’ Equity |
|
|
|
|
|
243,556 |
|
|
217,909 |
|
|||||||||||||
|
Total Liabilities and Shareholders’ Equity |
|
$ |
290,919 |
|
$ |
243,503 |
|
||||||||||||||||
|
|
|
|
|
|
|
|
|
|
|
|
|||||||||||||
|
Condensed Statements of Income |
|
|
|
|
|
|
|
|
|
|
|||||||||||||
|
|
|
|
|
|
|
|
|
|
|
|
|||||||||||||
|
(in thousands) |
|
|
2009 |
|
|
2008 |
|
|
2007 |
|
|||||||||||||
|
Dividends from available-for-sale securities |
|
$ |
1 |
|
$ |
2 |
|
$ |
2 |
|
|||||||||||||
|
Dividends received from subsidiaries |
|
|
8,726 |
|
|
23,730 |
|
|
30,545 |
|
|||||||||||||
|
Other income |
|
|
613 |
|
|
44 |
|
|
129 |
|
|||||||||||||
|
Total Operating Income |
|
|
9,340 |
|
|
23,776 |
|
|
30,676 |
|
|||||||||||||
|
|
|
|
|
|
|
|
|
|
|
|
|||||||||||||
|
Interest expense |
|
|
1,389 |
|
|
578 |
|
|
0 |
|
|||||||||||||
|
Other expenses |
|
|
4,907 |
|
|
4,367 |
|
|
3,413 |
|
|||||||||||||
|
Total Operating Expenses |
|
|
6,296 |
|
|
4,945 |
|
|
3,413 |
|
|||||||||||||
|
Income Before Taxes and Equity in Undistributed |
|
|
|
|
|
|
|
|
|
|
|||||||||||||
|
Earnings of Subsidiaries |
|
|
3,044 |
|
|
18,831 |
|
|
27,263 |
|
|||||||||||||
|
Income tax benefit |
|
|
2,224 |
|
|
1,983 |
|
|
1,330 |
|
|||||||||||||
|
(Distributions in excess of earnings of subsidiaries)/Equity in undistributed earnings of subsidiaries |
|
|
26,563 |
|
|
9,020 |
|
|
(2,222 |
) |
|||||||||||||
|
Net Income |
|
$ |
31,831 |
|
$ |
29,834 |
|
$ |
26,371 |
|
|||||||||||||
86
Note 21 Condensed Parent Company Only Financial Statements (continued)
Condensed Statements of Cash Flows
|
|
|
|
|
|
|
|
|
|
|
|
|
(in thousands) |
|
2009 |
|
2008 |
|
2007 |
|
|||
|
OPERATING ACTIVITIES |
|
|
|
|
|
|
|
|
|
|
|
|
|
|
|
|
|
|
|
|
|
|
|
Net income |
|
$ |
31,831 |
|
$ |
29,834 |
|
$ |
26,371 |
|
|
Adjustments to reconcile net income to net cash provided by operating activities: Distributions in excess of earnings of subsidiaries (equity in undistributed earnings of subsidiaries) |
|
|
(26,563 |
) |
|
(9,020 |
) |
|
2,222 |
|
|
Stock-based compensation expense |
|
|
938 |
|
|
931 |
|
|
713 |
|
|
Other, net |
|
|
34 |
|
|
1,097 |
|
|
(3,658 |
) |
|
Net Cash Provided by Operating Activities |
|
|
6,240 |
|
|
22,842 |
|
|
25,648 |
|
|
INVESTING ACTIVITIES |
|
|
|
|
|
|
|
|
|
|
|
Net cash used in acquisitions |
|
|
0 |
|
|
(30,434 |
) |
|
0 |
|
|
Investments in subsidiaries |
|
|
(13,385 |
) |
|
(5,121 |
) |
|
0 |
|
|
Other, net |
|
|
(1,238 |
) |
|
(121 |
) |
|
(43 |
) |
|
Net Cash Used in Investing Activities |
|
|
(14,623 |
) |
|
(35,676 |
) |
|
(43 |
) |
|
FINANCING ACTIVITIES |
|
|
|
|
|
|
|
|
|
|
|
Borrowing, net |
|
|
22,072 |
|
|
24,000 |
|
|
0 |
|
|
Cash dividends |
|
|
(13,208 |
) |
|
(12,728 |
) |
|
(12,023 |
) |
|
Repurchase of common shares |
|
|
(178 |
) |
|
(58 |
) |
|
(12,914 |
) |
|
Shares issued for dividend reinvestment plans |
|
|
631 |
|
|
0 |
|
|
0 |
|
|
Net proceeds from exercise of stock options |
|
|
955 |
|
|
3,354 |
|
|
611 |
|
|
Tax benefits of stock options exercised |
|
|
163 |
|
|
587 |
|
|
51 |
|
|
Net Cash Provided by (Used in) Financing Activities |
|
|
10,435 |
|
|
15,155 |
|
|
(24,275 |
) |
|
Net increase in cash |
|
|
2,052 |
|
|
2,321 |
|
|
1,330 |
|
|
Cash at beginning of year |
|
|
3,662 |
|
|
1,341 |
|
|
11 |
|
|
Cash at End of Year |
|
$ |
5,714 |
|
$ |
3,662 |
|
$ |
1,341 |
|
A statement of changes in shareholders’ equity has not been presented since it is the same as the Consolidated Statement of Changes in Shareholders’ Equity previously presented.
Note 22 Segment and Related Information
The Company manages its operations through two business segments: banking and financial services. Financial services activities consist of the results of the Company’s trust, financial planning and wealth management, broker-dealer, and risk management operations. All other activities, including holding company activities, are considered banking. The Company accounts for intercompany fees and services at an estimated fair value according to regulatory requirements for the services provided. Intercompany items relate primarily to the use of human resources, accounting and marketing services provided by any of the Banks and the holding company. All other accounting policies are the same as those described in the summary of significant accounting policies.
87
Note 22 Segment and Related Information (continued)
Summarized financial information concerning the Company’s reportable segments and the reconciliation to the Company’s consolidated results is shown in the following table. Investment in subsidiaries is netted out of the presentations below. The “Intercompany” column identifies the intercompany activities of revenues, expenses and other assets between the banking and financial services segment.
|
|
|
|
|
|
|
|
|
|
|
|
|
|
|
|
|
|
As of and for the year ended December 31, 2009 |
|
||||||||||
|
(in thousands) |
|
Banking |
|
Financial |
|
Intercompany |
|
Consolidated |
|
||||
|
Interest income |
|
$ |
146,563 |
|
$ |
260 |
|
$ |
(28 |
) |
$ |
146,795 |
|
|
Interest expense |
|
|
39,783 |
|
|
3 |
|
|
(28 |
) |
|
39,758 |
|
|
Net interest income |
|
|
106,780 |
|
|
257 |
|
|
0 |
|
|
107,037 |
|
|
Provision for loan and lease losses |
|
|
9,288 |
|
|
0 |
|
|
0 |
|
|
9,288 |
|
|
Noninterest income |
|
|
21,209 |
|
|
25,574 |
|
|
(570 |
) |
|
46,213 |
|
|
Noninterest expense |
|
|
76,650 |
|
|
20,537 |
|
|
(570 |
) |
|
96,617 |
|
|
Income before income tax expense |
|
|
42,051 |
|
|
5,294 |
|
|
0 |
|
|
47,345 |
|
|
Income tax expense |
|
|
13,492 |
|
|
1,891 |
|
|
0 |
|
|
15,383 |
|
|
Net Income attributable to noncontrolling interests and Tompkins Financial Corporation |
|
|
28,559 |
|
|
3,403 |
|
|
0 |
|
|
31,962 |
|
|
Less: Net income attributable to noncontrolling interest |
|
|
131 |
|
|
0 |
|
|
0 |
|
|
131 |
|
|
Net Income attributable to Tompkins Financial Corporation |
|
$ |
28,428 |
|
$ |
3,403 |
|
$ |
0 |
|
$ |
31,831 |
|
|
|
|
|
|
|
|
|
|
|
|
|
|
|
|
|
Depreciation and amortization |
|
$ |
4,297 |
|
$ |
187 |
|
$ |
0 |
|
$ |
4,484 |
|
|
Assets |
|
|
3,128,772 |
|
|
28,057 |
|
|
(3,569 |
) |
|
3,153,260 |
|
|
Goodwill |
|
|
23,600 |
|
|
17,989 |
|
|
0 |
|
|
41,589 |
|
|
Other intangibles |
|
|
3,266 |
|
|
1,598 |
|
|
0 |
|
|
4,864 |
|
|
Loans, net |
|
|
1,890,468 |
|
|
0 |
|
|
0 |
|
|
1,890,468 |
|
|
Deposits |
|
|
2,443,192 |
|
|
0 |
|
|
(3,328 |
) |
|
2,439,864 |
|
|
Total equity |
|
|
222,552 |
|
|
22,456 |
|
|
0 |
|
|
245,008 |
|
|
|
|
|
|
|
|
|
|
|
|
|
|
|
|
|
|
|
As of and for the year ended December 31, 2008 |
|
||||||||||
|
(in thousands) |
|
Banking |
|
Financial |
|
Intercompany |
|
Consolidated |
|
||||
|
Interest income |
|
$ |
140,601 |
|
$ |
234 |
|
$ |
(52 |
) |
$ |
140,783 |
|
|
Interest expense |
|
|
50,438 |
|
|
7 |
|
|
(52 |
) |
|
50,393 |
|
|
Net interest income |
|
|
90,163 |
|
|
227 |
|
|
0 |
|
|
90,390 |
|
|
Provision for loan and lease losses |
|
|
5,428 |
|
|
0 |
|
|
0 |
|
|
5,428 |
|
|
Noninterest income |
|
|
20,867 |
|
|
25,781 |
|
|
(613 |
) |
|
46,035 |
|
|
Noninterest expense |
|
|
67,682 |
|
|
19,987 |
|
|
(613 |
) |
|
87,056 |
|
|
Income before income tax expense |
|
|
37,920 |
|
|
6,021 |
|
|
0 |
|
|
43,941 |
|
|
Income tax expense |
|
|
11,656 |
|
|
2,154 |
|
|
0 |
|
|
13,810 |
|
|
Net Income attributable to noncontrolling interests and Tompkins Financial Corporation |
|
|
26,264 |
|
|
3,867 |
|
|
0 |
|
|
30,131 |
|
|
Less: Net income attributable to noncontrolling interest |
|
|
297 |
|
|
0 |
|
|
0 |
|
|
297 |
|
|
Net Income attributable to Tompkins Financial Corporation |
|
$ |
25,967 |
|
$ |
3,867 |
|
$ |
0 |
|
$ |
29,834 |
|
|
|
|
|
|
|
|
|
|
|
|
|
|
|
|
|
Depreciation and amortization |
|
$ |
4,436 |
|
$ |
234 |
|
$ |
0 |
|
$ |
4,670 |
|
|
Assets |
|
|
2,838,923 |
|
|
32,209 |
|
|
(3,410 |
) |
|
2,867,722 |
|
|
Goodwill |
|
|
23,573 |
|
|
17,906 |
|
|
0 |
|
|
41,479 |
|
|
Other intangibles |
|
|
3,428 |
|
|
1,871 |
|
|
0 |
|
|
5,299 |
|
|
Loans, net |
|
|
1,798,859 |
|
|
0 |
|
|
0 |
|
|
1,798,859 |
|
|
Deposits |
|
|
2,137,238 |
|
|
0 |
|
|
(3,231 |
) |
|
2,134,007 |
|
|
Total equity |
|
|
196,190 |
|
|
23,171 |
|
|
0 |
|
|
219,361 |
|
88
Note 22 Segment and Related Information (continued)
|
|
|
|
|
|
|
|
|
|
|
|
|
|
|
|
|
|
For the year ended December 31, 2007 |
|
||||||||||
|
(in thousands) |
|
Banking |
|
Financial |
|
Intercompany |
|
Consolidated |
|
||||
|
Interest income |
|
$ |
132,172 |
|
$ |
324 |
|
$ |
(55 |
) |
$ |
132,441 |
|
|
Interest expense |
|
|
58,457 |
|
|
10 |
|
|
(55 |
) |
|
58,412 |
|
|
Net interest income |
|
|
73,715 |
|
|
314 |
|
|
0 |
|
|
74,029 |
|
|
Provision for loan and lease losses |
|
|
1,529 |
|
|
0 |
|
|
0 |
|
|
1,529 |
|
|
Noninterest income |
|
|
19,106 |
|
|
25,416 |
|
|
(473 |
) |
|
44,049 |
|
|
Noninterest expense |
|
|
60,377 |
|
|
18,152 |
|
|
(473 |
) |
|
78,056 |
|
|
Income before income tax expense |
|
|
30,915 |
|
|
7,578 |
|
|
0 |
|
|
38,493 |
|
|
Income tax expense |
|
|
9,257 |
|
|
2,734 |
|
|
0 |
|
|
11,991 |
|
|
Net Income attributable to noncontrolling interests and Tompkins Financial Corporation |
|
|
21,658 |
|
|
4,844 |
|
|
0 |
|
|
26,502 |
|
|
Less: Net income attributable to noncontrolling interest |
|
|
131 |
|
|
0 |
|
|
0 |
|
|
131 |
|
|
Net Income attributable to Tompkins Financial Corporation |
|
$ |
21,527 |
|
$ |
4,844 |
|
$ |
0 |
|
$ |
26,371 |
|
|
|
|
|
|
|
|
|
|
|
|
|
|
|
|
|
|
|
|
|
|
|
|
|
|
|
|
|
|
|
|
|
|
2009 |
|
||||||||||
|
(in thousands except per share data) |
|
First |
|
Second |
|
Third |
|
Fourth |
|
||||
|
|
|
|
|
|
|
|
|
|
|
|
|
|
|
|
Interest and dividend income |
|
$ |
36,251 |
|
$ |
36,559 |
|
$ |
36,558 |
|
$ |
37,427 |
|
|
Interest expense |
|
|
10,400 |
|
|
10,050 |
|
|
9,778 |
|
|
9,530 |
|
|
Net interest income |
|
|
25,851 |
|
|
26,509 |
|
|
26,780 |
|
|
27,897 |
|
|
Provision for loan and lease losses |
|
|
2,036 |
|
|
2,367 |
|
|
2,127 |
|
|
2,758 |
|
|
Income before income tax |
|
|
11,459 |
|
|
11,006 |
|
|
12,530 |
|
|
12,350 |
|
|
Net income |
|
|
7,710 |
|
|
7,447 |
|
|
8,460 |
|
|
8,214 |
|
|
Net income per common share (basic) |
|
|
.72 |
|
|
.70 |
|
|
.79 |
|
|
.77 |
|
|
Net income per common share (diluted) |
|
|
.72 |
|
|
.69 |
|
|
.79 |
|
|
.76 |
|
|
|
|
2008 |
|
||||||||||
|
(in thousands except per share data) |
|
First |
|
Second |
|
Third |
|
Fourth |
|
||||
|
|
|
|
|
|
|
|
|
|
|
|
|
|
|
|
Interest and dividend income |
|
$ |
33,543 |
|
$ |
34,507 |
|
$ |
36,200 |
|
$ |
36,533 |
|
|
Interest expense |
|
|
13,861 |
|
|
12,640 |
|
|
12,162 |
|
|
11,730 |
|
|
Net interest income |
|
|
19,682 |
|
|
21,867 |
|
|
24,038 |
|
|
24,803 |
|
|
Provision for loan and lease losses |
|
|
625 |
|
|
1,183 |
|
|
1,515 |
|
|
2,105 |
|
|
Income before income tax |
|
|
11,343 |
|
|
10,522 |
|
|
11,775 |
|
|
10,301 |
|
|
Net income |
|
|
7,508 |
|
|
7,119 |
|
|
7,933 |
|
|
7,274 |
|
|
Net income per common share (basic) |
|
|
.71 |
|
|
.67 |
|
|
.75 |
|
|
.68 |
|
|
Net income per common share (diluted) |
|
|
.70 |
|
|
.66 |
|
|
.74 |
|
|
.68 |
|
Interest and dividend income, and interest expense for the first and second quarters of 2008 were adjusted from the amounts previously reported in the Quarterly Form 10-Q, as certain amounts were reclassified.
89
|
|
|
|
Changes in and Disagreements with Accountants on Accounting and Financial Disclosure |
None.
|
|
|
|
Controls and Procedures |
Evaluation of Disclosure Controls and Procedures
The Company’s management, including its Chief Executive Officer and Chief Financial Officer, evaluated the effectiveness of the design and operations of the Company’s disclosure controls and procedures (as defined in Rule 13a-15 under the Securities Exchange Act of 1934, as amended (the “Exchange Act”)) as of December 31, 2009. Based upon that evaluation, the Company’s Chief Executive Officer and Chief Financial Officer concluded that as of the end of the period covered by this Form 10-K, the Company’s disclosure controls and procedures were effective in providing reasonable assurance that information required to be disclosed by the Company in its reports filed or submitted under the Exchange Act is recorded, processed, summarized and reported within the time periods specified in the Securities and Exchange Commission’s rules and forms and that material information relating to the Company and its subsidiaries is made known to management, including the Chief Executive Officer and Chief Financial Officer, as appropriate to allow timely decisions regarding disclosure.
Management’s Annual Report on Internal Control Over Financial Reporting
The Company’s management is responsible for establishing and maintaining adequate internal control over financial reporting for the Company. As of December 31, 2009, management assessed the effectiveness of the Company’s internal control over financial reporting based on the framework for effective internal control over financial reporting established in “Internal Control - Integrated Framework,” issued by the Committee of Sponsoring Organizations (COSO) of the Treadway Commission. Based on its evaluation under the COSO framework, management concluded that the Company’s internal control over financial reporting was effective as of December 31, 2009 to provide reasonable assurance regarding the reliability of financial reporting and the preparation of financial statements for external reporting purposes in accordance with generally accepted accounting principles. The results of management’s assessment was reviewed with the Company’s Audit Committee of its Board of Directors. The Company’s registered public accounting firm has issued an attestation report on the Company’s internal controls over financial reporting, which is included in Part II, Item 7 of this Report.
Changes in Internal Control Over Financial Reporting
There were no changes in the Company’s internal control over financial reporting that occurred during the Company’s fourth quarter ended December 31, 2009, that has materially affected, or is reasonably likely to materially affect, the Company’s internal control over financial reporting.
|
|
|
|
Other Information |
None.
|
|
|
|
Directors, Executive Officers and Corporate Governance |
The information required by this item is incorporated herein by reference to the material under the captions “Proposal 1 – Election of Directors” and “Section 16(a) Beneficial Ownership Reporting Compliance”; the discussion of the Company’s code of ethics under the caption “Corporate Governance Matters-Policy Regarding Director Attendance at Annual Meetings”; the discussion of director nominees by stockholders and the Audit/Examining Committee under the caption “Board of Director Meetings and Committees” all in the Company’s definitive proxy statement relating to its 2010 annual meeting of shareholders to be held May 10, 2010 (the “Proxy Statement”); and the material captioned “Executive Officers of the Registrant” in Part I of this Report on Form 10-K.
90
|
|
|
|
Executive Compensation |
The information called for by this item is incorporated herein by reference to the material under the captions, “Executive Compensation”, “Compensation Committee Interlocks and Insider Participation” and “Compensation Committee Report” in the Proxy Statement.
The material incorporated herein by reference to the material under the caption “Compensation Committee Report” in the Proxy Statement shall be deemed furnished, and not filed, in this Report on Form 10-K and shall not be deemed incorporated by reference into any filing under the Securities Act of 1933, as amended, or the Securities Exchange Act of 1934, as amended, as a result of this furnishing, except to the extent that the Company specifically incorporates it by reference.
|
|
|
|
Security Ownership of Certain Beneficial Owners and Management and Related Stockholder Matters |
Information regarding stock-based compensation awards outstanding and available for future grant as of December 31, 2009 is presented in the table below.
|
|
|
|
|
|
|
|
|
|
|
|
|
Plan Category |
|
Number of Securities to be |
|
Weighted Average Exercise |
|
Number of Securities |
|
|||
|
Equity Compensation Plans Approved by Security Holders |
|
|
1,058,033 |
|
$ |
37.08 |
|
|
666,930 |
|
|
Equity Compensation Plans Not Approved by Security Holders |
|
|
0 |
|
|
0 |
|
|
0 |
|
|
|
|
|
Certain Relationships and Related Transactions, and Director Independence |
The information called for by this item is incorporated herein by reference to the material under the captions “Director Independence” and “Transactions with Related Persons” in the Proxy Statement.
|
|
|
|
Principal Accounting Fees and Services |
The information called for by this item is incorporated herein by reference to the material under the caption “Independent Auditors” in the Proxy Statement.
|
|
|
|
Exhibits and Financial Statement Schedules |
|
|
|
|
|
(a)(1) |
The
following financial statements and Report of KPMG are included in this Annual
Report on Form |
|
|
|
|
|
Report of KPMG LLP, Independent Registered Public Accounting Firm |
|
|
|
|
|
Consolidated Statements of Condition for the years ended December 31, 2009 and 2008 |
|
|
|
|
|
Consolidated Statements of Income for the years ended December 31, 2009, 2008, and 2007 |
|
|
|
|
|
Consolidated Statements of Cash Flows for the years ended December 31, 2009, 2008, and 2007 |
|
|
|
|
|
Consolidated Statements of Changes in Shareholders’ Equity for the years ended December 31, 2009, 2008, and 2007 |
91
|
|
|
|
|
Notes to Consolidated Financial Statements |
|
|
|
|
|
Unaudited Quarterly Financial Data |
|
|
|
|
(a)(2) |
List of Financial Schedules |
|
|
|
|
|
Not Applicable. |
|
|
|
|
(a)(3) |
Exhibits |
|
|
|
|
|
|
Item No. |
|
Description |
|
|
|
|
|
|
|
|
2.1 |
|
Agreement and Plan of Reorganization, dated as of March 14, 1995, among the Bank, the Company and the Interim Bank incorporated herein by reference to Exhibit 2 to the Company’s Registration Statement on Form 8-A (No. 0-27514), filed with the Commission on December 29, 1995, and amended by the Company’s Form 8-A/A filed with the Commission of January 22, 1996. |
|
|
|
|
|
|
|
2.2 |
|
Agreement and Plan of Reorganization, dated as of July 30, 1999 between the Company and Letchworth, incorporated by reference to Annex A to the Company’s Registration Statement of Form S-4 (Registration No. 333-90411), filed with the Commission of November 5, 1999. |
|
|
|
|
|
|
|
3.1 |
|
Amended and Restated Certificate of Incorporation of the Company, incorporated herein by reference to Exhibit 3(i) to the Company’s Form 10-Q, filed with the Commission on August 11, 2008. |
|
|
|
|
|
|
|
3.2 |
|
Amended and Restated Bylaws of the Company, incorporated herein by reference to Exhibit 3(ii) to the Company’s Form 10-Q, filed with the Commission on August 11, 2008. |
|
|
|
|
|
|
|
4. |
|
Form of Specimen Common Stock Certificate of the Company, incorporated herein by reference to Exhibit 4 to the Company’s Registration Statement on Form 8-A (No. 0-27514), filed with the Commission on December 29, 1995. |
|
|
|
|
|
|
|
4.1 |
|
Form of Specimen Common Stock Certificate of the Company, incorporated herein by reference to Exhibit 4 to the Company’s Registration Statement on Form 8-A (No. 0-27514), filed with the Commission on December 29, 1995. |
|
|
|
|
|
|
|
4.2 |
|
Indenture, dated as of April 10, 2009, incorporated herein by reference to Exhibit 4.1 to the Company’s Current Report on Form 8-K, filed with the Commission on April 16, 2009. |
|
|
|
|
|
|
|
4.3 |
|
Form of Subordinated Debenture (included as Exhibit A to Exhibit 4.2) |
|
|
|
|
|
|
|
4.4 |
|
Amended and Restated Trust Agreement, dated as of April 10, 2009, incorporated herein by reference to Exhibit 4.3 to the Company’s Current Report on Form 8-K, filed with the Commission on April 16, 2009. |
|
|
|
|
|
|
|
4.5 |
|
Form of Convertible Preferred Security Certificate of Tompkins Capital Trust I (included as Exhibit D to Exhibit 4.4) |
|
|
|
|
|
|
|
4.6 |
|
Preferred Securities Guarantee Agreement, dated as of April 10, 2009, incorporated herein by reference to Exhibit 4.5 to the Company’s Current Report on Form 8-K, filed with the Commission on April 16, 2009. |
|
|
|
|
|
|
|
4.7 |
|
Agreement as to Expenses and Liabilities, dated as of April 10, 2009, incorporated herein by reference to Exhibit 4.6 to the Company’s Current Report on Form 8-K, filed with the Commission on April 16, 2009. |
|
|
|
|
|
|
|
10.1* |
|
1992 Stock Option Plan, incorporated herein by reference to Exhibit 10.2 to the Company’s Registration Statement on Form 8-A (No. 0-27514), filed with the Commission on December 29, 1995. |
|
|
|
|
|
|
|
10.2* |
|
Amended and Restated Retainer Plan for Eligible Directors of Tompkins Financial Corporation and Its Wholly-owned Subsidiaries. |
|
|
|
|
|
|
|
10.3* |
|
Form of Director Deferred Compensation Agreement, incorporated herein by reference to Exhibit 10.4 to the Company’s Registration Statement on Form 8-A (No. 0-27514), filed with the Commission on December 29, 1995. |
|
|
|
|
|
|
|
10.4* |
|
Deferred Compensation Plan for Senior Officers, incorporated herein by reference to Exhibit 10.5 to the Company’s Registration Statement on Form 8-A (No. 0-27514), filed with the Commission on December 29, 1995 |
92
|
|
|
|
|
|
|
10.5* |
|
Supplemental Executive Retirement Agreement with James J. Byrnes, incorporated herein by reference to Exhibit 10.6 to the Company’s Registration Statement on Form 8-A (No. 0-27514), filed with the Commission on December 29, 1995. |
|
|
|
|
|
|
|
10.6* |
|
Severance Agreement with James J. Byrnes, incorporated herein by reference to Exhibit 10.7 to the Company’s Registration Statement on Form 8-A (No. 0-27514), filed with the Commission on December 29, 1995. |
|
|
|
|
|
|
|
10.7 |
|
Lease Agreement dated August 20, 1993, between Tompkins County Trust Company and Comex Plaza Associates, relating to leased property at the Rothschilds Building, Ithaca, NY, incorporated herein by reference to Exhibit 10.8 to the Company’s Form 10-K, filed with the Commission on March 26, 1996. |
|
|
|
|
|
|
|
10.8* |
|
Employment Agreement, dated September 12, 1989, by and between Registrant and James W. Fulmer, incorporated by reference to the Registrant’s Amendment No. 1 to Form S-18 Registration Statement (Reg. No. 33-3114-NY), filed with the Commission on October 31, 1989 and wherein such Exhibit is designated as Exhibit 10(a). |
|
|
|
|
|
|
|
10.9* |
|
2001 Stock Option Plan, incorporated herein by reference to Exhibit 99 to the Company’s Registration Statement on Form S-8 (No. 333-75822), filed with the Commission on December 12, 2001. |
|
|
|
|
|
|
|
10.11* |
|
Summary of Compensation Arrangements for Named Executive Officers and Directors, incorporated herein by reference to Exhibit 10.1 to the Company’s Current Report on Form 8-K, filed with the Commission on February 1, 2010. |
|
|
|
|
|
|
|
10.12* |
|
Supplemental Executive Retirement Agreement between James W. Fulmer and Tompkins Trustco, Inc., dated December 28, 2005, incorporated herein by reference to Exhibit 10.14 to the Company’s Annual Report on Form 10-K for the year ended December 31, 2005, filed with the Commission on March 16, 2006. |
|
|
|
|
|
|
|
10.14* |
|
Supplemental Executive Retirement Agreement between Stephen S. Romaine and Tompkins Trustco, Inc., dated December 28, 2005, incorporated herein by reference to Exhibit 10.16 to the Company’s Annual Report on Form 10-K for the year ended December 31, 2005, filed with the Commission on March 16, 2006. |
|
|
|
|
|
|
|
10.15* |
|
Supplemental Executive Retirement Agreement between Francis M. Fetsko and Tompkins Trustco, Inc., dated December 28, 2005, incorporated herein by reference to Exhibit 10.17 to the Company’s Annual Report on Form 10-K for the year ended December 31, 2005, filed with the Commission on March 16, 2006. |
|
|
|
|
|
|
|
10.16* |
|
Supplemental Executive Retirement Agreement between David S. Boyce and Tompkins Trustco, Inc., dated December 28, 2005, incorporated herein by reference to Exhibit 10.18 to the Company’s Annual Report on Form 10-K for the year ended December 31, 2005, filed with the Commission on March 16, 2006. |
|
|
|
|
|
|
|
10.17* |
|
Supplemental Executive Retirement Agreement between Robert B. Bantle and Tompkins Trustco, Inc., dated December 28, 2005, incorporated herein by reference to Exhibit 10.19 to the Company’s Annual Report on Form 10-K for the year ended December 31, 2005, filed with the Commission on March 16, 2006. |
|
|
|
|
|
|
|
10.18* |
|
Form of Officer Group Term Life Replacement Plan (the “Plan”) among Tompkins Trustco, Inc., or Tompkins Trust Company and the Participants in the Plan, including form of Split Dollar Policy Endorsement – Exhibit D to the Plan, including Exhibit D to Officer Group Term Replacement Plan for each executive officer filed individually. |
|
|
|
|
|
|
|
10.19* |
|
Consulting Agreement between Russell K. Achzet and Tompkins Trustco, Inc., dated January 5, 2006, incorporated herein by reference to Exhibit 10.21 to the Company’s Annual Report on Form 10-K for the year ended December 31, 2005, filed with the Commission on March 16, 2006. |
|
|
|
|
|
|
|
10.20* |
|
Amendment to the Tompkins Trustco, Inc. Supplemental Retirement Agreement with James J. Byrnes, incorporated herein by reference to Exhibit 10.1 to the Company’s Form 10-Q, filed with the Commission on August 9, 2006. |
|
|
|
|
|
|
|
10.21* |
|
Tompkins Trustco, Inc. Officer Group Term Replacement Plan, as amended on June 26, 2006, incorporated herein by reference to Exhibit 10.2 to the Company’s Form 10-Q, filed with the Commission on August 9, 2006. |
|
|
|
|
|
|
|
10.22* |
|
2009 Equity Plan, incorporated herein by reference to Exhibit 99 to the Company’s Registration Statement on Form S-8 (No. 333-160738) filed with the Commission on July 22, 2009. |
93
|
|
|
|
|
|
|
14. |
|
Tompkins Trustco, Inc. Code of Ethics For Chief Executive Officer and Senior Financial Officers dated April 25, 2006, incorporated herein by reference to Exhibit 10.22 to the Company’s Annual Report on Form 10-K for the year ended December 31, 2006, filed with the Commission on March 15, 2007. |
|
|
|
|
|
|
|
21. |
|
Subsidiaries of Registrant, incorporated by reference to Exhibit 21 to the Company’s Annual Report on Form 10-K for the year ended December 31, 2003, filed with the Commission on March 15, 2004. |
|
|
|
|
|
|
|
23. |
|
Consent of Independent Registered Public Accounting Firm (filed herewith) |
|
|
|
|
|
|
|
24. |
|
Power of Attorney, included on page 95 of this Report on Form 10-K. |
|
|
|
|
|
|
|
31.1 |
|
Certification of the Chief Executive Officer as required pursuant to Section 302 of the Sarbanes-Oxley Act of 2002 (filed herewith). |
|
|
|
|
|
|
|
31.2 |
|
Certification of the Chief Financial Officer as required pursuant to Section 302 of the Sarbanes-Oxley Act of 2002 (filed herewith). |
|
|
|
|
|
|
|
32.1 |
|
Certification of the Chief Executive Officer Pursuant to 18 U.S.C. Section 1350, as adopted pursuant to Section 906 of the Sarbanes-Oxley Act of 2002 (filed herewith). |
|
|
|
|
|
|
|
32.2 |
|
Certification of the Chief Financial Officer Pursuant to 18 U.S.C. Section 1350, as adopted pursuant to Section 906 of the Sarbanes-Oxley Act of 2002 (filed herewith). |
|
|
|
|
* |
Management contracts and compensatory plans and arrangements required to be filed as Exhibits to this Report on Form 10-K pursuant to Item 15(c) of the Report. |
94
SIGNATURES
Pursuant to the requirements of Section 13 or 15(d) of the Securities Exchange Act of 1934, the registrant has duly caused this report to be signed on its behalf by the undersigned, thereunto duly authorized.
|
|
|
|
|
|
TOMPKINS FINANCIAL CORPORATION |
|
|
|
|
|
|
|
|
|
|
|
|
|
|
By: |
Stephen S. Romaine |
|
|
|
President and Chief Executive Officer |
|
|
|
(Principal Executive Officer) |
|
|
|
|
|
|
|
Date: March 12, 2010 |
|

POWER OF ATTORNEY
KNOW ALL PERSONS BY THESE PRESENTS, that each person whose signature appears below constitutes and appoints, jointly and severally, Stephen S. Romaine and Frank M. Fetsko, and each of them, as his or her true and lawful attorneys-in-fact and agents, each with full power of substitution, for him or her, and in his or her name, place and stead, in any and all capacities, to sign any amendments to this Report on Form 10-K, and to file the same, with Exhibits thereto and other documents in connection therewith, with the Securities and Exchange Commission, granting unto said attorneys-in-fact and agents, and each of them, full power and authority to do and perform each and every act and thing requisite or necessary to be done as fully to all intents and purposes as he or she might or could do in person, hereby ratifying and confirming all that said attorneys-in-fact and agents, or any of them, or their substitutes, may lawfully do or cause to be done by virtue hereof.
Pursuant to the requirements of the Securities Exchange Act of 1934, this report has been signed by the following persons on behalf of the Registrant and in the capacities and on the dates indicated.
|
|
|
|
|
|
|
|
|
|
|
|
|
Signature |
|
Date |
|
Capacity |
|
Signature |
|
Date |
|
Capacity |
|
|
|
|
|
|
|
|
|
|
|
|
|
/S/ James J. Byrnes |
|
3/12/10 |
|
Chairman of the Board |
|
/S/ Elizabeth W. Harrison |
|
3/12/10 |
|
Director |
|
|
|
|
|
|
|
|
|
|
||
|
James J. Byrnes |
|
|
|
|
|
Elizabeth W. Harrison |
|
|
|
|
|
|
|
|
|
|
|
|
|
|
|
|
|
/S/ Stephen S. Romaine |
|
3/12/10 |
|
President and Chief Executive Officer |
|
/S/ James R. Hardie |
|
3/12/10 |
|
Director |
|
|
|
|
|
|
|
|
|
|
||
|
Stephen S. Romaine |
|
|
|
(Principal Executive Officer) |
|
James R. Hardie |
|
|
|
|
|
|
|
|
|
|
|
|
|
|
|
|
|
/S/ Thomas R. Salm |
|
3/12/10 |
|
Vice Chairman, Director |
|
/S/ Carl E. Haynes |
|
3/12/10 |
|
Director |
|
|
|
|
|
|
|
|
|
|
||
|
Thomas R. Salm |
|
|
|
|
|
Carl E. Haynes |
|
|
|
|
|
|
|
|
|
|
|
|
|
|
|
|
|
/S/ James W. Fulmer |
|
3/12/10 |
|
Vice Chairman, Director |
|
/S/ Patricia A. Johnson |
|
3/12/10 |
|
Director |
|
|
|
|
|
|
|
|
|
|
||
|
James W. Fulmer |
|
|
|
|
|
Patricia A. Johnson |
|
|
|
|
|
|
|
|
|
|
|
|
|
|
|
|
|
/S/ Francis M. Fetsko |
|
3/12/10 |
|
Executive Vice President and |
|
/S/ Hunter R. Rawlings, III |
|
3/12/10 |
|
Director |
|
|
|
|
|
|
|
|
|
|
||
|
Francis M. Fetsko |
|
|
|
Chief Financial Officer |
|
Hunter R. Rawlings, III |
|
|
|
|
|
|
|
|
|
(Principal Financial Officer) |
|
|
|
|
|
|
|
|
|
|
|
|
|
|
|
|
|
|
/S/ Russell K. Achzet |
|
3/12/10 |
|
Director |
|
/S/ Thomas R. Rochon |
|
3/12/10 |
|
Director |
|
|
|
|
|
|
|
|
|
|
||
|
Russell K. Achzet |
|
|
|
|
|
Thomas R. Rochon |
|
|
|
|
|
|
|
|
|
|
|
|
|
|
|
|
|
/S/ John E. Alexander |
|
3/12/10 |
|
Director |
|
/S/ Michael H. Spain |
|
3/12/10 |
|
Director |
|
|
|
|
|
|
|
|
|
|
||
|
John E. Alexander |
|
|
|
|
|
Michael H. Spain |
|
|
|
|
|
|
|
|
|
|
|
|
|
|
|
|
|
/S/ Daniel J. Fessenden |
|
3/12/10 |
|
Director |
|
/S/ William D. Spain, Jr. |
|
3/12/10 |
|
Director |
|
|
|
|
|
|
|
|
|
|
||
|
Daniel J. Fessenden |
|
|
|
|
|
William D. Spain, Jr. |
|
|
|
|
|
|
|
|
|
|
|
|
|
|
|
|
|
/S/ Reeder D. Gates |
|
3/12/10 |
|
Director |
|
/S/ Craig Yunker |
|
3/12/10 |
|
Director |
|
|
|
|
|
|
|
|
|
|
||
|
Reeder D. Gates |
|
|
|
|
|
Craig Yunker |
|
|
|
|
95
Exhibits Index
|
|
|
|
|
Item No. |
Description |
|
|
|
|
|
|
|
2.1 |
Agreement and Plan of Reorganization, dated as of March 14, 1995, among the Bank, the Company and the Interim Bank incorporated herein by reference to Exhibit 2 to the Company’s Registration Statement on Form 8-A (No. 0-27514), filed with the Commission on December 29, 1995, and amended by the Company’s Form 8-A/A filed with the Commission of January 22, 1996. |
|
|
|
|
|
|
2.2 |
Agreement and Plan of Reorganization, dated as of July 30, 1999 between the Company and Letchworth, incorporated by reference to Annex A to the Company’s Registration Statement of Form S-4 (Registration No. 333-90411), filed with the Commission of November 5, 1999. |
|
|
|
|
|
|
3.1 |
Amended and Restated Certificate of Incorporation of the Company, incorporated herein by reference to Exhibit 3(i) to the Company’s Form 10-Q, filed with the Commission on August 11, 2008. |
|
|
|
|
|
|
3.2 |
Amended and Restated Bylaws of the Company, incorporated herein by reference to Exhibit 3(ii) to the Company’s Form 10-Q, filed with the Commission on August 11, 2008. |
|
|
|
|
|
|
4. |
Form of Specimen Common Stock Certificate of the Company, incorporated herein by reference to Exhibit 4 to the Company’s Registration Statement on Form 8-A (No. 0-27514), filed with the Commission on December 29, 1995. |
|
|
|
|
|
|
4.1 |
Form of Specimen Common Stock Certificate of the Company, incorporated herein by reference to Exhibit 4 to the Company’s Registration Statement on Form 8-A (No. 0-27514), filed with the Commission on December 29, 1995. |
|
|
|
|
|
|
4.2 |
Indenture, dated as of April 10, 2009, incorporated herein by reference to Exhibit 4.1 to the Company’s Current Report on Form 8-K, filed with the Commission on April 16, 2009. |
|
|
|
|
|
|
4.3 |
Form of Subordinated Debenture (included as Exhibit A to Exhibit 4.2) |
|
|
|
|
|
|
4.4 |
Amended and Restated Trust Agreement, dated as of April 10, 2009, incorporated herein by reference to Exhibit 4.3 to the Company’s Current Report on Form 8-K, filed with the Commission on April 16, 2009. |
|
|
|
|
|
|
4.5 |
Form of Convertible Preferred Security Certificate of Tompkins Capital Trust I (included as Exhibit D to Exhibit 4.4) |
|
|
|
|
|
|
4.6 |
Preferred Securities Guarantee Agreement, dated as of April 10, 2009, incorporated herein by reference to Exhibit 4.5 to the Company’s Current Report on Form 8-K, filed with the Commission on April 16, 2009. |
|
|
|
|
|
|
4.7 |
Agreement as to Expenses and Liabilities, dated as of April 10, 2009, incorporated herein by reference to Exhibit 4.6 to the Company’s Current Report on Form 8-K, filed with the Commission on April 16, 2009. |
|
|
|
|
|
|
10.1* |
1992 Stock Option Plan, incorporated herein by reference to Exhibit 10.2 to the Company’s Registration Statement on Form 8-A (No. 0-27514), filed with the Commission on December 29, 1995. |
|
|
|
|
|
|
10.2* |
Amended and Restated Retainer Plan for Eligible Directors of Tompkins Financial Corporation and Its Wholly-owned Subsidiaries. |
|
|
|
|
|
|
10.3* |
Form of Director Deferred Compensation Agreement, incorporated herein by reference to Exhibit 10.4 to the Company’s Registration Statement on Form 8-A (No. 0-27514), filed with the Commission on December 29, 1995. |
|
|
|
|
|
|
10.4* |
Deferred Compensation Plan for Senior Officers, incorporated herein by reference to Exhibit 10.5 to the Company’s Registration Statement on Form 8-A (No. 0-27514), filed with the Commission on December 29, 1995 |
|
|
|
|
|
|
10.5* |
Supplemental Executive Retirement Agreement with James J. Byrnes, incorporated herein by reference to Exhibit 10.6 to the Company’s Registration Statement on Form 8-A (No. 0-27514), filed with the Commission on December 29, 1995. |
|
|
|
|
|
|
10.6* |
Severance Agreement with James J. Byrnes, incorporated herein by reference to Exhibit 10.7 to the Company’s Registration Statement on Form 8-A (No. 0-27514), filed with the Commission on December 29, 1995. |
|
|
|
|
|
|
10.7 |
Lease Agreement dated August 20, 1993, between Tompkins County Trust Company and Comex Plaza Associates, relating to leased property at the Rothschilds Building, Ithaca, NY, incorporated herein by reference to Exhibit 10.8 to the Company’s Form 10-K, filed with the Commission on March 26, 1996. |
|
|
|
|
|
|
10.8* |
Employment Agreement, dated September 12, 1989, by and between Registrant and James W. Fulmer, incorporated by reference to the Registrant’s Amendment No. 1 to Form S-18 Registration Statement (Reg. No. 33-3114-NY), filed with the Commission on October 31, 1989 and wherein such Exhibit is designated as Exhibit 10(a). |
|
|
|
|
|
|
10.9* |
2001 Stock Option Plan, incorporated herein by reference to Exhibit 99 to the Company’s Registration Statement on Form S-8 (No. 333-75822), filed with the Commission on December 12, 2001. |
|
|
|
|
|
|
10.11* |
Summary of Compensation Arrangements for Named Executive Officers and Directors, incorporated herein by reference to Exhibit 10.1 to the Company’s Current Report on Form 8-K, filed with the Commission on February 1, 2010. |
|
|
|
|
|
|
10.12* |
Supplemental Executive Retirement Agreement between James W. Fulmer and Tompkins Trustco, Inc., dated December 28, 2005, incorporated herein by reference to Exhibit 10.14 to the Company’s Annual Report on Form 10-K for the year ended December 31, 2005, filed with the Commission on March 16, 2006. |
|
|
|
|
|
|
10.14* |
Supplemental Executive Retirement Agreement between Stephen S. Romaine and Tompkins Trustco, Inc., dated December 28, 2005, incorporated herein by reference to Exhibit 10.16 to the Company’s Annual Report on Form 10-K for the year ended December 31, 2005, filed with the Commission on March 16, 2006. |
|
|
|
|
|
|
10.15* |
Supplemental Executive Retirement Agreement between Francis M. Fetsko and Tompkins Trustco, Inc., dated December 28, 2005, incorporated herein by reference to Exhibit 10.17 to the Company’s Annual Report on Form 10-K for the year ended December 31, 2005, filed with the Commission on March 16, 2006. |
|
|
|
|
|
|
10.16* |
Supplemental Executive Retirement Agreement between David S. Boyce and Tompkins Trustco, Inc., dated December 28, 2005, incorporated herein by reference to Exhibit 10.18 to the Company’s Annual Report on Form 10-K for the year ended December 31, 2005, filed with the Commission on March 16, 2006. |
|
|
|
|
|
|
10.17* |
Supplemental Executive Retirement Agreement between Robert B. Bantle and Tompkins Trustco, Inc., dated December 28, 2005, incorporated herein by reference to Exhibit 10.19 to the Company’s Annual Report on Form 10-K for the year ended December 31, 2005, filed with the Commission on March 16, 2006. |
|
|
|
|
|
|
10.18* |
Form of Officer Group Term Life Replacement Plan (the “Plan”) among Tompkins Trustco, Inc., or Tompkins Trust Company and the Participants in the Plan, including form of Split Dollar Policy Endorsement – Exhibit D to the Plan, including Exhibit D to Officer Group Term Replacement Plan for each executive officer filed individually. |
|
|
|
|
|
|
10.19* |
Consulting Agreement between Russell K. Achzet and Tompkins Trustco, Inc., dated January 5, 2006, incorporated herein by reference to Exhibit 10.21 to the Company’s Annual Report on Form 10-K for the year ended December 31, 2005, filed with the Commission on March 16, 2006. |
|
|
|
|
|
|
10.20* |
Amendment to the Tompkins Trustco, Inc. Supplemental Retirement Agreement with James J. Byrnes, incorporated herein by reference to Exhibit 10.1 to the Company’s Form 10-Q, filed with the Commission on August 9, 2006. |
|
|
|
|
|
|
10.21* |
Tompkins Trustco, Inc. Officer Group Term Replacement Plan, as amended on June 26, 2006, incorporated herein by reference to Exhibit 10.2 to the Company’s Form 10-Q, filed with the Commission on August 9, 2006. |
|
|
|
|
|
|
10.22* |
2009 Equity Plan, incorporated herein by reference to Exhibit 99 to the Company’s Registration Statement on Form S-8 (No. 333-160738) filed with the Commission on July 22, 2009. |
|
|
|
|
|
|
14. |
Tompkins Trustco, Inc. Code of Ethics For Chief Executive Officer and Senior Financial Officers dated April 25, 2006, incorporated herein by reference to Exhibit 10.22 to the Company’s Annual Report on Form 10-K for the year ended December 31, 2006, filed with the Commission on March 15, 2007. |
|
|
|
|
|
|
21. |
Subsidiaries of Registrant, incorporated by reference to Exhibit 21 to the Company’s Annual Report on Form 10-K for the year ended December 31, 2003, filed with the Commission on March 15, 2004. |
|
|
|
|
|
|
23. |
Consent of Independent Registered Public Accounting Firm (filed herewith) |
|
|
|
|
|
|
24. |
Power of Attorney, included on page 91 of this Report on Form 10-K. |
|
|
|
|
|
|
31.1 |
Certification of the Chief Executive Officer as required pursuant to Section 302 of the Sarbanes-Oxley Act of 2002 (filed herewith). |
|
|
|
|
|
|
31.2 |
Certification of the Chief Financial Officer as required pursuant to Section 302 of the Sarbanes-Oxley Act of 2002 (filed herewith). |
|
|
|
|
|
|
32.1 |
Certification of the Chief Executive Officer Pursuant to 18 U.S.C. Section 1350, as adopted pursuant to Section 906 of the Sarbanes-Oxley Act of 2002 (filed herewith). |
|
|
|
|
|
|
32.2 |
Certification of the Chief Financial Officer Pursuant to 18 U.S.C. Section 1350, as adopted pursuant to Section 906 of the Sarbanes-Oxley Act of 2002 (filed herewith). |
|
|
|
|
* |
Management contracts and compensatory plans and arrangements required to be filed as Exhibits to this Report on Form 10-K pursuant to Item 15(c) of the Report. |